Embed Size (px)
Citation preview

BUDGET REPORTFOR THE FISCAL YEAR ENDING JUNE 30, 2013
InDEPEnDEnT SchOOl DISTRIcT 270 hOPkInS PUBlIc SchOOlS
Serving Eden Prairie, Edina, Golden Valley, Hopkins, Minnetonka, Plymouth, and St. Louis Park
Educational Services center 1001 Highway 7 Hopkins, Minnesota 55305
Every School. Every Student.
Eve
ry D
ay.
EX
cE
ll E n c E

MISSION STATEMENT
Serving a community rich in culture and diversity,
the Hopkins Public Schools
develops in all students
the skills, knowledge, and passion
for lifelong learning.
1

THIS PAGE INTENTIONALLY
LEFT BLANK
2

INDEPENDENT SCHOOL DISTRICT #270 SCHOOL BOARD
Original Term Term
Commenced Expires Susan Wootten Chairperson 2010 2014 Warren Goodroad Vice Chair 2010 2014 Wendy Donovan Treasurer 2008 2016 Steve Adams Director 2012 2016 Betsy Anderson Director 2006 2014 Irma McIntosh Coleman Director 2008 2016 Kris Newcomer Director 2012 2016
3

THIS PAGE INTENTIONALLY
LEFT BLANK
4

Excellence. Every School. Every Student. Every Day.
Introduction Welcome to the 2012-13 Hopkins School District budget book. Budgets are as much about the financial plan of the school district as it is about the programs that the budget funds to educate its learners. The budget described herein has been under development since September 2011, when the Hopkins School Board began suggesting programmatic changes to the budget. Every budget is determined by a set of assumptions, since revenue is dependent on State budgets and enrollment. In developing its assumptions for the 2012-2013 school budget, the Hopkins School Board used data generated by the fiscal planning model, advice from the Citizen’s Financial Advisory Committee (CFAC), Board deliberation and direction from the department of Business Services in developing budget parameters. Throughout the budget’s development, the Hopkins School Board kept its mission of educating Hopkins Public Schools learners:
Serving a community rich in culture and diversity, the Hopkins Public Schools
develops in all students the skills, knowledge, and passion for lifelong learning.
Hopkins Public School Educational Program The 2012-13 budget funds a myriad of programs to meet its mission in educating its citizens. Hopkins Public Schools provides a strong foundational education in its six K-6 elementary schools. Its curriculum includes Reading, Mathematics, Language Arts, Science, Health, Physical Education, Social Studies, Music, and Art. It also administers a Chinese Immersion Magnet School at Eisenhower Elementary School. In most recent years, the District has implemented intervention programs, like Response to Intervention (RtI) to ensure students have every opportunity to secure their skills in reading and mathematics. The budget being presented in 2012-2013 expands our Intervention programming. The FY2011, FY2012 and FY2012-13 budgets have expanded our educational programming to include early childhood education for pre-kindergarten students at Alice Smith and Eisenhower Elementary Schools. The elementary program builds a foundation to prepare students for a wide range of choice in the secondary schools. Additional curricula offered
5

2
Excellence. Every School. Every Student. Every Day.
beyond what is offered in the elementary includes, but is not limited to, foreign languages, business and financial education, technology education, computer technology, culinary arts, and video production. Talented educational professionals who are supported by a strong staff development budget deliver the Hopkins curricula. As innovation is a key value of the District, Hopkins Public Schools finds alternative ways to meet student’s needs. Specific to the 2012-2013 budget is our transformation of our curriculum and instruction to digital learning. The 2012-2013 budget introduces to the P-12 program a framework for teaching and offering curricula in an accessible and high quality digital framework. As it is impossible to catalogue every program in the District, it should be noted that Hopkins Public Schools remains an educational institution that remains innovative and responsive in the education of its learners. 2012-13 Revenue Assumption The 2012-13 budget is the second year of the State biennial budget, where the State of Minnesota increased per-pupil funding by 1% in 2011-12 and by 1% in 2012-13, this budget year. The State of Minnesota provides revenue to every school district primarily based on the Districts pupil enrollment. It also provides other categorical revenue, which includes special education, compensatory revenue, English Language Learner revenue and more. Please refer to the Revenue Analysis section in the budget book for further detail. Title I dollars, which are tied to free and reduced lunch pupil count, are federal dollars, which are used for mathematics and reading remediation. This budget will also show that revenue comes from property tax levies on residents of the Hopkins Public Schools. Hopkins Public Schools is fortunate to have a strong tax base to support its schools. It should be noted that Hopkins Public Schools revenue has showed decreases in recent years due to declining enrollment, which is managed through decreasing the number of staff. Since education takes up approximately 40% of the State's budget, and with another projected State budget deficit on the horizon, it is unknown what impact the next biennium will have on Hopkins’ revenue. As the District is in a strong financial position with a strong fund balance, fiscal modeling systems, and a well-represented Citizens Financial Advisory Committee (CFAC), it is
6

3
Excellence. Every School. Every Student. Every Day.
positioned well to adapt to whatever the new reality will be in the next biennium. 2012-13 Expenditure Proposal This budget will maintain current programming and class size levels for the 2012-13 school year. This budget was preliminarily approved in two parts: 2012-13 Operating Budget and 2012-13 Program Adjustments and Enhancements. The biggest changes to the 2012-13 budget are: allocating additional resource for Response to Intervention, digital learning, and a one-year exploratory amount for International Baccalaureate. As in the past, the budget provides administration with Targeted Staffing that will be used to manage class size fluctuations that occur throughout the summer and early fall. Fund Balance Notification Per the District’s Fund Balance Policy it is required that if the projected Unassigned fund balance will fall below 6% (using the parameters set by the School Board in creating the Preliminary Budget) at any time during the year being budgeted for, or the next two succeeding years, that the District administration will notify the School Board in writing of the occurrence. Based on the parameters of this budget the Unassigned fund balance will fall below 6% in the third budget year. This constitutes the School Board’s notification of such occurrence. Conclusion Further analysis of the 2012-13 school district budget assumptions and variables will be needed when 2011-12 audited results are known, and fall enrollment is realized. The mid-year budget revision for 2012-13 will take these and other known factors into account at that time. It will be important for budgeting to be fluid and responsive, which it can be based on the strong fund balance and fiscal health of Hopkins Public Schools.
John Schultz, PhD, John Toop Superintendent Director of Business Services
7

THIS PAGE INTENTIONALLY
LEFT BLANK
8
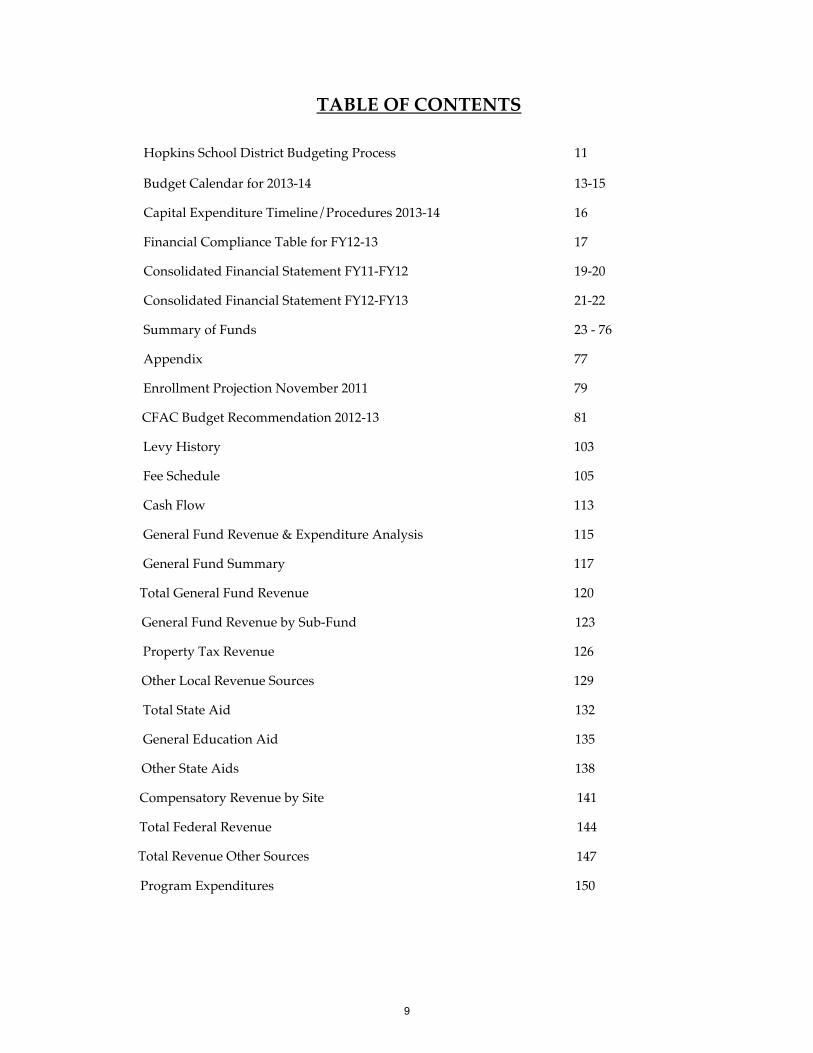
TABLE OF CONTENTS
Hopkins School District Budgeting Process 11 Budget Calendar for 2013-14 13-15 Capital Expenditure Timeline/Procedures 2013-14 16 Financial Compliance Table for FY12-13 17 Consolidated Financial Statement FY11-FY12 19-20 Consolidated Financial Statement FY12-FY13 21-22 Summary of Funds 23 - 76 Appendix 77 Enrollment Projection November 2011 79 CFAC Budget Recommendation 2012-13 81 Levy History 103 Fee Schedule 105 Cash Flow 113 General Fund Revenue & Expenditure Analysis 115 General Fund Summary 117 Total General Fund Revenue 120 General Fund Revenue by Sub-Fund 123 Property Tax Revenue 126 Other Local Revenue Sources 129 Total State Aid 132 General Education Aid 135 Other State Aids 138 Compensatory Revenue by Site 141 Total Federal Revenue 144 Total Revenue Other Sources 147 Program Expenditures 150
9

THIS PAGE INTENTIONALLY
LEFT BLANK
10

advises
is presented to fiscally guides
guidesprovides guidance
is provided to
is provided monthly to
developsare presented to
leads
modifiesdevelops
informs
presented to
provides budget progress to
fiscally guides
reflects
guidesinforms
supports
is provided to
School Board
Citizen's Financial Advisory
Committee (CFAC)
Financial Planning
Model
Board Policy and Goals
Strategic Plan
Superintendent
Administration
Board Priorities for Budget and
Program
Program Development
Public
Annual Budget
Board Audit
Financial Information
Hopkins School District Budgeting Process
Public Input
11

THIS PAGE INTENTIONALLY
LEFT BLANK
12

Hopkins Schools District Budget and Education Program Development Schedule
Group Responsible June 12 July 12 August 12 September 12 Board Board approves budget for next
fiscal year (FY13) Board Communicates Fiscal Parameters and Strategic Priorities for School Year (FY14)
---- ---- Approve Preliminary Levy
Business Office Operations
Business Office Completes Runs of FPM at legislative funding level1
Submit MDE 2Calculations for Preliminary Levy Close Books from Previous Year Audit Preparation
Audit Support Audit Support
District Audit ---- Audit Begins Audit in Progress Audit in Progress District Administration Budget Development
---- ---- ---- ----
Citizen’s Financial Advisory Committee (CFAC)
Review District Fiscal Conditions Review Runs of FPM3
----- ----- -----
Community and Parents
Communications as appropriate
Bd Audit Comm Plan development for audit Give auditors direction Select new CFAC member ----
1 Legislature will adopt biennial budgets in May. Funding levels will determine programming to add or reduce. Preliminary projections can be developed. 2 Minnesota Department of Education 3 Fiscal Planning Model
13

Group October 12 November 12 December 12 Board ----
Annual Fiscal Recommendations presented to Board from Administration Board Audit Committee Receives Audit Report Board Audit Committee completes analysis.
Board approves District Audit Board holds Truth in Taxation hearing Board certifies Final Property Tax levy Board reviews and accepts CFAC’s recommendation report.
Business Office Operations
Enrollment/Census Data/Fiscal Planning Updated Fiscal Recommendations Developed
Fiscal Recommendations Presented to CFAC
Implements recommendations and development of budget based on FPM and accepted by Board.
District Audit Audit in Progress Preliminary Fund Balance Available
Audit Presented to Board Audit Committee Audit Report Presented to Board
District Administration Budget Development
Budget Information Shared: Fiscal Status, Fiscal Planning Model Program Development Planning Board Program Priorities Revisited
Budget Development: Program Modifications Prioritized
Budget Development: Program Modifications Prioritized
Citizen’s Financial Advisory Committee (CFAC)
Review District Fiscal Conditions Board Fiscal and Strategic Priorities Reviewed Fiscal Planning Model Reviewed
Review District Fiscal Conditions Fiscal Planning Model Finalized Fiscal Recommendations Reviewed/Developed Fiscal Recommendations Finalized
Review District Fiscal Conditions
Community and Parents
Communications as appropriate
Formal Communications Plan Developed Communications as appropriate
Communications as appropriate
Bd Audit Comm ---- ---- Interviews with staff BAC in-depth review of audit Board workshop on audit
14

Group
January 13 February 13 March 13 April 13 May 13 June 13
Board Board Update on Program/Budget Status
Board Update on Program/Budget Status
Board Provide Preliminary Approval of FY13 Budget at First Board Meeting
Board Establishes Budget and Strategic Priorities for FY14
---- Board approves budget for next fiscal year (FY14) Board Communicates Fiscal Parameters and Strategic Priorities for School Year (FY15)
Business Office Operations
Budget Manager meeting to determine method for 12-13 budget modifications
FY14 Budget Developed ---- ---- Business Office Completes Runs of FPM at legislative funding level4
District Audit ---- ---- ---- ---- ---- ---- District Administration Budget Development
Budget Development: Program Modifications Prioritized
Administration Finalizes Program and Budget Recommendation
Priorities for FY14 are Developed
Budget Managers complete detailed budget entry
---- ----
Citizen’s Financial Advisory Committee (CFAC)
Review District Fiscal Conditions
Review District Fiscal Conditions
Review District Fiscal Conditions
---- ---- Review District Fiscal Conditions Review Runs of FPM5
Community and Parents
Communications Plan Developed
One Public Informational Meeting to Communicate Program Changes Held
Releases Describing Program for FY14 School Year Public Input taken (FY15)
Public Input taken (FY15)
Public Input taken (FY15)
Communications as appropriate
Bd Audit Comm BAC/admin meet to plan next steps based on any audit findings
BAC post-audit self-evaluation meeting
---- BAC/admin meet to review action steps and plan for upcoming audit
4 Legislature will adopt biennial budgets in May. Funding levels will determine programming to add or reduce. Preliminary projections can be developed. 5 Fiscal Planning Model
15
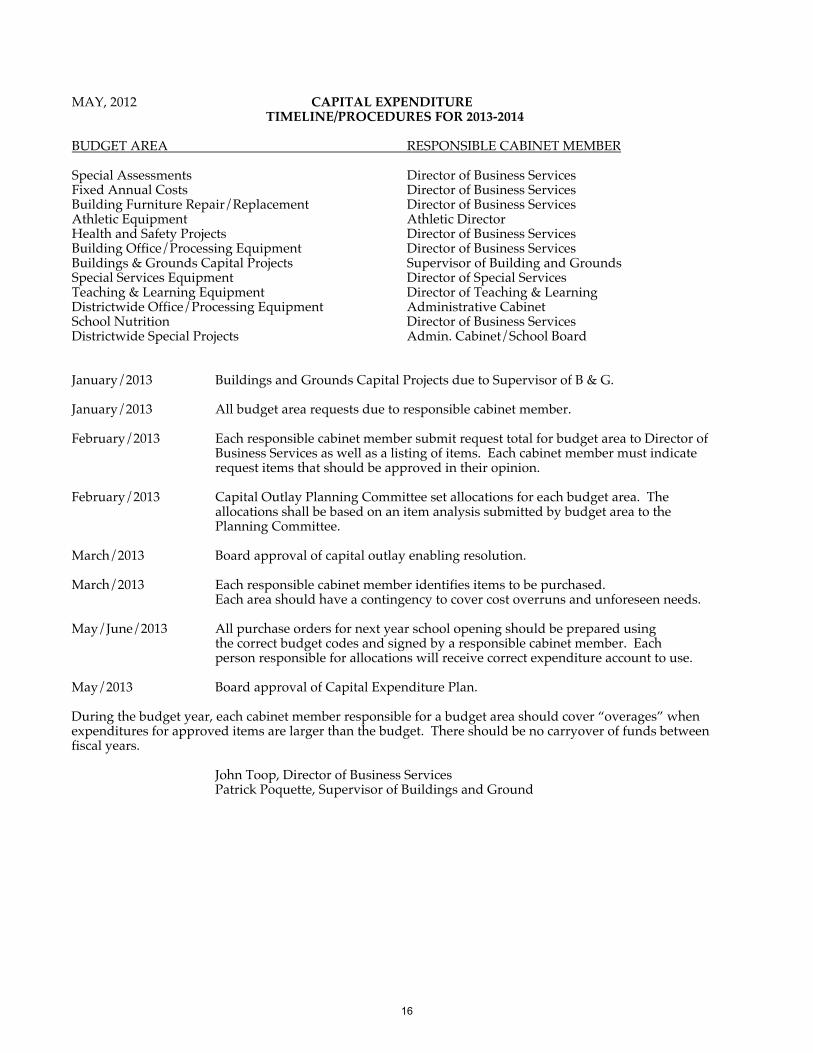
MAY, 2012 CAPITAL EXPENDITURE TIMELINE/PROCEDURES FOR 2013-2014
BUDGET AREA RESPONSIBLE CABINET MEMBER Special Assessments Director of Business Services Fixed Annual Costs Director of Business Services Building Furniture Repair/Replacement Director of Business Services Athletic Equipment Athletic Director Health and Safety Projects Director of Business Services Building Office/Processing Equipment Director of Business Services Buildings & Grounds Capital Projects Supervisor of Building and Grounds Special Services Equipment Director of Special Services Teaching & Learning Equipment Director of Teaching & Learning Districtwide Office/Processing Equipment Administrative Cabinet School Nutrition Director of Business Services Districtwide Special Projects Admin. Cabinet/School Board January/2013 Buildings and Grounds Capital Projects due to Supervisor of B & G. January/2013 All budget area requests due to responsible cabinet member. February/2013 Each responsible cabinet member submit request total for budget area to Director of Business Services as well as a listing of items. Each cabinet member must indicate request items that should be approved in their opinion. February/2013 Capital Outlay Planning Committee set allocations for each budget area. The allocations shall be based on an item analysis submitted by budget area to the Planning Committee. March/2013 Board approval of capital outlay enabling resolution. March/2013 Each responsible cabinet member identifies items to be purchased. Each area should have a contingency to cover cost overruns and unforeseen needs. May/June/2013 All purchase orders for next year school opening should be prepared using the correct budget codes and signed by a responsible cabinet member. Each person responsible for allocations will receive correct expenditure account to use. May/2013 Board approval of Capital Expenditure Plan. During the budget year, each cabinet member responsible for a budget area should cover “overages” when expenditures for approved items are larger than the budget. There should be no carryover of funds between fiscal years. John Toop, Director of Business Services Patrick Poquette, Supervisor of Buildings and Ground
16

Financial Compliance Table for Fiscal Year 2012-13
School Board adopts Fiscal Year 2012-13 budget prior to July 1 per Minnesota Statute section 123B.77 Subdivision 4 Proof: School Board meeting minutes reflect approval of the budget prior to July 1. √
A.1 Preliminary unaudited UFARS data is submitted to MDE by September 15 of each year (Minnesota Statues, section 123B.77, subdivision 2).
A.2 The district/school’s Revenues and Expenditure Budget form for 2012-2013 (form
ED-00110-35) is published on the district/school’s official website and in a qualified Newspaper of general circulation within one week of the board’s acceptance of the final FY 2012 audit by the board, or by November 30, 2012, whichever is earlier. The website posting must include a link to the district/school’s report card located at MDE’s website (Minnesota Statutes, section 123B.10, subdivision 1). A.3 Final audited UFARS data is submitted to MDE by November 30, 2012 (Minnesota Statues, section 123B.77, subdivision 3).
A.4 The Fiscal Compliance Table is completed by November 30, 2012.
A.5 The audited financial statement is submitted to MDE by December 31, 2012 Minnesota Statues, Section 123B.77, subdivision 3). A.6 District/school uses state-approved financial software (Minnesota Statutes, section √ 125B.05, subdivision 3). B.1 The district/school has a written, board approved fund balance policy in place by √ July 1, 2011 B.2 The district/school has a zero or positive balance in the General Fund Unassigned Fund Balance account 422. B.3 The district/school has a zero or positive aggregate fund balance in each of the funds 2, 4, and 7. C.1 The district/school’s final UFARS Turnaround Edit Report has no errors.
C.2 The district/school’s final audited UFARS data agrees with the independent audit data.
C.3 The district/school’s final SERVS/UFARS Comparison Report has no variances.* C.4 The district/school’s final EDRS/UFARS Comparison Report has no variances.
* This criterion is contingent on successful completion and testing of the FY2012 SERVS/UFARS
Comparison Report.
17

THIS PAGE INTENTIONALLY
LEFT BLANK
18

Actual Revised BudgetActual % of Total Revised Budget % of Total10-11 10-11 11-12 11-12
Sources of Funds:Local Sources:
Property Taxes 27,120,125 31.71% 18,938,892 22.59%All Other 4,062,439 4.75% 3,551,072 4.23%Total Local Sources 31,182,564 36.46% 22,489,964 26.82%
State Sources:General Education Aid 47,468,517 55.50% 48,426,135 57.75%Special Education Aid 7,161,353 8.37% 7,000,000 8.35%All Other State Aid (5,981,674) -6.99% 2,079,626 2.48%Total State Sources 48,648,196 56.88% 57,505,761 68.58%
Federal Sources: 5,690,599 6.65% 3,856,598 4.60%
Total Sources of Funds -- General Fund 85,521,359 100.00% 83,852,323 100.00%
Uses of Funds:Instruction, Support Services, and School Level Administration
Instruction:Salaries 39,879,089 49.38% 39,351,250 47.31%Benefits and Payroll Taxes 9,199,561 11.39% 11,000,311 13.23%All Other 4,597,953 5.69% 4,858,751 5.84%
Total Instruction 53,676,602 66.46% 55,210,312 66.38%
Adjustments: District Level Administration - 0.00% - 0.00%
Adjusted Total Instruction 53,676,602 66.46% 55,210,312 66.38%
Instructional and Pupil Support Services:Salaries 4,562,598 5.65% 4,864,789 5.85%Benefits and Payroll Taxes 1,067,655 1.32% 1,258,489 1.51%All Other 714,093 0.88% 1,401,034 1.68%
Total Instructional and Pupil Support Services 6,344,346 7.86% 7,524,312 9.05%
Adjustments: Asst Principal Salaries (636,863) -0.79% (537,238) -0.65% Integration Salaries - 0.00% - 0.00%Total Adjustments (636,863) -0.79% (537,238) -0.65%
Adj Total Instructional & Pupil Support 5,707,483 7.07% 6,987,074 8.40%
School Level Administration Salaries 2,029,577 2.51% 1,791,214 2.15% Benefits and Payroll Taxes 395,971 0.49% 458,627 0.55% All Other 95,635 0.12% 139,477 0.17%
Total School Level Administration 2,521,184 3.12% 2,389,318 2.87%
Adjustments: Asst Principal Salaries 636,863 0.79% 537,238 0.65% Lindbergh Center Expenses - 0.00% - 0.00% Integration Administrative Expenses - 0.00% - 0.00%Total Adjustments 636,863 0.79% 537,238 0.65%
Adjusted Total School Level Administration 3,158,048 3.91% 2,926,556 3.52%
Facilities, Operations & MaintenanceSalaries 2,879,109 3.56% 2,719,980 3.27%Benefits and Payroll Taxes 815,157 1.01% 907,724 1.09%All Other 6,233,858 7.72% 6,200,146 7.45%
Total Facilities, Operations & Maintenance 9,928,125 12.29% 9,827,850 11.82%
Adjustments: Lindbergh Center Expenses - 0.00% - 0.00%
Adj. Total Facilities, Operations & Maint. 9,928,125 12.29% 9,827,850 11.82%
School Level Education Services 72,470,257 89.73% 74,951,792 90.12%
Skyward Report
Hopkins Consolidated Financial StatementAll General Fund Revenue and Expense
Annual Report Actual Compared to BudgetData based upon Skyward Reports
Source of Funds FY11-12 Budget General Fund
Local Sources:, 26.82%
State Sources:, 68.58%
Federal Sources:,
4.60%
Uses of Funds by Function/Activity FY11-12 Budget General Fund
78.30%
3.72%
6.16%11.82%
Facilities, Operations & Maintenance
Student Transportation
District Level Administration
Instruction, Pupil Support Services & School Level Admin.
Uses of Funds - School vs. District Level FY11-12 Budget General Fund
90.12%
6.16%3.72%
School Level Education Services Student Transportation
District Level Administration
Uses of Funds - Compensation vs. All Other FY11-12 Budget General Fund
Salaries, 61.18%
Benefits & Payroll Taxes, 17.04%
All Other, 21.78%
19

Actual Revised BudgetActual % of Total Revised Budget % of Total10-11 10-11 11-12 11-12
Skyward Report
Hopkins Consolidated Financial StatementAll General Fund Revenue and Expense
Annual Report Actual Compared to BudgetData based upon Skyward Reports
Student TransportationSalaries 281,309 0.35% 267,643 0.32%Benefits and Payroll Taxes 77,035 0.10% 89,560 0.11%All Other 4,913,904 6.08% 4,766,759 5.73%
Total Student Transportation 5,272,247 6.53% 5,123,962 6.16%
District Level AdministrationSalaries 2,009,373 2.49% 1,888,924 2.27%Benefits and Payroll Taxes 418,198 0.52% 456,311 0.55%All Other 590,726 0.73% 751,297 0.90%
Total District Level Administration 3,018,298 3.74% 3,096,532 3.72%
Adjustments: Instruction - 0.00% - 0.00%
Adjusted Total District Level Administration 3,018,298 3.74% 3,096,532 3.72%
Subtotal Student Transp. & District Level Admin. 8,290,545 10.27% 8,220,494 9.88%
Total Uses of Funds -- General Fund 80,760,802 100.00% 83,172,286 100.00%
Sources Over (Under) Uses 4,760,557 680,037
Other Financial Sources (Uses) 12,925 - Other Adjustments - - Net Transfer In (Out) (228,000) (500,000)
Net Change in Funds 4,545,482 180,037
Total Fund BalanceBeginning of Year 17,052,536 20,654,565 End of Year 21,598,018 12,646,218
Restricted 60,162 (184,458) Committed 8,188,384 - Assigned 664,173 1,251,868 Unassigned 11,741,846 11,578,808
20

Revised Budget Original BudgetRevised Budget % of Total Original Budget % of Total
11-12 11-12 12-13 12-13Sources of Funds:Local Sources:
Property Taxes 18,938,892 22.59% 19,645,563 23.25%All Other 3,551,072 4.23% 3,611,072 4.27%Total Local Sources 22,489,964 26.82% 23,256,635 27.53%
State Sources:General Education Aid 48,426,135 57.75% 48,486,450 57.39%Special Education Aid 7,000,000 8.35% 6,720,000 7.95%All Other State Aid 2,079,626 2.48% 2,541,626 3.01%Total State Sources 57,505,761 68.58% 57,748,076 68.35%
Federal Sources: 3,856,598 4.60% 3,481,789 4.12%
Total Sources of Funds -- General Fund 83,852,323 100.00% 84,486,500 100.00%
Uses of Funds:Instruction, Support Services, and School Level Administration
Instruction:Salaries 39,351,250 47.31% 39,982,898 47.98%Benefits and Payroll Taxes 11,000,311 13.23% 11,689,618 14.03%All Other 4,858,751 5.84% 4,798,361 5.76%
Total Instruction 55,210,312 66.38% 56,470,877 67.76%
Adjustments: District Level Administration - 0.00% - 0.00%
Adjusted Total Instruction 55,210,312 66.38% 56,470,877 67.76%
Instructional and Pupil Support Services:Salaries 4,864,789 5.85% 4,406,755 5.29%Benefits and Payroll Taxes 1,258,489 1.51% 1,235,637 1.48%All Other 1,401,034 1.68% 746,186 0.90%
Total Instructional and Pupil Support Services 7,524,312 9.05% 6,388,578 7.67%
Adjustments: Asst Principal Salaries (537,238) -0.65% (551,583) -0.66% Integration Salaries - 0.00% - 0.00%Total Adjustments (537,238) -0.65% (551,583) -0.66%
Adj Total Instructional & Pupil Support 6,987,074 8.40% 5,836,995 7.00%
School Level Administration Salaries 1,791,214 2.15% 1,839,041 2.21% Benefits and Payroll Taxes 458,627 0.55% 482,620 0.58% All Other 139,477 0.17% 137,293 0.16%
Total School Level Administration 2,389,318 2.87% 2,458,954 2.95%
Adjustments: Asst Principal Salaries 537,238 0.65% 551,583 0.66% Lindbergh Center Expenses - 0.00% - 0.00% Integration Administrative Expenses - 0.00% - 0.00%Total Adjustments 537,238 0.65% 551,583 0.66%
Adjusted Total School Level Administration 2,926,556 3.52% 3,010,537 3.61%
Facilities, Operations & MaintenanceSalaries 2,719,980 3.27% 2,792,603 3.35%Benefits and Payroll Taxes 907,724 1.09% 962,187 1.15%All Other 6,200,146 7.45% 5,913,978 7.10%
Total Facilities, Operations & Maintenance 9,827,850 11.82% 9,668,768 11.60%
Adjustments: Lindbergh Center Expenses - 0.00% - 0.00%
Adj. Total Facilities, Operations & Maint. 9,827,850 11.82% 9,668,768 11.60%
School Level Education Services 74,951,792 90.12% 74,987,177 89.98%
Skyward Report
Hopkins Consolidated Financial StatementAll General Fund Revenue and Expense
Annual Report Revised Budget FY 12 to Original Budget FY13Data based upon Skyward Reports
Source of Funds FY12-13 Budget General Fund
Local Sources:, 27.53%
State Sources:, 68.35%
Federal Sources:,
4.12%
Uses of Funds by Function/Activity FY12-13 Budget General Fund
11.60% 6.28%
3.75%78.38%
Facilities, Operations & Maintenance
Student Transportation
District Level Administration
Instruction, Pupil Support Services & School Level Admin.
Uses of Funds - School vs. District Level FY12-13 Budget General Fund
89.98%
6.28%3.75%
School Level Education Services Student Transportation
District Level Administration
Uses of Funds - Compensation vs. All Other FY12-13 Budget General Fund
Salaries, 61.48%
Benefits & Payroll Taxes, 17.94%
All Other, 20.58%
21

Revised Budget Original BudgetRevised Budget % of Total Original Budget % of Total
11-12 11-12 12-13 12-13
Skyward Report
Hopkins Consolidated Financial StatementAll General Fund Revenue and Expense
Annual Report Revised Budget FY 12 to Original Budget FY13Data based upon Skyward Reports
Student TransportationSalaries 267,643 0.32% 274,788 0.33%Benefits and Payroll Taxes 89,560 0.11% 94,933 0.11%All Other 4,766,759 5.73% 4,862,095 5.83%
Total Student Transportation 5,123,962 6.16% 5,231,816 6.28%
District Level AdministrationSalaries 1,888,924 2.27% 1,943,909 2.33%Benefits and Payroll Taxes 456,311 0.55% 484,520 0.58%All Other 751,297 0.90% 692,687 0.83%
Total District Level Administration 3,096,532 3.72% 3,121,116 3.75%
Adjustments: Instruction - 0.00% - 0.00%
Adjusted Total District Level Administration 3,096,532 3.72% 3,121,116 3.75%
Subtotal Student Transp. & District Level Admin. 8,220,494 9.88% 8,352,932 10.02%
Total Uses of Funds -- General Fund 83,172,286 100.00% 83,340,109 100.00%
Sources Over (Under) Uses 680,037 1,146,391
Other Financial Sources (Uses) - - Other Adjustments - - Net Transfer In (Out) (500,000) (868,000)
Net Change in Funds 180,037 278,391
Total Fund BalanceBeginning of Year 20,654,565 12,646,218 End of Year 12,646,218 12,924,609
Restricted (184,458) (273,955) Committed - - Assigned 1,251,868 28,755 Unassigned 11,578,808 13,255,810
22

Budget 2012-2013
Fund Summaries

HOPKINS ISD #270
GENERAL FUND
EXECUTIVE SUMMARY
Est. Unassigned Fund Balance 6/30/12 11,578,808
General Fund Unassigned Revenues 80,746,127
General Fund Transfers IN:
MDE Approved from Oper. Capital 426,140
MDE Approved from Staff Dev. 324,242
Total General Fund Unassigned Revenue 81,496,509
General Fund Unassigned Expenses (80,260,612)
Gneral Fund Transfers OUT:
To Community Ed for Marketing (368,000)
To ISF Retiree Severance (Normal Cost) (500,000)
Total General Fund Unassigned Expenses (81,128,612)
Revenues less Expenses 367,897 Includes additional $68,000 for marketing and 1.0 FTE for 7/8 Math Test Prep
and reduces interest expense for cash flow borrowing to zero
Est. Ending Unassigned Fund Balance 6/30/13 11,946,705 14.57%
Plus Assigned for HEA Settlement 1,223,113 Goes to Unassigned at end of 6/30/13 as HEA contract expires
Plus Assigned for Elementary Study 68,000 Source for $68,000 of $368,000 transfer to Community Ed for marketing
Plus Assigned for Elementary AVID 18,000 Source for est. expenses for Elementary AVID (Year 2 of 3)
Plus Restricted for Staff Development (8) Staff Development rounding
Est. General Fund Unassigned Fund Balance 6/30/13 13,255,810 16.17%
Non‐Spendable and Assigned General Fund Balances: 6/30/2012 Revenue Expense Transfer 6/30/13
Non‐Spendable for Prepaids and Inventory 943,454 943,454 0 0 0 943,454
Assigned for QComp WJH 10,755 10,755 0 0 0 10,755
Assigned for Elementary AVID 18,000 36,000 0 18,000 0 18,000
Est. Unassigned, Assigned and Non‐Spendable 6/30/13 14,228,019
Restricted General Fund Balances: 6/30/2012 Revenue Expense Transfer 6/30/13
Restricted for Staff Development 0 (8) 873,010 548,760 324,242 0
Restricted for Operating Capital 266,229 250,722 2,572,384 2,130,737 426,140 266,229
Restricted for Health & Safety (540,184) (435,172) 294,988 400,000 0 (540,184)
Total Est. General Fund Balances 6/30/13 13,954,064
25
1
2
3
4
5
6
7
8
9
10
11
12
13
14
15
16
17
18
19
20
21
22
23
24
25
26
27
28
29
30
31
32
33
34
35
36
37
38
39
40
41
42
43
44
45
46
47
48
49
50
51
52
53
54
55
56
57
58
59
60
61
62
63
64
65
66
67
68
69
70
71
72
B C D F H J L
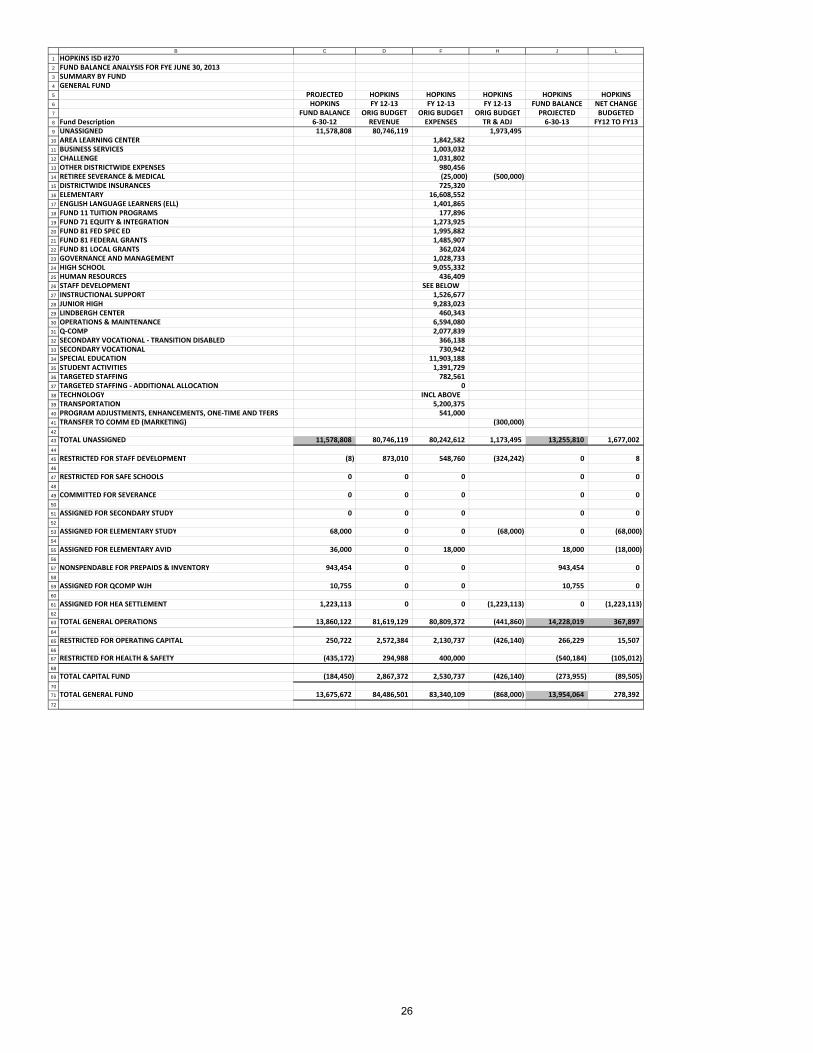
HOPKINS ISD #270FUND BALANCE ANALYSIS FOR FYE JUNE 30, 2013SUMMARY BY FUNDGENERAL FUND
PROJECTED HOPKINS HOPKINS HOPKINS HOPKINS HOPKINSHOPKINS FY 12‐13 FY 12‐13 FY 12‐13 FUND BALANCE NET CHANGE
FUND BALANCE ORIG BUDGET ORIG BUDGET ORIG BUDGET PROJECTED BUDGETEDFund Description 6‐30‐12 REVENUE EXPENSES TR & ADJ 6‐30‐13 FY12 TO FY13UNASSIGNED 11,578,808 80,746,119 1,973,495AREA LEARNING CENTER 1,842,582BUSINESS SERVICES 1,003,032CHALLENGE 1,031,802OTHER DISTRICTWIDE EXPENSES 980,456RETIREE SEVERANCE & MEDICAL (25,000) (500,000)DISTRICTWIDE INSURANCES 725,320ELEMENTARY 16,608,552ENGLISH LANGUAGE LEARNERS (ELL) 1,401,865FUND 11 TUITION PROGRAMS 177,896FUND 71 EQUITY & INTEGRATION 1,273,925FUND 81 FED SPEC ED 1,995,882FUND 81 FEDERAL GRANTS 1,485,907FUND 81 LOCAL GRANTS 362,024GOVERNANCE AND MANAGEMENT 1,028,733HIGH SCHOOL 9,055,332HUMAN RESOURCES 436,409STAFF DEVELOPMENT SEE BELOWINSTRUCTIONAL SUPPORT 1,526,677JUNIOR HIGH 9,283,023LINDBERGH CENTER 460,343OPERATIONS & MAINTENANCE 6,594,080Q‐COMP 2,077,839SECONDARY VOCATIONAL ‐ TRANSITION DISABLED 366,138SECONDARY VOCATIONAL 730,942SPECIAL EDUCATION 11,903,188STUDENT ACTIVITIES 1,391,729TARGETED STAFFING 782,561TARGETED STAFFING ‐ ADDITIONAL ALLOCATION 0TECHNOLOGY INCL ABOVETRANSPORTATION 5,200,375PROGRAM ADJUSTMENTS, ENHANCEMENTS, ONE‐TIME AND TFERS 541,000TRANSFER TO COMM ED (MARKETING) (300,000)
TOTAL UNASSIGNED 11,578,808 80,746,119 80,242,612 1,173,495 13,255,810 1,677,002
RESTRICTED FOR STAFF DEVELOPMENT (8) 873,010 548,760 (324,242) 0 8
RESTRICTED FOR SAFE SCHOOLS 0 0 0 0 0
COMMITTED FOR SEVERANCE 0 0 0 0 0
ASSIGNED FOR SECONDARY STUDY 0 0 0 0 0
ASSIGNED FOR ELEMENTARY STUDY 68,000 0 0 (68,000) 0 (68,000)
ASSIGNED FOR ELEMENTARY AVID 36,000 0 18,000 18,000 (18,000)
NONSPENDABLE FOR PREPAIDS & INVENTORY 943,454 0 0 943,454 0
ASSIGNED FOR QCOMP WJH 10,755 0 0 10,755 0
ASSIGNED FOR HEA SETTLEMENT 1,223,113 0 0 (1,223,113) 0 (1,223,113)
TOTAL GENERAL OPERATIONS 13,860,122 81,619,129 80,809,372 (441,860) 14,228,019 367,897
RESTRICTED FOR OPERATING CAPITAL 250,722 2,572,384 2,130,737 (426,140) 266,229 15,507
RESTRICTED FOR HEALTH & SAFETY (435,172) 294,988 400,000 (540,184) (105,012)
TOTAL CAPITAL FUND (184,450) 2,867,372 2,530,737 (426,140) (273,955) (89,505)
TOTAL GENERAL FUND 13,675,672 84,486,501 83,340,109 (868,000) 13,954,064 278,392
26

73
74
75
76
77
78
79
80
81
82
83
84
85
86
87
88
89
90
91
92
93
94
95
96
97
98
99
100
101
102
103
104
105
106
107
108
109
110
111
112
113
114
115
116
117
118
119
120
121
B C D F H J L
HOPKINS ISD #270FUND BALANCE ANALYSIS FOR FYE JUNE 30, 2013SUMMARY BY FUND
PROJECTED HOPKINS HOPKINS HOPKINS HOPKINS HOPKINSHOPKINS FY 12‐13 FY 12‐13 FY 12‐13 FUND BALANCE NET CHANGE
FUND BALANCE ORIG BUDGET ORIG BUDGET ORIG BUDGET PROJECTED BUDGETEDFund Description 6‐30‐12 REVENUE EXPENSES TR & ADJ 6‐30‐13 FY12 TO FY13
FOOD SERVICE FUNDNONSPENDABLE FOR PREPAIDS & INVENTORY 43,336 0 0 43,336 0RESTRICTED FOR FOOD SERVICE PROGRAM 11,477 4,230,224 4,130,677 111,024 99,547TOTAL FOOD SERVICE 54,813 4,230,224 4,130,677 0 154,360 99,547
COMMUNITY SERVICE FUNDNONSPENDABLE FOR PREPAIDS & INVENTORY 713 0 0 713 0RESTRICTED FOR REGULAR COMMUNITY ED 587,642 6,378,246 6,736,243 368,000 597,645 10,003RESTRICTED FOR E.C.F.E. 65,145 443,408 443,108 65,445 300RESTRICTED FOR SCHOOL READINESS 6,925 86,697 86,665 6,957 32RESTRICTED FOR ADULT BASIC ED 183,690 1,443,050 1,387,151 239,589 55,899RESTRICTED FOR OTHER PURPOSES 77,364 521,960 523,945 75,379 (1,985)TOTAL COMMUNITY SERVICE 921,479 8,873,361 9,177,112 368,000 985,728 64,249
BUILDING CONSTRUCTION FUNDNONSPENDABLE FOR PREPAIDS & INVENTORY 106,947 0 0RESTRICTED FOR CONSTRUCTION BOND (0) 0 0 (0) 0RESTRICTED FOR ALT FACILITIES 150,000 15,306,087 7,500,000 7,956,087 7,806,087RESTRICTED FOR CAPITAL PROJECTS LEVY 0 6,164,119 6,067,326 96,793 96,793TOTAL BUILDING CONSTRUCTION 256,947 21,470,206 13,567,326 0 8,052,880 7,902,880
DEBT REDEMPTION FUNDRESTRICTED FOR DEBT SERVICE 2,320,046 13,943,190 13,174,105 0 3,089,131 769,085RESTRICTED FOR OPEB DEBT SERVICE (FUND 47) 70,168 968,077 923,978 114,267 44,100RESTRICTED FOR BOND REFUNDING (0) 0 0 (0) 0TOTAL DEBT REDEMPTION 2,390,213 14,911,267 14,098,083 0 3,203,398 813,185
TRUST FUNDASSIGNED 85,097 33,650 37,550 0 81,197 (3,900)
AGENCY FUNDASSIGNED 0 0 0 0 0 0
INTERNAL SERVICE FUNDSELF‐INSURED HEALTH INSURANCE 1,217,581 9,630,000 9,630,000 0 1,217,581 0OTHER POST EMPLOYMENT BENEFITS REVOCABLE TRUST 15,916,688 0 0 0 15,916,688 0SELF‐INSURED RETIREE SEVERANCE 7,738,384 0 950,000 500,000 7,288,384 (450,000)TOTAL INTERNAL SERVICE FUNDS 24,872,653 9,630,000 10,580,000 500,000 24,422,653 (450,000)
TOTAL ALL FUNDS 42,256,874 143,635,209 134,930,857 0 50,810,943 8,704,353
27

Budget Area: Area Learning Centers (ALC)
Budget Manager(s): Nik Lightfoot, Ed.D., J.D., Assistant Superintendent
Budget Description: Includes two high school Alternative Learning Center (ALC) programs, two junior high school alternative learningprograms, targeted services for students in elementary schools, extended learning programs for basic skillsoffered through the secondary summer school program (9th‐12th grades), and targeted service extendedlearning options for students (1st‐9th grades).
Historical Budget Information:
Budget Inc.(Dec.) %
2011‐12 Original 1,842,546 2011‐12 Revised 1,785,404 (57,142) ‐3.10%
Current Budget Information: Global Assumptions:
2012‐13 Proposed Budget: 1,842,582 Salaries ‐ All Staff: 2.67%Benefits ‐ All Staff: 6.00%
Increase/(Decrease) ‐ $ 57,178
Increase/(Decrease) ‐ % 3.20%
1. No changes
Future Budget Considerations
2012‐13 Area Learning Center (ALC) Budget
Executive Summary
Financial Information
Budget Highlights
28

Budget Area: Business Services
Budget Manager(s): John Toop, Director of Business Services
Budget Description: The District's Business Services department includes areas such as budgeting and accounting, payroll,accounts payable and receivable, legal services, Central Copy Center and school elections.
Historical Budget Information:
Budget Inc./(Dec.) %
2011‐12 Original 1,006,636 2011‐12 Revised 1,020,854 14,218 1.41%
Current Budget Information: Global Assumptions:
2012‐13 Proposed Budget: 1,003,032 Salaries ‐ All Staff: 2.67%Benefits ‐ All Staff: 6.00%
Increase/(Decrease) ‐ $ (17,822)
Increase/(Decrease) ‐ % ‐1.75%
1. Consulting Fees going down for FY13 by est. $50,000.
Future Budget Considerations
2012‐13 Business Services Budget
Executive Summary
Financial Information
Budget Highlights
29

Budget Area: Challenge
Budget Manager(s): Susan Anderson, Challenge Coordinator
Budget Description: Provides curricular and instructional service beyond the regular classroom curricula for students in K‐12, andoffers a broad range of services to students at each building, including support for curriculum differentiation inpartnership with the classroom teaching staff. Changes in Challenge enrollment over the past several years areprimarily due to standardization of Challenges services criteria and reporting, as well as the implications of an overalldistrict enrollment decline. The Challenge budget is also supported by state revenue, along with AdvancedPlacement student fees for the administration of AP testing and support services.
Historical Budget Information:
Budget Inc./(Dec.) %
2011‐12 Original 1,000,384 2011‐12 Revised 994,128 (6,256) ‐0.63%
Current Budget Information: Global Assumptions:
2012‐13 Proposed Preliminary: 1,031,802 Salaries ‐ All Staff: 2.67%Benefits ‐ All Staff 6.00%
Increase/(Decrease) ‐ $ 37,674
Increase/(Decrease) ‐ % 3.79%
1. Includes additional $6,000 for proportional distribution of Challenge services to Eisenhower elementary
Future Budget Considerations
2012‐13 Challenge Budget
Executive Summary
Financial Information
Budget Highlights
30

Budget Area: Other District Wide Expenses
Budget Manager(s): John Toop, Director of Business Services
Budget Description: Other district wide expenses include tuition payments for resident students attending WMEP sponsored FAIRand IDDS schools, contracted police liaison officer costs for the High School and safe school personnel for theJunior High Schools. Also, payments for Safe Schools to ISD # 287 and Interest Expense is in this budget.
Historical Budget Information:
Budget Inc./(Dec.) %
2011‐12 Original 1,517,712 2011‐12 Revised 984,674 (533,038) ‐35.12%
Current Budget Information: Global Assumptions:
2012‐13 Proposed Budget 980,456 Salaries ‐ All Staff 2.67%Benefits ‐ All Staff 6.00%
Increase/(Decrease) ‐ $ (4,218)
Increase/(Decrease) ‐ % ‐0.43%
1. Reduction of projected FY11‐12 Interest Expense for only potential late‐year borrowing. 2. Zero out FY12‐13 Interest Expense ($165,316) as no cash flow borrowing is projected to be necessary.
Future Budget Considerations
2012‐13 Other District Wide Expenses Budget
Executive Summary
Financial Information
Budget Highlights
31
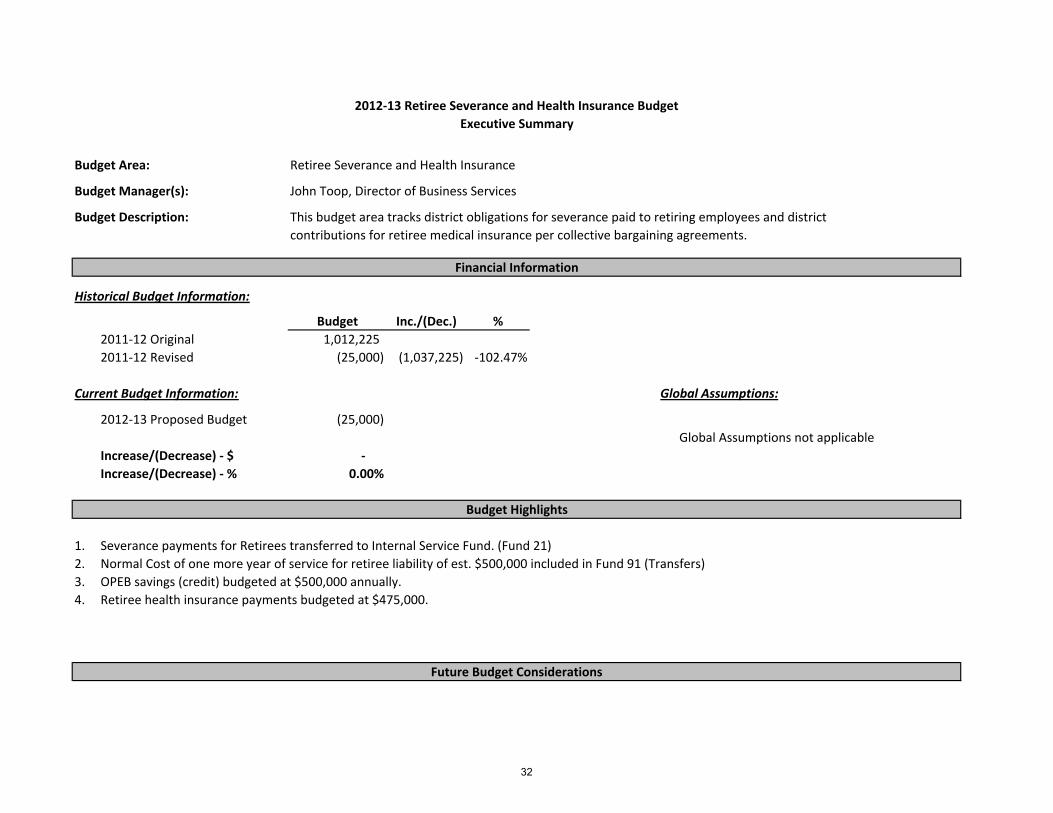
Budget Area: Retiree Severance and Health Insurance
Budget Manager(s): John Toop, Director of Business Services
Budget Description: This budget area tracks district obligations for severance paid to retiring employees and districtcontributions for retiree medical insurance per collective bargaining agreements.
Historical Budget Information:
Budget Inc./(Dec.) %
2011‐12 Original 1,012,225 2011‐12 Revised (25,000) (1,037,225) ‐102.47%
Current Budget Information: Global Assumptions:
2012‐13 Proposed Budget (25,000) Global Assumptions not applicable
Increase/(Decrease) ‐ $ ‐
Increase/(Decrease) ‐ % 0.00%
1. Severance payments for Retirees transferred to Internal Service Fund. (Fund 21) 2. Normal Cost of one more year of service for retiree liability of est. $500,000 included in Fund 91 (Transfers)3. OPEB savings (credit) budgeted at $500,000 annually.4. Retiree health insurance payments budgeted at $475,000.
Future Budget Considerations
2012‐13 Retiree Severance and Health Insurance Budget
Executive Summary
Financial Information
Budget Highlights
32
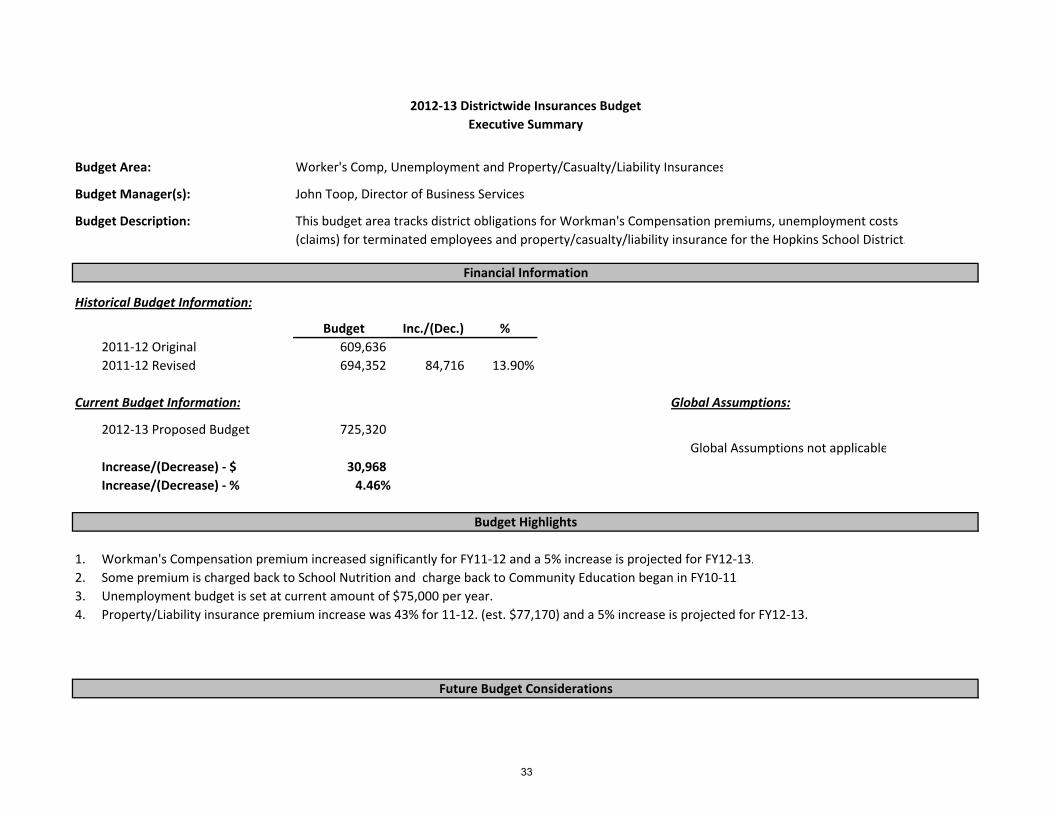
Budget Area: Worker's Comp, Unemployment and Property/Casualty/Liability Insurances
Budget Manager(s): John Toop, Director of Business Services
Budget Description: This budget area tracks district obligations for Workman's Compensation premiums, unemployment costs (claims) for terminated employees and property/casualty/liability insurance for the Hopkins School District.
Historical Budget Information:
Budget Inc./(Dec.) %
2011‐12 Original 609,636 2011‐12 Revised 694,352 84,716 13.90%
Current Budget Information: Global Assumptions:
2012‐13 Proposed Budget 725,320 Global Assumptions not applicable
Increase/(Decrease) ‐ $ 30,968
Increase/(Decrease) ‐ % 4.46%
1. Workman's Compensation premium increased significantly for FY11‐12 and a 5% increase is projected for FY12‐13.2. Some premium is charged back to School Nutrition and charge back to Community Education began in FY10‐11.3. Unemployment budget is set at current amount of $75,000 per year.4. Property/Liability insurance premium increase was 43% for 11‐12. (est. $77,170) and a 5% increase is projected for FY12‐13.
Future Budget Considerations
2012‐13 Districtwide Insurances Budget
Executive Summary
Financial Information
Budget Highlights
33

Budget Area: Elementary
Budget Manager(s): Alice Smith ‐ Jody de St. HubertEisenhower / XinXing ‐ Terri SiguenzaGatewood ‐ Donna MontgomeryGlen Lake ‐ Beth PotterL.H. Tanglen ‐ Gail Lewis‐MillerMeadowbrook ‐ Greta Evans‐Becker
Budget Description: Provides instruction to students in kindergarten through 6th grade in basic skills such as literacy, mathematics,the sciences, the arts, and self‐development skills.
Historical Budget Information:
Budget Inc./(Dec.) %
2011‐12 Original 15,958,337 2011‐12 Revised 16,129,006 170,669 1.07%
Current Budget Information: Global Assumptions:
2012‐13 Proposed Budget 16,608,552 Salaries ‐ All Staff 2.67%Benefits ‐ All Staff 6.00%
Increase/(Decrease) ‐ $ 479,547
Increase/(Decrease) ‐ % 2.97%
1. 2.00 FTE increase for enrollment ( 0 FTE for Reg Ed and 2 FTE increase for Xin Xing)2. Reallocation of final 1/3 of Media Generalists to CPL (3rd year of 3)3. Reflects XinXing All Day K Chgbk to Comm Ed4. Reflects All Day K Chgbk to Comm Ed5. Reflects 3 FTE charged to Targeted Staffing $160,287 (Direct charged to Targeted Staffing)6. Includes additional $76,000 for equalized prep time across all elementary schools7. Includes additional $71,000 (less $6,000 for Challenge = $65,000) for proportional distribution of support services for IKE
1. Elementary Study results financial implications
Future Budget Considerations
2012‐13 Elementary Budget
Executive Summary
Financial Information:
Budget Highlights
34

Budget Area: English Language Learners (ELL)
Budget Manager(s): Diane Schimelpfenig, Ed D., Director of Teaching and Learning
Budget Description: The English Language Learner program includes licensed and paraprofessional staffing for ELL services.
Historical Budget Information:
Budget Inc./(Dec.) %
2011‐12 Original 1,461,271 2011‐12 Revised 1,356,312 (104,959) ‐7.18%
Current Budget Information: Global Assumptions:
2012‐13 Proposed Budget 1,401,865 Salaries ‐ All Staff 2.67%Benefits ‐ All Staff 6.00%
Increase/(Decrease) ‐ $ 45,554
Increase/(Decrease) ‐ % 3.36%
1. No changes.
Future Budget Considerations
2012‐13 English Language Learners (ELL) Budget
Executive Summary
Financial Information
Budget Highlights
35

Budget Area: Fund 11 Tuition Programs
Budget Manager(s): Linda Gardner, Director of Special Services
Budget Description: Fund 11 covers the tuition based programs of Delta and Epsilon for students in bothregular and special education. Costs for non‐resident students are billed back to the resident district.
Historical Budget Information:
Budget Inc./(Dec.) %
2011‐12 Original 828,132 2011‐12 Revised 173,053 (655,079) ‐79.10%
Current Budget Information: Global Assumptions:
2012‐13 Proposed Budget 177,896 Salaries ‐ All Staff 2.67%Salaries ‐ All Benefits 6.00%
Increase/(Decrease) ‐ $ 4,843
Increase/(Decrease) ‐ % 2.80%
1. No changes.
Future Budget Considerations
2012‐13 Fund 11 Tuition Programs Budget
Executive Summary
Financial Information
Budget Highlights
36

Budget Area: Fund 71 ‐ Equity & Integration
Budget Manager(s): Nik Lightfoot, Ed.D, J.D. ‐ Assistant Superintendent
Budget Description: Fund 71 is a sub‐fund of the General Fund to track costs associated with the Desegregation program.Costs include staffing and payments to the West Metro Education Program (WMEP). This is a revenue‐based budget.
Historical Budget Information:
Budget Inc./(Dec.) %
2011‐12 Original 1,297,855 2011‐12 Revised 1,297,470 (385) ‐0.03%
Current Budget Information: Global Assumptions:
2012‐13 Proposed 1,273,925 Salaries ‐ All Staff: 2.67%Benefits ‐ All Staff: 6.00%
Increase/(Decrease) ‐ $ (23,545)
Increase/(Decrease) ‐ % ‐1.81%
Future Budget Considerations
2012‐13 Fund 71 ‐ Equity & Integration Budget
Executive Summary
Financial Information:
Budget Highlights
37

Budget Area: Fund 81 ‐ Federal Special Education
Budget Manager(s): Linda Gardner, Director of Special Services
Budget Description: Fund 81 is a sub‐fund of the General Fund and is maintained as a balanced fund ‐ meaning revenue equalsexpenditures. Local grants, Federal grants and Federal Special Education dollars are included in Fund 81.The Federal Special Education dollars are separated out from the Local and Federal Grants budget.
Historical Budget Information:
Budget Inc./(Dec.) %
2011‐12 Original 1,903,304 2011‐12 Revised 1,935,841 32,537 1.71%
Current Budget Information: Global Assumptions:
2012‐13 Proposed Budget 1,995,882 Salaries ‐ All Staff: 2.67%Benefits ‐ All Staff 6.00%
Increase/(Decrease) ‐ $ 60,041
Increase/(Decrease) ‐ % 3.10%
1. No changes.
Future Budget Considerations
2012‐13 Fund 81 ‐ Federal Special Education Budget
Executive Summary
Financial Information:
Budget Highlights
38

Budget Area: Fund 81 ‐ Local and Federal Grants
Budget Manager(s): Diane Schimelpfenig, Ed D., Director of Teaching and LearningJohn Toop, Director of Business Services
Budget Description: Fund 81 is a sub‐fund of the General Fund and is maintained as a balanced fund ‐ meaning revenue equalsexpenditures. Local grants, Federal grants and Federal Special Education dollars are included in Fund 81.The Local and Federal Grants portion is separated out from the Federal Special Education dollars.
Historical Budget Information:
Budget Inc./(Dec.) %
2011‐12 Original 2,528,326 2011‐12 Revised 2,140,137 (388,189) ‐15.35%
Current Budget Information: Global Assumptions:
2012‐13 Proposed Budget 1,847,931 Global Assumptions not applicable
Increase/(Decrease) ‐ $ (292,206)
Increase/(Decrease) ‐ % ‐13.65%
1. No changes
Future Budget Considerations
2012‐13 Fund 81 ‐ Local and Federal Grants Budget
Executive Summary
Financial Information:
Budget Highlights
39

Budget Area: Governance & Management
Budget Manager(s): Nik Lightfoot, Ed.D., J.D., Assistant Superintendent
Budget Description: Governance and Management encompasses the functions of the Board of Education, Superintendent's Office,Assistant Superintendent's office, Strategic Planning and graduation expenses.
Historical Budget Information:
Budget Inc./(Dec.) %
2011‐12 Original 1,005,692 2011‐12 Revised 1,017,232 11,540 1.15%
Current Budget Information: Global Assumptions:
2012‐13 Proposed Budget 1,028,733 Salaries ‐ All Staff 2.67%Benefits ‐ All Staff 6.00%
Increase/(Decrease) ‐ $ 11,500
Increase/(Decrease) ‐ % 1.13%
1. School Board 108,264 2. Office of Superintendent 358,336 3. Superintendent Contingency 100,003 4. Asst. Superintendent 358,896 5. Strategic Plan 57,034 6. Graduation 46,200
Total Governance & Mgmnt 1,028,733
Future Budget Considerations
2012‐13 Governance & Management Budget
Executive Summary
Financial Information
Budget Highlights
40

Budget Area: High School
Budget Manager(s): Patti Johnson, High School Principal
Budget Description: Encompasses art, business education, language arts, debate, drama, learning lab, mathematics,reading, speech, world languages, physical education, health science, technology education,instrumental and vocal music, science, social studies, alternative programs, distributive education, family and cosumer science, business and office education, work experience, career counseling and job placement,media services, and audio visual and television production.
Historical Budget Information:
Budget Inc./(Dec.) %
2011‐12 Original 8,760,132 2011‐12 Revised 8,957,236 197,104 2.25%
Current Budget Information: Global Assumptions:
2012‐13 Proposed Budget 9,055,332 Salaries ‐ All Staff 2.67%Benefits ‐ All Staff 6.00%
Increase/(Decrease) ‐ $ 98,096
Increase/(Decrease) ‐ % 1.10%
1. Decrease of .507 FTE for declining enrollment2. Reallocation of Media Generalists to CPL on phased in basis. (Yr. 3 of 3)
Future Budget Considerations
2012‐13 High School Budget
Executive Summary
Financial Information
Budget Highlights
41
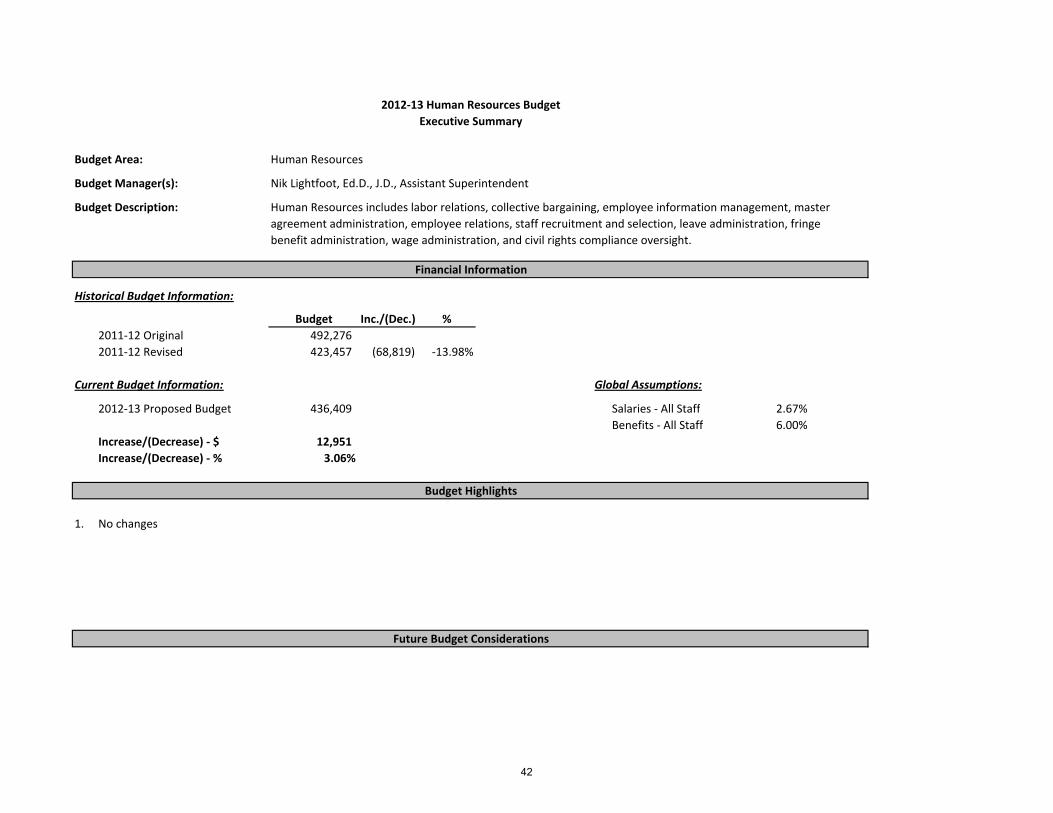
Budget Area: Human Resources
Budget Manager(s): Nik Lightfoot, Ed.D., J.D., Assistant Superintendent
Budget Description: Human Resources includes labor relations, collective bargaining, employee information management, masteragreement administration, employee relations, staff recruitment and selection, leave administration, fringebenefit administration, wage administration, and civil rights compliance oversight.
Historical Budget Information:
Budget Inc./(Dec.) %
2011‐12 Original 492,276 2011‐12 Revised 423,457 (68,819) ‐13.98%
Current Budget Information: Global Assumptions:
2012‐13 Proposed Budget 436,409 Salaries ‐ All Staff 2.67%Benefits ‐ All Staff 6.00%
Increase/(Decrease) ‐ $ 12,951
Increase/(Decrease) ‐ % 3.06%
1. No changes
Future Budget Considerations
2012‐13 Human Resources Budget
Executive Summary
Financial Information
Budget Highlights
42

Budget Area: Instructional Support
Budget Manager(s): Diane Schimelpfenig, Ed D., Director of Teaching and Learning
Budget Description: Includes Office of Teaching and Learning expenses, K‐12 curriculum coordination and building leadership,instructional and classroom mentors, extended learning experiences, and assessment coordination and analysis
Historical Budget Information:
Budget Inc./(Dec.) %
2011‐12 Original 1,220,690 2011‐12 Revised 1,234,558 13,868 1.136%
Current Budget Information: Global Assumptions:
2012‐13 Proposed Budget 1,526,677 Salaries ‐ All Staff 2.67%Salaries ‐ All Benefits 6.00%
Increase/(Decrease) ‐ $ 292,119 Increase/(Decrease) ‐ % 23.66%
1. Additional $253,000 added for Response to Intervention.
Future Budget Considerations
2012‐13 Instructional Support Budget
Executive Summary
Financial Information
Budget Highlights
43

Budget Area: Junior High
Budget Manager(s): Shirley Gregoire, West Junior High PrincipalBecky Melville, North Junior High Principal
Budget Description: Allows students to develop skills and explore their interests in the areas of reading, language arts, mathematics,science, social studies, art, music, health, business education, technology education, family and consumer sciences, physical education, and world language.
Historical Budget Information:
Budget Inc./(Dec.) %
2011‐12 Original 9,014,447 2011‐12 Revised 9,248,113 233,666 2.59%
Current Budget Information: Global Assumptions:
2012‐13 Proposed Budget 9,283,023 Salaries ‐ All Staff 2.67%Benefits ‐ All Staff 6.00%
Increase/(Decrease) ‐ $ 34,910
Increase/(Decrease) ‐ % 0.38%
1. Reduction of 2.09 FTE's for declining enrollment2. Reallocation of Media Generalists to CPL on phased in basis. (Yr. 3 of 3)
Future Budget Considerations
2012‐13 Junior High Budget
Executive Summary
Financial Information
Budget Highlights
44

Budget Area: Lindbergh Center
Budget Manager(s): John Toop, Director of Business Services
Budget Description: The Lindbergh Center is a shared‐use facility with the City of Minnetonka attached to Hopkins High School.
Historical Budget Information:
Budget Inc./(Dec.) %
2011‐12 Original 467,885 2011‐12 Revised 447,134 (20,751) ‐4.44%
Current Budget Information: Global Assumptions:
2012‐13 Proposed Budget 460,343 Salaries ‐ All Staff 2.67%Benefits ‐ All Staff 6.00%
Increase/(Decrease) ‐ $ 13,209
Increase/(Decrease) ‐ % 2.95%
1. No changes.
Future Budget Considerations
2012‐13 Lindbergh Center Budget
Executive Summary
Financial Information
Budget Highlights
45

Budget Area: Operations & Maintenance
Budget Manager(s): Patrick Poquette, Supervisor of Building and Grounds
Budget Description: Provides custodial, building maintenance, and utility support services. In addition, to cleaning and sanitizingthe district's 11 buildings, it includes building and utility repair, lawn care, snow removal and sanding, courierdeliveries, and laundry services.
Historical Budget Information:
Budget Inc./(Dec.) %
2011‐12 Original 6,267,007 2011‐12 Revised 6,121,386 (145,621) ‐2.32%
Current Budget Information: Global Assumptions:
2012‐13 Proposed Budget 6,594,080 Salaries ‐ All Staff 2.67%Benefits ‐ All Staff 6.00%
Increase/(Decrease) ‐ $ 472,694
Increase/(Decrease) ‐ % 7.72%
1. Revised 2011‐12 Budget reflects est. $300,00 savings in Natural Gas expense. This $300,000 amount is added back as an expense for 2012‐13.
Future Budget Considerations
2012‐13 Operations & Maintenance Budget
Executive Summary
Financial Information
Budget Highlights
46

Budget Area: Q‐Comp
Budget Manager(s): Nik Lightfoot, Ed.D., J.D., Assistant Superintendent
Budget Description: This is a revenue based budget predicated on enrollment. The district receives $260 per student.Quality compensation is paid to teaching staff when measurable individual and building goals are met.
Historical Budget Information:
Inc./(Dec.) %
2011‐12 Original 1,892,800 2011‐12 Revised 2,075,959 183,159 9.68%
Current Budget Information: Global Assumptions:
2012‐13 Preliminary: 2,077,839 Salaries ‐ All Staff: 2.67%Benefits ‐ All Staff: 6.00%
Increase/(Decrease) ‐ $ 1,879
Increase/(Decrease) ‐ % 0.09%
1. No changes.
Future Budget Considerations
2012‐13 Q‐Comp Budget
Executive Summary
Financial Information
Budget Highlights
47

Budget Area: Secondary Vocational ‐ Transition Disabled
Budget Manager(s): Linda Gardner, Director of Special Services
Budget Description: Provides transition skills in jobs and job training, postsecondary services to students with disabilities, ages 14 to 21, in 14 disability categories, including identification, referral and vocational assessments ofstudents needing transition services, and the development of individualized education plans in jobs and jobtraining, as well as postsecondary.
Historical Budget Information:
Budget Inc./(Dec.) %
2011‐12 Original 279,314 2011‐12 Revised 354,548 75,234 26.94%
Current Budget Information: Global Assumptions:
2012‐13 Proposed Budget 366,138 Salaries ‐ All Staff 2.67%Benefits ‐ All Staff 6.00%
Increase/(Decrease) ‐ $ 11,590
Increase/(Decrease) ‐ % 3.27%
1. No changes.
Future Budget Considerations
2012‐13 Secondary Vocational ‐ Transition Disabled Budget
Executive Summary
Financial Information
Budget Highlights
48

Budget Area: Secondary Vocational (Career and Technical Education)
Budget Manager(s): Diane Schimelpfenig, Ed D., Director of Teaching and Learning
Budget Description: Career and Technical Education (CTE) provides support and assistance to high school students throughcareer and technical education programs in Minnesota schools. CTE students gain academic and technicalskills in various occupational pathways and develop solid college and career paths while still in school.The District receives funding under the federal Carl D. Perkins and Tech Prep programs, and local careerand technical education levies.
Historical Budget Information:
Budget Inc./(Dec.) %
2011‐12 Original 853,846 2011‐12 Revised 710,461 (143,385) ‐16.79%
Current Budget Information: Global Assumptions:
2012‐13 Proposed Budget 730,942 Salaries ‐ All Staff 2.67%Benefits ‐ All Staff 6.00%
Increase/(Decrease) ‐ $ 20,481
Increase/(Decrease) ‐ % 2.88%
1. No changes.
Future Budget Considerations
2012‐13 Secondary Vocational (Career and Technical Education) Budget
Executive Summary
Financial Information
Budget Highlights
49
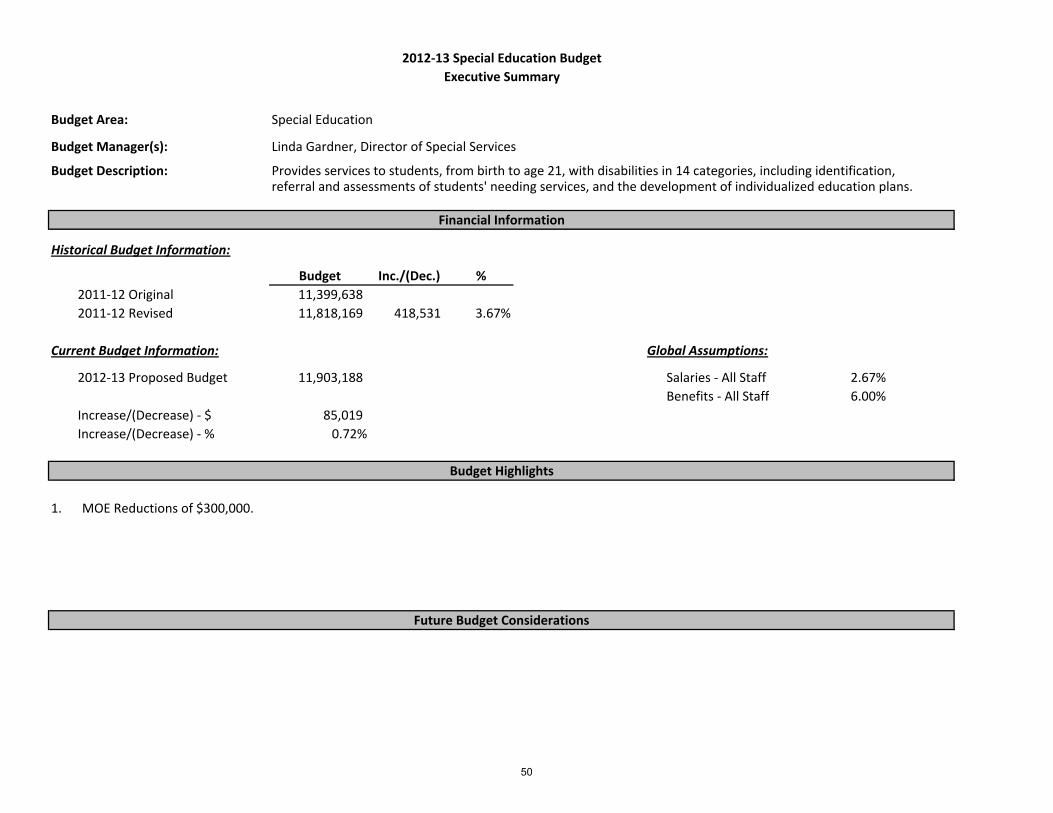
Budget Area: Special Education
Budget Manager(s): Linda Gardner, Director of Special Services
Budget Description: Provides services to students, from birth to age 21, with disabilities in 14 categories, including identification,referral and assessments of students' needing services, and the development of individualized education plans.
Historical Budget Information:
Budget Inc./(Dec.) %
2011‐12 Original 11,399,638 2011‐12 Revised 11,818,169 418,531 3.67%
Current Budget Information: Global Assumptions:
2012‐13 Proposed Budget 11,903,188 Salaries ‐ All Staff 2.67%Benefits ‐ All Staff 6.00%
Increase/(Decrease) ‐ $ 85,019 Increase/(Decrease) ‐ % 0.72%
1. MOE Reductions of $300,000.
Future Budget Considerations
2012‐13 Special Education Budget
Executive Summary
Financial Information
Budget Highlights
50

Budget Area: Student Activities
Budget Manager(s): Dan Johnson, Director of Activities
Budget Description: Includes competitive sports, intramural activities, Debate, Theatre, and non‐varsity sports programs.
Historical Budget Information:
Budget Inc./(Dec.) %
2011‐12 Original 1,290,811 2011‐12 Revised 1,309,904 19,093 1.48%
Current Budget Information: Global Assumptions:
2012‐13 Proposed Budget 1,391,729 Salaries ‐ All Staff 2.67%Benefits ‐ All Staff 6.00%
Increase/(Decrease) ‐ $ 81,825
Increase/(Decrease) ‐ % 6.25%
1. .4 FTE Strength and Conditioning Staffing for FY12‐13.
Future Budget Considerations
2012‐13 Student Activities
Executive Summary
Financial Information
Budget Highlights
51

Budget Area: Targeted Staffing
Budget Manager(s): Nik Lightfoot, Ed D, J.D., Assistant Superintendent
Budget Description: This budget package was created to provide staffing flexibility within the budget. Positions coveredunder the targeted staffing budget package are temporary positions.
Historical Budget Information:
Budget Inc./(Dec.) %
2011‐12 Original 381,988 2011‐12 Revised 558,249 176,261 46.14%
Current Budget Information: Global Assumptions:
2012‐13 Proposed Budget: 782,561 Salaries ‐ All Staff: 2.67%Benefits ‐ All Staff: 6.00%
Increase/(Decrease) ‐ $ 224,312
Increase/(Decrease) ‐ % 40.18%
1.2.3.
Staffing is based on determined needs after staffing is completed in the Elementary, Junior High and High School budgeting packages.
2012‐13 Targeted Staffing Budget
Executive Summary
Financial Information
Budget Highlights
Board motions to increase Targeted Staffing for FY11‐12 by approximately $201,000. Actual estimate is $176,261.
Includes $60,000 for 1.0 FTE for 7th/8th grade math test prep
Future Budget Considerations
52

Budget Area: Transportation
Budget Manager(s): Derrick Agate, Supervisor of Transportation
Budget Description: Includes the transportation of regular, disabled, nonpublic and desegregation students and the transportation of students to the West Metro Education Program (WMEP) magnet schools.
Historical Budget Information:
Budget Inc./(Dec.) %
2011‐12 Original 5,966,303 2011‐12 Revised 5,093,137 (873,166) ‐14.63%
Current Budget Information: Global Assumptions:
2012‐13 Proposed Budget 5,200,375 Salaries ‐ All Staff 2.67%Benefits ‐ All Staff 6.00%
Increase/(Decrease) ‐ $ 107,238
Increase/(Decrease) ‐ % 2.11%
1. Routing efficiencies identified in accordance and adhering to School Board policy.2. Routing efficiencies credited per Supv. of Transportation estimates for FY11‐12 and carried forward into FY12‐13.
Future Budget Considerations
2012‐13 Transportation
Executive Summary
Financial Information
Budget Highlights
53

Budget Area: Fund 91 ‐ Program Adjustments, Enhancements, One‐Time Expenses and Transfers
Budget Manager(s): Supt. John Schultz, PhD
Budget Description: Program adjsutments and enhancements are proposed on an annual basis and considered by theSchool Board as part of the preliminary and final budget approval. One‐time expenses allow the districtto spend excess fund balance on areas such as technology and not incur ongoing costs. Fund Transfersare explained to and approved by the School Board in the budgeting process.
Historical Budget Information:
Budget Inc./(Dec.) %
2011‐12 Original 411,570 2011‐12 Revised 1,822,455 1,410,885 342.81%
Current Budget Information: Global Assumptions:
2012‐13 Proposed Budget 1,427,000 Global Assumptions not applicable
Increase/(Decrease) ‐ $ (395,455)
Increase/(Decrease) ‐ % ‐21.70%
1. Pre‐K @ Alice Smith and Eisenhower 150,000 2. Elementary AVID 18,000 3. One Voice Transitional Funding 35,000 4. Marketing (Transfer to Community Ed) 368,000 5. Exploratory/First‐Year IB Candidacy 109,000 6. HHS Strategic Work 17,000 7. Behavior Intervention programming and data tracking (PBIS & SWIS) 30,000 8. Transfer from General Fund to Self‐Insured Retiree Severance for Normal Cost 500,000 9. Digital Content 200,000
Total Program Adjustments, Enhancements, One‐Time Expenses and Transfers 1,427,000
Future Budget Considerations
2012‐13 Fund 91 ‐ Program Adjustments, Enhancements, One‐Time Expenses and Transfers
Executive Summary
Financial Information
Budget Highlights
54

Budget Area: Staff Development
Budget Manager(s): Diane Schimelpfenig, Ed D., Director of Teaching and Learning
Budget Description: Staff development includes building and District staff development opportunities. By law, 50% of staff development funds are allocated to the school sites on a per pupil basis, 25% is allocated to the sites forDistrict initiatives, and 25% supports District staff development initiatives.
Historical Budget Information:
Budget Inc./(Dec.) %
2011‐12 Original 867,301 2011‐12 Revised 1,061,109 193,808 22.35%
Current Budget Information: Global Assumptions:
2012‐13 Proposed 873,002 Salaries ‐ All Staff: 2.67%Benefits ‐ All Staff: 6.00%
Increase/(Decrease) ‐ $ (188,108)
Increase/(Decrease) ‐ % ‐17.73%
1. Staff development amount reflects current law allocation with a transfer of $324,242 to General Fund Unassigned revenueper MDE approval.
Future Budget Considerations
2012‐13 Staff Development Budget
Executive Summary
Financial Information
Budget Highlights
55

Independent School District #270 HOPKINS SCHOOLS
Budget Year 2012-13
GENERAL FUND (01)
FUND ANALYSIS DESCRIPTION: The General Fund is used to show all operations of the School District which are not accounted for in other special purpose funds. This fund includes teacher and administrator salaries and fringe benefits as well as all operations and maintenance activities. Since salaries and benefits make up approximately 80% of the district’s expenditures, this fund represents the major operating fund for our district. Legislation has combined the former Transportation Fund and the Capital Expenditure Fund with the General Fund. A separate program is maintained for transportation and a reserved program is maintained for capital expenditures within the General Fund. FUND SUMMARY Estimated General Fund Unassigned Fund Balance (6/30/12) 11,578,808 2012-13 Budgeted Revenues & Transfers In 81,496,509 2012-13 Budgeted Expenditures & Transfers Out 81,128,612 Estimated Fund Balance (6/30/13) 11,946,705
Projected revenues and expenditures include the transportation program.
We use a number of sub funds within the General Fund, which are included in the above summary. Our sub funds include:
Sub Fund 11/Used for tuition programs/Special Services Sub Fund 41/Used for Staff Development programs Sub Fund 51/Lindbergh Center shared use facility with the City of Minnetonka Sub Fund 71/This sub fund contains all activities related to desegregation Sub Fund 81/Used for Federal Title and Federal Special Education grant programs and
local grants. This is maintained as a balanced sub-fund. Sub Fund 91/Pilot Programs and one time expense
State accounting laws and regulations for school districts establish various required reserves. Other items are set aside by the School Board itself in the form of Committed or Assigned fund balances per the new GASB 54 fund balance requirements. The following Committed, Assigned and Restricted reserves are in the General Fund and their projected revenues and expenses and ending projected reserve amounts as of June 30, 2013 are as follows:
56

Reserve Account Est. Balance
6/30/12 Revenues
FY13 Expenses
FY13 Est. Balance
6/30/13 Committed for Severance To ISF (1) 0 0 0 Restricted for Operating Capital
250,722 2,572,384 2,556,877 266,229
Restricted for Health & Safety
(435,172) 294,988 400,000 (540,184)
Restricted for Staff Development
(8) 873,010 873,002 0
Assigned for Elementary Study
68,000 0 68,000 0
Assigned for Elementary AVID
36,000 0 18,000 18,000
Assigned for QComp WJH
10,755 0 0 10,755
Assigned for HEA Settlement
1,223,113 0 1,223,113 (2) 0
(1) Committed for Severance was transferred during FY11-12 to a separate Internal
Service Fund. Committed for Severance represents the estimated actuarial liability for all severance payouts for all staff. The estimate is required to be updated every two years. As of this writing, the actuarial liability is set to be updated in the summer of 2012, with the new estimated actuarial liability to be reflected in the audit report for the fiscal year ending June 30, 2012. The actuarial liability as of the June 30, 2011 audit report was $8,188,384.
(2) Assigned for HEA Settlement is an estimated amount assigned in FY12 after settlement of the Hopkins Education Association contract agreement that represents the amount in excess of proportionate available new revenue for the HEA contract settlement. Since the contract runs from July 1, 2011 – June 30, 2013, the assignment will expire at the end of the contract and go back into the Unassigned fund balance as of June 30, 2013.
COMMENTS:
Our cash flow projections show no need for cash flow borrowing in FY 2012-13. Our fund balance in the General Fund is the main reason we show such a strong cash position, as the fund balance provides a cushion for seeing us through times when State Aid and County tax receipts do not match up with our expenses. In our preliminary budget approval on March 15th , we had projected interest expense for cash flow borrowing of $165,316. In our original FY 12-13 budget for School Board approval on May 31, we have now budgeted $0 for interest expense.
The revenues and expenditures were prepared using fund projection recommendations
by the Board of Education. The School Board adopted the 2012-13 budget parameters in January 2012. Preliminary budget approval was adopted at the March 15th School Board meeting. The 2012-13 legislative session that recently adjourned had no impact to the General Fund budget. We have budgeted for a 1% ($50) increase in basic student aid. Title I and other Federal allocations are factored in as equal revenue and
57

expense amounts at this time. Additional budget recommendations and adjustments will be made during the finalization process occurring in February 2013.
Revenue notes include:
Interest income was set at $3,691. Investment earnings on idle cash continue to be at all-time lows. This estimate reflects the 2010-11 actual amount of investment income.
State aid increase of 1%. Enrollment decline will offset much of this state aid
increase. The scheduled additional local operating levy increase of $42 per pupil ($1,713 to $1,755) from FY12 to FY13 (originally approved by voters in November 2005) is included in the projected revenues for the district. Certain local revenues are projected to increase by 0.5%.
For general education revenue calculation purposes student enrollment is projected
from the 10/1/11 district enrollment projections. The district typically has used 10/1 data for enrollment projection purposes for the subsequent budget year, with a true-up to the actual 10/1 numbers occurring in the mid-year budget adjustment in February.
Expenditure notes include:
All salaries were increased at 2.67%, while benefits were estimated to increase at a global settlement percentage increase of 6.0%. All other costs are projected at an increase of 2%.
Superintendent contingency was set at $100,000.
The revenue and expenditure activities relative to Federal programs for next year have been budgeted on an estimated basis (Sub Fund 81). We will make mid-year adjustments in February 2013 when more accurate revenue and expenditure information is available. Other Budget notes:
The district does not budget for delinquent taxes because it cannot be predicted when they will be paid. Patrons have up to seven years to pay back delinquent taxes. The delinquent tax receivable amount for all funds as of June 30, 2011 is $453,859, a decrease of $230,816 from June 30, 2010.
Abatement adjustments have been budgeted and are reflected in levy revenue in the
respective funds. The General Fund proposed budget is being presented as determined by the parameters given by the Board of Education. We are projecting revenues will exceed expenses in the General Fund in FY 2012-13 given the assumptions we have made. General Fund challenges include:
Maintaining expenditure levels that do not exceed budgeted revenues to maintain a solid financial position in our General Fund Undesignated fund balance.
58

Maintaining our fund balance at 6% or greater level (Board policy) within the subsequent years.
We will continue to monitor these fiscal challenges in order to provide the best educational programming possible for the Hopkins School District students within a fiscally sustainable environment.
59

Independent School District #270 HOPKINS SCHOOLS
Budget Year 2012-13
TRANSPORTATION PROGRAM (THIS PROGRAM IS INCLUDED IN THE GENERAL FUND)
PROGRAM ANALYSIS DESCRIPTION: The Transportation Program is used to record financial transactions related to providing pupil transportation, i.e., those activities involved with conveyance of pupils to and from school activities, as provided by State law for both public school students and non-public schools students (including handicapped students). Authorized transportation activities include the following:
1. All regular transportation between residence and school for students greater than one mile from school.
2. Noon kindergarten transportation. 3. Late activity bus transportation. 4. Between schools transportation 5. Special Services transportation. 6. Hazardous transportation for students less than one mile from school. 7. WMEP transportation services. 8. The Choice is Yours transportation services.
Under present State statutes, the transportation fund has been combined with the general fund effective in FY 1997. We will continue to account for transportation activities as a separate program so that expenditures will remain easy to differentiate. When reporting to the State, transportation expenditures will be coded (crosswalked) to the general fund. PROGRAM SUMMARY 2012-13 Expenditures $5,200,375 COMMENTS:
The district will begin its sixth year of contracting regular bus service with Mainline Transportation Inc. formally known as Minnetonka Transportation, Inc., in addition to the special needs transportation MTI has provided for many years. A new contract has been negotiated with MTI for 12-13 for two years, with an option to extend for an additional two years.
The bus depot purchased by the District in Golden Valley will be in its sixth
operational year in 2012-13.
60

Transportation will also be provided for the International Spanish Language
Academy (ISLA) located on Shady Oak Road and for the Xin Xing Academy Chinese Immersion Language School located inside of Eisenhower Elementary School.
Eliminated Elementary Shuttle System. This system was used in the 2010-2011 school year to transport students together who otherwise attended school at multiple sites: Eisenhower Elementary, Xin Xing Academy, The Blake School, St. John’s Catholic and ISLA. Students would be transported to Eisenhower Elementary school where some students would simply get off the bus to attend Eisenhower or Xin Xing. The remaining students would get off their regular bus and transfer to a shuttle bus that would transport them to their final destination. The reverse would happen in the afternoon at the end of the program day. This system caused great confusion amongst the students, parents, staff and bus drivers. In the 2011-2012 school year, the Transportation Department successfully eliminated this system by routing all students to their individual campuses without adding cost. We believe this is a benefit to all parties involved.
The District entered into a service sharing arrangement with The International School of Minnesota. Transportation provides routing services for a fee and shares the cost of three buses. We expect this agreement to continue for next school year.
The District purchased five Type II-A buses in August, 2011. Four of those new
vehicles are now being used to transport students to and from Transition Plus. District staff members are being trained in-house to safely drive those vehicles and transport students. These staff members transport students with these new vehicles daily during the school year, saving the District transportation dollars that would otherwise have to be paid out to our contractor.
61

Independent School District #270 HOPKINS SCHOOLS
Budget Year 2012-13
CAPITAL EXPENDITURE RESTRICTED PROGRAM ACCOUNTS (THIS PROGRAM IS INLCUDED IN THE GENERAL FUND AS RESTRICTED)
PROGRAM ANALYSIS DESCRIPTION: The Capital Expenditure Fund is made up of the following two sub accounts: 1. Operating Capital (including expenses for Lease Levy) The Operating Capital program revenue is used for purchases of equipment, improvements to buildings, vehicle purchases, operation and maintenance of telecommunications systems, computers, related equipment, and network and application software. Lease levy revenue is used to pay for leased space costs that are approved by the Minnesota Department of Education annually. 2. Health & Safety The Health and Safety revenue may be used only for expenditures necessary to correct fire safety hazards, life safety hazards, or for the removal or encapsulation of asbestos related repairs, cleanup and disposal of PCP’s found in school buildings or property, or the cleanup, removal, disposal, and repairs related to storing transportation fuels such as alcohol, gasoline, fuel oil, and special fuels. PROGRAM SUMMARY 2012-13 Total Budgeted Expenditures 2,956,877
Operating Capital (incl. Leave Levy Expense) & Transfers 2,556,877
Health & Safety 400,000 COMMENTS:
Present funding in the Operating Capital fund is inadequate to meet all of the School District’s capital needs, however, eligibility in the Alternative Facilities Bonding and Levy Program provides budget relief for the Operating Capital account.
All revenues for the Operating Capital program are a part of the General
Education revenues, while the Lease Levy and Health & Safety Levy are separate levies based on approved expenses.
62

����������� ��
������������������������
������������������������� ���� � � �� � � � � ! � !� " � "� #
������������������������� $% $&�! $&%!$& % $�#�$& $�%�$ " $�#�$��� $�!�$���
'����������(�)��������� � � � � �
*�����*��+�����*��+ #%#$ �� &! $! � �#"$� � �%#$ �� �#�$��� �#�$���
'�,���-��������)���� "%$&! !�$�%!
(������������������������������ $""#$# $!#"$� $#�#$!!� $#� $!%" $#��$��� $"%�$���
������������������./������ ���� � � �� � � � � ! � !� " � "� #
0�/�������� "�"$ #! !%#$ #% !�"$!�# !� $%�# ! &$�&� !! $% �
(�)������)��������+10����������2��� "�$##� "#$"�� � � � �
���������(�)�3������+10����������2��� �
(����2������4�������0��� "& $ �� " &$ "�
��-������*���� 5������������������������6��,�)���*��+7 � � � � � �
*�����*��+�./����� #%#$ �� &! $! � &��$&"" �!"$��# ���$��# %��$ "
8��(�('* $&& $!&% $ & $�#� �%!$�"� $"& $� � $�%�$&�" $ " $�#%
������1(��)����0�������� #$��� �#$��� �#$��� & $�%% �#$��� �#$���
��������������+�����./������ &%$&!� " $��& � �
! '������)� ��$��� ��$��� ��$��� % $!%! ��$��� ��$���
" .��)������������)�������� #$��� !#$��� !#$��� %$%!" !#$��� !#$���
# �����)���-$������)�����9�'�����-��� ��$��� !��$��� !��$��� "�$ #� !��$��� !��$���
& ������������� !#�$���
� )���)����:��-�����-�����5�--����2� � �;�< ��$����;���7 � �
% (�)������+�����=�������)�������������� #�$��� #�$��� #�$��� !$#�# #�$��� #�$���
� '����������(�)��./������
� (�)������+�����./������ � %$�#
>��=����?�����
�2�=����*�)������
! �����)�����?�����������
" ��-������*�:�
# ���������9�4������1�)����+ !��$��� !��$��� !!�$��� "�$ #� !��$��� !��$���
& ��)��������)�� � &#$��� &#$��� &#$��� &#$��� &#$���
� ���������'���)����� #�$��� ��$��� ��$��� % $!%! ��$��� ��$���
% '��)��-�������-�)����������5 �;�< �$���7�5�������)������7
� .������=�����=�(@�-�����
� 0���������+�;���
0���������+���������;�?A�
./�����������;���
! B�������(��)����)����+���2�=���
" �����+���������)�����������)����� &$��� &$��� &$��� &$��� &$��� &$���
# �����+������������+�������������� #�$���
& .������=�����--����+�����������������)+�5��--�.�7 #$��� #$��� �$#�& #$��� #$���
� 4����������������)+�5����������22�)�7 � � !�$��� � � !�$���
% ���������)+�5'�-����������������)��7 � � � � � �
� '�,���-��������)���� 5 ��$ %%7
!� (�-������'�������)��+���- �$#��
! ���������.��*�:���-���� &$���
! B.�@�)���C���)� ������-��D��� �$���
!! C����=:�����B���������������- %$���
!" C���)��������:������ #$��� #$��� #$��� #$��� #$��� #$���
!# ���������� ����������2�B.�2�������������������+ !�$�"&
!& .������=�������+�2���B�2���������9��))�������� �$� �
!� 4����*����B�������)����6���)�����2���������9��))�������� �$� �
!% ������)�=�����������:�����������4���=����.��-�����+ %�$���
!� C���2+�'��)��-����)�������-��������-��� #�$���
"� C���2+�B.�)�������-��������-��� !�$���
" (��2�0����������)�-���
" �����)�-�����2�.��C��D��� �
"! ./���������2�>A��C��D��� � � !#$���
"" �����)�-�����2�*���:�����)���:������5������=����+7 � %�$���
"# 4���=����*�)���� �
"& 4����*�����������- �
"� >A����2�������(�:��� �
"% ��)��������������2�������������- �
"� '��)��-����������-�����-��� !�$���
#� ���������*�:���-������� � #�$���
# ��������������-�������(������1���+�������;�4����*��� #�$���
# B.����+�����������:��������� � !�$���
#! *��������*�����������4���=��� #$���
#" C���2+�B.�)�������-5�7 �$���
## �����-���������2�)����+ � "�$���
8��(�('* $�&%$��! $ ""$�%% $#"�$��� $��"$%#� $"�&$��� $ � $���
(�('* !$&!�$ � $"�&$ "# $#! $�"� $##&$%�� $"�!$&�" $!"!$�#%
.����2�+������������2�������E�����2����:����)� !!�$"#& �%$!! #�$� &&$ % � $##" "��$"�&
�F F �F �F F �F
�������9��2��+
��������2��-���9��*��+ �& $"" &#�$�#� !&%$#& �"$�%% "��$��� "��$���
�������9��2��+ 5'�����:,�)������������������7 #%&$ # & !$�& "��$��� "��$��� "��$��� "��$���
.����2�+������������2�����9��2����:����)� 5!!�$�&�7 5!��$� 5!! $"�"7 5"!�$" &7 5"!�$" &7 5"!�$" &7
(�������������0����������� !$ ��$�#" !$��"$��% $%�!$�� $%&�$!� $���$��� $%%�$���
(�������������0����./������ "$ &$"%& !$� �$ �� $�! $�"� $�#&$%�� $%�!$&�" $�"!$�#%
63

Independent School District #270 HOPKINS SCHOOLS
Budget Year 2012-13
FOOD SERVICE FUND (02)
FUND ANALYSIS DESCRIPTION: The Food Service Fund accounts for all transactions related to school nutrition operations, i.e., those activities which have as their purpose the preparation and serving of breakfast, lunches, snacks and incidental meals in connection with school activities; the department also oversees the implementation of the District-wide Wellness Policy. It should be noted that this is a stand alone fund, meaning that this fund does not have a levy as a source of revenue, but rather is a fee based fund, with additional revenue provided through State and Federal government reimbursements per meal. The School Nutrition program continues to evolve to a program that emphasizes whole child wellness. Our school nutrition department is identified internally as Royal Cuisine Student Nutrition Services. Mission Statement
As a nurturing culinary team, we are committed to providing learners
with healthy and diverse choices, nutritional and sensory experiences through education,
and foster community involvement and partnerships while providing extended culinary services
Nutrition Statements Our student, staff & auxiliary dining programs will… …encourage consumption of healthy and diverse food choices within USDA guidelines
…offer foods that are fresh, high quality and minimally processed
…increase natural fibers & other natural ingredients while reducing caloric intake
…teach lifelong eating habits that reinforce a belief in moderate consumption of all food groups
64

(02) FUND SUMMARY Estimated Fund Balance (6/30/12) 54,813 2012-13 Budgeted Revenues & Transfers In 4,230,224 2012-13 Budgeted Expenditures & Transfers Out 4,130,677 Estimated Fund Balance (6/30/13) 154,360 COMMENTS:
Reimbursable student lunch prices will increase by $.10 across all grade levels for SY 12-13. Breakfast & milk prices will remain the same for 12-13.
Breakfast and lunch prices are presently set at:
Elementary Junior High High School Adult
Breakfast SY 11-12 (Actual) 1.25 1.75 1.75 2.05
Breakfast SY 12-13 (Approved) 1.25 1.75 1.75 2.05
Lunch SY 11-12 (Actual) 2.55 2.80 3.05 3.55/3.70
Lunch SY 12-13 (Approved) 2.65 2.90 3.15 3.65/3.80
The school nutrition receives no General Fund Revenue for the administration of
the Application for Educational Benefits program for the District. The Application for Educational Benefits data is used for several General Fund compensation formulas by the State and Federal government for programs other than student meals. This program is expected to generate over $2.8 million dollars in Minnesota Compensatory Aid Revenue for schools to use to help improve student achievement in SY 2012-13. The annual cost of administering this program for the District is very conservatively estimated at $50,000.
The school nutrition fund currently receives no funding support through the Capital Expenditures fund. The department is exploring ways to fund the completion of the student cafeteria & kitchen remodel projects of Glen Lake, Tanglen and North Junior High School to conclude the cycle of updating student nutrition facilities to accommodate healthier school meal initiatives.
Fiscally, beginning in 06-07 and continuing each fiscal year, a chargeback of
$200,000 has been made from the General Fund (Fund 01) to the school nutrition Fund (Fund 02) to cover custodial cleanup of kitchen areas and cost of custodial supplies in all district buildings. This reduces expenses in the General Fund by $200,000.
65

Independent School District #270 HOPKINS SCHOOLS
Budget Year 2012-13
COMMUNITY SERVICE FUND (04)
FUND ANALYSIS DESCRIPTION: Community Education provides programs and services designed to meet the needs of all segments of the community; preschoolers through senior citizens, including but not exclusive of education, recreation, cultural and civic affairs, social services, and neighborhood concerns. It is the goal of Community Education to promote the optimum use of resources (human, monetary, and physical facilities) in the development of these programs and services. All non-public activities for Health, Guidance and Counseling, and textbooks are also included in this fund as well as Early Childhood Health Screening. Adult Basic Education activities are also included in this fund. FUND SUMMARY Estimated Fund Balance (6/30/12) 921,479 2012-13 Budgeted Revenues & Transfers In 9,241,361 2012-13 Budgeted Expenditures & Transfers Out 9,177,112 Estimated Fund Balance (6/30/13) 985,728 COMMENTS:
Many Community Education revenue formulas are generated from the School District population. The 2000 census number used for our population is 62,483.
User fees account for an estimated 55% of this funds revenue. Due to the fact that
this fund is largely fee driven, the District tends to have greater fiscal control throughout the fiscal year. This fund remains under strong fiscal control by all of the budget managers within the Community Service programs.
As the Community Education budget was developed for the 2012-13 school year,
efficiencies across all departments within Community Education were considered.
The Community Service Fund will maintain a positive fund balance position for the 2012-13 fiscal year.
66

Independent School District #270
HOPKINS SCHOOLS Budget Year 2012-13
BUILDING CONSTRUCTION FUND (06)
FUND ANALYSIS DESCRIPTION: This fund is established in a District where building construction has been authorized by voters with a bond issue and/or a Capital Projects Levy. If a district qualifies for funding under the Alternative Facilities Bonding and Levy Program the revenue and expense for this program is also accounted for in this fund. All costs related to construction and the equipping of facilities from the sale of bond proceeds must be recorded in this fund. There shall be no borrowing from this fund. Any cash balance or investment in a building construction fund is held in trust for authorized projects and must not be used to support cash deficits in other funds. The voters of the Hopkins District approved a $3 million building bond on November 2, 2010 for safety and security improvements at all schools and parking lot improvements. These funds were received in April 2011 for use in the summers of 2011 and 2012. It is anticipated that these funds will be spent out as of June 30, 2012. This is a restricted account. On November 2, 2010 the voters of the Hopkins School District also approved a renewal and increase of the Capital Projects Levy for Curriculum and Technology. This vote increased the amount of the levy up to $6.5 million, based on a fixed tax rate levied on net tax capacity, for 10 years. The funds will be received beginning July 1, 2011 for FY 11-12. The levy amount, because it is based on a fixed tax rate, fluctuates based on market values translated into Total Taxable Net Tax Capacity. In a declining market value for real estate, the Capital Projects Levy will only generate $6,164,119 of revenue for FY12-13. It is anticipated that we may have another decrease in this levy for FY13-14. The Total Cost of Ownership (TCO) of district technology will reside in this fund. This is also a restricted account. The Alternative Facilities Bonding and Levy program’s Phase III activities for deferred maintenance continue according to its State approved 10-year facilities plan. Phase III activities will continue through the summer of 2012. Bonding for Phase IV activities will occur during FY12-13, with Phase IV activity scheduled for the summers of 2013 and 2014. This is also a restricted account.
67

FUND SUMMARY 2012-13 Budgeted Expenditures Construction Bond Restricted Fund Estimated Fund Balance (6/30/12) 0 Construction Bond Revenues 0 Construction Bond Expenses 0 Estimated Fund Balance (6/30/13) 0 2012-13 Alternative Facilities Bond & Levy Restricted Fund Estimated Fund Balance (6/30/12) 150,000 Alternative Facility Revenues 15,306,087 Alternative Facility Expenses 7,500,000 Estimated Fund Balance (6/30/13) 7,956,087 2012-13 Capital Projects Levy for Curriculum and Technology Restricted Fund Estimated Fund Balance (6/30/12) 0 Capital Project Levy Revenues 6,164,119 Capital Project Levy Expenses 6,067,326 Estimated Fund Balance (6/30/13) 96,793
68

Independent School District #270 HOPKINS SCHOOLS
Budget Year 2012-13
DEBT REDEMPTION FUND (07) and OPEB DEBT FUND (47)
FUND ANALYSIS DESCRIPTION: The Debt Redemption Fund is established to finance bonded indebtedness whether for building construction or operating capital, and whether for initial or refunding bonds. When a bond issue is sold, the school board must levy a direct general tax upon the property of the district for the payment of principal and interest on such bonds as due. Revenue from sale or loss of property financed with bonds in an amount sufficient to pay remaining bonds and interest costs should be deposited in this fund. There shall be no borrowing from the Debt Redemption Fund. Refunding bonds that have been set aside in a reserved account are no longer a part of the fund balance. This reveals a true fund balance position. Bond activity during FY 11-12 was as follows: The 2002 Bonds refunded in December 2006 and held in an escrow account were paid off as of February 1, 2012. It is anticipated that a crossover refunding of the $9,870,000 2004 G.O. bonds will be completed by June 30, 2012. This refunding is estimated to generate for district taxpayers $600,000 of net present value savings. FUND SUMMARY (FUND 07) Estimated Fund Balance (6/30/12) 2,320,046 2012-13 Budgeted Revenues 13,943,190 2012-13 Budgeted Expenditures 13,174,105 Estimated Fund Balance (6/30/13) 3,089,131
69

OTHER POST-EMPLOYMENT BENEFITS (OPEB) BONDS (FUND 47) Estimated Fund Balance (6/30/12) 70,168 2012-13 Budgeted Revenues 968,077 2012-13 Budgeted Expenditures 923,978 Estimated Fund Balance (6/30/13) 114,267 2002 Bonds refunded in December 2006 held in escrow: Paid off as of 2/1/12 Estimated Escrow account Fund Balance (6/30/12) 0 2012-13 Budgeted Revenues 0 2012-13 Budgeted Expenditures 0 Estimated Escrow account Fund Balance (6/30/13) 0 COMMENTS:
At this time, the District’s bond rating is Aa2, with only a handful of other
School Districts in the State of Minnesota having an equal or higher rating.
Included on the following 4 pages is a summary of District bond payments for FY12-13 and future years, along with a proposed schedule for the crossover refunding of the 2004 bonds.
This fund remains a balanced fund with adequate revenues to meet bond payments during the 2012-13 fiscal year.
70
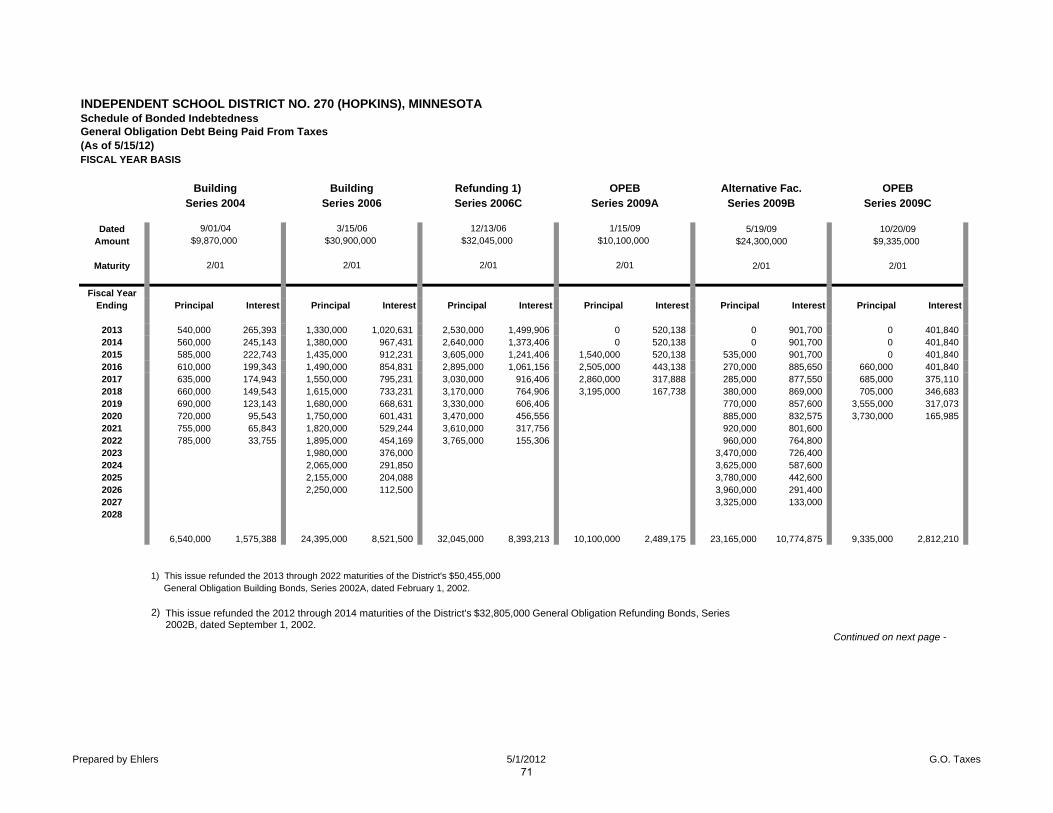
INDEPENDENT SCHOOL DISTRICT NO. 270 (HOPKINS), MINNESOTASchedule of Bonded IndebtednessGeneral Obligation Debt Being Paid From Taxes
DatedAmount
Maturity
Fiscal YearEnding Principal Interest Principal Interest Principal Interest Principal Interest Principal Interest Principal Interest
2013 540,000 265,393 1,330,000 1,020,631 2,530,000 1,499,906 0 520,138 0 901,700 0 401,8402014 560,000 245,143 1,380,000 967,431 2,640,000 1,373,406 0 520,138 0 901,700 0 401,8402015 585,000 222,743 1,435,000 912,231 3,605,000 1,241,406 1,540,000 520,138 535,000 901,700 0 401,8402016 610,000 199,343 1,490,000 854,831 2,895,000 1,061,156 2,505,000 443,138 270,000 885,650 660,000 401,8402017 635,000 174,943 1,550,000 795,231 3,030,000 916,406 2,860,000 317,888 285,000 877,550 685,000 375,1102018 660,000 149,543 1,615,000 733,231 3,170,000 764,906 3,195,000 167,738 380,000 869,000 705,000 346,6832019 690,000 123,143 1,680,000 668,631 3,330,000 606,406 770,000 857,600 3,555,000 317,0732020 720,000 95,543 1,750,000 601,431 3,470,000 456,556 885,000 832,575 3,730,000 165,9852021 755,000 65,843 1,820,000 529,244 3,610,000 317,756 920,000 801,6002022 785,000 33,755 1,895,000 454,169 3,765,000 155,306 960,000 764,8002023 1,980,000 376,000 3,470,000 726,4002024 2,065,000 291,850 3,625,000 587,6002025 2,155,000 204,088 3,780,000 442,6002026 2,250,000 112,500 3,960,000 291,4002027 3,325,000 133,0002028
6,540,000 1,575,388 24,395,000 8,521,500 32,045,000 8,393,213 10,100,000 2,489,175 23,165,000 10,774,875 9,335,000 2,812,210
1) This issue refunded the 2013 through 2022 maturities of the District's $50,455,000 General Obligation Building Bonds, Series 2002A, dated February 1, 2002.
2)
Continued on next page -
Series 2006Series 2004
2/01
$9,870,000 $30,900,0001/15/09
$10,100,0003/15/06
(As of 5/15/12)FISCAL YEAR BASIS
2/01
Series 2006C
12/13/06$32,045,000
2/012/01
Building Building Refunding 1) OPEB Alternative Fac.
9/01/04
Series 2009A Series 2009B
5/19/09$24,300,000
2/01
Series 2009C
10/20/09$9,335,000
2/01
OPEB
This issue refunded the 2012 through 2014 maturities of the District's $32,805,000 General Obligation Refunding Bonds, Series2002B, dated September 1, 2002.
Prepared by Ehlers 5/1/2012 G.O. Taxes71
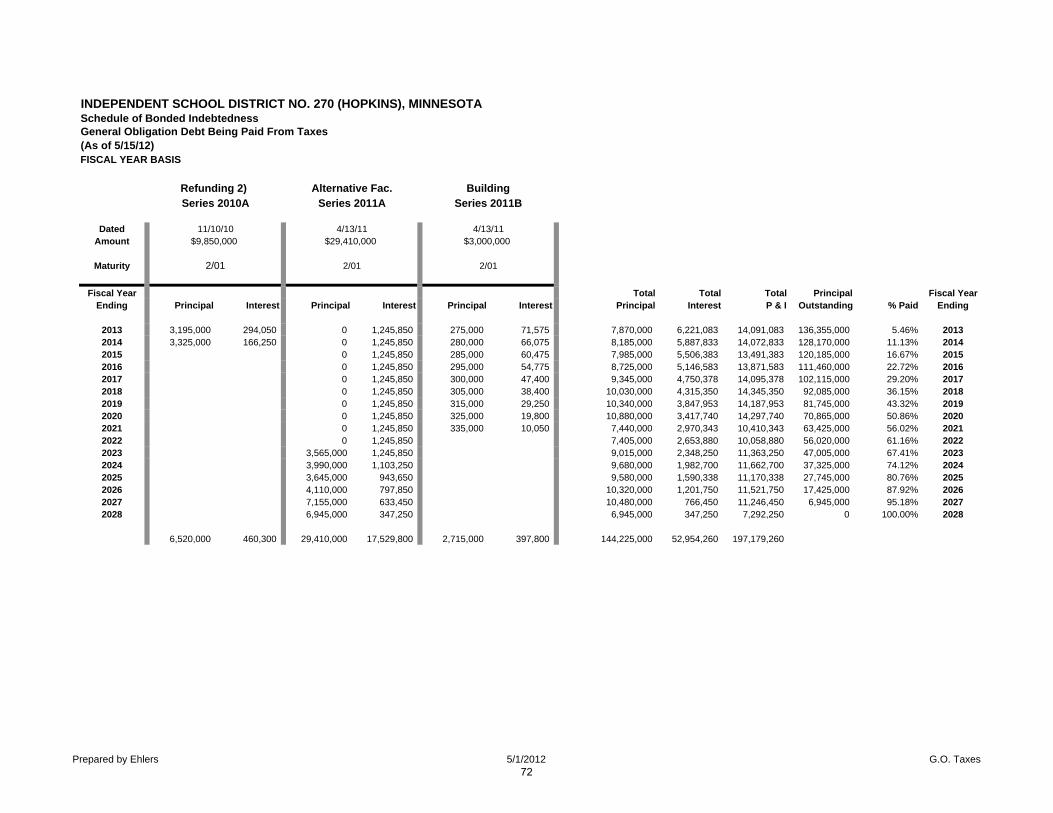
INDEPENDENT SCHOOL DISTRICT NO. 270 (HOPKINS), MINNESOTASchedule of Bonded IndebtednessGeneral Obligation Debt Being Paid From Taxes
DatedAmount
Maturity
Fiscal Year Total Total Total Principal Fiscal YearEnding Principal Interest Principal Interest Principal Interest Principal Interest P & I Outstanding % Paid Ending
2013 3,195,000 294,050 0 1,245,850 275,000 71,575 7,870,000 6,221,083 14,091,083 136,355,000 5.46% 20132014 3,325,000 166,250 0 1,245,850 280,000 66,075 8,185,000 5,887,833 14,072,833 128,170,000 11.13% 20142015 0 1,245,850 285,000 60,475 7,985,000 5,506,383 13,491,383 120,185,000 16.67% 20152016 0 1,245,850 295,000 54,775 8,725,000 5,146,583 13,871,583 111,460,000 22.72% 20162017 0 1,245,850 300,000 47,400 9,345,000 4,750,378 14,095,378 102,115,000 29.20% 20172018 0 1,245,850 305,000 38,400 10,030,000 4,315,350 14,345,350 92,085,000 36.15% 20182019 0 1,245,850 315,000 29,250 10,340,000 3,847,953 14,187,953 81,745,000 43.32% 20192020 0 1,245,850 325,000 19,800 10,880,000 3,417,740 14,297,740 70,865,000 50.86% 20202021 0 1,245,850 335,000 10,050 7,440,000 2,970,343 10,410,343 63,425,000 56.02% 20212022 0 1,245,850 7,405,000 2,653,880 10,058,880 56,020,000 61.16% 20222023 3,565,000 1,245,850 9,015,000 2,348,250 11,363,250 47,005,000 67.41% 20232024 3,990,000 1,103,250 9,680,000 1,982,700 11,662,700 37,325,000 74.12% 20242025 3,645,000 943,650 9,580,000 1,590,338 11,170,338 27,745,000 80.76% 20252026 4,110,000 797,850 10,320,000 1,201,750 11,521,750 17,425,000 87.92% 20262027 7,155,000 633,450 10,480,000 766,450 11,246,450 6,945,000 95.18% 20272028 6,945,000 347,250 6,945,000 347,250 7,292,250 0 100.00% 2028
6,520,000 460,300 29,410,000 17,529,800 2,715,000 397,800 144,225,000 52,954,260 197,179,260
Series 2011A
4/13/11
Alternative Fac. Building
11/10/10$9,850,000
2/01
$29,410,000
2/01
4/13/11$3,000,000
2/01
Series 2011B
(As of 5/15/12)FISCAL YEAR BASIS
Refunding 2) Series 2010A
Prepared by Ehlers 5/1/2012 G.O. Taxes72
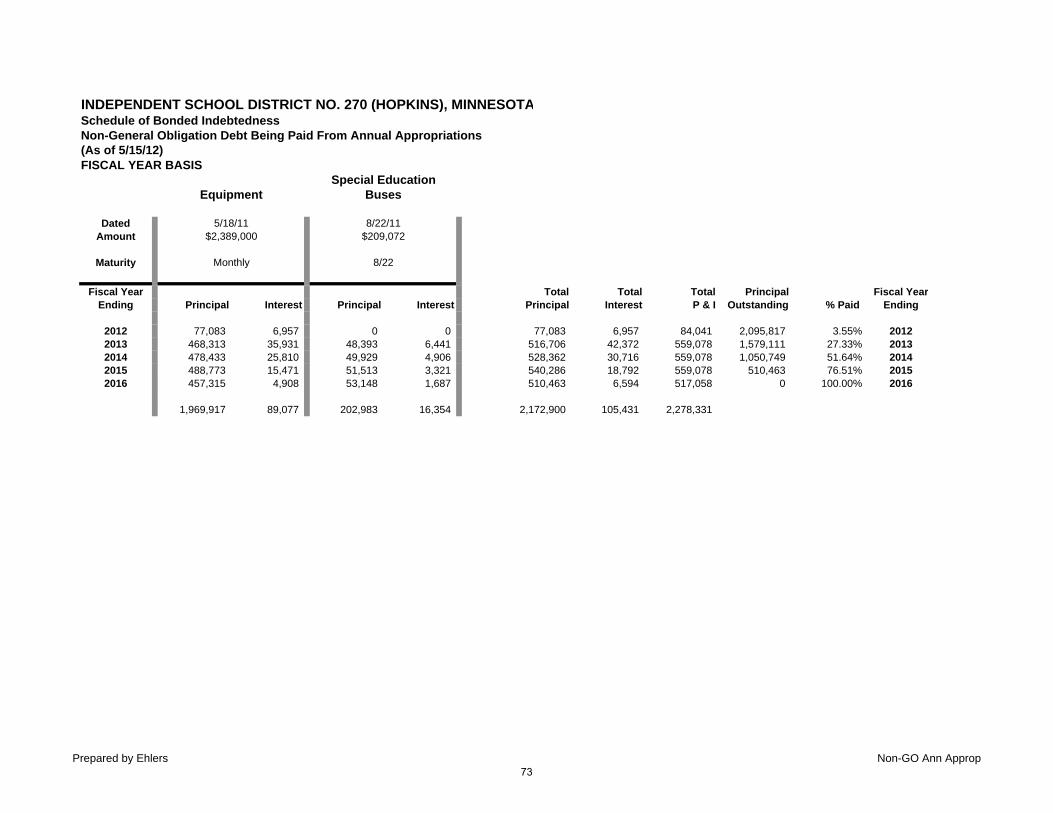
INDEPENDENT SCHOOL DISTRICT NO. 270 (HOPKINS), MINNESOTASchedule of Bonded IndebtednessNon-General Obligation Debt Being Paid From Annual Appropriations
FISCAL YEAR BASIS
DatedAmount
Maturity
Fiscal Year Total Total Total Principal Fiscal YearEnding Principal Interest Principal Interest Principal Interest P & I Outstanding % Paid Ending
2012 77,083 6,957 0 0 77,083 6,957 84,041 2,095,817 3.55% 20122013 468,313 35,931 48,393 6,441 516,706 42,372 559,078 1,579,111 27.33% 20132014 478,433 25,810 49,929 4,906 528,362 30,716 559,078 1,050,749 51.64% 20142015 488,773 15,471 51,513 3,321 540,286 18,792 559,078 510,463 76.51% 20152016 457,315 4,908 53,148 1,687 510,463 6,594 517,058 0 100.00% 2016
1,969,917 89,077 202,983 16,354 2,172,900 105,431 2,278,331
(As of 5/15/12)
Equipment Buses
5/18/11 8/22/11
Monthly 8/22
Special Education
$2,389,000 $209,072
Prepared by Ehlers Non-GO Ann Approp73

I.S.D. No. 270 (Hopkins), MN $5,610,000 G.O. School Building Refunding Bonds, Series 2012 Proposed Crossover Refunding of $9,870,000 G.O. School Building Bonds, Series 2004
Debt Service Comparison
Date Total P+I PCF Existing D/S Net New D/S Old Net D/S Savings Fiscal Total06/27/2012 - - - (939.60) - 939.60 -02/01/2013 123,079.72 (6,123,079.72) 6,145,723.60 145,723.60 145,723.60 - 939.6008/01/2013 103,525.00 - - 103,525.00 122,571.25 19,046.25 -02/01/2014 628,525.00 - - 628,525.00 682,571.25 54,046.25 73,092.5008/01/2014 93,025.00 - - 93,025.00 111,371.25 18,346.25 -02/01/2015 643,025.00 - - 643,025.00 696,371.25 53,346.25 71,692.5008/01/2015 82,025.00 - - 82,025.00 99,671.25 17,646.25 -02/01/2016 657,025.00 - - 657,025.00 709,671.25 52,646.25 70,292.5008/01/2016 70,525.00 - - 70,525.00 87,471.25 16,946.25 -02/01/2017 665,525.00 - - 665,525.00 722,471.25 56,946.25 73,892.5008/01/2017 58,625.00 - - 58,625.00 74,771.25 16,146.25 -02/01/2018 678,625.00 - - 678,625.00 734,771.25 56,146.25 72,292.5008/01/2018 46,225.00 - - 46,225.00 61,571.25 15,346.25 -02/01/2019 696,225.00 - - 696,225.00 751,571.25 55,346.25 70,692.5008/01/2019 33,225.00 - - 33,225.00 47,771.25 14,546.25 -02/01/2020 708,225.00 - - 708,225.00 767,771.25 59,546.25 74,092.5008/01/2020 23,100.00 - - 23,100.00 32,921.25 9,821.25 -02/01/2021 723,100.00 - - 723,100.00 787,921.25 64,821.25 74,642.5008/01/2021 12,600.00 - - 12,600.00 16,877.50 4,277.50 -02/01/2022 732,600.00 - - 732,600.00 801,877.50 69,277.50 73,555.00
Total $6,778,829.72 (6,123,079.72) $6,145,723.60 $6,800,534.00 $7,455,718.60 $655,184.60 -
PV Analysis Summary (Net to Net) Gross PV Debt Service Savings..................... 599,424.85 Net PV Cashflow Savings @ 1.609%(Bond Yield)..... 599,424.85 Contingency or Rounding Amount.................... 939.60Net Present Value Benefit $600,364.45 Net PV Benefit / $6,692,248.98 PV Refunded Debt Service 8.971%Net PV Benefit / $6,000,000 Refunded Principal... 10.006%Net PV Benefit / $5,610,000 Refunding Principal.. 10.702% Refunding Bond Information Refunding Dated Date 6/27/2012Refunding Delivery Date 6/27/2012
06 xover of Ser 2004 $9.8 | SINGLE PURPOSE | 4/27/2012 | 9:02 AM
Page 8
74

Independent School District #270 HOPKINS SCHOOLS
Budget Year 2012-13
TRUST FUND (08)
FUND ANALYSIS DESCRIPTION: The Trust Fund was established during the 1995-1996 school term. Under former UFAR’s accounting practices, the Trust and Agency Fund was a combined fund. Under the new UFAR’s account procedures, school districts must split the trust financial activities from the agency financial activities. The Trust Fund (08) was a new fund for the 1997 fiscal year. Activities in this fund are:
1. District scholarship programs 2. Endowments 3. Gifts to the district
This fund is meant to be a stand alone fund with no transfers being made from other funds. FUND SUMMARY Estimated Fund Balance (6/30/12) 85,097 2012-13 Budgeted Revenues 33,650 2012-13 Budgeted Expenditures 37,550 Estimated Fund Balance (6/30/13) 81,197 COMMENTS:
Very little expenditure activity will occur in this fund during the 2012-13 year. This fund maintains a positive fund balance position and no transfers are
recommended to be made to this fund during FY 12-13.
75

THIS PAGE INTENTIONALLY
LEFT BLANK
76

Budget 2012-2013
Appendix

Actual Proj. NEW Old NEW Old NEW Old NEW Old NEW2009-10 2010-11 2011-12 2011-12 Diff. 2012-13 2012-13 Diff. 2013-14 2013-14 Diff. 2014-15 2014-15 Diff. 2015-16 2015-16 Diff. 2016-17
GradeKindergarten 520 507 479 500 (21) 470 500 (30) 470 500 (30) 470 500 (30) 470 500 (30) 470Grade 1 498 529 505 506 (1) 481 499 (18) 472 499 (27) 472 499 (27) 472 499 (27) 472Grade 2 502 519 528 538 (10) 511 515 (4) 487 507 (20) 478 507 (29) 478 507 (29) 478Grade 3 541 502 512 509 3 523 527 (4) 507 504 3 482 498 (16) 473 498 (25) 473Grade 4 503 532 512 491 21 512 498 14 521 516 5 507 494 13 480 487 (7) 471Grade 5 503 516 537 537 - 519 496 23 518 502 16 528 520 8 514 498 16 486Grade 6 520 505 532 514 18 544 535 9 526 494 32 525 501 24 535 519 16 520Grade 7 580 538 530 524 6 557 534 23 578 556 22 558 513 45 568 520 48 577Grade 8 595 598 535 548 (13) 527 534 (7) 554 545 9 575 566 9 555 523 32 565Grade 9 618 605 592 607 (15) 529 556 (27) 521 542 (21) 548 552 (4) 569 575 (6) 549Grade 10 615 634 605 617 (12) 597 619 (22) 544 567 (23) 547 553 (6) 572 563 9 585Grade 11 616 609 635 620 15 604 603 1 594 605 (11) 539 555 (16) 543 541 2 567Grade 12 658 614 603 625 (22) 630 636 (6) 603 619 (16) 597 620 (23) 542 568 (26) 545
Total K-3 2,061 2,057 2,024 2,053 (29) 1,985 2,041 (56) 1,936 2,010 (74) 1,902 2,004 (102) 1,893 2,004 (111) 1,893Total 4-6 1,526 1,553 1,581 1,542 39 1,575 1,529 46 1,565 1,512 53 1,560 1,515 45 1,529 1,504 25 1,477Total 7-9 1,793 1,741 1,657 1,679 (22) 1,613 1,624 (11) 1,653 1,643 10 1,681 1,631 50 1,692 1,618 74 1,691Total 10-12 1,889 1,857 1,843 1,862 (19) 1,831 1,858 (27) 1,741 1,791 (50) 1,683 1,728 (45) 1,657 1,672 (15) 1,697Total K-12 7,269 7,208 7,105 7,136 (31) 7,004 7,052 (48) 6,895 6,956 (61) 6,826 6,878 (52) 6,771 6,798 (27) 6,758
Enrollment ProjectionsBased on October 1 Fall Seat Count
November 2011
Enrollment History Enrollment Projections
Enrollment Projections Provided By: Carman Consulting, LLC November, 2011
Total K-6 3,587 3,610 3,605 3,595 10 3,560 3,570 (10) 3,501 3,522 (21) 3,462 3,519 (57) 3,422 3,508 (86) 3,370Total 7-12 3,682 3,598 3,500 3,541 (41) 3,444 3,482 (38) 3,394 3,434 (40) 3,364 3,359 5 3,349 3,290 59 3,388Total K-12 7,269 7,208 7,105 7,136 (31) 7,004 7,052 (48) 6,895 6,956 (61) 6,826 6,878 (52) 6,771 6,798 (27) 6,758
Kindergarten 520 507 479 500 (21) 470 500 (30) 470 500 (30) 470 500 (30) 470 500 (30) 47012th (Prev. Yr.) 671 658 614 614 603 625 630 636 603 619 597 620 54212-K Difference (151) (151) (135) (114) (133) (125) (160) (136) (133) (119) (127) (120) (72)
Total 1-6 3,067 3,103 3,126 3,095 31 3,090 3,070 20 3,031 3,022 9 2,992 3,019 (27) 2,952 3,008 (56) 2,900Total 7-12 3,682 3,598 3,500 3,541 (41) 3,444 3,482 (38) 3,394 3,434 (40) 3,364 3,359 5 3,349 3,290 59 3,388Total 1-12 6,749 6,701 6,626 6,636 (10) 6,534 6,552 (18) 6,425 6,456 (31) 6,356 6,378 (22) 6,301 6,298 3 6,288
Total K-12 7,269 7,208 7,105 7,136 (31) 7,004 7,052 (48) 6,895 6,956 (61) 6,826 6,878 (52) 6,771 6,798 (27) 6,758
Projected Annual Student Decline - NEW Projections (101) (109) (69) (55) (13)
Note: Projection Methods were split/blended: K-3: 2-Year Weight Ratio4-6: 4-Year Weight Ratio7-9: 1-Year Numerical Analysis
10-12: 2-Year Weight Ratio
Enrollment Projections Provided By: Carman Consulting, LLC November, 2011
79

THIS PAGE INTENTIONALLY
LEFT BLANK
80

Citizens Financial Advisory Committee 2012‐13 Budget Recommendations
to the School Board
December 14, 2011
EXECUTIVE SUMMARY The Citizens Financial Advisory Committee (CFAC) was established to leverage the financial experience and expertise of a small group of community members and provide recommendations to the School Board regarding the financial planning and performance of the Hopkins School District. This is a long‐standing advisory committee to the School Board. The current citizen committee members are: Rick Ellingson Kip Heegaard Dave Koppe Jeffrey Ringer Nechia Agate (ex officio) The committee has formally met five times with Superintendent John Schultz, Assistant Superintendent Nik Lightfoot and Director of Business Services John Toop. Certain members of the School Board have been present at the meetings. Committee members have also had numerous informal discussions with District staff. The committee review has focused on the following information:
Audited results for FYE June 30, 2011 General Fund Unassigned fund balance as of June 30, 2011 Forecasting Model for next year (FY2013) thru FY 2016 (3 more years) Number of students enrolled and future enrollment projections Per student funding from the State and future per student State funding Salary and fringe benefit costs of teachers, support staff and administration Workers Comp and Property/Casualty/Liability insurance Shared services that the District is currently participating in Severance and Other Post Employment Benefits (OPEB) funding Unique programming to potentially attract additional enrollment
CFAC’s review has produced by consensus the following recommendations:
State per student funding for the next biennium per range estimates (see Exhibits A1‐A5) Other district revenue to increase at one‐half percent annually Salary increases in a range estimate (see Exhibits A1‐A5) Fringe benefits increase annually at a projected 8% All other costs to increase annually at a projected 2% General Fund Unassigned fund balance to follow Board fund balance policy through FY14‐
15
81

If a decision is made to develop unique programming to attract enrollment, such programs should have defined exit strategies
CFAC Conclusion CFAC remains impressed by the ability and knowledge of financial management within the District. The District’s Forecasting Model is excellent. The District, with a fund balance of $11.7 million, remains financially stable at the present time. Because of continued large economic uncertainty, particularly from the State of Minnesota, we continue to advocate maintaining a strong fund balance and trust that will be kept in mind as decisions and agreements are being made in the near future. CFAC recommends the Board consider any fund balance above 10% (currently 4.5%) could potentially be used by the Board as an investment tool for the District. This investment can be for teachers and/or programs, but should only be used for one‐time items or for programming that can attract enrollment. If that enrollment is not realized, a defined exit strategy should then be implemented.
82

Background to CFAC Recommendations The Citizens Financial Advisory Committee (CFAC) has conducted an overview of the current and projected financial condition of the Hopkins School District. Our recommendations to the Hopkins School Board are based on consensus of the group to determine the underlying budget assumptions to form the budget projections for 2012‐13 (and beyond). The recommendations are based on current and near‐term economic factors that impact the present and future financial situation of both the State of Minnesota and the Hopkins School District. Our recommendations are largely influenced by three primary conditions:
1. The short and mid‐term outlook for revenue increases is pessimistic. 2. The District’s cost structure is roughly 80% human resources, followed by building operating
costs. 3. The District continues to face a short and mid‐term enrollment decline.
It is important to note that the Hopkins district is not alone in experiencing these above conditions, yet as an individual district the Hopkins administration and Board is faced with the increasingly difficult task to find financial solutions to maintain the District’s financial stability. State Economy and Funding The State of Minnesota, along with many other states and the Federal government, faces extreme budget pressure during the next four to six years. Exhibit C shows that for the current biennium (FY12 and FY13), K‐12 per pupil funding increased by only 1% each year, while many other State budget areas experienced funding reductions. With the continued projected State budget deficit, it is highly likely K‐12 education funding in the next biennium (FY14 and FY15) will be flat. Decreases are possible. This is even before consideration of paying back any prior “payment delays” or “payment shifts.” Payment shifts and their impact The Governor and Legislature enacted a number of measures to decrease spending to balance the State budget through FY 12‐13. The impact to K‐12 education included increasing the delay (typically 10%) of State aid payments to school districts from 30% to 40% (est. $18 million cash flow delay for Hopkins), and a 48.6% property tax shift effective in FY 10‐11 year (est. $9 million dollar cash flow delay for Hopkins). It is very unclear when these payment shifts and delays will be paid back. As a historical reference, it took over 15 years to pay back a similar delay implemented by the State in the early 1980’s. Most school districts needed to engage in short‐term borrowing because of these payment delays, unless their General Fund balance and resulting positive cash balances were significant enough to withstand the effect of these payment shifts. Hopkins General Fund balance was healthy enough to withstand the State aid payment delay of 30%, but because of the additional 10% aid shift and property tax shift, will likely need to engage in short‐term borrowing to some degree in FY 11‐12 and into the future.
83

General Fund Balance Reserves Exhibits B1 and B2 show Hopkins General Fund Unassigned fund balance and total General Fund fund balance breakdown compared to surrounding districts. Hopkins General Fund Unassigned fund balance, after audited results for FY10‐11, stands at $11,741,844, or 14.54% of FY11 General Fund expenses. This fund balance percentage is in line with other neighboring districts. Hopkins has also begun to appropriately fund their previous and ongoing severance pay obligations. It is imperative because of the above discussion on the State economy, funding, and expenses that Hopkins follows its fund balance policy. A modification to that fund balance policy was made in May 2009, stating that “actual amounts above 6% (cash flow reserve) will be considered a “contingency reserve.” “Contingency reserves” should be used for the following purposes:
to allow for the time and flexibility to correct for the revenue and expense fluctuations as noted above;
to protect the system in cases of sudden shortfalls in revenue (e.g., unforeseen shortfall in enrollment or reduction in state appropriation within the current biennium);
to cover unanticipated expenses (e.g., one‐time legal fees, major disasters, unanticipated increases in utility costs);
to provide for extraordinary one‐time investments. CFAC recommends the District continue using the Forecasting Model to monitor the 3 to 5 year
projected Fund Balance and make sure it does not fall below $8 million or 10% of annual operating expenses. This is critical to assure the District can sustain the quality curriculum/program offered its students.
CFAC recommends careful management of the District’s Fund Balance. The current General Fund Unassigned Fund Balance is $11.7 million (14.5% of annual operating expenses). This account is effectively the contingency reserve for the District and if it declines far enough SOD could occur. The following suggestions should be considered:
In an era of anticipated flat or decreasing State revenue, the fund balance should not be used to
simply cover ongoing cost increases because it will be quickly depleted. The District should continue to maintain the detailed Forecasting Model to show intermediate
and long term impact of different financial options. CFAC Recommendation: The Board could consider the amount above 10% (4.5%) be used by the Board as an investment tool for the District. This investment can be for teachers and/or programs, but should only be used for one‐time items, or for programming that can attract enrollment. Other than noted above, if the “contingency reserve” is determined to be utilized for a specific purpose in a given budget year other than using the contingency amounts to assist with general budget fluctuations, restorative plans for the reserve must be included in Board deliberations. Total General Fund Revenue Sources and History Exhibit D shows General Fund revenues by major source for FY11. State funding comprises 59% of our revenue, with 34% coming from local property taxes and other local sources including activity participation fees, gate receipts, gifts, and interest income and 7% from Federal sources. It should be
84

noted that the percentage of property tax revenue is higher than historic levels due to the advance recognition of tax revenue as a result of the tax shift of 48.6% for FY11. Revenue from State sources for FY11 will show a corresponding decrease. Federal sources at 7% are higher than normal due to the one‐time Federal Edujobs funding in FY11. Exhibit E shows General Fund revenue increases and decreases by percentage from FY02 to Projected FY12. CFAC Recommendation: At this time, based on the uncertain State revenue picture, CFAC is unable to give single point estimates on State revenue. See Exhibits A1‐A5 for point range estimates of State revenue. CFAC does recommend that other selected revenue components increase at .5% per year (one‐half percent) for FY 12‐13 through FY 15‐16. CFAC believes this revenue projection range is realistic. Student Enrollment and Impact on Revenue CFAC recommends accepting the District’s assumption that the District will lose approximately 70 students per year for the next five years. October 2011 fall enrollment was 7,105 students and is projected to fall to 6,758 students in October 2016. Enrollment should be monitored and the forecast adjusted annually. Falling enrollment has been a reality since FY2000. Current demographic analysis by the State supports the assumption of declining enrollment across the State. (see Exhibit F) Most Minnesota school districts are experiencing declining enrollment due to demographic changes. Revenue increases to the per pupil formula allowance are then offset by the fewer numbers of students attending, resulting in even smaller actual gross revenue increases. Hopkins has been experiencing declining enrollment from FY02 to FY11 to the magnitude of 1,030 students, or about a 12.3% decrease over this 9‐year period. (see Exhibit F). State funding on average is equal to about $6,000 per student. When enrollment declines, revenue is reduced by the loss of students from the previous year times $6,000 per student. If the amount per student increases, then gross revenue will remain relatively flat, depending on the increase and enrollment decline. If the enrollment declines with no increase in the amount per student, gross revenue will decrease for the school district, all others things being equal. This declining enrollment gap, sometimes called the “Phantom Gap” is actually quite real. If students decline by 100, causing a $600,000 decrease in revenue, and 6 teachers are reduced as a result of this decline with salaries and benefits of $60,000 each, there is a reduction in expenses of $360,000. There still remains a “gap” between revenue losses matching expense reduction of $240,000. This difference, the “Phantom Gap,” (see Exhibit G) is actually the difference in real dollars that needs to be reduced in other areas of the budget to match revenue loss with expense reductions. CFAC Recommendation: Based upon the enrollment analysis and assumptions presented, CFAC supports the administration’s recommendation for projecting enrollment for FY13 to FY17. The selected method will project a 347 student decline, or about 4.9%, over this five year period from FY12 to FY17. It is also further recommended that these enrollment projections and underlying assumptions continue to be updated on an annual basis.
85

Total General Fund Expense and History Exhibit E shows General Fund expense increases and decreases by percentage from FY02 to Projected FY12. Expenses from FY07 to FY11 have averaged slightly over $78 million and have remained flat throughout this time. Exhibit I shows revenues and expenses per ADM (Average Daily Membership, or per student) that indicates the revenue and expense trend from 2004‐05 through 2010‐11. Revenues have exceeded expenses per student (and in total dollars) for the General Fund for the past six fiscal years. Salary and Fringe Benefit Expenses School districts are labor intensive, (see Exhibit H) with 80‐85% of their expenses for salaries and benefits. If these expenses increase above the increases in revenue, it becomes increasingly difficult to keep reductions away from the classroom, decreasing programming/curriculum or increasing class sizes to levels that become unacceptable in the public’s eye. There is little wiggle room in reducing expenses that do not affect the classroom in some way. We are proud of the performance of our District and greatly appreciative of the talent and commitment of all of our staff, but unfortunately we have to operate within the existing economic climate in the country and particularly the State of Minnesota. Since salary and fringe benefit costs make up 80+% of the District’s expenses, any growth in this area in excess of the rate of state reimbursement will seriously threaten the financial and programmatic viability of the District over a 3 to 5 year period. CFAC Recommendation: The District should continue the open and active dialogue with the unions representing all staff regarding the fundamental importance of controlling the growth of compensation and benefits at or below the level of growth in per student state reimbursement. CFAC also recommends that the School Board maintains their sustainability principle that states that any increases to employee compensation above a baseline amount be reflected in the form of an FTE impact for the settlement, and that this FTE impact be clearly communicated to the bargaining group agreeing to an increase above the baseline amount. In order to help the Board in its budget setting work, CFAC believes Exhibits A1‐A3 are helpful in showing various combinations of State revenue coupled with various salary negotiation results, and what financial impact these combinations have on fund balance results. CFAC recommends accepting the District’s assumption that fringe benefit costs will increase by 8% in each of the next 5 years. The increase is in line with historical experience in spite of the fact that the district has a self‐insured plan. Other Costs CFAC recognizes the amount of shared services that the district is already participating in, including, but not limited to,
District purchasing services done by Performance Management Group, resulting in $140,000 in savings over a 2‐year period;
Continued use of State contract pricing by PMG to determine a benchmark on whether a better price can be achieved through a formal bid process;
86

Joint Purchase Agreement with Burnsville School District to reduce the amount of bids necessary for both school districts while allowing both districts to realize savings on mutually purchased items;
Joint Purchase Agreement with Anoka‐Hennepin School District for school food service buying, resulting in many districts saving time and costs;
Participation in a multi‐district Special Education bus route study through ISD #287 to determine if districts can share and combine routes between districts transporting students to ISD #287 and realize savings.
CFAC is aware of the ongoing investment that the district is making in their facilities through involvement in the Alternative Facilities Bonding and Levy program. Keeping building facilities updated and in good physical condition contributes to a healthy learning environment for all students. The district is also looking to be proactive in addressing changing student and facility needs through a Long‐Term Facilities Management Plan currently being developed. This plan will guide facility decision‐making on an ongoing basis, with periodic updates to the plan in subsequent years. CFAC Recommendation: CFAC recommends continuing to look for ways to bring additional efficiencies to control other costs. For budgeting purposes we believe an increase in these other cost projections at a 2.0% annual increase for FY 12‐13 to FY 15‐16 is reasonable.
87

10-11 Actual 2011-12 2012-13 2013-14 2014-15 2015-16 0.00% Rev / 0.00% Salary 15.08% 17.03% 19.29% 18.41% 15.02% 8.94% 0.00% Rev / 2.00% Salary 15.08% 15.50% 14.96% 10.46% 2.76% -8.02% 0.00% Rev / 4.00% Salary 15.08% 14.02% 10.79% 2.98% -8.57% -23.67% Minimum Fund Balance 6.00% 6.00% 6.00% 6.00% 6.00% 6.00% Minimum plus 4% Reserve 10.00% 10.00% 10.00% 10.00% 10.00% 10.00% Statutory Operating Debt -2.50% -2.50% -2.50% -2.50% -2.50% -2.50%
5,224 5,224 5,224 5,224
Forecasting Model - Range of Results
Per Pupil Assumption
Basic Revenue Assumption: 0.00%
Description (Rev/Salary)
To review additional financial assumptions refer to the Footnotes on Exhibit A5.
Exhibit A1
Fund Balance % After GASB Designation for Severance
-30.00%
-25.00%
-20.00%
-15.00%
-10.00%
-5.00%
0.00%
5.00%
10.00%
15.00%
20.00%
25.00%
10-11 Actual 2011-12 2012-13 2013-14 2014-15 2015-16
Year 0.00% Rev / 0.00% Salary 0.00% Rev / 2.00% Salary 0.00% Rev / 4.00% Salary Minimum Fund Balance
Minimum plus 4% Reserve Statutory Operating Debt
88

Description (Rev/Salary) 10-11 Actual 2011-12 2012-13 2013-14 2014-15 2015-16 -2.00% Rev / 0.00% Salary 15.08% 17.03% 19.29% 17.33% 12.92% 5.86% -2.00% Rev / 2.00% Salary 15.08% 15.50% 14.96% 9.43% 0.76% -10.94% -2.00% Rev / 4.00% Salary 15.08% 14.02% 10.79% 1.98% -10.49% -26.43% Minimum Fund Balance 6.00% 6.00% 6.00% 6.00% 6.00% 6.00% Minimum plus 4% Reserve 10.00% 10.00% 10.00% 10.00% 10.00% 10.00% Statutory Operating Debt -2.50% -2.50% -2.50% -2.50% -2.50% -2.50%
5,224 5,120 5,120 5,120 Per Pupil Assumption
Exhibit A2
Forecasting Model - Range of Results
Basic Revenue Assumption: -2.00% ($104 per pupil reduction)
To review additional financial assumptions refer to the Footnotes on Exhibit A5.
Fund Balance % After GASB Designation for Severance
-30.00%
-20.00%
-10.00%
0.00%
10.00%
20.00%
30.00%
10-11 Actual 2011-12 2012-13 2013-14 2014-15 2015-16
Year -2.00% Rev / 0.00% Salary -2.00% Rev / 2.00% Salary -2.00% Rev / 4.00% Salary Minimum Fund Balance
Minimum plus 4% Reserve Statutory Operating Debt
89

Description (Rev/Salary) 10-11 Actual 2011-12 2012-13 2013-14 2014-15 2015-16 2.00% Rev / 0.00% Salary 15.08% 17.03% 19.29% 19.48% 17.12% 12.02% 2.00% Rev / 2.00% Salary 15.08% 15.50% 14.96% 11.50% 4.77% -5.10% 2.00% Rev / 4.00% Salary 15.08% 14.02% 10.79% 3.98% -6.66% -20.91% Minimum Fund Balance 6.00% 6.00% 6.00% 6.00% 6.00% 6.00% Minimum plus 4% Reserve 10.00% 10.00% 10.00% 10.00% 10.00% 10.00% Statutory Operating Debt -2.50% -2.50% -2.50% -2.50% -2.50% -2.50%
5,224 5,328 5,328 5,328
Exhibit A3
Basic Revenue Assumption: 2.00% ($104 per pupil Increase)
Forecasting Model - Range of Results
To review additional financial assumptions refer to the Footnotes on Exhibit A5.
Per Pupil Assumption
Fund Balance % After GASB Designation for Severance
-25.00%
-20.00%
-15.00%
-10.00%
-5.00%
0.00%
5.00%
10.00%
15.00%
20.00%
25.00%
10-11 Actual 2011-12 2012-13 2013-14 2014-15 2015-16
Year 2.00% Rev / 0.00% Salary 2.00% Rev / 2.00% Salary 2.00% Rev / 4.00% Salary Minimum Fund Balance
Minimum plus 4% Reserve Statutory Operating Debt
90
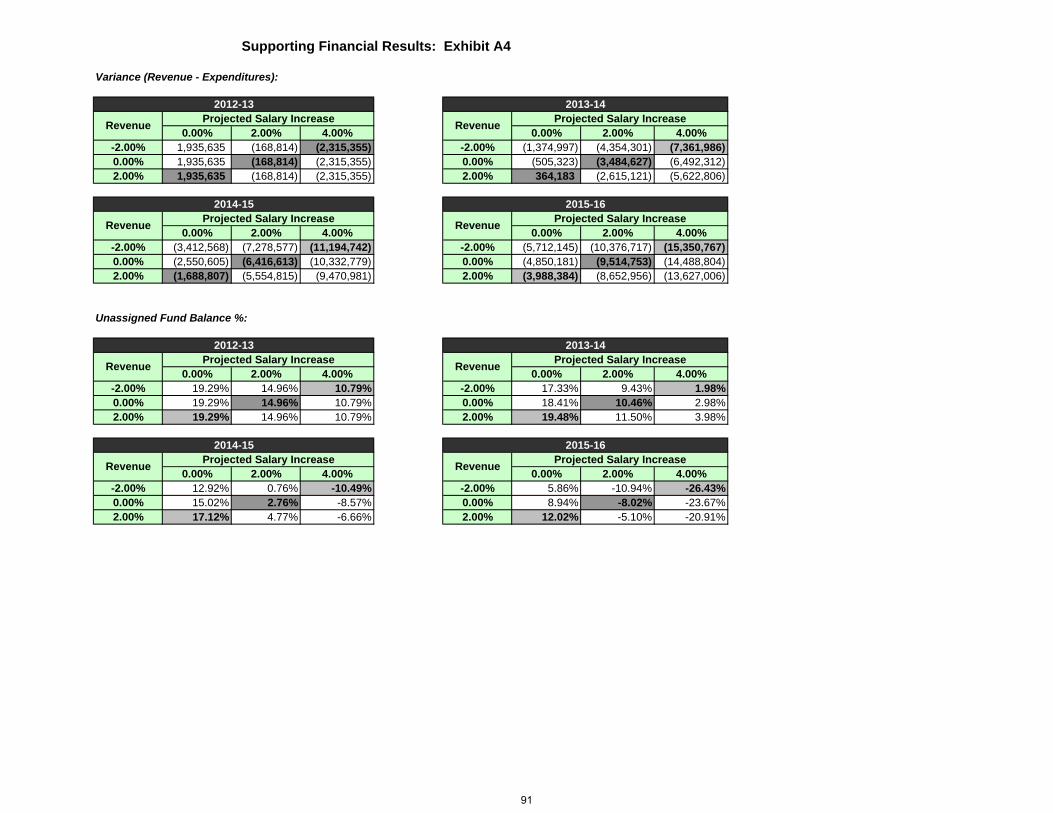
Variance (Revenue - Expenditures):
0.00% 2.00% 4.00% 0.00% 2.00% 4.00%-2.00% 1,935,635 (168,814) (2,315,355) -2.00% (1,374,997) (4,354,301) (7,361,986) 0.00% 1,935,635 (168,814) (2,315,355) 0.00% (505,323) (3,484,627) (6,492,312) 2.00% 1,935,635 (168,814) (2,315,355) 2.00% 364,183 (2,615,121) (5,622,806)
0.00% 2.00% 4.00% 0.00% 2.00% 4.00%-2.00% (3,412,568) (7,278,577) (11,194,742) -2.00% (5,712,145) (10,376,717) (15,350,767) 0.00% (2,550,605) (6,416,613) (10,332,779) 0.00% (4,850,181) (9,514,753) (14,488,804) 2.00% (1,688,807) (5,554,815) (9,470,981) 2.00% (3,988,384) (8,652,956) (13,627,006)
Unassigned Fund Balance %:
0.00% 2.00% 4.00% 0.00% 2.00% 4.00%-2.00% 19.29% 14.96% 10.79% -2.00% 17.33% 9.43% 1.98%0.00% 19.29% 14.96% 10.79% 0.00% 18.41% 10.46% 2.98%2.00% 19.29% 14.96% 10.79% 2.00% 19.48% 11.50% 3.98%
0.00% 2.00% 4.00% 0.00% 2.00% 4.00%-2.00% 12.92% 0.76% -10.49% -2.00% 5.86% -10.94% -26.43%0.00% 15.02% 2.76% -8.57% 0.00% 8.94% -8.02% -23.67%2.00% 17.12% 4.77% -6.66% 2.00% 12.02% -5.10% -20.91%
RevenueProjected Salary Increase
2015-16
RevenueProjected Salary Increase
Projected Salary Increase2013-14
Revenue
2012-13Projected Salary Increase
Revenue
2012-13Projected Salary Increase
2013-14Projected Salary Increase
Revenue
Projected Salary IncreaseRevenue
Projected Salary Increase
Revenue
2014-15
Supporting Financial Results: Exhibit A4
2014-15 2015-16
Revenue
91

Assumptions:
1. Enrollment projections from November 20112. Auditing results: 2010-113. Original Budget: 2011-124. Preliminary True-up based upon actual results: 2011-125. Percentage increase other revenue (non-formula allowance and non-referendum revenue): 0.50% all years.6. Percentage increase for fringe benefits: 8.00% all years.7. Percentage increase all non-salary and non-benefit expenditures: 2.00% all years.8. Pro-rated special education revenue: 96.00% FY12 through FY16.9. Legislative payment timing assumption: 60/40 all years.10. Legislative property tax shift: $9,000,000 all years.11. Interest expense assumption: 1.00%.
2009-10 2010-11 2011-12 2012-13 2013-14 2014-15 2015-1612. TRA Rate assumptions: 5.50% 5.50% 6.00% 6.50% 7.00% 7.50% 7.50%13. PERA Rate assumptions: 7.00% 7.25% 7.25% 7.25% 7.25% 7.25% 7.25%14. OPEB Explicit/Implicit/VEBA: (1,754,483) (1,321,004) (500,000) (500,000) (500,000) (500,000) (500,000) 15. GASB Designation for Severance: 5,231,755 8,188,384 8,188,384 8,188,384 8,188,384 8,188,384 8,188,384 16. Staff Development Assumption: 442,045 226,114 875,536 873,002 861,013 853,374 848,660 17. Other Reductions: Net Savings - PMG - (25,000) (35,000) (50,000) - - -
18. Transfer Media Generalist to Capital Projects Levy over three years beginning in FY11.19. Operating Capital transfer of $426,140 in FY12-13 with MDE commissioner approval.20. Federal Education Jobs (ARRA) allocation: $131,000 in one-time revenue in FY12 and $1,130,000 allocated to targeted staffing over two years ($565,000 FY12 and FY13). 21. Literacy Incentive Aid of $462,000 in FY13 through FY15.22. Compensatory revenue adjustment downward of $253,973 in FY13 through FY15.23. Assume the special education budget continues to be reduced annually based upon the inflation for salaries and benefits.24. Additional reduction in Transportation expenses of $500,000 in 11-12 and continuing through 14-15.25. No assumptions were made to the following: Debt service transfers, transfers to and from self-insured health insurance fund, implementation of any new programs including an elementary world language program, changes in transportation expenses including a bell time change and/or implementation of a fee-for-service, no changes in the high school schedule, continue with the recommended change to the junior high schedule to an alternating quarter beginning in 2011-12, and no enrollment sensitivity.26. It is assumed that the revenue assumptions entered above in Exhibits A1-A3 do NOT become effective until 2013-14. Because of this revenue assumption, the reader will notice the revenue minus expense variance and the Unassigned fund balance %'s are equal in 2012-13 for each of the revenue assumptions of -2%, 0%, and 2%. The per pupil allowance for 2012-13 is $5,224.
Supporting Financial Results: Exhibit A5
92

Hopkins Edina Minnetonka Eden Prairie Wayzata Orono Bloomington Burnsville St. Louis Park RobbinsdaleUnassigned Fund Balance % 14.54% 6.22% 12.15% 11.92% 10.61% 11.12% 4.49% 10.15% 6.53% 9.50%6-District Average ( > 10%) 11.75% 11.75% 11.75% 11.75% 11.75% 11.75% 11.75% 11.75% 11.75% 11.75%10-District Average 9.72% 9.72% 9.72% 9.72% 9.72% 9.72% 9.72% 9.72% 9.72% 9.72%
Fund Balance % with Committed 24.68% 8.00% 12.15% 11.92% 10.61% 11.12% 21.72% 12.71% 6.53% 9.50%7-District Average ( > 10%) 13.11% 13.11% 13.11% 13.11% 13.11% 13.11% 13.11% 13.11% 13.11% 13.11%10-District Average 12.89% 12.89% 12.89% 12.89% 12.89% 12.89% 12.89% 12.89% 12.89% 12.89%
Exhibit B1
District Comparison FY11 Unassigned Fund Balance %
14.54%
6.22%
12.15% 11.92%10.61% 11.12%
4.49%
10.15%
6.53%
9.50%
0.00%
2.00%
4.00%
6.00%
8.00%
10.00%
12.00%
14.00%
16.00%
Hopkins Edina Minnetonka Eden Prairie Wayzata Orono Bloomington Burnsville St. Louis Park Robbinsdale
Unassigned Fund Balance % 6-District Average ( > 10%) 10-District Average
93

Hopkins Edina Minnetonka Eden Prairie Wayzata Orono Bloomington Burnsville St. Louis Park RobbinsdaleNon-Spendable 943,453 815,358 926,216 278,350 1,129,124 516,868 488,881 278,075 973,658 2,070,239 Restricted 60,161 (879,026) 1,987,164 2,514,651 7,103,321 1,518,496 5,476,134 2,851,833 1,933,329 6,202,569 Assigned 664,172 3,931,165 3,438,927 2,830,859 1,983,459 2,209,746 - - 931,923 - Committed 8,188,384 1,523,051 - - - - 19,337,103 2,903,318 - - Unassigned Fund Balance 11,741,844 5,331,565 10,551,949 12,132,507 11,525,349 2,999,391 5,034,544 11,508,181 3,134,693 12,713,136 Total Fund Balance 21,598,014 10,722,113 16,904,256 17,756,367 21,741,253 7,244,501 30,336,662 17,541,407 6,973,603 20,985,944
Total Fund Balance MDE SOD calc 21,537,853 11,601,139 14,917,092 15,241,716 14,637,932 5,726,005 24,860,528 14,689,574 5,040,274 14,783,375 MDE Expenditure Denominator 69,996,896 76,011,066 76,729,539 81,783,519 97,528,093 24,588,647 94,858,190 96,380,928 43,196,649 118,014,996 Total Fund Balance % MDE SOD calc 30.77% 15.26% 19.44% 18.64% 15.01% 23.29% 26.21% 15.24% 11.67% 12.53%Unassigned Fund Balance % per MDE 16.77% 7.01% 13.75% 14.83% 11.82% 12.20% 5.31% 11.94% 7.26% 10.77%Fund Balance % with Committed per MDE 28.47% 9.02% 13.75% 14.83% 11.82% 12.20% 25.69% 14.95% 7.26% 10.77%Report Run Date 11/11/11 11/18/11 11/23/11 11/18/11 11/18/11 11/17/11 11/21/11 11/23/11 11/23/11 11/11/11
Total General Fund Expenses 80,760,802 85,658,552 86,847,683 101,743,189 108,655,026 26,982,418 112,191,435 113,377,021 48,026,954 133,887,261 Unassigned Fund Balance % 14.54% 6.22% 12.15% 11.92% 10.61% 11.12% 4.49% 10.15% 6.53% 9.50%Fund Balance % with Committed 24.68% 8.00% 12.15% 11.92% 10.61% 11.12% 21.72% 12.71% 6.53% 9.50%
Footnotes:
Nonspendable ‐ portions of fund balance related to prepaids, inventories, long term receivables, and corpus of any permanent fund.Restricted ‐ funds are constrained from outside parties (statute, grantors, bond agreements, etc.).Committed ‐ funds are established and modified by a resolution approved by the Board of Education.Assigned ‐ consists of internally imposed constraints. The Board of Education passed a resolution authorizing the Supt. and Dir. of Business Services to assign fund balances and their intended uses.Unassigned ‐ is the residual classification for the general fund and also reflects negative residual amounts in other funds.
Exhibit B2
District Comparison FY11 Fund Balance Breakdown
(5,000,000)
-
5,000,000
10,000,000
15,000,000
20,000,000
25,000,000
30,000,000
35,000,000
Hopkins Edina Minnetonka Eden Prairie Wayzata Orono Bloomington Burnsville St. Louis Park Robbinsdale
Non-Spendable Restricted Assigned Committed Unassigned Fund Balance
94

2001-02 2002-03 2003-04 2004-05 2005-06 2006-07 2007-08 2008-09 2009-10 2010-11 2011-12 2012-13Basic Formula Allowance Excluding Roll-ins 3,958 4,062 4,062 4,062 4,244 4,435 4,535 4,585 4,585 4,585 4,635 4,735 Annual Rate of Change 2.70% 2.63% 0.00% 0.00% 4.48% 4.50% 2.25% 1.10% 0.00% 0.00% 1.09% 2.16%Basic Formula Allowance 4,068 4,601 4,601 4,601 4,783 4,974 5,074 5,124 5,124 5,124 5,174 5,224
Exhibit C
Basic Formula Allowance per Studentand % Increase by Year
FY02 through FY13
0.00%
1.09%
2.16%
2.70%2.63%
0.00% 0.00%
4.48% 4.50%
2.25%
1.10%
0.00%0.00%
1.00%
2.00%
3.00%
4.00%
5.00%
2001-02 2002-03 2003-04 2004-05 2005-06 2006-07 2007-08 2008-09 2009-10 2010-11 2011-12 2012-13Ba
sic
Fo
rmu
la A
llow
an
ce
Ex
clu
din
g R
oll-
Ins
Annual Rate of Change
95

0
Local State Federal Other Transfers Total
2010-11 24,582,603 48,648,196 5,690,599 3,608,808 0 82,530,206
Exhibit D
Hopkins Public Schools - Revenue by SourceFY11 General Fund excluding Capital and OPEB
State, $48,648,196, 58.95%
Federal, $5,690,599,6.90%
Other, $3,608,808, 4.37% Transfers, $0,
0.00%
Local, $24,582,603,29.79%
Local State Federal Other Transfers
96

Org. Budgt2001-02 2002-03 2003-04 2004-05 2005-06 2006-07 2007-08 2008-09 2009-10 2010-11 2011-12*
Revenue 1.11% 3.77% 3.01% -0.12% 6.24% 1.53% 0.96% -2.34% 1.52% -0.81% -1.85%Expenditures 2.21% 1.70% 2.89% 3.38% 1.73% -3.89% -0.33% 0.55% -1.36% 0.54% 4.71%
* Note: The rate of change reflected for 2011-12 expenditures is based upon the original budget. Once this budget is formally revised by the School Board in thefirst quarter of 2012, a lower increase will be reflected in the expenditure rate of change from 2010-11 to 2011-12.
Exhibit E
Hopkins Annual Rate of ChangeRevenue (Excluding Capital) and Expenditures
FY02 through FY12
1.11%
-0.12%
6.24%
0.96%
-2.34%-1.85%
3.38%
1.73%
4.71%3.77%3.01%
1.53%1.52%
-0.81%
2.21%
1.70%
2.89%
-3.89%
-0.33%0.55%
-1.36%
0.54%
-6.00%
-4.00%
-2.00%
0.00%
2.00%
4.00%
6.00%
8.00%
2001-02 2002-03 2003-04 2004-05 2005-06 2006-07 2007-08 2008-09 2009-10 2010-11 2011-12*
Gen
eral
Fu
nd
Rev
enu
e E
xclu
din
g C
apit
al
Revenue Expenditures
97

2001-02 2002-03 2003-04 2004-05 2005-06 2006-07 2007-08 2008-09 2009-10 2010-11 2011-12 2012-13 2013-14 2014-15 2015-16 2016-17EOY Adj. ADM 8,359 8,328 8,288 8,195 8,181 8,014 7,663 7,426 7,374 7,329 7,246 7,167 7,070 7,023 6,988 7,008 Annual Decline (84) (31) (40) (93) (14) (168) (351) (237) (52) (46) (82) (79) (97) (48) (34) 20
Note: Katherine Curren closed in 2007-08.
Exhibit F
Enrollment Projections - November 2011
Hopkins Public SchoolsEC - 12 EOY Adj. ADM
8,359 8,328 8,288 8,195 8,181 8,0147,663 7,426 7,374 7,329 7,246 7,167 7,070 7,023 6,988 7,008
-
1,000
2,000
3,000
4,000
5,000
6,000
7,000
8,000
9,000
10,000
2001-02 2002-03 2003-04 2004-05 2005-06 2006-07 2007-08 2008-09 2009-10 2010-11 2011-12 2012-13 2013-14 2014-15 2015-16 2016-17
EOY Adj. ADM
98

2010-11 2011-12 2012-13 2013-14 2014-15 2015-16353,722 754,726 1,025,982 1,480,300 1,713,930 1,965,442
75,527 527,577 963,167 1,487,004 1,697,694 1,719,837
278,195 227,149 62,815 (6,704) 16,236 245,605
2.50% 2.00% 2.00% 2.00%8.00% 8.00% 8.00% 8.00%0.00% 0.00% 0.00% 0.00%Revenue Assumption
Phantom Gap - 11/10 Enrollment ProjectionsPhantom Gap - 11/11 Enrollment Projections
Difference in the Gap - 11/10 to 11/11
Exhibit G
Phantom Gap
Salary AssumptionBenefit Assumption
$214,920
$768,540
$1,243,860
$1,825,860
$2,110,860$2,317,260
$139,393$240,963 $280,693 $338,856 $413,166
$597,423
‐
500,000
1,000,000
1,500,000
2,000,000
2,500,000
3,000,000
3,500,000
2010‐11 2011‐12 2012‐13 2013‐14 2014‐15 2015‐16
Cumulative Loss in Revenue ‐ Declining Enrollment (11/11) Cumulative Decrease in Exp. FTE Reductions (11/11)
Cumulative Loss in Revenue ‐ Declining Enrollment (11/10) Cumulative Decrease in Exp. FTE Reductions (11/10)
The phantom gap will continue to exist as long as enrollment continues to decline. As illustrated in this graph, and similar to November 2010, as the rate of
the enrollment decline slows, the gap narrows.
99
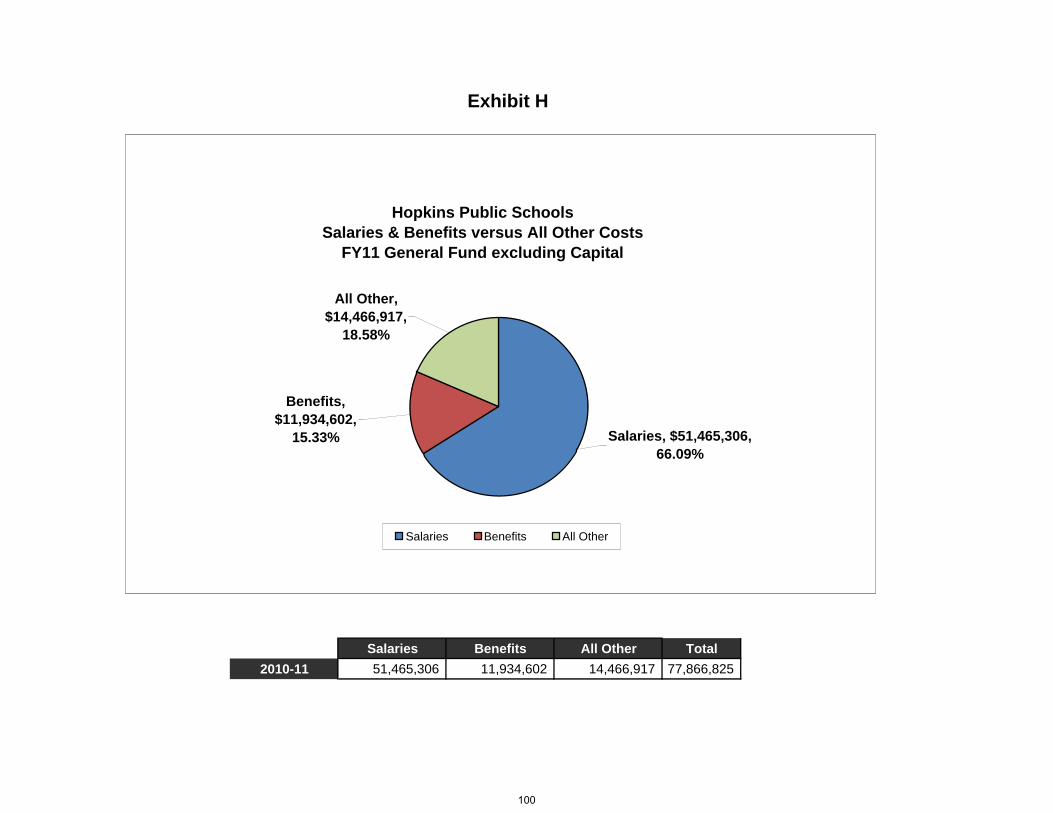
Salaries Benefits All Other Total
2010-11 51,465,306 11,934,602 14,466,917 77,866,825
Exhibit H
Hopkins Public SchoolsSalaries & Benefits versus All Other Costs
FY11 General Fund excluding Capital
All Other, $14,466,917,
18.58%
Benefits, $11,934,602,
15.33% Salaries, $51,465,306, 66.09%
Salaries Benefits All Other
100

Budgeted2001-02 2002-03 2003-04 2004-05 2005-06 2006-07 2007-08 2008-09 2009-10 2010-11 2011-12*
Total Revenue per ADM 8,635 8,994 9,309 9,403 10,007 10,373 10,952 11,037 11,283 11,261 11,179Expenditures per ADM 8,862 9,046 9,352 9,777 9,964 9,777 10,191 10,574 10,503 10,625 11,252
* Note: The Expenditures per ADM reflected for 2011-12 expenditures is based upon the original budget. Once this budget is formally revised by theSchool Board in the first quarter of 2012, a lower amount will be reflected in the Expenditures per ADM for 2011-12.
Exhibit I
Hopkins General Fund Revenue and Expenditures per ADMFY02 through Budgeted FY12
0
2,000
4,000
6,000
8,000
10,000
12,000
2001-02 2002-03 2003-04 2004-05 2005-06 2006-07 2007-08 2008-09 2009-10 2010-11 2011-12*Gen
eral
Fu
nd
Rev
enu
e an
d E
xpen
se p
er A
DM
Total Revenue per ADM Expenditures per ADM
101

THIS PAGE INTENTIONALLY
LEFT BLANK
102
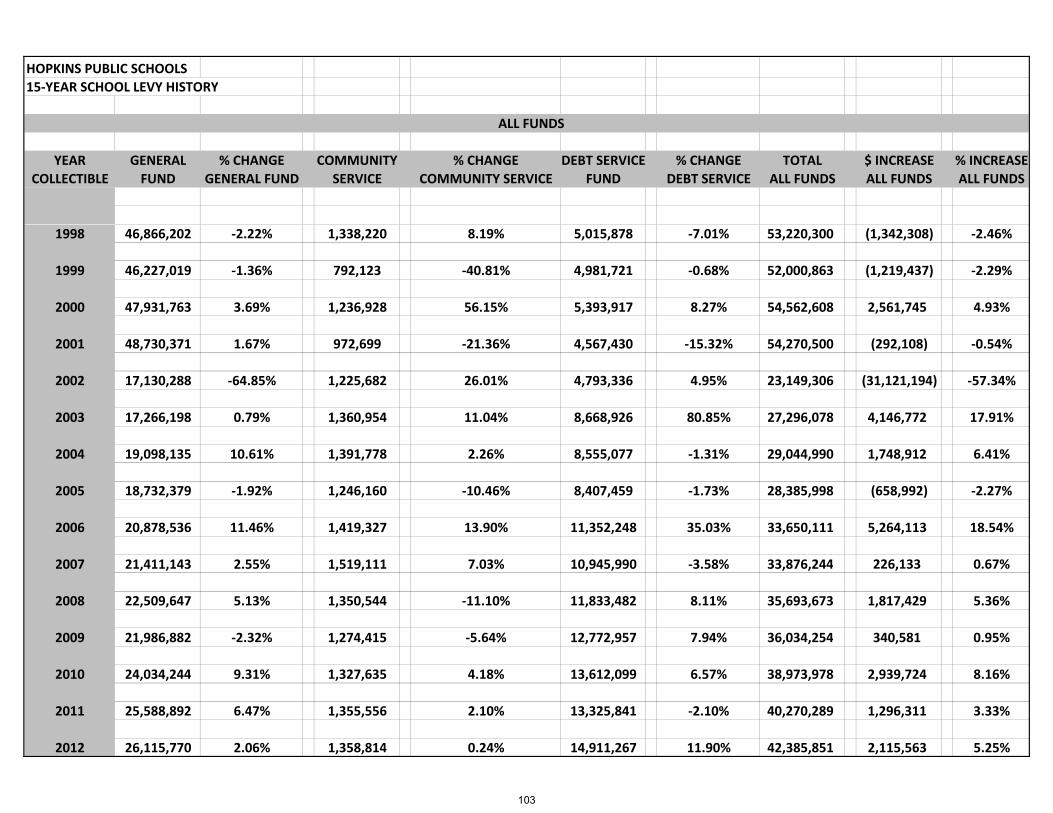
HOPKINS PUBLIC SCHOOLS
15‐YEAR SCHOOL LEVY HISTORY
YEAR GENERAL % CHANGE COMMUNITY % CHANGE DEBT SERVICE % CHANGE TOTAL $ INCREASE % INCREASE
COLLECTIBLE FUND GENERAL FUND SERVICE COMMUNITY SERVICE FUND DEBT SERVICE ALL FUNDS ALL FUNDS ALL FUNDS
ALL FUNDS
1998 46,866,202 ‐2.22% 1,338,220 8.19% 5,015,878 ‐7.01% 53,220,300 (1,342,308) ‐2.46%
1999 46,227,019 ‐1.36% 792,123 ‐40.81% 4,981,721 ‐0.68% 52,000,863 (1,219,437) ‐2.29%
2000 47,931,763 3.69% 1,236,928 56.15% 5,393,917 8.27% 54,562,608 2,561,745 4.93%
2001 48,730,371 1.67% 972,699 ‐21.36% 4,567,430 ‐15.32% 54,270,500 (292,108) ‐0.54%
2002 17,130,288 ‐64.85% 1,225,682 26.01% 4,793,336 4.95% 23,149,306 (31,121,194) ‐57.34%
2003 17,266,198 0.79% 1,360,954 11.04% 8,668,926 80.85% 27,296,078 4,146,772 17.91%
2004 19,098,135 10.61% 1,391,778 2.26% 8,555,077 ‐1.31% 29,044,990 1,748,912 6.41%
2005 18,732,379 ‐1.92% 1,246,160 ‐10.46% 8,407,459 ‐1.73% 28,385,998 (658,992) ‐2.27%
2006 20,878,536 11.46% 1,419,327 13.90% 11,352,248 35.03% 33,650,111 5,264,113 18.54%
2007 21,411,143 2.55% 1,519,111 7.03% 10,945,990 ‐3.58% 33,876,244 226,133 0.67%
2008 22,509,647 5.13% 1,350,544 ‐11.10% 11,833,482 8.11% 35,693,673 1,817,429 5.36%
2009 21,986,882 ‐2.32% 1,274,415 ‐5.64% 12,772,957 7.94% 36,034,254 340,581 0.95%
2010 24,034,244 9.31% 1,327,635 4.18% 13,612,099 6.57% 38,973,978 2,939,724 8.16%
2011 25,588,892 6.47% 1,355,556 2.10% 13,325,841 ‐2.10% 40,270,289 1,296,311 3.33%
2012 26,115,770 2.06% 1,358,814 0.24% 14,911,267 11.90% 42,385,851 2,115,563 5.25%
103

THIS PAGE INTENTIONALLY
LEFT BLANK
104

HOPKINS PUBLIC SCHOOLS FINAL BUDGET Page 12012 - 2013 PUPIL FEE SCHEDULE
2012-2013High School Jr. High School Elementary
N/A N/AEvent Admission Fees Adult/Pupil
Boys FY-12 / FY-13 FY-12 / FY-13 FY-12 / FY-13Baseball $0/$0 - $0/$0Football $7/$5 - $7/$5Basketball $7/$5 - $7/$5Hockey $7/$5 - $7/$5Track & Field $0/$0 - $0/$0Swimming $7/$5 - $7/$5GolfTennisWrestling $7/$5 - $7/$5Cross Country / TrackSlalom SkiCross Country SkiSoccer $7/$5 - $7/$5Adaptive AthleticsLacrosse $7/$5 - $7/5
Girls FY-12/ FY-13 FY-12 / FY-13 FY-12/ FY-13Softball $0/$0 - $0/$0Basketball $7/$5 - $7/$5Track & Field $0/$0 - $0/$0Volleyball $7/$5 - $7/$5Gymnastics $0/$0 - $0/$0Swimming $7/$5 - $7/$5GolfTennisCross Country / TrackSlalom SkiCross Country / SkiSoccer $7/$5 - $7/$5Adaptive AthleticsDanceline $7/$5 - $7/$5Sync. Swimming $0/$0 - $0/$0CheerleadersHockey $7/$5 - $7/$5Lacrosse $7/$5 - $7/$5
Parking Lot Fees Per Year or Day Per Year or Day Per Year or DayIndividual Permit FY-12 / FY-13 $300/$300Daily Parking Permit FY-12 / FY-13 $3.00/$3.00
105

2012 - 2013 PUPIL FEE SCHEDULE Page 2
2012-2013High School Jr. High School Jr. High School
Student Participation Fees VAR/JV/B (9-12) GRADE 7 & 8 Grade 9Per Season Per Season N/A
Boys FY-12 / FY-13 FY-12 / FY-13 FY12/FY13Baseball $230/$230Football $230/$230 $135/$135Basketball $230/$230 $135/$135Hockey $230/$230Track & Field $230/$230 $135/$135Swimming & Diving $230/$230 Golf $230/$230Tennis $230/$230/$135 $135/$135Wrestling $230/$230 $135/$135Cross Country / Track $230/$230 $135/$135Slalom Ski $230/$230Cross Country Ski $230/$230Soccer $230/$230 $135/$135Adaptive Athletics $230/$230Lacrosse $230/$230
Girls FY-12/ FY-13 FY-12/ FY-13 FY12/FY13Softball $230/$230 $135/$135Basketball $230/$230 $135/$135Track & Field $230/$230 $135/$135Volleyball $230/$230 $135/$135Gymnastics $230/$230Swimming & Diving $230/$230 $135/$135Golf $230/$230Tennis $230/$230/$135 $135/$135Cross Country / Track $230/$230 $135/$135Slalom Ski $230/$230Cross Country / Ski $230/$230Soccer $230/$230 $135/$135Adaptive Athletics $230/$230Danceline $230/$230Sync. Swimming $230/$230Cheerleaders $230/$230Hockey $230/$230Lacrosse $230/$230
Student Participation Fees / Boys and Girls Per Season Per Season Per SeasonDebate $230/$230Math League $55/$55Drama Participation Cast ($100) / Crew ($20) $100-$20/$100-$20Jr. High Drama Participation Cast ($75)/Crew ($20) $75-$20/$75-$20Lost Materials (Uniforms,Equipment etc.) Replacement Cost
106

2012 - 2013 PUPIL FEE SCHEDULE Page 3
2012-2013 High School Jr. High School Elementary
Performing Arts Admissions Adult/Pupil FY-12 / FY-13
Band Concerts $7/$5 - $7/$5Vocal Concerts $7/$5 - $7/$5 Pops Concert $7/$5 - $7/$5Orchestra Concerts $7/$5 - $7/$5
at costTheatre Admissions Ticket prices will reflect production expenses.
Rental of Musical Instruments Per year Per Year Per YearFY-12 / FY-13 FY-12 / FY-13 FY-12 / FY-13
Brass Instruments $110/$110 $110/$110 $110/$110Woodwind Instruments $110/$110 $110/$110 $110/$110Percussion Instruments $40/$25 $40/$25 $40/$25String Instruments $110/$110 $110/$110 $110/$110Guitar $20/$20Jr. High Extra Music Activities at costHS Uniform rental $25/$25Summer Instrumental Rental (All) $50/$40 $50/$40 $50/$40Music Practice Books at cost
Field Trips / Elementary & Secondary Per year Per Year Per YearMusic Related Trips at cost at cost at costEnvironmental Learning Center Camps/Elementary at costOther Trips at cost at cost at cost
Transportation Per year Per Year Per YearOptional / Not related to regular "to & from" at cost at cost at cost
High School Guidance Office Per Occurrence Per Occurrence Per Occurrence FY-12 / FY-13 FY-12 / FY-13 FY-12 / FY-13Interest Inventory Tests $4/$4P.S.A.T. Free/FreeTranscript Fee $5/$5Fax Charge $1.00/$1.00Copy Charge (per copy/personal use) $.15/$.15Copy Charge (per copy/schedule) $.15/$.15 A.P. Testing Charges - This is estimated fee if state $100/$50 subsidy for AP tests.
107

2012 - 2013 PUPIL FEE SCHEDULE Page 4
2012-2013 High School Jr. High School Elementary
School District Nutrition Services Per Meal Per Meal Per Meal FY-12 / FY-13 FY-12/ FY-13 FY-12 / FY-13Student Lunch $3.05/$3.15 $2.80/$2.90 $2.55/$2.65Adult Lunch $3.70/$3.80 $3.55/$3.65 $3.55/$3.65Student Breakfast $1.75/$1.75 $1.75/$1.75 $1.25/$1.25Adult Breakfast $2.05/$2.05 $2.05/$2.05 $2.05/$2.05Milk $.50/$.50 $.50/$.50 $.50/$.50Infinite Campus Account Management Systems $1.50 per transaction fee
Dances / Social Events Per School Year Per School Year Per School YearAll costs of social events determined at building N/A N/A N/Alevel with no cost to School District.
Media Centers Per day/item Per day/item Per day/itemLost Materials Cost to Replace Cost to Replace Cost to ReplaceOverdue Materials FinesCopy Fees $0.15 Damage Fees S.H/J.H. $5.00 $5.00Elementary Classroom Weekly Periodicals at costLaptop Damage Cost of Repair Cost of Repair Cost of Repair
Padlocks Per Year Per Year Per Year FY-12 / FY-13 FY-12 / FY-13 FY-12/ FY-13Physical Education $12.00/$12.00 $12.00/$12.00Hallway Locker $12.00/$12.00 $12.00/$12.00Music Locker $12.00/$12.00 $12.00/$12.00Fees paid and reimbursed when student returns padlock
Textbooks and Materials Per Course Per Course Per CourseLoss of Book or Materials at cost at cost at cost
Fine Arts & Pratical Arts (Make & take) Per Course Per Course Per CourseElective Classes at cost at cost
Graduations Event Event EventYear End Graduations No Charge No Charge No ChargeSenior Activities Fee $75/$35
108

2012 - 2013 PUPIL FEE SCHEDULE Page 5
Addendum to Student Participation Fees and Ticket Fees
2012-2013High School Jr. High School ElementaryFY-12/ FY-13 FY-12 / FY-13 FY-12 / FY-13
Participation Fees (Greater than ONE Activity)Minimum Participation fee for every athletic/activity registration $20/$20 $20/$20
First Sport $230/$230 $135/$135Second Sport $230/$230 $135/$135Third Sport $115/$115 $65/$65
Intramural Fee $10.00 $10.00 Family Maximums 1 child $575/$575
2 children $800/$8003 or more children $965/$965
Activity Pass
" Athletic Event Pass" $40
"Family Athletic Event Pass" $160
Note to Fee Schedule: All School District fees are administrated under the directives of the Minnesota Fee Laws, M.S. 123B 37 & 38. These fees will be revisedas legislative changes are made to these laws.
109

2012 - 2013 FACILITY USE FEE SCHEDULE Page 6
Community Services Addendum Regarding Facilities FeesLast adjusted as of July 1, 2011
Personnel Fees Per HourFY12/FY13
Custodial $35/$35Building Supervisor $20/$20Kitchen Supervisor $30/$35All-Day Kindergarten * $3,550/school yearTheater Technical Manager $35/$35Theater Technical Expert $25/$25Theater Technical Student $15/$15Event Ushers $15/$15
Tennis AnnualFY12/FY13
Membership - Resident $20/$20Membership - Non-Resident $35/$35Court Fees $23/$23/hr/court
Lindbergh Center Membership Annual
FY12/FY13Daily use fee $5/$5Resident Adult Basic $75/$75Resident Adult Complete $100/$100Non-Resident Adult Basic $100/$100Non-Resident Adult Complete $140/$140Resident Family Basic $105/$105Resident Family Complete $150/$150Non-Resident Family Basic $150/$150Non-Resident Family Complete $220/$220Student Resident Free/FreeStudent Non-Resident $65/$65College Student Resident $50/$50College Student Non-Resident $65/$65Staff Free/Free* Subject to annual review
110

2012 - 2013 FACILITY USE FEE SCHEDULE Page 7
Community Services Addendum Regarding Facilities FeesLast adjusted as of July 1, 2011
Facilities Use Per Hour/courtFY12/FY13
Pools $12/$12Gyms $10/$10Classrooms $10/$10Cafeterias $12/$12Dining Rooms $35/$35All outdoor natural grass fields $10/$10
Turf Practice Field/Stadium Per HourFY12/FY13
Youth practices $35/$35Youth games $50/$50Adult practices $65/$65Adult games $125/$125
Theater/Auditorium Per HourFY12/FY13
High School Little Theater $50/hr/$50/hrEisenhower Conference Center Theater $75/hr/$75/hr
Conference Center Per HourFY/12/FY13
233 (Board Room) with breakouts $65/$65233 (Board Room) without breakouts $35/$35Large rooms $30/$30Small rooms $20/$20
Lindbergh Center-Exclusive use Per Day/EveningFY12/FY13
All day $1250/$1250Friday evening $625/$625Custodial fee day $250/$250
111

THIS PAGE INTENTIONALLY
LEFT BLANK
112

Estimated Cash Balance Cash Budget Bookfor July 1, 2011 Receipts Disbursements Balance Projection Difference
ALL FUNDS $5,672,592
JULY Actual 5,537,351.89 (3,462,852.28) $7,747,091 $5,680,763 $2,066,328AUGUST Actual 13,342,741.47 (5,413,201.15) $15,676,632 $14,273,162 $1,403,469SEPTEMBER Actual 12,573,740.16 (6,295,154.66) $21,955,217 $17,884,133 $4,071,084OCTOBER Actual 10,352,697.60 (8,945,356.22) $23,362,559 $21,949,026 $1,413,532NOVEMBER Actual 8,739,317.84 (7,652,450.67) $24,449,426 $17,537,754 $6,911,672DECEMBER Actual 1,527,223.72 (7,542,440.39) $18,434,209 $10,862,794 $7,571,415JANUARY Actual 6,696,574.63 (10,425,969.78) $14,704,814 $9,106,143 $5,598,671FEBRUARY Actual 6,869,309.35 (8,142,058.76) $13,432,064 $9,450,518 $3,981,547MARCH Actual 10,176,846.41 (8,447,535.59) $15,161,375 $9,576,050 $5,585,326APRIL Actual 5,675,165.66 (8,499,152.46) $12,337,389 $6,584,464 $5,752,924MAY Estimate 5,431,451.07 (8,576,125.39) $9,192,714 $1,295,207 $7,897,507JUNE Estimate 9,328,459.72 (13,800,185.40) $4,720,989 ($2,345,718) $7,066,707
TOTAL 96,250,879.52 ($97,202,483)
EST. ENDING CASH BALANCE 6/30/12 $4,720,989
JULY 5,969,432.92 (3,584,052.11) $7,106,369AUGUST 15,601,388.03 (5,602,663.19) $17,105,094
Note: Includes the state aid payment shift at 70/30
CASH FLOW ESTIMATE FOR 2011-12(As of April 30, 2011)
2% Increase Local Receipts/3.5% Increase Disbursements (excluding OPEB, debt service & bldg constr)
CASH FLOW BY MONTH
Jul
Aug
SeptOct
Nov
Dec
JanFeb
Mar
Apr
May
Jun
$0
$5,000,000
$10,000,000
$15,000,000
$20,000,000
$25,000,000
$30,000,000
113

Estimated Cash Balance Cashfor July 1, 2012 Receipts Disbursements Balance
ALL FUNDS $4,720,989
JULY 5,969,432.92 (3,584,052.11) $7,106,369AUGUST 15,601,388.03 (5,602,663.19) $17,105,094SEPTEMBER 14,074,371.82 (6,514,417.82) $24,665,048OCTOBER 13,046,698.47 (9,258,443.69) $28,453,303NOVEMBER 8,753,477.62 (7,920,286.44) $29,286,494DECEMBER 1,551,284.08 (7,806,425.80) $23,031,352JANUARY 5,275,557.29 (10,790,878.72) $17,516,031FEBRUARY 6,891,425.03 (8,427,030.82) $15,980,425MARCH 10,205,697.61 (8,743,199.34) $17,442,923APRIL 5,693,615.32 (8,796,622.80) $14,339,916MAY 5,446,598.64 (8,745,059.24) $11,041,455JUNE 9,344,638.10 (13,800,185.40) $6,585,908
TOTAL 101,854,184.89 ($99,989,265)
EST. ENDING CASH BALANCE 6/30/13 $6,585,908
JULY 5,984,327.00 (3,709,493.93) $8,860,741AUGUST 15,593,119.10 (5,798,756.40) $18,655,104
Note: Includes the state aid payment shift at 60/40.Payment shift changed by law to 64/36 for FY12-13 but updated estimates have not been received.
CASH FLOW ESTIMATE FOR 2012-13(As of April 30, 2012)
2% Increase Local Receipts/3.5% Increase Disbursements (excluding OPEB, debt service & bldg constr)
CASH FLOW BY MONTH
Jul
Aug
Sept
Oct Nov
Dec
JanFeb
Mar
Apr
May
Jun
$0$5,000,000
$10,000,000$15,000,000$20,000,000$25,000,000$30,000,000$35,000,000
114

General Fund Revenue and Expense Analysis Section
The following section gives the reader additional analysis from an historical perspective on revenue and expense for the General Fund from FY01‐02 through FY12‐13. As Local and State funding has changed considerably in this time frame it may be more appropriate to look at Property Tax and State Aid on a combined basis. Also provided in each section is the End of Year Adjusted Average Daily Membership (EOY Adjusted ADM) for each Fiscal Year and revenue or expense per ADM. The last page of each summary provides 3, 5 and 10‐year rates of change on a projected and actual basis. The projected basis includes the FY12‐13 budget year. The actual basis includes through the last actual audit year of FY10‐11. General Fund Summary – A combined revenue and expense summary in dollars and dollars per student with 3, 5 and 10‐year rates of change on a projected and actual basis. Total General Fund Revenue – A summary by revenue source code that clearly shows the switch from Property Tax revenue to State revenue. The second page graph of this analysis shows this change occurred from FY01‐02 to FY02‐03 under the Ventura administration. General Fund Revenue by Sub‐Fund – A summary of the revenue splits between the different sub‐funds that the Hopkins District General Fund budget is separated into within the General Fund. General Fund Property Tax Revenue – A summary of the different levy components that make up the General Fund Property Tax levy revenue. General Fund Other Local Revenue Sources – A summary of the different local revenue components collected by the Hopkins District. In total, this revenue component has decreased from FY01‐02 to FY12‐13. General Fund Total State Aid – A summary of both State General Education Aid revenue and Other State Aids revenue. This component is now the primary funding vehicle for the Hopkins District, replacing Property Tax revenue beginning in FY 02‐03. General Fund State General Education Aid – A summary of the different components that make up State General Education Aid revenue. Compensatory Aid, which is based on free and reduced lunch counts, has increased substantially from FY01‐02 to FY12‐13. QComp revenue, which started in FY05‐06, has both a property tax and state aid revenue component. General Fund Other State Aids – A summary of all the other miscellaneous State aids paid to the Hopkins District, the major one being Special Education Aid. General Fund Compensatory Revenue by Site – A summary of Compensatory Revenue by Site to capture the growth by site. All sites have experienced increases in Compensatory Revenue from FY01‐02 to FY12‐13. General Fund Total Federal Revenue – A summary of General Fund Federal Revenue received by the Hopkins District through the Minnesota Dept. of Education (MDE) or directly from Federal Sources. Federal Special Education revenue comprises about a third of this revenue. FY10‐11 reflects the second and final year of additional Federal stimulus revenue received by the Hopkins District. General Fund Other Revenue Sources – A summary of General Fund Other Revenue Sources that annually comprises a very small amount of revenue, unless there is a special circumstance in a given year, such as the sale of bonds in FY08‐09. General Fund Program Expenditures by Budget Package – A summary of General Fund expenses based on how the Hopkins District budgets expenses within the General Fund.
115
The following General Fund Revenue and Expense Analysis section is licensed as software to the Hopkins School District and is considered proprietary confidential property of Carman Consulting, LLC, available only under license. This is an unpublished work as of 2012, protected under the laws of copyright.
116
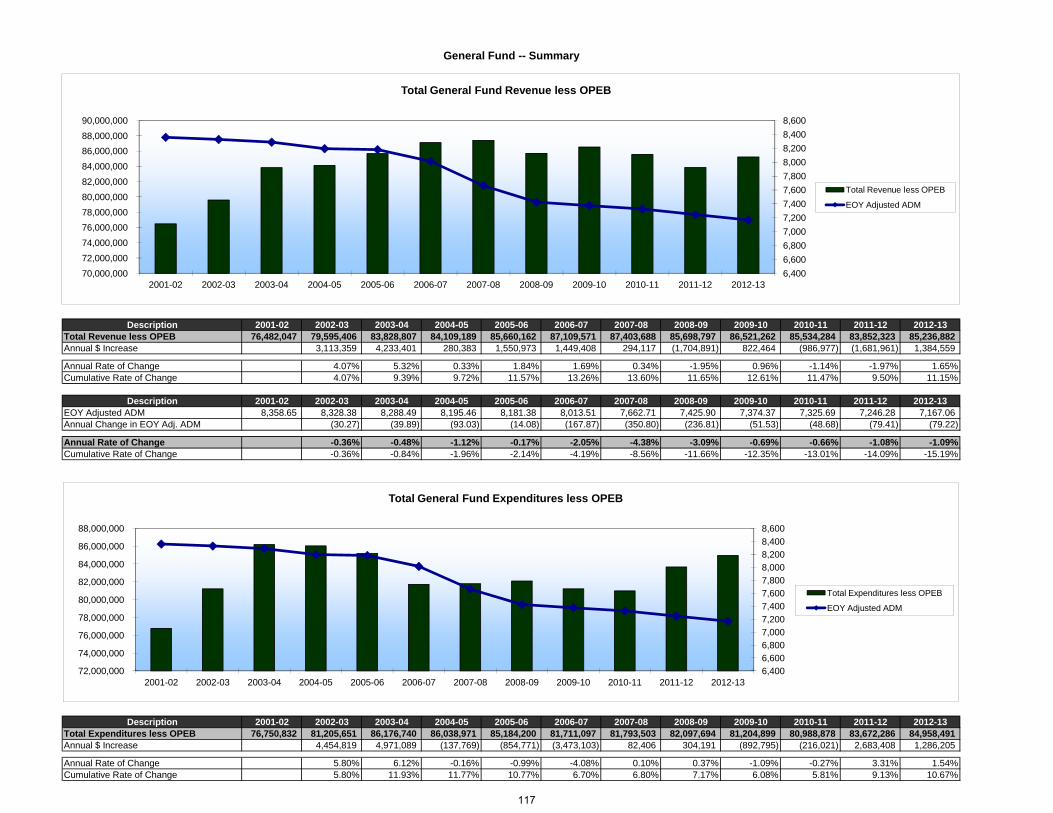
2001-02 2002-03 2003-04 2004-05 2005-06 2006-07 2007-08 2008-09 2009-10 2010-11 2011-12 2012-1376,482,047 79,595,406 83,828,807 84,109,189 85,660,162 87,109,571 87,403,688 85,698,797 86,521,262 85,534,284 83,852,323 85,236,882
3,113,359 4,233,401 280,383 1,550,973 1,449,408 294,117 (1,704,891) 822,464 (986,977) (1,681,961) 1,384,559
4.07% 5.32% 0.33% 1.84% 1.69% 0.34% -1.95% 0.96% -1.14% -1.97% 1.65%4.07% 9.39% 9.72% 11.57% 13.26% 13.60% 11.65% 12.61% 11.47% 9.50% 11.15%
2001-02 2002-03 2003-04 2004-05 2005-06 2006-07 2007-08 2008-09 2009-10 2010-11 2011-12 2012-138,358.65 8,328.38 8,288.49 8,195.46 8,181.38 8,013.51 7,662.71 7,425.90 7,374.37 7,325.69 7,246.28 7,167.06
(30.27) (39.89) (93.03) (14.08) (167.87) (350.80) (236.81) (51.53) (48.68) (79.41) (79.22)
Annual $ Increase
Annual Change in EOY Adj. ADM
General Fund -- Summary
DescriptionTotal Revenue less OPEB
Annual Rate of ChangeCumulative Rate of Change
DescriptionEOY Adjusted ADM
6,400
6,600
6,800
7,000
7,200
7,400
7,600
7,800
8,000
8,200
8,400
8,600
70,000,000
72,000,000
74,000,000
76,000,000
78,000,000
80,000,000
82,000,000
84,000,000
86,000,000
88,000,000
90,000,000
2001-02 2002-03 2003-04 2004-05 2005-06 2006-07 2007-08 2008-09 2009-10 2010-11 2011-12 2012-13
Total General Fund Revenue less OPEB
Total Revenue less OPEB
EOY Adjusted ADM
( ) ( ) ( ) ( ) ( ) ( ) ( ) ( ) ( ) ( ) ( )
-0.36% -0.48% -1.12% -0.17% -2.05% -4.38% -3.09% -0.69% -0.66% -1.08% -1.09%-0.36% -0.84% -1.96% -2.14% -4.19% -8.56% -11.66% -12.35% -13.01% -14.09% -15.19%
2001-02 2002-03 2003-04 2004-05 2005-06 2006-07 2007-08 2008-09 2009-10 2010-11 2011-12 2012-1376,750,832 81,205,651 86,176,740 86,038,971 85,184,200 81,711,097 81,793,503 82,097,694 81,204,899 80,988,878 83,672,286 84,958,491
4,454,819 4,971,089 (137,769) (854,771) (3,473,103) 82,406 304,191 (892,795) (216,021) 2,683,408 1,286,205
5.80% 6.12% -0.16% -0.99% -4.08% 0.10% 0.37% -1.09% -0.27% 3.31% 1.54%5.80% 11.93% 11.77% 10.77% 6.70% 6.80% 7.17% 6.08% 5.81% 9.13% 10.67%
Total Expenditures less OPEBAnnual $ Increase
Annual Rate of Change
g j
Description
Annual Rate of ChangeCumulative Rate of Change
Cumulative Rate of Change
6,400
6,600
6,800
7,000
7,200
7,400
7,600
7,800
8,000
8,200
8,400
8,600
72,000,000
74,000,000
76,000,000
78,000,000
80,000,000
82,000,000
84,000,000
86,000,000
88,000,000
2001-02 2002-03 2003-04 2004-05 2005-06 2006-07 2007-08 2008-09 2009-10 2010-11 2011-12 2012-13
Total General Fund Expenditures less OPEB
Total Expenditures less OPEB
EOY Adjusted ADM
117

General Fund -- Summary
2001-02 2002-03 2003-04 2004-05 2005-06 2006-07 2007-08 2008-09 2009-10 2010-11 2011-12 2012-1376,482,047 79,595,406 83,828,807 84,109,189 85,660,162 87,109,571 87,403,688 85,698,797 86,521,262 85,534,284 83,852,323 85,236,882 76,750,832 81,205,651 86,176,740 86,038,971 85,184,200 81,711,097 81,793,503 82,097,694 81,204,899 80,988,878 83,672,286 84,958,491
(268,785) (1,610,245) (2,347,933) (1,929,782) 475,962 5,398,474 5,610,185 3,601,104 5,316,363 4,545,406 180,037 278,391 Variance (Revenue - Expenditures)
DescriptionTotal Revenue less OPEBTotal Expenditures less OPEB
70,000,000
72,000,000
74,000,000
76,000,000
78,000,000
80,000,000
82,000,000
84,000,000
86,000,000
88,000,000
90,000,000
2001-02 2002-03 2003-04 2004-05 2005-06 2006-07 2007-08 2008-09 2009-10 2010-11 2011-12 2012-13
Total General Fund Revenue and Expenditures less OPEB
Total Revenue less OPEB
Total Expenditures less OPEB
Total General Fund $ per EOY Adjusted ADM -- Revenue and Expenditures less OPEB
2001-02 2002-03 2003-04 2004-05 2005-06 2006-07 2007-08 2008-09 2009-10 2010-11 2011-12 2012-138,358.65 8,328.38 8,288.49 8,195.46 8,181.38 8,013.51 7,662.71 7,425.90 7,374.37 7,325.69 7,246.28 7,167.06
9,150.05 9,557.13 10,113.88 10,262.90 10,470.14 10,870.34 11,406.37 11,540.53 11,732.70 11,675.94 11,571.78 11,892.87 4.45% 5.83% 1.47% 2.02% 3.82% 4.93% 1.18% 1.67% -0.48% -0.89% 2.77%4.45% 10.27% 11.75% 13.77% 17.59% 22.52% 23.70% 25.36% 24.88% 23.99% 26.76%
9,182.20 9,750.47 10,397.16 10,498.37 10,411.96 10,196.67 10,674.23 11,055.59 11,011.77 11,055.46 11,546.93 11,854.02 6.19% 6.63% 0.97% -0.82% -2.07% 4.68% 3.57% -0.40% 0.40% 4.45% 2.66%6.19% 12.82% 13.79% 12.97% 10.90% 15.59% 19.16% 18.76% 19.16% 23.61% 26.27%
Annual Rate of ChangeCumulative Rate of Change
Annual Rate of ChangeCumulative Rate of Change
Total Expenditure per EOY Adj. ADM
Description
Total Revenue per EOY Adj. ADM
EOY Adjusted ADM
-
2,000.00
4,000.00
6,000.00
8,000.00
10,000.00
12,000.00
14,000.00
2001-02 2002-03 2003-04 2004-05 2005-06 2006-07 2007-08 2008-09 2009-10 2010-11 2011-12 2012-13
p j p
Total Revenue per EOY Adj. ADM
Total Expenditure per EOY Adj. ADM
118

General Fund -- Summary
17.59%
7.22% 7.22%
14.01%
10.00%
20.00%
30.00%
40.00%
50.00%
Rate of Change - Projected
1.17%
7.41%
27.61%
8.42%
20.40%
5.00%
10.00%
15.00%
20.00%
25.00%
30.00%
Rate of Change - Actual
3-Year 5-Year 10-Year 3-Year 5-Year 10-Year1.86% 3.05% 17.59% 1.17% 7.41% 27.61%
Total Expenditure per EOY Adj. ADM 7.22% 7.22% 14.01% Total Expenditure per EOY Adj. ADM 0.00% 8.42% 20.40%EOY Adjusted ADM -2.17% -3.49% -13.53% EOY Adjusted ADM -1.35% -8.58% -12.36%
Averages3-Year 2010-11 2012-13 2008-09 2010-115-Year 2008-09 2012-13 2006-07 2010-1110-Year 2003-04 2012-13 2001-02 2010-11
Total Revenue per EOY Adj. ADM Total Revenue per EOY Adj. ADM
Projected Actual
DescriptionDescriptionRate of Change - Projected Rate of Change - Actual
1.86%3.05%
-2.17%-3.49%
-13.53%
-20.00%
-10.00%
0.00%
Total Revenue per EOY Adj. ADM Total Expenditure per EOY Adj. ADM EOY Adjusted ADM
0.00%-1.35%
-8.58%
-12.36%
-15.00%
-10.00%
-5.00%
0.00%
Total Revenue per EOY Adj. ADM Total Expenditure per EOY Adj. ADM EOY Adjusted ADM
119
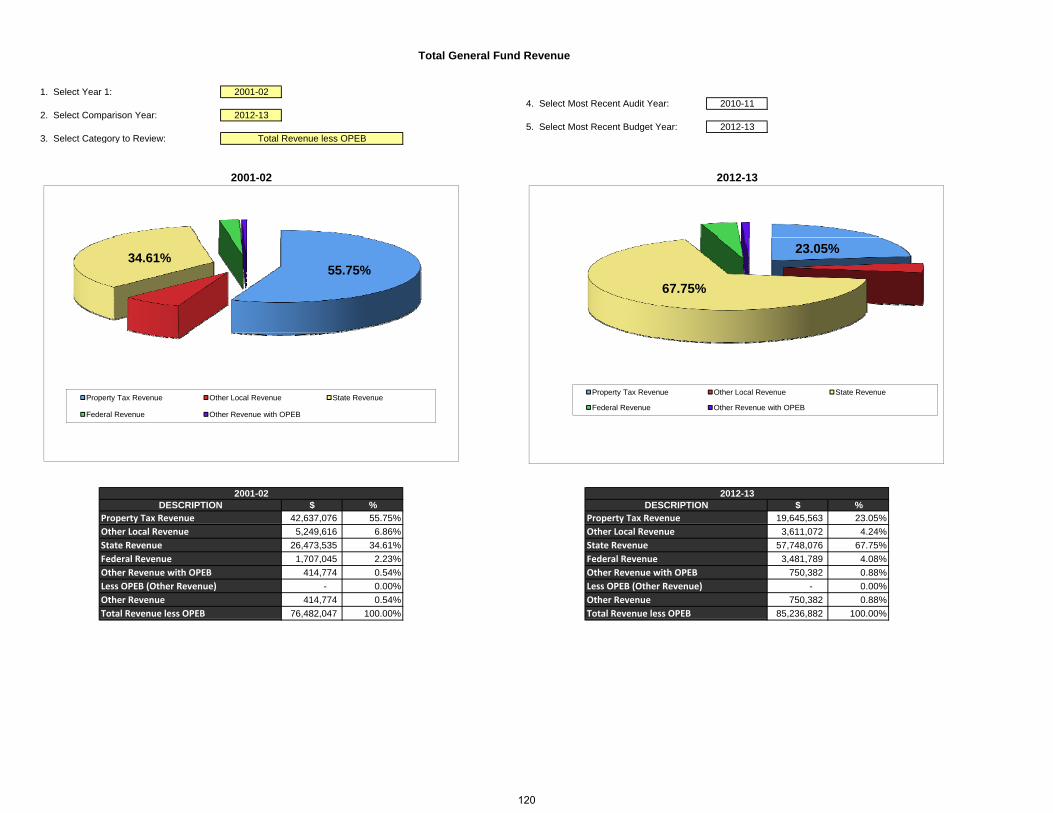
1. Select Year 1: 2001-024. Select Most Recent Audit Year: 2010-11
2. Select Comparison Year: 2012-135. Select Most Recent Budget Year: 2012-13
3. Select Category to Review:
Total General Fund Revenue
Total Revenue less OPEBg y
2001-02 2012-13
55.75%34.61%
23.05%
67.75%
Property Tax Revenue Other Local Revenue State Revenue
Federal Revenue Other Revenue with OPEB
Property Tax Revenue Other Local Revenue State Revenue
Federal Revenue Other Revenue with OPEB
$ % $ %Property Tax Revenue 42,637,076 55.75% 19,645,563 23.05%Property Tax Revenue
DESCRIPTION DESCRIPTION2001-02 2012-13
Other Local Revenue 5,249,616 6.86% 3,611,072 4.24%
State Revenue 26,473,535 34.61% 57,748,076 67.75%
Federal Revenue 1,707,045 2.23% 3,481,789 4.08%
Other Revenue with OPEB 414,774 0.54% 750,382 0.88%
Less OPEB (Other Revenue) - 0.00% - 0.00%
Other Revenue 414,774 0.54% 750,382 0.88%
Total Revenue less OPEB 76,482,047 100.00% 85,236,882 100.00%Total Revenue less OPEBOther Revenue
Other Local RevenueState Revenue
Other Revenue with OPEBLess OPEB (Other Revenue)
Federal Revenue
120

1. Select Year 1: 2001-024. Select Most Recent Audit Year: 2010-11
2. Select Comparison Year: 2012-135. Select Most Recent Budget Year: 2012-13
3. Select Category to Review:
Total General Fund Revenue
Total Revenue less OPEBg y
-0.50%
0.00%
88,000,000
90,000,000
-2.50%
-2.00%
-1.50%
-1.00%
80,000,000
82,000,000
84,000,000
86,000,000
Total Revenue less OPEB
EOY Adjusted ADM
-4.50%
-4.00%
-3.50%
-3.00%
72,000,000
74,000,000
76,000,000
78,000,000
2001-02 2002-03 2003-04 2004-05 2005-06 2006-07 2007-08 2008-09 2009-10 2010-11 2011-12 2012-1376,482,047 79,595,406 83,828,807 84,109,189 85,660,162 87,109,571 87,403,688 85,698,797 84,088,142 85,534,287 83,852,323 85,236,882
4 07% 5 32% 0 33% 1 84% 1 69% 0 34% 1 95% 1 88% 1 72% 1 97% 1 65%
DescriptionTotal Revenue less OPEBAnnual Change
-5.00%70,000,000 2001-02 2002-03 2003-04 2004-05 2005-06 2006-07 2007-08 2008-09 2009-10 2010-11 2011-12 2012-13
4.07% 5.32% 0.33% 1.84% 1.69% 0.34% -1.95% -1.88% 1.72% -1.97% 1.65%8,358.65 8,328.38 8,288.49 8,195.46 8,181.38 8,013.51 7,662.71 7,425.90 7,374.37 7,325.69 7,246.28 7,167.06
-0.36% -0.48% -1.12% -0.17% -2.05% -4.38% -3.09% -0.69% -0.66% -1.08% -1.09%9,150 9,557 10,114 10,263 10,470 10,870 11,406 11,541 11,403 11,676 11,572 11,893
4.45% 5.83% 1.47% 2.02% 3.82% 4.93% 1.18% -1.19% 2.40% -0.89% 2.77%
2001-02 2002-03 2003-04 2004-05 2005-06 2006-07 2007-08 2008-09 2009-10 2010-11 2011-12 2012-1342 637 076 17 271 447 21 913 461 17 702 476 10 691 062 18 736 002 18 421 219 19 252 074 18 055 523 27 120 128 18 938 892 19 645 563
Annual Change
Property Tax Revenue
Annual Change
EOY Adjusted ADMAnnual Change
Revenue per ADM
Description42,637,076 17,271,447 21,913,461 17,702,476 10,691,062 18,736,002 18,421,219 19,252,074 18,055,523 27,120,128 18,938,892 19,645,563
5,249,616 4,059,037 5,395,143 6,986,085 6,347,249 5,270,261 5,117,243 4,542,302 4,478,419 4,062,439 3,551,072 3,611,072
26,473,535 55,893,592 53,756,608 55,691,707 65,066,740 60,284,818 61,009,365 59,061,772 52,614,038 48,648,196 57,505,761 57,748,076
1,707,045 1,988,973 2,382,905 3,185,289 2,807,163 2,443,689 2,746,224 2,712,901 8,940,521 5,690,599 3,856,598 3,481,789
414,774 382,357 380,689 543,632 747,950 374,800 109,637 9,274,339 8,462,378 12,925 - 750,382
- - - - - - - 9,144,590 8,462,738 - - -
414,774 382,357 380,689 543,632 747,950 374,800 109,637 129,749 (360) 12,925 - 750,382
76 482 047 79 595 406 83 828 807 84 109 189 85 660 162 87 109 571 87 403 688 85 698 797 84 088 142 85 534 287 83 852 323 85 236 882
Other Local Revenue
Federal Revenue
Property Tax Revenue
Total Revenue less OPEBOther Revenue
Other Revenue with OPEBLess OPEB (Other Revenue)
State Revenue
76,482,047 79,595,406 83,828,807 84,109,189 85,660,162 87,109,571 87,403,688 85,698,797 84,088,142 85,534,287 83,852,323 85,236,882Total Revenue less OPEB
121
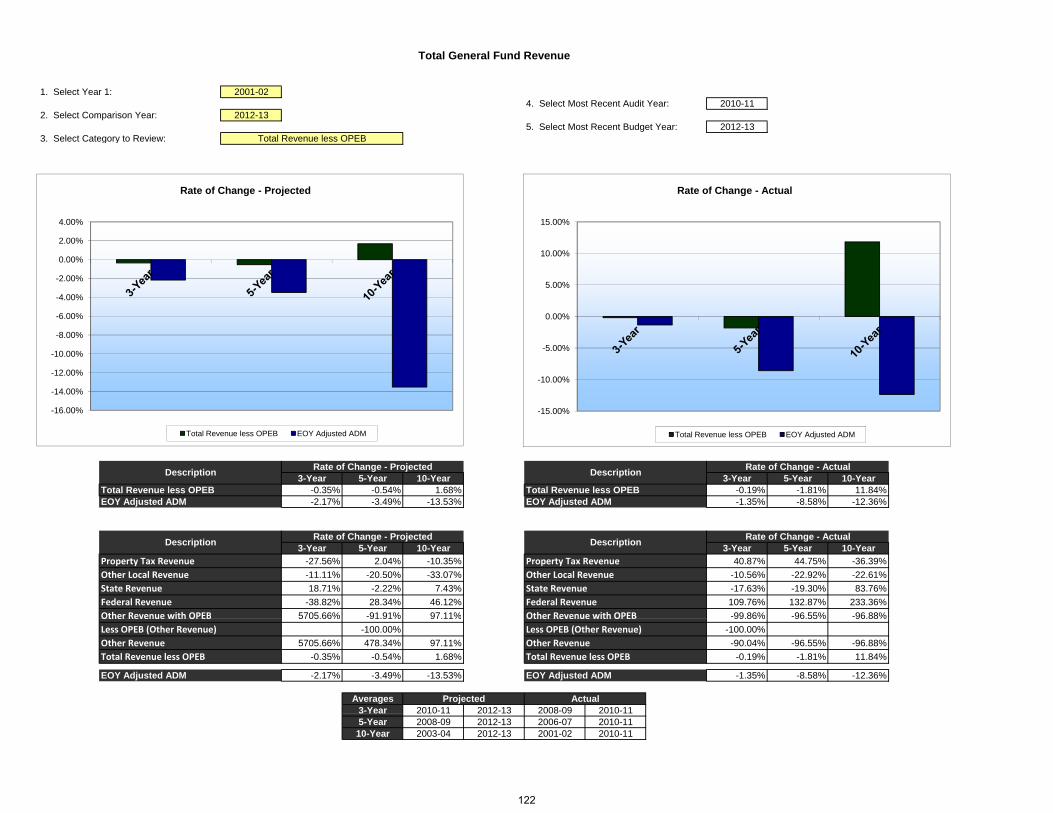
1. Select Year 1: 2001-024. Select Most Recent Audit Year: 2010-11
2. Select Comparison Year: 2012-135. Select Most Recent Budget Year: 2012-13
3. Select Category to Review:
Total General Fund Revenue
Total Revenue less OPEBg y
2 00%
4.00%
Rate of Change - Projected
15.00%
Rate of Change - Actual
8 00%
-6.00%
-4.00%
-2.00%
0.00%
2.00%
0.00%
5.00%
10.00%
-16.00%
-14.00%
-12.00%
-10.00%
-8.00%
-15.00%
-10.00%
-5.00%
3-Year 5-Year 10-Year 3-Year 5-Year 10-Year-0.35% -0.54% 1.68% -0.19% -1.81% 11.84%
EOY Adjusted ADM -2.17% -3.49% -13.53% EOY Adjusted ADM -1.35% -8.58% -12.36%Total Revenue less OPEB Total Revenue less OPEB
DescriptionRate of Change - ActualRate of Change - Projected
Description
Total Revenue less OPEB EOY Adjusted ADM Total Revenue less OPEB EOY Adjusted ADM
3-Year 5-Year 10-Year 3-Year 5-Year 10-YearProperty Tax Revenue -27.56% 2.04% -10.35% Property Tax Revenue 40.87% 44.75% -36.39%
Other Local Revenue -11.11% -20.50% -33.07% Other Local Revenue -10.56% -22.92% -22.61%
State Revenue 18.71% -2.22% 7.43% State Revenue -17.63% -19.30% 83.76%
Federal Revenue -38.82% 28.34% 46.12% Federal Revenue 109.76% 132.87% 233.36%
Other Revenue with OPEB 5705.66% -91.91% 97.11% Other Revenue with OPEB -99.86% -96.55% -96.88%
Rate of Change - ActualDescription
Rate of Change - ProjectedDescription
Other Revenue with OPEB 5705.66% 91.91% 97.11% Other Revenue with OPEB 99.86% 96.55% 96.88%
Less OPEB (Other Revenue) -100.00% Less OPEB (Other Revenue) -100.00%
Other Revenue 5705.66% 478.34% 97.11% Other Revenue -90.04% -96.55% -96.88%
Total Revenue less OPEB -0.35% -0.54% 1.68% Total Revenue less OPEB -0.19% -1.81% 11.84%
EOY Adjusted ADM -2.17% -3.49% -13.53% EOY Adjusted ADM -1.35% -8.58% -12.36%
Averages3-Year 2010-11 2012-13 2008-09 2010-11
Projected Actual3 Year 2010 11 2012 13 2008 09 2010 115-Year 2008-09 2012-13 2006-07 2010-1110-Year 2003-04 2012-13 2001-02 2010-11
122
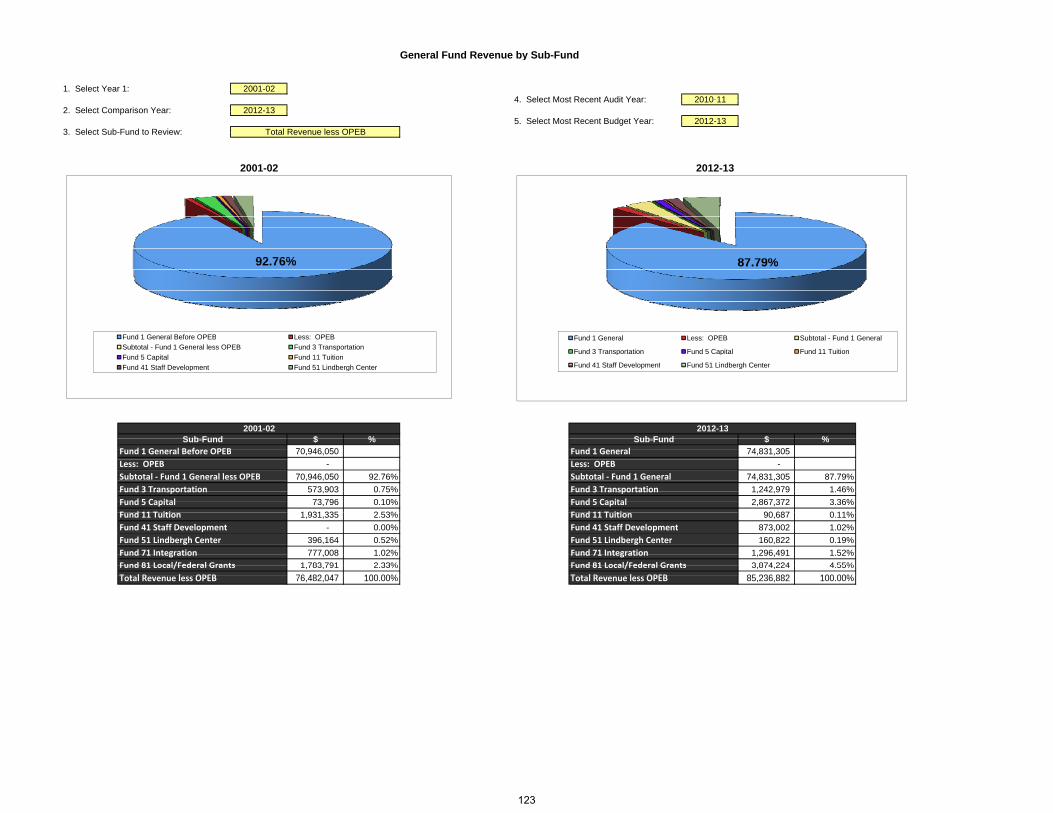
General Fund Revenue by Sub-FundGeneral Fund Revenue by Sub Fund
1 Select Year 1: 2001-021. Select Year 1: 2001 024 Select Most Recent Audit Year: 2010-114. Select Most Recent Audit Year: 2010 11
2 Select Comparison Year: 2012-132. Select Comparison Year: 2012-135 Select Most Recent Budget Year: 2012-135. Select Most Recent Budget Year: 2012-13
3 Select Sub-Fund to Review: Total Revenue less OPEB3. Select Sub-Fund to Review: Total Revenue less OPEB
2012-132001-02
92 76% 87 79%92.76% 87.79%
Fund 1 General Before OPEB Less: OPEB Fund 1 General Less: OPEB Subtotal - Fund 1 GeneralSubtotal - Fund 1 General less OPEB Fund 3 Transportation
Fund 3 Transportation Fund 5 Capital Fund 11 TuitionFund 5 Capital Fund 11 Tuition
p p
Fund 41 Staff Development Fund 51 Lindbergh CenterFund 41 Staff Development Fund 51 Lindbergh Center Fund 41 Staff Development Fund 51 Lindbergh Center
2001 02 2012 13$ % $ %
2001-02Sub Fund Sub Fund
2012-13$ % $ %
70 946 050 74 831 305F d 1 G l B f OPEB F d 1 G lSub-Fund Sub-Fund
70,946,050 74,831,305 Fund 1 General Before OPEB Fund 1 General- - Less: OPEB Less: OPEB
70,946,050 92.76% 74,831,305 87.79%Subtotal ‐ Fund 1 General less OPEB Subtotal ‐ Fund 1 General, , , ,
573 903 0 75% 1 242 979 1 46%Fund 3 Transportation Fund 3 Transportation573,903 0.75% 1,242,979 1.46%
73 796 0 10% 2 867 372 3 36%
Fund 3 TransportationFund 5 Capital Fund 5 Capital
Fund 3 Transportation73,796 0.10% 2,867,372 3.36%
1 931 335 2 53% 90 687 0 11%F d 11 T itiF d 11 T itiFund 5 Capital Fund 5 Capital
1,931,335 2.53% 90,687 0.11%Fund 11 TuitionFund 11 Tuition- 0.00% 873,002 1.02%Fund 41 Staff DevelopmentFund 41 Staff Development
396,164 0.52% 160,822 0.19%Fund 51 Lindbergh Center Fund 51 Lindbergh Center, ,
777 008 1 02% 1 296 491 1 52%
gFund 71 Integration
gFund 71 Integration 777,008 1.02% 1,296,491 1.52%
1 783 791 2 33% 3 874 224 4 55%Fund 81 Local/Federal GrantsFund 71 IntegrationFund 81 Local/Federal Grants
Fund 71 Integration1,783,791 2.33% 3,874,224 4.55%
76 482 047 100 00% 85 236 882 100 00%
Fund 81 Local/Federal GrantsT t l R l OPEB
Fund 81 Local/Federal GrantsT t l R l OPEB76,482,047 100.00% 85,236,882 100.00%Total Revenue less OPEB Total Revenue less OPEB
123

General Fund Revenue by Sub-FundGeneral Fund Revenue by Sub Fund
1 Select Year 1: 2001-021. Select Year 1: 2001 024 Select Most Recent Audit Year: 2010-114. Select Most Recent Audit Year: 2010 11
2 Select Comparison Year: 2012-132. Select Comparison Year: 2012-135 Select Most Recent Budget Year: 2012-135. Select Most Recent Budget Year: 2012-13
3 Select Sub-Fund to Review: Total Revenue less OPEB3. Select Sub-Fund to Review: Total Revenue less OPEB
0.00%90,000,000
0 50%88 000 000 -0.50%88,000,000
1 00%86 000 000 -1.00%86,000,000
-1.50%84,000,000 1.50%84,000,000
-2.00%82,000,000
2 50%80 000 000Total Revenue less OPEB
-2.50%80,000,000 EOY Adjusted ADM
3 00%78 000 000EOY Adjusted ADM
-3.00%78,000,000
-3.50%76,000,000 3.50%76,000,000
-4.00%74,000,000
4 50%72 000 000 -4.50%72,000,000
5 00%70 000 000 -5.00%70,000,000 2001 02 2002 03 2003 04 2004 05 2005 06 2006 07 2007 08 2008 09 2009 10 2010 11 2011 12 2012 132001-02 2002-03 2003-04 2004-05 2005-06 2006-07 2007-08 2008-09 2009-10 2010-11 2011-12 2012-13
2001-02 2002-03 2003-04 2004-05 2005-06 2006-07 2007-08 2008-09 2009-10 2010-11 2011-12 2012-13Sub-Fund76,482,047 79,595,406 83,828,807 84,109,189 85,660,162 87,109,571 87,403,688 85,698,797 86,521,262 85,534,284 83,852,323 85,236,882 Total Revenue less OPEB
4.07% 5.32% 0.33% 1.84% 1.69% 0.34% -1.95% 0.96% -1.14% -1.97% 1.65%Annual Change8,358.65 8,328.38 8,288.49 8,195.46 8,181.38 8,013.51 7,662.71 7,425.90 7,374.37 7,325.69 7,246.28 7,167.06 EOY Adjusted ADM
g, , , , , , , , , , , ,
-0.36% -0.48% -1.12% -0.17% -2.05% -4.38% -3.09% -0.69% -0.66% -1.08% -1.09%j
Annual Change9,150 9,557 10,114 10,263 10,470 10,870 11,406 11,541 11,733 11,676 11,572 11,893 Revenue per ADM
g, , , , , , , , , , , ,
4.45% 5.83% 1.47% 2.02% 3.82% 4.93% 1.18% 1.67% -0.48% -0.89% 2.77%p
Annual Change % % % % % % % % % % %g
2001-02 2002-03 2003-04 2004-05 2005-06 2006-07 2007-08 2008-09 2009-10 2010-11 2011-12 2012-13Sub-Fund 2001 02 2002 03 2003 04 2004 05 2005 06 2006 07 2007 08 2008 09 2009 10 2010 11 2011 12 2012 1370 946 050 73 779 533 76 156 141 68 685 942 74 044 345 76 070 510 77 223 279 84 567 418 84 137 414 75 454 836 73 209 267 74 831 305Fund 1 General Before OPEB
Sub Fund70,946,050 73,779,533 76,156,141 68,685,942 74,044,345 76,070,510 77,223,279 84,567,418 84,137,414 75,454,836 73,209,267 74,831,305
9 144 590 8 462 378
Fund 1 General Before OPEBLess: OPEB - - - - - - - 9,144,590 8,462,378 - - -
0 9 6 0 0 3 9 33 6 1 6 1 1 68 68 9 2 0 3 6 0 0 10 223 2 9 22 828 6 036 836 3 209 26 831 30b l d l lLess: OPEB
70,946,050 73,779,533 76,156,141 68,685,942 74,044,345 76,070,510 77,223,279 75,422,828 75,675,036 75,454,836 73,209,267 74,831,305 Subtotal ‐ Fund 1 General less OPEB573,903 516,530 1,447,936 1,079,946 1,025,997 1,307,001 981,638 624,223 625,989 1,218,838 1,242,979 1,242,979 Fund 3 Transportation
73,796 3,740 46,027 6,454,768 3,407,985 3,855,605 3,373,002 3,741,080 3,159,322 3,004,078 2,873,901 2,867,372 Fund 5 Capital 73,796 3,740 46,027 6,454,768 3,407,985 3,855,605 3,373,002 3,741,080 3,159,322 3,004,078 2,873,901 2,867,372
1 931 335 1 501 387 1 878 000 2 791 841 1 863 364 1 170 522 949 026 706 412 706 413 293 984 90 687 90 687Fund 11 TuitionFund 5 Capital
1,931,335 1,501,387 1,878,000 2,791,841 1,863,364 1,170,522 949,026 706,412 706,413 293,984 90,687 90,687
1 843 189 198 850 127 830 108 234 450 091 442 740 219 419 875 536 873 002
Fund 11 TuitionFund 41 Staff Development - 1,843 - 189 198,850 127,830 108,234 450,091 442,740 219,419 875,536 873,002 Fund 41 Staff Development
d i db h 396,164 422,735 387,119 383,855 480,186 202,240 246,622 211,161 211,161 157,642 160,822 160,822 Fund 51 Lindbergh Center777,008 1,207,126 1,181,007 1,285,149 1,272,539 1,432,508 1,278,858 1,336,830 1,231,772 1,272,853 1,292,967 1,296,491 Fund 71 Integration
1,783,791 2,162,513 2,732,577 3,427,499 3,366,894 2,943,355 3,243,029 3,206,173 4,468,829 3,912,635 4,106,164 3,874,224 Fund 81 Local/Federal Grants 1,783,791 2,162,513 2,732,577 3,427,499 3,366,894 2,943,355 3,243,029 3,206,173 4,468,829 3,912,635 4,106,164 3,874,224
76 482 047 79 595 406 83 828 807 84 109 189 85 660 162 87 109 571 87 403 688 85 698 797 86 521 262 85 534 284 83 852 323 85 236 882Total Revenue less OPEBFund 81 Local/Federal Grants
76,482,047 79,595,406 83,828,807 84,109,189 85,660,162 87,109,571 87,403,688 85,698,797 86,521,262 85,534,284 83,852,323 85,236,882 Total Revenue less OPEB
124

General Fund Revenue by Sub-FundGeneral Fund Revenue by Sub Fund
1 Select Year 1: 2001-021. Select Year 1: 2001 024 Select Most Recent Audit Year: 2010-114. Select Most Recent Audit Year: 2010 11
2 Select Comparison Year: 2012-132. Select Comparison Year: 2012-135 Select Most Recent Budget Year: 2012-135. Select Most Recent Budget Year: 2012-13
3 Select Sub-Fund to Review: Total Revenue less OPEB3. Select Sub-Fund to Review: Total Revenue less OPEB
Rate of Change - Projected Rate of Change - Actual
4 00% 15 00%
2 00%
4.00% 15.00%
2.00%10 00%0.00% 10.00%
-2.00% 5 00%-4.00%
5.00%
-6 00% 0 00%
8 00%
6.00% 0.00%
10 00%
-8.00%-5 00%-10.00% 5.00%
-12.00%-10.00%
-14.00%10.00%
-16.00% -15.00%15.00%
Total Revenue less OPEB EOY Adjusted ADM Total Revenue less OPEB EOY Adjusted ADMj ota e e ue ess O O djusted
Rate of Change - ProjectedSub Fund Sub Fund
Rate of Change - Actual3-Year 5-Year 10-Year 3-Year 5-Year 10-Year
g jSub-Fund Sub-Fund
g
-0.35% -0.54% 1.68% -0.19% -1.81% 11.84%Total Revenue less OPEBTotal Revenue less OPEBEOY Adjusted ADM -2.17% -3.49% -13.53% EOY Adjusted ADM -1.35% -8.58% -12.36%EOY Adjusted ADM 2.17% 3.49% 13.53% EOY Adjusted ADM 1.35% 8.58% 12.36%
Rate of Change - ProjectedS b F d
Rate of Change - ActualS b F d
3-Year 5-Year 10-Year 3-Year 5-Year 10-YearRate of Change Projected
Sub-FundRate of Change Actual
Sub-Fund3 Year 5 Year 10 Year 3 Year 5 Year 10 Year
Fund 1 General Before OPEB -0 83% -11 51% -1 74% Fund 1 General Before OPEB -10 78% -0 81% 6 36%Fund 1 General Before OPEB -0.83% -11.51% -1.74% Fund 1 General Before OPEB -10.78% -0.81% 6.36%
Less OPEB 100 00% Less OPEB 100 00%Less: OPEB -100.00% Less: OPEB -100.00%
Subtotal ‐ Fund 1 General less OPEB -0.83% -0.78% -1.74% Subtotal ‐ Fund 1 General less OPEB 0.04% -0.81% 6.36%
Fund 3 Transportation 1.98% 99.12% -14.16% Fund 3 Transportation 95.26% -6.75% 112.38%
Fund 5 Capital -4.55% -23.35% 6129.73% Fund 5 Capital -19.70% -22.09% 3970.78%Fund 5 Capital 4.55% 23.35% 6129.73% Fund 5 Capital 19.70% 22.09% 3970.78%
Fund 11 Tuition -69 15% -87 16% -95 17% Fund 11 Tuition -58 38% -74 88% -84 78%Fund 11 Tuition -69.15% -87.16% -95.17% Fund 11 Tuition -58.38% -74.88% -84.78%
F d 41 St ff D l t 297 87% 93 96% F d 41 St ff D l t 51 25% 71 65%Fund 41 Staff Development 297.87% 93.96% Fund 41 Staff Development -51.25% 71.65%
Fund 51 Lindbergh Center 2.02% -23.84% -58.46% Fund 51 Lindbergh Center -25.34% -22.05% -60.21%
Fund 71 Integration 1.86% -3.02% 9.78% Fund 71 Integration -4.79% -11.15% 63.81%g gFund 81 Local/Federal Grants -0.98% 20.84% 41.78% Fund 81 Local/Federal Grants 22.03% 32.93% 119.34%Fund 81 Local/Federal Grants 0.98% 20.84% 41.78% Fund 81 Local/Federal Grants 22.03% 32.93% 119.34%
Total Revenue less OPEB 0 35% 0 54% 1 68% Total Revenue less OPEB 0 19% 1 81% 11 84%Total Revenue less OPEB -0.35% -0.54% 1.68% Total Revenue less OPEB -0.19% -1.81% 11.84%
EOY Adjusted ADM -2.17% -3.49% -13.53% EOY Adjusted ADM -1.35% -8.58% -12.36%j j
Averages Projected Actualg3-Year 2010-11 2012-13 2008-09 2010-11
j
5-Year 2008-09 2012-13 2006-07 2010-1110-Year 2003-04 2012-13 2001-02 2010-1110 Year 2003 04 2012 13 2001 02 2010 11
125
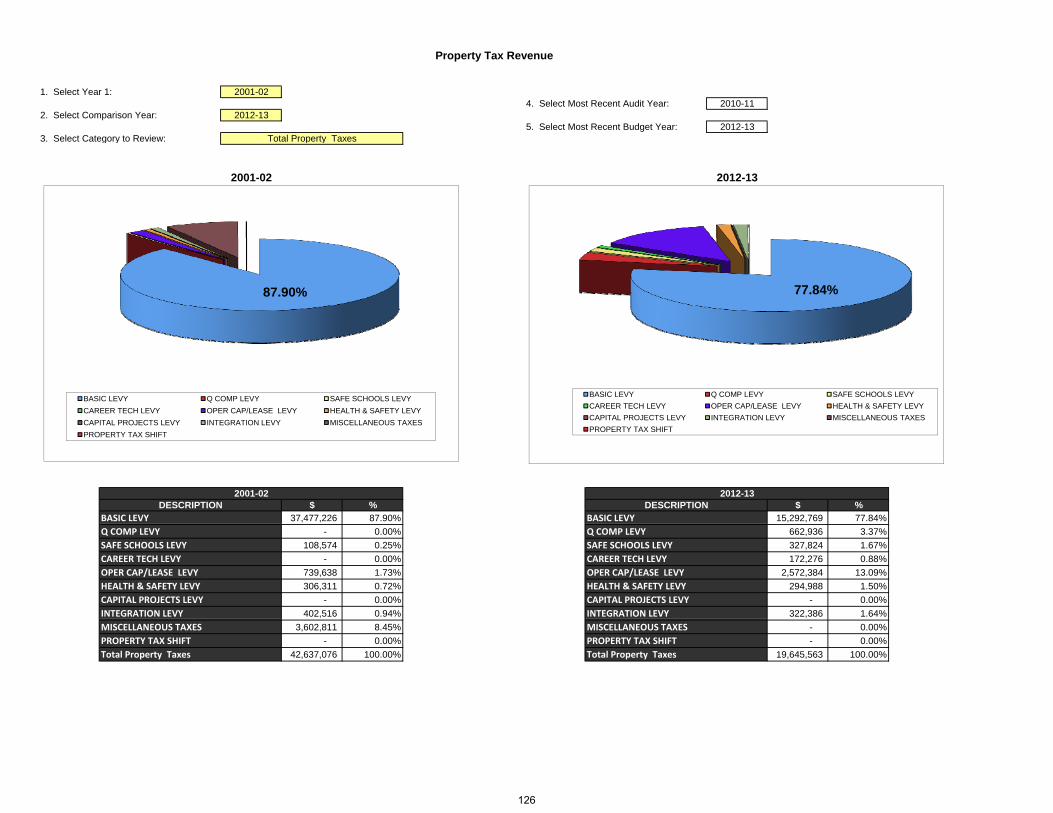
1. Select Year 1: 2001-024. Select Most Recent Audit Year: 2010-11
2. Select Comparison Year: 2012-135. Select Most Recent Budget Year: 2012-13
3. Select Category to Review:
Property Tax Revenue
Total Property Taxesg y p y
2001-02 2012-13
87.90% 77.84%
BASIC LEVY Q COMP LEVY SAFE SCHOOLS LEVY
CAREER TECH LEVY OPER CAP/LEASE LEVY HEALTH & SAFETY LEVY
CAPITAL PROJECTS LEVY INTEGRATION LEVY MISCELLANEOUS TAXES
BASIC LEVY Q COMP LEVY SAFE SCHOOLS LEVY
CAREER TECH LEVY OPER CAP/LEASE LEVY HEALTH & SAFETY LEVY
CAPITAL PROJECTS LEVY INTEGRATION LEVY MISCELLANEOUS TAXES
PROPERTY TAX SHIFT
$ % $ %BASIC LEVY 37,477,226 87.90% 15,292,769 77.84%
2001-02 2012-13DESCRIPTION DESCRIPTION
BASIC LEVY
PROPERTY TAX SHIFTPROPERTY TAX SHIFT
Q COMP LEVY - 0.00% 662,936 3.37%
SAFE SCHOOLS LEVY 108,574 0.25% 327,824 1.67%
CAREER TECH LEVY - 0.00% 172,276 0.88%
OPER CAP/LEASE LEVY 739,638 1.73% 2,572,384 13.09%
HEALTH & SAFETY LEVY 306,311 0.72% 294,988 1.50%
CAPITAL PROJECTS LEVY - 0.00% - 0.00%
INTEGRATION LEVY 402,516 0.94% 322,386 1.64%
Q COMP LEVYSAFE SCHOOLS LEVYCAREER TECH LEVY
INTEGRATION LEVYCAPITAL PROJECTS LEVY
OPER CAP/LEASE LEVYHEALTH & SAFETY LEVY
MISCELLANEOUS TAXES 3,602,811 8.45% - 0.00%
PROPERTY TAX SHIFT - 0.00% - 0.00%
Total Property Taxes 42,637,076 100.00% 19,645,563 100.00%
MISCELLANEOUS TAXESPROPERTY TAX SHIFTTotal Property Taxes
126

1. Select Year 1: 2001-024. Select Most Recent Audit Year: 2010-11
2. Select Comparison Year: 2012-135. Select Most Recent Budget Year: 2012-13
3. Select Category to Review:
Property Tax Revenue
Total Property Taxesg y p y
-0.50%
0.00%
40,000,000
45,000,000
3 00%
-2.50%
-2.00%
-1.50%
-1.00%
20,000,000
25,000,000
30,000,000
35,000,000
Total Property Taxes
EOY Adjusted ADM
-5.00%
-4.50%
-4.00%
-3.50%
-3.00%
-
5,000,000
10,000,000
15,000,000
2001-02 2002-03 2003-04 2004-05 2005-06 2006-07 2007-08 2008-09 2009-10 2010-11 2011-12 2012-1342,637,076 17,271,447 21,913,461 17,702,476 10,691,062 18,736,002 18,421,219 19,252,074 18,055,523 27,120,125 18,938,892 19,645,563
-59.49% 26.88% -19.22% -39.61% 75.25% -1.68% 4.51% -6.22% 50.20% -30.17% 3.73%8 358 65 8 328 38 8 288 49 8 195 46 8 181 38 8 013 51 7 662 71 7 425 90 7 374 37 7 325 69 7 246 28 7 167 06
Annual ChangeEOY Adjusted ADM
DescriptionTotal Property Taxes
5 00%2001-02 2002-03 2003-04 2004-05 2005-06 2006-07 2007-08 2008-09 2009-10 2010-11 2011-12 2012-13
8,358.65 8,328.38 8,288.49 8,195.46 8,181.38 8,013.51 7,662.71 7,425.90 7,374.37 7,325.69 7,246.28 7,167.06 -0.36% -0.48% -1.12% -0.17% -2.05% -4.38% -3.09% -0.69% -0.66% -1.08% -1.09%
5,101 2,074 2,644 2,160 1,307 2,338 2,404 2,593 2,448 3,702 2,614 2,741 -59.34% 27.49% -18.30% -39.50% 78.92% 2.82% 7.84% -5.56% 51.20% -29.40% 4.88%
2001-02 2002-03 2003-04 2004-05 2005-06 2006-07 2007-08 2008-09 2009-10 2010-11 2011-12 2012-1337,477,226 12,101,346 11,409,565 10,798,037 11,644,403 12,664,180 12,916,291 13,085,475 12,014,424 13,048,756 14,623,529 15,292,769
579 593 549 239 556 583 651 603 628 693 688 676 662 936
EOY Adjusted ADM
Q COMP LEVY
Annual ChangeRevenue per ADMAnnual Change
DescriptionBASIC LEVY
- - - - - 579,593 549,239 556,583 651,603 628,693 688,676 662,936
108,574 107,175 289,103 250,801 249,932 249,942 250,261 369,272 352,246 318,639 317,519 327,824
- 136,810 153,906 145,358 145,358 145,358 145,358 145,358 155,374 155,374 146,405 172,276
739,638 778,349 822,257 1,466,133 1,602,004 2,784,075 2,369,860 2,434,778 2,396,880 2,314,938 2,475,339 2,572,384
306,311 594,896 845,572 1,512,802 604,783 699,880 165,077 662,332 762,442 650,057 368,562 294,988
- 2,000,000 2,000,000 2,000,000 - - - - - - - -
402,516 468,958 273,405 370,552 326,972 355,637 350,832 362,157 300,256 313,223 318,862 322,386
3 602 811 1 083 915 1 160 095 1 318 532 917 431 1 257 338 1 674 302 1 636 120 1 422 298 1 514 966MISCELLANEOUS TAXES
HEALTH & SAFETY LEVYCAPITAL PROJECTS LEVY
Q COMP LEVYSAFE SCHOOLS LEVY
OPER CAP/LEASE LEVY
INTEGRATION LEVY
CAREER TECH LEVY
3,602,811 1,083,915 1,160,095 1,318,532 917,431 1,257,338 1,674,302 1,636,120 1,422,298 1,514,966 - -
- - 4,959,559 (159,738) (4,799,821) - - - - 8,175,479 - -
42,637,076 17,271,447 21,913,461 17,702,476 10,691,062 18,736,002 18,421,219 19,252,074 18,055,523 27,120,125 18,938,892 19,645,563
MISCELLANEOUS TAXESPROPERTY TAX SHIFTTotal Property Taxes
127

1. Select Year 1: 2001-024. Select Most Recent Audit Year: 2010-11
2. Select Comparison Year: 2012-135. Select Most Recent Budget Year: 2012-13
3. Select Category to Review:
Property Tax Revenue
Total Property Taxesg y p y
5.00%
Rate of Change - Projected
40 00%
50.00%
Rate of Change - Actual
-15.00%
-10.00%
-5.00%
0.00%
10 00%
0.00%
10.00%
20.00%
30.00%
40.00%
-30.00%
-25.00%
-20.00%
-50.00%
-40.00%
-30.00%
-20.00%
-10.00%
3-Year 5-Year 10-Year 3-Year 5-Year 10-Year-27.56% 2.04% -10.35% 40.87% 44.75% -36.39%
EOY Adjusted ADM -2.17% -3.49% -13.53% EOY Adjusted ADM -1.35% -8.58% -12.36%Total Property Taxes Total Property Taxes
DescriptionDescriptionRate of Change - Projected Rate of Change - Actual
Total Property Taxes EOY Adjusted ADM Total Property Taxes EOY Adjusted ADM
3-Year 5-Year 10-Year 3-Year 5-Year 10-YearBASIC LEVY 17.20% 16.87% 34.03% BASIC LEVY -0.28% 3.04% -65.18%
OPER CAP/LEASE LEVY 11.12% 5.65% 212.84% OPER CAP/LEASE LEVY -4.92% -16.85% 212.98%
HEALTH & SAFETY LEVY -54.62% -55.46% -65.11% HEALTH & SAFETY LEVY -1.85% -7.12% 112.22%
CAPITAL PROJECTS LEVY -100.00% CAPITAL PROJECTS LEVYINTEGRATION LEVY 2.93% -10.98% 17.92% INTEGRATION LEVY -13.51% -11.93% -22.18%
DescriptionRate of Change - Projected
DescriptionRate of Change - Actual
INTEGRATION LEVY 2.93% 10.98% 17.92% INTEGRATION LEVY 13.51% 11.93% 22.18%
MISCELLANEOUS TAXES -100.00% -100.00% -100.00% MISCELLANEOUS TAXES -7.40% 20.49% -57.95%
PROPERTY TAX SHIFT -100.00% -100.00% PROPERTY TAX SHIFTTotal Property Taxes -27.56% 2.04% -10.35% Total Property Taxes 40.87% 44.75% -36.39%
EOY Adjusted ADM -2.17% -3.49% -13.53% EOY Adjusted ADM -1.35% -8.58% -12.36%
Averages3-Year 2010-11 2012-13 2008-09 2010-11
Projected Actual3 Year 2010 11 2012 13 2008 09 2010 115-Year 2008-09 2012-13 2006-07 2010-1110-Year 2003-04 2012-13 2001-02 2010-11
128

1. Select Year 1: 2001-024. Select Most Recent Audit Year: 2010-11
2. Select Comparison Year: 2012-135. Select Most Recent Budget Year: 2012-13
3. Select Category to Review:
Other LOCAL Revenue Sources
TOTAL other LOCAL Revenueg y
2001-02 2012-13
53.36% 7.82%
ALC Revenue Challenge/AP Testing Revenue Athletic/Activity RevenueALC Revenue Challenge/AP Testing Revenue Athletic/Activity Revenue
Music Rentals and Fees Interest Earnings Facility Rentals
$ % $ %2001-02 2012-13
DESCRIPTION DESCRIPTION
Music Rentals and Fees Interest Earnings Facility Rentals
Revenue from Other MN Districts All Other Revenue
Revenue from Other MN Districts All Other Revenue
ALC Revenue 130,636 2.49% 426,198 11.80%
Challenge/AP Testing Revenue 30,201 0.58% 40,928 1.13%
Athletic/Activity Revenue 291,698 5.56% 591,301 16.37%
Music Rentals and Fees 23,227 0.44% 58,945 1.63%
Interest Earnings 400,961 7.64% 3,691 0.10%
Facility Rentals 311,134 5.93% 778,934 21.57%
Revenue from Other MN Districts 2,801,204 53.36% 282,211 7.82%
ALC RevenueChallenge/AP Testing Revenue
Interest EarningsFacility RentalsRevenue from Other MN Districts
Athletic/Activity RevenueMusic Rentals and Fees
All Other Revenue 1,260,556 24.01% 1,428,864 39.57%
TOTAL other LOCAL Revenue 5,249,616 100.00% 3,611,072 100.00%TOTAL other LOCAL RevenueAll Other Revenue
129

1. Select Year 1: 2001-024. Select Most Recent Audit Year: 2010-11
2. Select Comparison Year: 2012-135. Select Most Recent Budget Year: 2012-13
3. Select Category to Review:
Other LOCAL Revenue Sources
TOTAL other LOCAL Revenueg y
-0.50%
0.00%
7,000,000
8,000,000
-2.50%
-2.00%
-1.50%
-1.00%
4,000,000
5,000,000
6,000,000
TOTAL other LOCAL Revenue
EOY Adjusted ADM
-4.50%
-4.00%
-3.50%
-3.00%
1,000,000
2,000,000
3,000,000
2001-02 2002-03 2003-04 2004-05 2005-06 2006-07 2007-08 2008-09 2009-10 2010-11 2011-12 2012-135,249,616 4,059,037 5,395,143 6,986,085 6,347,249 5,270,261 5,117,243 4,542,302 4,478,419 4,062,439 3,551,072 3,611,072
22 68% 32 92% 29 49% 9 14% 16 97% 2 90% 11 24% 1 41% 9 29% 12 59% 1 69%TOTAL other LOCAL RevenueAnnual Change
Description
-5.00%-2001-02 2002-03 2003-04 2004-05 2005-06 2006-07 2007-08 2008-09 2009-10 2010-11 2011-12 2012-13
-22.68% 32.92% 29.49% -9.14% -16.97% -2.90% -11.24% -1.41% -9.29% -12.59% 1.69%8,358.65 8,328.38 8,288.49 8,195.46 8,181.38 8,013.51 7,662.71 7,425.90 7,374.37 7,325.69 7,246.28 7,167.06
-0.36% -0.48% -1.12% -0.17% -2.05% -4.38% -3.09% -0.69% -0.66% -1.08% -1.09%628 487 651 852 776 658 668 612 607 555 490 504
-22.40% 33.56% 30.96% -8.99% -15.23% 1.54% -8.40% -0.72% -8.69% -11.63% 2.81%
2001-02 2002-03 2003-04 2004-05 2005-06 2006-07 2007-08 2008-09 2009-10 2010-11 2011-12 2012-13130 636 156 083 149 766 621 832 362 480 395 078 475 816 481 772 520 503 462 590 426 198 426 198ALC Revenue
Annual ChangeEOY Adjusted ADMAnnual Change
Description
Revenue per ADMAnnual Change
130,636 156,083 149,766 621,832 362,480 395,078 475,816 481,772 520,503 462,590 426,198 426,198
30,201 65,862 72,387 57,765 33,109 42,593 67,988 17,843 44,990 40,928 40,928 40,928
291,698 285,110 465,232 446,998 548,118 542,219 475,793 581,980 571,254 591,292 591,301 591,301
23,227 33,554 29,634 31,069 12,528 38,163 36,025 68,763 68,521 58,945 58,945 58,945
400,961 (12,109) 45,372 48,270 322,421 216,490 336,382 111,232 9,517 3,691 3,691 3,691
311,134 204,847 254,121 357,089 255,026 306,294 622,195 616,668 535,268 608,934 688,934 778,934
2,801,204 2,223,475 2,948,360 3,909,082 3,128,399 1,812,597 1,336,073 1,152,519 628,844 362,313 282,211 282,211
1 260 556 1 102 217 1 430 270 1 513 981 1 685 168 1 916 827 1 766 970 1 511 525 2 099 523 1 933 746 1 458 864 1 428 864
Interest Earnings
Revenue from Other MN DistrictsAll Other Revenue
Facility Rentals
ALC RevenueChallenge/AP Testing RevenueAthletic/Activity RevenueMusic Rentals and Fees
1,260,556 1,102,217 1,430,270 1,513,981 1,685,168 1,916,827 1,766,970 1,511,525 2,099,523 1,933,746 1,458,864 1,428,864
5,249,616 4,059,037 5,395,143 6,986,085 6,347,249 5,270,261 5,117,243 4,542,302 4,478,419 4,062,439 3,551,072 3,611,072 TOTAL other LOCAL RevenueAll Other Revenue
130

1. Select Year 1: 2001-024. Select Most Recent Audit Year: 2010-11
2. Select Comparison Year: 2012-135. Select Most Recent Budget Year: 2012-13
3. Select Category to Review:
Other LOCAL Revenue Sources
TOTAL other LOCAL Revenueg y
0.00%
Rate of Change - Projected
0.00%
Rate of Change - Actual
-20.00%
-15.00%
-10.00%
-5.00%
-15.00%
-10.00%
-5.00%
-35.00%
-30.00%
-25.00%
TOTAL other LOCAL Revenue EOY Adjusted ADM
-25.00%
-20.00%
TOTAL other LOCAL Revenue EOY Adjusted ADM
3-Year 5-Year 10-Year 3-Year 5-Year 10-Year-11.11% -20.50% -33.07% -10.56% -22.92% -22.61%
EOY Adjusted ADM -2.17% -3.49% -13.53% EOY Adjusted ADM -1.35% -8.58% -12.36%
Description
TOTAL other LOCAL Revenue
Rate of Change - Actual
R t f Ch A t l
Rate of Change - ProjectedDescription
TOTAL other LOCAL Revenue
R t f Ch P j t d3-Year 5-Year 10-Year 3-Year 5-Year 10-Year
ALC Revenue -7.87% -11.54% 184.58% ALC Revenue -3.98% 17.09% 254.11%
Interest Earnings 0.01% -96.68% -91.87% Interest Earnings -96.68% -98.30% -99.08%
Facility Rentals 27.92% 26.31% 206.52% Facility Rentals -1.25% 98.81% 95.71%
Revenue from Other MN Districts -22.11% -75.51% -90.43% Revenue from Other MN Districts -68.56% -80.01% -87.07%
All Other Revenue -26.11% -5.47% -0.10% All Other Revenue 27.93% 0.88% 53.40%
TOTAL other LOCAL Revenue -11 11% -20 50% -33 07% TOTAL other LOCAL Revenue -10 56% -22 92% -22 61%
Rate of Change - ActualDescription
Rate of Change - ProjectedDescription
TOTAL other LOCAL Revenue -11.11% -20.50% -33.07% TOTAL other LOCAL Revenue -10.56% -22.92% -22.61%
EOY Adjusted ADM -2.17% -3.49% -13.53% EOY Adjusted ADM -1.35% -8.58% -12.36%
Averages3-Year 2010-11 2012-13 2008-09 2010-115-Year 2008-09 2012-13 2006-07 2010-1110-Year 2003-04 2012-13 2001-02 2010-11
Projected Actual
131

1. Select Year 1: 2001-024. Select Most Recent Audit Year: 2010-11
2. Select Comparison Year: 2012-135. Select Most Recent Budget Year: 2012-13
3. Select Category to Review:
General Fund - TOTAL State General Education Aid
TOTAL STATE GEN ED AIDg y
2001-02 2012-13
34.44%
65.56%83.59%
16.41%
TOTAL STATE GEN ED AID TOTAL OTHER STATE AIDS TOTAL STATE GEN ED AID TOTAL OTHER STATE AIDS
$ % $ %TOTAL STATE GEN ED AID 9,116,985 34.44% 48,270,122 83.59%
TOTAL OTHER STATE AIDS 17,356,550 65.56% 9,477,954 16.41%
DescriptionTOTAL STATE GEN ED AIDTOTAL OTHER STATE AIDS
Description2001-02 2012-13
TOTAL GENERAL EDUCATION AID 26,473,535 100.00% 57,748,076 100.00%TOTAL GENERAL EDUCATION AID
132

1. Select Year 1: 2001-024. Select Most Recent Audit Year: 2010-11
2. Select Comparison Year: 2012-135. Select Most Recent Budget Year: 2012-13
3. Select Category to Review:
General Fund - TOTAL State General Education Aid
TOTAL STATE GEN ED AIDg y
-0.50%
0.00%60,000,000
-2.00%
-1.50%
-1.00%
40,000,000
50,000,000
-3.50%
-3.00%
-2.50%
20,000,000
30,000,000 TOTAL STATE GEN ED AID
EOY Adjusted ADM
-5.00%
-4.50%
-4.00%
-
10,000,000
2001-02 2002-03 2003-04 2004-05 2005-06 2006-07 2007-08 2008-09 2009-10 2010-11 2011-12 2012-139,116,985 45,997,729 46,877,139 45,186,239 49,251,123 48,954,409 48,720,522 48,555,517 42,326,315 47,254,551 48,209,807 48,270,122
404.53% 1.91% -3.61% 9.00% -0.60% -0.48% -0.34% -12.83% 11.64% 2.02% 0.13%8,358.65 8,328.38 8,288.49 8,195.46 8,181.38 8,013.51 7,662.71 7,425.90 7,374.37 7,325.69 7,246.28 7,167.06
TOTAL STATE GEN ED AIDAnnual Change
Description
EOY Adjusted ADM
2001-02 2002-03 2003-04 2004-05 2005-06 2006-07 2007-08 2008-09 2009-10 2010-11 2011-12 2012-13
8,358.65 8,328.38 8,288.49 8,195.46 8,181.38 8,013.51 7,662.71 7,425.90 7,374.37 7,325.69 7,246.28 7,167.06 -0.36% -0.48% -1.12% -0.17% -2.05% -4.38% -3.09% -0.69% -0.66% -1.08% -1.09%
1,091 5,523 5,656 5,514 6,020 6,109 6,358 6,539 5,740 6,451 6,653 6,735 406.36% 2.40% -2.51% 9.18% 1.48% 4.08% 2.84% -12.22% 12.39% 3.14% 1.23%
2001-02 2002-03 2003-04 2004-05 2005-06 2006-07 2007-08 2008-09 2009-10 2010-11 2011-12 2012-139,116,985 45,997,729 46,877,139 45,186,239 49,251,123 48,954,409 48,720,522 48,555,517 42,326,315 47,254,551 48,209,807 48,270,122
17 356 550 9 895 863 6 879 469 10 505 469 15 815 617 11 330 409 12 288 844 10 506 256 10 287 723 1 393 645 9 295 954 9 477 954
Revenue per ADMAnnual Change
DescriptionTOTAL STATE GEN ED AIDTOTAL OTHER STATE AIDS
Annual ChangeEOY Adjusted ADM
17,356,550 9,895,863 6,879,469 10,505,469 15,815,617 11,330,409 12,288,844 10,506,256 10,287,723 1,393,645 9,295,954 9,477,954
26,473,535 55,893,592 53,756,608 55,691,707 65,066,740 60,284,818 61,009,365 59,061,772 52,614,038 48,648,196 57,505,761 57,748,076 TOTAL GENERAL EDUCATION AIDTOTAL OTHER STATE AIDS
133

1. Select Year 1: 2001-024. Select Most Recent Audit Year: 2010-11
2. Select Comparison Year: 2012-135. Select Most Recent Budget Year: 2012-13
3. Select Category to Review:
General Fund - TOTAL State General Education Aid
TOTAL STATE GEN ED AIDg y
0.00%
Rate of Change - Projected
400 00%
450.00%
Rate of Change - Actual
-10.00%
-8.00%
-6.00%
-4.00%
-2.00%
150.00%
200.00%
250.00%
300.00%
350.00%
400.00%
-16.00%
-14.00%
-12.00%
-50.00%
0.00%
50.00%
100.00%
150.00%
3-Year 5-Year 10-Year 3-Year 5-Year 10-Year2.15% -0.59% 2.97% -2.68% -3.47% 418.31%
EOY Adjusted ADM -2.17% -3.49% -13.53% EOY Adjusted ADM -1.35% -8.58% -12.36%
DescriptionRate of Change - Actual
TOTAL STATE GEN ED AID TOTAL STATE GEN ED AID
Rate of Change - ProjectedDescription
TOTAL STATE GEN ED AID EOY Adjusted ADM TOTAL STATE GEN ED AID EOY Adjusted ADM
3-Year 5-Year 10-Year 3-Year 5-Year 10-YearTOTAL STATE GEN ED AID 2.15% -0.59% 2.97% TOTAL STATE GEN ED AID -2.68% -3.47% 418.31%
TOTAL OTHER STATE AIDS 580.08% -9.79% 37.77% TOTAL OTHER STATE AIDS -86.74% -87.70% -91.97%
TOTAL GENERAL EDUCATION AID 18.71% -2.22% 7.43% TOTAL GENERAL EDUCATION AID -17.63% -19.30% 83.76%
EOY Adjusted ADM -2.17% -3.49% -13.53% EOY Adjusted ADM -1.35% -8.58% -12.36%
DescriptionRate of Change - Projected
DescriptionRate of Change - Actual
Averages3-Year 2010-11 2012-13 2008-09 2010-115-Year 2008-09 2012-13 2006-07 2010-1110-Year 2003-04 2012-13 2001-02 2010-11
Projected Actual
134

1. Select Year 1: 2001-024. Select Most Recent Audit Year: 2010-11
2. Select Comparison Year: 2012-135. Select Most Recent Budget Year: 2012-13
3. Select Category to Review:
General Fund - STATE General Education Aid
GENERAL ED AIDg y
2001-02 2012-13
97.13% 85.26%
GENERAL ED AID COMPENSATORY AID GENERAL ED AID COMPENSATORY AIDGENERAL ED AID COMPENSATORY AID
ENGLISH LANG LEARNER AID LEARNING & DEVELOPMENT AID
QCOMP AID GIFTED & TALENTED AID
TECHNOLOGY AID STAFF DEVELOPMENT AID
GENERAL ED AID COMPENSATORY AID
ENGLISH LANG LEARNER AID LEARNING & DEVELOPMENT AID
QCOMP AID GIFTED & TALENTED AID
TECHNOLOGY AID STAFF DEVELOPMENT AID
$ % $ %GENERAL ED AID 8,854,965 97.13% 41,153,939 85.26%
COMPENSATORY AID 262,020 2.87% 2,899,298 6.01%
ENGLISH LANG LEARNER AID - 0.00% 457,350 0.95%
LEARNING & DEVELOPMENT AID - 0.00% 1,555,945 3.22%
QCOMP AID 0 00% 1 230 320 2 55%QCOMP AID
ENGLISH LANG LEARNER AIDLEARNING & DEVELOPMENT AID
GENERAL ED AIDCOMPENSATORY AID
2001-02 2012-13DESCRIPTION DESCRIPTION
QCOMP AID - 0.00% 1,230,320 2.55%
GIFTED & TALENTED AID - 0.00% 100,268 0.21%
TECHNOLOGY AID - 0.00% - 0.00%
STAFF DEVELOPMENT AID - 0.00% 873,002 1.81%
TOTAL GENERAL EDUCATION AID 9,116,985 100.00% 48,270,122 100.00%
QCOMP AIDGIFTED & TALENTED AID
TOTAL GENERAL EDUCATION AID
TECHNOLOGY AIDSTAFF DEVELOPMENT AID
135

1. Select Year 1: 2001-024. Select Most Recent Audit Year: 2010-11
2. Select Comparison Year: 2012-135. Select Most Recent Budget Year: 2012-13
3. Select Category to Review:
General Fund - STATE General Education Aid
GENERAL ED AIDg y
-0.50%
0.00%
45,000,000
50,000,000
-3.00%
-2.50%
-2.00%
-1.50%
-1.00%
20,000,000
25,000,000
30,000,000
35,000,000
40,000,000
GENERAL ED AID
EOY Adjusted ADM
-5.00%
-4.50%
-4.00%
-3.50%
-
5,000,000
10,000,000
15,000,000
2001-02 2002-03 2003-04 2004-05 2005-06 2006-07 2007-08 2008-09 2009-10 2010-11 2011-12 2012-13
2001-02 2002-03 2003-04 2004-05 2005-06 2006-07 2007-08 2008-09 2009-10 2010-11 2011-12 2012-138,854,965 45,756,729 46,374,191 41,295,676 42,887,200 44,271,900 43,375,620 42,524,240 37,056,906 41,527,725 41,202,345 41,153,939
416.74% 1.35% -10.95% 3.85% 3.23% -2.02% -1.96% -12.86% 12.06% -0.78% -0.12%8,358.65 8,328.38 8,288.49 8,195.46 8,181.38 8,013.51 7,662.71 7,425.90 7,374.37 7,325.69 7,246.28 7,167.06
-0.36% -0.48% -1.12% -0.17% -2.05% -4.38% -3.09% -0.69% -0.66% -1.08% -1.09%1 059 5 494 5 595 5 039 5 242 5 525 5 661 5 726 5 025 5 669 5 686 5 742
Annual ChangeEOY Adjusted ADMAnnual ChangeRevenue per ADM
DescriptionGENERAL ED AID
1,059 5,494 5,595 5,039 5,242 5,525 5,661 5,726 5,025 5,669 5,686 5,742 418.61% 1.84% -9.94% 4.03% 5.39% 2.46% 1.16% -12.25% 12.81% 0.30% 0.99%
2001-02 2002-03 2003-04 2004-05 2005-06 2006-07 2007-08 2008-09 2009-10 2010-11 2011-12 2012-138,854,965 45,756,729 46,374,191 41,295,676 42,887,200 44,271,900 43,375,620 42,524,240 37,056,906 41,527,725 41,202,345 41,153,939
262,020 241,000 502,948 1,152,308 928,669 1,035,182 1,340,941 1,607,773 1,626,771 2,294,319 2,844,549 2,899,298
- - - - 328,717 287,160 320,469 369,749 333,633 333,633 402,018 457,350
GENERAL ED AIDCOMPENSATORY AIDENGLISH LANG LEARNER AID
Description
Revenue per ADMAnnual Change
- - - 1,551,559 1,597,123 1,626,122 1,570,951 1,551,681 1,534,824 1,537,574 1,553,481 1,555,945
- - - - 2,147,860 1,533,784 1,533,784 1,458,140 1,239,108 1,239,108 1,230,320 1,230,320
- - - - 37,925 84,411 108,582 105,056 103,551 102,772 101,558 100,268
- - - 1,186,695 1,124,779 - 361,941 490,286 (10,642) - - -
- - - - 198,850 115,850 108,234 448,591 442,164 219,419 875,536 873,002
9,116,985 45,997,729 46,877,139 45,186,239 49,251,123 48,954,409 48,720,522 48,555,517 42,326,315 47,254,551 48,209,807 48,270,122
TECHNOLOGY AIDSTAFF DEVELOPMENT AIDTOTAL GENERAL EDUCATION AID
LEARNING & DEVELOPMENT AIDQCOMP AIDGIFTED & TALENTED AID
136
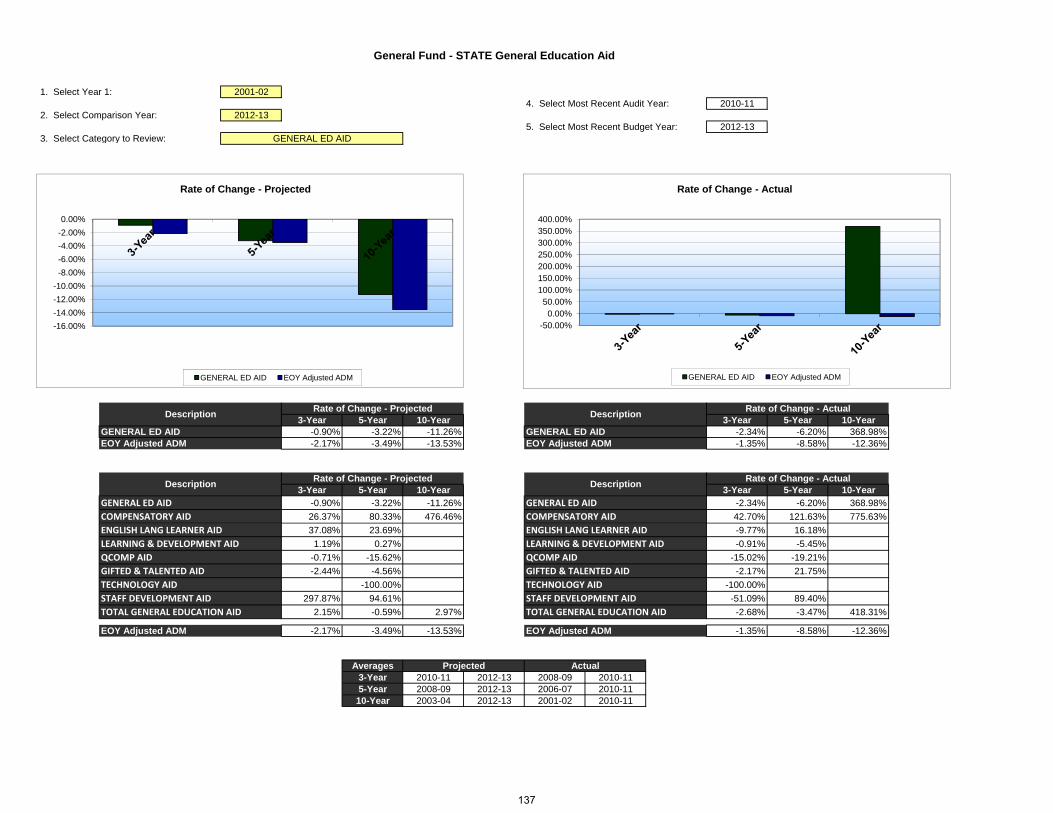
1. Select Year 1: 2001-024. Select Most Recent Audit Year: 2010-11
2. Select Comparison Year: 2012-135. Select Most Recent Budget Year: 2012-13
3. Select Category to Review:
General Fund - STATE General Education Aid
GENERAL ED AIDg y
-2.00%
0.00%
Rate of Change - Projected
350.00%400.00%
Rate of Change - Actual
-16.00%
-14.00%
-12.00%
-10.00%
-8.00%
-6.00%
-4.00%
-50.00%0.00%
50.00%100.00%150.00%200.00%250.00%300.00%
3-Year 5-Year 10-Year 3-Year 5-Year 10-YearDescription
Rate of Change - ActualDescription
Rate of Change - Projected
GENERAL ED AID EOY Adjusted ADM GENERAL ED AID EOY Adjusted ADM
-0.90% -3.22% -11.26% -2.34% -6.20% 368.98%EOY Adjusted ADM -2.17% -3.49% -13.53% EOY Adjusted ADM -1.35% -8.58% -12.36%
3-Year 5-Year 10-Year 3-Year 5-Year 10-YearGENERAL ED AID -0.90% -3.22% -11.26% GENERAL ED AID -2.34% -6.20% 368.98%
COMPENSATORY AID 26.37% 80.33% 476.46% COMPENSATORY AID 42.70% 121.63% 775.63%
Description DescriptionRate of Change - Actual
GENERAL ED AID
Rate of Change - Projected
GENERAL ED AID
ENGLISH LANG LEARNER AID 37.08% 23.69% ENGLISH LANG LEARNER AID -9.77% 16.18%
LEARNING & DEVELOPMENT AID 1.19% 0.27% LEARNING & DEVELOPMENT AID -0.91% -5.45%
QCOMP AID -0.71% -15.62% QCOMP AID -15.02% -19.21%
GIFTED & TALENTED AID -2.44% -4.56% GIFTED & TALENTED AID -2.17% 21.75%
TECHNOLOGY AID -100.00% TECHNOLOGY AID -100.00%
STAFF DEVELOPMENT AID 297.87% 94.61% STAFF DEVELOPMENT AID -51.09% 89.40%
TOTAL GENERAL EDUCATION AID 2.15% -0.59% 2.97% TOTAL GENERAL EDUCATION AID -2.68% -3.47% 418.31%
EOY Adjusted ADM -2.17% -3.49% -13.53% EOY Adjusted ADM -1.35% -8.58% -12.36%
Averages3-Year 2010-11 2012-13 2008-09 2010-115-Year 2008-09 2012-13 2006-07 2010-1110-Year 2003-04 2012-13 2001-02 2010-11
Projected Actual
137

1. Select Year 1: 2001-024. Select Most Recent Audit Year: 2010-11
2. Select Comparison Year: 2012-135. Select Most Recent Budget Year: 2012-13
3. Select Category to Review:
General Fund - OTHER State General Education Aid
TOTAL OTHER STATE AIDSg y
2001-02 2012-13
53.44% 70.90%
OTHER GENERAL AIDS & CREDITS SPECIAL EDUCATION AIDTELECOMMUNICATIONS AID DEFERRED MAINTENANCE AIDSECONDARY VOCATIONAL AID SEC VOC DISABLED AIDDESEG TRANSPORTATION AID NON-PUBLIC TRANSP AIDSPECIAL PUPIL AID INTEGRATION AIDSTATE AID ADJ for TAX SHIFT MISC REVENUE from MDE
OTHER GENERAL AIDS & CREDITS SPECIAL EDUCATION AIDTELECOMMUNICATIONS AID DEFERRED MAINTENANCE AIDSECONDARY VOCATIONAL AID SEC VOC DISABLED AIDDESEG TRANSPORTATION AID NON-PUBLIC TRANSP AIDSPECIAL PUPIL AID INTEGRATION AIDSTATE AID ADJ for TAX SHIFT MISC REVENUE from MDE
$ % $ %OTHER GENERAL AIDS & CREDITS 6,622,010 38.15% 216,328 2.28%
SPECIAL EDUCATION AID 9,275,039 53.44% 6,720,000 70.90%
TELECOMMUNICATIONS AID 1,006 0.01% - 0.00%
DEFERRED MAINTENANCE AID (163) 0 00% 0 00%
OTHER GENERAL AIDS & CREDITSSPECIAL EDUCATION AIDTELECOMMUNICATIONS AIDDEFERRED MAINTENANCE AID
DESCRIPTION DESCRIPTION2001-02 2012-13
DEFERRED MAINTENANCE AID (163) 0.00% - 0.00%
SECONDARY VOCATIONAL AID 17,103 0.10% - 0.00%
SEC VOC DISABLED AID 73,749 0.42% - 0.00%
DESEG TRANSPORTATION AID 205,194 1.18% 650,000 6.86%
NON‐PUBLIC TRANSP AID 234,619 1.35% 393,062 4.15%
SPECIAL PUPIL AID 81,319 0.47% 40,947 0.43%
INTEGRATION AID 729,346 4.20% 931,937 9.83%
STATE AID ADJ for TAX SHIFT 0 00% 0 00%
SPECIAL PUPIL AIDINTEGRATION AIDSTATE AID ADJ for TAX SHIFT
SECONDARY VOCATIONAL AIDSEC VOC DISABLED AIDDESEG TRANSPORTATION AIDNON‐PUBLIC TRANSP AID
DEFERRED MAINTENANCE AID
STATE AID ADJ for TAX SHIFT - 0.00% - 0.00%
MISC REVENUE from MDE 117,327 0.68% 525,680 5.55%
TOTAL OTHER STATE AIDS 17,356,550 100.00% 9,477,954 100.00%
STATE AID ADJ for TAX SHIFTMISC REVENUE from MDETOTAL OTHER STATE AIDS
138

1. Select Year 1: 2001-024. Select Most Recent Audit Year: 2010-11
2. Select Comparison Year: 2012-135. Select Most Recent Budget Year: 2012-13
3. Select Category to Review:
General Fund - OTHER State General Education Aid
TOTAL OTHER STATE AIDSg y
-0.50%
0.00%
18,000,000
20,000,000
-3.00%
-2.50%
-2.00%
-1.50%
-1.00%
8,000,000
10,000,000
12,000,000
14,000,000
16,000,000
TOTAL OTHER STATE AIDS
EOY Adjusted ADM
-5.00%
-4.50%
-4.00%
-3.50%
-
2,000,000
4,000,000
6,000,000
2001-02 2002-03 2003-04 2004-05 2005-06 2006-07 2007-08 2008-09 2009-10 2010-11 2011-12 2012-13
2001-02 2002-03 2003-04 2004-05 2005-06 2006-07 2007-08 2008-09 2009-10 2010-11 2011-12 2012-1317,356,550 9,895,863 6,879,469 10,505,469 15,815,617 11,330,409 12,288,844 10,506,256 10,287,723 1,393,645 9,295,954 9,477,954
-42.98% -30.48% 52.71% 50.55% -28.36% 8.46% -14.51% -2.08% -86.45% 567.02% 1.96%8,358.65 8,328.38 8,288.49 8,195.46 8,181.38 8,013.51 7,662.71 7,425.90 7,374.37 7,325.69 7,246.28 7,167.06
-0.36% -0.48% -1.12% -0.17% -2.05% -4.38% -3.09% -0.69% -0.66% -1.08% -1.09%2 076 1 188 830 1 282 1 933 1 414 1 604 1 415 1 395 190 1 283 1 322
EOY Adjusted ADMAnnual ChangeRevenue per ADM
Annual Change
DescriptionTOTAL OTHER STATE AIDS
2,076 1,188 830 1,282 1,933 1,414 1,604 1,415 1,395 190 1,283 1,322 -42.78% -30.15% 54.44% 50.81% -26.86% 13.42% -11.78% -1.40% -86.36% 574.33% 3.08%
2001-02 2002-03 2003-04 2004-05 2005-06 2006-07 2007-08 2008-09 2009-10 2010-11 2011-12 2012-136,622,010 398,860 354,126 430,450 403,867 424,573 432,394 411,243 366,197 407,737 216,328 216,328
9,275,039 7,928,240 9,179,343 7,781,405 8,465,114 8,631,799 10,155,410 8,507,537 8,033,422 7,146,637 7,000,000 6,720,000
1,006 (7,901) - - 930 6,380 7,970 - - - - -
Description
SPECIAL EDUCATION AIDOTHER GENERAL AIDS & CREDITS
TELECOMMUNICATIONS AID
Revenue per ADMAnnual Change
(163) - - - - - - - - - - -
17,103 - - - - - - - - - - -
73,749 49,637 48,595 282,153 249,944 288,982 (87,258) - - - - -
205,194 318,860 1,024,905 647,723 566,448 592,963 469,921 377,733 737,257 708,345 650,000 650,000
234,619 320,159 294,223 278,002 270,637 368,142 242,261 149,113 138,416 310,561 393,062 393,062
81,319 83,826 9,083 35,776 26,010 32,882 57,660 15,234 63,165 40,947 40,947 40,947
729,346 776,185 908,547 871,549 907,584 919,461 849,308 900,567 878,587 881,067 931,937 931,937
SPECIAL PUPIL AIDINTEGRATION AID
DEFERRED MAINTENANCE AIDSECONDARY VOCATIONAL AID
NON‐PUBLIC TRANSP AID
SEC VOC DISABLED AIDDESEG TRANSPORTATION AID
- - (4,959,559) 159,738 4,799,821 - - - - (8,175,479) - -
117,327 27,998 20,208 18,671 125,262 65,229 161,178 144,829 70,678 73,829 63,680 525,680
17,356,550 9,895,863 6,879,469 10,505,469 15,815,617 11,330,409 12,288,844 10,506,256 10,287,723 1,393,645 9,295,954 9,477,954
STATE AID ADJ for TAX SHIFTMISC REVENUE from MDETOTAL OTHER STATE AIDS
139

1. Select Year 1: 2001-024. Select Most Recent Audit Year: 2010-11
2. Select Comparison Year: 2012-135. Select Most Recent Budget Year: 2012-13
3. Select Category to Review:
General Fund - OTHER State General Education Aid
TOTAL OTHER STATE AIDSg y
600.00%
700.00%
Rate of Change - Projected
-10.00%
0.00%
Rate of Change - Actual
0 00%
100.00%
200.00%
300.00%
400.00%
500.00%
600.00%
-80.00%
-70.00%
-60.00%
-50.00%
-40.00%
-30.00%
-20.00%
3-Year 5-Year 10-Year 3-Year 5-Year 10-YearDescription Description
Rate of Change - ActualRate of Change - Projected
-100.00%
0.00%
TOTAL OTHER STATE AIDS EOY Adjusted ADM
-100.00%
-90.00%
TOTAL OTHER STATE AIDS EOY Adjusted ADM
580.08% -9.79% 37.77% -86.74% -87.70% -91.97%EOY Adjusted ADM -2.17% -3.49% -13.53% EOY Adjusted ADM -1.35% -8.58% -12.36%
3-Year 5-Year 10-Year 3-Year 5-Year 10-YearOTHER GENERAL AIDS & CREDITS -46.94% -47.40% -38.91% OTHER GENERAL AIDS & CREDITS -0.85% -3.97% -93.84%
SPECIAL EDUCATION AID -5.97% -21.01% -26.79% SPECIAL EDUCATION AID -16.00% -17.21% -22.95%
Rate of Change - ActualDescription
Rate of Change - ProjectedDescription
TOTAL OTHER STATE AIDS TOTAL OTHER STATE AIDS
TELECOMMUNICATIONS AID TELECOMMUNICATIONS AID -100.00% -100.00%
DEFERRED MAINTENANCE AID DEFERRED MAINTENANCE AID -100.00%
SECONDARY VOCATIONAL AID SECONDARY VOCATIONAL AID -100.00%
SEC VOC DISABLED AID -100.00% SEC VOC DISABLED AID -100.00% -100.00%
DESEG TRANSPORTATION AID -8.24% 72.08% -36.58% DESEG TRANSPORTATION AID 87.53% 19.46% 245.21%
NON‐PUBLIC TRANSP AID 26.57% 163.60% 33.59% NON‐PUBLIC TRANSP AID 108.27% -15.64% 32.37%
SPECIAL PUPIL AID 0.00% 168.79% 350.83% SPECIAL PUPIL AID 168.80% 24.53% -49.65%
INTEGRATION AID 5.77% 3.48% 2.57% INTEGRATION AID -2.17% -4.18% 20.80%
STATE AID ADJ for TAX SHIFT -100.00% -100.00% STATE AID ADJ for TAX SHIFTMISC REVENUE from MDE 612.02% 262.97% 2501.37% MISC REVENUE from MDE -49.02% 13.19% -37.07%
TOTAL OTHER STATE AIDS 580.08% -9.79% 37.77% TOTAL OTHER STATE AIDS -86.74% -87.70% -91.97%
EOY Adjusted ADM -2.17% -3.49% -13.53% EOY Adjusted ADM -1.35% -8.58% -12.36%
Averages3-Year 2010-11 2012-13 2008-09 2010-115-Year 2008-09 2012-13 2006-07 2010-1110-Year 2003-04 2012-13 2001-02 2010-11
ActualProjected
140

1. Select Year 1: 2001-024. Select Most Recent Audit Year: 2010-11
2. Select Comparison Year: 2012-135. Select Most Recent Budget Year: 2012-13
3. Select Category to Review:
General Fund - Compensatory Revenue
TOTAL COMPENSATORY AID
2001-02 2012-13
GENERAL COMPENSATORY TRANSITION PLUS NEW CONNECTIONS
DELTA OMEGON HOPKINS HIGH SCHOOL
NORTH JUNIOR HIGH WEST JUNIOR HIGH ALICE SMITH
GLEN LAKE HARLEY HOPKINS KATHERINE CURREN
EISENHOWER TANGLEN GATEWOOD
MEADOWBROOK
GENERAL COMPENSATORY TRANSITION PLUS NEW CONNECTIONS
DELTA OMEGON HOPKINS HIGH SCHOOL
NORTH JUNIOR HIGH WEST JUNIOR HIGH ALICE SMITH
GLEN LAKE HARLEY HOPKINS KATHERINE CURREN
EISENHOWER TANGLEN GATEWOOD
MEADOWBROOK
$ % $ %GENERAL COMPENSATORY - 0.00% - 0.00%
TRANSITION PLUS - 0.00% 4,184 0.14%
NEW CONNECTIONS - 0.00% - 0.00%
DELTA 814 0.31% - 0.00%
OMEGON - 0.00% - 0.00%OMEGON
DESCRIPTION DESCRIPTIONGENERAL COMPENSATORYTRANSITION PLUSNEW CONNECTIONSDELTA
2001-02 2012-13
HOPKINS HIGH SCHOOL 22,089 8.43% 448,920 15.48%
NORTH JUNIOR HIGH 31,568 12.05% 404,052 13.94%
WEST JUNIOR HIGH 13,546 5.17% 233,766 8.06%
ALICE SMITH 24,001 9.16% 558,758 19.27%
GLEN LAKE 732 0.28% 73,337 2.53%
HARLEY HOPKINS - 0.00% 35,923 1.24%
KATHERINE CURREN 69,807 26.64% - 0.00%
HOPKINS HIGH SCHOOL
ALICE SMITH
KATHERINE CURREN
GLEN LAKEHARLEY HOPKINS
NORTH JUNIOR HIGHWEST JUNIOR HIGH
EISENHOWER 57,806 22.06% 510,956 17.62%
TANGLEN 27,703 10.57% 284,404 9.81%
GATEWOOD 12,082 4.61% 291,858 10.07%
MEADOWBROOK 1,871 0.71% 53,140 1.83%
TOTAL COMPENSATORY AID 262,020 100.00% 2,899,298 100.00%TOTAL COMPENSATORY AID
EISENHOWERTANGLENGATEWOODMEADOWBROOK
141

1. Select Year 1: 2001-024. Select Most Recent Audit Year: 2010-11
2. Select Comparison Year: 2012-135. Select Most Recent Budget Year: 2012-13
3. Select Category to Review:
General Fund - Compensatory Revenue
TOTAL COMPENSATORY AID
1 50%
-1.00%
-0.50%
0.00%
2 500 000
3,000,000
3,500,000
-4.00%
-3.50%
-3.00%
-2.50%
-2.00%
-1.50%
1,000,000
1,500,000
2,000,000
2,500,000
TOTAL COMPENSATORY AID
EOY Adjusted ADM
2001-02 2002-03 2003-04 2004-05 2005-06 2006-07 2007-08 2008-09 2009-10 2010-11 2011-12 2012-13Description
-5.00%
-4.50%
-
500,000
2001-02 2002-03 2003-04 2004-05 2005-06 2006-07 2007-08 2008-09 2009-10 2010-11 2011-12 2012-13
2001 02 2002 03 2003 04 2004 05 2005 06 2006 07 2007 08 2008 09 2009 10 2010 11 2011 12 2012 13262,020 241,000 502,948 1,152,308 928,669 1,035,182 1,340,941 1,607,773 1,626,771 2,294,319 2,844,549 2,899,298
-8.02% 108.69% 129.11% -19.41% 11.47% 29.54% 19.90% 1.18% 41.04% 23.98% 1.92%8,358.65 8,328.38 8,288.49 8,195.46 8,181.38 8,013.51 7,662.71 7,425.90 7,374.37 7,325.69 7,246.28 7,167.06
-0.36% -0.48% -1.12% -0.17% -2.05% -4.38% -3.09% -0.69% -0.66% -1.08% -1.09%31 29 61 141 114 129 175 217 221 313 393 405
-7.69% 109.70% 131.71% -19.27% 13.80% 35.47% 23.72% 1.89% 41.97% 25.34% 3.05%
2001-02 2002-03 2003-04 2004-05 2005-06 2006-07 2007-08 2008-09 2009-10 2010-11 2011-12 2012-13
Annual Change
Description
DescriptionTOTAL COMPENSATORY AIDAnnual ChangeEOY Adjusted ADMAnnual ChangeRevenue per ADM
- - - 454,293 77,695 55,042 52,541 53,850 - - - -
- - - - - - 606 3,202 94 6,263 7,805 4,184
- - - - - - 512 - - - - -
814 - - 2,386 655 2,781 326 11,302 5,510 10,642 8,757 -
- 276 - - - - - - - - - -
22,089 24,477 49,311 82,087 109,287 163,714 178,020 245,574 188,643 323,885 436,400 448,920
31,568 23,695 46,339 94,143 135,670 142,833 124,302 185,440 196,554 278,867 377,198 404,052
13 546 15 781 26 665 36 334 49 053 44 086 101 520 142 636 135 713 189 584 237 617 233 766
HOPKINS HIGH SCHOOLNORTH JUNIOR HIGHWEST JUNIOR HIGH
TRANSITION PLUSNEW CONNECTIONSDELTAOMEGON
GENERAL COMPENSATORY
13,546 15,781 26,665 36,334 49,053 44,086 101,520 142,636 135,713 189,584 237,617 233,766
24,001 31,517 47,386 75,139 84,696 82,883 132,704 210,963 283,717 395,697 593,495 558,758
732 230 921 2,763 1,966 5,425 43,111 15,351 19,307 58,910 49,303 73,337
- 92 - 2,302 - - - 4,850 7,111 27,595 35,264 35,923
69,807 58,203 122,231 151,994 160,262 173,743 - - - - - -
57,806 54,568 128,971 159,487 182,495 220,063 398,313 374,648 409,448 498,071 506,929 510,956
27,703 16,702 41,023 40,227 60,715 65,467 118,540 165,003 188,077 202,864 270,168 284,404
12,082 13,803 36,711 41,944 50,756 58,583 124,830 161,472 160,954 251,508 266,218 291,858
TANGLENGATEWOOD
KATHERINE CURRENEISENHOWER
WEST JUNIOR HIGHALICE SMITHGLEN LAKEHARLEY HOPKINS
,08 3,803 36, ,9 50, 56 58,583 ,830 6 , 60,95 5 ,508 66, 8 9 ,858
1,871 1,656 3,391 9,209 15,419 20,561 65,614 33,481 31,644 50,433 55,395 53,140
262,020 241,000 502,948 1,152,308 928,669 1,035,182 1,340,941 1,607,773 1,626,771 2,294,319 2,844,549 2,899,298
GAT WOOMEADOWBROOKTOTAL COMPENSATORY AID
142

1. Select Year 1: 2001-024. Select Most Recent Audit Year: 2010-11
2. Select Comparison Year: 2012-135. Select Most Recent Budget Year: 2012-13
3. Select Category to Review:
General Fund - Compensatory Revenue
TOTAL COMPENSATORY AID
300 00%
400.00%
500.00%
600.00%
Rate of Change - Projected
500.00%600.00%700.00%800.00%900.00%
Rate of Change - Actual
-100.00%
0.00%
100.00%
200.00%
300.00%
-100.00%0.00%
100.00%200.00%300.00%400.00%500.00%
3-Year 5-Year 10-Year 3-Year 5-Year 10-Year26.37% 80.33% 476.46% 42.70% 121.63% 775.63%
EOY Adjusted ADM -2.17% -3.49% -13.53% EOY Adjusted ADM -1.35% -8.58% -12.36%
DescriptionRate of Change - Actual
Rate of Change - Projected Rate of Change - Actual
TOTAL COMPENSATORY AID TOTAL COMPENSATORY AID
DescriptionRate of Change - Projected
TOTAL COMPENSATORY AID EOY Adjusted ADM TOTAL COMPENSATORY AID EOY Adjusted ADM
3-Year 5-Year 10-Year 3-Year 5-Year 10-YearGENERAL COMPENSATORY -100.00% GENERAL COMPENSATORY -100.00% -100.00%TRANSITION PLUS -33.19% 30.66% TRANSITION PLUS 95.59%NEW CONNECTIONS NEW CONNECTIONSDELTA -100.00% -100.00% DELTA -5.83% 282.68% 1208.06%OMEGON OMEGONHOPKINS HIGH SCHOOL 38.60% 82.80% 810.38% HOPKINS HIGH SCHOOL 31.89% 97.84% 1366.26%NORTH JUNIOR HIGH 44 89% 117 89% 771 95% NORTH JUNIOR HIGH 50 38% 95 24% 783 39%
DescriptionRate of Change - Projected
DescriptionRate of Change - Actual
NORTH JUNIOR HIGH 44.89% 117.89% 771.95% NORTH JUNIOR HIGH 50.38% 95.24% 783.39%WEST JUNIOR HIGH 23.30% 63.89% 776.68% WEST JUNIOR HIGH 32.92% 330.04% 1299.51%ALICE SMITH 41.21% 164.86% 1079.17% ALICE SMITH 87.57% 377.42% 1548.66%GLEN LAKE 24.49% 377.72% 7863.45% GLEN LAKE 283.74% 985.85% 7945.12%HARLEY HOPKINS 30.18% 640.64% HARLEY HOPKINS 468.93%KATHERINE CURREN -100.00% KATHERINE CURREN -100.00% -100.00%EISENHOWER 2.59% 36.38% 296.18% EISENHOWER 32.94% 126.33% 761.62%TANGLEN 40.19% 72.36% 593.28% TANGLEN 22.95% 209.87% 632.28%GATEWOOD 16.04% 80.75% 695.01% GATEWOOD 55.76% 329.32% 1981.68%MEADOWBROOK 5.37% 58.72% 1467.25% MEADOWBROOK 50.63% 145.29% 2595.13%TOTAL COMPENSATORY AID 26.37% 80.33% 476.46% TOTAL COMPENSATORY AID 42.70% 121.63% 775.63%
EOY Adjusted ADM -2.17% -3.49% -13.53% EOY Adjusted ADM -1.35% -8.58% -12.36%
Averages3-Year 2010-11 2012-13 2008-09 2010-115-Year 2008-09 2012-13 2006-07 2010-11
Projected Actual
10-Year 2003-04 2012-13 2001-02 2010-11
143

1. Select Year 1: 2001-024. Select Most Recent Audit Year: 2010-11
2. Select Comparison Year: 2012-135. Select Most Recent Budget Year: 2012-13
3. Select Category to Review:
Total FEDERAL Revenue
TOTAL FEDERAL AIDg y
2001-02 2012-13
60%40%
0%
46%54%
0%
FEDERAL AID THRU MDE FEDERAL SPECIAL ED AID DIRECT FEDERAL AID
$ % $ %2001-02 2012-13
DESCRIPTION DESCRIPTION
FEDERAL AID THRU MDE FEDERAL SPECIAL ED AID DIRECT FEDERAL AID
FEDERAL AID THRU MDE 1,016,452 59.54% 1,591,443 45.71%
FEDERAL SPECIAL ED AID 690,593 40.46% 1,890,346 54.29%
DIRECT FEDERAL AID - 0.00% - 0.00%
TOTAL FEDERAL AID 1,707,045 100.00% 3,481,789 100.00%TOTAL FEDERAL AID
FEDERAL AID THRU MDEFEDERAL SPECIAL ED AIDDIRECT FEDERAL AID
144
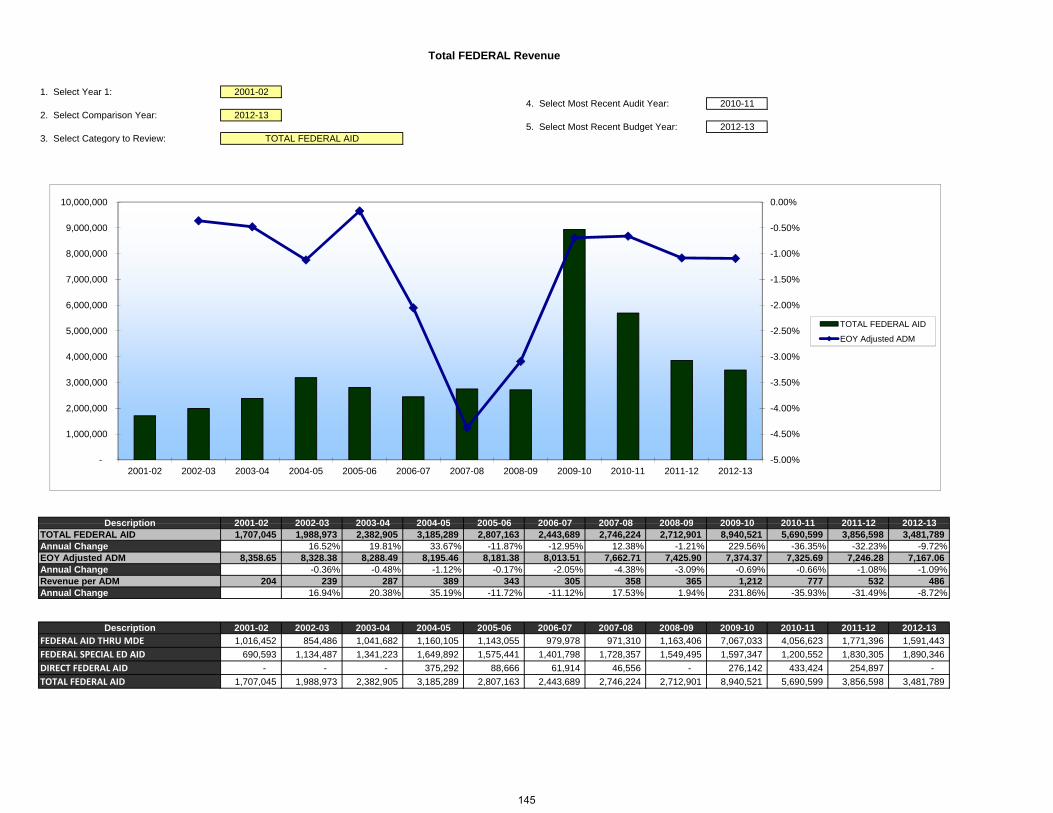
1. Select Year 1: 2001-024. Select Most Recent Audit Year: 2010-11
2. Select Comparison Year: 2012-135. Select Most Recent Budget Year: 2012-13
3. Select Category to Review:
Total FEDERAL Revenue
TOTAL FEDERAL AIDg y
-0.50%
0.00%
9,000,000
10,000,000
-2 50%
-2.00%
-1.50%
-1.00%
5 000 000
6,000,000
7,000,000
8,000,000
TOTAL FEDERAL AID
-4.00%
-3.50%
-3.00%
2.50%
2,000,000
3,000,000
4,000,000
5,000,000 EOY Adjusted ADM
2001-02 2002-03 2003-04 2004-05 2005-06 2006-07 2007-08 2008-09 2009-10 2010-11 2011-12 2012-13Description
-5.00%
-4.50%
-
1,000,000
2001-02 2002-03 2003-04 2004-05 2005-06 2006-07 2007-08 2008-09 2009-10 2010-11 2011-12 2012-13
2001-02 2002-03 2003-04 2004-05 2005-06 2006-07 2007-08 2008-09 2009-10 2010-11 2011-12 2012-131,707,045 1,988,973 2,382,905 3,185,289 2,807,163 2,443,689 2,746,224 2,712,901 8,940,521 5,690,599 3,856,598 3,481,789
16.52% 19.81% 33.67% -11.87% -12.95% 12.38% -1.21% 229.56% -36.35% -32.23% -9.72%8,358.65 8,328.38 8,288.49 8,195.46 8,181.38 8,013.51 7,662.71 7,425.90 7,374.37 7,325.69 7,246.28 7,167.06
-0.36% -0.48% -1.12% -0.17% -2.05% -4.38% -3.09% -0.69% -0.66% -1.08% -1.09%204 239 287 389 343 305 358 365 1,212 777 532 486
16.94% 20.38% 35.19% -11.72% -11.12% 17.53% 1.94% 231.86% -35.93% -31.49% -8.72%
Annual ChangeRevenue per ADMAnnual Change
TOTAL FEDERAL AIDAnnual ChangeEOY Adjusted ADM
Description
2001-02 2002-03 2003-04 2004-05 2005-06 2006-07 2007-08 2008-09 2009-10 2010-11 2011-12 2012-131,016,452 854,486 1,041,682 1,160,105 1,143,055 979,978 971,310 1,163,406 7,067,033 4,056,623 1,771,396 1,591,443
690,593 1,134,487 1,341,223 1,649,892 1,575,441 1,401,798 1,728,357 1,549,495 1,597,347 1,200,552 1,830,305 1,890,346
- - - 375,292 88,666 61,914 46,556 - 276,142 433,424 254,897 -
1,707,045 1,988,973 2,382,905 3,185,289 2,807,163 2,443,689 2,746,224 2,712,901 8,940,521 5,690,599 3,856,598 3,481,789 TOTAL FEDERAL AID
DescriptionFEDERAL AID THRU MDEFEDERAL SPECIAL ED AIDDIRECT FEDERAL AID
145

1. Select Year 1: 2001-024. Select Most Recent Audit Year: 2010-11
2. Select Comparison Year: 2012-135. Select Most Recent Budget Year: 2012-13
3. Select Category to Review:
Total FEDERAL Revenue
TOTAL FEDERAL AIDg y
50 00%
60.00%
Rate of Change - Projected
250.00%
Rate of Change - Actual
0.00%
10.00%
20.00%
30.00%
40.00%
50.00%
100.00%
150.00%
200.00%
-50.00%
-40.00%
-30.00%
-20.00%
-10.00%
-50.00%
0.00%
50.00%
3-Year 5-Year 10-Year 3-Year 5-Year 10-Year-38.82% 28.34% 46.12% 109.76% 132.87% 233.36%
EOY Adjusted ADM -2.17% -3.49% -13.53% EOY Adjusted ADM -1.35% -8.58% -12.36%
DescriptionRate of Change - Actual
TOTAL FEDERAL AID TOTAL FEDERAL AID
Rate of Change - ProjectedDescription
TOTAL FEDERAL AID EOY Adjusted ADMTOTAL FEDERAL AID EOY Adjusted ADM
3-Year 5-Year 10-Year 3-Year 5-Year 10-YearFEDERAL AID THRU MDE -60.77% 36.79% 52.78% FEDERAL AID THRU MDE 248.69% 313.95% 299.10%
FEDERAL SPECIAL ED AID 57.46% 22.00% 40.94% FEDERAL SPECIAL ED AID -22.52% -14.36% 73.84%
DIRECT FEDERAL AID -100.00% DIRECT FEDERAL AID 600.05%
TOTAL FEDERAL AID -38.82% 28.34% 46.12% TOTAL FEDERAL AID 109.76% 132.87% 233.36%
DescriptionRate of Change - Projected
DescriptionRate of Change - Actual
EOY Adjusted ADM -2.17% -3.49% -13.53% EOY Adjusted ADM -1.35% -8.58% -12.36%
Averages3-Year 2010-11 2012-13 2008-09 2010-115-Year 2008-09 2012-13 2006-07 2010-1110-Year 2003-04 2012-13 2001-02 2010-11
Projected Actual
146

1. Select Year 1: 2001-024. Select Most Recent Audit Year: 2010-11
2. Select Comparison Year: 2012-135. Select Most Recent Budget Year: 2012-13
3. Select Category to Review:
Total Revenue - OTHER Sources
TOTAL OTHER SOURCESg y
2001-02 2012-13
52.62%
100.00%
SALES OF MATERIALS SALE OF PROPERTY SALE OF EQUIPMENT
INSURANCE RECOVERY SALE OF BONDS STATE LOANS
SALES OF MATERIALS SALE OF PROPERTY SALE OF EQUIPMENT
INSURANCE RECOVERY SALE OF BONDS STATE LOANS
REIMB from OTHER MN DIST TRANSFERS IN MISC SALES
$ % $ %SALES OF MATERIALS 149,031 35.93% - 0.00%SALES OF MATERIALS
DESCRIPTION DESCRIPTION2001-02 2012-13
REIMB from OTHER MN DIST TRANSFERS IN MISC SALESREIMB from OTHER MN DIST TRANSFERS IN MISC SALES
SALE OF PROPERTY - 0.00% - 0.00%
SALE OF EQUIPMENT - 0.00% - 0.00%
INSURANCE RECOVERY 11,491 2.77% - 0.00%
SALE OF BONDS - 0.00% - 0.00%
STATE LOANS - 0.00% - 0.00%
REIMB from OTHER MN DIST 36,000 8.68% - 0.00%
TRANSFERS IN 218,252 52.62% 750,382 100.00%
SALE OF BONDSSTATE LOANSREIMB from OTHER MN DISTTRANSFERS IN
SALE OF PROPERTYSALE OF EQUIPMENTINSURANCE RECOVERY
MISC SALES - 0.00% - 0.00%
TOTAL OTHER SOURCES 414,774 100.00% 750,382 100.00%
Less OPEB - -
TOTAL less OPEB 414,774 750,382
TOTAL OTHER SOURCESLess OPEB
MISC SALES
TOTAL less OPEB
147

1. Select Year 1: 2001-024. Select Most Recent Audit Year: 2010-11
2. Select Comparison Year: 2012-135. Select Most Recent Budget Year: 2012-13
3. Select Category to Review:
Total Revenue - OTHER Sources
TOTAL OTHER SOURCESg y
-0.50%
0.00%
9,000,000
10,000,000
-3.00%
-2.50%
-2.00%
-1.50%
-1.00%
4,000,000
5,000,000
6,000,000
7,000,000
8,000,000
TOTAL OTHER SOURCES
-5.00%
-4.50%
-4.00%
-3.50%
-
1,000,000
2,000,000
3,000,000
, ,
2001-02 2002-03 2003-04 2004-05 2005-06 2006-07 2007-08 2008-09 2009-10 2010-11 2011-12 2012-13
2001-02 2002-03 2003-04 2004-05 2005-06 2006-07 2007-08 2008-09 2009-10 2010-11 2011-12 2012-13414,774 382,357 380,689 543,632 747,950 374,800 109,637 9,274,339 8,462,378 12,925 - 750,382
-7.82% -0.44% 42.80% 37.58% -49.89% -70.75% 8359.13% -8.75% -99.85% -100.00% #DIV/0!8,358.65 8,328.38 8,288.49 8,195.46 8,181.38 8,013.51 7,662.71 7,425.90 7,374.37 7,325.69 7,246.28 7,167.06
0 36% 0 48% 1 12% 0 17% 2 05% 4 38% 3 09% 0 69% 0 66% 1 08% 1 09%
TOTAL OTHER SOURCESAnnual ChangeEOY Adjusted ADMAnnual Change
Description
-0.36% -0.48% -1.12% -0.17% -2.05% -4.38% -3.09% -0.69% -0.66% -1.08% -1.09%50 46 46 66 91 47 14 1,249 1,148 2 - 105
-7.48% 0.04% 44.42% 37.82% -48.84% -69.41% 8628.89% -8.12% -99.85% -100.00% #DIV/0!
2001-02 2002-03 2003-04 2004-05 2005-06 2006-07 2007-08 2008-09 2009-10 2010-11 2011-12 2012-13149,031 119,255 140,477 127,396 151,761 132,034 111,882 121,958 - - - -
- - - 10,000 288,319 98,414 - - - 12,925 - -
1 192 1 800
SALE OF PROPERTYSALE OF EQUIPMENT
Annual ChangeRevenue per ADMAnnual Change
DescriptionSALES OF MATERIALS
- - - - 1,192 - - 1,800 - - - -
11,491 7,509 4,393 2,727 14,399 131,156 500 537 - - - -
- - - - - - - 9,144,590 8,462,378 - - -
- - - - - - - - - - - -
36,000 - 18,000 18,000 - 5,000 - - - - - -
218,252 255,594 217,819 385,509 291,911 - - - - - - 750,382
- - - - 367 8,196 (2,745) 5,454 - - - -
TRANSFERS INMISC SALES
SALE OF EQUIPMENT
STATE LOANSREIMB from OTHER MN DIST
INSURANCE RECOVERYSALE OF BONDS
414,774 382,357 380,689 543,632 747,950 374,800 109,637 9,274,339 8,462,378 12,925 - 750,382
- - - - - - - 9,144,590 8,462,378 - - -
414,774 382,357 380,689 543,632 747,950 374,800 109,637 129,749 - 12,925 - 750,382
TOTAL OTHER SOURCESLess OPEBTOTAL less OPEB
148

1. Select Year 1: 2001-024. Select Most Recent Audit Year: 2010-11
2. Select Comparison Year: 2012-135. Select Most Recent Budget Year: 2012-13
3. Select Category to Review:
Total Revenue - OTHER Sources
TOTAL OTHER SOURCESg y
6000.00%
Rate of Change - Projected
0.00%
Rate of Change - Actual
1000.00%
2000.00%
3000.00%
4000.00%
5000.00%
-80.00%
-60.00%
-40.00%
-20.00%
-1000.00%
0.00%
1000.00%
TOTAL OTHER SOURCESEOY Adjusted ADM
-120.00%
-100.00%
TOTAL OTHER SOURCESEOY Adjusted ADM
3-Year 5-Year 10-Year 3-Year 5-Year 10-Year5705.66% -91.91% 97.11% -99.86% -96.55% -96.88%
EOY Adjusted ADM -2.17% -3.49% -13.53% EOY Adjusted ADM -1.35% -8.58% -12.36%
3-Year 5-Year 10-Year 3-Year 5-Year 10-YearSALES OF MATERIALS 100 00% 100 00% SALES OF MATERIALS 100 00% 100 00% 100 00%
DescriptionRate of Change - Projected
DescriptionRate of Change - Projected
DescriptionRate of Change - Actual
Rate of Change - Actual
TOTAL OTHER SOURCES TOTAL OTHER SOURCES
Description
SALES OF MATERIALS -100.00% -100.00% SALES OF MATERIALS -100.00% -100.00% -100.00%
SALE OF BONDS -100.00% SALE OF BONDS -100.00%
STATE LOANS STATE LOANSREIMB from OTHER MN DIST -100.00% REIMB from OTHER MN DIST -100.00% -100.00%
TRANSFERS IN 244.50% TRANSFERS IN -100.00%
MISC SALES -100.00% MISC SALES -100.00% -100.00%
TOTAL OTHER SOURCES 5705.66% -91.91% 97.11% TOTAL OTHER SOURCES -99.86% -96.55% -96.88%
100 00% 100 00%Less OPEB -100.00% Less OPEB -100.00%
TOTAL less OPEB 5705.66% 478.34% 97.11% TOTAL less OPEB -90.04% -96.55% -96.88%
EOY Adjusted ADM -2.17% -3.49% -13.53% EOY Adjusted ADM -1.35% -8.58% -12.36%
Averages3-Year 2010-11 2012-13 2008-09 2010-115-Year 2008-09 2012-13 2006-07 2010-1110-Year 2003-04 2012-13 2001-02 2010-11
Projected Actual
10-Year 2003-04 2012-13 2001-02 2010-11
149
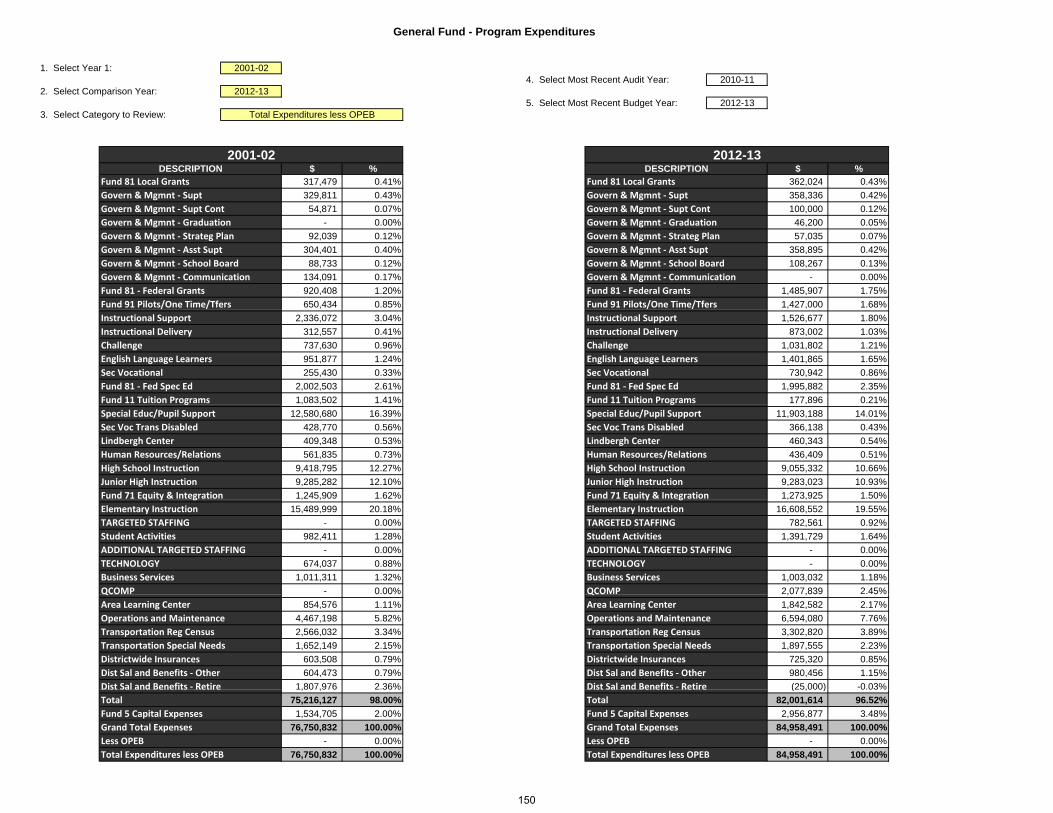
1. Select Year 1: 2001-024. Select Most Recent Audit Year: 2010-11
2. Select Comparison Year: 2012-135. Select Most Recent Budget Year: 2012-13
3. Select Category to Review:
General Fund - Program Expenditures
Total Expenditures less OPEBg y
$ % $ %Fund 81 Local Grants 317,479 0.41% 362,024 0.43%
Govern & Mgmnt ‐ Supt 329,811 0.43% 358,336 0.42%
Govern & Mgmnt ‐ Supt Cont 54,871 0.07% 100,000 0.12%
p
2001-02 2012-13DESCRIPTION DESCRIPTION
Govern & Mgmnt ‐ Supt ContGovern & Mgmnt ‐ SuptFund 81 Local Grants
Govern & Mgmnt ‐ Graduation - 0.00% 46,200 0.05%
Govern & Mgmnt ‐ Strateg Plan 92,039 0.12% 57,035 0.07%
Govern & Mgmnt ‐ Asst Supt 304,401 0.40% 358,895 0.42%
Govern & Mgmnt ‐ School Board 88,733 0.12% 108,267 0.13%
Govern & Mgmnt ‐ Communication 134,091 0.17% - 0.00%
Fund 81 ‐ Federal Grants 920,408 1.20% 1,485,907 1.75%
Fund 91 Pilots/One Time/Tfers 650,434 0.85% 1,427,000 1.68%
Fund 81 ‐ Federal GrantsFund 91 Pilots/One Time/Tfers
Govern & Mgmnt ‐ Strateg PlanGovern & Mgmnt ‐ Asst Supt
Govern & Mgmnt ‐ Communication
Govern & Mgmnt ‐ Graduation
Govern & Mgmnt ‐ School Board
Instructional Support 2,336,072 3.04% 1,526,677 1.80%
Instructional Delivery 312,557 0.41% 873,002 1.03%
Challenge 737,630 0.96% 1,031,802 1.21%
English Language Learners 951,877 1.24% 1,401,865 1.65%
Sec Vocational 255,430 0.33% 730,942 0.86%
Fund 81 ‐ Fed Spec Ed 2,002,503 2.61% 1,995,882 2.35%
Fund 11 Tuition Programs 1,083,502 1.41% 177,896 0.21%
Fund 81 ‐ Fed Spec EdFund 11 Tuition Programs
Instructional SupportInstructional Delivery
Sec Vocational
ChallengeEnglish Language Learners
g , , ,
Special Educ/Pupil Support 12,580,680 16.39% 11,903,188 14.01%
Sec Voc Trans Disabled 428,770 0.56% 366,138 0.43%
Lindbergh Center 409,348 0.53% 460,343 0.54%
Human Resources/Relations 561,835 0.73% 436,409 0.51%
High School Instruction 9,418,795 12.27% 9,055,332 10.66%
Junior High Instruction 9,285,282 12.10% 9,283,023 10.93%
Fund 71 Equity & Integration 1,245,909 1.62% 1,273,925 1.50%
gSpecial Educ/Pupil Support
Junior High InstructionHigh School Instruction
Sec Voc Trans Disabled
Human Resources/RelationsLindbergh Center
Fund 71 Equity & Integrationq y g , , , ,
Elementary Instruction 15,489,999 20.18% 16,608,552 19.55%
TARGETED STAFFING - 0.00% 782,561 0.92%
Student Activities 982,411 1.28% 1,391,729 1.64%
ADDITIONAL TARGETED STAFFING - 0.00% - 0.00%
TECHNOLOGY 674,037 0.88% - 0.00%
Business Services 1,011,311 1.32% 1,003,032 1.18%
QCOMP - 0.00% 2,077,839 2.45%
Student Activities
Business Services
Elementary InstructionTARGETED STAFFING
ADDITIONAL TARGETED STAFFINGTECHNOLOGY
QCOMP
q y g
QCO 0 00% ,0 ,839 5%
Area Learning Center 854,576 1.11% 1,842,582 2.17%
Operations and Maintenance 4,467,198 5.82% 6,594,080 7.76%
Transportation Reg Census 2,566,032 3.34% 3,302,820 3.89%
Transportation Special Needs 1,652,149 2.15% 1,897,555 2.23%
Districtwide Insurances 603,508 0.79% 725,320 0.85%
Dist Sal and Benefits ‐ Other 604,473 0.79% 980,456 1.15%
Dist Sal and Benefits ‐ Retire 1,807,976 2.36% (25,000) -0.03%Dist Sal and Benefits ‐ Retire
Districtwide InsurancesDist Sal and Benefits ‐ Other
Transportation Special NeedsTransportation Reg Census
Area Learning CenterOperations and Maintenance
QCO
Dist Sal and Benefits Retire 1,807,976 2.36% (25,000) 0.03%
Total 75,216,127 98.00% 82,001,614 96.52%
Fund 5 Capital Expenses 1,534,705 2.00% 2,956,877 3.48%
Grand Total Expenses 76,750,832 100.00% 84,958,491 100.00%
Less OPEB - 0.00% - 0.00%
Total Expenditures less OPEB 76,750,832 100.00% 84,958,491 100.00%
Fund 5 Capital ExpensesGrand Total ExpensesLess OPEB
Dist Sal and Benefits RetireTotal
Total Expenditures less OPEB
150

1. Select Year 1: 2001-024. Select Most Recent Audit Year: 2010-11
2. Select Comparison Year: 2012-135. Select Most Recent Budget Year: 2012-13
3. Select Category to Review:
General Fund - Program Expenditures
Total Expenditures less OPEBg y p
-0.50%
0.00%
86,000,000
88,000,000
-2.00%
-1.50%
-1.00%
82,000,000
84,000,000
3 50%
-3.00%
-2.50%
78,000,000
80,000,000 Total Expenditures less OPEB
EOY Adjusted ADM
-4.50%
-4.00%
-3.50%
74,000,000
76,000,000
2001-02 2002-03 2003-04 2004-05 2005-06 2006-07 2007-08 2008-09 2009-10 2010-11 2011-12 2012-1376,750,832 81,205,651 86,176,740 86,038,971 85,184,200 81,711,097 81,793,503 82,097,694 81,204,899 80,988,878 83,672,286 84,958,491
5 80% 6 12% -0 16% -0 99% -4 08% 0 10% 0 37% -1 09% -0 27% 3 31% 1 54%
DescriptionTotal Expenditures less OPEBAnnual Change
-5.00%72,000,000 2001-02 2002-03 2003-04 2004-05 2005-06 2006-07 2007-08 2008-09 2009-10 2010-11 2011-12 2012-13
5.80% 6.12% 0.16% 0.99% 4.08% 0.10% 0.37% 1.09% 0.27% 3.31% 1.54%8,358.65 8,328.38 8,288.49 8,195.46 8,181.38 8,013.51 7,662.71 7,425.90 7,374.37 7,325.69 7,246.28 7,167.06
-0.36% -0.48% -1.12% -0.17% -2.05% -4.38% -3.09% -0.69% -0.66% -1.08% -1.09%9,182 9,750 10,397 10,498 10,412 10,197 10,674 11,056 11,012 11,055 11,547 11,854
6.19% 6.63% 0.97% -0.82% -2.07% 4.68% 3.57% -0.40% 0.40% 4.45% 2.66%Revenue per ADMAnnual Change
Annual Change
Annual ChangeEOY Adjusted ADM
151

1. Select Year 1: 2001-024. Select Most Recent Audit Year: 2010-11
2. Select Comparison Year: 2012-135. Select Most Recent Budget Year: 2012-13
3. Select Category to Review:
General Fund - Program Expenditures
Total Expenditures less OPEBg y p
2001-02 2002-03 2003-04 2004-05 2005-06 2006-07 2007-08 2008-09 2009-10 2010-11 2011-12 2012-13317,479 327,164 360,734 411,119 364,673 403,703 395,102 344,705 344,125 421,554 362,024 362,024
329,811 349,009 309,570 319,788 376,507 297,147 321,240 318,530 312,872 328,543 347,346 358,336
54,871 50,322 120,703 84,804 106,045 92,876 70,980 72,697 78,470 42,870 100,000 100,000
- 22,814 42,417 32,166 41,352 48,242 49,920 43,845 48,330 27,536 60,000 46,200
92 039 83 018 41 644 64 043 48 658 15 917 27 277 17 394 25 583 22 019 55 554 57 035
Description
G &M S PlGovern & Mgmnt ‐ GraduationGovern & Mgmnt ‐ Supt ContGovern & Mgmnt ‐ SuptFund 81 Local Grants
92,039 83,018 41,644 64,043 48,658 15,917 27,277 17,394 25,583 22,019 55,554 57,035
304,401 303,581 389,397 288,533 394,400 301,998 251,841 308,745 328,085 340,571 348,587 358,895
88,733 101,659 102,193 80,262 114,700 111,482 92,462 94,060 86,764 102,111 105,745 108,267
134,091 130,976 136,490 140,685 130,769 127,177 65,022 (1) - - - -
920,408 887,975 982,352 1,475,777 1,108,695 971,993 984,796 1,203,649 1,716,331 2,057,308 1,778,113 1,485,907
650,434 296,864 217,819 455,065 352,750 541,333 213,390 1,864,515 - 991,380 1,822,455 1,427,000
2,336,072 2,278,078 1,912,410 1,692,999 1,556,661 1,240,563 1,272,652 1,275,328 1,176,040 1,089,759 1,234,558 1,526,677
312 557 348 681 117 382 209 524 176 119 123 696 131 237 407 442 332 493 269 759 1 061 109 873 002
Govern & Mgmnt ‐ Strateg Plan
Fund 91 Pilots/One Time/TfersInstructional Support
Govern & Mgmnt ‐ School Board
Fund 81 ‐ Federal Grants
i l li
Govern & Mgmnt ‐ Communication
Govern & Mgmnt ‐ Asst Supt
312,557 348,681 117,382 209,524 176,119 123,696 131,237 407,442 332,493 269,759 1,061,109 873,002
737,630 751,520 805,495 822,203 854,892 888,014 876,260 957,371 957,317 933,412 994,128 1,031,802
951,877 998,147 943,874 1,016,776 1,081,565 978,850 1,190,884 1,199,032 1,250,849 1,405,422 1,356,312 1,401,865
255,430 289,023 287,907 331,638 613,639 703,746 763,595 912,364 749,792 668,138 710,461 730,942
2,002,503 2,257,388 2,736,697 3,964,110 1,787,919 1,601,871 1,927,601 1,706,692 1,778,228 1,476,905 1,935,841 1,995,882
1,083,502 1,141,873 1,188,098 1,064,310 1,867,020 1,751,503 1,471,832 1,150,463 925,720 673,845 173,053 177,896
12,580,680 12,171,375 11,822,397 12,324,212 13,089,680 12,126,618 11,979,580 11,265,424 11,193,761 11,787,637 11,818,169 11,903,188
Fund 11 Tuition ProgramsSpecial Educ/Pupil Support
Sec Vocational
ChallengeEnglish Language Learners
Fund 81 ‐ Fed Spec Ed
Instructional Delivery
428,770 753,512 768,036 739,573 397,465 391,188 381,466 418,782 386,031 294,544 354,548 366,138
409,348 436,419 412,862 420,805 480,186 426,684 486,741 461,545 452,926 434,077 447,134 460,343
561,835 765,461 736,232 655,455 707,057 512,757 517,046 497,838 471,354 419,444 423,457 436,409
9,418,795 10,119,189 9,820,813 9,009,435 8,802,509 8,671,781 8,311,212 8,405,872 8,359,448 8,292,002 8,957,236 9,055,332
9,285,282 9,194,029 9,662,739 9,389,073 9,154,853 8,976,061 8,770,801 9,027,544 9,124,439 8,976,541 9,248,113 9,283,023
1,245,909 1,211,516 1,450,581 1,354,730 1,395,201 1,274,133 1,347,311 1,344,036 1,289,364 1,313,259 1,297,470 1,273,925
15,489,999 15,826,382 16,417,465 15,894,312 15,937,594 16,383,272 15,682,413 15,702,085 15,676,022 15,268,813 16,129,006 16,608,552
High School InstructionJunior High InstructionFund 71 Equity & Integration
Sec Voc Trans DisabledLindbergh CenterHuman Resources/Relations
Elementary Instruction- - - - - - - 518,174 429,958 1,367,196 558,249 782,561
982,411 989,761 907,863 1,009,140 1,085,727 1,047,809 1,059,715 1,178,018 1,207,874 1,235,396 1,309,904 1,391,729
- - - - - - - - 160,287 - - -
674,037 649,116 296,214 301,534 326,850 260,885 275,267 453,818 391,611 48 - -
1,011,311 1,070,699 1,008,334 869,523 790,771 905,349 982,390 826,187 831,167 891,656 1,020,854 1,003,032
- - - - 2,037,000 2,161,642 2,006,053 2,069,066 1,869,469 2,067,814 2,075,959 2,077,839
854,576 900,134 1,173,919 1,279,052 1,378,406 1,233,543 1,458,285 1,544,601 1,679,736 1,621,794 1,785,404 1,842,582
Student ActivitiesADDITIONAL TARGETED STAFFING
QCOMPArea Learning Center
Business Services
TARGETED STAFFING
TECHNOLOGY
4,467,198 4,523,897 4,958,836 5,428,549 5,782,469 5,019,595 5,465,362 5,583,245 5,625,061 5,962,592 6,121,386 6,594,080
2,566,032 2,719,424 3,066,300 3,128,832 3,031,435 3,057,828 3,757,445 3,455,023 4,428,497 3,371,150 3,235,110 3,302,820
1,652,149 1,809,452 2,019,577 2,342,196 2,647,051 2,390,200 2,423,690 2,357,241 2,481,224 1,840,153 1,858,027 1,897,555
603,508 494,223 742,778 843,668 857,891 601,485 476,541 521,282 578,531 631,180 694,352 725,320
604,473 521,269 559,396 836,109 1,185,980 1,054,306 1,090,872 1,123,055 999,124 1,061,535 984,674 980,456
1,807,976 2,081,862 1,579,087 2,334,186 2,087,476 1,851,518 1,754,950 9,037,908 8,165,181 178,938 (25,000) (25,000)
75,216,127 76,855,812 78,098,611 80,614,186 82,151,965 78,546,765 78,333,231 87,667,575 85,912,064 77,866,901 80,739,338 82,001,614
Dist Sal and Benefits ‐ Retire
Transportation Special NeedsDistrictwide InsurancesDist Sal and Benefits ‐ Other
Total
Operations and MaintenanceTransportation Reg Census
1,534,705 4,349,839 8,078,129 5,424,785 3,032,235 3,164,332 3,460,272 3,576,753 3,755,213 3,121,977 2,932,948 2,956,877
76,750,832 81,205,651 86,176,740 86,038,971 85,184,200 81,711,097 81,793,503 91,244,328 89,667,277 80,988,878 83,672,286 84,958,491
- - - - - - - 9,146,634 8,462,378 - - -
76,750,832 81,205,651 86,176,740 86,038,971 85,184,200 81,711,097 81,793,503 82,097,694 81,204,899 80,988,878 83,672,286 84,958,491
Fund 5 Capital Expenses
Total Expenditures less OPEBLess OPEBGrand Total Expenses
152

1. Select Year 1: 2001-024. Select Most Recent Audit Year: 2010-11
2. Select Comparison Year: 2012-135. Select Most Recent Budget Year: 2012-13
3. Select Category to Review:
General Fund - Program Expenditures
Total Expenditures less OPEBg y p
10.00%
Rate of Change - Projected
8.00%
Rate of Change - Actual
0.00%
5.00%
0.00%
2.00%
4.00%
6.00%
10 00%
-5.00%
-8.00%
-6.00%
-4.00%
-2.00%
-15.00%
-10.00%
Total Expenditures less OPEB EOY Adjusted ADM
-14.00%
-12.00%
-10.00%
Total Expenditures less OPEB EOY Adjusted ADM
3-Year 5-Year 10-Year 3-Year 5-Year 10-Year4.90% 3.48% -1.41% -1.35% -0.88% 5.52%
EOY Adjusted ADM -2.17% -3.49% -13.53% EOY Adjusted ADM -1.35% -8.58% -12.36%
DescriptionRate of Change - Projected Rate of Change - Actual
Description
Total Expenditures less OPEB Total Expenditures less OPEB
Averages3-Year 2010-11 2012-13 2008-09 2010-115-Year 2008-09 2012-13 2006-07 2010-1110-Year 2003-04 2012-13 2001-02 2010-11
Projected Actual
153

1. Select Year 1: 2001-024. Select Most Recent Audit Year: 2010-11
2. Select Comparison Year: 2012-135. Select Most Recent Budget Year: 2012-13
3. Select Category to Review:
General Fund - Program Expenditures
Total Expenditures less OPEBg y p
3-Year 5-Year 10-Year 3-Year 5-Year 10-YearFund 81 Local Grants -14.12% 5.02% 0.36% Fund 81 Local Grants 22.29% 4.42% 32.78%
Govern & Mgmnt ‐ Supt 9.07% 12.50% 15.75% Govern & Mgmnt ‐ Supt 3.14% 10.57% -0.38%
Govern & Mgmnt ‐ Supt Cont 133 26% 37 56% -17 15% Govern & Mgmnt ‐ Supt Cont -41 03% -53 84% -21 87%
Rate of Change - ActualDescription
Rate of Change - ProjectedDescription
Govern & Mgmnt ‐ Supt Cont 133.26% 37.56% -17.15% Govern & Mgmnt ‐ Supt Cont -41.03% -53.84% -21.87%
Govern & Mgmnt ‐ Graduation 67.78% 5.37% 8.92% Govern & Mgmnt ‐ Graduation -37.20% -42.92%
Govern & Mgmnt ‐ Strateg Plan 159.03% 227.90% 36.96% Govern & Mgmnt ‐ Strateg Plan 26.59% 38.34% -76.08%
Govern & Mgmnt ‐ Asst Supt 5.38% 16.24% -7.83% Govern & Mgmnt ‐ Asst Supt 10.31% 12.77% 11.88%
Govern & Mgmnt ‐ School Board 6.03% 15.10% 5.94% Govern & Mgmnt ‐ School Board 8.56% -8.41% 15.08%
Govern & Mgmnt ‐ Communication -100.00% -100.00% Govern & Mgmnt ‐ Communication -100.00% -100.00% -100.00%
Fund 81 ‐ Federal Grants -27.77% 23.45% 51.26% Fund 81 ‐ Federal Grants 70.92% 111.66% 123.52%
Fund 91 Pilots/One Time/Tfers 43 94% -23 47% 555 13% Fund 91 Pilots/One Time/Tfers -46 83% 83 14% 52 42%Fund 91 Pilots/One Time/Tfers 43.94% -23.47% 555.13% Fund 91 Pilots/One Time/Tfers -46.83% 83.14% 52.42%
Instructional Support 40.09% 19.71% -20.17% Instructional Support -14.55% -12.16% -53.35%
Instructional Delivery 223.62% 114.26% 643.73% Instructional Delivery -33.79% 118.08% -13.69%
Challenge 10.54% 7.77% 28.10% Challenge -2.50% 5.11% 26.54%
English Language Learners -0.25% 16.92% 48.52% English Language Learners 17.21% 43.58% 47.65%
Sec Vocational 9.40% -19.88% 153.88% Sec Vocational -26.77% -5.06% 161.57%
Fund 81 ‐ Fed Spec Ed 35.14% 16.94% -27.07% Fund 81 ‐ Fed Spec Ed -13.46% -7.80% -26.25%
Fund 11 Tuition Programs 73 60% 84 54% 85 03% Fund 11 Tuition Programs 41 43% 61 53% 37 81%Fund 11 Tuition Programs -73.60% -84.54% -85.03% Fund 11 Tuition Programs -41.43% -61.53% -37.81%
Special Educ/Pupil Support 0.98% 5.66% 0.68% Special Educ/Pupil Support 4.64% -2.80% -6.30%
Sec Voc Trans Disabled 24.31% -12.57% -52.33% Sec Voc Trans Disabled -29.67% -24.71% -31.30%
Lindbergh Center 6.05% -0.26% 11.50% Lindbergh Center -5.95% 1.73% 6.04%
Human Resources/Relations 4.04% -12.34% -40.72% Human Resources/Relations -15.75% -18.20% -25.34%
High School Instruction 9.21% 7.73% -7.79% High School Instruction -1.35% -4.38% -11.96%
Junior High Instruction 3.41% 2.83% -3.93% Junior High Instruction -0.56% 0.01% -3.33%
Fund 71 Equity & Integration 3 00% 5 22% 12 18% Fund 71 Equity & Integration 2 29% 3 07% 5 41%Fund 71 Equity & Integration -3.00% -5.22% -12.18% Fund 71 Equity & Integration -2.29% 3.07% 5.41%
Elementary Instruction 8.77% 5.77% 1.16% Elementary Instruction -2.76% -6.80% -1.43%
TARGETED STAFFING -42.76% 51.02% TARGETED STAFFING 163.85%
Student Activities 12.65% 18.14% 53.30% Student Activities 4.87% 17.90% 25.75%
ADDITIONAL TARGETED STAFFING ADDITIONAL TARGETED STAFFINGTECHNOLOGY -100.00% -100.00% -100.00% TECHNOLOGY -99.99% -99.98% -99.99%
Business Services 12.49% 21.40% -0.53% Business Services 7.92% -1.51% -11.83%
QCOMP 0 48% 0 42% QCOMP 0 06% 4 34%QCOMP 0.48% 0.42% QCOMP -0.06% -4.34%
Area Learning Center 13.61% 19.29% 56.96% Area Learning Center 5.00% 31.47% 89.78%
Operations and Maintenance 10.59% 18.10% 32.98% Operations and Maintenance 6.79% 18.79% 33.47%
Transportation Reg Census -2.03% -4.41% 7.71% Transportation Reg Census -2.43% 10.25% 31.38%
Transportation Special Needs 3.12% -19.50% -6.04% Transportation Special Needs -21.94% -23.01% 11.38%
Districtwide Insurances 14.91% 39.14% -2.35% Districtwide Insurances 21.08% 4.94% 4.59%
Dist Sal and Benefits ‐ Other -7.64% -12.70% 75.27% Dist Sal and Benefits ‐ Other -5.48% 0.69% 75.61%
Dist Sal and Benefits Retire 113 97% 100 28% 101 58% Dist Sal and Benefits Retire 98 02% 90 34% 90 10%Dist Sal and Benefits ‐ Retire -113.97% -100.28% -101.58% Dist Sal and Benefits ‐ Retire -98.02% -90.34% -90.10%
Total 5.31% -6.46% 5.00% Total -11.18% -0.87% 3.52%
Fund 5 Capital Expenses -5.29% -17.33% -63.40% Fund 5 Capital Expenses -12.71% -1.34% 103.43%
Grand Total Expenses 4.90% -6.89% -1.41% Grand Total Expenses -11.24% -0.88% 5.52%
Less OPEB -100.00% Less OPEB -100.00%
Total Expenditures less OPEB 4.90% 3.48% -1.41% Total Expenditures less OPEB -1.35% -0.88% 5.52%
EOY Adjusted ADM -2.17% -3.49% -13.53% EOY Adjusted ADM -1.35% -8.58% -12.36% 154
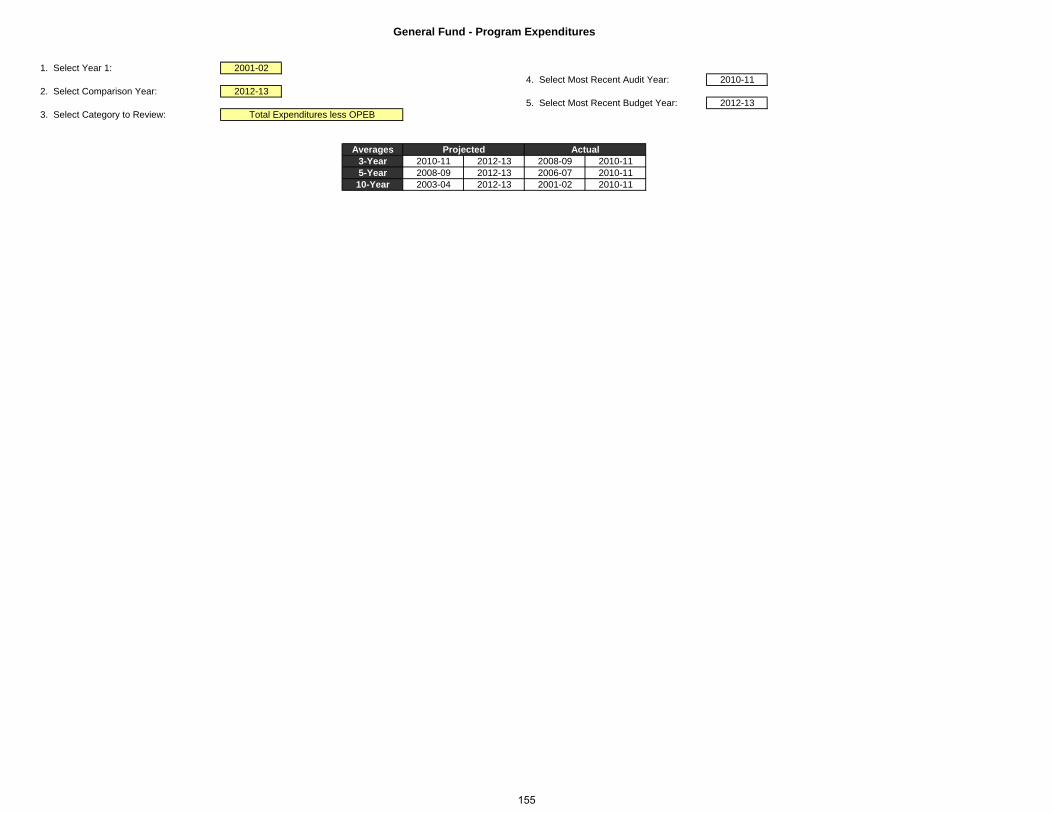
1. Select Year 1: 2001-024. Select Most Recent Audit Year: 2010-11
2. Select Comparison Year: 2012-135. Select Most Recent Budget Year: 2012-13
3. Select Category to Review:
General Fund - Program Expenditures
Total Expenditures less OPEBg y p
Averages3-Year 2010-11 2012-13 2008-09 2010-115-Year 2008-09 2012-13 2006-07 2010-1110-Year 2003-04 2012-13 2001-02 2010-11
Projected Actual
155