Embed Size (px)
Citation preview
BUDGET OVERVIEW
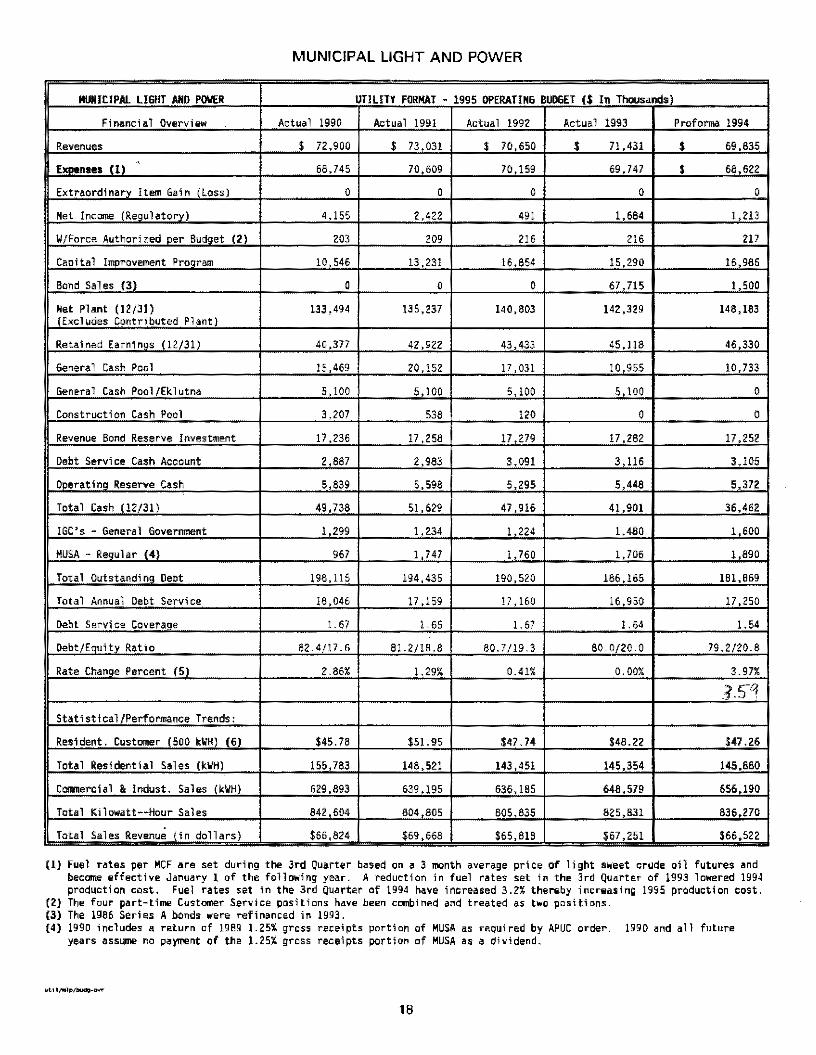
MUNICIPAL LIGHT AND POWER
MIJIIICIPAI. LIGHT AHD POWER UTILITY FORMAT - 1995 OPERATING BUDGET ($ In Thousands)
Financial Overview Actual 1990 Actual 1991 Actual 1992 Actual 1993 Proforma 1994
Revenues $ 72,900 $ 73,031 $ 70,650 $ 71,431 $ 69,635
EX111!naes Ill 68J45 70,609 70,159 69J47 $ 68 622
Extraordinary Item Gain (loss) 0 0 0 0 0
Net Income (Reoulatorv) 4,155 2,422 491 1,684 1,213
W/Force Authorized oer Budoet (2) 203 209 216 216 217
Caoital Imorovement Program 10 546 13 231 16.654 15,290 16 986
Bond Sales (31 0 0 0 67 715 1 500
Net Plant (12/31) 133,494 !35,237 140,603 142,329 148,183 (Excludes Contributed Plant)
Retained Earninos 02/31) 40,377 42,922 43,433 45,118 46,330
General Cash Pool 15,469 20,152 17,031 10 955 10,733
General Cash Pool/Eklutna 5 100 5 100 5,100 5 100 0
Construction Cash Poo1 3,207 538 120 0 0
Revenue Bond Reserve Investment 17,236 17,258 17 279 17,262 17,252
Debt Service Cash Account 2,667 2,983 3,091 3,116 3,105
Operating Reserve Cash 5,839 5,598 5 295 5,448 5,372
Total Cash (12/31) 49,738 51,629 47,916 41,901 36,462
IGC 1 S - General Government 1,299 1,234 1,224 1,480 1,600
MUSA - Reqular (4) 967 1,747 1, 760 1,706 1,890
Total Outstandina Debt 198,115 194,435 190 520 186,165 181,869
Total Annual Debt Service 18 046 17,159 17,160 16,950 17,250
Debt Service Coverage 1.67 1.65 L67 1.64 1.54
Debt/Equity Ratio 82.4/17.6 81.2/18.8 80.7/19.3 80.0/20.0 79.2{20.8
Rate Change Percent (5) 2.86% 1.29% 0.41% 0.00% 3.97%
1S<1 Statistical/Performance Trends:
Resident. Customer (500 kWH) (6) $45.78 $51.95 $47.74 $46.22 $47.26
Total Residential Sales (kWH] 155,783 148,521 143,451 145,354 145.880
Commercial & lndust. Sales (kWH) 629,893 639,195 636,185 648,579 656,190
Total Kilowatt--Hour Sales 842,604 804,805 605,835 825,831 836,270
Total Sales Revenue (in dollars} $66,824 $69,668 $65,818 $67,251 $66,522
(1) Fuel rates per MCF are set during the 3rd Quarter based on a 3 month average price of light sweet crude oi1 futures and became effective January 1 of the following year. A reduction in fuel rates set in the 3rd Quarter of 1993 lowered 1994 production cost. Fuel rates set in the 3rd Quarter of 1994 have increased 3.2% thereby increasing 1995 production cost.
(2} The four part-time Customer Service positions have been combined and treated as two positions. (3) The 1986 Series A bonds were refinanced in 1993. (4) 1990 includes a return of 1989 1.25% gross receipts portion of MUSA as required by APUC order. 1990 and all future
years assume no payment of the 1.25% gross receipts portion of MUSA as a di~idend.
18
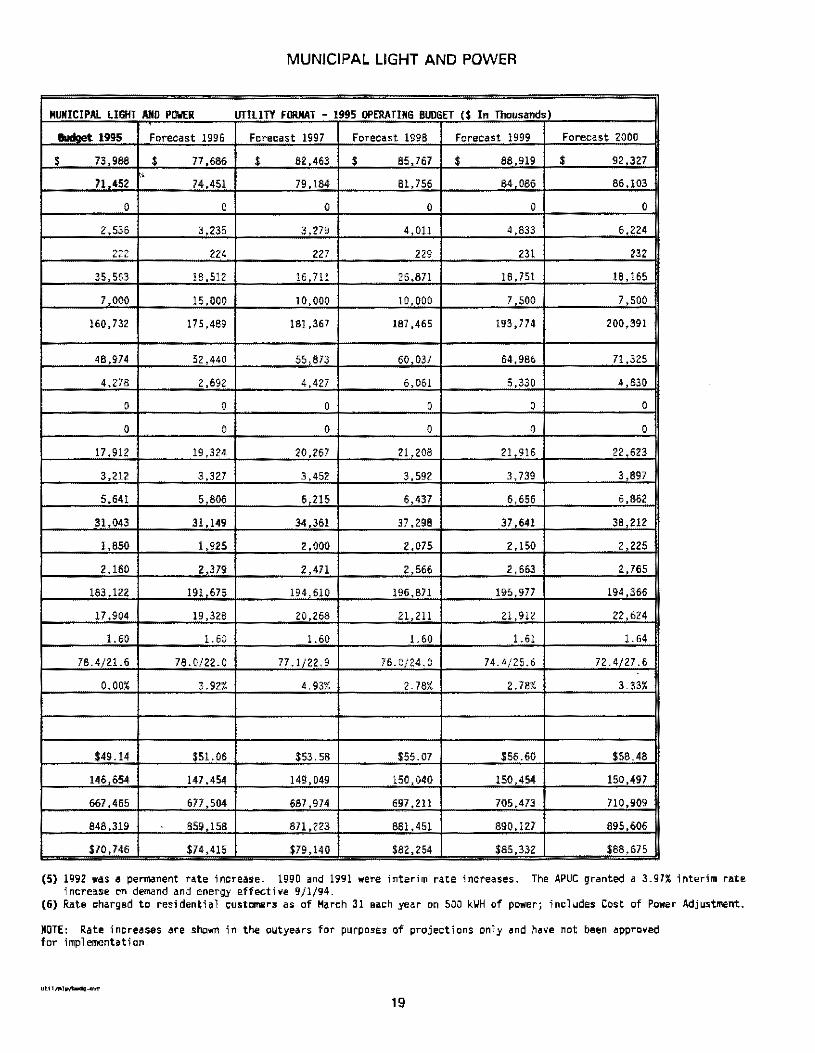
MUNICIPAL LIGHT AND POWER
MUNICIPAL LIGHT AHD POWER UTiliTY fORMAT - 1995 OPERATING BUDGET ($ In Thousands
8udoet 1995 Forecast 1996 Forecast 1997 Forecast 1998 forecast 1999 Forecast 2000
$ 73,988 $ 77,686 $ 82,463 $ 85,767 $ 88,919 $ 92,3Z7 ,,
71 452 74,451 79,184 81,756 84,086 86,103
0 0 0 0 0 0
2 536 3,235 3,279 4,011 4,833 6,224
222 224 ZZ7 229 231 232
35,563 18,512 16 711 26,871 18,751 18,165
7,000 15,000 10,000 10,000 7 500 7,500
160,732 175,489 181,367 187,465 193,774 200,391
48,974 52,440 55,873 60,037 64,986 71,325
4,278 2,692 4,427 6,061 5,330 4,830
0 0 0 0 0 0
0 0 0 0 0 0
17 912 19,324 20,267 21 208 21,916 22 623
3,212 3,327 3,452 3,592 3, 739 3 897
5,641 5 806 6 215 6,437 6,656 6,862
31,043 31,149 34 361 37,298 37,641 38,212
1,850 1 925 2,000 2,075 2,150 2 225
2,160 2,379 2,471 2,566 2,663 2,765
183 122 191,675 194,610 196.871 195,977 194 366
17,904 19,328 20 268 21,211 21 ~12 22,624
1.60 1.60 1.60 1.60 1.61 1.64
78.4/21.6 78.0/22.0 77.1/22,9 76.0/24.0 74.4/25.6 72.4/27,6
0.00% 3.92% 4.93% 2. 78% 2,78% 3.33%
$49.14 $51.06 $53.58 $55.07 $56.60 $58.48
146 654 147,454 149,049 ISO 040 150,454 150,497
667,465 677,504 687,974 697,211 705,473 710,909
848,319 - 859,158 871,223 881,451 890,127 895,606
$70,746 $74,415 $79,140 $82,254 $85,332 $88,675
(5} 1992 was a permanent rate increase. 1990 and 1991 were interim rate increases. The APUC granted a 3.97% interim rate increase on demand and energy effective 9/1/94.
(6) Rate charged to residential customers as of March 31 each year on 500 kWH of power; includes Cost of Power Adjustment.
NOTE: Rate increases are shown in the outyears for purposes of projections oniy and have not been approved for implementation,
19
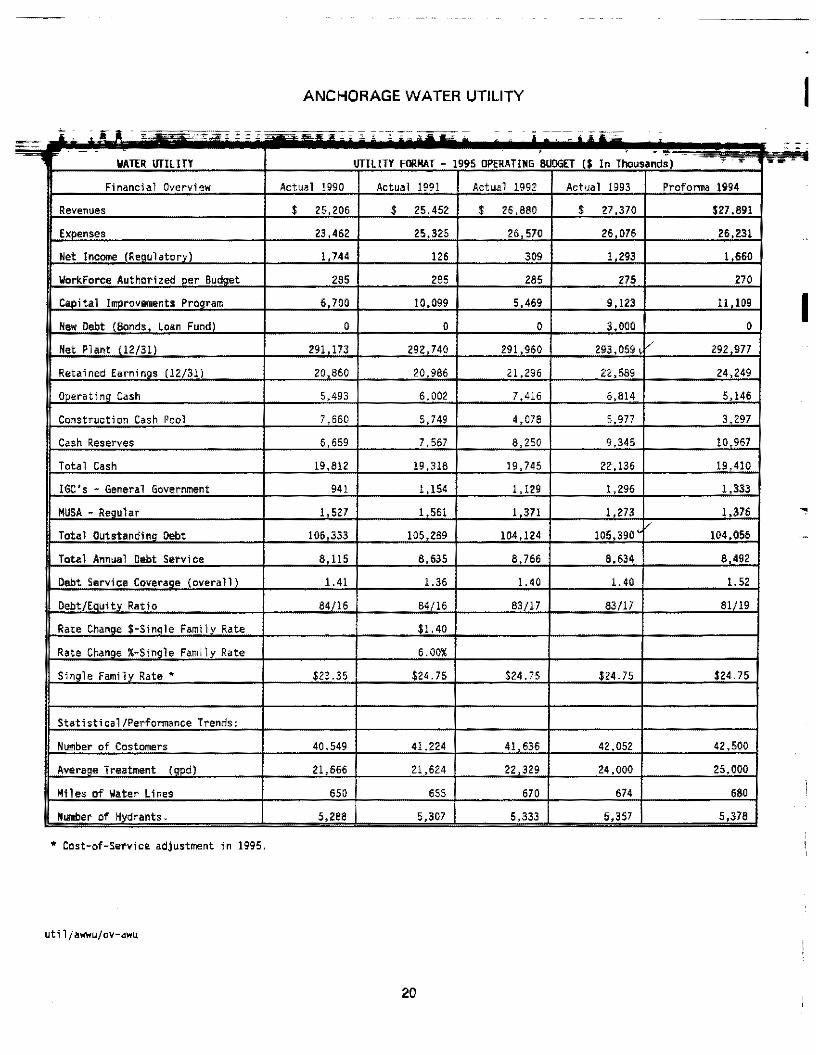
ANCHORAGE WATER UTILITY I - ~
~- - - - .. ~ ·~;; .:;; - i ;o; A: ii:;;;; ~
·7·~·--:=~ WATER IITit HY lT!llTY FOIIMAT - 1995 8UD6fT !S In
Financial Actual !990 Actual 1~91 Actual 1992 Actual 1993 1994
Oovonn•• $ 25.206 $ 25.452 $ 26.880 $ 27.370 $27.891
23.462 25,325 26,570 26.076 26.231 .. Net Income !.744 126 309 !.293 1.660
per Budget 285 285 285 275 270
Capital 6,700 10,099 5,469 9,123 11 109 I New Debt (Bonds, loan Fund) 0 0 0 3,000 0
Net Plant {12/31) 291,173 292,740 291,960 293,059 / 292,977
Retained Earnings (12/311 20,860 20,986 21,296 22,589 24,249
inq Cash 5,493 6,002 7,416 6,814 5,146
r. ·•· -•; on Cash Pool 7,660 5,749 4,078 5,977 3,297
Cash 0• 6,659 7.567 8.250 9,345 10,967
Total Cash 19.812 19.318 19.745 22.136 19.410
IGC's - 941 !.154 1.129 !.296 1.333
MUSA - o~u1"' !.527 _1,561 1.371 1.273 1.376 ~
Total Ina Oebt 106.333 10< ?RQ 104.124 105.390' 104 05B ~
Total Annual Debt Service 8,115 8,635 8,766 8,634 8._4'1f
Debt I) 1.41 1.36 1.40 1.40 !.52
Ooh Ratio 84/16 84/16 83/17 83/17 81/19
Rate Change • · Family Rate $1.40
Rate Chanae •-«· ·1• Famil v Rate 6.00%
Single Family Rate • $23.35 $24.75 $24.75 $24.75 $24.75
Statistical Trends:
Number of 40,549 41.224 41,636 42,052 42,500
!oodl 21.666 21.624 22.329 24,000 25,000
Mi 1 es of \later lines 650 655 670 674 680 i Number of - 5,288 5,307 5,333 5,357 5,378
* Cost-of-Service adjustment in 1995.
utiljawwu/ov-awu
20
• I l I
I
ANCHORAGE WATER UTILITY
-------------------
VATER UTILITY UTILITY FORMAT - 1995 OPERATING BUDGET ($ In Thousands)
BudQet 1995 Forecast 1996 Forecast 1997 Forecast 1998 Forecast 1999 Forecast 2000
28,240 29,586 31,199 32,207 33,163 33,347
26,668 27,936 28,609 29,147 29,741 30,210
1,572 1,650 2,590 3,060 3,422 3,137
272 273 273 273 273 273
10,420 7,245 18,375 18,175 17,035 13,215
3,000 3,000 0 0 0 0
290,362 287,212 283,481 279,117 274,066 268,268
25,821 27,471 30,061 33,121 36,543 39,679
3,746 2,238 2,781 3,205 4,181 5,953
1,877 3,203 1,203 3 3 3
12,741 14,613 16,588 18,670 20,463 20,309
18,364 20,054 20,572 21,878 24,647 26,265
1,617 1,697 1,782 1,871 I, 965 2,063
1,417 1,460 1,504 1,549 1,595 1,643
105,214 106,205 104,101 101,938 99,617 96,275
8,888 9,143 9,138 9,043 9,087 9,951
1.44 1.42 !.52 !.58 I. 61 !.52
80/20 79121 77/23 75/25 73/27 71/29
1.30 2.34 1.42
9.0% 5.0%
26.05 28.39 28.39 29.81 29.81 29.81
43,000 43,400 43,600 43,800 44,000 44,200
25,500 26,000 26,500 27,000 27,500 28,000
686 691 695 700 706 711
5,427 5,470 5,500 5,534 5,567 5,588
NOTE: Rate increases are shown in the outyears for purposes of projections only and have not been approved for implementation.
util\awwu\ov-awu
21
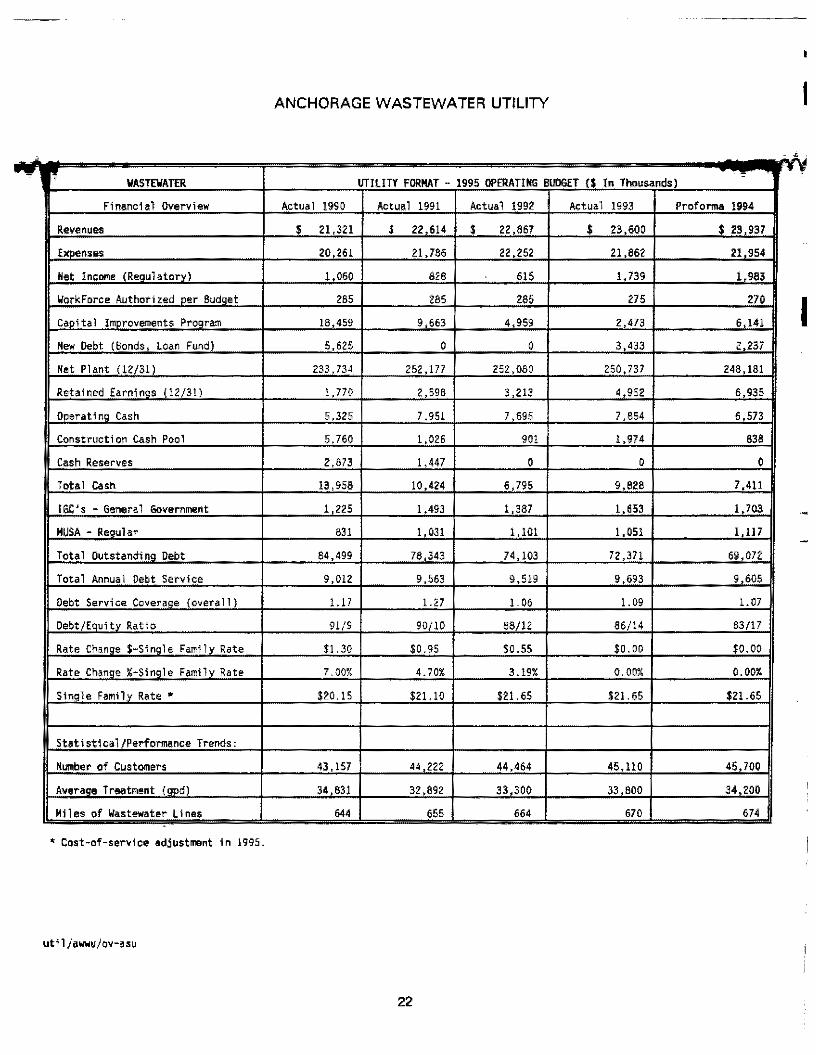
ANCHORAGE WASTEWATER UTILITY I
.;..~.
?'I? ifll!TY FORMAT - 1995 BUOOET !$ In
Financial Actual 1990 Actual 1991 Actual 1992 Actual 1993 1994
s 21.321 $ 22.614 $ 22.867 $ 23,600 s 23,937
20,261 21.786 22,252 21,862 21,954
Het Income ·'' 1,060 828 615 1,739 1.983
,.; per Budget 285 285 285 275 210 H I Capital 18,459 9,663 4,959 2,473 6,141
New Debt (Bonds Loan Fund) 5,625 0 0 3,433 2,237
Net Plant (12/311 233.734 252.177 252,080 250,737 248,181
Retained Earnings {12/311 1.770 2.598 3.213 4,952 6.935
ina Cash 5.325 7 951 7.695 7.854 6.573
r. ion Cash Pool 5.760 1,026 901 1.974 838
Cash 2.873 1,447 0 0 0
Total Cash 13 '958 10.424 6,795 9.828 7.411
IGC's - General 1,225 1,493 1,387 1,653 1,703 -HUSA - Regular 831 1,031 1,101 1,051 1,111 -Total n. ing Debt 84,499 78,343 74,!03 72,371 69.072
Total Annual Debt 9,012 9.563 9,519 9,693
Debt Service (overall} 1.17 1.27 1.06 1.09 1.07
""' · ,., "i tv Ratio 91/9 90/10 86/l2 86/14 83/17
Rate Chance S-Sinale Familv Rate $1.30 $0.95 $0.55 $0.00 so.oo Rate Change %-Single Family Rate 7.00% 4. 70% 3.19% O.OQ% 0.00%
Single Family Rate • $20.15 $21.10 $21.65 $21.65 $21.65
« H, H, .1 Trends:
Number of Customers 43.157 44.222 44,464 45,110 45.700
(gpd) 34,631 32,892 33,300 33,800 34,200 '
Miles of u. Lines 644 655 664 670 674
* Cost-of-service adjustment in 1995,
util/awwu/ov-asu
22
J-
1 -
:
1 , I
1 I l !
! , :
I. I I
I ' I. '
'
,
' I !
.
Budget 1995
24.033
22.732
1.301
27Z
4.205
6.000
245,533
8.236
4,542
393
0
4,935
1.998
1.162
69.454
9.669
1.00
82/18
$0.40
0.00%
$21.25
46,300
34,700
679
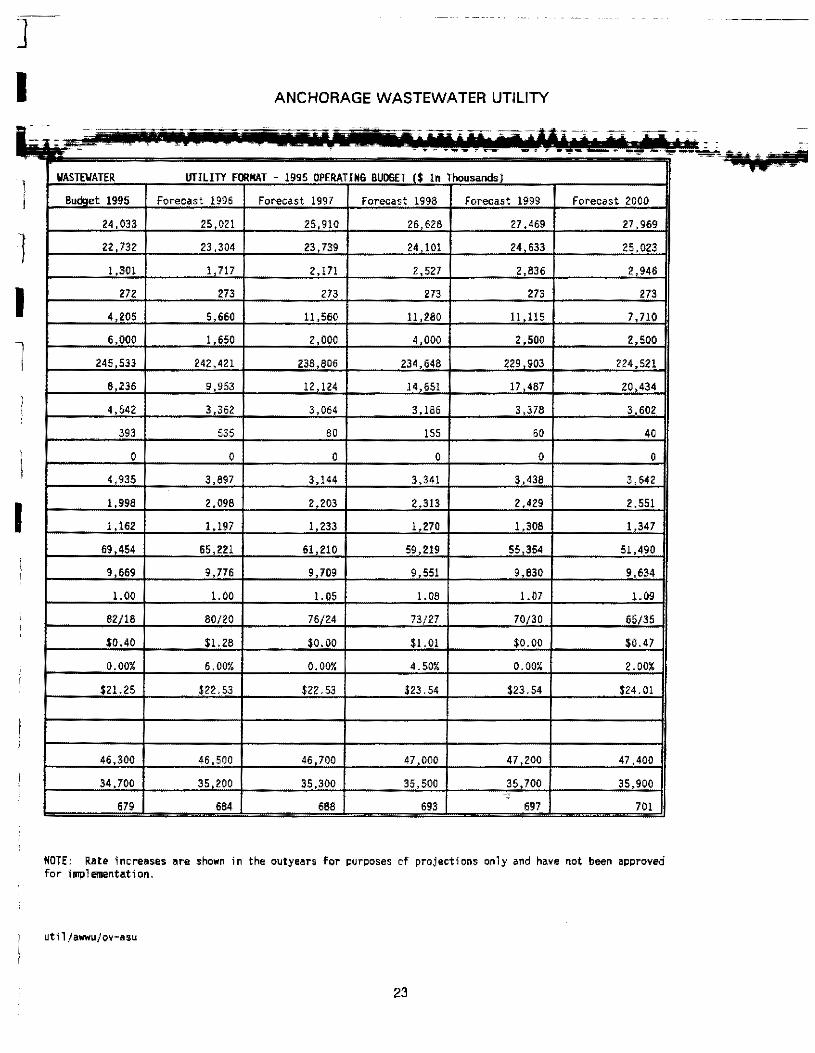
ANCHORAGE WASTEWATER UTILITY
iii ; i:&i. i: ~jiijijiii -::.:. :i::£ ~ ~ ---~ .,. -
UTILITY FORMAT - 1995 BUOGET ($ ln
1996 •• 1997 1998 1999 2000
25.021 25.910 26.628 27.469 27.969
23.304 23.739 24.101 24.633 25.023
1. 717 2,17! 2,527 2,836 2.946
273 27_3 273 273 273
5.660 11.560 11.280 11.115 7.710
1.650 2.000 4.000 2.500 2.500
242,421 "" •n• 234,648 229,903 224,521
9,953 12,124 14,651 17,487 20,434
3,362 3,064 3,186 3,378 3,602
535 80 !55 60 40
0 0 0 0 0
3,897 3,144 3,341 3,438 3,642
2.098 2.203 2.313 2.429 2.551
1.197 1.233 1.270 1.308 1.347
65.221 61.210 59.219 55.354 51,49Q
9.776 9.709 9.551 9.830 9.634
1.00 1.05 1.08 1.07 1.09
80/20 76/24 73/27 70/30 65/35
$1.28 $0.00 $1.01 $0.00 $0.47
6.00% o. oor. 4.50% 0.00% 2.00%
$22.53 $22.53 $23.54 $23.54 $24.01
46,500 46,700 47,000 47,200 47,400
35,200 35,300 35,500 35,700 35,900
664 688 693 -, 697 701
NOTE: Rate increases are shown in the outyears for purposes of projections only and have not been approved for implementation.
util/awwu/ov-asu
23
·---
- -
"' '± j.
........
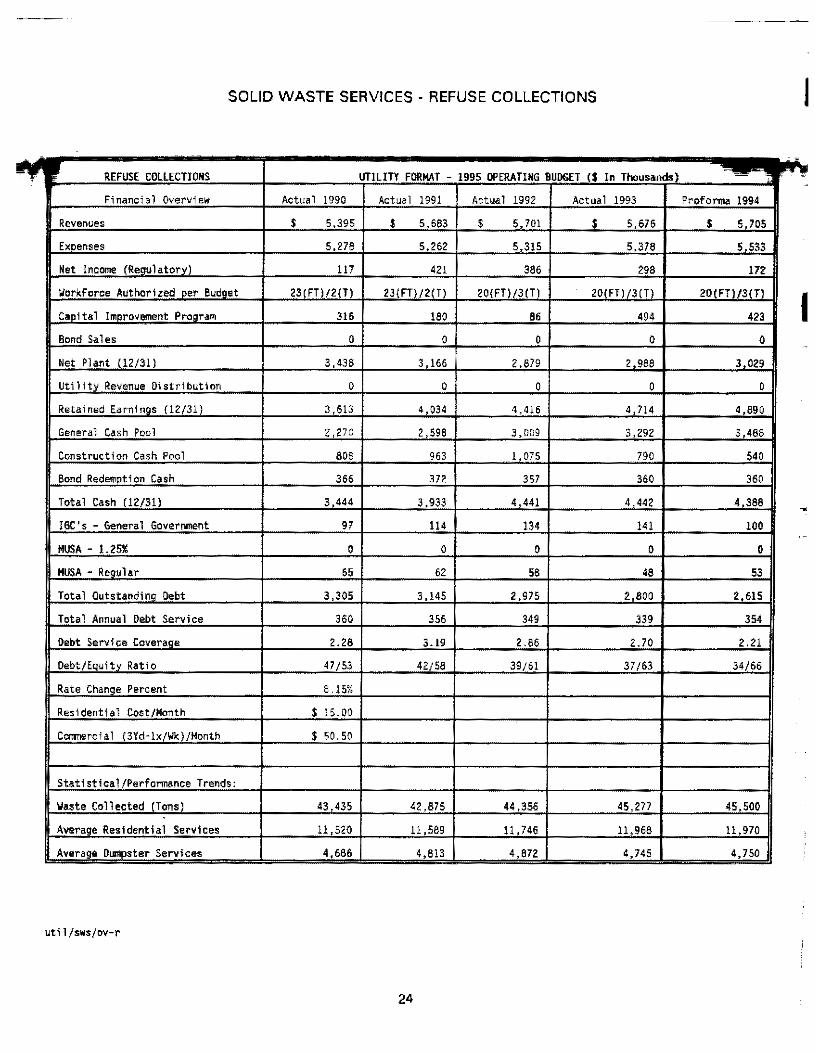
SOLID WASTE SERVICES - REFUSE COLLECTIONS I
REFUSE COLL UTILITY FORMAT - I995 BUDGET ($ In ~ Fi -; • 1 Overview Actual 1990 Actual 1991 Actual 1992 Actual 1993 1994
$ 5,395 $ 5,663 $ 5,701 $ 5,676 $ 5.705
5,278 5,262 5,315 5,378 5.533
Net Income (Regulatory) 117 421 386 298 17Z
..... •ized per Budget 23(FT)/2(T) 23(FT)/2(T) 20(FT)f3(T) 20(FT) /3 (T) 20(FTl/3(Tl
I 316 180 86 494 423
Bond Sales 0 0 0 0 0
Net Plant (12/311 3,438 3,166 2,879 2,988 3,029
Utilltv Distribution 0 0 0 0 0
••••inorl ;, 'inM (12/311 3,6!3 4,034 4 416 4,714 4,890
Cash Pool 2,270 2,596 3,009 3,292 3,488
Oion Cash Pool 808 963 1,075 790 540
Bond Cash 366 372 357 360 360
Total Cash (12!31) 3,444 3,933 4,441 4,442 4,388 ... IGC's - 97 114 134 141 100
MUSA - 1. 25% 0 0 0 0 0
HUSA - 65 62 58 48 53
Total n. ·'" Debt 3.305 3,145 2,975 2,800 2.615
Total Annua 1 Debt 360 356 349 339 354
Debt Service 2.28 3.19 2.86 2.70 2.21
"•'"'"•i ty Ratio 47/53 42/58 39/51 37/63 34/66
Rate Change 8.15%
Residential r. IM• +h $ 15.00
ial (3Yd-1 <IWI:)/Month $ 50.50
Statistical. Trends:
Waste Collected (Tons) 43,435 42,875 44,356 45.277 45,500
Residential 11,520 11.589 11 '746 11,968 11.970
4,686 4.813 4,872 4,745 4,7_50
util/sws/ov-r
24
J I
' i I
l I 1 I
1
i I
I ; I
!
i
l i !
i
' ~
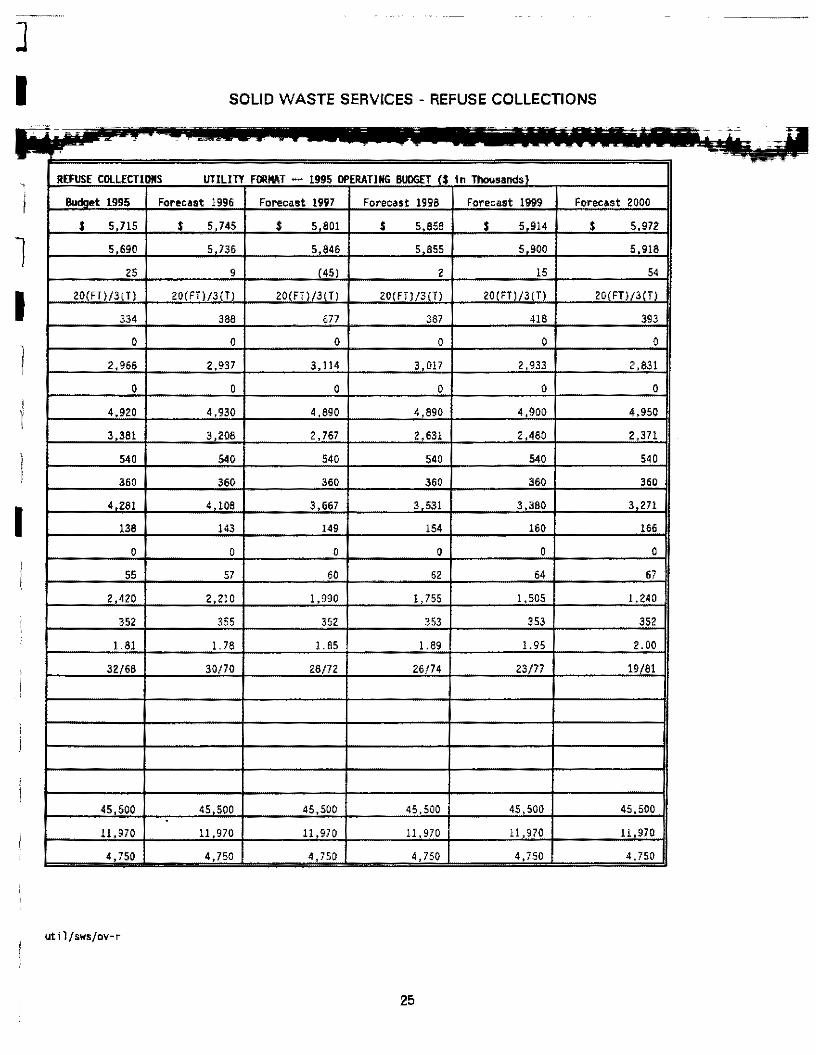
REFUSE COLL
Budoet 1995
$ 5,715
5,690
25
20(FTl/3(T)
334
0
2,966
0
4,920
3,381
540
360
4,281
138
0
55
2.420
352
1.81
32/68
45,500
11.970
4~
util/sws{ov-r
SOLID WASTE SERVICES - REFUSE COLLECTIONS
-,. - .
~~
11Tllll1 FOIU!AT -- 1995 HG BUDGE! CS in ,,
1996 1997 1998 1999 c. 2000
$ 5,745 $ 5,801 $ 5,656 $ 5,914 $ 5,972
5,736 5,846 5,855 5,900 5,918
9 (45) 2 15 54
20(FT)/3(T) 20(FTl/3(T) 20(FT)/3(T) 20(FT)/3(T) 20(FT)/3(T)
388 677 387 418 393
0 0 0 0 0
2.937 3.114 3.017 2,933 2.831
0 0 0 0 0
4.930 4.890 4,890 4.900 4.950
3,208 2,767 2,63! 2.480 2,3LJ
540 540 540 540 540
360 360 360 360 360
4,108 3,667 3,531 3,380 3,271
143 149 154 160 166
0 0 0 0 0
57 60 62 64 67
2.210 !,990 1.755 1,505 1,240
355 352 353 353 352
1.78 1 85 1.89 1.95 2.00
30/70 28/72 26174 23/77 19/81
45,500 45,500 45,500 45,500 45,500
11,970 11.970 11,970 11 '970 11,970
4.750 4, 4,750 4,750 4,750
25
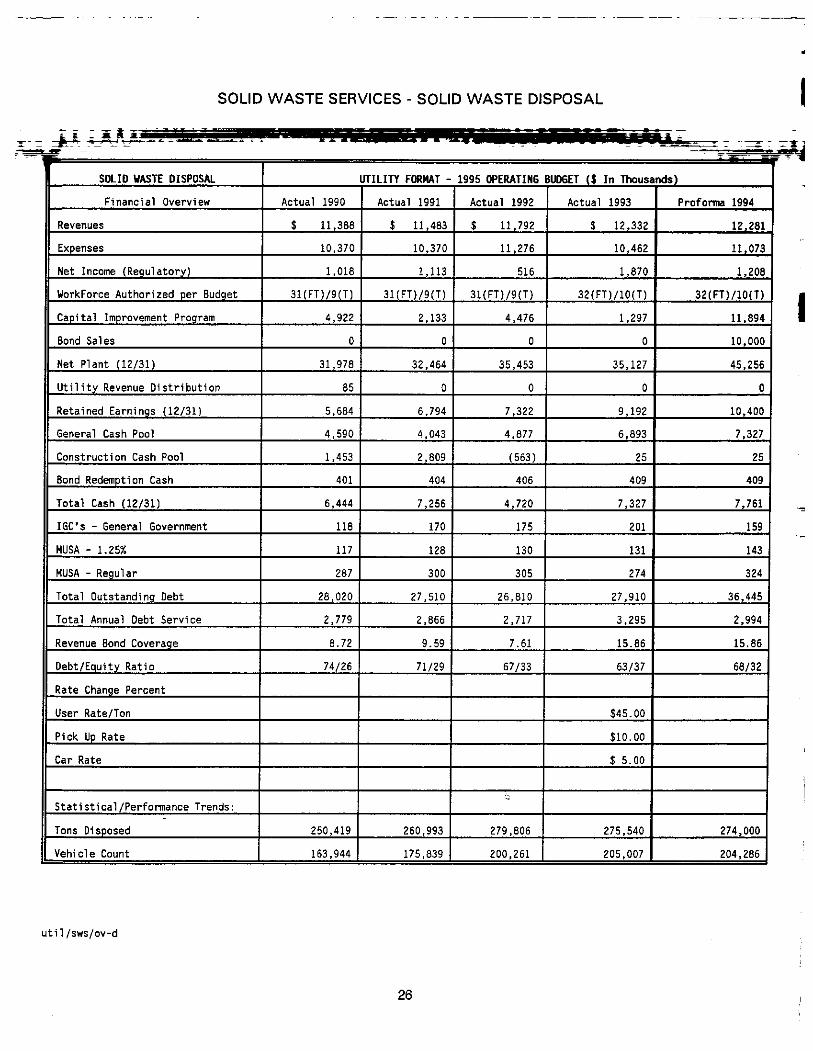
SOLID WASTE SERVICES- SOLID WASTE DISPOSAL I j,. - jic l .ll -• .EiJ &£L -. Ui IIIIJi I -_ ..... - *:0%] - -
- - .. SOLIO WASTE OISPOSAl UTILITY FORMAT - 1995 OPERATING BUOGET ($ In Thousands)
Financial Overview Actual 1990 Actual 1991 Actual 1992 Actual 1993 Profonna 1994
Revenues $ 11,366 $ 11,463 $ 11,792 $ 12,332 12 281
Expenses 10,370 10,370 11,276 10,462 11,073
Net Income (Regulatory) 1,018 1,113 516 1.870 1,208
Workforce Authorized per Budget 31 (FT)/9(T) 31 (FT)/9(T) 31(FT)/9(T) 32(FT)!l0(T) 32(FT)/10(T)
I Capita 1 Improvement Proqram 4,922 2,133 4,476 1,297 11,894
Bond Sales 0 0 0 0 10,000
Net Plant (12/31) 31,978 32,464 35,453 35,127 45,256
Utility Revenue Distribution 65 0 0 0 0
Retained Earnings (12/31) 5,664 6,794 7,322 9,192 10,400
General Cash Pool 4,590 4,043 4,877 6,693 7,327
Construction Cash Pool 1,453 2,609 ( 563) 25 25
Bond Redemption Cash 401 404 406 409 409
Total Cash (12/31) 6,444 7,256 4,720 7,327 7,761 -IGC's - General Government 116 170 175 201 159 -MUSA - 1.25% 117 126 130 131 143
MUSA - Regular 287 300 305 274 324
Total Outstanding Debt 26,020 27,510 26,610 27,910 36,445
Total Annual Debt Service 2,779 2,666 2,717 3,295 2,994
Revenue Bond Coveraqe 6.72 9.59 7.61 15.66 15.66
Debt/Eauitv Ratio 74/26 71/29 67/33 63/37 68!32
Rate Change Percent
User Rate/Ton $45.00
Pick Up Rate $10.00
Car Rate $ 5.00
i
! -Statistical/Performance Trends:
Tons Disposed 250,419 260,993 279,606 275,540 274 000
Vehicle Count 163,944 175,639 200,261 205,007 204,266
util/swsfov-d
26
]
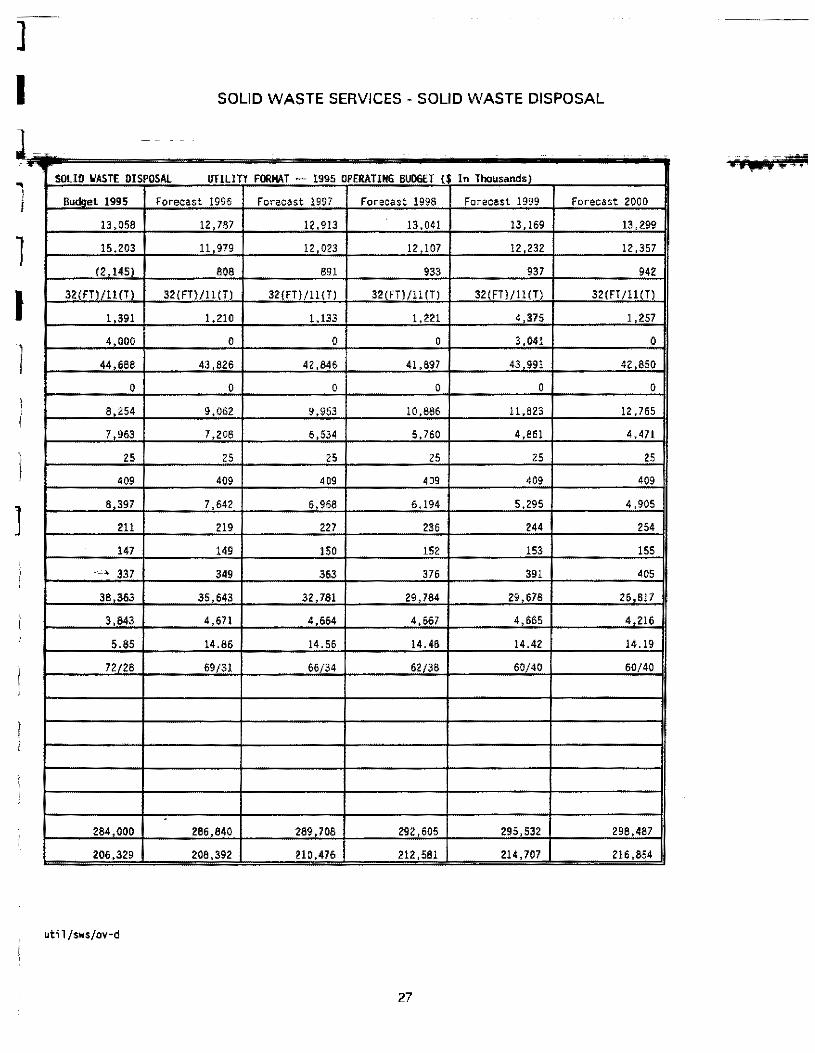
I SOLID WASTE SERVICES - SOLID WASTE DISPOSAL
l= -
.. SOLID WASTE DISPOSAl lfflLITY FORMAT -- 1995 OPERATING BUOGET ($ In Thousands!
' Budget 1995 i Forecast 1996 Forecast 1997 Forecast 1998 Forecast 1999 Forecast 2000 I 13,058 12 787 12,913 13,041 13,169 13,299
1 15,203 11,979 12 023 12,107 12 232 12 357
(2 145) 808 891 933 937 942
I 32(FT)/li(T) 32(FT)/ll(T) 32(FT)/ll(T) 32(FT)/11(T) 32(FT)/11(T) 32(FT/ll(T)
1,391 1,210 1,133 1,221 4 375 1 257
) 4,000 0 0 0 3,041 0
44 688 43 826 42,846 41,897 43,991 42,850
0 0 0 0 0 0 I 8 254 9,062 9,953 10,886 11,823 12,765 ' i
7 963 7,208 6,534 5,760 4,861 4,471
\ 25 25 \
25 25 25 25
I 409 409 409 409 409 409
J 8 397 7,642 6,968 6,194 5,295 4,905
211 219 227 236 244 254
147 149 150 !52 !53 155 j
' _, 337 349 363 376 391 405
I 38 363 35,643 32,781 29 784 29 678 26 817
! 3,843 4,671 4 664 4,667 4 665 4 216
I 5.85 14.86 14.56 14.48 14.42 14.19
72/ZS 69/31 66/34
I 62/38 60/40 60/40
! I
. 284 000 286,840 289,708 292,605 295,532 298,487
206,329 208,392 210,476 212,561 214,707 216 854
uti] /SWS/OV·d
27
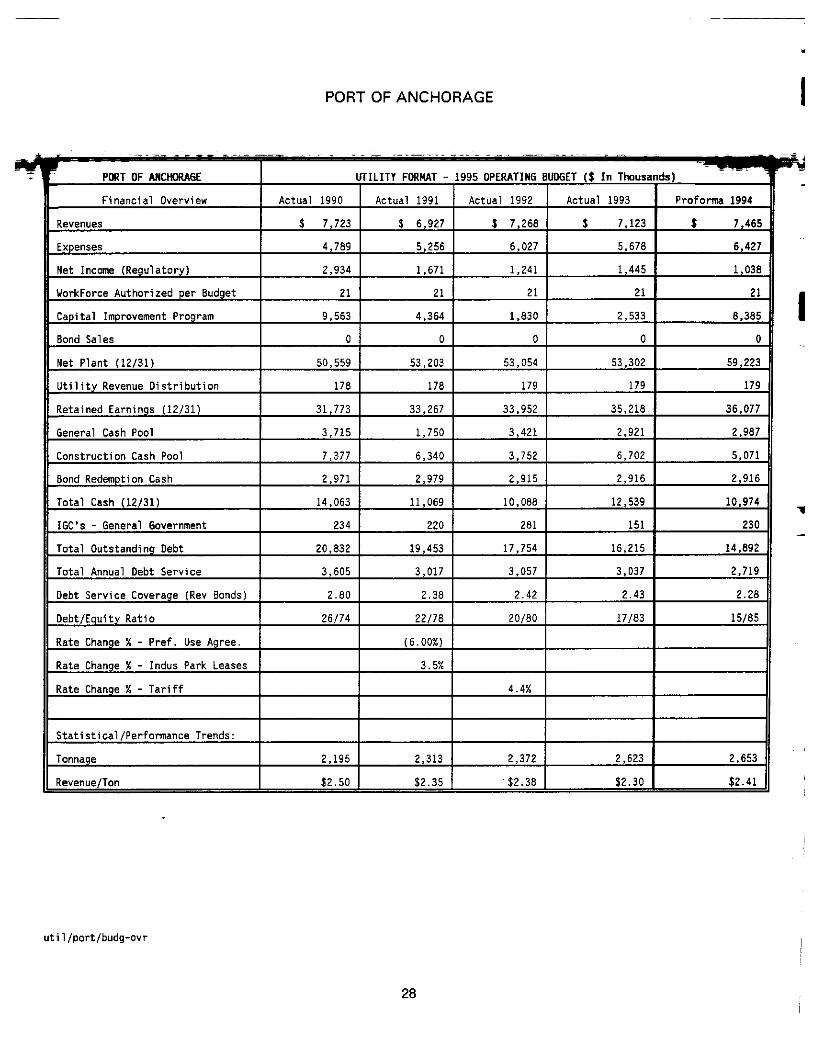
PORT OF ANCHORAGE I ---- - - - - - - - - - ·'-··- -_ --- - -- . - - - w • - F PORT OF AltCHORAGE UTILITY FORMAT - 1995 OPERATING BUDGET ($ - - "' - In Thousands) -
Financial Overview Actual 1990 Actua 1 1991 Actual 1992 Actual 1993 Proforma 1994
Revenues $ 7,723 $ 6,927 $ 7,268 $ 7,123 $ 7,465
Exoenses 4,789 5,256 6,027 5,678 6,427
Net Income (Reoulatorv) 2,934 1,671 1,241 1,445 1,038
WorkForce Authorized oer Budqet 21 21 21 21 21
I Capital I~provement Proqram 9,563 4,364 1,830 2,533 8,385
Bond Sales 0 0 0 0 0
Net Plant (12/31) 50,559 53.203 53,054 53,302 59,223
Utility Revenue Distribution 178 178 179 179 179
Retained Earninqs (12/31) 31,773 33,267 33,952 35,218 36,077
General Cash Pool 3,715 1,750 3,421 2,921 2,987
Construction Cash Pool 7,377 6,340 3,752 6,702 5,071
Bond Redem~tion Cash 2,971 2,979 2. 915 2,916 2,916
Total Cash (12/31) 14,063 II , 069 10,088 12,539 10,974
"" IGC's - General Government 234 220 281 151 230 ·-Total Outstanding Debt 20,832 19,453 17,754 16,215 14 892
Total Annual Debt Service 3,605 3,017 3,057 3. 037 2,719
Debt Service Coveraqe (Rev Bonds) 2.80 2.38 2.42 2.43 2.28
Debt/Eauitv Ratio 26/74 22/78 20/80 17/83 15/85
Rate Change%- Pref. Use Agree. (6.00%)
Rate Change % - Indus Park leases 3.5%
Rate Chance% - Tariff 4.4%
Statistical/Performance Trends:
Tonnage 2,195 2,313 2,372 2,623 2,653
Revenue/Ton $2.50 $2.35 $2.38 $2.30 $2.41
util/port/budg-ovr
28
]
I
~
' j
l I l I
I
. \ I '
I I
i '
i •
\
}
! I
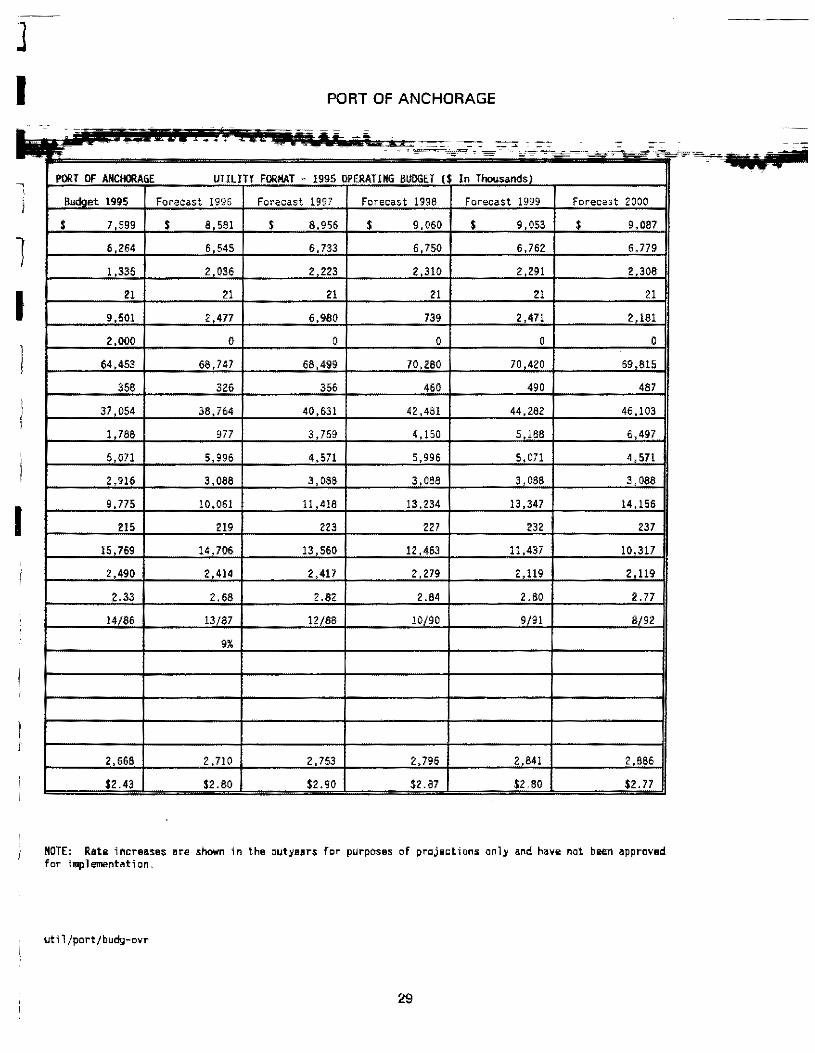
PORT OF ANCHORAGE
~ ~
'"'"', &io ,i -~ - - =:t .;~ - - ~
PORT OF ••~~· 'r UTil'TT FORMAT • 1995 BUDGET ( l In ,, ~w:lget 1995 1996 1997 1998 1999 2000
$ 7,599 $ 8,581 $ 8,956 $ 9,060 $ 9,053 $ 9,087
6,264 6,545 6,733 6,750 6,762 6,779
1,335 2,036 2,223 2,310 2,291 2,308
21 21 21 21 21 21
9,501 2,477 6,980 739 2,471 2,181
2,000 0 0 0 0 0
64,453 68,747 68.499 70.280 70,420 69.815
358 326 356 460 490 487
37.054 38.764 40.631 42.481 44.282 46.103
!.788 977 3,759 4,150 5.188 6.497
5,071 5,996 4,571 5 996 5,071 4,571
2.916 3,088 3,088 3,088 3.068 3.088
9,775 10,061 !1,418 13,234 13,347 14,156
215 219 223 227 232 237
15,769 !4,706 13,560 12,463 11,437 10,317
2,490 2,414 2,417 2,279 2,119 2,119
2.33 2.68 2.62 2.64 2.80 2.77
14/86 13/87 12/88 10/90 9/91 8/92
9%
2.668 2.710 2.753 2,796 2,841 2,886
.43 $2.80 $2.90 $2~87 $2~ $2.77
NOTE: Rate increases are shown in the outyears for purposes of projections only and have not been approved for implementation.
util/port/budg·ovr
29
.;.:;,; ~ ,_.,.-
MERRILL FIELD AIRPORT I -
::tZ ~ 1 MERRI(t F!EtO AIRPORT UTILITY FORMAT - 1995 OPERATING BUilGET IS In Thousands) -
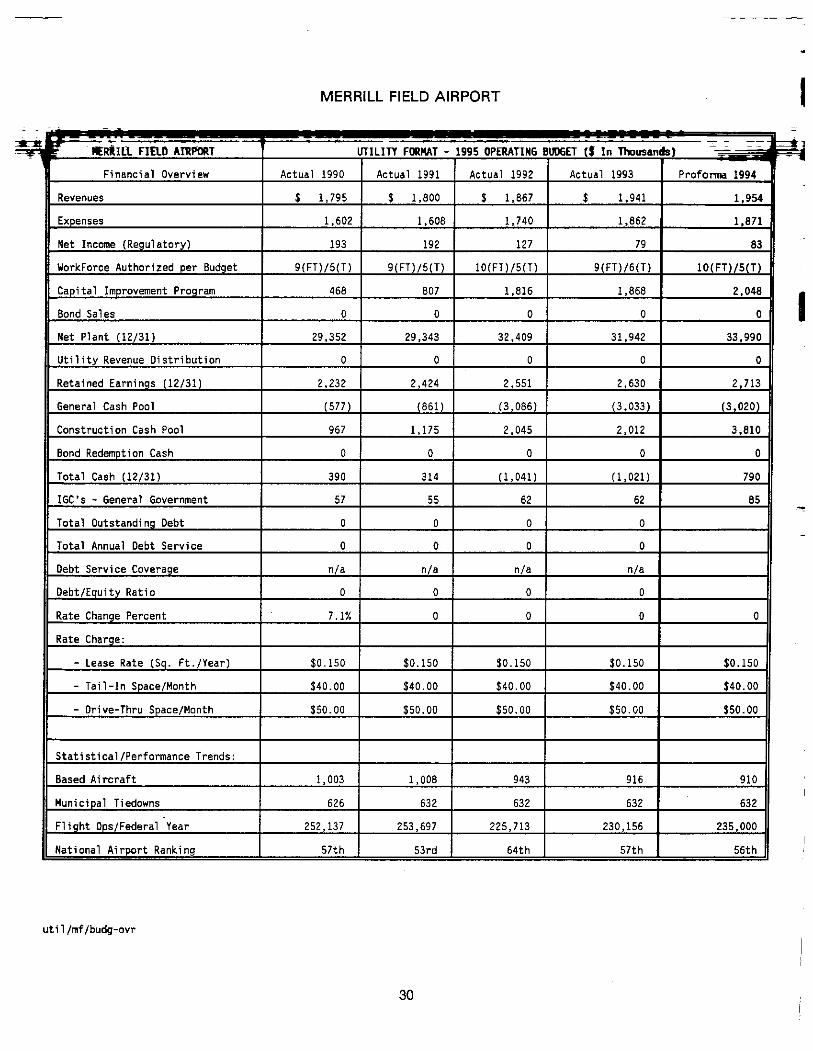
Financial Overview Actual 1990 Actual 1991 Actual 1992 Actual 1993 Profonna 1994 -
Revenues $ 1,795 $ 1,800 $ 1,867 $ 1,941 1,954
Expenses 1,602 1,608 1,740 1,862 1,871
Net Income (Regulatory) 193 192 127 79 83
WorkForce Authorized per Budget 9(FT)/5(T) 9(FT)/5(T) IO(FT)/5(T) 9(FT)/6(T) IO(FT)/5(T)
Capital Improvement Proqram 468 807 1,816 1,868 2,048
I Bond Sales 0 0 0 0 0
Net Plant (12/31) 29,352 29,343 32,409 31,942 33,990
Utility Revenue Distribution 0 0 0 0 0
Retained Earnings (12/31) 2,232 2,424 2,551 2,630 2,713
General Cash Pool (577) (861) (3,086) (3,033) (3,020)
Construction Cash Pool 967 1,175 2,045 2,012 3,810
Bond Redemption Cash 0 0 0 0 0
Total Cash (12/31) 390 314 (1,041) (1,021) 790
IGC's - General Government 57 55 62 62 85 ..., Total Outstandina Debt 0 0 0 0
-Total Annual Debt Service 0 0 0 0
Debt Service Coverage n/a n/a n/a n/a
Debt/Equity Ratio 0 0 0 0
Rate Change Percent 7.1% 0 0 0 0
Rate Charoe:
- lease Rate (Sq. Ft./Year) $0.150 $0.150 $0.150 $0.150 $0.150
-Tail-In Space/Month $40.00 $40.00 $40.00 $40.00 $40.00
- Drive-Thru Space/Month $50.00 $50.00 $50.00 $50.00 $50.00
Statistical/Performance Trends:
Based Aircraft 1,003 1,008 943 916 910 I
Municipal Tiedowns 626 632 632 632 632
Flight Cps/Federal Year 252,137 253,697 225,713 230,156 235,000 I
National Airport Ranking 57th 53rd 64th 57th 56th
util/mf/budg-ovr
30
J I I·~·· - -- ---= -;;:: ~ :::- -- -
MERRILL FIELD AIRPORT
- ---- -
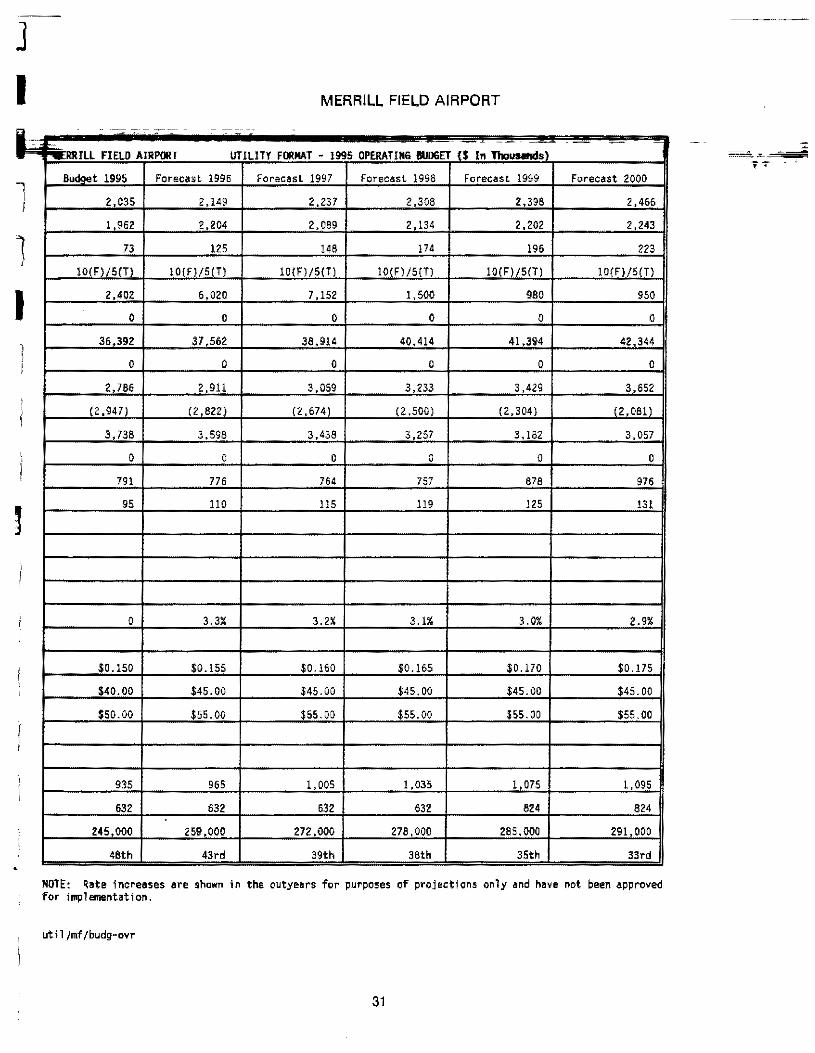
~ ~Ill FIELD AIRPORT UTILITY FORMAT - !995 OPERATIIIG I!IIOGET ($ In Tllotmllds)
Budoet 1995 Forecast 1996 Forecast 1997 forecast 1998 Forecast 1999 ', 2 035 2,149 2,237 2,308 2,398
' I 962 2,204 2,089 2,134 2,202
l '
73 125 148 174 196
!O(F)/S(T) !O(f)/S(T) 10(F)/5(T) 10(F)/5(T) 10(F)/5(T)
I 2,402 6,020 7,152 !,500 980
0 0 0 0 0
) 36,392 37,562 38,9!4 40,414 41,394
I 0 0 0 0 0 I 2 786 2,911 3,059 3,233 3,429
i (2,9471 (2 8221 (2,6741 (2,500) ( 2. 304) '
3,738 3,598 3,438 3 257 3,182
\ 0 0 0 0 0 •
! 791 776 764 757 878
~ 95 110 115 119 125
I
: 0 3.3% 3.2% 3.1% 3.0%
I $0.150 $0.155 $0.160 $0.165 $0.170 f $40.00 $45.00 $45.00 $45.00 $45.00
$50.00 $55.00 $55.00 $55.00 $55.00
I I
935 965 1,005 1,035 1,075
632 632 632 632 824
245 000 259 000 272,000 278' 000 285,000
48th 43rd 39th 38th 35th
Forecast 2000
2,466
2 243
223
!O(F)/5(T)
950
0
42,344
0
3,652
(2,081)
3,057
0
976
131
2.9%
$0.175
$45.00
$55.00
1,095
824
291 000
33rd
NOTE: Rate increases are shown in the outyears for purposes of projections only and have not been approved for implementation.
uti1/mf/budg-ovr
31


![Company Overview · 6. Financial Results [Consolidated] (Billions of yen) Company Overview FYE March 2011 FYE March 2012 FYE March 2013 Full year actual against (a) Full year actual](https://img.pdfslide.us/doc/110x75/5f4ac601db382e5424389f2a/company-overview-6-financial-results-consolidated-billions-of-yen-company-overview.jpg)