Embed Size (px)
Citation preview
SUMMARY & ANALYSIS
HIGHLIGHTS
Accountability Initiative, Centre for Policy Research, Dharam Marg, Chanakyapuri, New Delhi - 110021
₹ 48,853 crGoI allocations for Ministry of Health and Family Welfate (MoHFW) in FY 2017-18
₹ 26,691 crGoI allocations for NHM in FY 2017-18
National Health Mission (NHM) GoI, 2017-18
BUDGET BRIEFSVol 10/ Issue 6
Prepared by: Avani Kapur, [email protected] & Prerananandita Baisnab, [email protected]
The National Health Mission (NHM) is Government of India's (GoI) largest public health programme. It consists of two sub-missions: ■ National Rural Health Mission (NRHM), and ■ National Urban Health Mission (NUHM)
Using government data, this brief reports on: ■ Allocations, releases and expenditures for NHM■ NHM component-wise approvals and expenditures■ Outputs: Infrastructure and human resources ■ Outcomes: maternal and child health and Non-Communicable Disease (NCD) burden
Cost share and implementation: For FY 2017-18, the funding pattern between GoI and the states is in the ratio of 60:40 for all states except the Northeastern and three Himalayan states which is 90:10. The analysis does not include Union Territories (UTs).
Complete expenditure data is available for FY 2016-17.
■ Allocations for MoHFW increased from `39,688 crore in Financial Year (FY) 2016-17 to `48,853 crore in FY 2017-18. In FY 2017-18, GoI allocated `26,691 crore to NHM, an increase of 20 per cent from the previous year.
■ Fund for NHM are released by GoI to state treasuries who further release it to State Health Societies (SHSs). There are significant delays in the release of funds from the treasury to SHSs. In FY 2016-17, release of funds from treasury to SHS took around 5 months in Karnataka and Maharashtra.
■ Expenditure as a proportion of total budget available (including unspent balances from the previous year) was low. In FY 2016-17, only 57 per cent of total available budget was spent.
■ There are significant shortfalls in specialists in Community Health Centres (CHCs). As on March 2017, there was an 82 per cent shortfall in the number of specialists required across CHCs and 65 per cent of the sanctioned posts were vacant.
■ India has made progress in maternal and child health. As on September 2017, the Infant Mortality Rate (IMR) stood at 34 deaths per 1000 live births. There are however state differences. Among larger states, Madhya Pradesh, Odisha, Assam, Uttar Pradesh and Rajasthan records the highest number of child deaths in the country.

2 ACCOUNTABILITY INITIATIVE, INDIA
29,912 31,274 33,83239,688
48,853
18,206 18,609 19,122 22,19826,691
0
10,000
20,000
30,000
40,000
50,000
60,000
2013-14 2014-15 2015-16 2016-17 2017-18 BE
GoI allocations for MoHFW excluding AYUSH (in ` crore) GoI allocations for NHM (in ` crore)
TRENDS IN STATE-WISE APPROVALS, RELEASES, AND EXPENDITURESProposals and Approvals
■ Total approvals under NHM are based on Project Implementation Plans (PIPs) submitted by state governments and approved by GoI. These approved allocations are called the Record of Proceedings (ROPs). The final budget includes the total available resource envelope calculated on the basis of GoI's own funds, the proportional share of state releases, and unspent balances available with the states. Further, states may request additional funds through the submission of supplementary proposals.
TRENDS IN GOI ALLOCATIONS AND RELEASESAllocations
■ In May 2013, GoI launched the National Health Mission (NHM), aimed at achieving universal access to health care by strengthening health systems, institutions and capabilities. NHM consists of two sub-missions: a) the National Rural Health Mission (NRHM) launched in 2005 to provide accessible, affordable and quality health care in rural India ,and b) the National Urban Health Mission (NUHM), a sub-mission launched in 2013 for urban health.
■ Allocations for Ministry of Health and Family Welfare (MoHFW) excluding the Ministry of Ayurvedi Yoga and Naturopathy Unani, Siddha and Homoeopathy (MoAYUSH) increased from `39,688 crore in FY 2016-17 to `48,853 crore in FY 2017-18.
■ NHM is the single largest scheme run by MoHFW. Between FY 2016-17 and FY 2017-18, GoI allocations for MoHFW increased by 23 per cent from `39,688 crore to `48,853 crore. During the same period, however, share of NHM in total MoHFW allocations declined from 56 per cent to 55 per cent.
■ In FY 2017-18, GoI allocated `26,691 crore to NHM, an increase of 20 per cent from the previous year. A breakup of the total NHM budget indicates that this increase was driven primarily by an exponential 168 per cent increase in human resources for health and medical education including upgradation and strengthening of hospitals and medical colleges with human resources at the state and district level. NUHM budget also saw a 31 per cent increase during this same time period. In contrast, allocations for NRHM increased by only 9 per cent.
Source: India Expenditure Budget, Vol 2, Ministry of Health and Family Welfare. Available online at: http://indiabudget.nic.inNote: Figures are in rupees crore and are Revised Estimates (RE), except for FY 2017-18 which are Budget Estimates (BE). GoI allocations for MoHFW do not include allocations for AYUSH related services. Last accessed on 12 January 2018.
20% INCREASE IN GOI ALLOCATIONS FOR NHM BETWEEN 2016-17 AND 2017-18
BUDGET BRIEFS, NHM, GOI 2017-18, VOL10/ISSUE6 3
70 7383 89 82
72 7381 76 76 75 74 73
69
42
74
92 90 90 90 89 89 85 84 84 82 80 77 73 7064
82
0%
20%
40%
60%
80%
100%
Percentage of proposed funds approved in 2016-17 Percentage of proposed funds approved in 2017-18
Source: NHM, Record of Proceedings (ROPs) and Supplementary ROPs in FY 2016-17 and FY 2017-18 of all states. Available online at: http://nrhm.gov.in/nrhm-in-state/state-programimplementation-plans-pips.html. Last accessed on 12 January 2018.
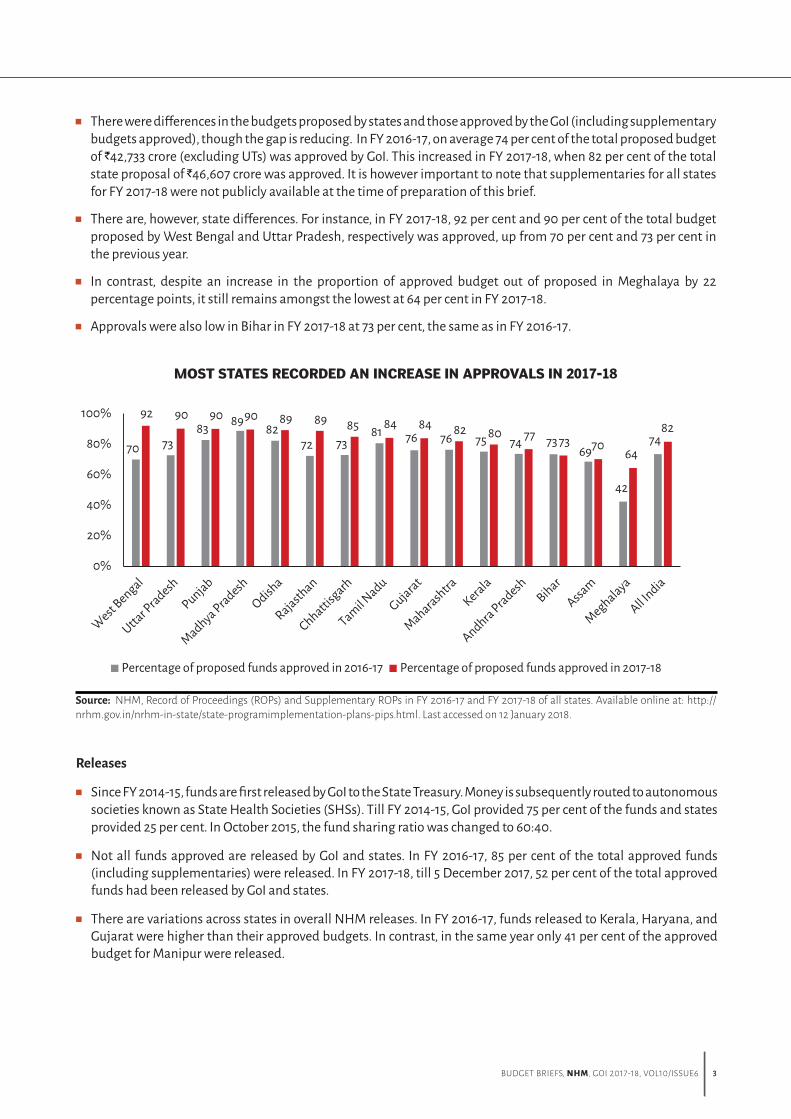
MOST STATES RECORDED AN INCREASE IN APPROVALS IN 2017-18
■ There were differences in the budgets proposed by states and those approved by the GoI (including supplementary budgets approved), though the gap is reducing. In FY 2016-17, on average 74 per cent of the total proposed budget of `42,733 crore (excluding UTs) was approved by GoI. This increased in FY 2017-18, when 82 per cent of the total state proposal of `46,607 crore was approved. It is however important to note that supplementaries for all states for FY 2017-18 were not publicly available at the time of preparation of this brief.
■ There are, however, state differences. For instance, in FY 2017-18, 92 per cent and 90 per cent of the total budget proposed by West Bengal and Uttar Pradesh, respectively was approved, up from 70 per cent and 73 per cent in the previous year.
■ In contrast, despite an increase in the proportion of approved budget out of proposed in Meghalaya by 22 percentage points, it still remains amongst the lowest at 64 per cent in FY 2017-18.
■ Approvals were also low in Bihar in FY 2017-18 at 73 per cent, the same as in FY 2016-17.
Releases
■ Since FY 2014-15, funds are first released by GoI to the State Treasury. Money is subsequently routed to autonomous societies known as State Health Societies (SHSs). Till FY 2014-15, GoI provided 75 per cent of the funds and states provided 25 per cent. In October 2015, the fund sharing ratio was changed to 60:40.
■ Not all funds approved are released by GoI and states. In FY 2016-17, 85 per cent of the total approved funds (including supplementaries) were released. In FY 2017-18, till 5 December 2017, 52 per cent of the total approved funds had been released by GoI and states.
■ There are variations across states in overall NHM releases. In FY 2016-17, funds released to Kerala, Haryana, and Gujarat were higher than their approved budgets. In contrast, in the same year only 41 per cent of the approved budget for Manipur were released.

4 ACCOUNTABILITY INITIATIVE, INDIA
100
148
9777 88 88
113 109
7283 77
106
73 79 79
41
8578 75 70 70 60 59 56 55 54 54 51 44 39 31 299
52
0%20%40%60%80%
100%120%140%160%
Percentage released out of approved in 2016-17 Percentage released out of approved in 2017-18
Source: (1) NHM, Record of Proceedings (ROPs) and Supplementary ROPs for FY 2016-17 and FY 2017-18 of all states. Available online at: http://nrhm.gov.in/nrhm-in-state/state-programimplementation-plans-pips.html. Last accessed on 12 January 2018. (2) RTI response from MoHFW. Release data for FY 2017-18 is available as on 5 December 2017.
IN 2017-18, STATES HAD RECEIVED ONLY 50% OF THEIR APPROVED BUDGETS BY THE 3RD QUARTER OF THE FINANCIAL YEAR
■ Data on timing of release of funds by GoI are only available for NRHM. According to the NRHM-Management Information System (MIS), there have been improvements in the pace of funds released by GoI for NRHM. In FY 2015-16, 41 per cent of GoI's allocations were released in the first quarter and 59 per cent in the last quarter of the financial year. This improved in FY 2016-17 as GoI released 65 per cent of its total allocations in the first two quarters of the financial year and only 20 per cent in the last quarter.
■ According to the NHM guidelines, upon receipt of funds by GoI, treasuries are meant to release funds to SHSs who in turn release funds to the districts within 15 days. There are, however, significant delays in the release of funds from the treasuries to the SHSs. In FY 2016-17, for instance, it took on average 146 days in Maharashtra and 155 days in Karnataka to transfer funds to the respective SHSs. In contrast, the fund release process was smoother in Gujarat and Madhya Pradesh. On average it took 39 and 24 days, respectively, for the treasuries to transfer funds to the SHSs.
■ There have, however, been improvements in most states (with the exception of Karnataka, Andhra Pradesh, Uttar Pradesh, and Haryana) in the fund release process compared to previous years. For instance, in FY 2014-15, on average it took 143 days for money to be credited from the treasury to the SHS in Bihar. This, however, decreased in FY 2016-17 to 97 days. Similarly, the average number of days in crediting funds to the SHS decreased significantly in Jharkhand from 140 days to 31 days.
■ The proportion of approved budgets released in FY 2017-18 has been variable. In FY 2017-18, as on 5 December 2017, Chhattisgarh, Kerala, Madhya Pradesh, and Andhra Pradesh had already released funds amounting to at least 70 per cent of their total approved budgets. In contrast, less than 50 per cent of the approved budgets had been released for Maharashtra, Assam, and Bihar. Release of funds was the lowest for Manipur. In FY 2017-18, till 5 December 2017, it had received only 9 per cent of its approved funds.

BUDGET BRIEFS, NHM, GOI 2017-18, VOL10/ISSUE6 5
Source: RTI response from MoHFW. Data is as on 5 December 2017.
IN 2016-17, RELEASE OF FUNDS FROM TREASURY TO SHS TOOK AROUND 5 MONTHS IN KARNATAKA AND MAHARASHTRA
125
162
86
143
45
84
27
100 83 70 7953
79
140
46
155 146127
97 9370 69 68 57 55 54 47 39 31 24
0
50
100
150
200
Delay in average number of days to credit from Treasury to SHSs in 2014-15Delay in average number of days to credit from Treasury to SHSs in 2016-17
Expenditures
■ Expenditure can be measured in two ways: (a) as a proportion of the approved budget or RoPs, and (b) as a proportion of the total available budget which takes into account the unspent balances from previous year.
■ In FY 2016-17, expenditure as a proportion of the total available budget (including committed liabilities) was only 57 per cent.
■ There are, however, state variations. In FY 2016-17, Gujarat, Kerala, and Tamil Nadu spent more than 80 per cent of their available budget. In contrast, expenditure was low in Telangana, Bihar, Uttar Pradesh, Nagaland, and Meghalaya at less than 50 per cent of the available budget.
10392 101
82 7990 90
99
73 6955
6852
77
51 4859
72
37
83 80 79 72 71 67 63 62 59 5845 45 45 43 42 40 36 33 30
0%20%40%60%80%
100%120%
Percentage expenditure out of approved budget in 2016-17Percentage expenditure out of total available budget (including unspent balaces) in 2016-17
Source: Financial Management Report (FMR) for FY 2016-17. Available online at: http://nhm.gov.in/nrhm-components/nhm-finance.html?layout=edit&id=544. Last accessed on 12 January 2018.
EXPENDITURE AS A PERCENTAGE OF AVAILABLE BUDGET WAS THE HIGHEST IN GUJARAT AND KERALA IN 2016-17
6 ACCOUNTABILITY INITIATIVE, INDIA
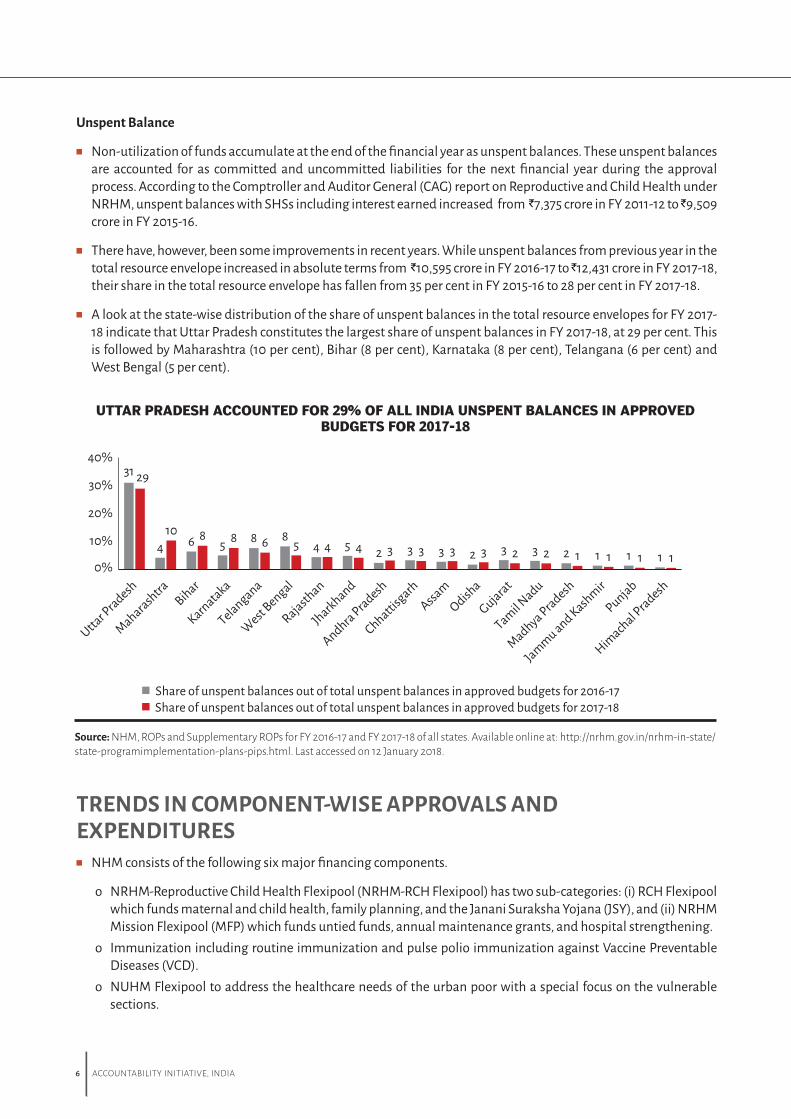
Unspent Balance
■ Non-utilization of funds accumulate at the end of the financial year as unspent balances. These unspent balances are accounted for as committed and uncommitted liabilities for the next financial year during the approval process. According to the Comptroller and Auditor General (CAG) report on Reproductive and Child Health under NRHM, unspent balances with SHSs including interest earned increased from `7,375 crore in FY 2011-12 to `9,509 crore in FY 2015-16.
■ There have, however, been some improvements in recent years. While unspent balances from previous year in the total resource envelope increased in absolute terms from `10,595 crore in FY 2016-17 to `12,431 crore in FY 2017-18, their share in the total resource envelope has fallen from 35 per cent in FY 2015-16 to 28 per cent in FY 2017-18.
■ A look at the state-wise distribution of the share of unspent balances in the total resource envelopes for FY 2017-18 indicate that Uttar Pradesh constitutes the largest share of unspent balances in FY 2017-18, at 29 per cent. This is followed by Maharashtra (10 per cent), Bihar (8 per cent), Karnataka (8 per cent), Telangana (6 per cent) and West Bengal (5 per cent).
Source: NHM, ROPs and Supplementary ROPs for FY 2016-17 and FY 2017-18 of all states. Available online at: http://nrhm.gov.in/nrhm-in-state/state-programimplementation-plans-pips.html. Last accessed on 12 January 2018.
UTTAR PRADESH ACCOUNTED FOR 29% OF ALL INDIA UNSPENT BALANCES IN APPROVED BUDGETS FOR 2017-18
31
4 6 5 8 84 5 2 3 3 2 3 3 2 1 1 1
29
10 8 8 6 5 4 4 3 3 3 3 2 2 1 1 1 10%
10%
20%
30%
40%
Share of unspent balances out of total unspent balances in approved budgets for 2016-17 Share of unspent balances out of total unspent balances in approved budgets for 2017-18
TRENDS IN COMPONENT-WISE APPROVALS AND EXPENDITURES■ NHM consists of the following six major financing components.
o NRHM-Reproductive Child Health Flexipool (NRHM-RCH Flexipool) has two sub-categories: (i) RCH Flexipool which funds maternal and child health, family planning, and the Janani Suraksha Yojana (JSY), and (ii) NRHM Mission Flexipool (MFP) which funds untied funds, annual maintenance grants, and hospital strengthening.
o Immunization including routine immunization and pulse polio immunization against Vaccine Preventable Diseases (VCD).
o NUHM Flexipool to address the healthcare needs of the urban poor with a special focus on the vulnerable sections.

BUDGET BRIEFS, NHM, GOI 2017-18, VOL10/ISSUE6 7
o Flexipool for Communicable Diseases includes programmes such as Revised National Tuberculosis Control Program (RNTCP), National Vector Borne Disease Control Programme (NVBDCP), Integrated Disease Surveillance Programme (IDSP), and National Leprosy Eradication Programme (NLEP).
o Flexipool for Non-Communicable Diseases includes programmes such as the National Programme for Control of Blindness (NPCB), National Programme for Prevention and Control of Cancer, Diabetes, Cardiovascular Diseases and Stroke (NPCDCS), National Tobacco Control Programme (NTCP), National Programme for the Healthcare of the Elderly (NPHCE), National Mental Health Programme (NMHP), and National Iodine Deficiency Disorders Control Programme (NIDDCP).
o Infrastructure Maintenance funds are allotted across various programmatic divisions of NHM.
■ NRHM-RCH Flexipool is the largest share of the total approved budget, accounting to 74 per cent of the total approved budget. Within this, the share of the approved budget for MFP increased significantly from 37 per cent in FY 2016-17 to 55 per cent in FY 2017-18. On the other hand, the share of RCH Flexipool declined from 36 per cent in FY 2016-17 to only 19 per cent in FY 2017-18.
Proposals Approved
■ A comparison of budgets proposed by states and final approval by GoI across components gives an indication of GoI priorities. Excluding UTs, in FY 2016-17, 84 per cent of budgets proposed under RCH Flexipool were approved. This increased to 87 per cent in FY 2017-18. Similarly, for MFP, the approval rate in FY 2017-18 had gone up from 64 per cent in FY 2016-17 to 76 per cent in FY 2017-18.
■ Approvals were highest for Infrastructure Maintenance in FY 2017-18 at 118 per cent, up from FY 2016-17, when only 88 per cent of total funds proposed were approved.
■ Interestingly, funds approved out of proposed budgets increased significantly for both Flexible Pools for Communicable and Non-Communicable Diseases by 12 percentage points and 14 percentage points, respectively, between FY 2016-17 and FY 2017-18. However, their share of the total funds approved fell by 1 percentage point during the same period.
Flexipool forCommunicable
Diseases
8877
8493
6456
71
118
89 87 8476 70 66
0%
20%
40%
60%
80%
100%
120%
InfrastructureMaintenance
RCH Flexipool
NUHM Flexipool
Percentage of proposed funds approved in 2016-17 Percentage of proposed funds approved in 2017-18
Immunization Mission Flexible
Pool (MFP)
Flexipool forNon
CommunicableDiseases
Source: NHM, ROPs and Supplementary ROPs for FY 2016-17 and FY 2017-18 of all states. Available online at: http://nrhm.gov.in/nrhm-in-state/state-programimplementation-plans-pips.html. Last accessed on 12 January 2018.
EXCEPT FOR IMMUNIZATION AND NUHM, ALL OTHER COMPONENTS RECEIVED A HIGHER APPROVAL IN 2017-18 COMPARED TO THE PREVIOUS YEAR

8 ACCOUNTABILITY INITIATIVE, INDIA
7465 69
78
5458 56 54 50
33
0%
20%
40%
60%
80%
100%
NRHM-RCHFlexipool
Immunization Flexipool forCommunicable
Diseases
NUHM Flexipool Flexipool for Non-Communicable
Diseases
Percentage spent out of approved budget in 2016-17Percentage spent out of budget available including unspent balance in 2016-17
Source: NHM Financial Management Report (FMR) for FY 2016-17. Available online at: http://nhm.gov.in/nrhm-components/nhm-finance.html?layout=edit&id=544 Last accessed on 12 January 2018.
Expenditures
■ The percentage spent out of the available budget was less than 60 per cent for all components. NRHM-RCH Flexipool had the highest utilization at 58 per cent in FY 2016-17, followed by Immunization and Flexipool for Communicable Diseases at 56 per cent and 54 per cent, respectively.
■ Expenditure as a proportion of available budgets was the lowest for the Flexipool for Non-Communicable Disease at 33 per cent.
TRENDS IN OUTPUTS Infrastructure
■ The rural healthcare system in India has three tiers: (a) Sub-Centres (SCs), (b) Primary Health Centres (PHCs), and (c) Community Health Centres (CHCs).
■ SCs are the focal point between the community and the primary healthcare system. According to the guidelines, one SC has to cater to 5,000 residents in the plains and 3,000 residents in hilly regions. Two community health workers staff each SC.
■ The PHC is the first point of contact with access to a qualified doctor in rural areas. PHCs also provide pharmaceutical and laboratory services. Each PHC is meant to serve 30,000 residents in the plains, and 20,000 residents in hilly, tribal, or difficult areas.
■ CHCs are larger referral centres for patients from PHCs requiring specialised medical services such as surgery, gynaecology, or paediatric services. There must be one CHC for every 1,00,000 residents in the plains, and one for every 80,000 residents in tribal and desert areas.
■ Between March 2016 and March 2017, the number of both SCs and PHCs increased by 1 per cent. The number of CHCs increased by 2 per cent. As on March 2017, there were 1,56,231 SCs; 25,650 PHCs, and 5,624 CHCs operating in the country.
LOW EXPENDITURES ACROSS COMPONENTS, LOWEST FOR NCD

BUDGET BRIEFS, NHM, GOI 2017-18, VOL10/ISSUE6 9
■ There are gaps in the quality of health infrastructure. The Indian Public Health Standards (IPHS) set measures for the quality of health infrastructure in all PHCs, CHCs, and government hospitals.
■ As on March 2017, there were only 11 per cent SCs, 16 per cent PHCs, and 16 per cent CHCs functioning as per IPHS norms. The number of functioning facilities as per IPHS norms dropped between March 2016 and March 2017. The highest fall was for CHCs, which fell from 27 per cent to 16 per cent.
■ As on March 2017, while Goa, Tripura, and Tamil Nadu had the highest percentage of CHCs functioning as per IPHS norms, no CHC met the IPHS standards in Chhattisgarh, Himachal Pradesh, Jharkhand, Karnataka, Manipur, Mizoram, Nagaland, Odisha, Sikkim, and Telangana.
BETWEEN MARCH 2016 AND MARCH 2017, ALL FUNCTIONING HEALTH FACILITIES FELL IN STANDARD AS PER IPHS NORMS
14 21 2711 16 16
0%20%40%60%80%
100%
Percentage of SCs functioning asper IPHS norms
Percentage of PHCs functioning asper IPHS norms
Percentage of CHCs functioning asper IPHS norms
As on March 2016 As on March 2017
Source: Rural Health Statistics (RHS) for 2016 and 2017. Available online at: https://nrhm-mis.nic.in/Pages/RHS2017.aspx?RootFolder=%2FRURAL%20HEALTH%20STATISTICS%2F%28A%29RHS%20-%202017&FolderCTID=0x01200057278FD1EC909F429B03E86C7A7C3F31&View={9029EB52-8EA2-4991-9611-FDF53C824827} Last accessed on 12 January 2018.
■ India is also lacking in health infrastructure in terms of hospital beds. As per the National Health Profile of India, the average population served by a government hospital bed has increased from 1,833 persons in 2015 to 2,046 persons in 2017.
■ Most major states have not been able to improve their capacity in the last two years. In fact, for Maharashtra the number of people served per hospital bed increased from 715 persons per bed to 2,306 persons per bed. The bed population ratio is the highest in Bihar. As on March 2017, Bihar had an average of 1 bed for 8,645 persons.
■ Kerala, Tamil Nadu, Karnataka, and West Bengal are amongst the only major states serving around 1,000 persons per bed.
Human Resources
■ On average, in FY 2016-17, 12 per cent of the total NHM budget was allocated for Human Resources (HR). Expenditure, however, was low at 68 per cent out of total HR allocations.
■ There were state variations. HR constituted over 20 per cent of the budget in Nagaland and Assam in FY 2016-17. In contrast, the share of the total budget going for HR was low in Rajasthan (5 per cent) and Uttar Pradesh (7 per cent).

10 ACCOUNTABILITY INITIATIVE, INDIA
■ Despite the low share of budget going for HR in Rajasthan, expenditure in Rajasthan was also amongst the lowest with only 28 per cent of the available budget spent in FY 2016-17. In contrast, expenditure on HR out of available budget was high in Tamil Nadu and Odisha at 92 per cent and 89 per cent, respectively.
15 9 12 11 12 19 229 13 7 9
19 14 12 17 2414
5
92 89 83 81 78 77 77 75 73 67 66 65 64 6254
47 4328
0%
20%
40%
60%
80%
100%
Percentage share of HR budget out of total NHM budget in 2016-17
Percentage spent out of total available HR budget in 2016-17
68% OF ALL INDIA HR BUDGET SPENT IN 2016-17
Source: Financial Management Report (FMR) for FY 2016-17. Available online at: http://nhm.gov.in/nrhm-components/nhm-finance.html?layout=edit&id=544. Last accessed on 12 January 2018.
■ Between March 2016 and March 2017, the number of ANMs in SCs and doctors in PHCs increased by 3 per cent and 2 per cent, respectively. Consequently, as on March 2017, there were no shortfalls in these positions.
■ A number of sanctioned posts, however, were vacant. As on March 2017, 14 per cent of the sanctioned posts for ANMs at SCs and 20 per cent for doctors at PHCs were vacant.
■ Specialists at Community Health Centres (CHCs) comprise surgeons, paediatricians, physicians, obstetricians, and gynaecologists. Despite an increase in the number of specialists in the last year, the shortfall of specialists in CHCs continues to be high. As on March 2017, there was an 82 per cent shortfall in the number of specialists required across CHCs and 65 per cent of the sanctioned posts were vacant.

BUDGET BRIEFS, NHM, GOI 2017-18, VOL10/ISSUE6 11
■ As on March 2017, 97 per cent of CHCs in Himachal Pradesh and 96 per cent in Haryana, Kerala, and Manipur were functioning without specialists. Shortfalls were lower in Karnataka and Jammu and Kashmir at 40 per cent and 43 per cent, respectively.
■ Shortfalls aside, a number of states had a large number of vacancies in sanctioned posts. Vacancies were high in Gujarat, West Bengal, Jharkhand, Haryana, and Uttar Pradesh.
82% SHORTFALL OF SPECIALISTS OUT OF REQUIRED AS ON MARCH 2017
97 96 96 96 92 90 86 85 85 79 7865 55
43 40
82
0%20%40%60%80%
100%120%
Percentage shortfall of specialists out of required at CHCs as on March 2017
Source: Rural Health Statistics (RHS) 2017. Available online at: https://nrhm-mis.nic.in/Pages/RHS2017.aspx?RootFolder=%2FRURAL%20HEALTH%20STATISTICS%2F%28A%29RHS%20-%202017&FolderCTID=0x01200057278FD1EC909F429B03E86C7A7C3F31&View={9029EB52-8EA2-4991-9611-FDF53C824827} Last accessed on 12 January 2018.
20% OF POSTS FOR DOCTORS IN PHCS AND 65% OF POSTS FOR SPECIALIST IN CHCS WERE VACANT AS ON MARCH 2017
Source: Rural Health Statistics (RHS) 2017. Available online at: https://nrhm-mis.nic.in/Pages/RHS2017.aspx?RootFolder=%2FRURAL%20HEALTH%20STATISTICS%2F%28A%29RHS%20-%202017&FolderCTID=0x01200057278FD1EC909F429B03E86C7A7C3F31&View={9029EB52-8EA2-4991-9611-FDF53C824827} Last accessed on 12 January 2018.
0
14
0
20
82
65
0%
20%
40%
60%
80%
100%
Percentage shortfall of
Percentage shortfall of
Percentage shortfall of
HW/ANM out ofrequired at SCs
Percentage vacancy Percentage vacancy Percentage vacancy of HW/ANMs
out of sanctioned posts at SCs
doctors out ofrequired at PHCs
of doctors out ofsanctioned
posts at PHCs specialists out ofrequired at CHCs
of specialists out of sanctioned
posts at CHCs

12 ACCOUNTABILITY INITIATIVE, INDIA
■ India has made progress in maternal and child health indicators. As on September 2017, the Infant Mortality Rate (IMR) stood at 34 child deaths per 1,000 live births. Whereas as per 2011-2013 record, Maternal Mortality Rate (MMR) stood at 167 deaths per 1,00,000 live births.
■ There were, however, state differences. Among the larger states, Madhya Pradesh, Odisha, Assam, Uttar Pradesh, and Rajasthan recorded the highest number of child deaths in the country, above 40. In contrast, IMR was lower in Punjab and Maharashtra at 21 and 19, respectively. Kerala and Manipur had amongst the lowest number of infant deaths per 1,000 live births at 10 and 11, respectively.
TRENDS IN OUTCOMESMaternal and Child Health
■ Maternal and child health accounted for 13 per cent of the total NHM available budget (including unspent from the previous year) in FY 2016-17 and 71 per cent of this budget was spent. There were, however, state differences.
■ The share of NHM available budget for maternal and child health is highest for Madhya Pradesh and West Bengal at 19 per cent of its total NHM budget. Most Northeastern states have a lower share of budget going for maternal and child health.
■ There were variations in the percentage of available budget for maternal and child health spent across states. Expenditures were less than 50 per cent for Maharashtra, Telangana, Mizoram and Nagaland. Highest expenditures were recorded in Punjab, Gujarat, Jammu and Kashmir and Andhra Pradesh.
8 8 12 13 11 178
17 19 187
194 10 14 11 9 9
104 96 9684 84 82 81 80 79 75 69 68 66 63 62
51 46 46
0%20%40%60%80%
100%120%
Percentage share of maternal and child health budget out of total NHM budget in 2016-17
Percentage spent out of maternal and child health available budget (including unspent balances) in 2016-17
71% OF MATERNAL & CHILD HEALTH BUDGET SPENT IN 2016-17
Source: Financial Management Report (FMR) for FY 2016-17. Available online at: http://nhm.gov.in/nrhm-components/nhm-finance.html?layout=edit&id=544. Last accessed on 12 January 2018.
BUDGET BRIEFS, NHM, GOI 2017-18, VOL10/ISSUE6 13
65 57 60 51
75
49 53 52 48 51 5065 63
4859 61 59
84 72 68 61 55 54 5040 37 32 30
22 19 17 10 8 60%
20%40%60%80%
100%
Percentage of NCD disease burden out of total disease burden from 1990-2016Percentage spent out of total budget for NCD in 2016-17
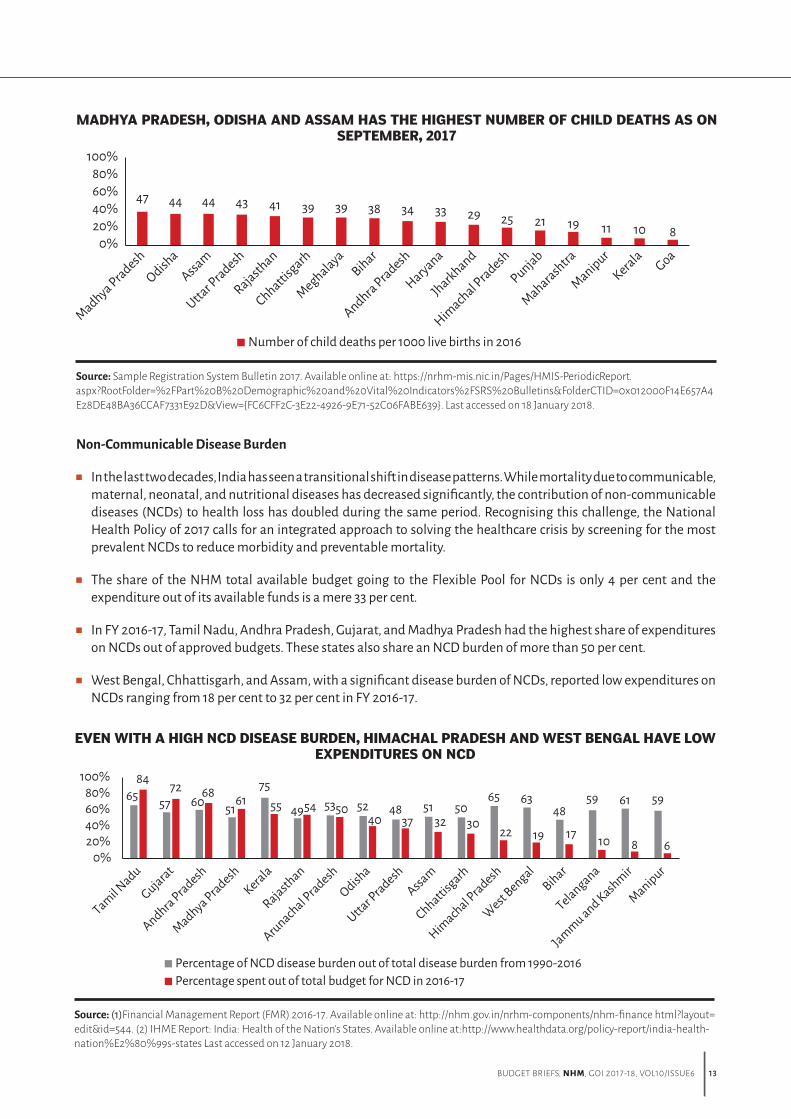
EVEN WITH A HIGH NCD DISEASE BURDEN, HIMACHAL PRADESH AND WEST BENGAL HAVE LOW EXPENDITURES ON NCD
Source: (1)Financial Management Report (FMR) 2016-17. Available online at: http://nhm.gov.in/nrhm-components/nhm-finance html?layout= edit&id=544. (2) IHME Report: India: Health of the Nation’s States. Available online at:http://www.healthdata.org/policy-report/india-health-nation%E2%80%99s-states Last accessed on 12 January 2018.
Non-Communicable Disease Burden
■ In the last two decades, India has seen a transitional shift in disease patterns. While mortality due to communicable, maternal, neonatal, and nutritional diseases has decreased significantly, the contribution of non-communicable diseases (NCDs) to health loss has doubled during the same period. Recognising this challenge, the National Health Policy of 2017 calls for an integrated approach to solving the healthcare crisis by screening for the most prevalent NCDs to reduce morbidity and preventable mortality.
■ The share of the NHM total available budget going to the Flexible Pool for NCDs is only 4 per cent and the expenditure out of its available funds is a mere 33 per cent.
■ In FY 2016-17, Tamil Nadu, Andhra Pradesh, Gujarat, and Madhya Pradesh had the highest share of expenditures on NCDs out of approved budgets. These states also share an NCD burden of more than 50 per cent.
■ West Bengal, Chhattisgarh, and Assam, with a significant disease burden of NCDs, reported low expenditures on NCDs ranging from 18 per cent to 32 per cent in FY 2016-17.
47 44 44 43 41 39 39 38 34 33 29 25 21 19 11 10 80%
20%40%60%80%
100%
Number of child deaths per 1000 live births in 2016
MADHYA PRADESH, ODISHA AND ASSAM HAS THE HIGHEST NUMBER OF CHILD DEATHS AS ON SEPTEMBER, 2017
Source: Sample Registration System Bulletin 2017. Available online at: https://nrhm-mis.nic.in/Pages/HMIS-PeriodicReport.aspx?RootFolder=%2FPart%20B%20Demographic%20and%20Vital%20Indicators%2FSRS%20Bulletins&FolderCTID=0x012000F14E657A4E28DE48BA36CCAF7331E92D&View={FC6CFF2C-3E22-4926-9E71-52C06FABE639}. Last accessed on 18 January 2018.