Embed Size (px)
Citation preview

BUDGET BOOK 2017-2018

5500 Campanile DriveSan Diego, CA 92182 • 8000Tel: 619 594 • 5201Fax: 619 594 • 8894
Office of the PresidentSan Diego State University
THE CALIFORNIA STATE UNIVERSITY • BAKERSFIELD • CHANNEL ISLANDS • CHICO • DOMINGUEZ HILLS • EAST BAY • FRESNO • FULLERTON • HUMBOLDT • LONG BEACH • LOS ANGELES MARITIME ACADEMY • MONTEREY BAY • NORTHRIDGE • POMONA • SACRAMENTO • SAN BERNARDINO • SAN DIEGO • SAN FRANCISCO • SAN JOSE • SAN LUIS OBISPO • SAN MARCOS • SONOMA • STANISLAUS
September 30, 2017
Members of the university community:
San Diego State University is committed to providing accurate and useful information about our budget. As part of this effort, please find enclosed the 2017-18 university budget totaling $894.2 million. You also may view this document at: http://bfa.sdsu.edu/financial/budget/genfund.aspx
This budget is the first to incorporate our university community’s shared goals as expressed in our strategic plan, “Building on Excellence.”
The university budget as of July 1, 2017, includes the following funds:
University Operating Fund: The University Operating Fund budget is $415.8 million and is comprised of tuition and fee revenues of $166.5 million and the state appropriation of $190.1 million. The University Operating Fund budget also includes $59.2 million in departmental fee revenues (including the new Student Success fee) and cost recovery from other funds, auxiliaries and external entities. Tuition fee revenues reflect tuition fee discounts (SUG) and an increase of 100 FTES in the resident enrollment target. The state appropriation increased by $10.6 million from last fiscal year, reducing the decline since 2007-08 to $31.2 million.
Designated Funds: These funds total $119.7 million and include program funds for student housing, parking, continuing education, lottery, enterprise funds, athletics self-support, special projects and federal work study.
Auxiliary Organization Funds: The combined budget includes four campus auxiliary organizations with a combined total budget of $305.7 million: Associated Students with revenue of $25.8 million, Aztec Shops Inc. with $67.6 million, The Campanile Foundation with $45.1 million and the SDSU Research Foundation with an operating budget of $30.0 million and restricted funds (including grants and contracts) of $137.2 million.
This 2017-18 budget continues the university’s ongoing commitment to maintain the highest level of support for our academic and co-curricular programs despite ongoing state budget challenges. Budget changes resulting from state actions subsequent to July 1 are not included. For updates on those, watch for University Update messages and visit their website links.
I would like to express my appreciation to the campus community for their ongoing collaboration in the development of the University Operating Fund budget.
With best regards,
Sally RoushPresident

San Diego State University2017/2018 BudgetTable of Contents
PAGE
UNIVERSITY BUDGET 1
UNIVERSITY BUDGET (INCLUDING AUXILIARY ORGANIZATIONS) Chart 3
BUDGET CHARTS/GRAPHS
UNIVERSITY BUDGET (EXCLUDING AUXILIARY ORGANIZATIONS) Chart 5
UNIVERSITY BUDGET EXPENDITURES BY DIVISION Chart 7
UNIVERSITY BUDGET BY CATEGORY OF EXPENSE Chart 9
UNIVERSITY OPERATING FUND (UOF) 11
UOF BUDGET Table 13
UOF BUDGET EXPENDITURES BY DIVISION Chart 15
UOF BUDGET BY CATEGORY OF EXPENSE Chart 17
UOF EXPENSE/BUDGET SUMMARY Table 19
OFFICE OF THE PRESIDENT/KPBS 21
ACADEMIC AFFAIRS 27
ATHLETICS 49
BUSINESS & FINANCIAL AFFAIRS 55
STUDENT AFFAIRS 73
UNIVERSITY RELATIONS & DEVELOPMENT 83
INSTITUTIONAL 89
OTHER FUNDS
LOTTERY 93
CONTINUING EDUCATION 93
HOUSING 93
PARKING FEES 94
PARKING FINES AND FORFEITURES 94
ENTERPRISE FUNDS 94
INTERNAL SERVICE FUNDS 94
ATHLETICS SELF-SUPPORT REVENUES 95
SPECIAL PROJECTS 95
FEDERAL WORK STUDY 95
SUPPLEMENTAL INFORMATION
INDIV. ENROLLMENT (HEADCOUNT), FTES, AND AVG STUDENT LOAD Chart 97
FINANCIAL AID & SCHOLARSHIPS SOURCES BY PROGRAM Chart 99
FINANCIAL AID & SCHOLARSHIPS USES Chart 101
AUXILIARY ORGANIZATIONS
SDSU RESEARCH FOUNDATION 103
ASSOCIATED STUDENTS 105
AZTEC SHOPS 107
THE CAMPANILE FOUNDATION 109
UNIVERSITY FUNDS HELD AT SDSU RESEARCH FOUNDATION 111

University Budget Overview For Fiscal Year 2017/18, San Diego State University (SDSU) was allocated $190.1 million in state General Fund appropriation and is budgeted to collect an additional $166.5 million from tuition (net of tuition fee discounts) and fees and $59.2 million from revenue-based fees (including the Student Success fee) and cost recovery revenues for a total University Operating Fund budget of $415.8 million. Throughout the year, budget adjustments may occur due to changes in enrollment and the resulting changes in fee revenue, changes in revenue-based and cost recovery revenues, mid-year changes in appropriations, and supplemental allocations. Other dedicated revenues include $45.1 million from the Housing fund, $14.2 million from the Continuing Education fund, $2.5 million from the Lottery fund, $8.0 million from Parking Fees, Fines & Forfeitures funds, $38.2 million from Athletics Self-Support (IRA fees, ticket sales, corporate sponsorships and private donations), $1.3 million from Special Projects (conference and project revenues), $9.2 million from Enterprise (testing and career service revenues, etc.) and Internal Service (network and telecommunications revenues, etc.) funds and $1.2 million from Federal Work Study. Additional information about these revenues can be found in the “Other Funds” tab. Additionally, SDSU has four non-profit auxiliary corporations with budgets as follows: Associated Students, $25.8 million; Aztec Shops, $67.6 million; The Campanile Foundation, $45.1 million; and the SDSU Research Foundation, with an operating budget of $30.0 million and restricted funds (including grants and contracts) of $137.2 million. Additional budget information can be found in the “Auxiliary Organizations” tab. SDSU administers Federal, State and University Financial Aid & Scholarship funds of approximately $147.2 million in student awards. This includes amounts applied to tuition, fees, housing and $53 million in direct disbursements to students. Divisions: The President is the University’s Chief Executive Officer. The Office of the President, and KPBS have been combined for the budget presentation. KPBS operates KPBS TV and Radio, San Diego’s public broadcasting stations, and reports to the President’s Office. Although KPBS receives state funded support, the majority of its budget comes from self-generated sources administered by the SDSU Research Foundation, such as grants, membership fees and private donations. Academic Affairs is responsible for all instructional activity and academic support areas such as the library, enrollment services, instructional technology, graduate/research programs, and extended education programs for both the San Diego campus and the Imperial Valley campus.
1

University Budget
Business & Financial Affairs is responsible for the financial, business and facility resources of the campus and provides support services including accounting and budgeting, procurement, human resources, public safety, parking services, communications, computing services, environmental health, construction, facilities, and student housing. Student Affairs is responsible for student support services including student life and leadership, financial aid and scholarships, career services, and residential education. Student health care is paid for by dedicated, mandatory health services and health facilities fees. University Relations and Development is responsible for the university’s comprehensive campaign, fund raising, marketing and communications, alumni relations, media and public relations, annual giving, and governmental affairs. Athletics is responsible for Division I-A athletic programs. A significant portion of the athletic budget comes from self-generated funds such as revenue from ticket sales, corporate sponsorships, and private donations. Auxiliaries: Associated Students manages programs and funds for the benefit of the university related to various student organizations, activities, and facilities including the Aztec Student Union, Aztec Recreation Center and Viejas Arena.
Aztec Shops manages commercial operations including food services, the campus bookstore, and some select housing properties for the benefit of the university.
The Campanile Foundation receives, acknowledges, and manages contributions made to the university. In addition, The Campanile Foundation is responsible for management of the university’s endowment of approximately $262 million.
SDSU Research Foundation manages funds related to the university’s grants and contracts from federal and other sources. The SDSU Research Foundation also holds private contributions made to the public broadcasting stations, and provides financial support services to some university self-support entities.
San Diego State University is committed to providing the university community with accurate and useful information about our budget. Please address any questions regarding the Fiscal Year 2017/18 Budget, or suggestions for improving this document, to the University Budget and Finance Office at 619-594-6602 or e-mail: [email protected].
2
Enterprise/Internal Service Funds$9.2 M1.0%
Designated Revenues (3)$39.5 M4.4%
Lottery$2.5 M0.3%
Housing Fund (1)$45.1 M5.0%
Parking Fees / Fines & Forfeitures (1)
$8.0 M0.9%
Continuing Education Fund (1)$14.2 M1.6%
SDSURF General Fund$30.0 M3.4%
SDSURF Restricted (1)(5)$137.2 M15.3%
The Campanile Foundation (1)(6)
$45.1 M5.0%Aztec Shops (1)
$67.6 M7.6%
Associated Students (1)$25.8 M2.9%
Financial Aid & Scholarships Disbursements to Students (7)
$53.0 M5.9%
Federal Work Study (8)$1.2 M0.1%
State Appropriation$190.1 M21.3%
Tuition & Fees (2)$166.5 M18.6%
Student Success Fee$13.0 M1.5%
Revenue‐based / Cost Recovery (4)$46.2 M5.2%
Total University Operating
Fund$415.8M46.6%
SAN DIEGO STATE UNIVERSITYUniversity Budget (Including Auxiliary Organizations)
2017/18
$894.2 M
(1) Net of reimbursements to the University Operating Fund (included in Cost Recovery) and Enterprise/Internal Service Funds(2) Includes basic & non‐resident tuition and institutional fees (such as application and late fees); excludes tuition fee discounts (SUG waivers)(3) Includes Special Projects (such as conferences) and Athletics Self‐Support (such as IRA fees, ticket sales, corporate sponsorships and private donations)(4) Departmental revenues and cost recovery from Housing, Parking, Continued Education, Auxiliaries and external entities(5) Includes KPBS self‐generated sources (such as grants, membership fees and private donations)(6) Excludes Athletics Grant‐in‐Aid (included in Athletics Self‐Support)(7) Excludes loans(8) Excludes campus match
3

Enterprise/Internal Service Funds
$9.2 M1.6%
Designated Revenues (3)$39.5 M6.7%
Lottery$2.5 M0.4%
Continuing Education Fund (1)$14.2 M2.4%
Housing Fund (1)$45.1 M7.7%
Parking Fees / Fines & Forfeitures (1)
$8.0 M1.4%
Financial Aid & Scholarships
Disbursements to Students (5)$53.0 M8.9%
Federal Work Study (6)$1.2 M0.2%
Tuition & Fees (2)$166.5 M28.3%
State Appropriation$190.1 M32.3%
Student Success Fee$13.0 M2.2%
Revenue‐based / Cost Recovery (4)
$46.2 M7.9%
SAN DIEGO STATE UNIVERSITYUniversity Budget (Excluding Auxiliaries)
2017/18
$588.5 M
Total University Operating Fund
$415.8 M70.7%
(1) Net of reimbursements to the University Operating Fund (included in Cost Recovery) and Internal Service Funds(2) Includes basic & non‐resident tuition and institutional fees (such as application and late fees); excludes tuition fee discounts (SUG waivers)(3) Includes Special Projects (such as conferences) and Athletics Self‐Support (such as ticket sales, corporate sponsorships and private donations)(4) Departmental revenues and cost recovery from Housing, Parking, Continued Education, Auxiliaries and external entities(5) Excludes loans(6) Excludes campus match
5

President's Office/KPBS$2.6 M0.4%
Academic Affairs$265.1 M45.0%
Athletics (4)$46.9 M8.0%
Business & Financial Affairs$54.5 M9.3%
Student Affairs (3)$31.8 M5.4%
University Relations & Development
$8.6 M1.5%
Institutional (2)$47.1 M8.0%
Federal Work Study (6)$1.2 M0.2%
Financial Aid & Scholarships Disbursements to Students (5)
$53.0 M9.0%
Housing, Parking, Continued Education Funds
$67.3 M11.4%
Enterprise/Internal Service Funds$9.2 M1.6%
Special Projects$1.2 M0.2%
SAN DIEGO STATE UNIVERSITYUniversity Budget (Excluding Auxiliaries)
Expenditures by Division (1)
2017/18
$588.5 M
(1) Divisional totals include University Operating Fund (including Cost Recovery & Revenue‐based) and Lottery budgets(2) Includes institutional utilities, insurance premiums, unallocated compensation and University Operating Fund financial aid (Educational Opportunity Program, Grad Equity Grant, etc.); excludes State University Grant (tuition fee discount)(3) Includes Student Health Services revenues (4) Includes Self‐Support revenues and Grant‐in‐Aid(5) Excludes loans(6) Excludes campus match
7

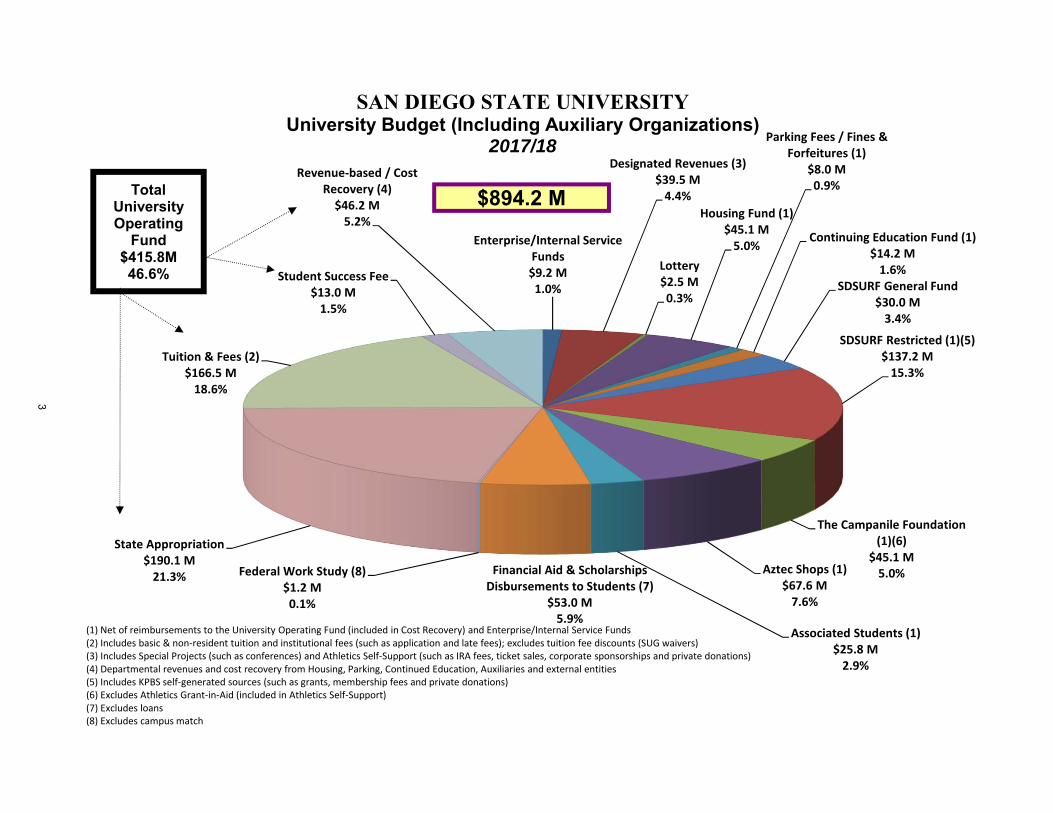
Salaries and Wages$257.8 M43.8%
Benefits$118.5 M20.1%
Other Operating Expenses$147.2 M25.0%
Financial Aid & Scholarships (1)$12.0 M2.1%
Financial Aid & Scholarships Disbursements to Students (2)
$53.0 M9.0%
$588.5 M
SAN DIEGO STATE UNIVERSITYUniversity Budget (Excluding Auxiliaries)
by Category of Expense2017/18
(1) Includes University Operating Fund grants (Educational Opportunity Program, Graduate Equity, Doctoral of Physical Therapy, and Graduate Business Professional) and Athletics Grant‐in‐Aid; excludes State University Grant (tuition fee discount)(2) Excludes loans
9

University Operating Fund
The University Operating Fund Budget presents the 2017/2018 budget allocations and 2016/2017 and 2015/2016 actual expenditures summarized by college/division. San Diego State University receives its University Operating Fund support appropriation from the State of California by allocation from the California State University (CSU) Chancellor’s Office. The allocation process for the 23 individual universities and the system office begins with a request from the CSU Chancellor and Trustees to the Department of Finance prior to December of each year. The Governor then determines the CSU funding to include in the Governor’s Budget Request which is released in mid-January. This request then goes to the state legislature. In mid-May the Governor typically issues the “May Revise” which is a revision of the original budget based on the most current state revenue/expense projections. The legislature is required to return its version of the budget to the Governor for approval in June. The Governor has considerable power to veto individual items in the Budget before signing it into law for the state’s fiscal year beginning July 1. In 2017/18, San Diego State University’s Operating Fund Budget is based upon the following:
Full-Time Equivalent Student (FTES) 31,007* Individual Enrollment (Headcount) 36,766** Student/Faculty Ratio 23.7:1 Custodial Square Footage 3,236,761
Basic Tuition Fee per Academic Year
Teacher Undergraduate Credential
Graduate/Post Baccalaureate
Part time (Up to 6 units) $3,330 $3,864 $4,164
Regular (6.1 or more units) $5,742 $6,660 $7,176
* Includes Summer and is based on CSU Budget Letter 17-005 FTES target ** Includes Summer and is based on campus budgeted Headcount FTES and headcount includes all students - undergraduate, graduate, resident, non-resident
11

University Operating Fund
For purposes of clarity and consistency with CSU budget categories, positions are grouped as described below: CATEGORY: DESCRIPTION: Academic Faculty Faculty, Teaching Associates, and Graduate Assistants Department Chair Department Chairs SSPAR/Assist Deans/Other Student Service Professional Academic Related,
Assistant Deans for Student Affairs and other academic positions Management Management/Supervisory classifications (including Deans) Education Coordinators Education Coordinators Librarians Librarians
Support Staff Includes all other positions Student Assistant All Student Assistant classifications Work Study on Campus On–campus work study classifications In the University Operating Fund presentation, these three circumstances apply:
The employee benefit budget is based on prior year actual expenditures and is subject to redistribution based on current year experience. This budget includes benefits for revenue-based positions.
The 2017/18 compensation budget includes compensation adjustments (and associated
benefits) for certain bargaining units but has not been fully distributed by employee at this time. Therefore, salaries and wages for each division are reflected at 2016/17 rates.
The 30% divisional contribution to on-campus work-study expenditures is included in the
divisional salary budget. The off-campus and on-campus 70% Federal work-study allocation and expenditure are not included in the UOF presentation. These expenditures occur directly in the work-study fund and are included as Federal Work Study (presented in the Other Funds section).
The following categories include salaries and operating expenditures: Cost Recovery Includes all expenditures related to cost recovery for providing
facilities, goods or services to self-support programs funded by the University Operating Fund.
Revenue-based Includes all expenditures related to departmental revenues for
state-supported instruction and related programs and operations exclusively in the University Operating Fund.
12

San Diego State University
2017-18
Salaries / Wages
Benefits OEE SubTotal Cost Recovery (1)
TotalRevenue-Based (2)
University Operating Fund Budget
Office of the President/KPBS 1,647,512 911,886 23,878 2,583,27602,583,276 0
Institutional 0 0 675,765 995,765320,000675,765 0
1,647,512 911,886 699,643 3,579,041320,0003,259,041 0SubTotal
Academic Affairs 144,814,230 75,382,526 11,810,628 262,678,50919,474,780232,007,384 11,196,345
Institutional 49,068 22,816 491,212 563,0960563,096 0
144,863,298 75,405,342 12,301,840 263,241,60519,474,780232,570,480 11,196,345SubTotal
Athletics 2,673,708 5,905,368 0 8,579,07608,579,076 0
Institutional 0 0 339,478 339,4780339,478 0
2,673,708 5,905,368 339,478 8,918,55408,918,554 0SubTotal
Business and Financial Affairs 24,592,171 13,635,024 3,089,672 54,483,2721,823,25241,316,867 11,343,153
Institutional 1,283,950 506,979 20,113,749 22,059,678155,00021,904,678 0
25,876,121 14,142,003 23,203,421 76,542,9501,978,25263,221,545 11,343,153SubTotal
Student Affairs 8,578,178 6,999,926 3,294,600 20,830,079898,00018,872,704 1,059,375
Student Health Services Revenue 0 0 0 10,936,00010,936,0000 0
Institutional 0 0 56,900 56,900056,900 0
8,578,178 6,999,926 3,351,500 31,822,97911,834,00018,929,604 1,059,375SubTotal
University Relations and Development 4,624,663 2,680,227 604,350 8,617,44407,909,240 708,204
Institutional 0 0 998,500 998,5000998,500 0
4,624,663 2,680,227 1,602,850 9,615,94408,907,740 708,204SubTotal
188,263,480 106,044,752 41,498,732 393,721,07333,607,032335,806,964 24,307,077SubTotal Divisional
Institutional (3) 17,801,997 0 4,304,441 22,106,438022,106,438 0
206,065,477 106,044,752 45,803,173 415,827,51133,607,032357,913,402 24,307,077Total
(1) Cost Recovery includes associated benefits.
(3) Includes 2017/18 compensation and applicable benefits - to be allocated to divisions in 2017/18.
(2) Revenue-based benefits are included in Benefits category, except the Student Success Fee (SSF).
OEE includes University Operating Fund financial aid and institutional reserves.
13

President's Office/KPBS$2,583,276
0.6%
Academic Affairs$262,678,509
63.2%
Athletics$8,579,076
2.1%
Business & Financial Affairs$54,483,272
13.1%
Student Affairs (2)$31,766,079
7.6%
University Relations & Development$8,617,444
2.1%
Institutional (1)$44,131,600
10.6%
Financial Aid & Scholarships (3)$2,988,255
0.7%
SAN DIEGO STATE UNIVERSITYUniversity Operating Fund Budget
Expenditures by Division2017/18
$415,827,511
(1) Institutional utilities, insurance premiums, and unallocated compensation(2) Includes Student Health Services revenues of $10,936,000(3) Includes Educational Opportunity Program Grant, Graduate Equity Grant, Education Doctoral Grant, Doctoral of Physical Therapy Grant, Graduate Business ProfessionalGrant; excludes State University Grant (tuition fee discounting) and Athletics Grant‐in‐Aid
15

Salaries and Wages$236,759,886
56.9%
Benefits$113,654,081
27.4%
Other Operating Expenses$62,425,289
15.0%
Financial Aid & Scholarships (1)$2,988,255
0.7%
$415,827,511
SAN DIEGO STATE UNIVERSITYUniversity Operating Fund Budget
by Category of Expense2017/18
(1) Includes Educational Opportunity Program Grant, Graduate Equity Grant, Education Doctoral Grant, Doctoral of Physical Therapy Grant,Graduate Business Professional Grant; excludes State University Grant (tuition fee discounting) and Athletics Grant‐in‐Aid
17

San Diego State UniversitySummary (by Division)
2017-18 Budget
Revenue-Based (4)
Total Cost Recovery (3)
SubTotal OEEBenefitsSalaries / Wages
2016-17 Actual
Expense (1)
2015-16 Actual
Expense (1)
Change
% Change
%
fm PYfm PY
(2)
Office of the President/KPBS 2,583,276002,583,27623,878911,8861,647,5122,410,8202,318,151 7.15%4.00%
Academic Affairs 262,678,50919,474,78011,196,345232,007,38411,810,62875,382,526144,814,230258,560,389240,078,401 1.59%7.70%
Athletics 8,579,076008,579,07605,905,3682,673,7089,032,5098,999,003 -5.02%0.37%
Business and Financial Affairs 54,483,2721,823,25211,343,15341,316,8673,089,67213,635,02424,592,17160,604,20160,755,877 -10.10%-0.25%
Student Affairs 20,830,079898,0001,059,37518,872,7043,294,6006,999,9268,578,17821,566,68919,005,491 -3.42%13.48%
Student Health Services Revenue 10,936,00010,936,0000000010,093,68010,167,777 8.35%-0.73%
University Relations and Development 8,617,4440708,2047,909,240604,3502,680,2274,624,66310,692,87711,743,659 -19.41%-8.95%
SubTotal 368,707,65633,132,03224,307,077311,268,54718,823,128105,514,957186,930,462372,961,165353,068,359 5.39% 4.22%
Institutional 47,119,855475,000046,644,85526,980,045529,79519,135,01526,029,04225,502,815 81.03%2.06%
Total 415,827,51133,607,03224,307,077357,913,40245,803,173106,044,752206,065,477398,990,208378,571,174 5.39% 4.22%
(3) Cost Recovery includes associated benefits.
(4) Revenue-based benefits are included in Benefits category, except the Student Success Fee (SSF).
(2) Includes current year budget allocations only.
(1) Actual include use of prior year carryforwards.
19

Office of the President/KPBS2017-18 Budget Summary
2015-16 Actual
2016-17 Actual
2017-18 Budget(2)
Salaries / Wages
Benefits OEE SubTotal Cost Recovery (3)
TotalRevenue-Based (4)Expense (1)Expense (1)
0 0 00 0 0 0 00
OFFICE OF THE PRESIDENT 1,046,162 1,072,585 406,857740,057 23,878 1,170,792 0 1,170,7920
KPBS 1,271,989 1,338,236 505,029907,455 0 1,412,484 0 1,412,4840
2,318,151 2,410,820SubTotal 1,647,512 911,886 23,878 2,583,27602,583,276 0
INSTITUTIONAL 586,372 639,083 00 675,765 675,765 320,000 995,7650
2,904,523 3,049,903Total 1,647,512 911,886 699,643 3,579,041320,0003,259,041 0
(3) Cost Recovery includes associated benefits.
(4) Revenue-based benefits are included in Benefits category.
(1) Actuals include use of prior year carryforwards.
(2) Includes current year allocations only.
21

Office of the President/KPBS – Summary
Budget FY2017-18 FY2016-17 FY2015-16 Time Base Budget Actual Actual SALARIES PRESIDENT 1.0 428,645 378,645 370,240 MANAGEMENT 6.0 867,000 881,671 861,498 SUPPORT STAFF 6.1 342,867 319,014 312,375 STUDENT ASSISTANT 0.4 9,000 2,567 8,060 WORK STUDY ON CAMPUS 0 7,886 6,965
TOTAL SALARIES 13.5 1,647,512 1,589,783 1,559,138
BENEFITS 911,886 738,881 683,449 SUBTOTAL PERSONAL SERVICES 13.5 2,559,398 2,328,664 2,242,588
OPERATING EXPENSES SPACE RENT 435,765 449,922 438,601 MEMBERSHIPS AND SUBSCRIPTIONS 146,000 141,974 127,854 SERVICES 94,000 12,299 1,750 SUPPLIES 23,878 362 398 OTHER 0 116,683 93,332
SUBTOTAL OPERATING EXPENSES 699,643 721,238 661,935
TOTAL NON-REVENUE-BASED Office of the 13.5 3,259,041 3,049,903 2,904,523 President/KPBS - Summary
COST RECOVERY 0 0 0
REVENUE-BASED 320,000 0 0
TOTAL Office of the President/KPBS - Summary 13.5 3,579,041 3,049,903 2,904,523
23

Office of the President/KPBS
OFFICE OF THE PRESIDENT Budget FY2017-18 FY2016-17 FY2015-16 Time Base Budget Actual Actual
SALARIES PRESIDENT 1.0 428,645 378,645 370,240 MANAGEMENT 1.0 139,572 139,572 132,924 SUPPORT STAFF 3.1 162,840 161,508 164,001 STUDENT ASSISTANT 0.4 9,000 2,567 8,060
TOTAL SALARIES 5.5 740,057 682,292 675,225
BENEFITS 406,857 308,136 295,373
SUBTOTAL PERSONAL SERVICES 5.5 1,146,914 990,429 970,598
OPERATING EXPENSES SUPPLIES 23,878 362 398 OTHER 0 81,794 75,165
SUBTOTAL OPERATING EXPENSES 23,878 82,156 75,563
TOTAL OFFICE OF THE PRESIDENT 5.5 1,170,792 1,072,585 1,046,162
24

Office of the President/KPBS
KPBS Budget FY2017-18 FY2016-17 FY2015-16 Time Base Budget Actual Actual
SALARIES MANAGEMENT 5.0 727,428 742,099 728,574 SUPPORT STAFF 3.0 180,027 157,506 148,374 WORK STUDY ON CAMPUS 0 7,886 6,965
TOTAL SALARIES 8.0 907,455 907,491 883,913
BENEFITS 505,029 430,745 388,076
SUBTOTAL PERSONAL SERVICES 8.0 1,412,484 1,338,236 1,271,989
TOTAL KPBS 8.0 1,412,484 1,338,236 1,271,989
25

Office of the President/KPBS
INSTITUTIONAL Budget FY2017-18 FY2016-17 FY2015-16 Time Base Budget Actual Actual
OPERATING EXPENSES SPACE RENT 435,765 449,922 438,601 MEMBERSHIPS AND SUBSCRIPTIONS 146,000 141,974 127,854 SERVICES 94,000 12,299 1,750 OTHER 0 34,889 18,167
SUBTOTAL OPERATING EXPENSES 675,765 639,083 586,372
TOTAL NON-REVENUE-BASED 675,765 639,083 586,372 INSTITUTIONAL
REVENUE-BASED 320,000 0 0
TOTAL INSTITUTIONAL 995,765 639,083 586,372
TOTAL Office of the President/KPBS 13.5 3,579,041 3,049,903 2,904,523 Division
26

Academic Affairs2017-18 Budget Summary
2015-16 Actual
2016-17 Actual
2017-18 Budget(2)
Salaries / Wages
Benefits OEE SubTotal Cost Recovery (3)
TotalRevenue-Based (4)Expense (1)Expense (1)
OFFICE OF THE PROVOST 7,159,468 6,863,467 9,810,81814,181,215 3,004,257 26,996,290 7,140,928 41,462,3127,325,094
COLLEGE OF ARTS & LETTERS 42,463,550 45,194,451 13,616,79827,832,206 550,125 41,999,129 919,968 43,651,836732,739
COLLEGE OF BUSINESS ADMINISTRATION 18,976,244 20,857,752 5,589,0919,896,772 56,951 15,542,814 2,824,298 18,751,597384,485
COLLEGE OF EDUCATION 16,840,479 18,306,700 4,706,2249,617,915 1,086,087 15,410,226 577,096 16,117,745130,423
COLLEGE OF ENGINEERING 14,783,379 18,110,954 3,691,6237,547,462 98,376 11,337,461 1,000,776 12,563,200224,963
COLLEGE OF HEALTH & HUMAN SERVICES 23,796,178 26,727,554 6,569,70612,180,555 527,392 19,277,653 2,633,116 22,080,773170,004
COLLEGE OF PROFESSIONAL STUDIES & FINE ARTS 23,952,545 26,840,809 7,222,54014,743,961 483,469 22,449,970 617,114 23,398,224331,140
COLLEGE OF SCIENCES 46,891,721 49,172,655 12,508,99225,540,688 696,384 38,746,064 1,498,984 40,727,110482,062
COLLEGE OF SCIENCES - CSUPERB 1,176,476 1,249,938 229,150467,616 622,216 1,318,982 0 1,318,9820
ENROLLMENT SERVICES 14,953,860 15,656,627 4,221,1828,220,547 563,679 13,005,408 450,000 13,738,776283,368
GRADUATE AND RESEARCH AFFAIRS 3,476,384 3,482,704 835,5561,626,446 1,381,123 3,843,125 74,000 3,997,12980,004
IMPERIAL VALLEY CAMPUS 6,950,644 7,717,764 2,206,7404,480,655 204,090 6,891,485 43,000 7,249,485315,000
INSTRUCTIONAL TECHNOLOGY SERVICES 2,636,002 3,023,149 845,8031,751,494 19,229 2,616,526 0 2,806,676190,150
LIBRARY 13,439,171 12,928,095 2,640,7735,321,801 2,313,303 10,275,877 1,695,500 12,368,290396,913
SENATE 61,652 95,610 22,90446,740 1,082 70,726 0 70,7260
ACADEMIC ENGAGEMENT & STUDENT ACHIEVEMENT 2,520,649 2,332,161 664,6261,358,157 202,865 2,225,648 0 2,375,648150,000
240,078,401 258,560,389SubTotal 144,814,230 75,382,526 11,810,628 262,678,50919,474,780232,007,384 11,196,345
INSTITUTIONAL 560,737 555,057 22,81649,068 491,212 563,096 0 563,0960
240,639,138 259,115,446Total 144,863,298 75,405,342 12,301,840 263,241,60519,474,780232,570,480 11,196,345
(3) Cost Recovery includes associated benefits.
(4) Revenue-based benefits are included in Benefits category.
(1) Actuals include use of prior year carryforwards.
(2) Includes current year allocations only.
27

Academic Affairs – Summary
Budget FY2017-18 FY2016-17 FY2015-16 Time Base Budget Actual Actual
SALARIES ACADEMIC FACULTY (1) 632.1 97,647,036 100,397,690 93,854,652
DEPARTMENT CHAIR 24.6 3,541,949 3,783,239 3,315,770
SSPAR/ASST DEANS/OTHER 11.1 1,024,161 2,022,163 1,793,731
LIBRARIANS 22.2 2,155,644 2,303,522 2,002,033
MANAGEMENT 75.6 9,055,796 9,438,207 9,497,207
SUPPORT STAFF 586.0 30,478,668 27,441,417 26,347,346
EDUCATION COORDINATORS 6.8 391,150 245,851 220,658
STUDENT ASSISTANT 13.9 339,894 1,919,818 1,656,525
NIGHT SHIFT DIFFERENTIAL 3,000 4,124 2,619
OVERTIME 0 74,611 60,245
WORK STUDY ON CAMPUS 11.1 226,000 232,513 230,674
WORK STUDY OFF CAMPUS 0 5,752 968
TOTAL SALARIES 1,383.4 144,863,298 147,868,907 138,982,428
BENEFITS 75,405,342 70,542,005 64,889,246 SUBTOTAL PERSONAL SERVICES 1,383.4 220,268,640 218,410,912 203,871,674
(1) FTEF for Tenure/Tenure-Track faculty only (T/T, Probationary, FERPS). Lecturers are excluded in the FTEF.
29

Academic Affairs – Summary
Budget FY2017-18 FY2016-17 FY2015-16 Time Base Budget Actual Actual
OPERATING EXPENSES SUPPLIES 4,419,331 2,379,044 2,161,953 EQUIPMENT 1,528,766 4,703,477 4,411,346
SUBSCRIPTIONS/PERIODICALS 1,247,370 1,664,615 1,665,863 DOCTORAL SUPPORT 947,781 174,882 246,810 DIVISION-WIDE - IT SOFTWARE 876,560 0 0 CONTRACTUAL SERVICES 594,073 322,690 222,949 CHEC 549,425 535,375 397,437 SPACE RENT 463,712 455,339 454,870 LIBRARY - SERIALS 300,000 21,565 0 LIBRARY - BOOKS 236,475 181,672 256,601 MASTER TEACHER 158,838 127,878 116,388 SOFTWARE ACQUISITION / IMPLEMENTATION 157,800 63,658 0 GRANTS AND RESEARCH ENTERPRISE WRITING (GREW) 154,000 36,510 90,852
TRAVEL 191,736 1,240,333 1,014,527
SUPPLIES-VPAA RESERVE 104,767 0 0 T/TT FACULTY RECRUITING 100,000 8,989 2,659 ACCREDITATION 92,493 95,811 51,087 ZIP LAUNCHPAD SUPPLIES 67,294 15,787 8,103 UNDERGRADUATE RESEARCH 50,000 0 0 REPROGRAPHICS 27,500 19,118 20,199 TEL EQUIP MAINTENANCE 22,419 0 0 BOOK BINDING 8,000 6,680 7,732 ATHLETIC ELIGIBILITY 3,500 461 2,183 OTHER 0 10,026,765 7,811,313
SUBTOTAL OPERATING EXPENSES 12,301,840 22,081,648 18,942,872
TOTAL NON-REVENUE-BASED Academic Affairs 1,383.4 232,570,480 240,491,560 222,814,546 - Summary
COST RECOVERY 54.5 11,196,345 5,683,841 7,332,116
REVENUE-BASED 88.0 19,474,780 12,940,045 10,492,476
TOTAL Academic Affairs - Summary 1,525.9 263,241,605 259,115,446 240,639,138
30

Academic Affairs
OFFICE OF THE PROVOST Budget FY2017-18 FY2016-17 FY2015-16 Time Base Budget Actual Actual
SALARIES
ACADEMIC FACULTY (1):
FACULTY DEVELOPMENT 452,206 0 0
REMEDIAL TUTOR/COORDINATORS 360,157 0 0
COURSE SECTION FUNDS 396,871 0 0
ALL UNIVERSITY ASSIGNED TIME (AUAT) 321,288 0 0
SUMMER 400,353 0 0 NEW T/TT POSITIONS & START-UP (2) 6,611,005 0 0 AREAS OF EXCELLENCE - GRADUATE ASSISTANTS 160,000 0 0
ON-LINE COURSE DEVELOPMENT 104,860 0 0 HONORS COLLEGE 206,400 0 0 INSTRUCTIONAL STUDENT ASSISTANTS 500,000 0 0 PROGRAM COMMITMENTS 719,359 0 0 INSTRUCTIONAL RESERVE 616,312 0 0
MANAGEMENT 4.8 836,406 859,210 955,277
SUPPORT STAFF: OFFICE OF THE PROVOST 12.0 896,477 617,451 635,419 INTERNATIONAL PROGRAMS 4.0 160,704 35,172 33,053 MRI PERSONNEL 3.0 250,000 0 0 UNIVERSITY GRANT FELLOWSHIP (3) 7.5 387,500 0 0 RESERVE (1) 439,470 0 0
STUDENT ASSISTANTS:
OFFICE OF THE PROVOST 0.6 15,000 13,966 8,993 INTERNATIONAL PROGRAMS 0.2 4,500 0 0 RESERVE (1) 4.8 116,347 0 0 WORK STUDY MATCH (4) 11.1 226,000 566 5,300
TOTAL SALARIES 48.0 14,181,215 1,526,365 1,638,042
BENEFITS 9,810,818 718,497 673,379
SUBTOTAL PERSONAL SERVICES 48.0 23,992,033 2,244,862 2,311,421
31

Academic Affairs
OFFICE OF THE PROVOST Budget FY2017-18 FY2016-17 FY2015-16
Time Base Budget Actual Actual
OPERATING EXPENSES SUPPLIES & SERVICES:
OFFICE OF THE PROVOST 54,741 22,825 10,172
DIVISION-WIDE - IT SOFTWARE 876,560 882,351 809,567
INTERNATIONAL PROGRAMS 71,143 14,574 26,066
CERF OH OFFSET 97,268 0 0
RESERVE (1) 104,767 0 0
EQUIPMENT (1) 1,528,766 19,032 12,347
TRAVEL:
OFFICE OF THE PROVOST 18,519 4,902 4,811
INTERNATIONAL PROGRAMS 60,000 55,509 8,182
T/TT FACULTY RECRUITING (1) 100,000 8,989 2,659
ACCREDITATION 92,493 95,811 51,087
OTHER 0 2,591,504 777,721
SUBTOTAL OPERATING EXPENSES 3,004,257 3,695,497 1,702,612
TOTAL NON-REVENUE-BASED 48.0 26,996,290 5,940,359 4,014,034OFFICE OF THE PROVOST
COST RECOVERY/SUPPLEMENTAL FUNDING 40.0 7,325,094 (5) 923,108 3,145,434
REVENUE-BASED 19.0 7,140,928 (6) 0 0
TOTAL OFFICE OF THE PROVOST 107.0 41,462,312 6,863,467 7,159,468
ANNUALIZED FTES:
PROJECTED ACTUAL ACTUAL 2017/18 2016/17 2015/16
CY STUDENT ENROLLMENT (Honors & Undergraduate Studies) 197 152 126
(1) Reflects funds to be allocated to colleges/divisions throughout the fiscal year.
(2) Funds to be used to support FY 2018/19 T/TT hires and startup packages.
(3) Reflects competitive merit based funding to support graduate students.
(4) Budget is provided to colleges/divisions to cover 30% of work study match through a mass allocation process after monthly salaryexpenses post.
(5) Includes Academic Affairs grants and contracts reimbursements.
(6) Reflects Year 4 of Student Success Fee revenue, and excludes funding allocated directly to colleges to support new T/TT faculty positions.
Benefits for SSF positions are held in AA and allocated monthly to colleges based on actual benefit expense for T/TT faculty positions.
32

Academic Affairs
COLLEGE OF ARTS & LETTERS Budget FY2017-18 FY2016-17 FY2015-16 Time Base Budget Actual Actual
SALARIES ACADEMIC FACULTY (1) 163.2 23,917,785 25,028,349 24,213,034 DEPARTMENT CHAIR 4.3 498,850 573,437 541,430
SSPAR/ASST DEANS/OTHER 0.7 58,790 150,585 157,157 MANAGEMENT 3.5 480,864 517,398 552,671 SUPPORT STAFF 60.0 2,830,935 2,655,520 2,515,026 STUDENT ASSISTANT 1.8 44,982 153,399 114,221 OVERTIME 0 14,544 1,994 WORK STUDY ON CAMPUS 0 25,128 25,925
TOTAL SALARIES 233.5 27,832,206 29,118,358 28,121,457
BENEFITS 13,616,798 13,440,852 12,592,085
SUBTOTAL PERSONAL SERVICES 233.5 41,449,004 42,559,211 40,713,543
OPERATING EXPENSES SUPPLIES 491,215 207,437 94,493 CONTRACTUAL SERVICES 58,910 118,846 0 TRAVEL 0 145,278 78,886
EQUIPMENT 0 62,357 56,679 OTHER 0 245,132 264,755
SUBTOTAL OPERATING EXPENSES 550,125 779,050 494,813
TOTAL NON-REVENUE-BASED 233.5 41,999,129 43,338,261 41,208,356 COLLEGE OF ARTS & LETTERS
COST RECOVERY/SUPPLEMENTAL FUNDNG 4.9 732,739 (2) 839,715 697,408
REVENUE-BASED 11.0 919,968 (3) 1,016,475 557,786
TOTAL COLLEGE OF ARTS & LETTERS 249.4 43,651,836 45,194,451 42,463,550 ANNUALIZED FTES:
PROJECTED ACTUAL ACTUAL 2017/18 2016/17 2015/16 CY STUDENT ENROLLMENT (4) 9,297 9,209 9,106
(1) FTEF for Tenure/Tenure-Track faculty only (T/T, Probationary, FERPS). Lecturers are excluded in the FTEF.
(2) Includes 3.9 FTEF and $522,938 related to department chairs.
(3) Includes 11.0 FTEF and $867,468 related to new T/TT hires funded by Student Success Fee (SSF).
(4) Excludes Honors FTES 33

Academic Affairs
FOWLER COLLEGE OF BUSINESS Budget FY2017-18 FY2016-17 FY2015-16 Time Base Budget Actual Actual
SALARIES ACADEMIC FACULTY (1) 53.0 7,561,994 8,723,056 7,659,324 DEPARTMENT CHAIR 3.8 614,529 704,496 538,500 SSPAR/ASST DEANS/OTHER 0.5 33,425 40,452 19,050
MANAGEMENT 5.8 578,922 687,515 622,628 SUPPORT STAFF 21.5 1,104,822 908,291 901,769 STUDENT ASSISTANT 0.1 3,080 53,835 26,158 NIGHT SHIFT DIFFERENTIAL 0 86 77 OVERTIME 0 88 1,902 WORK STUDY ON CAMPUS 0 12,372 11,254
TOTAL SALARIES 84.7 9,896,772 11,130,190 9,780,661
BENEFITS 5,589,091 5,416,419 4,859,052
SUBTOTAL PERSONAL SERVICES 84.7 15,485,863 16,546,610 14,639,713
OPERATING EXPENSES SUPPLIES 56,951 44,117 131,808 TRAVEL 0 40,233 32,233 EQUIPMENT 0 173,468 105,896 OTHER 0 375,358 347,523
SUBTOTAL OPERATING EXPENSES 56,951 633,176 617,460
TOTAL NON-REVENUE-BASED 84.7 15,542,814 17,179,785 15,257,173 FOWLER COLLEGE OF BUSINESS
COST RECOVERY/SUPPLEMENTAL FUNDING 1.0 384,485 (2) 406,875 517,862
REVENUE-BASED 10.0 2,824,298 (3)(4) 3,271,093 3,201,210
TOTAL FOWLER COLLEGE OF 95.7 18,751,597 20,857,752 18,976,244 BUSINESS
ANNUALIZED FTES:
PROJECTED ACTUAL ACTUAL 2017/18 2016/17 2015/16
CY STUDENT ENROLLMENT (5) 3,493 3,427 3,238
(1) FTEF for Tenure/Tenure-Track faculty only (T/T, Probationary, FERPS). Lecturers are excluded in the FTEF.
(2) Includes 1.0 FTEF and $125,844 related to department chairs.
(3) Includes $544,336 in permanent faculty funding from the Graduate Business Professional Fee.
(4) Includes 10.0 FTEF and $1,279,020 related to new T/TT hires funded by Student Success Fee (SSF).
(5) Excludes Honors FTES. 34

Academic Affairs
COLLEGE OF EDUCATION Budget FY2017-18 FY2016-17 FY2015-16 Time Base Budget Actual Actual
SALARIES ACADEMIC FACULTY (1) 56.6 6,766,875 8,503,639 7,781,264 CHEC ACADEMIC FACULTY (2) 0 0 8,616 DEPARTMENT CHAIR 2.8 358,524 339,983 368,397 SSPAR/ASST DEANS/OTHER 0.5 48,636 88,537 100,447 MANAGEMENT 4.7 608,016 622,215 618,981 EDUCATION COORDINATORS 6.8 391,150 245,851 220,658 SUPPORT STAFF 29.1 1,430,590 1,372,164 1,321,333 STUDENT ASSISTANT 0.6 14,124 236,716 178,492 OVERTIME 0 4,849 3,814 WORK STUDY ON CAMPUS 0 22,869 21,648 WORK STUDY OFF CAMPUS 0 5,752 968
TOTAL SALARIES 101.1 9,617,915 11,442,574 10,624,618
BENEFITS 4,706,224 4,824,823 4,339,215
SUBTOTAL PERSONAL SERVICES 101.1 14,324,139 16,267,397 14,963,834
OPERATING EXPENSES CHEC (2) 549,425 535,375 397,437 SUPPLIES 369,213 181,306 109,328 MASTER TEACHER 158,838 127,878 116,388 TRAVEL 8,611 139,985 146,243 EQUIPMENT 0 73,375 61,829 OTHER 0 364,475 361,539
SUBTOTAL OPERATING EXPENSES 1,086,087 1,422,394 1,192,764
TOTAL NON-REVENUE-BASED 101.1 15,410,226 17,689,790 16,156,598 COLLEGE OF EDUCATION COST RECOVERY/SUPPLEMENTAL FUNDING 0.8 130,423 (3) 157,070 222,109
REVENUE-BASED 5.0 577,096 (4) 459,839 461,772
TOTAL COLLEGE OF EDUCATION 106.9 16,117,745 18,306,700 16,840,479 ANNUALIZED FTES:
PROJECTED ACTUAL ACTUAL 2017/18 2016/17 2015/16 CY STUDENT ENROLLMENT (5) 2,219 2,155 2,027
(1) FTEF for Tenure/Tenure-Track faculty only (T/T, Probationary, FERPS). Lecturers are excluded in the FTEF.
(2) CHEC – City Heights Educational Collaborative.
(3) Includes .75 FTEF and $81,792 related to department chairs.
(4) Includes 5.0 FTEF and $402,096 related to new T/TT hires funded by Student Success Fee (SSF).
(5) Excludes Honors FTES. 35

Academic Affairs
COLLEGE OF ENGINEERING Budget FY2017-18 FY2016-17 FY2015-16 Time Base Budget Actual Actual
SALARIES ACADEMIC FACULTY (1) 44.5 5,453,030 6,894,497 6,571,876 DEPARTMENT CHAIR 3.0 528,828 529,421 445,061
SSPAR/ASST DEANS/OTHER 0.5 42,846 249,673 247,390 MANAGEMENT 2.5 392,112 407,065 313,996 SUPPORT STAFF 20.8 1,116,522 1,059,752 965,154 STUDENT ASSISTANT 0.6 14,124 232,301 109,852 OVERTIME 0 839 361 WORK STUDY ON CAMPUS 0 10,115 8,812
TOTAL SALARIES 71.9 7,547,462 9,383,663 8,662,503
BENEFITS 3,691,623 4,103,008 3,885,004
SUBTOTAL PERSONAL SERVICES 71.9 11,239,085 13,486,671 12,547,508
OPERATING EXPENSES SUPPLIES 97,329 87,921 102,841 TRAVEL 1,047 43,327 53,626 EQUIPMENT 0 1,268,719 890,750 OTHER 0 1,709,635 437,495
SUBTOTAL OPERATING EXPENSES 98,376 3,109,603 1,484,712
TOTAL NON-REVENUE-BASED 71.9 11,337,461 16,596,273 14,032,220 COLLEGE OF ENGINEERING
COST RECOVERY/SUPPLEMENTAL FUNDING 2.0 224,963 (2) 385,286 274,035
REVENUE-BASED 9.0 1,000,776 (3) 1,129,394 477,124
TOTAL COLLEGE OF ENGINEERING 82.9 12,563,200 18,110,954 14,783,379 ANNUALIZED FTES:
PROJECTED ACTUAL ACTUAL 2017/18 2016/17 2015/16 CY STUDENT ENROLLMENT (4) 2,044 1,925 1,784
(1) FTEF for Tenure/Tenure-Track faculty only (T/T, Probationary, FERPS). Lecturers are excluded in the FTEF.
(2) Includes 1.0 FTEF and $169,020 related to department chairs.
(3) Includes 9.0 FTEF and $925,776 related to new T/TT hires funded by Student Success Fee (SSF).
(4) Excludes Honors FTES. 36

Academic Affairs
COLLEGE OF HEALTH & HUMAN SERVICES Budget FY2017-18 FY2016-17 FY2015-16 Time Base Budget Actual Actual
SALARIES ACADEMIC FACULTY (1) 68.2 9,379,239 11,589,188 10,642,547 DEPARTMENT CHAIR 4.0 602,025 609,818 526,576
SSPAR/ASST DEANS/OTHER 0.5 39,852 120,234 67,113 MANAGEMENT 3.0 407,412 389,490 405,960 SUPPORT STAFF 37.4 1,752,027 1,641,955 1,566,045 STUDENT ASSISTANT 0 147,677 133,522 OVERTIME 0 2,194 0 WORK STUDY ON CAMPUS 0 7,427 7,382
TOTAL SALARIES 113.1 12,180,555 14,507,984 13,349,144
BENEFITS 6,569,706 7,253,251 6,513,901
SUBTOTAL PERSONAL SERVICES 113.1 18,750,261 21,761,235 19,863,045
OPERATING EXPENSES SUPPLIES 307,980 359,829 110,921 CONTRACTUAL SERVICES 216,912 167,433 221,659 TRAVEL 2,500 165,768 88,379 EQUIPMENT 0 690,934 608,412 OTHER 0 744,077 470,676
SUBTOTAL OPERATING EXPENSES 527,392 2,128,041 1,500,047
TOTAL NON-REVENUE-BASED 113.1 19,277,653 23,889,276 21,363,091 COLLEGE OF HEALTH & HUMAN SERVICES
COST RECOVERY/SUPPLEMENTAL FUNDING 1.0 170,004 (2) 236,913 228,772
REVENUE-BASED 14.0 2,633,116 (3)(4) 2,601,366 2,204,315
TOTAL COLLEGE OF HEALTH & 128.1 22,080,773 26,727,554 23,796,178 HUMAN SERVICES
ANNUALIZED FTES:
PROJECTED ACTUAL ACTUAL 2017/18 2016/17 2015/16 CY STUDENT ENROLLMENT (5) 3,211 3,265 3,174
(1) FTEF for Tenure/Tenure-Track faculty only (T/T, Probationary, FERPS). Lecturers are excluded in the FTEF.
(2) Includes 1.0 FTEF and $170,004 related to department chairs.
(3) Includes projected Doctorate of Physical Therapy (DPT) program fees of $1,568,817 and supports 7.0 FTE T/TT positions.
(4) Includes 7.0 FTEF and $629,964 related to new T/TT hires funded by Student Success Fee (SSF).
(5) Excludes Honors FTES. 37

Academic Affairs
COLLEGE OF PROFESSIONAL STUDIES & FINE ARTS Budget FY2017-18 FY2016-17 FY2015-16 Time Base Budget Actual Actual
SALARIES ACADEMIC FACULTY (1) 90.2 11,488,148 13,059,786 11,908,260 DEPARTMENT CHAIR 2.4 315,619 349,114 326,162 SSPAR/ASST DEANS/OTHER 0.5 39,504 189,150 117,261
MANAGEMENT 5.0 670,330 673,043 692,644 SUPPORT STAFF 46.4 2,225,129 2,078,737 1,979,722 STUDENT ASSISTANT 0.2 5,231 162,694 151,323 OVERTIME 0 9,358 11,408 WORK STUDY ON CAMPUS 0 29,216 30,971
TOTAL SALARIES 144.7 14,743,961 16,551,096 15,217,751
BENEFITS 7,222,540 7,529,818 6,752,088
SUBTOTAL PERSONAL SERVICES 144.7 21,966,501 24,080,914 21,969,839
OPERATING EXPENSES SUPPLIES 461,765 187,429 198,897 TRAVEL 21,704 120,802 97,779 EQUIPMENT 0 496,788 338,732 OTHER 0 587,882 400,245
SUBTOTAL OPERATING EXPENSES 483,469 1,392,902 1,035,654
TOTAL NON-REVENUE-BASED 144.7 22,449,970 25,473,817 23,005,493 COLLEGE OF PROFESSIONAL STUDIES & FINE ARTS
COST RECOVERY/SUPPLEMENTAL FUNDING 2.4 331,140 (2) 515,967 455,742
REVENUE-BASED 7.0 617,114 (3) 851,025 491,310
TOTAL COLLEGE OF PROFESSIONAL 154.1 23,398,224 26,840,809 23,952,545 STUDIES & FINE ARTS
ANNUALIZED FTES:
PROJECTED ACTUAL ACTUAL 2017/18 2016/17 2015/16 CY STUDENT ENROLLMENT (4) 4,104 3,992 3,934
(1) FTEF for Tenure/Tenure-Track faculty only (T/T, Probationary, FERPS). Lecturers are excluded in the FTEF.
(2) Includes 2.4 FTEF and $323,990 related to department chairs.
(3) Includes 7.0 FTEF and $565,764 related to new T/TT hires funded by Student Success Fee (SSF).
(4) Excludes Honors FTES. 38

Academic Affairs
COLLEGE OF SCIENCES Budget FY2017-18 FY2016-17 FY2015-16 Time Base Budget Actual Actual
SALARIES ACADEMIC FACULTY (1) 141.4 19,683,206 23,751,227 22,488,331 DEPARTMENT CHAIR 4.3 623,574 676,971 569,644 SSPAR/ASST DEANS/OTHER 4.0 469,314 817,450 606,705
MANAGEMENT 5.0 671,856 737,578 703,718 SUPPORT STAFF 74.3 4,078,614 3,710,538 3,740,846 STUDENT ASSISTANT 0.6 14,124 280,650 262,359 OVERTIME 0 14,429 14,864 WORK STUDY ON CAMPUS 0 30,765 32,475
TOTAL SALARIES 229.6 25,540,688 30,019,608 28,418,941
BENEFITS 12,508,992 14,558,724 13,569,106
SUBTOTAL PERSONAL SERVICES 229.6 38,049,680 44,578,332 41,988,047
OPERATING EXPENSES SUPPLIES 647,844 423,724 581,462 TRAVEL 48,540 154,250 118,147 EQUIPMENT 0 889,972 1,562,369 OTHER 0 824,920 981,610
SUBTOTAL OPERATING EXPENSES 696,384 2,292,866 3,243,588
TOTAL NON-REVENUE-BASED 229.6 38,746,064 46,871,199 45,231,635 COLLEGE OF SCIENCES
COST RECOVERY/SUPPLEMENTAL FUNDING 2.4 482,062 (2) 820,642 763,243
REVENUE-BASED 13.0 1,498,984 (3) 1,480,814 896,843
TOTAL COLLEGE OF SCIENCES 245.0 40,727,110 49,172,655 46,891,721
ANNUALIZED FTES:
PROJECTED ACTUAL ACTUAL 2017/18 2016/17 2015/16 CY STUDENT ENROLLMENT (4) 6,536 6,573 6,494
(1) FTEF for Tenure/Tenure-Track faculty only (T/T, Probationary, FERPS). Lecturers are excluded in the FTEF.
(2) Includes 2.4 FTEF and $368,184 related to department chairs.
(3) Includes 13.0 FTEF and $1,188,984 related to new T/TT hires funded by Student Success Fee (SSF).
(4) Excludes Honors FTES. 39

Academic Affairs
COLLEGE OF SCIENCES – CSUPERB (1) Budget FY2017-18 FY2016-17 FY2015-16 Time Base Budget Actual Actual
SALARIES ACADEMIC FACULTY 0 68,940 57,933 MANAGEMENT 1.0 210,012 200,004 200,004 SUPPORT STAFF 4.0 257,604 216,370 179,076 STUDENT ASSISTANT 0 11,337 13,744
OVERTIME 0 1,282 4,387
TOTAL SALARIES 5.0 467,616 497,933 455,144
BENEFITS 229,150 213,296 186,336
SUBTOTAL PERSONAL SERVICES 5.0 696,766 711,229 641,480
OPERATING EXPENSES SUPPLIES 622,216 18,516 20,398 EQUIPMENT 0 0 1,389 OTHER 0 463,092 464,574
SUBTOTAL OPERATING EXPENSES 622,216 481,288 486,361
TOTAL NON-REVENUE-BASED 5.0 1,318,982 1,192,837 1,127,841 COLLEGE OF SCIENCES - CSUPERB
COST RECOVERY 0 57,101 48,635
TOTAL COLLEGE OF SCIENCES - 5.0 1,318,982 1,249,938 1,176,476 CSUPERB
(1) CSUPERB – California State University Program for Education and Research in Biotechnology.
40

Academic Affairs
ENROLLMENT SERVICES Budget FY2017-18 FY2016-17 FY2015-16 Time Base Budget Actual Actual
SALARIES MANAGEMENT 18.0 1,613,772 1,579,273 1,659,731 SUPPORT STAFF 124.8 6,595,775 6,813,258 6,358,520 STUDENT ASSISTANT 0.4 11,000 193,081 234,860 OVERTIME 0 19,998 14,043 WORK STUDY ON CAMPUS 0 13,653 9,081
TOTAL SALARIES 143.2 8,220,547 8,619,262 8,276,235
BENEFITS 4,221,182 4,893,144 4,439,510
SUBTOTAL PERSONAL SERVICES 143.2 12,441,729 13,512,406 12,715,745
OPERATING EXPENSES SUPPLIES 491,889 83,658 128,608 CONTRACTUAL SERVICES 41,790 21,573 21,553 TRAVEL 26,500 197,303 203,267 ATHLETIC ELIGIBILITY 3,500 461 2,183 EQUIPMENT 0 356,984 144,355 OTHER 0 891,112 1,182,552
SUBTOTAL OPERATING EXPENSES 563,679 1,551,092 1,682,518
TOTAL NON-REVENUE-BASED 143.2 13,005,408 15,063,499 14,398,263 ENROLLMENT SERVICES
COST RECOVERY 283,368 157,038 182,443
REVENUE-BASED 450,000 436,090 373,155
TOTAL ENROLLMENT SERVICES 143.2 13,738,776 15,656,627 14,953,860
41

Academic Affairs
GRADUATE AND RESEARCH AFFAIRS Budget FY2017-18 FY2016-17 FY2015-16 Time Base Budget Actual Actual
SALARIES SSPAR/ASST DEANS/OTHER 0.5 48,690 60,794 57,012 MANAGEMENT 3.2 465,081 770,322 738,334 ZIP LAUNCHPAD MANAGEMENT (1) 2.5 266,142 196,476 214,165
SUPPORT STAFF 18.5 846,533 784,273 770,562 ZIP LAUNCHPAD STAFF (1) 0 23,013 0
TOTAL SALARIES 24.7 1,626,446 1,834,878 1,780,073
BENEFITS 835,556 1,047,209 915,023
SUBTOTAL PERSONAL SERVICES 24.7 2,462,002 2,882,087 2,695,096
OPERATING EXPENSES DOCTORAL SUPPORT 947,781 174,882 246,810
SOFTWARE ACQUISITION / IMPLEMENTATION 157,800 63,658 0
GRANTS AND RESEARCH ENTERPRISE WRITING (GREW) 154,000 36,510 90,852
UNDERGRADUATE RESEARCH (2) 50,000 0 0
TRAVEL 3,248 16,942 11,700
SUPPLIES 1,000 41,519 57,330 ZIP LAUNCHPAD SUPPLIES (1) 67,294 15,787 8,103
EQUIPMENT 0 7,523 3,407 OTHER 0 63,606 235,649
SUBTOTAL OPERATING EXPENSES 1,381,123 420,427 653,851
TOTAL NON-REVENUE-BASED 24.7 3,843,125 3,302,514 3,348,947 GRADUATE AND RESEARCH AFFAIRS
COST RECOVERY 80,004 85,992 1,982
REVENUE-BASED 74,000 94,198 125,455
TOTAL GRADUATE AND RESEARCH 24.7 3,997,129 3,482,704 3,476,384 AFFAIRS
(1) ZIP – Zahn Innovation Platform.
(2) Reflects funds to be allocated to colleges to support faculty sponsored undergraduate student research.
42

Academic Affairs
IMPERIAL VALLEY CAMPUS Budget FY2017-18 FY2016-17 FY2015-16 Time Base Budget Actual Actual
SALARIES ACADEMIC FACULTY (1) 15.0 2,547,948 2,779,009 2,523,467 SSPAR/ASST DEANS/OTHER 0.5 37,530 59,103 68,089 LIBRARIANS 1.0 92,376 92,376 86,688 MANAGEMENT 4.0 416,520 347,663 510,340 SUPPORT STAFF 31.2 1,386,281 1,291,946 1,227,039 STUDENT ASSISTANT 0 17,659 10,819 NIGHT SHIFT DIFFERENTIAL 0 1,446 1,129 OVERTIME 0 210 1,955 WORK STUDY ON CAMPUS 0 35,832 32,008
TOTAL SALARIES 51.7 4,480,655 4,625,243 4,461,535
BENEFITS 2,206,740 2,220,860 2,093,042
SUBTOTAL PERSONAL SERVICES 51.7 6,687,395 6,846,103 6,554,577
OPERATING EXPENSES SUPPLIES 82,476 32,757 36,595 CONTRACTUAL SERVICES 62,720 6,104 7,674 LIBRARY - BOOKS 36,475 4,370 12,813 TEL EQUIP MAINTENANCE 22,419 0 0 TRAVEL 0 16,873 19,216
EQUIPMENT 0 157,823 46,411 OTHER 0 145,698 89,568
SUBTOTAL OPERATING EXPENSES 204,090 363,625 212,278
TOTAL NON-REVENUE-BASED 51.7 6,891,485 7,209,728 6,766,854 IMPERIAL VALLEY CAMPUS
COST RECOVERY 315,000 472,062 156,383
REVENUE-BASED 43,000 35,974 27,407
TOTAL IMPERIAL VALLEY CAMPUS 51.7 7,249,485 7,717,764 6,950,644
ANNUALIZED FTES:
PROJECTED ACTUAL ACTUAL 2017/18 2016/17 2015/16 CY STUDENT ENROLLMENT 729 720 790
(1) FTEF for Tenure/Tenure-Track faculty only (T/T, Probationary, FERPS). Lecturers are excluded in the FTEF. 43

Academic Affairs
INSTRUCTIONAL TECHNOLOGY SERVICES Budget FY2017-18 FY2016-17 FY2015-16 Time Base Budget Actual Actual
SALARIES MANAGEMENT 3.0 322,380 321,936 267,647 SUPPORT STAFF 22.0 1,400,614 1,221,331 1,149,603 STUDENT ASSISTANT 1.0 25,500 112,316 115,020 NIGHT SHIFT DIFFERENTIAL 3,000 2,593 1,413 OVERTIME 0 1,934 1,733 WORK STUDY ON CAMPUS 0 4,398 6,425
TOTAL SALARIES 26.0 1,751,494 1,664,507 1,541,842
BENEFITS 845,803 805,728 759,065
SUBTOTAL PERSONAL SERVICES 26.0 2,597,297 2,470,235 2,300,907
OPERATING EXPENSES SUPPLIES 19,229 29,519 0 TRAVEL 0 32,545 27,158
EQUIPMENT 0 295,532 130,403 OTHER 0 75,256 20,503
SUBTOTAL OPERATING EXPENSES 19,229 432,851 178,064
TOTAL NON-REVENUE-BASED 26.0 2,616,526 2,903,086 2,478,972 INSTRUCTIONAL TECHNOLOGY SERVICES
COST RECOVERY 190,150 120,063 157,030
TOTAL INSTRUCTIONAL TECHNOLOGY 26.0 2,806,676 3,023,149 2,636,002 SERVICES
44

Academic Affairs
LIBRARY Budget FY2017-18 FY2016-17 FY2015-16 Time Base Budget Actual Actual
SALARIES LIBRARIANS (1) 21.2 2,063,268 2,211,146 1,915,345 MANAGEMENT 5.3 592,855 606,048 565,951 SUPPORT STAFF 49.5 2,595,678 2,353,431 2,298,420 STUDENT ASSISTANT 2.9 70,000 246,294 261,423 OVERTIME 0 4,888 3,785 WORK STUDY ON CAMPUS 0 36,923 34,743
TOTAL SALARIES 78.9 5,321,801 5,458,729 5,079,666
BENEFITS 2,640,773 2,814,921 2,551,785
SUBTOTAL PERSONAL SERVICES 78.9 7,962,574 8,273,649 7,631,451
OPERATING EXPENSES SUBSCRIPTIONS/PERIODICALS 1,247,370 1,664,615 1,665,863 SUPPLIES 344,192 68,224 34,863 LIBRARY - SERIALS 300,000 21,565 0 CONTRACTUAL SERVICES 213,741 8,735 (27,938) LIBRARY - BOOKS 200,000 177,302 243,788 BOOK BINDING 8,000 6,680 7,732 TRAVEL 0 60,214 72,635
EQUIPMENT 0 189,578 446,584 OTHER 0 418,945 1,258,194
SUBTOTAL OPERATING EXPENSES 2,313,303 2,615,858 3,701,721
TOTAL NON-REVENUE-BASED 78.9 10,275,877 10,889,507 11,333,172 LIBRARY
COST RECOVERY 396,913 500,165 438,946
REVENUE-BASED 1,695,500 1,538,423 1,667,052
TOTAL LIBRARY 78.9 12,368,290 12,928,095 13,439,171
(1) FTEF for Tenure/Tenure-Track faculty only (T/T, Probationary, FERPS). Lecturers are excluded in the FTEF. 45

Academic Affairs
SENATE Budget FY2017-18 FY2016-17 FY2015-16 Time Base Budget Actual Actual
SALARIES SUPPORT STAFF 1.0 46,740 46,740 30,967
TOTAL SALARIES 1.0 46,740 46,740 30,967
BENEFITS 22,904 37,042 18,859
SUBTOTAL PERSONAL SERVICES 1.0 69,644 83,782 49,826
OPERATING EXPENSES SUPPLIES 1,082 240 113 TRAVEL 0 11,258 11,983
OTHER 0 330 (270)
SUBTOTAL OPERATING EXPENSES 1,082 11,828 11,826
TOTAL SENATE 1.0 70,726 95,610 61,652
46

Academic Affairs
ACADEMIC ENGAGEMENT & STUDENT ACHIEVEMENT Budget FY2017-18 FY2016-17 FY2015-16 Time Base Budget Actual Actual
SALARIES SSPAR/ASST DEANS/OTHER 2.9 205,574 246,185 353,509 MANAGEMENT 4.3 523,116 522,970 475,160 SUPPORT STAFF 9.3 452,731 442,191 570,118 SI LEADERS - ISA 8.7 174,854 119,222 54,935 STUDENT ASSISTANT 0.1 1,882 57,895 35,737 WORK STUDY ON CAMPUS 0 3,251 4,650
TOTAL SALARIES 25.3 1,358,157 1,391,714 1,494,108
BENEFITS 664,626 642,752 717,008
SUBTOTAL PERSONAL SERVICES 25.3 2,022,783 2,034,466 2,211,116
OPERATING EXPENSES SUPPLIES 201,798 55,256 57,940 TRAVEL 1,067 35,143 40,284 EQUIPMENT 0 21,391 3,172 OTHER 0 106,484 166,045
SUBTOTAL OPERATING EXPENSES 202,865 218,273 267,441
TOTAL NON-REVENUE-BASED 25.3 2,225,648 2,252,740 2,478,557 ACADEMIC ENGAGEMENT & STUDENT ACHIEVEMENT COST RECOVERY 150,000 62,947 42,092
REVENUE-BASED 0 16,474 0
TOTAL ACADEMIC ENGAGEMENT 25.3 2,375,648 2,332,161 2,520,649
& STUDENT ACHIEVEMENT
47

Academic Affairs
INSTITUTIONAL Budget FY2017-18 FY2016-17 FY2015-16 Time Base Budget Actual Actual
SALARIES SUPPORT STAFF 1.0 49,068 50,063 49,740
TOTAL SALARIES 1.0 49,068 50,063 49,740
BENEFITS 22,816 21,659 24,788
SUBTOTAL PERSONAL SERVICES 1.0 71,884 71,722 74,528
OPERATING EXPENSES SPACE RENT 463,712 455,339 454,870 REPROGRAPHICS 27,500 19,118 20,199 OTHER 0 0 2,092
SUBTOTAL OPERATING EXPENSES 491,212 474,457 477,161
TOTAL NON-REVENUE-BASED 1.0 563,096 546,179 551,689 INSTITUTIONAL
REVENUE-BASED 0 8,878 9,049
TOTAL INSTITUTIONAL 1.0 563,096 555,057 560,737
TOTAL Academic Affairs Division 1,525.9 263,241,605 259,115,446 240,639,138
48

Athletics2017-18 Budget Summary
2015-16 Actual
2016-17 Actual
2017-18 Budget(2)
Salaries / Wages
Benefits OEE SubTotal Cost Recovery (3)
TotalRevenue-Based (4)Expense (1)Expense (1)
ATHLETICS 8,999,003 9,032,509 5,905,3682,673,708 0 8,579,076 0 8,579,0760
8,999,003 9,032,509SubTotal 2,673,708 5,905,368 0 8,579,07608,579,076 0
INSTITUTIONAL 334,324 323,128 00 339,478 339,478 0 339,4780
9,333,327 9,355,637Total 2,673,708 5,905,368 339,478 8,918,55408,918,554 0
(3) Cost Recovery includes associated benefits.
(4) Revenue-based benefits are included in Benefits category.
(1) Actuals include use of prior year carryforwards.
(2) Includes current year allocations only.
49

Athletics – Summary
Budget FY2017-18 FY2016-17 FY2015-16 Time Base Budget Actual Actual
SALARIES ACADEMIC FACULTY 32.9 2,127,234 2,580,358 3,018,226 MANAGEMENT 4.0 546,474 845,118 429,111 SUPPORT STAFF 0 1,040 40,836 NIGHT SHIFT DIFFERENTIAL 0 0 145 OVERTIME 0 0 503
TOTAL SALARIES 36.9 2,673,708 3,426,516 3,488,821
BENEFITS 5,905,368 5,605,993 5,510,182 SUBTOTAL PERSONAL SERVICES 36.9 8,579,076 9,032,509 8,999,003
OPERATING EXPENSES INSURANCE EXPENSE 313,126 296,776 307,972 SPACE RENT 26,352 26,352 26,352
SUBTOTAL OPERATING EXPENSES 339,478 323,128 334,324
COST RECOVERY 0 0 0
REVENUE-BASED 0 0 0
TOTAL Athletics - Summary 36.9 8,918,554 9,355,637 9,333,327
51

Athletics
ATHLETICS Budget FY2017-18 FY2016-17 FY2015-16 Time Base Budget Actual Actual
SALARIES ACADEMIC FACULTY 32.9 2,127,234 2,580,358 3,018,226 MANAGEMENT 4.0 546,474 845,118 429,111 SUPPORT STAFF 0 1,040 40,836 NIGHT SHIFT DIFFERENTIAL 0 0 145 OVERTIME 0 0 503
TOTAL SALARIES 36.9 2,673,708 3,426,516 3,488,821
BENEFITS 5,905,368 5,605,993 5,510,182
SUBTOTAL PERSONAL SERVICES 36.9 8,579,076 9,032,509 8,999,003
OPERATING EXPENSES
TOTAL ATHLETICS 36.9 8,579,076 9,032,509 8,999,003
52

Athletics
INSTITUTIONAL Budget FY2017-18 FY2016-17 FY2015-16 Time Base Budget Actual Actual
OPERATING EXPENSES INSURANCE EXPENSE 313,126 296,776 307,972 SPACE RENT 26,352 26,352 26,352
SUBTOTAL OPERATING EXPENSES 339,478 323,128 334,324
TOTAL INSTITUTIONAL 339,478 323,128 334,324
TOTAL Athletics Division 36.9 8,918,554 9,355,637 9,333,327
53
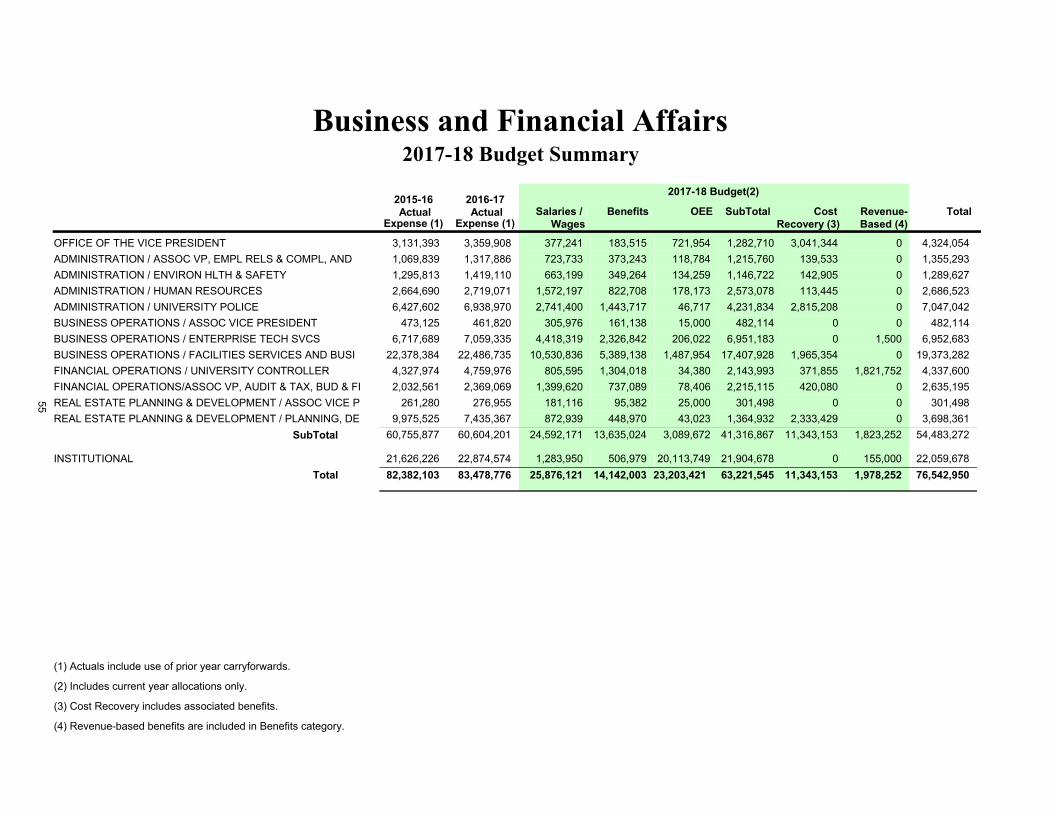
Business and Financial Affairs2017-18 Budget Summary
2015-16 Actual
2016-17 Actual
2017-18 Budget(2)
Salaries / Wages
Benefits OEE SubTotal Cost Recovery (3)
TotalRevenue-Based (4)Expense (1)Expense (1)
OFFICE OF THE VICE PRESIDENT 3,131,393 3,359,908 183,515377,241 721,954 1,282,710 0 4,324,0543,041,344
ADMINISTRATION / ASSOC VP, EMPL RELS & COMPL, AND 1,069,839 1,317,886 373,243723,733 118,784 1,215,760 0 1,355,293139,533
ADMINISTRATION / ENVIRON HLTH & SAFETY 1,295,813 1,419,110 349,264663,199 134,259 1,146,722 0 1,289,627142,905
ADMINISTRATION / HUMAN RESOURCES 2,664,690 2,719,071 822,7081,572,197 178,173 2,573,078 0 2,686,523113,445
ADMINISTRATION / UNIVERSITY POLICE 6,427,602 6,938,970 1,443,7172,741,400 46,717 4,231,834 0 7,047,0422,815,208
BUSINESS OPERATIONS / ASSOC VICE PRESIDENT 473,125 461,820 161,138305,976 15,000 482,114 0 482,1140
BUSINESS OPERATIONS / ENTERPRISE TECH SVCS 6,717,689 7,059,335 2,326,8424,418,319 206,022 6,951,183 1,500 6,952,6830
BUSINESS OPERATIONS / FACILITIES SERVICES AND BUSI 22,378,384 22,486,735 5,389,13810,530,836 1,487,954 17,407,928 0 19,373,2821,965,354
FINANCIAL OPERATIONS / UNIVERSITY CONTROLLER 4,327,974 4,759,976 1,304,018805,595 34,380 2,143,993 1,821,752 4,337,600371,855
FINANCIAL OPERATIONS/ASSOC VP, AUDIT & TAX, BUD & FI 2,032,561 2,369,069 737,0891,399,620 78,406 2,215,115 0 2,635,195420,080
REAL ESTATE PLANNING & DEVELOPMENT / ASSOC VICE P 261,280 276,955 95,382181,116 25,000 301,498 0 301,4980
REAL ESTATE PLANNING & DEVELOPMENT / PLANNING, DE 9,975,525 7,435,367 448,970872,939 43,023 1,364,932 0 3,698,3612,333,429
60,755,877 60,604,201SubTotal 24,592,171 13,635,024 3,089,672 54,483,2721,823,25241,316,867 11,343,153
INSTITUTIONAL 21,626,226 22,874,574 506,9791,283,950 20,113,749 21,904,678 155,000 22,059,6780
82,382,103 83,478,776Total 25,876,121 14,142,003 23,203,421 76,542,9501,978,25263,221,545 11,343,153
(3) Cost Recovery includes associated benefits.
(4) Revenue-based benefits are included in Benefits category.
(1) Actuals include use of prior year carryforwards.
(2) Includes current year allocations only.
55

Business and Financial Affairs – Summary
Budget FY2017-18 FY2016-17 FY2015-16 Time Base Budget Actual Actual SALARIES ERP MANAGEMENT 1.0 135,528 135,528 132,876 MANAGEMENT 70.2 7,477,817 7,330,559 6,807,297 ERP SUPPORT STAFF 8.6 597,713 458,867 385,971 CO-GEN SUPPORT STAFF 6.3 403,909 345,790 345,930
SUPPORT STAFF 301.2 16,214,956 14,514,136 14,191,074 STUDENT ASSISTANT 8.3 166,627 394,181 399,496 CO-GEN STUDENT ASSISTANT 0.1 1,000 0 0 CO-GEN NIGHT SHIFT DIFFERENTIAL 10,800 11,452 10,610 NIGHT SHIFT DIFFERENTIAL 205,500 240,128 234,582 ASBESTOS & WATER TREATMENT PAY 1,000 2,805 2,190 POST CERT/SPEC ASSIGNMENT STIP 98,400 98,450 67,200 ERP OVERTIME 0 1,317 9,057 CO-GEN OVERTIME 65,000 99,183 96,464
OVERTIME 469,098 766,032 753,355 WORK STUDY ON CAMPUS 1.4 28,773 20,939 22,954
TOTAL SALARIES 397.1 25,876,121 24,419,366 23,459,055
BENEFITS 14,142,003 14,667,266 13,477,108 SUBTOTAL PERSONAL SERVICES 397.1 40,018,124 39,086,632 36,936,163
57
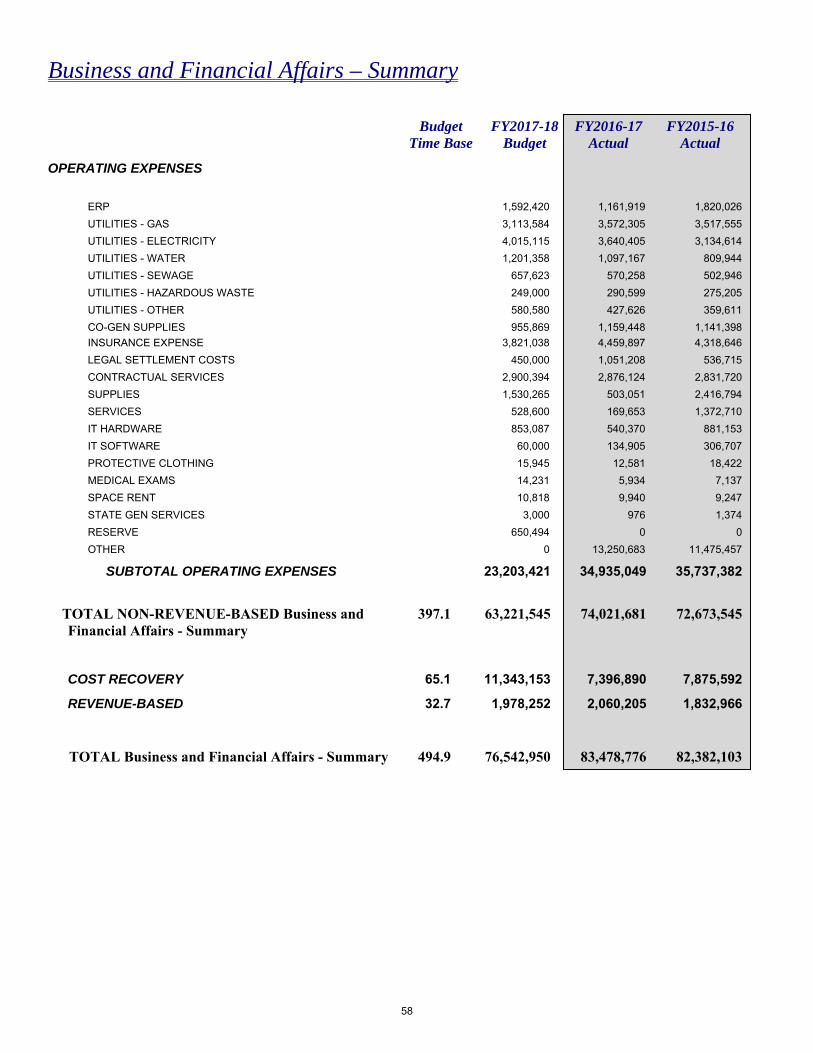
Business and Financial Affairs – Summary
Budget FY2017-18 FY2016-17 FY2015-16 Time Base Budget Actual Actual OPERATING EXPENSES ERP 1,592,420 1,161,919 1,820,026
UTILITIES - GAS 3,113,584 3,572,305 3,517,555 UTILITIES - ELECTRICITY 4,015,115 3,640,405 3,134,614 UTILITIES - WATER 1,201,358 1,097,167 809,944
UTILITIES - SEWAGE 657,623 570,258 502,946
UTILITIES - HAZARDOUS WASTE 249,000 290,599 275,205 UTILITIES - OTHER 580,580 427,626 359,611
CO-GEN SUPPLIES 955,869 1,159,448 1,141,398 INSURANCE EXPENSE 3,821,038 4,459,897 4,318,646 LEGAL SETTLEMENT COSTS 450,000 1,051,208 536,715
CONTRACTUAL SERVICES 2,900,394 2,876,124 2,831,720
SUPPLIES 1,530,265 503,051 2,416,794
SERVICES 528,600 169,653 1,372,710 IT HARDWARE 853,087 540,370 881,153
IT SOFTWARE 60,000 134,905 306,707 PROTECTIVE CLOTHING 15,945 12,581 18,422 MEDICAL EXAMS 14,231 5,934 7,137 SPACE RENT 10,818 9,940 9,247 STATE GEN SERVICES 3,000 976 1,374 RESERVE 650,494 0 0 OTHER 0 13,250,683 11,475,457
SUBTOTAL OPERATING EXPENSES 23,203,421 34,935,049 35,737,382 TOTAL NON-REVENUE-BASED Business and 397.1 63,221,545 74,021,681 72,673,545 Financial Affairs - Summary
COST RECOVERY 65.1 11,343,153 7,396,890 7,875,592
REVENUE-BASED 32.7 1,978,252 2,060,205 1,832,966
TOTAL Business and Financial Affairs - Summary 494.9 76,542,950 83,478,776 82,382,103
58

Business and Financial Affairs
OFFICE OF THE VICE PRESIDENT Budget FY2017-18 FY2016-17 FY2015-16 Time Base Budget Actual Actual
SALARIES MANAGEMENT 2.0 348,468 345,252 327,984 STUDENT ASSISTANT 0 19,932 22,035 WORK STUDY ON CAMPUS 1.4 28,773 0 0
TOTAL SALARIES 3.4 377,241 365,184 350,019
BENEFITS 183,515 147,489 136,937
SUBTOTAL PERSONAL SERVICES 3.4 560,756 512,673 486,956
OPERATING EXPENSES RESERVE 650,494 0 0 SUPPLIES 71,460 20,337 13,076 OTHER 0 2,457,176 2,408,941
SUBTOTAL OPERATING EXPENSES 721,954 2,477,513 2,422,017
TOTAL NON-REVENUE-BASED 3.4 1,282,710 2,990,186 2,908,973 OFFICE OF THE VICE PRESIDENT
COST RECOVERY 2.0 3,041,344 369,721 222,420
TOTAL OFFICE OF THE VICE PRESIDENT 5.4 4,324,054 3,359,908 3,131,393
59

Business and Financial Affairs
ADMINISTRATION / ASSOC VP, EMPL RELS & COMPL, AND EMERG Budget FY2017-18 FY2016-17 FY2015-16 SVCS & RISK MGMT Time Base Budget Actual Actual SALARIES MANAGEMENT 6.0 666,220 674,585 557,982 SUPPORT STAFF 0.8 42,513 44,669 39,198 STUDENT ASSISTANT 0.7 15,000 762 0 OVERTIME 0 2,335 0 WORK STUDY ON CAMPUS 0 2,054 2,420
TOTAL SALARIES 7.5 723,733 724,405 599,600
BENEFITS 373,243 375,663 299,714
SUBTOTAL PERSONAL SERVICES 7.5 1,096,976 1,100,067 899,315
OPERATING EXPENSES SUPPLIES 118,784 17,297 8,007 OTHER 0 26,359 45,181
SUBTOTAL OPERATING EXPENSES 118,784 43,656 53,188
TOTAL NON-REVENUE-BASED 7.5 1,215,760 1,143,723 952,502 ADMINISTRATION / ASSOC VP, EMPL RELS & COMPL, AND EMERG SVCS & RISK MGMT
COST RECOVERY 1.0 139,533 174,163 117,337
TOTAL ADMINISTRATION / ASSOC VP, 8.5 1,355,293 1,317,886 1,069,839 EMPL RELS & COMPL, AND EMERG SVCS & RISK MGMT
60

Business and Financial Affairs
ADMINISTRATION / ENVIRON HLTH & SAFETY Budget FY2017-18 FY2016-17 FY2015-16 Time Base Budget Actual Actual
SALARIES MANAGEMENT 9.8 605,431 749,805 709,440 SUPPORT STAFF 1.0 57,768 49,891 29,319 STUDENT ASSISTANT 0 0 4,430
TOTAL SALARIES 10.8 663,199 799,696 743,189
BENEFITS 349,264 446,359 377,258
SUBTOTAL PERSONAL SERVICES 10.8 1,012,463 1,246,054 1,120,447
OPERATING EXPENSES SUPPLIES 118,314 9,328 10,127 PROTECTIVE CLOTHING 15,945 12,581 18,422 OTHER 0 27,075 27,206
SUBTOTAL OPERATING EXPENSES 134,259 48,984 55,755
TOTAL NON-REVENUE-BASED 10.8 1,146,722 1,295,039 1,176,203 ADMINISTRATION / ENVIRON HLTH & SAFETY
COST RECOVERY 1.2 142,905 124,071 119,611
TOTAL ADMINISTRATION / ENVIRON 12.0 1,289,627 1,419,110 1,295,813 HLTH & SAFETY
61

Business and Financial Affairs
ADMINISTRATION / HUMAN RESOURCES Budget FY2017-18 FY2016-17 FY2015-16 Time Base Budget Actual Actual
SALARIES MANAGEMENT 8.0 754,552 746,423 747,065 SUPPORT STAFF 17.2 807,645 783,896 751,727 STUDENT ASSISTANT 0.5 10,000 3,265 8,492 OVERTIME 0 14,641 7,596 WORK STUDY ON CAMPUS 0 6,288 4,723
TOTAL SALARIES 25.7 1,572,197 1,554,512 1,519,603
BENEFITS 822,708 865,805 798,697
SUBTOTAL PERSONAL SERVICES 25.7 2,394,905 2,420,317 2,318,300
OPERATING EXPENSES SUPPLIES 163,942 7,530 17,592 MEDICAL EXAMS 14,231 5,934 7,137 OTHER 0 160,894 217,093
SUBTOTAL OPERATING EXPENSES 178,173 174,358 241,822
TOTAL NON-REVENUE-BASED 25.7 2,573,078 2,594,675 2,560,122 ADMINISTRATION / HUMAN RESOURCES
COST RECOVERY 0.5 113,445 124,397 104,569
TOTAL ADMINISTRATION / HUMAN 26.2 2,686,523 2,719,071 2,664,690 RESOURCES
62

Business and Financial Affairs
ADMINISTRATION / UNIVERSITY POLICE Budget FY2017-18 FY2016-17 FY2015-16 Time Base Budget Actual Actual
SALARIES MANAGEMENT 5.0 626,480 511,258 520,210 SUPPORT STAFF 22.5 1,784,895 1,448,799 1,196,465 STUDENT ASSISTANT 0 76,074 46,037 NIGHT SHIFT DIFFERENTIAL 23,500 23,432 22,427 POST CERT/SPEC ASSIGNMENT STIP 98,400 98,450 67,200 OVERTIME 208,125 252,261 212,328
TOTAL SALARIES 27.5 2,741,400 2,410,275 2,064,667
BENEFITS 1,443,717 1,255,044 1,007,319
SUBTOTAL PERSONAL SERVICES 27.5 4,185,117 3,665,319 3,071,985
OPERATING EXPENSES SUPPLIES 46,717 81,027 47,894 OTHER 0 730,995 322,821
SUBTOTAL OPERATING EXPENSES 46,717 812,022 370,715
TOTAL NON-REVENUE-BASED 27.5 4,231,834 4,477,341 3,442,700 ADMINISTRATION / UNIVERSITY POLICE
COST RECOVERY 23.8 2,815,208 2,461,628 2,984,902
TOTAL ADMINISTRATION / UNIVERSITY 51.3 7,047,042 6,938,970 6,427,602 POLICE
63

Business and Financial Affairs
BUSINESS OPERATIONS / ASSOC VICE PRESIDENT Budget FY2017-18 FY2016-17 FY2015-16 Time Base Budget Actual Actual
SALARIES MANAGEMENT 2.0 305,976 305,976 299,112 SUPPORT STAFF 0 0 16,906
TOTAL SALARIES 2.0 305,976 305,976 316,018
BENEFITS 161,138 143,880 142,410
SUBTOTAL PERSONAL SERVICES 2.0 467,114 449,856 458,428
OPERATING EXPENSES SUPPLIES 15,000 195 0 OTHER 0 11,769 14,698
SUBTOTAL OPERATING EXPENSES 15,000 11,964 14,698
TOTAL BUSINESS OPERATIONS / ASSOC 2.0 482,114 461,820 473,125 VICE PRESIDENT
64

Business and Financial Affairs
BUSINESS OPERATIONS / ENTERPRISE TECH SVCS Budget FY2017-18 FY2016-17 FY2015-16 Time Base Budget Actual Actual
SALARIES MANAGEMENT 7.0 876,103 923,724 839,333 SUPPORT STAFF 47.0 3,462,216 3,391,112 3,191,948 STUDENT ASSISTANT 0 0 58,425 NIGHT SHIFT DIFFERENTIAL 0 4,765 5,028 OVERTIME 80,000 121,183 131,013 WORK STUDY ON CAMPUS 0 2,122 3,897
TOTAL SALARIES 54.0 4,418,319 4,442,906 4,229,645
BENEFITS 2,326,842 2,346,298 2,137,767
SUBTOTAL PERSONAL SERVICES 54.0 6,745,161 6,789,204 6,367,412
OPERATING EXPENSES IT HARDWARE 853,087 540,370 881,153 IT SOFTWARE 60,000 134,905 306,707 SUPPLIES 348,935 14,475 74,569 OTHER (1,056,000) (422,740) (932,722)
SUBTOTAL OPERATING EXPENSES 206,022 267,011 329,707
TOTAL NON-REVENUE-BASED 54.0 6,951,183 7,056,215 6,697,119 BUSINESS OPERATIONS / ENTERPRISE TECH SVCS
REVENUE-BASED 1,500 3,120 20,571
TOTAL BUSINESS OPERATIONS / 54.0 6,952,683 7,059,335 6,717,689 ENTERPRISE TECH SVCS
65

Business and Financial Affairs
BUSINESS OPERATIONS / FACILITIES SERVICES AND Budget FY2017-18 FY2016-17 FY2015-16 BUSINESS SERVICES Time Base Budget Actual Actual SALARIES MANAGEMENT 14.9 1,376,623 1,248,370 1,222,849 SUPPORT STAFF 189.2 8,679,765 7,489,452 7,821,364 STUDENT ASSISTANT 5.7 113,000 131,845 166,707 NIGHT SHIFT DIFFERENTIAL 182,000 211,931 207,127 ASBESTOS & WATER TREATMENT PAY 1,000 2,805 2,190 OVERTIME 178,448 359,007 391,329 WORK STUDY ON CAMPUS 0 0 1,758
TOTAL SALARIES 209.8 10,530,836 9,443,410 9,813,323
BENEFITS 5,389,138 5,950,641 6,027,796
SUBTOTAL PERSONAL SERVICES 209.8 15,919,974 15,394,051 15,841,118
OPERATING EXPENSES SUPPLIES 1,456,754 150,812 1,970,325 SERVICES 31,200 85,430 1,125,199 OTHER 0 6,223,834 1,589,228
SUBTOTAL OPERATING EXPENSES 1,487,954 6,460,076 4,684,752
TOTAL NON-REVENUE-BASED 209.8 17,407,928 21,854,127 20,525,870 BUSINESS OPERATIONS / FACILITIES SERVICES AND BUSINESS SERVICES
COST RECOVERY 21.1 1,965,354 632,608 1,852,514
TOTAL BUSINESS OPERATIONS / 230.9 19,373,282 22,486,735 22,378,384 FACILITIES SERVICES AND BUSINESS SERVICES
66

Business and Financial Affairs
FINANCIAL OPERATIONS / UNIVERSITY CONTROLLER Budget FY2017-18 FY2016-17 FY2015-16 Time Base Budget Actual Actual
SALARIES MANAGEMENT 5.0 567,168 579,407 547,236 SUPPORT STAFF 5.0 224,784 178,287 168,228 STUDENT ASSISTANT 0.6 12,643 88,218 69,408 OVERTIME 1,000 4,808 7,065 WORK STUDY ON CAMPUS 0 10,476 10,156
TOTAL SALARIES 10.6 805,595 861,196 802,093
BENEFITS 1,304,018 1,431,022 1,176,799
SUBTOTAL PERSONAL SERVICES 10.6 2,109,613 2,292,218 1,978,891
OPERATING EXPENSES SUPPLIES 34,380 877 8,966 OTHER 0 205,523 156,444
SUBTOTAL OPERATING EXPENSES 34,380 206,401 165,410
TOTAL NON-REVENUE-BASED 10.6 2,143,993 2,498,618 2,144,301 FINANCIAL OPERATIONS / UNIVERSITY CONTROLLER
COST RECOVERY 2.0 371,855 406,531 489,651
REVENUE-BASED 32.7 1,821,752 1,854,827 1,694,022
TOTAL FINANCIAL OPERATIONS / 45.3 4,337,600 4,759,976 4,327,974 UNIVERSITY CONTROLLER
67

Business and Financial Affairs
FINANCIAL OPERATIONS/ASSOC VP, AUDIT & TAX, BUD & FIN, AND Budget FY2017-18 FY2016-17 FY2015-16 CONTRACT & PR Time Base Budget Actual Actual SALARIES MANAGEMENT 5.0 684,060 581,952 494,523 SUPPORT STAFF 11.8 715,560 705,889 612,105 STUDENT ASSISTANT 0 290 3,291 OVERTIME 0 4,541 3,275
TOTAL SALARIES 16.8 1,399,620 1,292,672 1,113,194
BENEFITS 737,089 651,568 543,815
SUBTOTAL PERSONAL SERVICES 16.8 2,136,709 1,944,240 1,657,009
OPERATING EXPENSES SUPPLIES 78,406 3,891 5,089 OTHER 0 72,587 99,800
SUBTOTAL OPERATING EXPENSES 78,406 76,478 104,889
TOTAL NON-REVENUE-BASED 16.8 2,215,115 2,020,718 1,761,898 FINANCIAL OPERATIONS/ASSOC VP, AUDIT & TAX, BUD & FIN, AND CONTRACT & PR
COST RECOVERY 4.0 420,080 348,350 270,662
TOTAL FINANCIAL OPERATIONS/ASSOC 20.8 2,635,195 2,369,069 2,032,561 VP, AUDIT & TAX, BUD & FIN, AND CONTRACT & PR
68

Business and Financial Affairs
REAL ESTATE PLANNING & DEVELOPMENT / ASSOC VICE Budget FY2017-18 FY2016-17 FY2015-16 PRESIDENT Time Base Budget Actual Actual SALARIES MANAGEMENT 1.0 181,116 181,116 176,868
TOTAL SALARIES 1.0 181,116 181,116 176,868
BENEFITS 95,382 75,910 71,299
SUBTOTAL PERSONAL SERVICES 1.0 276,498 257,026 248,167
OPERATING EXPENSES SUPPLIES 25,000 43 182 OTHER 0 19,886 12,930
SUBTOTAL OPERATING EXPENSES 25,000 19,929 13,113
TOTAL REAL ESTATE PLANNING & 1.0 301,498 276,955 261,280 DEVELOPMENT / ASSOC VICE PRESIDENT
69

Business and Financial Affairs
REAL ESTATE PLANNING & DEVELOPMENT / PLANNING, Budget FY2017-18 FY2016-17 FY2015-16 DESIGN & CONSTR Time Base Budget Actual Actual SALARIES MANAGEMENT 3.5 415,620 463,691 364,696 SUPPORT STAFF 6.7 439,810 422,141 363,814 STUDENT ASSISTANT 0.8 15,984 73,794 20,671 OVERTIME 1,525 7,256 749
TOTAL SALARIES 11.0 872,939 966,882 749,930
BENEFITS 448,970 496,310 341,713
SUBTOTAL PERSONAL SERVICES 11.0 1,321,909 1,463,191 1,091,643
OPERATING EXPENSES SUPPLIES 43,023 192,171 251,866 OTHER 0 3,024,584 6,918,091
SUBTOTAL OPERATING EXPENSES 43,023 3,216,756 7,169,956
TOTAL NON-REVENUE-BASED REAL 11.0 1,364,932 4,679,947 8,261,599 ESTATE PLANNING & DEVELOPMENT / PLANNING, DESIGN & CONSTR
COST RECOVERY 9.5 2,333,429 2,755,420 1,713,926
TOTAL REAL ESTATE PLANNING & 20.5 3,698,361 7,435,367 9,975,525 DEVELOPMENT / PLANNING, DESIGN & CONSTR
70

Business and Financial Affairs
INSTITUTIONAL Budget FY2017-18 FY2016-17 FY2015-16 Time Base Budget Actual Actual
SALARIES
ERP MANAGEMENT 1.0 135,528 135,528 132,876 MANAGEMENT 1.0 70,000 19,000 0 CO-GEN SUPPORT STAFF 6.3 403,909 345,790 345,930 ERP SUPPORT STAFF 8.6 597,713 458,867 385,971 CO-GEN STUDENT ASSISTANT 0.1 1,000 0 0 CO-GEN NIGHT SHIFT DIFFERENTIAL 10,800 11,452 10,610
ERP OVERTIME 0 1,317 9,057
CO-GEN OVERTIME 65,000 99,183 96,464
TOTAL SALARIES 17.0 1,283,950 1,071,137 980,908
BENEFITS 506,979 481,278 415,584
SUBTOTAL PERSONAL SERVICES 17.0 1,790,929 1,552,415 1,396,492
OPERATING EXPENSES ERP 1,592,420 1,161,919 1,820,026 UTILITIES - GAS 3,113,584 3,572,305 3,517,555
UTILITIES - ELECTRICITY 4,015,115 3,640,405 3,134,614
UTILITIES - WATER 1,201,358 1,097,167 809,944
UTILITIES - SEWAGE 657,623 570,258 502,946
UTILITIES - HAZARDOUS WASTE 249,000 290,599 275,205 UTILITIES - OTHER 580,580 427,626 359,611
INSURANCE EXPENSE 3,821,038 4,459,897 4,318,646
LEGAL SETTLEMENT COSTS 450,000 1,051,208 536,715 CONTRACTUAL SERVICES 2,900,394 2,876,124 2,831,720
CO-GEN SUPPLIES 955,869 1,159,448 1,141,398
SUPPLIES 65,550 5,069 9,100 SERVICES 497,400 84,224 247,511
SPACE RENT 10,818 9,940 9,247 STATE GEN SERVICES 3,000 976 1,374 OTHER 0 712,738 595,748
SUBTOTAL OPERATING EXPENSES 20,113,749 21,119,902 20,111,360
TOTAL NON-REVENUE-BASED 17.0 21,904,678 22,672,316 21,507,852 INSTITUTIONAL REVENUE-BASED 155,000 202,258 118,374
TOTAL INSTITUTIONAL 17.0 22,059,678 22,874,574 21,626,226 TOTAL Business and Financial Affairs 494.9 76,542,950 83,478,776 82,382,103 Division
71

Student Affairs 2017-18 Budget Summary
2015-16 Actual
Expense (1)
2016-17 Actual
Expense (1)
Salaries / Wages
Benefits
2017-18 Budget(2)
OEE SubTotal
Cost Recovery (3)
Revenue- Based (4)
Total
OFFICE OF THE VICE PRESIDENT - SA 2,238,612 4,017,051 1,339,360 593,175 977,808 2,910,343 73,211 0 2,983,554 ASSOCIATE VICE PRESIDENT (AM) 4,142,639 4,813,537 1,260,766 3,701,680 286,843 5,249,289 126,700 58,000 5,433,989
STUDENT HEALTH SERVICES REVENUE 10,167,777 10,093,680 0 0 0 0 0 10,936,000 10,936,000 ASSOCIATE VICE PRESIDENT (CS) 3,275,418 3,400,819 835,932 474,453 1,181,432 2,491,817 425,964 840,000 3,757,781 ASSOCIATE VICE PRESIDENT (TC) 6,757,574 6,492,458 3,829,644 1,661,275 692,050 6,182,969 0 0 6,182,969 ASSOCIATE VICE PRESIDENT (VF) 2,591,248 2,842,824 1,312,476 569,343 156,467 2,038,286 433,500 0 2,471,786 SubTotal 29,173,268 31,660,369 8,578,178 6,999,926 3,294,600 18,872,704 1,059,375 11,834,000 31,766,079
INSTITUTIONAL 43,548 53,423 0 0 56,900 56,900 0 0 56,900 Total 29,216,816 31,713,792 8,578,178 6,999,926 3,351,500 18,929,604 1,059,375 11,834,000 31,822,979
(1) Actuals include use of prior year carryforwards.
(2) Includes current year allocations only.
(3) Cost Recovery includes associated benefits.
(4) Revenue-based benefits are included in Benefits category.
73

Student Affairs – Summary
Budget FY2017-18 FY2016-17 FY2015-16 Time Base Budget Actual Actual
SALARIES SSPAR/ASST DEANS/OTHER 4.0 340,536 364,463 362,279 MANAGEMENT 35.8 3,374,894 3,384,570 3,222,315 SUPPORT STAFF 89.8 4,861,748 4,563,629 4,734,329 STUDENT ASSISTANT 0 862,413 781,027 NIGHT SHIFT DIFFERENTIAL 0 1,009 670 OVERTIME 0 1,740 154 WORK STUDY ON CAMPUS 1,000 52,058 70,460 WORK STUDY OFF CAMPUS 0 12,820 9,033
TOTAL SALARIES 129.6 8,578,178 9,242,703 9,180,267
BENEFITS 6,999,926 6,648,429 6,329,072 SUBTOTAL PERSONAL SERVICES 129.6 15,578,104 15,891,132 15,509,338
OPERATING EXPENSES SUPPLIES 3,266,632 417,721 321,641 SPACE RENT 56,900 47,381 34,817 SERVICES 22,968 150,531 188,630 IT SOFTWARE 5,000 10,070 300 OTHER 0 3,192,467 1,411,688
SUBTOTAL OPERATING EXPENSES 3,351,500 3,818,170 1,957,076
TOTAL NON-REVENUE-BASED Student Affairs - 129.6 18,929,604 19,709,302 17,466,415 Summary
COST RECOVERY 11.1 1,059,375 995,117 705,997
REVENUE-BASED 123.0 11,834,000 11,009,373 11,044,405
TOTAL Student Affairs - Summary 263.7 31,822,979 31,713,792 29,216,816
75

Student Affairs
OFFICE OF THE VICE PRESIDENT - SA Budget FY2017-18 FY2016-17 FY2015-16 Time Base Budget Actual Actual
SALARIES MANAGEMENT 6.0 1,008,444 1,040,105 1,027,871 SUPPORT STAFF 7.0 329,916 179,320 155,940 STUDENT ASSISTANT 0 28,497 30,427 WORK STUDY ON CAMPUS 1,000 0 373
TOTAL SALARIES 13.0 1,339,360 1,247,922 1,214,611
BENEFITS 593,175 609,066 534,754
SUBTOTAL PERSONAL SERVICES 13.0 1,932,535 1,856,987 1,749,364
OPERATING EXPENSES SUPPLIES 977,808 194,420 177,025 OTHER 0 1,917,528 289,673
SUBTOTAL OPERATING EXPENSES 977,808 2,111,948 466,698
TOTAL NON-REVENUE-BASED 13.0 2,910,343 3,968,935 2,216,062 OFFICE OF THE VICE PRESIDENT - SA
COST RECOVERY 73,211 48,116 22,549
REVENUE-BASED 0 48,116 0
TOTAL OFFICE OF THE 13.0 2,983,554 4,017,051 2,238,612 VICE PRESIDENT - SA
76

Student Affairs
ASSOCIATE VICE PRESIDENT (AM) Budget FY2017-18 FY2016-17 FY2015-16 Time Base Budget Actual Actual
SALARIES SSPAR/ASST DEANS/OTHER 0 26,287 69,617 MANAGEMENT 5.0 386,612 402,991 391,683 SUPPORT STAFF 13.8 874,154 956,092 829,326 STUDENT ASSISTANT 0 93,135 56,353 NIGHT SHIFT DIFFERENTIAL 0 1,009 670 WORK STUDY ON CAMPUS 0 17,867 19,337 WORK STUDY OFF CAMPUS 0 0 410
TOTAL SALARIES 18.8 1,260,766 1,497,381 1,367,396
BENEFITS 3,701,680 2,636,376 2,497,604
SUBTOTAL PERSONAL SERVICES 18.8 4,962,446 4,133,757 3,865,000
OPERATING EXPENSES SUPPLIES 281,843 39,911 10,158 IT SOFTWARE 5,000 10,070 300 OTHER 0 364,816 88,515
SUBTOTAL OPERATING EXPENSES 286,843 414,797 98,973
TOTAL NON-REVENUE-BASED 18.8 5,249,289 4,548,554 3,963,973 ASSOCIATE VICE PRESIDENT (AM)
COST RECOVERY 1.0 126,700 222,611 112,617
REVENUE-BASED 111.7 10,994,000 10,136,052 10,233,542
TOTAL ASSOCIATE 131.5 16,369,989 14,907,217 14,310,132 VICE PRESIDENT (AM)
77

Student Affairs
ASSOCIATE VICE PRESIDENT (CS) Budget FY2017-18 FY2016-17 FY2015-16 Time Base Budget Actual Actual
SALARIES MANAGEMENT 6.0 431,460 411,913 338,098 SUPPORT STAFF 8.0 404,472 222,640 218,113 STUDENT ASSISTANT 0 388,946 331,899 WORK STUDY ON CAMPUS 0 6,252 9,308
TOTAL SALARIES 14.0 835,932 1,029,752 897,418
BENEFITS 474,453 512,094 448,796
SUBTOTAL PERSONAL SERVICES 14.0 1,310,385 1,541,846 1,346,214
OPERATING EXPENSES SUPPLIES 1,181,432 59,020 59,892 OTHER 0 568,964 732,538
SUBTOTAL OPERATING EXPENSES 1,181,432 627,984 792,430
TOTAL NON-REVENUE-BASED 14.0 2,491,817 2,169,830 2,138,644 ASSOCIATE VICE PRESIDENT (CS)
COST RECOVERY 4.7 425,964 357,668 326,195
REVENUE-BASED 11.3 840,000 873,321 810,578
TOTAL ASSOCIATE 30.0 3,757,781 3,400,819 3,275,418 VICE PRESIDENT (CS)
78
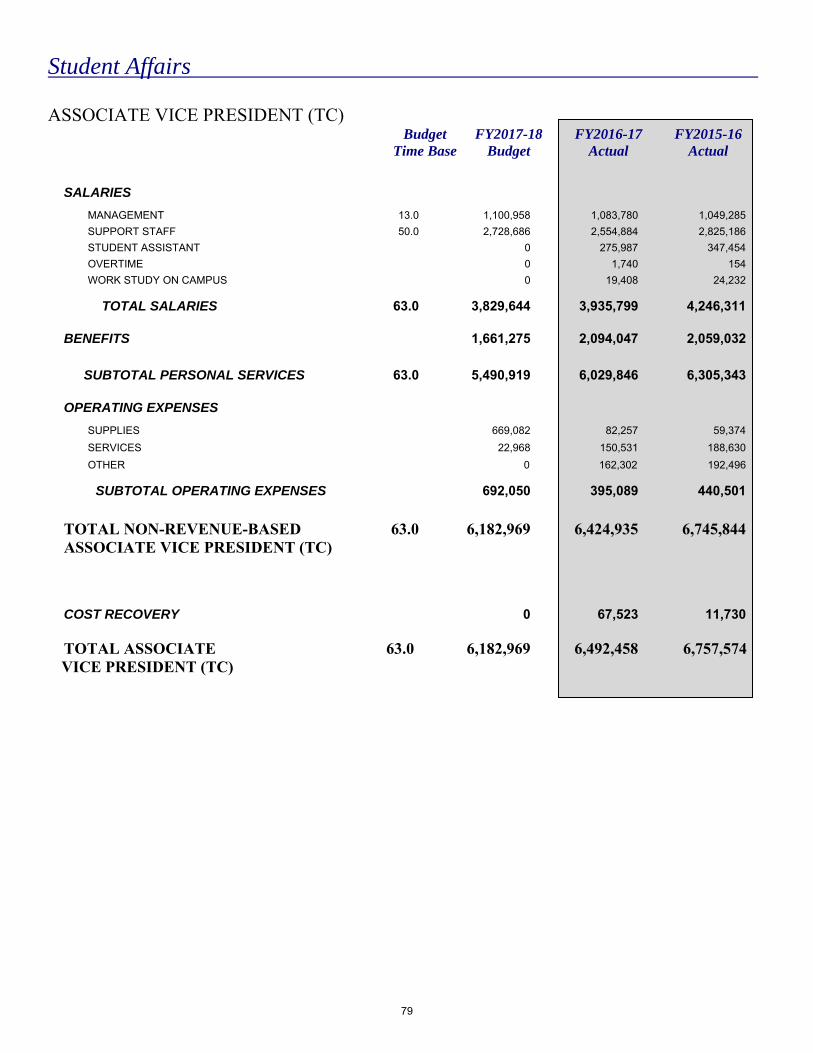
Student Affairs
ASSOCIATE VICE PRESIDENT (TC) Budget FY2017-18 FY2016-17 FY2015-16 Time Base Budget Actual Actual
SALARIES MANAGEMENT 13.0 1,100,958 1,083,780 1,049,285 SUPPORT STAFF 50.0 2,728,686 2,554,884 2,825,186 STUDENT ASSISTANT 0 275,987 347,454 OVERTIME 0 1,740 154 WORK STUDY ON CAMPUS 0 19,408 24,232
TOTAL SALARIES 63.0 3,829,644 3,935,799 4,246,311
BENEFITS 1,661,275 2,094,047 2,059,032
SUBTOTAL PERSONAL SERVICES 63.0 5,490,919 6,029,846 6,305,343
OPERATING EXPENSES SUPPLIES 669,082 82,257 59,374 SERVICES 22,968 150,531 188,630 OTHER 0 162,302 192,496
SUBTOTAL OPERATING EXPENSES 692,050 395,089 440,501
TOTAL NON-REVENUE-BASED 63.0 6,182,969 6,424,935 6,745,844 ASSOCIATE VICE PRESIDENT (TC)
COST RECOVERY 0 67,523 11,730
TOTAL ASSOCIATE 63.0 6,182,969 6,492,458 6,757,574 VICE PRESIDENT (TC)
79

Student Affairs
ASSOCIATE VICE PRESIDENT (VF) Budget FY2017-18 FY2016-17 FY2015-16 Time Base Budget Actual Actual
SALARIES SSPAR/ASST DEANS/OTHER 4.0 340,536 338,176 292,662 MANAGEMENT 5.8 447,420 445,781 415,379 SUPPORT STAFF 11.0 524,520 650,694 705,764 STUDENT ASSISTANT 0 75,848 14,893 WORK STUDY ON CAMPUS 0 8,530 17,211 WORK STUDY OFF CAMPUS 0 12,820 8,623
TOTAL SALARIES 20.8 1,312,476 1,531,849 1,454,531
BENEFITS 569,343 796,846 788,885
SUBTOTAL PERSONAL SERVICES 20.8 1,881,819 2,328,695 2,243,417
OPERATING EXPENSES SUPPLIES 156,467 42,113 15,192 OTHER 0 172,816 99,734
SUBTOTAL OPERATING EXPENSES 156,467 214,929 114,926
TOTAL NON-REVENUE-BASED 20.8 2,038,286 2,543,625 2,358,343 ASSOCIATE VICE PRESIDENT (VF)
COST RECOVERY 5.4 433,500 299,199 232,905
TOTAL ASSOCIATE 26.2 2,471,786 2,842,824 2,591,248 VICE PRESIDENT (VF)
80

Student Affairs
INSTITUTIONAL Budget FY2017-18 FY2016-17 FY2015-16 Time Base Budget Actual Actual
OPERATING EXPENSES SPACE RENT 56,900 47,381 34,817 OTHER 0 6,042 8,731
SUBTOTAL OPERATING EXPENSES 56,900 53,423 43,548
TOTAL INSTITUTIONAL 56,900 53,423 43,548
TOTAL Student Affairs Division 263.7 31,822,979 31,713,792 29,216,816
81

University Relations and Development2017-18 Budget Summary
2015-16 Actual
2016-17 Actual
2017-18 Budget(2)
Salaries / Wages
Benefits OEE SubTotal Cost Recovery (3)
TotalRevenue-Based (4)Expense (1)Expense (1)
UNIVERSITY RELATIONS AND DEVELOPMENT 11,743,659 10,692,877 2,680,2274,624,663 604,350 7,909,240 0 8,617,444708,204
11,743,659 10,692,877SubTotal 4,624,663 2,680,227 604,350 8,617,44407,909,240 708,204
INSTITUTIONAL 434,102 439,873 00 998,500 998,500 0 998,5000
12,177,761 11,132,750Total 4,624,663 2,680,227 1,602,850 9,615,94408,907,740 708,204
(3) Cost Recovery includes associated benefits.
(4) Revenue-based benefits are included in Benefits category.
(1) Actuals include use of prior year carryforwards.
(2) Includes current year allocations only.
83

University Relations and Development - Summary
Budget FY2017-18 FY2016-17 FY2015-16 Time Base Budget Actual Actual SALARIES MANAGEMENT 41.0 3,093,803 4,184,110 4,434,889 SUPPORT STAFF 35.0 1,500,000 1,916,079 2,094,985 STUDENT ASSISTANT 1.0 23,000 24,674 26,845 OVERTIME 0 4,611 3,243 WORK STUDY ON CAMPUS 0.4 7,860 2,427 2,347
TOTAL SALARIES 77.4 4,624,663 6,131,901 6,562,309
BENEFITS 2,680,227 3,107,934 3,275,858 SUBTOTAL PERSONAL SERVICES 77.4 7,304,890 9,239,835 9,838,167
OPERATING EXPENSES SERVICES 535,250 334,426 269,064 OTHER 1,067,600 475,704 939,211
SUBTOTAL OPERATING EXPENSES 1,602,850 810,130 1,208,275
TOTAL NON-REVENUE-BASED University 77.4 8,907,740 10,049,965 11,046,443 Relations and Development - Summary
COST RECOVERY 708,204 702,065 762,466
REVENUE-BASED 0 380,720 368,852
TOTAL University Relations and Development - 77.4 9,615,944 11,132,750 12,177,761 Summary
85

University Relations and Development
UNIVERSITY RELATIONS AND DEVELOPMENT Budget FY2017-18 FY2016-17 FY2015-16 Time Base Budget Actual Actual
SALARIES MANAGEMENT 41.0 3,093,803 4,184,110 4,434,889 SUPPORT STAFF 35.0 1,500,000 1,916,079 2,094,985 STUDENT ASSISTANT 1.0 23,000 24,674 26,845 OVERTIME 0 4,611 3,243 WORK STUDY ON CAMPUS 0.4 7,860 2,427 2,347
TOTAL SALARIES 77.4 4,624,663 6,131,901 6,562,309
BENEFITS 2,680,227 3,106,299 3,274,599
SUBTOTAL PERSONAL SERVICES 77.4 7,304,890 9,238,200 9,836,908
OPERATING EXPENSES SERVICES 526,750 281,394 217,269 OTHER 77,600 471,218 927,017
SUBTOTAL OPERATING EXPENSES 604,350 752,612 1,144,286
TOTAL NON-REVENUE-BASED 77.4 7,909,240 9,990,812 10,981,193 UNIVERSITY RELATIONS AND DEVELOPMENT
COST RECOVERY 708,204 702,065 762,466
TOTAL UNIVERSITY RELATIONS AND 77.4 8,617,444 10,692,877 11,743,659 DEVELOPMENT
86
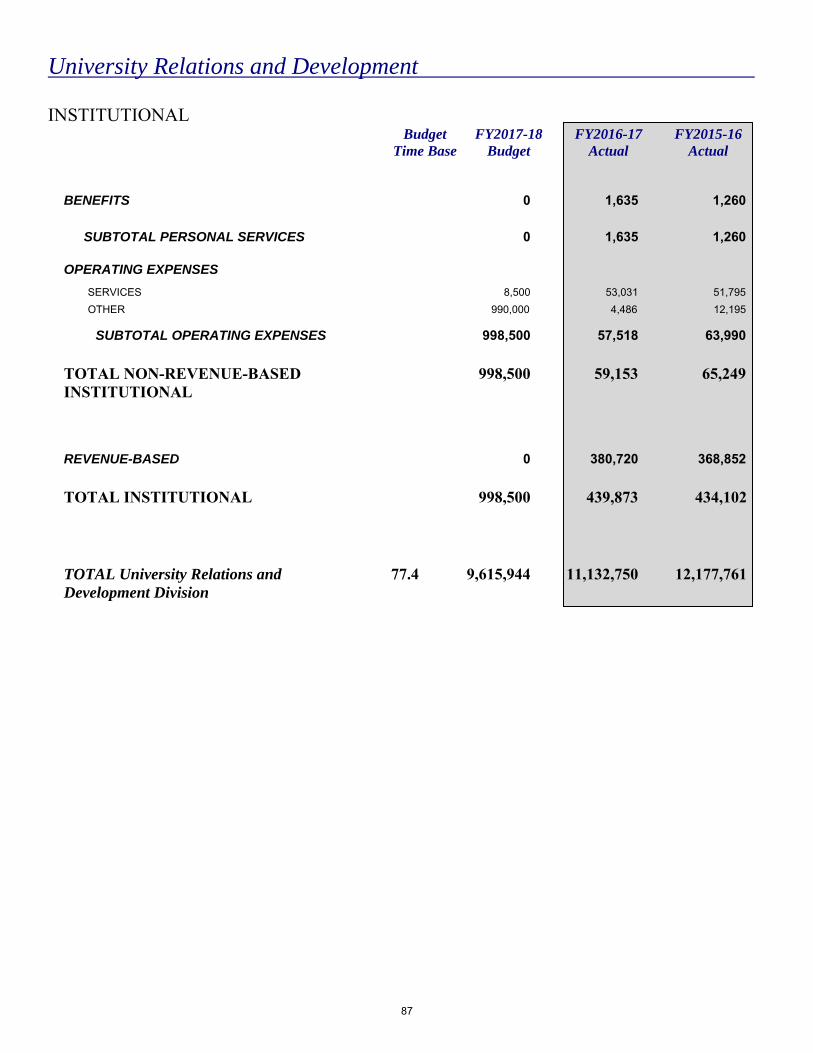
University Relations and Development
INSTITUTIONAL Budget FY2017-18 FY2016-17 FY2015-16 Time Base Budget Actual Actual
BENEFITS 0 1,635 1,260
SUBTOTAL PERSONAL SERVICES 0 1,635 1,260
OPERATING EXPENSES SERVICES 8,500 53,031 51,795 OTHER 990,000 4,486 12,195
SUBTOTAL OPERATING EXPENSES 998,500 57,518 63,990
TOTAL NON-REVENUE-BASED 998,500 59,153 65,249 INSTITUTIONAL
REVENUE-BASED 0 380,720 368,852
TOTAL INSTITUTIONAL 998,500 439,873 434,102
TOTAL University Relations and 77.4 9,615,944 11,132,750 12,177,761 Development Division
87

Institutional2017-18 Budget Summary
2015-16 Actual
2016-17 Actual
2017-18 Budget(2)
Salaries / Wages
Benefits OEE SubTotal Cost Recovery (3)
TotalRevenue-Based (4)Expense (1)Expense (1)
INSTITUTIONAL 1,917,506 1,143,904 017,801,997 4,304,441 22,106,438 0 22,106,4380
1,917,506 1,143,904Total 17,801,997 0 4,304,441 22,106,438022,106,438 0
(3) Cost Recovery includes associated benefits.
(4) Revenue-based benefits are included in Benefits category.
(1) Actuals include use of prior year carryforwards.
(2) Includes current year allocations only.
89

Institutional Budget FY2017-18 FY2016-17 FY2015-16 Time Base Budget Actual Actual
REVENUE STATE APPROPRIATION (190,147,596) (182,262,596) (167,276,596) BASIC TUITION FEE (175,224,000) (178,187,764) (176,370,545) SUG/TUITION FEE DISCOUNT 43,529,646 33,671,599 36,506,543 ED.D. GRANT 128,154 56,982 97,410 NON RESIDENT TUITION (18,022,000) (23,972,614) (20,636,843) FOREIGN TUITION (13,838,000) (20,099,775) (18,784,001)
APPLICATION FEE (2,294,000) (3,420,505) (3,415,845) NON-COURSE RELATED FEES (360,000) (382,913) (365,961) REVENUE-BASED (17,452,937) (17,387,070) (17,271,572) DOCTORATE IN PHYSICAL THERAPY TUITION FEE (2,413,226) (2,210,323) (1,376,661)
GRADUATE BUSINESS PROF FEE (2,060,371) (2,116,010) (2,490,034)
STUDENT SUCCESS FEE (13,000,000) (9,969,567) (6,456,264) COST-RECOVERY (24,307,077) (24,442,981) (20,670,536)
FED FIN AID ADMIN ALLOWANCE (230,000) (221,201) (218,191) AUXILIARY AUDIT REIMBURSEMENT (136,104) (136,104) (136,104) OTHER 0 (9,678,313) (3,648,128)
TOTAL REVENUE (415,827,511) (440,759,157) (402,513,328)
SALARIES COMPENSATION INCREASE 17,801,997 0 0 SUPPORT STAFF 0 6,103 50,916
TOTAL SALARIES 17,801,997 6,103 50,916
BENEFITS 0 (54,970) (182,853)
SUBTOTAL PERSONAL SERVICES 17,801,997 (48,867) (131,937)
OPERATING EXPENSES STATE E.O.P. GRANT 1,598,390 916,460 1,595,005 DOCTORATE IN PHYSICAL THERAPY GRANT 804,409 648,000 628,000 GRADUATE BUSINESS PROF FEE GRANT 515,093 513,945 584,032 GRAD EQUITY GRANT 70,363 71,000 94,000
RESERVES 1,316,186 0 0 OTHER 0 (956,633) (851,593)
SUBTOTAL OPERATING EXPENSES 4,304,441 1,192,772 2,049,444
TOTAL NON-REVENUE-BASED 22,106,438 1,143,904 1,917,506 INSTITUTIONAL TOTAL INSTITUTIONAL (393,721,073) (439,615,253) (400,595,822)
TOTAL Institutional Division (393,721,073) (439,615,253) (400,595,822)
91

San Diego State University 2017/2018 Other Funds
FY 2017/18Fund Budget
LOTTERY FUND
Revenue is derived from sale of lottery tickets and allocated to the university by the Board of Trustees. Funds are restricted by Education Code Section 89722.5 and Government Code Section 8880.5 to be used for instructionally related purposes.
Lottery Allocation $2,465,000
Outreach & Scholarship Programs $537,000 Instructional & Academic Support Programs 1,928,000 Total Expense $2,465,000
CONTINUING EDUCATION
Revenue is derived from fees of students enrolled in extension classes and self- supporting instructional programs in accordance with Education Code Section 89704.
Total Revenue $16,007,457
On-Campus Expenditures $9,079,330 Reimbursements to the University Operating Fund and Internal Service Funds $6,194,040 Systemwide Expenses 389,987 Transfer to Debt Service 344,100 Total Expense $16,007,457
HOUSING
Revenue is derived from room license fees for housing facilities. Revenue and expenses are governed by Education Code Sections 89700, 90012 ,90068 and 90079, Executive Order 740 and Section 42004 of Title 5, California Code of Regulations. Funds are restricted for housing program operations, maintenance and repairs and future capital outlay.
Total Revenue $49,208,215
On-Campus Expenditures $29,241,177 Reimbursements to the University Operating Fund and Internal Service Funds $4,122,736 Systemwide Expenses 416,370 Transfer to Debt Service 15,427,932 Total Expense $49,208,215
93

San Diego State University 2017/2018 Other Funds
FY 2017/18Fund Budget
PARKING FEES
Revenue is derived from payment of parking fees, restricted by Education Code Sections 89701 & 90079, is to be used for parking program operations, maintenance and repair and future capital outlay.
Total Revenue $10,845,000
On-Campus Expenditures $5,440,084 Reimbursements to the University Operating Fund and Internal Service Funds $2,828,445 Systemwide Expenses 102,482 Transfer to Debt Service 2,473,989 Total Expense $10,845,000
PARKING FINES AND FORFEITURES
Revenue is derived from fines and forfeitures related to state and local parking violations. Revenues and expenditures are governed by the Education Code and Penal Code. Expenditures are to be used for the development, enhancement and operations of alternative methods of transportation and citation administration.
Total Revenue $602,000
On-Campus Expenditures $31,348 Reimbursements to the University Operating Fund and Internal Service Funds $570,652 Total Expense $602,000
ENTERPRISE FUNDS
Revenue is derived from fees charged to external users for campus goods or services such as testing and career services. Revenues and expenditures are governed by the Education Code.
Total Revenue $2,099,214
Total Expense $2,099,214
INTERNAL SERVICE FUNDS
Revenue is derived from fees charged to internal users for campus goods or services such as telecommunications or reprographics. Revenues and expenditures are governed by the Education Code.
Total Revenue $7,143,566
Total Expense $7,143,566
94

San Diego State University 2017/2018 Other Funds
FY 2017/18Fund Budget
ATHLETICS SELF-SUPPORT REVENUES
Non-appropriated expenditures are related to non-state athletic revenues such as ticket sales, corporate sponsorships and private donations. Funds are used for designated purposes consistent with Education Code Section 89721.
Total Revenue $38,283,793
Total Expense $38,283,793
SPECIAL PROJECTS
Non-appropriated expenditures that are related to conferences and special projects such as CSUPERB annual symposium and Field Stations Research. Funds are used for the designated purposes consistent with Education Code Section 89721.
Total Revenue $1,254,684
Total Expense $1,254,684
FEDERAL WORK STUDY
Authorization from Federal Department of Education to be used for work study student payroll, to include community service programs, and job location & development.
Total Revenue $1,151,824
Total Expense $1,151,824
GRAND TOTAL, Other Fund Expenditures $129,060,753
95
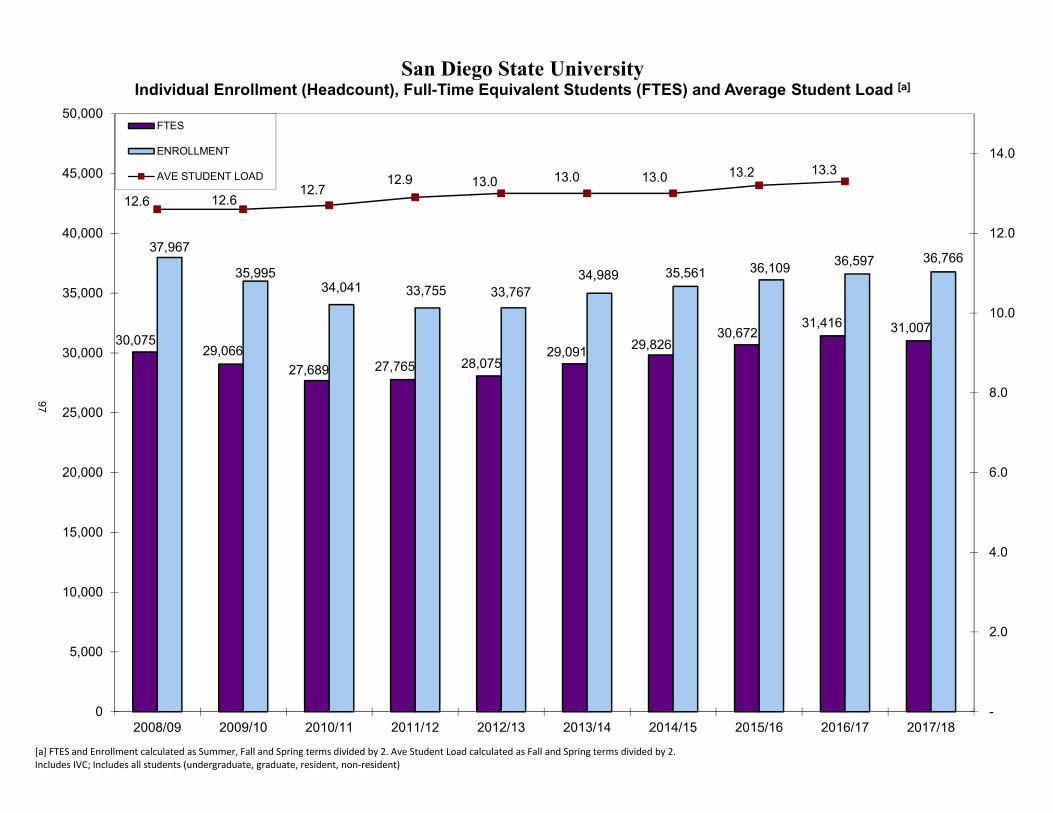
30,07529,066
27,689 27,765 28,07529,091 29,826
30,67231,416 31,007
37,967
35,99534,041 33,755 33,767
34,989 35,561 36,109 36,597 36,766
12.6 12.6 12.7
12.9 13.0 13.0 13.0 13.2 13.3
-
2.0
4.0
6.0
8.0
10.0
12.0
14.0
0
5,000
10,000
15,000
20,000
25,000
30,000
35,000
40,000
45,000
50,000
2008/09 2009/10 2010/11 2011/12 2012/13 2013/14 2014/15 2015/16 2016/17 2017/18
San Diego State UniversityIndividual Enrollment (Headcount), Full-Time Equivalent Students (FTES) and Average Student Load [a]
FTES
ENROLLMENT
AVE STUDENT LOAD
[a] FTES and Enrollment calculated as Summer, Fall and Spring terms divided by 2. Ave Student Load calculated as Fall and Spring terms divided by 2.Includes IVC; Includes all students (undergraduate, graduate, resident, non‐resident)
97

UOF ‐ STATE UNIVERSITY GRANT (tuition fee discount)
$43.7 M29.6%
UOF ‐ EQUAL OPPORTUNITY
GRANT$1.6 M1.1%
UOF ‐ MISC GRANTS$1.4 M1.0%
ATHLETICS GRANT‐IN‐AID
$9.0 M6.1%
UNIVERSITY SCHOLARSHIPS (1)$4.5 M3.1%MISC GRANTS (1)
$2.0 M1.4%
FEDERAL COLLEGE WORK STUDY (2)
$1.5 M1.0%
PELL GRANT PROGRAM (1)$48.0 M32.6%
CAL GRANT PROGRAM (1)$32.0 M21.7%
MIDDLE CLASS SCHOLARSHIP$3.5 M2.4%
$147.2 M
SAN DIEGO STATE UNIVERSITYFinancial Aid & Scholarships (excluding loans)
Sources by Program2017/18
(1) Estimate of funds to be awarded to students (2) Includes Federal funding and campus matching funds
99

TUITION & FEES/FINAID/LOANS$87.5 M 59.4%
HOUSING FEES$5.2 M3.5%
FEDERAL COLLEGE WORK STUDY (2)
$1.5 M 1.0%
DISBURSEMENTS TO STUDENTS$53.0 M36.1%
$147.2 M
SAN DIEGO STATE UNIVERSITYFinancial Aid & Scholarships (excluding loans)
Uses: Payments/Disbursements (1)
2017/18
(1) Estimated based on prior year distribution of awards(2) Includes Federal funding and campus matching funds
101

2016/17 Budget 2016/17 Projected Actual2016/17 Actual versus
Budget Variance 2017/18 Budget
2017/18 Budget versus 2016/17 Projected Actual
Variance
Source of Funds:Grants & Contracts F&A 17,850,000 18,800,000 950,000 19,800,000 1,000,000
Self‐Support Program Fees 3,304,000 3,204,000 (100,000) 3,268,000 64,000
Facilities Rents 5,835,000 5,607,000 (228,000) 5,696,000 89,000
Royalties and Other TTO Income 134,000 139,000 5,000 106,000 (33,000)
Investments 940,000 1,200,000 260,000 1,145,000 (55,000)
Total Source of Funds: 28,063,000$ 28,950,000$ 887,000$ 30,015,000$ 1,065,000$
Use of Funds:Administration & Operations 14,670,000 14,620,000 (50,000) 15,500,000 880,000
Facilities Expenses 7,299,000 7,119,000 (180,000) 7,242,000 123,000
Debt Service 3,354,000 3,281,000 (73,000) 3,287,000 6,000
Allocations for Enhanced Program Support:
Direct Support of Research 2,944,000 2,974,000 30,000 2,973,000 (1,000)
Support of Research Infrastructure 734,000 734,000 ‐ 751,000 17,000
Investment in Enhanced Service Initiatives 262,000 262,000 ‐ 262,000 ‐
Total Use of Funds: 29,263,000$ 28,990,000$ (273,000)$ 30,015,000$ 1,025,000$
Net funds to (from) Reserves: (1,200,000)$ (40,000)$ 1,160,000$ ‐$ 40,000$
Reserves:Beginning Balance 4,677,000 6,257,000 6,729,000
Activity 333,000 512,000 50,000
Net funds to (from) Reserves (1,200,000) (40,000) 1,160,000 ‐ 40,000
Ending Balance 3,810,000$ 6,729,000$ 1,160,000$ 6,779,000$ 40,000$
Reserve Designations:Income Equalization 500,000 500,000
Working Capital 2,095,000 2,508,000
Operating Contingency 1,413,000 1,000,000
Facilities 960,000 960,000
Insurance 805,000 855,000
Debt Service 956,000 956,000
Total 6,729,000$ 6,779,000$
2017/18 Budget ‐ SDSU RESEARCH FOUNDATION GENERAL FUND
103

2016/17 Budget [a] 2016/17 Projected Actual2016/17 Actual versus Budget
Variance 2017/18 Budget2017/18 Budget versus 2016/17
Projected Actual Variance
Source of Funds:Total Fee Revenue 8,890,228 8,890,228 ‐ 9,174,244 284,016 Corporate Administration 195,895 216,903 21,008 216,903 ‐ Student Government & Programs 66,750 67,045 295 58,750 (8,295) Aztec Student Union Board 36,000 82,635 46,635 37,000 (45,635) Aztec Nights 249,500 254,000 4,500 249,500 (4,500) Children's Center 2,083,841 2,122,716 38,875 2,211,166 88,450 Aztec Recreation 6,059,063 6,226,927 167,864 6,287,032 60,105 Mission Bay Aquatic Center 2,749,804 2,521,883 (227,921) 2,519,196 (2,687) Aztec Student Union/Scripps Cotta 1,307,132 1,551,694 244,562 1,403,268 (148,426) Viejas Arena/Open Air Theatre 4,698,543 5,201,152 502,609 5,606,148 404,996 Daily Aztec/KCR 170,430 184,778 14,348 174,576 (10,202) Imperial Valley Campus ‐
Total Source of Funds: 26,507,186$ 27,319,961$ 812,775$ 27,937,783$ 617,822$
Use of Funds:Corporate Administration 2,461,941 2,469,978 8,037 2,506,506 36,528 Student Government & Programs 1,595,893 1,656,494 60,601 1,746,855 90,361 Aztec Student Union Board 531,650 578,285 46,635 557,000 (21,285) Aztec Nights 324,500 329,000 4,500 324,500 (4,500) Children's Center 2,349,849 2,379,130 29,281 2,462,620 83,490 Aztec Recreation 5,715,504 5,767,702 52,198 5,902,285 134,583 Mission Bay Aquatic Center 2,667,436 2,378,715 (288,721) 2,412,828 34,113 Aztec Student Union/Scripps Cotta 4,283,119 4,300,548 17,429 4,577,392 276,844 Viejas Arena/Open Air Theatre 4,585,746 4,939,893 354,147 5,197,072 257,179 Daily Aztec/KCR 239,068 253,457 14,389 253,717 260 Minimum wage increase 70,000 ‐ (70,000) ‐ ‐ Imperial Valley Campus 183,491 183,491 ‐ 165,619 (17,872) Cap ex 1,414,221 2,276,512 862,291 1,400,899 (875,613)
‐ ‐ Total Use of Funds: 26,422,418$ 27,513,205$ 1,090,787$ 27,507,293$ (5,912)$
Net funds to (from) Reserves: 84,768$ (193,244)$ 430,490$ 623,734$
Reserves:Beginning Balance 15,295,395 15,295,395 ‐ 15,102,151 ActivityNet funds to (from) Reserves 84,768 (193,244) (278,012) 430,490 623,734 Ending Balance 15,380,163$ 15,102,151$ (278,012)$ 15,532,641$ 623,734$
Reserve Designations:General Working Capital 839,923 914,288 74,365 914,288 ‐ Facility Working Capital 2,884,902 2,506,675 (378,227) 2,506,675 ‐ Repair and Equipment Replacemen 7,936,159 8,302,788 366,629 8,433,278 130,490 Future Facility 3,719,179 3,378,399 (340,780) 3,678,399 300,000 Total 15,380,163$ 15,102,150$ (278,013)$ 15,532,640$ 430,490$
Footnotes:[a] Original 2016/17 budget; spring re‐budgeted presented in Board approved 2017/18 budget
2017/18 Budget ‐ ASSOCIATED STUDENTS
105

2016/17 Budget 2016/17 Projected Actual2016/17 Actual versus Budget Variance $
2016/17 Actual versus Budget Variance % 2017/18 Budget
2017/18 Budget versus 2016/17 Projected Actual
Variance $
2017/18 Budget versus 2016/17 Projected Actual
Variance %
Source of Funds:Sales
Campus Stores 18,148,635 18,496,171 347,536 1.88% 18,391,608 (104,563) ‐0.57%
Food Services 22,618,681 22,909,441 290,760 1.27% 23,193,770 284,329 1.24%
Total Sales 40,767,316 41,405,612 638,296 1.54% 41,585,378 179,766 0.43%
Credits and Revenues
Housing 14,204,999 14,564,545 359,546 2.47% 15,527,244 962,699 6.61% (1) Text Rentals, Commissions
and Revenues 10,841,288 11,139,056 297,768 2.67% 11,594,897 455,841 4.09%
25,046,287 25,703,601 657,314 2.56% 27,122,141 1,418,540 5.52%
Total Source of Funds: 65,813,603$ 67,109,213$ 1,295,610$ 1.93% 68,707,519$ 1,598,306$ 2.38%
Use of Funds:Cost of Goods
Campus Stores 11,871,513 12,289,216 417,703 3.40% 12,225,451 (63,765) ‐0.52%
Food Services 8,455,562 8,054,205 (401,357) ‐4.98% 8,265,309 211,104 2.62%
20,327,075 20,343,421 16,346 0.08% 20,490,760 147,339 0.72%
Operating Expenses
Salaries and Benefits 17,367,384 17,662,315 294,931 1.67% 17,676,489 14,174 0.08% (2)
Other Operating Expenses 27,016,599 27,268,725 252,126 0.92% 28,526,934 1,258,209 4.61% (3)
Total Operating Expenses 44,383,983 44,931,040 547,057 1.22% 46,203,423 1,272,383 2.83%
Total Use of Funds: 64,711,058$ 65,274,461$ 563,403$ 0.86% 66,694,183$ 1,419,722$ 2.18%
Net funds to (from) Reserves: 1,102,545$ 1,834,752$ 732,207$ 2,013,336$ 178,584$
Reserves (Net Assets):Beginning Balance 2,866,068 (30,103) 574,649
Activity
Estimated Allocation (790,000) (765,000)
Estimated Incentive @ 100% (440,000) (451,000)
Net funds to (from) Reserves* 1,102,545 1,834,752 2,013,336
Ending Balance 3,968,613$ 574,649$ ‐$ 1,371,985$ ‐$
2017/18 Budget ‐ AZTEC SHOPS LTD
107

Footnotes:* Excludes non‐operating actuarial adjustments for retiree benefits.
(1) South Campus Plaza Retail Opens(2) Category includes $300,000 contingency (which is slightly under 1% of operating expenses)(3) South Campus Plaza Retail Opens, Meal Plan Discounts
Aztec Shops Budget Assumptions:a) 2.5% merit pool increase January 2018b) Healthcare costs increase 11.6% January 2018c) Utilities increase +10% July 2017d) CalPERS decrease 22% July 2017 (paid down side fund liability in FY2017)e) Worker's Compensation Insurance decrease 35% July 2017 (switching from Zenith to AORMA)
108

2016/17 Budget 2016/17 Projected Actual2016/17 Actual versus Budget
Variance 2017/18 Budget2017/18 Budget versus 2016/17
Projected Actual Variance
Source of Funds:a Current Programs 30,800,000 30,500,000 (300,000) 30,500,000 ‐
b Long Term Endowments 15,000,000 18,000,000 3,000,000 18,000,000 ‐
c Fee Income 4,350,000 4,450,000 100,000 4,600,000 150,000
Total Source of Funds: 50,150,000$ 52,950,000$ 2,800,000$ 53,100,000$ 150,000$
Use of Funds:d Current Campus Programs 24,410,000 25,600,000 1,190,000 25,000,000 (600,000)
e Held for future campus programs 14,000,000 15,230,000 1,230,000 16,000,000 770,000
f Student scholarships 9,500,000 9,600,000 100,000 9,500,000 (100,000)
g Fundraising 2,000,000 2,000,000 ‐ 1,900,000 (100,000)
h General administration 712,000 700,000 (12,000) 728,500 28,500
Total Use of Funds: 50,622,000$ 53,130,000$ 2,508,000$ 53,128,500$ (1,500)$
Net funds to (from) Reserves: (472,000)$ (180,000)$ 292,000$ (28,500)$ 151,500$
Reserves:Beginning Balance 1,800,000 1,746,000 (54,000) 1,566,000
Activity
i Net funds to (from) Reserves (472,000) (180,000) 292,000 (28,500) 151,500
j Ending Balance 1,328,000$ 1,566,000$ 238,000$ 1,537,500$ 151,500$
Footnotes:Source of Funds:a Current Programs includes annual program and scholarship donations
b Long Term Endowments reflects the permanently restricted contributions to the TCF endowment pool
c Fee Income reflects 5% gift fee on incoming cash gifts and 1.25% endowment management fee
Use of Funds:d Current Campus Programs reflects all transfers to the campus excluding student aid
e Held for future Campus Programs reflects the increase in the endowment pool (equal to income plus/minus market appreciation)
f Student scholarships represents all student aid
g Fundraising costs include Campaign Fund and College self‐reported fundraising costs
h General administration reflects TCF Operations fund only
Net funds to (from) Reserves:i URAD continues to project using reserves to complete the campaign on schedule
j TCF main operating reserves, additional contingency reserves exist
2017/18 Budget ‐ THE CAMPANILE FOUNDATION
109

San Diego State UniversityUniversity Funds held at SDSU Research Foundation
FY 2017/18 Expense Projection by Fund Type
General Research Support
(2 Ledger)
Sponsored Research(5 Ledger)
Campus & Community
Funds(9 Ledger)
The Campanile Foundation (C Ledger)
Scholarships (A Ledger)
Total
SDSU Division/College
FY 2017/18 Expense
Projection
FY 2017/18 Expense
Projection
FY 2017/18 Expense
Projection
FY 2017/18 Expense
Projection
FY 2017/18 Expense
Projection
FY 2017/18 Expense
Projection
Academic Affairs 758 195,486 200,518 711,820 342,032 1,450,614Grad/Research Affairs 1,828,951 138,467 323,527 234,673 2,525,617Imperial Valley Campus 1,379 576,805 51,578 25,921 84,393 740,076College of Arts & Letters 303,499 5,403,539 476,156 2,793,423 503,497 9,480,115College of Business Admin 9,006 802,936 156,876 1,548,620 259,362 2,776,800College of Education 77,563 18,549,239 954,353 560,108 250,835 20,392,099College of Engineering 266,685 5,291,435 872,132 653,157 171,457 7,254,866College of Extended Studies 127,633 20,967,941 9,476 21,105,050College of Hlth & Hum Serv 398,542 30,305,555 3,109,383 268,282 330,450 34,412,212College of PSFA [1] (1,281) 251,568 399,236 1,772,860 515,673 2,938,056College of Sciences 1,288,013 26,377,671 848,610 335,752 520,669 29,370,715KPBS 4,757,641 18,338,161 2,897 23,098,699Office of the President / Diversity & Equity 4,852 7,039 1,159 13,050Student Affairs 814,348 990,148 199,282 5,183,964 7,187,742Business & Financial Affairs 217,192 4,283 7,953 229,427Athletics 2,302,718 8,180,314 178,542 10,661,574Univ Relations & Development 5,870,521 1,486,047 7,356,569SDSU Affiliated Projects [2] 3,684,000 519,437 8,049 4,211,487
Total 2,344,164 99,184,000 50,334,849 23,276,104 10,065,651 185,204,769
[1] PSFA negative due to deduction of campus space charges forfaculty that did not generate RSF funding.[2] Includes SDSU Georgia
111

San Diego State UniversityUniversity Funds held at SDSU Research Foundation
FY 2016/17 Expense by Fund Type
General Research Support
(2 Ledger)
Sponsored Research(5 Ledger)
Campus & Community
Funds(9 Ledger)
The Campanile Foundation (C Ledger)
Scholarships (A Ledger)
Total
SDSU Division/College FY 2016/17
Expense FY 2016/17
Expense FY 2016/17
Expense FY 2016/17
Expense FY 2016/17
Expense FY 2016/17
Expense
Academic Affairs 249,038 186,481 217,411 740,875 295,141 1,688,945Grad/Research Affairs 76,676 1,744,701 150,133 336,732 202,500 2,510,741Imperial Valley Campus 10,307 550,235 55,924 26,979 72,823 716,267College of Arts & Letters 252,655 5,154,627 516,271 2,907,442 434,470 9,265,464College of Business Admin 14,599 765,949 170,093 1,611,829 223,805 2,786,275College of Education 41,452 17,694,775 1,034,754 582,970 216,447 19,570,398College of Engineering 154,226 5,047,687 945,607 679,817 147,951 6,975,287College of Extended Studies 121,754 22,734,428 9,863 22,866,045College of Hlth & Hum Serv 1,136,699 28,909,539 3,371,339 279,232 285,147 33,981,956College of PSFA 79,327 239,980 432,870 1,845,222 444,977 3,042,376College of Sciences 1,314,573 25,162,592 920,102 349,456 449,288 28,196,012KPBS 4,538,481 19,883,097 2,500 24,424,078Office of the President / Diversity & Equity 30,833 5,261 7,327 1,000 44,421Student Affairs 31,020 776,835 1,073,565 207,416 4,473,266 6,562,103Business & Financial Affairs 85,048 207,187 4,644 8,277 305,156Athletics 2,496,715 8,514,208 154,065 11,164,988Univ Relations & Development 18,805 6,110,137 1,282,317 7,411,259SDSU Affiliated Projects [1] 4,752,909 563,198 8,378 5,324,485
Total 3,495,257 95,853,732 54,575,411 24,226,160 8,685,697 186,836,257
[1] Includes SDSU Georgia
112

San Diego State UniversityUniversity Funds held at SDSU Research Foundation
FY 2016/17 Cash Balance at June 30, 2017 by Fund Type
General Research Support
(2 Ledger)
Campus & Community
Funds(9 Ledger)
The Campanile Foundation (C Ledger)
Scholarships (A Ledger)
Total
SDSU Division/College Cash Balance June 30, 2017
Cash Balance June 30, 2017
Cash Balance June 30, 2017
Cash Balance June 30, 2017
Cash Balance June 30, 2017
Academic Affairs 154,372 557,418 3,701,477 639,429 5,052,695Grad/Research Affairs 889,909 238,448 506,979 532,625 2,167,961Imperial Valley Campus 14,989 14,628 71,555 554,919 656,093College of Arts & Letters 424,411 1,060,454 3,805,602 1,213,465 6,503,932College of Business Admin 152,774 239,883 3,947,427 641,044 4,981,129College of Education 183,334 450,555 596,348 318,860 1,549,097College of Engineering 384,635 1,190,717 1,384,022 327,373 3,286,747College of Extended Studies 21,513,693 116,067 21,629,760College of Hlth & Hum Serv 1,172,359 1,815,000 540,321 622,432 4,150,112College of PSFA 108,962 175,136 2,531,869 889,793 3,705,760College of Sciences 2,770,772 1,372,069 3,129,856 855,085 8,127,782KPBS 2,013,861 1,709,645 10,000 3,733,506Office of the President / Diversity & Equity 15,718 13,772 157 8,684 38,332Student Affairs 53,495 2,303,292 1,534,235 2,031,976 5,922,999Business & Financial Affairs 156,177 102,396 70,394 328,967Athletics 624,184 783,309 71,606 1,479,099Univ Relations & Development 5,969 2,985,616 353,709 3,345,294SDSU Affiliated Projects [1] 4,257,118 27,102 4,284,220
Total 8,501,739 37,638,409 25,732,337 9,071,001 80,943,485
[1] Includes SDSU Georgia
113