Embed Size (px)
Citation preview
Budget book 2015-16
Budget book 2015-16

This page has been intentionally left blank

ASHFORD BOROUGH COUNCIL
BUDGET BOOK 2015/16
CONTENTS Page No. BUDGET INTRODUCTION 5 COUNCIL TAX STATISTICS 7 PARISH EXPENDITURE 10 GENERAL FUND
General Fund Summary 14 Subjective Analysis 15 Analysis of Estimates Reserves 16
Service Budgets and Plans
Corporate, Strategy and Personnel 18 Legal and Democratic Services 26 Planning and Development 34 Financial Services 42 Communications and Technology 54 Community and Housing 62 Culture and Project Services 76 Net Interest and Capital Charges 85
HOUSING REVENUE ACCOUNT 86 CAPITAL PROGRAMME 94
REPAIRS AND RENEWAL PROGRAMME 96 FEES AND CHARGES 97

This page has been intentionally left blank
ASHFORD BOROUGH COUNCIL
BUDGET 2015/16
Introduction
This Budget Book shows the Council’s revenue estimates for 2015/16, the Capital Programme 2015/16 to 2017/18 and the Fees and Charges operative from 1st April 2015. All estimates in this book are at estimated outturn levels (all allowances for pay awards and inflation are included in the figures).
The Budget book reflects the last year of the five year business plan. In October 2013 the Council introduced the Focus 2013-15 report which seeks to re-focus the Council’s efforts to deliver the remaining priorities within the plan.
2015/16 is the third year of Government’s new financing regime for Local Authorities. This regime includes the localisation of Council Tax Support and Business Rates, as well as a new Revenue Support Grant; as a result of these changes there has be more focus on monitoring the Collection Fund. In the budget book we have included base data that will help with this by including the Council’s estimate of business rates and tax base information that underpin the principles of the new regime.

This page has been intentionally left blank

2014/15
No No % Increase
41,846 Tax Base 42,365 N/A
£ Band D Rates: £ % Increase
145.45 Ashford Borough Council 145.45 0.00%
1,068.66 Kent County Council 1,089.99 2.00%
144.28 Kent Police Authority 147.15 1.99%
69.30 Kent and Medway Fire Authority 70.65 1.95%
1,427.69 1,453.24 1.79%
6,086,501 Ashford Borough Council 6,161,989 N/A
44,719,146 Kent County Council 46,177,426 N/A
6,037,541 Kent Police Authority 6,234,010 N/A
2,899,928 Kent and Medway Fire Authority 2,993,087 N/A
1,134,725 Parish Councils 1,233,838 N/A
60,877,841 62,800,351 N/A
Ashford BC Kent CC Kent Police Kent Fire TOTAL
2006/07 117.63 918.72 116.37 59.40 1,212.12
2007/08 123.34 964.17 122.18 61.65 1,271.34
2008/09 129.20 1,001.79 128.25 63.81 1,323.05
2009/10 135.27 1,026.27 134.65 66.06 1,362.25
2010/11 140.67 1,047.78 138.68 67.95 1,395.08
2011/12 140.67 1,047.78 138.68 67.95 1,395.08
2012/13 140.67 1,047.78 138.68 67.95 1,395.08
2013/14 145.45 1,047.78 141.47 67.95 1,402.65
2014/15 145.45 1,068.66 144.28 69.30 1,427.69
2015/16 145.45 1,089.99 147.15 70.65 1,453.24
% Change for year 0.00% 2.00% 1.99% 1.95% 1.79%
The table gives the make up of the Council Tax for Band D properties for previous
years.
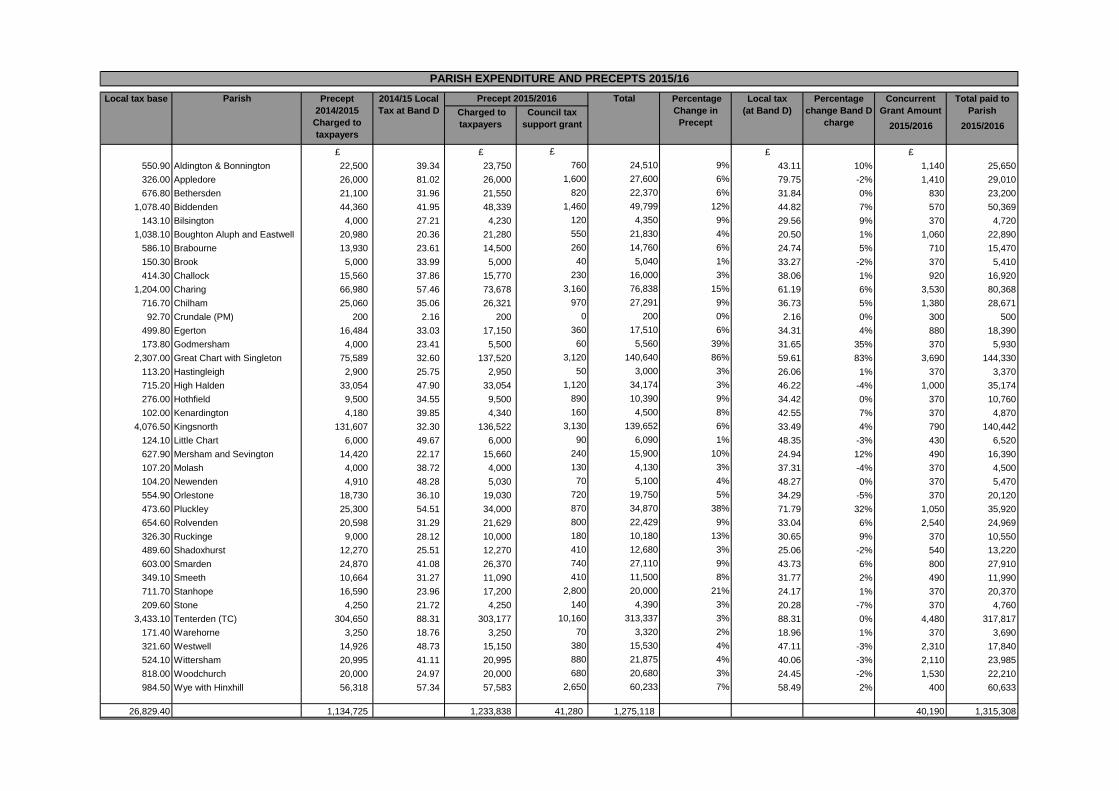
PARISH PRECEPTS
Council taxpayers living in parished areas pay additional amounts to provide for the
precepts levied by their parish/town council. Expressed as Band D these amounts
range from £2.16 (Crundale) to £88.31 (Tenterden). The total of all Parish Precepts
is £1,233,838, an increase of 8.74% over 2014/15
COUNCIL TAX STATISTICS
2015/16
COUNCIL TAX
PRECEPTS
COMPARISON WITH PREVIOUS YEARS
£ £
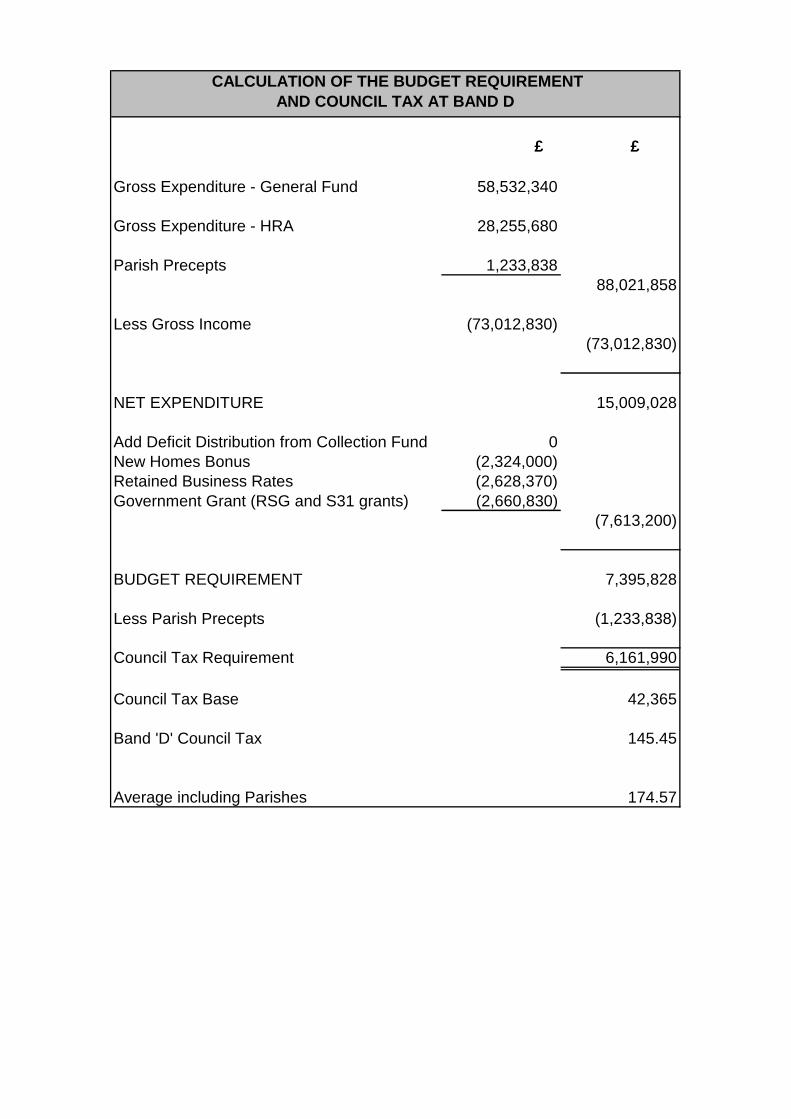
Gross Expenditure - General Fund 58,532,340
Gross Expenditure - HRA 28,255,680
Parish Precepts 1,233,838
88,021,858
Less Gross Income (73,012,830)
(73,012,830)
NET EXPENDITURE 15,009,028
Add Deficit Distribution from Collection Fund 0
New Homes Bonus (2,324,000)
Retained Business Rates (2,628,370)
Government Grant (RSG and S31 grants) (2,660,830)
(7,613,200)
BUDGET REQUIREMENT 7,395,828
Less Parish Precepts (1,233,838)
Council Tax Requirement 6,161,990
Council Tax Base 42,365
Band 'D' Council Tax 145.45
Average including Parishes 174.57
CALCULATION OF THE BUDGET REQUIREMENT
AND COUNCIL TAX AT BAND D
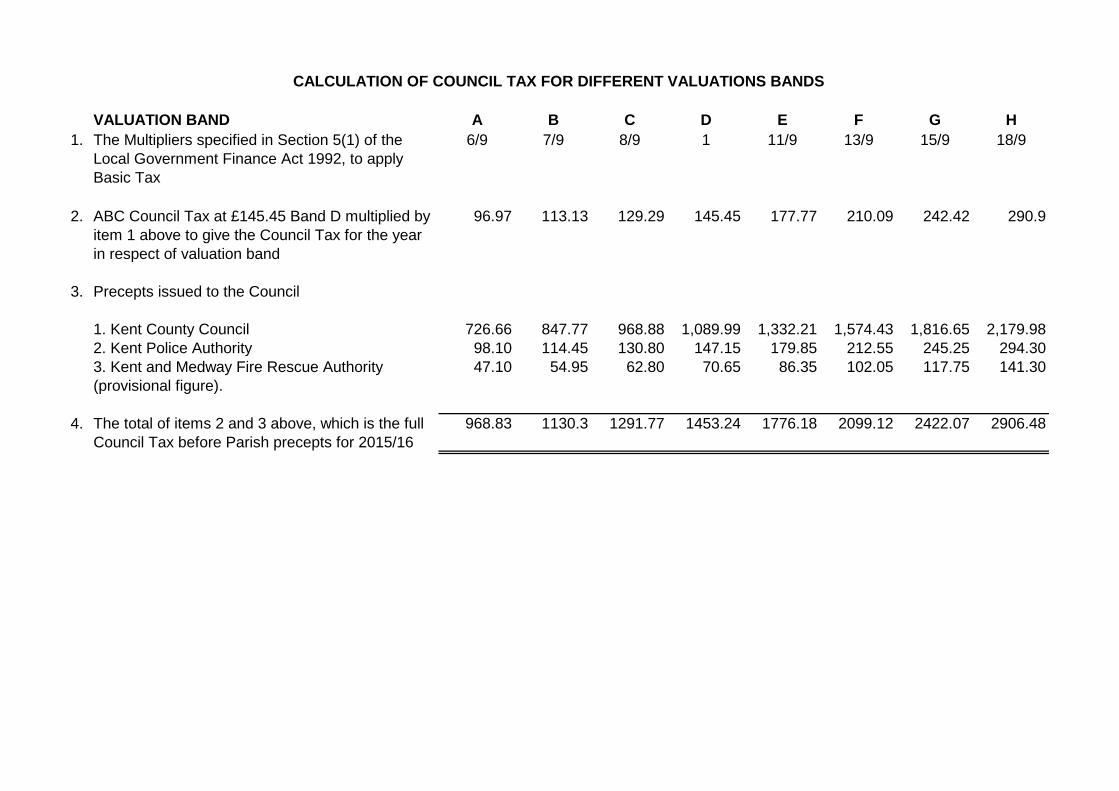
VALUATION BAND A B C D E F G H
1. The Multipliers specified in Section 5(1) of the
Local Government Finance Act 1992, to apply
Basic Tax
6/9 7/9 8/9 1 11/9 13/9 15/9 18/9
2. ABC Council Tax at £145.45 Band D multiplied by
item 1 above to give the Council Tax for the year
in respect of valuation band
96.97 113.13 129.29 145.45 177.77 210.09 242.42 290.9
3. Precepts issued to the Council
1. Kent County Council 726.66 847.77 968.88 1,089.99 1,332.21 1,574.43 1,816.65 2,179.98
2. Kent Police Authority 98.10 114.45 130.80 147.15 179.85 212.55 245.25 294.30
3. Kent and Medway Fire Rescue Authority
(provisional figure).
47.10 54.95 62.80 70.65 86.35 102.05 117.75 141.30
4. The total of items 2 and 3 above, which is the full
Council Tax before Parish precepts for 2015/16
968.83 1130.3 1291.77 1453.24 1776.18 2099.12 2422.07 2906.48
CALCULATION OF COUNCIL TAX FOR DIFFERENT VALUATIONS BANDS
Parish Total
2015/2016 2015/2016
£ £ £ £ £
550.90 Aldington & Bonnington 22,500 39.34 23,750 760 24,510 9% 43.11 10% 1,140 25,650
326.00 Appledore 26,000 81.02 26,000 1,600 27,600 6% 79.75 -2% 1,410 29,010
676.80 Bethersden 21,100 31.96 21,550 820 22,370 6% 31.84 0% 830 23,200
1,078.40 Biddenden 44,360 41.95 48,339 1,460 49,799 12% 44.82 7% 570 50,369
143.10 Bilsington 4,000 27.21 4,230 120 4,350 9% 29.56 9% 370 4,720
1,038.10 Boughton Aluph and Eastwell 20,980 20.36 21,280 550 21,830 4% 20.50 1% 1,060 22,890
586.10 Brabourne 13,930 23.61 14,500 260 14,760 6% 24.74 5% 710 15,470
150.30 Brook 5,000 33.99 5,000 40 5,040 1% 33.27 -2% 370 5,410
414.30 Challock 15,560 37.86 15,770 230 16,000 3% 38.06 1% 920 16,920
1,204.00 Charing 66,980 57.46 73,678 3,160 76,838 15% 61.19 6% 3,530 80,368
716.70 Chilham 25,060 35.06 26,321 970 27,291 9% 36.73 5% 1,380 28,671
92.70 Crundale (PM) 200 2.16 200 0 200 0% 2.16 0% 300 500
499.80 Egerton 16,484 33.03 17,150 360 17,510 6% 34.31 4% 880 18,390
173.80 Godmersham 4,000 23.41 5,500 60 5,560 39% 31.65 35% 370 5,930
2,307.00 Great Chart with Singleton 75,589 32.60 137,520 3,120 140,640 86% 59.61 83% 3,690 144,330
113.20 Hastingleigh 2,900 25.75 2,950 50 3,000 3% 26.06 1% 370 3,370
715.20 High Halden 33,054 47.90 33,054 1,120 34,174 3% 46.22 -4% 1,000 35,174
276.00 Hothfield 9,500 34.55 9,500 890 10,390 9% 34.42 0% 370 10,760
102.00 Kenardington 4,180 39.85 4,340 160 4,500 8% 42.55 7% 370 4,870
4,076.50 Kingsnorth 131,607 32.30 136,522 3,130 139,652 6% 33.49 4% 790 140,442
124.10 Little Chart 6,000 49.67 6,000 90 6,090 1% 48.35 -3% 430 6,520
627.90 Mersham and Sevington 14,420 22.17 15,660 240 15,900 10% 24.94 12% 490 16,390
107.20 Molash 4,000 38.72 4,000 130 4,130 3% 37.31 -4% 370 4,500
104.20 Newenden 4,910 48.28 5,030 70 5,100 4% 48.27 0% 370 5,470
554.90 Orlestone 18,730 36.10 19,030 720 19,750 5% 34.29 -5% 370 20,120
473.60 Pluckley 25,300 54.51 34,000 870 34,870 38% 71.79 32% 1,050 35,920
654.60 Rolvenden 20,598 31.29 21,629 800 22,429 9% 33.04 6% 2,540 24,969
326.30 Ruckinge 9,000 28.12 10,000 180 10,180 13% 30.65 9% 370 10,550
489.60 Shadoxhurst 12,270 25.51 12,270 410 12,680 3% 25.06 -2% 540 13,220
603.00 Smarden 24,870 41.08 26,370 740 27,110 9% 43.73 6% 800 27,910
349.10 Smeeth 10,664 31.27 11,090 410 11,500 8% 31.77 2% 490 11,990
711.70 Stanhope 16,590 23.96 17,200 2,800 20,000 21% 24.17 1% 370 20,370
209.60 Stone 4,250 21.72 4,250 140 4,390 3% 20.28 -7% 370 4,760
3,433.10 Tenterden (TC) 304,650 88.31 303,177 10,160 313,337 3% 88.31 0% 4,480 317,817
171.40 Warehorne 3,250 18.76 3,250 70 3,320 2% 18.96 1% 370 3,690
321.60 Westwell 14,926 48.73 15,150 380 15,530 4% 47.11 -3% 2,310 17,840
524.10 Wittersham 20,995 41.11 20,995 880 21,875 4% 40.06 -3% 2,110 23,985
818.00 Woodchurch 20,000 24.97 20,000 680 20,680 3% 24.45 -2% 1,530 22,210
984.50 Wye with Hinxhill 56,318 57.34 57,583 2,650 60,233 7% 58.49 2% 400 60,633
26,829.40 1,134,725 1,233,838 41,280 1,275,118 40,190 1,315,308
PARISH EXPENDITURE AND PRECEPTS 2015/16
Percentage
change Band D
charge
Concurrent
Grant Amount
claimed
Total paid to
Parish Charged to
taxpayers
Council tax
support grant
Local tax base Precept
2014/2015
Charged to
taxpayers
2014/15 Local
Tax at Band D
Precept 2015/2016 Percentage
Change in
Precept
Local tax
(at Band D)
2014/15 2015/16
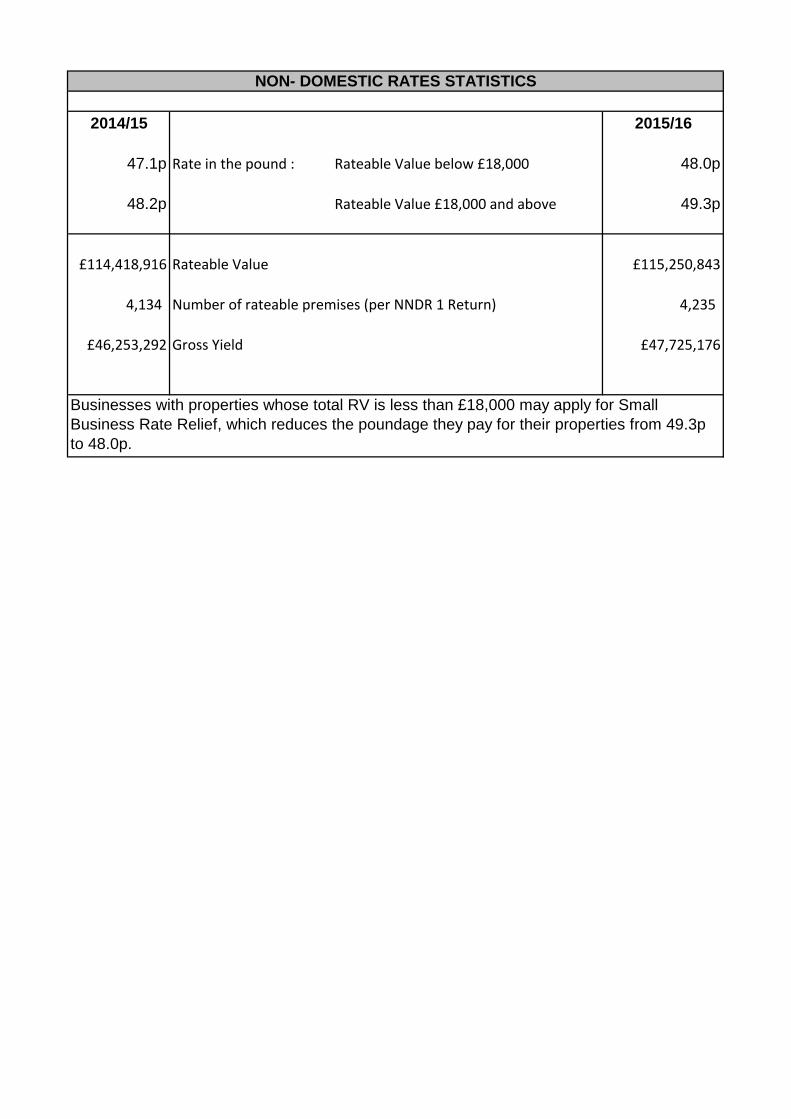
47.1p Rate in the pound : Rateable Value below £18,000 48.0p
48.2p Rateable Value £18,000 and above 49.3p
£114,418,916 Rateable Value £115,250,843
4,134 Number of rateable premises (per NNDR 1 Return) 4,235
£46,253,292 Gross Yield £47,725,176
NON- DOMESTIC RATES STATISTICS
Businesses with properties whose total RV is less than £18,000 may apply for Small
Business Rate Relief, which reduces the poundage they pay for their properties from 49.3p
to 48.0p.
1
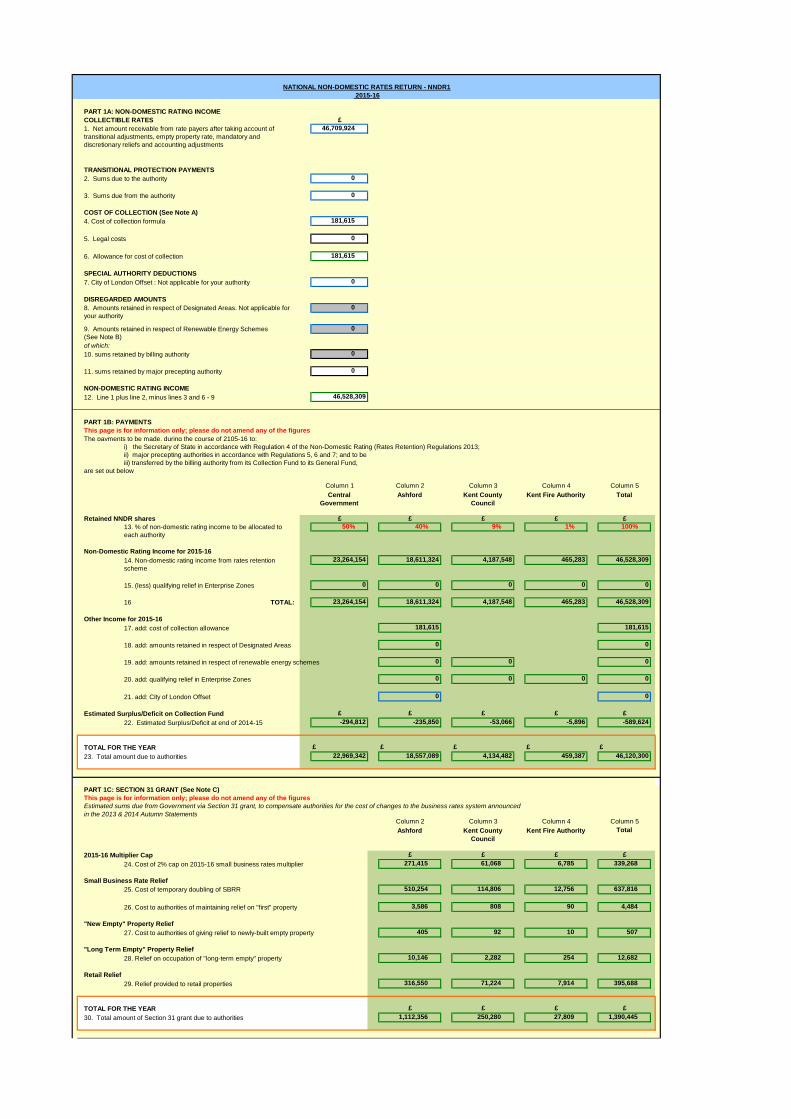
COLLECTIBLE RATES
2. Sums due to the authority
3. Sums due from the authority
COST OF COLLECTION (See Note A)
4. Cost of collection formula
5. Legal costs
6. Allowance for cost of collection
SPECIAL AUTHORITY DEDUCTIONS
7. City of London Offset : Not applicable for your authority
DISREGARDED AMOUNTS
of which:
10. sums retained by billing authority
11. sums retained by major precepting authority
NON-DOMESTIC RATING INCOME
12. Line 1 plus line 2, minus lines 3 and 6 - 9
PART 1B: PAYMENTS
This page is for information only; please do not amend any of the figures
The payments to be made, during the course of 2105-16 to:
i) the Secretary of State in accordance with Regulation 4 of the Non-Domestic Rating (Rates Retention) Regulations 2013;
ii) major precepting authorities in accordance with Regulations 5, 6 and 7; and to be
iii) transferred by the billing authority from its Collection Fund to its General Fund,
are set out below
Retained NNDR shares
Non-Domestic Rating Income for 2015-16
15. (less) qualifying relief in Enterprise Zones
16 TOTAL:
Other Income for 2015-16
17. add: cost of collection allowance
18. add: amounts retained in respect of Designated Areas
19. add: amounts retained in respect of renewable energy schemes
20. add: qualifying relief in Enterprise Zones
21. add: City of London Offset
Estimated Surplus/Deficit on Collection Fund
22. Estimated Surplus/Deficit at end of 2014-15
TOTAL FOR THE YEAR
23. Total amount due to authorities
PART 1C: SECTION 31 GRANT (See Note C)
This page is for information only; please do not amend any of the figures
2015-16 Multiplier Cap
24. Cost of 2% cap on 2015-16 small business rates multiplier
Small Business Rate Relief
25. Cost of temporary doubling of SBRR
26. Cost to authorities of maintaining relief on "first" property
"New Empty" Property Relief
27. Cost to authorities of giving relief to newly-built empty property
"Long Term Empty" Property Relief
28. Relief on occupation of "long-term empty" property
Retail Relief
29. Relief provided to retail properties
TOTAL FOR THE YEAR
30. Total amount of Section 31 grant due to authorities 1,112,356 250,280 27,809 1,390,445
316,550 71,224 7,914 395,688
£ £ £ £
405 92 10 507
10,146 2,282 254 12,682
510,254 114,806 12,756 637,816
3,586 808 90 4,484
£ £ £ £
271,415 61,068 6,785 339,268
Estimated sums due from Government via Section 31 grant, to compensate authorities for the cost of changes to the business rates system announced
in the 2013 & 2014 Autumn StatementsColumn 2 Column 3 Column 4 Column 5
Ashford Kent County
Council
Kent Fire Authority Total
£ £ £ £ £
22,969,342 18,557,089 4,134,482 459,387 46,120,300
£ £ £ £ £
-294,812 -235,850 -53,066 -5,896 -589,624
0 0 0 0
0 0
181,615 181,615
0 0
0 0 0
0 0 0 0 0
23,264,154 18,611,324 4,187,548 465,283 46,528,309
14. Non-domestic rating income from rates retention
scheme
23,264,154 18,611,324 4,187,548 465,283 46,528,309
13. % of non-domestic rating income to be allocated to
each authority
50% 40% 9% 1% 100%
Central
Government
Ashford Kent County
Council
Kent Fire Authority Total
£ £ £ £ £
Column 1 Column 2 Column 3 Column 4 Column 5
0
0
46,528,309
0
8. Amounts retained in respect of Designated Areas. Not applicable for
your authority
0
9. Amounts retained in respect of Renewable Energy Schemes
(See Note B)
0
TRANSITIONAL PROTECTION PAYMENTS
0
0
181,615
0
181,615
PART 1A: NON-DOMESTIC RATING INCOME
£
1. Net amount receivable from rate payers after taking account of
transitional adjustments, empty property rate, mandatory and
discretionary reliefs and accounting adjustments
46,709,924
NATIONAL NON-DOMESTIC RATES RETURN - NNDR1
2015-16

This page has been intentionally left blank
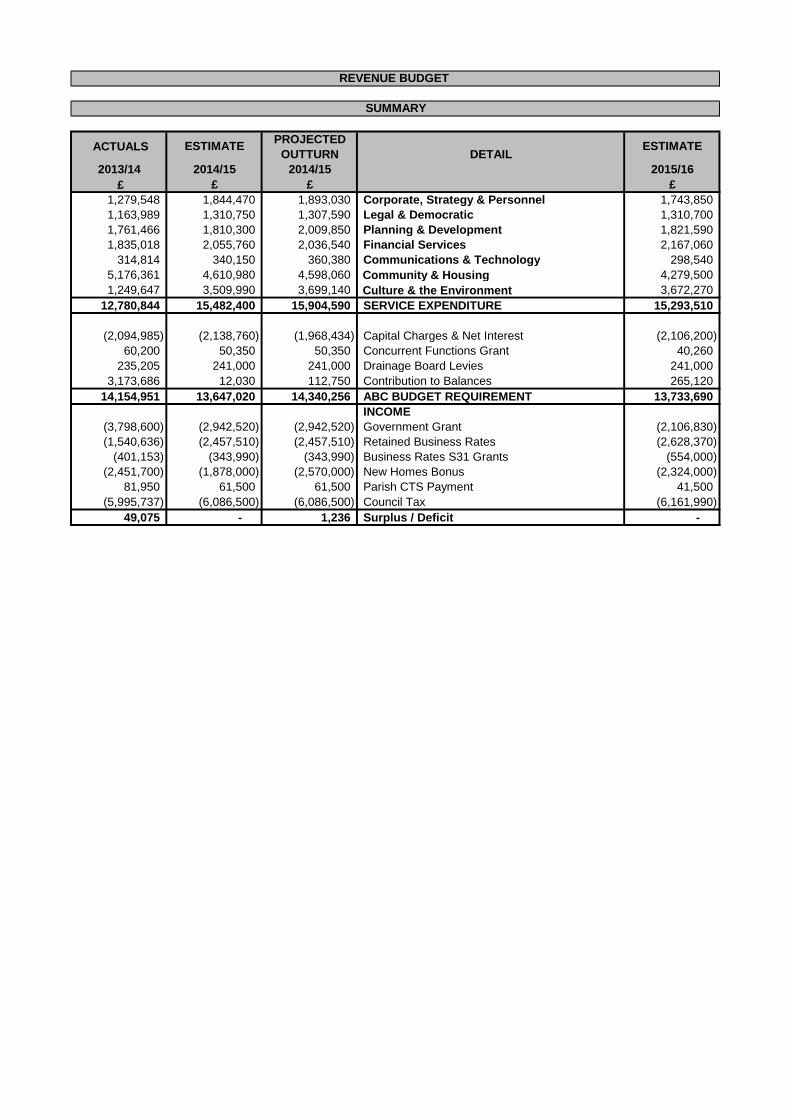
PROJECTED
OUTTURN DETAIL
2013/14 2014/15 2014/15 2015/16
£ £ £ £
1,279,548 1,844,470 1,893,030 Corporate, Strategy & Personnel 1,743,850
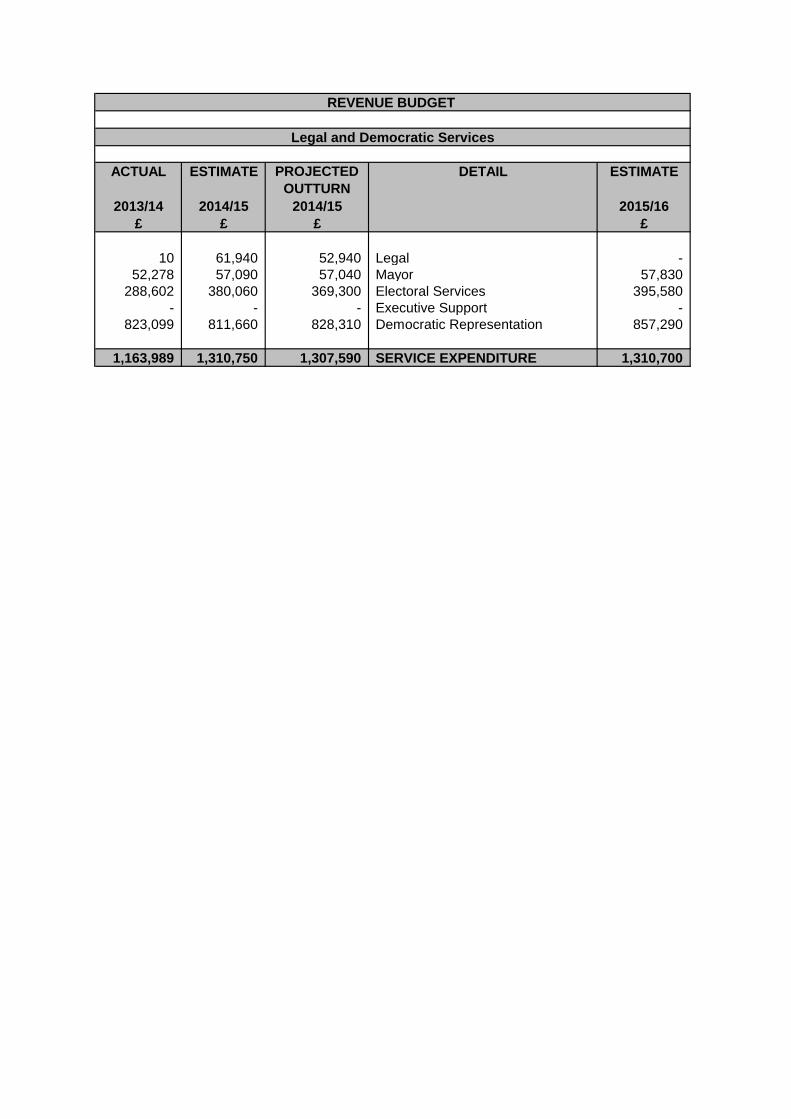
1,163,989 1,310,750 1,307,590 Legal & Democratic 1,310,700
1,761,466 1,810,300 2,009,850 Planning & Development 1,821,590
1,835,018 2,055,760 2,036,540 Financial Services 2,167,060
314,814 340,150 360,380 Communications & Technology 298,540
5,176,361 4,610,980 4,598,060 Community & Housing 4,279,500
1,249,647 3,509,990 3,699,140 Culture & the Environment 3,672,270
12,780,844 15,482,400 15,904,590 SERVICE EXPENDITURE 15,293,510
(2,094,985) (2,138,760) (1,968,434) Capital Charges & Net Interest (2,106,200)
60,200 50,350 50,350 Concurrent Functions Grant 40,260
235,205 241,000 241,000 Drainage Board Levies 241,000
3,173,686 12,030 112,750 Contribution to Balances 265,120
14,154,951 13,647,020 14,340,256 ABC BUDGET REQUIREMENT 13,733,690
INCOME
(3,798,600) (2,942,520) (2,942,520) Government Grant (2,106,830)
(1,540,636) (2,457,510) (2,457,510) Retained Business Rates (2,628,370)
(401,153) (343,990) (343,990) Business Rates S31 Grants (554,000)
(2,451,700) (1,878,000) (2,570,000) New Homes Bonus (2,324,000)
81,950 61,500 61,500 Parish CTS Payment 41,500
(5,995,737) (6,086,500) (6,086,500) Council Tax (6,161,990)
49,075 - 1,236 Surplus / Deficit -
REVENUE BUDGET
SUMMARY
ACTUALS ESTIMATE ESTIMATE
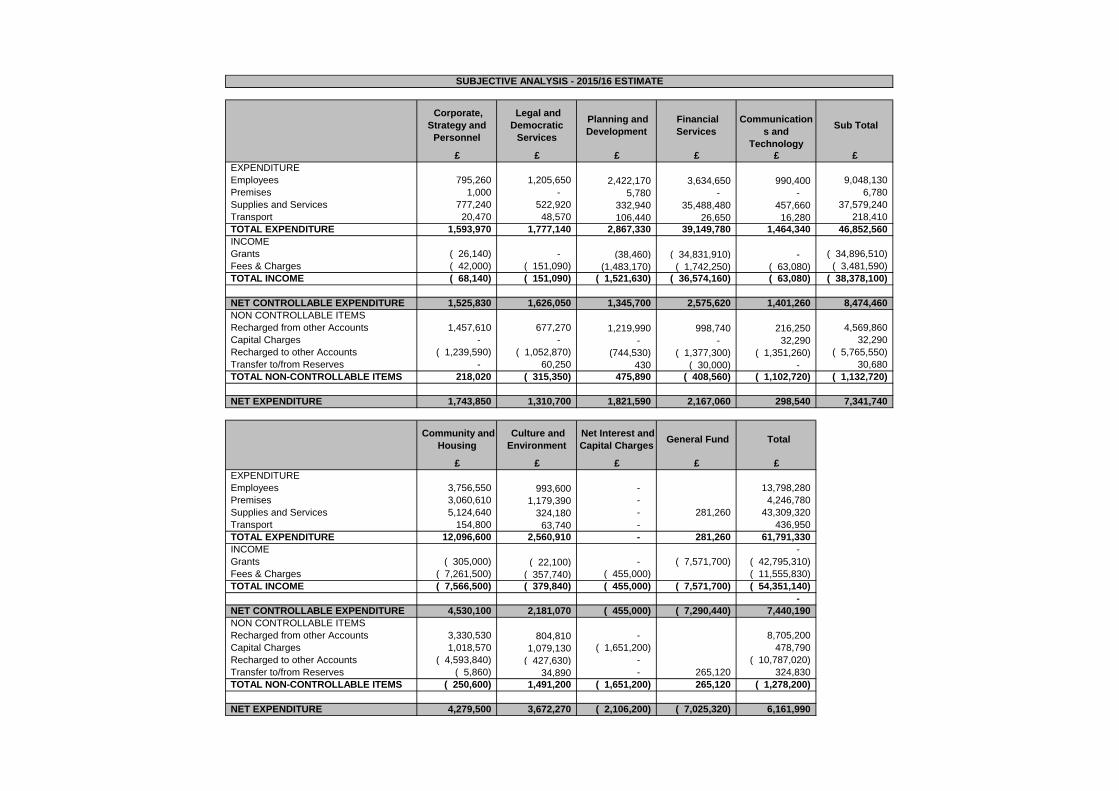
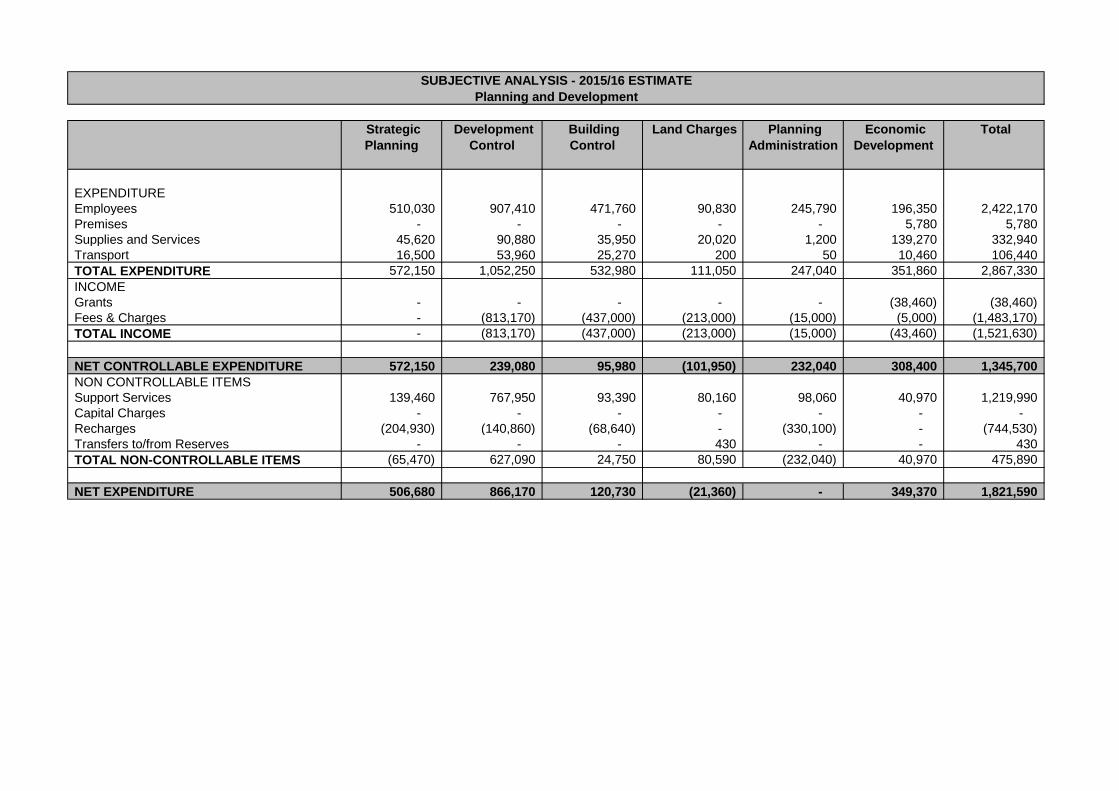
SUBJECTIVE ANALYSIS - 2015/16 ESTIMATE
Corporate,
Strategy and
Personnel
Legal and
Democratic
Services
Planning and
Development
Financial
Services
Communication
s and
Technology
Sub Total
£ £ £ £ £ £
EXPENDITURE
Employees 795,260 1,205,650 2,422,170 3,634,650 990,400 9,048,130
Premises 1,000 - 5,780 - - 6,780
Supplies and Services 777,240 522,920 332,940 35,488,480 457,660 37,579,240
Transport 20,470 48,570 106,440 26,650 16,280 218,410
TOTAL EXPENDITURE 1,593,970 1,777,140 2,867,330 39,149,780 1,464,340 46,852,560
INCOME
Grants ( 26,140) - (38,460) ( 34,831,910) - ( 34,896,510)
Fees & Charges ( 42,000) ( 151,090) (1,483,170) ( 1,742,250) ( 63,080) ( 3,481,590)
TOTAL INCOME ( 68,140) ( 151,090) ( 1,521,630) ( 36,574,160) ( 63,080) ( 38,378,100)
NET CONTROLLABLE EXPENDITURE 1,525,830 1,626,050 1,345,700 2,575,620 1,401,260 8,474,460
NON CONTROLLABLE ITEMS
Recharged from other Accounts 1,457,610 677,270 1,219,990 998,740 216,250 4,569,860
Capital Charges - - - - 32,290 32,290
Recharged to other Accounts ( 1,239,590) ( 1,052,870) (744,530) ( 1,377,300) ( 1,351,260) ( 5,765,550)
Transfer to/from Reserves - 60,250 430 ( 30,000) - 30,680
TOTAL NON-CONTROLLABLE ITEMS 218,020 ( 315,350) 475,890 ( 408,560) ( 1,102,720) ( 1,132,720)
NET EXPENDITURE 1,743,850 1,310,700 1,821,590 2,167,060 298,540 7,341,740
Community and
Housing
Culture and
Environment
Net Interest and
Capital Charges General Fund Total
£ £ £ £ £
EXPENDITURE
Employees 3,756,550 993,600 - 13,798,280
Premises 3,060,610 1,179,390 - 4,246,780
Supplies and Services 5,124,640 324,180 - 281,260 43,309,320
Transport 154,800 63,740 - 436,950
TOTAL EXPENDITURE 12,096,600 2,560,910 - 281,260 61,791,330
INCOME -
Grants ( 305,000) ( 22,100) - ( 7,571,700) ( 42,795,310)
Fees & Charges ( 7,261,500) ( 357,740) ( 455,000) ( 11,555,830)
TOTAL INCOME ( 7,566,500) ( 379,840) ( 455,000) ( 7,571,700) ( 54,351,140)
-
NET CONTROLLABLE EXPENDITURE 4,530,100 2,181,070 ( 455,000) ( 7,290,440) 7,440,190
NON CONTROLLABLE ITEMS
Recharged from other Accounts 3,330,530 804,810 - 8,705,200
Capital Charges 1,018,570 1,079,130 ( 1,651,200) 478,790
Recharged to other Accounts ( 4,593,840) ( 427,630) - ( 10,787,020)
Transfer to/from Reserves ( 5,860) 34,890 - 265,120 324,830
TOTAL NON-CONTROLLABLE ITEMS ( 250,600) 1,491,200 ( 1,651,200) 265,120 ( 1,278,200)
NET EXPENDITURE 4,279,500 3,672,270 ( 2,106,200) ( 7,025,320) 6,161,990
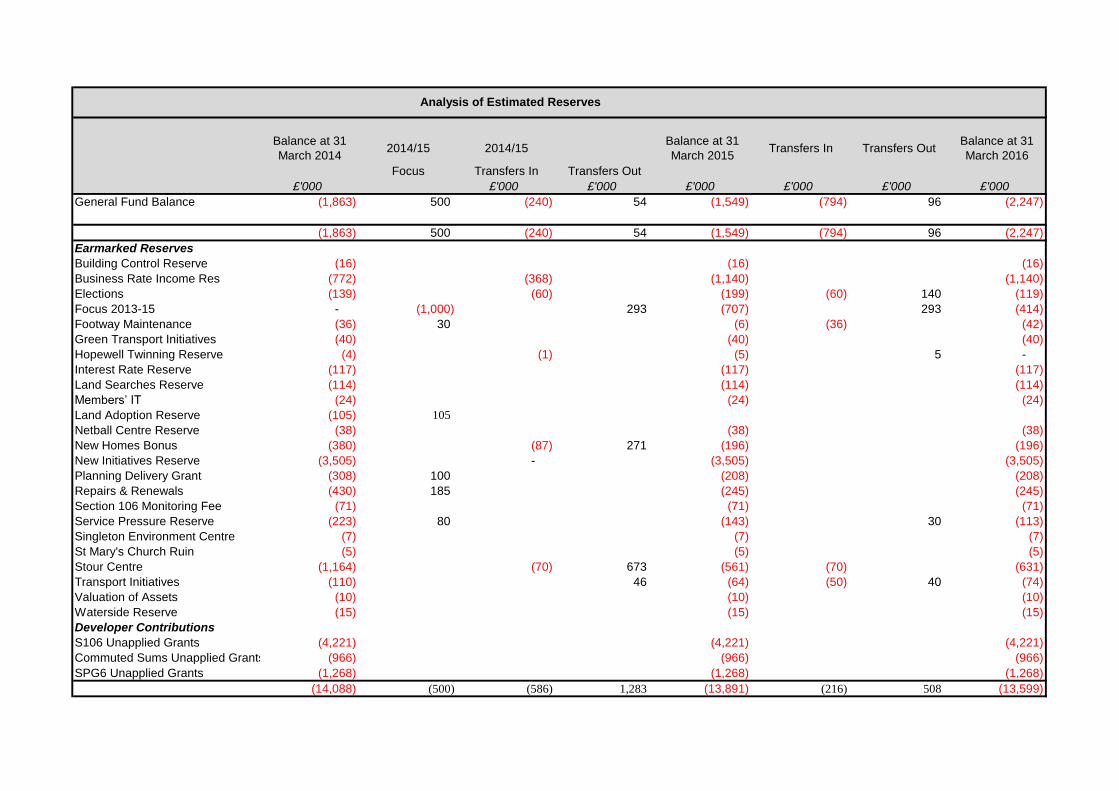
Balance at 31
March 20142014/15 2014/15
Balance at 31
March 2015Transfers In Transfers Out
Balance at 31
March 2016
Focus Transfers In Transfers Out
£'000 £'000 £'000 £'000 £'000 £'000 £'000
General Fund Balance (1,863) 500 (240) 54 (1,549) (794) 96 (2,247)
(1,863) 500 (240) 54 (1,549) (794) 96 (2,247)
Earmarked Reserves
Building Control Reserve (16) (16) (16)
Business Rate Income Res (772) (368) (1,140) (1,140)
Elections (139) (60) (199) (60) 140 (119)
Focus 2013-15 - (1,000) 293 (707) 293 (414)
Footway Maintenance (36) 30 (6) (36) (42)
Green Transport Initiatives (40) (40) (40)
Hopewell Twinning Reserve (4) (1) (5) 5 -
Interest Rate Reserve (117) (117) (117)
Land Searches Reserve (114) (114) (114)
Members’ IT (24) (24) (24)
Land Adoption Reserve (105) 105
Netball Centre Reserve (38) (38) (38)
New Homes Bonus (380) (87) 271 (196) (196)
New Initiatives Reserve (3,505) - (3,505) (3,505)
Planning Delivery Grant (308) 100 (208) (208)
Repairs & Renewals (430) 185 (245) (245)
Section 106 Monitoring Fee (71) (71) (71)
Service Pressure Reserve (223) 80 (143) 30 (113)
Singleton Environment Centre (7) (7) (7)
St Mary's Church Ruin (5) (5) (5)
Stour Centre (1,164) (70) 673 (561) (70) (631)
Transport Initiatives (110) 46 (64) (50) 40 (74)
Valuation of Assets (10) (10) (10)
Waterside Reserve (15) (15) (15)
Developer Contributions
S106 Unapplied Grants (4,221) (4,221) (4,221)
Commuted Sums Unapplied Grants (966) (966) (966)
SPG6 Unapplied Grants (1,268) (1,268) (1,268)
(14,088) (500) (586) 1,283 (13,891) (216) 508 (13,599)
Analysis of Estimated Reserves

This page has been intentionally left blank
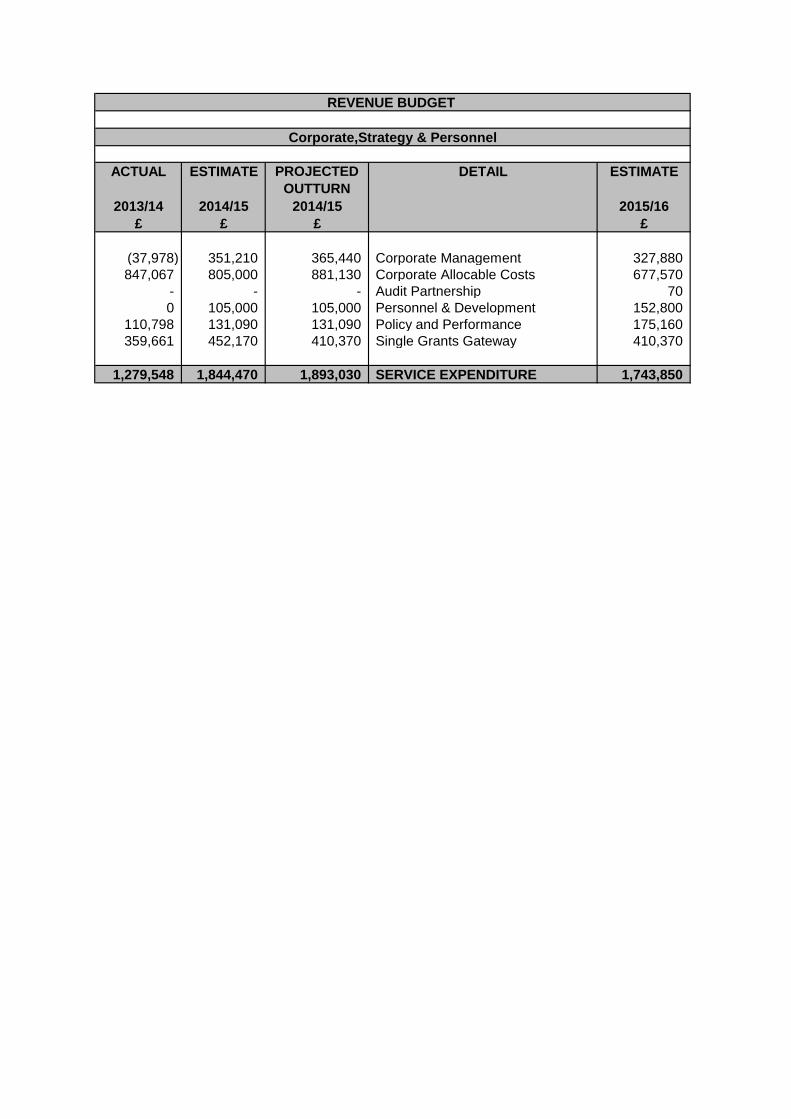
ACTUAL ESTIMATE PROJECTED
OUTTURN
DETAIL ESTIMATE
2013/14 2014/15 2014/15 2015/16
£ £ £ £
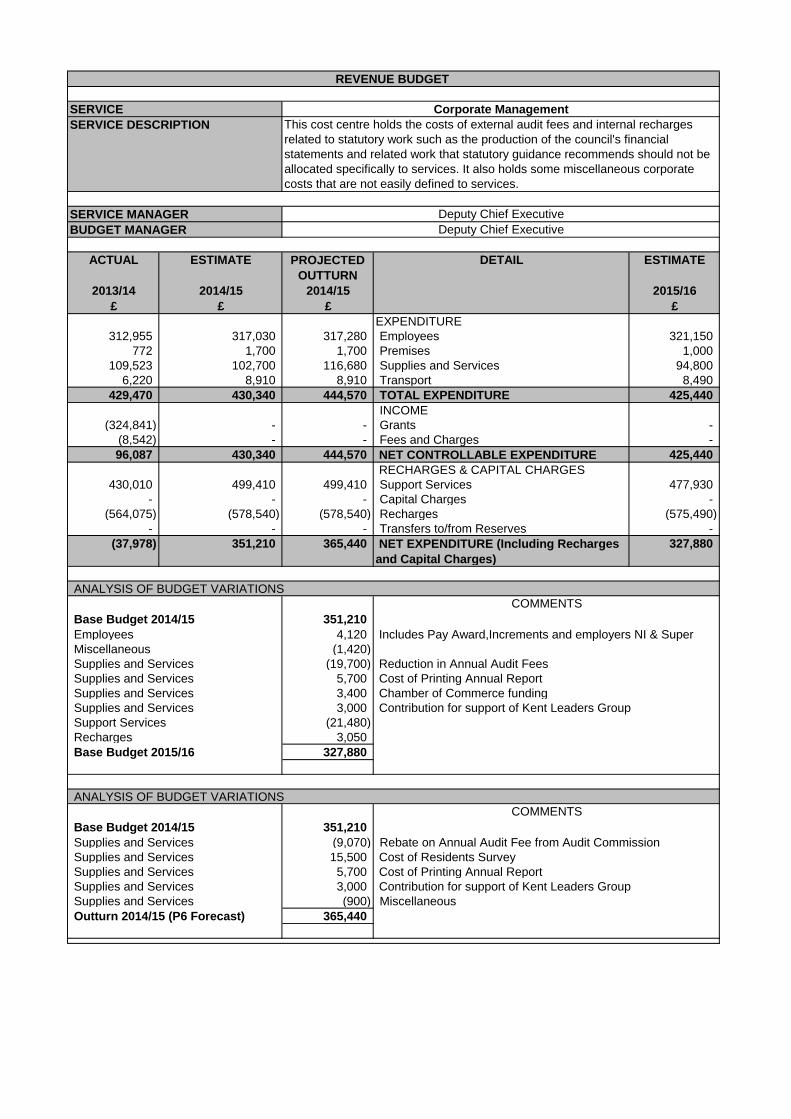
(37,978) 351,210 365,440 Corporate Management 327,880
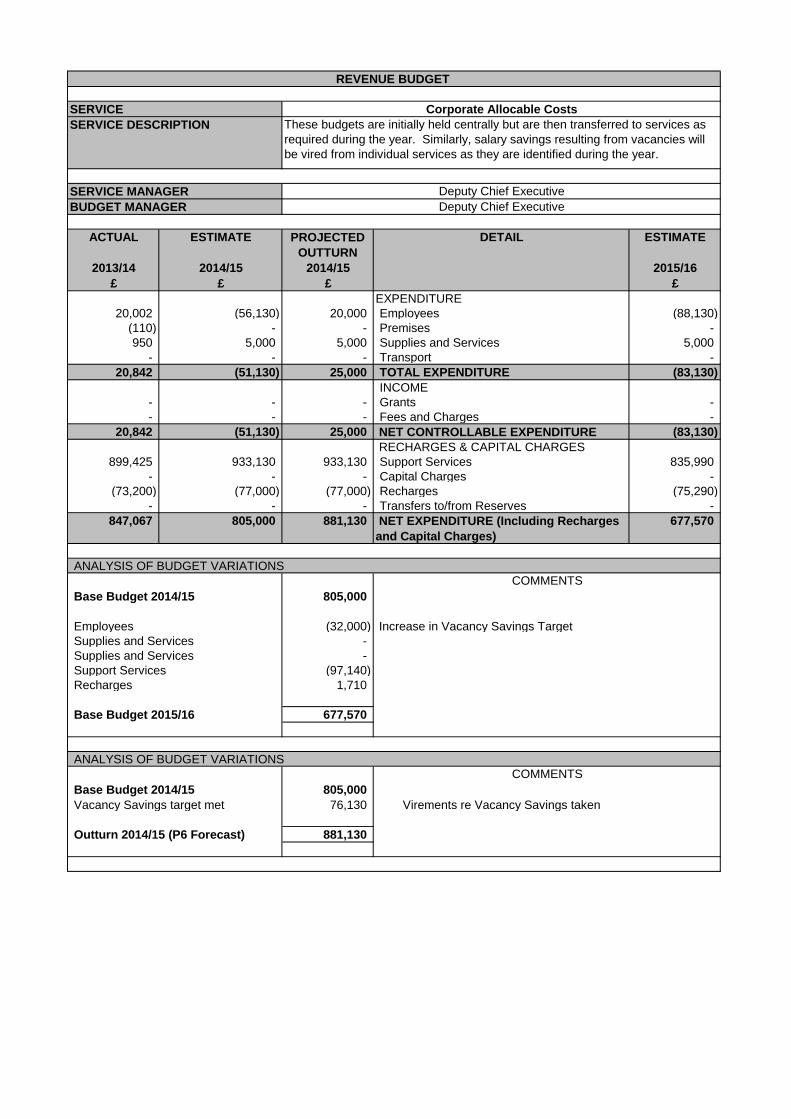
847,067 805,000 881,130 Corporate Allocable Costs 677,570
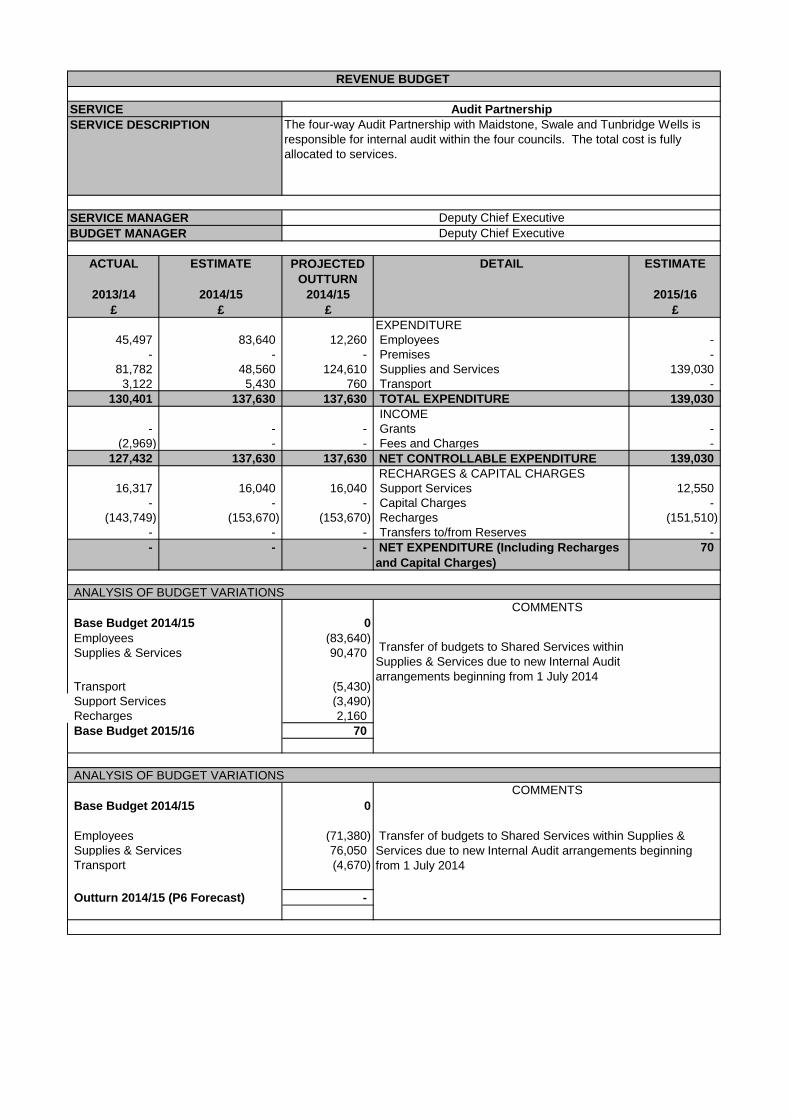
- - - Audit Partnership 70
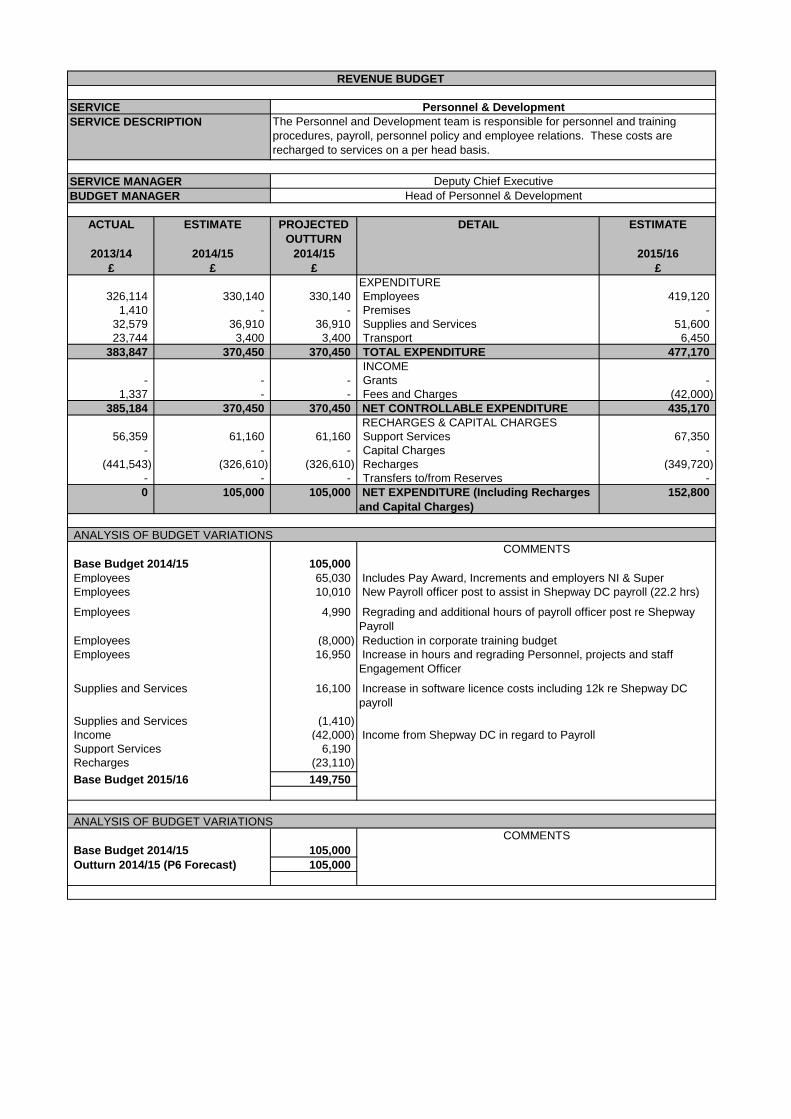
0 105,000 105,000 Personnel & Development 152,800
110,798 131,090 131,090 Policy and Performance 175,160
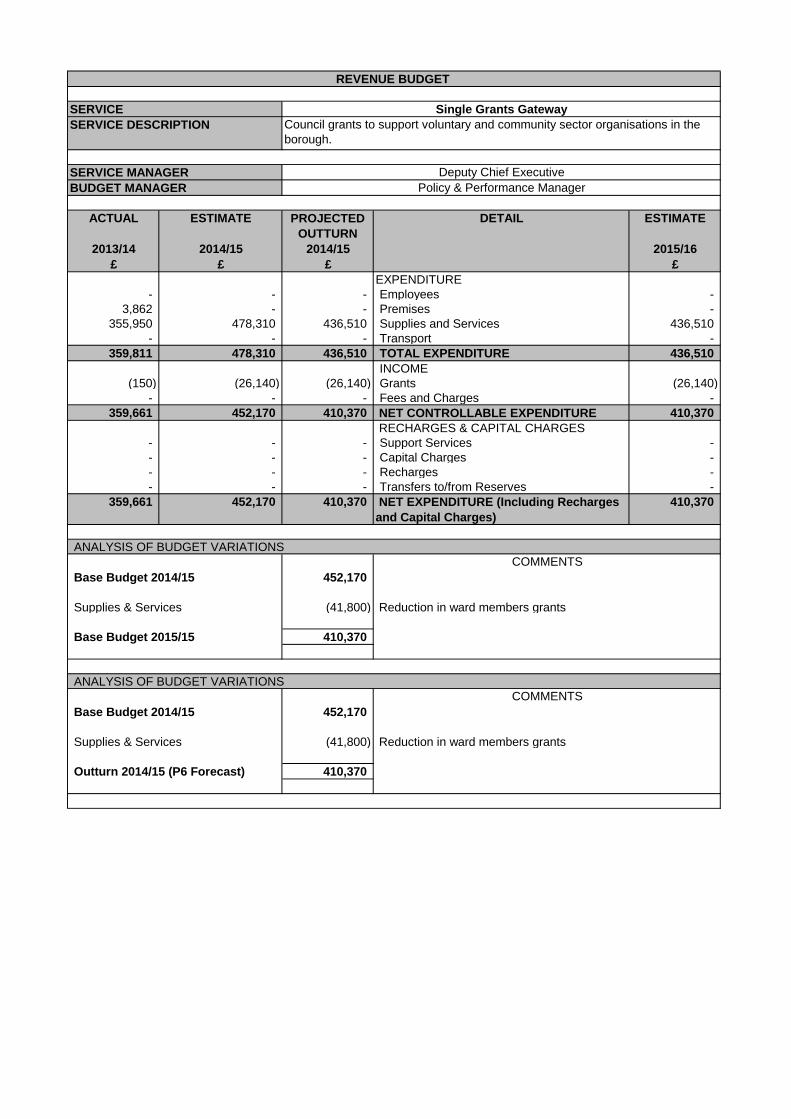
359,661 452,170 410,370 Single Grants Gateway 410,370
1,279,548 1,844,470 1,893,030 SERVICE EXPENDITURE 1,743,850
REVENUE BUDGET
Corporate,Strategy & Personnel
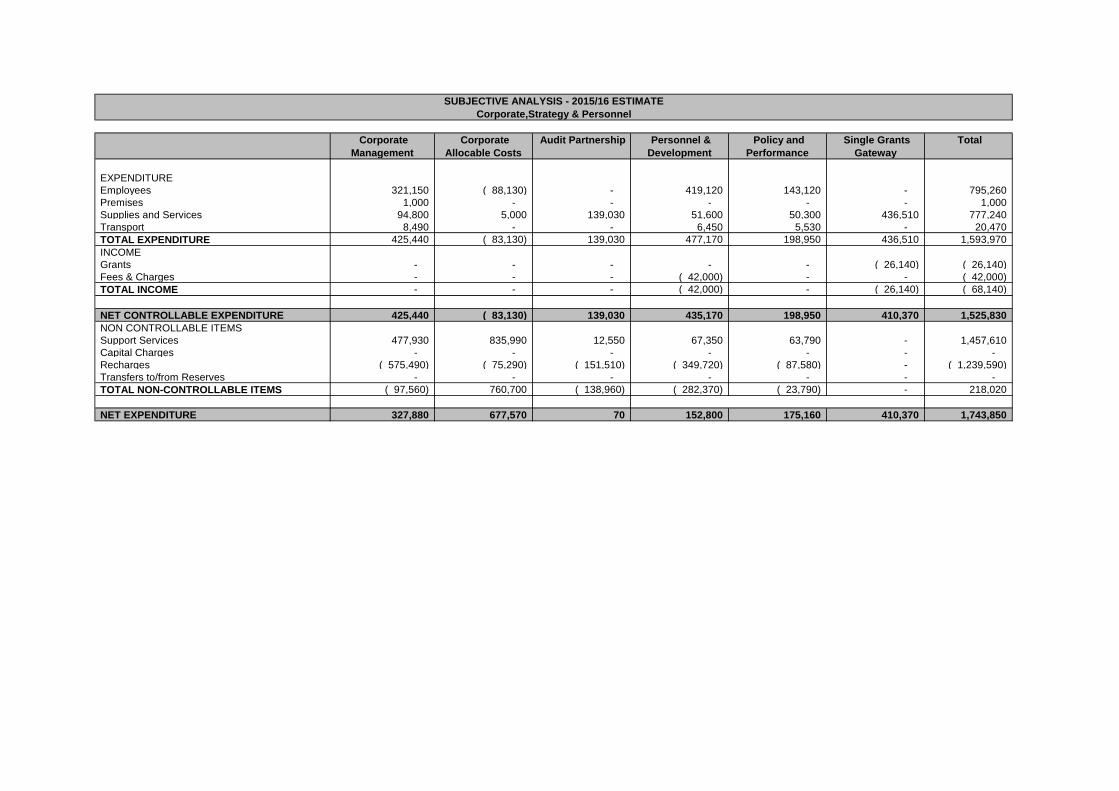
Corporate
Management
Corporate
Allocable Costs
Audit Partnership Personnel &
Development
Policy and
Performance
Single Grants
Gateway
Total
EXPENDITURE
Employees 321,150 ( 88,130) - 419,120 143,120 - 795,260
Premises 1,000 - - - - - 1,000
Supplies and Services 94,800 5,000 139,030 51,600 50,300 436,510 777,240
Transport 8,490 - - 6,450 5,530 - 20,470
TOTAL EXPENDITURE 425,440 ( 83,130) 139,030 477,170 198,950 436,510 1,593,970
INCOME
Grants - - - - - ( 26,140) ( 26,140)
Fees & Charges - - - ( 42,000) - - ( 42,000)
TOTAL INCOME - - - ( 42,000) - ( 26,140) ( 68,140)
NET CONTROLLABLE EXPENDITURE 425,440 ( 83,130) 139,030 435,170 198,950 410,370 1,525,830
NON CONTROLLABLE ITEMS
Support Services 477,930 835,990 12,550 67,350 63,790 - 1,457,610
Capital Charges - - - - - - -
Recharges ( 575,490) ( 75,290) ( 151,510) ( 349,720) ( 87,580) - ( 1,239,590)
Transfers to/from Reserves - - - - - - -
TOTAL NON-CONTROLLABLE ITEMS ( 97,560) 760,700 ( 138,960) ( 282,370) ( 23,790) - 218,020
NET EXPENDITURE 327,880 677,570 70 152,800 175,160 410,370 1,743,850
SUBJECTIVE ANALYSIS - 2015/16 ESTIMATE
Corporate,Strategy & Personnel
ACTUAL ESTIMATE PROJECTED
OUTTURN
DETAIL ESTIMATE
2013/14 2014/15 2014/15 2015/16
£ £ £ £
EXPENDITURE
312,955 317,030 317,280 Employees 321,150
772 1,700 1,700 Premises 1,000
109,523 102,700 116,680 Supplies and Services 94,800
6,220 8,910 8,910 Transport 8,490
429,470 430,340 444,570 TOTAL EXPENDITURE 425,440
INCOME
(324,841) - - Grants -
(8,542) - - Fees and Charges -
96,087 430,340 444,570 NET CONTROLLABLE EXPENDITURE 425,440
RECHARGES & CAPITAL CHARGES
430,010 499,410 499,410 Support Services 477,930
- - - Capital Charges -
(564,075) (578,540) (578,540) Recharges (575,490)
- - - Transfers to/from Reserves -
(37,978) 351,210 365,440 NET EXPENDITURE (Including Recharges
and Capital Charges)
327,880
351,210
Employees 4,120
Miscellaneous (1,420)
Supplies and Services (19,700) Reduction in Annual Audit Fees
Supplies and Services 5,700 Cost of Printing Annual Report
Supplies and Services 3,400 Chamber of Commerce funding
Supplies and Services 3,000
Support Services (21,480)
Recharges 3,050
327,880
351,210
Supplies and Services (9,070) Rebate on Annual Audit Fee from Audit Commission
Supplies and Services 15,500
Supplies and Services 5,700 Cost of Printing Annual Report
Supplies and Services 3,000
Supplies and Services (900) Miscellaneous
365,440
REVENUE BUDGET
SERVICE Corporate Management
SERVICE DESCRIPTION This cost centre holds the costs of external audit fees and internal recharges
related to statutory work such as the production of the council's financial
statements and related work that statutory guidance recommends should not be
allocated specifically to services. It also holds some miscellaneous corporate
costs that are not easily defined to services.
SERVICE MANAGER Deputy Chief Executive
BUDGET MANAGER Deputy Chief Executive
ANALYSIS OF BUDGET VARIATIONS
COMMENTS
Base Budget 2014/15
Contribution for support of Kent Leaders Group
Includes Pay Award,Increments and employers NI & Super
COMMENTS
Base Budget 2015/16
ANALYSIS OF BUDGET VARIATIONS
Base Budget 2014/15
Cost of Residents Survey
Contribution for support of Kent Leaders Group
Outturn 2014/15 (P6 Forecast)
ACTUAL ESTIMATE PROJECTED
OUTTURN
DETAIL ESTIMATE
2013/14 2014/15 2014/15 2015/16
£ £ £ £
EXPENDITURE
20,002 (56,130) 20,000 Employees (88,130)
(110) - - Premises -
950 5,000 5,000 Supplies and Services 5,000
- - - Transport -
20,842 (51,130) 25,000 TOTAL EXPENDITURE (83,130)
INCOME
- - - Grants -
- - - Fees and Charges -
20,842 (51,130) 25,000 NET CONTROLLABLE EXPENDITURE (83,130)
RECHARGES & CAPITAL CHARGES
899,425 933,130 933,130 Support Services 835,990
- - - Capital Charges -
(73,200) (77,000) (77,000) Recharges (75,290)
- - - Transfers to/from Reserves -
847,067 805,000 881,130 NET EXPENDITURE (Including Recharges
and Capital Charges)
677,570
805,000
Employees (32,000) Increase in Vacancy Savings Target
Supplies and Services -
Supplies and Services -
Support Services (97,140)
Recharges 1,710
677,570
805,000
Vacancy Savings target met 76,130 Virements re Vacancy Savings taken
881,130
REVENUE BUDGET
SERVICE Corporate Allocable Costs
SERVICE DESCRIPTION These budgets are initially held centrally but are then transferred to services as
required during the year. Similarly, salary savings resulting from vacancies will
be vired from individual services as they are identified during the year.
SERVICE MANAGER Deputy Chief Executive
BUDGET MANAGER Deputy Chief Executive
ANALYSIS OF BUDGET VARIATIONS
COMMENTS
Base Budget 2014/15
COMMENTS
Base Budget 2015/16
ANALYSIS OF BUDGET VARIATIONS
Base Budget 2014/15
Outturn 2014/15 (P6 Forecast)
ACTUAL ESTIMATE PROJECTED
OUTTURN
DETAIL ESTIMATE
2013/14 2014/15 2014/15 2015/16
£ £ £ £
EXPENDITURE
45,497 83,640 12,260 Employees -
- - - Premises -
81,782 48,560 124,610 Supplies and Services 139,030
3,122 5,430 760 Transport -
130,401 137,630 137,630 TOTAL EXPENDITURE 139,030
INCOME
- - - Grants -
(2,969) - - Fees and Charges -
127,432 137,630 137,630 NET CONTROLLABLE EXPENDITURE 139,030
RECHARGES & CAPITAL CHARGES
16,317 16,040 16,040 Support Services 12,550
- - - Capital Charges -
(143,749) (153,670) (153,670) Recharges (151,510)
- - - Transfers to/from Reserves -
- - - NET EXPENDITURE (Including Recharges
and Capital Charges)
70
0
Employees (83,640)
Supplies & Services 90,470
Transport (5,430)
Support Services (3,490)
Recharges 2,160
70
0
Employees (71,380)
Supplies & Services 76,050
Transport (4,670)
-
REVENUE BUDGET
SERVICE Audit Partnership
SERVICE DESCRIPTION The four-way Audit Partnership with Maidstone, Swale and Tunbridge Wells is
responsible for internal audit within the four councils. The total cost is fully
allocated to services.
SERVICE MANAGER Deputy Chief Executive
BUDGET MANAGER Deputy Chief Executive
ANALYSIS OF BUDGET VARIATIONS
COMMENTS
Base Budget 2014/15
Transfer of budgets to Shared Services within
Supplies & Services due to new Internal Audit
arrangements beginning from 1 July 2014
COMMENTS
Base Budget 2015/16
ANALYSIS OF BUDGET VARIATIONS
Base Budget 2014/15
Transfer of budgets to Shared Services within Supplies &
Services due to new Internal Audit arrangements beginning
from 1 July 2014
Outturn 2014/15 (P6 Forecast)
ACTUAL ESTIMATE PROJECTED
OUTTURN
DETAIL ESTIMATE
2013/14 2014/15 2014/15 2015/16
£ £ £ £
EXPENDITURE
326,114 330,140 330,140 Employees 419,120
1,410 - - Premises -
32,579 36,910 36,910 Supplies and Services 51,600
23,744 3,400 3,400 Transport 6,450
383,847 370,450 370,450 TOTAL EXPENDITURE 477,170
INCOME
- - - Grants -
1,337 - - Fees and Charges (42,000)
385,184 370,450 370,450 NET CONTROLLABLE EXPENDITURE 435,170
RECHARGES & CAPITAL CHARGES
56,359 61,160 61,160 Support Services 67,350
- - - Capital Charges -
(441,543) (326,610) (326,610) Recharges (349,720)
- - - Transfers to/from Reserves -
0 105,000 105,000 NET EXPENDITURE (Including Recharges
and Capital Charges)
152,800
105,000
Employees 65,030
Employees 10,010
Employees 4,990
Employees (8,000)
Employees 16,950
Supplies and Services 16,100
Supplies and Services (1,410)
Income (42,000)
Support Services 6,190
Recharges (23,110)
149,750
105,000
105,000
REVENUE BUDGET
SERVICE Personnel & Development
SERVICE DESCRIPTION The Personnel and Development team is responsible for personnel and training
procedures, payroll, personnel policy and employee relations. These costs are
recharged to services on a per head basis.
SERVICE MANAGER Deputy Chief Executive
BUDGET MANAGER Head of Personnel & Development
ANALYSIS OF BUDGET VARIATIONS
COMMENTS
Base Budget 2014/15
Includes Pay Award, Increments and employers NI & Super
COMMENTS
Base Budget 2015/16
ANALYSIS OF BUDGET VARIATIONS
Income from Shepway DC in regard to Payroll
Outturn 2014/15 (P6 Forecast)
Base Budget 2014/15
New Payroll officer post to assist in Shepway DC payroll (22.2 hrs)
Reduction in corporate training budget
Increase in hours and regrading Personnel, projects and staff
Engagement Officer
Regrading and additional hours of payroll officer post re Shepway
Payroll
Increase in software licence costs including 12k re Shepway DC
payroll

ACTUAL ESTIMATE PROJECTED
OUTTURN
DETAIL ESTIMATE
2013/14 2014/15 2014/15 2015/16
£ £ £ £
EXPENDITURE
137,180 140,490 140,490 Employees 143,120
- - - Premises -
1,497 - - Supplies and Services 50,300
5,324 5,280 5,280 Transport 5,530
144,001 145,770 145,770 TOTAL EXPENDITURE 198,950
INCOME
(18,990) - (16,400) Grants -
- - - Fees and Charges -
125,011 145,770 129,370 NET CONTROLLABLE EXPENDITURE 198,950
RECHARGES & CAPITAL CHARGES
49,439 50,860 50,860 Support Services 63,790
- - - Capital Charges -
(63,652) (65,540) (65,540) Recharges (87,580)
- - 16,400 Transfers to/from Reserves -
110,798 131,090 131,090 NET EXPENDITURE (Including Recharges
and Capital Charges)
175,160
131,090
Employees 2,630 Includes Pay Award, Increments and
employers NI & Superannuation
Supplies and Services 300
Supplies and Services 50,000 50k re public consultation and business
planning
Transport 250
Support Services 12,930
Recharges (22,040)
175,160
131,090
Grants (16,400) New Burdens Grant
Transfers to/from Reserves 16,400 New burdens grant moved to reserves
131,090
REVENUE BUDGET
SERVICE Policy and Performance
SERVICE DESCRIPTION Responsible for development and oversight of business planning, corporate
strategy,policy and performance management, corporate partnerships and
voluntary and community sector grants.
SERVICE MANAGER Deputy Chief Executive
BUDGET MANAGER Policy & Performance Manager
ANALYSIS OF BUDGET VARIATIONS
COMMENTS
Base Budget 2014/15
COMMENTS
Base Budget 2015/16
ANALYSIS OF BUDGET VARIATIONS
Base Budget 2014/15
Outturn 2014/15 (P6 Forecast)
ACTUAL ESTIMATE PROJECTED
OUTTURN
DETAIL ESTIMATE
2013/14 2014/15 2014/15 2015/16
£ £ £ £
EXPENDITURE
- - - Employees -
3,862 - - Premises -
355,950 478,310 436,510 Supplies and Services 436,510
- - - Transport -
359,811 478,310 436,510 TOTAL EXPENDITURE 436,510
INCOME
(150) (26,140) (26,140) Grants (26,140)
- - - Fees and Charges -
359,661 452,170 410,370 NET CONTROLLABLE EXPENDITURE 410,370
RECHARGES & CAPITAL CHARGES
- - - Support Services -
- - - Capital Charges -
- - - Recharges -
- - - Transfers to/from Reserves -
359,661 452,170 410,370 NET EXPENDITURE (Including Recharges
and Capital Charges)
410,370
452,170
Supplies & Services (41,800) Reduction in ward members grants
410,370
452,170
Supplies & Services (41,800) Reduction in ward members grants
410,370
REVENUE BUDGET
SERVICE Single Grants Gateway
SERVICE DESCRIPTION Council grants to support voluntary and community sector organisations in the
borough.
SERVICE MANAGER Deputy Chief Executive
BUDGET MANAGER Policy & Performance Manager
ANALYSIS OF BUDGET VARIATIONS
COMMENTS
Base Budget 2014/15
COMMENTS
Base Budget 2015/15
ANALYSIS OF BUDGET VARIATIONS
Base Budget 2014/15
Outturn 2014/15 (P6 Forecast)
ACTUAL ESTIMATE PROJECTED
OUTTURN
DETAIL ESTIMATE
2013/14 2014/15 2014/15 2015/16
£ £ £ £
10 61,940 52,940 Legal -
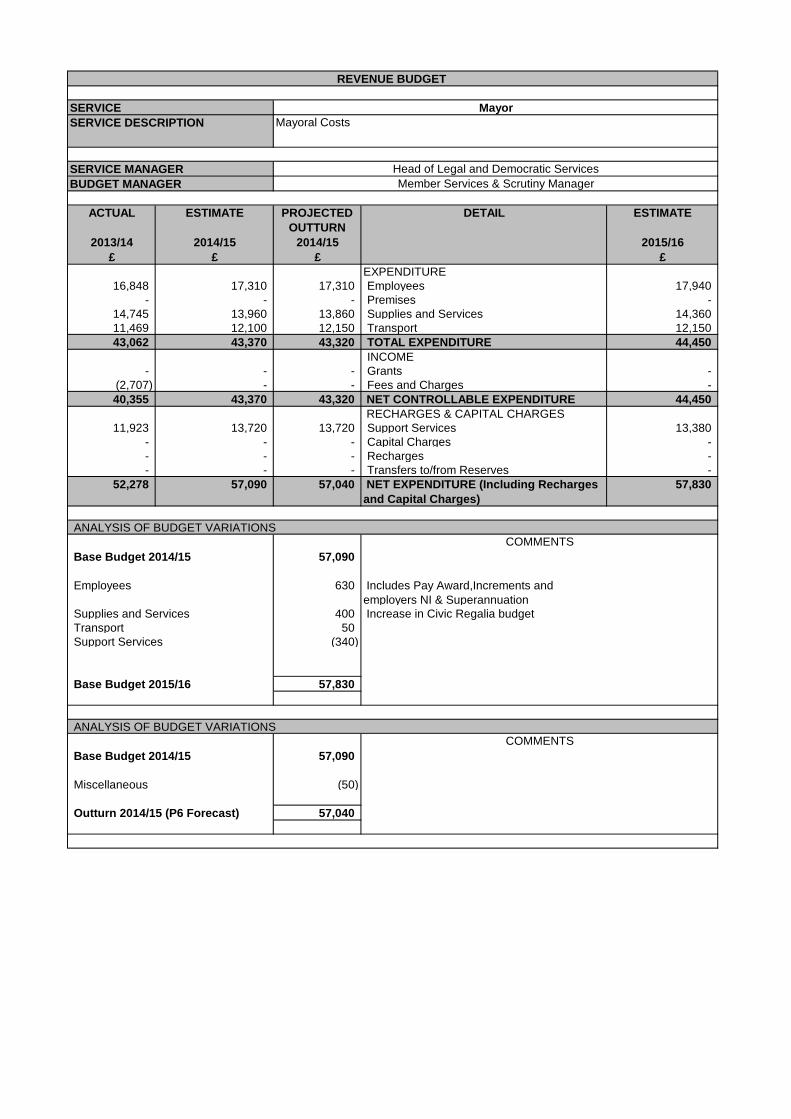
52,278 57,090 57,040 Mayor 57,830
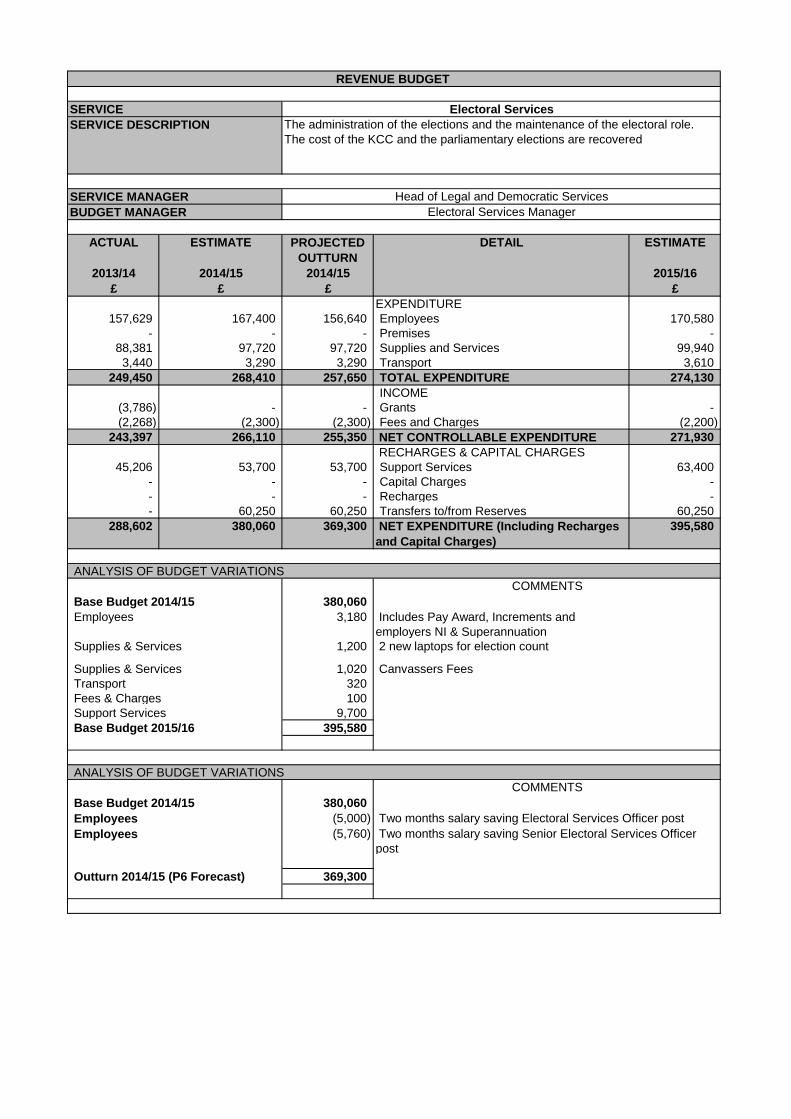
288,602 380,060 369,300 Electoral Services 395,580
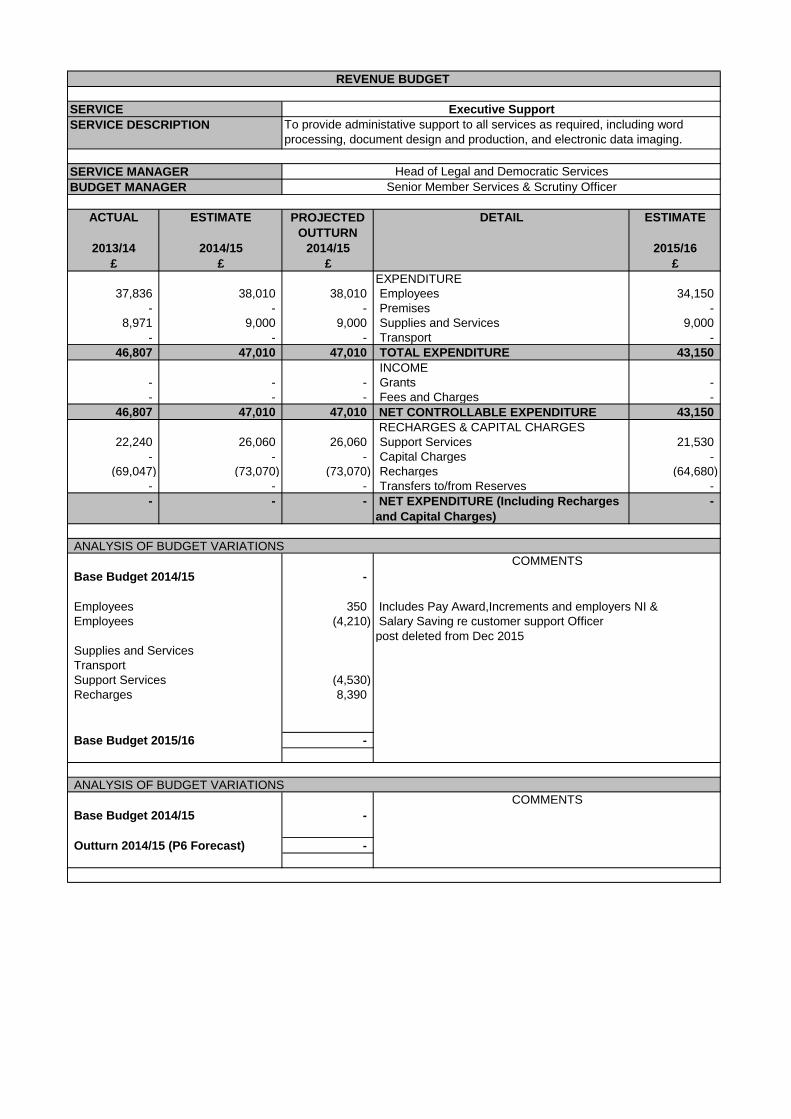
- - - Executive Support -
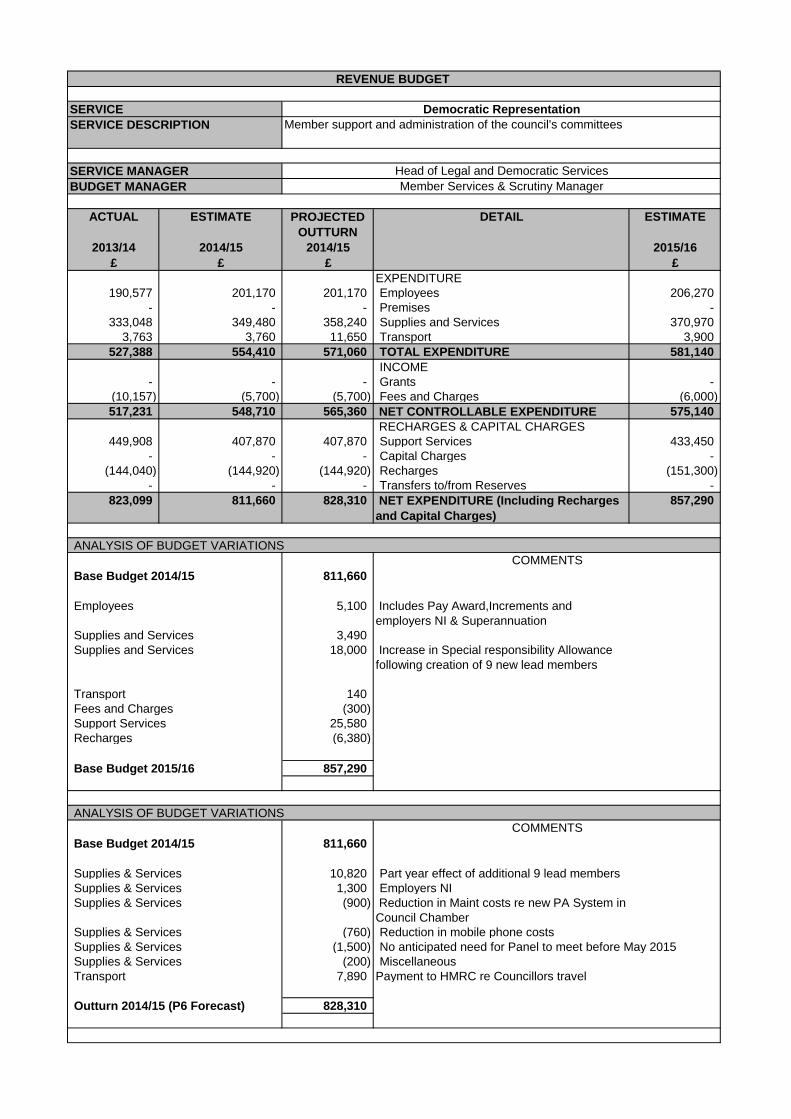
823,099 811,660 828,310 Democratic Representation 857,290
1,163,989 1,310,750 1,307,590 SERVICE EXPENDITURE 1,310,700
REVENUE BUDGET
Legal and Democratic Services
Legal Mayor Electoral Services Executive Support Democratic
Representation
Total
EXPENDITURE
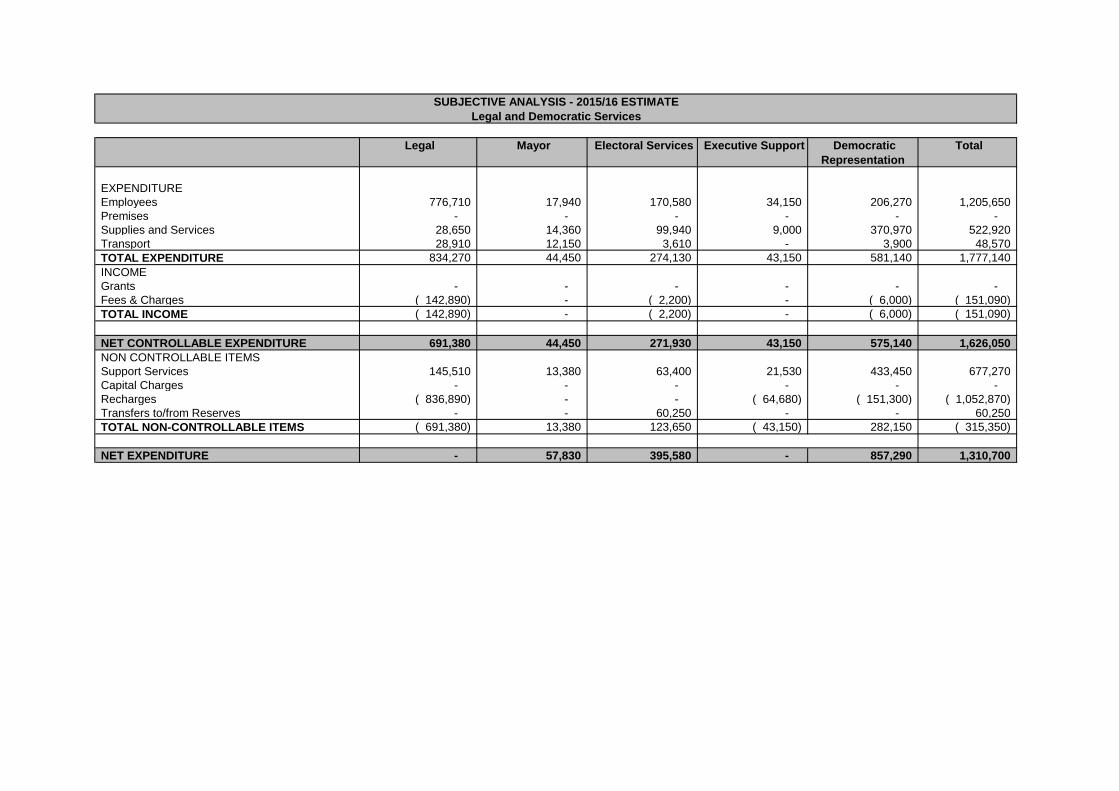
Employees 776,710 17,940 170,580 34,150 206,270 1,205,650
Premises - - - - - -
Supplies and Services 28,650 14,360 99,940 9,000 370,970 522,920
Transport 28,910 12,150 3,610 - 3,900 48,570
TOTAL EXPENDITURE 834,270 44,450 274,130 43,150 581,140 1,777,140
INCOME
Grants - - - - - -
Fees & Charges ( 142,890) - ( 2,200) - ( 6,000) ( 151,090)
TOTAL INCOME ( 142,890) - ( 2,200) - ( 6,000) ( 151,090)
NET CONTROLLABLE EXPENDITURE 691,380 44,450 271,930 43,150 575,140 1,626,050
NON CONTROLLABLE ITEMS
Support Services 145,510 13,380 63,400 21,530 433,450 677,270
Capital Charges - - - - - -
Recharges ( 836,890) - - ( 64,680) ( 151,300) ( 1,052,870)
Transfers to/from Reserves - - 60,250 - - 60,250
TOTAL NON-CONTROLLABLE ITEMS ( 691,380) 13,380 123,650 ( 43,150) 282,150 ( 315,350)
NET EXPENDITURE - 57,830 395,580 - 857,290 1,310,700
SUBJECTIVE ANALYSIS - 2015/16 ESTIMATE
Legal and Democratic Services

ACTUAL ESTIMATE PROJECTED
OUTTURN
DETAIL ESTIMATE
2013/14 2014/15 2014/15 2015/16
£ £ £ £
EXPENDITURE
696,349 816,280 807,280 Employees 776,710
- - - Premises -
64,472 41,940 41,940 Supplies and Services 28,650
23,287 26,780 26,780 Transport 28,910
784,109 885,000 876,000 TOTAL EXPENDITURE 834,270
INCOME
- - - Grants -
(105,210) (139,400) (139,400) Fees and Charges (142,890)
678,899 745,600 736,600 NET CONTROLLABLE EXPENDITURE 691,380
RECHARGES & CAPITAL CHARGES
132,375 140,370 140,370 Support Services 145,510
- - - Capital Charges -
(811,264) (824,030) (824,030) Recharges (836,890)
- - - Transfers to/from Reserves -
10 61,940 52,940 NET EXPENDITURE (Including Recharges
and Capital Charges)
-
61,940
Salaries - Post Deletion (37,000)
Salaries - Reduction in Hours (6,090)
Salaries - pay awards,increments etc 3,520
Supplies and Services (8,000)
Supplies and Services (5,000)
Supplies and Services (290) Miscellaneous
Transport 2,130 Increase in Cash Alternative payments
Income (3,490) Increase in line with MTFP
Support Services 5,140
Recharges (12,860)
-
61,940
Vacancy Savings (8,590) 2 months senior solicitor (Planning) post
Miscellaneous savings (410)
52,940
REVENUE BUDGET
SERVICE Legal
SERVICE DESCRIPTION Providing Legal services to all departments and ensuring full compliance with
Member Code of Conduct and Monitoring Officer Duties
SERVICE MANAGER Head of Legal and Democratic Services
BUDGET MANAGER Principal Solicitor (Property and Projects)
ANALYSIS OF BUDGET VARIATIONS
COMMENTS
Base Budget 2014/15
Deletion of Deputy Monitoring Officer post (15% savings
target)
Reduction of 7.4 hours per week PA to head of legal services
(15% savings target)
Includes Pay Award,Increments and employers NI &
Superannuation
COMMENTS
Base Budget 2015/16
ANALYSIS OF BUDGET VARIATIONS
Base Budget 2014/15
Reduction of Books & Publications Budget(15% savings target)
Reduction in Professional Fees (15% savings target)
Outturn 2014/15 (P6 Forecast)
ACTUAL ESTIMATE PROJECTED
OUTTURN
DETAIL ESTIMATE
2013/14 2014/15 2014/15 2015/16
£ £ £ £
EXPENDITURE
16,848 17,310 17,310 Employees 17,940
- - - Premises -
14,745 13,960 13,860 Supplies and Services 14,360
11,469 12,100 12,150 Transport 12,150
43,062 43,370 43,320 TOTAL EXPENDITURE 44,450
INCOME
- - - Grants -
(2,707) - - Fees and Charges -
40,355 43,370 43,320 NET CONTROLLABLE EXPENDITURE 44,450
RECHARGES & CAPITAL CHARGES
11,923 13,720 13,720 Support Services 13,380
- - - Capital Charges -
- - - Recharges -
- - - Transfers to/from Reserves -
52,278 57,090 57,040 NET EXPENDITURE (Including Recharges
and Capital Charges)
57,830
57,090
Employees 630 Includes Pay Award,Increments and
employers NI & Superannuation
Supplies and Services 400
Transport 50
Support Services (340)
57,830
57,090
Miscellaneous (50)
57,040
REVENUE BUDGET
SERVICE Mayor
SERVICE DESCRIPTION Mayoral Costs
SERVICE MANAGER Head of Legal and Democratic Services
BUDGET MANAGER Member Services & Scrutiny Manager
ANALYSIS OF BUDGET VARIATIONS
COMMENTS
Base Budget 2014/15
Increase in Civic Regalia budget
COMMENTS
Base Budget 2015/16
ANALYSIS OF BUDGET VARIATIONS
Base Budget 2014/15
Outturn 2014/15 (P6 Forecast)
ACTUAL ESTIMATE PROJECTED
OUTTURN
DETAIL ESTIMATE
2013/14 2014/15 2014/15 2015/16
£ £ £ £
EXPENDITURE
157,629 167,400 156,640 Employees 170,580
- - - Premises -
88,381 97,720 97,720 Supplies and Services 99,940
3,440 3,290 3,290 Transport 3,610
249,450 268,410 257,650 TOTAL EXPENDITURE 274,130
INCOME
(3,786) - - Grants -
(2,268) (2,300) (2,300) Fees and Charges (2,200)
243,397 266,110 255,350 NET CONTROLLABLE EXPENDITURE 271,930
RECHARGES & CAPITAL CHARGES
45,206 53,700 53,700 Support Services 63,400
- - - Capital Charges -
- - - Recharges -
- 60,250 60,250 Transfers to/from Reserves 60,250
288,602 380,060 369,300 NET EXPENDITURE (Including Recharges
and Capital Charges)
395,580
380,060
Employees 3,180 Includes Pay Award, Increments and
employers NI & Superannuation
Supplies & Services 1,200
Supplies & Services 1,020 Canvassers Fees
Transport 320
Fees & Charges 100
Support Services 9,700
395,580
380,060
Employees (5,000)
Employees (5,760)
369,300
REVENUE BUDGET
SERVICE Electoral Services
SERVICE DESCRIPTION The administration of the elections and the maintenance of the electoral role.
The cost of the KCC and the parliamentary elections are recovered
SERVICE MANAGER Head of Legal and Democratic Services
BUDGET MANAGER Electoral Services Manager
ANALYSIS OF BUDGET VARIATIONS
COMMENTS
Base Budget 2014/15
2 new laptops for election count
COMMENTS
Base Budget 2015/16
ANALYSIS OF BUDGET VARIATIONS
Base Budget 2014/15
Two months salary saving Electoral Services Officer post
Two months salary saving Senior Electoral Services Officer
post
Outturn 2014/15 (P6 Forecast)
ACTUAL ESTIMATE PROJECTED
OUTTURN
DETAIL ESTIMATE
2013/14 2014/15 2014/15 2015/16
£ £ £ £
EXPENDITURE
37,836 38,010 38,010 Employees 34,150
- - - Premises -
8,971 9,000 9,000 Supplies and Services 9,000
- - - Transport -
46,807 47,010 47,010 TOTAL EXPENDITURE 43,150
INCOME
- - - Grants -
- - - Fees and Charges -
46,807 47,010 47,010 NET CONTROLLABLE EXPENDITURE 43,150
RECHARGES & CAPITAL CHARGES
22,240 26,060 26,060 Support Services 21,530
- - - Capital Charges -
(69,047) (73,070) (73,070) Recharges (64,680)
- - - Transfers to/from Reserves -
- - - NET EXPENDITURE (Including Recharges
and Capital Charges)
-
-
Employees 350
Employees (4,210) Salary Saving re customer support Officer
post deleted from Dec 2015
Supplies and Services
Transport
Support Services (4,530)
Recharges 8,390
-
-
-
REVENUE BUDGET
SERVICE Executive Support
SERVICE DESCRIPTION To provide administative support to all services as required, including word
processing, document design and production, and electronic data imaging.
SERVICE MANAGER Head of Legal and Democratic Services
BUDGET MANAGER Senior Member Services & Scrutiny Officer
ANALYSIS OF BUDGET VARIATIONS
COMMENTS
Base Budget 2014/15
Includes Pay Award,Increments and employers NI &
COMMENTS
Base Budget 2015/16
ANALYSIS OF BUDGET VARIATIONS
Outturn 2014/15 (P6 Forecast)
Base Budget 2014/15
ACTUAL ESTIMATE PROJECTED
OUTTURN
DETAIL ESTIMATE
2013/14 2014/15 2014/15 2015/16
£ £ £ £
EXPENDITURE
190,577 201,170 201,170 Employees 206,270
- - - Premises -
333,048 349,480 358,240 Supplies and Services 370,970
3,763 3,760 11,650 Transport 3,900
527,388 554,410 571,060 TOTAL EXPENDITURE 581,140
INCOME
- - - Grants -
(10,157) (5,700) (5,700) Fees and Charges (6,000)
517,231 548,710 565,360 NET CONTROLLABLE EXPENDITURE 575,140
RECHARGES & CAPITAL CHARGES
449,908 407,870 407,870 Support Services 433,450
- - - Capital Charges -
(144,040) (144,920) (144,920) Recharges (151,300)
- - - Transfers to/from Reserves -
823,099 811,660 828,310 NET EXPENDITURE (Including Recharges
and Capital Charges)
857,290
811,660
Employees 5,100 Includes Pay Award,Increments and
employers NI & Superannuation
Supplies and Services 3,490
Supplies and Services 18,000 Increase in Special responsibility Allowance
following creation of 9 new lead members
Transport 140
Fees and Charges (300)
Support Services 25,580
Recharges (6,380)
857,290
811,660
Supplies & Services 10,820 Part year effect of additional 9 lead members
Supplies & Services 1,300 Employers NI
Supplies & Services (900) Reduction in Maint costs re new PA System in
Council Chamber
Supplies & Services (760) Reduction in mobile phone costs
Supplies & Services (1,500) No anticipated need for Panel to meet before May 2015
Supplies & Services (200) Miscellaneous
7,890 Payment to HMRC re Councillors travel
828,310
REVENUE BUDGET
SERVICE Democratic Representation
SERVICE DESCRIPTION Member support and administration of the council's committees
SERVICE MANAGER Head of Legal and Democratic Services
BUDGET MANAGER Member Services & Scrutiny Manager
ANALYSIS OF BUDGET VARIATIONS
COMMENTS
Base Budget 2014/15
COMMENTS
Base Budget 2015/16
ANALYSIS OF BUDGET VARIATIONS
Base Budget 2014/15
Transport
Outturn 2014/15 (P6 Forecast)

This page has been intentionally left blank
ACTUAL ESTIMATE PROJECTED
OUTTURN
DETAIL ESTIMATE
2013/14 2014/15 2014/15 2015/16
£ £ £ £
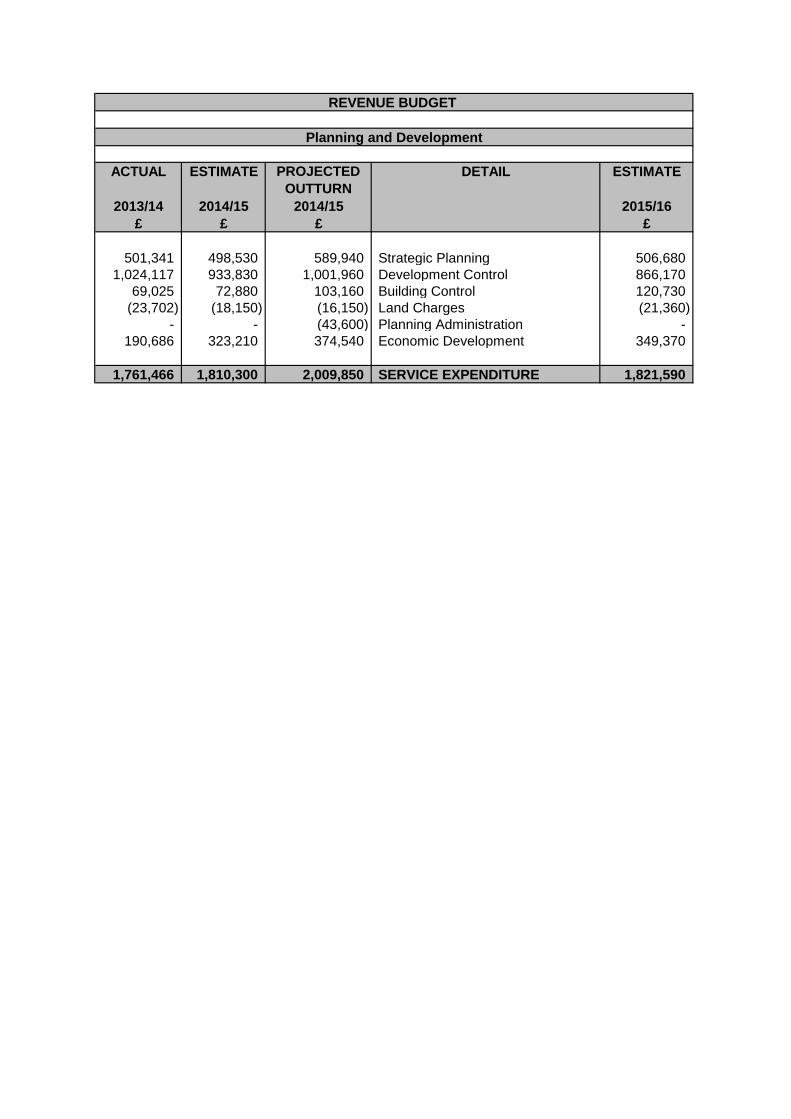
501,341 498,530 589,940 Strategic Planning 506,680
1,024,117 933,830 1,001,960 Development Control 866,170
69,025 72,880 103,160 Building Control 120,730
(23,702) (18,150) (16,150) Land Charges (21,360)
- - (43,600) Planning Administration -
190,686 323,210 374,540 Economic Development 349,370
1,761,466 1,810,300 2,009,850 SERVICE EXPENDITURE 1,821,590
REVENUE BUDGET
Planning and Development
Strategic
Planning
Development
Control
Building
Control
Land Charges Planning
Administration
Economic
Development
Total
EXPENDITURE
Employees 510,030 907,410 471,760 90,830 245,790 196,350 2,422,170
Premises - - - - - 5,780 5,780
Supplies and Services 45,620 90,880 35,950 20,020 1,200 139,270 332,940
Transport 16,500 53,960 25,270 200 50 10,460 106,440
TOTAL EXPENDITURE 572,150 1,052,250 532,980 111,050 247,040 351,860 2,867,330
INCOME
Grants - - - - - (38,460) (38,460)
Fees & Charges - (813,170) (437,000) (213,000) (15,000) (5,000) (1,483,170)
TOTAL INCOME - (813,170) (437,000) (213,000) (15,000) (43,460) (1,521,630)
NET CONTROLLABLE EXPENDITURE 572,150 239,080 95,980 (101,950) 232,040 308,400 1,345,700
NON CONTROLLABLE ITEMS
Support Services 139,460 767,950 93,390 80,160 98,060 40,970 1,219,990
Capital Charges - - - - - - -
Recharges (204,930) (140,860) (68,640) - (330,100) - (744,530)
Transfers to/from Reserves - - - 430 - - 430
TOTAL NON-CONTROLLABLE ITEMS (65,470) 627,090 24,750 80,590 (232,040) 40,970 475,890
NET EXPENDITURE 506,680 866,170 120,730 (21,360) - 349,370 1,821,590
SUBJECTIVE ANALYSIS - 2015/16 ESTIMATE
Planning and Development

ACTUAL ESTIMATE PROJECTED
OUTTURN
DETAIL ESTIMATE
2013/14 2014/15 2014/15 2015/16
£ £ £ £
EXPENDITURE
518,157 532,460 469,230 Employees 510,030
360 - - Premises -
54,874 41,620 206,260 Supplies and Services 45,620
21,349 20,150 20,150 Transport 16,500
594,740 594,230 695,640 TOTAL EXPENDITURE 572,150
INCOME
(5,000) - (10,000) Grants -
(1,289) - - Fees and Charges -
588,451 594,230 685,640 NET CONTROLLABLE EXPENDITURE 572,150
RECHARGES & CAPITAL CHARGES
111,293 103,130 103,130 Support Services 139,460
- - - Capital Charges -
(198,404) (198,830) (198,830) Recharges (204,930)
- - - Transfers to/from Reserves -
501,341 498,530 589,940 NET EXPENDITURE (Including Recharges
and Capital Charges)
506,680
498,530
Employees (22,430)
Supplies and Services 4,000
Transport (3,650) Reduction from deleted post above
Support Services 36,330 Increased recharges from departments
Recharges (6,100) increase in recharges to departments
506,680
498,530
Employees (63,230) Saving resulting from vacancies
Supplies and Services 125,000 NHB funding for Specialist Planning Advice
Supplies and Services 35,000 NHB funding for ABC Truck Stop
Supplies and Services 4,640
Grants (10,000) Government Grants awarded.
589,940
REVENUE BUDGET
SERVICE Strategic Planning
SERVICE DESCRIPTION Producing the Local Development Framework for the Borough and taking
forward Ashford growth proposals
SERVICE MANAGER Head of Planning and Development
BUDGET MANAGER Business Manager and Head of Building Control
ANALYSIS OF BUDGET VARIATIONS
COMMENTS
Base Budget 2014/15
Professional journal subscription
COMMENTS
Base Budget 2015/16
ANALYSIS OF BUDGET VARIATIONS
Professional journal subscription & other small changes
Senior Planning Officer post removed from structure
Outturn 2014/15 (P6 Forecast)
Base Budget 2014/15
ACTUAL ESTIMATE PROJECTED
OUTTURN
DETAIL ESTIMATE
2013/14 2014/15 2014/15 2015/16
£ £ £ £
EXPENDITURE
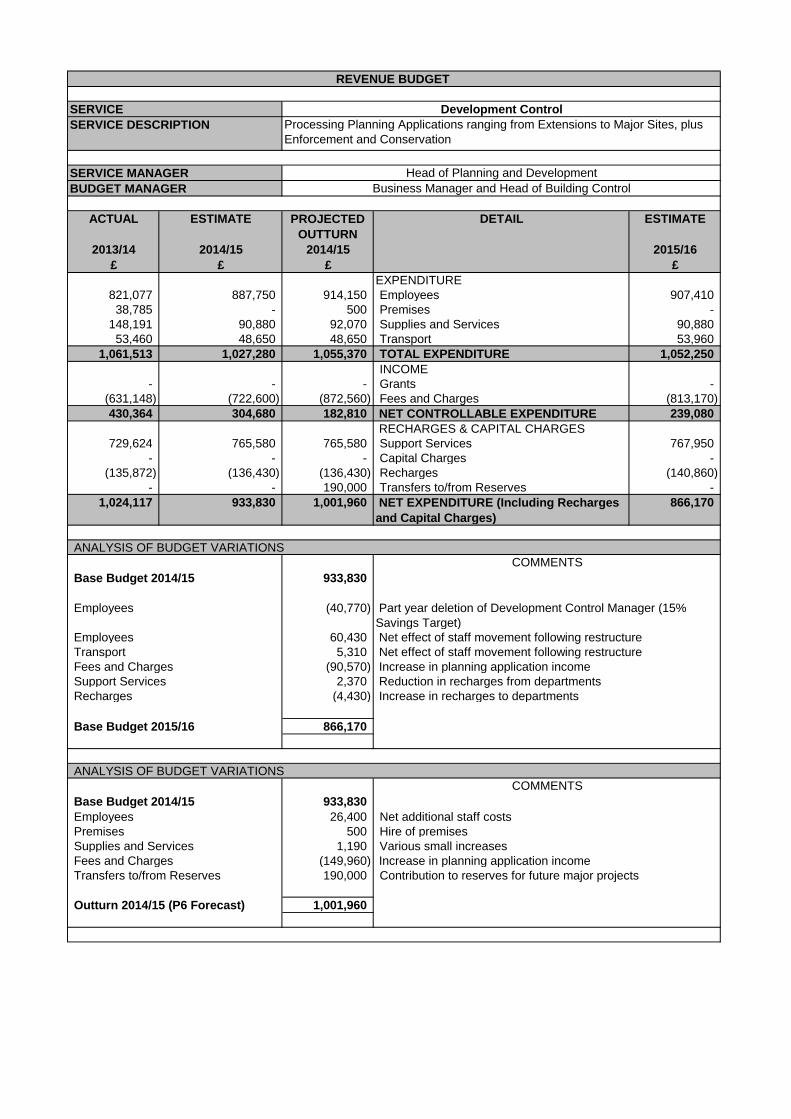
821,077 887,750 914,150 Employees 907,410
38,785 - 500 Premises -
148,191 90,880 92,070 Supplies and Services 90,880
53,460 48,650 48,650 Transport 53,960
1,061,513 1,027,280 1,055,370 TOTAL EXPENDITURE 1,052,250
INCOME
- - - Grants -
(631,148) (722,600) (872,560) Fees and Charges (813,170)
430,364 304,680 182,810 NET CONTROLLABLE EXPENDITURE 239,080
RECHARGES & CAPITAL CHARGES
729,624 765,580 765,580 Support Services 767,950
- - - Capital Charges -
(135,872) (136,430) (136,430) Recharges (140,860)
- - 190,000 Transfers to/from Reserves -
1,024,117 933,830 1,001,960 NET EXPENDITURE (Including Recharges
and Capital Charges)
866,170
933,830
Employees (40,770)
Employees 60,430
Transport 5,310
Fees and Charges (90,570)
Support Services 2,370
Recharges (4,430) Increase in recharges to departments
866,170
933,830
Employees 26,400 Net additional staff costs
Premises 500 Hire of premises
Supplies and Services 1,190 Various small increases
Fees and Charges (149,960)
Transfers to/from Reserves 190,000 Contribution to reserves for future major projects
1,001,960
REVENUE BUDGET
SERVICE Development Control
SERVICE DESCRIPTION Processing Planning Applications ranging from Extensions to Major Sites, plus
Enforcement and Conservation
SERVICE MANAGER Head of Planning and Development
BUDGET MANAGER Business Manager and Head of Building Control
ANALYSIS OF BUDGET VARIATIONS
COMMENTS
Base Budget 2014/15
Part year deletion of Development Control Manager (15%
Savings Target)
Increase in planning application income
COMMENTS
Base Budget 2015/16
ANALYSIS OF BUDGET VARIATIONS
Base Budget 2014/15
Increase in planning application income
Reduction in recharges from departments
Net effect of staff movement following restructure
Net effect of staff movement following restructure
Outturn 2014/15 (P6 Forecast)
ACTUAL ESTIMATE PROJECTED
OUTTURN
DETAIL ESTIMATE
2013/14 2014/15 2014/15 2015/16
£ £ £ £
EXPENDITURE
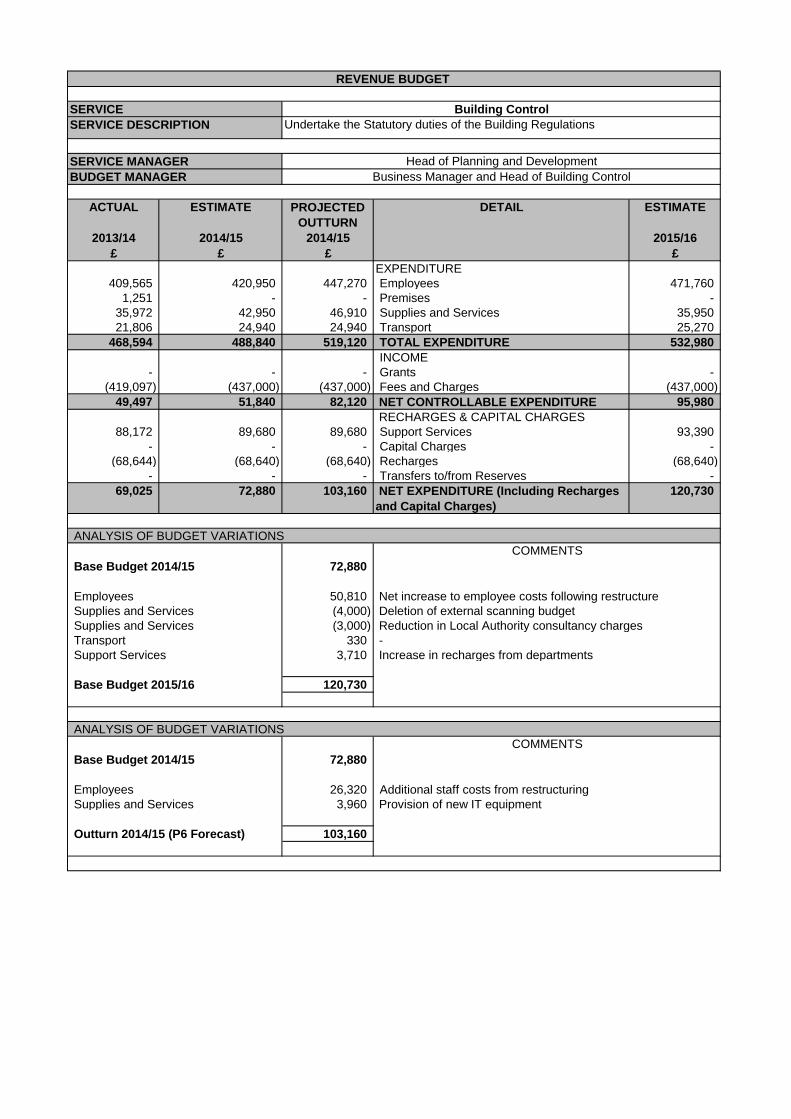
409,565 420,950 447,270 Employees 471,760
1,251 - - Premises -
35,972 42,950 46,910 Supplies and Services 35,950
21,806 24,940 24,940 Transport 25,270
468,594 488,840 519,120 TOTAL EXPENDITURE 532,980
INCOME
- - - Grants -
(419,097) (437,000) (437,000) Fees and Charges (437,000)
49,497 51,840 82,120 NET CONTROLLABLE EXPENDITURE 95,980
RECHARGES & CAPITAL CHARGES
88,172 89,680 89,680 Support Services 93,390
- - - Capital Charges -
(68,644) (68,640) (68,640) Recharges (68,640)
- - - Transfers to/from Reserves -
69,025 72,880 103,160 NET EXPENDITURE (Including Recharges
and Capital Charges)
120,730
72,880
Employees 50,810
Supplies and Services (4,000)
Supplies and Services (3,000)
Transport 330 -
Support Services 3,710 Increase in recharges from departments
120,730
72,880
Employees 26,320 Additional staff costs from restructuring
Supplies and Services 3,960
103,160
REVENUE BUDGET
SERVICE Building Control
SERVICE DESCRIPTION Undertake the Statutory duties of the Building Regulations
SERVICE MANAGER Head of Planning and Development
BUDGET MANAGER Business Manager and Head of Building Control
ANALYSIS OF BUDGET VARIATIONS
COMMENTS
Base Budget 2014/15
Net increase to employee costs following restructure
Deletion of external scanning budget
Reduction in Local Authority consultancy charges
COMMENTS
Base Budget 2015/16
ANALYSIS OF BUDGET VARIATIONS
Base Budget 2014/15
Provision of new IT equipment
Outturn 2014/15 (P6 Forecast)

ACTUAL ESTIMATE PROJECTED
OUTTURN
DETAIL ESTIMATE
2013/14 2014/15 2014/15 2015/16
£ £ £ £
EXPENDITURE
80,975 92,640 93,870 Employees 90,830
- - - Premises -
46,305 20,020 20,790 Supplies and Services 20,020
732 200 200 Transport 200
128,012 112,860 114,860 TOTAL EXPENDITURE 111,050
INCOME
- - - Grants -
(235,611) (213,000) (213,000) Fees and Charges (213,000)
(107,599) (100,140) (98,140) NET CONTROLLABLE EXPENDITURE (101,950)
RECHARGES & CAPITAL CHARGES
83,897 81,560 81,560 Support Services 80,160
- - - Capital Charges -
- - - Recharges -
- 430 430 Transfers to/from Reserves 430
(23,702) (18,150) (16,150) NET EXPENDITURE (Including Recharges
and Capital Charges)
(21,360)
(18,150)
Employees (1,810)
Support Services (1,400)
Fees and Charges -
(21,360)
(18,150)
Employees 1,230
Supplies and Services 770
(16,150)
REVENUE BUDGET
SERVICE Land Charges
SERVICE DESCRIPTION Provision of IT support to all services and to lead in the development of new
applications, including GIS
SERVICE MANAGER Head of Planning and Development
BUDGET MANAGER Business Manager and Head of Building Control
ANALYSIS OF BUDGET VARIATIONS
COMMENTS
Base Budget 2014/15
COMMENTS
Base Budget 2015/16
ANALYSIS OF BUDGET VARIATIONS
NOTES
Any surplus or deficit at year end is moved to the Land Charges reserve
Outturn 2014/15 (P6 Forecast)
Base Budget 2014/15

ACTUAL ESTIMATE PROJECTED
OUTTURN
DETAIL ESTIMATE
2013/14 2014/15 2014/15 2015/16
£ £ £ £
EXPENDITURE
272,388 282,930 239,330 Employees 245,790
352 - - Premises -
53,397 1,200 1,200 Supplies and Services 1,200
266 50 50 Transport 50
326,403 284,180 240,580 TOTAL EXPENDITURE 247,040
INCOME
- - - Grants -
(91,593) (10,000) (10,000) Fees and Charges (15,000)
234,810 274,180 230,580 NET CONTROLLABLE EXPENDITURE 232,040
RECHARGES & CAPITAL CHARGES
106,176 105,060 105,060 Support Services 98,060
- - - Capital Charges -
(340,986) (379,240) (379,240) Recharges (330,100)
- - - Transfers to/from Reserves -
- - (43,600) NET EXPENDITURE (Including Recharges
and Capital Charges)
-
-
Employees (37,140) Deletion of a Technical Clerk and movement
of Planning Enforcement Officer to
Development Control
Fees and Charges (5,000) Increase in charges
Support Services (7,000) Reduction in recharges from departments
Recharges 49,140 Reduction in recharges to departments
-
-
Employees (43,600) Vacancy savings and savings from secondment
(43,600)
REVENUE BUDGET
SERVICE Planning Administration
SERVICE DESCRIPTION Holding account for the costs of the administration for the Planning and Building
Control Service.
SERVICE MANAGER Head of Planning and Development
BUDGET MANAGER Business Manager and Head of Building Control
ANALYSIS OF BUDGET VARIATIONS
COMMENTS
Base Budget 2014/15
COMMENTS
Base Budget 2015/16
ANALYSIS OF BUDGET VARIATIONS
Base Budget 2014/15
Outturn 2014/15 (P6 Forecast)
ACTUAL ESTIMATE PROJECTED
OUTTURN
DETAIL ESTIMATE
2013/14 2014/15 2014/15 2015/16
£ £ £ £
EXPENDITURE
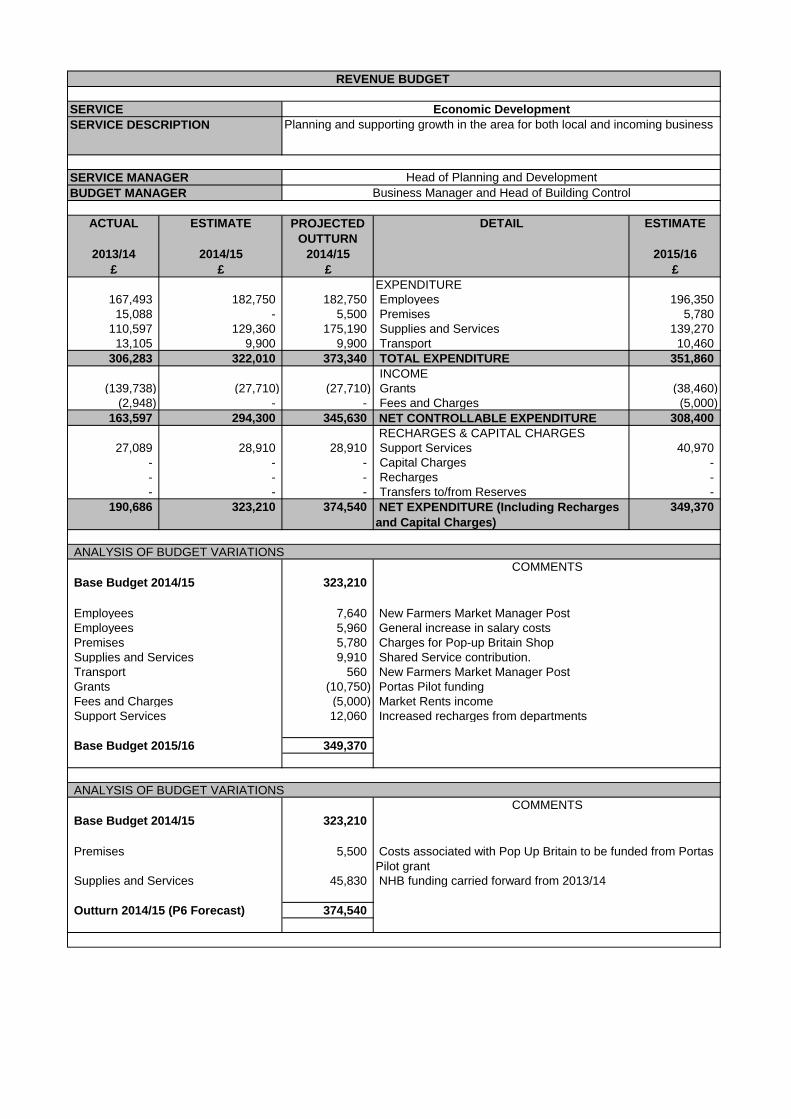
167,493 182,750 182,750 Employees 196,350
15,088 - 5,500 Premises 5,780
110,597 129,360 175,190 Supplies and Services 139,270
13,105 9,900 9,900 Transport 10,460
306,283 322,010 373,340 TOTAL EXPENDITURE 351,860
INCOME
(139,738) (27,710) (27,710) Grants (38,460)
(2,948) - - Fees and Charges (5,000)
163,597 294,300 345,630 NET CONTROLLABLE EXPENDITURE 308,400
RECHARGES & CAPITAL CHARGES
27,089 28,910 28,910 Support Services 40,970
- - - Capital Charges -
- - - Recharges -
- - - Transfers to/from Reserves -
190,686 323,210 374,540 NET EXPENDITURE (Including Recharges
and Capital Charges)
349,370
323,210
Employees 7,640
Employees 5,960 General increase in salary costs
Premises 5,780
Supplies and Services 9,910
Transport 560
Grants (10,750) Portas Pilot funding
Fees and Charges (5,000) Market Rents income
Support Services 12,060 Increased recharges from departments
349,370
323,210
Premises 5,500
Supplies and Services 45,830
374,540
REVENUE BUDGET
SERVICE Economic Development
SERVICE DESCRIPTION Planning and supporting growth in the area for both local and incoming business
SERVICE MANAGER Head of Planning and Development
BUDGET MANAGER Business Manager and Head of Building Control
ANALYSIS OF BUDGET VARIATIONS
COMMENTS
Base Budget 2014/15
New Farmers Market Manager Post
Charges for Pop-up Britain Shop
Shared Service contribution.
COMMENTS
Base Budget 2015/16
ANALYSIS OF BUDGET VARIATIONS
Costs associated with Pop Up Britain to be funded from Portas
Pilot grant
NHB funding carried forward from 2013/14
New Farmers Market Manager Post
Outturn 2014/15 (P6 Forecast)
Base Budget 2014/15
ACTUAL ESTIMATE PROJECTED
OUTTURN
DETAIL ESTIMATE
2013/14 2014/15 2014/15 2015/16
£ £ £ £
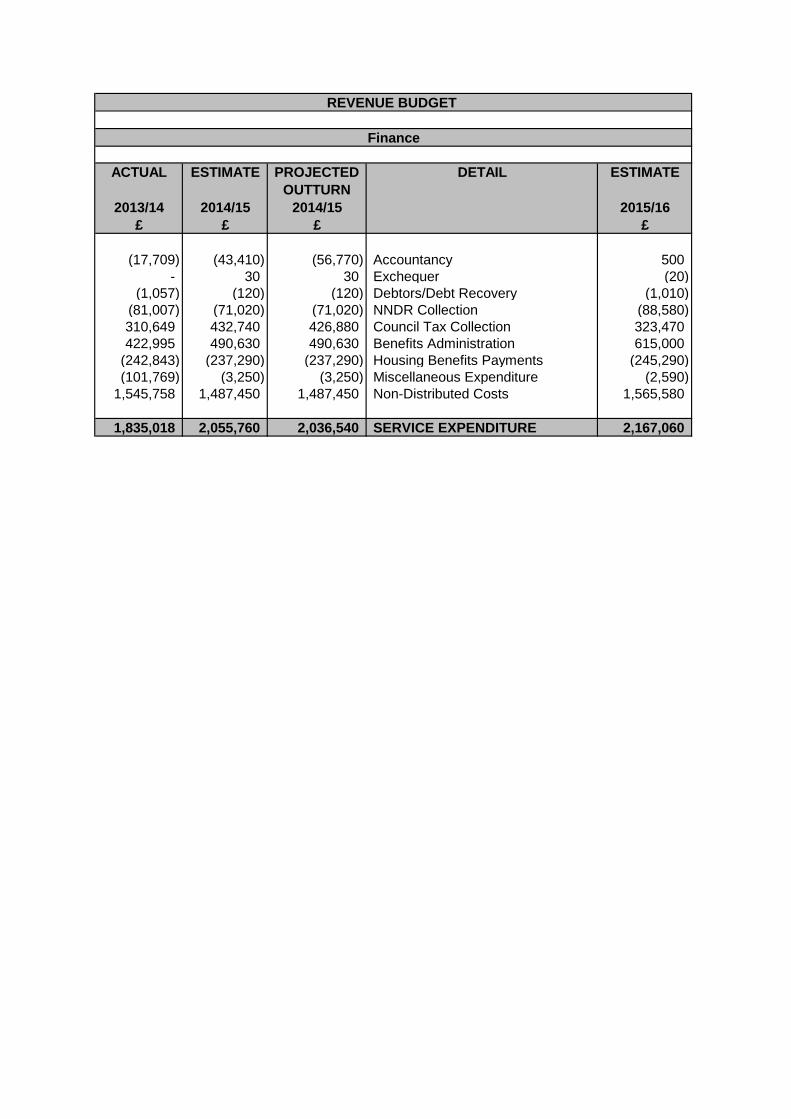
(17,709) (43,410) (56,770) Accountancy 500
- 30 30 Exchequer (20)
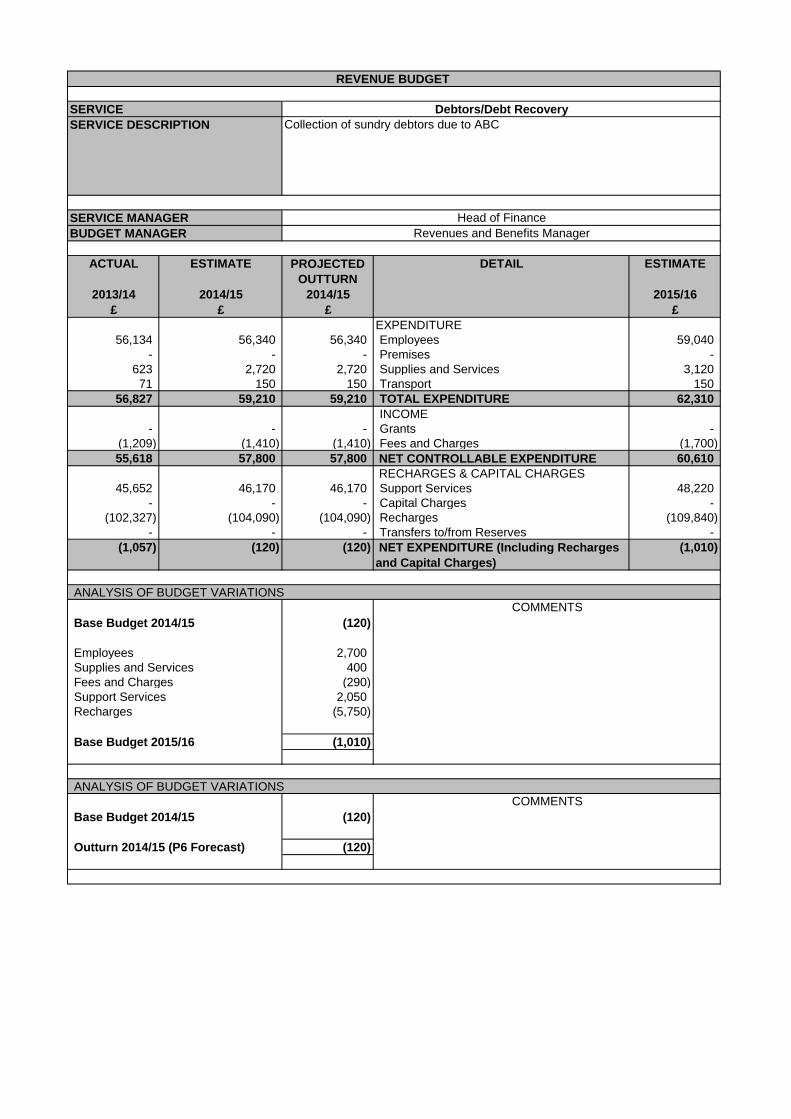
(1,057) (120) (120) Debtors/Debt Recovery (1,010)
(81,007) (71,020) (71,020) NNDR Collection (88,580)
310,649 432,740 426,880 Council Tax Collection 323,470
422,995 490,630 490,630 Benefits Administration 615,000
(242,843) (237,290) (237,290) Housing Benefits Payments (245,290)
(101,769) (3,250) (3,250) Miscellaneous Expenditure (2,590)
1,545,758 1,487,450 1,487,450 Non-Distributed Costs 1,565,580
1,835,018 2,055,760 2,036,540 SERVICE EXPENDITURE 2,167,060
REVENUE BUDGET
Finance
Accountancy Exchequer Debtors/Debt
Recovery
NNDR Collection Council Tax
Collection
Benefits
Administration
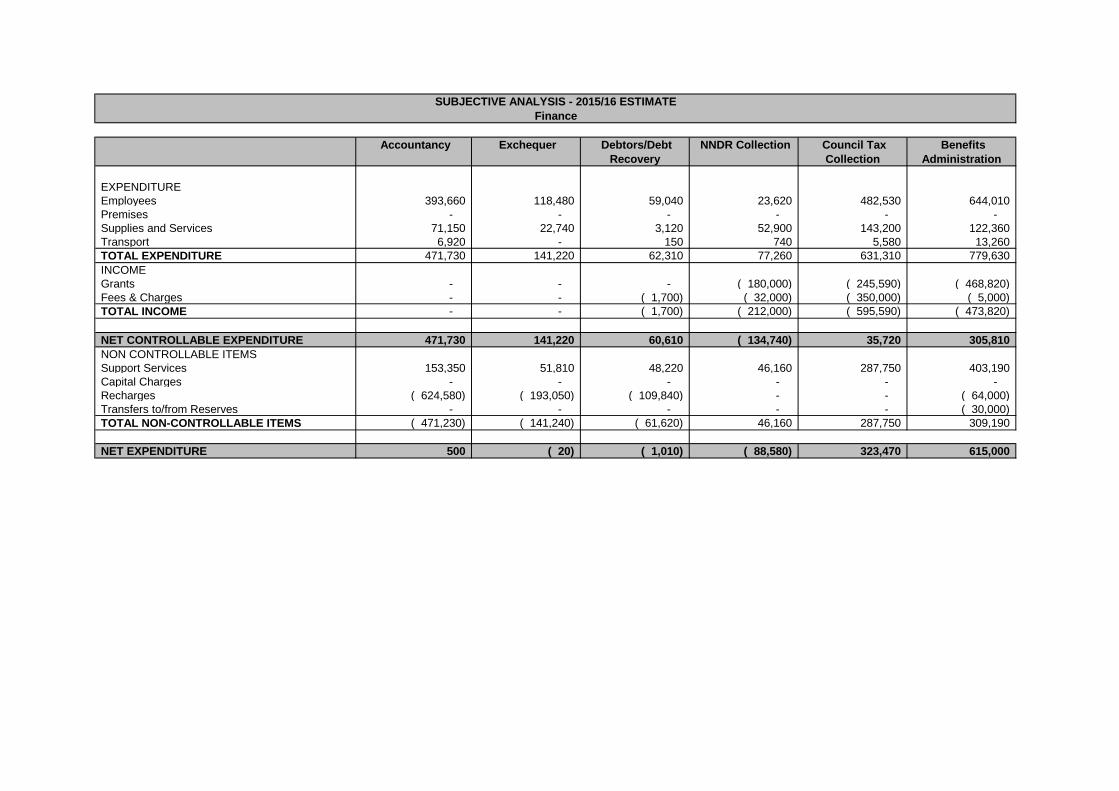
EXPENDITURE
Employees 393,660 118,480 59,040 23,620 482,530 644,010
Premises - - - - - -
Supplies and Services 71,150 22,740 3,120 52,900 143,200 122,360
Transport 6,920 - 150 740 5,580 13,260
TOTAL EXPENDITURE 471,730 141,220 62,310 77,260 631,310 779,630
INCOME
Grants - - - ( 180,000) ( 245,590) ( 468,820)
Fees & Charges - - ( 1,700) ( 32,000) ( 350,000) ( 5,000)
TOTAL INCOME - - ( 1,700) ( 212,000) ( 595,590) ( 473,820)
NET CONTROLLABLE EXPENDITURE 471,730 141,220 60,610 ( 134,740) 35,720 305,810
NON CONTROLLABLE ITEMS
Support Services 153,350 51,810 48,220 46,160 287,750 403,190
Capital Charges - - - - - -
Recharges ( 624,580) ( 193,050) ( 109,840) - - ( 64,000)
Transfers to/from Reserves - - - - - ( 30,000)
TOTAL NON-CONTROLLABLE ITEMS ( 471,230) ( 141,240) ( 61,620) 46,160 287,750 309,190
NET EXPENDITURE 500 ( 20) ( 1,010) ( 88,580) 323,470 615,000
SUBJECTIVE ANALYSIS - 2015/16 ESTIMATE
Finance
ACTUAL ESTIMATE PROJECTED
OUTTURN
DETAIL ESTIMATE
2013/14 2014/15 2014/15 2015/16
£ £ £ £
EXPENDITURE
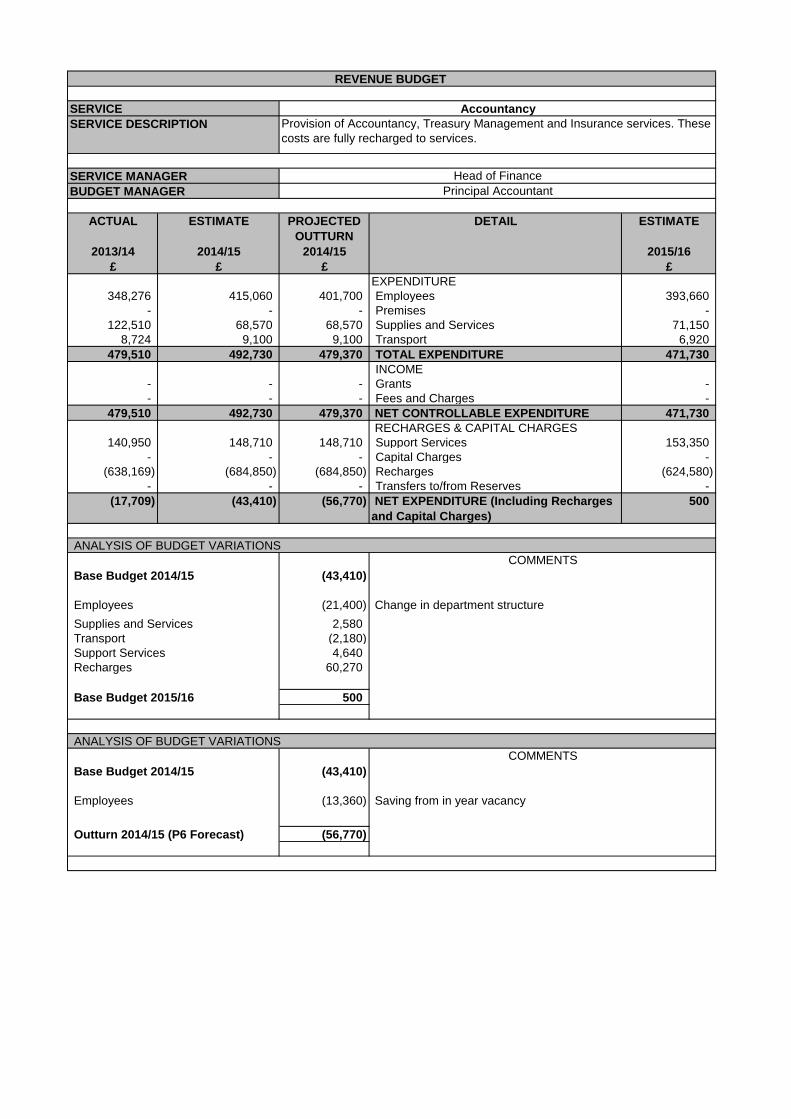
348,276 415,060 401,700 Employees 393,660
- - - Premises -
122,510 68,570 68,570 Supplies and Services 71,150
8,724 9,100 9,100 Transport 6,920
479,510 492,730 479,370 TOTAL EXPENDITURE 471,730
INCOME
- - - Grants -
- - - Fees and Charges -
479,510 492,730 479,370 NET CONTROLLABLE EXPENDITURE 471,730
RECHARGES & CAPITAL CHARGES
140,950 148,710 148,710 Support Services 153,350
- - - Capital Charges -
(638,169) (684,850) (684,850) Recharges (624,580)
- - - Transfers to/from Reserves -
(17,709) (43,410) (56,770) NET EXPENDITURE (Including Recharges
and Capital Charges)
500
(43,410)
Employees (21,400)
Supplies and Services 2,580
Transport (2,180)
Support Services 4,640
Recharges 60,270
500
(43,410)
Employees (13,360)
(56,770)
REVENUE BUDGET
SERVICE Accountancy
SERVICE DESCRIPTION Provision of Accountancy, Treasury Management and Insurance services. These
costs are fully recharged to services.
SERVICE MANAGER Head of Finance
BUDGET MANAGER Principal Accountant
ANALYSIS OF BUDGET VARIATIONS
COMMENTS
Base Budget 2014/15
Change in department structure
Base Budget 2015/16
ANALYSIS OF BUDGET VARIATIONS
Base Budget 2014/15
Saving from in year vacancy
Outturn 2014/15 (P6 Forecast)
COMMENTS
ACTUAL ESTIMATE PROJECTED
OUTTURN
DETAIL ESTIMATE
2013/14 2014/15 2014/15 2015/16
£ £ £ £
EXPENDITURE
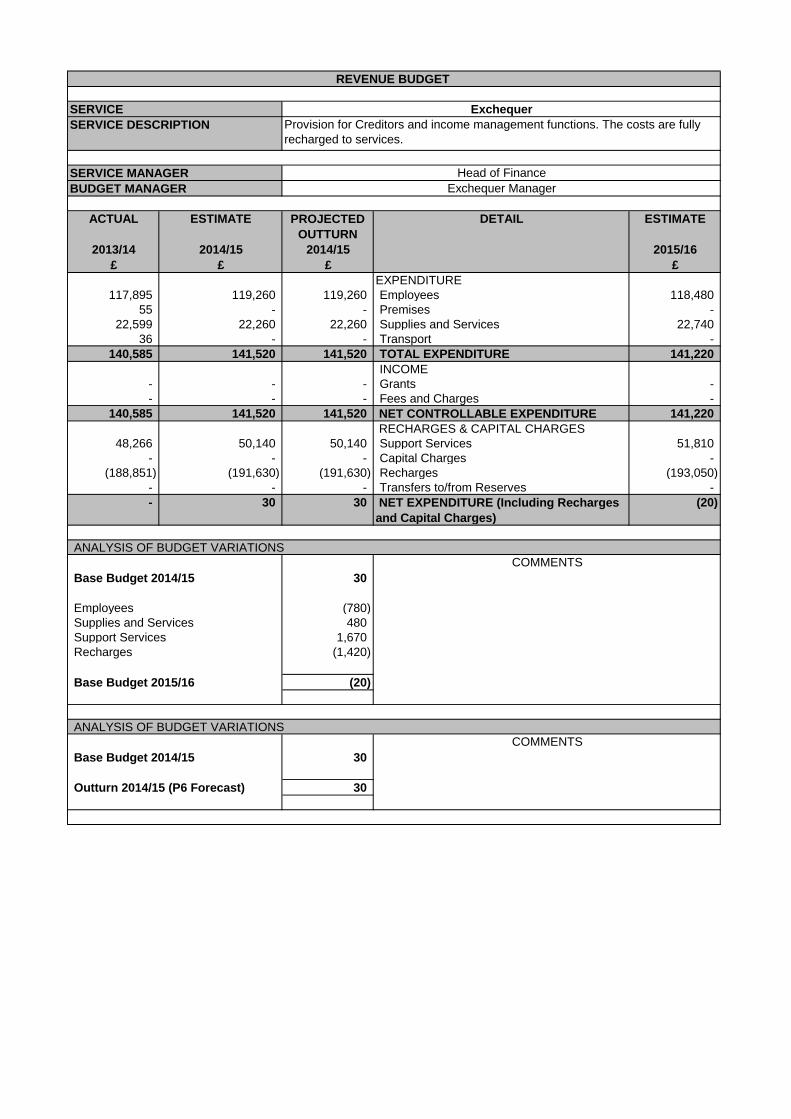
117,895 119,260 119,260 Employees 118,480
55 - - Premises -
22,599 22,260 22,260 Supplies and Services 22,740
36 - - Transport -
140,585 141,520 141,520 TOTAL EXPENDITURE 141,220
INCOME
- - - Grants -
- - - Fees and Charges -
140,585 141,520 141,520 NET CONTROLLABLE EXPENDITURE 141,220
RECHARGES & CAPITAL CHARGES
48,266 50,140 50,140 Support Services 51,810
- - - Capital Charges -
(188,851) (191,630) (191,630) Recharges (193,050)
- - - Transfers to/from Reserves -
- 30 30 NET EXPENDITURE (Including Recharges
and Capital Charges)
(20)
30
Employees (780)
Supplies and Services 480
Support Services 1,670
Recharges (1,420)
(20)
30
30
REVENUE BUDGET
SERVICE Exchequer
SERVICE DESCRIPTION Provision for Creditors and income management functions. The costs are fully
recharged to services.
SERVICE MANAGER
BUDGET MANAGER
ANALYSIS OF BUDGET VARIATIONS
COMMENTS
Base Budget 2014/15
Head of Finance
Exchequer Manager
COMMENTS
Base Budget 2015/16
ANALYSIS OF BUDGET VARIATIONS
Base Budget 2014/15
Outturn 2014/15 (P6 Forecast)
ACTUAL ESTIMATE PROJECTED
OUTTURN
DETAIL ESTIMATE
2013/14 2014/15 2014/15 2015/16
£ £ £ £
EXPENDITURE
56,134 56,340 56,340 Employees 59,040
- - - Premises -
623 2,720 2,720 Supplies and Services 3,120
71 150 150 Transport 150
56,827 59,210 59,210 TOTAL EXPENDITURE 62,310
INCOME
- - - Grants -
(1,209) (1,410) (1,410) Fees and Charges (1,700)
55,618 57,800 57,800 NET CONTROLLABLE EXPENDITURE 60,610
RECHARGES & CAPITAL CHARGES
45,652 46,170 46,170 Support Services 48,220
- - - Capital Charges -
(102,327) (104,090) (104,090) Recharges (109,840)
- - - Transfers to/from Reserves -
(1,057) (120) (120) NET EXPENDITURE (Including Recharges
and Capital Charges)
(1,010)
(120)
Employees 2,700
Supplies and Services 400
Fees and Charges (290)
Support Services 2,050
Recharges (5,750)
(1,010)
(120)
(120) Outturn 2014/15 (P6 Forecast)
Base Budget 2014/15
COMMENTS
Base Budget 2015/16
ANALYSIS OF BUDGET VARIATIONS
SERVICE MANAGER Head of Finance
BUDGET MANAGER Revenues and Benefits Manager
ANALYSIS OF BUDGET VARIATIONS
COMMENTS
Base Budget 2014/15
REVENUE BUDGET
SERVICE Debtors/Debt Recovery
SERVICE DESCRIPTION Collection of sundry debtors due to ABC
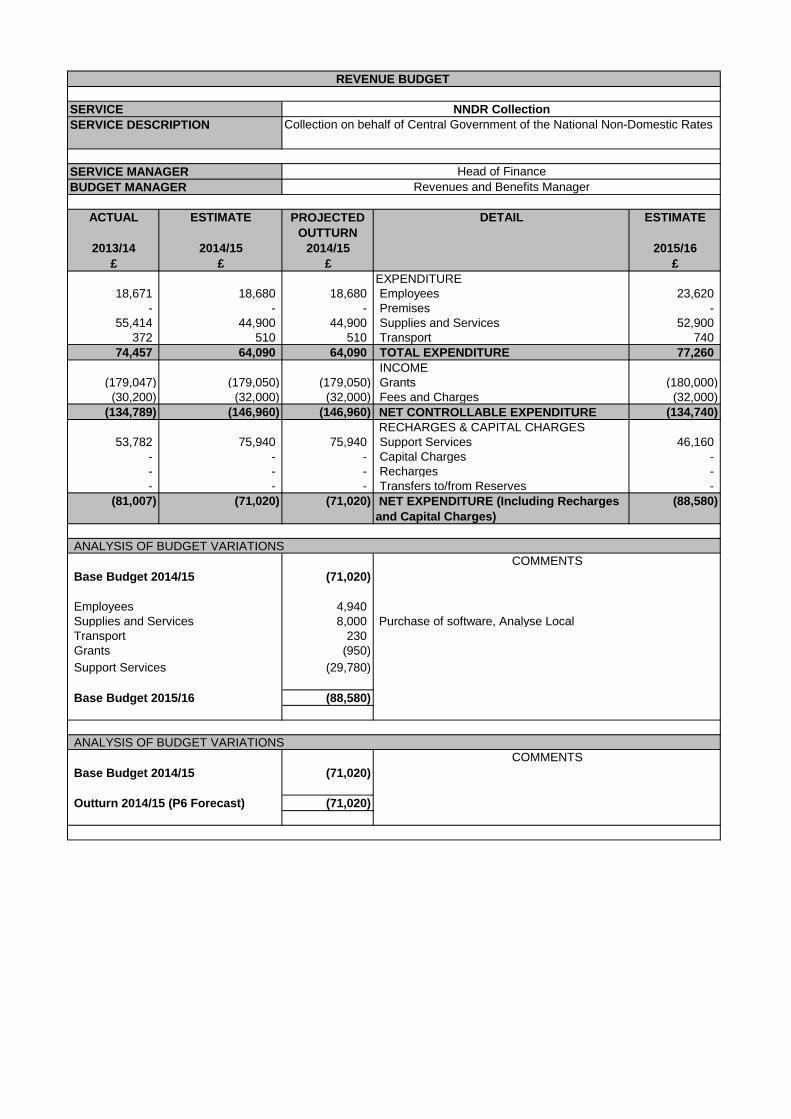
ACTUAL ESTIMATE PROJECTED
OUTTURN
DETAIL ESTIMATE
2013/14 2014/15 2014/15 2015/16
£ £ £ £
EXPENDITURE
18,671 18,680 18,680 Employees 23,620
- - - Premises -
55,414 44,900 44,900 Supplies and Services 52,900
372 510 510 Transport 740
74,457 64,090 64,090 TOTAL EXPENDITURE 77,260
INCOME
(179,047) (179,050) (179,050) Grants (180,000)
(30,200) (32,000) (32,000) Fees and Charges (32,000)
(134,789) (146,960) (146,960) NET CONTROLLABLE EXPENDITURE (134,740)
RECHARGES & CAPITAL CHARGES
53,782 75,940 75,940 Support Services 46,160
- - - Capital Charges -
- - - Recharges -
- - - Transfers to/from Reserves -
(81,007) (71,020) (71,020) NET EXPENDITURE (Including Recharges
and Capital Charges)
(88,580)
(71,020)
Employees 4,940
Supplies and Services 8,000 Purchase of software, Analyse Local
Transport 230
Grants (950)
Support Services (29,780)
(88,580)
(71,020)
(71,020)
REVENUE BUDGET
SERVICE NNDR Collection
SERVICE DESCRIPTION Collection on behalf of Central Government of the National Non-Domestic Rates
SERVICE MANAGER Head of Finance
BUDGET MANAGER Revenues and Benefits Manager
ANALYSIS OF BUDGET VARIATIONS
COMMENTS
Base Budget 2014/15
COMMENTS
Base Budget 2015/16
ANALYSIS OF BUDGET VARIATIONS
Outturn 2014/15 (P6 Forecast)
Base Budget 2014/15
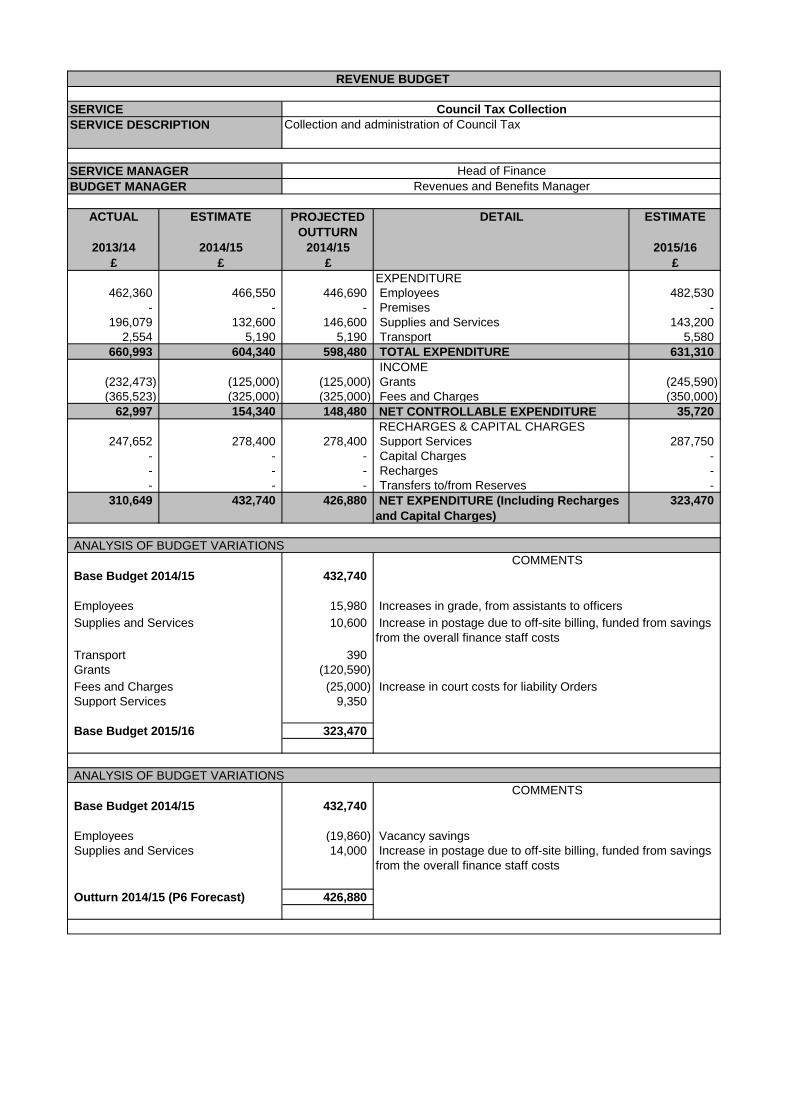
ACTUAL ESTIMATE PROJECTED
OUTTURN
DETAIL ESTIMATE
2013/14 2014/15 2014/15 2015/16
£ £ £ £
EXPENDITURE
462,360 466,550 446,690 Employees 482,530
- - - Premises -
196,079 132,600 146,600 Supplies and Services 143,200
2,554 5,190 5,190 Transport 5,580
660,993 604,340 598,480 TOTAL EXPENDITURE 631,310
INCOME
(232,473) (125,000) (125,000) Grants (245,590)
(365,523) (325,000) (325,000) Fees and Charges (350,000)
62,997 154,340 148,480 NET CONTROLLABLE EXPENDITURE 35,720
RECHARGES & CAPITAL CHARGES
247,652 278,400 278,400 Support Services 287,750
- - - Capital Charges -
- - - Recharges -
- - - Transfers to/from Reserves -
310,649 432,740 426,880 NET EXPENDITURE (Including Recharges
and Capital Charges)
323,470
432,740
Employees 15,980
Supplies and Services 10,600
Transport 390
Grants (120,590)
Fees and Charges (25,000) Increase in court costs for liability Orders
Support Services 9,350
323,470
432,740
Employees (19,860)
Supplies and Services 14,000
426,880
REVENUE BUDGET
SERVICE Council Tax Collection
SERVICE DESCRIPTION Collection and administration of Council Tax
SERVICE MANAGER Head of Finance
BUDGET MANAGER Revenues and Benefits Manager
ANALYSIS OF BUDGET VARIATIONS
COMMENTS
Base Budget 2014/15
Base Budget 2015/16
ANALYSIS OF BUDGET VARIATIONS
Base Budget 2014/15
Vacancy savings
Increase in postage due to off-site billing, funded from savings
from the overall finance staff costs
Outturn 2014/15 (P6 Forecast)
Increase in postage due to off-site billing, funded from savings
from the overall finance staff costs
Increases in grade, from assistants to officers
COMMENTS
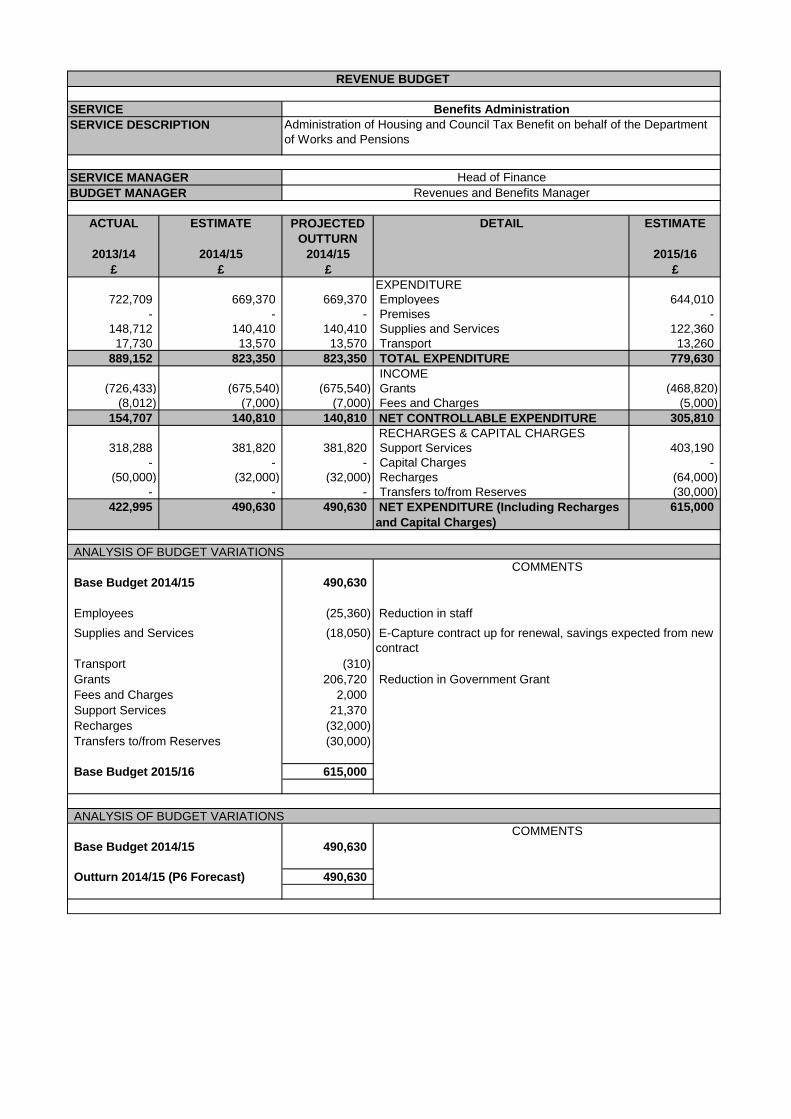
ACTUAL ESTIMATE PROJECTED
OUTTURN
DETAIL ESTIMATE
2013/14 2014/15 2014/15 2015/16
£ £ £ £
EXPENDITURE
722,709 669,370 669,370 Employees 644,010
- - - Premises -
148,712 140,410 140,410 Supplies and Services 122,360
17,730 13,570 13,570 Transport 13,260
889,152 823,350 823,350 TOTAL EXPENDITURE 779,630
INCOME
(726,433) (675,540) (675,540) Grants (468,820)
(8,012) (7,000) (7,000) Fees and Charges (5,000)
154,707 140,810 140,810 NET CONTROLLABLE EXPENDITURE 305,810
RECHARGES & CAPITAL CHARGES
318,288 381,820 381,820 Support Services 403,190
- - - Capital Charges -
(50,000) (32,000) (32,000) Recharges (64,000)
- - - Transfers to/from Reserves (30,000)
422,995 490,630 490,630 NET EXPENDITURE (Including Recharges
and Capital Charges)
615,000
490,630
Employees (25,360)
Supplies and Services (18,050)
Transport (310)
Grants 206,720
Fees and Charges 2,000
Support Services 21,370
Recharges (32,000)
Transfers to/from Reserves (30,000)
615,000
490,630
490,630
REVENUE BUDGET
SERVICE Benefits Administration
SERVICE DESCRIPTION Administration of Housing and Council Tax Benefit on behalf of the Department
of Works and Pensions
SERVICE MANAGER Head of Finance
BUDGET MANAGER Revenues and Benefits Manager
ANALYSIS OF BUDGET VARIATIONS
COMMENTS
Base Budget 2014/15
COMMENTS
Base Budget 2015/16
ANALYSIS OF BUDGET VARIATIONS
Base Budget 2014/15
Outturn 2014/15 (P6 Forecast)
Reduction in Government Grant
E-Capture contract up for renewal, savings expected from new
contract
Reduction in staff
ACTUAL ESTIMATE PROJECTED
OUTTURN
DETAIL ESTIMATE
2013/14 2014/15 2014/15 2015/16
£ £ £ £
EXPENDITURE
- - - Employees -
- - - Premises -
37,686,056 33,849,810 34,999,810 Supplies and Services 34,999,810
- - - Transport -
37,686,056 33,849,810 34,999,810 TOTAL EXPENDITURE 34,999,810
INCOME
(36,492,304) (32,750,000) (33,900,000) Grants (33,900,000)
(1,436,596) (1,337,100) (1,337,100) Fees and Charges (1,345,100)
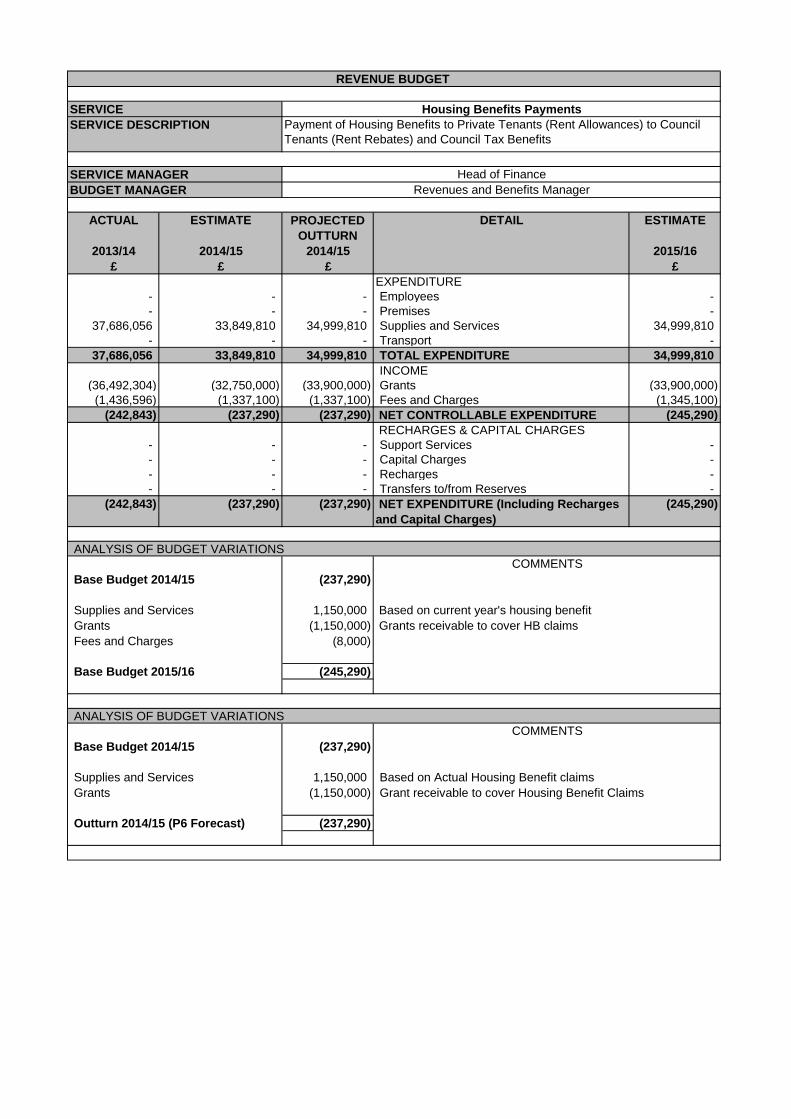
(242,843) (237,290) (237,290) NET CONTROLLABLE EXPENDITURE (245,290)
RECHARGES & CAPITAL CHARGES
- - - Support Services -
- - - Capital Charges -
- - - Recharges -
- - - Transfers to/from Reserves -
(242,843) (237,290) (237,290) NET EXPENDITURE (Including Recharges
and Capital Charges)
(245,290)
(237,290)
Supplies and Services 1,150,000 Based on current year's housing benefit
claims Grants (1,150,000) Grants receivable to cover HB claims
Fees and Charges (8,000)
(245,290)
(237,290)
Supplies and Services 1,150,000 Based on Actual Housing Benefit claims
Grants (1,150,000) Grant receivable to cover Housing Benefit Claims
(237,290)
REVENUE BUDGET
SERVICE Housing Benefits Payments
SERVICE DESCRIPTION Payment of Housing Benefits to Private Tenants (Rent Allowances) to Council
Tenants (Rent Rebates) and Council Tax Benefits
SERVICE MANAGER Head of Finance
BUDGET MANAGER Revenues and Benefits Manager
ANALYSIS OF BUDGET VARIATIONS
COMMENTS
Base Budget 2014/15
COMMENTS
Base Budget 2015/16
ANALYSIS OF BUDGET VARIATIONS
Base Budget 2014/15
Outturn 2014/15 (P6 Forecast)
ACTUAL ESTIMATE PROJECTED
OUTTURN
DETAIL ESTIMATE
2013/14 2014/15 2014/15 2015/16
£ £ £ £
EXPENDITURE
- - - Employees -
- - - Premises -
(34,975) 70,600 70,600 Supplies and Services 73,200
- - - Transport -
(34,975) 70,600 70,600 TOTAL EXPENDITURE 73,200
INCOME
(34,710) (37,750) (37,750) Grants (37,500)
(12,871) (8,800) (8,800) Fees and Charges (8,450)
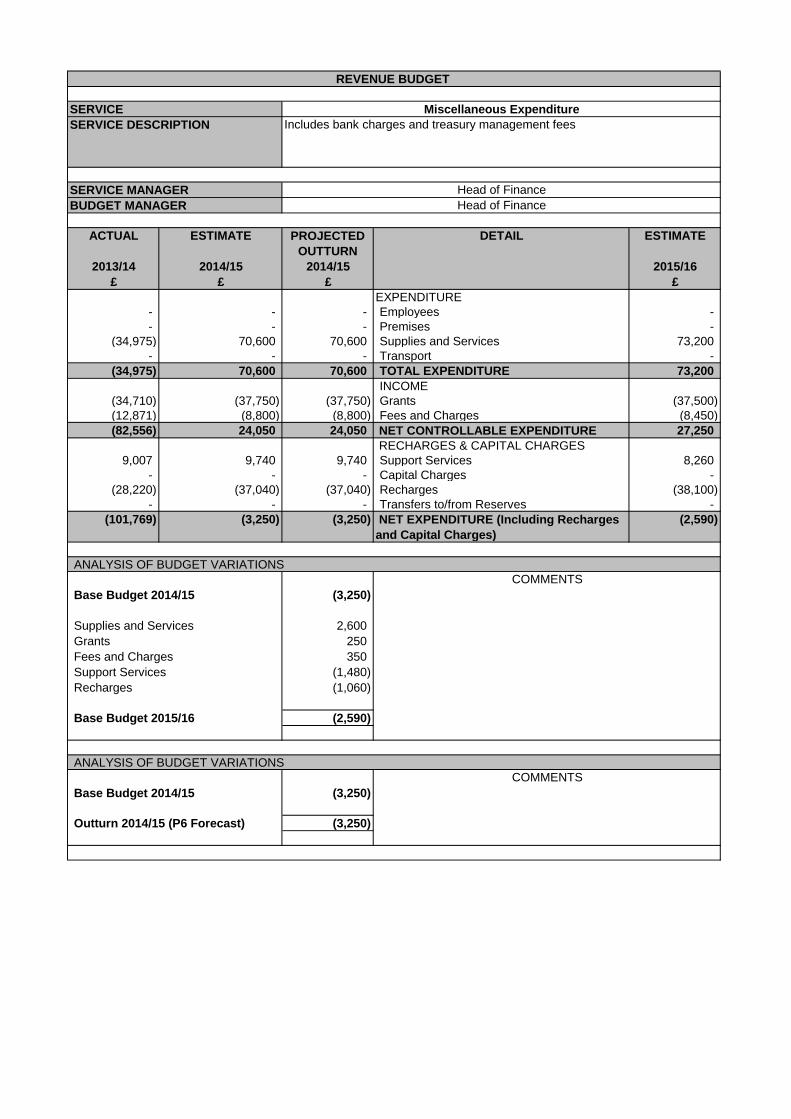
(82,556) 24,050 24,050 NET CONTROLLABLE EXPENDITURE 27,250
RECHARGES & CAPITAL CHARGES
9,007 9,740 9,740 Support Services 8,260
- - - Capital Charges -
(28,220) (37,040) (37,040) Recharges (38,100)
- - - Transfers to/from Reserves -
(101,769) (3,250) (3,250) NET EXPENDITURE (Including Recharges
and Capital Charges)
(2,590)
(3,250)
Supplies and Services 2,600
Grants 250
Fees and Charges 350
Support Services (1,480)
Recharges (1,060)
(2,590)
(3,250)
(3,250)
REVENUE BUDGET
SERVICE Miscellaneous Expenditure
SERVICE DESCRIPTION Includes bank charges and treasury management fees
SERVICE MANAGER Head of Finance
BUDGET MANAGER Head of Finance
ANALYSIS OF BUDGET VARIATIONS
COMMENTS
Base Budget 2014/15
COMMENTS
Base Budget 2015/16
ANALYSIS OF BUDGET VARIATIONS
Base Budget 2014/15
Outturn 2014/15 (P6 Forecast)
ACTUAL ESTIMATE PROJECTED
OUTTURN
DETAIL ESTIMATE
2013/14 2014/15 2014/15 2015/16
£ £ £ £
EXPENDITURE
1,916,290 1,853,430 1,853,430 Employees 1,913,310
- - - Premises -
- - - Supplies and Services -
- - - Transport -
1,916,290 1,853,430 1,853,430 TOTAL EXPENDITURE 1,913,310
INCOME
- - - Grants -
- - - Fees and Charges -
1,916,290 1,853,430 1,853,430 NET CONTROLLABLE EXPENDITURE 1,913,310
RECHARGES & CAPITAL CHARGES
- - - Support Services -
- - - Capital Charges -
(370,532) (365,980) (365,980) Recharges (347,730)
- - - Transfers to/from Reserves -
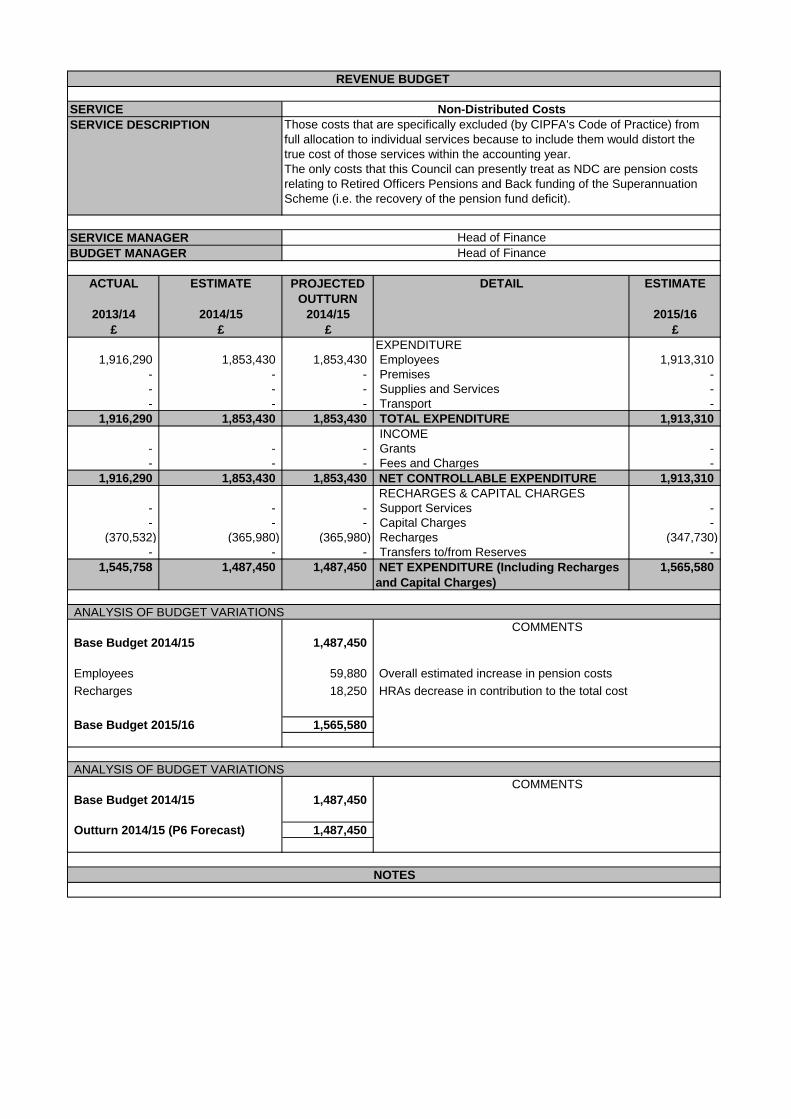
1,545,758 1,487,450 1,487,450 NET EXPENDITURE (Including Recharges
and Capital Charges)
1,565,580
1,487,450
Employees 59,880
Recharges 18,250
1,565,580
1,487,450
1,487,450
REVENUE BUDGET
SERVICE Non-Distributed Costs
SERVICE DESCRIPTION Those costs that are specifically excluded (by CIPFA's Code of Practice) from
full allocation to individual services because to include them would distort the
true cost of those services within the accounting year.
The only costs that this Council can presently treat as NDC are pension costs
relating to Retired Officers Pensions and Back funding of the Superannuation
Scheme (i.e. the recovery of the pension fund deficit).
SERVICE MANAGER Head of Finance
BUDGET MANAGER Head of Finance
ANALYSIS OF BUDGET VARIATIONS
COMMENTS
Base Budget 2014/15
HRAs decrease in contribution to the total cost
Overall estimated increase in pension costs
COMMENTS
Base Budget 2015/16
ANALYSIS OF BUDGET VARIATIONS
Base Budget 2014/15
NOTES
Outturn 2014/15 (P6 Forecast)

This page has been intentionally left blank
ACTUAL ESTIMATE PROJECTED
OUTTURN
DETAIL ESTIMATE
2013/14 2014/15 2014/15 2015/16
£ £ £ £
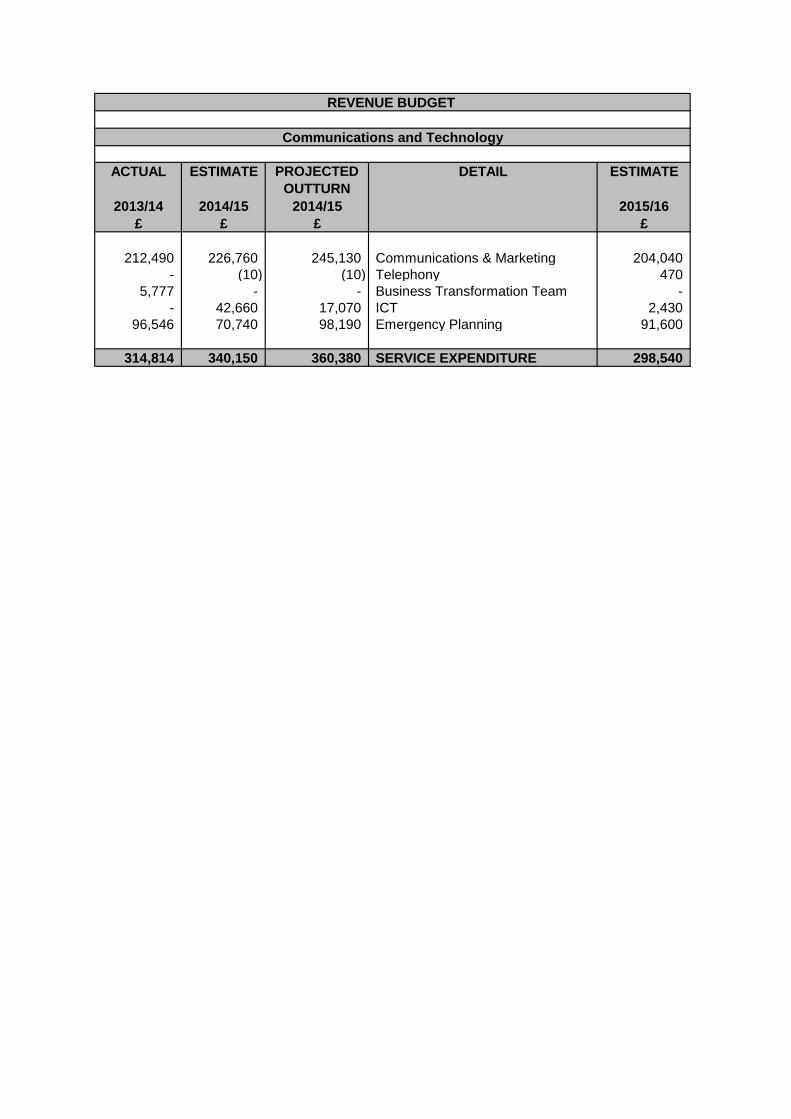
212,490 226,760 245,130 Communications & Marketing 204,040
- (10) (10) Telephony 470
5,777 - - Business Transformation Team -
- 42,660 17,070 ICT 2,430
96,546 70,740 98,190 Emergency Planning 91,600
314,814 340,150 360,380 SERVICE EXPENDITURE 298,540
REVENUE BUDGET
Communications and Technology
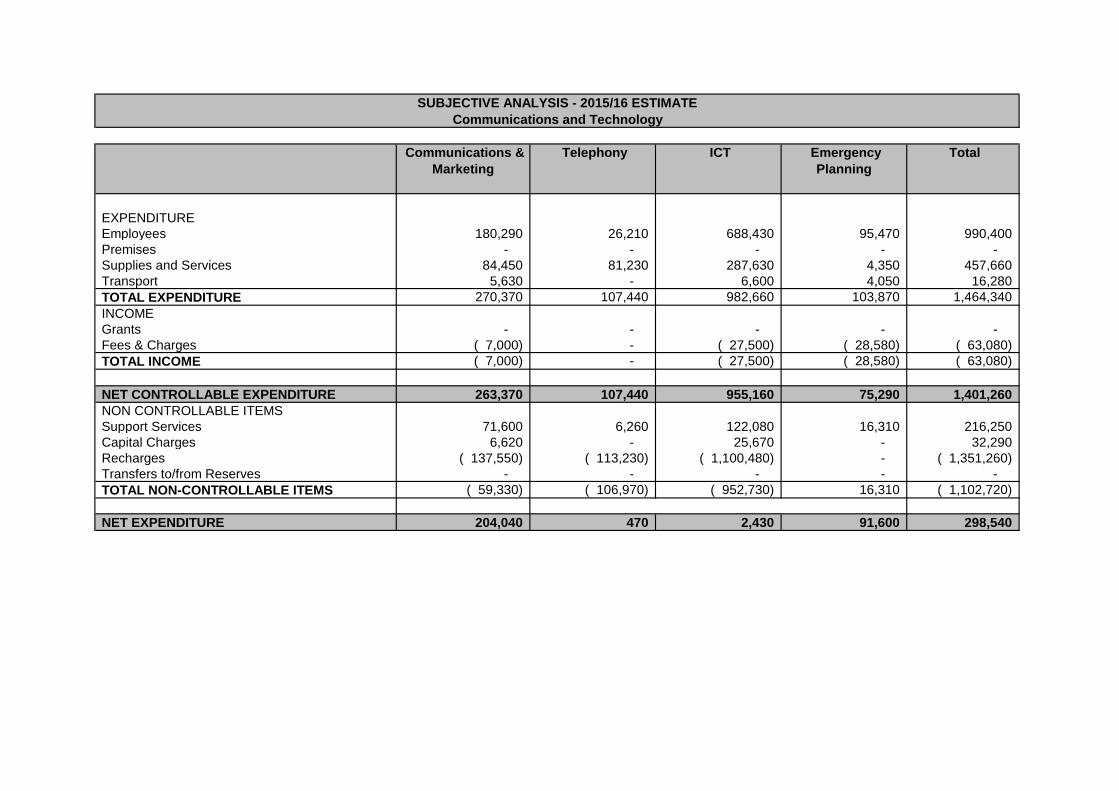
Communications &
Marketing
Telephony ICT Emergency
Planning
Total
EXPENDITURE
Employees 180,290 26,210 688,430 95,470 990,400
Premises - - - - -
Supplies and Services 84,450 81,230 287,630 4,350 457,660
Transport 5,630 - 6,600 4,050 16,280
TOTAL EXPENDITURE 270,370 107,440 982,660 103,870 1,464,340
INCOME
Grants - - - - -
Fees & Charges ( 7,000) - ( 27,500) ( 28,580) ( 63,080)
TOTAL INCOME ( 7,000) - ( 27,500) ( 28,580) ( 63,080)
NET CONTROLLABLE EXPENDITURE 263,370 107,440 955,160 75,290 1,401,260
NON CONTROLLABLE ITEMS
Support Services 71,600 6,260 122,080 16,310 216,250
Capital Charges 6,620 - 25,670 - 32,290
Recharges ( 137,550) ( 113,230) ( 1,100,480) - ( 1,351,260)
Transfers to/from Reserves - - - - -
TOTAL NON-CONTROLLABLE ITEMS ( 59,330) ( 106,970) ( 952,730) 16,310 ( 1,102,720)
NET EXPENDITURE 204,040 470 2,430 91,600 298,540
SUBJECTIVE ANALYSIS - 2015/16 ESTIMATE
Communications and Technology
ACTUAL ESTIMATE PROJECTED
OUTTURN
DETAIL ESTIMATE
2013/14 2014/15 2014/15 2015/16
£ £ £ £
EXPENDITURE
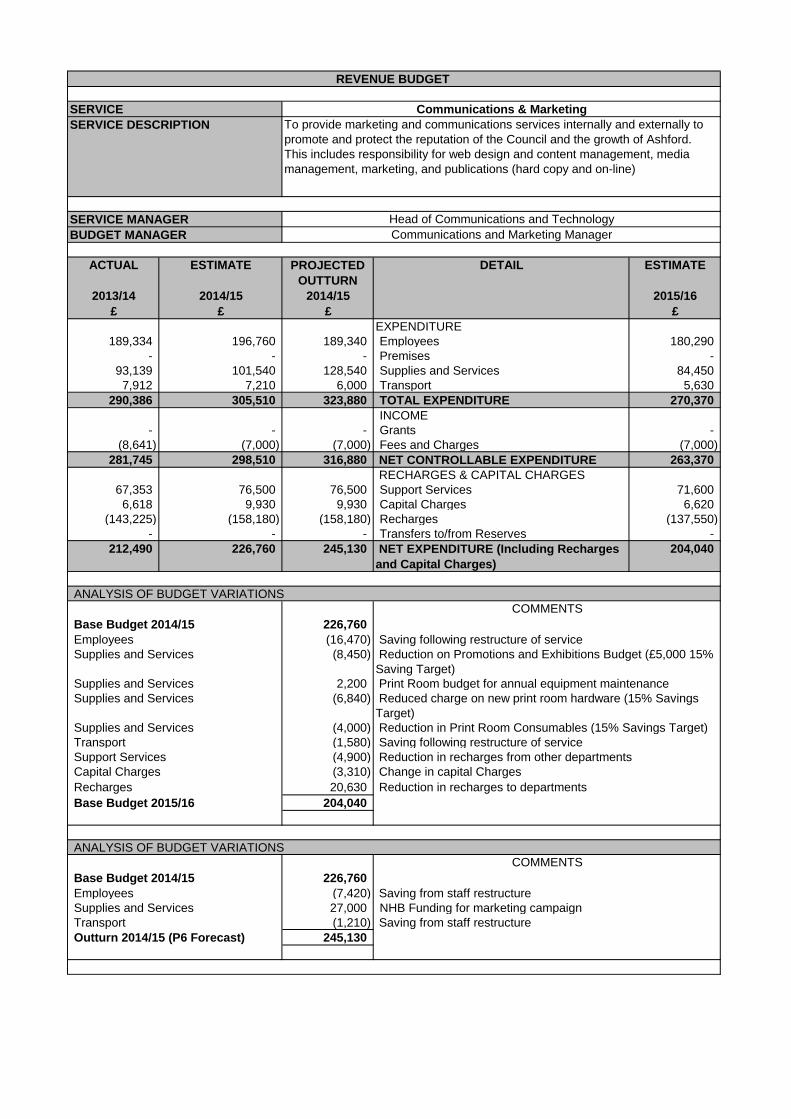
189,334 196,760 189,340 Employees 180,290
- - - Premises -
93,139 101,540 128,540 Supplies and Services 84,450
7,912 7,210 6,000 Transport 5,630
290,386 305,510 323,880 TOTAL EXPENDITURE 270,370
INCOME
- - - Grants -
(8,641) (7,000) (7,000) Fees and Charges (7,000)
281,745 298,510 316,880 NET CONTROLLABLE EXPENDITURE 263,370
RECHARGES & CAPITAL CHARGES
67,353 76,500 76,500 Support Services 71,600
6,618 9,930 9,930 Capital Charges 6,620
(143,225) (158,180) (158,180) Recharges (137,550)
- - - Transfers to/from Reserves -
212,490 226,760 245,130 NET EXPENDITURE (Including Recharges
and Capital Charges)
204,040
226,760
Employees (16,470) Saving following restructure of service
Supplies and Services (8,450)
Supplies and Services 2,200
Supplies and Services (6,840)
Supplies and Services (4,000)
Transport (1,580) Saving following restructure of service
Support Services (4,900)
Capital Charges (3,310) Change in capital Charges
Recharges 20,630 Reduction in recharges to departments
204,040
226,760
Employees (7,420)
Supplies and Services 27,000 NHB Funding for marketing campaign
Transport (1,210)
245,130
Reduction in Print Room Consumables (15% Savings Target)
Reduction in recharges from other departments
REVENUE BUDGET
SERVICE Communications & Marketing
SERVICE DESCRIPTION To provide marketing and communications services internally and externally to
promote and protect the reputation of the Council and the growth of Ashford.
This includes responsibility for web design and content management, media
management, marketing, and publications (hard copy and on-line)
SERVICE MANAGER Head of Communications and Technology
BUDGET MANAGER Communications and Marketing Manager
ANALYSIS OF BUDGET VARIATIONS
COMMENTS
Base Budget 2014/15
Reduction on Promotions and Exhibitions Budget (£5,000 15%
Saving Target)
Reduced charge on new print room hardware (15% Savings
Target)
Print Room budget for annual equipment maintenance
COMMENTS
Base Budget 2015/16
ANALYSIS OF BUDGET VARIATIONS
Base Budget 2014/15
Saving from staff restructure
Saving from staff restructure
Outturn 2014/15 (P6 Forecast)

ACTUAL ESTIMATE PROJECTED
OUTTURN
DETAIL ESTIMATE
2013/14 2014/15 2014/15 2015/16
£ £ £ £
EXPENDITURE
27,182 27,260 27,260 Employees 26,210
- - - Premises -
70,303 78,050 78,050 Supplies and Services 81,230
103 - - Transport -
97,589 105,310 105,310 TOTAL EXPENDITURE 107,440
INCOME
- - - Grants -
(949) - - Fees and Charges -
96,639 105,310 105,310 NET CONTROLLABLE EXPENDITURE 107,440
RECHARGES & CAPITAL CHARGES
3,863 3,720 3,720 Support Services 6,260
- - - Capital Charges -
(100,503) (109,040) (109,040) Recharges (113,230)
- - - Transfers to/from Reserves -
- (10) (10) NET EXPENDITURE (Including Recharges
and Capital Charges)
470
(10)
Employees (1,050) Revised salary charges
Supplies and Services 3,180
Support Services 2,540
Recharges (4,190) Increase in recharges to departments
470
(10)
(10)
REVENUE BUDGET
SERVICE Telephony
SERVICE DESCRIPTION All the organisations telephone are charged here then re-charged to individual
services
SERVICE MANAGER Head of Communications and Technology
BUDGET MANAGER IT Operations Manager
ANALYSIS OF BUDGET VARIATIONS
COMMENTS
Base Budget 2014/15
Increase in telephone line rental and charges
Increase in recharges from other departments
COMMENTS
Base Budget 2015/16
ANALYSIS OF BUDGET VARIATIONS
Base Budget 2014/15
Outturn 2014/15 (P6 Forecast)
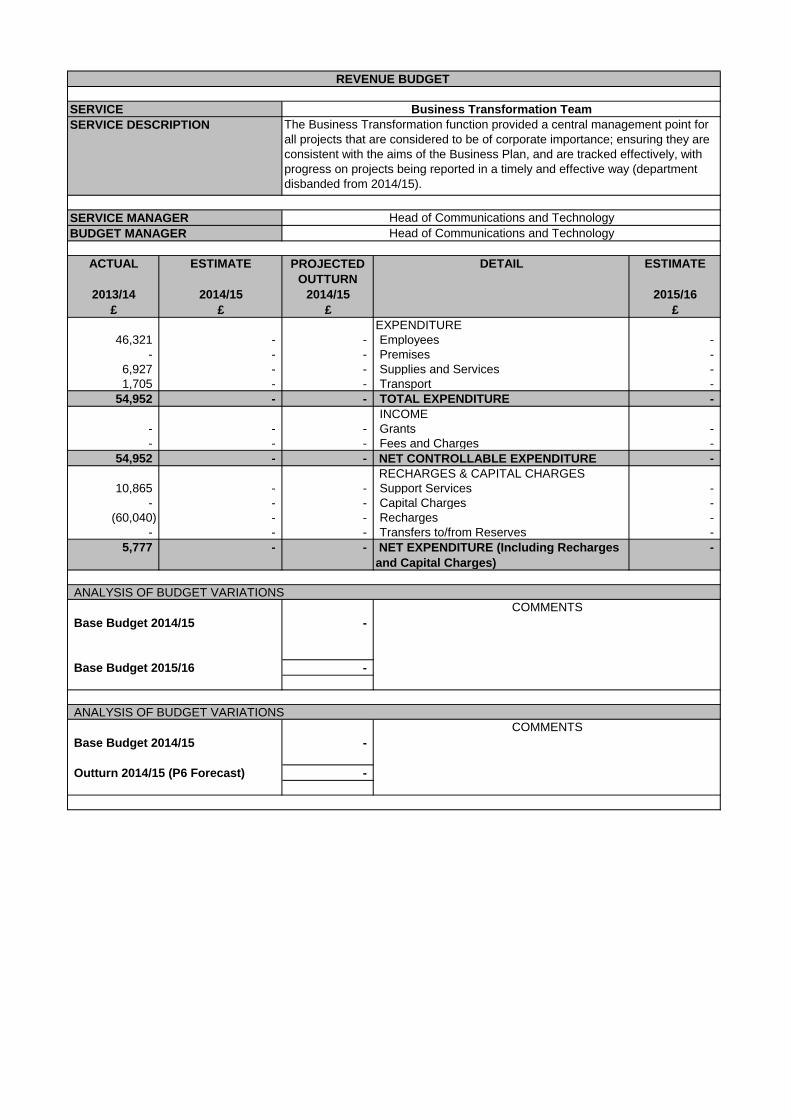
ACTUAL ESTIMATE PROJECTED
OUTTURN
DETAIL ESTIMATE
2013/14 2014/15 2014/15 2015/16
£ £ £ £
EXPENDITURE
46,321 - - Employees -
- - - Premises -
6,927 - - Supplies and Services -
1,705 - - Transport -
54,952 - - TOTAL EXPENDITURE -
INCOME
- - - Grants -
- - - Fees and Charges -
54,952 - - NET CONTROLLABLE EXPENDITURE -
RECHARGES & CAPITAL CHARGES
10,865 - - Support Services -
- - - Capital Charges -
(60,040) - - Recharges -
- - - Transfers to/from Reserves -
5,777 - - NET EXPENDITURE (Including Recharges
and Capital Charges)
-
-
-
-
-
REVENUE BUDGET
SERVICE Business Transformation Team
SERVICE DESCRIPTION The Business Transformation function provided a central management point for
all projects that are considered to be of corporate importance; ensuring they are
consistent with the aims of the Business Plan, and are tracked effectively, with
progress on projects being reported in a timely and effective way (department
disbanded from 2014/15).
SERVICE MANAGER Head of Communications and Technology
BUDGET MANAGER Head of Communications and Technology
ANALYSIS OF BUDGET VARIATIONS
COMMENTS
Base Budget 2014/15
COMMENTS
Base Budget 2015/16
ANALYSIS OF BUDGET VARIATIONS
Base Budget 2014/15
Outturn 2014/15 (P6 Forecast)
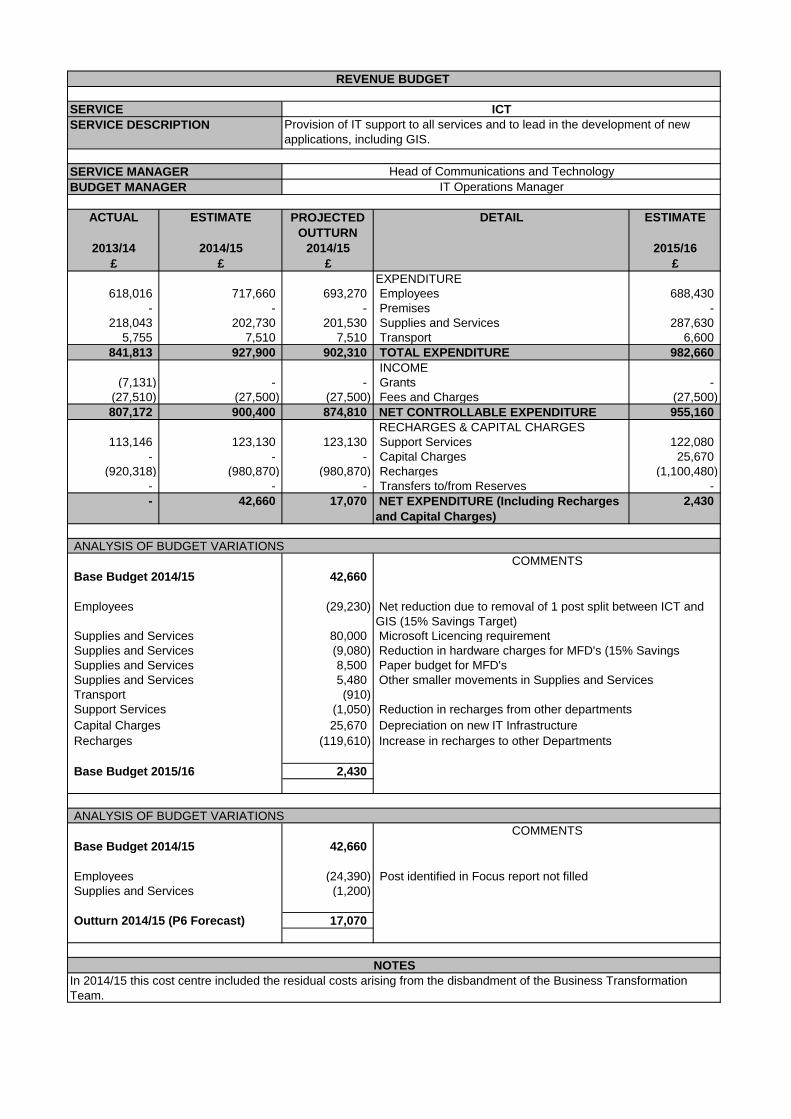
ACTUAL ESTIMATE PROJECTED
OUTTURN
DETAIL ESTIMATE
2013/14 2014/15 2014/15 2015/16
£ £ £ £
EXPENDITURE
618,016 717,660 693,270 Employees 688,430
- - - Premises -
218,043 202,730 201,530 Supplies and Services 287,630
5,755 7,510 7,510 Transport 6,600
841,813 927,900 902,310 TOTAL EXPENDITURE 982,660
INCOME
(7,131) - - Grants -
(27,510) (27,500) (27,500) Fees and Charges (27,500)
807,172 900,400 874,810 NET CONTROLLABLE EXPENDITURE 955,160
RECHARGES & CAPITAL CHARGES
113,146 123,130 123,130 Support Services 122,080
- - - Capital Charges 25,670
(920,318) (980,870) (980,870) Recharges (1,100,480)
- - - Transfers to/from Reserves -
- 42,660 17,070 NET EXPENDITURE (Including Recharges
and Capital Charges)
2,430
42,660
Employees (29,230)
Supplies and Services 80,000 Microsoft Licencing requirement
Supplies and Services (9,080)
Supplies and Services 8,500
Supplies and Services 5,480
Transport (910)
Support Services (1,050)
Capital Charges 25,670 Depreciation on new IT Infrastructure
Recharges (119,610)
2,430
42,660
Employees (24,390) Post identified in Focus report not filled
Supplies and Services (1,200)
17,070
Reduction in hardware charges for MFD's (15% Savings
Reduction in recharges from other departments
Increase in recharges to other Departments
REVENUE BUDGET
SERVICE ICT
SERVICE DESCRIPTION Provision of IT support to all services and to lead in the development of new
applications, including GIS.
Paper budget for MFD's
SERVICE MANAGER Head of Communications and Technology
BUDGET MANAGER IT Operations Manager
ANALYSIS OF BUDGET VARIATIONS
COMMENTS
Base Budget 2014/15
Net reduction due to removal of 1 post split between ICT and
GIS (15% Savings Target)
Other smaller movements in Supplies and Services
COMMENTS
Base Budget 2015/16
ANALYSIS OF BUDGET VARIATIONS
Base Budget 2014/15
NOTES
In 2014/15 this cost centre included the residual costs arising from the disbandment of the Business Transformation
Team.
Outturn 2014/15 (P6 Forecast)
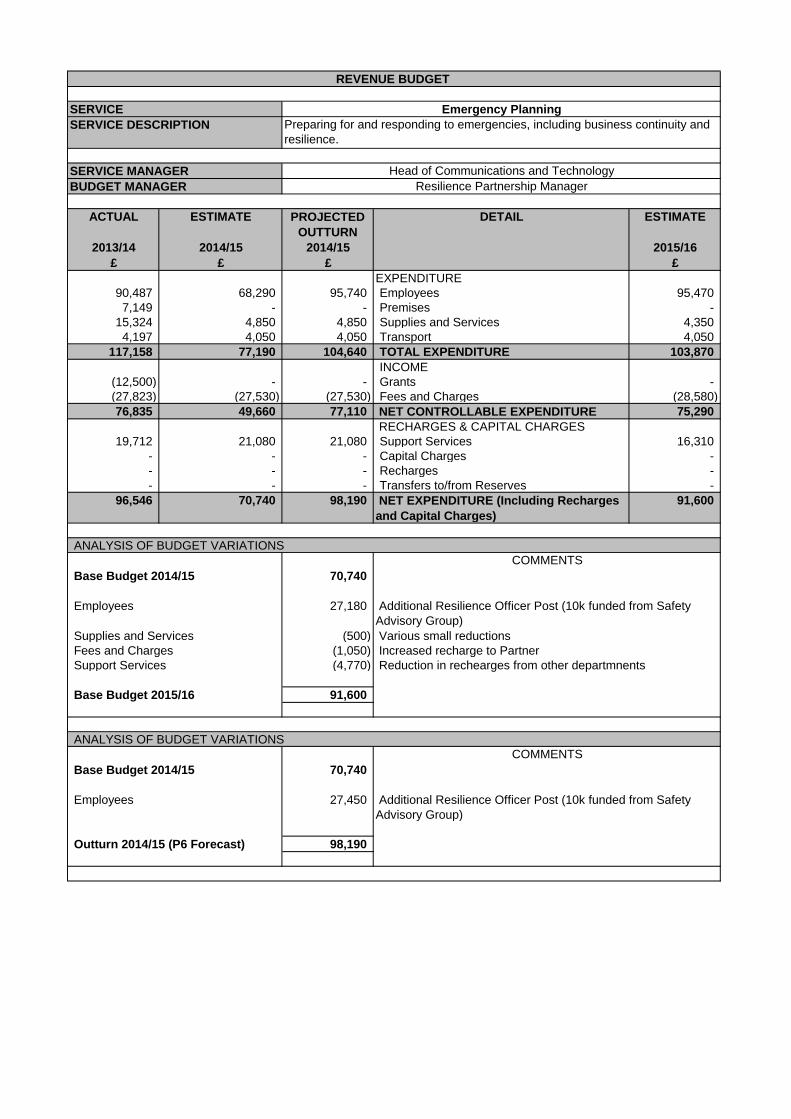
ACTUAL ESTIMATE PROJECTED
OUTTURN
DETAIL ESTIMATE
2013/14 2014/15 2014/15 2015/16
£ £ £ £
EXPENDITURE
90,487 68,290 95,740 Employees 95,470
7,149 - - Premises -
15,324 4,850 4,850 Supplies and Services 4,350
4,197 4,050 4,050 Transport 4,050
117,158 77,190 104,640 TOTAL EXPENDITURE 103,870
INCOME
(12,500) - - Grants -
(27,823) (27,530) (27,530) Fees and Charges (28,580)
76,835 49,660 77,110 NET CONTROLLABLE EXPENDITURE 75,290
RECHARGES & CAPITAL CHARGES
19,712 21,080 21,080 Support Services 16,310
- - - Capital Charges -
- - - Recharges -
- - - Transfers to/from Reserves -
96,546 70,740 98,190 NET EXPENDITURE (Including Recharges
and Capital Charges)
91,600
70,740
Employees 27,180
Supplies and Services (500) Various small reductions
Fees and Charges (1,050) Increased recharge to Partner
Support Services (4,770)
91,600
70,740
Employees 27,450
98,190
REVENUE BUDGET
SERVICE Emergency Planning
SERVICE DESCRIPTION Preparing for and responding to emergencies, including business continuity and
resilience.
SERVICE MANAGER Head of Communications and Technology
BUDGET MANAGER Resilience Partnership Manager
ANALYSIS OF BUDGET VARIATIONS
COMMENTS
Base Budget 2014/15
Reduction in rechearges from other departmnents
Additional Resilience Officer Post (10k funded from Safety
Advisory Group)
COMMENTS
Base Budget 2015/16
ANALYSIS OF BUDGET VARIATIONS
Base Budget 2014/15
Additional Resilience Officer Post (10k funded from Safety
Advisory Group)
Outturn 2014/15 (P6 Forecast)

This page has been intentionally left blank
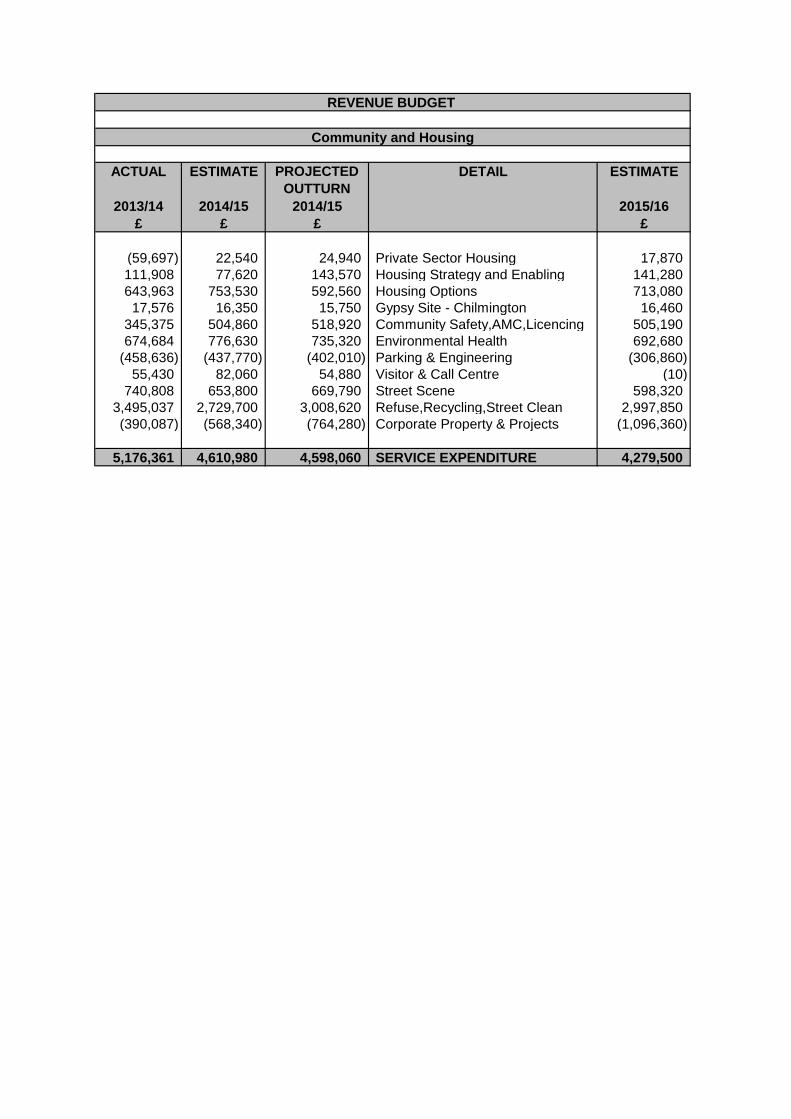
ACTUAL ESTIMATE PROJECTED
OUTTURN
DETAIL ESTIMATE
2013/14 2014/15 2014/15 2015/16
£ £ £ £
(59,697) 22,540 24,940 Private Sector Housing 17,870
111,908 77,620 143,570 Housing Strategy and Enabling 141,280
643,963 753,530 592,560 Housing Options 713,080
17,576 16,350 15,750 Gypsy Site - Chilmington 16,460
345,375 504,860 518,920 Community Safety,AMC,Licencing 505,190
674,684 776,630 735,320 Environmental Health 692,680
(458,636) (437,770) (402,010) Parking & Engineering (306,860)
55,430 82,060 54,880 Visitor & Call Centre (10)
740,808 653,800 669,790 Street Scene 598,320
3,495,037 2,729,700 3,008,620 Refuse,Recycling,Street Clean 2,997,850
(390,087) (568,340) (764,280) Corporate Property & Projects (1,096,360)
5,176,361 4,610,980 4,598,060 SERVICE EXPENDITURE 4,279,500
REVENUE BUDGET
Community and Housing
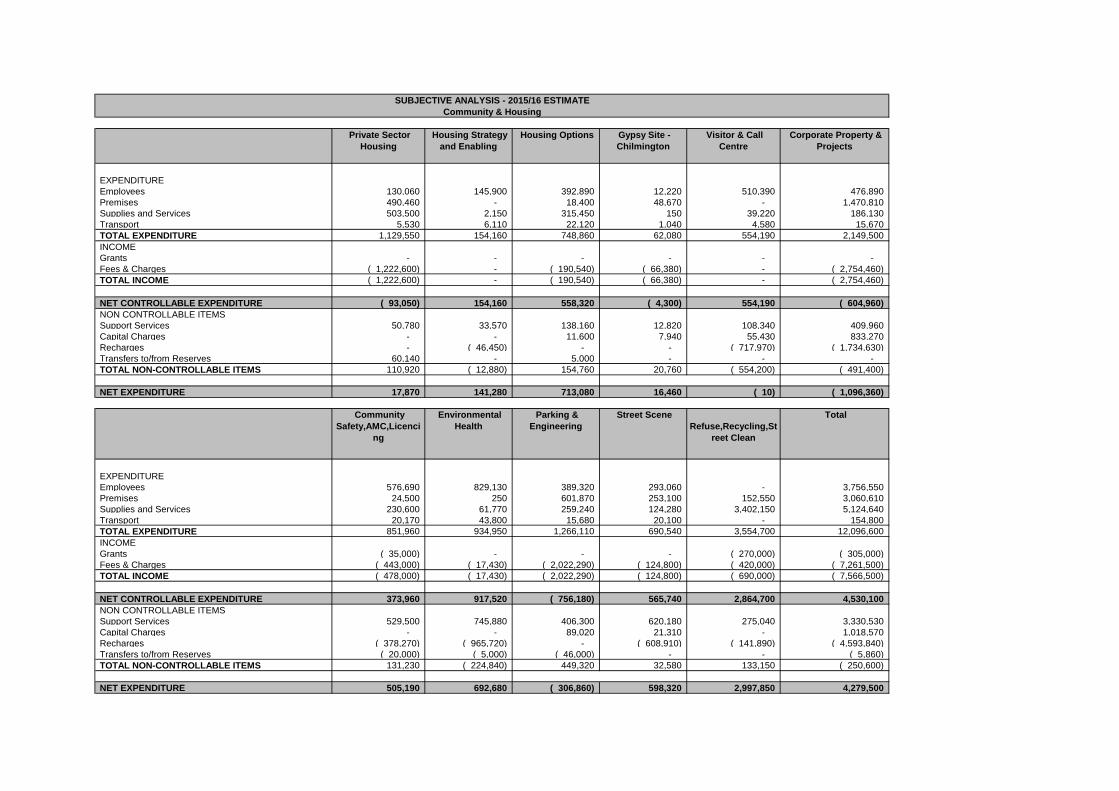
Private Sector
Housing
Housing Strategy
and Enabling
Housing Options Gypsy Site -
Chilmington
Visitor & Call
Centre
Corporate Property &
Projects
EXPENDITURE
Employees 130,060 145,900 392,890 12,220 510,390 476,890
Premises 490,460 - 18,400 48,670 - 1,470,810
Supplies and Services 503,500 2,150 315,450 150 39,220 186,130
Transport 5,530 6,110 22,120 1,040 4,580 15,670
TOTAL EXPENDITURE 1,129,550 154,160 748,860 62,080 554,190 2,149,500
INCOME
Grants - - - - - -
Fees & Charges ( 1,222,600) - ( 190,540) ( 66,380) - ( 2,754,460)
TOTAL INCOME ( 1,222,600) - ( 190,540) ( 66,380) - ( 2,754,460)
NET CONTROLLABLE EXPENDITURE ( 93,050) 154,160 558,320 ( 4,300) 554,190 ( 604,960)
NON CONTROLLABLE ITEMS
Support Services 50,780 33,570 138,160 12,820 108,340 409,960
Capital Charges - - 11,600 7,940 55,430 833,270
Recharges - ( 46,450) - - ( 717,970) ( 1,734,630)
Transfers to/from Reserves 60,140 - 5,000 - - -
TOTAL NON-CONTROLLABLE ITEMS 110,920 ( 12,880) 154,760 20,760 ( 554,200) ( 491,400)
NET EXPENDITURE 17,870 141,280 713,080 16,460 ( 10) ( 1,096,360)
Community
Safety,AMC,Licenci
ng
Environmental
Health
Parking &
Engineering
Street Scene
Refuse,Recycling,St
reet Clean
Total
EXPENDITURE
Employees 576,690 829,130 389,320 293,060 - 3,756,550
Premises 24,500 250 601,870 253,100 152,550 3,060,610
Supplies and Services 230,600 61,770 259,240 124,280 3,402,150 5,124,640
Transport 20,170 43,800 15,680 20,100 - 154,800
TOTAL EXPENDITURE 851,960 934,950 1,266,110 690,540 3,554,700 12,096,600
INCOME
Grants ( 35,000) - - - ( 270,000) ( 305,000)
Fees & Charges ( 443,000) ( 17,430) ( 2,022,290) ( 124,800) ( 420,000) ( 7,261,500)
TOTAL INCOME ( 478,000) ( 17,430) ( 2,022,290) ( 124,800) ( 690,000) ( 7,566,500)
NET CONTROLLABLE EXPENDITURE 373,960 917,520 ( 756,180) 565,740 2,864,700 4,530,100
NON CONTROLLABLE ITEMS
Support Services 529,500 745,880 406,300 620,180 275,040 3,330,530
Capital Charges - - 89,020 21,310 - 1,018,570
Recharges ( 378,270) ( 965,720) - ( 608,910) ( 141,890) ( 4,593,840)
Transfers to/from Reserves ( 20,000) ( 5,000) ( 46,000) - - ( 5,860)
TOTAL NON-CONTROLLABLE ITEMS 131,230 ( 224,840) 449,320 32,580 133,150 ( 250,600)
NET EXPENDITURE 505,190 692,680 ( 306,860) 598,320 2,997,850 4,279,500
SUBJECTIVE ANALYSIS - 2015/16 ESTIMATE
Community & Housing
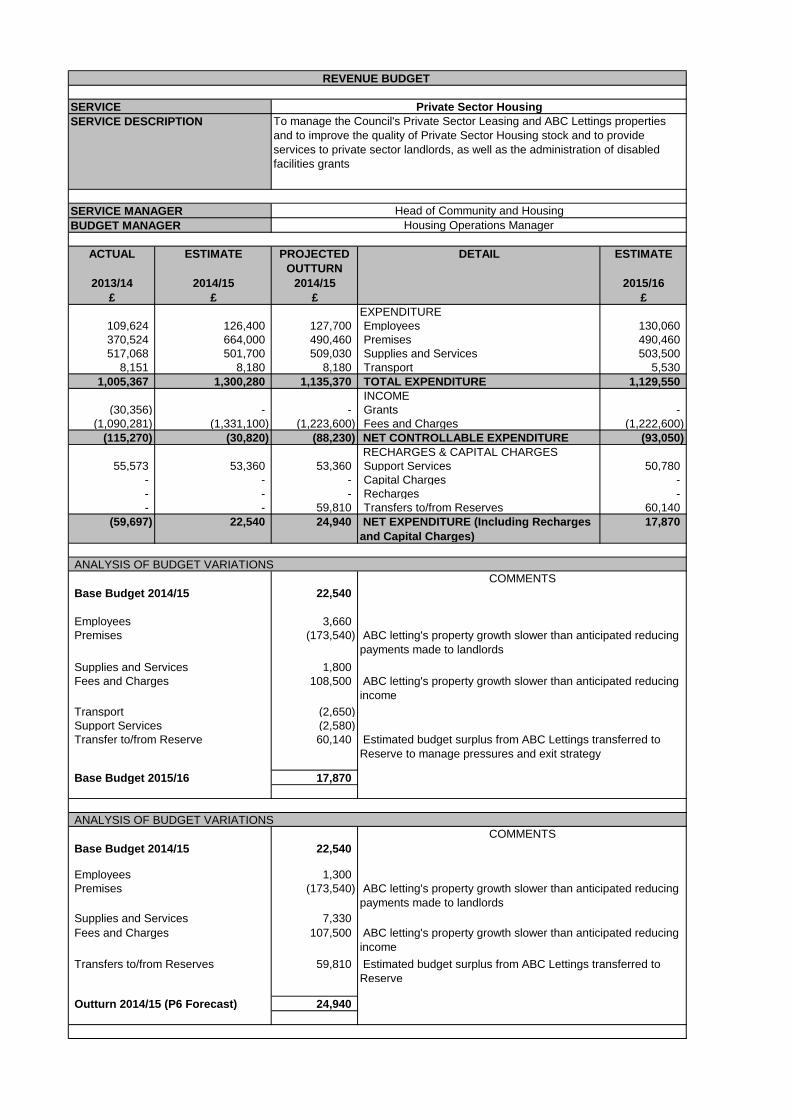
ACTUAL ESTIMATE PROJECTED
OUTTURN
DETAIL ESTIMATE
2013/14 2014/15 2014/15 2015/16
£ £ £ £
EXPENDITURE
109,624 126,400 127,700 Employees 130,060
370,524 664,000 490,460 Premises 490,460
517,068 501,700 509,030 Supplies and Services 503,500
8,151 8,180 8,180 Transport 5,530
1,005,367 1,300,280 1,135,370 TOTAL EXPENDITURE 1,129,550
INCOME
(30,356) - - Grants -
(1,090,281) (1,331,100) (1,223,600) Fees and Charges (1,222,600)
(115,270) (30,820) (88,230) NET CONTROLLABLE EXPENDITURE (93,050)
RECHARGES & CAPITAL CHARGES
55,573 53,360 53,360 Support Services 50,780
- - - Capital Charges -
- - - Recharges -
- - 59,810 Transfers to/from Reserves 60,140
(59,697) 22,540 24,940 NET EXPENDITURE (Including Recharges
and Capital Charges)
17,870
22,540
Employees 3,660
Premises (173,540)
Supplies and Services 1,800
Fees and Charges 108,500
Transport (2,650)
Support Services (2,580)
Transfer to/from Reserve 60,140
17,870
22,540
Employees 1,300
Premises (173,540)
Supplies and Services 7,330
Fees and Charges 107,500
Transfers to/from Reserves 59,810
24,940
Estimated budget surplus from ABC Lettings transferred to
Reserve
ABC letting's property growth slower than anticipated reducing
income
Base Budget 2014/15
ABC letting's property growth slower than anticipated reducing
payments made to landlords
COMMENTS
Outturn 2014/15 (P6 Forecast)
Base Budget 2015/16
ANALYSIS OF BUDGET VARIATIONS
SERVICE MANAGER Head of Community and Housing
BUDGET MANAGER Housing Operations Manager
ANALYSIS OF BUDGET VARIATIONS
COMMENTS
Base Budget 2014/15
ABC letting's property growth slower than anticipated reducing
payments made to landlords
ABC letting's property growth slower than anticipated reducing
income
Estimated budget surplus from ABC Lettings transferred to
Reserve to manage pressures and exit strategy
REVENUE BUDGET
SERVICE Private Sector Housing
SERVICE DESCRIPTION To manage the Council's Private Sector Leasing and ABC Lettings properties
and to improve the quality of Private Sector Housing stock and to provide
services to private sector landlords, as well as the administration of disabled
facilities grants

ACTUAL ESTIMATE PROJECTED
OUTTURN
DETAIL ESTIMATE
2013/14 2014/15 2014/15 2015/16
£ £ £ £
EXPENDITURE
114,290 100,610 163,160 Employees 145,900
77 - - Premises -
2,520 2,150 2,150 Supplies and Services 2,150
1,826 3,630 7,030 Transport 6,110
118,713 106,390 172,340 TOTAL EXPENDITURE 154,160
INCOME
- - - Grants -
- - - Fees and Charges -
118,713 106,390 172,340 NET CONTROLLABLE EXPENDITURE 154,160
RECHARGES & CAPITAL CHARGES
60,835 37,760 37,760 Support Services 33,570
- 1,110 1,110 Capital Charges -
(67,640) (67,640) (67,640) Recharges (46,450)
- - - Transfers to/from Reserves -
111,908 77,620 143,570 NET EXPENDITURE (Including Recharges
and Capital Charges)
141,280
77,620
Employees (14,860)
Employees 60,150
Transport 2,480
Support Services (4,190)
Recharges 21,190
Capital Charges (1,110)
141,280
77,620
Employees 62,550
Transport 3,400
143,570
Base Budget 2014/15
Outturn 2014/15 (P6 Forecast)
Performance Improvement Officer
COMMENTS
Base Budget 2015/16
ANALYSIS OF BUDGET VARIATIONS
REVENUE BUDGET
SERVICE Housing Strategy and Enabling
SERVICE DESCRIPTION To encourage the provision of affordable housing outside of the HRA
COMMENTS
Base Budget 2014/15
Head of Community and Housing
Housing Improvement Manager
SERVICE MANAGER
BUDGET MANAGER
ANALYSIS OF BUDGET VARIATIONS
Performance Improvement Officer
15% Savings - Affordable Housing HRA work
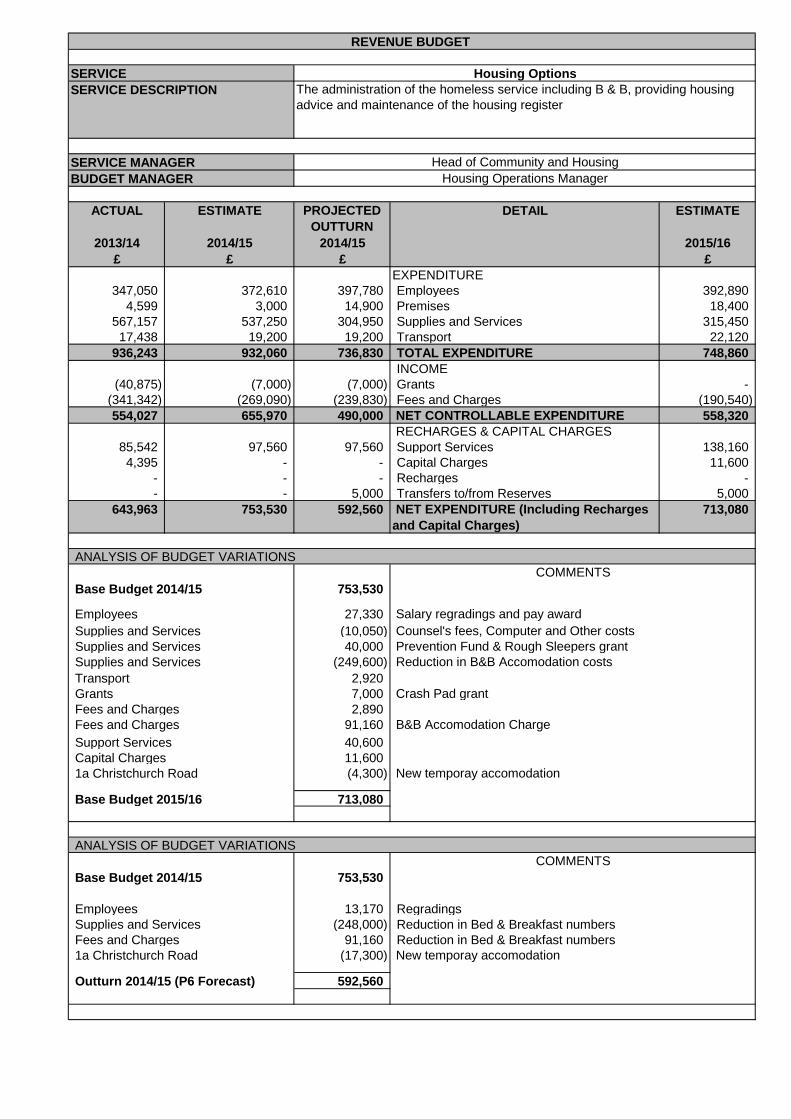
ACTUAL ESTIMATE PROJECTED
OUTTURN
DETAIL ESTIMATE
2013/14 2014/15 2014/15 2015/16
£ £ £ £
EXPENDITURE
347,050 372,610 397,780 Employees 392,890
4,599 3,000 14,900 Premises 18,400
567,157 537,250 304,950 Supplies and Services 315,450
17,438 19,200 19,200 Transport 22,120
936,243 932,060 736,830 TOTAL EXPENDITURE 748,860
INCOME
(40,875) (7,000) (7,000) Grants -
(341,342) (269,090) (239,830) Fees and Charges (190,540)
554,027 655,970 490,000 NET CONTROLLABLE EXPENDITURE 558,320
RECHARGES & CAPITAL CHARGES
85,542 97,560 97,560 Support Services 138,160
4,395 - - Capital Charges 11,600
- - - Recharges -
- - 5,000 Transfers to/from Reserves 5,000
643,963 753,530 592,560 NET EXPENDITURE (Including Recharges
and Capital Charges)
713,080
753,530
Employees 27,330
Supplies and Services (10,050)
Supplies and Services 40,000
Supplies and Services (249,600)
Transport 2,920
Grants 7,000 Crash Pad grant
Fees and Charges 2,890
Fees and Charges 91,160 B&B Accomodation Charge
Support Services 40,600
Capital Charges 11,600
1a Christchurch Road (4,300)
713,080
753,530
Employees 13,170 Regradings
Supplies and Services (248,000) Reduction in Bed & Breakfast numbers
Fees and Charges 91,160 Reduction in Bed & Breakfast numbers
1a Christchurch Road (17,300)
592,560 Outturn 2014/15 (P6 Forecast)
Base Budget 2014/15
New temporay accomodation
COMMENTS
Base Budget 2015/16
ANALYSIS OF BUDGET VARIATIONS
SERVICE MANAGER
BUDGET MANAGER
ANALYSIS OF BUDGET VARIATIONS
COMMENTS
Base Budget 2014/15
Salary regradings and pay award
Head of Community and Housing
Housing Operations Manager
Counsel's fees, Computer and Other costs
New temporay accomodation
REVENUE BUDGET
SERVICE Housing Options
SERVICE DESCRIPTION The administration of the homeless service including B & B, providing housing
advice and maintenance of the housing register
Prevention Fund & Rough Sleepers grant
Reduction in B&B Accomodation costs
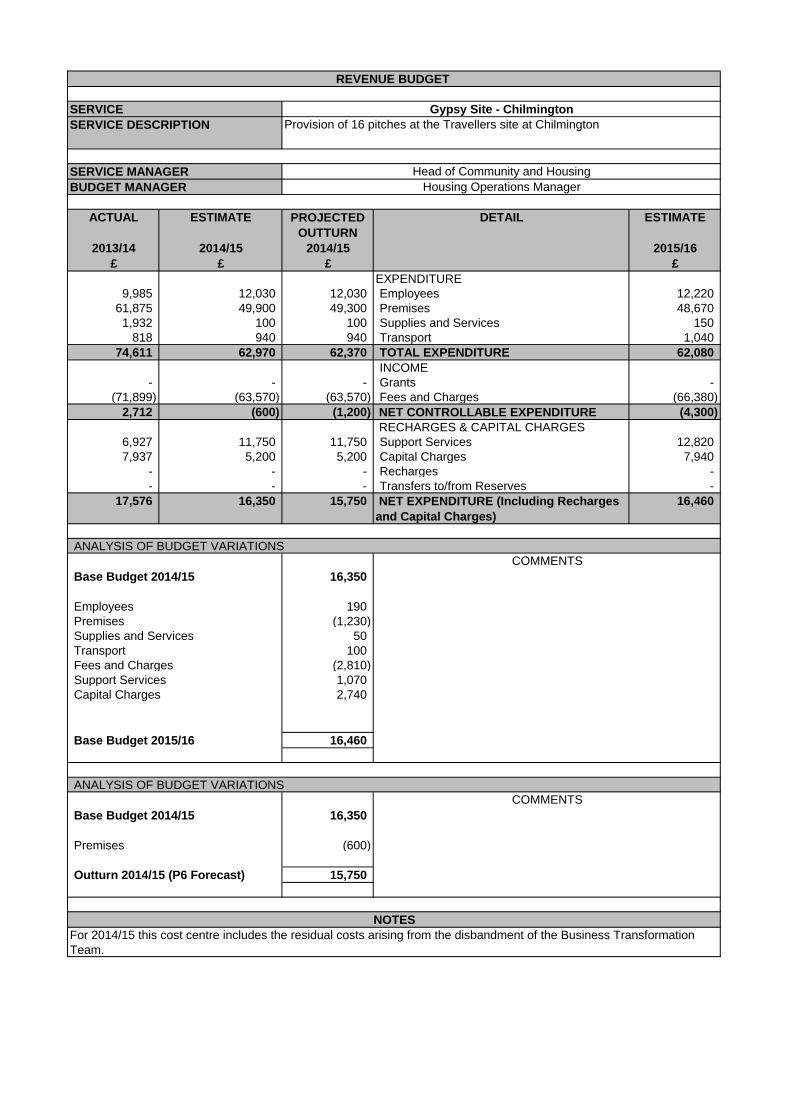
ACTUAL ESTIMATE PROJECTED
OUTTURN
DETAIL ESTIMATE
2013/14 2014/15 2014/15 2015/16
£ £ £ £
EXPENDITURE
9,985 12,030 12,030 Employees 12,220
61,875 49,900 49,300 Premises 48,670
1,932 100 100 Supplies and Services 150
818 940 940 Transport 1,040
74,611 62,970 62,370 TOTAL EXPENDITURE 62,080
INCOME
- - - Grants -
(71,899) (63,570) (63,570) Fees and Charges (66,380)
2,712 (600) (1,200) NET CONTROLLABLE EXPENDITURE (4,300)
RECHARGES & CAPITAL CHARGES
6,927 11,750 11,750 Support Services 12,820
7,937 5,200 5,200 Capital Charges 7,940
- - - Recharges -
- - - Transfers to/from Reserves -
17,576 16,350 15,750 NET EXPENDITURE (Including Recharges
and Capital Charges)
16,460
16,350
Employees 190
Premises (1,230)
Supplies and Services 50
Transport 100
Fees and Charges (2,810)
Support Services 1,070
Capital Charges 2,740
16,460
16,350
Premises (600)
15,750
NOTES
For 2014/15 this cost centre includes the residual costs arising from the disbandment of the Business Transformation
Team.
Outturn 2014/15 (P6 Forecast)
Base Budget 2014/15
COMMENTS
Base Budget 2015/16
ANALYSIS OF BUDGET VARIATIONS
SERVICE MANAGER
BUDGET MANAGER
ANALYSIS OF BUDGET VARIATIONS
COMMENTS
Base Budget 2014/15
Head of Community and Housing
Housing Operations Manager
REVENUE BUDGET
SERVICE Gypsy Site - Chilmington
SERVICE DESCRIPTION Provision of 16 pitches at the Travellers site at Chilmington
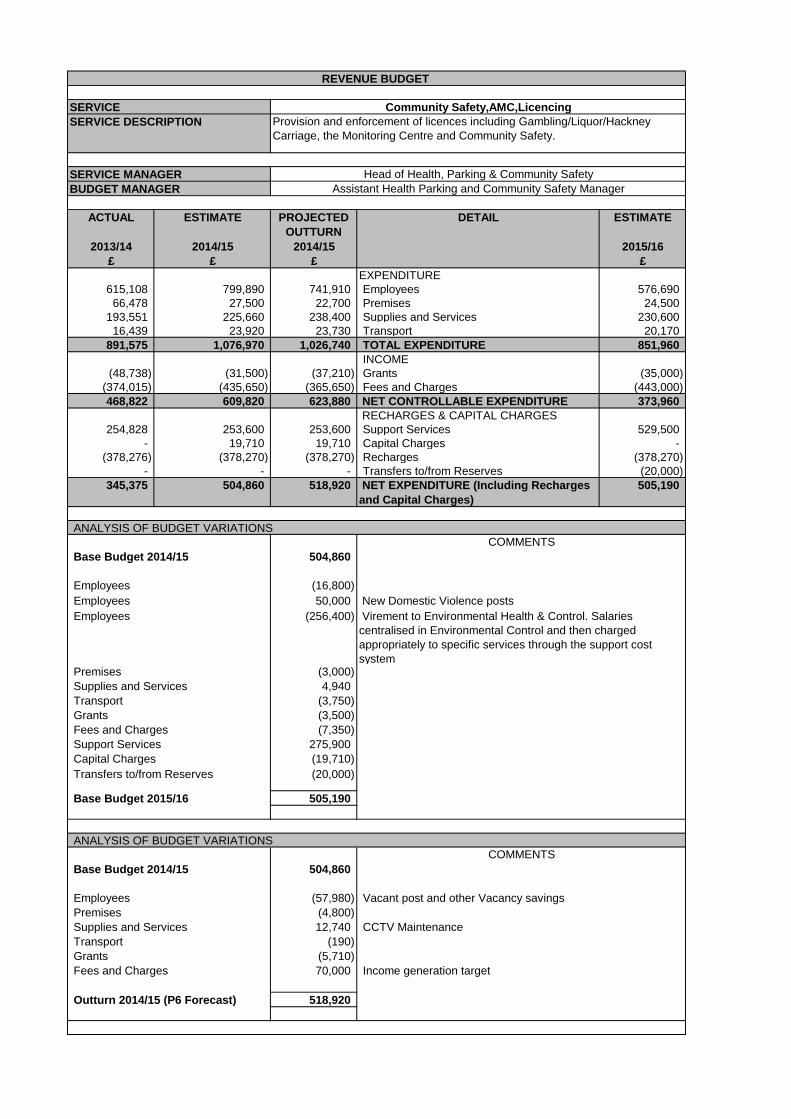
ACTUAL ESTIMATE PROJECTED
OUTTURN
DETAIL ESTIMATE
2013/14 2014/15 2014/15 2015/16
£ £ £ £
EXPENDITURE
615,108 799,890 741,910 Employees 576,690
66,478 27,500 22,700 Premises 24,500
193,551 225,660 238,400 Supplies and Services 230,600
16,439 23,920 23,730 Transport 20,170
891,575 1,076,970 1,026,740 TOTAL EXPENDITURE 851,960
INCOME
(48,738) (31,500) (37,210) Grants (35,000)
(374,015) (435,650) (365,650) Fees and Charges (443,000)
468,822 609,820 623,880 NET CONTROLLABLE EXPENDITURE 373,960
RECHARGES & CAPITAL CHARGES
254,828 253,600 253,600 Support Services 529,500
- 19,710 19,710 Capital Charges -
(378,276) (378,270) (378,270) Recharges (378,270)
- - - Transfers to/from Reserves (20,000)
345,375 504,860 518,920 NET EXPENDITURE (Including Recharges
and Capital Charges)
505,190
504,860
Employees (16,800)
Employees 50,000 New Domestic Violence posts
Employees (256,400)
Premises (3,000)
Supplies and Services 4,940
Transport (3,750)
Grants (3,500)
Fees and Charges (7,350)
Support Services 275,900
Capital Charges (19,710)
Transfers to/from Reserves (20,000)
505,190
504,860
Employees (57,980) Vacant post and other Vacancy savings
Premises (4,800)
Supplies and Services 12,740 CCTV Maintenance
Transport (190)
Grants (5,710)
Fees and Charges 70,000 Income generation target
518,920
Virement to Environmental Health & Control. Salaries
centralised in Environmental Control and then charged
appropriately to specific services through the support cost
system
Outturn 2014/15 (P6 Forecast)
Base Budget 2014/15
COMMENTS
Base Budget 2015/16
ANALYSIS OF BUDGET VARIATIONS
SERVICE MANAGER
BUDGET MANAGER
ANALYSIS OF BUDGET VARIATIONS
COMMENTS
Base Budget 2014/15
Head of Health, Parking & Community Safety
Assistant Health Parking and Community Safety Manager
REVENUE BUDGET
SERVICE Community Safety,AMC,Licencing
SERVICE DESCRIPTION Provision and enforcement of licences including Gambling/Liquor/Hackney
Carriage, the Monitoring Centre and Community Safety.
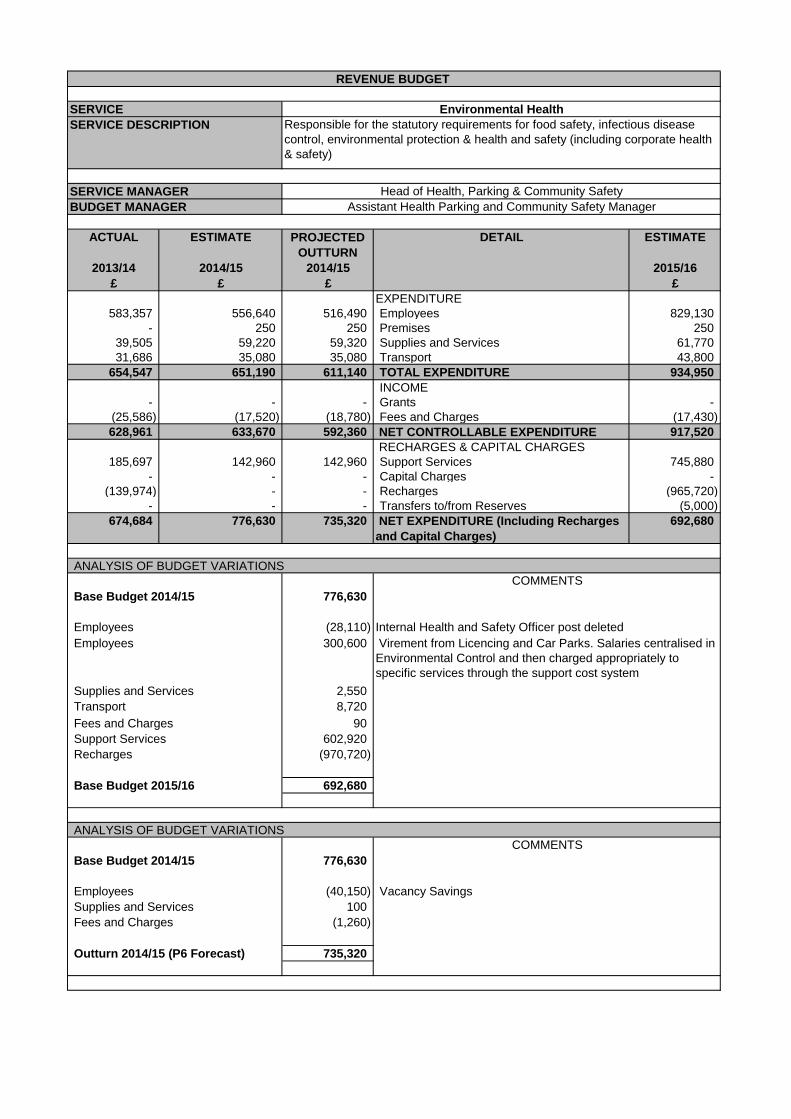
ACTUAL ESTIMATE PROJECTED
OUTTURN
DETAIL ESTIMATE
2013/14 2014/15 2014/15 2015/16
£ £ £ £
EXPENDITURE
583,357 556,640 516,490 Employees 829,130
- 250 250 Premises 250
39,505 59,220 59,320 Supplies and Services 61,770
31,686 35,080 35,080 Transport 43,800
654,547 651,190 611,140 TOTAL EXPENDITURE 934,950
INCOME
- - - Grants -
(25,586) (17,520) (18,780) Fees and Charges (17,430)
628,961 633,670 592,360 NET CONTROLLABLE EXPENDITURE 917,520
RECHARGES & CAPITAL CHARGES
185,697 142,960 142,960 Support Services 745,880
- - - Capital Charges -
(139,974) - - Recharges (965,720)
- - - Transfers to/from Reserves (5,000)
674,684 776,630 735,320 NET EXPENDITURE (Including Recharges
and Capital Charges)
692,680
776,630
Employees (28,110) Internal Health and Safety Officer post deleted
Employees 300,600
Supplies and Services 2,550
Transport 8,720
Fees and Charges 90
Support Services 602,920
Recharges (970,720)
692,680
776,630
Employees (40,150) Vacancy Savings
Supplies and Services 100
Fees and Charges (1,260)
735,320 Outturn 2014/15 (P6 Forecast)
Base Budget 2014/15
COMMENTS
Base Budget 2015/16
ANALYSIS OF BUDGET VARIATIONS
REVENUE BUDGET
SERVICE Environmental Health
SERVICE DESCRIPTION Responsible for the statutory requirements for food safety, infectious disease
control, environmental protection & health and safety (including corporate health
& safety)
Head of Health, Parking & Community Safety
Assistant Health Parking and Community Safety Manager
SERVICE MANAGER
BUDGET MANAGER
Virement from Licencing and Car Parks. Salaries centralised in
Environmental Control and then charged appropriately to
specific services through the support cost system
ANALYSIS OF BUDGET VARIATIONS
COMMENTS
Base Budget 2014/15
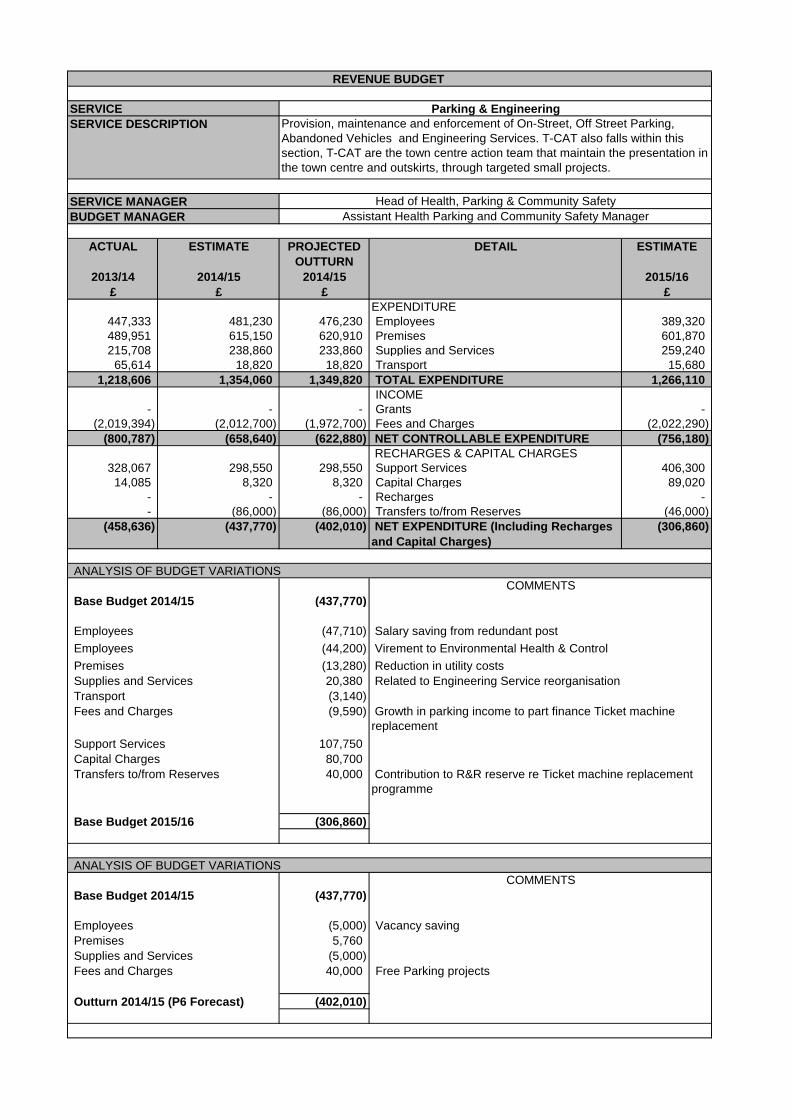
ACTUAL ESTIMATE PROJECTED
OUTTURN
DETAIL ESTIMATE
2013/14 2014/15 2014/15 2015/16
£ £ £ £
EXPENDITURE
447,333 481,230 476,230 Employees 389,320
489,951 615,150 620,910 Premises 601,870
215,708 238,860 233,860 Supplies and Services 259,240
65,614 18,820 18,820 Transport 15,680
1,218,606 1,354,060 1,349,820 TOTAL EXPENDITURE 1,266,110
INCOME
- - - Grants -
(2,019,394) (2,012,700) (1,972,700) Fees and Charges (2,022,290)
(800,787) (658,640) (622,880) NET CONTROLLABLE EXPENDITURE (756,180)
RECHARGES & CAPITAL CHARGES
328,067 298,550 298,550 Support Services 406,300
14,085 8,320 8,320 Capital Charges 89,020
- - - Recharges -
- (86,000) (86,000) Transfers to/from Reserves (46,000)
(458,636) (437,770) (402,010) NET EXPENDITURE (Including Recharges
and Capital Charges)
(306,860)
(437,770)
Employees (47,710)
Employees (44,200)
Premises (13,280)
Supplies and Services 20,380
Transport (3,140)
Fees and Charges (9,590)
Support Services 107,750
Capital Charges 80,700
Transfers to/from Reserves 40,000
(306,860)
(437,770)
Employees (5,000) Vacancy saving
Premises 5,760
Supplies and Services (5,000)
Fees and Charges 40,000 Free Parking projects
(402,010)
Virement to Environmental Health & Control
Related to Engineering Service reorganisation
Growth in parking income to part finance Ticket machine
replacement
Base Budget 2014/15
Outturn 2014/15 (P6 Forecast)
COMMENTS
Base Budget 2015/16
ANALYSIS OF BUDGET VARIATIONS
SERVICE MANAGER
BUDGET MANAGER
ANALYSIS OF BUDGET VARIATIONS
COMMENTS
Base Budget 2014/15
Head of Health, Parking & Community Safety
Assistant Health Parking and Community Safety Manager
Contribution to R&R reserve re Ticket machine replacement
programme
Salary saving from redundant post
Reduction in utility costs
REVENUE BUDGET
SERVICE Parking & Engineering
SERVICE DESCRIPTION Provision, maintenance and enforcement of On-Street, Off Street Parking,
Abandoned Vehicles and Engineering Services. T-CAT also falls within this
section, T-CAT are the town centre action team that maintain the presentation in
the town centre and outskirts, through targeted small projects.
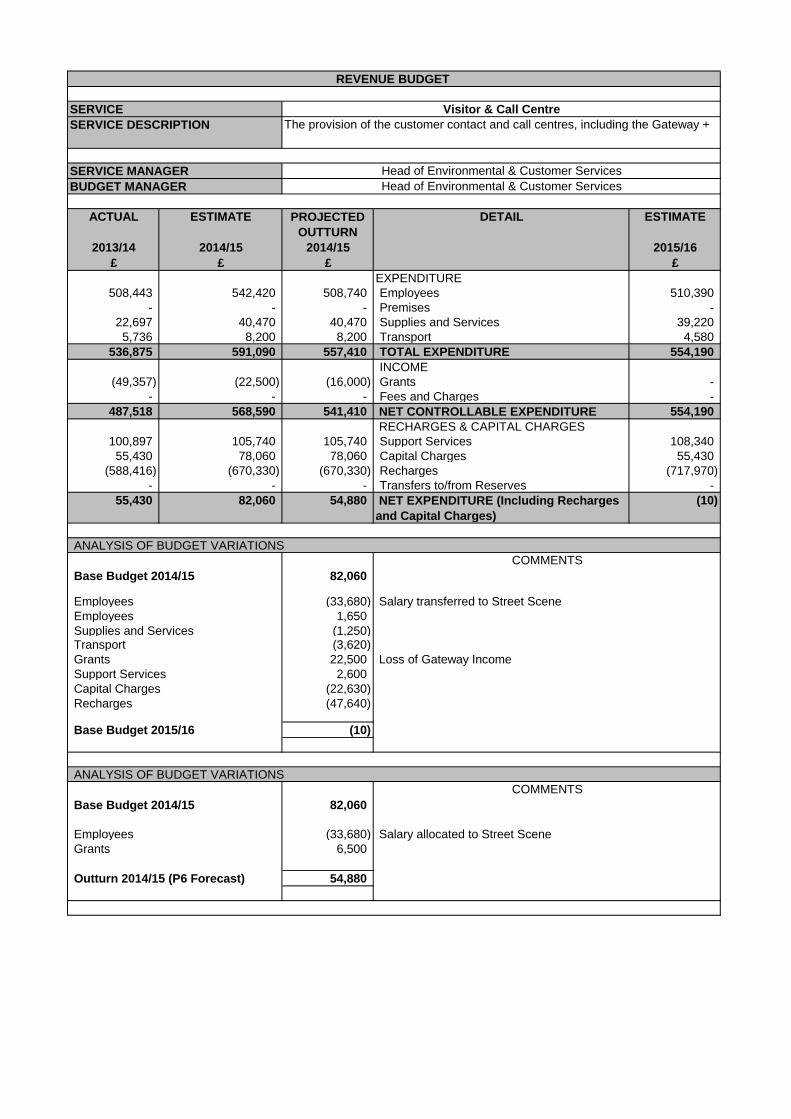
ACTUAL ESTIMATE PROJECTED
OUTTURN
DETAIL ESTIMATE
2013/14 2014/15 2014/15 2015/16
£ £ £ £
EXPENDITURE
508,443 542,420 508,740 Employees 510,390
- - - Premises -
22,697 40,470 40,470 Supplies and Services 39,220
5,736 8,200 8,200 Transport 4,580
536,875 591,090 557,410 TOTAL EXPENDITURE 554,190
INCOME
(49,357) (22,500) (16,000) Grants -
- - - Fees and Charges -
487,518 568,590 541,410 NET CONTROLLABLE EXPENDITURE 554,190
RECHARGES & CAPITAL CHARGES
100,897 105,740 105,740 Support Services 108,340
55,430 78,060 78,060 Capital Charges 55,430
(588,416) (670,330) (670,330) Recharges (717,970)
- - - Transfers to/from Reserves -
55,430 82,060 54,880 NET EXPENDITURE (Including Recharges
and Capital Charges)
(10)
82,060
Employees (33,680)
Employees 1,650
Supplies and Services (1,250) Transport (3,620)
Grants 22,500
Support Services 2,600
Capital Charges (22,630)
Recharges (47,640)
(10)
82,060
Employees (33,680)
Grants 6,500
54,880
Base Budget 2014/15
Salary allocated to Street Scene
Outturn 2014/15 (P6 Forecast)
COMMENTS
Base Budget 2015/16
ANALYSIS OF BUDGET VARIATIONS
Head of Environmental & Customer Services
Head of Environmental & Customer Services
Salary transferred to Street Scene
REVENUE BUDGET
SERVICE Visitor & Call Centre
SERVICE DESCRIPTION The provision of the customer contact and call centres, including the Gateway +
SERVICE MANAGER
BUDGET MANAGER
ANALYSIS OF BUDGET VARIATIONS
COMMENTS
Base Budget 2014/15
Loss of Gateway Income
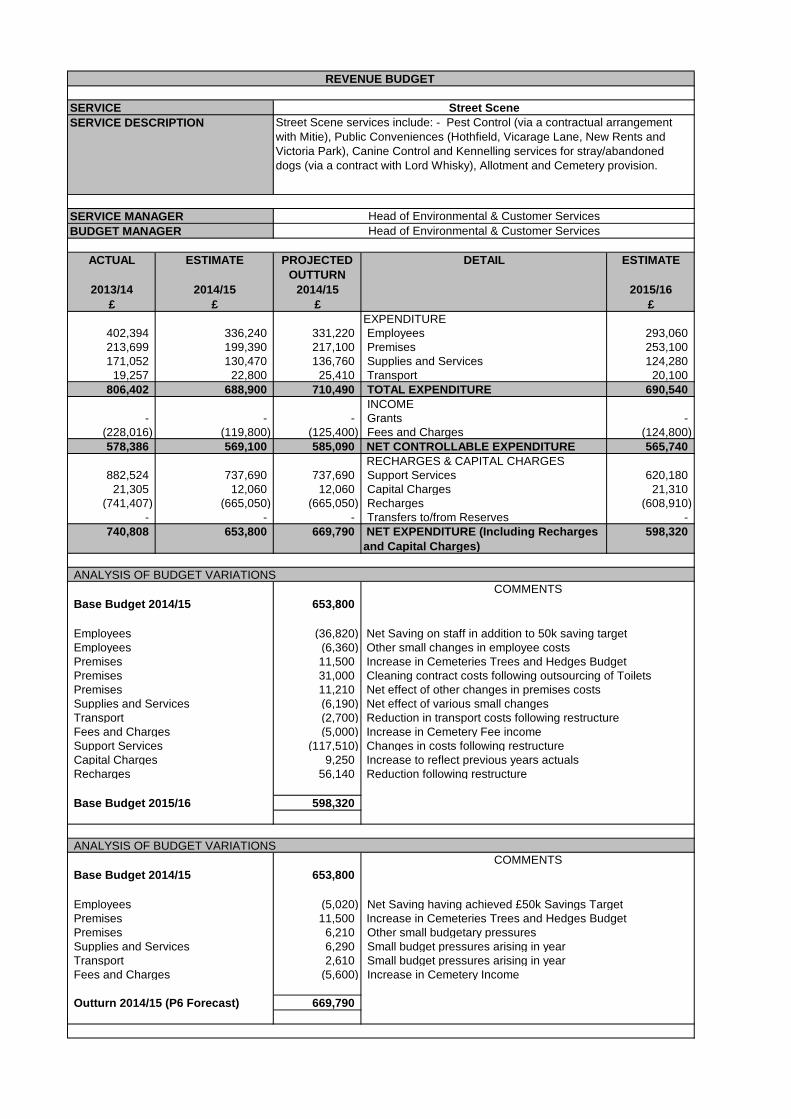
ACTUAL ESTIMATE PROJECTED
OUTTURN
DETAIL ESTIMATE
2013/14 2014/15 2014/15 2015/16
£ £ £ £
EXPENDITURE
402,394 336,240 331,220 Employees 293,060
213,699 199,390 217,100 Premises 253,100
171,052 130,470 136,760 Supplies and Services 124,280
19,257 22,800 25,410 Transport 20,100
806,402 688,900 710,490 TOTAL EXPENDITURE 690,540
INCOME
- - - Grants -
(228,016) (119,800) (125,400) Fees and Charges (124,800)
578,386 569,100 585,090 NET CONTROLLABLE EXPENDITURE 565,740
RECHARGES & CAPITAL CHARGES
882,524 737,690 737,690 Support Services 620,180
21,305 12,060 12,060 Capital Charges 21,310
(741,407) (665,050) (665,050) Recharges (608,910)
- - - Transfers to/from Reserves -
740,808 653,800 669,790 NET EXPENDITURE (Including Recharges
and Capital Charges)
598,320
653,800
Employees (36,820)
Employees (6,360)
Premises 11,500
Premises 31,000
Premises 11,210
Supplies and Services (6,190)
Transport (2,700)
Fees and Charges (5,000) Increase in Cemetery Fee income
Support Services (117,510) Changes in costs following restructure
Capital Charges 9,250
Recharges 56,140 Reduction following restructure
598,320
653,800
Employees (5,020) Net Saving having achieved £50k Savings Target
Premises 11,500
Premises 6,210 Other small budgetary pressures
Supplies and Services 6,290 Small budget pressures arising in year
Transport 2,610 Small budget pressures arising in year
Fees and Charges (5,600) Increase in Cemetery Income
669,790
Reduction in transport costs following restructure
Increase to reflect previous years actuals
Increase in Cemeteries Trees and Hedges Budget
Other small changes in employee costs
Cleaning contract costs following outsourcing of Toilets
Increase in Cemeteries Trees and Hedges Budget
Net effect of other changes in premises costs
COMMENTS
Outturn 2014/15 (P6 Forecast)
Base Budget 2014/15
Base Budget 2015/16
ANALYSIS OF BUDGET VARIATIONS
SERVICE MANAGER Head of Environmental & Customer Services
BUDGET MANAGER Head of Environmental & Customer Services
ANALYSIS OF BUDGET VARIATIONS
COMMENTS
Base Budget 2014/15
Net Saving on staff in addition to 50k saving target
Net effect of various small changes
REVENUE BUDGET
SERVICE Street Scene
SERVICE DESCRIPTION Street Scene services include: - Pest Control (via a contractual arrangement
with Mitie), Public Conveniences (Hothfield, Vicarage Lane, New Rents and
Victoria Park), Canine Control and Kennelling services for stray/abandoned
dogs (via a contract with Lord Whisky), Allotment and Cemetery provision.
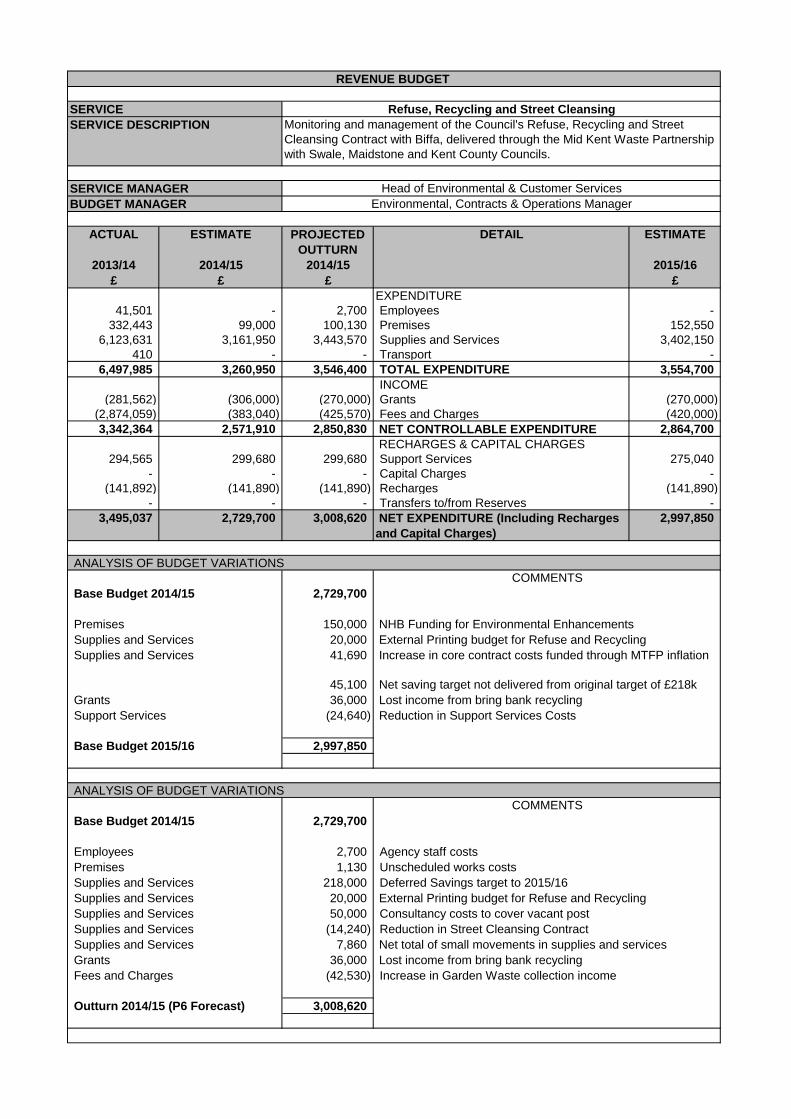
Refuse, Recycling and Street Cleansing
ACTUAL ESTIMATE PROJECTED
OUTTURN
DETAIL ESTIMATE
2013/14 2014/15 2014/15 2015/16
£ £ £ £
EXPENDITURE
41,501 - 2,700 Employees -
332,443 99,000 100,130 Premises 152,550
6,123,631 3,161,950 3,443,570 Supplies and Services 3,402,150
410 - - Transport -
6,497,985 3,260,950 3,546,400 TOTAL EXPENDITURE 3,554,700
INCOME
(281,562) (306,000) (270,000) Grants (270,000)
(2,874,059) (383,040) (425,570) Fees and Charges (420,000)
3,342,364 2,571,910 2,850,830 NET CONTROLLABLE EXPENDITURE 2,864,700
RECHARGES & CAPITAL CHARGES
294,565 299,680 299,680 Support Services 275,040
- - - Capital Charges -
(141,892) (141,890) (141,890) Recharges (141,890)
- - - Transfers to/from Reserves -
3,495,037 2,729,700 3,008,620 NET EXPENDITURE (Including Recharges
and Capital Charges)
2,997,850
2,729,700
Premises 150,000
Supplies and Services 20,000
Supplies and Services 41,690
45,100
Grants 36,000 Lost income from bring bank recycling
Support Services (24,640) Reduction in Support Services Costs
2,997,850
2,729,700
Employees 2,700 Agency staff costs
Premises 1,130 Unscheduled works costs
Supplies and Services 218,000 Deferred Savings target to 2015/16
Supplies and Services 20,000
Supplies and Services 50,000 Consultancy costs to cover vacant post
Supplies and Services (14,240) Reduction in Street Cleansing Contract
Supplies and Services 7,860
Grants 36,000 Lost income from bring bank recycling
Fees and Charges (42,530) Increase in Garden Waste collection income
3,008,620 Outturn 2014/15 (P6 Forecast)
Base Budget 2015/16
NHB Funding for Environmental Enhancements
External Printing budget for Refuse and Recycling
Increase in core contract costs funded through MTFP inflation
Net saving target not delivered from original target of £218k
ANALYSIS OF BUDGET VARIATIONS
COMMENTS
Base Budget 2014/15
Net total of small movements in supplies and services
COMMENTS
REVENUE BUDGET
SERVICE
SERVICE DESCRIPTION Monitoring and management of the Council's Refuse, Recycling and Street
Cleansing Contract with Biffa, delivered through the Mid Kent Waste Partnership
with Swale, Maidstone and Kent County Councils.
SERVICE MANAGER Head of Environmental & Customer Services
BUDGET MANAGER Environmental, Contracts & Operations Manager
External Printing budget for Refuse and Recycling
ANALYSIS OF BUDGET VARIATIONS
Base Budget 2014/15
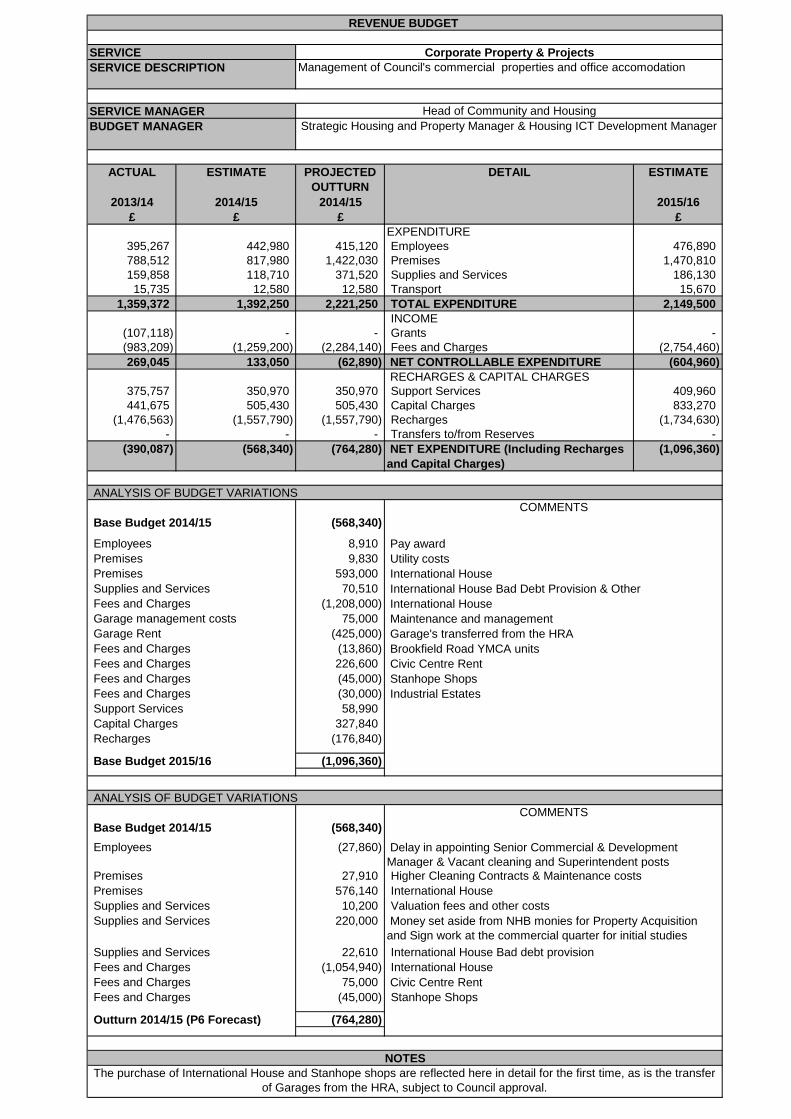
ACTUAL ESTIMATE PROJECTED
OUTTURN
DETAIL ESTIMATE
2013/14 2014/15 2014/15 2015/16
£ £ £ £
EXPENDITURE
395,267 442,980 415,120 Employees 476,890
788,512 817,980 1,422,030 Premises 1,470,810
159,858 118,710 371,520 Supplies and Services 186,130
15,735 12,580 12,580 Transport 15,670
1,359,372 1,392,250 2,221,250 TOTAL EXPENDITURE 2,149,500
INCOME
(107,118) - - Grants -
(983,209) (1,259,200) (2,284,140) Fees and Charges (2,754,460)
269,045 133,050 (62,890) NET CONTROLLABLE EXPENDITURE (604,960)
RECHARGES & CAPITAL CHARGES
375,757 350,970 350,970 Support Services 409,960
441,675 505,430 505,430 Capital Charges 833,270
(1,476,563) (1,557,790) (1,557,790) Recharges (1,734,630)
- - - Transfers to/from Reserves -
(390,087) (568,340) (764,280) NET EXPENDITURE (Including Recharges
and Capital Charges)
(1,096,360)
(568,340)
Employees 8,910
Premises 9,830 Utility costs
Premises 593,000 International House
Supplies and Services 70,510
Fees and Charges (1,208,000) International House
Garage management costs 75,000 Maintenance and management
Garage Rent (425,000) Garage's transferred from the HRA
Fees and Charges (13,860)
Fees and Charges 226,600 Civic Centre Rent
Fees and Charges (45,000) Stanhope Shops
Fees and Charges (30,000)
Support Services 58,990
Capital Charges 327,840
Recharges (176,840)
(1,096,360)
(568,340)
Employees (27,860)
Premises 27,910 Higher Cleaning Contracts & Maintenance costs
Premises 576,140 International House
Supplies and Services 10,200 Valuation fees and other costs
Supplies and Services 220,000
Supplies and Services 22,610 International House Bad debt provision
Fees and Charges (1,054,940) International House
Fees and Charges 75,000 Civic Centre Rent
Fees and Charges (45,000) Stanhope Shops
(764,280)
The purchase of International House and Stanhope shops are reflected here in detail for the first time, as is the transfer
of Garages from the HRA, subject to Council approval.
Outturn 2014/15 (P6 Forecast)
Base Budget 2014/15
Delay in appointing Senior Commercial & Development
Manager & Vacant cleaning and Superintendent posts
Money set aside from NHB monies for Property Acquisition
and Sign work at the commercial quarter for initial studies
NOTES
COMMENTS
Base Budget 2015/16
ANALYSIS OF BUDGET VARIATIONS
REVENUE BUDGET
SERVICE Corporate Property & Projects
SERVICE DESCRIPTION Management of Council's commercial properties and office accomodation
Head of Community and Housing
Strategic Housing and Property Manager & Housing ICT Development Manager
Brookfield Road YMCA units
SERVICE MANAGER
BUDGET MANAGER
Pay award
International House Bad Debt Provision & Other
ANALYSIS OF BUDGET VARIATIONS
COMMENTS
Base Budget 2014/15
Industrial Estates

This page has been intentionally left blank
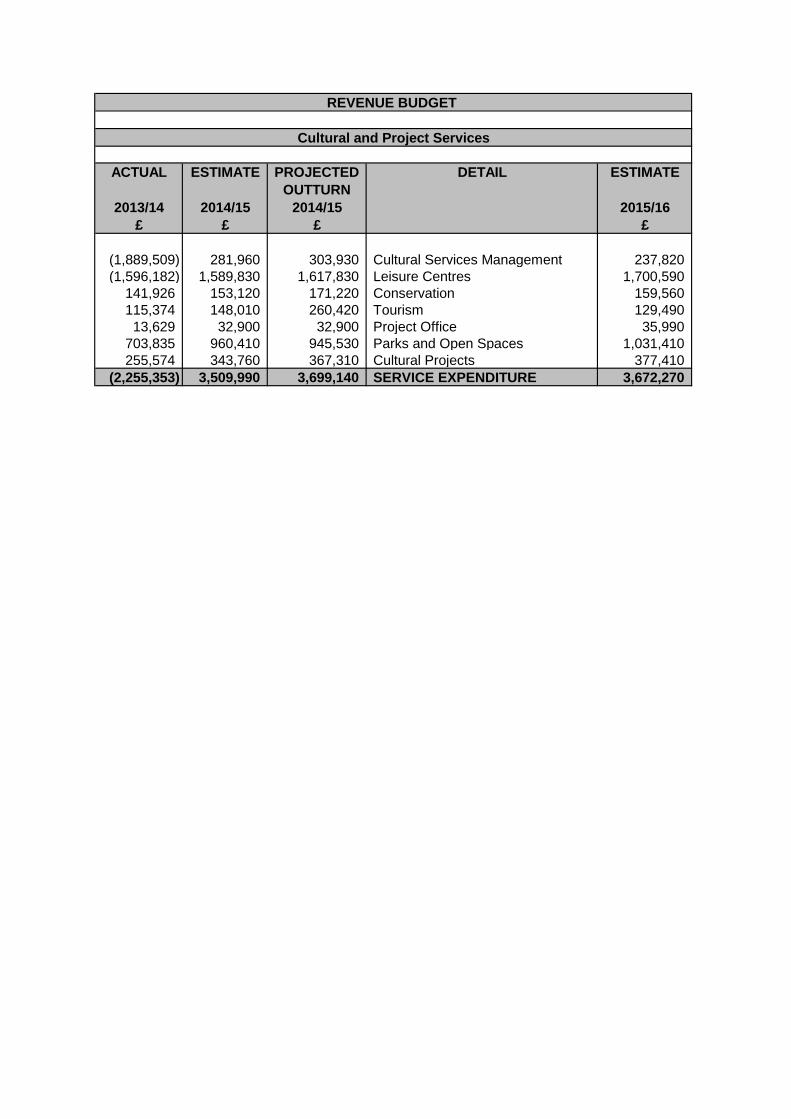
ACTUAL ESTIMATE PROJECTED
OUTTURN
DETAIL ESTIMATE
2013/14 2014/15 2014/15 2015/16
£ £ £ £
(1,889,509) 281,960 303,930 Cultural Services Management 237,820
(1,596,182) 1,589,830 1,617,830 Leisure Centres 1,700,590
141,926 153,120 171,220 Conservation 159,560
115,374 148,010 260,420 Tourism 129,490
13,629 32,900 32,900 Project Office 35,990
703,835 960,410 945,530 Parks and Open Spaces 1,031,410
255,574 343,760 367,310 Cultural Projects 377,410
(2,255,353) 3,509,990 3,699,140 SERVICE EXPENDITURE 3,672,270
REVENUE BUDGET
Cultural and Project Services
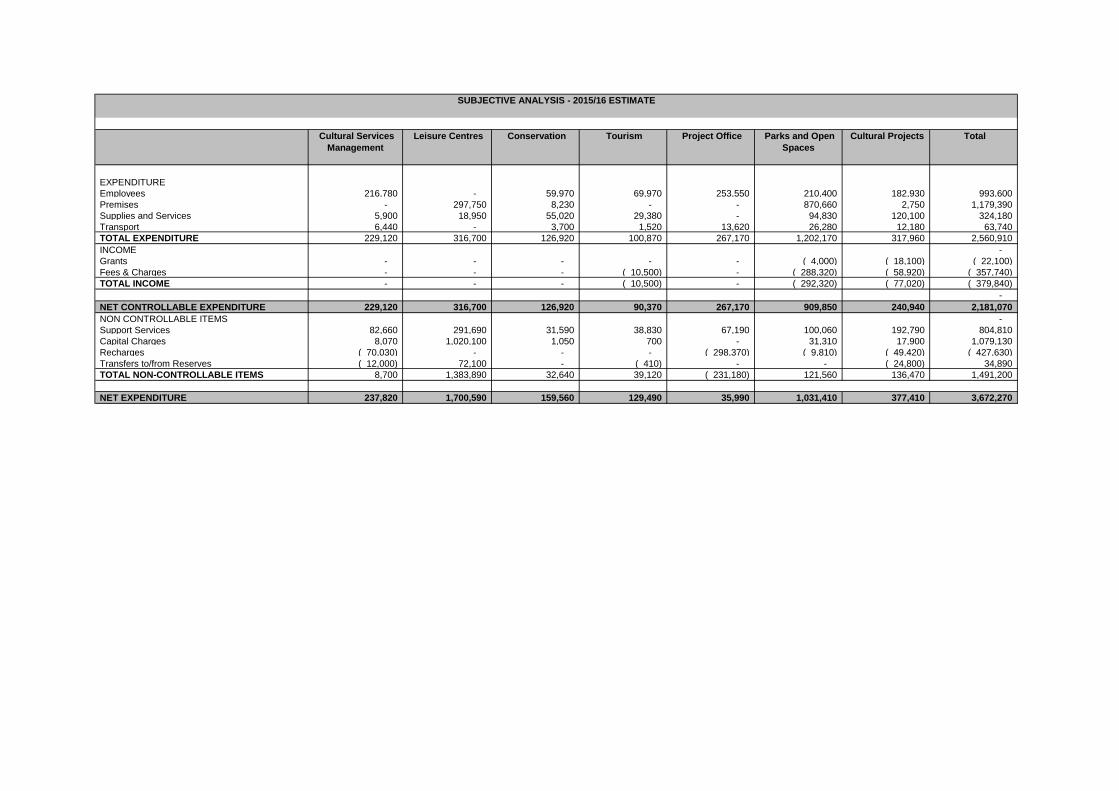
Cultural Services
Management
Leisure Centres Conservation Tourism Project Office Parks and Open
Spaces
Cultural Projects Total
EXPENDITURE
Employees 216,780 - 59,970 69,970 253,550 210,400 182,930 993,600
Premises - 297,750 8,230 - - 870,660 2,750 1,179,390
Supplies and Services 5,900 18,950 55,020 29,380 - 94,830 120,100 324,180
Transport 6,440 - 3,700 1,520 13,620 26,280 12,180 63,740
TOTAL EXPENDITURE 229,120 316,700 126,920 100,870 267,170 1,202,170 317,960 2,560,910
INCOME -
Grants - - - - - ( 4,000) ( 18,100) ( 22,100)
Fees & Charges - - - ( 10,500) - ( 288,320) ( 58,920) ( 357,740)
TOTAL INCOME - - - ( 10,500) - ( 292,320) ( 77,020) ( 379,840)
-
NET CONTROLLABLE EXPENDITURE 229,120 316,700 126,920 90,370 267,170 909,850 240,940 2,181,070
NON CONTROLLABLE ITEMS -
Support Services 82,660 291,690 31,590 38,830 67,190 100,060 192,790 804,810
Capital Charges 8,070 1,020,100 1,050 700 - 31,310 17,900 1,079,130
Recharges ( 70,030) - - - ( 298,370) ( 9,810) ( 49,420) ( 427,630)
Transfers to/from Reserves ( 12,000) 72,100 - ( 410) - - ( 24,800) 34,890
TOTAL NON-CONTROLLABLE ITEMS 8,700 1,383,890 32,640 39,120 ( 231,180) 121,560 136,470 1,491,200
NET EXPENDITURE 237,820 1,700,590 159,560 129,490 35,990 1,031,410 377,410 3,672,270
SUBJECTIVE ANALYSIS - 2015/16 ESTIMATE

ACTUAL ESTIMATE PROJECTED
OUTTURN
DETAIL ESTIMATE
2013/14 2014/15 2014/15 2015/16
£ £ £ £
EXPENDITURE
192,480 187,760 209,730 Employees 216,780
- - - Premises -
14,763 15,850 33,450 Supplies and Services 5,900
6,838 5,290 5,290 Transport 6,440
214,081 208,900 248,470 TOTAL EXPENDITURE 229,120
INCOME
(2,186,079) - - Grants -
- - (17,600) Fees and Charges -
(1,971,998) 208,900 230,870 NET CONTROLLABLE EXPENDITURE 229,120
RECHARGES & CAPITAL CHARGES
150,614 133,650 133,650 Support Services 82,660
8,067 15,600 15,600 Capital Charges 8,070
(76,192) (76,190) (76,190) Recharges (70,030)
- - - Transfers to/from Reserves (12,000)
(1,889,509) 281,960 303,930 NET EXPENDITURE (Including Recharges
and Capital Charges)
237,820
281,960
Employees 29,020
Supplies and Services (9,950)
Transport 1,150
Support Services (50,990)
Capital Charges (7,530)
Recharges 6,160
Transfers to/from Reserves (12,000)
237,820
281,960
Employees 21,970
Supplies and Services 17,600
Fees and Charges (17,600) Income from Tenterden Town Council for Strategy work
303,930
Assets revalued as at 01/04/13, matches last years actual
REVENUE BUDGET
SERVICE Cultural Services Management
SERVICE DESCRIPTION Management function of the Cultural Services Team, including administration
and safeguarding children co-ordination
SERVICE MANAGER Head of Cultural and Project Services
BUDGET MANAGER Cultural Operations and Projects Manager
ANALYSIS OF BUDGET VARIATIONS
COMMENTS
Base Budget 2014/15
Honorarium payment (funded from reserves) New apprentice
post and upgraded post
Savings achieved to fund 15% savings
Honorarium payment funded from reserves
COMMENTS
Base Budget 2015/16
ANALYSIS OF BUDGET VARIATIONS
Base Budget 2014/15
Honorarium payment to senior staff member, regrading of
posts due to re-structure
Strategy For Tenterden Town Council £17,600 (TTC to
reimburse costs)
Outturn 2014/15 (P6 Forecast)
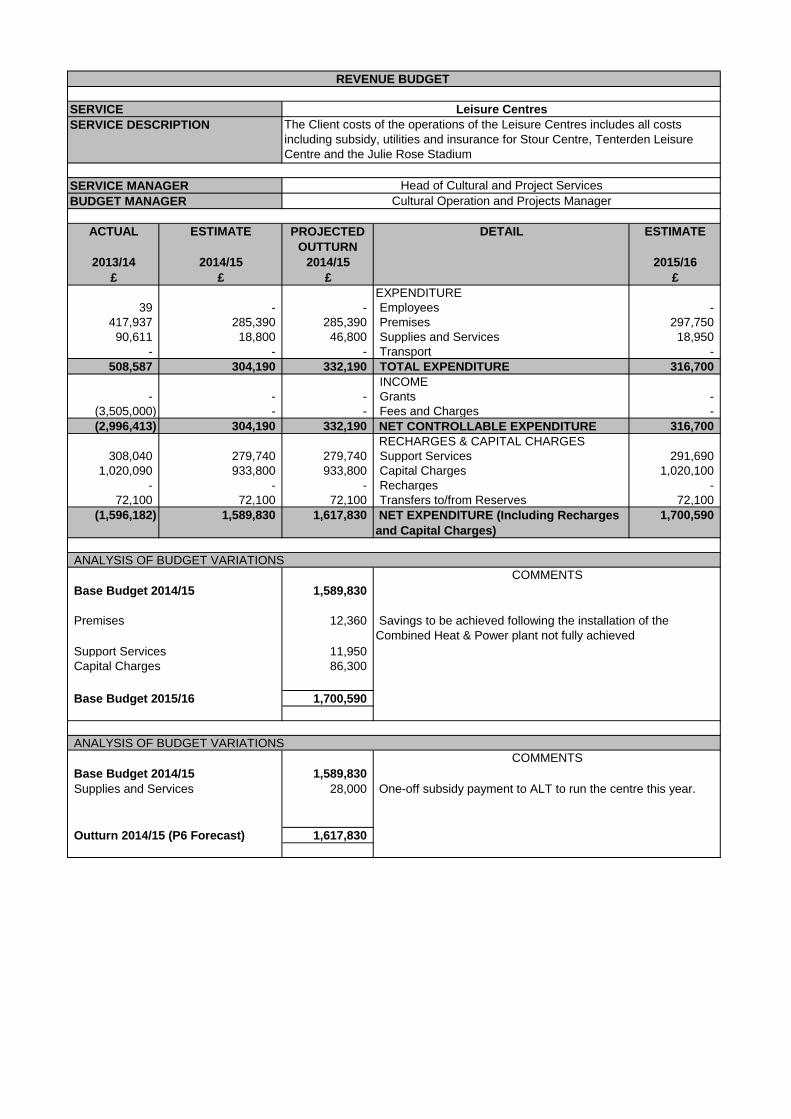
ACTUAL ESTIMATE PROJECTED
OUTTURN
DETAIL ESTIMATE
2013/14 2014/15 2014/15 2015/16
£ £ £ £
EXPENDITURE
39 - - Employees -
417,937 285,390 285,390 Premises 297,750
90,611 18,800 46,800 Supplies and Services 18,950
- - - Transport -
508,587 304,190 332,190 TOTAL EXPENDITURE 316,700
INCOME
- - - Grants -
(3,505,000) - - Fees and Charges -
(2,996,413) 304,190 332,190 NET CONTROLLABLE EXPENDITURE 316,700
RECHARGES & CAPITAL CHARGES
308,040 279,740 279,740 Support Services 291,690
1,020,090 933,800 933,800 Capital Charges 1,020,100
- - - Recharges -
72,100 72,100 72,100 Transfers to/from Reserves 72,100
(1,596,182) 1,589,830 1,617,830 NET EXPENDITURE (Including Recharges
and Capital Charges)
1,700,590
1,589,830
Premises 12,360
Support Services 11,950
Capital Charges 86,300
1,700,590
1,589,830
Supplies and Services 28,000
1,617,830
REVENUE BUDGET
SERVICE Leisure Centres
SERVICE DESCRIPTION The Client costs of the operations of the Leisure Centres includes all costs
including subsidy, utilities and insurance for Stour Centre, Tenterden Leisure
Centre and the Julie Rose Stadium
SERVICE MANAGER Head of Cultural and Project Services
BUDGET MANAGER Cultural Operation and Projects Manager
ANALYSIS OF BUDGET VARIATIONS
COMMENTS
Base Budget 2014/15
Savings to be achieved following the installation of the
Combined Heat & Power plant not fully achieved
COMMENTS
Base Budget 2015/16
ANALYSIS OF BUDGET VARIATIONS
Base Budget 2014/15
One-off subsidy payment to ALT to run the centre this year.
Outturn 2014/15 (P6 Forecast)
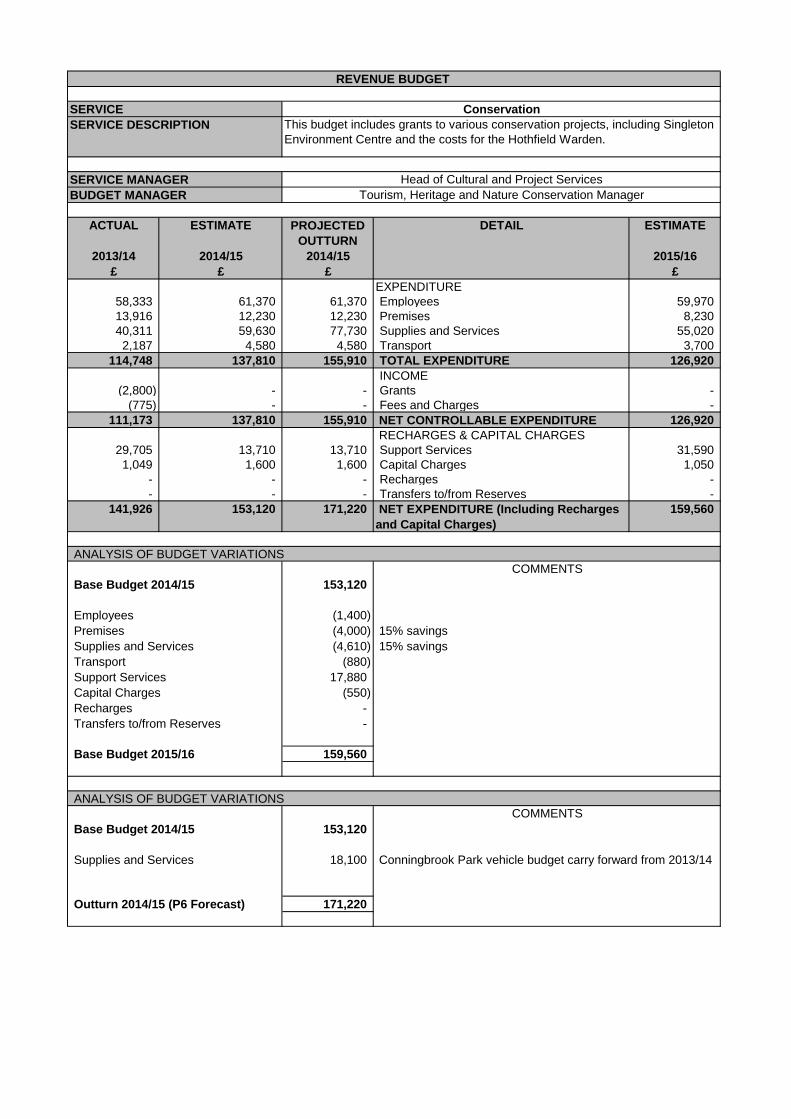
ACTUAL ESTIMATE PROJECTED
OUTTURN
DETAIL ESTIMATE
2013/14 2014/15 2014/15 2015/16
£ £ £ £
EXPENDITURE
58,333 61,370 61,370 Employees 59,970
13,916 12,230 12,230 Premises 8,230
40,311 59,630 77,730 Supplies and Services 55,020
2,187 4,580 4,580 Transport 3,700
114,748 137,810 155,910 TOTAL EXPENDITURE 126,920
INCOME
(2,800) - - Grants -
(775) - - Fees and Charges -
111,173 137,810 155,910 NET CONTROLLABLE EXPENDITURE 126,920
RECHARGES & CAPITAL CHARGES
29,705 13,710 13,710 Support Services 31,590
1,049 1,600 1,600 Capital Charges 1,050
- - - Recharges -
- - - Transfers to/from Reserves -
141,926 153,120 171,220 NET EXPENDITURE (Including Recharges
and Capital Charges)
159,560
153,120
Employees (1,400)
Premises (4,000) 15% savings
Supplies and Services (4,610) 15% savings
Transport (880)
Support Services 17,880
Capital Charges (550)
Recharges -
Transfers to/from Reserves -
159,560
153,120
Supplies and Services 18,100
171,220
REVENUE BUDGET
SERVICE Conservation
SERVICE DESCRIPTION This budget includes grants to various conservation projects, including Singleton
Environment Centre and the costs for the Hothfield Warden.
SERVICE MANAGER Head of Cultural and Project Services
BUDGET MANAGER Tourism, Heritage and Nature Conservation Manager
ANALYSIS OF BUDGET VARIATIONS
COMMENTS
Base Budget 2014/15
COMMENTS
Base Budget 2015/16
ANALYSIS OF BUDGET VARIATIONS
Base Budget 2014/15
Conningbrook Park vehicle budget carry forward from 2013/14
Outturn 2014/15 (P6 Forecast)

ACTUAL ESTIMATE PROJECTED
OUTTURN
DETAIL ESTIMATE
2013/14 2014/15 2014/15 2015/16
£ £ £ £
EXPENDITURE
69,316 71,680 71,680 Employees 69,970
14,725 - - Premises -
39,761 28,290 132,540 Supplies and Services 29,380
600 1,530 1,530 Transport 1,520
124,401 101,500 205,750 TOTAL EXPENDITURE 100,870
INCOME
- - - Grants -
(44,432) (17,700) (10,500) Fees and Charges (10,500)
79,969 83,800 195,250 NET CONTROLLABLE EXPENDITURE 90,370
RECHARGES & CAPITAL CHARGES
41,401 57,940 57,940 Support Services 38,830
699 2,080 2,080 Capital Charges 700
- - - Recharges -
(6,695) 4,190 5,150 Transfers to/from Reserves (410)
115,374 148,010 260,420 NET EXPENDITURE (Including Recharges
and Capital Charges)
129,490
148,010
Employees (1,710)
Supplies and Services 1,090
Transport (10)
Fees and Charges 7,200
Support Services (19,110)
Capital Charges (1,380)
Transfers to/from Reserves (4,600)
129,490
148,010
Supplies and Services 104,250
Fees and Charges 7,200
260,420
REVENUE BUDGET
SERVICE Tourism
SERVICE DESCRIPTION This budget covers the provision of the Tourist information offices at Tenterden
and Ashford and the wider tourism activities. This budget also includes twinning
costs and museum grants.
SERVICE MANAGER Head of Cultural and Project Services
BUDGET MANAGER Tourism, Heritage and Nature Conservation Manager
ANALYSIS OF BUDGET VARIATIONS
COMMENTS
Base Budget 2014/15
Tourism income built incorrectly in 2014/15 budget, reduced for
2015/16
COMMENTS
Base Budget 2015/16
ANALYSIS OF BUDGET VARIATIONS
Base Budget 2014/15
£20,000 to support tourism & business in rural areas carried
forward from 2013/14 from NHB reserve and Space Station
2014/15 budget built incorrectly, income rduced to match
expected outturn
Outturn 2014/15 (P6 Forecast)
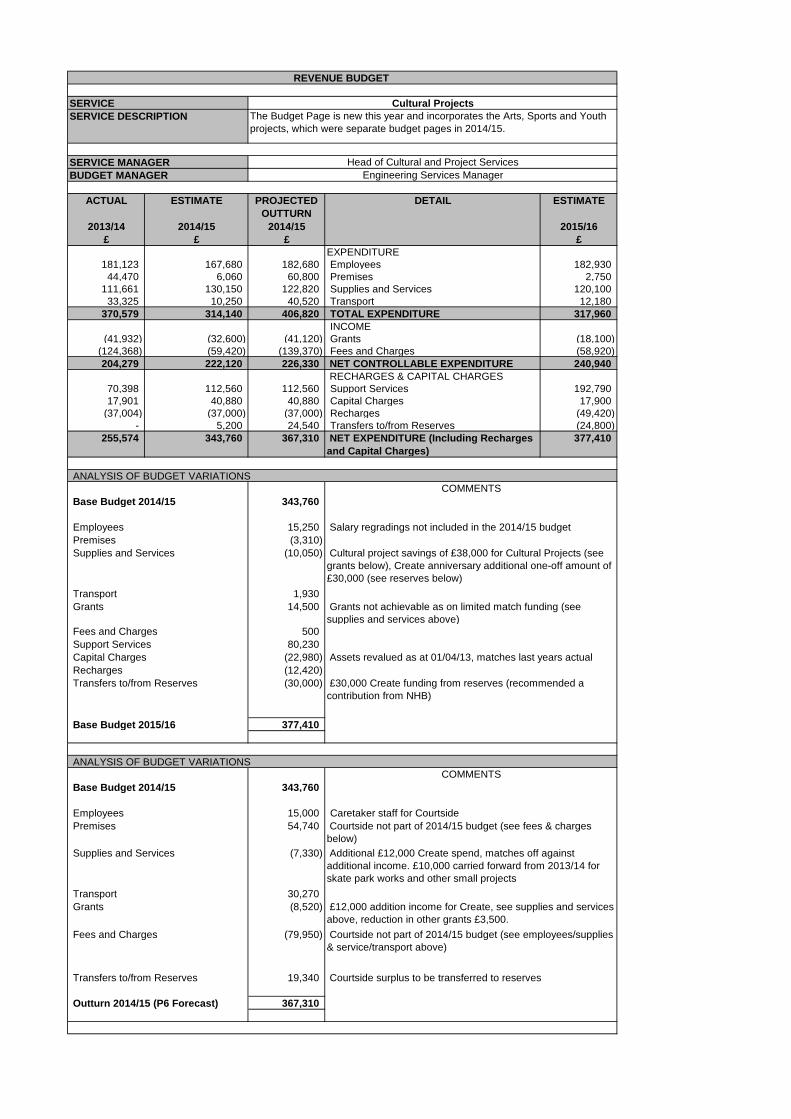
ACTUAL ESTIMATE PROJECTED
OUTTURN
DETAIL ESTIMATE
2013/14 2014/15 2014/15 2015/16
£ £ £ £
EXPENDITURE
181,123 167,680 182,680 Employees 182,930
44,470 6,060 60,800 Premises 2,750
111,661 130,150 122,820 Supplies and Services 120,100
33,325 10,250 40,520 Transport 12,180
370,579 314,140 406,820 TOTAL EXPENDITURE 317,960
INCOME
(41,932) (32,600) (41,120) Grants (18,100)
(124,368) (59,420) (139,370) Fees and Charges (58,920)
204,279 222,120 226,330 NET CONTROLLABLE EXPENDITURE 240,940
RECHARGES & CAPITAL CHARGES
70,398 112,560 112,560 Support Services 192,790
17,901 40,880 40,880 Capital Charges 17,900
(37,004) (37,000) (37,000) Recharges (49,420)
- 5,200 24,540 Transfers to/from Reserves (24,800)
255,574 343,760 367,310 NET EXPENDITURE (Including Recharges
and Capital Charges)
377,410
343,760
Employees 15,250
Premises (3,310)
Supplies and Services (10,050)
Transport 1,930
Grants 14,500
Fees and Charges 500
Support Services 80,230
Capital Charges (22,980)
Recharges (12,420)
Transfers to/from Reserves (30,000)
377,410
343,760
Employees 15,000 Caretaker staff for Courtside
Premises 54,740
Supplies and Services (7,330)
Transport 30,270
Grants (8,520)
Fees and Charges (79,950)
Transfers to/from Reserves 19,340
367,310
£30,000 Create funding from reserves (recommended a
contribution from NHB)
Courtside not part of 2014/15 budget (see fees & charges
below)
Courtside not part of 2014/15 budget (see employees/supplies
& service/transport above)
Assets revalued as at 01/04/13, matches last years actual
Additional £12,000 Create spend, matches off against
additional income. £10,000 carried forward from 2013/14 for
skate park works and other small projects
£12,000 addition income for Create, see supplies and services
above, reduction in other grants £3,500.
COMMENTS
REVENUE BUDGET
SERVICE Cultural Projects
SERVICE DESCRIPTION The Budget Page is new this year and incorporates the Arts, Sports and Youth
projects, which were separate budget pages in 2014/15.
SERVICE MANAGER Head of Cultural and Project Services
BUDGET MANAGER Engineering Services Manager
ANALYSIS OF BUDGET VARIATIONS
COMMENTS
Base Budget 2014/15
Salary regradings not included in the 2014/15 budget
Cultural project savings of £38,000 for Cultural Projects (see
grants below), Create anniversary additional one-off amount of
£30,000 (see reserves below)
Grants not achievable as on limited match funding (see
supplies and services above)
Base Budget 2015/16
ANALYSIS OF BUDGET VARIATIONS
Base Budget 2014/15
Courtside surplus to be transferred to reserves
Outturn 2014/15 (P6 Forecast)
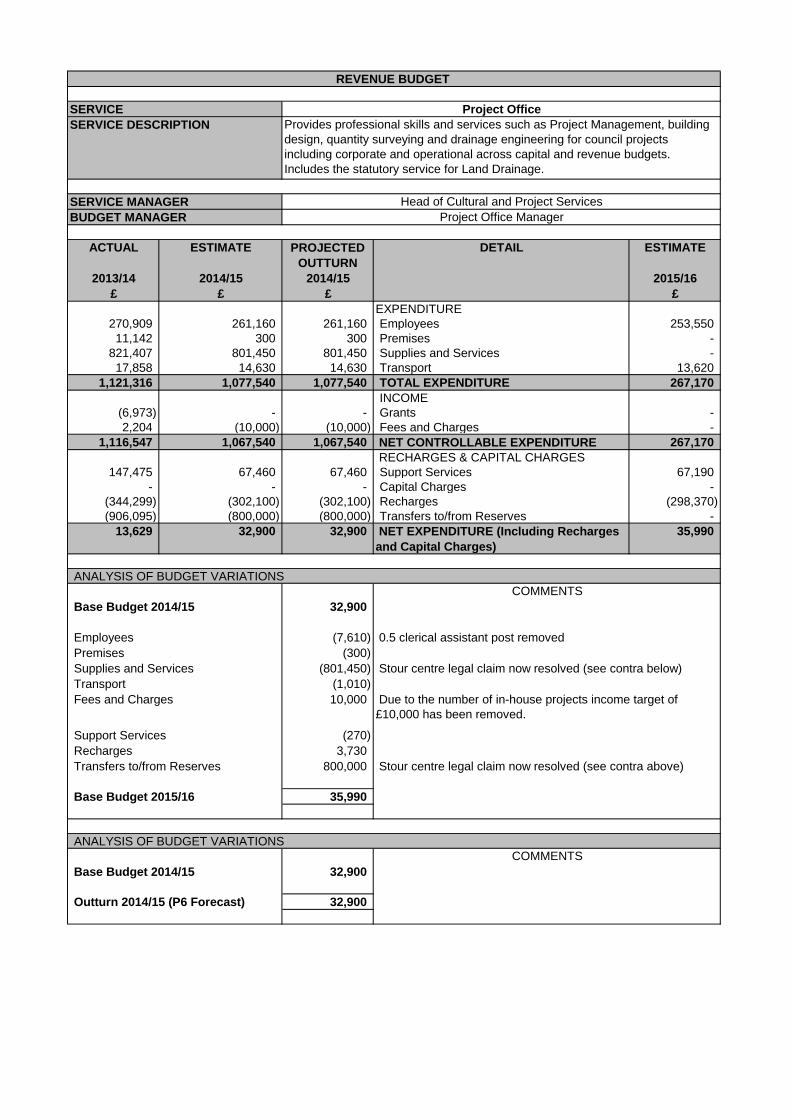
ACTUAL ESTIMATE PROJECTED
OUTTURN
DETAIL ESTIMATE
2013/14 2014/15 2014/15 2015/16
£ £ £ £
EXPENDITURE
270,909 261,160 261,160 Employees 253,550
11,142 300 300 Premises -
821,407 801,450 801,450 Supplies and Services -
17,858 14,630 14,630 Transport 13,620
1,121,316 1,077,540 1,077,540 TOTAL EXPENDITURE 267,170
INCOME
(6,973) - - Grants -
2,204 (10,000) (10,000) Fees and Charges -
1,116,547 1,067,540 1,067,540 NET CONTROLLABLE EXPENDITURE 267,170
RECHARGES & CAPITAL CHARGES
147,475 67,460 67,460 Support Services 67,190
- - - Capital Charges -
(344,299) (302,100) (302,100) Recharges (298,370)
(906,095) (800,000) (800,000) Transfers to/from Reserves -
13,629 32,900 32,900 NET EXPENDITURE (Including Recharges
and Capital Charges)
35,990
32,900
Employees (7,610)
Premises (300)
Supplies and Services (801,450)
Transport (1,010)
Fees and Charges 10,000
Support Services (270)
Recharges 3,730
Transfers to/from Reserves 800,000
35,990
32,900
32,900
Stour centre legal claim now resolved (see contra below)
Stour centre legal claim now resolved (see contra above)
Due to the number of in-house projects income target of
£10,000 has been removed.
REVENUE BUDGET
SERVICE Project Office
SERVICE DESCRIPTION Provides professional skills and services such as Project Management, building
design, quantity surveying and drainage engineering for council projects
including corporate and operational across capital and revenue budgets.
Includes the statutory service for Land Drainage.
SERVICE MANAGER Head of Cultural and Project Services
BUDGET MANAGER Project Office Manager
ANALYSIS OF BUDGET VARIATIONS
COMMENTS
Base Budget 2014/15
0.5 clerical assistant post removed
COMMENTS
Base Budget 2015/16
ANALYSIS OF BUDGET VARIATIONS
Base Budget 2014/15
Outturn 2014/15 (P6 Forecast)
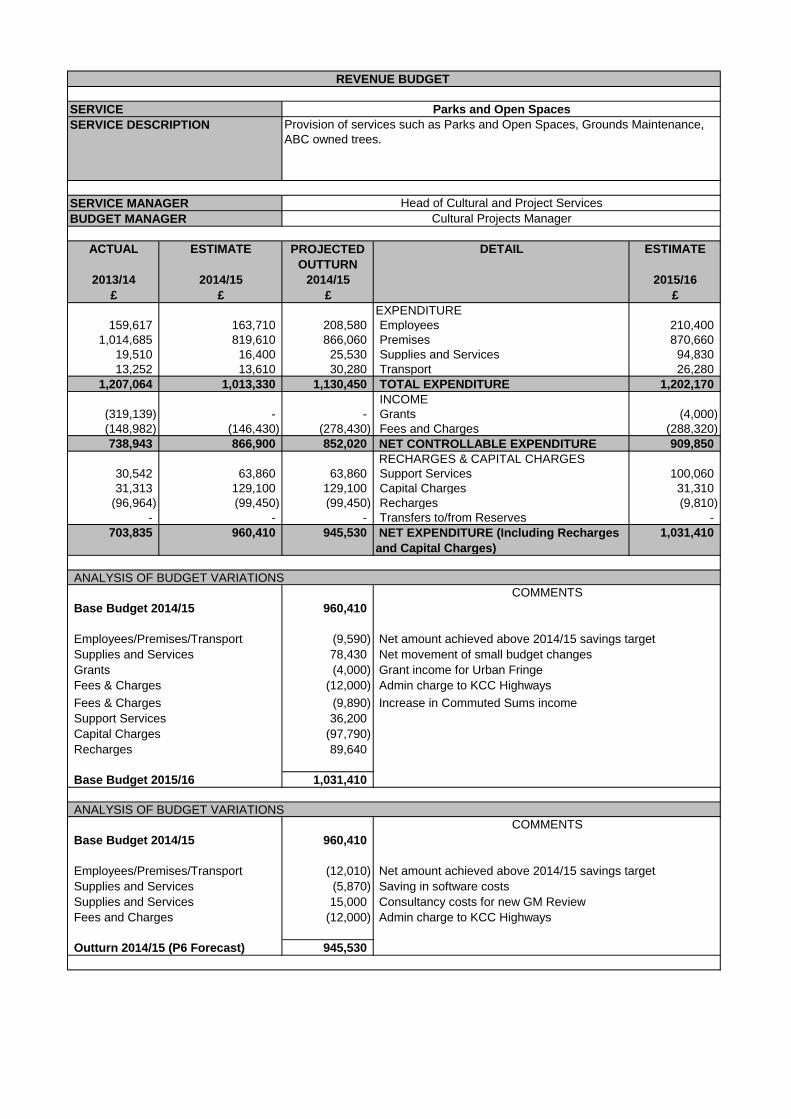
ACTUAL ESTIMATE PROJECTED
OUTTURN
DETAIL ESTIMATE
2013/14 2014/15 2014/15 2015/16
£ £ £ £
EXPENDITURE
159,617 163,710 208,580 Employees 210,400
1,014,685 819,610 866,060 Premises 870,660
19,510 16,400 25,530 Supplies and Services 94,830
13,252 13,610 30,280 Transport 26,280
1,207,064 1,013,330 1,130,450 TOTAL EXPENDITURE 1,202,170
INCOME
(319,139) - - Grants (4,000)
(148,982) (146,430) (278,430) Fees and Charges (288,320)
738,943 866,900 852,020 NET CONTROLLABLE EXPENDITURE 909,850
RECHARGES & CAPITAL CHARGES
30,542 63,860 63,860 Support Services 100,060
31,313 129,100 129,100 Capital Charges 31,310
(96,964) (99,450) (99,450) Recharges (9,810)
- - - Transfers to/from Reserves -
703,835 960,410 945,530 NET EXPENDITURE (Including Recharges
and Capital Charges)
1,031,410
960,410
Employees/Premises/Transport (9,590)
Supplies and Services 78,430
Grants (4,000)
Fees & Charges (12,000)
Fees & Charges (9,890) Increase in Commuted Sums income
Support Services 36,200
Capital Charges (97,790)
Recharges 89,640
1,031,410
960,410
Employees/Premises/Transport (12,010)
Supplies and Services (5,870)
Supplies and Services 15,000
Fees and Charges (12,000)
945,530
Net amount achieved above 2014/15 savings target
Admin charge to KCC Highways
Net amount achieved above 2014/15 savings target
Saving in software costs
Consultancy costs for new GM Review
ANALYSIS OF BUDGET VARIATIONS
SERVICE MANAGER Head of Cultural and Project Services
BUDGET MANAGER Cultural Projects Manager
REVENUE BUDGET
SERVICE Parks and Open Spaces
SERVICE DESCRIPTION Provision of services such as Parks and Open Spaces, Grounds Maintenance,
ABC owned trees.
COMMENTS
Base Budget 2014/15
Net movement of small budget changes
Grant income for Urban Fringe
Base Budget 2015/16
COMMENTS
ANALYSIS OF BUDGET VARIATIONS
Outturn 2014/15 (P6 Forecast)
Base Budget 2014/15
Admin charge to KCC Highways
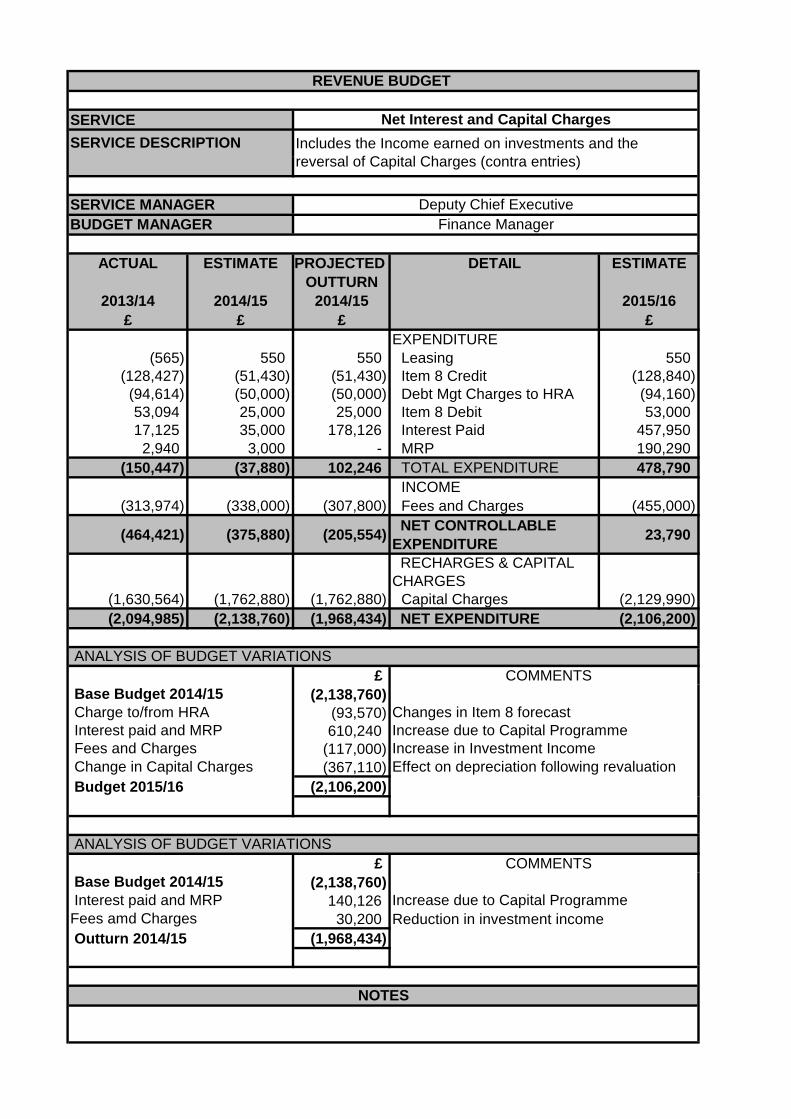
SERVICE
ACTUAL ESTIMATE PROJECTED DETAIL ESTIMATE
OUTTURN
2013/14 2014/15 2014/15 2015/16
£ £ £ £
EXPENDITURE
(565) 550 550 Leasing 550
(128,427) (51,430) (51,430) Item 8 Credit (128,840)
(94,614) (50,000) (50,000) Debt Mgt Charges to HRA (94,160)
53,094 25,000 25,000 Item 8 Debit 53,000
17,125 35,000 178,126 Interest Paid 457,950
2,940 3,000 - MRP 190,290
(150,447) (37,880) 102,246 TOTAL EXPENDITURE 478,790
INCOME
(313,974) (338,000) (307,800) Fees and Charges (455,000)
(464,421) (375,880) (205,554) NET CONTROLLABLE
EXPENDITURE 23,790
RECHARGES & CAPITAL
CHARGES
(1,630,564) (1,762,880) (1,762,880) Capital Charges (2,129,990)
(2,094,985) (2,138,760) (1,968,434) NET EXPENDITURE (2,106,200)
£ COMMENTS
(2,138,760)
(93,570)
610,240
(117,000)
(367,110)
Budget 2015/16 (2,106,200)
£ COMMENTS
(2,138,760)
140,126
30,200 Reduction in investment income
Outturn 2014/15 (1,968,434)
NOTES
Base Budget 2014/15
Interest paid and MRP Increase due to Capital Programme
Fees amd Charges
ANALYSIS OF BUDGET VARIATIONS
Fees and Charges
Effect on depreciation following revaluation
Interest paid and MRP Increase due to Capital Programme
Change in Capital Charges
Increase in Investment Income
ANALYSIS OF BUDGET VARIATIONS
Base Budget 2014/15
Charge to/from HRA Changes in Item 8 forecast
REVENUE BUDGET
Net Interest and Capital Charges
SERVICE DESCRIPTION Includes the Income earned on investments and the
reversal of Capital Charges (contra entries)
SERVICE MANAGER Deputy Chief Executive
BUDGET MANAGER Finance Manager
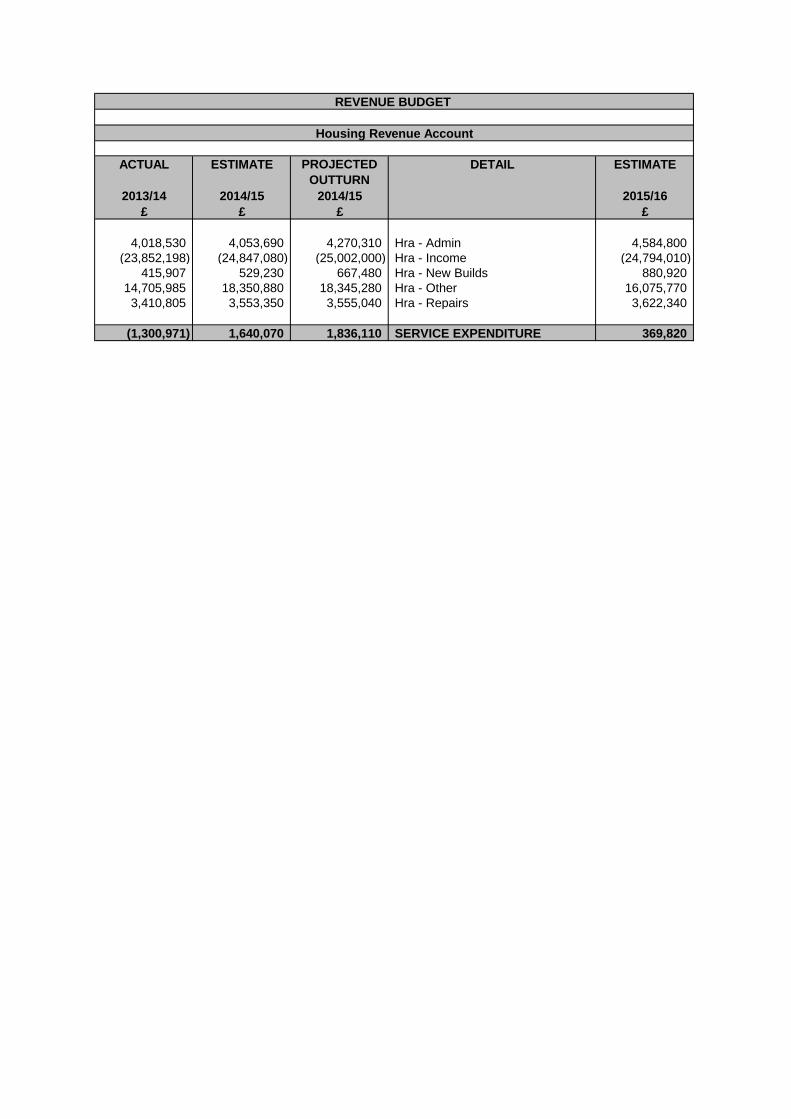
ACTUAL ESTIMATE PROJECTED
OUTTURN
DETAIL ESTIMATE
2013/14 2014/15 2014/15 2015/16
£ £ £ £
4,018,530 4,053,690 4,270,310 Hra - Admin 4,584,800
(23,852,198) (24,847,080) (25,002,000) Hra - Income (24,794,010)
415,907 529,230 667,480 Hra - New Builds 880,920
14,705,985 18,350,880 18,345,280 Hra - Other 16,075,770
3,410,805 3,553,350 3,555,040 Hra - Repairs 3,622,340
(1,300,971) 1,640,070 1,836,110 SERVICE EXPENDITURE 369,820
REVENUE BUDGET
Housing Revenue Account
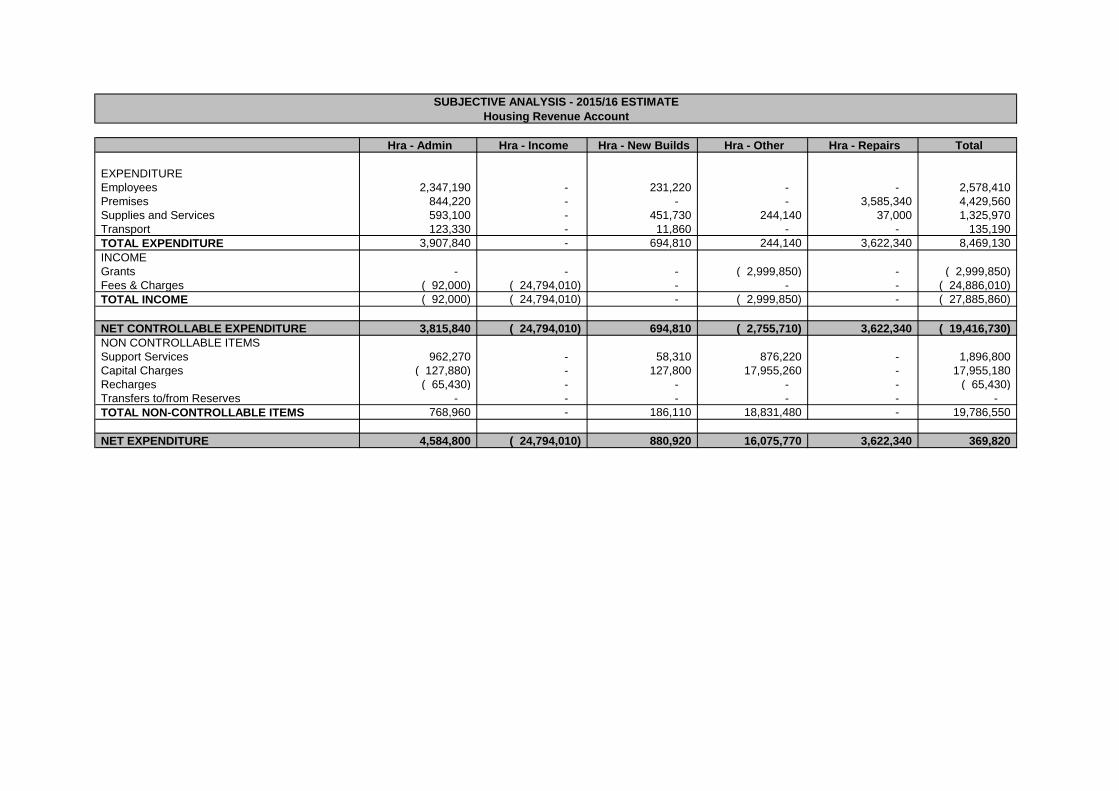
Hra - Admin Hra - Income Hra - New Builds Hra - Other Hra - Repairs Total
EXPENDITURE
Employees 2,347,190 - 231,220 - - 2,578,410
Premises 844,220 - - - 3,585,340 4,429,560
Supplies and Services 593,100 - 451,730 244,140 37,000 1,325,970
Transport 123,330 - 11,860 - - 135,190
TOTAL EXPENDITURE 3,907,840 - 694,810 244,140 3,622,340 8,469,130
INCOME
Grants - - - ( 2,999,850) - ( 2,999,850)
Fees & Charges ( 92,000) ( 24,794,010) - - - ( 24,886,010)
TOTAL INCOME ( 92,000) ( 24,794,010) - ( 2,999,850) - ( 27,885,860)
NET CONTROLLABLE EXPENDITURE 3,815,840 ( 24,794,010) 694,810 ( 2,755,710) 3,622,340 ( 19,416,730)
NON CONTROLLABLE ITEMS
Support Services 962,270 - 58,310 876,220 - 1,896,800
Capital Charges ( 127,880) - 127,800 17,955,260 - 17,955,180
Recharges ( 65,430) - - - - ( 65,430)
Transfers to/from Reserves - - - - - -
TOTAL NON-CONTROLLABLE ITEMS 768,960 - 186,110 18,831,480 - 19,786,550
NET EXPENDITURE 4,584,800 ( 24,794,010) 880,920 16,075,770 3,622,340 369,820
SUBJECTIVE ANALYSIS - 2015/16 ESTIMATE
Housing Revenue Account
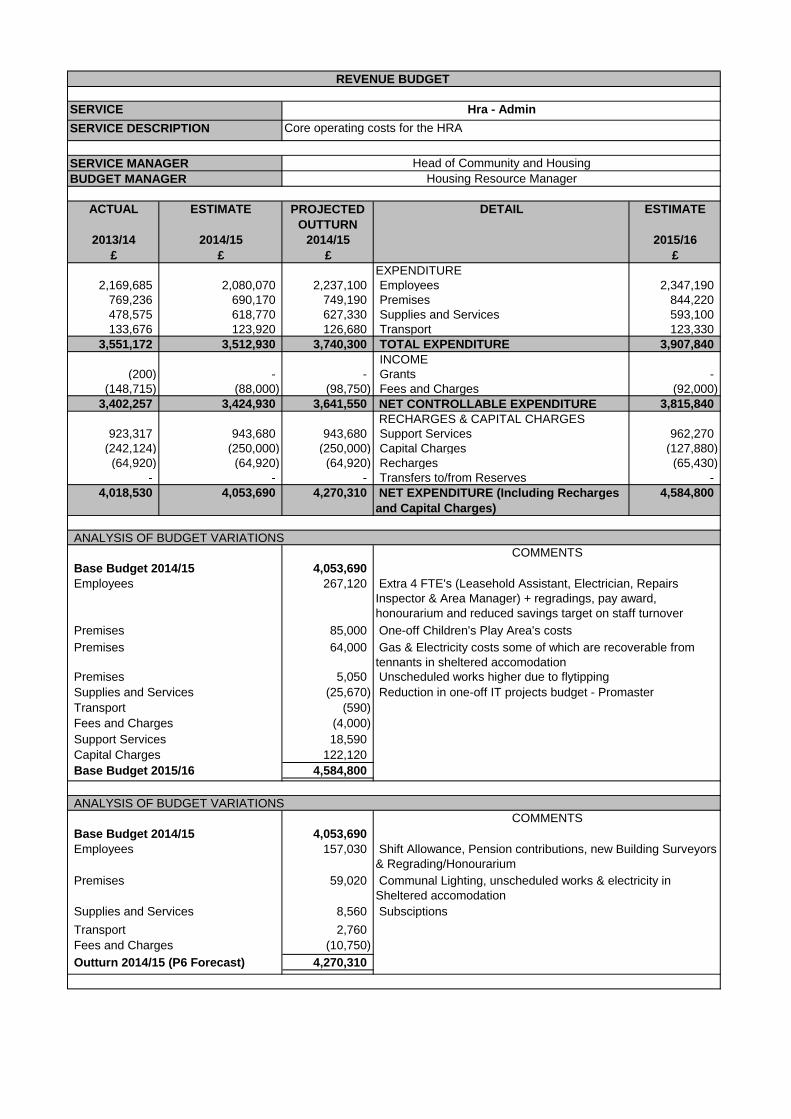
ACTUAL ESTIMATE PROJECTED
OUTTURN
DETAIL ESTIMATE
2013/14 2014/15 2014/15 2015/16
£ £ £ £
EXPENDITURE
2,169,685 2,080,070 2,237,100 Employees 2,347,190
769,236 690,170 749,190 Premises 844,220
478,575 618,770 627,330 Supplies and Services 593,100
133,676 123,920 126,680 Transport 123,330
3,551,172 3,512,930 3,740,300 TOTAL EXPENDITURE 3,907,840
INCOME
(200) - - Grants -
(148,715) (88,000) (98,750) Fees and Charges (92,000)
3,402,257 3,424,930 3,641,550 NET CONTROLLABLE EXPENDITURE 3,815,840
RECHARGES & CAPITAL CHARGES
923,317 943,680 943,680 Support Services 962,270
(242,124) (250,000) (250,000) Capital Charges (127,880)
(64,920) (64,920) (64,920) Recharges (65,430)
- - - Transfers to/from Reserves -
4,018,530 4,053,690 4,270,310 NET EXPENDITURE (Including Recharges
and Capital Charges)
4,584,800
4,053,690
Employees 267,120
Premises 85,000
Premises 64,000
Premises 5,050
Supplies and Services (25,670)
Transport (590)
Fees and Charges (4,000)
Support Services 18,590
Capital Charges 122,120
4,584,800
4,053,690
Employees 157,030
Premises 59,020
Supplies and Services 8,560
Transport 2,760
Fees and Charges (10,750)
4,270,310
ANALYSIS OF BUDGET VARIATIONS
COMMENTS
Unscheduled works higher due to flytipping
Gas & Electricity costs some of which are recoverable from
tennants in sheltered accomodation
Subsciptions
REVENUE BUDGET
SERVICE Hra - Admin
SERVICE DESCRIPTION Core operating costs for the HRA
SERVICE MANAGER Head of Community and Housing
BUDGET MANAGER Housing Resource Manager
ANALYSIS OF BUDGET VARIATIONS
COMMENTS
Base Budget 2014/15
Base Budget 2015/16
Base Budget 2014/15
Extra 4 FTE's (Leasehold Assistant, Electrician, Repairs
Inspector & Area Manager) + regradings, pay award,
honourarium and reduced savings target on staff turnover
One-off Children's Play Area's costs
Reduction in one-off IT projects budget - Promaster
Outturn 2014/15 (P6 Forecast)
Shift Allowance, Pension contributions, new Building Surveyors
& Regrading/Honourarium
Communal Lighting, unscheduled works & electricity in
Sheltered accomodation
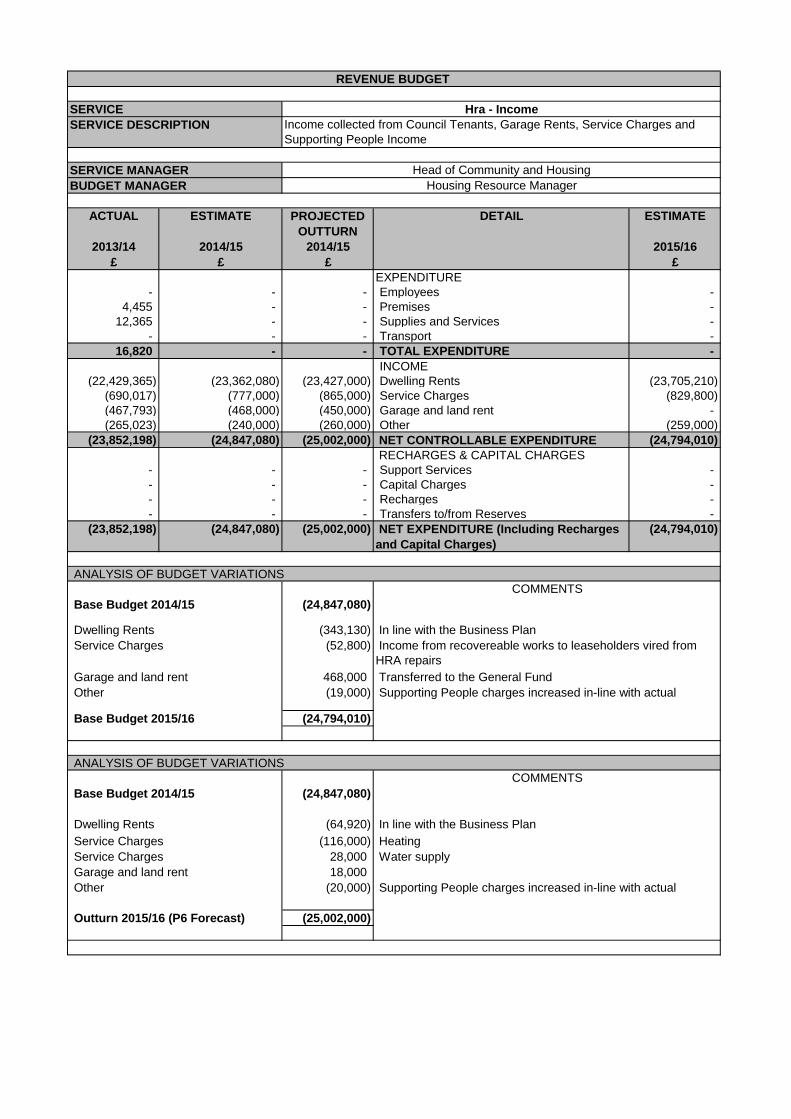
ACTUAL ESTIMATE PROJECTED
OUTTURN
DETAIL ESTIMATE
2013/14 2014/15 2014/15 2015/16
£ £ £ £
EXPENDITURE
- - - Employees -
4,455 - - Premises -
12,365 - - Supplies and Services -
- - - Transport -
16,820 - - TOTAL EXPENDITURE -
INCOME
(22,429,365) (23,362,080) (23,427,000) Dwelling Rents (23,705,210)
(690,017) (777,000) (865,000) Service Charges (829,800)
(467,793) (468,000) (450,000) Garage and land rent -
(265,023) (240,000) (260,000) Other (259,000)
(23,852,198) (24,847,080) (25,002,000) NET CONTROLLABLE EXPENDITURE (24,794,010)
RECHARGES & CAPITAL CHARGES
- - - Support Services -
- - - Capital Charges -
- - - Recharges -
- - - Transfers to/from Reserves -
(23,852,198) (24,847,080) (25,002,000) NET EXPENDITURE (Including Recharges
and Capital Charges)
(24,794,010)
(24,847,080)
Dwelling Rents (343,130)
Service Charges (52,800)
Garage and land rent 468,000
Other (19,000)
(24,794,010)
(24,847,080)
Dwelling Rents (64,920)
Service Charges (116,000)
Service Charges 28,000
Garage and land rent 18,000
Other (20,000)
(25,002,000)
SERVICE MANAGER Head of Community and Housing
BUDGET MANAGER Housing Resource Manager
REVENUE BUDGET
SERVICE Hra - Income
SERVICE DESCRIPTION Income collected from Council Tenants, Garage Rents, Service Charges and
Supporting People Income
In line with the Business Plan
Income from recovereable works to leaseholders vired from
HRA repairs
Transferred to the General Fund
Supporting People charges increased in-line with actual
ANALYSIS OF BUDGET VARIATIONS
COMMENTS
Base Budget 2014/15
ANALYSIS OF BUDGET VARIATIONS
COMMENTS
Base Budget 2014/15
Base Budget 2015/16
Outturn 2015/16 (P6 Forecast)
In line with the Business Plan
Supporting People charges increased in-line with actual
Heating
Water supply
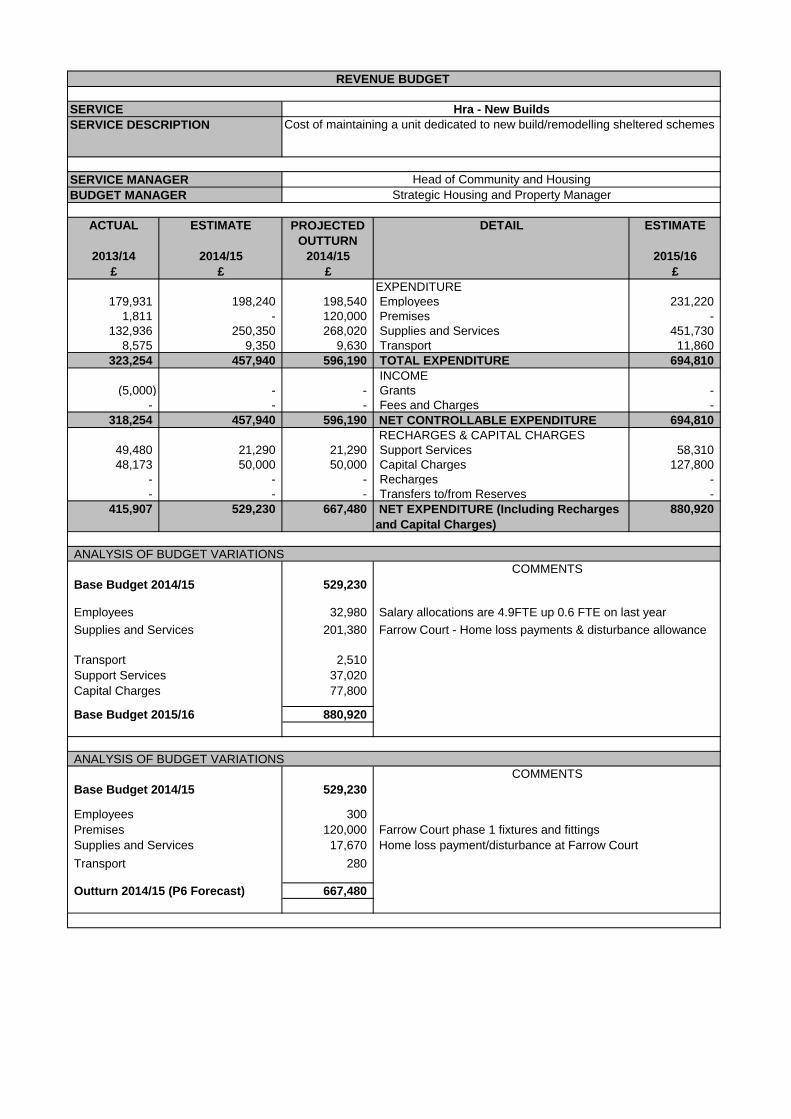
ACTUAL ESTIMATE PROJECTED
OUTTURN
DETAIL ESTIMATE
2013/14 2014/15 2014/15 2015/16
£ £ £ £
EXPENDITURE
179,931 198,240 198,540 Employees 231,220
1,811 - 120,000 Premises -
132,936 250,350 268,020 Supplies and Services 451,730
8,575 9,350 9,630 Transport 11,860
323,254 457,940 596,190 TOTAL EXPENDITURE 694,810
INCOME
(5,000) - - Grants -
- - - Fees and Charges -
318,254 457,940 596,190 NET CONTROLLABLE EXPENDITURE 694,810
RECHARGES & CAPITAL CHARGES
49,480 21,290 21,290 Support Services 58,310
48,173 50,000 50,000 Capital Charges 127,800
- - - Recharges -
- - - Transfers to/from Reserves -
415,907 529,230 667,480 NET EXPENDITURE (Including Recharges
and Capital Charges)
880,920
529,230
Employees 32,980
Supplies and Services 201,380
Transport 2,510
Support Services 37,020
Capital Charges 77,800
880,920
529,230
Employees 300
Premises 120,000
Supplies and Services 17,670
Transport 280
667,480
COMMENTS
Farrow Court - Home loss payments & disturbance allowance
REVENUE BUDGET
SERVICE Hra - New Builds
SERVICE DESCRIPTION Cost of maintaining a unit dedicated to new build/remodelling sheltered schemes
SERVICE MANAGER Head of Community and Housing
BUDGET MANAGER Strategic Housing and Property Manager
ANALYSIS OF BUDGET VARIATIONS
COMMENTS
Base Budget 2014/15
Salary allocations are 4.9FTE up 0.6 FTE on last year
Base Budget 2015/16
ANALYSIS OF BUDGET VARIATIONS
Base Budget 2014/15
Farrow Court phase 1 fixtures and fittings
Home loss payment/disturbance at Farrow Court
Outturn 2014/15 (P6 Forecast)
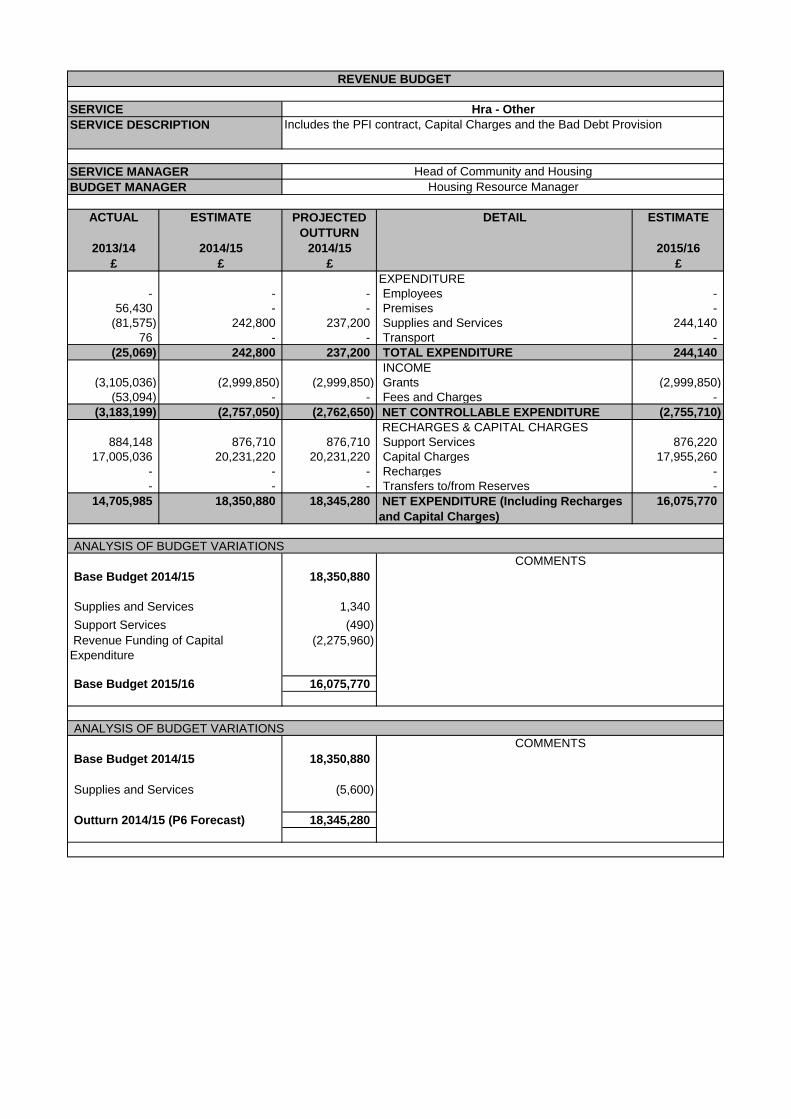
ACTUAL ESTIMATE PROJECTED
OUTTURN
DETAIL ESTIMATE
2013/14 2014/15 2014/15 2015/16
£ £ £ £
EXPENDITURE
- - - Employees -
56,430 - - Premises -
(81,575) 242,800 237,200 Supplies and Services 244,140
76 - - Transport -
(25,069) 242,800 237,200 TOTAL EXPENDITURE 244,140
INCOME
(3,105,036) (2,999,850) (2,999,850) Grants (2,999,850)
(53,094) - - Fees and Charges -
(3,183,199) (2,757,050) (2,762,650) NET CONTROLLABLE EXPENDITURE (2,755,710)
RECHARGES & CAPITAL CHARGES
884,148 876,710 876,710 Support Services 876,220
17,005,036 20,231,220 20,231,220 Capital Charges 17,955,260
- - - Recharges -
- - - Transfers to/from Reserves -
14,705,985 18,350,880 18,345,280 NET EXPENDITURE (Including Recharges
and Capital Charges)
16,075,770
18,350,880
Supplies and Services 1,340
Support Services (490)
(2,275,960)
16,075,770
18,350,880
Supplies and Services (5,600)
18,345,280
Revenue Funding of Capital
Expenditure
COMMENTS
REVENUE BUDGET
SERVICE Hra - Other
SERVICE DESCRIPTION Includes the PFI contract, Capital Charges and the Bad Debt Provision
SERVICE MANAGER Head of Community and Housing
BUDGET MANAGER Housing Resource Manager
ANALYSIS OF BUDGET VARIATIONS
COMMENTS
Base Budget 2014/15
Base Budget 2014/15
Base Budget 2015/16
ANALYSIS OF BUDGET VARIATIONS
Outturn 2014/15 (P6 Forecast)
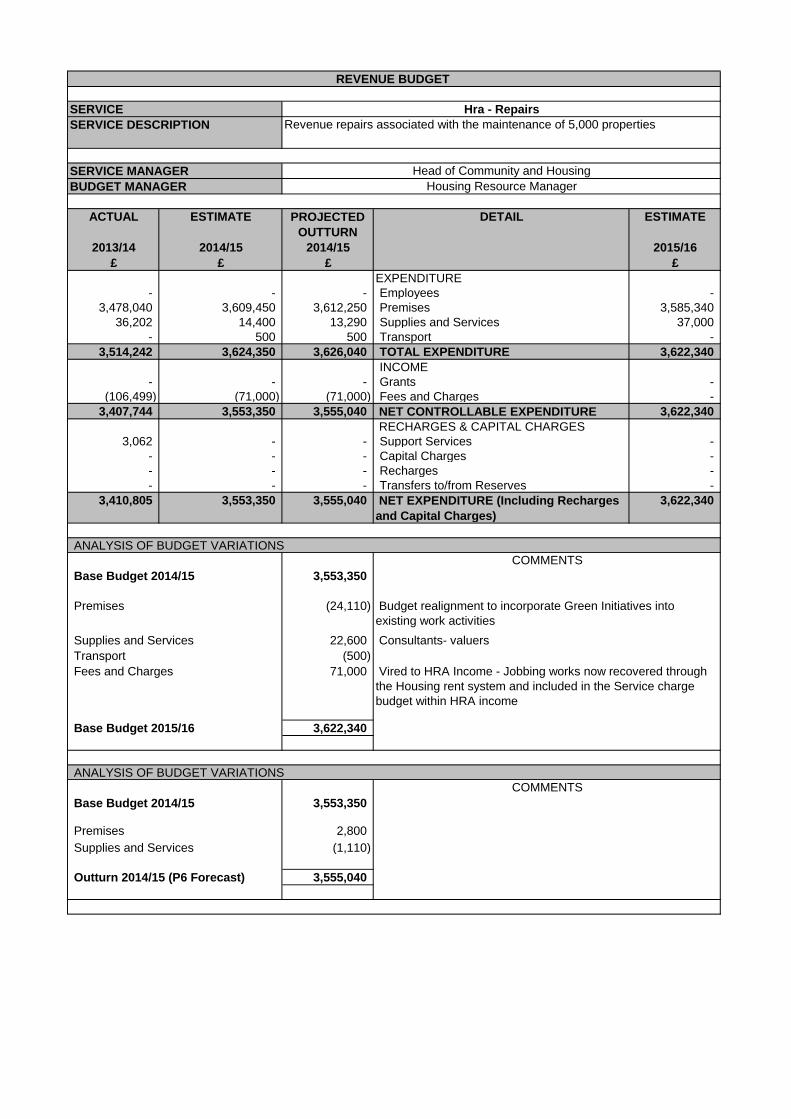
ACTUAL ESTIMATE PROJECTED
OUTTURN
DETAIL ESTIMATE
2013/14 2014/15 2014/15 2015/16
£ £ £ £
EXPENDITURE
- - - Employees -
3,478,040 3,609,450 3,612,250 Premises 3,585,340
36,202 14,400 13,290 Supplies and Services 37,000
- 500 500 Transport -
3,514,242 3,624,350 3,626,040 TOTAL EXPENDITURE 3,622,340
INCOME
- - - Grants -
(106,499) (71,000) (71,000) Fees and Charges -
3,407,744 3,553,350 3,555,040 NET CONTROLLABLE EXPENDITURE 3,622,340
RECHARGES & CAPITAL CHARGES
3,062 - - Support Services -
- - - Capital Charges -
- - - Recharges -
- - - Transfers to/from Reserves -
3,410,805 3,553,350 3,555,040 NET EXPENDITURE (Including Recharges
and Capital Charges)
3,622,340
3,553,350
Premises (24,110)
Supplies and Services 22,600
Transport (500)
Fees and Charges 71,000
3,622,340
3,553,350
Premises 2,800
Supplies and Services (1,110)
3,555,040
COMMENTS
Consultants- valuers
Vired to HRA Income - Jobbing works now recovered through
the Housing rent system and included in the Service charge
budget within HRA income
REVENUE BUDGET
SERVICE Hra - Repairs
SERVICE DESCRIPTION Revenue repairs associated with the maintenance of 5,000 properties
SERVICE MANAGER Head of Community and Housing
BUDGET MANAGER Housing Resource Manager
ANALYSIS OF BUDGET VARIATIONS
COMMENTS
Base Budget 2014/15
Budget realignment to incorporate Green Initiatives into
existing work activities
Base Budget 2015/16
ANALYSIS OF BUDGET VARIATIONS
Base Budget 2014/15
Outturn 2014/15 (P6 Forecast)

2013/14
Actuals
2014/15
Original
2014/15
Current
2015/16
Estimate
£'000's £'000's £'000's £'000's
Insulation 64 80 50 350
Central Heating 1,071 958 700 1,162
Structural Works/Underpinning 1 20 20 20
Adaptations For The Disabled 317 320 400 435
Structural Works 0 15 15 20
Re-Roofing 385 717 640 625
P.V.C.U Gutters/Fascias/Soffit 354 261 261 339
Water Mains Replacement 83 298 298 117
Kitchen Refurbishments 1,004 1,269 850 1,269
Rewiring 429 394 450 224
Bathroom Refurbishment 700 501 650 653
Environmental Improvements (2) 70 70 0
Remodelling Sheltered Accom. 155 150 150 150
Bedsit Conversions 8 15 15 0
External Walls 7 170 265 185
Fire Safety Works 13 25 25 30
Digital Tv Upgrades (30) 10 10 10
4,560 5,273 4,868 5,589
Financed By:
Major Repairs Allowance (4,526) (5,200) (5,200) (5,192)
Major Repairs Reserve (34) (73) 332 (397)
Summary of HRA Capital Works

Original
Budget
Current
Budget
Previous
years2014/15 2015/16 2016/17 2017/18
£ £ £ £ £ £ £
Community & Housing
Repairs and renewals funded from capital (see R&R Schedule) 2,000,000 2,000,000 111,840 309,900 708,160 512,770 357,330
Acquisition of Property 6,000,000 6,000,000 0 2,000,000 2,000,000 2,000,000 0
Property Company Financing (£2m approved to date) 10,000,000 10,000,000 0 2,000,000 2,000,000 3,000,000 3,000,000
International House Works 650,000 650,000 0 325,000 325,000 0 0
Ellingham Industrial Estate 400,000 400,000 0 100,000 300,000 0 0
Commercial Quarter Enabling Works 120,000 120,000 0 90,000 30,000 0 0
Parking Machine Replacement 270,000 270,000 0 90,000 90,000 90,000 0
Mandatory Disabled Facility Grants
Expenditure 1,716,943 1,716,943 0 485,530 410,471 410,471 410,471
External Funding (1,281,884) (1,281,884) 0 (320,471) (320,471) (320,471) (320,471)
435,059 435,059 0 165,059 90,000 90,000 90,000
Total - Community & Housing 21,156,943 21,156,943 111,840 5,400,430 5,863,631 6,013,241 3,767,801
Communications & Technology
Income Management System 81,000 81,000 0 40,000 41,000 0 0
Total Communications & Technology 81,000 81,000 0 40,000 41,000 0 0
Corporate, Strategy & Personnel
Single Grants Gateway Fund 300,000 300,000 0 75,000 75,000 75,000 75,000
Total - Corporate, Strategy & Personnel 300,000 300,000 0 75,000 75,000 75,000 75,000
Culture & the Environment
Stour Centre Regeneration Project (Spin Studio) 170,000 170,000 0 85,000 85,000 0 0
Stour Centre Regeneration Feasibility Project (JV)
Expenditure 362,000 362,000 0 181,000 181,000 0 0
External Funding (256,000) (256,000) 0 (128,000) (128,000) 0 0
106,000 106,000 0 53,000 53,000 0 0
Town Centre Signage 0 0 0
Market Gates and Associated Works 20,000 20,000 0 4,000 0 16,000 0
Willesborough St. Mary's Community Centre 100,000 100,000 0 0 100,000 0 0
Park Farm S & E (MUGA)
Expenditure 100,000 100,000 0 0 100,000 0 0
External Funding (100,000) (100,000) 0 0 (100,000) 0 0
0 0 0 0 0 0 0
Park Farm S & E (Bridge Field Play & Amenities)
Expenditure 650,000 650,000 0 0 100,000 550,000 0
External Funding (650,000) (650,000) 0 0 (100,000) (550,000) 0
0 0 0 0 0 0 0
Park Farm S & E (Cheeseman Green Facilities)
Expenditure 650,000 650,000 0 0 0 0 650,000
External Funding (650,000) (650,000) 0 0 0 0 (650,000)
0 0 0 0 0 0 0
Repton Park Community Centre
Expenditure 1,208,365 1,208,365 15,585 10,000 1,000,000 182,780 0
External Funding (1,208,365) (1,208,365) (15,585) (10,000) (1,000,000) (182,780) 0
0 0 0 0 0 0 0
Town Centre Signage
Expenditure 50,000 77,000 0 40,000 37,000 0 0
External Funding (50,000) (77,000) 0 (40,000) (37,000) 0
0 0 0 0 0 0 0
Brisley Farm - Community Leisure
Expenditure 133,000 133,000 0 0 0 10,000 123,000
External Funding (133,000) (133,000) 0 0 0 (10,000) (123,000)
0 0 0 0 0 0 0
Hothfield Visitors' Centre 24,815 327,000 0 124,000 203,000 0 0
Brisley Farm - Play Provision
Expenditure 130,000 300,000 0 0 300,000 0 0
External Funding (130,000) (300,000) 0 0 (300,000) 0 0
0 0 0 0 0 0 0
Stour Centre CHP, Roofing & PV Panels
Expenditure 2,060,000 2,060,000 900,320 550,000 609,680 0 0
External Funding 0 0 0 0 0 0 0
2,060,000 2,060,000 900,320 550,000 609,680 0 0
Total Culture & the Environment 5,658,180 6,157,365 915,905 994,000 2,715,680 758,780 773,000
General Fund Total 27,196,123 27,695,308 1,027,745 6,509,430 8,695,311 6,847,021 4,615,801
HRA Capital Works
Programmed Works 0 0 0 5,267,000 5,699,000 5,062,000 5,169,000
Farrow Court Redevelopment (inc Sheltered Housing)
Expenditure 15,400,000 15,400,000 1,885,656 4,500,000 4,507,172 4,507,172 0
External Funding (4,060,000) (4,060,000) (543,845) (531,945) (1,492,105) (1,492,105) 0
11,340,000 11,340,000 1,341,811 3,968,055 3,015,067 3,015,067 0
HRA New Build Phase 4
Expenditure 5,804,000 5,804,000 901,588 2,602,000 2,300,412 0 0
External Funding (901,000) (901,000) (457,114) (221,943) (221,943) 0 0
4,903,000 4,903,000 444,474 2,380,057 2,078,469 0 0
Affordable Housing (Charing) 3,050,000 3,050,000 0 762,500 2,287,500 0 0
Total HRA 24,254,000 24,254,000 2,787,244 13,131,500 14,794,084 9,569,172 5,169,000
Total Capital Spend 51,450,123 51,949,308 3,814,989 19,640,930 23,489,395 16,416,193 9,784,801
Capital Financing
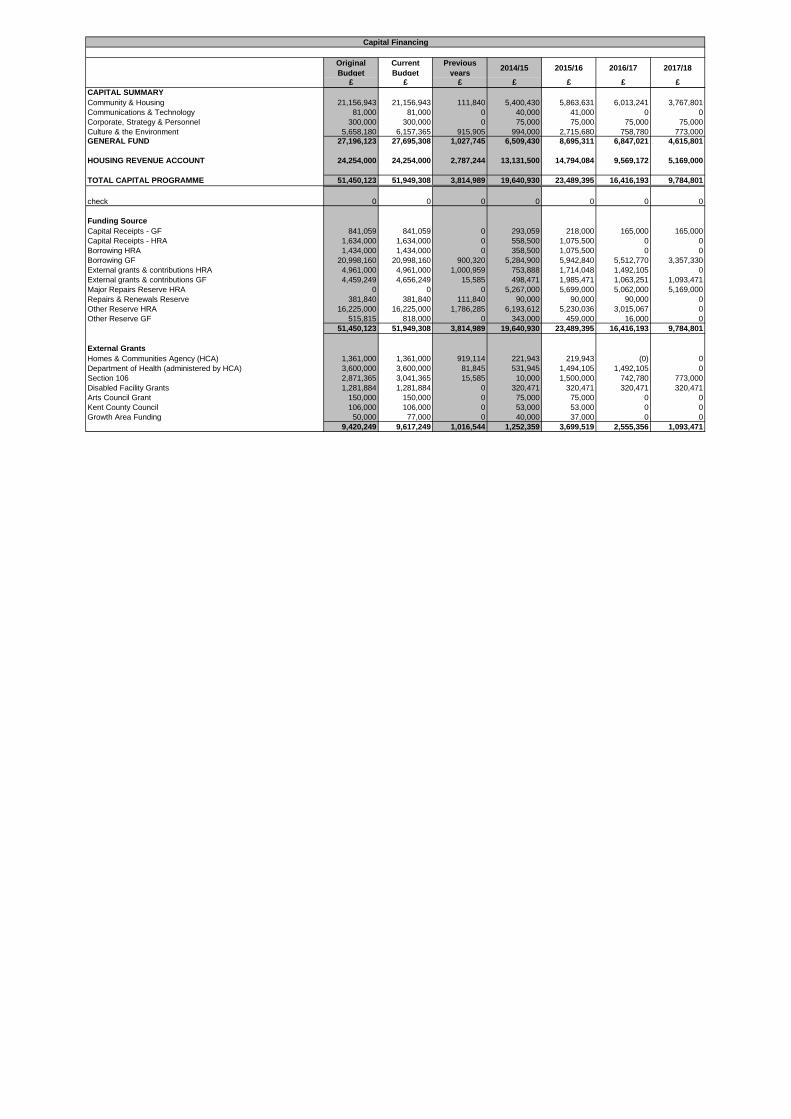
Original
Budget
Current
Budget
Previous
years2014/15 2015/16 2016/17 2017/18
£ £ £ £ £ £ £
Capital Financing
CAPITAL SUMMARY
Community & Housing 21,156,943 21,156,943 111,840 5,400,430 5,863,631 6,013,241 3,767,801
Communications & Technology 81,000 81,000 0 40,000 41,000 0 0
Corporate, Strategy & Personnel 300,000 300,000 0 75,000 75,000 75,000 75,000
Culture & the Environment 5,658,180 6,157,365 915,905 994,000 2,715,680 758,780 773,000
GENERAL FUND 27,196,123 27,695,308 1,027,745 6,509,430 8,695,311 6,847,021 4,615,801
HOUSING REVENUE ACCOUNT 24,254,000 24,254,000 2,787,244 13,131,500 14,794,084 9,569,172 5,169,000
TOTAL CAPITAL PROGRAMME 51,450,123 51,949,308 3,814,989 19,640,930 23,489,395 16,416,193 9,784,801
check 0 0 0 0 0 0 0
Funding Source
Capital Receipts - GF 841,059 841,059 0 293,059 218,000 165,000 165,000
Capital Receipts - HRA 1,634,000 1,634,000 0 558,500 1,075,500 0 0
Borrowing HRA 1,434,000 1,434,000 0 358,500 1,075,500 0 0
Borrowing GF 20,998,160 20,998,160 900,320 5,284,900 5,942,840 5,512,770 3,357,330
External grants & contributions HRA 4,961,000 4,961,000 1,000,959 753,888 1,714,048 1,492,105 0
External grants & contributions GF 4,459,249 4,656,249 15,585 498,471 1,985,471 1,063,251 1,093,471
Major Repairs Reserve HRA 0 0 0 5,267,000 5,699,000 5,062,000 5,169,000
Repairs & Renewals Reserve 381,840 381,840 111,840 90,000 90,000 90,000 0
Other Reserve HRA 16,225,000 16,225,000 1,786,285 6,193,612 5,230,036 3,015,067 0
Other Reserve GF 515,815 818,000 0 343,000 459,000 16,000 0
51,450,123 51,949,308 3,814,989 19,640,930 23,489,395 16,416,193 9,784,801
External Grants
Homes & Communities Agency (HCA) 1,361,000 1,361,000 919,114 221,943 219,943 (0) 0
Department of Health (administered by HCA) 3,600,000 3,600,000 81,845 531,945 1,494,105 1,492,105 0
Section 106 2,871,365 3,041,365 15,585 10,000 1,500,000 742,780 773,000
Disabled Facility Grants 1,281,884 1,281,884 0 320,471 320,471 320,471 320,471
Arts Council Grant 150,000 150,000 0 75,000 75,000 0 0
Kent County Council 106,000 106,000 0 53,000 53,000 0 0
Growth Area Funding 50,000 77,000 0 40,000 37,000 0 0
9,420,249 9,617,249 1,016,544 1,252,359 3,699,519 2,555,356 1,093,471
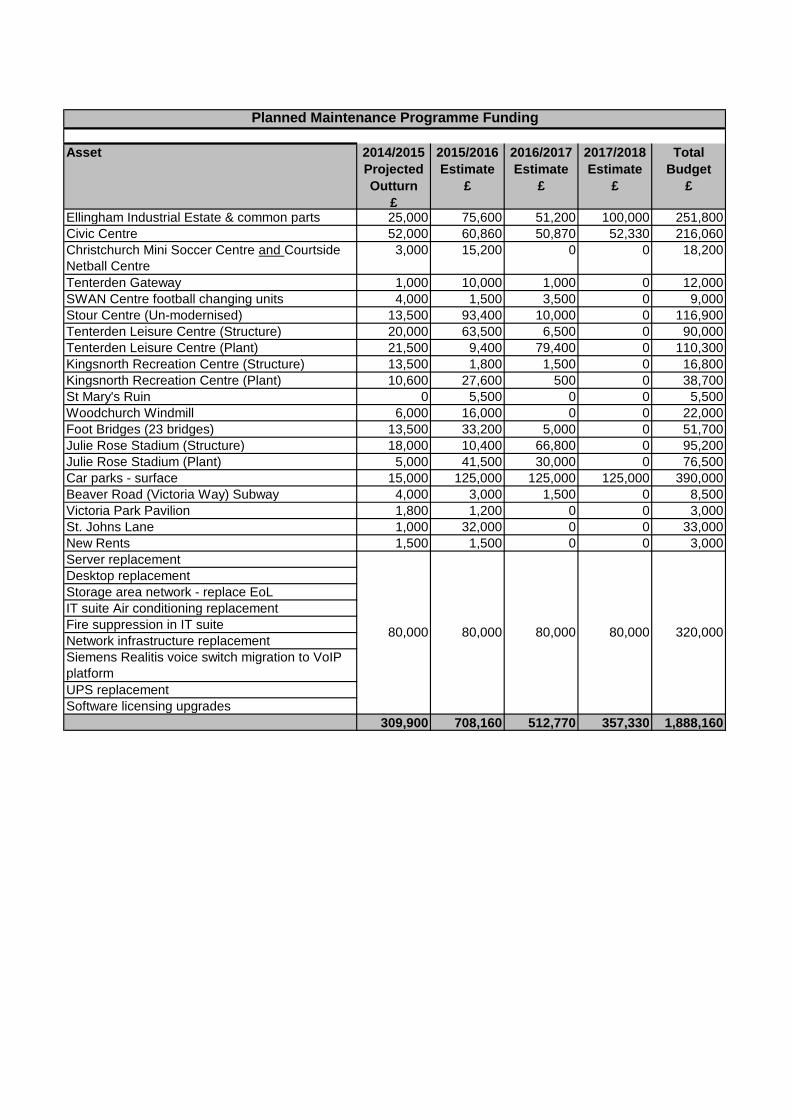
Asset 2014/2015
Projected
Outturn
£
2015/2016
Estimate
£
2016/2017
Estimate
£
2017/2018
Estimate
£
Total
Budget
£
Ellingham Industrial Estate & common parts 25,000 75,600 51,200 100,000 251,800
Civic Centre 52,000 60,860 50,870 52,330 216,060
Christchurch Mini Soccer Centre and Courtside
Netball Centre
3,000 15,200 0 0 18,200
Tenterden Gateway 1,000 10,000 1,000 0 12,000
SWAN Centre football changing units 4,000 1,500 3,500 0 9,000
Stour Centre (Un-modernised) 13,500 93,400 10,000 0 116,900
Tenterden Leisure Centre (Structure) 20,000 63,500 6,500 0 90,000
Tenterden Leisure Centre (Plant) 21,500 9,400 79,400 0 110,300
Kingsnorth Recreation Centre (Structure) 13,500 1,800 1,500 0 16,800
Kingsnorth Recreation Centre (Plant) 10,600 27,600 500 0 38,700
St Mary's Ruin 0 5,500 0 0 5,500
Woodchurch Windmill 6,000 16,000 0 0 22,000
Foot Bridges (23 bridges) 13,500 33,200 5,000 0 51,700
Julie Rose Stadium (Structure) 18,000 10,400 66,800 0 95,200
Julie Rose Stadium (Plant) 5,000 41,500 30,000 0 76,500
Car parks - surface 15,000 125,000 125,000 125,000 390,000
Beaver Road (Victoria Way) Subway 4,000 3,000 1,500 0 8,500
Victoria Park Pavilion 1,800 1,200 0 0 3,000
St. Johns Lane 1,000 32,000 0 0 33,000
New Rents 1,500 1,500 0 0 3,000
Server replacement
Desktop replacement
Storage area network - replace EoL
IT suite Air conditioning replacement
Fire suppression in IT suite
Network infrastructure replacement
Siemens Realitis voice switch migration to VoIP
platform
UPS replacement
Software licensing upgrades
309,900 708,160 512,770 357,330 1,888,160
320,00080,000 80,000 80,000 80,000
Planned Maintenance Programme Funding
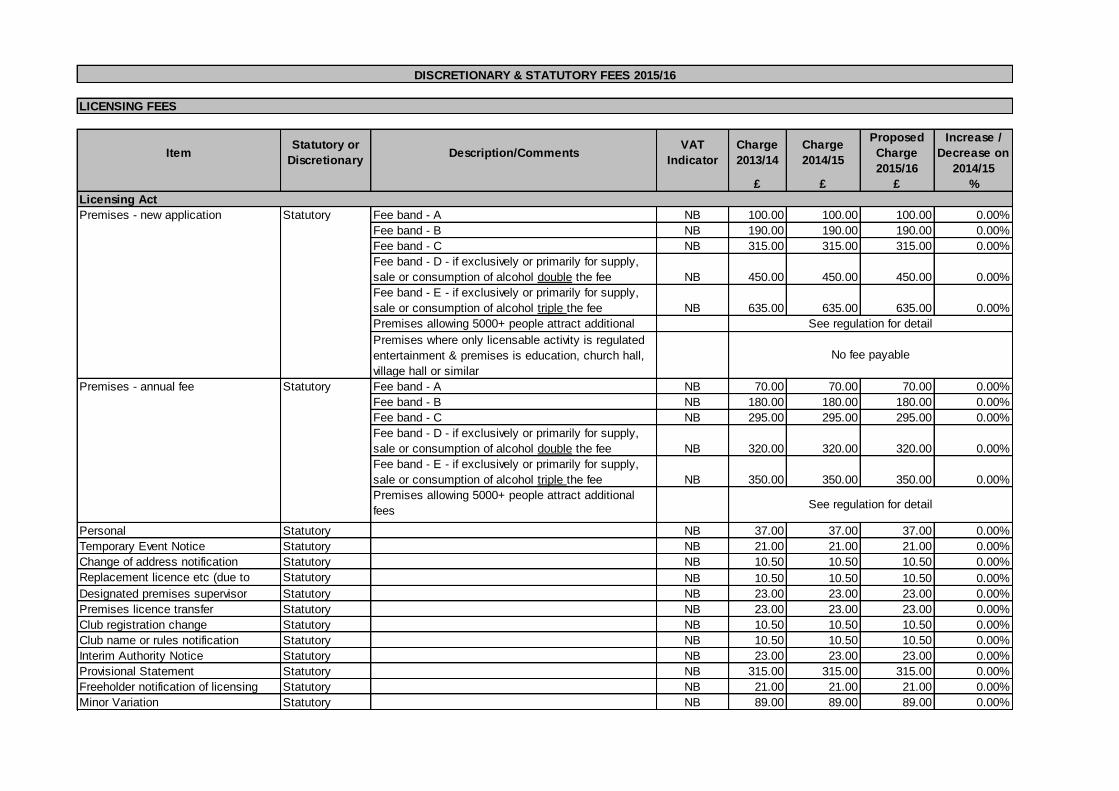
LICENSING FEES
ItemStatutory or
DiscretionaryDescription/Comments
VAT
Indicator
Charge
2013/14
Charge
2014/15
Proposed
Charge
2015/16
Increase /
Decrease on
2014/15
£ £ £ %
Licensing Act
Statutory Fee band - A NB 100.00 100.00 100.00 0.00%
Fee band - B NB 190.00 190.00 190.00 0.00%
Fee band - C NB 315.00 315.00 315.00 0.00%
Fee band - D - if exclusively or primarily for supply,
sale or consumption of alcohol double the fee NB 450.00 450.00 450.00 0.00%
Fee band - E - if exclusively or primarily for supply,
sale or consumption of alcohol triple the fee NB 635.00 635.00 635.00 0.00%
Premises allowing 5000+ people attract additional
feesPremises where only licensable activity is regulated
entertainment & premises is education, church hall,
village hall or similar
Statutory Fee band - A NB 70.00 70.00 70.00 0.00%
Fee band - B NB 180.00 180.00 180.00 0.00%
Fee band - C NB 295.00 295.00 295.00 0.00%
Fee band - D - if exclusively or primarily for supply,
sale or consumption of alcohol double the fee NB 320.00 320.00 320.00 0.00%
Fee band - E - if exclusively or primarily for supply,
sale or consumption of alcohol triple the fee NB 350.00 350.00 350.00 0.00%
Premises allowing 5000+ people attract additional
fees
Personal Statutory NB 37.00 37.00 37.00 0.00%
Temporary Event Notice Statutory NB 21.00 21.00 21.00 0.00%
Change of address notification Statutory NB 10.50 10.50 10.50 0.00%
Replacement licence etc (due to
loss/theft etc)
Statutory NB 10.50 10.50 10.50 0.00%
Designated premises supervisor Statutory NB 23.00 23.00 23.00 0.00%
Premises licence transfer Statutory NB 23.00 23.00 23.00 0.00%
Club registration change Statutory NB 10.50 10.50 10.50 0.00%
Club name or rules notification Statutory NB 10.50 10.50 10.50 0.00%
Interim Authority Notice Statutory NB 23.00 23.00 23.00 0.00%
Provisional Statement Statutory NB 315.00 315.00 315.00 0.00%
Freeholder notification of licensing Statutory NB 21.00 21.00 21.00 0.00%
Minor Variation Statutory NB 89.00 89.00 89.00 0.00%
DISCRETIONARY & STATUTORY FEES 2015/16
Premises - new application
Premises - annual fee
See regulation for detail
No fee payable
See regulation for detail
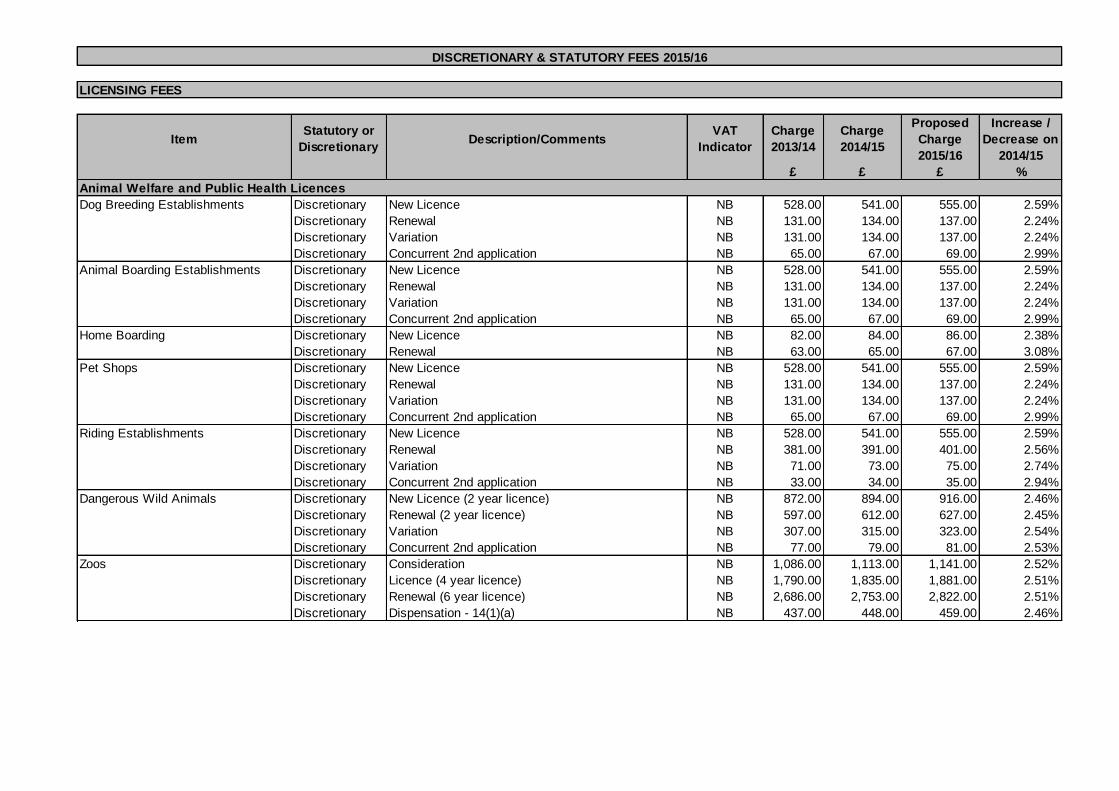
LICENSING FEES
ItemStatutory or
DiscretionaryDescription/Comments
VAT
Indicator
Charge
2013/14
Charge
2014/15
Proposed
Charge
2015/16
Increase /
Decrease on
2014/15
£ £ £ %
Discretionary New Licence NB 528.00 541.00 555.00 2.59%
Discretionary Renewal NB 131.00 134.00 137.00 2.24%
Discretionary Variation NB 131.00 134.00 137.00 2.24%
Discretionary Concurrent 2nd application NB 65.00 67.00 69.00 2.99%
Discretionary New Licence NB 528.00 541.00 555.00 2.59%
Discretionary Renewal NB 131.00 134.00 137.00 2.24%
Discretionary Variation NB 131.00 134.00 137.00 2.24%
Discretionary Concurrent 2nd application NB 65.00 67.00 69.00 2.99%
Discretionary New Licence NB 82.00 84.00 86.00 2.38%
Discretionary Renewal NB 63.00 65.00 67.00 3.08%
Discretionary New Licence NB 528.00 541.00 555.00 2.59%
Discretionary Renewal NB 131.00 134.00 137.00 2.24%
Discretionary Variation NB 131.00 134.00 137.00 2.24%
Discretionary Concurrent 2nd application NB 65.00 67.00 69.00 2.99%
Discretionary New Licence NB 528.00 541.00 555.00 2.59%
Discretionary Renewal NB 381.00 391.00 401.00 2.56%
Discretionary Variation NB 71.00 73.00 75.00 2.74%
Discretionary Concurrent 2nd application NB 33.00 34.00 35.00 2.94%
Discretionary New Licence (2 year licence) NB 872.00 894.00 916.00 2.46%
Discretionary Renewal (2 year licence) NB 597.00 612.00 627.00 2.45%
Discretionary Variation NB 307.00 315.00 323.00 2.54%
Discretionary Concurrent 2nd application NB 77.00 79.00 81.00 2.53%
Discretionary Consideration NB 1,086.00 1,113.00 1,141.00 2.52%
Discretionary Licence (4 year licence) NB 1,790.00 1,835.00 1,881.00 2.51%
Discretionary Renewal (6 year licence) NB 2,686.00 2,753.00 2,822.00 2.51%
Discretionary Dispensation - 14(1)(a) NB 437.00 448.00 459.00 2.46%
Dangerous Wild Animals
Zoos
Animal Boarding Establishments
Home Boarding
Pet Shops
Riding Establishments
DISCRETIONARY & STATUTORY FEES 2015/16
Dog Breeding Establishments
Animal Welfare and Public Health Licences
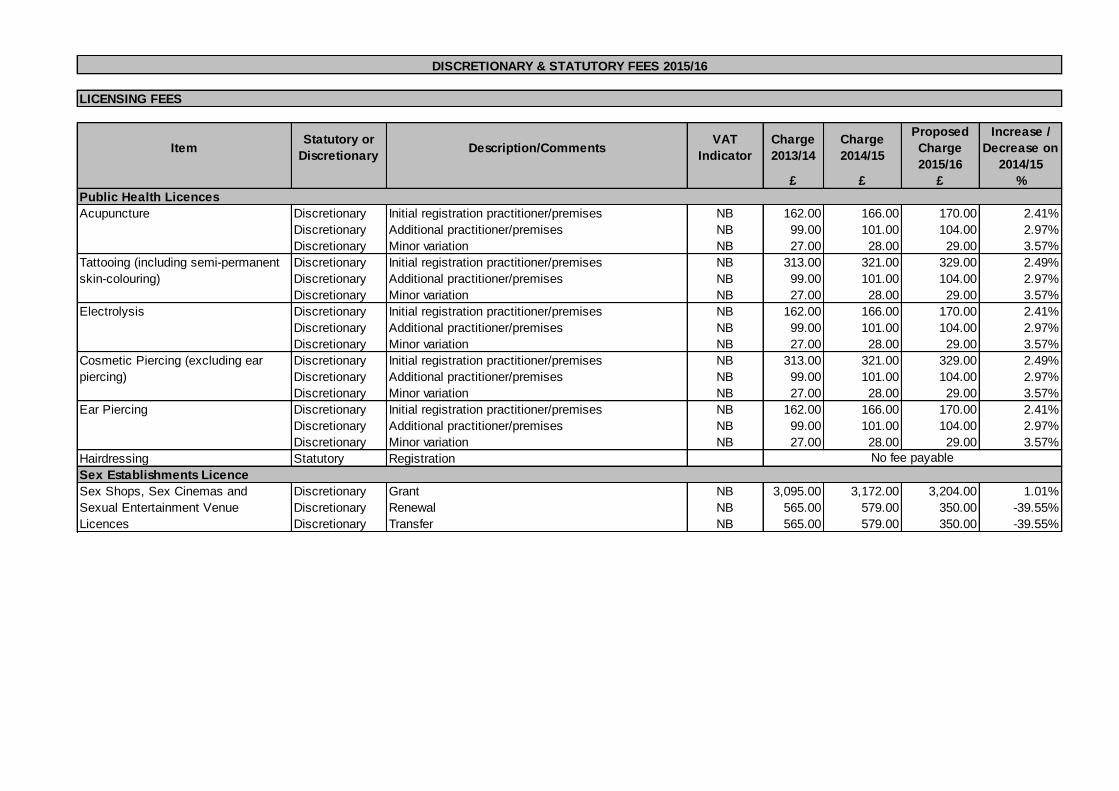
LICENSING FEES
ItemStatutory or
DiscretionaryDescription/Comments
VAT
Indicator
Charge
2013/14
Charge
2014/15
Proposed
Charge
2015/16
Increase /
Decrease on
2014/15
£ £ £ %
Public Health Licences
Discretionary Initial registration practitioner/premises NB 162.00 166.00 170.00 2.41%
Discretionary Additional practitioner/premises NB 99.00 101.00 104.00 2.97%
Discretionary Minor variation NB 27.00 28.00 29.00 3.57%
Discretionary Initial registration practitioner/premises NB 313.00 321.00 329.00 2.49%
Discretionary Additional practitioner/premises NB 99.00 101.00 104.00 2.97%
Discretionary Minor variation NB 27.00 28.00 29.00 3.57%
Electrolysis Discretionary Initial registration practitioner/premises NB 162.00 166.00 170.00 2.41%
Discretionary Additional practitioner/premises NB 99.00 101.00 104.00 2.97%
Discretionary Minor variation NB 27.00 28.00 29.00 3.57%
Discretionary Initial registration practitioner/premises NB 313.00 321.00 329.00 2.49%
Discretionary Additional practitioner/premises NB 99.00 101.00 104.00 2.97%
Discretionary Minor variation NB 27.00 28.00 29.00 3.57%
Discretionary Initial registration practitioner/premises NB 162.00 166.00 170.00 2.41%
Discretionary Additional practitioner/premises NB 99.00 101.00 104.00 2.97%
Discretionary Minor variation NB 27.00 28.00 29.00 3.57%
Hairdressing Statutory Registration
Sex Establishments Licence
Discretionary Grant NB 3,095.00 3,172.00 3,204.00 1.01%
Discretionary Renewal NB 565.00 579.00 350.00 -39.55%
Discretionary Transfer NB 565.00 579.00 350.00 -39.55%
Cosmetic Piercing (excluding ear
piercing)
Ear Piercing
Sex Shops, Sex Cinemas and
Sexual Entertainment Venue
Licences
Acupuncture
Tattooing (including semi-permanent
skin-colouring)
DISCRETIONARY & STATUTORY FEES 2015/16
No fee payable

LICENSING FEES
ItemStatutory or
DiscretionaryDescription/Comments
VAT
Indicator
Charge
2013/14
Charge
2014/15
Proposed
Charge
2015/16
Increase /
Decrease on
2014/15
£ £ £ %
Street Trading and Consents
Publicity Displays Statutory
Street Collection Permit Statutory
Street Trading Licence Discretionary Yearly NB 69.00 71.00 71.00 0.00%
Casual Street Trading
Licence/Consent For One Off Event
Discretionary Grant
NB 11.00 11.50 11.50 0.00%
Casual Street Trading Licence for
Market
Discretionary Monthly
NB 24.00 25.00 25.00 0.00%
Street Trading Consent Discretionary Yearly NB 69.00 71.00 71.00 0.00%
New Site Street Trading Consent -
static
Discretionary Grant -if planning permission already granted
NB 300.00 155.00 100.00 -35.48%
New Site Street Trading Consent -
static
Discretionary Grant - if no planning permission at time of
application NB 300.00 310.00 200.00 -35.48%
New Site Street Trading Consent -
short term static
Discretionary Grant - 1 site £100 (£25 extra for each additional site,
i.e. £125 for 2 sites, £150 for 3 sites
NB
£150 per
site plus
£50 per
additional
£160 per site
plus £55 per
additional
site
£100 per site
plus £25 per
additional
site -37.50%
Hawker Street Trading Consent Discretionary Yearly
NB 71.00 71.00 0.00%
Town Centre Commercial Booking Discretionary Daily (Monday - Friday, Sunday).For 4 consecutive
days deduct £100 from total cost 5 consecutive days
deduct £150, and for 6 consecutive days deduct
£200) NB 150.00 150.00 0.00%
Town Centre Commercial Booking Discretionary 1 day (Saturday)
NB 200.00 200.00 0.00%
DISCRETIONARY & STATUTORY FEES 2015/16
No fee payable
No fee payable

LICENSING FEES
ItemStatutory or
DiscretionaryDescription/Comments
VAT
Indicator
Charge
2013/14
Charge
2014/15
Proposed
Charge
2015/16
Increase /
Decrease on
2014/15
£ £ £ %
Street Trading Consent Rents
Furners Wood Lay-by - cherry stall Discretionary Monthly rents NB 121.00 150.00 150.00 0.00%
Furners Wood Lay-by - hot food Discretionary Monthly rents NB 260.00 225.00 225.00 0.00%
Great Chart - A28 Tenterden bound -
Food
Discretionary Monthly rents
NB 190.00 225.00 225.00 0.00%
Great Chart - A28 Tenterden bound -
Non Food
Discretionary Monthly rents
NB 130.00 150.00 150.00 0.00%
Great Chart - A28 Ashford bound -
Food
Discretionary Monthly rents
NB 190.00 225.00 225.00 0.00%
Great Chart - A28 Ashford bound Non
Food
Discretionary Monthly rents
NB 130.00 150.00 150.00 0.00%
Hothfield - A20 Maidstone bound -
Non Food
Discretionary Monthly rents
NB 121.00 150.00 150.00 0.00%
Hothfield - A20 Maidstone bound -
Food
Discretionary Monthly rents
NB 255.00 225.00 225.00 0.00%
Hothfield - A20 Ashford bound - Non
Food
Discretionary Monthly rents
NB 94.00 150.00 150.00 0.00%
Hothfield - A20 Ashford bound - Food Discretionary Monthly rents
NB 190.00 225.00 225.00 0.00%
Henwood Discretionary Monthly rents NB 196.00 206.50 206.50 0.00%
Recreation Ground Road car park Discretionary Monthly rents NB 306.00 380.00 380.00 0.00%
Potters Corner, Hothfield Discretionary Monthly rents NB 156.00 225.00 225.00 0.00%
Hall Avenue, Sevington Discretionary Max 28 days use per year NB 234.00 240.00 240.00 0.00%
Chilham Mill Discretionary NB 190.00 225.00 225.00 0.00%
DISCRETIONARY & STATUTORY FEES 2015/16

LICENSING FEES
ItemStatutory or
DiscretionaryDescription/Comments
VAT
Indicator
Charge
2013/14
Charge
2014/15
Proposed
Charge
2015/16
Increase /
Decrease on
2014/15
£ £ £ %
Council Land
Charity Discretionary
Commercial (e.g. circuses and
funfairs)
Discretionary per operating day
NB 241.00 260.00 267.00 2.69%
Discretionary per non-operating day NB 168.00 185.00 190.00 2.70%
Food Hygiene
Level 2 course Discretionary EX 68.00 70.00 48.00 -31.43%
Re-sit (at time of next course) Discretionary EX 18.00 18.00 18.00 0.00%
Re-sit (oral) Discretionary EX 41.00 42.00 42.00 0.00%
Food Safety Charges
Food Surrender Certificate Discretionary NB 91.00 93.00 95.00 2.15%
Inspection (Voluntary Surrender) or Discretionary Per hour NB 89.00 91.00 93.00 2.20%
plus tipping charge at cost Charged by tip NA NA NA NA
Export Certificate for food
manufacture
Discretionary
NB 150.00 154.00 158.00 2.60%
Miscellaneous
Scrap Metal Site Licence Discretionary NB 240 300.00 303.00 1.00%
Scrap Metal Collectors Licence Discretionary NB 180 200.00 202.00 1.00%
Scrap Metal Site Licence - Renewal DiscretionaryNB 200.00 202.00 1.00%
Scrap Metal Collectors Licence -
Renewal
Discretionary
NB 100.00 101.00 1.00%
Scrap Metal Variations Discretionary NB 75.00 76.00 1.33%
Scrap Metal Replacement Licence Discretionary NB 11.00 NA
DISCRETIONARY & STATUTORY FEES 2015/16
No fee payable
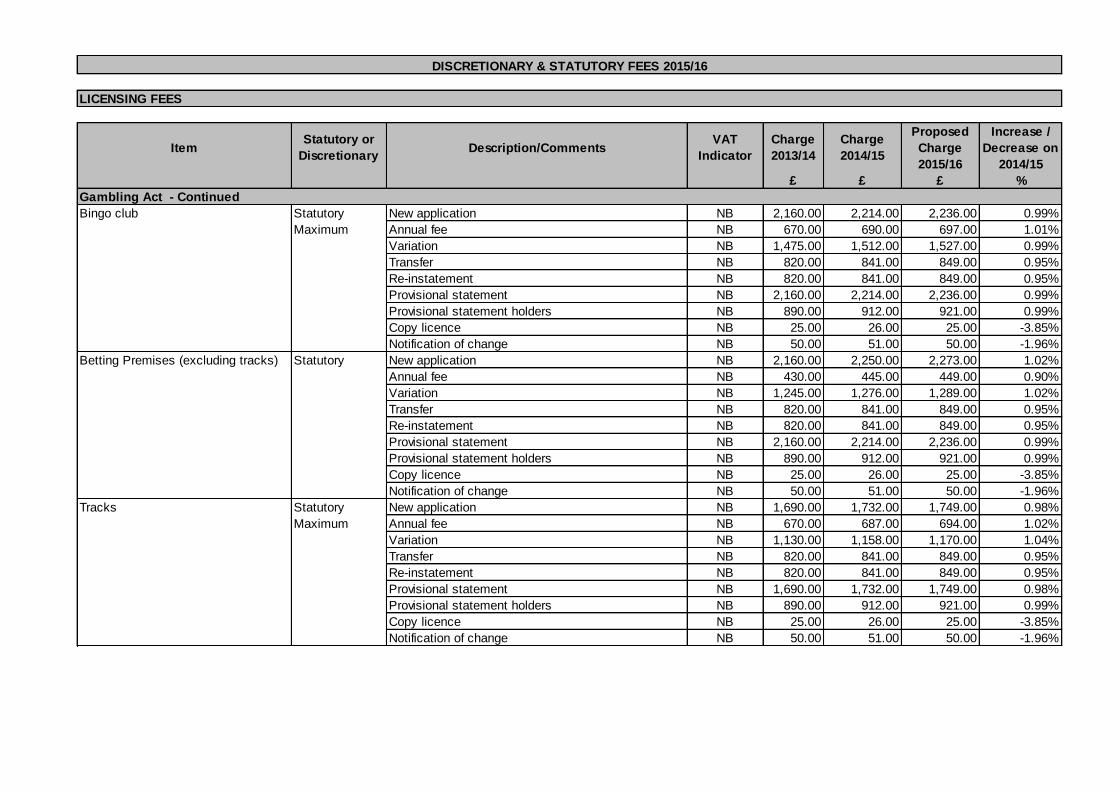
LICENSING FEES
ItemStatutory or
DiscretionaryDescription/Comments
VAT
Indicator
Charge
2013/14
Charge
2014/15
Proposed
Charge
2015/16
Increase /
Decrease on
2014/15
£ £ £ %
Gambling Act - Continued
New application NB 2,160.00 2,214.00 2,236.00 0.99%
Annual fee NB 670.00 690.00 697.00 1.01%
Variation NB 1,475.00 1,512.00 1,527.00 0.99%
Transfer NB 820.00 841.00 849.00 0.95%
Re-instatement NB 820.00 841.00 849.00 0.95%
Provisional statement NB 2,160.00 2,214.00 2,236.00 0.99%
Provisional statement holders NB 890.00 912.00 921.00 0.99%
Copy licence NB 25.00 26.00 25.00 -3.85%
Notification of change NB 50.00 51.00 50.00 -1.96%
Betting Premises (excluding tracks) Statutory New application NB 2,160.00 2,250.00 2,273.00 1.02%
Annual fee NB 430.00 445.00 449.00 0.90%
Variation NB 1,245.00 1,276.00 1,289.00 1.02%
Transfer NB 820.00 841.00 849.00 0.95%
Re-instatement NB 820.00 841.00 849.00 0.95%
Provisional statement NB 2,160.00 2,214.00 2,236.00 0.99%
Provisional statement holders NB 890.00 912.00 921.00 0.99%
Copy licence NB 25.00 26.00 25.00 -3.85%
Notification of change NB 50.00 51.00 50.00 -1.96%
New application NB 1,690.00 1,732.00 1,749.00 0.98%
Annual fee NB 670.00 687.00 694.00 1.02%
Variation NB 1,130.00 1,158.00 1,170.00 1.04%
Transfer NB 820.00 841.00 849.00 0.95%
Re-instatement NB 820.00 841.00 849.00 0.95%
Provisional statement NB 1,690.00 1,732.00 1,749.00 0.98%
Provisional statement holders NB 890.00 912.00 921.00 0.99%
Copy licence NB 25.00 26.00 25.00 -3.85%
Notification of change NB 50.00 51.00 50.00 -1.96%
Tracks Statutory
Maximum
DISCRETIONARY & STATUTORY FEES 2015/16
Bingo club Statutory
Maximum
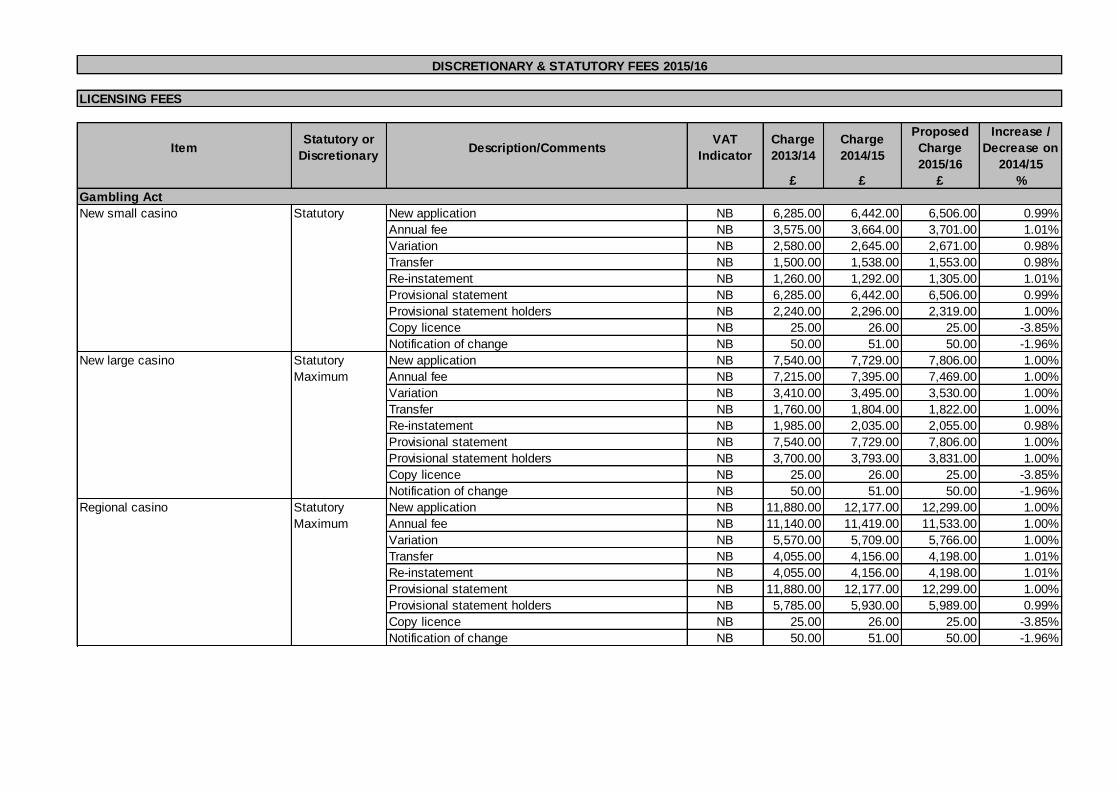
LICENSING FEES
ItemStatutory or
DiscretionaryDescription/Comments
VAT
Indicator
Charge
2013/14
Charge
2014/15
Proposed
Charge
2015/16
Increase /
Decrease on
2014/15
£ £ £ %
Gambling Act
New small casino Statutory New application NB 6,285.00 6,442.00 6,506.00 0.99%
Annual fee NB 3,575.00 3,664.00 3,701.00 1.01%
Variation NB 2,580.00 2,645.00 2,671.00 0.98%
Transfer NB 1,500.00 1,538.00 1,553.00 0.98%
Re-instatement NB 1,260.00 1,292.00 1,305.00 1.01%
Provisional statement NB 6,285.00 6,442.00 6,506.00 0.99%
Provisional statement holders NB 2,240.00 2,296.00 2,319.00 1.00%
Copy licence NB 25.00 26.00 25.00 -3.85%
Notification of change NB 50.00 51.00 50.00 -1.96%
New application NB 7,540.00 7,729.00 7,806.00 1.00%
Annual fee NB 7,215.00 7,395.00 7,469.00 1.00%
Variation NB 3,410.00 3,495.00 3,530.00 1.00%
Transfer NB 1,760.00 1,804.00 1,822.00 1.00%
Re-instatement NB 1,985.00 2,035.00 2,055.00 0.98%
Provisional statement NB 7,540.00 7,729.00 7,806.00 1.00%
Provisional statement holders NB 3,700.00 3,793.00 3,831.00 1.00%
Copy licence NB 25.00 26.00 25.00 -3.85%
Notification of change NB 50.00 51.00 50.00 -1.96%
New application NB 11,880.00 12,177.00 12,299.00 1.00%
Annual fee NB 11,140.00 11,419.00 11,533.00 1.00%
Variation NB 5,570.00 5,709.00 5,766.00 1.00%
Transfer NB 4,055.00 4,156.00 4,198.00 1.01%
Re-instatement NB 4,055.00 4,156.00 4,198.00 1.01%
Provisional statement NB 11,880.00 12,177.00 12,299.00 1.00%
Provisional statement holders NB 5,785.00 5,930.00 5,989.00 0.99%
Copy licence NB 25.00 26.00 25.00 -3.85%
Notification of change NB 50.00 51.00 50.00 -1.96%
DISCRETIONARY & STATUTORY FEES 2015/16
New large casino Statutory
Maximum
Regional casino Statutory
Maximum
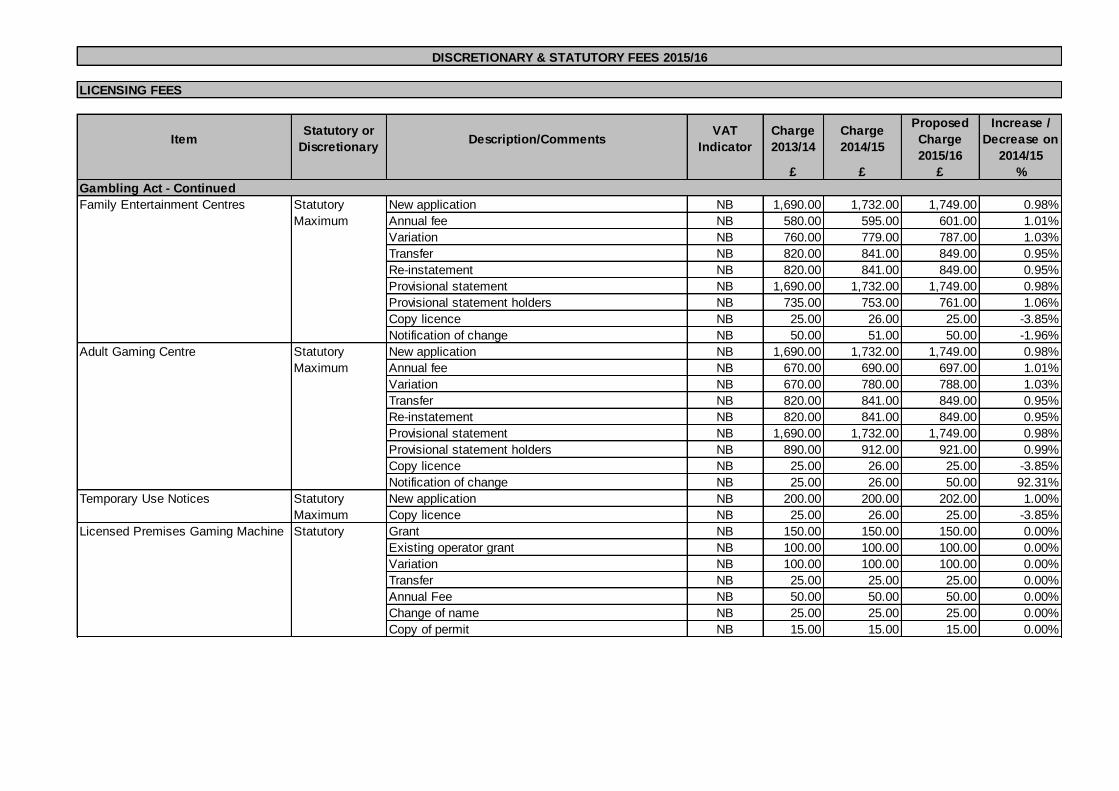
LICENSING FEES
ItemStatutory or
DiscretionaryDescription/Comments
VAT
Indicator
Charge
2013/14
Charge
2014/15
Proposed
Charge
2015/16
Increase /
Decrease on
2014/15
£ £ £ %
Gambling Act - Continued
New application NB 1,690.00 1,732.00 1,749.00 0.98%
Annual fee NB 580.00 595.00 601.00 1.01%
Variation NB 760.00 779.00 787.00 1.03%
Transfer NB 820.00 841.00 849.00 0.95%
Re-instatement NB 820.00 841.00 849.00 0.95%
Provisional statement NB 1,690.00 1,732.00 1,749.00 0.98%
Provisional statement holders NB 735.00 753.00 761.00 1.06%
Copy licence NB 25.00 26.00 25.00 -3.85%
Notification of change NB 50.00 51.00 50.00 -1.96%
New application NB 1,690.00 1,732.00 1,749.00 0.98%
Annual fee NB 670.00 690.00 697.00 1.01%
Variation NB 670.00 780.00 788.00 1.03%
Transfer NB 820.00 841.00 849.00 0.95%
Re-instatement NB 820.00 841.00 849.00 0.95%
Provisional statement NB 1,690.00 1,732.00 1,749.00 0.98%
Provisional statement holders NB 890.00 912.00 921.00 0.99%
Copy licence NB 25.00 26.00 25.00 -3.85%
Notification of change NB 25.00 26.00 50.00 92.31%
New application NB 200.00 200.00 202.00 1.00%
Copy licence NB 25.00 26.00 25.00 -3.85%
Licensed Premises Gaming Machine Statutory Grant NB 150.00 150.00 150.00 0.00%
Existing operator grant NB 100.00 100.00 100.00 0.00%
Variation NB 100.00 100.00 100.00 0.00%
Transfer NB 25.00 25.00 25.00 0.00%
Annual Fee NB 50.00 50.00 50.00 0.00%
Change of name NB 25.00 25.00 25.00 0.00%
Copy of permit NB 15.00 15.00 15.00 0.00%
Family Entertainment Centres Statutory
Maximum
DISCRETIONARY & STATUTORY FEES 2015/16
Adult Gaming Centre Statutory
Maximum
Temporary Use Notices Statutory
Maximum
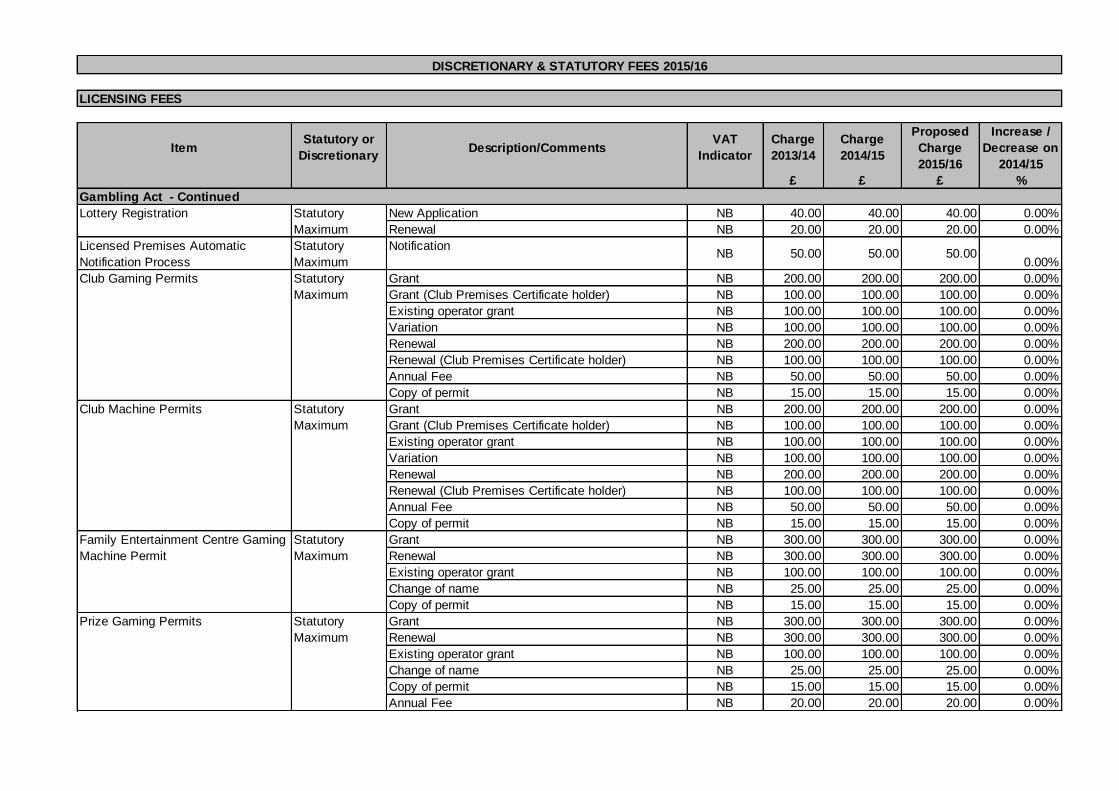
LICENSING FEES
ItemStatutory or
DiscretionaryDescription/Comments
VAT
Indicator
Charge
2013/14
Charge
2014/15
Proposed
Charge
2015/16
Increase /
Decrease on
2014/15
£ £ £ %
Gambling Act - Continued
New Application NB 40.00 40.00 40.00 0.00%
Renewal NB 20.00 20.00 20.00 0.00%
Licensed Premises Automatic
Notification Process
Statutory
Maximum
NotificationNB 50.00 50.00 50.00
0.00%
Grant NB 200.00 200.00 200.00 0.00%
Grant (Club Premises Certificate holder) NB 100.00 100.00 100.00 0.00%
Existing operator grant NB 100.00 100.00 100.00 0.00%
Variation NB 100.00 100.00 100.00 0.00%
Renewal NB 200.00 200.00 200.00 0.00%
Renewal (Club Premises Certificate holder) NB 100.00 100.00 100.00 0.00%
Annual Fee NB 50.00 50.00 50.00 0.00%
Copy of permit NB 15.00 15.00 15.00 0.00%
Grant NB 300.00 300.00 300.00 0.00%
Renewal NB 300.00 300.00 300.00 0.00%
Existing operator grant NB 100.00 100.00 100.00 0.00%
Change of name NB 25.00 25.00 25.00 0.00%
Copy of permit NB 15.00 15.00 15.00 0.00%
Grant NB 300.00 300.00 300.00 0.00%
Renewal NB 300.00 300.00 300.00 0.00%
Existing operator grant NB 100.00 100.00 100.00 0.00%
Change of name NB 25.00 25.00 25.00 0.00%
Copy of permit NB 15.00 15.00 15.00 0.00%
Annual Fee NB 20.00 20.00 20.00 0.00%
Prize Gaming Permits Statutory
Maximum
Club Machine Permits Statutory
Maximum
Family Entertainment Centre Gaming
Machine Permit
Statutory
Maximum
Lottery Registration Statutory
Maximum
DISCRETIONARY & STATUTORY FEES 2015/16
Club Gaming Permits Statutory
Maximum

LICENSING FEES
ItemStatutory or
DiscretionaryDescription/Comments
VAT
Indicator
Charge
2013/14
Charge
2014/15
Proposed
Charge
2015/16
Increase /
Decrease on
2014/15
£ £ £ %
Hackney Carriage/Private Hire
For 1 year NB 49.00 49.00 50.00 2.04%
For 3 years NB 75.00 75.00 100.00 33.33%
Vehicle Licence Discretionary New NB 290.00 300.00 303.00 1.00%
Renewal NB 270.00 280.00 283.00 1.07%
Additional Hackney Carriage &
Private Hire Drivers licence
Discretionary
NB 20.00 20.00 20.00 0.00%
1-3 Vehicles NB 73.00 75.00 76.00 1.33%
4-10 Vehicles NB 310.00 250.00 253.00 1.20%
11-20 Vehicles NB 480.00 500.00 505.00 1.00%
Drivers Badge (replacement) Discretionary NB 15.00 10.50 11.00 4.76%
Fee for Returned (Bounced) Cheques Discretionary NB 16.00 16.00 16.00 0.00%
Transfer of vehicle licence (including
plate)
Discretionary
NB 20.00 25.00 25.00 0.00%
Replcement Plate (internal/external) Discretionary
NB 20.00 25.00 25.00 0.00%
Discretionary Category 1-3 to 4-10 NB 237.00 175.00 177.00 1.14%
Discretionary Category 4-10 to 11-20 NB 310.00 250.00 253.00 1.20%
Replacement Licence Discretionary NB 20.00 10.50 11.00 4.76%
CRB Set by Home
Office NB 44.00 44.00 44.00 0.00%
VAT Indicator:
NB = Non Business no VAT
EX = Exempt from VAT
Additional Vehicle under an
Operators Licence
Private Hire Operators Discretionary
Hackney Carriage & Private Hire
Drivers Licence
Discretionary
DISCRETIONARY & STATUTORY FEES 2015/16
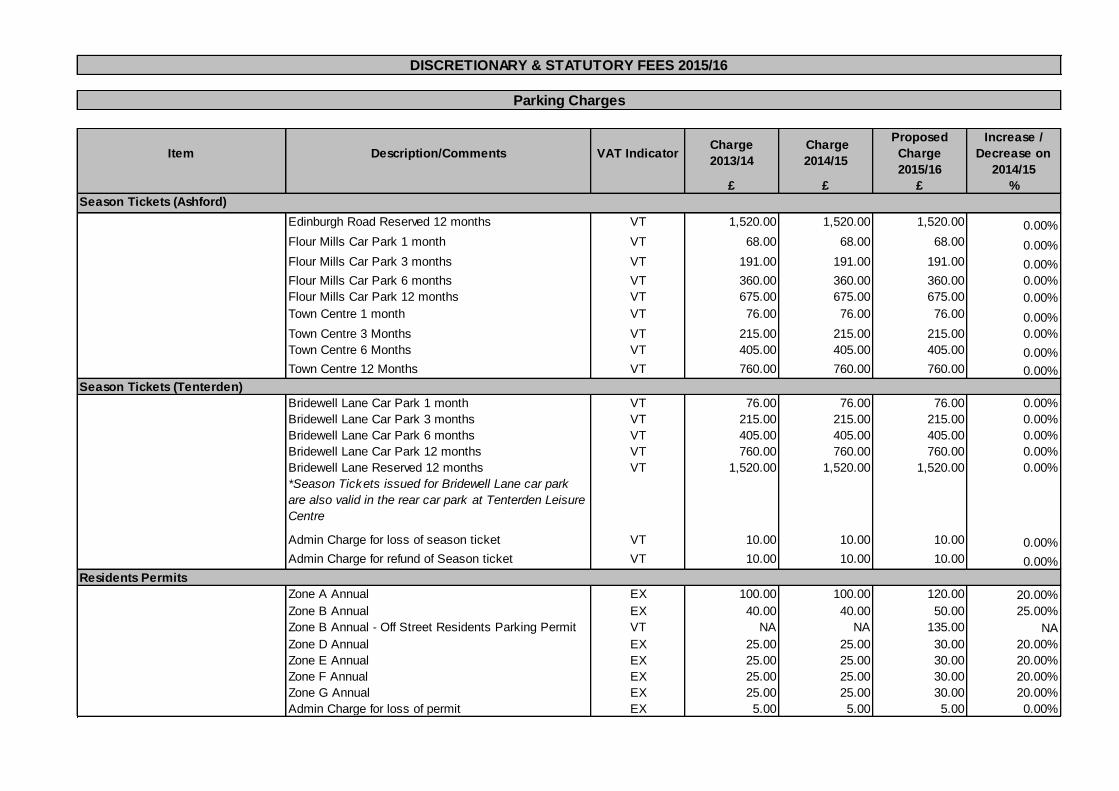
Item Description/Comments VAT IndicatorCharge
2013/14
Charge
2014/15
Proposed
Charge
2015/16
Increase /
Decrease on
2014/15
£ £ £ %
Season Tickets (Ashford)
Edinburgh Road Reserved 12 months VT 1,520.00 1,520.00 1,520.00 0.00%
Flour Mills Car Park 1 month VT 68.00 68.00 68.00 0.00%
Flour Mills Car Park 3 months VT 191.00 191.00 191.00 0.00%
Flour Mills Car Park 6 months VT 360.00 360.00 360.00 0.00%
Flour Mills Car Park 12 months VT 675.00 675.00 675.00 0.00%
Town Centre 1 month VT 76.00 76.00 76.00 0.00%
Town Centre 3 Months VT 215.00 215.00 215.00 0.00%
Town Centre 6 Months VT 405.00 405.00 405.00 0.00%
Town Centre 12 Months VT 760.00 760.00 760.00 0.00%
Season Tickets (Tenterden)
Bridewell Lane Car Park 1 month VT 76.00 76.00 76.00 0.00%
Bridewell Lane Car Park 3 months VT 215.00 215.00 215.00 0.00%
Bridewell Lane Car Park 6 months VT 405.00 405.00 405.00 0.00%
Bridewell Lane Car Park 12 months VT 760.00 760.00 760.00 0.00%
Bridewell Lane Reserved 12 months VT 1,520.00 1,520.00 1,520.00 0.00%
*Season Tickets issued for Bridewell Lane car park
are also valid in the rear car park at Tenterden Leisure
Centre
Admin Charge for loss of season ticket VT 10.00 10.00 10.00 0.00%
Admin Charge for refund of Season ticket VT 10.00 10.00 10.00 0.00%
Residents Permits
Zone A Annual EX 100.00 100.00 120.00 20.00%
Zone B Annual EX 40.00 40.00 50.00 25.00%
Zone B Annual - Off Street Residents Parking Permit VT NA NA 135.00 NA
Zone D Annual EX 25.00 25.00 30.00 20.00%
Zone E Annual EX 25.00 25.00 30.00 20.00%
Zone F Annual EX 25.00 25.00 30.00 20.00%
Zone G Annual EX 25.00 25.00 30.00 20.00%
Admin Charge for loss of permit EX 5.00 5.00 5.00 0.00%
DISCRETIONARY & STATUTORY FEES 2015/16
Parking Charges
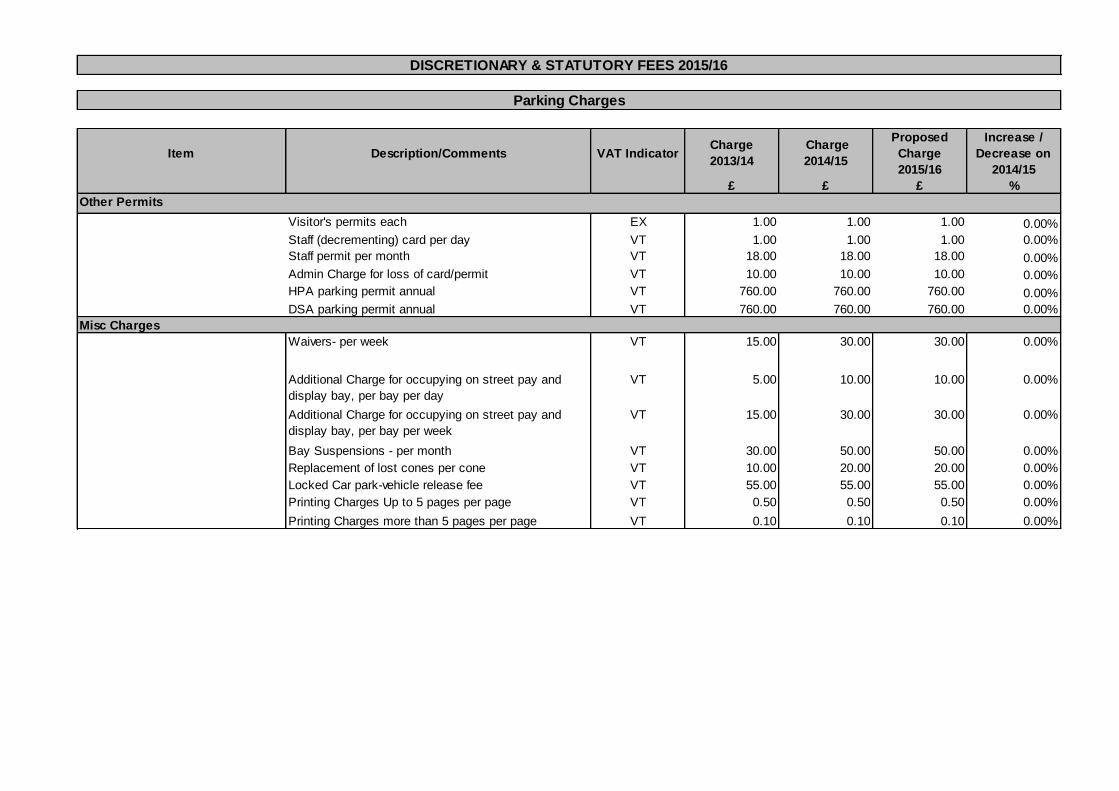
Item Description/Comments VAT IndicatorCharge
2013/14
Charge
2014/15
Proposed
Charge
2015/16
Increase /
Decrease on
2014/15
£ £ £ %
Other Permits
Visitor's permits each EX 1.00 1.00 1.00 0.00%
Staff (decrementing) card per day VT 1.00 1.00 1.00 0.00%
Staff permit per month VT 18.00 18.00 18.00 0.00%
Admin Charge for loss of card/permit VT 10.00 10.00 10.00 0.00%
HPA parking permit annual VT 760.00 760.00 760.00 0.00%
DSA parking permit annual VT 760.00 760.00 760.00 0.00%
Misc Charges
Waivers- per week VT 15.00 30.00 30.00 0.00%
Additional Charge for occupying on street pay and
display bay, per bay per day
VT 5.00 10.00 10.00 0.00%
Additional Charge for occupying on street pay and
display bay, per bay per week
VT 15.00 30.00 30.00 0.00%
Bay Suspensions - per month VT 30.00 50.00 50.00 0.00%
Replacement of lost cones per cone VT 10.00 20.00 20.00 0.00%
Locked Car park-vehicle release fee VT 55.00 55.00 55.00 0.00%
Printing Charges Up to 5 pages per page VT 0.50 0.50 0.50 0.00%
Printing Charges more than 5 pages per page VT 0.10 0.10 0.10 0.00%
DISCRETIONARY & STATUTORY FEES 2015/16
Parking Charges
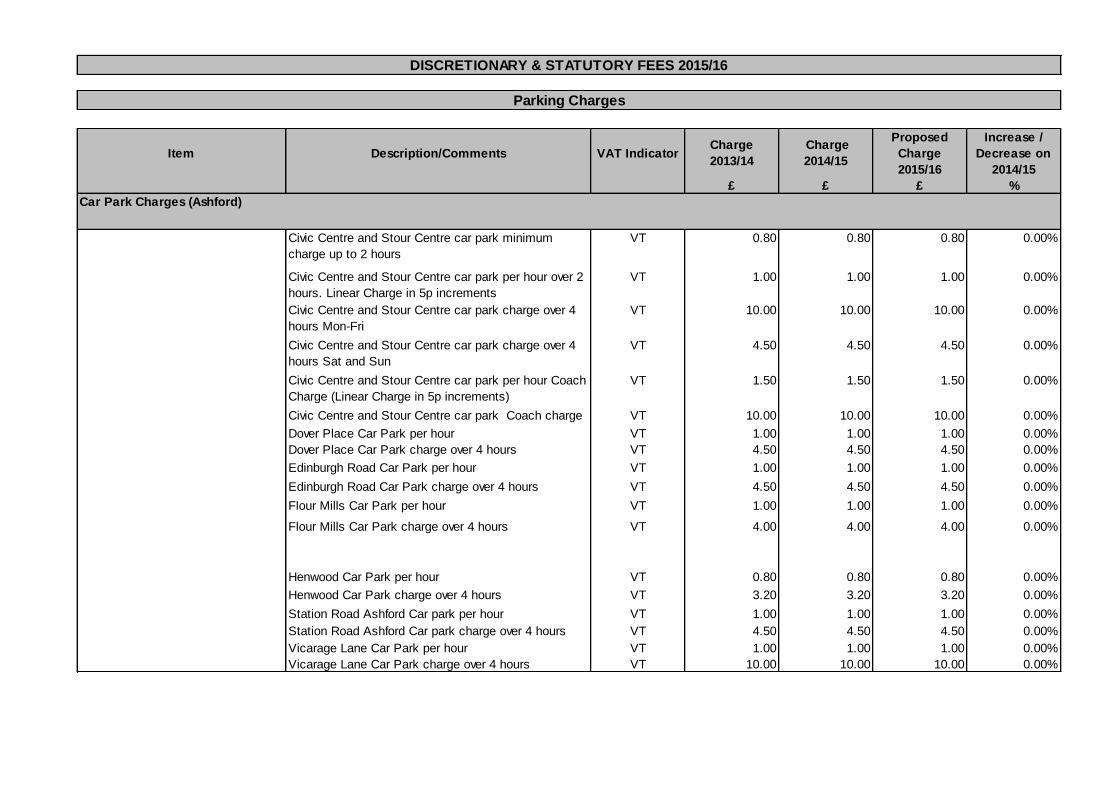
Item Description/Comments VAT IndicatorCharge
2013/14
Charge
2014/15
Proposed
Charge
2015/16
Increase /
Decrease on
2014/15
£ £ £ %
Car Park Charges (Ashford)
Civic Centre and Stour Centre car park minimum
charge up to 2 hours
VT 0.80 0.80 0.80 0.00%
Civic Centre and Stour Centre car park per hour over 2
hours. Linear Charge in 5p increments
VT 1.00 1.00 1.00 0.00%
Civic Centre and Stour Centre car park charge over 4
hours Mon-Fri
VT 10.00 10.00 10.00 0.00%
Civic Centre and Stour Centre car park charge over 4
hours Sat and Sun
VT 4.50 4.50 4.50 0.00%
Civic Centre and Stour Centre car park per hour Coach
Charge (Linear Charge in 5p increments)
VT 1.50 1.50 1.50 0.00%
Civic Centre and Stour Centre car park Coach charge
over 4 hours
VT 10.00 10.00 10.00 0.00%
Dover Place Car Park per hour VT 1.00 1.00 1.00 0.00%
Dover Place Car Park charge over 4 hours VT 4.50 4.50 4.50 0.00%
Edinburgh Road Car Park per hour VT 1.00 1.00 1.00 0.00%
Edinburgh Road Car Park charge over 4 hours VT 4.50 4.50 4.50 0.00%
Flour Mills Car Park per hour VT 1.00 1.00 1.00 0.00%
Flour Mills Car Park charge over 4 hours VT 4.00 4.00 4.00 0.00%
Henwood Car Park per hour VT 0.80 0.80 0.80 0.00%
Henwood Car Park charge over 4 hours VT 3.20 3.20 3.20 0.00%
Station Road Ashford Car park per hour VT 1.00 1.00 1.00 0.00%
Station Road Ashford Car park charge over 4 hours VT 4.50 4.50 4.50 0.00%
Vicarage Lane Car Park per hour VT 1.00 1.00 1.00 0.00%
Vicarage Lane Car Park charge over 4 hours VT 10.00 10.00 10.00 0.00%
DISCRETIONARY & STATUTORY FEES 2015/16
Parking Charges
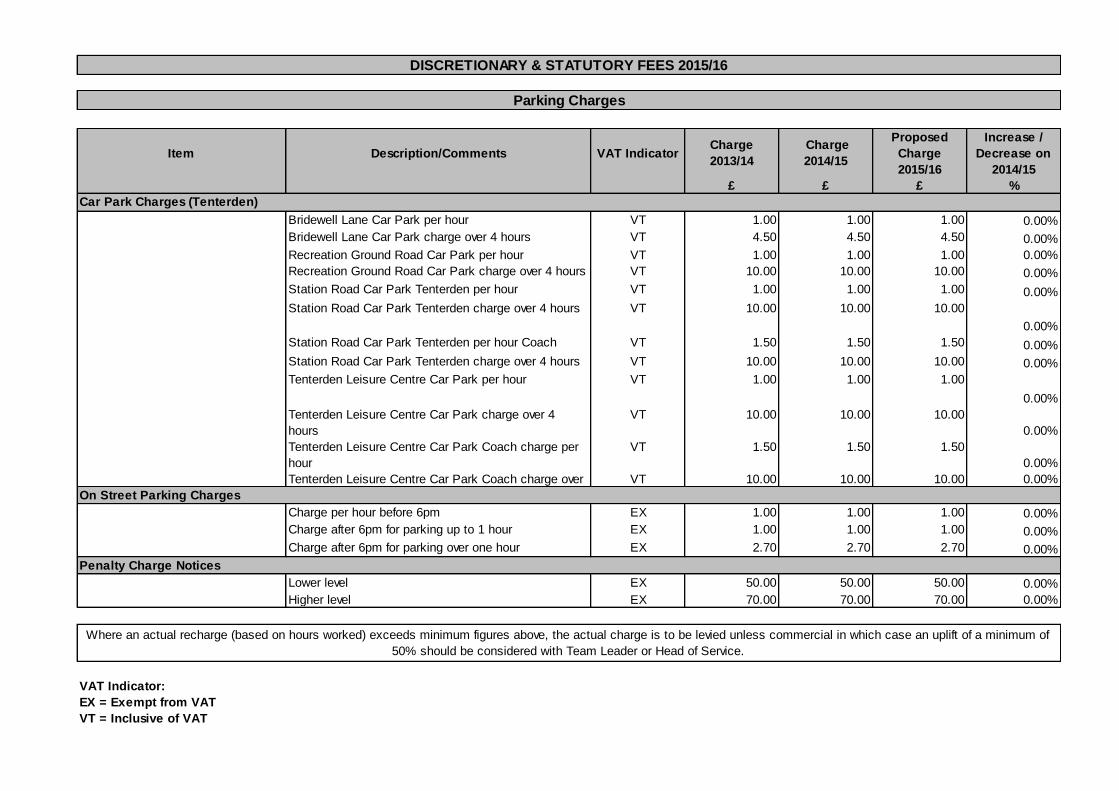
Item Description/Comments VAT IndicatorCharge
2013/14
Charge
2014/15
Proposed
Charge
2015/16
Increase /
Decrease on
2014/15
£ £ £ %
Car Park Charges (Tenterden)
Bridewell Lane Car Park per hour VT 1.00 1.00 1.00 0.00%
Bridewell Lane Car Park charge over 4 hours VT 4.50 4.50 4.50 0.00%
Recreation Ground Road Car Park per hour VT 1.00 1.00 1.00 0.00%
Recreation Ground Road Car Park charge over 4 hours VT 10.00 10.00 10.00 0.00%
Station Road Car Park Tenterden per hour VT 1.00 1.00 1.00 0.00%
Station Road Car Park Tenterden charge over 4 hours VT 10.00 10.00 10.00
0.00%
Station Road Car Park Tenterden per hour Coach
charge
VT 1.50 1.50 1.50 0.00%
Station Road Car Park Tenterden charge over 4 hours VT 10.00 10.00 10.00 0.00%
Tenterden Leisure Centre Car Park per hour VT 1.00 1.00 1.00
0.00%
Tenterden Leisure Centre Car Park charge over 4
hours
VT 10.00 10.00 10.00
0.00%
Tenterden Leisure Centre Car Park Coach charge per
hour
VT 1.50 1.50 1.50
0.00%
Tenterden Leisure Centre Car Park Coach charge over VT 10.00 10.00 10.00 0.00%
On Street Parking Charges
Charge per hour before 6pm EX 1.00 1.00 1.00 0.00%
Charge after 6pm for parking up to 1 hour EX 1.00 1.00 1.00 0.00%
Charge after 6pm for parking over one hour EX 2.70 2.70 2.70 0.00%
Penalty Charge Notices
Lower level EX 50.00 50.00 50.00 0.00%
Higher level EX 70.00 70.00 70.00 0.00%
VAT Indicator:
EX = Exempt from VAT
VT = Inclusive of VAT
DISCRETIONARY & STATUTORY FEES 2015/16
Parking Charges
Where an actual recharge (based on hours worked) exceeds minimum figures above, the actual charge is to be levied unless commercial in which case an uplift of a minimum of
50% should be considered with Team Leader or Head of Service.
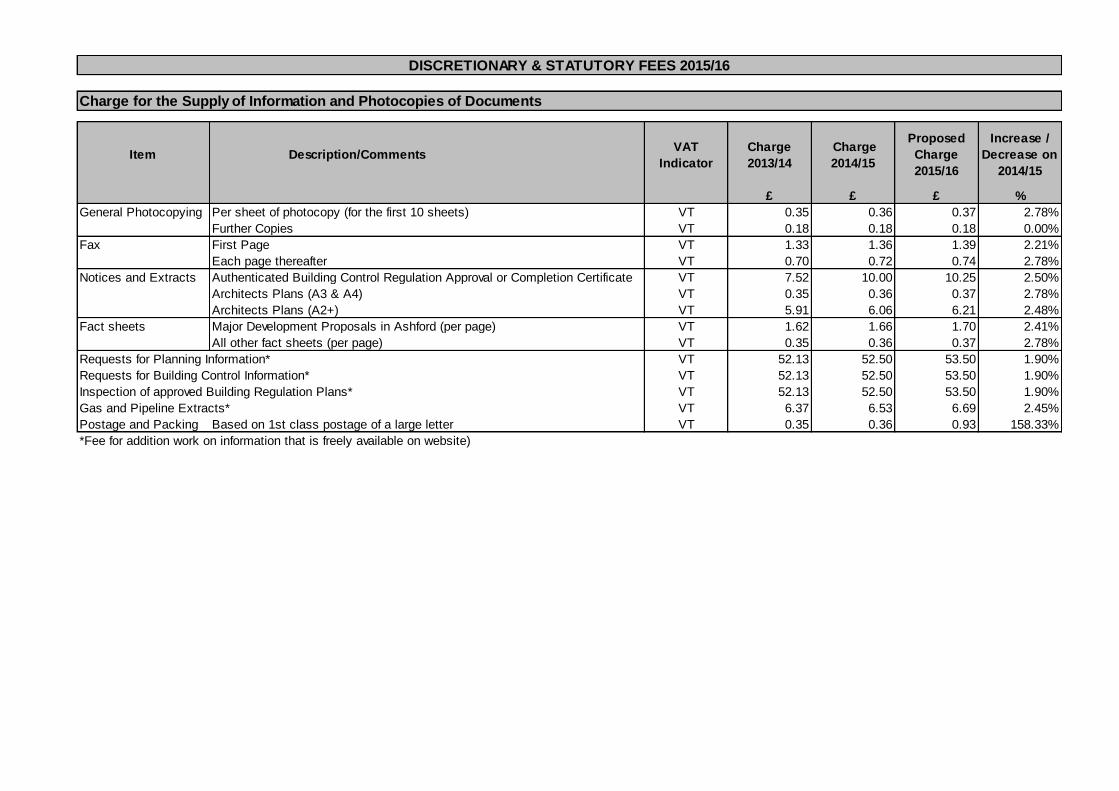
Charge for the Supply of Information and Photocopies of Documents
Item Description/CommentsVAT
Indicator
Charge
2013/14
Charge
2014/15
Proposed
Charge
2015/16
Increase /
Decrease on
2014/15
£ £ £ %
General Photocopying Per sheet of photocopy (for the first 10 sheets) VT 0.35 0.36 0.37 2.78%
Further Copies VT 0.18 0.18 0.18 0.00%
Fax First Page VT 1.33 1.36 1.39 2.21%
Each page thereafter VT 0.70 0.72 0.74 2.78%
Notices and Extracts VT 7.52 10.00 10.25 2.50%
Architects Plans (A3 & A4) VT 0.35 0.36 0.37 2.78%
Architects Plans (A2+) VT 5.91 6.06 6.21 2.48%
Fact sheets VT 1.62 1.66 1.70 2.41%
All other fact sheets (per page) VT 0.35 0.36 0.37 2.78%
Requests for Planning Information* VT 52.13 52.50 53.50 1.90%
Requests for Building Control Information* VT 52.13 52.50 53.50 1.90%
Inspection of approved Building Regulation Plans* VT 52.13 52.50 53.50 1.90%
Gas and Pipeline Extracts* VT 6.37 6.53 6.69 2.45%
Postage and Packing Based on 1st class postage of a large letter VT 0.35 0.36 0.93 158.33%
*Fee for addition work on information that is freely available on website)
DISCRETIONARY & STATUTORY FEES 2015/16
Authenticated Building Control Regulation Approval or Completion Certificate
Major Development Proposals in Ashford (per page)
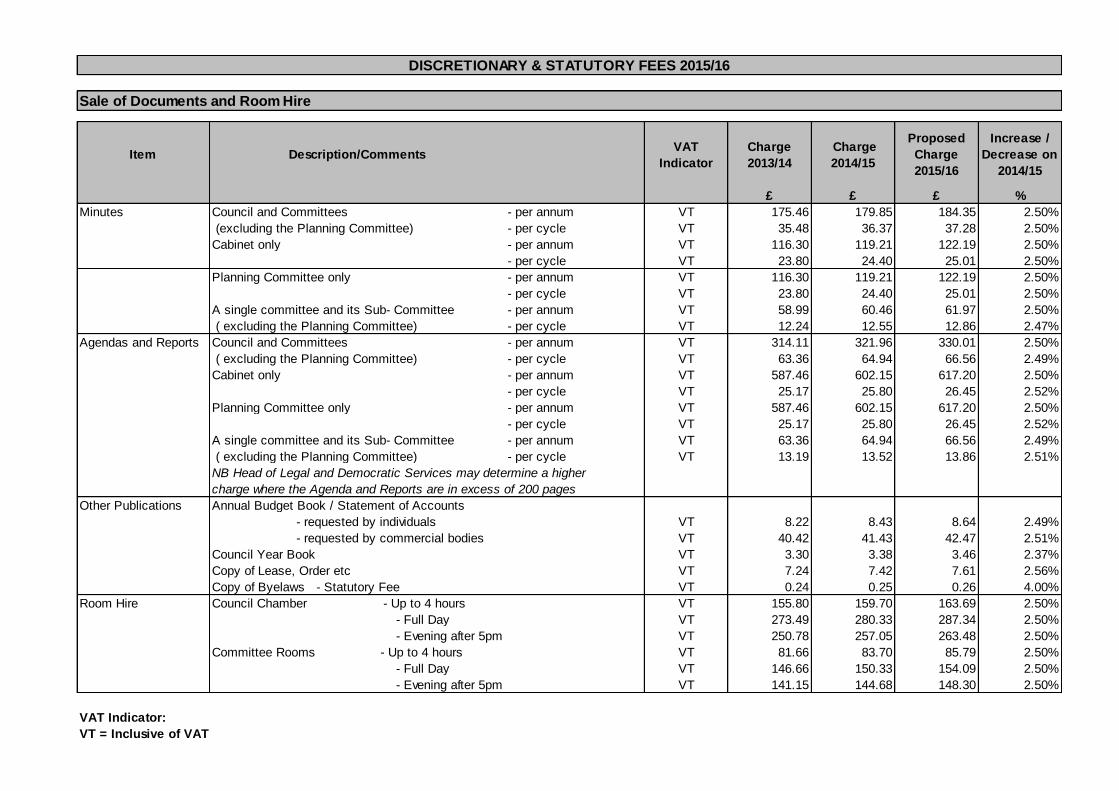
Sale of Documents and Room Hire
Item Description/CommentsVAT
Indicator
Charge
2013/14
Charge
2014/15
Proposed
Charge
2015/16
Increase /
Decrease on
2014/15
£ £ £ %
Minutes Council and Committees - per annum VT 175.46 179.85 184.35 2.50%
(excluding the Planning Committee) - per cycle VT 35.48 36.37 37.28 2.50%
Cabinet only - per annum VT 116.30 119.21 122.19 2.50%
- per cycle VT 23.80 24.40 25.01 2.50%
Planning Committee only - per annum VT 116.30 119.21 122.19 2.50%
- per cycle VT 23.80 24.40 25.01 2.50%
A single committee and its Sub- Committee - per annum VT 58.99 60.46 61.97 2.50%
( excluding the Planning Committee) - per cycle VT 12.24 12.55 12.86 2.47%
Agendas and Reports Council and Committees - per annum VT 314.11 321.96 330.01 2.50%
( excluding the Planning Committee) - per cycle VT 63.36 64.94 66.56 2.49%
Cabinet only - per annum VT 587.46 602.15 617.20 2.50%
- per cycle VT 25.17 25.80 26.45 2.52%
Planning Committee only - per annum VT 587.46 602.15 617.20 2.50%
- per cycle VT 25.17 25.80 26.45 2.52%
A single committee and its Sub- Committee - per annum VT 63.36 64.94 66.56 2.49%
( excluding the Planning Committee) - per cycle VT 13.19 13.52 13.86 2.51%
Other Publications Annual Budget Book / Statement of Accounts
- requested by individuals VT 8.22 8.43 8.64 2.49%
VT 40.42 41.43 42.47 2.51%
Council Year Book VT 3.30 3.38 3.46 2.37%
Copy of Lease, Order etc VT 7.24 7.42 7.61 2.56%
Copy of Byelaws - Statutory Fee VT 0.24 0.25 0.26 4.00%
Room Hire Council Chamber - Up to 4 hours VT 155.80 159.70 163.69 2.50%
- Full Day VT 273.49 280.33 287.34 2.50%
- Evening after 5pm VT 250.78 257.05 263.48 2.50%
Committee Rooms - Up to 4 hours VT 81.66 83.70 85.79 2.50%
- Full Day VT 146.66 150.33 154.09 2.50%
- Evening after 5pm VT 141.15 144.68 148.30 2.50%
VAT Indicator:
VT = Inclusive of VAT
DISCRETIONARY & STATUTORY FEES 2015/16
- requested by commercial bodies
charge where the Agenda and Reports are in excess of 200 pages
NB Head of Legal and Democratic Services may determine a higher

Cemetery Charges
Item Description/CommentsVAT
Indicator
Charge
2013/14
Charge
2014/15
Proposed
Charge
2015/16
Increase /
Decrease
on 2014/15
£ £ £ %
Cemetery Charges - Bybrook and Willesborough Cemeteries
(1) Single Grave Depth EX 1,060.00 1,087.00 1,114.00 2.48%
(2) Double Grave Depth EX 1,169.00 1,198.00 1,228.00 2.50%
(3) Triple Grave Depth EX 1,367.00 1,401.00 1,436.00 2.50%
(4) Child under 12 months
(5) Child aged 1 year to 16 years (please note the digging
fee is waivered for the digging of children's graves but if the
family wish to erect a memorial at a future date a purchase
fee and permit fee will be required)
(NB If grave required to be reopened to enable further
family burial(s) the fees in (2) and (3) apply
(6) Cremated Remains - Garden of Remembrance
Willesborough
EX 380.00 390.00 400.00 2.56%
(7) Single grave depth - includes boarding out with timber NA NA 1,339.00 NA
(1) Single Grave Depth EX 504.00 517.00 530.00 2.51%
(2) Double Grave Depth EX 614.00 629.00 645.00 2.54%
(3) Triple Grave Depth EX NA NA 930.00 NA
(4) Cremated Remains EX 104.00 107.00 110.00 2.80%
Additional fee for Saturday interments (consideration may be given in special circumstances
NB: A SURCHARGE OF 100% ON THE ABOVE SCALE OF CHARGES IS MADE FOR PERSONS
WHO LIVE OUTSIDE ASHFORD BOROUGH. (THIS IS COMMON PRACTICE WITH OTHER AUTHORITIES)
DISCRETIONARY & STATUTORY FEES 2015/16
FREE
By negotiation
FREE
REOPENING OF EXISTING
GRAVES/OPENING OF PRE-
PURCHASED GRAVES
Non standard grave sizes may require the adjacent grave to be purchased if this grave is put out of use due to the over size coffin
COMPOSITE BURIAL FEE FOR NEW
GRAVES
(Includes Digging Fee, Purchase of Right
of Burial for 30 years and wooden cross)
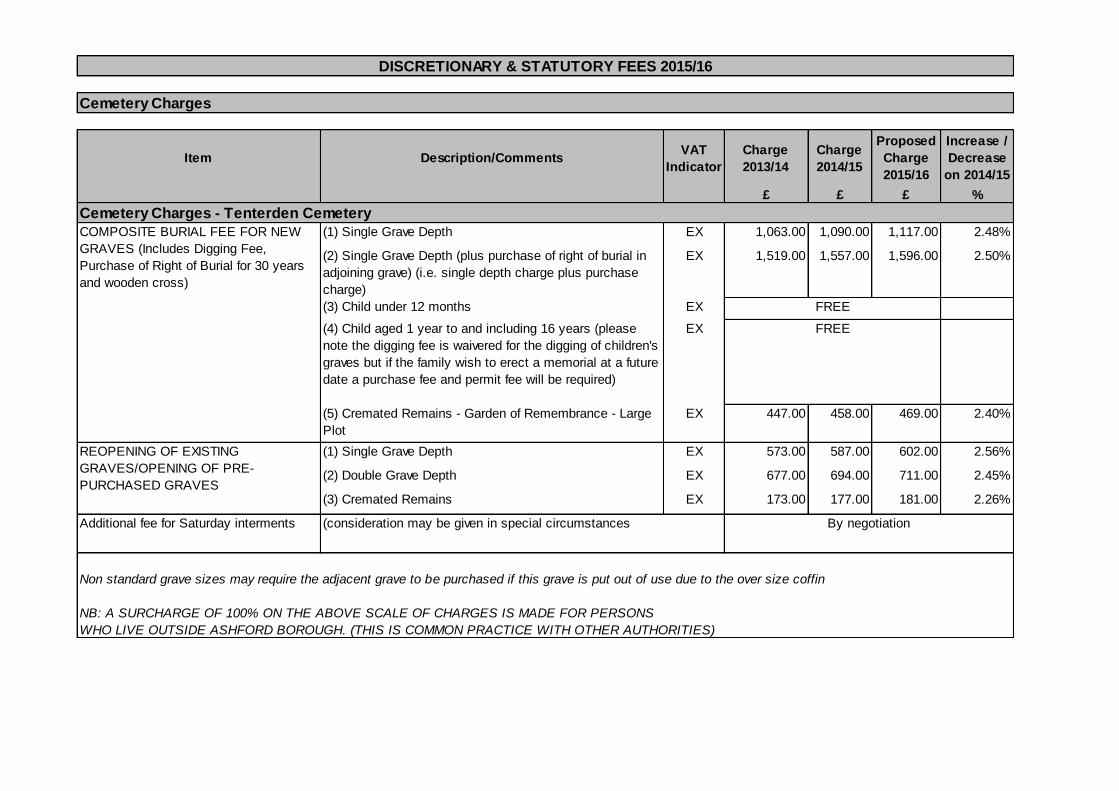
Cemetery Charges
Item Description/CommentsVAT
Indicator
Charge
2013/14
Charge
2014/15
Proposed
Charge
2015/16
Increase /
Decrease
on 2014/15
£ £ £ %
Cemetery Charges - Tenterden Cemetery
(1) Single Grave Depth EX 1,063.00 1,090.00 1,117.00 2.48%
(2) Single Grave Depth (plus purchase of right of burial in
adjoining grave) (i.e. single depth charge plus purchase
charge)
EX 1,519.00 1,557.00 1,596.00 2.50%
(3) Child under 12 months EX
(4) Child aged 1 year to and including 16 years (please
note the digging fee is waivered for the digging of children's
graves but if the family wish to erect a memorial at a future
date a purchase fee and permit fee will be required)
EX
(5) Cremated Remains - Garden of Remembrance - Large
Plot
EX 447.00 458.00 469.00 2.40%
(1) Single Grave Depth EX 573.00 587.00 602.00 2.56%
(2) Double Grave Depth EX 677.00 694.00 711.00 2.45%
(3) Cremated Remains EX 173.00 177.00 181.00 2.26%
Additional fee for Saturday interments (consideration may be given in special circumstances
NB: A SURCHARGE OF 100% ON THE ABOVE SCALE OF CHARGES IS MADE FOR PERSONS
WHO LIVE OUTSIDE ASHFORD BOROUGH. (THIS IS COMMON PRACTICE WITH OTHER AUTHORITIES)
Non standard grave sizes may require the adjacent grave to be purchased if this grave is put out of use due to the over size coffin
DISCRETIONARY & STATUTORY FEES 2015/16
By negotiation
FREE
COMPOSITE BURIAL FEE FOR NEW
GRAVES (Includes Digging Fee,
Purchase of Right of Burial for 30 years
and wooden cross)
REOPENING OF EXISTING
GRAVES/OPENING OF PRE-
PURCHASED GRAVES
FREE
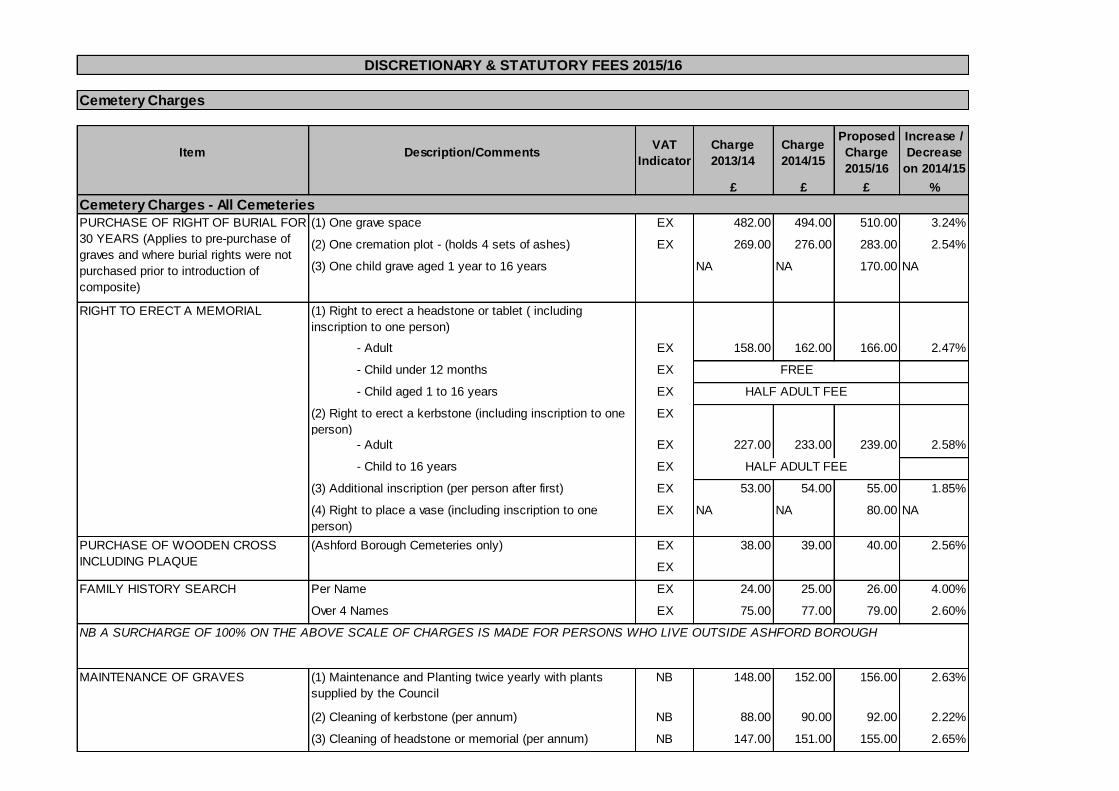
Cemetery Charges
Item Description/CommentsVAT
Indicator
Charge
2013/14
Charge
2014/15
Proposed
Charge
2015/16
Increase /
Decrease
on 2014/15
£ £ £ %
Cemetery Charges - All Cemeteries
(1) One grave space EX 482.00 494.00 510.00 3.24%
(2) One cremation plot - (holds 4 sets of ashes) EX 269.00 276.00 283.00 2.54%
(3) One child grave aged 1 year to 16 years NA NA 170.00 NA
RIGHT TO ERECT A MEMORIAL (1) Right to erect a headstone or tablet ( including
inscription to one person)
- Adult EX 158.00 162.00 166.00 2.47%
- Child under 12 months EX
- Child aged 1 to 16 years EX
(2) Right to erect a kerbstone (including inscription to one
person)
EX
- Adult EX 227.00 233.00 239.00 2.58%
- Child to 16 years EX
(3) Additional inscription (per person after first) EX 53.00 54.00 55.00 1.85%
(4) Right to place a vase (including inscription to one
person)
EX NA NA 80.00 NA
(Ashford Borough Cemeteries only) EX 38.00 39.00 40.00 2.56%
EX
FAMILY HISTORY SEARCH Per Name EX 24.00 25.00 26.00 4.00%
Over 4 Names EX 75.00 77.00 79.00 2.60%
MAINTENANCE OF GRAVES (1) Maintenance and Planting twice yearly with plants
supplied by the Council
NB 148.00 152.00 156.00 2.63%
(2) Cleaning of kerbstone (per annum) NB 88.00 90.00 92.00 2.22%
(3) Cleaning of headstone or memorial (per annum) NB 147.00 151.00 155.00 2.65%
PURCHASE OF RIGHT OF BURIAL FOR
30 YEARS (Applies to pre-purchase of
graves and where burial rights were not
purchased prior to introduction of
composite)
NB A SURCHARGE OF 100% ON THE ABOVE SCALE OF CHARGES IS MADE FOR PERSONS WHO LIVE OUTSIDE ASHFORD BOROUGH
FREE
HALF ADULT FEE
HALF ADULT FEE
PURCHASE OF WOODEN CROSS
INCLUDING PLAQUE
DISCRETIONARY & STATUTORY FEES 2015/16
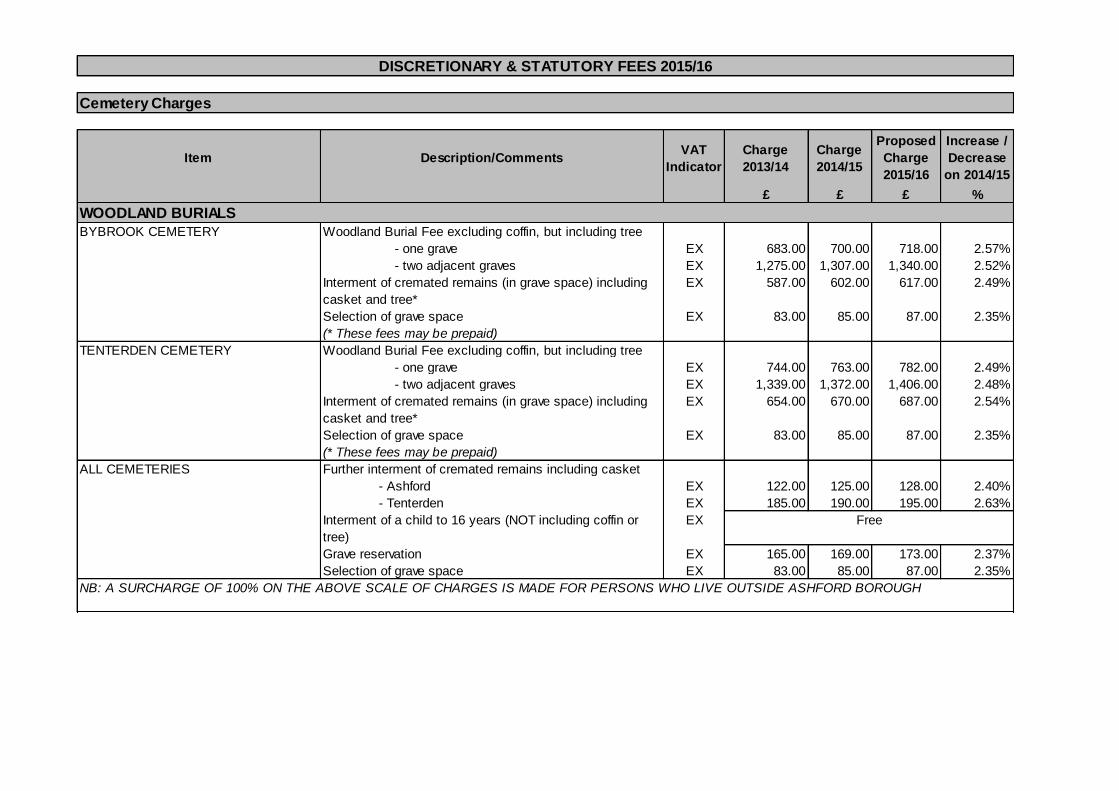
Cemetery Charges
Item Description/CommentsVAT
Indicator
Charge
2013/14
Charge
2014/15
Proposed
Charge
2015/16
Increase /
Decrease
on 2014/15
£ £ £ %
WOODLAND BURIALS
BYBROOK CEMETERY Woodland Burial Fee excluding coffin, but including tree
- one grave EX 683.00 700.00 718.00 2.57%
- two adjacent graves EX 1,275.00 1,307.00 1,340.00 2.52%
Interment of cremated remains (in grave space) including
casket and tree*
EX 587.00 602.00 617.00 2.49%
Selection of grave space EX 83.00 85.00 87.00 2.35%
(* These fees may be prepaid)
TENTERDEN CEMETERY Woodland Burial Fee excluding coffin, but including tree
- one grave EX 744.00 763.00 782.00 2.49%
- two adjacent graves EX 1,339.00 1,372.00 1,406.00 2.48%
Interment of cremated remains (in grave space) including
casket and tree*
EX 654.00 670.00 687.00 2.54%
Selection of grave space EX 83.00 85.00 87.00 2.35%
(* These fees may be prepaid)
ALL CEMETERIES Further interment of cremated remains including casket
- Ashford EX 122.00 125.00 128.00 2.40%
- Tenterden EX 185.00 190.00 195.00 2.63%
Interment of a child to 16 years (NOT including coffin or
tree)
EX
Grave reservation EX 165.00 169.00 173.00 2.37%
Selection of grave space EX 83.00 85.00 87.00 2.35%
NB: A SURCHARGE OF 100% ON THE ABOVE SCALE OF CHARGES IS MADE FOR PERSONS WHO LIVE OUTSIDE ASHFORD BOROUGH
Free
DISCRETIONARY & STATUTORY FEES 2015/16
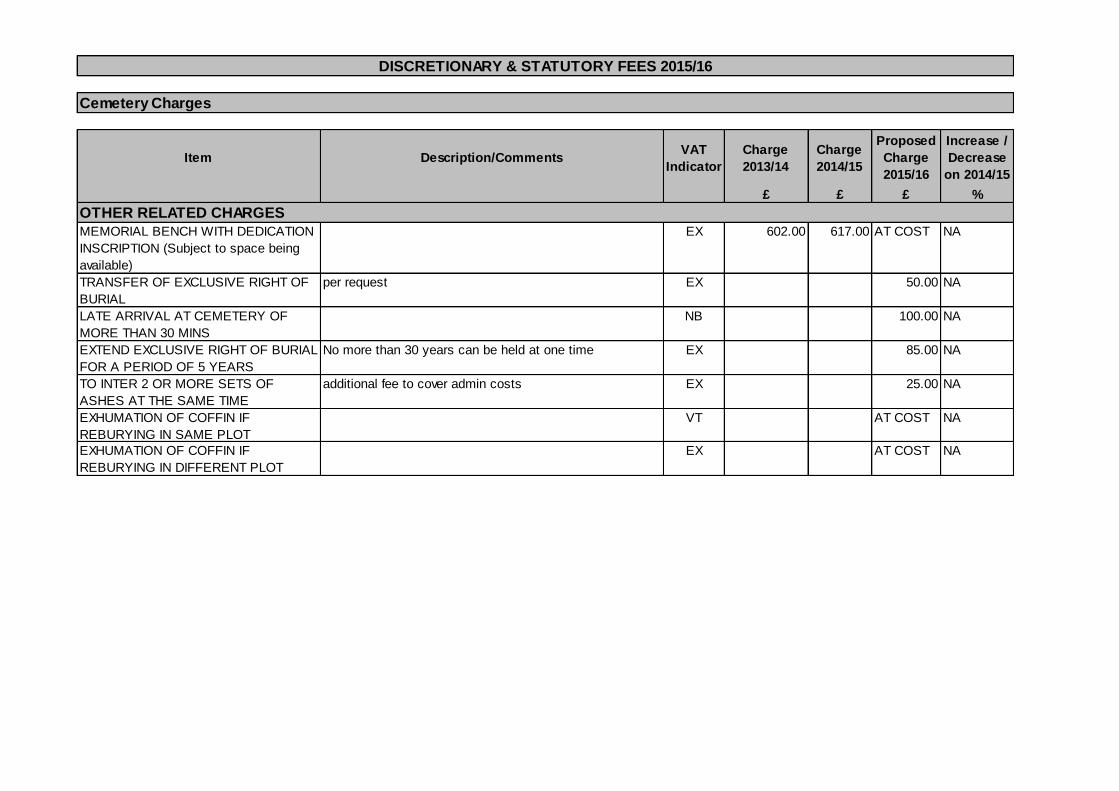
Cemetery Charges
Item Description/CommentsVAT
Indicator
Charge
2013/14
Charge
2014/15
Proposed
Charge
2015/16
Increase /
Decrease
on 2014/15
£ £ £ %
OTHER RELATED CHARGES
EX 602.00 617.00 AT COST NA
TRANSFER OF EXCLUSIVE RIGHT OF
BURIAL
per request EX 50.00 NA
LATE ARRIVAL AT CEMETERY OF
MORE THAN 30 MINS
NB 100.00 NA
EXTEND EXCLUSIVE RIGHT OF BURIAL
FOR A PERIOD OF 5 YEARS
No more than 30 years can be held at one time EX 85.00 NA
TO INTER 2 OR MORE SETS OF
ASHES AT THE SAME TIME
additional fee to cover admin costs EX 25.00 NA
EXHUMATION OF COFFIN IF
REBURYING IN SAME PLOT
VT AT COST NA
EXHUMATION OF COFFIN IF
REBURYING IN DIFFERENT PLOT
EX AT COST NA
MEMORIAL BENCH WITH DEDICATION
INSCRIPTION (Subject to space being
available)
DISCRETIONARY & STATUTORY FEES 2015/16
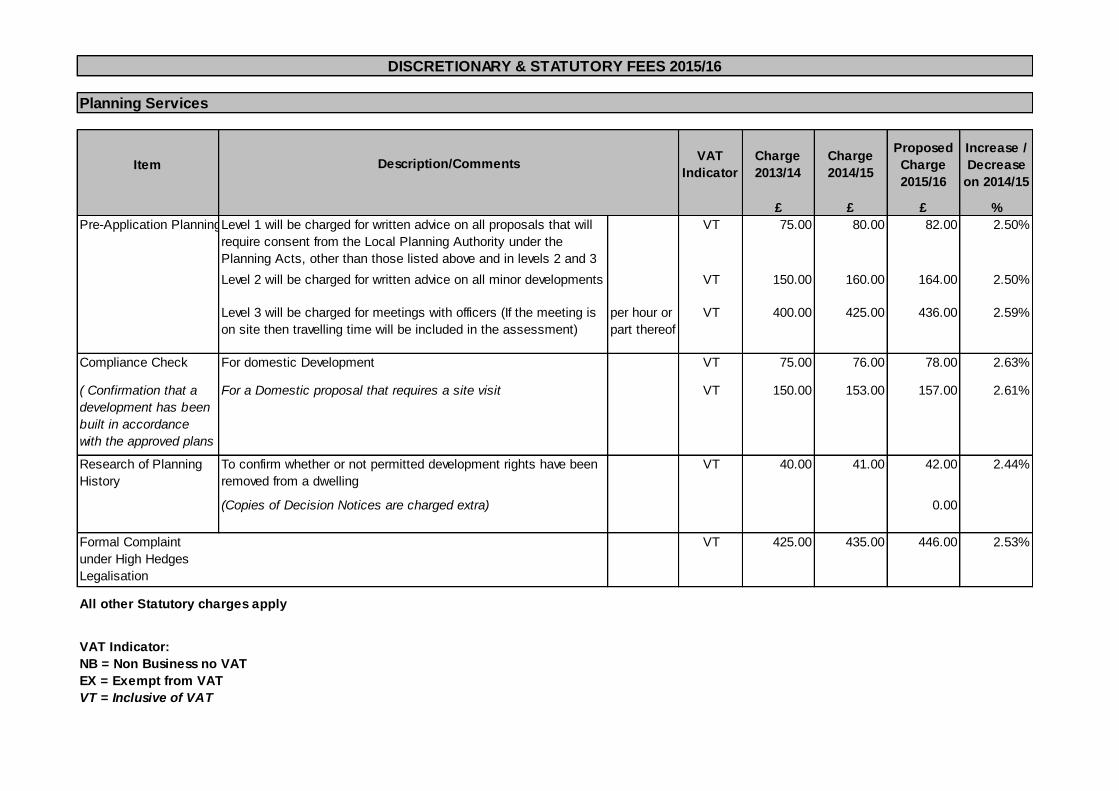
Planning Services
ItemVAT
Indicator
Charge
2013/14
Charge
2014/15
Proposed
Charge
2015/16
Increase /
Decrease
on 2014/15
£ £ £ %
Pre-Application Planning & Policy Advice VT 75.00 80.00 82.00 2.50%
VT 150.00 160.00 164.00 2.50%
per hour or
part thereof
VT 400.00 425.00 436.00 2.59%
Compliance Check VT 75.00 76.00 78.00 2.63%
( Confirmation that a
development has been
built in accordance
with the approved plans
VT 150.00 153.00 157.00 2.61%
Research of Planning
History
VT 40.00 41.00 42.00 2.44%
0.00
Formal Complaint
under High Hedges
Legalisation
VT 425.00 435.00 446.00 2.53%
VAT Indicator:
NB = Non Business no VAT
VT = Inclusive of VAT
DISCRETIONARY & STATUTORY FEES 2015/16
EX = Exempt from VAT
Description/Comments
To confirm whether or not permitted development rights have been
removed from a dwelling
Level 1 will be charged for written advice on all proposals that will
require consent from the Local Planning Authority under the
Planning Acts, other than those listed above and in levels 2 and 3
Level 2 will be charged for written advice on all minor developments
Level 3 will be charged for meetings with officers (If the meeting is
on site then travelling time will be included in the assessment)
For domestic Development
For a Domestic proposal that requires a site visit
(Copies of Decision Notices are charged extra)
All other Statutory charges apply
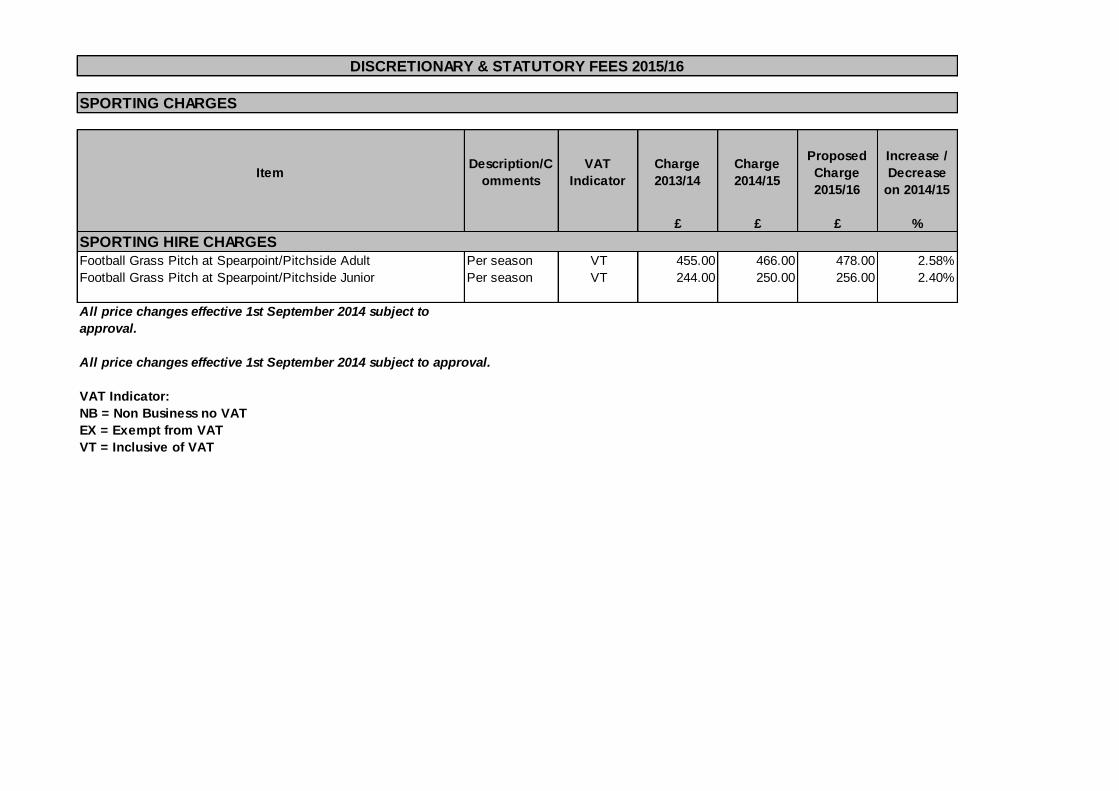
SPORTING CHARGES
ItemDescription/C
omments
VAT
Indicator
Charge
2013/14
Charge
2014/15
Proposed
Charge
2015/16
Increase /
Decrease
on 2014/15
£ £ £ %
SPORTING HIRE CHARGES
Football Grass Pitch at Spearpoint/Pitchside Adult Per season VT 455.00 466.00 478.00 2.58%
Football Grass Pitch at Spearpoint/Pitchside Junior Per season VT 244.00 250.00 256.00 2.40%
All price changes effective 1st September 2014 subject to
approval.
All price changes effective 1st September 2014 subject to approval.
VAT Indicator:
NB = Non Business no VAT
EX = Exempt from VAT
VT = Inclusive of VAT
DISCRETIONARY & STATUTORY FEES 2015/16
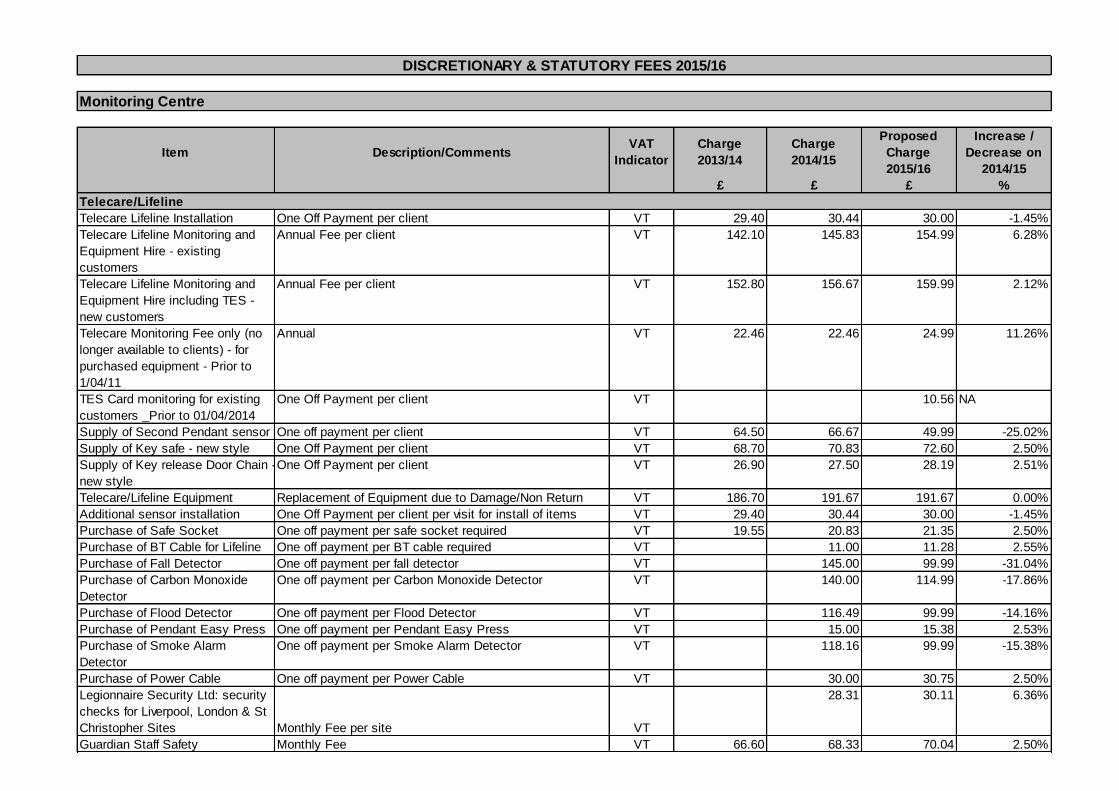
Monitoring Centre
Item Description/CommentsVAT
Indicator
Charge
2013/14
Charge
2014/15
Proposed
Charge
2015/16
Increase /
Decrease on
2014/15
£ £ £ %
Telecare/Lifeline
Telecare Lifeline Installation One Off Payment per client VT 29.40 30.44 30.00 -1.45%
Telecare Lifeline Monitoring and
Equipment Hire - existing
customers
Annual Fee per client VT 142.10 145.83 154.99 6.28%
Telecare Lifeline Monitoring and
Equipment Hire including TES -
new customers
Annual Fee per client VT 152.80 156.67 159.99 2.12%
Telecare Monitoring Fee only (no
longer available to clients) - for
purchased equipment - Prior to
1/04/11
Annual VT 22.46 22.46 24.99 11.26%
TES Card monitoring for existing
customers _Prior to 01/04/2014
One Off Payment per client VT 10.56 NA
Supply of Second Pendant sensor One off payment per client VT 64.50 66.67 49.99 -25.02%
Supply of Key safe - new style One Off Payment per client VT 68.70 70.83 72.60 2.50%
Supply of Key release Door Chain -
new style
One Off Payment per client VT 26.90 27.50 28.19 2.51%
Telecare/Lifeline Equipment Replacement of Equipment due to Damage/Non Return VT 186.70 191.67 191.67 0.00%
Additional sensor installation One Off Payment per client per visit for install of items VT 29.40 30.44 30.00 -1.45%
Purchase of Safe Socket One off payment per safe socket required VT 19.55 20.83 21.35 2.50%
Purchase of BT Cable for Lifeline One off payment per BT cable required VT 11.00 11.28 2.55%
Purchase of Fall Detector One off payment per fall detector VT 145.00 99.99 -31.04%
Purchase of Carbon Monoxide
Detector
One off payment per Carbon Monoxide Detector VT 140.00 114.99 -17.86%
Purchase of Flood Detector One off payment per Flood Detector VT 116.49 99.99 -14.16%
Purchase of Pendant Easy Press One off payment per Pendant Easy Press VT 15.00 15.38 2.53%
Purchase of Smoke Alarm
Detector
One off payment per Smoke Alarm Detector VT 118.16 99.99 -15.38%
Purchase of Power Cable One off payment per Power Cable VT 30.00 30.75 2.50%
Legionnaire Security Ltd: security
checks for Liverpool, London & St
Christopher Sites Monthly Fee per site VT
28.31 30.11 6.36%
Guardian Staff Safety Monthly Fee VT 66.60 68.33 70.04 2.50%
DISCRETIONARY & STATUTORY FEES 2015/16

Monitoring Centre
Item Description/CommentsVAT
Indicator
Charge
2013/14
Charge
2014/15
Proposed
Charge
2015/16
Increase /
Decrease on
2014/15
£ £ £ %
Other Monitoring Services
Kent Community Health NHS
Trust: Trinity House remote CCTV
monitoring
Annual Fee VT 1,042.48 1,068.54 2.50%
Peverel Management Services
Ltd: Lifeline Monitoring for resident
at Poldark Court
Annual Fee VT 556.79 570.71 2.50%
Red Alert Ltd: Battle of Britain
remote CCTV monitorig
Annual Fee VT 854.86 876.23 2.50%
Trinity Homes: Maintenance Annual Fee VT 1,826.99 1,872.66 2.50%
Trinity Homes: Scheme
monitoring Annual Fee VT
882.01 904.06 2.50%
The Mercers Company:
Whittington College social alarm
monitoring Annual Fee VT
1,745.96 1,789.61 2.50%
The Mercers Company:
Whittington College daily
reassurance calls 1 resident Annual Fee VT
450.40 461.66 2.50%
Wye Almshouse Charity:
Monitoring Annual Fee per resident VT
96.25 98.66 2.50%
Wye Almshouse Charity:
Maintenance Annual Fee per resident VT
15.95 16.35 2.51%
Kent Community Health NHS
Trust: NHS Walk in Centre, Royal
Victoria Hospital Annual Fee VT
4,459.00 4,570.48 2.50%
Hythe Town Council: CCTV
Monitoring Annual Fee VT
1,919.99 1,967.99 2.50%
VAT Indicator:
NB = Non Business no VAT
EX = Exempt from VAT
VT = Exclusive of VAT
DISCRETIONARY & STATUTORY FEES 2015/16
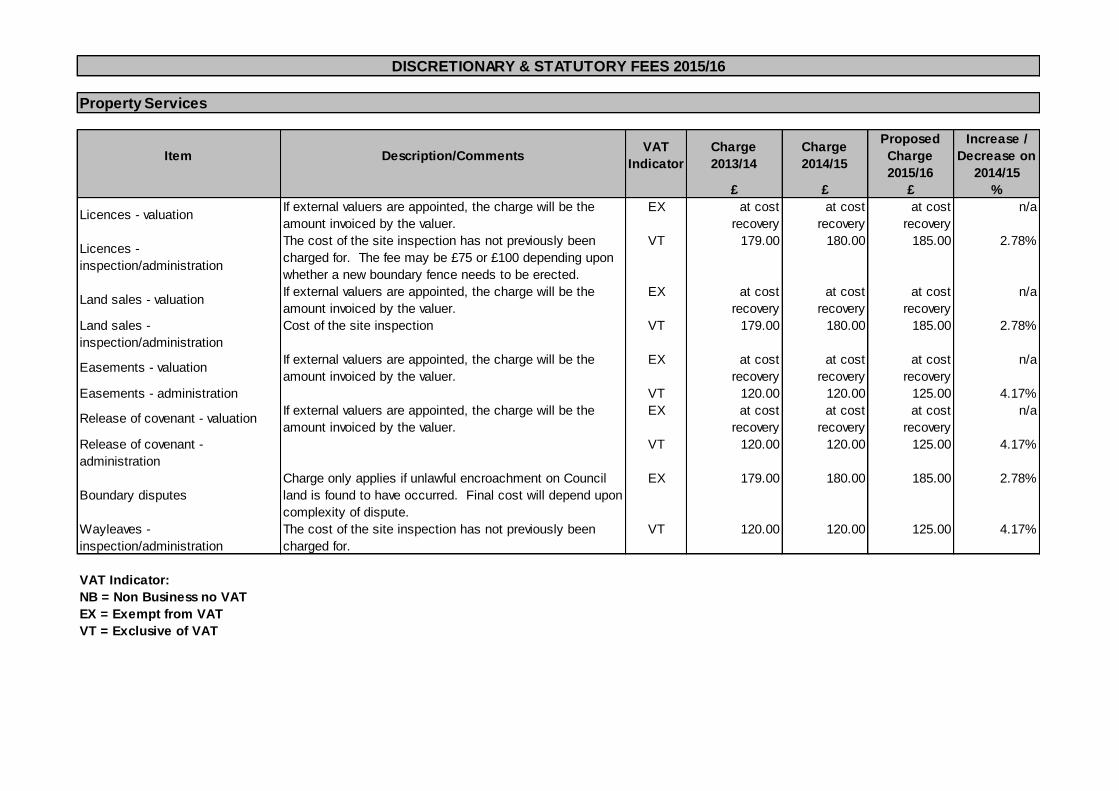
Property Services
Item Description/CommentsVAT
Indicator
Charge
2013/14
Charge
2014/15
Proposed
Charge
2015/16
Increase /
Decrease on
2014/15
£ £ £ %
Licences - valuation If external valuers are appointed, the charge will be the
amount invoiced by the valuer.
EX at cost
recovery
at cost
recovery
at cost
recovery
n/a
Licences -
inspection/administration
The cost of the site inspection has not previously been
charged for. The fee may be £75 or £100 depending upon
whether a new boundary fence needs to be erected.
VT 179.00 180.00 185.00 2.78%
Land sales - valuation If external valuers are appointed, the charge will be the
amount invoiced by the valuer.
EX at cost
recovery
at cost
recovery
at cost
recovery
n/a
Land sales -
inspection/administration
Cost of the site inspection VT 179.00 180.00 185.00 2.78%
Easements - valuation If external valuers are appointed, the charge will be the
amount invoiced by the valuer.
EX at cost
recovery
at cost
recovery
at cost
recovery
n/a
Easements - administration VT 120.00 120.00 125.00 4.17%
Release of covenant - valuationIf external valuers are appointed, the charge will be the
amount invoiced by the valuer.
EX at cost
recovery
at cost
recovery
at cost
recovery
n/a
Release of covenant -
administration
VT 120.00 120.00 125.00 4.17%
Boundary disputes
Charge only applies if unlawful encroachment on Council
land is found to have occurred. Final cost will depend upon
complexity of dispute.
EX 179.00 180.00 185.00 2.78%
Wayleaves -
inspection/administration
The cost of the site inspection has not previously been
charged for.
VT 120.00 120.00 125.00 4.17%
VAT Indicator:
NB = Non Business no VAT
EX = Exempt from VAT
VT = Exclusive of VAT
DISCRETIONARY & STATUTORY FEES 2015/16
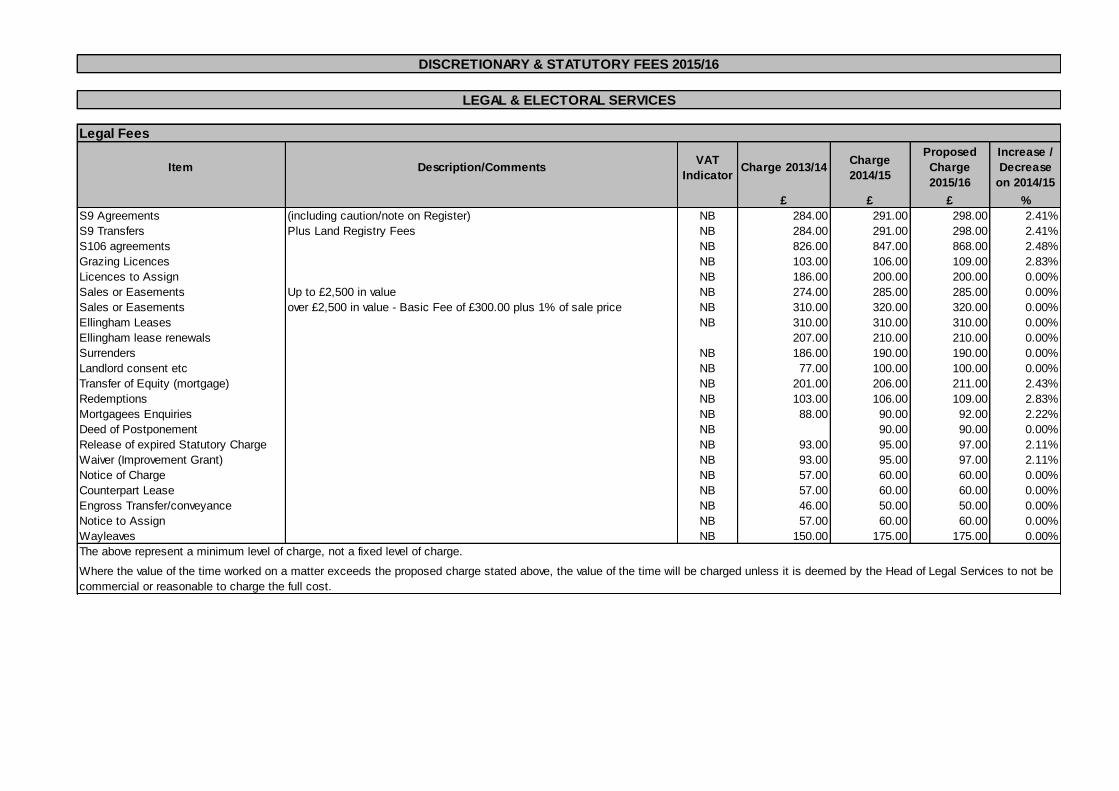
Legal Fees
Item Description/CommentsVAT
IndicatorCharge 2013/14
Charge
2014/15
Proposed
Charge
2015/16
Increase /
Decrease
on 2014/15
£ £ £ %
S9 Agreements (including caution/note on Register) NB 284.00 291.00 298.00 2.41%
S9 Transfers Plus Land Registry Fees NB 284.00 291.00 298.00 2.41%
S106 agreements NB 826.00 847.00 868.00 2.48%
Grazing Licences NB 103.00 106.00 109.00 2.83%
Licences to Assign NB 186.00 200.00 200.00 0.00%
Sales or Easements Up to £2,500 in value NB 274.00 285.00 285.00 0.00%
Sales or Easements over £2,500 in value - Basic Fee of £300.00 plus 1% of sale price NB 310.00 320.00 320.00 0.00%
Ellingham Leases NB 310.00 310.00 310.00 0.00%
Ellingham lease renewals 207.00 210.00 210.00 0.00%
Surrenders NB 186.00 190.00 190.00 0.00%
Landlord consent etc NB 77.00 100.00 100.00 0.00%
Transfer of Equity (mortgage) NB 201.00 206.00 211.00 2.43%
Redemptions NB 103.00 106.00 109.00 2.83%
Mortgagees Enquiries NB 88.00 90.00 92.00 2.22%
Deed of Postponement NB 90.00 90.00 0.00%
Release of expired Statutory Charge NB 93.00 95.00 97.00 2.11%
Waiver (Improvement Grant) NB 93.00 95.00 97.00 2.11%
Notice of Charge NB 57.00 60.00 60.00 0.00%
Counterpart Lease NB 57.00 60.00 60.00 0.00%
Engross Transfer/conveyance NB 46.00 50.00 50.00 0.00%
Notice to Assign NB 57.00 60.00 60.00 0.00%
Wayleaves NB 150.00 175.00 175.00 0.00%
The above represent a minimum level of charge, not a fixed level of charge.
Where the value of the time worked on a matter exceeds the proposed charge stated above, the value of the time will be charged unless it is deemed by the Head of Legal Services to not be
commercial or reasonable to charge the full cost.
DISCRETIONARY & STATUTORY FEES 2015/16
LEGAL & ELECTORAL SERVICES
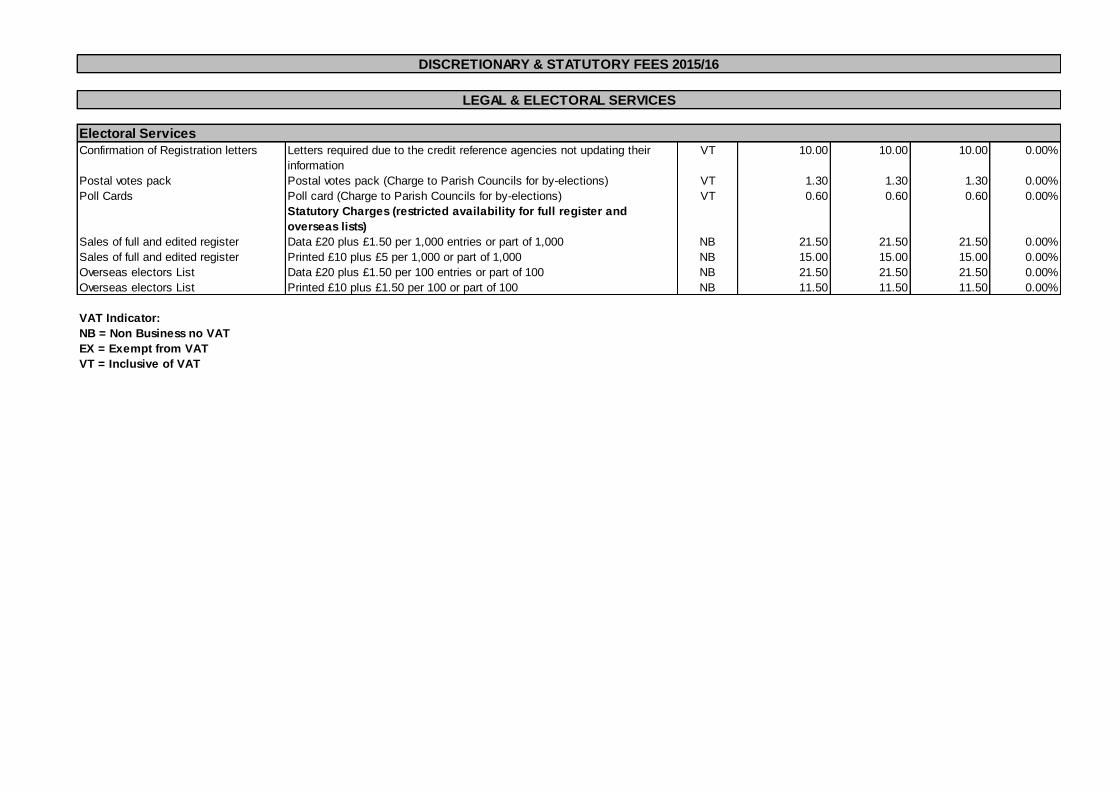
Electoral Services
Confirmation of Registration letters Letters required due to the credit reference agencies not updating their
information
VT 10.00 10.00 10.00 0.00%
Postal votes pack Postal votes pack (Charge to Parish Councils for by-elections) VT 1.30 1.30 1.30 0.00%
Poll Cards Poll card (Charge to Parish Councils for by-elections) VT 0.60 0.60 0.60 0.00%
Statutory Charges (restricted availability for full register and
overseas lists)
Sales of full and edited register Data £20 plus £1.50 per 1,000 entries or part of 1,000 NB 21.50 21.50 21.50 0.00%
Sales of full and edited register Printed £10 plus £5 per 1,000 or part of 1,000 NB 15.00 15.00 15.00 0.00%
Overseas electors List Data £20 plus £1.50 per 100 entries or part of 100 NB 21.50 21.50 21.50 0.00%
Overseas electors List Printed £10 plus £1.50 per 100 or part of 100 NB 11.50 11.50 11.50 0.00%
VAT Indicator:
NB = Non Business no VAT
EX = Exempt from VAT
VT = Inclusive of VAT
DISCRETIONARY & STATUTORY FEES 2015/16
LEGAL & ELECTORAL SERVICES
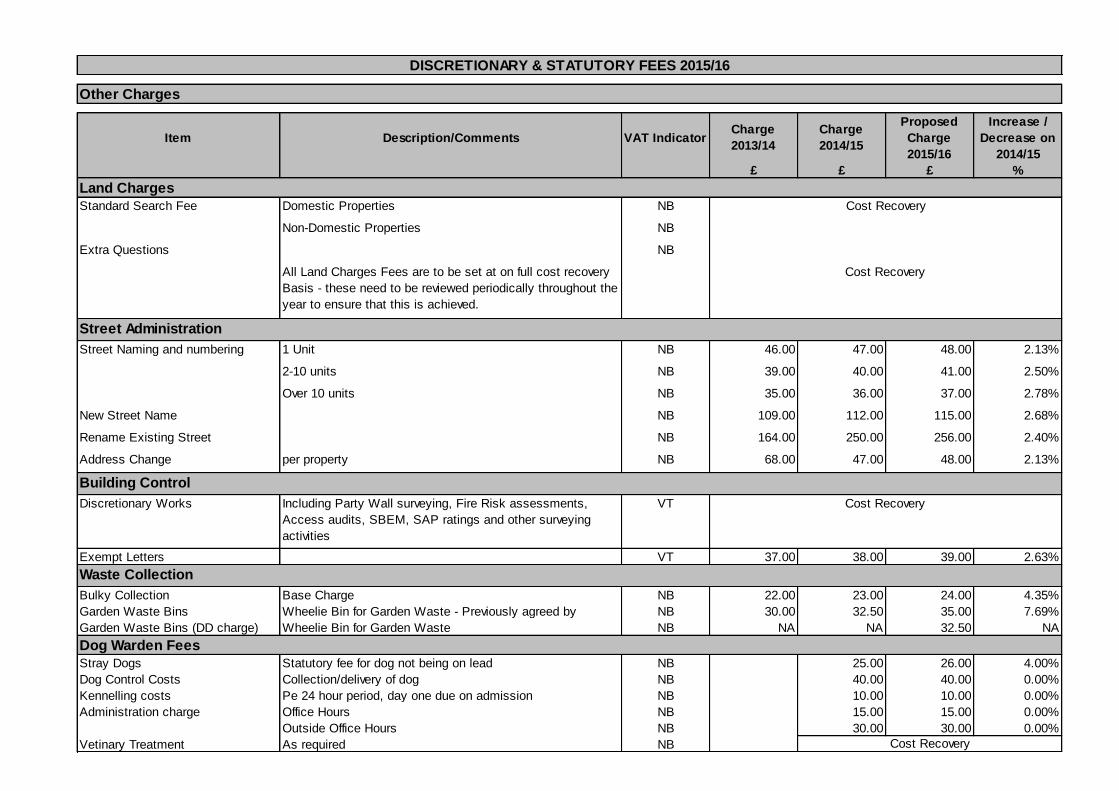
Other Charges
Item Description/Comments VAT IndicatorCharge
2013/14
Charge
2014/15
Proposed
Charge
2015/16
Increase /
Decrease on
2014/15
£ £ £ %
Land Charges
Standard Search Fee Domestic Properties NB
Non-Domestic Properties NB
Extra Questions NB
All Land Charges Fees are to be set at on full cost recovery
Basis - these need to be reviewed periodically throughout the
year to ensure that this is achieved.
Street Administration
Street Naming and numbering 1 Unit NB 46.00 47.00 48.00 2.13%
2-10 units NB 39.00 40.00 41.00 2.50%
Over 10 units NB 35.00 36.00 37.00 2.78%
New Street Name NB 109.00 112.00 115.00 2.68%
Rename Existing Street NB 164.00 250.00 256.00 2.40%
Address Change per property NB 68.00 47.00 48.00 2.13%
Building Control
Discretionary Works Including Party Wall surveying, Fire Risk assessments,
Access audits, SBEM, SAP ratings and other surveying
activities
VT
Exempt Letters VT 37.00 38.00 39.00 2.63%
Waste Collection
Bulky Collection Base Charge NB 22.00 23.00 24.00 4.35%
Garden Waste Bins Wheelie Bin for Garden Waste - Previously agreed by NB 30.00 32.50 35.00 7.69%
Garden Waste Bins (DD charge) Wheelie Bin for Garden Waste NB NA NA 32.50 NA
Dog Warden Fees
Stray Dogs Statutory fee for dog not being on lead NB 25.00 26.00 4.00%
Dog Control Costs Collection/delivery of dog NB 40.00 40.00 0.00%
Kennelling costs Pe 24 hour period, day one due on admission NB 10.00 10.00 0.00%
Administration charge Office Hours NB 15.00 15.00 0.00%
Outside Office Hours NB 30.00 30.00 0.00%
Vetinary Treatment As required NB
Cost Recovery
DISCRETIONARY & STATUTORY FEES 2015/16
Cost Recovery
Cost Recovery
Cost Recovery
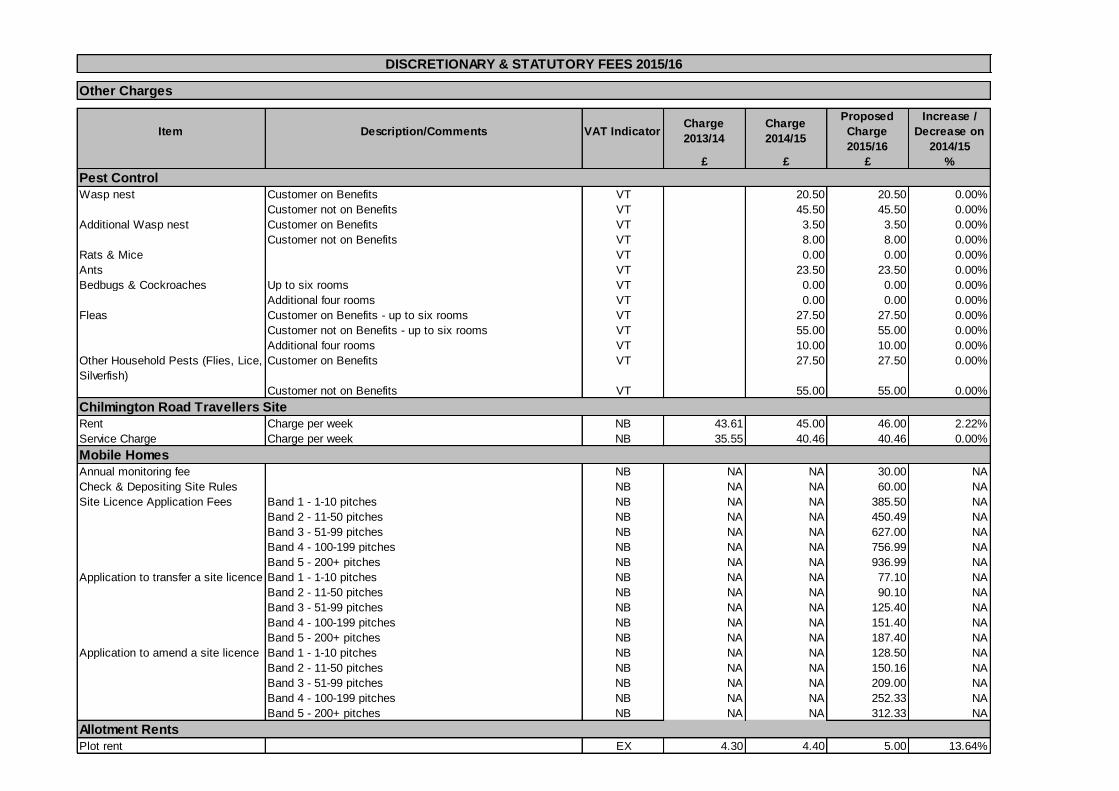
Other Charges
Item Description/Comments VAT IndicatorCharge
2013/14
Charge
2014/15
Proposed
Charge
2015/16
Increase /
Decrease on
2014/15
£ £ £ %
Pest Control
Wasp nest Customer on Benefits VT 20.50 20.50 0.00%
Customer not on Benefits VT 45.50 45.50 0.00%
Additional Wasp nest Customer on Benefits VT 3.50 3.50 0.00%
Customer not on Benefits VT 8.00 8.00 0.00%
Rats & Mice VT 0.00 0.00 0.00%
Ants VT 23.50 23.50 0.00%
Bedbugs & Cockroaches Up to six rooms VT 0.00 0.00 0.00%
Additional four rooms VT 0.00 0.00 0.00%
Fleas Customer on Benefits - up to six rooms VT 27.50 27.50 0.00%
Customer not on Benefits - up to six rooms VT 55.00 55.00 0.00%
Additional four rooms VT 10.00 10.00 0.00%
Other Household Pests (Flies, Lice,
Silverfish)
Customer on Benefits VT 27.50 27.50 0.00%
Customer not on Benefits VT 55.00 55.00 0.00%
Rent Charge per week NB 43.61 45.00 46.00 2.22%
Service Charge Charge per week NB 35.55 40.46 40.46 0.00%
Annual monitoring fee NB NA NA 30.00 NA
Check & Depositing Site Rules NB NA NA 60.00 NA
Site Licence Application Fees Band 1 - 1-10 pitches NB NA NA 385.50 NA
Band 2 - 11-50 pitches NB NA NA 450.49 NA
Band 3 - 51-99 pitches NB NA NA 627.00 NA
Band 4 - 100-199 pitches NB NA NA 756.99 NA
Band 5 - 200+ pitches NB NA NA 936.99 NA
Application to transfer a site licence Band 1 - 1-10 pitches NB NA NA 77.10 NA
Band 2 - 11-50 pitches NB NA NA 90.10 NA
Band 3 - 51-99 pitches NB NA NA 125.40 NA
Band 4 - 100-199 pitches NB NA NA 151.40 NA
Band 5 - 200+ pitches NB NA NA 187.40 NA
Application to amend a site licence Band 1 - 1-10 pitches NB NA NA 128.50 NA
Band 2 - 11-50 pitches NB NA NA 150.16 NA
Band 3 - 51-99 pitches NB NA NA 209.00 NA
Band 4 - 100-199 pitches NB NA NA 252.33 NA
Band 5 - 200+ pitches NB NA NA 312.33 NA
Allotment Rents
Plot rent EX 4.30 4.40 5.00 13.64%
Chilmington Road Travellers Site
DISCRETIONARY & STATUTORY FEES 2015/16
Mobile Homes
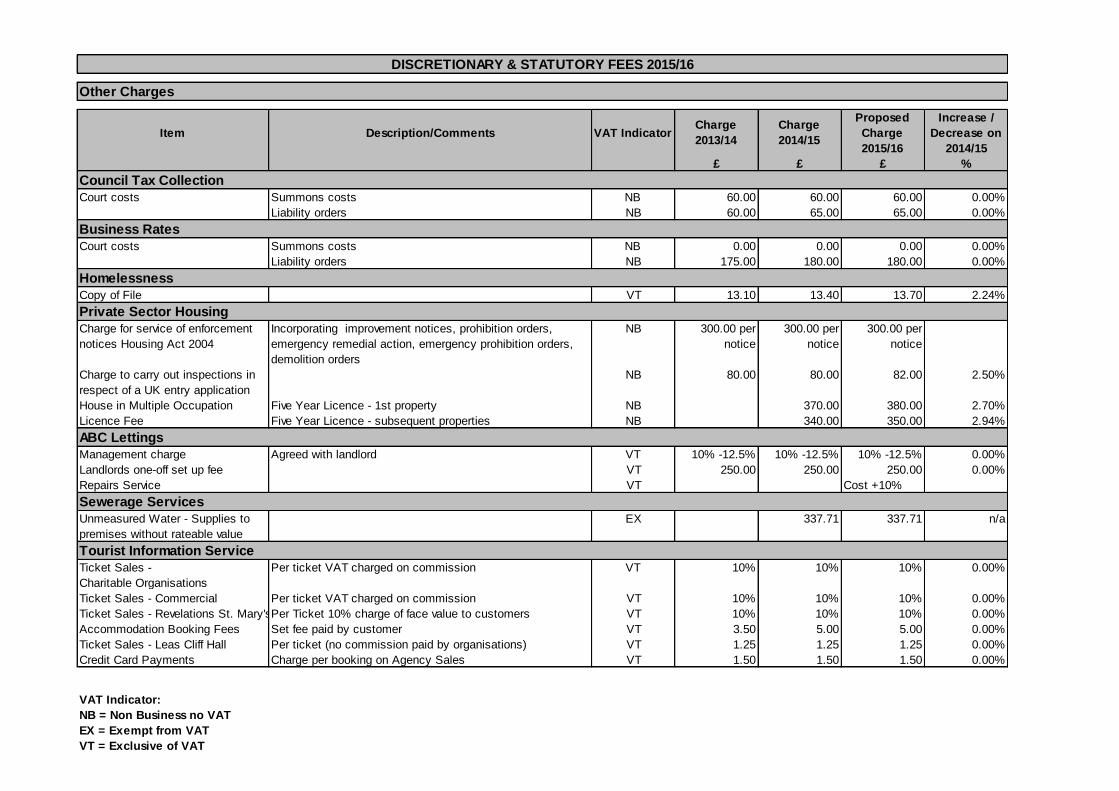
Other Charges
Item Description/Comments VAT IndicatorCharge
2013/14
Charge
2014/15
Proposed
Charge
2015/16
Increase /
Decrease on
2014/15
£ £ £ %
Council Tax Collection
Court costs Summons costs NB 60.00 60.00 60.00 0.00%
Liability orders NB 60.00 65.00 65.00 0.00%
Business Rates
Court costs Summons costs NB 0.00 0.00 0.00 0.00%
Liability orders NB 175.00 180.00 180.00 0.00%
Homelessness
Copy of File VT 13.10 13.40 13.70 2.24%
Private Sector Housing
Charge for service of enforcement
notices Housing Act 2004
Incorporating improvement notices, prohibition orders,
emergency remedial action, emergency prohibition orders,
demolition orders
NB 300.00 per
notice
300.00 per
notice
300.00 per
notice
Charge to carry out inspections in
respect of a UK entry application
NB 80.00 80.00 82.00 2.50%
Five Year Licence - 1st property NB 370.00 380.00 2.70%
Five Year Licence - subsequent properties NB 340.00 350.00 2.94%
ABC Lettings
Management charge Agreed with landlord VT 10% -12.5% 10% -12.5% 10% -12.5% 0.00%
Landlords one-off set up fee VT 250.00 250.00 250.00 0.00%
Repairs Service VT Cost +10%
Sewerage Services
Unmeasured Water - Supplies to
premises without rateable value
EX 337.71 337.71 n/a
Tourist Information Service
Ticket Sales -
Charitable Organisations
Per ticket VAT charged on commission VT 10% 10% 10% 0.00%
Ticket Sales - Commercial Per ticket VAT charged on commission VT 10% 10% 10% 0.00%
Ticket Sales - Revelations St. Mary'sPer Ticket 10% charge of face value to customers VT 10% 10% 10% 0.00%
Accommodation Booking Fees Set fee paid by customer VT 3.50 5.00 5.00 0.00%
Ticket Sales - Leas Cliff Hall Per ticket (no commission paid by organisations) VT 1.25 1.25 1.25 0.00%
Credit Card Payments Charge per booking on Agency Sales VT 1.50 1.50 1.50 0.00%
VAT Indicator:
NB = Non Business no VAT
EX = Exempt from VAT
VT = Exclusive of VAT
House in Multiple Occupation
Licence Fee
DISCRETIONARY & STATUTORY FEES 2015/16

This page has been intentionally left blank

This page has been intentionally left blank

This page has been intentionally left blank