Embed Size (px)
Citation preview
National TreasuryDepartment:
REPUBLIC OF SOUTH AFRICA
Budget 2014EstimatEs of NatioNal ExpENditurE
VOTE 24 JusTice and consTiTuTional developmenT

Estim
ates o
f Natio
na
l expen
ditu
re
Estimates of
National Expenditure
2014
National Treasury
Republic of South Africa
26 February 2014
ISBN: 978-0-621-42406-5
RP: 01/2014
The Estimates of National Expenditure 2014 e-publications are compiled with the latest available information from
departmental and other sources. Some of this information is unaudited or subject to revision.
The Estimates of National Expenditure e-publications for individual votes are available on www.treasury.gov.za.
Compared to the abridged version of the Estimates of National Expenditure, which includes all national government budget
votes, in respect of individual votes these e-publications contain more comprehensive coverage of goods and services,
transfers and subsidies, and public entities. Additional tables are also included containing information on the main and
adjusted appropriation, with revised spending estimates for the current financial year, on skills training, conditional grants
to provinces and municipalities, public private partnerships and information on donor funding. Expenditure information at
the level of service delivery is also included, where appropriate.

Foreword
The national development plan, Vision 2030 of the government of South Africa, states that ‘Alongside hard
work and effort, capabilities and the opportunities that flow from development enable individuals to live the
lives to which they aspire.’ The 2014 Budget has been prepared in the spirit of this statement.
While the medium term expenditure framework (MTEF) contained in the 2014 Budget ushers in the new
administration after the May elections, the country faces a markedly different situation from that of 2009.
In 2006/07 and 2007/08, South Africa achieved budget surpluses. In 2008, however, the worldwide economic
crisis meant budget deficit forecasts were inevitable. It is now clear that the recovery in real economic growth
has been less robust than initially anticipated. Despite this, the economy is growing and government revenue
collection is broadly on target. The 2009 Budget announced a ‘haircut’ and reprioritisation within budget
baselines. At that stage, the reassignment of R19 billion comprised 12 per cent of the total monetary value of
amendments to budgets made, of R160.6 billion. By contrast, the reassignment of the R19.6 billion in the
2014 Budget comprises 51 per cent of the total of R38.8 billion in amendments to budgets. The quantum of
amendments to the total budget that can be made has clearly decreased substantially over time.
Despite the fiscal environment becoming increasingly constrained, National Treasury has been able to sustain
the intensity of the pursuit for budget efficiencies, with most of the fiscal space for improvements to service
delivery being made through reprioritisation. This will be reinforced by procurement reform and expenditure
review initiatives. While the current fiscal position no longer automatically creates room by making additional
funding available, progress towards our country objectives of inclusive economic growth and employment
creation must be made in the face of a tough fiscal environment. Therefore the main budget non-interest
aggregate expenditure ceiling established in the 2013 Budget remains intact. New priorities and the expansion
of existing programmes must be achieved through reprioritisation within the existing resource envelope.
The current fiscal context is necessitating hard trade-offs: difficult choices will need to be made in choosing
between spending priorities and in deciding on the sequencing of programme implementation. Given the
constraints brought to bear by the expenditure ceiling, all government institutions need to manage any cost
pressures that may be related to changes in the inflation rate, exchange rate or any other factors affecting input
prices with great efficiency. This means that not everything that we believe must be done, can be done at once.
In the reprioritisation of existing funds, certain outputs will have to be delayed, or discontinued.
The issue is what goods and services tax-payers’ monies ‘buy’. In keeping with the ongoing endeavour to
improve transparency and reinforce accountability, the focus of the sections on budget programme expenditure
trends within each vote in the 2014 Estimates of National Expenditure (ENE) publications has shifted, to an
explanation of the interrelationship between the significant changes in spending, performance outputs and
outcomes, and in personnel.
National Treasury teams have worked closely with policy and budget teams of national and provincial
departments, as well as with public entities and local government, ensuring the alignment of policy
developments with the national development plan and scrutinising spending trends and cost drivers, ever
mindful of service delivery. Without this cooperation and commitment across government, it would not be
possible to submit the credible and comprehensive institutional budgets contained in this publication. The
political guidance of the Minister of Finance, his Deputy and the members of the ministers’ committee on the
budget, has been indispensable to the medium term expenditure committee of accounting officers of
departments at the centre of government, in its task of providing the strategic direction in formulating the
budget. I thank you all for your assistance.
Lungisa Fuzile Director-General: National Treasury

Introduction
The Estimates of National Expenditure publications
The Estimates of National Expenditure (ENE) publications are important accountability documents, which set
out the details of planned expenditure and planned performance at the time the Budget is tabled. The 2014 ENE
publications largely retain the same layout of information as presented in previous years’ publications. This
allows information to be easily compared across publications and financial years. As in the past, information is
presented for a seven-year period and contains details of all national departmental programmes and
subprogrammes. Information is presented in a similar way for the national public entities related to each
department. For the first time in the ENE publications, in 2014, information on changes in finances, personnel
and performance is brought together with the focus on the significant interrelationships between these changes.
This discussion, in the expenditure trends sections of the budget programmes in each chapter, allows the reader
to assess the effectiveness of past, as well as of planned, spending.
When compared to the abridged version of the ENE, which includes all national government votes, the ENE e-
publications provide more detailed expenditure information for individual votes on goods and services as well
as transfers and subsidies. While the abridged version of the ENE contains one additional table at the end of
each vote which has information on infrastructure spending, the ENE e-publications’ additional tables also
contain summaries of: the budgeted expenditure and revised estimate for 2013/14, and the audited outcome for
2012/13, by programme and economic classification; expenditure on training; conditional grants to provinces
and municipalities; departmental public private partnerships; and donor funding. In selected cases more detailed
information at the level of the site of service delivery is included. Budget information is also provided for the
public entities that are simply listed in the abridged publication.
A separate ENE Overview e-publication is also available, which contains a description at the main budget non-
interest level, summarising the Estimates of National Expenditure publication information across votes. The
Overview contains this narrative explanation and summary tables; and also has a write-up on interpreting the
information that is contained in each section of the publications.

Justice and Constitutional Development
National Treasury
Republic of South Africa
Contents
Budget summary .............................................................................................................................. 1
Aim .................................................................................................................................................... 1
Mandate ............................................................................................................................................. 1
Strategic goals .................................................................................................................................. 1
Programme purposes ...................................................................................................................... 2
Selected performance indicators .................................................................................................... 2
The national development plan ....................................................................................................... 3
Expenditure estimates ..................................................................................................................... 4
Personnel information ..................................................................................................................... 5
Expenditure trends ........................................................................................................................... 5
Departmental receipts ...................................................................................................................... 6
Programme 1: Administration ......................................................................................................... 7
Programme 2: Court Services ......................................................................................................... 9
Programme 3: State Legal Services ............................................................................................... 14
Programme 4: National Prosecuting Authority ............................................................................. 18
Programme 5: Auxiliary and Associated Services ........................................................................ 22
Public entities and other agencies ................................................................................................. 24
Additional tables ............................................................................................................................. 35
1
Vote 24 Justice and Constitutional Development
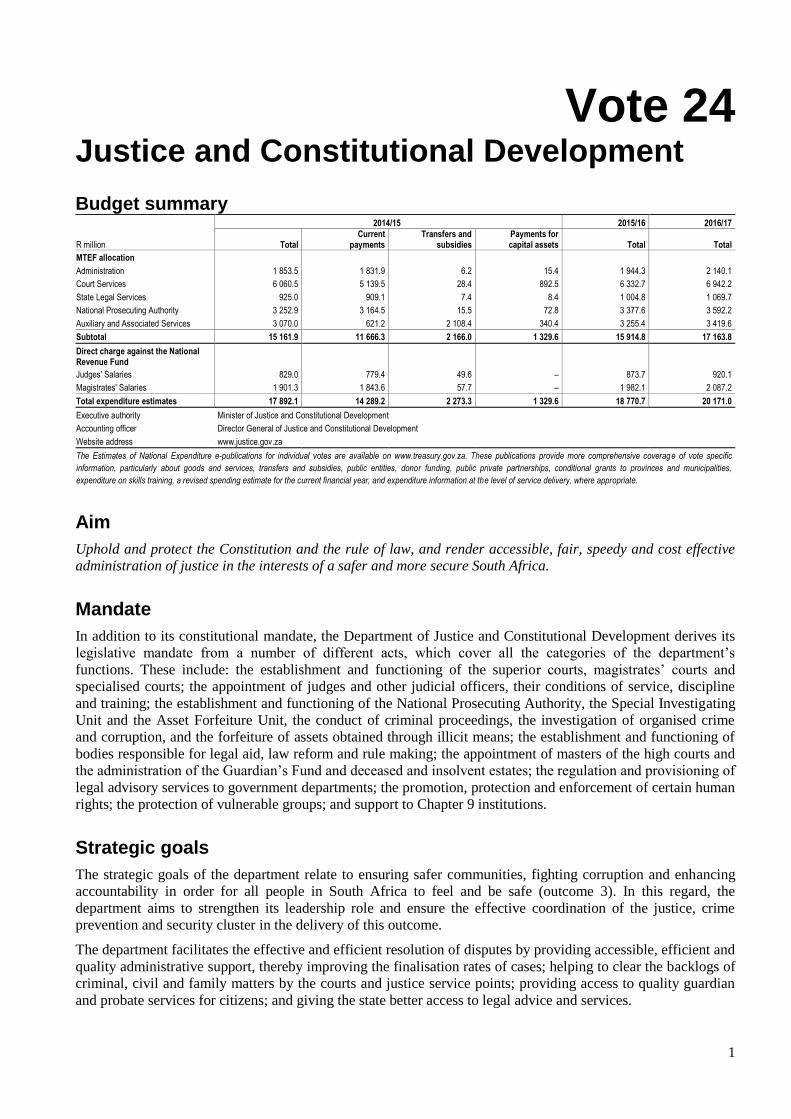
Budget summary 2014/15 2015/16 2016/17
R million Total Current
payments Transfers and
subsidies Payments for capital assets Total Total
MTEF allocation
Administration 1 853.5 1 831.9 6.2 15.4 1 944.3 2 140.1
Court Services 6 060.5 5 139.5 28.4 892.5 6 332.7 6 942.2
State Legal Services 925.0 909.1 7.4 8.4 1 004.8 1 069.7
National Prosecuting Authority 3 252.9 3 164.5 15.5 72.8 3 377.6 3 592.2
Auxiliary and Associated Services 3 070.0 621.2 2 108.4 340.4 3 255.4 3 419.6
Subtotal 15 161.9 11 666.3 2 166.0 1 329.6 15 914.8 17 163.8
Direct charge against the National Revenue Fund
Judges' Salaries 829.0 779.4 49.6 – 873.7 920.1
Magistrates' Salaries 1 901.3 1 843.6 57.7 – 1 982.1 2 087.2
Total expenditure estimates 17 892.1 14 289.2 2 273.3 1 329.6 18 770.7 20 171.0
Executive authority Minister of Justice and Constitutional Development
Accounting officer Director General of Justice and Constitutional Development
Website address www.justice.gov.za
The Estimates of National Expenditure e-publications for individual votes are available on www.treasury.gov.za. These publications provide more comprehensive coverage of vote specific
information, particularly about goods and services, transfers and subsidies, public entities, donor funding, public private partnerships, conditional grants to provinces and municipalities,
expenditure on skills training, a revised spending estimate for the current financial year, and expenditure information at the level of service delivery, where appropriate.
Aim
Uphold and protect the Constitution and the rule of law, and render accessible, fair, speedy and cost effective
administration of justice in the interests of a safer and more secure South Africa.
Mandate
In addition to its constitutional mandate, the Department of Justice and Constitutional Development derives its
legislative mandate from a number of different acts, which cover all the categories of the department’s
functions. These include: the establishment and functioning of the superior courts, magistrates’ courts and
specialised courts; the appointment of judges and other judicial officers, their conditions of service, discipline
and training; the establishment and functioning of the National Prosecuting Authority, the Special Investigating
Unit and the Asset Forfeiture Unit, the conduct of criminal proceedings, the investigation of organised crime
and corruption, and the forfeiture of assets obtained through illicit means; the establishment and functioning of
bodies responsible for legal aid, law reform and rule making; the appointment of masters of the high courts and
the administration of the Guardian’s Fund and deceased and insolvent estates; the regulation and provisioning of
legal advisory services to government departments; the promotion, protection and enforcement of certain human
rights; the protection of vulnerable groups; and support to Chapter 9 institutions.
Strategic goals
The strategic goals of the department relate to ensuring safer communities, fighting corruption and enhancing
accountability in order for all people in South Africa to feel and be safe (outcome 3). In this regard, the
department aims to strengthen its leadership role and ensure the effective coordination of the justice, crime
prevention and security cluster in the delivery of this outcome.
The department facilitates the effective and efficient resolution of disputes by providing accessible, efficient and
quality administrative support, thereby improving the finalisation rates of cases; helping to clear the backlogs of
criminal, civil and family matters by the courts and justice service points; providing access to quality guardian
and probate services for citizens; and giving the state better access to legal advice and services.
2014 Estimates of National Expenditure
2
In addition, the department will direct its attention to the provision of effective and cost efficient state legal
services that anticipate, meet and exceed stakeholder needs and expectations, thereby reducing the exposure of
government to legal risk. The developmental function of the department is to promote the ability of citizens to
exercise their constitutional rights by assisting other departments to comply with the Promotion of
Administrative Justice Act (2000). The strategic goal of the National Prosecuting Authority is to improve the
delivery of justice for victims of crime.
Programme purposes
Programme 1: Administration
Purpose: Manage the department, develop policies and strategies for the efficient administration of justice, and
provide centralised support services.
Programme 2: Court Services
Purpose: Facilitate the resolution of criminal and civil cases and family law disputes by providing accessible,
efficient and quality administrative support to the courts and managing court facilities.
Programme 3: State Legal Services
Purpose: Provide legal and legislative services to government. Supervise the registration of trusts and the
administration of deceased and insolvent estates and estates undergoing liquidation. Manage the Guardian’s
Fund, prepare and promote legislation, facilitate constitutional development and undertake research in support
of this.
Programme 4: National Prosecuting Authority
Purpose: Provide a coordinated prosecuting service that: ensures justice is delivered to the victims of crime
through general and specialised prosecutions; removes the profit from crime; and protects certain witnesses.
Programme 5: Auxiliary and Associated Services
Purpose: Provide a variety of auxiliary services associated with the department’s aim. Fund transfer payments
to the South African Human Rights Commission, the Public Protector of South Africa, Legal Aid South Africa,
the Special Investigating Unit and the President’s Fund.
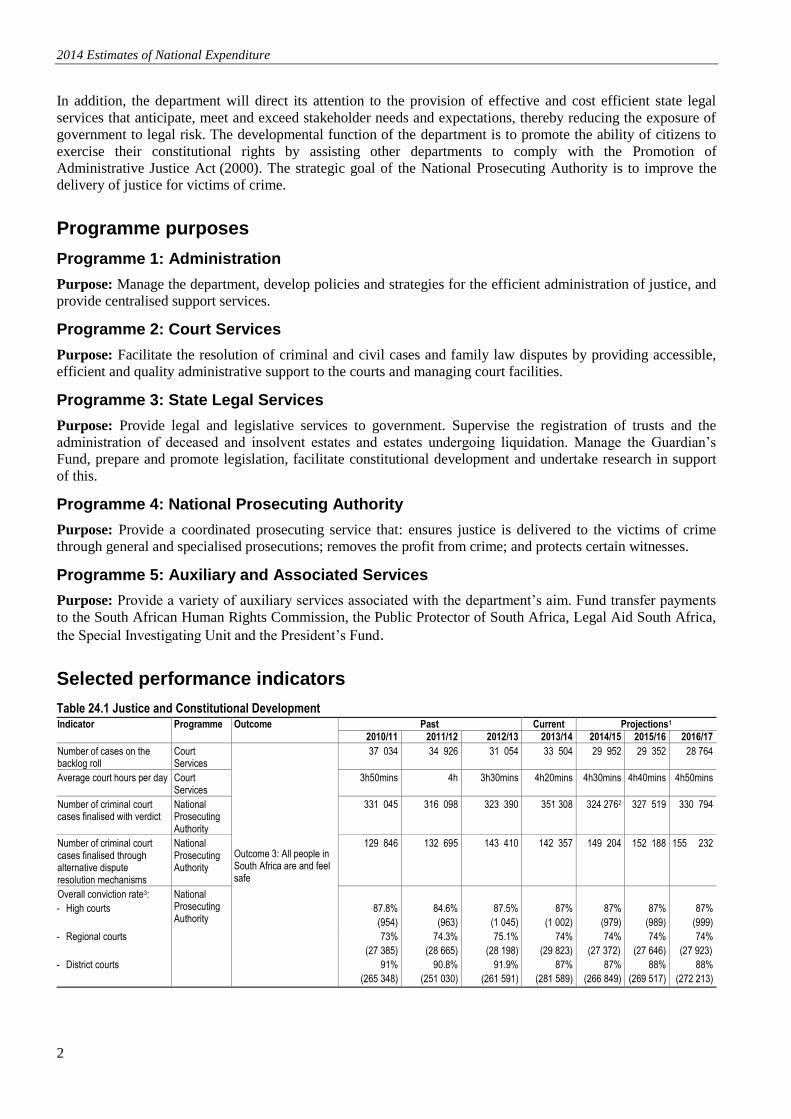
Selected performance indicators
Table 24.1 Justice and Constitutional Development Indicator Programme Outcome Past Current Projections1
2010/11 2011/12 2012/13 2013/14 2014/15 2015/16 2016/17
Number of cases on the backlog roll
Court Services
Outcome 3: All people in South Africa are and feel safe
37 034 34 926 31 054 33 504 29 952 29 352 28 764
Average court hours per day Court Services
3h50mins 4h 3h30mins 4h20mins 4h30mins 4h40mins 4h50mins
Number of criminal court cases finalised with verdict
National Prosecuting Authority
331 045 316 098 323 390 351 308 324 2762 327 519 330 794
Number of criminal court cases finalised through alternative dispute resolution mechanisms
National Prosecuting Authority
129 846 132 695 143 410 142 357 149 204 152 188 155 232
Overall conviction rate3:
- High courts
National Prosecuting Authority
87.8%
(954)
84.6%
(963)
87.5%
(1 045)
87%
(1 002)
87%
(979)
87%
(989)
87%
(999)
- Regional courts 73%
(27 385)
74.3%
(28 665)
75.1%
(28 198)
74%
(29 823)
74%
(27 372)
74%
(27 646)
74%
(27 923)
- District courts 91%
(265 348)
90.8%
(251 030)
91.9%
(261 591)
87%
(281 589)
87%
(266 849)
88%
(269 517)
88%
(272 213)
Vote 24: Justice and Constitutional Development
3
Ch
ap
ter na
me
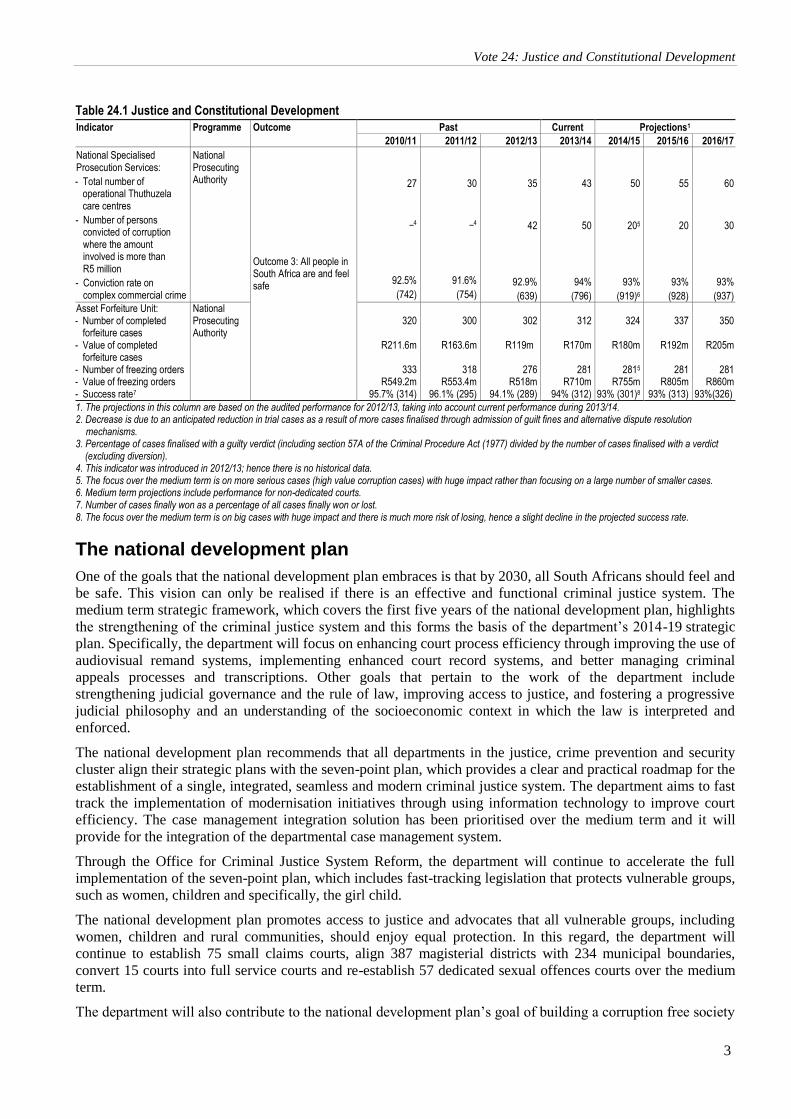
Table 24.1 Justice and Constitutional Development
Indicator Programme Outcome Past Current Projections1
2010/11 2011/12 2012/13 2013/14 2014/15 2015/16 2016/17
National Specialised Prosecution Services:
- Total number of operational Thuthuzela care centres
- Number of persons convicted of corruption where the amount involved is more than R5 million
- Conviction rate on complex commercial crime
National Prosecuting Authority
Outcome 3: All people in South Africa are and feel safe
27
–4
92.5%
(742)
30
–4
91.6%
(754)
35
42
92.9%
(639)
43
50
94%
(796)
50
205
93%
(919)6
55
20
93%
(928)
60
30
93%
(937) Asset Forfeiture Unit: - Number of completed
forfeiture cases - Value of completed
forfeiture cases - Number of freezing orders - Value of freezing orders - Success rate7
National Prosecuting Authority
320
R211.6m
333
R549.2m 95.7% (314)
300
R163.6m
318
R553.4m 96.1% (295)
302
R119m
276
R518m 94.1% (289)
312
R170m
281
R710m 94% (312)
324
R180m
2815
R755m 93% (301)8
337
R192m
281
R805m 93% (313)
350
R205m
281
R860m 93%(326)
1. The projections in this column are based on the audited performance for 2012/13, taking into account current performance during 2013/14. 2. Decrease is due to an anticipated reduction in trial cases as a result of more cases finalised through admission of guilt fines and alternative dispute resolution
mechanisms. 3. Percentage of cases finalised with a guilty verdict (including section 57A of the Criminal Procedure Act (1977) divided by the number of cases finalised with a verdict
(excluding diversion). 4. This indicator was introduced in 2012/13; hence there is no historical data. 5. The focus over the medium term is on more serious cases (high value corruption cases) with huge impact rather than focusing on a large number of smaller cases. 6. Medium term projections include performance for non-dedicated courts. 7. Number of cases finally won as a percentage of all cases finally won or lost. 8. The focus over the medium term is on big cases with huge impact and there is much more risk of losing, hence a slight decline in the projected success rate.
The national development plan
One of the goals that the national development plan embraces is that by 2030, all South Africans should feel and
be safe. This vision can only be realised if there is an effective and functional criminal justice system. The
medium term strategic framework, which covers the first five years of the national development plan, highlights
the strengthening of the criminal justice system and this forms the basis of the department’s 2014-19 strategic
plan. Specifically, the department will focus on enhancing court process efficiency through improving the use of
audiovisual remand systems, implementing enhanced court record systems, and better managing criminal
appeals processes and transcriptions. Other goals that pertain to the work of the department include
strengthening judicial governance and the rule of law, improving access to justice, and fostering a progressive
judicial philosophy and an understanding of the socioeconomic context in which the law is interpreted and
enforced.
The national development plan recommends that all departments in the justice, crime prevention and security
cluster align their strategic plans with the seven-point plan, which provides a clear and practical roadmap for the
establishment of a single, integrated, seamless and modern criminal justice system. The department aims to fast
track the implementation of modernisation initiatives through using information technology to improve court
efficiency. The case management integration solution has been prioritised over the medium term and it will
provide for the integration of the departmental case management system.
Through the Office for Criminal Justice System Reform, the department will continue to accelerate the full
implementation of the seven-point plan, which includes fast-tracking legislation that protects vulnerable groups,
such as women, children and specifically, the girl child.
The national development plan promotes access to justice and advocates that all vulnerable groups, including
women, children and rural communities, should enjoy equal protection. In this regard, the department will
continue to establish 75 small claims courts, align 387 magisterial districts with 234 municipal boundaries,
convert 15 courts into full service courts and re-establish 57 dedicated sexual offences courts over the medium
term.
The department will also contribute to the national development plan’s goal of building a corruption free society
2014 Estimates of National Expenditure
4
by continuing to strengthen the investigative capacity of the Public Protector of South Africa and the Special
Investigating Unit. The number of investigative capacity practitioners in these two institutions will increase
from 467 in 2013/14 to 564 in 2016/17.
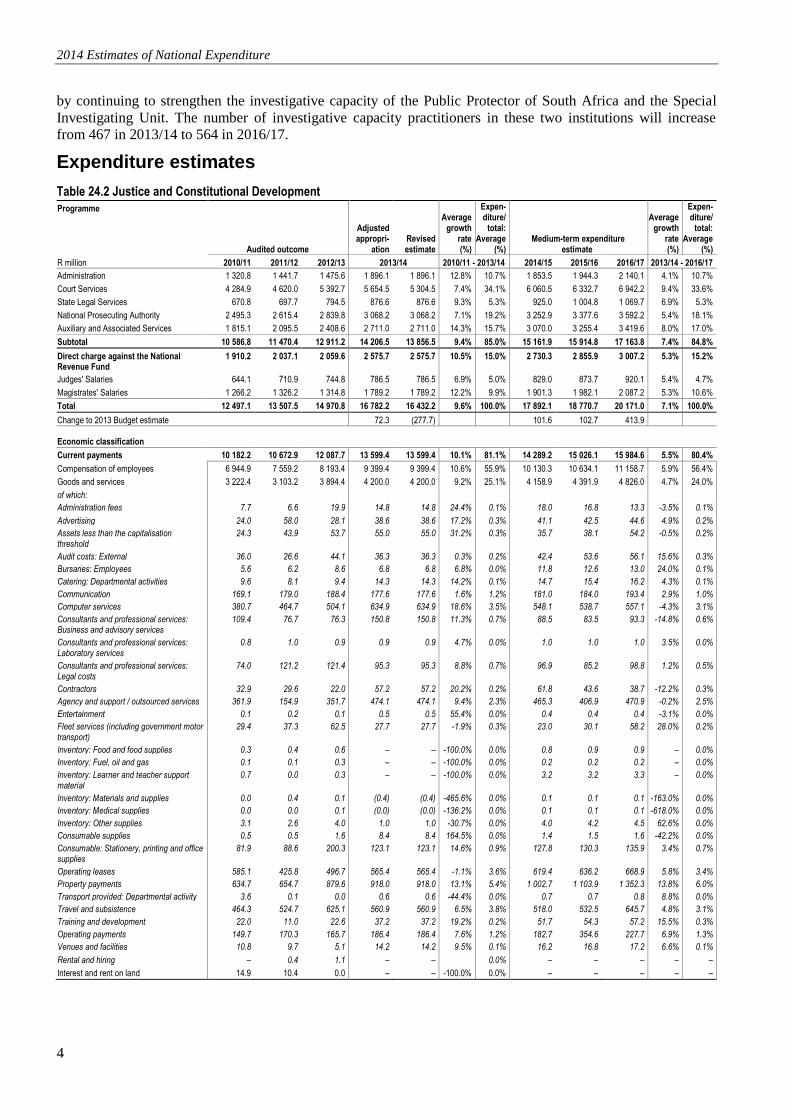
Expenditure estimates
Table 24.2 Justice and Constitutional Development
Programme
Audited outcome
Adjusted appropri-
ation Revised estimate
Average growth
rate (%)
Expen- diture/
total: Average
(%) Medium-term expenditure
estimate
Average growth
rate (%)
Expen- diture/
total: Average
(%)
R million 2010/11 2011/12 2012/13 2013/14 2010/11 - 2013/14 2014/15 2015/16 2016/17 2013/14 - 2016/17
Administration 1 320.8 1 441.7 1 475.6 1 896.1 1 896.1 12.8% 10.7% 1 853.5 1 944.3 2 140.1 4.1% 10.7%
Court Services 4 284.9 4 620.0 5 392.7 5 654.5 5 304.5 7.4% 34.1% 6 060.5 6 332.7 6 942.2 9.4% 33.6%
State Legal Services 670.8 697.7 794.5 876.6 876.6 9.3% 5.3% 925.0 1 004.8 1 069.7 6.9% 5.3%
National Prosecuting Authority 2 495.3 2 615.4 2 839.8 3 068.2 3 068.2 7.1% 19.2% 3 252.9 3 377.6 3 592.2 5.4% 18.1%
Auxiliary and Associated Services 1 815.1 2 095.5 2 408.6 2 711.0 2 711.0 14.3% 15.7% 3 070.0 3 255.4 3 419.6 8.0% 17.0%
Subtotal 10 586.8 11 470.4 12 911.2 14 206.5 13 856.5 9.4% 85.0% 15 161.9 15 914.8 17 163.8 7.4% 84.8%
Direct charge against the National Revenue Fund
1 910.2 2 037.1 2 059.6 2 575.7 2 575.7 10.5% 15.0% 2 730.3 2 855.9 3 007.2 5.3% 15.2%
Judges' Salaries 644.1 710.9 744.8 786.5 786.5 6.9% 5.0% 829.0 873.7 920.1 5.4% 4.7%
Magistrates' Salaries 1 266.2 1 326.2 1 314.8 1 789.2 1 789.2 12.2% 9.9% 1 901.3 1 982.1 2 087.2 5.3% 10.6%
Total 12 497.1 13 507.5 14 970.8 16 782.2 16 432.2 9.6% 100.0% 17 892.1 18 770.7 20 171.0 7.1% 100.0%
Change to 2013 Budget estimate 72.3 (277.7) 101.6 102.7 413.9
Economic classification
Current payments 10 182.2 10 672.9 12 087.7 13 599.4 13 599.4 10.1% 81.1% 14 289.2 15 026.1 15 984.6 5.5% 80.4%
Compensation of employees 6 944.9 7 559.2 8 193.4 9 399.4 9 399.4 10.6% 55.9% 10 130.3 10 634.1 11 158.7 5.9% 56.4%
Goods and services 3 222.4 3 103.2 3 894.4 4 200.0 4 200.0 9.2% 25.1% 4 158.9 4 391.9 4 826.0 4.7% 24.0%
of which:
Administration fees 7.7 6.6 19.9 14.8 14.8 24.4% 0.1% 18.0 16.8 13.3 -3.5% 0.1%
Advertising 24.0 58.0 28.1 38.6 38.6 17.2% 0.3% 41.1 42.5 44.6 4.9% 0.2%
Assets less than the capitalisation threshold
24.3 43.9 53.7 55.0 55.0 31.2% 0.3% 35.7 38.1 54.2 -0.5% 0.2%
Audit costs: External 36.0 26.6 44.1 36.3 36.3 0.3% 0.2% 42.4 53.6 56.1 15.6% 0.3%
Bursaries: Employees 5.6 6.2 8.6 6.8 6.8 6.8% 0.0% 11.8 12.6 13.0 24.0% 0.1%
Catering: Departmental activities 9.6 8.1 9.4 14.3 14.3 14.2% 0.1% 14.7 15.4 16.2 4.3% 0.1%
Communication 169.1 179.0 188.4 177.6 177.6 1.6% 1.2% 181.0 184.0 193.4 2.9% 1.0%
Computer services 380.7 464.7 504.1 634.9 634.9 18.6% 3.5% 548.1 538.7 557.1 -4.3% 3.1%
Consultants and professional services: Business and advisory services
109.4 76.7 76.3 150.8 150.8 11.3% 0.7% 88.5 83.5 93.3 -14.8% 0.6%
Consultants and professional services: Laboratory services
0.8 1.0 0.9 0.9 0.9 4.7% 0.0% 1.0 1.0 1.0 3.5% 0.0%
Consultants and professional services: Legal costs
74.0 121.2 121.4 95.3 95.3 8.8% 0.7% 96.9 85.2 98.8 1.2% 0.5%
Contractors 32.9 29.6 22.0 57.2 57.2 20.2% 0.2% 61.8 43.6 38.7 -12.2% 0.3%
Agency and support / outsourced services 361.9 154.9 351.7 474.1 474.1 9.4% 2.3% 465.3 406.9 470.9 -0.2% 2.5%
Entertainment 0.1 0.2 0.1 0.5 0.5 55.4% 0.0% 0.4 0.4 0.4 -3.1% 0.0%
Fleet services (including government motor transport)
29.4 37.3 62.5 27.7 27.7 -1.9% 0.3% 23.0 30.1 58.2 28.0% 0.2%
Inventory: Food and food supplies 0.3 0.4 0.6 – – -100.0% 0.0% 0.8 0.9 0.9 – 0.0%
Inventory: Fuel, oil and gas 0.1 0.1 0.3 – – -100.0% 0.0% 0.2 0.2 0.2 – 0.0%
Inventory: Learner and teacher support material
0.7 0.0 0.3 – – -100.0% 0.0% 3.2 3.2 3.3 – 0.0%
Inventory: Materials and supplies 0.0 0.4 0.1 (0.4) (0.4) -465.6% 0.0% 0.1 0.1 0.1 -163.0% 0.0%
Inventory: Medical supplies 0.0 0.0 0.1 (0.0) (0.0) -136.2% 0.0% 0.1 0.1 0.1 -618.0% 0.0%
Inventory: Other supplies 3.1 2.6 4.0 1.0 1.0 -30.7% 0.0% 4.0 4.2 4.5 62.6% 0.0%
Consumable supplies 0.5 0.5 1.6 8.4 8.4 164.5% 0.0% 1.4 1.5 1.6 -42.2% 0.0%
Consumable: Stationery, printing and office supplies
81.9 88.6 200.3 123.1 123.1 14.6% 0.9% 127.8 130.3 135.9 3.4% 0.7%
Operating leases 585.1 425.8 496.7 565.4 565.4 -1.1% 3.6% 619.4 636.2 668.9 5.8% 3.4%
Property payments 634.7 654.7 879.6 918.0 918.0 13.1% 5.4% 1 002.7 1 103.9 1 352.3 13.8% 6.0%
Transport provided: Departmental activity 3.6 0.1 0.0 0.6 0.6 -44.4% 0.0% 0.7 0.7 0.8 8.8% 0.0%
Travel and subsistence 464.3 524.7 625.1 560.9 560.9 6.5% 3.8% 518.0 532.5 645.7 4.8% 3.1%
Training and development 22.0 11.0 22.6 37.2 37.2 19.2% 0.2% 51.7 54.3 57.2 15.5% 0.3%
Operating payments 149.7 170.3 165.7 186.4 186.4 7.6% 1.2% 182.7 354.6 227.7 6.9% 1.3%
Venues and facilities 10.8 9.7 5.1 14.2 14.2 9.5% 0.1% 16.2 16.8 17.2 6.6% 0.1%
Rental and hiring – 0.4 1.1 – – 0.0% – – – – –
Interest and rent on land 14.9 10.4 0.0 – – -100.0% 0.0% – – – – –
Vote 24: Justice and Constitutional Development
5
Ch
ap
ter na
me
Table 24.2 Justice and Constitutional Development Economic classification
Audited outcome
Adjusted appropri-
ation Revised estimate
Average growth
rate (%)
Expen- diture/
total: Average
(%) Medium-term expenditure
estimate
Average growth
rate (%)
Expen- diture/
total: Average
(%)
R million 2010/11 2011/12 2012/13 2013/14 2010/11 - 2013/14 2014/15 2015/16 2016/17 2013/14 - 2016/17
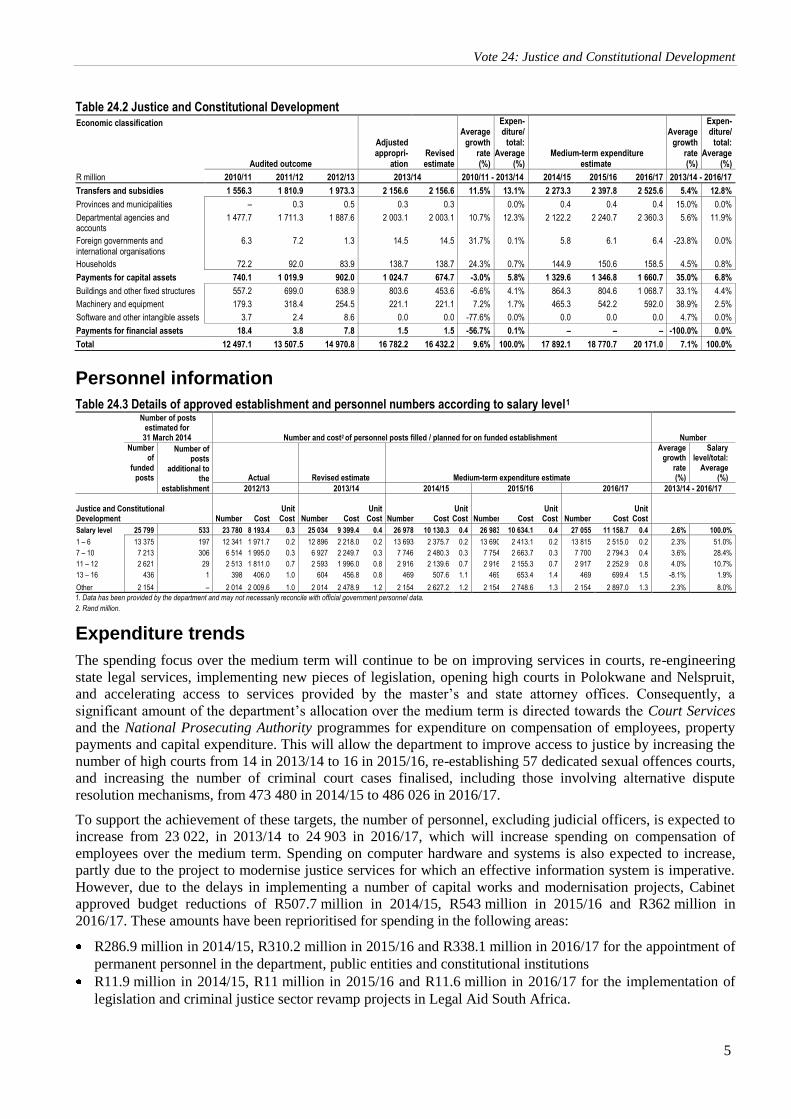
Transfers and subsidies 1 556.3 1 810.9 1 973.3 2 156.6 2 156.6 11.5% 13.1% 2 273.3 2 397.8 2 525.6 5.4% 12.8%
Provinces and municipalities – 0.3 0.5 0.3 0.3 0.0% 0.4 0.4 0.4 15.0% 0.0%
Departmental agencies and accounts
1 477.7 1 711.3 1 887.6 2 003.1 2 003.1 10.7% 12.3% 2 122.2 2 240.7 2 360.3 5.6% 11.9%
Foreign governments and international organisations
6.3 7.2 1.3 14.5 14.5 31.7% 0.1% 5.8 6.1 6.4 -23.8% 0.0%
Households 72.2 92.0 83.9 138.7 138.7 24.3% 0.7% 144.9 150.6 158.5 4.5% 0.8%
Payments for capital assets 740.1 1 019.9 902.0 1 024.7 674.7 -3.0% 5.8% 1 329.6 1 346.8 1 660.7 35.0% 6.8%
Buildings and other fixed structures 557.2 699.0 638.9 803.6 453.6 -6.6% 4.1% 864.3 804.6 1 068.7 33.1% 4.4%
Machinery and equipment 179.3 318.4 254.5 221.1 221.1 7.2% 1.7% 465.3 542.2 592.0 38.9% 2.5%
Software and other intangible assets 3.7 2.4 8.6 0.0 0.0 -77.6% 0.0% 0.0 0.0 0.0 4.7% 0.0%
Payments for financial assets 18.4 3.8 7.8 1.5 1.5 -56.7% 0.1% – – – -100.0% 0.0%
Total 12 497.1 13 507.5 14 970.8 16 782.2 16 432.2 9.6% 100.0% 17 892.1 18 770.7 20 171.0 7.1% 100.0%
Personnel information
Table 24.3 Details of approved establishment and personnel numbers according to salary level1
Number of posts estimated for
31 March 2014 Number and cost2 of personnel posts filled / planned for on funded establishment Number
Number of
funded posts
Number of posts
additional to the
establishment
Actual Revised estimate Medium-term expenditure estimate
Average growth
rate (%)
Salary level/total:
Average (%)
2012/13 2013/14 2014/15 2015/16 2016/17 2013/14 - 2016/17
Justice and Constitutional Development Number Cost
Unit Cost Number Cost
Unit Cost
Number Cost
Unit
Cost
Number Cost Unit Cost Number Cost
Unit
Cost
Salary level 25 799 533 23 780 8 193.4 0.3 25 034 9 399.4 0.4 26 978 10 130.3 0.4 26 983 10 634.1 0.4 27 055 11 158.7 0.4 2.6% 100.0%
1 – 6 13 375 197 12 341 1 971.7 0.2 12 896 2 218.0 0.2 13 693 2 375.7 0.2 13 690 2 413.1 0.2 13 815 2 515.0 0.2 2.3% 51.0%
7 – 10 7 213 306 6 514 1 995.0 0.3 6 927 2 249.7 0.3 7 746 2 480.3 0.3 7 754 2 663.7 0.3 7 700 2 794.3 0.4 3.6% 28.4%
11 – 12 2 621 29 2 513 1 811.0 0.7 2 593 1 996.0 0.8 2 916 2 139.6 0.7 2 916 2 155.3 0.7 2 917 2 252.9 0.8 4.0% 10.7%
13 – 16 436 1 398 406.0 1.0 604 456.8 0.8 469 507.6 1.1 469 653.4 1.4 469 699.4 1.5 -8.1% 1.9%
Other 2 154 – 2 014 2 009.6 1.0 2 014 2 478.9 1.2 2 154 2 627.2 1.2 2 154 2 748.6 1.3 2 154 2 897.0 1.3 2.3% 8.0%
1. Data has been provided by the department and may not necessarily reconcile with official government personnel data.
2. Rand million.
Expenditure trends
The spending focus over the medium term will continue to be on improving services in courts, re-engineering
state legal services, implementing new pieces of legislation, opening high courts in Polokwane and Nelspruit,
and accelerating access to services provided by the master’s and state attorney offices. Consequently, a
significant amount of the department’s allocation over the medium term is directed towards the Court Services
and the National Prosecuting Authority programmes for expenditure on compensation of employees, property
payments and capital expenditure. This will allow the department to improve access to justice by increasing the
number of high courts from 14 in 2013/14 to 16 in 2015/16, re-establishing 57 dedicated sexual offences courts,
and increasing the number of criminal court cases finalised, including those involving alternative dispute
resolution mechanisms, from 473 480 in 2014/15 to 486 026 in 2016/17.
To support the achievement of these targets, the number of personnel, excluding judicial officers, is expected to
increase from 23 022, in 2013/14 to 24 903 in 2016/17, which will increase spending on compensation of
employees over the medium term. Spending on computer hardware and systems is also expected to increase,
partly due to the project to modernise justice services for which an effective information system is imperative.
However, due to the delays in implementing a number of capital works and modernisation projects, Cabinet
approved budget reductions of R507.7 million in 2014/15, R543 million in 2015/16 and R362 million in
2016/17. These amounts have been reprioritised for spending in the following areas:
R286.9 million in 2014/15, R310.2 million in 2015/16 and R338.1 million in 2016/17 for the appointment of
permanent personnel in the department, public entities and constitutional institutions
R11.9 million in 2014/15, R11 million in 2015/16 and R11.6 million in 2016/17 for the implementation of
legislation and criminal justice sector revamp projects in Legal Aid South Africa.
2014 Estimates of National Expenditure
6
The department has a funded establishment of 23 647 (excluding judicial officers) and 533 positions are filled
additional to the establishment. At the end of November 2013, 2 364 posts were vacant due to natural attrition
and the length of time it takes to finalise the recruitment process.
Infrastructure spending
Spending on infrastructure increased from R542.5 million in 2010/11 to R784.6 million in 2013/14, and is
expected to increase to R1 billion over the medium term.
In 2013/14, the department completed the construction of the new Kagiso magistrate’s office at a cost of
R74 million. The department will complete the construction of the Polokwane high court in 2014/15 at a cost of
R796.5 million, while the construction of the Mpumalanga high court is expected to be completed in 2015/16 at
a cost of R706.4 million. Once completed, the department will comply with the Superior Courts Act (2013),
which establishes the high court divisions of Mpumalanga and Limpopo. In 2014/15, work on the construction
of six new magistrate courts will begin at a total cost of R967.6 million. The courts are to be located in Richards
Bay and Port Shepstone (KwaZulu-Natal), Plettenberg Bay (Southern Cape), Booysens (Gauteng), and Bityi
and Dimbaza (Eastern Cape). The refurbishment and provision of additional accommodation for the South
Gauteng high court will continue, and is expected to be completed in October 2015.
Other major projects over the medium term include the relocation of the family court in Cape Town and the
provision of new offices for the National Prosecuting Authority in Pietermaritzburg (KwaZulu-Natal), which
will be completed at a total cost of R238.1 million.
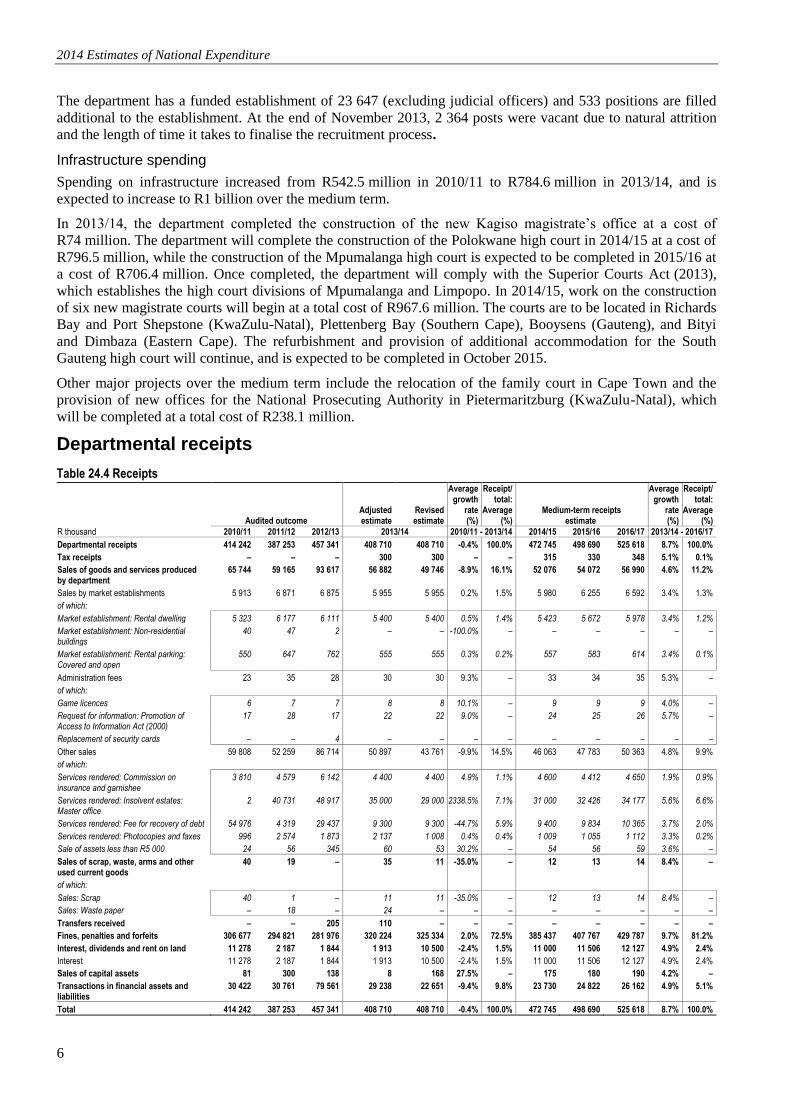
Departmental receipts
Table 24.4 Receipts
Audited outcome Adjusted estimate
Revised estimate
Average growth
rate (%)
Receipt/ total:
Average (%)
Medium-term receipts estimate
Average growth
rate (%)
Receipt/ total:
Average (%)
R thousand 2010/11 2011/12 2012/13 2013/14 2010/11 - 2013/14 2014/15 2015/16 2016/17 2013/14 - 2016/17
Departmental receipts 414 242 387 253 457 341 408 710 408 710 -0.4% 100.0% 472 745 498 690 525 618 8.7% 100.0%
Tax receipts – – – 300 300 – – 315 330 348 5.1% 0.1%
Sales of goods and services produced by department
65 744 59 165 93 617 56 882 49 746 -8.9% 16.1% 52 076 54 072 56 990 4.6% 11.2%
Sales by market establishments 5 913 6 871 6 875 5 955 5 955 0.2% 1.5% 5 980 6 255 6 592 3.4% 1.3%
of which:
Market establishment: Rental dwelling 5 323 6 177 6 111 5 400 5 400 0.5% 1.4% 5 423 5 672 5 978 3.4% 1.2%
Market establishment: Non-residential buildings
40 47 2 – – -100.0% – – – – – –
Market establishment: Rental parking: Covered and open
550 647 762 555 555 0.3% 0.2% 557 583 614 3.4% 0.1%
Administration fees 23 35 28 30 30 9.3% – 33 34 35 5.3% –
of which:
Game licences 6 7 7 8 8 10.1% – 9 9 9 4.0% –
Request for information: Promotion of Access to Information Act (2000)
17 28 17 22 22 9.0% – 24 25 26 5.7% –
Replacement of security cards – – 4 – – – – – – – – –
Other sales 59 808 52 259 86 714 50 897 43 761 -9.9% 14.5% 46 063 47 783 50 363 4.8% 9.9%
of which:
Services rendered: Commission on insurance and garnishee
3 810 4 579 6 142 4 400 4 400 4.9% 1.1% 4 600 4 412 4 650 1.9% 0.9%
Services rendered: Insolvent estates: Master office
2 40 731 48 917 35 000 29 000 2338.5% 7.1% 31 000 32 426 34 177 5.6% 6.6%
Services rendered: Fee for recovery of debt 54 976 4 319 29 437 9 300 9 300 -44.7% 5.9% 9 400 9 834 10 365 3.7% 2.0%
Services rendered: Photocopies and faxes 996 2 574 1 873 2 137 1 008 0.4% 0.4% 1 009 1 055 1 112 3.3% 0.2%
Sale of assets less than R5 000 24 56 345 60 53 30.2% – 54 56 59 3.6% –
Sales of scrap, waste, arms and other used current goods
40 19 – 35 11 -35.0% – 12 13 14 8.4% –
of which:
Sales: Scrap 40 1 – 11 11 -35.0% – 12 13 14 8.4% –
Sales: Waste paper – 18 – 24 – – – – – – – –
Transfers received – – 205 110 – – – – – – – –
Fines, penalties and forfeits 306 677 294 821 281 976 320 224 325 334 2.0% 72.5% 385 437 407 767 429 787 9.7% 81.2%
Interest, dividends and rent on land 11 278 2 187 1 844 1 913 10 500 -2.4% 1.5% 11 000 11 506 12 127 4.9% 2.4%
Interest 11 278 2 187 1 844 1 913 10 500 -2.4% 1.5% 11 000 11 506 12 127 4.9% 2.4%
Sales of capital assets 81 300 138 8 168 27.5% – 175 180 190 4.2% –
Transactions in financial assets and liabilities
30 422 30 761 79 561 29 238 22 651 -9.4% 9.8% 23 730 24 822 26 162 4.9% 5.1%
Total 414 242 387 253 457 341 408 710 408 710 -0.4% 100.0% 472 745 498 690 525 618 8.7% 100.0%
Vote 24: Justice and Constitutional Development
7
Ch
ap
ter na
me
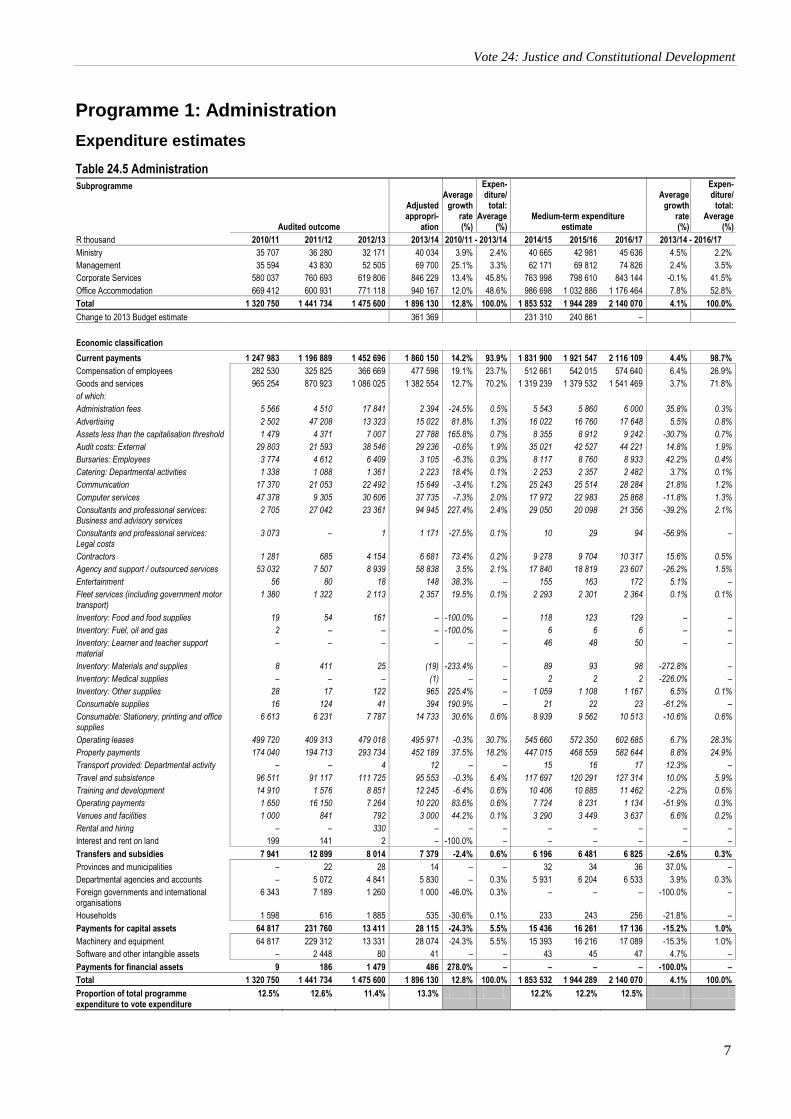
Programme 1: Administration
Expenditure estimates
Table 24.5 Administration
Subprogramme
Audited outcome
Adjusted appropri-
ation
Average growth
rate (%)
Expen- diture/
total: Average
(%) Medium-term expenditure
estimate
Average
growth rate (%)
Expen- diture/
total: Average
(%)
R thousand 2010/11 2011/12 2012/13 2013/14 2010/11 - 2013/14 2014/15 2015/16 2016/17 2013/14 - 2016/17
Ministry 35 707 36 280 32 171 40 034 3.9% 2.4% 40 665 42 981 45 636 4.5% 2.2%
Management 35 594 43 830 52 505 69 700 25.1% 3.3% 62 171 69 812 74 826 2.4% 3.5%
Corporate Services 580 037 760 693 619 806 846 229 13.4% 45.8% 763 998 798 610 843 144 -0.1% 41.5%
Office Accommodation 669 412 600 931 771 118 940 167 12.0% 48.6% 986 698 1 032 886 1 176 464 7.8% 52.8%
Total 1 320 750 1 441 734 1 475 600 1 896 130 12.8% 100.0% 1 853 532 1 944 289 2 140 070 4.1% 100.0%
Change to 2013 Budget estimate 361 369 231 310 240 861 –
Economic classification
Current payments 1 247 983 1 196 889 1 452 696 1 860 150 14.2% 93.9% 1 831 900 1 921 547 2 116 109 4.4% 98.7%
Compensation of employees 282 530 325 825 366 669 477 596 19.1% 23.7% 512 661 542 015 574 640 6.4% 26.9%
Goods and services 965 254 870 923 1 086 025 1 382 554 12.7% 70.2% 1 319 239 1 379 532 1 541 469 3.7% 71.8%
of which:
Administration fees 5 566 4 510 17 841 2 394 -24.5% 0.5% 5 543 5 860 6 000 35.8% 0.3%
Advertising 2 502 47 208 13 323 15 022 81.8% 1.3% 16 022 16 760 17 648 5.5% 0.8%
Assets less than the capitalisation threshold 1 479 4 371 7 007 27 788 165.8% 0.7% 8 355 8 912 9 242 -30.7% 0.7%
Audit costs: External 29 803 21 593 38 546 29 236 -0.6% 1.9% 35 021 42 527 44 221 14.8% 1.9%
Bursaries: Employees 3 774 4 612 6 409 3 105 -6.3% 0.3% 8 117 8 760 8 933 42.2% 0.4%
Catering: Departmental activities 1 338 1 088 1 361 2 223 18.4% 0.1% 2 253 2 357 2 482 3.7% 0.1%
Communication 17 370 21 053 22 492 15 649 -3.4% 1.2% 25 243 25 514 28 284 21.8% 1.2%
Computer services 47 378 9 305 30 606 37 735 -7.3% 2.0% 17 972 22 983 25 868 -11.8% 1.3%
Consultants and professional services: Business and advisory services
2 705 27 042 23 361 94 945 227.4% 2.4% 29 050 20 098 21 356 -39.2% 2.1%
Consultants and professional services: Legal costs
3 073 – 1 1 171 -27.5% 0.1% 10 29 94 -56.9% –
Contractors 1 281 685 4 154 6 681 73.4% 0.2% 9 278 9 704 10 317 15.6% 0.5%
Agency and support / outsourced services 53 032 7 507 8 939 58 838 3.5% 2.1% 17 840 18 819 23 607 -26.2% 1.5%
Entertainment 56 80 18 148 38.3% – 155 163 172 5.1% –
Fleet services (including government motor transport)
1 380 1 322 2 113 2 357 19.5% 0.1% 2 293 2 301 2 364 0.1% 0.1%
Inventory: Food and food supplies 19 54 161 – -100.0% – 118 123 129 – –
Inventory: Fuel, oil and gas 2 – – – -100.0% – 6 6 6 – –
Inventory: Learner and teacher support material
– – – – – – 46 48 50 – –
Inventory: Materials and supplies 8 411 25 (19) -233.4% – 89 93 98 -272.8% –
Inventory: Medical supplies – – – (1) – – 2 2 2 -226.0% –
Inventory: Other supplies 28 17 122 965 225.4% – 1 059 1 108 1 167 6.5% 0.1%
Consumable supplies 16 124 41 394 190.9% – 21 22 23 -61.2% –
Consumable: Stationery, printing and office supplies
6 613 6 231 7 787 14 733 30.6% 0.6% 8 939 9 562 10 513 -10.6% 0.6%
Operating leases 499 720 409 313 479 018 495 971 -0.3% 30.7% 545 660 572 350 602 685 6.7% 28.3%
Property payments 174 040 194 713 293 734 452 189 37.5% 18.2% 447 015 468 559 582 644 8.8% 24.9%
Transport provided: Departmental activity – – 4 12 – – 15 16 17 12.3% –
Travel and subsistence 96 511 91 117 111 725 95 553 -0.3% 6.4% 117 697 120 291 127 314 10.0% 5.9%
Training and development 14 910 1 576 8 851 12 245 -6.4% 0.6% 10 406 10 885 11 462 -2.2% 0.6%
Operating payments 1 650 16 150 7 264 10 220 83.6% 0.6% 7 724 8 231 1 134 -51.9% 0.3%
Venues and facilities 1 000 841 792 3 000 44.2% 0.1% 3 290 3 449 3 637 6.6% 0.2%
Rental and hiring – – 330 – – – – – – – –
Interest and rent on land 199 141 2 – -100.0% – – – – – –
Transfers and subsidies 7 941 12 899 8 014 7 379 -2.4% 0.6% 6 196 6 481 6 825 -2.6% 0.3%
Provinces and municipalities – 22 28 14 – – 32 34 36 37.0% –
Departmental agencies and accounts – 5 072 4 841 5 830 – 0.3% 5 931 6 204 6 533 3.9% 0.3%
Foreign governments and international organisations
6 343 7 189 1 260 1 000 -46.0% 0.3% – – – -100.0% –
Households 1 598 616 1 885 535 -30.6% 0.1% 233 243 256 -21.8% –
Payments for capital assets 64 817 231 760 13 411 28 115 -24.3% 5.5% 15 436 16 261 17 136 -15.2% 1.0%
Machinery and equipment 64 817 229 312 13 331 28 074 -24.3% 5.5% 15 393 16 216 17 089 -15.3% 1.0%
Software and other intangible assets – 2 448 80 41 – – 43 45 47 4.7% –
Payments for financial assets 9 186 1 479 486 278.0% – – – – -100.0% –
Total 1 320 750 1 441 734 1 475 600 1 896 130 12.8% 100.0% 1 853 532 1 944 289 2 140 070 4.1% 100.0%
Proportion of total programme expenditure to vote expenditure
12.5% 12.6% 11.4% 13.3% 12.2% 12.2% 12.5%
2014 Estimates of National Expenditure
8
Table 24.5 Administration
Details of transfers and subsidies
Audited outcome
Adjusted appropri-
ation
Average growth
rate (%)
Expen- diture/
total: Average
(%) Medium-term expenditure
estimate
Average
growth rate (%)
Expen- diture/
total: Average
(%)
R thousand 2010/11 2011/12 2012/13 2013/14 2010/11 - 2013/14 2014/15 2015/16 2016/17 2013/14 - 2016/17
Provinces and municipalities
Municipalities
Municipal bank accounts
Current – 22 28 14 – – 32 34 36 37.0% –
Vehicle licences – 22 28 14 – – 32 34 36 37.0% –
Households
Other transfers to households
Current – – 43 – – – – – – – –
Employee social benefits – – 43 – – – – – – – –
Departmental agencies and accounts
Departmental agencies (non-business entities)
Current – 5 072 4 841 5 830 – 0.3% 5 931 6 204 6 533 3.9% 0.3%
Safety and security sector education and training authority
– 5 072 4 841 5 830 – 0.3% 5 931 6 204 6 533 3.9% 0.3%
Households
Social benefits
Current 1 598 616 1 842 535 -30.6% 0.1% 233 243 256 -21.8% –
Employee social benefits 1 598 616 1 842 535 -30.6% 0.1% 233 243 256 -21.8% –
Foreign governments and international organisations
Current 6 343 7 189 1 260 1 000 -46.0% 0.3% – – – -100.0% –
International Criminal Court 6 343 7 189 1 260 1 000 -46.0% 0.3% – – – -100.0% –
Personnel information
Table 24.6 Details of approved establishment and personnel numbers according to salary level1
Number of posts estimated for 31 March 2014 Number and cost2 of personnel posts filled / planned for on funded establishment Number
Number of
funded posts
Number of posts
additional to the
establishment
Actual Revised estimate Medium-term expenditure estimate
Average growth
rate (%)
Salary level/total:
Average (%)
2012/13 2013/14 2014/15 2015/16 2016/17 2013/14 - 2016/17
Administration
Number Cost Unit Cost
Number Cost
Unit Cost
Number Cost
Unit Cost
Number Cost
Unit Cost
Number Cost
Unit Cost
Salary
level
1 247 21 1 008 366.7 0.4 1 165 477.6 0.4 1 343 512.7 0.4 1 343 542.0 0.4 1 343 574.6 0.4 4.9% 100.0%
1 – 6 400 11 308 47.9 0.2 356 68.9 0.2 424 81.8 0.2 424 85.4 0.2 424 92.3 0.2 6.0% 31.3%
7 – 10 597 10 498 148.6 0.3 560 196.3 0.4 637 214.9 0.3 637 228.9 0.4 637 236.4 0.4 4.4% 47.6%
11 – 12 171 – 131 92.1 0.7 150 119.2 0.8 182 121.3 0.7 182 128.3 0.7 182 142.0 0.8 6.7% 13.4%
13 – 16 77 – 69 74.4 1.1 97 88.8 0.9 98 90.5 0.9 98 94.4 1.0 98 95.8 1.0 0.3% 7.5%
Other 2 – 2 3.7 1.8 2 4.4 2.2 2 4.2 2.1 2 5.0 2.5 2 8.0 4.0 – 0.2%
1. Data has been provided by the department and may not necessarily reconcile with official government personnel data. 2. Rand million.
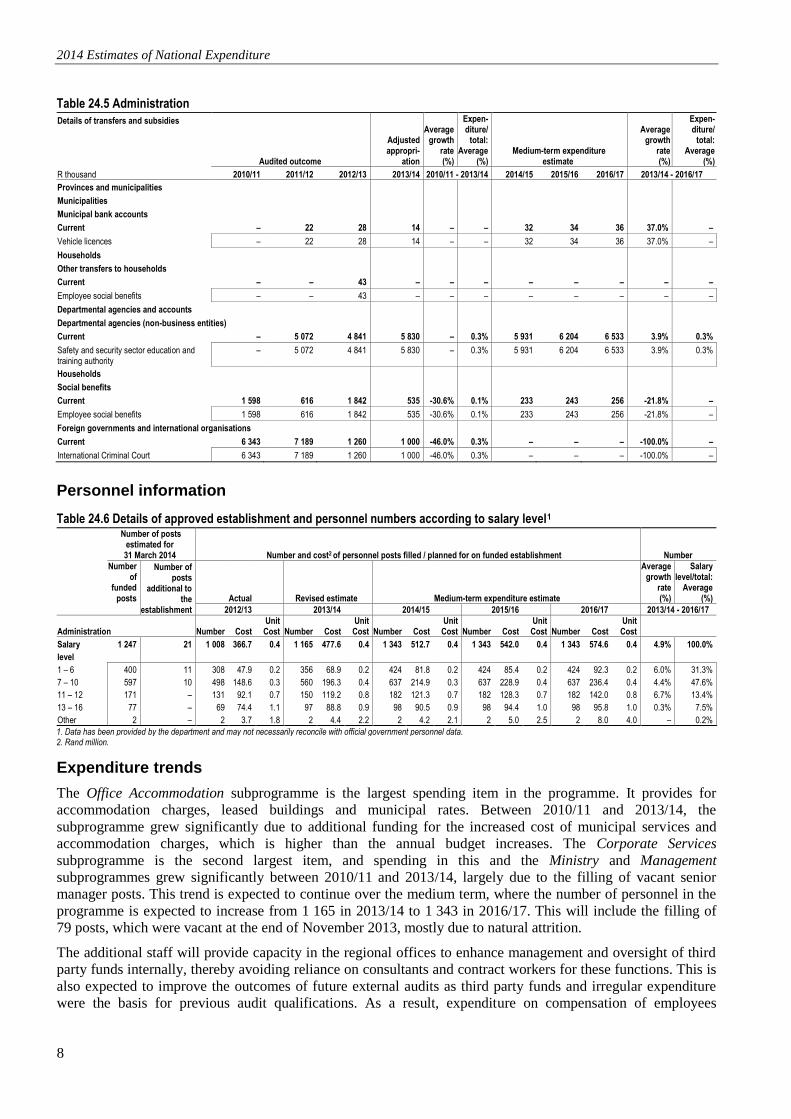
Expenditure trends
The Office Accommodation subprogramme is the largest spending item in the programme. It provides for
accommodation charges, leased buildings and municipal rates. Between 2010/11 and 2013/14, the
subprogramme grew significantly due to additional funding for the increased cost of municipal services and
accommodation charges, which is higher than the annual budget increases. The Corporate Services
subprogramme is the second largest item, and spending in this and the Ministry and Management
subprogrammes grew significantly between 2010/11 and 2013/14, largely due to the filling of vacant senior
manager posts. This trend is expected to continue over the medium term, where the number of personnel in the
programme is expected to increase from 1 165 in 2013/14 to 1 343 in 2016/17. This will include the filling of
79 posts, which were vacant at the end of November 2013, mostly due to natural attrition.
The additional staff will provide capacity in the regional offices to enhance management and oversight of third
party funds internally, thereby avoiding reliance on consultants and contract workers for these functions. This is
also expected to improve the outcomes of future external audits as third party funds and irregular expenditure
were the basis for previous audit qualifications. As a result, expenditure on compensation of employees
Vote 24: Justice and Constitutional Development
9
Ch
ap
ter na
me
increased in 2013/14, while expenditure on consultants is expected to decrease over the medium term.
Expenditure on consultants increased significantly in 2013/14 due to the specialised skills required for work on
asset management, third party funds and the commissions of inquiry (Seriti Arms Procurement Commission and
Marikana Commission of Inquiry). The commissions of inquiry were allocated an additional amount of
R133.7 million in 2013/14, which increased expenditure in the Corporate Services subprogramme in that year.
Programme 2: Court Services
Objectives
Ensure timely, efficient and effective justice proceedings by:
– reducing case backlogs from 33 504 in 2013/14 to 28 764 by 2016/17
– converting 42 backlog courts into permanent courts by 2014/15
– upgrading 15 regional courts into sexual offences courts, compliant with the new sexual offences court
model by 2014/15
– establishing an integrated information system to facilitate the effective monitoring and implementation of
the Prevention and Combating of Trafficking in Persons Act (2013) by 2015/16
– re-designating 15 branch courts into full services courts (detached courts) per year until 2018/19 to
provide full court services, through upgrading infrastructure, conferring new and extended jurisdiction
and by providing additional staff, training and accommodation
– rationalising areas of courts’ jurisdiction and harmonising the areas of jurisdiction of magistrates courts
and divisions of the South African high court with the local and provincial court system, in line with the
Constitution, by 2014/15.
Provide adequate family law litigation services and family mediation services to protect the interests of
children by:
– increasing the percentage of court reports filed by the family advocate within 15 days of the finalisation
of an enquiry from 50 per cent in 2012/13 to 70 per cent in 2014/15
– increasing the percentage of finalised non-litigation matters from 15 per cent in 2013/14 to 20 per cent in
2014/15.
Subprogrammes
Constitutional Court funds the activities and operations of the Constitutional Court, which has jurisdiction
over constitutional matters only. The court has 11 judges, including the chief justice. A minimum of 8 judges
must hear a case, with the chief justice or deputy chief justice presiding. By the end of 2012/13, the court had
finalised 198 matters with a staff complement of 81. In the first half of 2013/14, the court finalised
104 matters with a staff complement of 112.
Supreme Court of Appeal funds the activities and operations of the Supreme Court of Appeal, which
adjudicates appeals and questions of law from the high courts. The court has 26 judges, including a president
and deputy president, and a minimum of 3 to 5 judges must hear a case. By the end of 2012/13, the court had
finalised 551 criminal appeals and civil petitions with a staff complement of 43. In the first half of 2013/14,
the court finalised 291 criminal appeals and civil petitions with a staff complement of 43.
High Courts funds the activities and operations of the various high court divisions, which have jurisdiction
over the defined geographical areas in which they are located. There are currently 14 high courts and
195 high court judges. By the end of 2012/13, high courts had finalised 1 194 criminal cases with a staff
complement of 1 087. In the first half of 2013/14, these courts finalised 544 criminal cases with a staff
complement of 1 204.
Specialised Courts funds the activities and operations of labour and labour appeal courts, the land claims
court, the special tribunal, and family courts. By the end of 2012/13, the labour and labour appeal courts had
finalised 448 taxation matters with a staff complement of 118, and the land claims court had finalised
213 land restitution and taxation matters with a staff complement of 31. In the first half of 2013/14, the
labour and labour appeal courts finalised 357 taxation matters with a staff complement of 118, and the land
2014 Estimates of National Expenditure
10
claims court finalised 40 restitution and taxation matters with a staff complement of 31.
Lower Courts is discussed in more detail below.
Family Advocate funds family advocate offices. The family advocate conducts family mediations in non-
litigation matters, with the goal of settling parental disputes out of court. In litigation matters, the family
advocate files court reports, makes recommendations and appears in courts to promote and protect the best
interests of children. The family advocate’s office also deals with international cases of children who were
abducted or retained in foreign countries in terms of the Hague Convention on the Civil Aspects of
International Child Abduction. By the end of 2012/13, the family advocate had filed 11 632 court reports on
unsuccessful mediation and finalised 1 048 cases in mediation with a staff complement of 329. In the first
half of 2013/14, the family advocate filed 1 992 court reports and finalised 975 non-litigation matters with a
staff complement of 325.
Magistrate’s Commission funds the Magistrate’s Commission, which makes recommendations on the
appointment and tenure of magistrates. In 2012/13, with the approval of the Minister of Justice and
Constitutional Development, the commission appointed 174 magistrates at different levels. A further
308 posts were advertised in 2013/14. This subprogramme had a staff complement of 23 in 2012/13 and 20
at the end of September 2013.
Government Motor Transport funds vehicles for judges and departmental officials. This subprogramme’s
total budget is used for purchasing vehicles. By the end of 2012/13, 14 vehicles had been purchased for
judges and 131 vehicles had been purchased for departmental officials. In the first half of 2013/14,
14 vehicles had been purchased for judges and 61 had been purchased for departmental officials.
Facilities Management funds the provision of accommodation for courts and justice service delivery points.
The subprogramme manages funds for the construction of new and additional accommodation as well as the
leasing of privately owned premises for use by the department. 4 new lower courts buildings (Tsakane, Palm
Ridge, Gelvandale and Ntuzuma) were completed in 2012/13 while repairs and renovations and the
construction of new accommodation were carried out in 2 courts (Caledon and Danielskuil) in the first half
of 2013/14.
Administration of Courts funds the management of courts’ administration and performance evaluation
functions, with 1 national office and 9 provincial offices. This subprogramme had a staff complement
of 1 081 in 2012/13 and 1 190 in the first half of 2013/14.
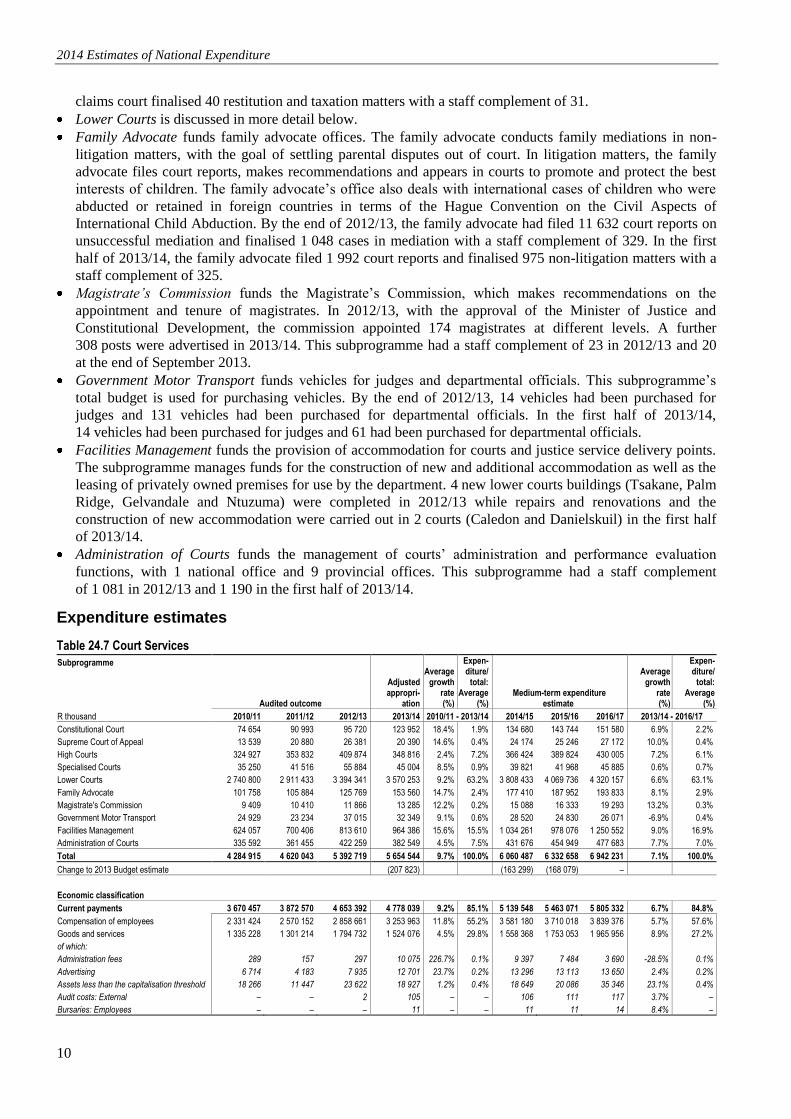
Expenditure estimates
Table 24.7 Court Services
Subprogramme
Audited outcome
Adjusted appropri-
ation
Average growth
rate (%)
Expen- diture/
total: Average
(%) Medium-term expenditure
estimate
Average
growth rate (%)
Expen- diture/
total: Average
(%)
R thousand 2010/11 2011/12 2012/13 2013/14 2010/11 - 2013/14 2014/15 2015/16 2016/17 2013/14 - 2016/17
Constitutional Court 74 654 90 993 95 720 123 952 18.4% 1.9% 134 680 143 744 151 580 6.9% 2.2%
Supreme Court of Appeal 13 539 20 880 26 381 20 390 14.6% 0.4% 24 174 25 246 27 172 10.0% 0.4%
High Courts 324 927 353 832 409 874 348 816 2.4% 7.2% 366 424 389 824 430 005 7.2% 6.1%
Specialised Courts 35 250 41 516 55 884 45 004 8.5% 0.9% 39 821 41 968 45 885 0.6% 0.7%
Lower Courts 2 740 800 2 911 433 3 394 341 3 570 253 9.2% 63.2% 3 808 433 4 069 736 4 320 157 6.6% 63.1%
Family Advocate 101 758 105 884 125 769 153 560 14.7% 2.4% 177 410 187 952 193 833 8.1% 2.9%
Magistrate's Commission 9 409 10 410 11 866 13 285 12.2% 0.2% 15 088 16 333 19 293 13.2% 0.3%
Government Motor Transport 24 929 23 234 37 015 32 349 9.1% 0.6% 28 520 24 830 26 071 -6.9% 0.4%
Facilities Management 624 057 700 406 813 610 964 386 15.6% 15.5% 1 034 261 978 076 1 250 552 9.0% 16.9%
Administration of Courts 335 592 361 455 422 259 382 549 4.5% 7.5% 431 676 454 949 477 683 7.7% 7.0%
Total 4 284 915 4 620 043 5 392 719 5 654 544 9.7% 100.0% 6 060 487 6 332 658 6 942 231 7.1% 100.0%
Change to 2013 Budget estimate (207 823) (163 299) (168 079) –
Economic classification
Current payments 3 670 457 3 872 570 4 653 392 4 778 039 9.2% 85.1% 5 139 548 5 463 071 5 805 332 6.7% 84.8%
Compensation of employees 2 331 424 2 570 152 2 858 661 3 253 963 11.8% 55.2% 3 581 180 3 710 018 3 839 376 5.7% 57.6%
Goods and services 1 335 228 1 301 214 1 794 732 1 524 076 4.5% 29.8% 1 558 368 1 753 053 1 965 956 8.9% 27.2%
of which:
Administration fees 289 157 297 10 075 226.7% 0.1% 9 397 7 484 3 690 -28.5% 0.1%
Advertising 6 714 4 183 7 935 12 701 23.7% 0.2% 13 296 13 113 13 650 2.4% 0.2%
Assets less than the capitalisation threshold 18 266 11 447 23 622 18 927 1.2% 0.4% 18 649 20 086 35 346 23.1% 0.4%
Audit costs: External – – 2 105 – – 106 111 117 3.7% –
Bursaries: Employees – – – 11 – – 11 11 14 8.4% –
Vote 24: Justice and Constitutional Development
11
Ch
ap
ter na
me
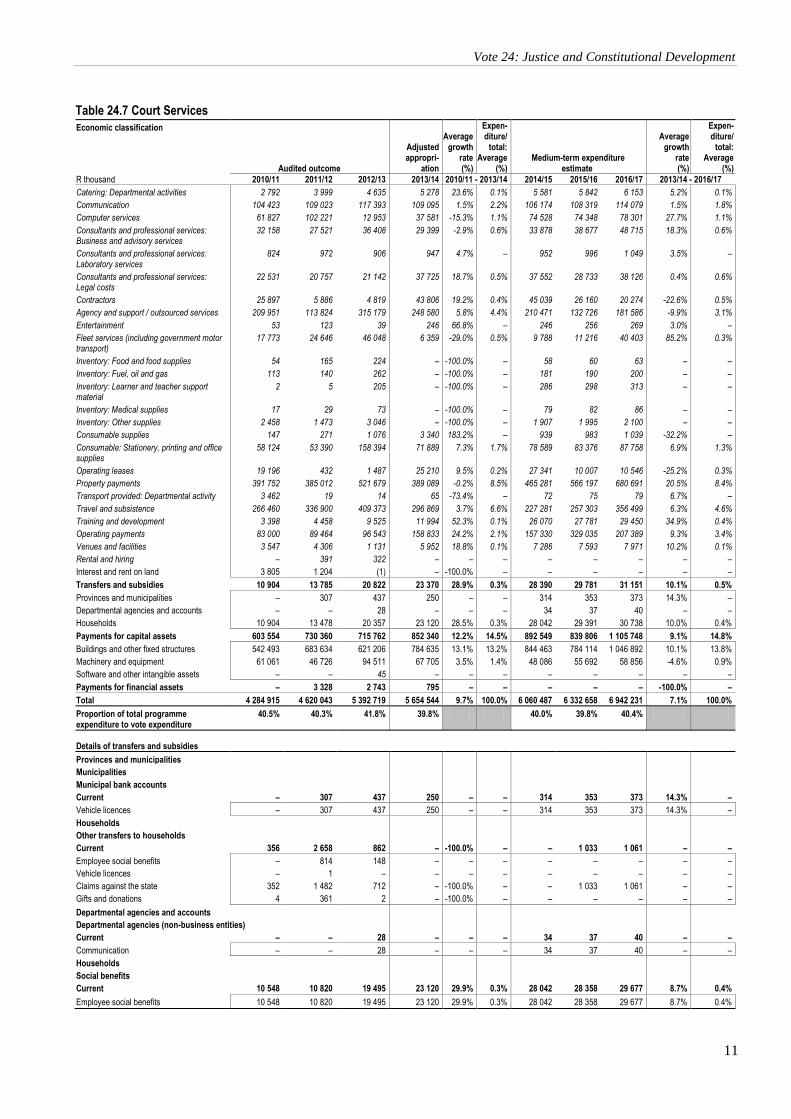
Table 24.7 Court Services
Economic classification
Audited outcome
Adjusted appropri-
ation
Average growth
rate (%)
Expen- diture/
total: Average
(%) Medium-term expenditure
estimate
Average
growth rate (%)
Expen- diture/
total: Average
(%)
R thousand 2010/11 2011/12 2012/13 2013/14 2010/11 - 2013/14 2014/15 2015/16 2016/17 2013/14 - 2016/17
Catering: Departmental activities 2 792 3 999 4 635 5 278 23.6% 0.1% 5 581 5 842 6 153 5.2% 0.1%
Communication 104 423 109 023 117 393 109 095 1.5% 2.2% 106 174 108 319 114 079 1.5% 1.8%
Computer services 61 827 102 221 12 953 37 581 -15.3% 1.1% 74 528 74 348 78 301 27.7% 1.1%
Consultants and professional services: Business and advisory services
32 158 27 521 36 408 29 399 -2.9% 0.6% 33 878 38 677 48 715 18.3% 0.6%
Consultants and professional services: Laboratory services
824 972 906 947 4.7% – 952 996 1 049 3.5% –
Consultants and professional services: Legal costs
22 531 20 757 21 142 37 725 18.7% 0.5% 37 552 28 733 38 126 0.4% 0.6%
Contractors 25 897 5 886 4 819 43 806 19.2% 0.4% 45 039 26 160 20 274 -22.6% 0.5%
Agency and support / outsourced services 209 951 113 824 315 179 248 580 5.8% 4.4% 210 471 132 726 181 586 -9.9% 3.1%
Entertainment 53 123 39 246 66.8% – 246 256 269 3.0% –
Fleet services (including government motor transport)
17 773 24 646 46 048 6 359 -29.0% 0.5% 9 788 11 216 40 403 85.2% 0.3%
Inventory: Food and food supplies 54 165 224 – -100.0% – 58 60 63 – –
Inventory: Fuel, oil and gas 113 140 262 – -100.0% – 181 190 200 – –
Inventory: Learner and teacher support material
2 5 205 – -100.0% – 286 298 313 – –
Inventory: Medical supplies 17 29 73 – -100.0% – 79 82 86 – –
Inventory: Other supplies 2 458 1 473 3 046 – -100.0% – 1 907 1 995 2 100 – –
Consumable supplies 147 271 1 076 3 340 183.2% – 939 983 1 039 -32.2% –
Consumable: Stationery, printing and office supplies
58 124 53 390 158 394 71 889 7.3% 1.7% 78 589 83 376 87 758 6.9% 1.3%
Operating leases 19 196 432 1 487 25 210 9.5% 0.2% 27 341 10 007 10 546 -25.2% 0.3%
Property payments 391 752 385 012 521 679 389 089 -0.2% 8.5% 465 281 566 197 680 691 20.5% 8.4%
Transport provided: Departmental activity 3 462 19 14 65 -73.4% – 72 75 79 6.7% –
Travel and subsistence 266 460 336 900 409 373 296 869 3.7% 6.6% 227 281 257 303 356 499 6.3% 4.6%
Training and development 3 398 4 458 9 525 11 994 52.3% 0.1% 26 070 27 781 29 450 34.9% 0.4%
Operating payments 83 000 89 464 96 543 158 833 24.2% 2.1% 157 330 329 035 207 389 9.3% 3.4%
Venues and facilities 3 547 4 306 1 131 5 952 18.8% 0.1% 7 286 7 593 7 971 10.2% 0.1%
Rental and hiring – 391 322 – – – – – – – –
Interest and rent on land 3 805 1 204 (1) – -100.0% – – – – – –
Transfers and subsidies 10 904 13 785 20 822 23 370 28.9% 0.3% 28 390 29 781 31 151 10.1% 0.5%
Provinces and municipalities – 307 437 250 – – 314 353 373 14.3% –
Departmental agencies and accounts – – 28 – – – 34 37 40 – –
Households 10 904 13 478 20 357 23 120 28.5% 0.3% 28 042 29 391 30 738 10.0% 0.4%
Payments for capital assets 603 554 730 360 715 762 852 340 12.2% 14.5% 892 549 839 806 1 105 748 9.1% 14.8%
Buildings and other fixed structures 542 493 683 634 621 206 784 635 13.1% 13.2% 844 463 784 114 1 046 892 10.1% 13.8%
Machinery and equipment 61 061 46 726 94 511 67 705 3.5% 1.4% 48 086 55 692 58 856 -4.6% 0.9%
Software and other intangible assets – – 45 – – – – – – – –
Payments for financial assets – 3 328 2 743 795 – – – – – -100.0% –
Total 4 284 915 4 620 043 5 392 719 5 654 544 9.7% 100.0% 6 060 487 6 332 658 6 942 231 7.1% 100.0%
Proportion of total programme expenditure to vote expenditure
40.5% 40.3% 41.8% 39.8% 40.0% 39.8% 40.4%
Details of transfers and subsidies
Provinces and municipalities
Municipalities
Municipal bank accounts
Current – 307 437 250 – – 314 353 373 14.3% –
Vehicle licences – 307 437 250 – – 314 353 373 14.3% –
Households
Other transfers to households
Current 356 2 658 862 – -100.0% – – 1 033 1 061 – –
Employee social benefits – 814 148 – – – – – – – –
Vehicle licences – 1 – – – – – – – – –
Claims against the state 352 1 482 712 – -100.0% – – 1 033 1 061 – –
Gifts and donations 4 361 2 – -100.0% – – – – – –
Departmental agencies and accounts
Departmental agencies (non-business entities)
Current – – 28 – – – 34 37 40 – –
Communication – – 28 – – – 34 37 40 – –
Households
Social benefits
Current 10 548 10 820 19 495 23 120 29.9% 0.3% 28 042 28 358 29 677 8.7% 0.4%
Employee social benefits 10 548 10 820 19 495 23 120 29.9% 0.3% 28 042 28 358 29 677 8.7% 0.4%
2014 Estimates of National Expenditure
12
Personnel information
Table 24.8 Details of approved establishment and personnel numbers according to salary level1
Number of posts estimated for
31 March 2014 Number and cost2 of personnel posts filled / planned for on funded establishment Number
Number of funded
posts Number of posts additional to
the establishment
Actual Revised estimate Medium-term expenditure estimate
Average growth
rate (%)
Salary level/total:
Average (%)
2012/13 2013/14 2014/15 2015/16 2016/17 2013/14 - 2016/17
Court Services Number Cost Unit Cost Number Cost
Unit Cost Number Cost
Unit Cost Number Cost
Unit Cost Number Cost
Unit Cost
Salary
level
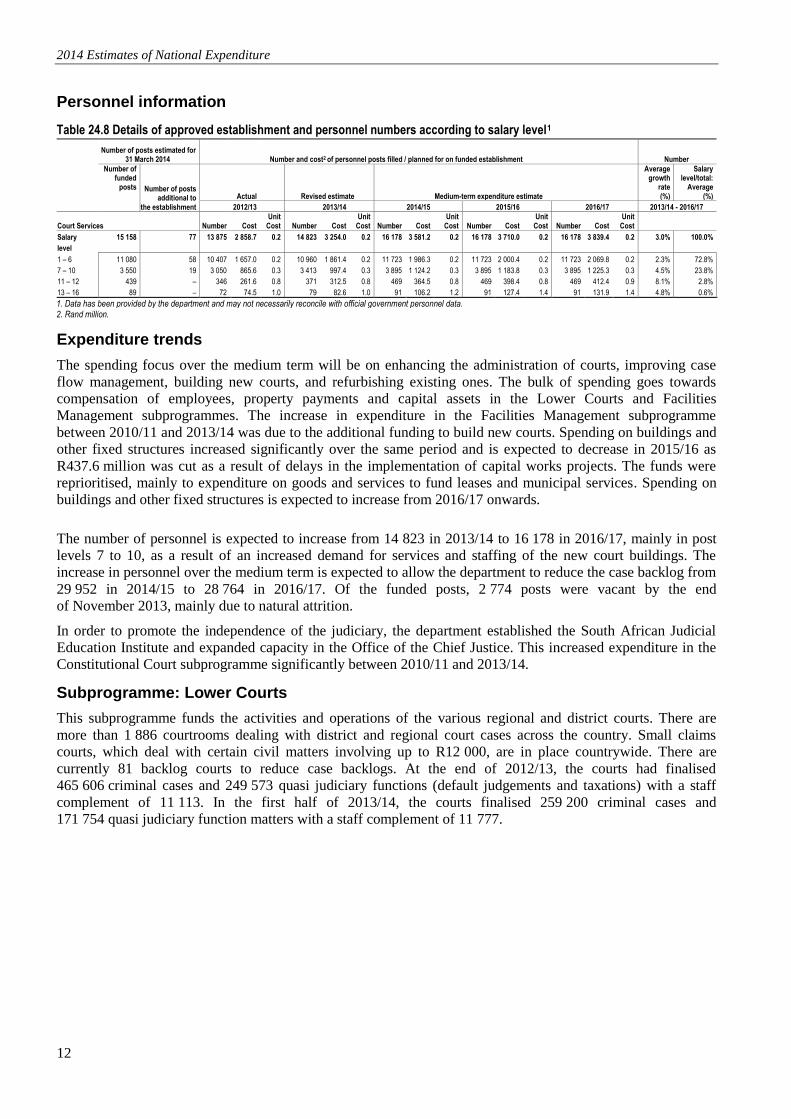
15 158 77 13 875 2 858.7 0.2 14 823 3 254.0 0.2 16 178 3 581.2 0.2 16 178 3 710.0 0.2 16 178 3 839.4 0.2 3.0% 100.0%
1 – 6 11 080 58 10 407 1 657.0 0.2 10 960 1 861.4 0.2 11 723 1 986.3 0.2 11 723 2 000.4 0.2 11 723 2 069.8 0.2 2.3% 72.8%
7 – 10 3 550 19 3 050 865.6 0.3 3 413 997.4 0.3 3 895 1 124.2 0.3 3 895 1 183.8 0.3 3 895 1 225.3 0.3 4.5% 23.8%
11 – 12 439 – 346 261.6 0.8 371 312.5 0.8 469 364.5 0.8 469 398.4 0.8 469 412.4 0.9 8.1% 2.8%
13 – 16 89 – 72 74.5 1.0 79 82.6 1.0 91 106.2 1.2 91 127.4 1.4 91 131.9 1.4 4.8% 0.6%
1. Data has been provided by the department and may not necessarily reconcile with official government personnel data. 2. Rand million.
Expenditure trends
The spending focus over the medium term will be on enhancing the administration of courts, improving case
flow management, building new courts, and refurbishing existing ones. The bulk of spending goes towards
compensation of employees, property payments and capital assets in the Lower Courts and Facilities
Management subprogrammes. The increase in expenditure in the Facilities Management subprogramme
between 2010/11 and 2013/14 was due to the additional funding to build new courts. Spending on buildings and
other fixed structures increased significantly over the same period and is expected to decrease in 2015/16 as
R437.6 million was cut as a result of delays in the implementation of capital works projects. The funds were
reprioritised, mainly to expenditure on goods and services to fund leases and municipal services. Spending on
buildings and other fixed structures is expected to increase from 2016/17 onwards.
The number of personnel is expected to increase from 14 823 in 2013/14 to 16 178 in 2016/17, mainly in post
levels 7 to 10, as a result of an increased demand for services and staffing of the new court buildings. The
increase in personnel over the medium term is expected to allow the department to reduce the case backlog from
29 952 in 2014/15 to 28 764 in 2016/17. Of the funded posts, 2 774 posts were vacant by the end
of November 2013, mainly due to natural attrition.
In order to promote the independence of the judiciary, the department established the South African Judicial
Education Institute and expanded capacity in the Office of the Chief Justice. This increased expenditure in the
Constitutional Court subprogramme significantly between 2010/11 and 2013/14.
Subprogramme: Lower Courts
This subprogramme funds the activities and operations of the various regional and district courts. There are
more than 1 886 courtrooms dealing with district and regional court cases across the country. Small claims
courts, which deal with certain civil matters involving up to R12 000, are in place countrywide. There are
currently 81 backlog courts to reduce case backlogs. At the end of 2012/13, the courts had finalised
465 606 criminal cases and 249 573 quasi judiciary functions (default judgements and taxations) with a staff
complement of 11 113. In the first half of 2013/14, the courts finalised 259 200 criminal cases and
171 754 quasi judiciary function matters with a staff complement of 11 777.
Vote 24: Justice and Constitutional Development
13
Ch
ap
ter na
me
Expenditure estimates
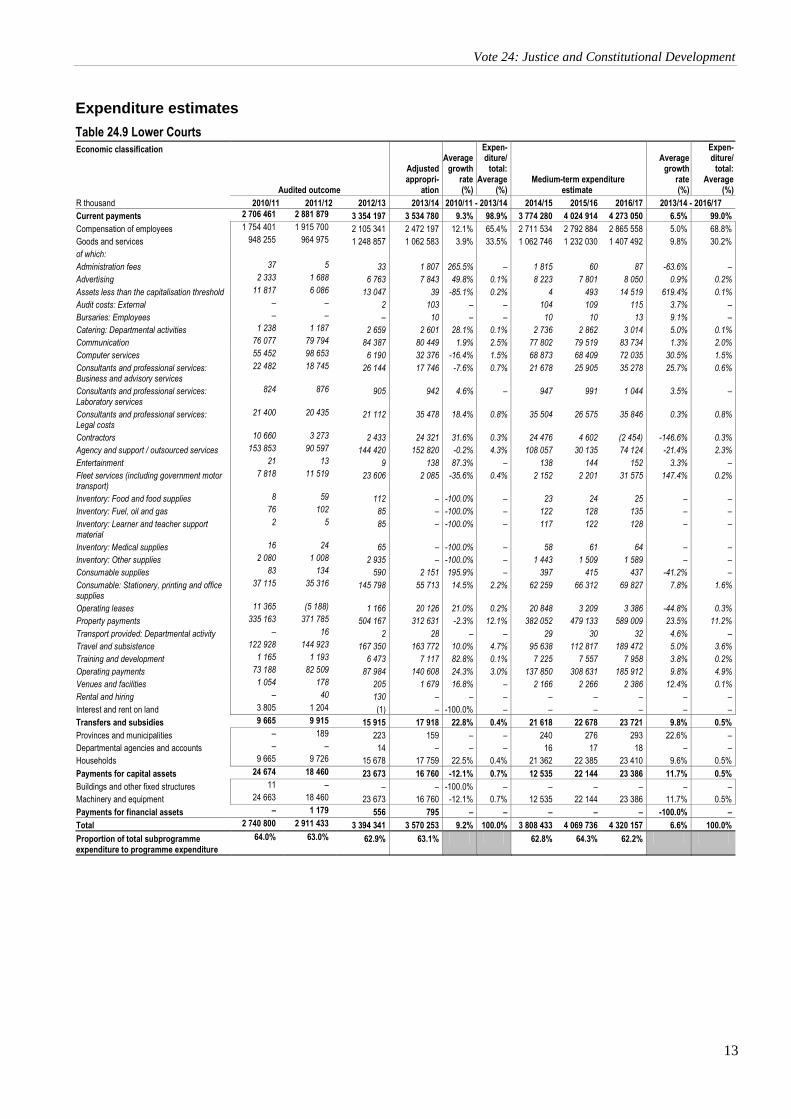
Table 24.9 Lower Courts
Economic classification
Audited outcome
Adjusted appropri-
ation
Average growth
rate (%)
Expen- diture/
total: Average
(%) Medium-term expenditure
estimate
Average
growth rate (%)
Expen- diture/
total: Average
(%)
R thousand 2010/11 2011/12 2012/13 2013/14 2010/11 - 2013/14 2014/15 2015/16 2016/17 2013/14 - 2016/17
Current payments 2 706 461 2 881 879 3 354 197 3 534 780 9.3% 98.9% 3 774 280 4 024 914 4 273 050 6.5% 99.0%
Compensation of employees 1 754 401 1 915 700 2 105 341 2 472 197 12.1% 65.4% 2 711 534 2 792 884 2 865 558 5.0% 68.8%
Goods and services 948 255 964 975 1 248 857 1 062 583 3.9% 33.5% 1 062 746 1 232 030 1 407 492 9.8% 30.2%
of which:
Administration fees 37 5 33 1 807 265.5% – 1 815 60 87 -63.6% –
Advertising 2 333 1 688 6 763 7 843 49.8% 0.1% 8 223 7 801 8 050 0.9% 0.2%
Assets less than the capitalisation threshold 11 817 6 086 13 047 39 -85.1% 0.2% 4 493 14 519 619.4% 0.1%
Audit costs: External – – 2 103 – – 104 109 115 3.7% –
Bursaries: Employees – – – 10 – – 10 10 13 9.1% –
Catering: Departmental activities 1 238 1 187 2 659 2 601 28.1% 0.1% 2 736 2 862 3 014 5.0% 0.1%
Communication 76 077 79 794 84 387 80 449 1.9% 2.5% 77 802 79 519 83 734 1.3% 2.0%
Computer services 55 452 98 653 6 190 32 376 -16.4% 1.5% 68 873 68 409 72 035 30.5% 1.5%
Consultants and professional services: Business and advisory services
22 482 18 745 26 144 17 746 -7.6% 0.7% 21 678 25 905 35 278 25.7% 0.6%
Consultants and professional services: Laboratory services
824 876 905 942 4.6% – 947 991 1 044 3.5% –
Consultants and professional services: Legal costs
21 400 20 435 21 112 35 478 18.4% 0.8% 35 504 26 575 35 846 0.3% 0.8%
Contractors 10 660 3 273 2 433 24 321 31.6% 0.3% 24 476 4 602 (2 454) -146.6% 0.3%
Agency and support / outsourced services 153 853 90 597 144 420 152 820 -0.2% 4.3% 108 057 30 135 74 124 -21.4% 2.3%
Entertainment 21 13 9 138 87.3% – 138 144 152 3.3% –
Fleet services (including government motor transport)
7 818 11 519 23 606 2 085 -35.6% 0.4% 2 152 2 201 31 575 147.4% 0.2%
Inventory: Food and food supplies 8 59 112 – -100.0% – 23 24 25 – –
Inventory: Fuel, oil and gas 76 102 85 – -100.0% – 122 128 135 – –
Inventory: Learner and teacher support material
2 5 85 – -100.0% – 117 122 128 – –
Inventory: Medical supplies 16 24 65 – -100.0% – 58 61 64 – –
Inventory: Other supplies 2 080 1 008 2 935 – -100.0% – 1 443 1 509 1 589 – –
Consumable supplies 83 134 590 2 151 195.9% – 397 415 437 -41.2% –
Consumable: Stationery, printing and office supplies
37 115 35 316 145 798 55 713 14.5% 2.2% 62 259 66 312 69 827 7.8% 1.6%
Operating leases 11 365 (5 188) 1 166 20 126 21.0% 0.2% 20 848 3 209 3 386 -44.8% 0.3%
Property payments 335 163 371 785 504 167 312 631 -2.3% 12.1% 382 052 479 133 589 009 23.5% 11.2%
Transport provided: Departmental activity – 16 2 28 – – 29 30 32 4.6% –
Travel and subsistence 122 928 144 923 167 350 163 772 10.0% 4.7% 95 638 112 817 189 472 5.0% 3.6%
Training and development 1 165 1 193 6 473 7 117 82.8% 0.1% 7 225 7 557 7 958 3.8% 0.2%
Operating payments 73 188 82 509 87 984 140 608 24.3% 3.0% 137 850 308 631 185 912 9.8% 4.9%
Venues and facilities 1 054 178 205 1 679 16.8% – 2 166 2 266 2 386 12.4% 0.1%
Rental and hiring – 40 130 – – – – – – – –
Interest and rent on land 3 805 1 204 (1) – -100.0% – – – – – –
Transfers and subsidies 9 665 9 915 15 915 17 918 22.8% 0.4% 21 618 22 678 23 721 9.8% 0.5%
Provinces and municipalities – 189 223 159 – – 240 276 293 22.6% –
Departmental agencies and accounts – – 14 – – – 16 17 18 – –
Households 9 665 9 726 15 678 17 759 22.5% 0.4% 21 362 22 385 23 410 9.6% 0.5%
Payments for capital assets 24 674 18 460 23 673 16 760 -12.1% 0.7% 12 535 22 144 23 386 11.7% 0.5%
Buildings and other fixed structures 11 – – – -100.0% – – – – – –
Machinery and equipment 24 663 18 460 23 673 16 760 -12.1% 0.7% 12 535 22 144 23 386 11.7% 0.5%
Payments for financial assets – 1 179 556 795 – – – – – -100.0% –
Total 2 740 800 2 911 433 3 394 341 3 570 253 9.2% 100.0% 3 808 433 4 069 736 4 320 157 6.6% 100.0%
Proportion of total subprogramme expenditure to programme expenditure
64.0% 63.0% 62.9% 63.1% 62.8% 64.3% 62.2%
2014 Estimates of National Expenditure
14
Personnel information
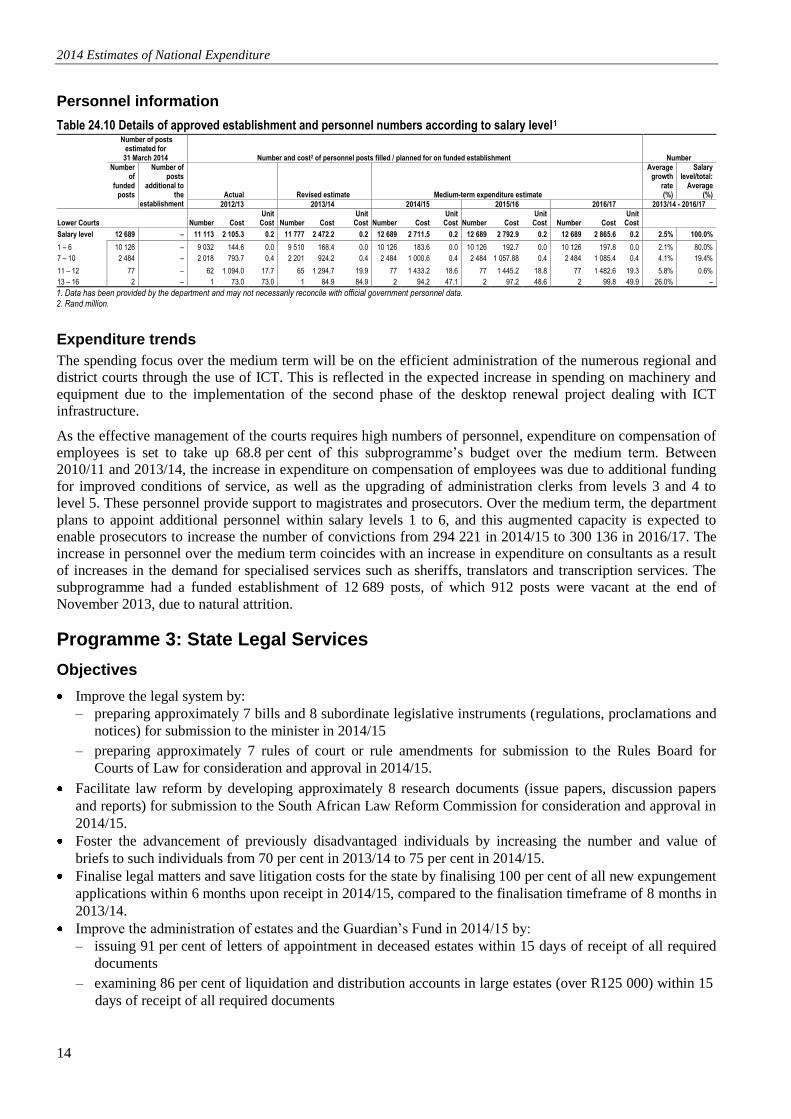
Table 24.10 Details of approved establishment and personnel numbers according to salary level1
Number of posts estimated for
31 March 2014 Number and cost2 of personnel posts filled / planned for on funded establishment Number
Number of
funded posts
Number of posts
additional to the
establishment Actual Revised estimate Medium-term expenditure estimate
Average growth
rate (%)
Salary level/total:
Average (%)
2012/13 2013/14 2014/15 2015/16 2016/17 2013/14 - 2016/17
Lower Courts
Number Cost Unit Cost
Number Cost
Unit Cost
Number Cost
Unit Cost
Number Cost
Unit Cost Number Cost
Unit Cost
Salary level 12 689 – 11 113 2 105.3 0.2 11 777 2 472.2 0.2 12 689 2 711.5 0.2 12 689 2 792.9 0.2 12 689 2 865.6 0.2 2.5% 100.0%
1 – 6 10 126 – 9 032 144.6 0.0 9 510 168.4 0.0 10 126 183.6 0.0 10 126 192.7 0.0 10 126 197.8 0.0 2.1% 80.0%
7 – 10 2 484 – 2 018 793.7 0.4 2 201 924.2 0.4 2 484 1 000.6 0.4 2 484 1 057.88 0.4 2 484 1 085.4 0.4 4.1% 19.4%
11 – 12 77 – 62 1 094.0 17.7 65 1 294.7 19.9 77 1 433.2 18.6 77 1 445.2 18.8 77 1 482.6 19.3 5.8% 0.6%
13 – 16 2 – 1 73.0 73.0 1 84.9 84.9 2 94.2 47.1 2 97.2 48.6 2 99.8 49.9 26.0% –
1. Data has been provided by the department and may not necessarily reconcile with official government personnel data. 2. Rand million.
Expenditure trends
The spending focus over the medium term will be on the efficient administration of the numerous regional and
district courts through the use of ICT. This is reflected in the expected increase in spending on machinery and
equipment due to the implementation of the second phase of the desktop renewal project dealing with ICT
infrastructure.
As the effective management of the courts requires high numbers of personnel, expenditure on compensation of
employees is set to take up 68.8 per cent of this subprogramme’s budget over the medium term. Between
2010/11 and 2013/14, the increase in expenditure on compensation of employees was due to additional funding
for improved conditions of service, as well as the upgrading of administration clerks from levels 3 and 4 to
level 5. These personnel provide support to magistrates and prosecutors. Over the medium term, the department
plans to appoint additional personnel within salary levels 1 to 6, and this augmented capacity is expected to
enable prosecutors to increase the number of convictions from 294 221 in 2014/15 to 300 136 in 2016/17. The
increase in personnel over the medium term coincides with an increase in expenditure on consultants as a result
of increases in the demand for specialised services such as sheriffs, translators and transcription services. The
subprogramme had a funded establishment of 12 689 posts, of which 912 posts were vacant at the end of
November 2013, due to natural attrition.
Programme 3: State Legal Services
Objectives
Improve the legal system by:
– preparing approximately 7 bills and 8 subordinate legislative instruments (regulations, proclamations and
notices) for submission to the minister in 2014/15
– preparing approximately 7 rules of court or rule amendments for submission to the Rules Board for
Courts of Law for consideration and approval in 2014/15.
Facilitate law reform by developing approximately 8 research documents (issue papers, discussion papers
and reports) for submission to the South African Law Reform Commission for consideration and approval in
2014/15.
Foster the advancement of previously disadvantaged individuals by increasing the number and value of
briefs to such individuals from 70 per cent in 2013/14 to 75 per cent in 2014/15.
Finalise legal matters and save litigation costs for the state by finalising 100 per cent of all new expungement
applications within 6 months upon receipt in 2014/15, compared to the finalisation timeframe of 8 months in
2013/14.
Improve the administration of estates and the Guardian’s Fund in 2014/15 by:
– issuing 91 per cent of letters of appointment in deceased estates within 15 days of receipt of all required
documents
– examining 86 per cent of liquidation and distribution accounts in large estates (over R125 000) within 15
days of receipt of all required documents
Vote 24: Justice and Constitutional Development
15
Ch
ap
ter na
me
– providing 90 per cent of beneficiaries of the Guardian’s Fund with access to funds within 40 days of
application, after all necessary documentation has been received
– issuing 81 per cent of certificates of appointment in bankruptcy matters within 10 days of receipt of all
required documents
– examining 81 per cent of liquidation and distribution accounts in bankruptcy matters within 15 days of
receipt of all required documents
– issuing 92 per cent of letters of authority in trusts within 14 days of receipt of all required documents
– ensuring that 75 per cent of new deceased estates are registered on the paperless estate administration
system.
Promote and strengthen constitutional development through the enhancement of the implementation of the
Promotion of Equality and Prevention of Unfair Discrimination Act (2000) and the rollout of the training
programme for civil society organisations in all 9 provinces on an ongoing basis.
Subprogrammes
State Law Advisors provides legal advice, representation and legislative drafting services to the executive, all
state departments, state owned enterprises and autonomous government bodies through the Office of the
Chief State Law Advisor. By the end of 2012/13, the office had finalised 429 requests for legal opinions,
62 requests for preliminary opinions, 373 bills and other legislative instruments, and 78 requests for
translation with a staff complement of 84. In the first half of 2013/14, the office finalised 217 requests for
legal opinions, 30 requests for preliminary opinions, 160 bills and other legislative instruments, and
49 requests for translation with a staff complement of 89.
Litigation and Legal Services provides attorney, conveyance and notary services to the executive, all state
departments, state owned enterprises and other government bodies through the 12 offices of the state
attorney; and provides legal support to the department and the ministry. By the end of 2012/13, the office had
allocated 70 per cent or R314 million of the value of briefs to previously disadvantaged individuals, enrolled
5 556 cases, finalised 1 874 cases, settled 918 cases, won 750 or 30 per cent, and lost 386 cases. The staff
complement during this period was 668. In the first half of 2013/14, the office allocated a total of
R203 million in the value of briefs to previously disadvantaged individuals, 2 622 cases were enrolled,
660 cases were decided in courts and 395 cases were successfully concluded. This subprogramme had a staff
complement of 674 at the end of September 2013.
Legislative Development and Law Reform conducts research and prepares and promotes new and amending
legislation. By the end of 2012/13, the branch had developed 11 legislative instruments (bills, research
papers and rules) with a staff complement of 63. In the first half of 2013/14, 6 bills, 3 sets of regulations,
3 proclamations and 1 notice were submitted to the Minister of Justice and Constitutional Development for
consideration and approval with a staff complement of 64.
Master of the High Court funds the master’s office, which supervises the administration of deceased and
insolvent estates, trusts, curatorship and the Guardian’s Fund. There are 15 master’s offices. By the end of
2012/13, 167 519 files on estates worth less than R125 000 and 36 585 files on estates worth more than
R125 000 had been finalised with a staff complement of 1 049. Constitutional Development conducts research; coordinates the implementation of constitutionally mandated
legislation such as the Promotion of Equality and Prevention of Unfair Discrimination Act (2000) and the
Promotion of Administrative Justice Act (2000); promotes the Constitution and its values; assists and
protects independent institutions supporting constitutional democracy to ensure their independence and
effectiveness; and coordinates, promotes and develops programmes in support of social justice and
participatory democracy. By the end of 2012/13, this subprogramme had carried out 6 programmes on the
promotion of administrative justice across the country, provided administrative support to 2 Chapter 9
institutions (the South African Human Rights Commission and the Public Protector of South Africa) and
provided advice on salary adjustments for commissioners at the South African Human Rights Commission. It
also dealt with the resolution of complaints received from Chapter 9 institutions against the department and
launched the programme on the promotion and protection of the rights of lesbian, gay, bisexual, transgender
and intersex persons. This subprogramme had a staff complement of 49 during this period. In the first half of
2013/14, 3 programmes on the promotion of administrative justice were delivered across the country and
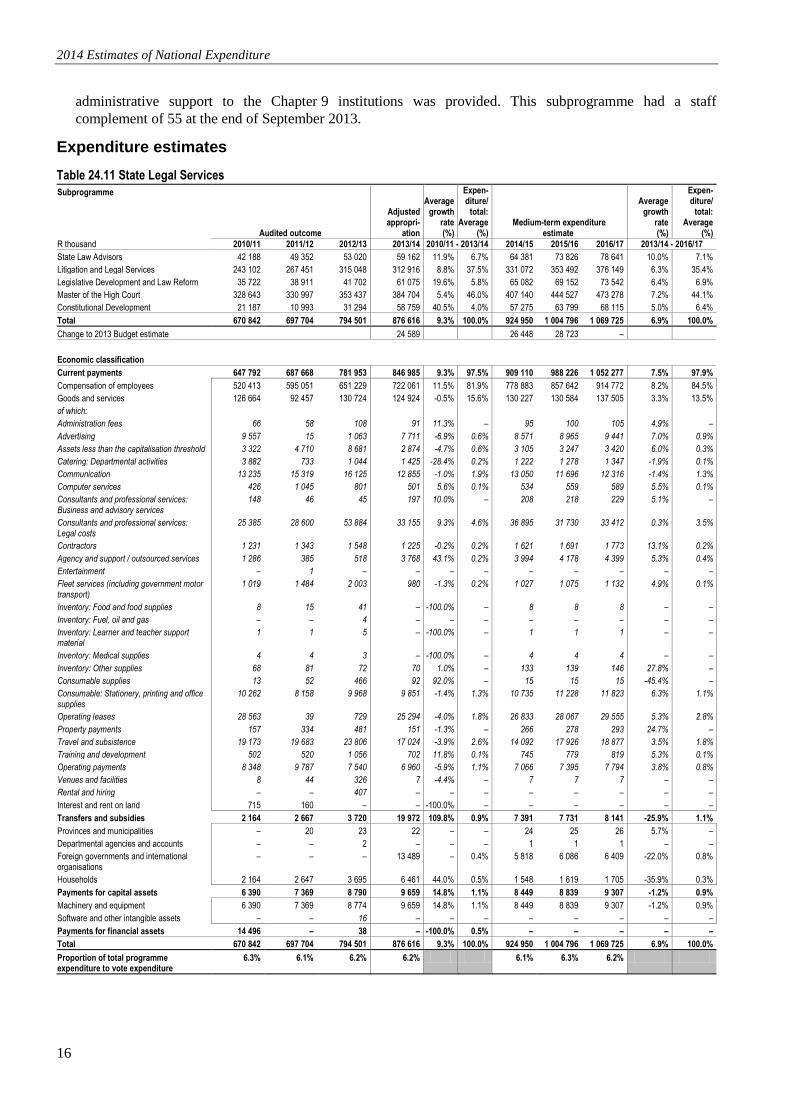
2014 Estimates of National Expenditure
16
administrative support to the Chapter 9 institutions was provided. This subprogramme had a staff
complement of 55 at the end of September 2013.
Expenditure estimates
Table 24.11 State Legal Services
Subprogramme
Audited outcome
Adjusted appropri-
ation
Average growth
rate (%)
Expen- diture/
total: Average
(%) Medium-term expenditure
estimate
Average growth
rate (%)
Expen- diture/
total: Average
(%)
R thousand 2010/11 2011/12 2012/13 2013/14 2010/11 - 2013/14 2014/15 2015/16 2016/17 2013/14 - 2016/17
State Law Advisors 42 188 49 352 53 020 59 162 11.9% 6.7% 64 381 73 826 78 641 10.0% 7.1%
Litigation and Legal Services 243 102 267 451 315 048 312 916 8.8% 37.5% 331 072 353 492 376 149 6.3% 35.4%
Legislative Development and Law Reform 35 722 38 911 41 702 61 075 19.6% 5.8% 65 082 69 152 73 542 6.4% 6.9%
Master of the High Court 328 643 330 997 353 437 384 704 5.4% 46.0% 407 140 444 527 473 278 7.2% 44.1%
Constitutional Development 21 187 10 993 31 294 58 759 40.5% 4.0% 57 275 63 799 68 115 5.0% 6.4%
Total 670 842 697 704 794 501 876 616 9.3% 100.0% 924 950 1 004 796 1 069 725 6.9% 100.0%
Change to 2013 Budget estimate 24 589 26 448 28 723 –
Economic classification
Current payments 647 792 687 668 781 953 846 985 9.3% 97.5% 909 110 988 226 1 052 277 7.5% 97.9%
Compensation of employees 520 413 595 051 651 229 722 061 11.5% 81.9% 778 883 857 642 914 772 8.2% 84.5%
Goods and services 126 664 92 457 130 724 124 924 -0.5% 15.6% 130 227 130 584 137 505 3.3% 13.5%
of which:
Administration fees 66 58 108 91 11.3% – 95 100 105 4.9% –
Advertising 9 557 15 1 063 7 711 -6.9% 0.6% 8 571 8 965 9 441 7.0% 0.9%
Assets less than the capitalisation threshold 3 322 4 710 8 681 2 874 -4.7% 0.6% 3 105 3 247 3 420 6.0% 0.3%
Catering: Departmental activities 3 882 733 1 044 1 425 -28.4% 0.2% 1 222 1 278 1 347 -1.9% 0.1%
Communication 13 235 15 319 16 125 12 855 -1.0% 1.9% 13 050 11 696 12 316 -1.4% 1.3%
Computer services 426 1 045 801 501 5.6% 0.1% 534 559 589 5.5% 0.1%
Consultants and professional services: Business and advisory services
148 46 45 197 10.0% – 208 218 229 5.1% –
Consultants and professional services: Legal costs
25 385 28 600 53 884 33 155 9.3% 4.6% 36 895 31 730 33 412 0.3% 3.5%
Contractors 1 231 1 343 1 548 1 225 -0.2% 0.2% 1 621 1 691 1 773 13.1% 0.2%
Agency and support / outsourced services 1 286 385 518 3 768 43.1% 0.2% 3 994 4 178 4 399 5.3% 0.4%
Entertainment – 1 – – – – – – – – –
Fleet services (including government motor transport)
1 019 1 484 2 003 980 -1.3% 0.2% 1 027 1 075 1 132 4.9% 0.1%
Inventory: Food and food supplies 8 15 41 – -100.0% – 8 8 8 – –
Inventory: Fuel, oil and gas – – 4 – – – – – – – –
Inventory: Learner and teacher support material
1 1 5 – -100.0% – 1 1 1 – –
Inventory: Medical supplies 4 4 3 – -100.0% – 4 4 4 – –
Inventory: Other supplies 68 81 72 70 1.0% – 133 139 146 27.8% –
Consumable supplies 13 52 466 92 92.0% – 15 15 15 -45.4% –
Consumable: Stationery, printing and office supplies
10 262 8 158 9 968 9 851 -1.4% 1.3% 10 735 11 228 11 823 6.3% 1.1%
Operating leases 28 563 39 729 25 294 -4.0% 1.8% 26 833 28 067 29 555 5.3% 2.8%
Property payments 157 334 481 151 -1.3% – 266 278 293 24.7% –
Travel and subsistence 19 173 19 683 23 806 17 024 -3.9% 2.6% 14 092 17 926 18 877 3.5% 1.8%
Training and development 502 520 1 056 702 11.8% 0.1% 745 779 819 5.3% 0.1%
Operating payments 8 348 9 787 7 540 6 960 -5.9% 1.1% 7 066 7 395 7 794 3.8% 0.8%
Venues and facilities 8 44 326 7 -4.4% – 7 7 7 – –
Rental and hiring – – 407 – – – – – – – –
Interest and rent on land 715 160 – – -100.0% – – – – – –
Transfers and subsidies 2 164 2 667 3 720 19 972 109.8% 0.9% 7 391 7 731 8 141 -25.9% 1.1%
Provinces and municipalities – 20 23 22 – – 24 25 26 5.7% –
Departmental agencies and accounts – – 2 – – – 1 1 1 – –
Foreign governments and international organisations
– – – 13 489 – 0.4% 5 818 6 086 6 409 -22.0% 0.8%
Households 2 164 2 647 3 695 6 461 44.0% 0.5% 1 548 1 619 1 705 -35.9% 0.3%
Payments for capital assets 6 390 7 369 8 790 9 659 14.8% 1.1% 8 449 8 839 9 307 -1.2% 0.9%
Machinery and equipment 6 390 7 369 8 774 9 659 14.8% 1.1% 8 449 8 839 9 307 -1.2% 0.9%
Software and other intangible assets – – 16 – – – – – – – –
Payments for financial assets 14 496 – 38 – -100.0% 0.5% – – – – –
Total 670 842 697 704 794 501 876 616 9.3% 100.0% 924 950 1 004 796 1 069 725 6.9% 100.0%
Proportion of total programme expenditure to vote expenditure
6.3% 6.1% 6.2% 6.2% 6.1% 6.3% 6.2%
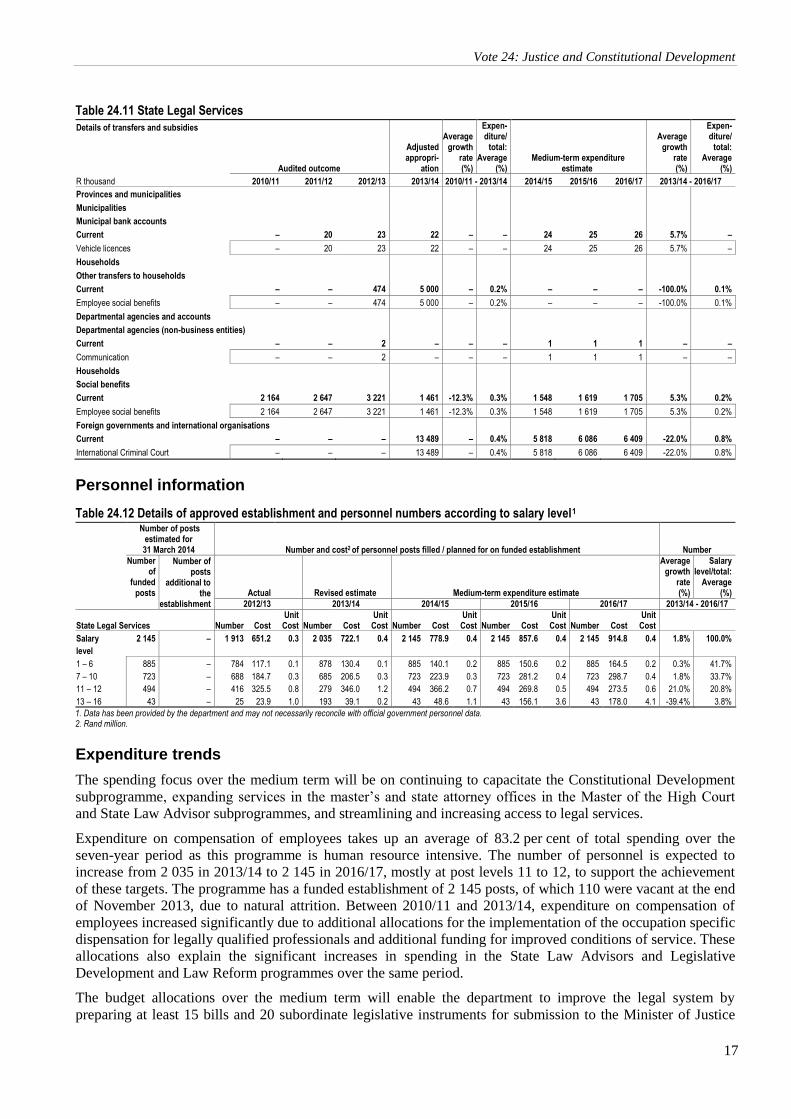
Vote 24: Justice and Constitutional Development
17
Ch
ap
ter na
me
Table 24.11 State Legal Services
Details of transfers and subsidies
Audited outcome
Adjusted appropri-
ation
Average growth
rate (%)
Expen- diture/
total: Average
(%) Medium-term expenditure
estimate
Average growth
rate (%)
Expen- diture/
total: Average
(%)
R thousand 2010/11 2011/12 2012/13 2013/14 2010/11 - 2013/14 2014/15 2015/16 2016/17 2013/14 - 2016/17
Provinces and municipalities
Municipalities
Municipal bank accounts
Current – 20 23 22 – – 24 25 26 5.7% –
Vehicle licences – 20 23 22 – – 24 25 26 5.7% –
Households
Other transfers to households
Current – – 474 5 000 – 0.2% – – – -100.0% 0.1%
Employee social benefits – – 474 5 000 – 0.2% – – – -100.0% 0.1%
Departmental agencies and accounts
Departmental agencies (non-business entities)
Current – – 2 – – – 1 1 1 – –
Communication – – 2 – – – 1 1 1 – –
Households
Social benefits
Current 2 164 2 647 3 221 1 461 -12.3% 0.3% 1 548 1 619 1 705 5.3% 0.2%
Employee social benefits 2 164 2 647 3 221 1 461 -12.3% 0.3% 1 548 1 619 1 705 5.3% 0.2%
Foreign governments and international organisations
Current – – – 13 489 – 0.4% 5 818 6 086 6 409 -22.0% 0.8%
International Criminal Court – – – 13 489 – 0.4% 5 818 6 086 6 409 -22.0% 0.8%
Personnel information
Table 24.12 Details of approved establishment and personnel numbers according to salary level1
Number of posts estimated for 31 March 2014 Number and cost2 of personnel posts filled / planned for on funded establishment Number
Number of
funded posts
Number of posts
additional to the
establishment
Actual Revised estimate Medium-term expenditure estimate
Average growth
rate (%)
Salary level/total:
Average (%)
2012/13 2013/14 2014/15 2015/16 2016/17 2013/14 - 2016/17
State Legal Services
Number Cost Unit Cost
Number Cost
Unit Cost
Number Cost
Unit Cost
Number Cost
Unit Cost
Number Cost
Unit Cost
Salary
level
2 145 – 1 913 651.2 0.3 2 035 722.1 0.4 2 145 778.9 0.4 2 145 857.6 0.4 2 145 914.8 0.4 1.8% 100.0%
1 – 6 885 – 784 117.1 0.1 878 130.4 0.1 885 140.1 0.2 885 150.6 0.2 885 164.5 0.2 0.3% 41.7%
7 – 10 723 – 688 184.7 0.3 685 206.5 0.3 723 223.9 0.3 723 281.2 0.4 723 298.7 0.4 1.8% 33.7%
11 – 12 494 – 416 325.5 0.8 279 346.0 1.2 494 366.2 0.7 494 269.8 0.5 494 273.5 0.6 21.0% 20.8%
13 – 16 43 – 25 23.9 1.0 193 39.1 0.2 43 48.6 1.1 43 156.1 3.6 43 178.0 4.1 -39.4% 3.8%
1. Data has been provided by the department and may not necessarily reconcile with official government personnel data. 2. Rand million.
Expenditure trends
The spending focus over the medium term will be on continuing to capacitate the Constitutional Development
subprogramme, expanding services in the master’s and state attorney offices in the Master of the High Court
and State Law Advisor subprogrammes, and streamlining and increasing access to legal services.
Expenditure on compensation of employees takes up an average of 83.2 per cent of total spending over the
seven-year period as this programme is human resource intensive. The number of personnel is expected to
increase from 2 035 in 2013/14 to 2 145 in 2016/17, mostly at post levels 11 to 12, to support the achievement
of these targets. The programme has a funded establishment of 2 145 posts, of which 110 were vacant at the end
of November 2013, due to natural attrition. Between 2010/11 and 2013/14, expenditure on compensation of
employees increased significantly due to additional allocations for the implementation of the occupation specific
dispensation for legally qualified professionals and additional funding for improved conditions of service. These
allocations also explain the significant increases in spending in the State Law Advisors and Legislative
Development and Law Reform programmes over the same period.
The budget allocations over the medium term will enable the department to improve the legal system by
preparing at least 15 bills and 20 subordinate legislative instruments for submission to the Minister of Justice
2014 Estimates of National Expenditure
18
and Constitutional Development, and increasing the number of state attorneys’ offices from 12 in 2012/13 to
15 in 2016/17. In order to provide for legal costs to deal with cases against the state, spending on consultants
and professional services (legal costs) increased at an average annual rate of 9.3 per cent between 2010/11 and
2013/14. This is projected to grow marginally over the medium term as the efficiency and effectiveness of state
legal services improves.
Programme 4: National Prosecuting Authority
Objectives
Improve the rate of successful prosecution by:
– increasing the number of criminal court cases finalised with a verdict from 324 276 in 2014/15 to
330 794 by 2016/17
– increasing the number of convictions in the regional and high courts from 28 351 in 2014/15 to 28 922 by
2016/17
– increasing the number of criminal court cases finalised through alternative dispute resolution mechanisms
from 149 204 in 2014/15 to 155 232 by 2016/17.
Improve the conviction in cases that require specialised prosecution by:
– ensuring that between 2014/15 and 2016/17, a total of 70 people are convicted for corruption where the
amount involved is more than R5 million
– increasing the number of convictions in complex commercial crime cases from 919 in 2014/15 to 937 by
2016/17
– expanding the number of Thuthuzela care centres from 43 in 2013/14 to 60 by 2016/17.
Contribute to the effectiveness of the criminal justice system by ensuring that threatened witnesses are
successfully protected.
Remove the profit from crime through increasing the impact of asset forfeiture by:
– increasing the number of new completed forfeiture cases from 312 in 2013/14 to 350 by 2016/17
– increasing the value of new completed forfeiture cases from R170 million in 2013/14 to R205 million by
2016/17
– increasing the value of new freezing orders from R710 million in 2013/14 to R860 million by 2016/17.
Subprogrammes
National Prosecutions Service is discussed in more detail below.
National Specialised Prosecutions Services deals with priority crimes, litigation, sexual offences and
community affairs, and specialised commercial crime. By the end of 2012/13, a conviction rate on complex
commercial crime cases of 92.9 per cent (639 convictions) had been achieved with a staff complement of
184. In the first half of 2013/14, the conviction rate on complex commercial crime cases was
94 per cent (529) with a staff complement of 186.
Asset Forfeiture Unit seizes assets that are the proceeds of crime or have been part of an offence through a
criminal or civil process. By the end of 2012/13, the success rate for this unit was 94.1 per cent (289 matters)
with a staff complement of 133. In the first half of 2013/14, the success rate was 94.4 per cent (218 matters)
and the staff complement was 134.
Office for Witness Protection provides for protection, support and related services to vulnerable and
intimidated witnesses and related persons in judicial proceedings in terms of the Witness Protection
Act (1998). No witnesses or their related persons were threatened, harmed or killed in both 2012/13 and in
the first half of 2013/14, and the staff complement was 155 and 154, respectively.
Support Services provides corporate support services in terms of finance, human resources, ICT, strategy
support, integrity, security communication and risk management to the National Prosecuting Authority. This
subprogramme had a staff complement of 372 in 2012/13 and 350 and in the first half of 2013/14.
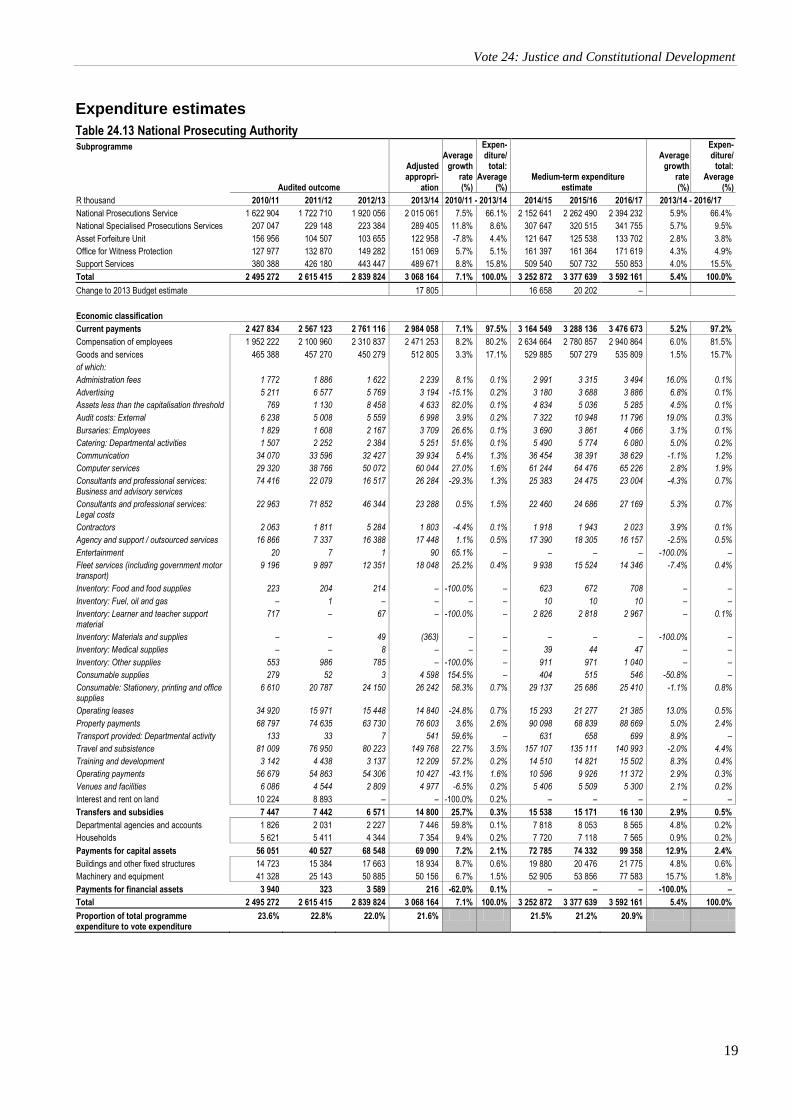
Vote 24: Justice and Constitutional Development
19
Ch
ap
ter na
me
Expenditure estimates
Table 24.13 National Prosecuting Authority Subprogramme
Audited outcome
Adjusted appropri-
ation
Average growth
rate (%)
Expen- diture/
total: Average
(%) Medium-term expenditure
estimate
Average
growth rate (%)
Expen- diture/
total: Average
(%)
R thousand 2010/11 2011/12 2012/13 2013/14 2010/11 - 2013/14 2014/15 2015/16 2016/17 2013/14 - 2016/17
National Prosecutions Service 1 622 904 1 722 710 1 920 056 2 015 061 7.5% 66.1% 2 152 641 2 262 490 2 394 232 5.9% 66.4%
National Specialised Prosecutions Services 207 047 229 148 223 384 289 405 11.8% 8.6% 307 647 320 515 341 755 5.7% 9.5%
Asset Forfeiture Unit 156 956 104 507 103 655 122 958 -7.8% 4.4% 121 647 125 538 133 702 2.8% 3.8%
Office for Witness Protection 127 977 132 870 149 282 151 069 5.7% 5.1% 161 397 161 364 171 619 4.3% 4.9%
Support Services 380 388 426 180 443 447 489 671 8.8% 15.8% 509 540 507 732 550 853 4.0% 15.5%
Total 2 495 272 2 615 415 2 839 824 3 068 164 7.1% 100.0% 3 252 872 3 377 639 3 592 161 5.4% 100.0%
Change to 2013 Budget estimate 17 805 16 658 20 202 –
Economic classification
Current payments 2 427 834 2 567 123 2 761 116 2 984 058 7.1% 97.5% 3 164 549 3 288 136 3 476 673 5.2% 97.2%
Compensation of employees 1 952 222 2 100 960 2 310 837 2 471 253 8.2% 80.2% 2 634 664 2 780 857 2 940 864 6.0% 81.5%
Goods and services 465 388 457 270 450 279 512 805 3.3% 17.1% 529 885 507 279 535 809 1.5% 15.7%
of which:
Administration fees 1 772 1 886 1 622 2 239 8.1% 0.1% 2 991 3 315 3 494 16.0% 0.1%
Advertising 5 211 6 577 5 769 3 194 -15.1% 0.2% 3 180 3 688 3 886 6.8% 0.1%
Assets less than the capitalisation threshold 769 1 130 8 458 4 633 82.0% 0.1% 4 834 5 036 5 285 4.5% 0.1%
Audit costs: External 6 238 5 008 5 559 6 998 3.9% 0.2% 7 322 10 948 11 796 19.0% 0.3%
Bursaries: Employees 1 829 1 608 2 167 3 709 26.6% 0.1% 3 690 3 861 4 066 3.1% 0.1%
Catering: Departmental activities 1 507 2 252 2 384 5 251 51.6% 0.1% 5 490 5 774 6 080 5.0% 0.2%
Communication 34 070 33 596 32 427 39 934 5.4% 1.3% 36 454 38 391 38 629 -1.1% 1.2%
Computer services 29 320 38 766 50 072 60 044 27.0% 1.6% 61 244 64 476 65 226 2.8% 1.9%
Consultants and professional services: Business and advisory services
74 416 22 079 16 517 26 284 -29.3% 1.3% 25 383 24 475 23 004 -4.3% 0.7%
Consultants and professional services: Legal costs
22 963 71 852 46 344 23 288 0.5% 1.5% 22 460 24 686 27 169 5.3% 0.7%
Contractors 2 063 1 811 5 284 1 803 -4.4% 0.1% 1 918 1 943 2 023 3.9% 0.1%
Agency and support / outsourced services 16 866 7 337 16 388 17 448 1.1% 0.5% 17 390 18 305 16 157 -2.5% 0.5%
Entertainment 20 7 1 90 65.1% – – – – -100.0% –
Fleet services (including government motor transport)
9 196 9 897 12 351 18 048 25.2% 0.4% 9 938 15 524 14 346 -7.4% 0.4%
Inventory: Food and food supplies 223 204 214 – -100.0% – 623 672 708 – –
Inventory: Fuel, oil and gas – 1 – – – – 10 10 10 – –
Inventory: Learner and teacher support material
717 – 67 – -100.0% – 2 826 2 818 2 967 – 0.1%
Inventory: Materials and supplies – – 49 (363) – – – – – -100.0% –
Inventory: Medical supplies – – 8 – – – 39 44 47 – –
Inventory: Other supplies 553 986 785 – -100.0% – 911 971 1 040 – –
Consumable supplies 279 52 3 4 598 154.5% – 404 515 546 -50.8% –
Consumable: Stationery, printing and office supplies
6 610 20 787 24 150 26 242 58.3% 0.7% 29 137 25 686 25 410 -1.1% 0.8%
Operating leases 34 920 15 971 15 448 14 840 -24.8% 0.7% 15 293 21 277 21 385 13.0% 0.5%
Property payments 68 797 74 635 63 730 76 603 3.6% 2.6% 90 098 68 839 88 669 5.0% 2.4%
Transport provided: Departmental activity 133 33 7 541 59.6% – 631 658 699 8.9% –
Travel and subsistence 81 009 76 950 80 223 149 768 22.7% 3.5% 157 107 135 111 140 993 -2.0% 4.4%
Training and development 3 142 4 438 3 137 12 209 57.2% 0.2% 14 510 14 821 15 502 8.3% 0.4%
Operating payments 56 679 54 863 54 306 10 427 -43.1% 1.6% 10 596 9 926 11 372 2.9% 0.3%
Venues and facilities 6 086 4 544 2 809 4 977 -6.5% 0.2% 5 406 5 509 5 300 2.1% 0.2%
Interest and rent on land 10 224 8 893 – – -100.0% 0.2% – – – – –
Transfers and subsidies 7 447 7 442 6 571 14 800 25.7% 0.3% 15 538 15 171 16 130 2.9% 0.5%
Departmental agencies and accounts 1 826 2 031 2 227 7 446 59.8% 0.1% 7 818 8 053 8 565 4.8% 0.2%
Households 5 621 5 411 4 344 7 354 9.4% 0.2% 7 720 7 118 7 565 0.9% 0.2%
Payments for capital assets 56 051 40 527 68 548 69 090 7.2% 2.1% 72 785 74 332 99 358 12.9% 2.4%
Buildings and other fixed structures 14 723 15 384 17 663 18 934 8.7% 0.6% 19 880 20 476 21 775 4.8% 0.6%
Machinery and equipment 41 328 25 143 50 885 50 156 6.7% 1.5% 52 905 53 856 77 583 15.7% 1.8%
Payments for financial assets 3 940 323 3 589 216 -62.0% 0.1% – – – -100.0% –
Total 2 495 272 2 615 415 2 839 824 3 068 164 7.1% 100.0% 3 252 872 3 377 639 3 592 161 5.4% 100.0%
Proportion of total programme expenditure to vote expenditure
23.6% 22.8% 22.0% 21.6% 21.5% 21.2% 20.9%
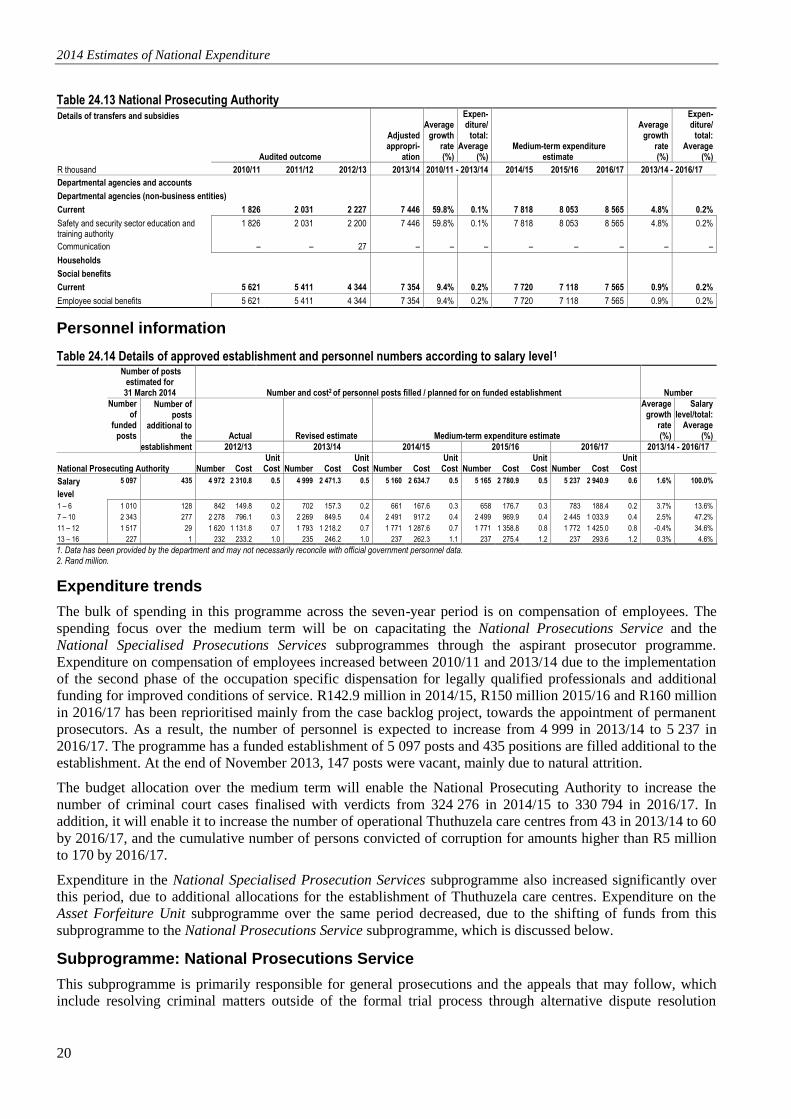
2014 Estimates of National Expenditure
20
Table 24.13 National Prosecuting Authority Details of transfers and subsidies
Audited outcome
Adjusted appropri-
ation
Average growth
rate (%)
Expen- diture/
total: Average
(%) Medium-term expenditure
estimate
Average growth
rate (%)
Expen- diture/
total: Average
(%)
R thousand 2010/11 2011/12 2012/13 2013/14 2010/11 - 2013/14 2014/15 2015/16 2016/17 2013/14 - 2016/17
Departmental agencies and accounts
Departmental agencies (non-business entities)
Current 1 826 2 031 2 227 7 446 59.8% 0.1% 7 818 8 053 8 565 4.8% 0.2%
Safety and security sector education and training authority
1 826 2 031 2 200 7 446 59.8% 0.1% 7 818 8 053 8 565 4.8% 0.2%
Communication – – 27 – – – – – – – –
Households
Social benefits
Current 5 621 5 411 4 344 7 354 9.4% 0.2% 7 720 7 118 7 565 0.9% 0.2%
Employee social benefits 5 621 5 411 4 344 7 354 9.4% 0.2% 7 720 7 118 7 565 0.9% 0.2%
Personnel information
Table 24.14 Details of approved establishment and personnel numbers according to salary level1
Number of posts estimated for 31 March 2014 Number and cost2 of personnel posts filled / planned for on funded establishment Number
Number of
funded posts
Number of posts
additional to the
establishment
Actual Revised estimate Medium-term expenditure estimate
Average growth
rate (%)
Salary level/total:
Average (%)
2012/13 2013/14 2014/15 2015/16 2016/17 2013/14 - 2016/17
National Prosecuting Authority
Number Cost Unit Cost
Number Cost
Unit Cost
Number Cost
Unit Cost
Number Cost
Unit Cost
Number Cost
Unit Cost
Salary
level
5 097 435 4 972 2 310.8 0.5 4 999 2 471.3 0.5 5 160 2 634.7 0.5 5 165 2 780.9 0.5 5 237 2 940.9 0.6 1.6% 100.0%
1 – 6 1 010 128 842 149.8 0.2 702 157.3 0.2 661 167.6 0.3 658 176.7 0.3 783 188.4 0.2 3.7% 13.6%
7 – 10 2 343 277 2 278 796.1 0.3 2 269 849.5 0.4 2 491 917.2 0.4 2 499 969.9 0.4 2 445 1 033.9 0.4 2.5% 47.2%
11 – 12 1 517 29 1 620 1 131.8 0.7 1 793 1 218.2 0.7 1 771 1 287.6 0.7 1 771 1 358.8 0.8 1 772 1 425.0 0.8 -0.4% 34.6%
13 – 16 227 1 232 233.2 1.0 235 246.2 1.0 237 262.3 1.1 237 275.4 1.2 237 293.6 1.2 0.3% 4.6%
1. Data has been provided by the department and may not necessarily reconcile with official government personnel data. 2. Rand million.
Expenditure trends
The bulk of spending in this programme across the seven-year period is on compensation of employees. The
spending focus over the medium term will be on capacitating the National Prosecutions Service and the
National Specialised Prosecutions Services subprogrammes through the aspirant prosecutor programme.
Expenditure on compensation of employees increased between 2010/11 and 2013/14 due to the implementation
of the second phase of the occupation specific dispensation for legally qualified professionals and additional
funding for improved conditions of service. R142.9 million in 2014/15, R150 million 2015/16 and R160 million
in 2016/17 has been reprioritised mainly from the case backlog project, towards the appointment of permanent
prosecutors. As a result, the number of personnel is expected to increase from 4 999 in 2013/14 to 5 237 in
2016/17. The programme has a funded establishment of 5 097 posts and 435 positions are filled additional to the
establishment. At the end of November 2013, 147 posts were vacant, mainly due to natural attrition.
The budget allocation over the medium term will enable the National Prosecuting Authority to increase the
number of criminal court cases finalised with verdicts from 324 276 in 2014/15 to 330 794 in 2016/17. In
addition, it will enable it to increase the number of operational Thuthuzela care centres from 43 in 2013/14 to 60
by 2016/17, and the cumulative number of persons convicted of corruption for amounts higher than R5 million
to 170 by 2016/17.
Expenditure in the National Specialised Prosecution Services subprogramme also increased significantly over
this period, due to additional allocations for the establishment of Thuthuzela care centres. Expenditure on the
Asset Forfeiture Unit subprogramme over the same period decreased, due to the shifting of funds from this
subprogramme to the National Prosecutions Service subprogramme, which is discussed below.
Subprogramme: National Prosecutions Service
This subprogramme is primarily responsible for general prosecutions and the appeals that may follow, which
include resolving criminal matters outside of the formal trial process through alternative dispute resolution
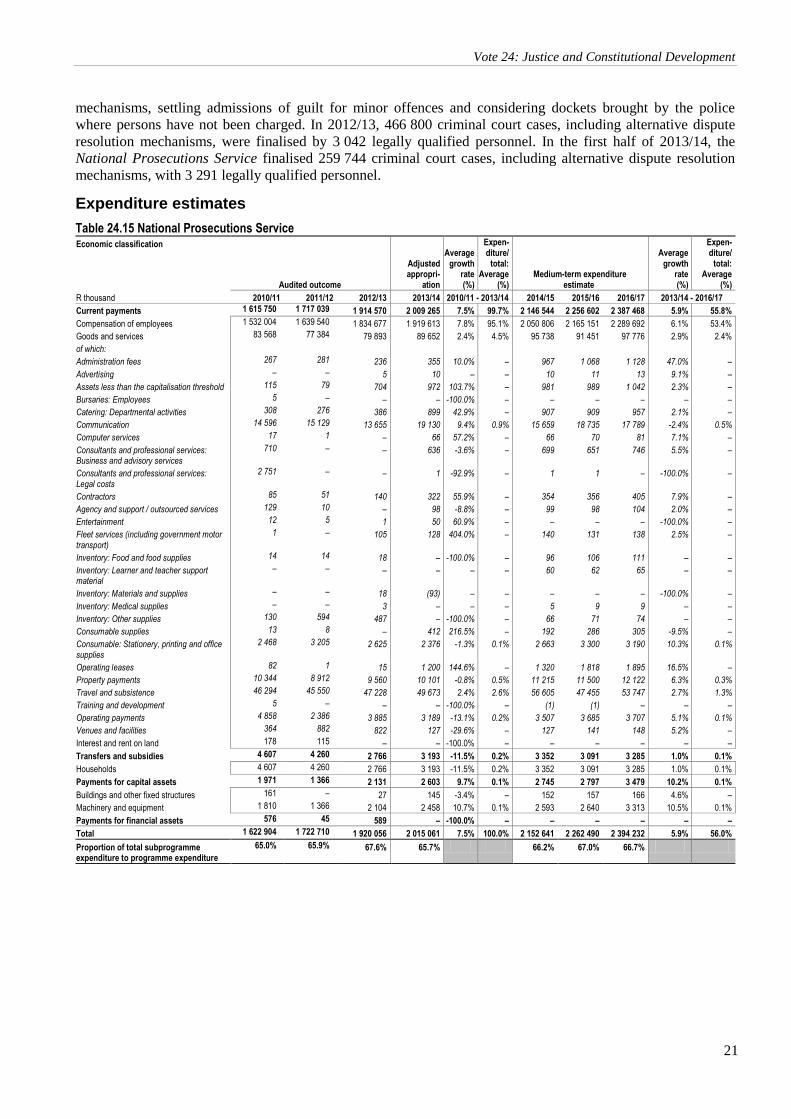
Vote 24: Justice and Constitutional Development
21
Ch
ap
ter na
me
mechanisms, settling admissions of guilt for minor offences and considering dockets brought by the police
where persons have not been charged. In 2012/13, 466 800 criminal court cases, including alternative dispute
resolution mechanisms, were finalised by 3 042 legally qualified personnel. In the first half of 2013/14, the
National Prosecutions Service finalised 259 744 criminal court cases, including alternative dispute resolution
mechanisms, with 3 291 legally qualified personnel.
Expenditure estimates
Table 24.15 National Prosecutions Service Economic classification
Audited outcome
Adjusted appropri-
ation
Average growth
rate (%)
Expen- diture/
total: Average
(%) Medium-term expenditure
estimate
Average growth
rate (%)
Expen- diture/
total: Average
(%)
R thousand 2010/11 2011/12 2012/13 2013/14 2010/11 - 2013/14 2014/15 2015/16 2016/17 2013/14 - 2016/17
Current payments 1 615 750 1 717 039 1 914 570 2 009 265 7.5% 99.7% 2 146 544 2 256 602 2 387 468 5.9% 55.8%
Compensation of employees 1 532 004 1 639 540 1 834 677 1 919 613 7.8% 95.1% 2 050 806 2 165 151 2 289 692 6.1% 53.4%
Goods and services 83 568 77 384 79 893 89 652 2.4% 4.5% 95 738 91 451 97 776 2.9% 2.4%
of which:
Administration fees 267 281 236 355 10.0% – 967 1 068 1 128 47.0% –
Advertising – – 5 10 – – 10 11 13 9.1% –
Assets less than the capitalisation threshold 115 79 704 972 103.7% – 981 989 1 042 2.3% –
Bursaries: Employees 5 – – – -100.0% – – – – – –
Catering: Departmental activities 308 276 386 899 42.9% – 907 909 957 2.1% –
Communication 14 596 15 129 13 655 19 130 9.4% 0.9% 15 659 18 735 17 789 -2.4% 0.5%
Computer services 17 1 – 66 57.2% – 66 70 81 7.1% –
Consultants and professional services: Business and advisory services
710 – – 636 -3.6% – 699 651 746 5.5% –
Consultants and professional services: Legal costs
2 751 – – 1 -92.9% – 1 1 – -100.0% –
Contractors 85 51 140 322 55.9% – 354 356 405 7.9% –
Agency and support / outsourced services 129 10 – 98 -8.8% – 99 98 104 2.0% –
Entertainment 12 5 1 50 60.9% – – – – -100.0% –
Fleet services (including government motor transport)
1 – 105 128 404.0% – 140 131 138 2.5% –
Inventory: Food and food supplies 14 14 18 – -100.0% – 96 106 111 – –
Inventory: Learner and teacher support material
– – – – – – 60 62 65 – –
Inventory: Materials and supplies – – 18 (93) – – – – – -100.0% –
Inventory: Medical supplies – – 3 – – – 5 9 9 – –
Inventory: Other supplies 130 594 487 – -100.0% – 66 71 74 – –
Consumable supplies 13 8 – 412 216.5% – 192 286 305 -9.5% –
Consumable: Stationery, printing and office supplies
2 468 3 205 2 625 2 376 -1.3% 0.1% 2 663 3 300 3 190 10.3% 0.1%
Operating leases 82 1 15 1 200 144.6% – 1 320 1 818 1 895 16.5% –
Property payments 10 344 8 912 9 560 10 101 -0.8% 0.5% 11 215 11 500 12 122 6.3% 0.3%
Travel and subsistence 46 294 45 550 47 228 49 673 2.4% 2.6% 56 605 47 455 53 747 2.7% 1.3%
Training and development 5 – – – -100.0% – (1) (1) – – –
Operating payments 4 858 2 386 3 885 3 189 -13.1% 0.2% 3 507 3 685 3 707 5.1% 0.1%
Venues and facilities 364 882 822 127 -29.6% – 127 141 148 5.2% –
Interest and rent on land 178 115 – – -100.0% – – – – – –
Transfers and subsidies 4 607 4 260 2 766 3 193 -11.5% 0.2% 3 352 3 091 3 285 1.0% 0.1%
Households 4 607 4 260 2 766 3 193 -11.5% 0.2% 3 352 3 091 3 285 1.0% 0.1%
Payments for capital assets 1 971 1 366 2 131 2 603 9.7% 0.1% 2 745 2 797 3 479 10.2% 0.1%
Buildings and other fixed structures 161 – 27 145 -3.4% – 152 157 166 4.6% –
Machinery and equipment 1 810 1 366 2 104 2 458 10.7% 0.1% 2 593 2 640 3 313 10.5% 0.1%
Payments for financial assets 576 45 589 – -100.0% – – – – – –
Total 1 622 904 1 722 710 1 920 056 2 015 061 7.5% 100.0% 2 152 641 2 262 490 2 394 232 5.9% 56.0%
Proportion of total subprogramme expenditure to programme expenditure
65.0% 65.9% 67.6% 65.7% 66.2% 67.0% 66.7%
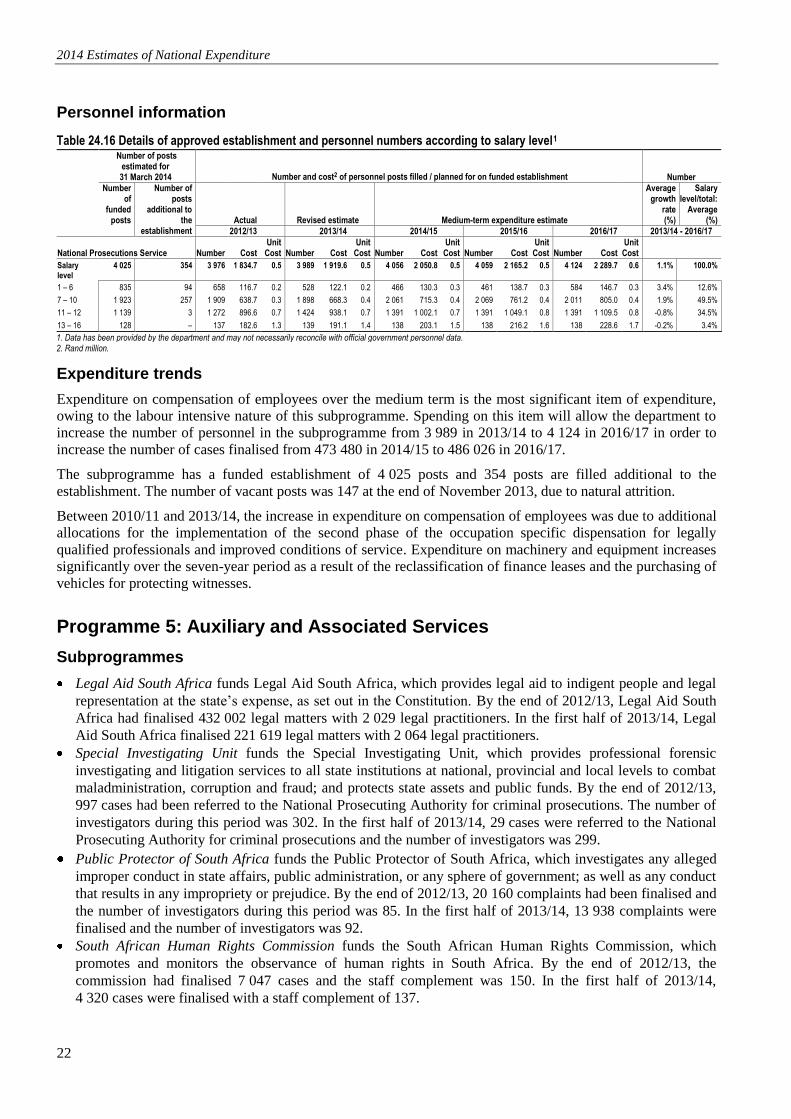
2014 Estimates of National Expenditure
22
Personnel information
Table 24.16 Details of approved establishment and personnel numbers according to salary level1
Number of posts estimated for 31 March 2014 Number and cost2 of personnel posts filled / planned for on funded establishment Number
Number of
funded posts
Number of posts
additional to the
establishment Actual Revised estimate Medium-term expenditure estimate
Average growth
rate (%)
Salary level/total:
Average (%)
2012/13 2013/14 2014/15 2015/16 2016/17 2013/14 - 2016/17
National Prosecutions Service
Number Cost Unit Cost
Number Cost
Unit Cost
Number Cost
Unit Cost
Number Cost
Unit Cost
Number Cost
Unit Cost
Salary level
4 025 354 3 976 1 834.7 0.5 3 989 1 919.6 0.5 4 056 2 050.8 0.5 4 059 2 165.2 0.5 4 124 2 289.7 0.6 1.1% 100.0%
1 – 6 835 94 658 116.7 0.2 528 122.1 0.2 466 130.3 0.3 461 138.7 0.3 584 146.7 0.3 3.4% 12.6%
7 – 10 1 923 257 1 909 638.7 0.3 1 898 668.3 0.4 2 061 715.3 0.4 2 069 761.2 0.4 2 011 805.0 0.4 1.9% 49.5%
11 – 12 1 139 3 1 272 896.6 0.7 1 424 938.1 0.7 1 391 1 002.1 0.7 1 391 1 049.1 0.8 1 391 1 109.5 0.8 -0.8% 34.5%
13 – 16 128 – 137 182.6 1.3 139 191.1 1.4 138 203.1 1.5 138 216.2 1.6 138 228.6 1.7 -0.2% 3.4%
1. Data has been provided by the department and may not necessarily reconcile with official government personnel data. 2. Rand million.
Expenditure trends
Expenditure on compensation of employees over the medium term is the most significant item of expenditure,
owing to the labour intensive nature of this subprogramme. Spending on this item will allow the department to
increase the number of personnel in the subprogramme from 3 989 in 2013/14 to 4 124 in 2016/17 in order to
increase the number of cases finalised from 473 480 in 2014/15 to 486 026 in 2016/17.
The subprogramme has a funded establishment of 4 025 posts and 354 posts are filled additional to the
establishment. The number of vacant posts was 147 at the end of November 2013, due to natural attrition.
Between 2010/11 and 2013/14, the increase in expenditure on compensation of employees was due to additional
allocations for the implementation of the second phase of the occupation specific dispensation for legally
qualified professionals and improved conditions of service. Expenditure on machinery and equipment increases
significantly over the seven-year period as a result of the reclassification of finance leases and the purchasing of
vehicles for protecting witnesses.
Programme 5: Auxiliary and Associated Services
Subprogrammes
Legal Aid South Africa funds Legal Aid South Africa, which provides legal aid to indigent people and legal
representation at the state’s expense, as set out in the Constitution. By the end of 2012/13, Legal Aid South
Africa had finalised 432 002 legal matters with 2 029 legal practitioners. In the first half of 2013/14, Legal
Aid South Africa finalised 221 619 legal matters with 2 064 legal practitioners.
Special Investigating Unit funds the Special Investigating Unit, which provides professional forensic
investigating and litigation services to all state institutions at national, provincial and local levels to combat
maladministration, corruption and fraud; and protects state assets and public funds. By the end of 2012/13,
997 cases had been referred to the National Prosecuting Authority for criminal prosecutions. The number of
investigators during this period was 302. In the first half of 2013/14, 29 cases were referred to the National
Prosecuting Authority for criminal prosecutions and the number of investigators was 299.
Public Protector of South Africa funds the Public Protector of South Africa, which investigates any alleged
improper conduct in state affairs, public administration, or any sphere of government; as well as any conduct
that results in any impropriety or prejudice. By the end of 2012/13, 20 160 complaints had been finalised and
the number of investigators during this period was 85. In the first half of 2013/14, 13 938 complaints were
finalised and the number of investigators was 92. South African Human Rights Commission funds the South African Human Rights Commission, which
promotes and monitors the observance of human rights in South Africa. By the end of 2012/13, the
commission had finalised 7 047 cases and the staff complement was 150. In the first half of 2013/14,
4 320 cases were finalised with a staff complement of 137.
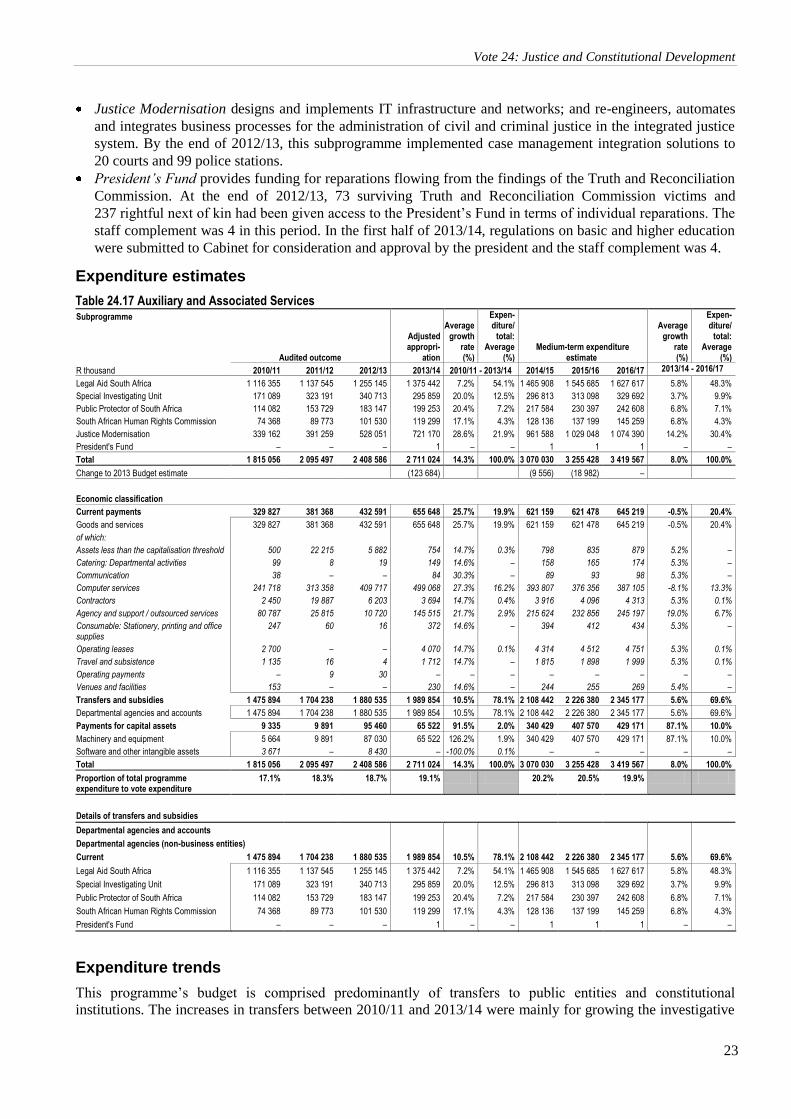
Vote 24: Justice and Constitutional Development
23
Ch
ap
ter na
me
Justice Modernisation designs and implements IT infrastructure and networks; and re-engineers, automates
and integrates business processes for the administration of civil and criminal justice in the integrated justice
system. By the end of 2012/13, this subprogramme implemented case management integration solutions to
20 courts and 99 police stations.
President’s Fund provides funding for reparations flowing from the findings of the Truth and Reconciliation
Commission. At the end of 2012/13, 73 surviving Truth and Reconciliation Commission victims and
237 rightful next of kin had been given access to the President’s Fund in terms of individual reparations. The
staff complement was 4 in this period. In the first half of 2013/14, regulations on basic and higher education
were submitted to Cabinet for consideration and approval by the president and the staff complement was 4.
Expenditure estimates
Table 24.17 Auxiliary and Associated Services Subprogramme
Audited outcome
Adjusted appropri-
ation
Average growth
rate (%)
Expen- diture/
total: Average
(%) Medium-term expenditure
estimate
Average growth
rate (%)
Expen- diture/
total: Average
(%)
R thousand 2010/11 2011/12 2012/13 2013/14 2010/11 - 2013/14 2014/15 2015/16 2016/17 2013/14 - 2016/17
Legal Aid South Africa 1 116 355 1 137 545 1 255 145 1 375 442 7.2% 54.1% 1 465 908 1 545 685 1 627 617 5.8% 48.3%
Special Investigating Unit 171 089 323 191 340 713 295 859 20.0% 12.5% 296 813 313 098 329 692 3.7% 9.9%
Public Protector of South Africa 114 082 153 729 183 147 199 253 20.4% 7.2% 217 584 230 397 242 608 6.8% 7.1%
South African Human Rights Commission 74 368 89 773 101 530 119 299 17.1% 4.3% 128 136 137 199 145 259 6.8% 4.3%
Justice Modernisation 339 162 391 259 528 051 721 170 28.6% 21.9% 961 588 1 029 048 1 074 390 14.2% 30.4%
President's Fund – – – 1 – – 1 1 1 – –
Total 1 815 056 2 095 497 2 408 586 2 711 024 14.3% 100.0% 3 070 030 3 255 428 3 419 567 8.0% 100.0%
Change to 2013 Budget estimate (123 684) (9 556) (18 982) –
Economic classification
Current payments 329 827 381 368 432 591 655 648 25.7% 19.9% 621 159 621 478 645 219 -0.5% 20.4%
Goods and services 329 827 381 368 432 591 655 648 25.7% 19.9% 621 159 621 478 645 219 -0.5% 20.4%
of which:
Assets less than the capitalisation threshold 500 22 215 5 882 754 14.7% 0.3% 798 835 879 5.2% –
Catering: Departmental activities 99 8 19 149 14.6% – 158 165 174 5.3% –
Communication 38 – – 84 30.3% – 89 93 98 5.3% –
Computer services 241 718 313 358 409 717 499 068 27.3% 16.2% 393 807 376 356 387 105 -8.1% 13.3%
Contractors 2 450 19 887 6 203 3 694 14.7% 0.4% 3 916 4 096 4 313 5.3% 0.1%
Agency and support / outsourced services 80 787 25 815 10 720 145 515 21.7% 2.9% 215 624 232 856 245 197 19.0% 6.7%
Consumable: Stationery, printing and office supplies
247 60 16 372 14.6% – 394 412 434 5.3% –
Operating leases 2 700 – – 4 070 14.7% 0.1% 4 314 4 512 4 751 5.3% 0.1%
Travel and subsistence 1 135 16 4 1 712 14.7% – 1 815 1 898 1 999 5.3% 0.1%
Operating payments – 9 30 – – – – – – – –
Venues and facilities 153 – – 230 14.6% – 244 255 269 5.4% –
Transfers and subsidies 1 475 894 1 704 238 1 880 535 1 989 854 10.5% 78.1% 2 108 442 2 226 380 2 345 177 5.6% 69.6%
Departmental agencies and accounts 1 475 894 1 704 238 1 880 535 1 989 854 10.5% 78.1% 2 108 442 2 226 380 2 345 177 5.6% 69.6%
Payments for capital assets 9 335 9 891 95 460 65 522 91.5% 2.0% 340 429 407 570 429 171 87.1% 10.0%
Machinery and equipment 5 664 9 891 87 030 65 522 126.2% 1.9% 340 429 407 570 429 171 87.1% 10.0%
Software and other intangible assets 3 671 – 8 430 – -100.0% 0.1% – – – – –
Total 1 815 056 2 095 497 2 408 586 2 711 024 14.3% 100.0% 3 070 030 3 255 428 3 419 567 8.0% 100.0%
Proportion of total programme expenditure to vote expenditure
17.1% 18.3% 18.7% 19.1% 20.2% 20.5% 19.9%
Details of transfers and subsidies
Departmental agencies and accounts
Departmental agencies (non-business entities)
Current 1 475 894 1 704 238 1 880 535 1 989 854 10.5% 78.1% 2 108 442 2 226 380 2 345 177 5.6% 69.6%
Legal Aid South Africa 1 116 355 1 137 545 1 255 145 1 375 442 7.2% 54.1% 1 465 908 1 545 685 1 627 617 5.8% 48.3%
Special Investigating Unit 171 089 323 191 340 713 295 859 20.0% 12.5% 296 813 313 098 329 692 3.7% 9.9%
Public Protector of South Africa 114 082 153 729 183 147 199 253 20.4% 7.2% 217 584 230 397 242 608 6.8% 7.1%
South African Human Rights Commission 74 368 89 773 101 530 119 299 17.1% 4.3% 128 136 137 199 145 259 6.8% 4.3%
President's Fund – – – 1 – – 1 1 1 – –
Expenditure trends
This programme’s budget is comprised predominantly of transfers to public entities and constitutional
institutions. The increases in transfers between 2010/11 and 2013/14 were mainly for growing the investigative
2014 Estimates of National Expenditure
24
capacity in the Public Protector of South Africa and the Special Investigating Unit in order to intensify the fight
against corruption, maladministration, malpractices and improper conduct in state affairs.
The spending focus over the medium term will be on building capacity in these entities as well as accelerating
modernisation projects administered by the department on behalf of the justice, crime prevention and security
cluster. The modernisation of the criminal justice system is in line with government’s priority of improving all
components of the criminal justice system.
The significant growth in expenditure in the Justice Modernisation subprogramme between 2010/11 and
2013/14 is as a result of funds that were reprioritised from the Department of Police to the Department of Justice
and Constitutional Development for the revamping of the criminal justice system. This is also the reason for the
significant increase in expenditure on computer services, which are key to the modernisation initiative, and
accounts for the projected increase in expenditure on goods and services over the medium term. The
modernisation and revamp of the justice system initiative received additional allocations over this period, as did
the transfers to entities and constitutional institutions, to fund an increase in personnel.
R90 million over the medium term has been reprioritised from the Justice Modernisation subprogramme for
human resource capacity in the Financial Intelligence Centre.
Public entities and other agencies
Legal Aid South Africa
Mandate and goals
The Legal Aid Board, trading as Legal Aid South Africa, was established in terms of section 2 of the Legal Aid
Act (1969), to provide legal aid to indigent people as well as legal representation at the state’s expense to
eligible people in terms of the Constitution. It is required to provide independent and impartial legal aid, with
the intention of improving justice and public confidence in the law and the administration of justice. It aims to
be a leader in the provision of accessible, sustainable, ethical, independent and quality legal services to the poor
and vulnerable. To this end, the entity has identified the following priority groups: children; all detained people,
including sentenced prisoners; all accused people who wish to appeal or review a court decision in a higher
court; women, particularly in divorces, maintenance and domestic violence cases; and the landless, especially in
eviction cases.
The organisation’s strategic goals over the medium term are to:
empower clients and communities to make informed choices about their legal rights and responsibilities
ensure an accessible, effective and efficient justice system serving all in South Africa
create effective, sustained stakeholder partnerships that are able to jointly increase access to justice as well as
support other external developing legal aid organisations
ensure financial and non-financial sustainability that impacts positively on society, the economy and the
environment
ensure good governance practices that enable high performance and accountability
create and maintain a recognised, respected, independent and acclaimed legal aid brand
ensure an effective and efficient, economic and environmentally responsive supply chain management
system supporting client services delivery and internal business processes
promote employee value proposition that is able to recruit and retain the best talent to deliver the
organisation’s mandate and strategies
develop modern, integrated, secure and effective information technology platforms facilitating client services
and linkages and enabling internal business needs.
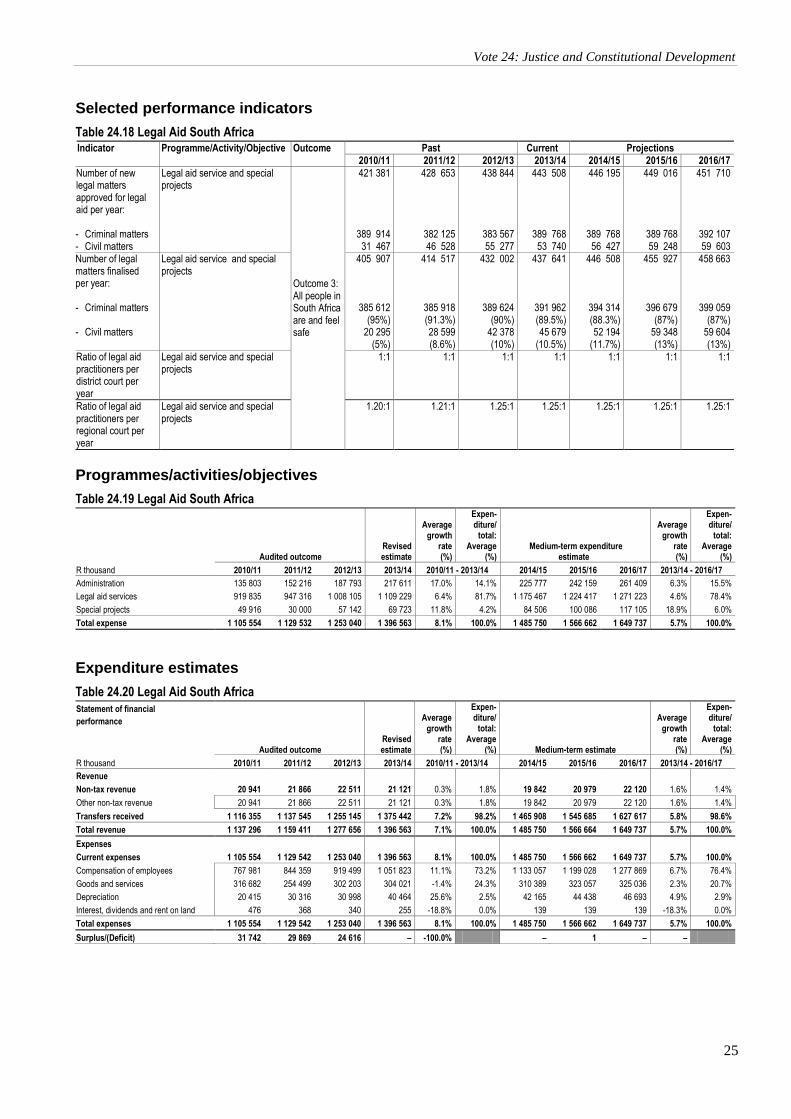
Vote 24: Justice and Constitutional Development
25
Ch
ap
ter na
me
Selected performance indicators
Table 24.18 Legal Aid South Africa Indicator Programme/Activity/Objective Outcome Past Current Projections 2010/11 2011/12 2012/13 2013/14 2014/15 2015/16 2016/17
Number of new legal matters approved for legal aid per year: - Criminal matters - Civil matters
Legal aid service and special projects
Outcome 3: All people in South Africa are and feel safe
421 381
389 914 31 467
428 653
382 125 46 528
438 844
383 567 55 277
443 508
389 768 53 740
446 195
389 768 56 427
449 016
389 768 59 248
451 710
392 107 59 603
Number of legal matters finalised per year: - Criminal matters
- Civil matters
Legal aid service and special projects
405 907
385 612 (95%)
20 295 (5%)
414 517
385 918 (91.3%) 28 599 (8.6%)
432 002
389 624 (90%)
42 378 (10%)
437 641
391 962 (89.5%) 45 679
(10.5%)
446 508
394 314 (88.3%) 52 194
(11.7%)
455 927
396 679
(87%) 59 348 (13%)
458 663
399 059 (87%)
59 604 (13%)
Ratio of legal aid practitioners per district court per year
Legal aid service and special projects
1:1 1:1 1:1 1:1 1:1 1:1 1:1
Ratio of legal aid practitioners per regional court per year
Legal aid service and special projects
1.20:1 1.21:1 1.25:1 1.25:1 1.25:1 1.25:1 1.25:1
Programmes/activities/objectives
Table 24.19 Legal Aid South Africa
Audited outcome Revised estimate
Average growth
rate (%)
Expen- diture/
total: Average
(%) Medium-term expenditure
estimate
Average growth
rate (%)
Expen- diture/
total: Average
(%)
R thousand 2010/11 2011/12 2012/13 2013/14 2010/11 - 2013/14 2014/15 2015/16 2016/17 2013/14 - 2016/17
Administration 135 803 152 216 187 793 217 611 17.0% 14.1% 225 777 242 159 261 409 6.3% 15.5%
Legal aid services 919 835 947 316 1 008 105 1 109 229 6.4% 81.7% 1 175 467 1 224 417 1 271 223 4.6% 78.4%
Special projects 49 916 30 000 57 142 69 723 11.8% 4.2% 84 506 100 086 117 105 18.9% 6.0%
Total expense 1 105 554 1 129 532 1 253 040 1 396 563 8.1% 100.0% 1 485 750 1 566 662 1 649 737 5.7% 100.0%
Expenditure estimates
Table 24.20 Legal Aid South Africa
Statement of financial
performance
Audited outcome Revised estimate
Average growth
rate (%)
Expen- diture/
total: Average
(%) Medium-term estimate
Average growth
rate (%)
Expen- diture/
total: Average
(%)
R thousand 2010/11 2011/12 2012/13 2013/14 2010/11 - 2013/14 2014/15 2015/16 2016/17 2013/14 - 2016/17
Revenue
Non-tax revenue 20 941 21 866 22 511 21 121 0.3% 1.8% 19 842 20 979 22 120 1.6% 1.4%
Other non-tax revenue 20 941 21 866 22 511 21 121 0.3% 1.8% 19 842 20 979 22 120 1.6% 1.4%
Transfers received 1 116 355 1 137 545 1 255 145 1 375 442 7.2% 98.2% 1 465 908 1 545 685 1 627 617 5.8% 98.6%
Total revenue 1 137 296 1 159 411 1 277 656 1 396 563 7.1% 100.0% 1 485 750 1 566 664 1 649 737 5.7% 100.0%
Expenses
Current expenses 1 105 554 1 129 542 1 253 040 1 396 563 8.1% 100.0% 1 485 750 1 566 662 1 649 737 5.7% 100.0%
Compensation of employees 767 981 844 359 919 499 1 051 823 11.1% 73.2% 1 133 057 1 199 028 1 277 869 6.7% 76.4%
Goods and services 316 682 254 499 302 203 304 021 -1.4% 24.3% 310 389 323 057 325 036 2.3% 20.7%
Depreciation 20 415 30 316 30 998 40 464 25.6% 2.5% 42 165 44 438 46 693 4.9% 2.9%
Interest, dividends and rent on land 476 368 340 255 -18.8% 0.0% 139 139 139 -18.3% 0.0%
Total expenses 1 105 554 1 129 542 1 253 040 1 396 563 8.1% 100.0% 1 485 750 1 566 662 1 649 737 5.7% 100.0%
Surplus/(Deficit) 31 742 29 869 24 616 – -100.0% – 1 – –
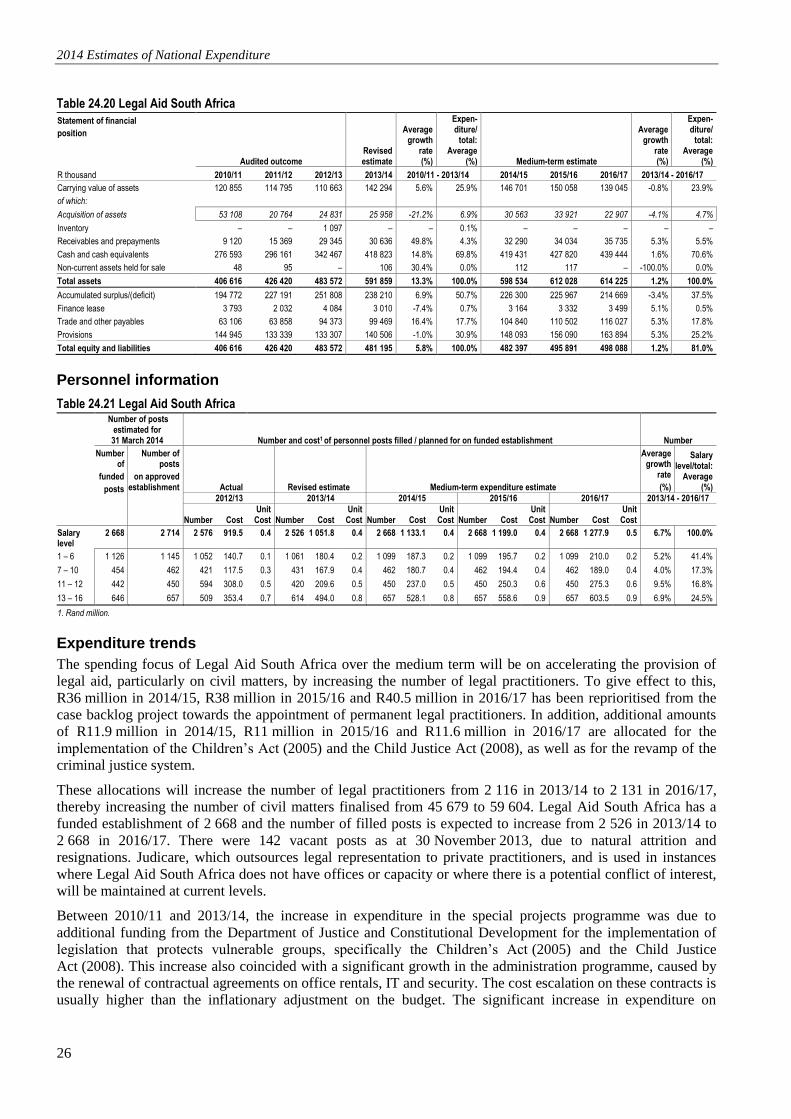
2014 Estimates of National Expenditure
26
Table 24.20 Legal Aid South Africa
Statement of financial
position
Audited outcome Revised estimate
Average growth
rate (%)
Expen- diture/
total: Average
(%) Medium-term estimate
Average growth
rate (%)
Expen- diture/
total: Average
(%)
R thousand 2010/11 2011/12 2012/13 2013/14 2010/11 - 2013/14 2014/15 2015/16 2016/17 2013/14 - 2016/17
Carrying value of assets 120 855 114 795 110 663 142 294 5.6% 25.9% 146 701 150 058 139 045 -0.8% 23.9%
of which:
Acquisition of assets 53 108 20 764 24 831 25 958 -21.2% 6.9% 30 563 33 921 22 907 -4.1% 4.7%
Inventory – – 1 097 – – 0.1% – – – – –
Receivables and prepayments 9 120 15 369 29 345 30 636 49.8% 4.3% 32 290 34 034 35 735 5.3% 5.5%
Cash and cash equivalents 276 593 296 161 342 467 418 823 14.8% 69.8% 419 431 427 820 439 444 1.6% 70.6%
Non-current assets held for sale 48 95 – 106 30.4% 0.0% 112 117 – -100.0% 0.0%
Total assets 406 616 426 420 483 572 591 859 13.3% 100.0% 598 534 612 028 614 225 1.2% 100.0%
Accumulated surplus/(deficit) 194 772 227 191 251 808 238 210 6.9% 50.7% 226 300 225 967 214 669 -3.4% 37.5%
Finance lease 3 793 2 032 4 084 3 010 -7.4% 0.7% 3 164 3 332 3 499 5.1% 0.5%
Trade and other payables 63 106 63 858 94 373 99 469 16.4% 17.7% 104 840 110 502 116 027 5.3% 17.8%
Provisions 144 945 133 339 133 307 140 506 -1.0% 30.9% 148 093 156 090 163 894 5.3% 25.2%
Total equity and liabilities 406 616 426 420 483 572 481 195 5.8% 100.0% 482 397 495 891 498 088 1.2% 81.0%
Personnel information
Table 24.21 Legal Aid South Africa
Number of posts estimated for 31 March 2014 Number and cost1 of personnel posts filled / planned for on funded establishment Number
Number of
funded
posts
Number of posts
on approved establishment Actual Revised estimate Medium-term expenditure estimate
Average growth
rate
(%)
Salary level/total:
Average (%)
2012/13 2013/14 2014/15 2015/16 2016/17 2013/14 - 2016/17
Number Cost Unit Cost
Number Cost
Unit Cost
Number Cost
Unit Cost
Number Cost
Unit Cost
Number Cost
Unit Cost
Salary level
2 668 2 714 2 576 919.5 0.4 2 526 1 051.8 0.4 2 668 1 133.1 0.4 2 668 1 199.0 0.4 2 668 1 277.9 0.5 6.7% 100.0%
1 – 6 1 126 1 145 1 052 140.7 0.1 1 061 180.4 0.2 1 099 187.3 0.2 1 099 195.7 0.2 1 099 210.0 0.2 5.2% 41.4%
7 – 10 454 462 421 117.5 0.3 431 167.9 0.4 462 180.7 0.4 462 194.4 0.4 462 189.0 0.4 4.0% 17.3%
11 – 12 442 450 594 308.0 0.5 420 209.6 0.5 450 237.0 0.5 450 250.3 0.6 450 275.3 0.6 9.5% 16.8%
13 – 16 646 657 509 353.4 0.7 614 494.0 0.8 657 528.1 0.8 657 558.6 0.9 657 603.5 0.9 6.9% 24.5%
1. Rand million.
Expenditure trends
The spending focus of Legal Aid South Africa over the medium term will be on accelerating the provision of
legal aid, particularly on civil matters, by increasing the number of legal practitioners. To give effect to this,
R36 million in 2014/15, R38 million in 2015/16 and R40.5 million in 2016/17 has been reprioritised from the
case backlog project towards the appointment of permanent legal practitioners. In addition, additional amounts
of R11.9 million in 2014/15, R11 million in 2015/16 and R11.6 million in 2016/17 are allocated for the
implementation of the Children’s Act (2005) and the Child Justice Act (2008), as well as for the revamp of the
criminal justice system.
These allocations will increase the number of legal practitioners from 2 116 in 2013/14 to 2 131 in 2016/17,
thereby increasing the number of civil matters finalised from 45 679 to 59 604. Legal Aid South Africa has a
funded establishment of 2 668 and the number of filled posts is expected to increase from 2 526 in 2013/14 to
2 668 in 2016/17. There were 142 vacant posts as at 30 November 2013, due to natural attrition and
resignations. Judicare, which outsources legal representation to private practitioners, and is used in instances
where Legal Aid South Africa does not have offices or capacity or where there is a potential conflict of interest,
will be maintained at current levels.
Between 2010/11 and 2013/14, the increase in expenditure in the special projects programme was due to
additional funding from the Department of Justice and Constitutional Development for the implementation of
legislation that protects vulnerable groups, specifically the Children’s Act (2005) and the Child Justice
Act (2008). This increase also coincided with a significant growth in the administration programme, caused by
the renewal of contractual agreements on office rentals, IT and security. The cost escalation on these contracts is
usually higher than the inflationary adjustment on the budget. The significant increase in expenditure on
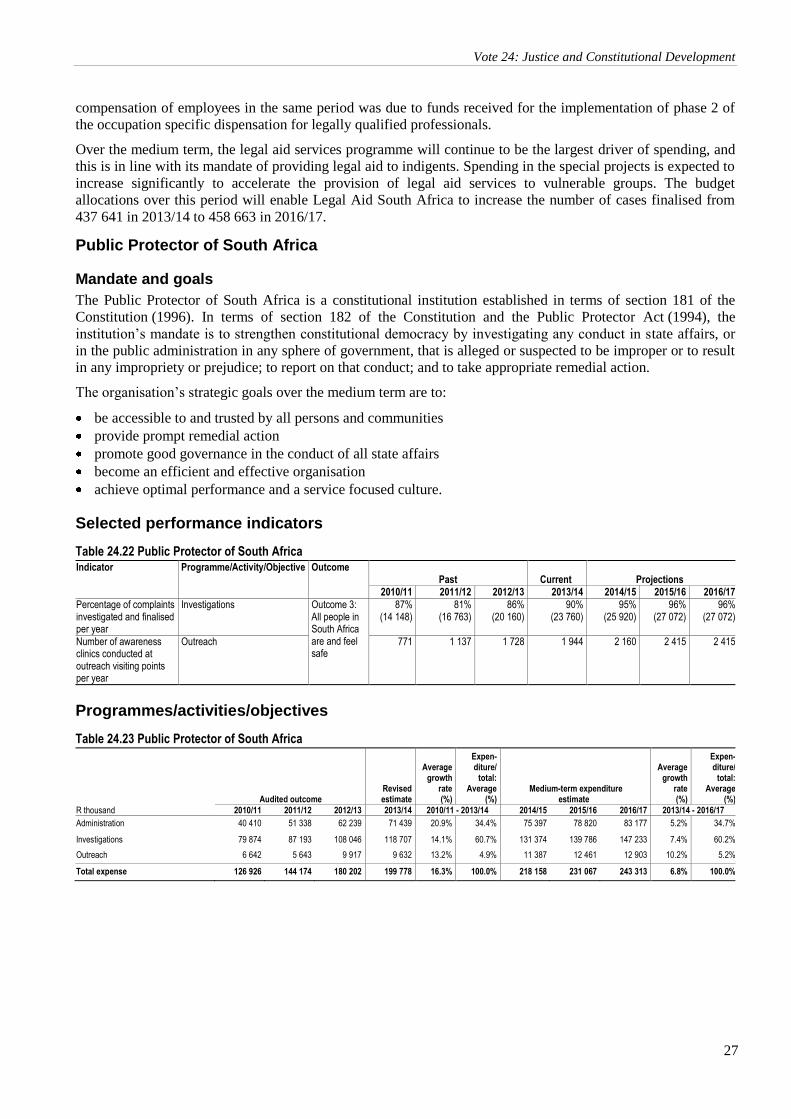
Vote 24: Justice and Constitutional Development
27
Ch
ap
ter na
me
compensation of employees in the same period was due to funds received for the implementation of phase 2 of
the occupation specific dispensation for legally qualified professionals.
Over the medium term, the legal aid services programme will continue to be the largest driver of spending, and
this is in line with its mandate of providing legal aid to indigents. Spending in the special projects is expected to
increase significantly to accelerate the provision of legal aid services to vulnerable groups. The budget
allocations over this period will enable Legal Aid South Africa to increase the number of cases finalised from
437 641 in 2013/14 to 458 663 in 2016/17.
Public Protector of South Africa
Mandate and goals
The Public Protector of South Africa is a constitutional institution established in terms of section 181 of the
Constitution (1996). In terms of section 182 of the Constitution and the Public Protector Act (1994), the
institution’s mandate is to strengthen constitutional democracy by investigating any conduct in state affairs, or
in the public administration in any sphere of government, that is alleged or suspected to be improper or to result
in any impropriety or prejudice; to report on that conduct; and to take appropriate remedial action.
The organisation’s strategic goals over the medium term are to:
be accessible to and trusted by all persons and communities
provide prompt remedial action
promote good governance in the conduct of all state affairs
become an efficient and effective organisation
achieve optimal performance and a service focused culture.
Selected performance indicators
Table 24.22 Public Protector of South Africa Indicator
Programme/Activity/Objective Outcome Past Current Projections
2010/11 2011/12 2012/13 2013/14 2014/15 2015/16 2016/17
Percentage of complaints investigated and finalised per year
Investigations Outcome 3: All people in South Africa are and feel safe
87% (14 148)
81% (16 763)
86% (20 160)
90% (23 760)
95% (25 920)
96% (27 072)
96% (27 072)
Number of awareness clinics conducted at outreach visiting points per year
Outreach 771 1 137 1 728 1 944 2 160 2 415 2 415
Programmes/activities/objectives
Table 24.23 Public Protector of South Africa
Audited outcome Revised estimate
Average growth
rate (%)
Expen- diture/
total: Average
(%) Medium-term expenditure
estimate
Average growth
rate (%)
Expen- diture/
total: Average
(%)
R thousand 2010/11 2011/12 2012/13 2013/14 2010/11 - 2013/14 2014/15 2015/16 2016/17 2013/14 - 2016/17
Administration 40 410 51 338 62 239 71 439 20.9% 34.4% 75 397 78 820 83 177 5.2% 34.7%
Investigations 79 874 87 193 108 046 118 707 14.1% 60.7% 131 374 139 786 147 233 7.4% 60.2%
Outreach 6 642 5 643 9 917 9 632 13.2% 4.9% 11 387 12 461 12 903 10.2% 5.2%
Total expense 126 926 144 174 180 202 199 778 16.3% 100.0% 218 158 231 067 243 313 6.8% 100.0%
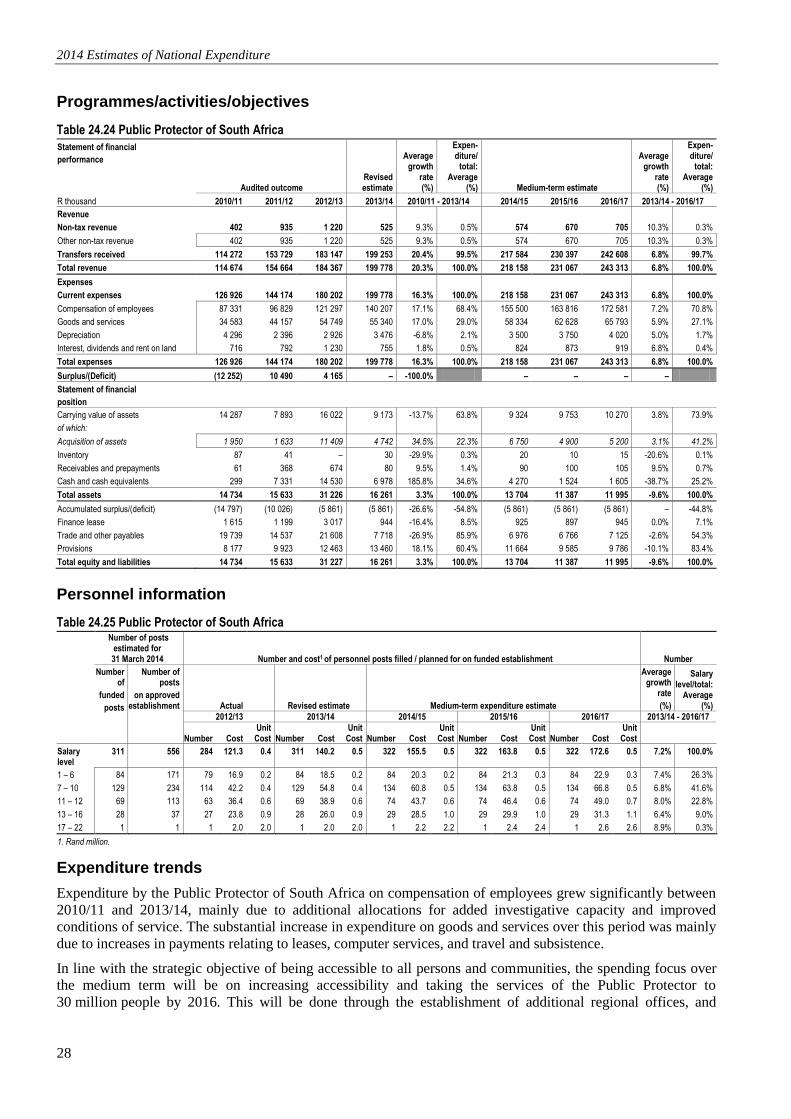
2014 Estimates of National Expenditure
28
Programmes/activities/objectives
Table 24.24 Public Protector of South Africa
Statement of financial
performance
Audited outcome Revised estimate
Average growth
rate (%)
Expen- diture/
total: Average
(%) Medium-term estimate
Average growth
rate (%)
Expen- diture/
total: Average
(%)
R thousand 2010/11 2011/12 2012/13 2013/14 2010/11 - 2013/14 2014/15 2015/16 2016/17 2013/14 - 2016/17
Revenue
Non-tax revenue 402 935 1 220 525 9.3% 0.5% 574 670 705 10.3% 0.3%
Other non-tax revenue 402 935 1 220 525 9.3% 0.5% 574 670 705 10.3% 0.3%
Transfers received 114 272 153 729 183 147 199 253 20.4% 99.5% 217 584 230 397 242 608 6.8% 99.7%
Total revenue 114 674 154 664 184 367 199 778 20.3% 100.0% 218 158 231 067 243 313 6.8% 100.0%
Expenses
Current expenses 126 926 144 174 180 202 199 778 16.3% 100.0% 218 158 231 067 243 313 6.8% 100.0%
Compensation of employees 87 331 96 829 121 297 140 207 17.1% 68.4% 155 500 163 816 172 581 7.2% 70.8%
Goods and services 34 583 44 157 54 749 55 340 17.0% 29.0% 58 334 62 628 65 793 5.9% 27.1%
Depreciation 4 296 2 396 2 926 3 476 -6.8% 2.1% 3 500 3 750 4 020 5.0% 1.7%
Interest, dividends and rent on land 716 792 1 230 755 1.8% 0.5% 824 873 919 6.8% 0.4%
Total expenses 126 926 144 174 180 202 199 778 16.3% 100.0% 218 158 231 067 243 313 6.8% 100.0%
Surplus/(Deficit) (12 252) 10 490 4 165 – -100.0% – – – –
Statement of financial
position
Carrying value of assets 14 287 7 893 16 022 9 173 -13.7% 63.8% 9 324 9 753 10 270 3.8% 73.9%
of which:
Acquisition of assets 1 950 1 633 11 409 4 742 34.5% 22.3% 6 750 4 900 5 200 3.1% 41.2%
Inventory 87 41 – 30 -29.9% 0.3% 20 10 15 -20.6% 0.1%
Receivables and prepayments 61 368 674 80 9.5% 1.4% 90 100 105 9.5% 0.7%
Cash and cash equivalents 299 7 331 14 530 6 978 185.8% 34.6% 4 270 1 524 1 605 -38.7% 25.2%
Total assets 14 734 15 633 31 226 16 261 3.3% 100.0% 13 704 11 387 11 995 -9.6% 100.0%
Accumulated surplus/(deficit) (14 797) (10 026) (5 861) (5 861) -26.6% -54.8% (5 861) (5 861) (5 861) – -44.8%
Finance lease 1 615 1 199 3 017 944 -16.4% 8.5% 925 897 945 0.0% 7.1%
Trade and other payables 19 739 14 537 21 608 7 718 -26.9% 85.9% 6 976 6 766 7 125 -2.6% 54.3%
Provisions 8 177 9 923 12 463 13 460 18.1% 60.4% 11 664 9 585 9 786 -10.1% 83.4%
Total equity and liabilities 14 734 15 633 31 227 16 261 3.3% 100.0% 13 704 11 387 11 995 -9.6% 100.0%
Personnel information
Table 24.25 Public Protector of South Africa
Number of posts estimated for 31 March 2014 Number and cost1 of personnel posts filled / planned for on funded establishment Number
Number of
funded
posts
Number of posts
on approved establishment Actual Revised estimate Medium-term expenditure estimate
Average growth
rate
(%)
Salary level/total:
Average (%)
2012/13 2013/14 2014/15 2015/16 2016/17 2013/14 - 2016/17
Number Cost Unit Cost
Number Cost
Unit Cost
Number Cost
Unit Cost
Number Cost
Unit Cost
Number Cost
Unit Cost
Salary level
311 556 284 121.3 0.4 311 140.2 0.5 322 155.5 0.5 322 163.8 0.5 322 172.6 0.5 7.2% 100.0%
1 – 6 84 171 79 16.9 0.2 84 18.5 0.2 84 20.3 0.2 84 21.3 0.3 84 22.9 0.3 7.4% 26.3%
7 – 10 129 234 114 42.2 0.4 129 54.8 0.4 134 60.8 0.5 134 63.8 0.5 134 66.8 0.5 6.8% 41.6%
11 – 12 69 113 63 36.4 0.6 69 38.9 0.6 74 43.7 0.6 74 46.4 0.6 74 49.0 0.7 8.0% 22.8%
13 – 16 28 37 27 23.8 0.9 28 26.0 0.9 29 28.5 1.0 29 29.9 1.0 29 31.3 1.1 6.4% 9.0%
17 – 22 1 1 1 2.0 2.0 1 2.0 2.0 1 2.2 2.2 1 2.4 2.4 1 2.6 2.6 8.9% 0.3%
1. Rand million.
Expenditure trends
Expenditure by the Public Protector of South Africa on compensation of employees grew significantly between
2010/11 and 2013/14, mainly due to additional allocations for added investigative capacity and improved
conditions of service. The substantial increase in expenditure on goods and services over this period was mainly
due to increases in payments relating to leases, computer services, and travel and subsistence.
In line with the strategic objective of being accessible to all persons and communities, the spending focus over
the medium term will be on increasing accessibility and taking the services of the Public Protector to
30 million people by 2016. This will be done through the establishment of additional regional offices, and
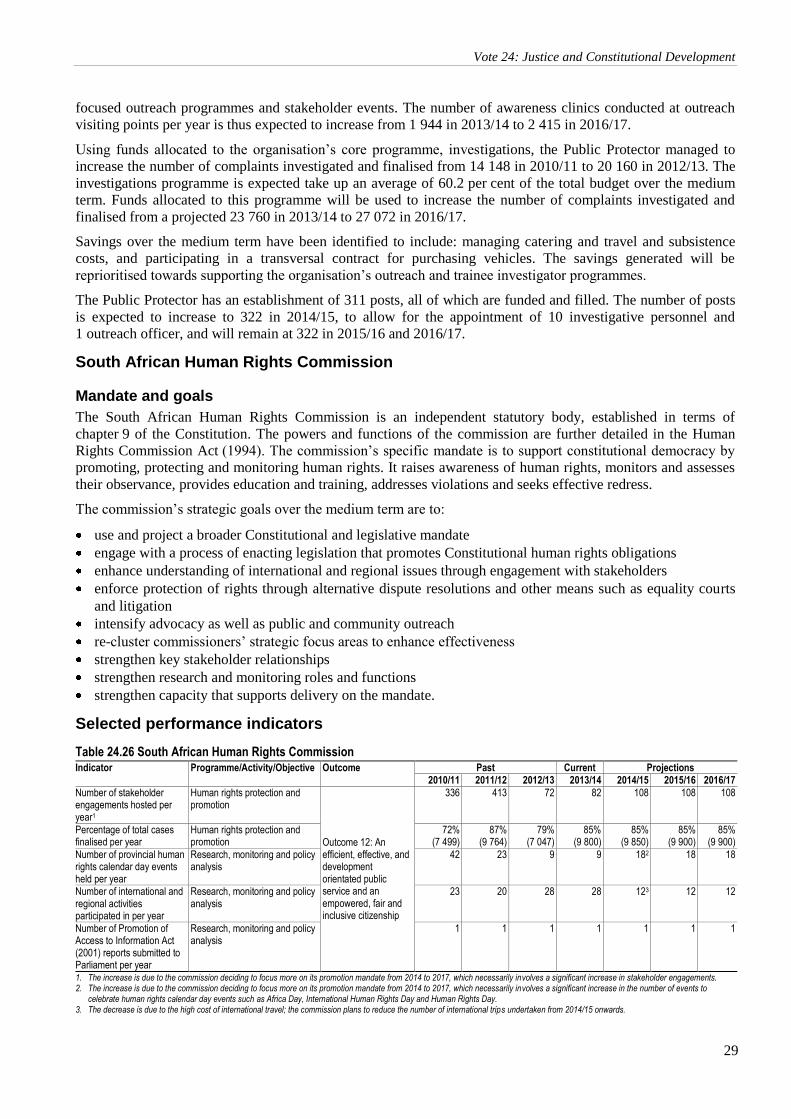
Vote 24: Justice and Constitutional Development
29
Ch
ap
ter na
me
focused outreach programmes and stakeholder events. The number of awareness clinics conducted at outreach
visiting points per year is thus expected to increase from 1 944 in 2013/14 to 2 415 in 2016/17.
Using funds allocated to the organisation’s core programme, investigations, the Public Protector managed to
increase the number of complaints investigated and finalised from 14 148 in 2010/11 to 20 160 in 2012/13. The
investigations programme is expected take up an average of 60.2 per cent of the total budget over the medium
term. Funds allocated to this programme will be used to increase the number of complaints investigated and
finalised from a projected 23 760 in 2013/14 to 27 072 in 2016/17.
Savings over the medium term have been identified to include: managing catering and travel and subsistence
costs, and participating in a transversal contract for purchasing vehicles. The savings generated will be
reprioritised towards supporting the organisation’s outreach and trainee investigator programmes.
The Public Protector has an establishment of 311 posts, all of which are funded and filled. The number of posts
is expected to increase to 322 in 2014/15, to allow for the appointment of 10 investigative personnel and
1 outreach officer, and will remain at 322 in 2015/16 and 2016/17.
South African Human Rights Commission
Mandate and goals
The South African Human Rights Commission is an independent statutory body, established in terms of
chapter 9 of the Constitution. The powers and functions of the commission are further detailed in the Human
Rights Commission Act (1994). The commission’s specific mandate is to support constitutional democracy by
promoting, protecting and monitoring human rights. It raises awareness of human rights, monitors and assesses
their observance, provides education and training, addresses violations and seeks effective redress.
The commission’s strategic goals over the medium term are to:
use and project a broader Constitutional and legislative mandate
engage with a process of enacting legislation that promotes Constitutional human rights obligations
enhance understanding of international and regional issues through engagement with stakeholders
enforce protection of rights through alternative dispute resolutions and other means such as equality courts
and litigation
intensify advocacy as well as public and community outreach
re-cluster commissioners’ strategic focus areas to enhance effectiveness
strengthen key stakeholder relationships
strengthen research and monitoring roles and functions
strengthen capacity that supports delivery on the mandate.
Selected performance indicators
Table 24.26 South African Human Rights Commission Indicator Programme/Activity/Objective Outcome Past Current Projections
2010/11 2011/12 2012/13 2013/14 2014/15 2015/16 2016/17
Number of stakeholder engagements hosted per year1
Human rights protection and promotion
Outcome 12: An efficient, effective, and development orientated public service and an empowered, fair and inclusive citizenship
336 413 72 82 108 108 108
Percentage of total cases finalised per year
Human rights protection and promotion
72% (7 499)
87% (9 764)
79% (7 047)
85% (9 800)
85% (9 850)
85% (9 900)
85% (9 900)
Number of provincial human rights calendar day events held per year
Research, monitoring and policy analysis
42 23 9 9 182 18 18
Number of international and regional activities participated in per year
Research, monitoring and policy analysis
23 20 28 28 123 12 12
Number of Promotion of Access to Information Act (2001) reports submitted to Parliament per year
Research, monitoring and policy analysis
1 1 1 1 1 1 1
1. The increase is due to the commission deciding to focus more on its promotion mandate from 2014 to 2017, which necessarily involves a significant increase in stakeholder engagements. 2. The increase is due to the commission deciding to focus more on its promotion mandate from 2014 to 2017, which necessarily involves a significant increase in the number of events to
celebrate human rights calendar day events such as Africa Day, International Human Rights Day and Human Rights Day. 3. The decrease is due to the high cost of international travel; the commission plans to reduce the number of international trips undertaken from 2014/15 onwards.
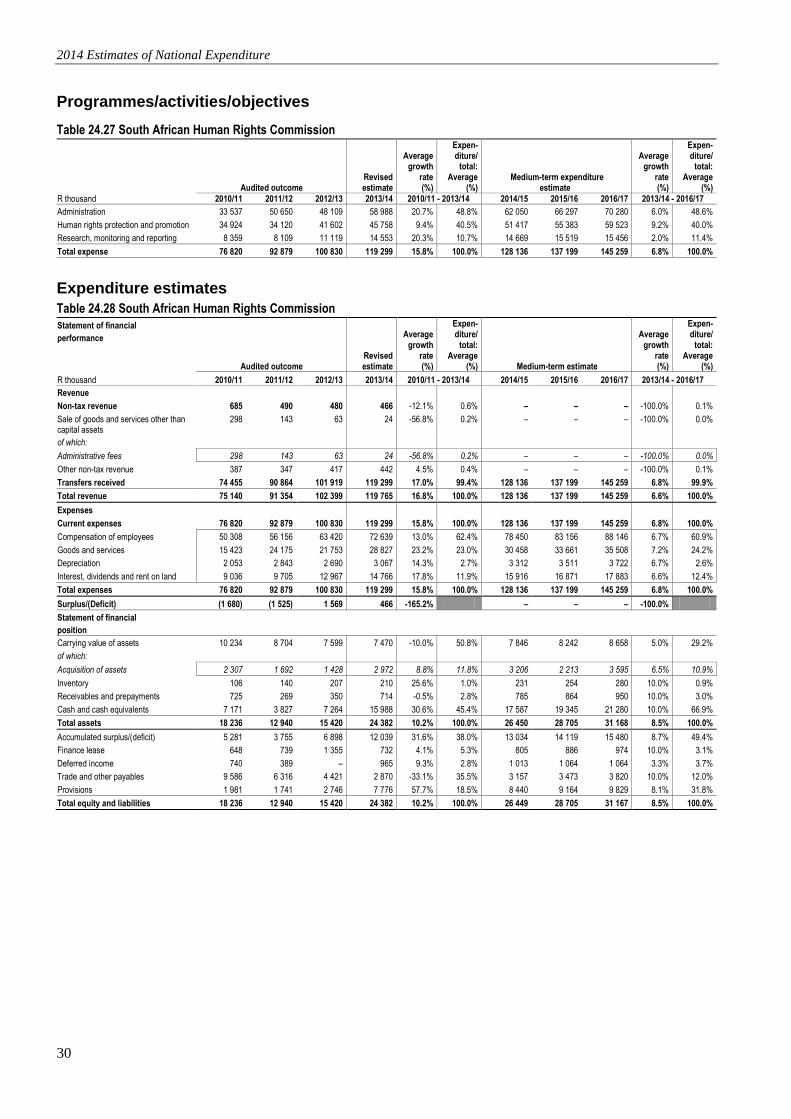
2014 Estimates of National Expenditure
30
Programmes/activities/objectives
Table 24.27 South African Human Rights Commission
Audited outcome Revised estimate
Average growth
rate (%)
Expen- diture/
total: Average
(%) Medium-term expenditure
estimate
Average growth
rate (%)
Expen- diture/
total: Average
(%)
R thousand 2010/11 2011/12 2012/13 2013/14 2010/11 - 2013/14 2014/15 2015/16 2016/17 2013/14 - 2016/17
Administration 33 537 50 650 48 109 58 988 20.7% 48.8% 62 050 66 297 70 280 6.0% 48.6%
Human rights protection and promotion 34 924 34 120 41 602 45 758 9.4% 40.5% 51 417 55 383 59 523 9.2% 40.0%
Research, monitoring and reporting 8 359 8 109 11 119 14 553 20.3% 10.7% 14 669 15 519 15 456 2.0% 11.4%
Total expense 76 820 92 879 100 830 119 299 15.8% 100.0% 128 136 137 199 145 259 6.8% 100.0%
Expenditure estimates
Table 24.28 South African Human Rights Commission
Statement of financial
performance
Audited outcome Revised estimate
Average growth
rate (%)
Expen- diture/
total: Average
(%) Medium-term estimate
Average growth
rate (%)
Expen- diture/
total: Average
(%)
R thousand 2010/11 2011/12 2012/13 2013/14 2010/11 - 2013/14 2014/15 2015/16 2016/17 2013/14 - 2016/17
Revenue
Non-tax revenue 685 490 480 466 -12.1% 0.6% – – – -100.0% 0.1%
Sale of goods and services other than capital assets
298 143 63 24 -56.8% 0.2% – – – -100.0% 0.0%
of which:
Administrative fees 298 143 63 24 -56.8% 0.2% – – – -100.0% 0.0%
Other non-tax revenue 387 347 417 442 4.5% 0.4% – – – -100.0% 0.1%
Transfers received 74 455 90 864 101 919 119 299 17.0% 99.4% 128 136 137 199 145 259 6.8% 99.9%
Total revenue 75 140 91 354 102 399 119 765 16.8% 100.0% 128 136 137 199 145 259 6.6% 100.0%
Expenses
Current expenses 76 820 92 879 100 830 119 299 15.8% 100.0% 128 136 137 199 145 259 6.8% 100.0%
Compensation of employees 50 308 56 156 63 420 72 639 13.0% 62.4% 78 450 83 156 88 146 6.7% 60.9%
Goods and services 15 423 24 175 21 753 28 827 23.2% 23.0% 30 458 33 661 35 508 7.2% 24.2%
Depreciation 2 053 2 843 2 690 3 067 14.3% 2.7% 3 312 3 511 3 722 6.7% 2.6%
Interest, dividends and rent on land 9 036 9 705 12 967 14 766 17.8% 11.9% 15 916 16 871 17 883 6.6% 12.4%
Total expenses 76 820 92 879 100 830 119 299 15.8% 100.0% 128 136 137 199 145 259 6.8% 100.0%
Surplus/(Deficit) (1 680) (1 525) 1 569 466 -165.2% – – – -100.0%
Statement of financial
position
Carrying value of assets 10 234 8 704 7 599 7 470 -10.0% 50.8% 7 846 8 242 8 658 5.0% 29.2%
of which:
Acquisition of assets 2 307 1 692 1 428 2 972 8.8% 11.8% 3 206 2 213 3 595 6.5% 10.9%
Inventory 106 140 207 210 25.6% 1.0% 231 254 280 10.0% 0.9%
Receivables and prepayments 725 269 350 714 -0.5% 2.8% 785 864 950 10.0% 3.0%
Cash and cash equivalents 7 171 3 827 7 264 15 988 30.6% 45.4% 17 587 19 345 21 280 10.0% 66.9%
Total assets 18 236 12 940 15 420 24 382 10.2% 100.0% 26 450 28 705 31 168 8.5% 100.0%
Accumulated surplus/(deficit) 5 281 3 755 6 898 12 039 31.6% 38.0% 13 034 14 119 15 480 8.7% 49.4%
Finance lease 648 739 1 355 732 4.1% 5.3% 805 886 974 10.0% 3.1%
Deferred income 740 389 – 965 9.3% 2.8% 1 013 1 064 1 064 3.3% 3.7%
Trade and other payables 9 586 6 316 4 421 2 870 -33.1% 35.5% 3 157 3 473 3 820 10.0% 12.0%
Provisions 1 981 1 741 2 746 7 776 57.7% 18.5% 8 440 9 164 9 829 8.1% 31.8%
Total equity and liabilities 18 236 12 940 15 420 24 382 10.2% 100.0% 26 449 28 705 31 167 8.5% 100.0%
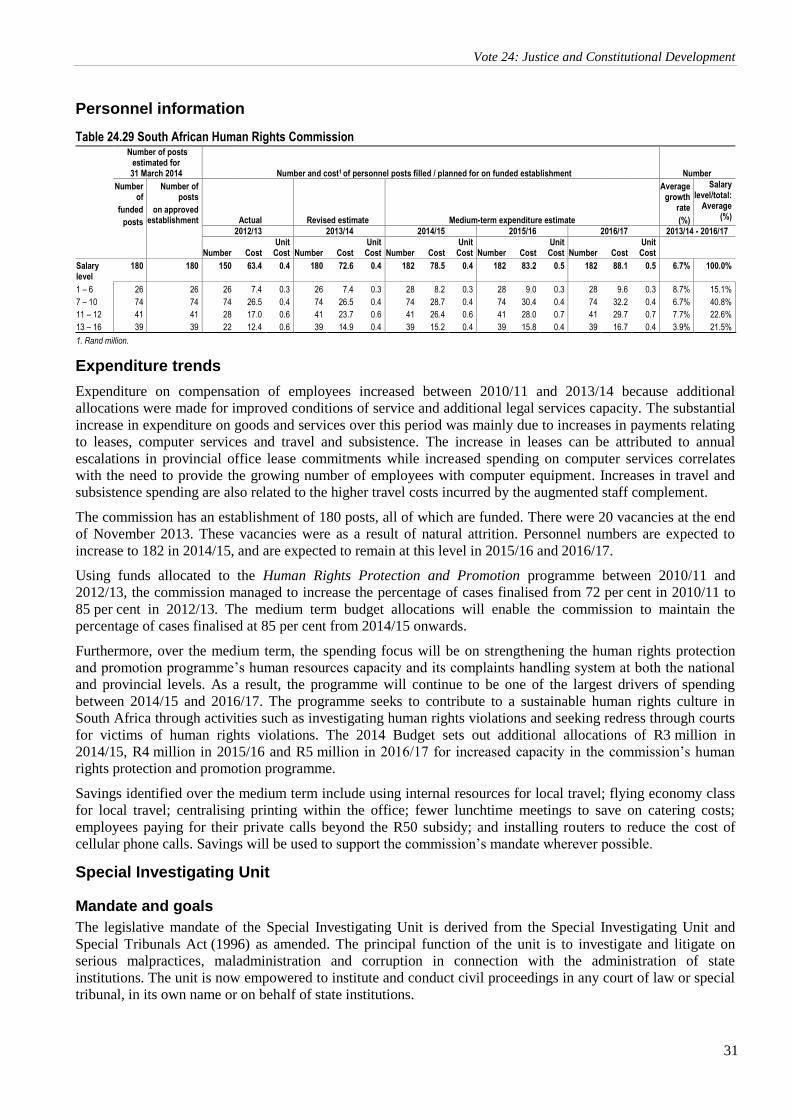
Vote 24: Justice and Constitutional Development
31
Ch
ap
ter na
me
Personnel information
Table 24.29 South African Human Rights Commission
Number of posts estimated for 31 March 2014 Number and cost1 of personnel posts filled / planned for on funded establishment Number
Number of
funded
posts
Number of posts
on approved establishment Actual Revised estimate Medium-term expenditure estimate
Average growth
rate
(%)
Salary level/total:
Average (%)
2012/13 2013/14 2014/15 2015/16 2016/17 2013/14 - 2016/17
Number Cost Unit Cost
Number Cost
Unit Cost
Number Cost
Unit Cost
Number Cost
Unit Cost
Number Cost
Unit Cost
Salary level
180 180 150 63.4 0.4 180 72.6 0.4 182 78.5 0.4 182 83.2 0.5 182 88.1 0.5 6.7% 100.0%
1 – 6 26 26 26 7.4 0.3 26 7.4 0.3 28 8.2 0.3 28 9.0 0.3 28 9.6 0.3 8.7% 15.1%
7 – 10 74 74 74 26.5 0.4 74 26.5 0.4 74 28.7 0.4 74 30.4 0.4 74 32.2 0.4 6.7% 40.8%
11 – 12 41 41 28 17.0 0.6 41 23.7 0.6 41 26.4 0.6 41 28.0 0.7 41 29.7 0.7 7.7% 22.6%
13 – 16 39 39 22 12.4 0.6 39 14.9 0.4 39 15.2 0.4 39 15.8 0.4 39 16.7 0.4 3.9% 21.5%
1. Rand million.
Expenditure trends
Expenditure on compensation of employees increased between 2010/11 and 2013/14 because additional
allocations were made for improved conditions of service and additional legal services capacity. The substantial
increase in expenditure on goods and services over this period was mainly due to increases in payments relating
to leases, computer services and travel and subsistence. The increase in leases can be attributed to annual
escalations in provincial office lease commitments while increased spending on computer services correlates
with the need to provide the growing number of employees with computer equipment. Increases in travel and
subsistence spending are also related to the higher travel costs incurred by the augmented staff complement.
The commission has an establishment of 180 posts, all of which are funded. There were 20 vacancies at the end
of November 2013. These vacancies were as a result of natural attrition. Personnel numbers are expected to
increase to 182 in 2014/15, and are expected to remain at this level in 2015/16 and 2016/17.
Using funds allocated to the Human Rights Protection and Promotion programme between 2010/11 and
2012/13, the commission managed to increase the percentage of cases finalised from 72 per cent in 2010/11 to
85 per cent in 2012/13. The medium term budget allocations will enable the commission to maintain the
percentage of cases finalised at 85 per cent from 2014/15 onwards.
Furthermore, over the medium term, the spending focus will be on strengthening the human rights protection
and promotion programme’s human resources capacity and its complaints handling system at both the national
and provincial levels. As a result, the programme will continue to be one of the largest drivers of spending
between 2014/15 and 2016/17. The programme seeks to contribute to a sustainable human rights culture in
South Africa through activities such as investigating human rights violations and seeking redress through courts
for victims of human rights violations. The 2014 Budget sets out additional allocations of R3 million in
2014/15, R4 million in 2015/16 and R5 million in 2016/17 for increased capacity in the commission’s human
rights protection and promotion programme.
Savings identified over the medium term include using internal resources for local travel; flying economy class
for local travel; centralising printing within the office; fewer lunchtime meetings to save on catering costs;
employees paying for their private calls beyond the R50 subsidy; and installing routers to reduce the cost of
cellular phone calls. Savings will be used to support the commission’s mandate wherever possible.
Special Investigating Unit
Mandate and goals
The legislative mandate of the Special Investigating Unit is derived from the Special Investigating Unit and
Special Tribunals Act (1996) as amended. The principal function of the unit is to investigate and litigate on
serious malpractices, maladministration and corruption in connection with the administration of state
institutions. The unit is now empowered to institute and conduct civil proceedings in any court of law or special
tribunal, in its own name or on behalf of state institutions.
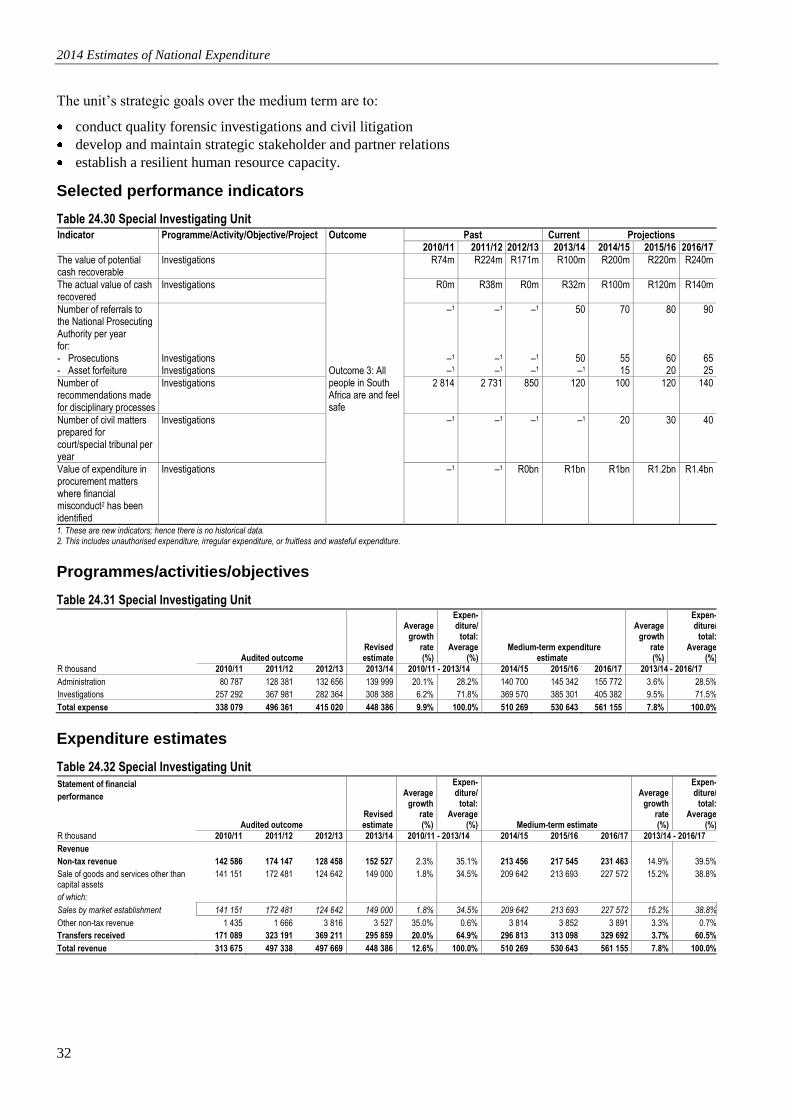
2014 Estimates of National Expenditure
32
The unit’s strategic goals over the medium term are to:
conduct quality forensic investigations and civil litigation
develop and maintain strategic stakeholder and partner relations
establish a resilient human resource capacity.
Selected performance indicators
Table 24.30 Special Investigating Unit Indicator Programme/Activity/Objective/Project Outcome Past Current Projections 2010/11 2011/12 2012/13 2013/14 2014/15 2015/16 2016/17
The value of potential cash recoverable
Investigations
Outcome 3: All people in South Africa are and feel safe
R74m R224m R171m R100m R200m R220m R240m
The actual value of cash recovered
Investigations R0m R38m R0m R32m R100m R120m R140m
Number of referrals to the National Prosecuting Authority per year for: - Prosecutions - Asset forfeiture
Investigations Investigations
–1
–1
–1
–1
–1
–1
–1
–1
–1
50
50 –1
70
55 15
80
60 20
90
65 25
Number of recommendations made for disciplinary processes
Investigations 2 814 2 731 850 120 100 120 140
Number of civil matters prepared for court/special tribunal per year
Investigations –1 –1 –1 –1 20 30 40
Value of expenditure in procurement matters where financial misconduct2 has been identified
Investigations –1 –1 R0bn R1bn R1bn R1.2bn R1.4bn
1. These are new indicators; hence there is no historical data. 2. This includes unauthorised expenditure, irregular expenditure, or fruitless and wasteful expenditure.
Programmes/activities/objectives
Table 24.31 Special Investigating Unit
Audited outcome Revised estimate
Average growth
rate (%)
Expen- diture/
total: Average
(%) Medium-term expenditure
estimate
Average growth
rate (%)
Expen- diture/
total: Average
(%)
R thousand 2010/11 2011/12 2012/13 2013/14 2010/11 - 2013/14 2014/15 2015/16 2016/17 2013/14 - 2016/17
Administration 80 787 128 381 132 656 139 999 20.1% 28.2% 140 700 145 342 155 772 3.6% 28.5%
Investigations 257 292 367 981 282 364 308 388 6.2% 71.8% 369 570 385 301 405 382 9.5% 71.5%
Total expense 338 079 496 361 415 020 448 386 9.9% 100.0% 510 269 530 643 561 155 7.8% 100.0%
Expenditure estimates
Table 24.32 Special Investigating Unit
Statement of financial
performance
Audited outcome Revised estimate
Average growth
rate (%)
Expen- diture/
total: Average
(%) Medium-term estimate
Average growth
rate (%)
Expen- diture/
total: Average
(%)
R thousand 2010/11 2011/12 2012/13 2013/14 2010/11 - 2013/14 2014/15 2015/16 2016/17 2013/14 - 2016/17
Revenue
Non-tax revenue 142 586 174 147 128 458 152 527 2.3% 35.1% 213 456 217 545 231 463 14.9% 39.5%
Sale of goods and services other than capital assets
141 151 172 481 124 642 149 000 1.8% 34.5% 209 642 213 693 227 572 15.2% 38.8%
of which:
Sales by market establishment 141 151 172 481 124 642 149 000 1.8% 34.5% 209 642 213 693 227 572 15.2% 38.8%
Other non-tax revenue 1 435 1 666 3 816 3 527 35.0% 0.6% 3 814 3 852 3 891 3.3% 0.7%
Transfers received 171 089 323 191 369 211 295 859 20.0% 64.9% 296 813 313 098 329 692 3.7% 60.5%
Total revenue 313 675 497 338 497 669 448 386 12.6% 100.0% 510 269 530 643 561 155 7.8% 100.0%
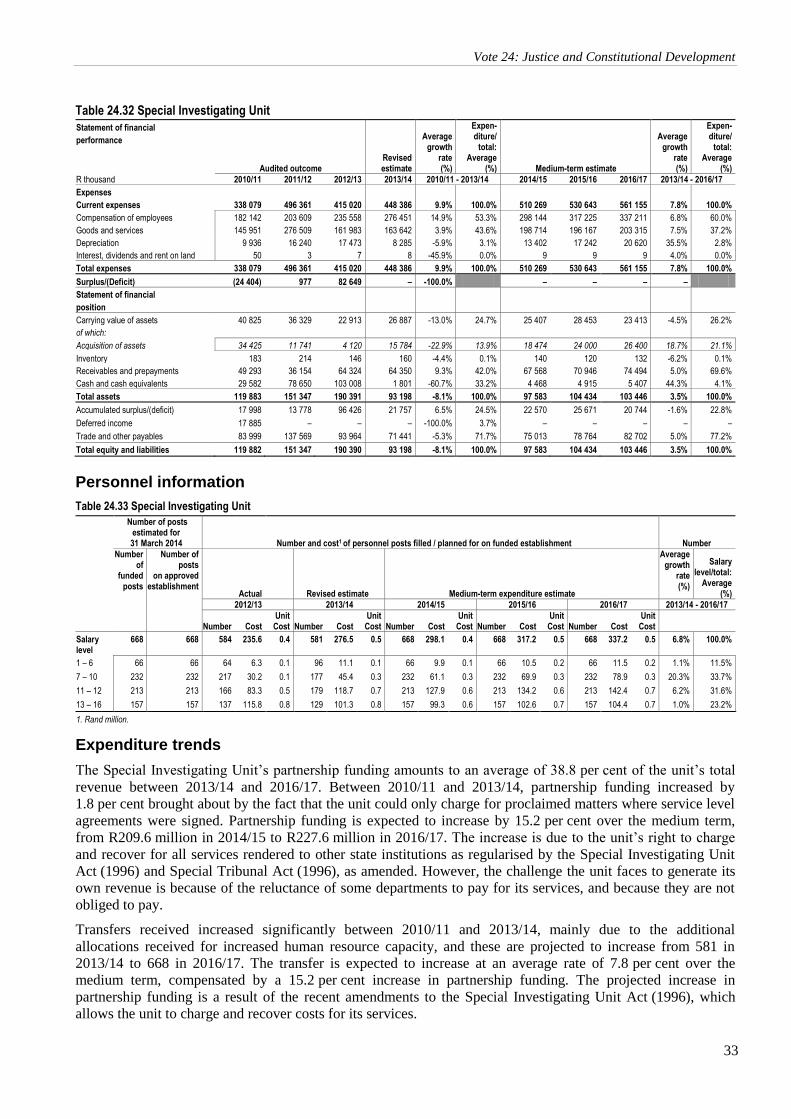
Vote 24: Justice and Constitutional Development
33
Ch
ap
ter na
me
Table 24.32 Special Investigating Unit
Statement of financial
performance
Audited outcome Revised estimate
Average growth
rate (%)
Expen- diture/
total: Average
(%) Medium-term estimate
Average growth
rate (%)
Expen- diture/
total: Average
(%)
R thousand 2010/11 2011/12 2012/13 2013/14 2010/11 - 2013/14 2014/15 2015/16 2016/17 2013/14 - 2016/17
Expenses
Current expenses 338 079 496 361 415 020 448 386 9.9% 100.0% 510 269 530 643 561 155 7.8% 100.0%
Compensation of employees 182 142 203 609 235 558 276 451 14.9% 53.3% 298 144 317 225 337 211 6.8% 60.0%
Goods and services 145 951 276 509 161 983 163 642 3.9% 43.6% 198 714 196 167 203 315 7.5% 37.2%
Depreciation 9 936 16 240 17 473 8 285 -5.9% 3.1% 13 402 17 242 20 620 35.5% 2.8%
Interest, dividends and rent on land 50 3 7 8 -45.9% 0.0% 9 9 9 4.0% 0.0%
Total expenses 338 079 496 361 415 020 448 386 9.9% 100.0% 510 269 530 643 561 155 7.8% 100.0%
Surplus/(Deficit) (24 404) 977 82 649 – -100.0% – – – –
Statement of financial
position
Carrying value of assets 40 825 36 329 22 913 26 887 -13.0% 24.7% 25 407 28 453 23 413 -4.5% 26.2%
of which:
Acquisition of assets 34 425 11 741 4 120 15 784 -22.9% 13.9% 18 474 24 000 26 400 18.7% 21.1%
Inventory 183 214 146 160 -4.4% 0.1% 140 120 132 -6.2% 0.1%
Receivables and prepayments 49 293 36 154 64 324 64 350 9.3% 42.0% 67 568 70 946 74 494 5.0% 69.6%
Cash and cash equivalents 29 582 78 650 103 008 1 801 -60.7% 33.2% 4 468 4 915 5 407 44.3% 4.1%
Total assets 119 883 151 347 190 391 93 198 -8.1% 100.0% 97 583 104 434 103 446 3.5% 100.0%
Accumulated surplus/(deficit) 17 998 13 778 96 426 21 757 6.5% 24.5% 22 570 25 671 20 744 -1.6% 22.8%
Deferred income 17 885 – – – -100.0% 3.7% – – – – –
Trade and other payables 83 999 137 569 93 964 71 441 -5.3% 71.7% 75 013 78 764 82 702 5.0% 77.2%
Total equity and liabilities 119 882 151 347 190 390 93 198 -8.1% 100.0% 97 583 104 434 103 446 3.5% 100.0%
Personnel information
Table 24.33 Special Investigating Unit
Number of posts estimated for 31 March 2014 Number and cost1 of personnel posts filled / planned for on funded establishment Number
Number of
funded posts
Number of posts
on approved establishment
Actual Revised estimate Medium-term expenditure estimate
Average growth
rate (%)
Salary level/total:
Average (%)
2012/13 2013/14 2014/15 2015/16 2016/17 2013/14 - 2016/17
Number Cost Unit Cost
Number Cost
Unit Cost
Number Cost
Unit Cost
Number Cost
Unit Cost
Number Cost
Unit Cost
Salary level
668 668 584 235.6 0.4 581 276.5 0.5 668 298.1 0.4 668 317.2 0.5 668 337.2 0.5 6.8% 100.0%
1 – 6 66 66 64 6.3 0.1 96 11.1 0.1 66 9.9 0.1 66 10.5 0.2 66 11.5 0.2 1.1% 11.5%
7 – 10 232 232 217 30.2 0.1 177 45.4 0.3 232 61.1 0.3 232 69.9 0.3 232 78.9 0.3 20.3% 33.7%
11 – 12 213 213 166 83.3 0.5 179 118.7 0.7 213 127.9 0.6 213 134.2 0.6 213 142.4 0.7 6.2% 31.6%
13 – 16 157 157 137 115.8 0.8 129 101.3 0.8 157 99.3 0.6 157 102.6 0.7 157 104.4 0.7 1.0% 23.2%
1. Rand million.
Expenditure trends
The Special Investigating Unit’s partnership funding amounts to an average of 38.8 per cent of the unit’s total
revenue between 2013/14 and 2016/17. Between 2010/11 and 2013/14, partnership funding increased by
1.8 per cent brought about by the fact that the unit could only charge for proclaimed matters where service level
agreements were signed. Partnership funding is expected to increase by 15.2 per cent over the medium term,
from R209.6 million in 2014/15 to R227.6 million in 2016/17. The increase is due to the unit’s right to charge
and recover for all services rendered to other state institutions as regularised by the Special Investigating Unit
Act (1996) and Special Tribunal Act (1996), as amended. However, the challenge the unit faces to generate its
own revenue is because of the reluctance of some departments to pay for its services, and because they are not
obliged to pay.
Transfers received increased significantly between 2010/11 and 2013/14, mainly due to the additional
allocations received for increased human resource capacity, and these are projected to increase from 581 in
2013/14 to 668 in 2016/17. The transfer is expected to increase at an average rate of 7.8 per cent over the
medium term, compensated by a 15.2 per cent increase in partnership funding. The projected increase in
partnership funding is a result of the recent amendments to the Special Investigating Unit Act (1996), which
allows the unit to charge and recover costs for its services.
2014 Estimates of National Expenditure
34
The spending focus of the unit over the medium term will be on investigating large procurement related matters
where there are alleged cases of fraud and corruption. Funds allocated to the investigation programme over this
period will enable the unit to increase the value of identified expenditure in procurement matters where financial
misconduct has been identified, from R1 billion in 2014/15 to R1.4 billion in 2016/17.
The significant increase in spending in the administration programme between 2010/11 and 2013/14 is mainly
due to the acquisition of additional rental space and training for investigators. Expenditure on goods and
services increased significantly between 2010/11 and 2011/12, due to an increase in the number of forensic
consultants to address the growing scope in forensic investigations. The main driver for the projected increase in
spending on goods and services over the medium term is the need for the unit to establish and build a special
tribunal to meet the performance targets which are set for civil matters prepared for court and for the number of
referrals made to the Asset Forfeiture Unit within the National Prosecuting Authority.
As part of cost saving measures, the unit intends to install video conferencing facilities to reduce the cost of
travel and accommodation. Members will be able to conduct meetings and presentations through these facilities
as opposed to travelling to the regions. To reduce telephone costs, the unit intends to install voice over internet
protocol to enable the unit to connect to the various regions over the network. These measures will enhance the
operational efficiency and effectiveness of the unit.
The entity has a funded establishment of 668 positions of which 87 posts were vacant at the end of
November 2013, due to natural attrition.
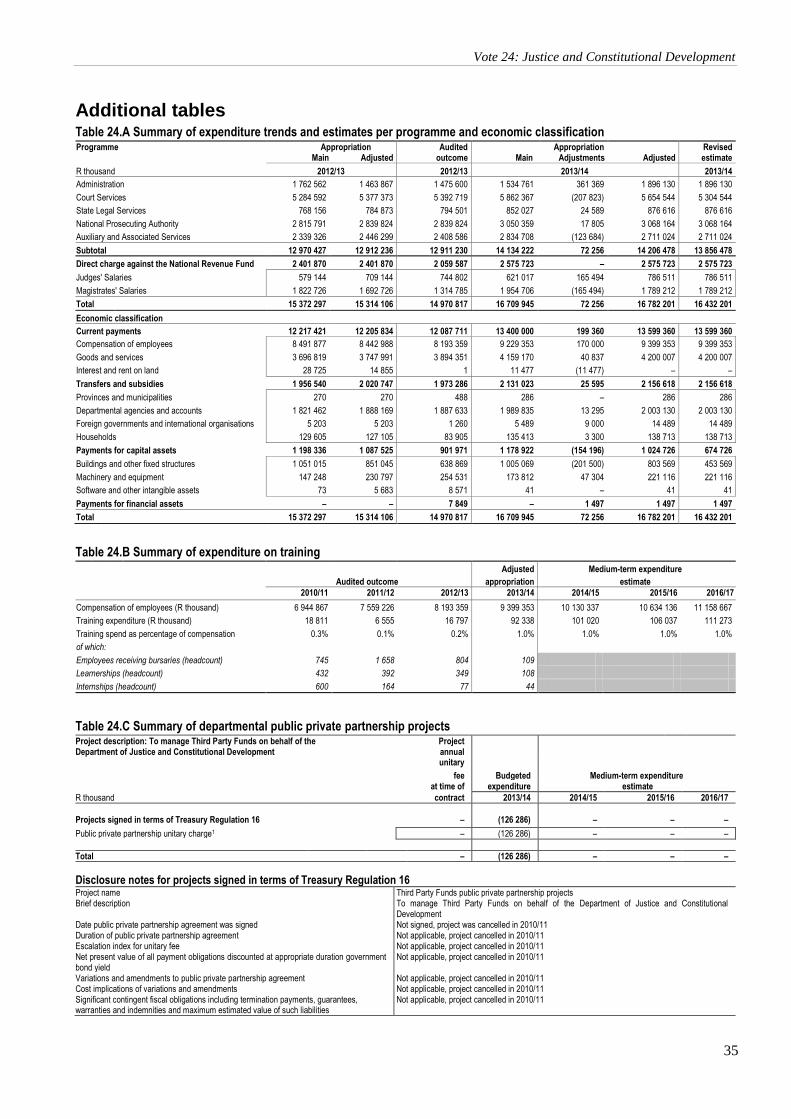
Vote 24: Justice and Constitutional Development
35
Ch
ap
ter na
me
Additional tables Table 24.A Summary of expenditure trends and estimates per programme and economic classification Programme Appropriation Audited Appropriation Revised
Main Adjusted outcome Main Adjustments Adjusted estimate
R thousand 2012/13 2012/13 2013/14 2013/14
Administration 1 762 562 1 463 867 1 475 600 1 534 761 361 369 1 896 130 1 896 130
Court Services 5 284 592 5 377 373 5 392 719 5 862 367 (207 823) 5 654 544 5 304 544
State Legal Services 768 156 784 873 794 501 852 027 24 589 876 616 876 616
National Prosecuting Authority 2 815 791 2 839 824 2 839 824 3 050 359 17 805 3 068 164 3 068 164
Auxiliary and Associated Services 2 339 326 2 446 299 2 408 586 2 834 708 (123 684) 2 711 024 2 711 024
Subtotal 12 970 427 12 912 236 12 911 230 14 134 222 72 256 14 206 478 13 856 478
Direct charge against the National Revenue Fund 2 401 870 2 401 870 2 059 587 2 575 723 – 2 575 723 2 575 723
Judges' Salaries 579 144 709 144 744 802 621 017 165 494 786 511 786 511
Magistrates' Salaries 1 822 726 1 692 726 1 314 785 1 954 706 (165 494) 1 789 212 1 789 212
Total 15 372 297 15 314 106 14 970 817 16 709 945 72 256 16 782 201 16 432 201
Economic classification
Current payments 12 217 421 12 205 834 12 087 711 13 400 000 199 360 13 599 360 13 599 360
Compensation of employees 8 491 877 8 442 988 8 193 359 9 229 353 170 000 9 399 353 9 399 353
Goods and services 3 696 819 3 747 991 3 894 351 4 159 170 40 837 4 200 007 4 200 007
Interest and rent on land 28 725 14 855 1 11 477 (11 477) – –
Transfers and subsidies 1 956 540 2 020 747 1 973 286 2 131 023 25 595 2 156 618 2 156 618
Provinces and municipalities 270 270 488 286 – 286 286
Departmental agencies and accounts 1 821 462 1 888 169 1 887 633 1 989 835 13 295 2 003 130 2 003 130
Foreign governments and international organisations 5 203 5 203 1 260 5 489 9 000 14 489 14 489
Households 129 605 127 105 83 905 135 413 3 300 138 713 138 713
Payments for capital assets 1 198 336 1 087 525 901 971 1 178 922 (154 196) 1 024 726 674 726
Buildings and other fixed structures 1 051 015 851 045 638 869 1 005 069 (201 500) 803 569 453 569
Machinery and equipment 147 248 230 797 254 531 173 812 47 304 221 116 221 116
Software and other intangible assets 73 5 683 8 571 41 – 41 41
Payments for financial assets – – 7 849 – 1 497 1 497 1 497
Total 15 372 297 15 314 106 14 970 817 16 709 945 72 256 16 782 201 16 432 201
Table 24.B Summary of expenditure on training
Adjusted Medium-term expenditure
Audited outcome appropriation estimate
2010/11 2011/12 2012/13 2013/14 2014/15 2015/16 2016/17
Compensation of employees (R thousand) 6 944 867 7 559 226 8 193 359 9 399 353 10 130 337 10 634 136 11 158 667
Training expenditure (R thousand) 18 811 6 555 16 797 92 338 101 020 106 037 111 273
Training spend as percentage of compensation 0.3% 0.1% 0.2% 1.0% 1.0% 1.0% 1.0%
of which:
Employees receiving bursaries (headcount) 745 1 658 804 109
Learnerships (headcount) 432 392 349 108
Internships (headcount) 600 164 77 44
Table 24.C Summary of departmental public private partnership projects Project description: To manage Third Party Funds on behalf of the Department of Justice and Constitutional Development
Project annual
unitary
fee Budgeted Medium-term expenditure at time of expenditure estimate
R thousand contract 2013/14 2014/15 2015/16 2016/17
Projects signed in terms of Treasury Regulation 16 – (126 286) – – –
Public private partnership unitary charge1 – (126 286) – – –
Total – (126 286) – – –
Disclosure notes for projects signed in terms of Treasury Regulation 16 Project name Third Party Funds public private partnership projects Brief description To manage Third Party Funds on behalf of the Department of Justice and Constitutional
Development Date public private partnership agreement was signed Not signed, project was cancelled in 2010/11 Duration of public private partnership agreement Not applicable, project cancelled in 2010/11 Escalation index for unitary fee Not applicable, project cancelled in 2010/11 Net present value of all payment obligations discounted at appropriate duration government bond yield
Not applicable, project cancelled in 2010/11
Variations and amendments to public private partnership agreement Not applicable, project cancelled in 2010/11 Cost implications of variations and amendments Not applicable, project cancelled in 2010/11 Significant contingent fiscal obligations including termination payments, guarantees, warranties and indemnities and maximum estimated value of such liabilities
Not applicable, project cancelled in 2010/11
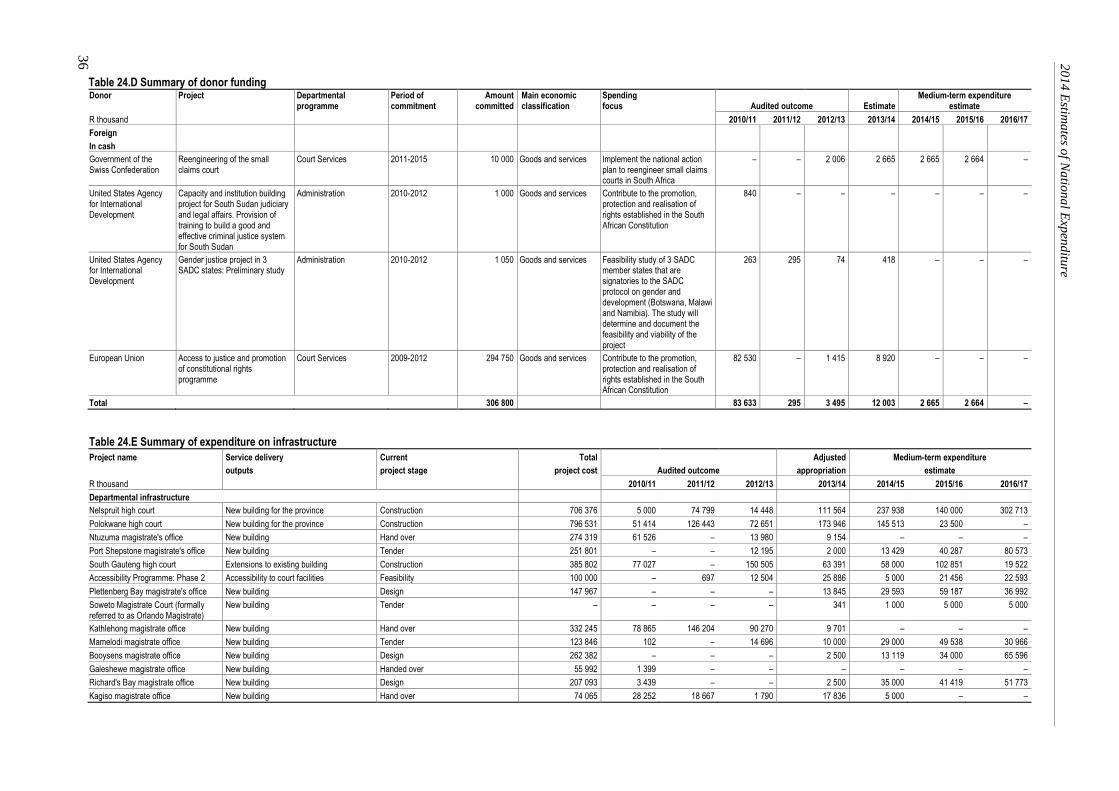
36 20
14
Estim
ates o
f Na
tion
al E
xpen
ditu
re
Table 24.D Summary of donor funding Donor Project Departmental Period of Amount Main economic Spending Medium-term expenditure programme commitment committed classification focus Audited outcome Estimate estimate
R thousand 2010/11 2011/12 2012/13 2013/14 2014/15 2015/16 2016/17
Foreign
In cash
Government of the Swiss Confederation
Reengineering of the small claims court
Court Services 2011-2015 10 000 Goods and services Implement the national action plan to reengineer small claims courts in South Africa
– – 2 006 2 665 2 665 2 664 –
United States Agency for International Development
Capacity and institution building project for South Sudan judiciary and legal affairs. Provision of training to build a good and effective criminal justice system for South Sudan
Administration 2010-2012 1 000 Goods and services Contribute to the promotion, protection and realisation of rights established in the South African Constitution
840 – – – – – –
United States Agency for International Development
Gender justice project in 3 SADC states: Preliminary study
Administration 2010-2012 1 050 Goods and services Feasibility study of 3 SADC member states that are signatories to the SADC protocol on gender and development (Botswana, Malawi and Namibia). The study will determine and document the feasibility and viability of the project
263 295 74 418 – – –
European Union Access to justice and promotion of constitutional rights programme
Court Services 2009-2012 294 750 Goods and services Contribute to the promotion, protection and realisation of rights established in the South African Constitution
82 530 – 1 415 8 920 – – –
Total 306 800 83 633 295 3 495 12 003 2 665 2 664 –
Table 24.E Summary of expenditure on infrastructure Project name Service delivery Current Total Adjusted Medium-term expenditure
outputs project stage project cost Audited outcome appropriation estimate
R thousand 2010/11 2011/12 2012/13 2013/14 2014/15 2015/16 2016/17
Departmental infrastructure
Nelspruit high court New building for the province Construction 706 376 5 000 74 799 14 448 111 564 237 938 140 000 302 713
Polokwane high court New building for the province Construction 796 531 51 414 126 443 72 651 173 946 145 513 23 500 –
Ntuzuma magistrate's office New building Hand over 274 319 61 526 – 13 980 9 154 – – –
Port Shepstone magistrate's office New building Tender 251 801 – – 12 195 2 000 13 429 40 287 80 573
South Gauteng high court Extensions to existing building Construction 385 802 77 027 – 150 505 63 391 58 000 102 851 19 522
Accessibility Programme: Phase 2 Accessibility to court facilities Feasibility 100 000 – 697 12 504 25 886 5 000 21 456 22 593
Plettenberg Bay magistrate's office New building Design 147 967 – – – 13 845 29 593 59 187 36 992
Soweto Magistrate Court (formally referred to as Orlando Magistrate)
New building Tender – – – – 341 1 000 5 000 5 000
Kathlehong magistrate office New building Hand over 332 245 78 865 146 204 90 270 9 701 – – –
Mamelodi magistrate office New building Tender 123 846 102 – 14 696 10 000 29 000 49 538 30 966
Booysens magistrate office New building Design 262 382 – – – 2 500 13 119 34 000 65 596
Galeshewe magistrate office New building Handed over 55 992 1 399 – – – – – –
Richard's Bay magistrate office New building Design 207 093 3 439 – – 2 500 35 000 41 419 51 773
Kagiso magistrate office New building Hand over 74 065 28 252 18 667 1 790 17 836 5 000 – –
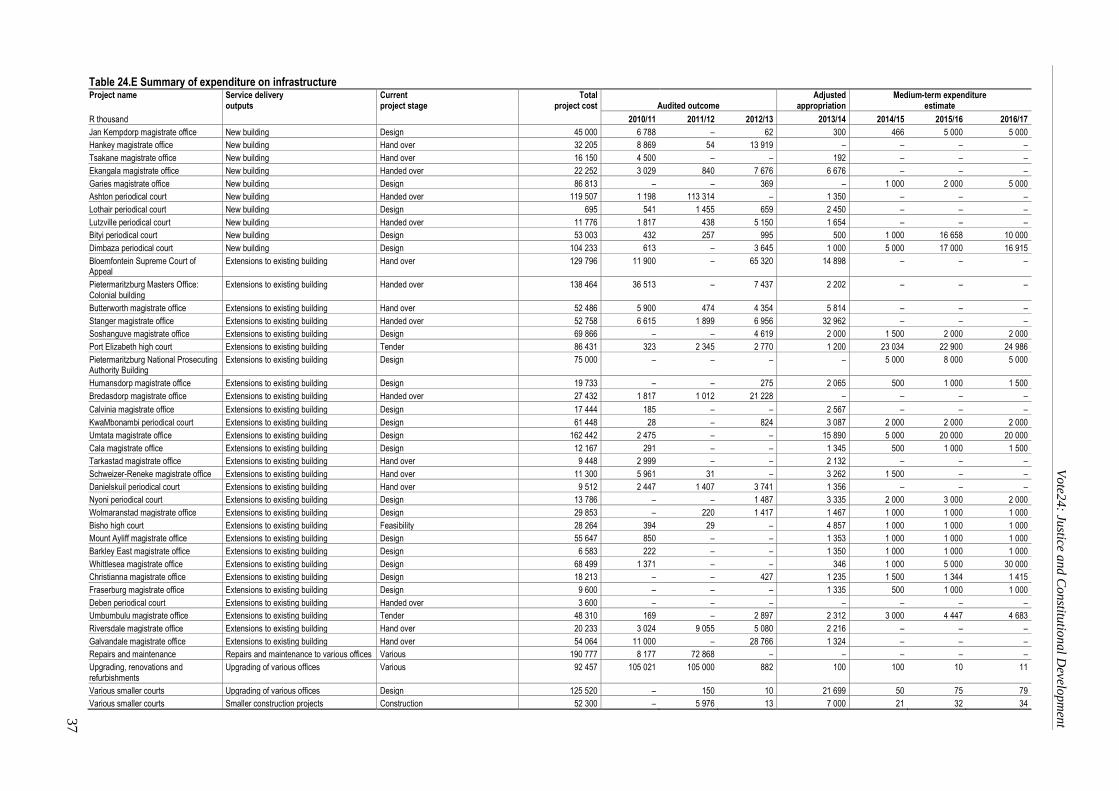
37
Vo
te24
: Justice a
nd
Co
nstitu
tion
al D
evelop
men
t
Table 24.E Summary of expenditure on infrastructure Project name Service delivery Current Total Adjusted Medium-term expenditure
outputs project stage project cost Audited outcome appropriation estimate
R thousand 2010/11 2011/12 2012/13 2013/14 2014/15 2015/16 2016/17
Jan Kempdorp magistrate office New building Design 45 000 6 788 – 62 300 466 5 000 5 000
Hankey magistrate office New building Hand over 32 205 8 869 54 13 919 – – – –
Tsakane magistrate office New building Hand over 16 150 4 500 – – 192 – – –
Ekangala magistrate office New building Handed over 22 252 3 029 840 7 676 6 676 – – –
Garies magistrate office New building Design 86 813 – – 369 – 1 000 2 000 5 000
Ashton periodical court New building Handed over 119 507 1 198 113 314 – 1 350 – – –
Lothair periodical court New building Design 695 541 1 455 659 2 450 – – –
Lutzville periodical court New building Handed over 11 776 1 817 438 5 150 1 654 – – –
Bityi periodical court New building Design 53 003 432 257 995 500 1 000 16 658 10 000
Dimbaza periodical court New building Design 104 233 613 – 3 645 1 000 5 000 17 000 16 915
Bloemfontein Supreme Court of Appeal
Extensions to existing building Hand over 129 796 11 900 – 65 320 14 898 – – –
Pietermaritzburg Masters Office: Colonial building
Extensions to existing building Handed over 138 464 36 513 – 7 437 2 202 – – –
Butterworth magistrate office Extensions to existing building Hand over 52 486 5 900 474 4 354 5 814 – – –
Stanger magistrate office Extensions to existing building Handed over 52 758 6 615 1 899 6 956 32 962 – – –
Soshanguve magistrate office Extensions to existing building Design 69 866 – – 4 619 2 000 1 500 2 000 2 000
Port Elizabeth high court Extensions to existing building Tender 86 431 323 2 345 2 770 1 200 23 034 22 900 24 986
Pietermaritzburg National Prosecuting Authority Building
Extensions to existing building Design 75 000 – – – – 5 000 8 000 5 000
Humansdorp magistrate office Extensions to existing building Design 19 733 – – 275 2 065 500 1 000 1 500
Bredasdorp magistrate office Extensions to existing building Handed over 27 432 1 817 1 012 21 228 – – – –
Calvinia magistrate office Extensions to existing building Design 17 444 185 – – 2 567 – – –
KwaMbonambi periodical court Extensions to existing building Design 61 448 28 – 824 3 087 2 000 2 000 2 000
Umtata magistrate office Extensions to existing building Design 162 442 2 475 – – 15 890 5 000 20 000 20 000
Cala magistrate office Extensions to existing building Design 12 167 291 – – 1 345 500 1 000 1 500
Tarkastad magistrate office Extensions to existing building Hand over 9 448 2 999 – – 2 132 – – –
Schweizer-Reneke magistrate office Extensions to existing building Hand over 11 300 5 961 31 – 3 262 1 500 – –
Danielskuil periodical court Extensions to existing building Hand over 9 512 2 447 1 407 3 741 1 356 – – –
Nyoni periodical court Extensions to existing building Design 13 786 – – 1 487 3 335 2 000 3 000 2 000
Wolmaranstad magistrate office Extensions to existing building Design 29 853 – 220 1 417 1 467 1 000 1 000 1 000
Bisho high court Extensions to existing building Feasibility 28 264 394 29 – 4 857 1 000 1 000 1 000
Mount Ayliff magistrate office Extensions to existing building Design 55 647 850 – – 1 353 1 000 1 000 1 000
Barkley East magistrate office Extensions to existing building Design 6 583 222 – – 1 350 1 000 1 000 1 000
Whittlesea magistrate office Extensions to existing building Design 68 499 1 371 – – 346 1 000 5 000 30 000
Christianna magistrate office Extensions to existing building Design 18 213 – – 427 1 235 1 500 1 344 1 415
Fraserburg magistrate office Extensions to existing building Design 9 600 – – – 1 335 500 1 000 1 000
Deben periodical court Extensions to existing building Handed over 3 600 – – – – – – –
Umbumbulu magistrate office Extensions to existing building Tender 48 310 169 – 2 897 2 312 3 000 4 447 4 683
Riversdale magistrate office Extensions to existing building Hand over 20 233 3 024 9 055 5 080 2 216 – – –
Galvandale magistrate office Extensions to existing building Hand over 54 064 11 000 – 28 766 1 324 – – –
Repairs and maintenance Repairs and maintenance to various offices Various 190 777 8 177 72 868 – – – – –
Upgrading, renovations and refurbishments
Upgrading of various offices Various 92 457 105 021 105 000 882 100 100 10 11
Various smaller courts Upgrading of various offices Design 125 520 – 150 10 21 699 50 75 79
Various smaller courts Smaller construction projects Construction 52 300 – 5 976 13 7 000 21 32 34
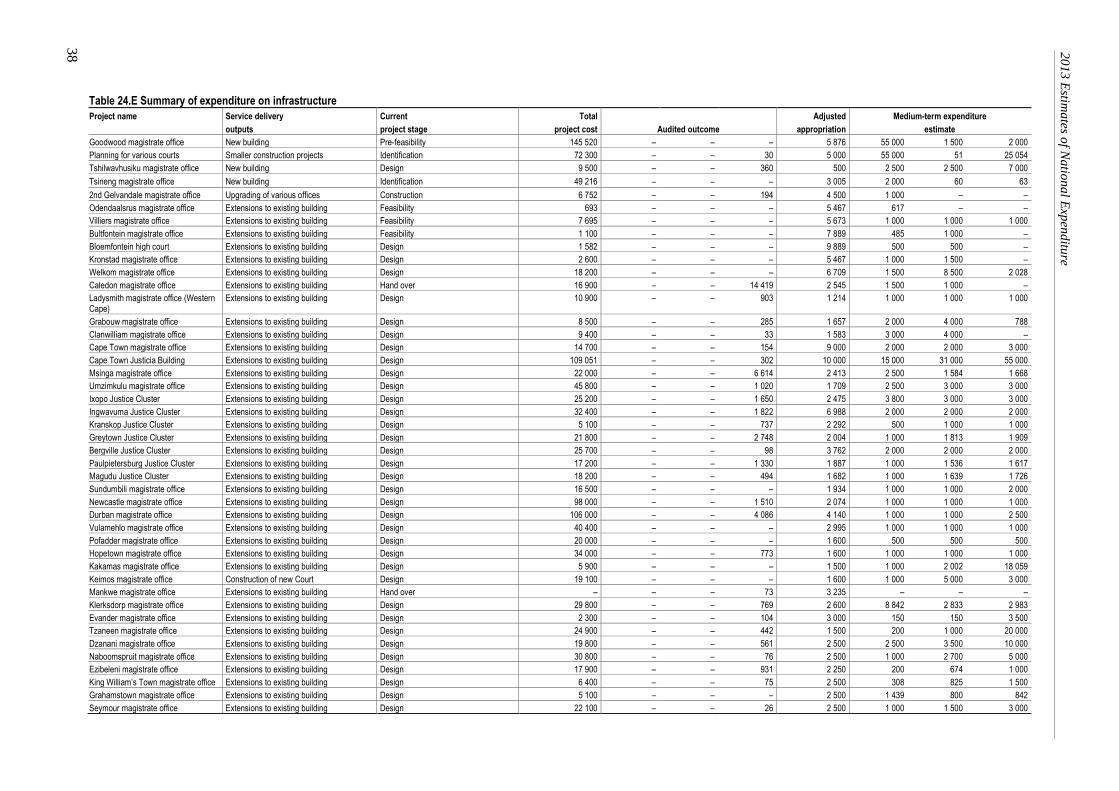
38
20
13
Estim
ates o
f Na
tion
al E
xpen
ditu
re
Table 24.E Summary of expenditure on infrastructure Project name Service delivery Current Total Adjusted Medium-term expenditure
outputs project stage project cost Audited outcome appropriation estimate
Goodwood magistrate office New building Pre-feasibility 145 520 – – – 5 876 55 000 1 500 2 000
Planning for various courts Smaller construction projects Identification 72 300 – – 30 5 000 55 000 51 25 054
Tshilwavhusiku magistrate office New building Design 9 500 – – 360 500 2 500 2 500 7 000
Tsineng magistrate office New building Identification 49 216 – – – 3 005 2 000 60 63
2nd Gelvandale magistrate office Upgrading of various offices Construction 6 752 – – 194 4 500 1 000 – –
Odendaalsrus magistrate office Extensions to existing building Feasibility 693 – – – 5 467 617 – –
Villiers magistrate office Extensions to existing building Feasibility 7 695 – – – 5 673 1 000 1 000 1 000
Bultfontein magistrate office Extensions to existing building Feasibility 1 100 – – – 7 889 485 1 000 –
Bloemfontein high court Extensions to existing building Design 1 582 – – – 9 889 500 500 –
Kronstad magistrate office Extensions to existing building Design 2 600 – – – 5 467 1 000 1 500 –
Welkom magistrate office Extensions to existing building Design 18 200 – – – 6 709 1 500 8 500 2 028
Caledon magistrate office Extensions to existing building Hand over 16 900 – – 14 419 2 545 1 500 1 000 –
Ladysmith magistrate office (Western Cape)
Extensions to existing building Design 10 900 – – 903 1 214 1 000 1 000 1 000
Grabouw magistrate office Extensions to existing building Design 8 500 – – 285 1 657 2 000 4 000 788
Clanwilliam magistrate office Extensions to existing building Design 9 400 – – 33 1 583 3 000 4 000 –
Cape Town magistrate office Extensions to existing building Design 14 700 – – 154 9 000 2 000 2 000 3 000
Cape Town Justicia Building Extensions to existing building Design 109 051 – – 302 10 000 15 000 31 000 55 000
Msinga magistrate office Extensions to existing building Design 22 000 – – 6 614 2 413 2 500 1 584 1 668
Umzimkulu magistrate office Extensions to existing building Design 45 800 – – 1 020 1 709 2 500 3 000 3 000
Ixopo Justice Cluster Extensions to existing building Design 25 200 – – 1 650 2 475 3 800 3 000 3 000
Ingwavuma Justice Cluster Extensions to existing building Design 32 400 – – 1 822 6 988 2 000 2 000 2 000
Kranskop Justice Cluster Extensions to existing building Design 5 100 – – 737 2 292 500 1 000 1 000
Greytown Justice Cluster Extensions to existing building Design 21 800 – – 2 748 2 004 1 000 1 813 1 909
Bergville Justice Cluster Extensions to existing building Design 25 700 – – 98 3 762 2 000 2 000 2 000
Paulpietersburg Justice Cluster Extensions to existing building Design 17 200 – – 1 330 1 887 1 000 1 536 1 617
Magudu Justice Cluster Extensions to existing building Design 18 200 – – 494 1 682 1 000 1 639 1 726
Sundumbili magistrate office Extensions to existing building Design 16 500 – – – 1 934 1 000 1 000 2 000
Newcastle magistrate office Extensions to existing building Design 98 000 – – 1 510 2 074 1 000 1 000 1 000
Durban magistrate office Extensions to existing building Design 106 000 – – 4 086 4 140 1 000 1 000 2 500
Vulamehlo magistrate office Extensions to existing building Design 40 400 – – – 2 995 1 000 1 000 1 000
Pofadder magistrate office Extensions to existing building Design 20 000 – – – 1 600 500 500 500
Hopetown magistrate office Extensions to existing building Design 34 000 – – 773 1 600 1 000 1 000 1 000
Kakamas magistrate office Extensions to existing building Design 5 900 – – – 1 500 1 000 2 002 18 059
Keimos magistrate office Construction of new Court Design 19 100 – – – 1 600 1 000 5 000 3 000
Mankwe magistrate office Extensions to existing building Hand over – – – 73 3 235 – – –
Klerksdorp magistrate office Extensions to existing building Design 29 800 – – 769 2 600 8 842 2 833 2 983
Evander magistrate office Extensions to existing building Design 2 300 – – 104 3 000 150 150 3 500
Tzaneen magistrate office Extensions to existing building Design 24 900 – – 442 1 500 200 1 000 20 000
Dzanani magistrate office Extensions to existing building Design 19 800 – – 561 2 500 2 500 3 500 10 000
Naboomspruit magistrate office Extensions to existing building Design 30 800 – – 76 2 500 1 000 2 700 5 000
Ezibeleni magistrate office Extensions to existing building Design 17 900 – – 931 2 250 200 674 1 000
King William’s Town magistrate office Extensions to existing building Design 6 400 – – 75 2 500 308 825 1 500
Grahamstown magistrate office Extensions to existing building Design 5 100 – – – 2 500 1 439 800 842
Seymour magistrate office Extensions to existing building Design 22 100 – – 26 2 500 1 000 1 500 3 000
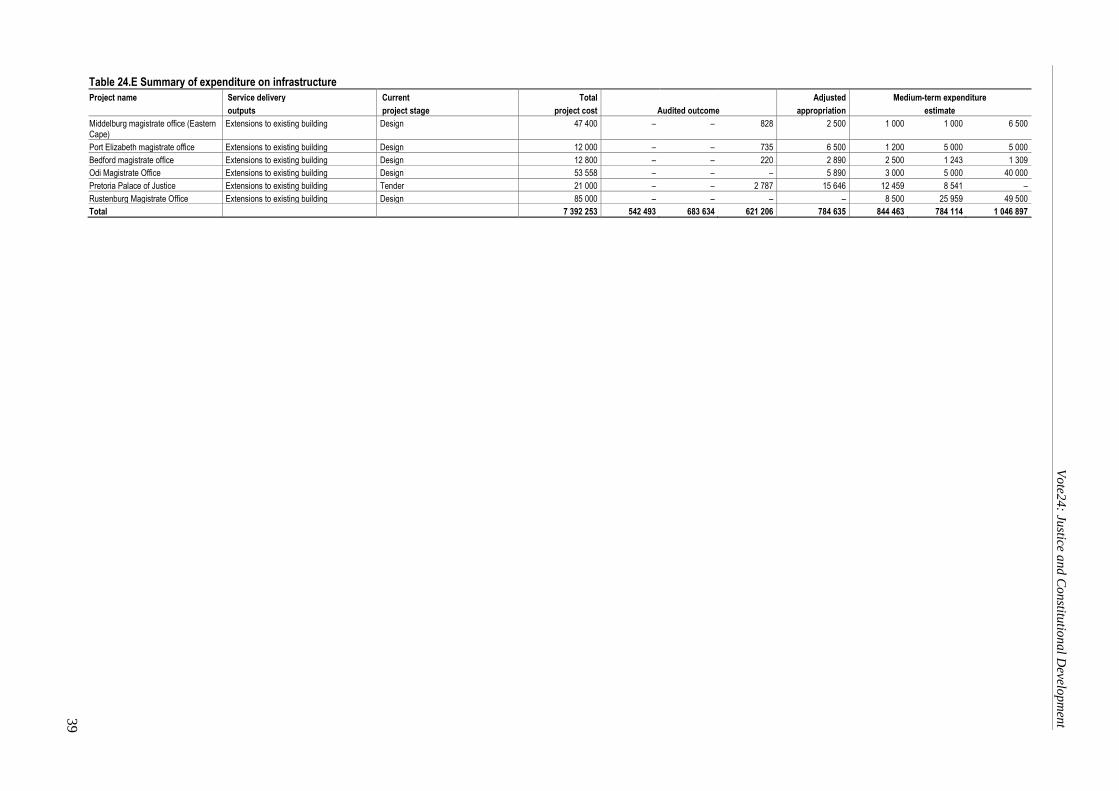
39
Vo
te24
: Justice a
nd
Co
nstitu
tion
al D
evelop
men
t
Table 24.E Summary of expenditure on infrastructure Project name Service delivery Current Total Adjusted Medium-term expenditure
outputs project stage project cost Audited outcome appropriation estimate
Middelburg magistrate office (Eastern Cape)
Extensions to existing building Design 47 400 – – 828 2 500 1 000 1 000 6 500
Port Elizabeth magistrate office Extensions to existing building Design 12 000 – – 735 6 500 1 200 5 000 5 000
Bedford magistrate office Extensions to existing building Design 12 800 – – 220 2 890 2 500 1 243 1 309
Odi Magistrate Office Extensions to existing building Design 53 558 – – – 5 890 3 000 5 000 40 000
Pretoria Palace of Justice Extensions to existing building Tender 21 000 – – 2 787 15 646 12 459 8 541 –
Rustenburg Magistrate Office Extensions to existing building Design 85 000 – – – – 8 500 25 959 49 500
Total 7 392 253 542 493 683 634 621 206 784 635 844 463 784 114 1 046 897
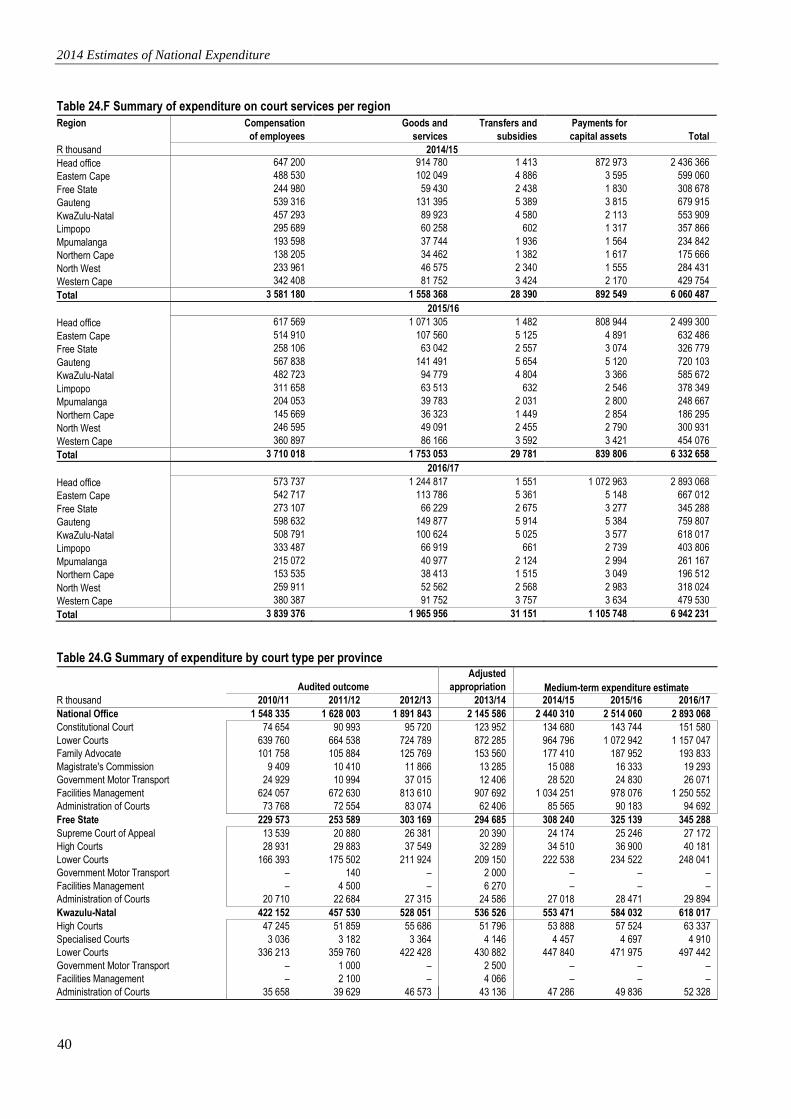
2014 Estimates of National Expenditure
40
20
14
Estim
ates o
f Na
tion
al E
xpen
ditu
re
Table 24.F Summary of expenditure on court services per region
Region Compensation Goods and Transfers and Payments for
of employees services subsidies capital assets Total
R thousand 2014/15
Head office 647 200 914 780 1 413 872 973 2 436 366
Eastern Cape 488 530 102 049 4 886 3 595 599 060
Free State 244 980 59 430 2 438 1 830 308 678
Gauteng 539 316 131 395 5 389 3 815 679 915
KwaZulu-Natal 457 293 89 923 4 580 2 113 553 909
Limpopo 295 689 60 258 602 1 317 357 866
Mpumalanga 193 598 37 744 1 936 1 564 234 842
Northern Cape 138 205 34 462 1 382 1 617 175 666
North West 233 961 46 575 2 340 1 555 284 431
Western Cape 342 408 81 752 3 424 2 170 429 754
Total 3 581 180 1 558 368 28 390 892 549 6 060 487
2015/16
Head office 617 569 1 071 305 1 482 808 944 2 499 300
Eastern Cape 514 910 107 560 5 125 4 891 632 486
Free State 258 106 63 042 2 557 3 074 326 779
Gauteng 567 838 141 491 5 654 5 120 720 103
KwaZulu-Natal 482 723 94 779 4 804 3 366 585 672
Limpopo 311 658 63 513 632 2 546 378 349
Mpumalanga 204 053 39 783 2 031 2 800 248 667
Northern Cape 145 669 36 323 1 449 2 854 186 295
North West 246 595 49 091 2 455 2 790 300 931
Western Cape 360 897 86 166 3 592 3 421 454 076
Total 3 710 018 1 753 053 29 781 839 806 6 332 658
2016/17
Head office 573 737 1 244 817 1 551 1 072 963 2 893 068
Eastern Cape 542 717 113 786 5 361 5 148 667 012
Free State 273 107 66 229 2 675 3 277 345 288
Gauteng 598 632 149 877 5 914 5 384 759 807
KwaZulu-Natal 508 791 100 624 5 025 3 577 618 017
Limpopo 333 487 66 919 661 2 739 403 806
Mpumalanga 215 072 40 977 2 124 2 994 261 167
Northern Cape 153 535 38 413 1 515 3 049 196 512
North West 259 911 52 562 2 568 2 983 318 024
Western Cape 380 387 91 752 3 757 3 634 479 530
Total 3 839 376 1 965 956 31 151 1 105 748 6 942 231
Table 24.G Summary of expenditure by court type per province Adjusted
Audited outcome appropriation Medium-term expenditure estimate R thousand 2010/11 2011/12 2012/13 2013/14 2014/15 2015/16 2016/17
National Office 1 548 335 1 628 003 1 891 843 2 145 586 2 440 310 2 514 060 2 893 068
Constitutional Court 74 654 90 993 95 720 123 952 134 680 143 744 151 580
Lower Courts 639 760 664 538 724 789 872 285 964 796 1 072 942 1 157 047
Family Advocate 101 758 105 884 125 769 153 560 177 410 187 952 193 833
Magistrate's Commission 9 409 10 410 11 866 13 285 15 088 16 333 19 293
Government Motor Transport 24 929 10 994 37 015 12 406 28 520 24 830 26 071
Facilities Management 624 057 672 630 813 610 907 692 1 034 251 978 076 1 250 552
Administration of Courts 73 768 72 554 83 074 62 406 85 565 90 183 94 692
Free State 229 573 253 589 303 169 294 685 308 240 325 139 345 288
Supreme Court of Appeal 13 539 20 880 26 381 20 390 24 174 25 246 27 172
High Courts 28 931 29 883 37 549 32 289 34 510 36 900 40 181
Lower Courts 166 393 175 502 211 924 209 150 222 538 234 522 248 041
Government Motor Transport – 140 – 2 000 – – –
Facilities Management – 4 500 – 6 270 – – –
Administration of Courts 20 710 22 684 27 315 24 586 27 018 28 471 29 894
Kwazulu-Natal 422 152 457 530 528 051 536 526 553 471 584 032 618 017
High Courts 47 245 51 859 55 686 51 796 53 888 57 524 63 337
Specialised Courts 3 036 3 182 3 364 4 146 4 457 4 697 4 910
Lower Courts 336 213 359 760 422 428 430 882 447 840 471 975 497 442
Government Motor Transport – 1 000 – 2 500 – – –
Facilities Management – 2 100 – 4 066 – – –
Administration of Courts 35 658 39 629 46 573 43 136 47 286 49 836 52 328
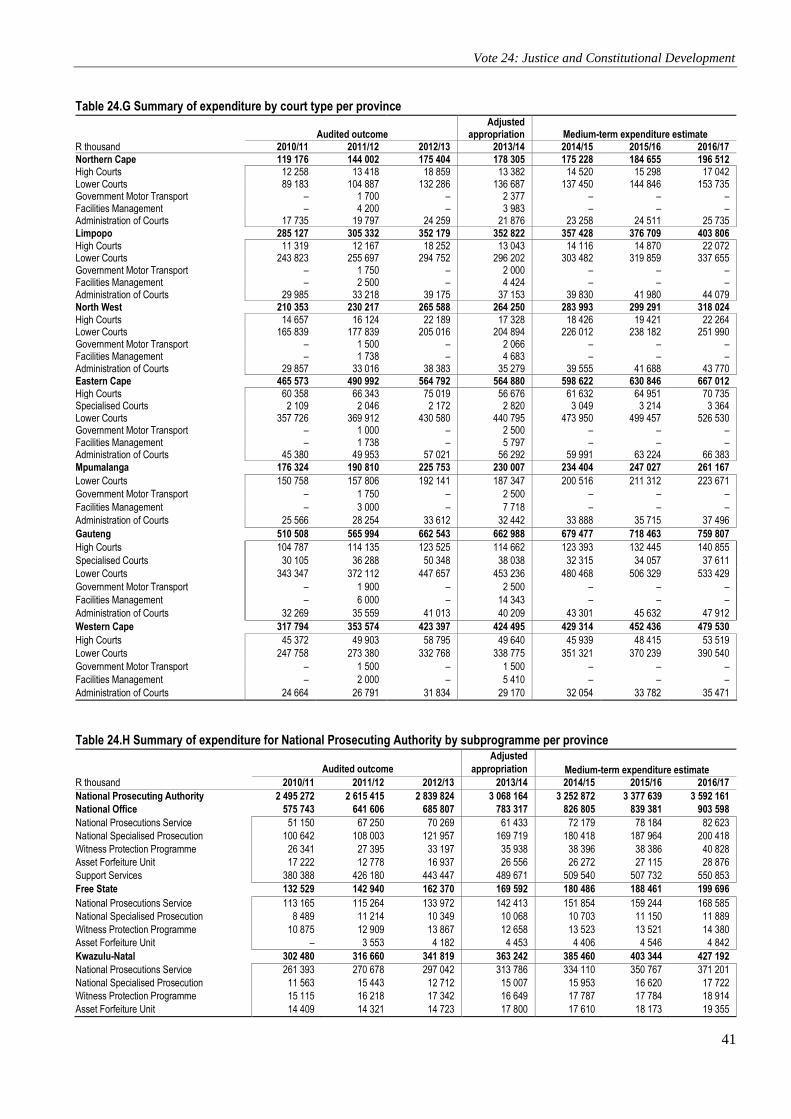
Vote 24: Justice and Constitutional Development
41
Vo
te24
: Justice a
nd
Co
nstitu
tion
al D
evelop
men
t
Table 24.G Summary of expenditure by court type per province Adjusted Audited outcome appropriation Medium-term expenditure estimate
R thousand 2010/11 2011/12 2012/13 2013/14 2014/15 2015/16 2016/17
Northern Cape 119 176 144 002 175 404 178 305 175 228 184 655 196 512 High Courts 12 258 13 418 18 859 13 382 14 520 15 298 17 042 Lower Courts 89 183 104 887 132 286 136 687 137 450 144 846 153 735 Government Motor Transport – 1 700 – 2 377 – – – Facilities Management – 4 200 – 3 983 – – – Administration of Courts 17 735 19 797 24 259 21 876 23 258 24 511 25 735
Limpopo 285 127 305 332 352 179 352 822 357 428 376 709 403 806
High Courts 11 319 12 167 18 252 13 043 14 116 14 870 22 072 Lower Courts 243 823 255 697 294 752 296 202 303 482 319 859 337 655 Government Motor Transport – 1 750 – 2 000 – – – Facilities Management – 2 500 – 4 424 – – – Administration of Courts 29 985 33 218 39 175 37 153 39 830 41 980 44 079 North West 210 353 230 217 265 588 264 250 283 993 299 291 318 024
High Courts 14 657 16 124 22 189 17 328 18 426 19 421 22 264 Lower Courts 165 839 177 839 205 016 204 894 226 012 238 182 251 990 Government Motor Transport – 1 500 – 2 066 – – – Facilities Management – 1 738 – 4 683 – – – Administration of Courts 29 857 33 016 38 383 35 279 39 555 41 688 43 770 Eastern Cape 465 573 490 992 564 792 564 880 598 622 630 846 667 012
High Courts 60 358 2 109
66 343 2 046
75 019 2 172
56 676 2 820
61 632 3 049
64 951 3 214
70 735 3 364 Specialised Courts
Lower Courts 357 726 369 912 430 580 440 795 473 950 499 457 526 530 Government Motor Transport – 1 000 – 2 500 – – – Facilities Management – 1 738 – 5 797 – – – Administration of Courts 45 380 49 953 57 021 56 292 59 991 63 224 66 383
Mpumalanga 176 324 190 810 225 753 230 007 234 404 247 027 261 167
Lower Courts 150 758 157 806 192 141 187 347 200 516 211 312 223 671
Government Motor Transport – 1 750 – 2 500 – – –
Facilities Management – 3 000 – 7 718 – – –
Administration of Courts 25 566 28 254 33 612 32 442 33 888 35 715 37 496
Gauteng 510 508 565 994 662 543 662 988 679 477 718 463 759 807
High Courts 104 787 114 135 123 525 114 662 123 393 132 445 140 855
Specialised Courts 30 105 36 288 50 348 38 038 32 315 34 057 37 611
Lower Courts 343 347 372 112 447 657 453 236 480 468 506 329 533 429
Government Motor Transport – 1 900 – 2 500 – – –
Facilities Management – 6 000 – 14 343 – – –
Administration of Courts 32 269 35 559 41 013 40 209 43 301 45 632 47 912
Western Cape 317 794 353 574 423 397 424 495 429 314 452 436 479 530
High Courts 45 372 49 903 58 795 49 640 45 939 48 415 53 519
Lower Courts 247 758 273 380 332 768 338 775 351 321 370 239 390 540
Government Motor Transport – 1 500 – 1 500 – – –
Facilities Management – 2 000 – 5 410 – – –
Administration of Courts 24 664 26 791 31 834 29 170 32 054 33 782 35 471
Table 24.H Summary of expenditure for National Prosecuting Authority by subprogramme per province Adjusted
Audited outcome appropriation Medium-term expenditure estimate
R thousand 2010/11 2011/12 2012/13 2013/14 2014/15 2015/16 2016/17
National Prosecuting Authority 2 495 272 2 615 415 2 839 824 3 068 164 3 252 872 3 377 639 3 592 161
National Office 575 743 641 606 685 807 783 317 826 805 839 381 903 598
National Prosecutions Service 51 150 67 250 70 269 61 433 72 179 78 184 82 623
National Specialised Prosecution 100 642 108 003 121 957 169 719 180 418 187 964 200 418
Witness Protection Programme 26 341 27 395 33 197 35 938 38 396 38 386 40 828
Asset Forfeiture Unit 17 222 12 778 16 937 26 556 26 272 27 115 28 876
Support Services 380 388 426 180 443 447 489 671 509 540 507 732 550 853
Free State 132 529 142 940 162 370 169 592 180 486 188 461 199 696
National Prosecutions Service 113 165 115 264 133 972 142 413 151 854 159 244 168 585
National Specialised Prosecution 8 489 11 214 10 349 10 068 10 703 11 150 11 889
Witness Protection Programme 10 875 12 909 13 867 12 658 13 523 13 521 14 380
Asset Forfeiture Unit – 3 553 4 182 4 453 4 406 4 546 4 842
Kwazulu-Natal 302 480 316 660 341 819 363 242 385 460 403 344 427 192
National Prosecutions Service 261 393 270 678 297 042 313 786 334 110 350 767 371 201
National Specialised Prosecution 11 563 15 443 12 712 15 007 15 953 16 620 17 722
Witness Protection Programme 15 115 16 218 17 342 16 649 17 787 17 784 18 914
Asset Forfeiture Unit 14 409 14 321 14 723 17 800 17 610 18 173 19 355
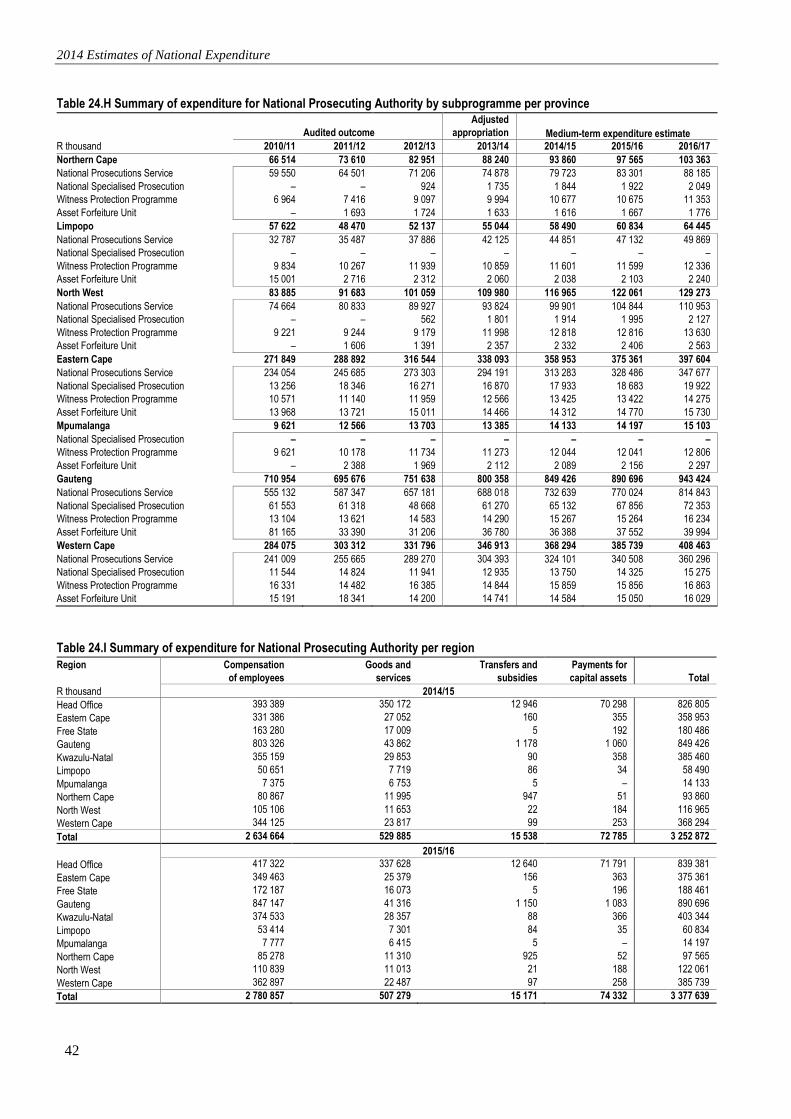
2014 Estimates of National Expenditure
42
20
13
Estim
ates o
f Na
tion
al E
xpen
ditu
re
Table 24.H Summary of expenditure for National Prosecuting Authority by subprogramme per province Adjusted
Audited outcome appropriation Medium-term expenditure estimate
R thousand 2010/11 2011/12 2012/13 2013/14 2014/15 2015/16 2016/17
Northern Cape 66 514 73 610 82 951 88 240 93 860 97 565 103 363
National Prosecutions Service 59 550 64 501 71 206 74 878 79 723 83 301 88 185
National Specialised Prosecution – – 924 1 735 1 844 1 922 2 049
Witness Protection Programme 6 964 7 416 9 097 9 994 10 677 10 675 11 353
Asset Forfeiture Unit – 1 693 1 724 1 633 1 616 1 667 1 776
Limpopo 57 622 48 470 52 137 55 044 58 490 60 834 64 445
National Prosecutions Service 32 787 35 487 37 886 42 125 44 851 47 132 49 869
National Specialised Prosecution – – – – – – –
Witness Protection Programme 9 834 10 267 11 939 10 859 11 601 11 599 12 336
Asset Forfeiture Unit 15 001 2 716 2 312 2 060 2 038 2 103 2 240
North West 83 885 91 683 101 059 109 980 116 965 122 061 129 273
National Prosecutions Service 74 664 80 833 89 927 93 824 99 901 104 844 110 953
National Specialised Prosecution – – 562 1 801 1 914 1 995 2 127
Witness Protection Programme 9 221 9 244 9 179 11 998 12 818 12 816 13 630
Asset Forfeiture Unit – 1 606 1 391 2 357 2 332 2 406 2 563
Eastern Cape 271 849 288 892 316 544 338 093 358 953 375 361 397 604
National Prosecutions Service 234 054 245 685 273 303 294 191 313 283 328 486 347 677
National Specialised Prosecution 13 256 18 346 16 271 16 870 17 933 18 683 19 922
Witness Protection Programme 10 571 11 140 11 959 12 566 13 425 13 422 14 275
Asset Forfeiture Unit 13 968 13 721 15 011 14 466 14 312 14 770 15 730
Mpumalanga 9 621 12 566 13 703 13 385 14 133 14 197 15 103
National Specialised Prosecution – – – – – – –
Witness Protection Programme 9 621 10 178 11 734 11 273 12 044 12 041 12 806
Asset Forfeiture Unit – 2 388 1 969 2 112 2 089 2 156 2 297
Gauteng 710 954 695 676 751 638 800 358 849 426 890 696 943 424
National Prosecutions Service 555 132 587 347 657 181 688 018 732 639 770 024 814 843
National Specialised Prosecution 61 553 61 318 48 668 61 270 65 132 67 856 72 353
Witness Protection Programme 13 104 13 621 14 583 14 290 15 267 15 264 16 234
Asset Forfeiture Unit 81 165 33 390 31 206 36 780 36 388 37 552 39 994
Western Cape 284 075 303 312 331 796 346 913 368 294 385 739 408 463
National Prosecutions Service 241 009 255 665 289 270 304 393 324 101 340 508 360 296
National Specialised Prosecution 11 544 14 824 11 941 12 935 13 750 14 325 15 275
Witness Protection Programme 16 331 14 482 16 385 14 844 15 859 15 856 16 863
Asset Forfeiture Unit 15 191 18 341 14 200 14 741 14 584 15 050 16 029
Table 24.I Summary of expenditure for National Prosecuting Authority per region Region Compensation Goods and Transfers and Payments for
of employees services subsidies capital assets Total
R thousand 2014/15
Head Office 393 389 350 172 12 946 70 298 826 805
Eastern Cape 331 386 27 052 160 355 358 953
Free State 163 280 17 009 5 192 180 486
Gauteng 803 326 43 862 1 178 1 060 849 426
Kwazulu-Natal 355 159 29 853 90 358 385 460
Limpopo 50 651 7 719 86 34 58 490
Mpumalanga 7 375 6 753 5 – 14 133
Northern Cape 80 867 11 995 947 51 93 860
North West 105 106 11 653 22 184 116 965
Western Cape 344 125 23 817 99 253 368 294
Total 2 634 664 529 885 15 538 72 785 3 252 872
2015/16
Head Office 417 322 337 628 12 640 71 791 839 381
Eastern Cape 349 463 25 379 156 363 375 361
Free State 172 187 16 073 5 196 188 461
Gauteng 847 147 41 316 1 150 1 083 890 696
Kwazulu-Natal 374 533 28 357 88 366 403 344
Limpopo 53 414 7 301 84 35 60 834
Mpumalanga 7 777 6 415 5 – 14 197
Northern Cape 85 278 11 310 925 52 97 565
North West 110 839 11 013 21 188 122 061
Western Cape 362 897 22 487 97 258 385 739
Total 2 780 857 507 279 15 171 74 332 3 377 639
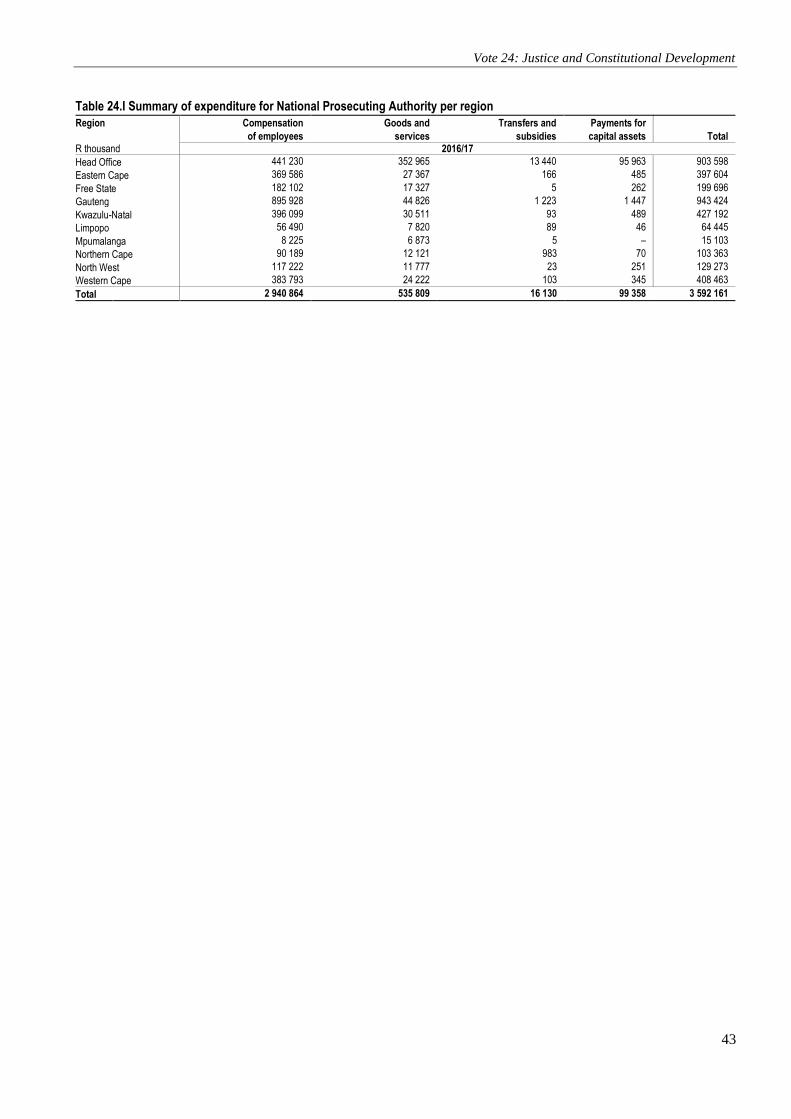
Vote 24: Justice and Constitutional Development
43
Vo
te24
: Justice a
nd
Co
nstitu
tion
al D
evelop
men
t
Table 24.I Summary of expenditure for National Prosecuting Authority per region Region Compensation Goods and Transfers and Payments for
of employees services subsidies capital assets Total
R thousand 2016/17
Head Office 441 230 352 965 13 440 95 963 903 598
Eastern Cape 369 586 27 367 166 485 397 604
Free State 182 102 17 327 5 262 199 696
Gauteng 895 928 44 826 1 223 1 447 943 424
Kwazulu-Natal 396 099 30 511 93 489 427 192
Limpopo 56 490 7 820 89 46 64 445
Mpumalanga 8 225 6 873 5 – 15 103
Northern Cape 90 189 12 121 983 70 103 363
North West 117 222 11 777 23 251 129 273
Western Cape 383 793 24 222 103 345 408 463
Total 2 940 864 535 809 16 130 99 358 3 592 161
2014 Estimates of National Expenditure
44

Estim
ates o
f Natio
na
l expen
ditu
re
National TreasuryDepartment:
REPUBLIC OF SOUTH AFRICA
Budget 2014 estimates of national expenditure
Private Bag X115, Pretoria, 0001, tel: +27 12 395 6697, fax: +27 12 315 5126