Embed Size (px)
Citation preview
BUDGET
BUDGET OF THE UNITED STATES GOVERNMENT
Fiscal Year 1999
THE BUDGET DOCUMENTS
Budget of the United States Government, Fiscal Year 1999contains the Budget Message of the President and information onthe President’s 1999 budget proposals. In addition, the Budget in-cludes the Nation’s first comprehensive Government-wide Perform-ance Plan.
Analytical Perspectives, Budget of the United States Govern-ment, Fiscal Year 1999 contains analyses that are designed to high-light specified subject areas or provide other significant presentationsof budget data that place the budget in perspective.
The Analytical Perspectives volume includes economic and account-ing analyses; information on Federal receipts and collections; analysesof Federal spending; detailed information on Federal borrowing anddebt; the Budget Enforcement Act preview report; current servicesestimates; and other technical presentations. It also includes informa-tion on the budget system and concepts and a listing of the Federalprograms by agency and account.
Historical Tables, Budget of the United States Government,Fiscal Year 1999 provides data on budget receipts, outlays, sur-pluses or deficits, Federal debt, and Federal employment coveringan extended time period—in most cases beginning in fiscal year 1940or earlier and ending in fiscal year 2003. These are much longertime periods than those covered by similar tables in other budgetdocuments. As much as possible, the data in this volume and allother historical data in the budget documents have been made con-sistent with the concepts and presentation used in the 1999 Budget,so the data series are comparable over time.
Budget of the United States Government, Fiscal Year 1999—Appendix contains detailed information on the various appropria-tions and funds that constitute the budget and is designed primarilyfor the use of the Appropriations Committee. The Appendix containsmore detailed financial information on individual programs and ap-propriation accounts than any of the other budget documents. Itincludes for each agency: the proposed text of appropriations lan-guage, budget schedules for each account, new legislative proposals,explanations of the work to be performed and the funds needed,
and proposed general provisions applicable to the appropriations ofentire agencies or group of agencies. Information is also providedon certain activities whose outlays are not part of the budget totals.
A Citizen’s Guide to the Federal Budget, Budget of the Unit-ed States Government, Fiscal Year 1999 provides general informa-tion about the budget and the budget process for the general public.
Budget System and Concepts, Fiscal Year 1999 contains anexplanation of the system and concepts used to formulate the Presi-dent’s budget proposals.
Budget Information for States, Fiscal Year 1999 is an Officeof Management and Budget (OMB) publication that provides proposedState-by-State obligations for the major Federal formula grant pro-grams to State and local governments. The allocations are basedon the proposals in the President’s budget. The report is releasedafter the budget and can be obtained from the Publications Officeof the Executive Office of the President, 725 17th Street NW, Wash-ington, DC 20503; (202) 395–7332.
AUTOMATED SOURCES OF BUDGET INFORMATION
The information contained in these documents is available inelectronic format from the following sources:
CD-ROM. The CD-ROM contains all of the budget documents andsoftware to support reading, printing, and searching the documents.The CD-ROM also has many of the tables in the budget inspreadsheet format.
Internet. All budget documents, including documents that arereleased at a future date, will be available for downloading in severalformats from the Internet. To access documents through the WorldWide Web, use the following address:
http://www.access.gpo.gov/su_docs/budget/index.html
For more information on access to the budget documents, call toll-free (888) 293–6498.
GENERAL NOTES
1. All years referred to are fiscal years, unless otherwise noted.2. Detail in this document may not add to the totals due to rounding.
U.S. GOVERNMENT PRINTING OFFICEWASHINGTON 1998
For sale by the U.S. Government Printing OfficeSuperintendent of Documents, Mail Stop: SSOP, Washington, D.C. 20402–9328
i
TABLE OF CONTENTS
Page
I. The Budget Message of the President ............................................................. 1
II. Preparing the Nation For a New American Century .................................. 9
III. Creating a Bright Economic Future ................................................................ 21
IV. Improving Performance Through Better Management .............................. 33
V. Preparing For the 21st Century
1. Investing in Education and Training .................................................. 51
2. Supporting Working Families .............................................................. 61
3. Strengthening Health Care .................................................................. 69
4. Protecting the Environment ................................................................. 77
5. Investing in Infrastructure ................................................................... 85
6. Promoting Research .............................................................................. 93
7. Enforcing the Law ................................................................................. 105
8. Strengthening the American Community ........................................... 115
9. Advancing United States Leadership in the World ........................... 125
10. Supporting the World’s Strongest Military Force .............................. 133
VI. Investing in the Common Good: Program Performance in Federal
Functions
11. Overview ................................................................................................ 143
12. National Defense ................................................................................... 149
13. International Affairs ............................................................................. 155
14. General Science, Space, and Technology ............................................. 161
15. Energy .................................................................................................... 167
16. Natural Resources and Environment .................................................. 173
17. Agriculture ............................................................................................. 181
18. Commerce and Housing Credit ............................................................ 187
19. Transportation ....................................................................................... 193
20. Community and Regional Development .............................................. 199
21. Education, Training, Employment, and Social Services .................... 205
22. Health .................................................................................................... 213
23. Medicare ................................................................................................ 219
24. Income Security ..................................................................................... 223
25. Social Security ....................................................................................... 229
ii
TABLE OF CONTENTS—Continued
Page
26. Veterans Benefits and Services ........................................................... 233
27. Administration of Justice ..................................................................... 239
28. General Government ............................................................................. 245
29. Net Interest ........................................................................................... 249
30. Allowances ............................................................................................. 253
31. Undistributed Offsetting Receipts ....................................................... 255
32. Regulation: Costs and Benefits ............................................................ 257
33. Detailed Functional Tables .................................................................. 261
VII. Summary Tables
1999 Budget Proposals .................................................................................. 341
Summaries by Agency ................................................................................... 359
Other Summary Tables ................................................................................. 365
VIII. List of Charts and Tables .................................................................................... 369
IX. OMB Contributors to the 1999 Budget ............................................................ 377
1
I. THE BUDGET MESSAGEOF THE PRESIDENT
2 THE BUDGET FOR FISCAL YEAR 1999
1980 1982 1984 1986 1988 1990 1992 1994 1996 1998 2000 2002
-700
-600
-500
-400
-300
-200
-100
0
100
SURPLUS (+) / DEFICITS (-) IN BILLIONS OF DOLLARS
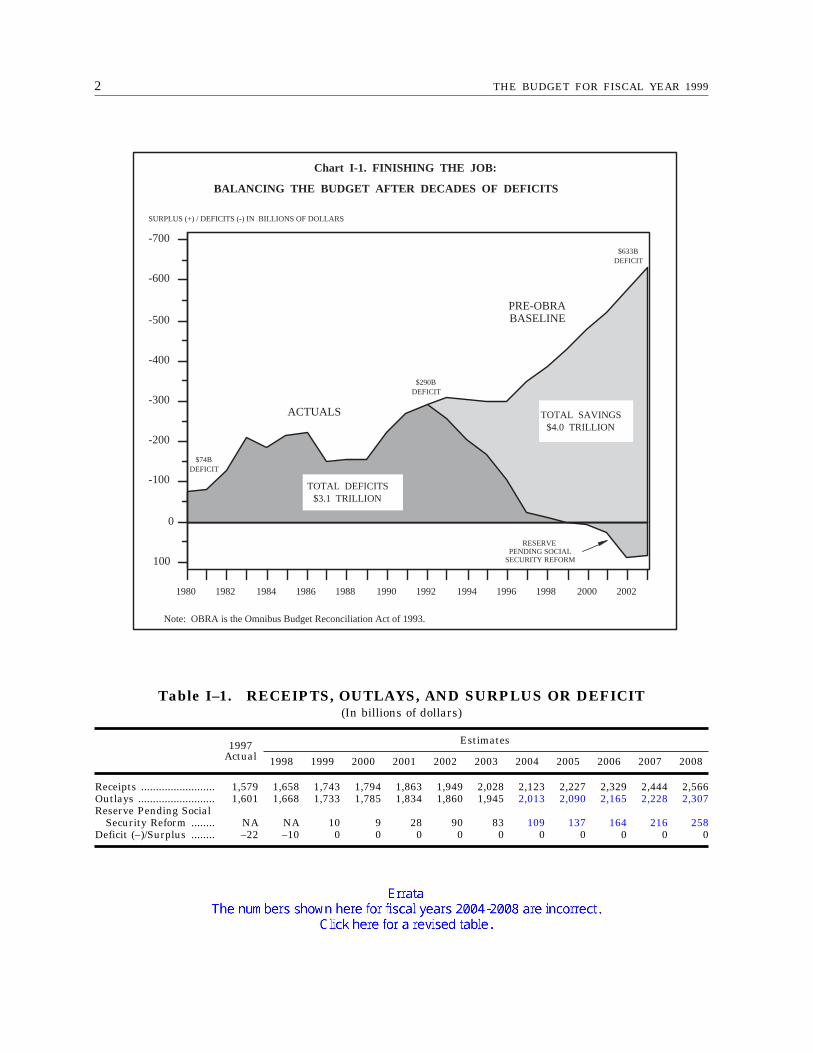
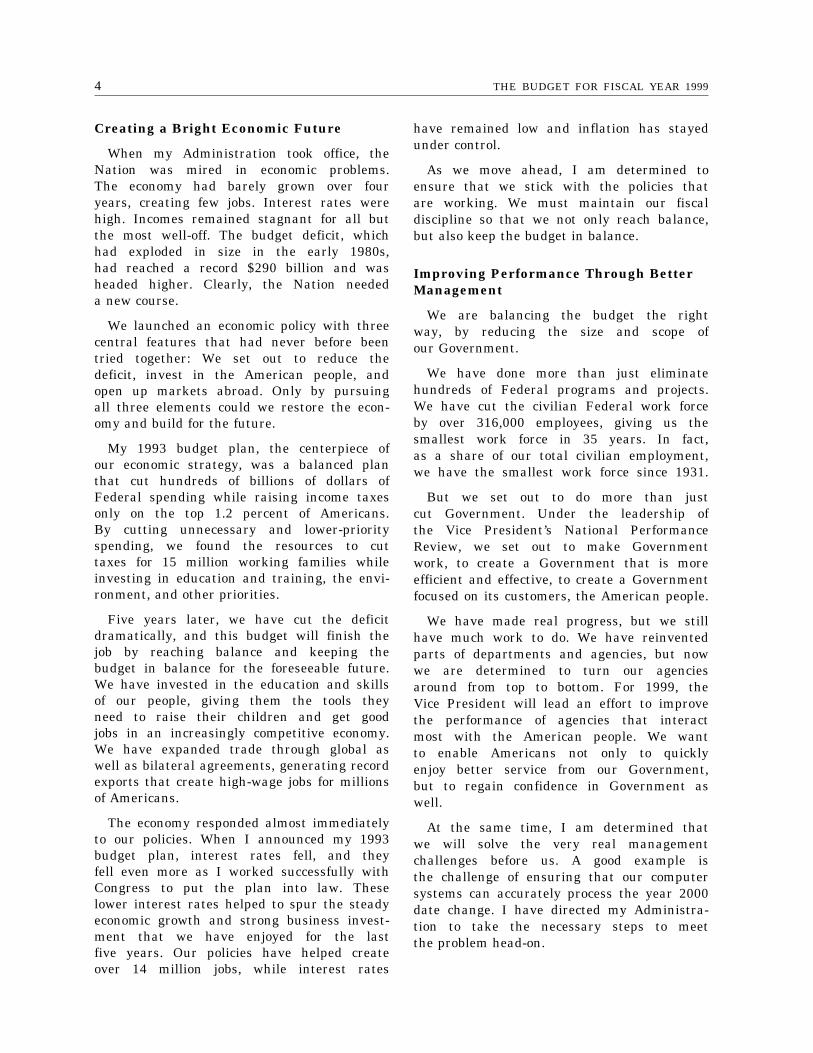
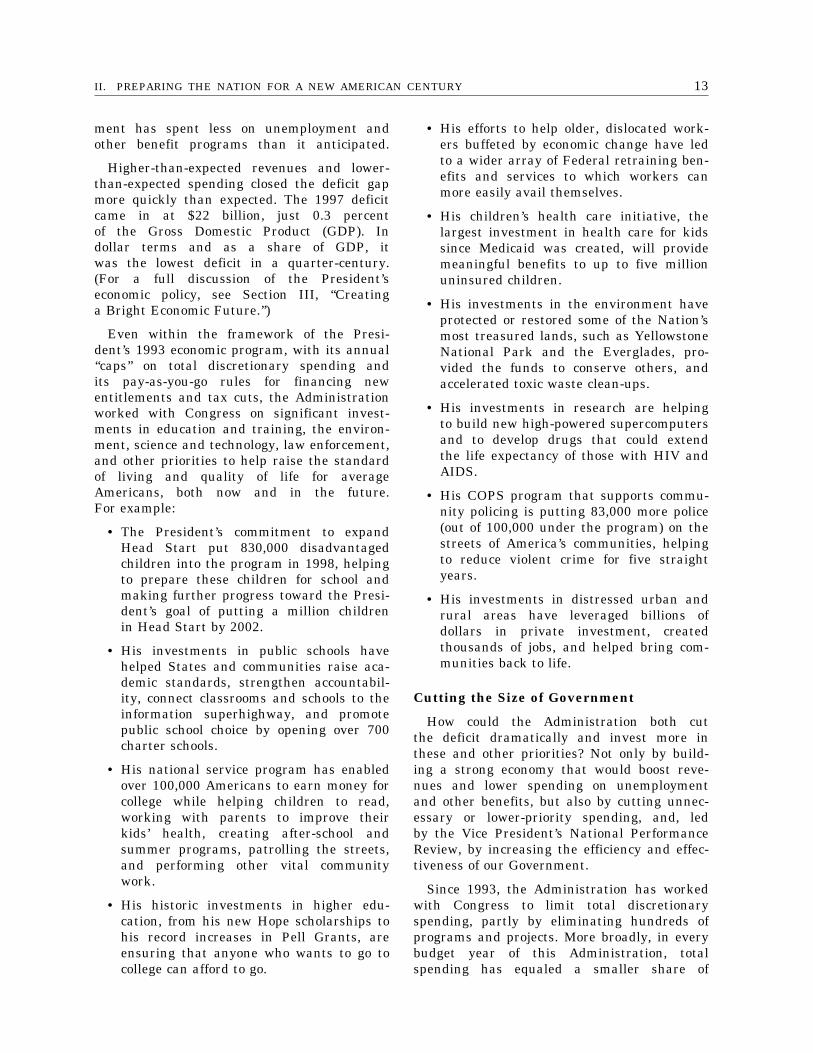
Chart I-1. FINISHING THE JOB:
BALANCING THE BUDGET AFTER DECADES OF DEFICITS
ACTUALS
TOTAL DEFICITS $3.1 TRILLION
TOTAL SAVINGS $4.0 TRILLION
$74BDEFICIT
$633BDEFICIT
$290BDEFICIT
PRE-OBRA BASELINE
RESERVEPENDING SOCIAL
SECURITY REFORM
Note: OBRA is the Omnibus Budget Reconciliation Act of 1993.
Table I–1. RECEIPTS, OUTLAYS, AND SURPLUS OR DEFICIT(In billions of dollars)
1997Actual
Estimates
1998 1999 2000 2001 2002 2003 2004 2005 2006 2007 2008
Receipts ......................... 1,579 1,658 1,743 1,794 1,863 1,949 2,028 2,123 2,227 2,329 2,444 2,566Outlays .......................... 1,601 1,668 1,733 1,785 1,834 1,860 1,945 2,013 2,090 2,165 2,228 2,307Reserve Pending Social
Security Reform ........ NA NA 10 9 28 90 83 109 137 164 216 258Deficit (–)/Surplus ........ –22 –10 0 0 0 0 0 0 0 0 0 0
3
THE BUDGET MESSAGE OF THE PRESIDENTTo the Congress of the United States:
The 1999 Budget, which I am submittingto you with this message, is a balancedFederal budget, marking the first such budgetin 30 years and bringing an era of explodingdeficits to an end.
By reaching balance, my budget representsa remarkable turnaround in our fiscal policyover the last five years. It brings to anend three decades of fiscal chaos, a periodin which Americans had lost confidence intheir Government and the ability of theirleaders to do the people’s business.
This budget is not just balanced, it isbalanced the right way. It not only endsthe deficit, it reflects the values that Ameri-cans hold dear—the values of opportunity,responsibility, and community. The budgetreflects my commitment to continue helpingworking families with their basic needs—to raise their children, send them to college,and pay for health care.
The budget invests in education and trainingand in research to raise the standard ofliving for average Americans. It invests inthe environment and in law enforcementto raise the quality of life across our Nation.It invests in our communities at home whileproviding the resources to maintain a strongdefense and conduct the international relationsthat have become so important to our future.
In the public and private sectors, prospectsfor a budget surplus are spurring a widearray of ideas about how to spend it. Atthis point, the Government has not yet reachedthe surplus milestone, and I continue tobelieve strongly that we should not spenda surplus that we don’t yet have.
More specifically, I believe that the Adminis-tration and Congress should not spend abudget surplus for any reason until we havea solution to the long-term financing challengefacing Social Security. With that in mind,my budget proposes a reserve for the projectedsurpluses for 1999 and beyond.
Preparing the Nation for a New AmericanCentury
Five years ago, my Administration tookoffice determined to restore the AmericanDream for every American. We were deter-mined to turn the economy around, to reinin a budget that was out of control, andto create a Government that once againwould focus on its customers, the Americanpeople.
Five years later, we have made enormousprogress. Our economy is strong, our budgetis headed toward balance, and our Governmentis making noticeable progress in providingbetter service to Americans.
We are beginning to bring Americans to-gether again, to repair the social fabricthat has frayed so badly in recent decades.All across America, crime is down, povertyis down, and welfare is down. Incomes arerising at all levels, and a new spirit ofoptimism is sweeping through many of oururban and rural communities that are re-bounding from decades of lost jobs and losthope.
Now that we have turned the economyaround, our task is to spread the benefitsof our economic well-being to more Americans,to ensure that every American has the chanceto live out his or her dreams. As we moveconfidently ahead as a Nation, we wantto ensure that nobody is left behind.
A century ago, the economy shifted fromagriculture to manufacturing, changing theway that Americans lived, the way theyworked, the way they related to one another.Today, the economy is shifting once more,this time from manufacturing to services,information, technology, and global commerce.
We can ensure that every American fullyenjoys the benefits of this exciting new age,but only if we continue to give people thetools they need and create the conditionsin which they can prosper. That is whatmy budget is designed to do.
4 THE BUDGET FOR FISCAL YEAR 1999
Creating a Bright Economic Future
When my Administration took office, theNation was mired in economic problems.The economy had barely grown over fouryears, creating few jobs. Interest rates werehigh. Incomes remained stagnant for all butthe most well-off. The budget deficit, whichhad exploded in size in the early 1980s,had reached a record $290 billion and washeaded higher. Clearly, the Nation neededa new course.
We launched an economic policy with threecentral features that had never before beentried together: We set out to reduce thedeficit, invest in the American people, andopen up markets abroad. Only by pursuingall three elements could we restore the econ-omy and build for the future.
My 1993 budget plan, the centerpiece ofour economic strategy, was a balanced planthat cut hundreds of billions of dollars ofFederal spending while raising income taxesonly on the top 1.2 percent of Americans.By cutting unnecessary and lower-priorityspending, we found the resources to cuttaxes for 15 million working families whileinvesting in education and training, the envi-ronment, and other priorities.
Five years later, we have cut the deficitdramatically, and this budget will finish thejob by reaching balance and keeping thebudget in balance for the foreseeable future.We have invested in the education and skillsof our people, giving them the tools theyneed to raise their children and get goodjobs in an increasingly competitive economy.We have expanded trade through global aswell as bilateral agreements, generating recordexports that create high-wage jobs for millionsof Americans.
The economy responded almost immediatelyto our policies. When I announced my 1993budget plan, interest rates fell, and theyfell even more as I worked successfully withCongress to put the plan into law. Theselower interest rates helped to spur the steadyeconomic growth and strong business invest-ment that we have enjoyed for the lastfive years. Our policies have helped createover 14 million jobs, while interest rates
have remained low and inflation has stayedunder control.
As we move ahead, I am determined toensure that we stick with the policies thatare working. We must maintain our fiscaldiscipline so that we not only reach balance,but also keep the budget in balance.
Improving Performance Through BetterManagement
We are balancing the budget the rightway, by reducing the size and scope ofour Government.
We have done more than just eliminatehundreds of Federal programs and projects.We have cut the civilian Federal work forceby over 316,000 employees, giving us thesmallest work force in 35 years. In fact,as a share of our total civilian employment,we have the smallest work force since 1931.
But we set out to do more than justcut Government. Under the leadership ofthe Vice President’s National PerformanceReview, we set out to make Governmentwork, to create a Government that is moreefficient and effective, to create a Governmentfocused on its customers, the American people.
We have made real progress, but we stillhave much work to do. We have reinventedparts of departments and agencies, but nowwe are determined to turn our agenciesaround from top to bottom. For 1999, theVice President will lead an effort to improvethe performance of agencies that interactmost with the American people. We wantto enable Americans not only to quicklyenjoy better service from our Government,but to regain confidence in Government aswell.
At the same time, I am determined thatwe will solve the very real managementchallenges before us. A good example isthe challenge of ensuring that our computersystems can accurately process the year 2000date change. I have directed my Administra-tion to take the necessary steps to meetthe problem head-on.
5THE BUDGET MESSAGE OF THE PRESIDENT
Preparing for the 21st Century
Nothing is more important to our futurethan education. It has become the dividingline between those who are moving aheadand those who are lagging behind. Thatis why I have devoted so much effort toensure that we have a world-class systemof education and training in place for Ameri-cans of all ages. Over the last five years,we have worked hard to ensure that everyboy and girl is prepared to learn, thatour schools focus on high standards andachievement, that anyone who wants to goto college can get the financial help toattend, and that those who need a secondchance at education and training or a chanceto improve or learn new skills can do so.My budget significantly increases funds tohelp children, especially in the poorest commu-nities, reach challenging academic standardsand makes further progress in implementingvoluntary national tests. It proposes to buildmore classrooms and pay for 100,000 moreteachers so that we can reduce class sizes.For higher education and training, my budgetincreases Pell Grants and other college schol-arships from the record levels that we havealready achieved; expands College Work-Studyto a record one million students; streamlinesstudent loan programs and cuts student fees;and expands access to job placement services,training, and related services for dislocatedworkers and others. Now that anyone whowants to attend college can find the meansthrough Hope scholarships, Pell Grants, andother assistance that we worked so hardto enact, I want to provide the same universalopportunity for job training and re-trainingto those who need it.
Over the last five years, we have workedhard to help working families. We cut taxesfor 15 million working families, provideda tax credit to help families raise theirchildren, ensured that 25 million Americansa year can change jobs without losing theirhealth insurance, made it easier for theself-employed and those with pre-existing con-ditions to get health insurance, providedhealth care coverage for up to five millionuninsured children, raised the minimum wage,and provided guaranteed time off for workerswho need to care for a newborn or addressthe health needs of a family member. Now,
with my new Child Care Initiative, I amdetermined to provide the help that familiesneed when it comes to finding safe, high-quality, affordable child care. Parents shouldknow that, when they go to work, theirchildren are in safe, healthy environments.I also propose to address the problems facedby a particular group of working families—legal immigrants. In signing the 1996 welfarereform law, I said that I would try torestore the cuts in benefits for legal immi-grants that were not only harsh and unneces-sary but that had nothing to do with thefundamental goal of welfare reform—to movepeople from welfare to work while protectingchildren. My budget restores Food Stampsto 730,000 legal immigrants and lets Statesprovide health insurance to the children oflegal immigrants.
This past year, we continued to improvehealth care for millions of Americans. Westrengthened Medicare by extending the lifeof the trust fund until at least 2010, whilewe also invested in preventive benefits, intro-duced more choice of health plans, andstrengthened our expanding array of activitiesto combat fraud and abuse. We extendedhealth care coverage to up to five millionuninsured children. We created the AdvisoryCommission on Consumer Protection andQuality in the Health Care Industry andwe later endorsed its Health Care ConsumerBill of Rights. With this budget, I proposethat we build on our achievements on ahost of important fronts. I want to workwith Congress to enact national bipartisantobacco legislation; nothing is more potentiallyimportant to the health of our people, particu-larly children. My budget also proposes toexpand health care coverage for some ofthe most vulnerable Americans aged 55 to65, to enroll more eligible children in Medicaid,to provide for unprecedented levels of invest-ment in health research, to expand accessto powerful AIDS therapies, to expand accessto cancer clinical trials, to increase fundsfor substance abuse treatment and prevention,and to help reduce health-related disparitiesacross racial and ethnic groups.
Last year was a remarkable one for theenvironment, and I am determined to buildon our progress. Led by the Vice President,the Administration reached an historic inter-
6 THE BUDGET FOR FISCAL YEAR 1999
national agreement in Kyoto that calls forcuts in greenhouse gas emissions. We alsoissued new, more protective air quality stand-ards to better safeguard public health, andwe strengthened our citizens’ right to knowabout toxic chemical releases. We continuedto protect our natural treasures, such asYellowstone National Park and Florida’s Ever-glades, and to make further progress towardmy goal of cleaning up 900 hazardous wastesites under the Superfund by the end ofthe year 2001. With this budget, I amproposing an Environmental Resources Fundfor America that will support increases formany of our key environmental programs.It provides for more construction, mainte-nance, and land acquisition for national parks,forests, refuges, and other public lands; fora new effort to improve the quality of ourwater; for improvements to community drink-ing water and wastewater facilities; and forcontinuing our efforts to clean up abandonedhazardous waste sites. My budget also includesa new, five-year, $6 billion program to preventglobal warming, and more resources to protectendangered species, control pollution, andpreserve the global environment.
I am proposing a Transportation Fundfor America, reflecting my commitment toprovide the resources to ensure that ourtransportation infrastructure remains safe, in-tegrated, and efficient enough to serve ourgrowing needs. Investment in infrastructureis good for America because it helps growthe economy, improve safety and public health,strengthen our competitiveness abroad, sup-port our national security, and increase themobility, access, and choice for Americanswho need to travel. We must build uponour vast network of roads, highways, andbridges to meet the demands of the nextcentury for a system that links our variousmodes of travel, that is cleaner and safer,and that helps bring together and supportour urban and rural communities. My budgetmaintains the Administration’s record supportfor transportation, and the Fund includesall of the Transportation Department’s high-way, highway safety, transit, and air transpor-tation programs.
Scientific and technological advances havecreated a world vastly different from theone our grandparents knew. They have helped
generate huge leaps in the speed and economyof transportation, enormous increases in farmproductivity, lightning-fast flows of informa-tion and services across national borders,and advances in treating and preventingdiseases and protecting the environment. Be-cause I am committed to America’s continuedleadership in science and technology, I amproposing a Research Fund for America, fromwhich many of our important investmentswill flow. It includes record increases forthe National Institutes of Health, higherfunding for the National Science Foundation,new resources to address global climatechange, and a wide variety of investmentsin basic and applied research. These invest-ments are vital; they help to create newknowledge, train more workers, spur newjobs and industries, address our health carechallenges, strengthen our understanding ofenvironmental problems, better educate ourchildren, and maintain a strong nationaldefense.
Our anti-crime strategy is working. Seriouscrime is down five years in a row and,in 1996, we witnessed the largest drop inviolent crime in 35 years. But, because crimeremains unacceptably high, we must go fur-ther. My budget expands our communitypolicing (COPS) program, which is alreadyputting 83,000 more police on the streetstoward my goal of 100,000 by the year2000. The budget also proposes a new Commu-nity Prosecutors Initiative to help prosecutorsprevent crimes from occurring, rather thansimply prosecuting criminals after the fact.And it provides the necessary funds to preventviolence against women, to help States andIndian Tribes build prisons, and to addressthe growing law enforcement crisis on Indianlands. To boost our efforts to control illegalimmigration, the budget provides the resourcesto strengthen border enforcement in the Southand West, to remove illegal aliens, and toexpand our efforts to verify whether newlyhired non-citizens are eligible for jobs. Tocombat drug use, particularly among youngpeople, my budget expands programs thatstress treatment and prevention, law enforce-ment, international assistance, and interdic-tion. It continues to build on our innovativeDrug Courts initiative, proposes School DrugPrevention Coordinators for our schools, sup-
7THE BUDGET MESSAGE OF THE PRESIDENT
ports local efforts that target drug-usingoffenders, expands drug testing, and strength-ens our efforts to make our ports and bordersmore secure from drugs while disruptingdrug trafficking organizations overseas.
Most Americans are enjoying the fruitsof our strong economy. But while manyurban and rural areas are doing better,too many others have grown disconnectedfrom our values of opportunity, responsibility,and community. Working with State andlocal governments and with the private sector,I am determined to help bring our distressedareas back to life, to replace despair withhope. My budget expands my national serviceprogram, giving more Americans the chanceto serve their country and help solve problemsat the local level while earning money forcollege. I am proposing to create moreEmpowerment Zones and Enterprise Commu-nities that offer tax incentives and directspending to encourage the kind of privateinvestment that creates jobs, and to providemore capital for lending through my Commu-nity Development Financial Institutions pro-gram. My budget also expands opportunitiesfor homeownership, provides more funds toenforce the Nation’s civil rights laws, main-tains our Government-to-Government commit-ment to Native Americans, and strengthensthe partnership we have begun with theDistrict of Columbia.
Because America continues to have a tre-mendous stake in world affairs, my budgetproposes the necessary funds to maintainnational security, to conduct our diplomacy,to promote democracy and free marketsabroad, and to increase exports. Last year,my Administration worked with Congress toincrease international affairs spending. But,Congress faces an unfinished agenda to pro-vide financial support for, and fulfill America’sobligations to, a number of internationalorganizations that benefit our economy andserve other objectives, including the Inter-national Monetary Fund (IMF), the UnitedNations system, and the multilateral develop-ment banks. Congress should continue tosupport the decisive action of the IMF aswell as our leadership in that institutionby providing the supplementary contingentIMF funding that the Administration hassought and replenishing the IMF’s basic finan-
cial resources. Congress also should givethe President traditional trade negotiatingauthority to help fuel our surging exportsinto the next century. To enhance nationalsecurity, my budget maintains large-scalefunding to support the Middle East peaceprocess, continues assistance to Bosnia tocarry out the Dayton Accords, supports NATOexpansion, and increases aid to the NewIndependent States of the former Soviet Unionto support the development of democracyand free markets. I am also proposing amajor initiative to provide critical, targetedassistance to African countries that are under-taking difficult economic reforms, and mybudget increases counter-narcotics aid to LatinAmerican countries and supports the Summitof the Americas.
Our military serves as the backbone ofour national security strategy, and I amcommitted to maintain a strong and capablemilitary that protects our freedoms and ourglobal leadership role as we approach the21st Century. The budget continues the Ad-ministration’s plan to complete the carefulresizing of our military forces, to fully supportmilitary readiness, to strengthen quality oflife programs for our armed forces, andto provide increased funding to modernizeour forces as new technologies become avail-able after the turn of the century. Mybudget reflects the recommendations of theQuadrennial Defense Review and of the De-fense Department’s recent Defense ReformInitiative to achieve a leaner, more efficient,and more cost-effective organization by improv-ing management and business practices. Toimplement these improvements, the DefenseDepartment will send legislation to Congressin conjunction with this budget, includinga request for two more rounds of baseclosures and realignments.
Investing in the Common Good
Our commitment to balance the budget,and to keep it in balance, will mean thatthe Administration and Congress must usetaxpayer dollars as wisely as possible. Ifwe are to continue funding Federal programs,they will have to show that they are reachingthe goals set for them. That is, they willhave to show that they are well-run andthat they can produce results.
8 THE BUDGET FOR FISCAL YEAR 1999
In 1993, I actively supported, and waseager to sign, the Government Performanceand Results Act. With this budget, I amdelighted to send Congress what the lawenvisioned—the first comprehensive, Govern-ment-wide Performance Plan.
In developing this budget, the Administra-tion for the first time could rely on perform-ance measures and annual performance goalsthat are now included in agency AnnualPerformance Plans. We have made a good
start on the process that the Administrationand Congress outlined in enacting the 1993law.
As we continue to implement this law,my Administration will focus more and moreattention on how programs work, whetherthey are meeting their goals, and what weshould do to make them better. We lookforward to working with Congress on ourshared goal of improving Government perform-ance.
WILLIAM J. CLINTON
February 2, 1998

9
II. PREPARING THE NATIONFOR A NEW AMERICAN
CENTURY
10
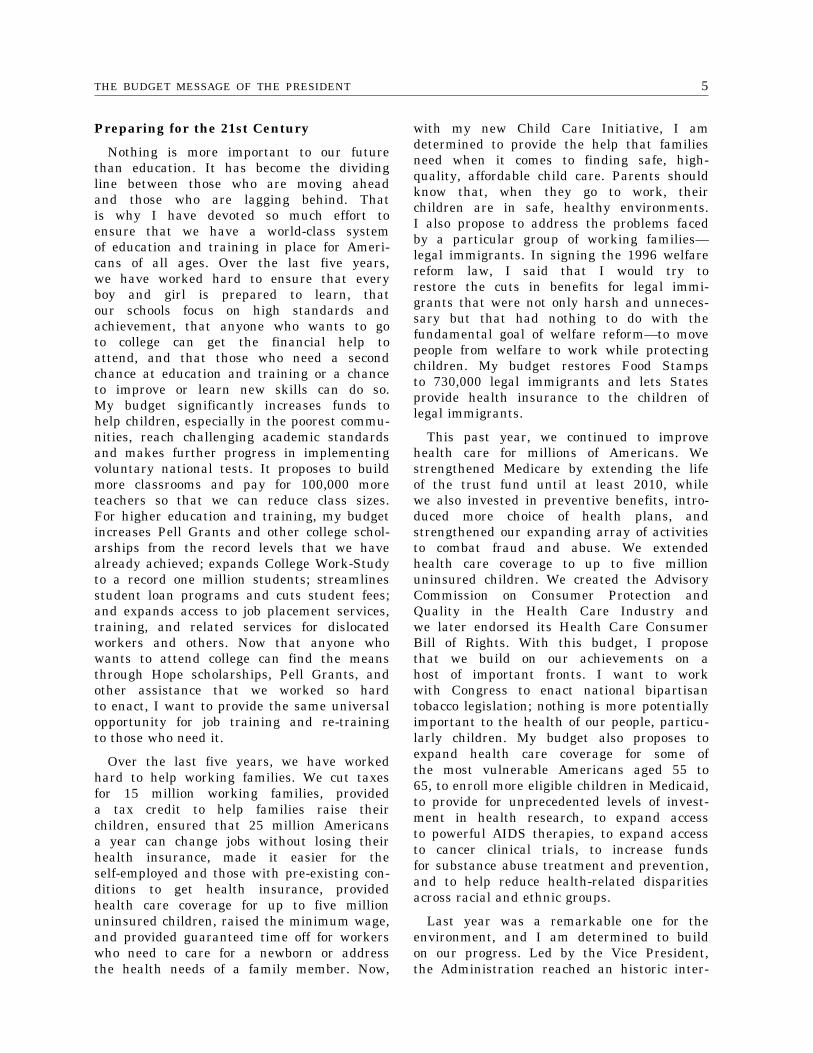
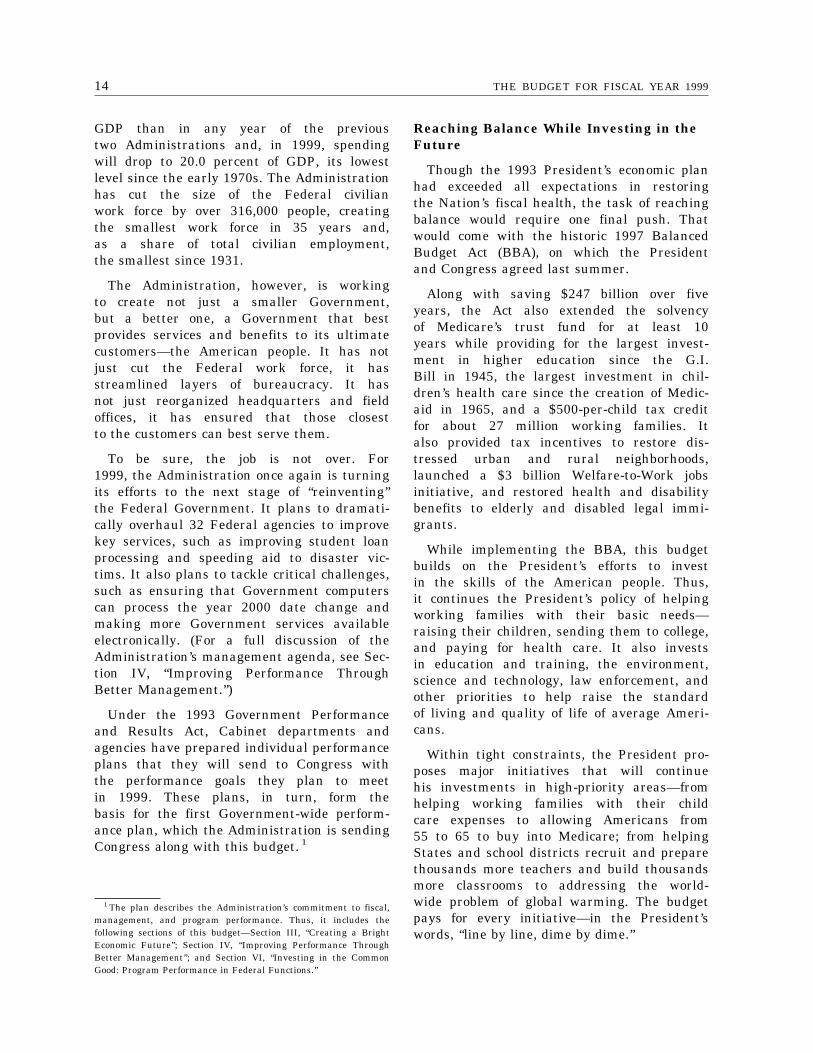
THE FEDERAL GOVERNMENT DOLLAR
WHERE IT GOES...
DIRECT BENEFITPAYMENTS FOR
INDIVIDUALS50%
NETINTEREST
14%
NATIONALDEFENSE
15%OTHER
FEDERALOPERATIONS
5%
GRANTS TO STATES
& LOCALITIES15%
WHERE IT COMES FROM...
EXCISETAXES
4%
OTHER5%
CORPORATEINCOMETAXES
11%
FISCAL YEAR 1999 ESTIMATES
SOCIALINSURANCERECEIPTS
34%
INDIVIDUALINCOMETAXES
46%
RESERVE PENDING SOCIAL SECURITY
REFORM1%
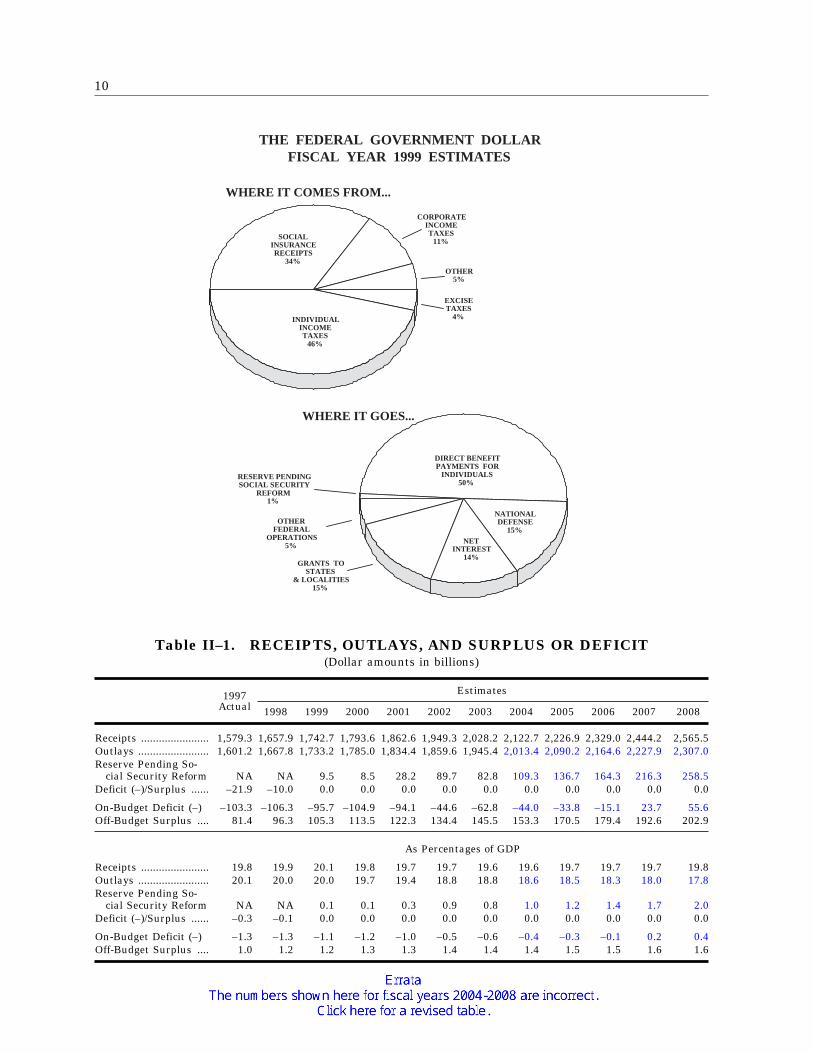
Table II–1. RECEIPTS, OUTLAYS, AND SURPLUS OR DEFICIT(Dollar amounts in billions)
1997Actual
Estimates
1998 1999 2000 2001 2002 2003 2004 2005 2006 2007 2008
Receipts ....................... 1,579.3 1,657.9 1,742.7 1,793.6 1,862.6 1,949.3 2,028.2 2,122.7 2,226.9 2,329.0 2,444.2 2,565.5Outlays ........................ 1,601.2 1,667.8 1,733.2 1,785.0 1,834.4 1,859.6 1,945.4 2,013.4 2,090.2 2,164.6 2,227.9 2,307.0Reserve Pending So-
cial Security Reform NA NA 9.5 8.5 28.2 89.7 82.8 109.3 136.7 164.3 216.3 258.5Deficit (–)/Surplus ...... –21.9 –10.0 0.0 0.0 0.0 0.0 0.0 0.0 0.0 0.0 0.0 0.0
On-Budget Deficit (–) –103.3 –106.3 –95.7 –104.9 –94.1 –44.6 –62.8 –44.0 –33.8 –15.1 23.7 55.6Off-Budget Surplus .... 81.4 96.3 105.3 113.5 122.3 134.4 145.5 153.3 170.5 179.4 192.6 202.9
As Percentages of GDP
Receipts ....................... 19.8 19.9 20.1 19.8 19.7 19.7 19.6 19.6 19.7 19.7 19.7 19.8Outlays ........................ 20.1 20.0 20.0 19.7 19.4 18.8 18.8 18.6 18.5 18.3 18.0 17.8Reserve Pending So-
cial Security Reform NA NA 0.1 0.1 0.3 0.9 0.8 1.0 1.2 1.4 1.7 2.0Deficit (–)/Surplus ...... –0.3 –0.1 0.0 0.0 0.0 0.0 0.0 0.0 0.0 0.0 0.0 0.0
On-Budget Deficit (–) –1.3 –1.3 –1.1 –1.2 –1.0 –0.5 –0.6 –0.4 –0.3 –0.1 0.2 0.4Off-Budget Surplus .... 1.0 1.2 1.2 1.3 1.3 1.4 1.4 1.4 1.5 1.5 1.6 1.6
11
II. PREPARING THE NATION FOR A NEWAMERICAN CENTURY
Imagine an America in which every child has a world-class education; in which every familycan fairly balance the demands of work and child-rearing; in which we lift living standards hereand around the world; in which we learn to grow our economy and preserve the common environ-ment which is our home; in which our oldest values of opportunity, responsibility and communityguide us into a new time of greatest opportunity.
President ClintonSeptember 1997
It is, as the President said not long ago,‘‘a time of genuine hope and earned optimismfor America.’’ A country that not many yearsago was approaching the 21st Century withuncertainty now looks to it with strengthand confidence, with the knowledge thatwe can make it a ‘‘New American Century.’’
The Administration’s five years of hardwork are paying off. Our economy is strong,our social health is improving, and our placeas the world’s undisputed leader for peaceand freedom is unchallenged. Our FederalGovernment is leaner, more efficient, moreeffective, and more connected to the essentialvalues that Americans share—opportunity, re-sponsibility, and community.
Our economy has grown an average ofthree percent a year, helping to create over14 million new jobs. Unemployment is belowfive percent, inflation is under control, andinterest rates are low. Investment growthand consumer confidence are at their highestlevels in a generation. Homeownership hashit record levels. And, after two decadesin which family incomes remained essentiallyflat, we are making progress on this mostintractable of economic problems as incomeshave begun to rise at all levels.
Violent crime has dropped dramatically forfive years in a row, and the 1996 dropwas the largest in 35 years. The welfarerolls have dropped by record numbers. Povertyand teen birth rates are also down while,all across America, many of our poorest
urban and rural communities are springingback to life.
Around the world, America remains theworld’s lone superpower in both militaryand economic terms. Our forces, our resources,and our international influence have helpedto keep the peace in war-torn nations, nurturedemocratic capitalism in former communistcountries, and open markets for our goods.
Perhaps most striking of all, the budgetdeficit continues to fall dramatically and,with this budget, the President proposesto reach balance in 1999, marking the firstbalanced budget in 30 years and an endto an era of continuous deficits that spiraledout of control through the 1980s and early1990s.
Implementing the President’s Agenda
Five years ago, the President took officeagainst the backdrop of a sweeping economictransformation both at home and abroadthat was already dramatically changing howAmericans lived, how they worked, and howthey related to one another. An economythat had shifted from agriculture to manufac-turing a century earlier was shifting again,this time from manufacturing to information,technology, and global commerce, challengingthe rhythms of American life.
In this new economy, Americans couldno longer rely solely on their hard workto earn a good living. Now, they wouldneed the skills to run the computers andother sophisticated equipment that had be-
12 THE BUDGET FOR FISCAL YEAR 1999
come the engines of growth. More and more,what they earned in an increasingly competi-tive economy depended on their knowledge,their creativity, their sense of innovation.
In early 1993, as one Administration re-placed another, the Federal Governmentseemed ill-prepared to meet the challengesthat lay at the Nation’s doorstep, paralyzedby a seemingly intractable quandary—howto reverse more than a decade of record-setting, and still rising, budget deficits anda soaring national debt.
In sheer dollars, the Nation had neverseen anything like it. The deficit, whichhad grown to worrisome levels in the mid-to late 1970s, soared in the early 1980s—first to over $100 billion, then quickly toover $200 billion. America faced the prospectof $200 billion deficits ‘‘as far as the eyecould see,’’ in the words of David Stockman,President Reagan’s Budget Director. Overthe next decade, Presidents and Congresses,together or on their own, tried to bringthe deficit under control, but a structuralmismatch between revenues and spendingcontinually out-paced their efforts.
Year after year, the task of cutting thedeficit cast a shadow over domestic, defense,and international policy. In that era, virtuallyevery policy proposal from the Administration,Congress, or the private sector first elicitedthe question, ‘‘How will it affect the deficit?’’The sheer merit of a proposal (e.g., to growthe economy, to address a social problem)often fell victim to Washington’s all-consumingcalculation of short-run cost.
President Clinton understood the need fordeficit reduction, and he exerted the leadershipto get it. But he understood just as clearlythat deficit reduction would not suffice. Whilereducing the deficit, he would also investmore in the skills and training of the Americanpeople, and he would push aggressively toexpand markets for U.S. goods.
The President’s 1993 economic plan, whichhe worked with Congress to enact, wasthe centerpiece of his strategy. It slowedthe growth of entitlements, raised taxes almostentirely on the wealthiest 1.2 percent ofAmericans, and extended the ‘‘caps’’ on discre-tionary spending for five years. It cut taxes
for 15 million working families and made90 percent of small businesses eligible fortax relief. And it began an ongoing effortto invest in education and training andin research in order to boost productivityand, thus, promote higher living standards;to protect the environment and fight crimein order to improve the quality of life forall Americans; and to secure the funds fora global policy that has brought peace tocertain troublespots and expanded marketsfor U.S. goods.
Reaping the Benefits
The three elements of the President’s plan—(1) reducing the deficit; (2) investing inthe future; and (3) opening markets to expandtrade—were never before tried together, andthe strategy met its share of skeptics. Oppo-nents predicted that the deficit would rise,not fall, because the economy would sinkinto recession, or worse. Jobs would disappear,the critics said, while interest rates andinflation would soar.
What happened? All elements of the strategyworked beyond even the Administration’s mostoptimistic hopes. Rather than generate higherdeficits, the plan helped cut the deficit beyondexpectations. Rather than prompt a recession,the plan helped cut interest rates, spurringsteady growth, over 14 million new jobs,record exports, lower unemployment and infla-tion, less poverty, less welfare, and lesscrime.
No element worked better than the first—reducing the deficit. The fiscal shortfall hadhit a record $290 billion in 1992, and theAdministration projected that, without changesin policy, it would hit $347 billion in 1997.The President’s 1993 economic plan was de-signed to reduce the accumulated deficitsover five years by a total of $505 billion.
What neither the Administration nor anyoneelse fully anticipated was how well the econ-omy and economic plan would work together.The plan reassured financial investors, helpingto cut interest rates and, in turn, spurgrowth and jobs. With the economy booming,Federal revenues from corporate and personalincome taxes have far exceeded expectations.And, for the same reason, the Federal Govern-
13II. PREPARING THE NATION FOR A NEW AMERICAN CENTURY
ment has spent less on unemployment andother benefit programs than it anticipated.
Higher-than-expected revenues and lower-than-expected spending closed the deficit gapmore quickly than expected. The 1997 deficitcame in at $22 billion, just 0.3 percentof the Gross Domestic Product (GDP). Indollar terms and as a share of GDP, itwas the lowest deficit in a quarter-century.(For a full discussion of the President’seconomic policy, see Section III, ‘‘Creatinga Bright Economic Future.’’)
Even within the framework of the Presi-dent’s 1993 economic program, with its annual‘‘caps’’ on total discretionary spending andits pay-as-you-go rules for financing newentitlements and tax cuts, the Administrationworked with Congress on significant invest-ments in education and training, the environ-ment, science and technology, law enforcement,and other priorities to help raise the standardof living and quality of life for averageAmericans, both now and in the future.For example:
• The President’s commitment to expandHead Start put 830,000 disadvantagedchildren into the program in 1998, helpingto prepare these children for school andmaking further progress toward the Presi-dent’s goal of putting a million childrenin Head Start by 2002.
• His investments in public schools havehelped States and communities raise aca-demic standards, strengthen accountabil-ity, connect classrooms and schools to theinformation superhighway, and promotepublic school choice by opening over 700charter schools.
• His national service program has enabledover 100,000 Americans to earn money forcollege while helping children to read,working with parents to improve theirkids’ health, creating after-school andsummer programs, patrolling the streets,and performing other vital communitywork.
• His historic investments in higher edu-cation, from his new Hope scholarships tohis record increases in Pell Grants, areensuring that anyone who wants to go tocollege can afford to go.
• His efforts to help older, dislocated work-ers buffeted by economic change have ledto a wider array of Federal retraining ben-efits and services to which workers canmore easily avail themselves.
• His children’s health care initiative, thelargest investment in health care for kidssince Medicaid was created, will providemeaningful benefits to up to five millionuninsured children.
• His investments in the environment haveprotected or restored some of the Nation’smost treasured lands, such as YellowstoneNational Park and the Everglades, pro-vided the funds to conserve others, andaccelerated toxic waste clean-ups.
• His investments in research are helpingto build new high-powered supercomputersand to develop drugs that could extendthe life expectancy of those with HIV andAIDS.
• His COPS program that supports commu-nity policing is putting 83,000 more police(out of 100,000 under the program) on thestreets of America’s communities, helpingto reduce violent crime for five straightyears.
• His investments in distressed urban andrural areas have leveraged billions ofdollars in private investment, createdthousands of jobs, and helped bring com-munities back to life.
Cutting the Size of Government
How could the Administration both cutthe deficit dramatically and invest more inthese and other priorities? Not only by build-ing a strong economy that would boost reve-nues and lower spending on unemploymentand other benefits, but also by cutting unnec-essary or lower-priority spending, and, ledby the Vice President’s National PerformanceReview, by increasing the efficiency and effec-tiveness of our Government.
Since 1993, the Administration has workedwith Congress to limit total discretionaryspending, partly by eliminating hundreds ofprograms and projects. More broadly, in everybudget year of this Administration, totalspending has equaled a smaller share of
14 THE BUDGET FOR FISCAL YEAR 1999
1 The plan describes the Administration’s commitment to fiscal,management, and program performance. Thus, it includes thefollowing sections of this budget—Section III, ‘‘Creating a BrightEconomic Future’’; Section IV, ‘‘Improving Performance ThroughBetter Management’’; and Section VI, ‘‘Investing in the CommonGood: Program Performance in Federal Functions.’’
GDP than in any year of the previoustwo Administrations and, in 1999, spendingwill drop to 20.0 percent of GDP, its lowestlevel since the early 1970s. The Administrationhas cut the size of the Federal civilianwork force by over 316,000 people, creatingthe smallest work force in 35 years and,as a share of total civilian employment,the smallest since 1931.
The Administration, however, is workingto create not just a smaller Government,but a better one, a Government that bestprovides services and benefits to its ultimatecustomers—the American people. It has notjust cut the Federal work force, it hasstreamlined layers of bureaucracy. It hasnot just reorganized headquarters and fieldoffices, it has ensured that those closestto the customers can best serve them.
To be sure, the job is not over. For1999, the Administration once again is turningits efforts to the next stage of ‘‘reinventing’’the Federal Government. It plans to dramati-cally overhaul 32 Federal agencies to improvekey services, such as improving student loanprocessing and speeding aid to disaster vic-tims. It also plans to tackle critical challenges,such as ensuring that Government computerscan process the year 2000 date change andmaking more Government services availableelectronically. (For a full discussion of theAdministration’s management agenda, see Sec-tion IV, ‘‘Improving Performance ThroughBetter Management.’’)
Under the 1993 Government Performanceand Results Act, Cabinet departments andagencies have prepared individual performanceplans that they will send to Congress withthe performance goals they plan to meetin 1999. These plans, in turn, form thebasis for the first Government-wide perform-ance plan, which the Administration is sendingCongress along with this budget. 1
Reaching Balance While Investing in theFuture
Though the 1993 President’s economic planhad exceeded all expectations in restoringthe Nation’s fiscal health, the task of reachingbalance would require one final push. Thatwould come with the historic 1997 BalancedBudget Act (BBA), on which the Presidentand Congress agreed last summer.
Along with saving $247 billion over fiveyears, the Act also extended the solvencyof Medicare’s trust fund for at least 10years while providing for the largest invest-ment in higher education since the G.I.Bill in 1945, the largest investment in chil-dren’s health care since the creation of Medic-aid in 1965, and a $500-per-child tax creditfor about 27 million working families. Italso provided tax incentives to restore dis-tressed urban and rural neighborhoods,launched a $3 billion Welfare-to-Work jobsinitiative, and restored health and disabilitybenefits to elderly and disabled legal immi-grants.
While implementing the BBA, this budgetbuilds on the President’s efforts to investin the skills of the American people. Thus,it continues the President’s policy of helpingworking families with their basic needs—raising their children, sending them to college,and paying for health care. It also investsin education and training, the environment,science and technology, law enforcement, andother priorities to help raise the standardof living and quality of life of average Ameri-cans.
Within tight constraints, the President pro-poses major initiatives that will continuehis investments in high-priority areas—fromhelping working families with their childcare expenses to allowing Americans from55 to 65 to buy into Medicare; from helpingStates and school districts recruit and preparethousands more teachers and build thousandsmore classrooms to addressing the world-wide problem of global warming. The budgetpays for every initiative—in the President’swords, ‘‘line by line, dime by dime.’’
15II. PREPARING THE NATION FOR A NEW AMERICAN CENTURY
Families and Children: For five years, thePresident has sought to help working familiesbalance the demands of work and family, andhe proposes a major effort to make child caremore affordable, accessible, and safe. His ChildCare Initiative provides tax breaks to helpfamilies pay for care; tax incentives to helpbusinesses create or expand child care facili-ties; direct subsidies for over two million pooror near-poor children; increased funding forbefore- and after-school programs; and fundsto help States enforce safety and quality, totrain child care staff, to promote early child-hood development, and to improve the healthof young children in child care. Also to helpworking families, the President proposes taxincentives to encourage small businesses tocreate pension plans for more workers.
Health Care: The President has workedhard to expand health care coverage and im-prove the Nation’s health. The budget givesnew insurance options to hundreds of thou-sands of Americans aged 55 to 65 and proposesnew initiatives to ensure that as many unin-sured children as possible are covered. In addi-tion, it provides for unprecedented investmentsin biomedical research at the National Insti-tutes of Health; advocates bipartisan nationallegislation that would reduce tobacco useamong the young; expands access to new AIDStherapies through the Ryan White program;enables more Medicare recipients to receivepromising cancer treatments by participatingmore easily in ‘‘clinical trials’’; expands sub-stance abuse prevention and treatment activi-ties; and enhances food safety. The budget alsofunds full participation in the Special Supple-mental Nutrition Program for Women, Infants,and Children (WIC), which will provide bene-fits to 7.5 million people by the end of 1999.
Education and Training: The Presidenthas worked to enhance access to, and the qual-ity of, education and training. The budgettakes the next step—helping States and schooldistricts to reduce class size by recruiting andpreparing thousands more teachers and tobuild thousands more classrooms; and creatingnew Education Opportunity Zones to provideneeded support for high-poverty, low-achievingurban and rural districts while holding themaccountable to boost student achievement. Thebudget also proposes to move further towardthe President’s commitment to put a million
disadvantaged children in Head Start by 2002;begin field testing voluntary national tests;mobilize and train reading tutors for children;help parents, teachers, and communities createmore charter schools that are free of mostState regulations; integrate technology into theclassroom as we connect every classroom tothe Internet; enable more Americans to servetheir communities and earn money for college;expand college work-study to a million stu-dents; make it easier for parents and studentsto borrow and repay college loans; raise themaximum Pell Grant college scholarship to itshighest level ever; expand assistance to work-ers dislocated as a result of global trade andtechnological change; increase G.I. bill edu-cational benefits for veterans; and expand re-sources for veterans who lose their jobs.
The Environment: The Administration,which helped engineer the global agreementin Kyoto to address climate change, proposesto launch the U.S. effort with tax incentivesand spending that will spur energy efficiencyand help develop low-carbon emission energysources. The proposal includes incentives forbuying new, highly fuel-efficient cars; forinvesting in energy-saving equipment for com-mercial and residential buildings; for commut-ing by public transit or vanpool; and for devel-oping innovative energy generation techniques,such as biomass, wind, and photovoltaics. Thebudget also would restore and rehabilitatenational parks, forests, and public lands andfacilities; expand efforts to restore and protectthe water quality of rivers and lakes; continueefforts to double the pace of Superfund clean-ups; extend the Brownfields initiative to pro-mote local cleanup and redevelopment; betterprotect endangered species; continue to restoreFlorida’s Everglades and California’s Bay-Delta and protect Yellowstone National Parkand California’s Headwaters Forest; improvethe roads through national parks; and expandthe public’s access to information about envi-ronmental conditions in their neighborhoods.
Research: The President has sought to tapthe full potential of our boundless future byinvesting heavily in basic and applied re-search. Along with increasing funds for bio-medical research at the National Institutes ofHealth, the budget would promote science andengineering research at the National ScienceFoundation; support space-related activities
16 THE BUDGET FOR FISCAL YEAR 1999
that enhance our knowledge of Earth; investin Federal-private ventures to more quickly de-velop cutting-edge technologies that createjobs; strengthen university-based research; in-vest in environmental research on safe foodand clean air and water; expand support forenergy efficiency and renewable energy pro-grams; enable Americans to travel more safely,more quickly, and more efficiently; and putcommercial industry’s technical know-how andeconomies of scale to work for nationaldefense.
Innovating to Invest
Challenging times demand innovative solu-tions, and the budget meets the challengeby proposing three new investment fundsfor America—for research, the environment,and transportation—that will focus attentionon these critical priorities. Together, thefunds provide $75.5 billion, a $4.7 billionincrease over the 1998 level for the programsthey contain. Because the funds rely onbudget offsets to help finance the spending,they, in effect, apply pay-as-you-go principlesto discretionary spending.
The funds are:
• The Research Fund for America, which in-cludes a broad range of investments inknowledge, including programs of theNational Institutes of Health, the Centersfor Disease Control and Prevention, theNational Science Foundation, the NationalAeronautics and Space Administration, theEnergy Department, the Commerce De-partment’s National Institute of Standardsand Technology, Agriculture Departmentresearch programs, the multi-agency Cli-mate Change Technology Initiative, andother programs. The budget finances thisFund, in part, through receipts from to-bacco legislation and savings in mandatoryprograms.
• The Environmental Resources Fund forAmerica, which encompasses the multi-agency Clean Water Initiative; the newLand, Water, and Facility Restoration Ini-tiative of the Interior and Agriculture De-partments; the Agriculture Department’swater and wastewater program for ruralcommunities; and the Environmental Pro-tection Agency’s programs for cleaning up
hazardous waste sites (within the Super-fund) and upgrading clean water and safedrinking water infrastructure. The budgetfinances the Fund, in part, through an ex-tension of Federal taxes that support theSuperfund.
• The Transportation Fund for America,which includes the Transportation Depart-ment’s highway, highway safety, and tran-sit programs; the Flight 2000 free flightdemonstration program; and the FederalAviation Administration’s programs, in-cluding Airport Grants. The budget fi-nances the Fund, in part, through a newFederal aviation user fee.
Looking Ahead
In policy-making terms, the fiscal groundhas shifted dramatically in Washington. Nolonger will the deficit hover like a darkcloud over all debate and decisions. No longerwill it serve as a symbol of fiscal incompetence.No longer will it sap the public’s confidencein its national leaders.
Five years into this Administration, theNation has turned the corner. A budgetthat was out of control is now headed towardbalance while investing in the American peopleand reflecting their values. As a result,an economy that was adrift is now strong,with the fundamentals in place to heraldan era of continuing prosperity. A Governmentthat lacked direction is now focused on provid-ing better service, more efficiently, at lowercost.
To be sure, challenges remain on thefiscal front. For one thing, the path tobalance is predicated on a continued adherenceto budget discipline, as framed first by the1993 economic program and, more recently,by the BBA. For another, the challengeof ensuring the financial solvency of SocialSecurity and Medicare, on which tens ofmillions of Americans rely, stands not toofar into the future.
In the public and private sectors, meanwhile,prospects for a budget surplus are spurringa wide array of ideas about how to useit. At this point, the Government has notyet reached the surplus milestone, and the

17II. PREPARING THE NATION FOR A NEW AMERICAN CENTURY
President believes strongly that ‘‘we shouldnot spend a surplus that we don’t yet have.’’
More specifically, he believes the Adminis-tration and Congress should not spend abudget surplus for any purpose until we
have a solution to the long-term financingchallenge facing Social Security. With thatin mind, the budget proposes a reserve forthe projected surpluses for the years 1999and beyond.


19
III. CREATING A BRIGHTECONOMIC FUTURE

21
1 Over 20 years ago, economist Arthur Okun developed the con-cept of a ‘‘misery index,’’ calculated by adding together the unem-ployment rate and the rate of inflation, as measured by theConsumer Price Index.
III. CREATING A BRIGHT ECONOMICFUTURE
There is no doubt that the economic strategy we put in place in 1993 created the conditions forthe extraordinary private sector growth we have all witnessed . . . Four straight years of deficitcuts have produced the economic expansion as well as real benefits for ordinary Americans: lowercar payments, lower mortgage rates, lower credit card rates. This balanced budget will close achapter in American history: years—decades in fact—when our people doubted whether Govern-ment could work for them and questioned whether our Nation could set and meet goals.
President ClintonAugust 1997
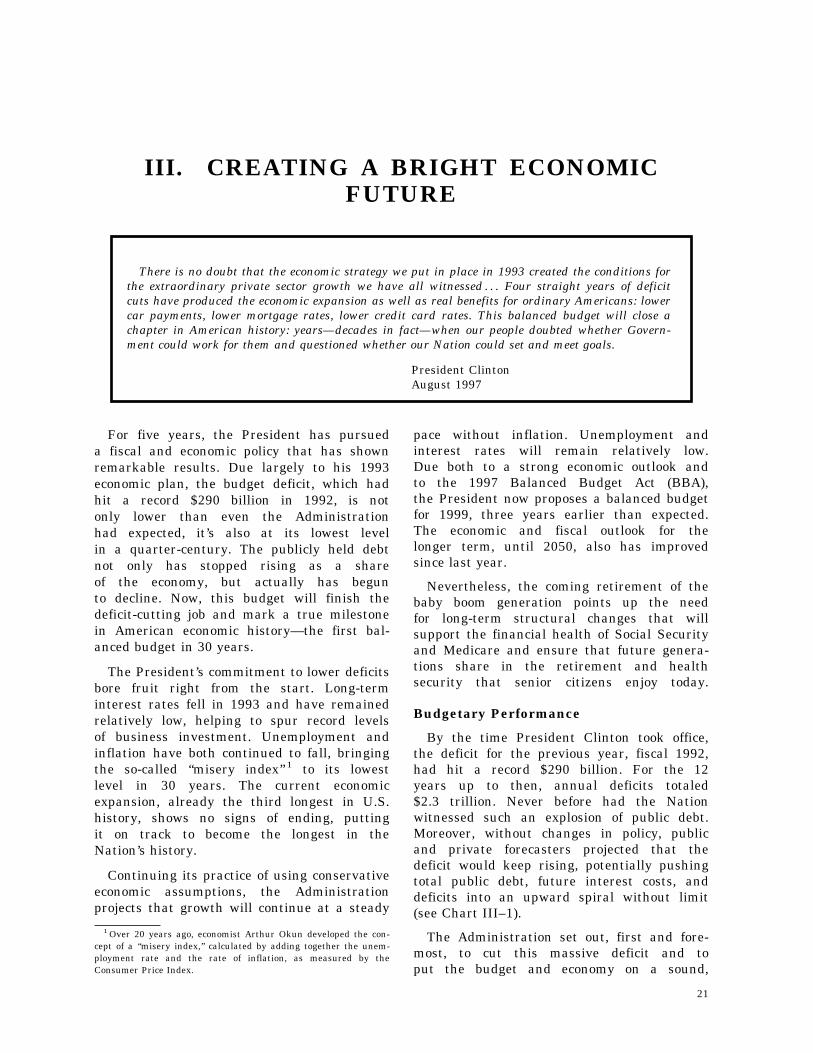
For five years, the President has pursueda fiscal and economic policy that has shownremarkable results. Due largely to his 1993economic plan, the budget deficit, which hadhit a record $290 billion in 1992, is notonly lower than even the Administrationhad expected, it’s also at its lowest levelin a quarter-century. The publicly held debtnot only has stopped rising as a shareof the economy, but actually has begunto decline. Now, this budget will finish thedeficit-cutting job and mark a true milestonein American economic history—the first bal-anced budget in 30 years.
The President’s commitment to lower deficitsbore fruit right from the start. Long-terminterest rates fell in 1993 and have remainedrelatively low, helping to spur record levelsof business investment. Unemployment andinflation have both continued to fall, bringingthe so-called ‘‘misery index’’ 1 to its lowestlevel in 30 years. The current economicexpansion, already the third longest in U.S.history, shows no signs of ending, puttingit on track to become the longest in theNation’s history.
Continuing its practice of using conservativeeconomic assumptions, the Administrationprojects that growth will continue at a steady
pace without inflation. Unemployment andinterest rates will remain relatively low.Due both to a strong economic outlook andto the 1997 Balanced Budget Act (BBA),the President now proposes a balanced budgetfor 1999, three years earlier than expected.The economic and fiscal outlook for thelonger term, until 2050, also has improvedsince last year.
Nevertheless, the coming retirement of thebaby boom generation points up the needfor long-term structural changes that willsupport the financial health of Social Securityand Medicare and ensure that future genera-tions share in the retirement and healthsecurity that senior citizens enjoy today.
Budgetary Performance
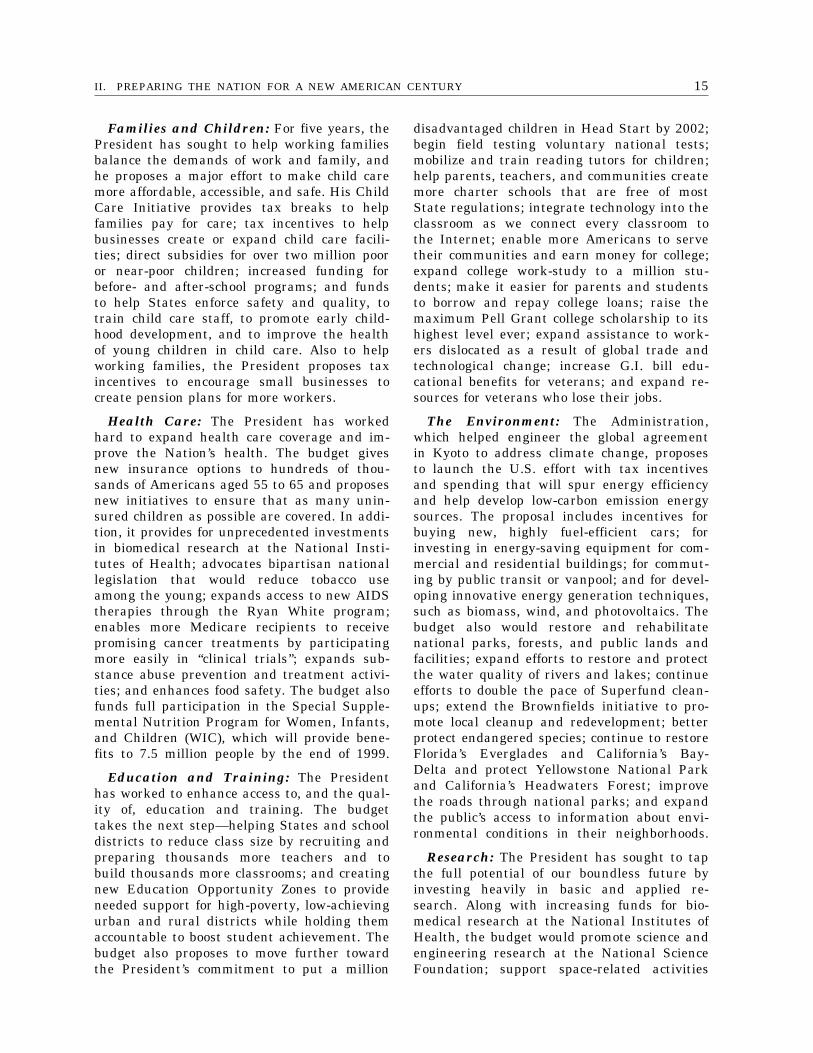
By the time President Clinton took office,the deficit for the previous year, fiscal 1992,had hit a record $290 billion. For the 12years up to then, annual deficits totaled$2.3 trillion. Never before had the Nationwitnessed such an explosion of public debt.Moreover, without changes in policy, publicand private forecasters projected that thedeficit would keep rising, potentially pushingtotal public debt, future interest costs, anddeficits into an upward spiral without limit(see Chart III–1).
The Administration set out, first and fore-most, to cut this massive deficit and toput the budget and economy on a sound,
22 THE BUDGET FOR FISCAL YEAR 1999
1980 1982 1984 1986 1988 1990 1992 1994 1996 1998 2000 2002
-700
-600
-500
-400
-300
-200
-100
0
100
SURPLUS (+) / DEFICITS (-) IN BILLIONS OF DOLLARS
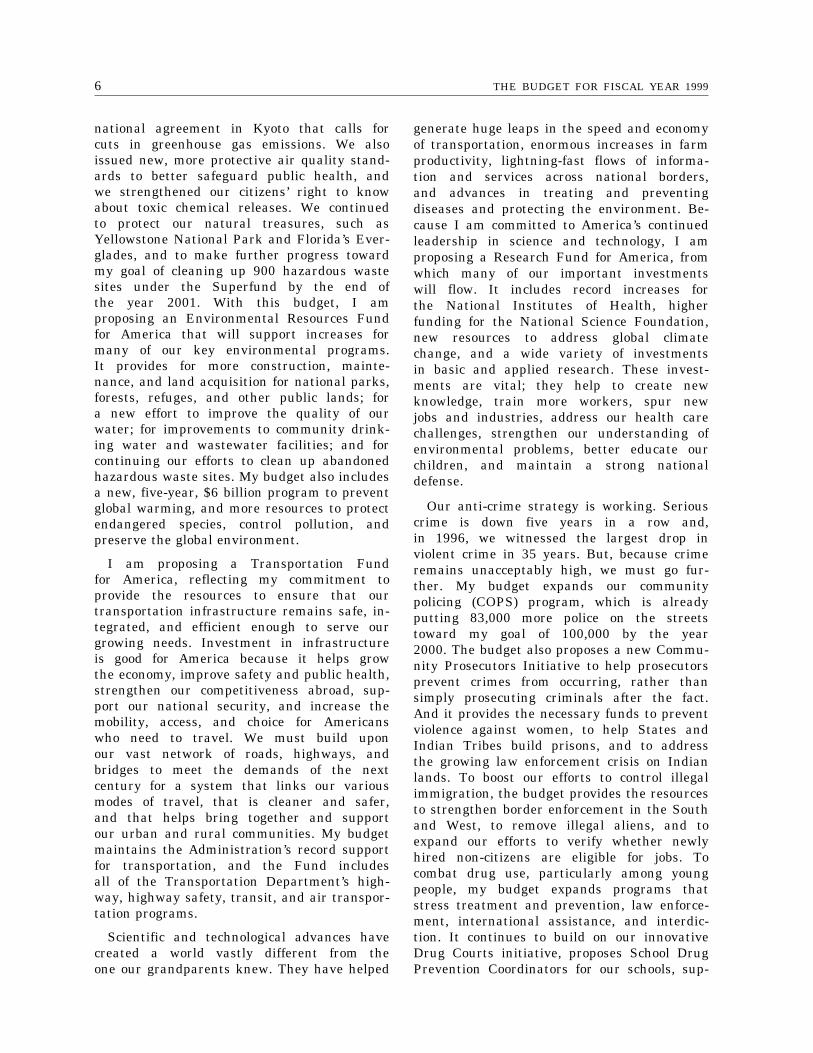
Chart III-1. FINISHING THE JOB:BALANCING THE BUDGET AFTER DECADES OF DEFICITS
ACTUALS
TOTAL DEFICITS $3.1 TRILLION
TOTAL SAVINGS $4.0 TRILLION
$74BDEFICIT
$633BDEFICIT
$290BDEFICIT
PRE-OBRA BASELINE
RESERVEPENDING SOCIAL
SECURITY REFORM
sustainable footing. To that end, the Presidentproposed, and Congress enacted, the OmnibusBudget Reconciliation Act (OBRA) in 1993as a solid first step toward fiscal responsibility.It has proved to be much more. In thelast four years, cumulative deficits and accu-mulating debt have fallen more than twiceas much as the Administration had conserv-atively projected.
Still, OMB and the Congressional BudgetOffice (CBO) agreed that the deficit wouldbegin rising again without further action.Consequently, the President worked with Con-gress to finish the job, enacting the BBAin mid-1997 with the goal of reaching balancein 2002. The Administration now proposesa balanced budget in 1999. In addition,the Administration projects that, together,OBRA and the BBA will reduce the totaldeficits from 1993 to 2003 by $4.0 trillion—more than the deficits that the Governmentaccumulated from 1981 to 1992.
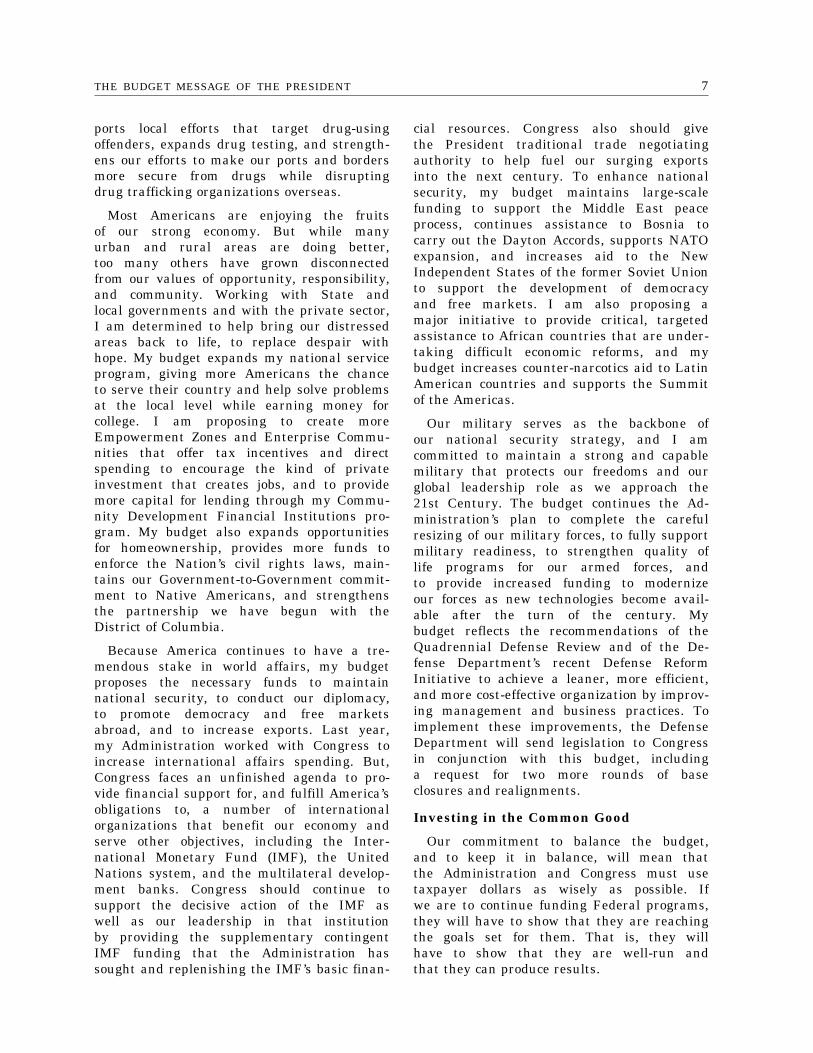
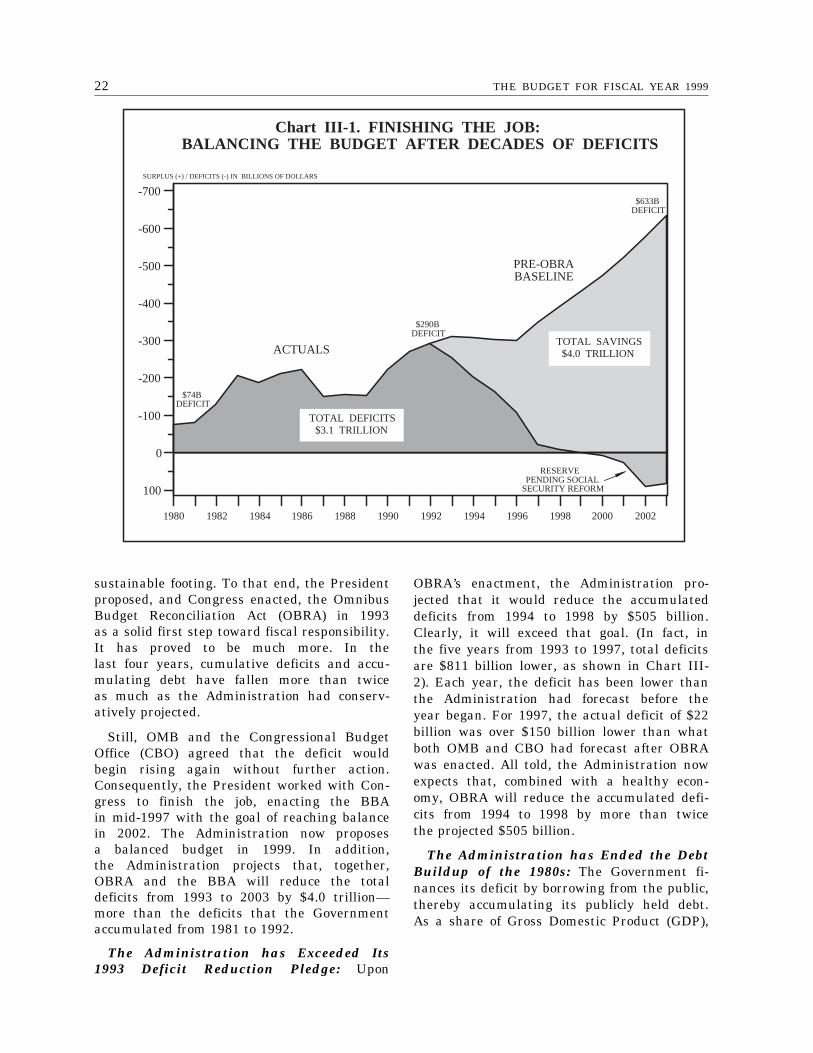
The Administration has Exceeded Its1993 Deficit Reduction Pledge: Upon
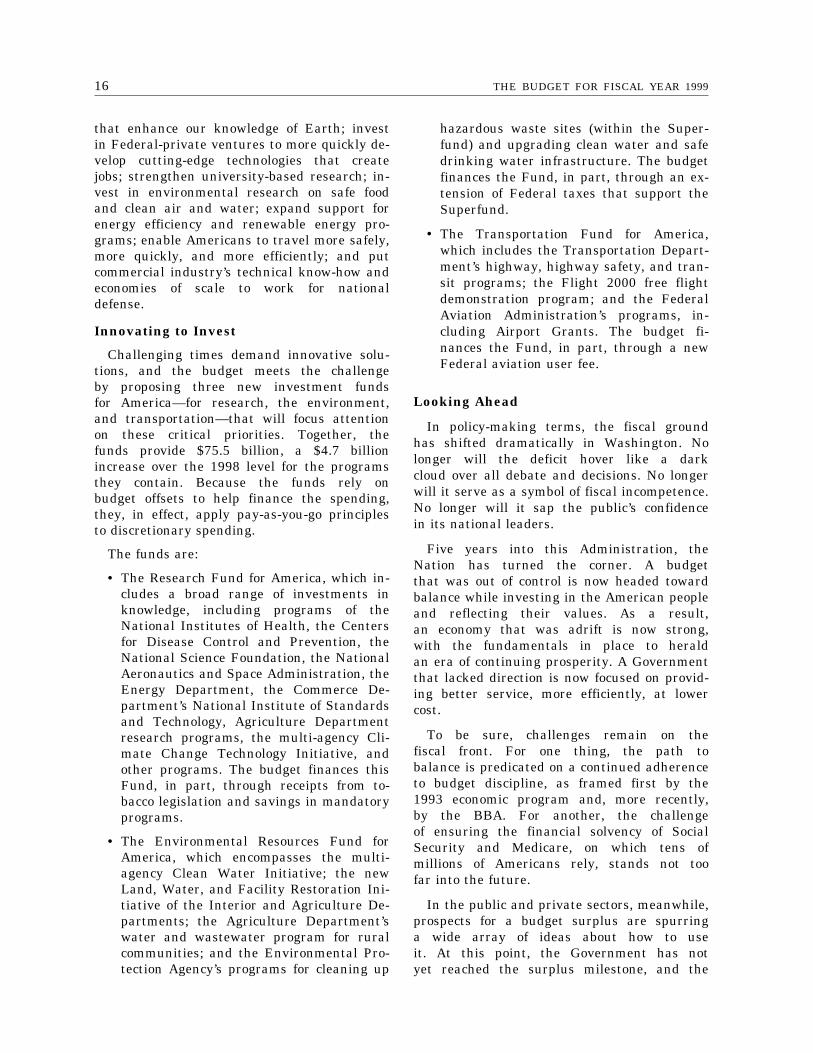
OBRA’s enactment, the Administration pro-jected that it would reduce the accumulateddeficits from 1994 to 1998 by $505 billion.Clearly, it will exceed that goal. (In fact, inthe five years from 1993 to 1997, total deficitsare $811 billion lower, as shown in Chart III-2). Each year, the deficit has been lower thanthe Administration had forecast before theyear began. For 1997, the actual deficit of $22billion was over $150 billion lower than whatboth OMB and CBO had forecast after OBRAwas enacted. All told, the Administration nowexpects that, combined with a healthy econ-omy, OBRA will reduce the accumulated defi-cits from 1994 to 1998 by more than twicethe projected $505 billion.
The Administration has Ended the DebtBuildup of the 1980s: The Government fi-nances its deficit by borrowing from the public,thereby accumulating its publicly held debt.As a share of Gross Domestic Product (GDP),
23III. CREATING A BRIGHT ECONOMIC FUTURE
1992 1993 1994 1995 1996 1997
-350
-300
-250
-200
-150
-100
-50
0
CLINTONACHIEVEMENT
PRE-OBRA BASELINE
-$290
-$255
-$310 -$305 -$302 -$298
-$203
-$164
-$107
Chart III-2. REDUCING THE DEFICIT: THE CLINTON RECORD
DOLLARS IN BILLIONS
-$22
-$347
TOTAL DEFICITREDUCTION:$811 BILLION
2 This measure excludes debt held in Federal trust funds. At theend of 1997, the trust funds held over $1.5 trillion of debt that theFederal Government owes to itself. Thus, such debt is both a Gov-ernment asset and a liability.
3 The G–7 comprises the world’s seven largest industrial powers:the United States, the United Kingdom, Germany, France, Japan,Italy, and Canada.
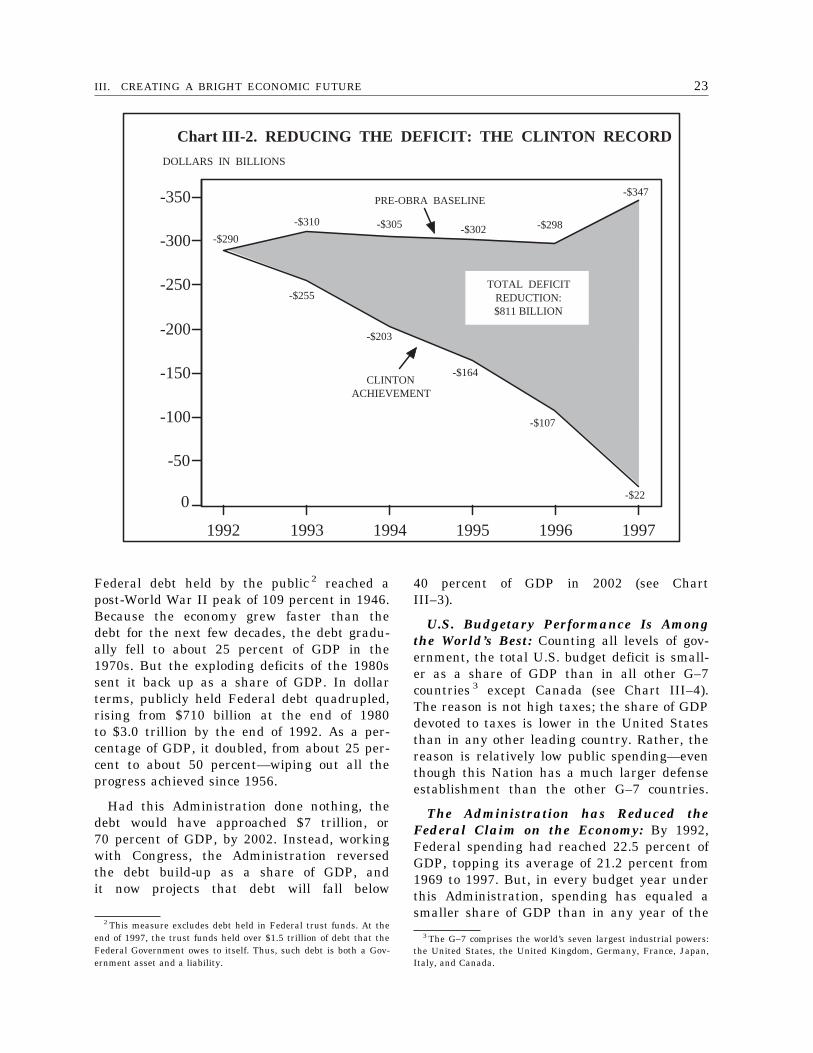
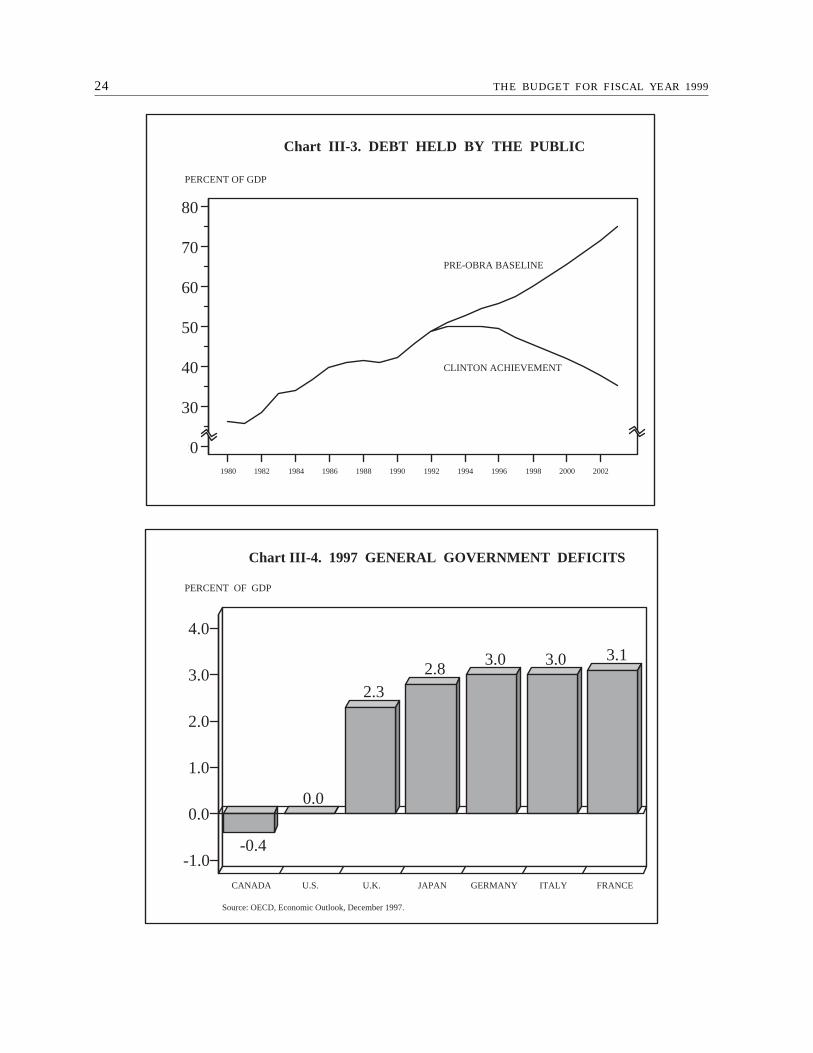
Federal debt held by the public 2 reached apost-World War II peak of 109 percent in 1946.Because the economy grew faster than thedebt for the next few decades, the debt gradu-ally fell to about 25 percent of GDP in the1970s. But the exploding deficits of the 1980ssent it back up as a share of GDP. In dollarterms, publicly held Federal debt quadrupled,rising from $710 billion at the end of 1980to $3.0 trillion by the end of 1992. As a per-centage of GDP, it doubled, from about 25 per-cent to about 50 percent—wiping out all theprogress achieved since 1956.
Had this Administration done nothing, thedebt would have approached $7 trillion, or70 percent of GDP, by 2002. Instead, workingwith Congress, the Administration reversedthe debt build-up as a share of GDP, andit now projects that debt will fall below
40 percent of GDP in 2002 (see ChartIII–3).
U.S. Budgetary Performance Is Amongthe World’s Best: Counting all levels of gov-ernment, the total U.S. budget deficit is small-er as a share of GDP than in all other G–7countries 3 except Canada (see Chart III–4).The reason is not high taxes; the share of GDPdevoted to taxes is lower in the United Statesthan in any other leading country. Rather, thereason is relatively low public spending—eventhough this Nation has a much larger defenseestablishment than the other G–7 countries.
The Administration has Reduced theFederal Claim on the Economy: By 1992,Federal spending had reached 22.5 percent ofGDP, topping its average of 21.2 percent from1969 to 1997. But, in every budget year underthis Administration, spending has equaled asmaller share of GDP than in any year of the
24 THE BUDGET FOR FISCAL YEAR 1999
1980 1982 1984 1986 1988 1990 1992 1994 1996 1998 2000 2002
20
30
40
50
60
70
80
PERCENT OF GDP
Chart III-3. DEBT HELD BY THE PUBLIC
PRE-OBRA BASELINE
CLINTON ACHIEVEMENT
-0.4
0.0
2.32.8
3.0 3.0 3.1
CANADA U.S. U.K. JAPAN GERMANY ITALY FRANCE
-1.0
0.0
1.0
2.0
3.0
4.0
PERCENT OF GDP
Chart III-4. 1997 GENERAL GOVERNMENT DEFICITS
Source: OECD, Economic Outlook, December 1997.
25III. CREATING A BRIGHT ECONOMIC FUTURE
4 According to the December Blue Chip survey.5 The structural deficit is the deficit that remains after account-
ing for cyclical changes in the economy as well as purely temporaryfactors, such as the annual costs and receipts from resolving thethrift crisis.
previous two Administrations. The Administra-tion now projects that, by 1999, spending willfall to 20.0 percent of GDP, its lowest levelsince the early 1970s.
Federal Receipts are Higher than Pro-jected, Mainly Due to Economic Growth:In the past five years, spending has beenlower, and receipts higher, than the Adminis-tration had projected, leading to lower deficitsthan projected. With regard to the most recent,and quite extraordinary, fall in the deficit from$107 billion in 1996 to just $22 billion in 1997,the answer lies in a continuing surge in re-ceipts and in spending that came in below ex-pectations. That surge is rooted in an espe-cially strong economy. Tax rates have re-mained constant since 1993.
Some economists predicted that the 1993targeted tax rate increases on the top 1.2percent of Americans would slow the economyand actually lead to lower tax collections,particularly among the well-to-do. In fact,tax revenues have soared since 1993—andthe largest increases have come at the top.Total Federal receipts have risen nearly eightpercent a year since 1992. Federal incometax revenues rose by nearly 25 percent from1992 to 1995 (the last year for which wehave data), but by nearly 50 percent forthose with incomes above $200,000.
The President’s balanced budget for 1999results from a drop in spending of 2.5percent of GDP since 1992 and an increasein revenues of 2.3 percent of GDP overthe same period, driven by economic growth.Thus, 52 percent of the total deficit reductionhas come from spending cuts, 48 percentfrom higher receipts.
Economic Performance
By reducing the Federal Government’s de-mand for capital in the financial markets,a falling deficit has freed capital for privateinvestment. At the same time, the promiseof future budgetary stability has promotedbusiness confidence. The fiscal improvementhas enabled the Federal Reserve to maintainlow, stable interest rates that, in turn, havehelped prolong and strengthen the economicexpansion. The surge in business investmentof the last five years shows that thesepolicies are working, and as the budget
reaches balance, prospects for continued eco-nomic progress are excellent.
The Current Expansion Is the ThirdLongest: In January 1998, the economy re-corded its 82nd straight month of growth,marking the third longest expansion in U.S.history (and the second longest in our peace-time history). If the economy continues to growthrough the end of 1998, the current expansionwill become the longest in peacetime history,surpassing that of the 1980s. If it continuesto grow until February 2000, as most privateforecasters expect,4 the expansion will becomethe longest of all time, surpassing the 106-month expansion of the 1960s.
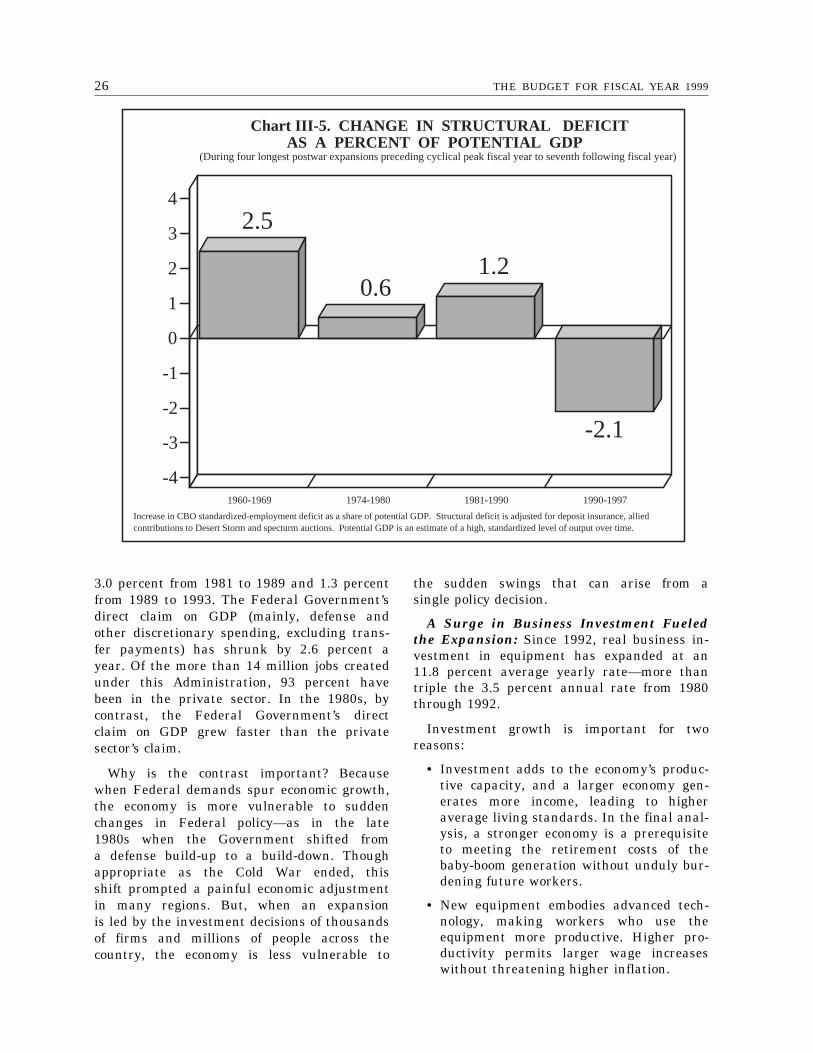
The Administration’s Fiscal Policy HasPromoted a Sound Expansion: Unsustain-able Federal deficits, in part, stimulated bothof the longer post-war expansions—the first inthe 1960s, the second in the 1980s (see ChartIII–5). The economy expanded because theGovernment expanded, dragging the privatesector along; when the Government removedits stimulus, the economy faltered.
In these earlier expansions, the fiscal stimu-lus came at different times. In the 1960s,the deficit was quite restrained early inthe decade, but grew sharply after 1965.In the early 1980s, the ‘‘structural deficit’’ 5
soared to almost five percent of GDP. Thatlarge deficit helped pull the economy outof the deep recession of 1981–1982, butthe Government’s subsequent failure to curbit held up real interest rates, led to thefinancial problems that marked the end ofthe decade, and helped bring on the recessionof 1990–1991.
In contrast, during the current expansion,the deficit has been shrinking and privateinvestment has propelled the economy forward.
This Expansion is Led by a Strong Pri-vate Sector: Under this Administration, theeconomy has grown at a healthy, inflation-adjusted 3.0 percent a year. But, at least asimportant, private demand for goods and serv-ices has grown even faster than the economyas a whole—3.6 percent a year compared to
26 THE BUDGET FOR FISCAL YEAR 1999
1960-1969 1974-1980 1981-1990 1990-1997
-4
-3
-2
-1
0
1
2
3
4
Chart III-5. CHANGE IN STRUCTURAL DEFICITAS A PERCENT OF POTENTIAL GDP
(During four longest postwar expansions preceding cyclical peak fiscal year to seventh following fiscal year)
Increase in CBO standardized-employment deficit as a share of potential GDP. Structural deficit is adjusted for deposit insurance, allied contributions to Desert Storm and specturm auctions. Potential GDP is an estimate of a high, standardized level of output over time.
2.5
0.61.2
-2.1
3.0 percent from 1981 to 1989 and 1.3 percentfrom 1989 to 1993. The Federal Government’sdirect claim on GDP (mainly, defense andother discretionary spending, excluding trans-fer payments) has shrunk by 2.6 percent ayear. Of the more than 14 million jobs createdunder this Administration, 93 percent havebeen in the private sector. In the 1980s, bycontrast, the Federal Government’s directclaim on GDP grew faster than the privatesector’s claim.
Why is the contrast important? Becausewhen Federal demands spur economic growth,the economy is more vulnerable to suddenchanges in Federal policy—as in the late1980s when the Government shifted froma defense build-up to a build-down. Thoughappropriate as the Cold War ended, thisshift prompted a painful economic adjustmentin many regions. But, when an expansionis led by the investment decisions of thousandsof firms and millions of people across thecountry, the economy is less vulnerable to
the sudden swings that can arise from asingle policy decision.
A Surge in Business Investment Fueledthe Expansion: Since 1992, real business in-vestment in equipment has expanded at an11.8 percent average yearly rate—more thantriple the 3.5 percent annual rate from 1980through 1992.
Investment growth is important for tworeasons:
• Investment adds to the economy’s produc-tive capacity, and a larger economy gen-erates more income, leading to higheraverage living standards. In the final anal-ysis, a stronger economy is a prerequisiteto meeting the retirement costs of thebaby-boom generation without unduly bur-dening future workers.
• New equipment embodies advanced tech-nology, making workers who use theequipment more productive. Higher pro-ductivity permits larger wage increaseswithout threatening higher inflation.
27III. CREATING A BRIGHT ECONOMIC FUTURE
1961 1964 1967 1970 1973 1976 1979 1982 1985 1988 1991 1994 1997
0
2
4
6
8
10
12
14
16
18
20
PERCENT
CORE CPI, 12-MO. PERCENT CHANGE
UNEMPLOYMENT RATE
Chart III-6. MISERY INDEX(Unemployment rate plus inflation rate)
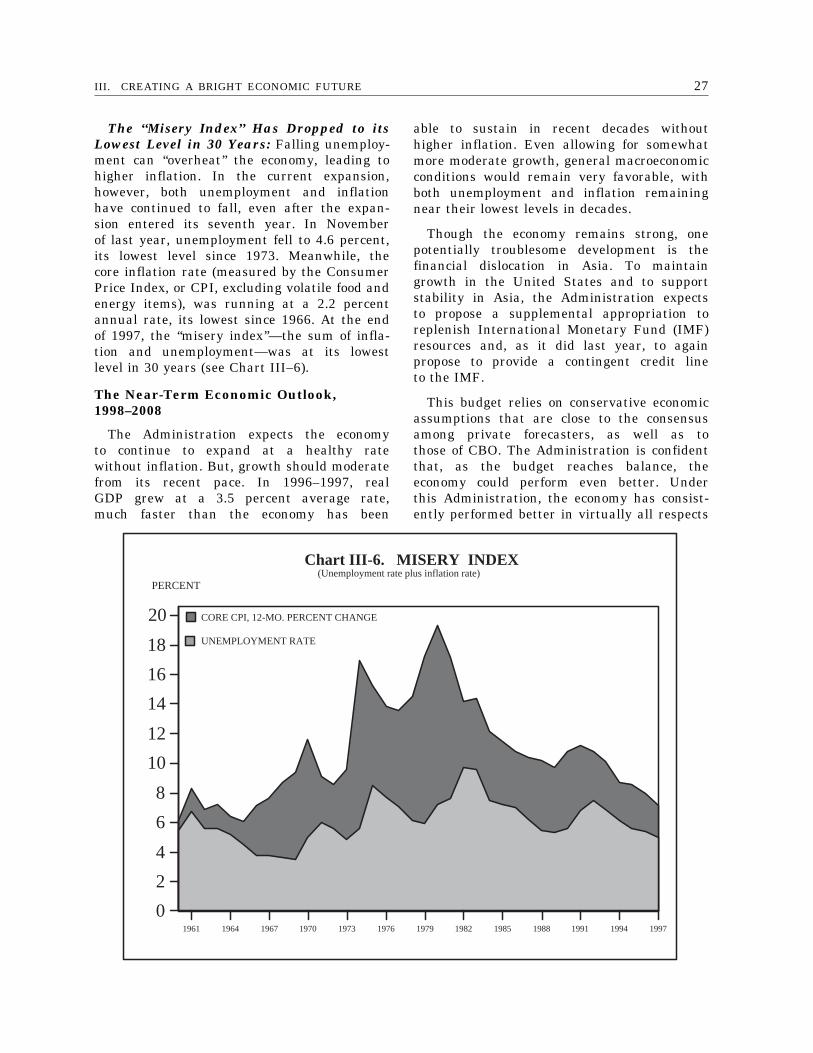
The ‘‘Misery Index’’ Has Dropped to itsLowest Level in 30 Years: Falling unemploy-ment can ‘‘overheat’’ the economy, leading tohigher inflation. In the current expansion,however, both unemployment and inflationhave continued to fall, even after the expan-sion entered its seventh year. In Novemberof last year, unemployment fell to 4.6 percent,its lowest level since 1973. Meanwhile, thecore inflation rate (measured by the ConsumerPrice Index, or CPI, excluding volatile food andenergy items), was running at a 2.2 percentannual rate, its lowest since 1966. At the endof 1997, the ‘‘misery index’’—the sum of infla-tion and unemployment—was at its lowestlevel in 30 years (see Chart III–6).
The Near-Term Economic Outlook,1998–2008
The Administration expects the economyto continue to expand at a healthy ratewithout inflation. But, growth should moderatefrom its recent pace. In 1996–1997, realGDP grew at a 3.5 percent average rate,much faster than the economy has been
able to sustain in recent decades withouthigher inflation. Even allowing for somewhatmore moderate growth, general macroeconomicconditions would remain very favorable, withboth unemployment and inflation remainingnear their lowest levels in decades.
Though the economy remains strong, onepotentially troublesome development is thefinancial dislocation in Asia. To maintaingrowth in the United States and to supportstability in Asia, the Administration expectsto propose a supplemental appropriation toreplenish International Monetary Fund (IMF)resources and, as it did last year, to againpropose to provide a contingent credit lineto the IMF.
This budget relies on conservative economicassumptions that are close to the consensusamong private forecasters, as well as tothose of CBO. The Administration is confidentthat, as the budget reaches balance, theeconomy could perform even better. Underthis Administration, the economy has consist-ently performed better in virtually all respects
28 THE BUDGET FOR FISCAL YEAR 1999
Investing in Economic Statistics
Our democracy and economy demand that public and private leaders have unbiased, relevant,accurate, and timely information on which to base their decisions. But rapid changes in theeconomy and society, and funding levels that do not enable statistical agencies to keep pace withthem, increasingly threaten the relevance and accuracy of America’s key statistics.
Economic data, in particular, are not only key indicators for fiscal and monetary policy; theyalso underlie Federal, State, and local income projections, investment planning, and businessdecisions. In recent years, active public debate has focused on the measuring of GDP, CPI, andmany other indicators that are widely used, explicitly and implicitly, in public and privatedecision-making. Small but essential investments to address these measurement issues willallow our statistical system to track the economy more accurately and, in the process, help bothGovernment and the private sector better allocate their limited resources.
The budget proposes such carefully targeted investments, ranging from improvements in data(including statistics on service industries, construction, and State and local government), to thedevelopment of more accurate summary statistics from those data (such as GDP and theNational and Personal Income estimates), to greater public access to Government data (includ-ing electronic distribution). These initiatives are documented in greater detail in Chapter 11 ofAnalytical Perspectives, ‘‘Strengthening Federal Statistics.’’
than the Administration or CBO had projected.But, for budget planning, the Administrationcontinues to believe it is prudent to useconservative economic assumptions, the high-lights of which include:
Real GDP: Real GDP growth averages2.0 percent on a fourth-quarter-over-fourth-quarter basis through 2000. For 2001 to2007, growth averages 2.4 percent a year,the Administration’s estimate of potentialsustained real growth. Starting in 2008, pro-jected economic growth slows due to theshifting composition of the population. AsAmericans age, a smaller portion of themwill likely be in the workforce. The Adminis-tration expects the resulting slowdown inthe growth of hours worked to lower realGDP growth.
Unemployment: The civilian unemploymentrate rises gradually, from 4.9 percent in1998 to 5.4 percent in 2001, which is theAdministration’s conservative estimate of thethreshold level of unemployment consistentwith stable inflation in the long run.
Inflation: The CPI rises 2.2 percent in1998–1999, then 2.3 percent a year in thefollowing years. These projections include tech-nical improvements in measuring the CPI.The price index for GDP rises 2.0 percentin 1998, 2.1 percent in 1999, and 2.2 percentin the following years. The gap betweenthe two measures of inflation, which has
been larger in the past, narrows due torecent and expected methodological improve-ments in both indexes. Without these improve-ments, measured inflation would rise slightlymore.
Interest rates: Interest rates, already lowerthan a year ago, remain below levels ofrecent years as the budget approaches balance.The yield on 10-year Treasury notes reaches5.7 percent by 2001; on a discount basis,the 91-day Treasury bill rate drops to 4.7percent.
The Administration does not try to projectthe business cycle beyond the next yearor so. The expansion will surely end atsome point, though no signs of a downturnhave emerged. But even allowing for futurerecessions, projected economic growth averages2.4 percent from 2001–2007, and projectedunemployment averages about 5.4 percent.In some years, growth will be faster andunemployment lower, while in others, growthand employment will fall short of theseprojections. But, because the Administrationexpects the growth and unemployment as-sumptions to hold on average over this period,they provide a sound, prudent basis forprojecting the budget. Similarly, the Adminis-tration expects inflation and interest ratesto average near the projections shown inTable III–1, although year-to-year fluctuationssurely will occur.
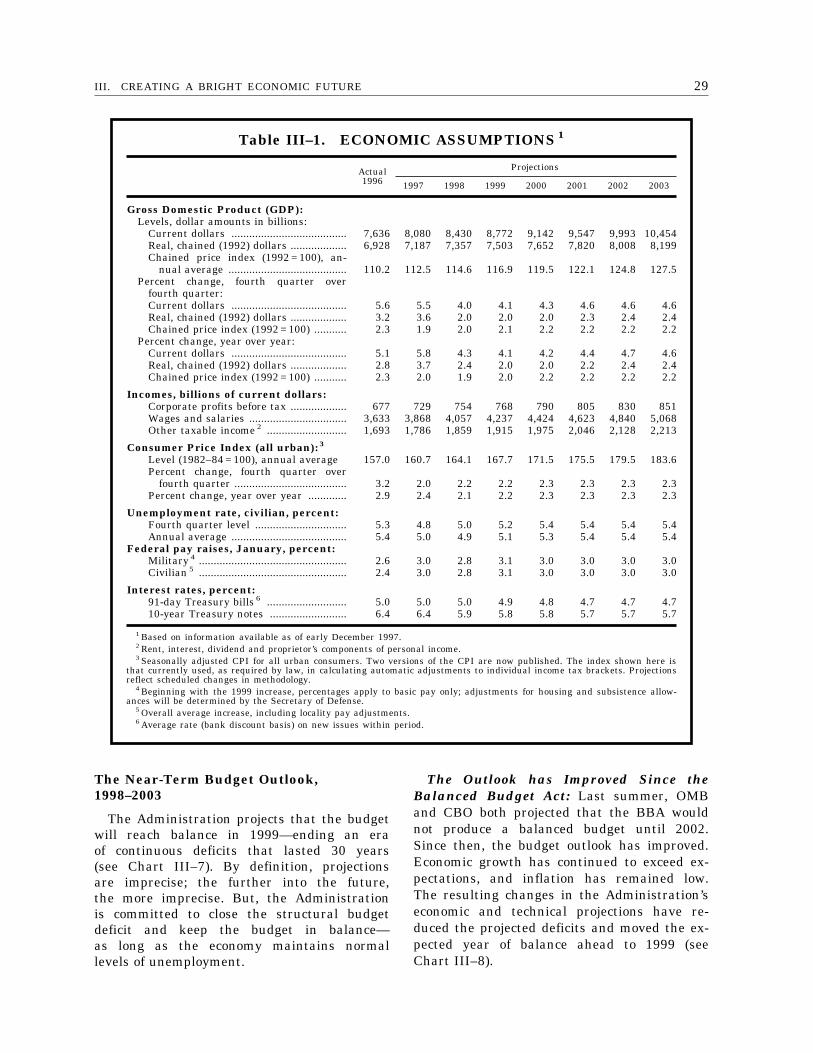
29III. CREATING A BRIGHT ECONOMIC FUTURE
Table III–1. ECONOMIC ASSUMPTIONS 1
Actual1996
Projections
1997 1998 1999 2000 2001 2002 2003
Gross Domestic Product (GDP):Levels, dollar amounts in billions:
Current dollars ....................................... 7,636 8,080 8,430 8,772 9,142 9,547 9,993 10,454Real, chained (1992) dollars ................... 6,928 7,187 7,357 7,503 7,652 7,820 8,008 8,199Chained price index (1992 = 100), an-
nual average ........................................ 110.2 112.5 114.6 116.9 119.5 122.1 124.8 127.5Percent change, fourth quarter over
fourth quarter:Current dollars ....................................... 5.6 5.5 4.0 4.1 4.3 4.6 4.6 4.6Real, chained (1992) dollars ................... 3.2 3.6 2.0 2.0 2.0 2.3 2.4 2.4Chained price index (1992 = 100) ........... 2.3 1.9 2.0 2.1 2.2 2.2 2.2 2.2
Percent change, year over year:Current dollars ....................................... 5.1 5.8 4.3 4.1 4.2 4.4 4.7 4.6Real, chained (1992) dollars ................... 2.8 3.7 2.4 2.0 2.0 2.2 2.4 2.4Chained price index (1992 = 100) ........... 2.3 2.0 1.9 2.0 2.2 2.2 2.2 2.2
Incomes, billions of current dollars:Corporate profits before tax ................... 677 729 754 768 790 805 830 851Wages and salaries ................................. 3,633 3,868 4,057 4,237 4,424 4,623 4,840 5,068Other taxable income 2 ........................... 1,693 1,786 1,859 1,915 1,975 2,046 2,128 2,213
Consumer Price Index (all urban): 3
Level (1982–84 = 100), annual average 157.0 160.7 164.1 167.7 171.5 175.5 179.5 183.6Percent change, fourth quarter over
fourth quarter ...................................... 3.2 2.0 2.2 2.2 2.3 2.3 2.3 2.3Percent change, year over year ............. 2.9 2.4 2.1 2.2 2.3 2.3 2.3 2.3
Unemployment rate, civilian, percent:Fourth quarter level ............................... 5.3 4.8 5.0 5.2 5.4 5.4 5.4 5.4Annual average ....................................... 5.4 5.0 4.9 5.1 5.3 5.4 5.4 5.4
Federal pay raises, January, percent:Military 4 .................................................. 2.6 3.0 2.8 3.1 3.0 3.0 3.0 3.0Civilian 5 .................................................. 2.4 3.0 2.8 3.1 3.0 3.0 3.0 3.0
Interest rates, percent:91-day Treasury bills 6 ........................... 5.0 5.0 5.0 4.9 4.8 4.7 4.7 4.710-year Treasury notes .......................... 6.4 6.4 5.9 5.8 5.8 5.7 5.7 5.7
1 Based on information available as of early December 1997.2 Rent, interest, dividend and proprietor’s components of personal income.3 Seasonally adjusted CPI for all urban consumers. Two versions of the CPI are now published. The index shown here is
that currently used, as required by law, in calculating automatic adjustments to individual income tax brackets. Projectionsreflect scheduled changes in methodology.
4 Beginning with the 1999 increase, percentages apply to basic pay only; adjustments for housing and subsistence allow-ances will be determined by the Secretary of Defense.
5 Overall average increase, including locality pay adjustments.6 Average rate (bank discount basis) on new issues within period.
The Near-Term Budget Outlook,1998–2003
The Administration projects that the budgetwill reach balance in 1999—ending an eraof continuous deficits that lasted 30 years(see Chart III–7). By definition, projectionsare imprecise; the further into the future,the more imprecise. But, the Administrationis committed to close the structural budgetdeficit and keep the budget in balance—as long as the economy maintains normallevels of unemployment.
The Outlook has Improved Since theBalanced Budget Act: Last summer, OMBand CBO both projected that the BBA wouldnot produce a balanced budget until 2002.Since then, the budget outlook has improved.Economic growth has continued to exceed ex-pectations, and inflation has remained low.The resulting changes in the Administration’seconomic and technical projections have re-duced the projected deficits and moved the ex-pected year of balance ahead to 1999 (seeChart III–8).
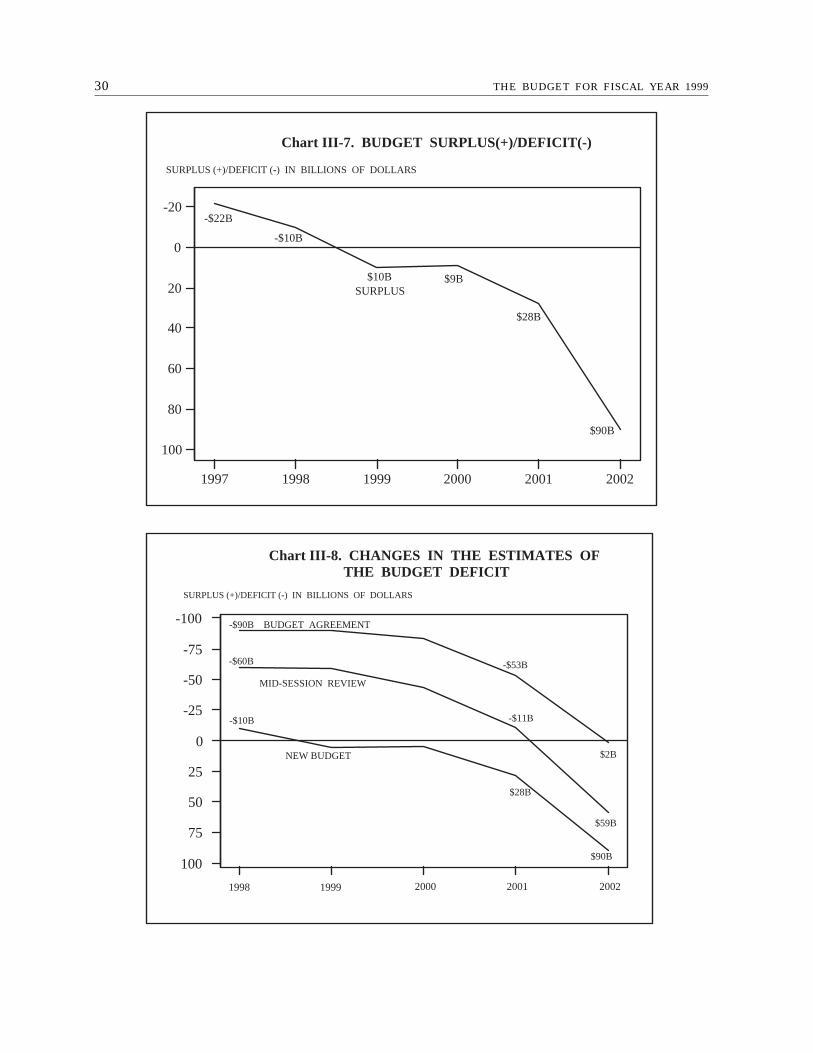
30 THE BUDGET FOR FISCAL YEAR 1999
1997 1998 1999 2000 2001 2002
-20
0
20
40
60
80
100
SURPLUS (+)/DEFICIT (-) IN BILLIONS OF DOLLARS
Chart III-7. BUDGET SURPLUS(+)/DEFICIT(-)
-$22B
$10BSURPLUS
$9B
$28B
$90B
-$10B
1998 1999 2000 2001 2002
-100
-75
-50
-25
0
25
50
75
100
SURPLUS (+)/DEFICIT (-) IN BILLIONS OF DOLLARS
Chart III-8. CHANGES IN THE ESTIMATES OF THE BUDGET DEFICIT
BUDGET AGREEMENT
NEW BUDGET
MID-SESSION REVIEW
-$90B
-$60B
-$10B
-$53B
-$11B
$2B
$59B
$90B
$28B

31
IV. IMPROVING PERFORMANCETHROUGH BETTER
MANAGEMENT

33
1 As of September 30, 1997.
2 For more information on the issues discussed in Section IV, seethe footnotes that list websites on the Internet.
IV. IMPROVING PERFORMANCE THROUGHBETTER MANAGEMENT
We had to reject the idea of those who say we should do nothing with Government and rejectthose who say we should try to do everything. Instead, we gave the American people a Govern-ment that is very much smaller, more focused, but more committed to giving people the tools andconditions they need to make the most of their lives.
President ClintonOctober 1997
The President has challenged the FederalGovernment to do more with less—and withgood reason.
Departments and agencies, which once couldcount on more funds from year to year,no longer can; indeed, with the Administrationcommitted to balancing the budget, someagencies will get less.
Public demands for more and better serviceshave not shrunk, however. Americans continueto want good schools, a clean environment,high-quality health care, and secure retire-ment benefits. Thus, the Government mustsatisfy these demands by managing betterand improving the performance of programs.
The Administration has answered the call.Vice President Gore, working with the depart-ments, agencies, and inter-agency workinggroups, and drawing on the expertise ofthe private sector, has led an unprecedentedeffort to cut the size of the Federal Govern-ment and make it more efficient and effective.Through these reinvention efforts, the Admin-istration has saved $137 billion over thelast five years.
The Administration has cut the civilianFederal work force by over 316,000 1 employ-ees, creating the smallest work force in35 years and, as a share of total civilianemployment, the smallest work force since1931. Almost all of the 14 Cabinet Depart-ments have cut their work forces; only theJustice Department’s work force is growing
due to the Administration’s expanded waron crime and drugs, while the CommerceDepartment’s work force is growing due tothe decennial census (see Charts IV–1 andIV–2).
But the work is not done, and the Adminis-tration has an ambitious agenda to continuereinventing Government so that it is moreeffective, more efficient, and more responsiveto the American people. This section highlightsthe key parts of this ‘‘Management Agenda’’ 2:
• The National Performance Review’s (NPR)efforts to reinvent entire agencies;
• The Administration’s top management ob-jectives;
• The Administration’s management supportinitiatives; and
• The activities of inter-agency workinggroups.
The NPR: Reinventing Agencies to ServeAmericans
The NPR has introduced important changesacross the Government that have improvedservices and cut costs—from streamlined drugapprovals at the Food and Drug Administra-tion to better customer service at the SocialSecurity Administration; from procurementreforms that have saved $12.3 billion tothe pending sale of the Naval Academy’s800-acre dairy farm in Annapolis, Md. Now,the NPR is moving from reinventing processes
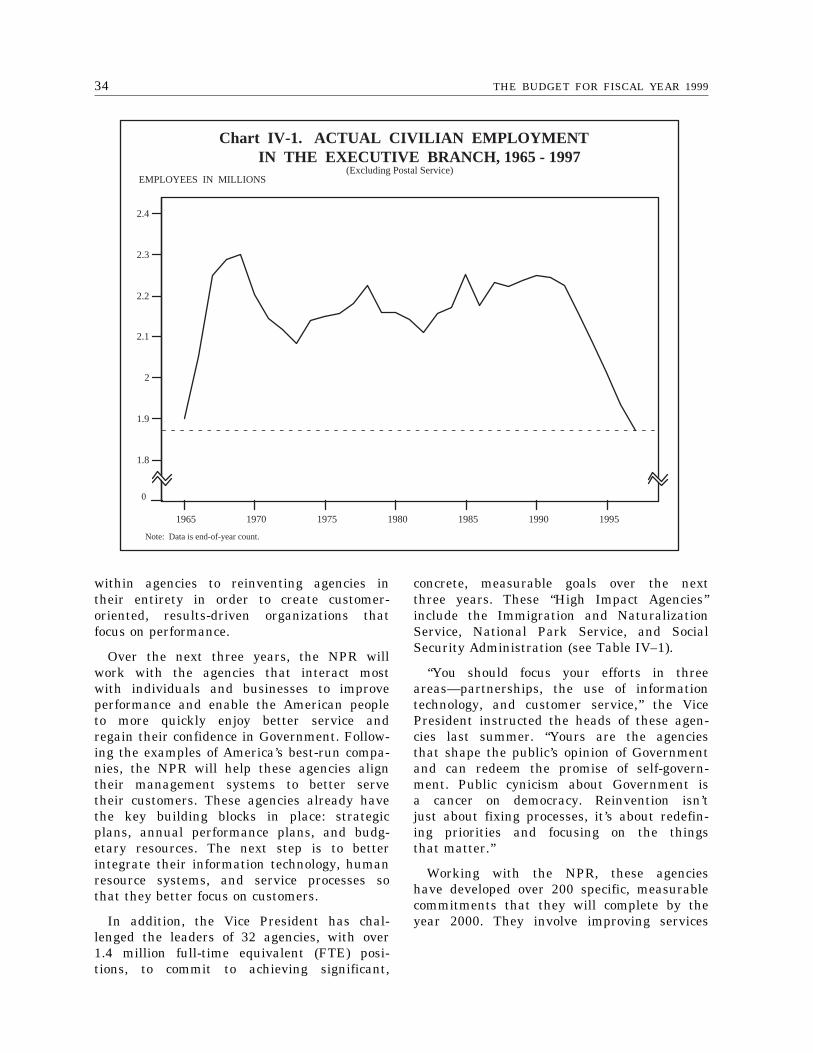
34 THE BUDGET FOR FISCAL YEAR 1999
1965 1970 1975 1980 1985 1990 1995
1.7
1.8
1.9
2
2.1
2.2
2.3
2.4
EMPLOYEES IN MILLIONS
Note: Data is end-of-year count.
Chart IV-1. ACTUAL CIVILIAN EMPLOYMENTIN THE EXECUTIVE BRANCH, 1965 - 1997
(Excluding Postal Service)
0
within agencies to reinventing agencies intheir entirety in order to create customer-oriented, results-driven organizations thatfocus on performance.
Over the next three years, the NPR willwork with the agencies that interact mostwith individuals and businesses to improveperformance and enable the American peopleto more quickly enjoy better service andregain their confidence in Government. Follow-ing the examples of America’s best-run compa-nies, the NPR will help these agencies aligntheir management systems to better servetheir customers. These agencies already havethe key building blocks in place: strategicplans, annual performance plans, and budg-etary resources. The next step is to betterintegrate their information technology, humanresource systems, and service processes sothat they better focus on customers.
In addition, the Vice President has chal-lenged the leaders of 32 agencies, with over1.4 million full-time equivalent (FTE) posi-tions, to commit to achieving significant,
concrete, measurable goals over the nextthree years. These ‘‘High Impact Agencies’’include the Immigration and NaturalizationService, National Park Service, and SocialSecurity Administration (see Table IV–1).
‘‘You should focus your efforts in threeareas—partnerships, the use of informationtechnology, and customer service,’’ the VicePresident instructed the heads of these agen-cies last summer. ‘‘Yours are the agenciesthat shape the public’s opinion of Governmentand can redeem the promise of self-govern-ment. Public cynicism about Government isa cancer on democracy. Reinvention isn’tjust about fixing processes, it’s about redefin-ing priorities and focusing on the thingsthat matter.’’
Working with the NPR, these agencieshave developed over 200 specific, measurablecommitments that they will complete by theyear 2000. They involve improving services
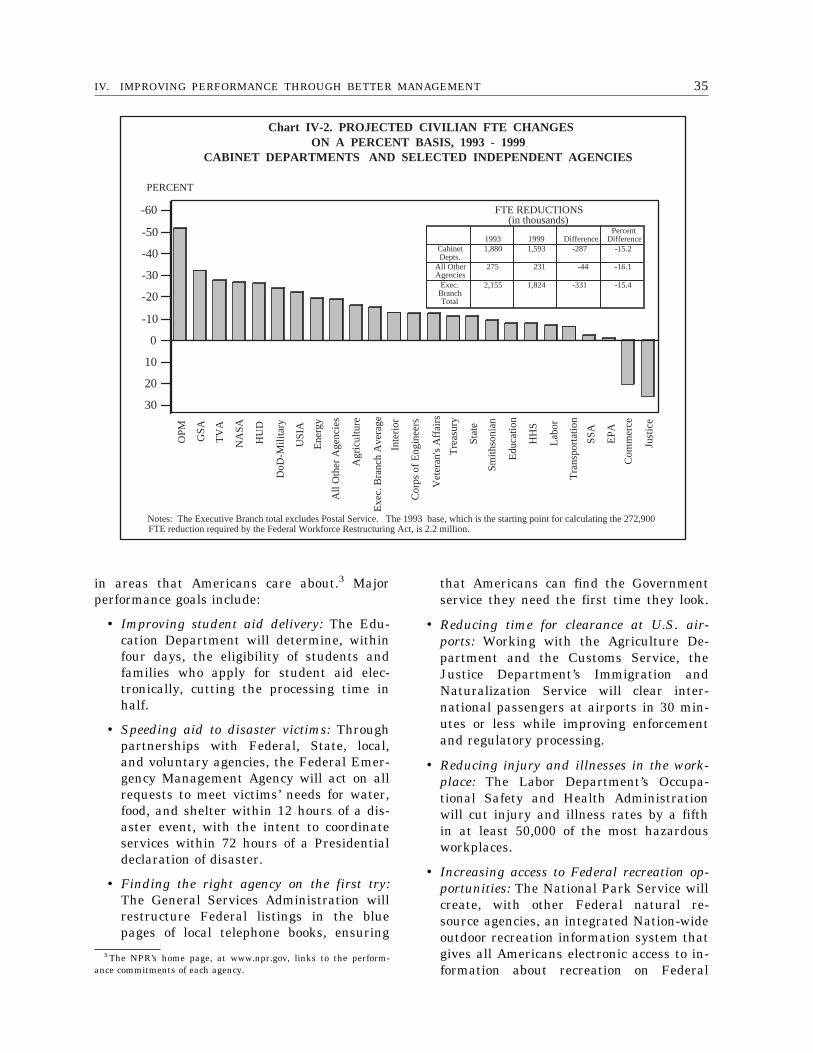
35IV. IMPROVING PERFORMANCE THROUGH BETTER MANAGEMENT
30
20
10
0
-10
-20
-30
-40
-50
-60
PERCENT
Notes: The Executive Branch total excludes Postal Service. The 1993 base, which is the starting point for calculating the 272,900FTE reduction required by the Federal Workforce Restructuring Act, is 2.2 million.
Chart IV-2. PROJECTED CIVILIAN FTE CHANGESON A PERCENT BASIS, 1993 - 1999
CABINET DEPARTMENTS AND SELECTED INDEPENDENT AGENCIES
FTE REDUCTIONS (in thousands)
1993 1999 DifferencePercent
DifferenceCabinet Depts.
1,880 1,593 -287 -15.2
All Other Agencies
275 231 -44 -16.1
Exec.Branch Total
2,155 1,824 -331 -15.4
OP
M
GS
A
TV
A
DoD
-Mili
tary
Ene
rgy
Agr
icul
ture
Inte
rior
Vet
eran
's A
ffairs
Sta
te
Edu
catio
n
Labo
r
SS
A
Com
mer
ce
HU
D
US
IA
All
Oth
er A
genc
ies
Exe
c. B
ranc
h A
vera
ge
Cor
ps o
f Eng
inee
rs
Tre
asur
y
Sm
ithso
nian
HH
S
Tra
nspo
rtat
ion
EP
A
Just
ice
NA
SA
3 The NPR’s home page, at www.npr.gov, links to the perform-ance commitments of each agency.
in areas that Americans care about.3 Majorperformance goals include:
• Improving student aid delivery: The Edu-cation Department will determine, withinfour days, the eligibility of students andfamilies who apply for student aid elec-tronically, cutting the processing time inhalf.
• Speeding aid to disaster victims: Throughpartnerships with Federal, State, local,and voluntary agencies, the Federal Emer-gency Management Agency will act on allrequests to meet victims’ needs for water,food, and shelter within 12 hours of a dis-aster event, with the intent to coordinateservices within 72 hours of a Presidentialdeclaration of disaster.
• Finding the right agency on the first try:The General Services Administration willrestructure Federal listings in the bluepages of local telephone books, ensuring
that Americans can find the Governmentservice they need the first time they look.
• Reducing time for clearance at U.S. air-ports: Working with the Agriculture De-partment and the Customs Service, theJustice Department’s Immigration andNaturalization Service will clear inter-national passengers at airports in 30 min-utes or less while improving enforcementand regulatory processing.
• Reducing injury and illnesses in the work-place: The Labor Department’s Occupa-tional Safety and Health Administrationwill cut injury and illness rates by a fifthin at least 50,000 of the most hazardousworkplaces.
• Increasing access to Federal recreation op-portunities: The National Park Service willcreate, with other Federal natural re-source agencies, an integrated Nation-wideoutdoor recreation information system thatgives all Americans electronic access to in-formation about recreation on Federal
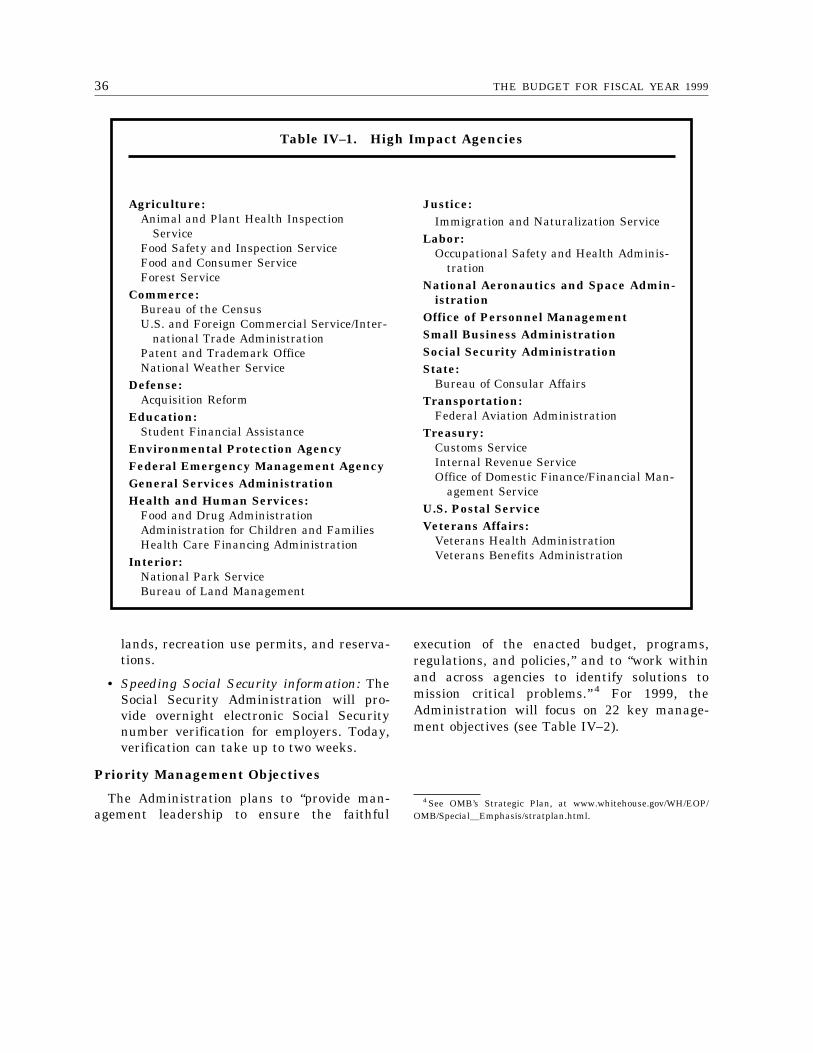
36 THE BUDGET FOR FISCAL YEAR 1999
Table IV–1. High Impact Agencies
Agriculture:Animal and Plant Health Inspection
ServiceFood Safety and Inspection ServiceFood and Consumer ServiceForest Service
Commerce:Bureau of the CensusU.S. and Foreign Commercial Service/Inter-
national Trade AdministrationPatent and Trademark OfficeNational Weather Service
Defense:Acquisition Reform
Education:Student Financial Assistance
Environmental Protection AgencyFederal Emergency Management AgencyGeneral Services AdministrationHealth and Human Services:
Food and Drug AdministrationAdministration for Children and FamiliesHealth Care Financing Administration
Interior:National Park ServiceBureau of Land Management
Justice:Immigration and Naturalization Service
Labor:Occupational Safety and Health Adminis-
trationNational Aeronautics and Space Admin-
istrationOffice of Personnel ManagementSmall Business AdministrationSocial Security AdministrationState:
Bureau of Consular AffairsTransportation:
Federal Aviation AdministrationTreasury:
Customs ServiceInternal Revenue ServiceOffice of Domestic Finance/Financial Man-
agement ServiceU.S. Postal ServiceVeterans Affairs:
Veterans Health AdministrationVeterans Benefits Administration
4 See OMB’s Strategic Plan, at www.whitehouse.gov/WH/EOP/OMB/SpeciallEmphasis/stratplan.html.
lands, recreation use permits, and reserva-tions.
• Speeding Social Security information: TheSocial Security Administration will pro-vide overnight electronic Social Securitynumber verification for employers. Today,verification can take up to two weeks.
Priority Management Objectives
The Administration plans to ‘‘provide man-agement leadership to ensure the faithful
execution of the enacted budget, programs,regulations, and policies,’’ and to ‘‘work withinand across agencies to identify solutions tomission critical problems.’’ 4 For 1999, theAdministration will focus on 22 key manage-ment objectives (see Table IV–2).
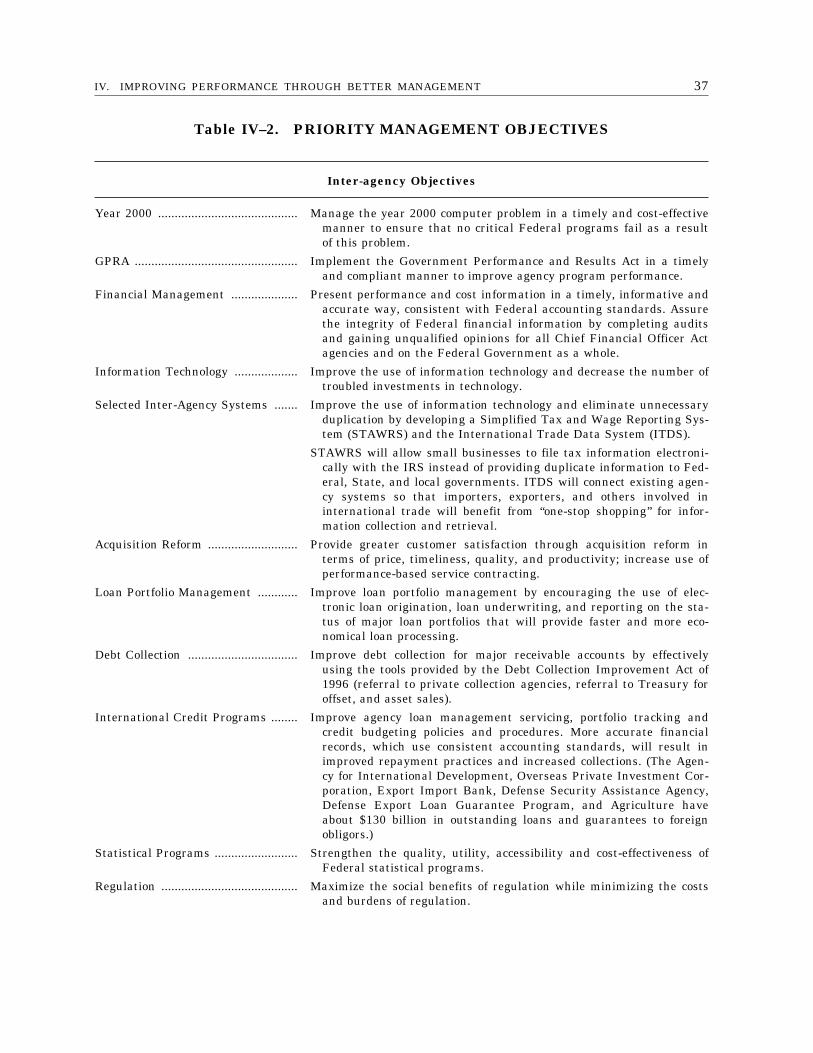
37IV. IMPROVING PERFORMANCE THROUGH BETTER MANAGEMENT
Table IV–2. PRIORITY MANAGEMENT OBJECTIVES
Inter-agency Objectives
Year 2000 .......................................... Manage the year 2000 computer problem in a timely and cost-effectivemanner to ensure that no critical Federal programs fail as a resultof this problem.
GPRA ................................................. Implement the Government Performance and Results Act in a timelyand compliant manner to improve agency program performance.
Financial Management .................... Present performance and cost information in a timely, informative andaccurate way, consistent with Federal accounting standards. Assurethe integrity of Federal financial information by completing auditsand gaining unqualified opinions for all Chief Financial Officer Actagencies and on the Federal Government as a whole.
Information Technology ................... Improve the use of information technology and decrease the number oftroubled investments in technology.
Selected Inter-Agency Systems ....... Improve the use of information technology and eliminate unnecessaryduplication by developing a Simplified Tax and Wage Reporting Sys-tem (STAWRS) and the International Trade Data System (ITDS).
STAWRS will allow small businesses to file tax information electroni-cally with the IRS instead of providing duplicate information to Fed-eral, State, and local governments. ITDS will connect existing agen-cy systems so that importers, exporters, and others involved ininternational trade will benefit from ‘‘one-stop shopping’’ for infor-mation collection and retrieval.
Acquisition Reform ........................... Provide greater customer satisfaction through acquisition reform interms of price, timeliness, quality, and productivity; increase use ofperformance-based service contracting.
Loan Portfolio Management ............ Improve loan portfolio management by encouraging the use of elec-tronic loan origination, loan underwriting, and reporting on the sta-tus of major loan portfolios that will provide faster and more eco-nomical loan processing.
Debt Collection ................................. Improve debt collection for major receivable accounts by effectivelyusing the tools provided by the Debt Collection Improvement Act of1996 (referral to private collection agencies, referral to Treasury foroffset, and asset sales).
International Credit Programs ........ Improve agency loan management servicing, portfolio tracking andcredit budgeting policies and procedures. More accurate financialrecords, which use consistent accounting standards, will result inimproved repayment practices and increased collections. (The Agen-cy for International Development, Overseas Private Investment Cor-poration, Export Import Bank, Defense Security Assistance Agency,Defense Export Loan Guarantee Program, and Agriculture haveabout $130 billion in outstanding loans and guarantees to foreignobligors.)
Statistical Programs ......................... Strengthen the quality, utility, accessibility and cost-effectiveness ofFederal statistical programs.
Regulation ......................................... Maximize the social benefits of regulation while minimizing the costsand burdens of regulation.
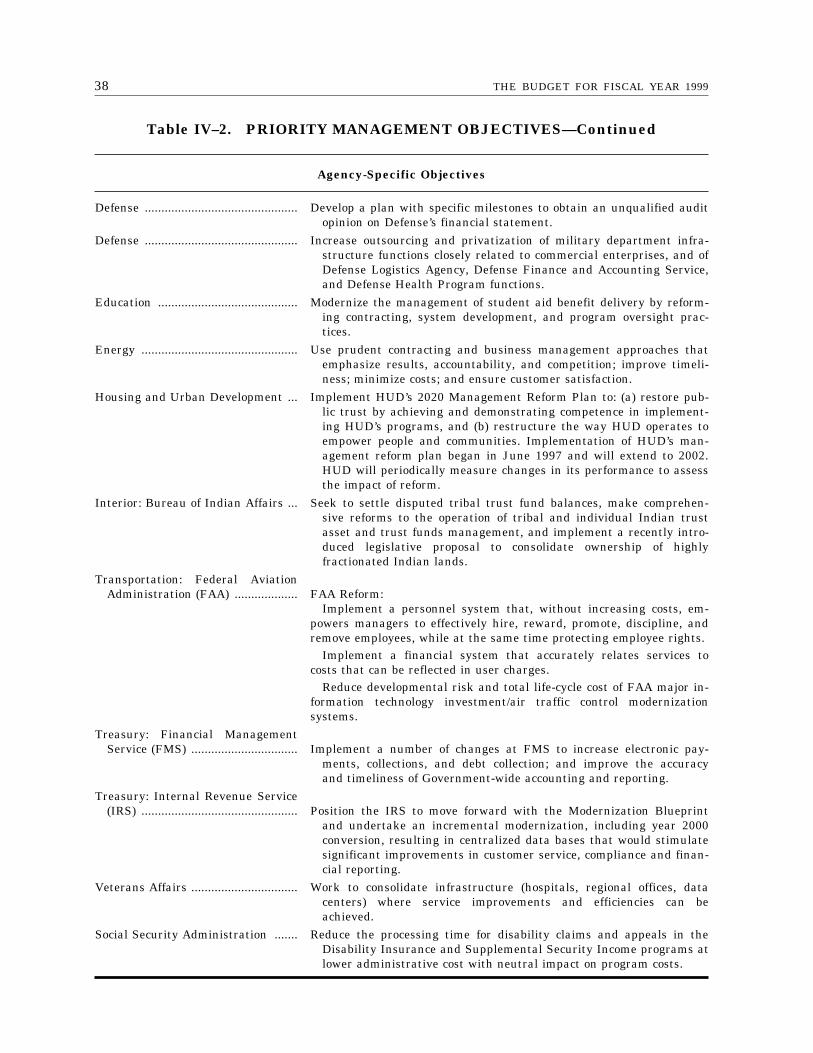
38 THE BUDGET FOR FISCAL YEAR 1999
Table IV–2. PRIORITY MANAGEMENT OBJECTIVES—Continued
Agency-Specific Objectives
Defense .............................................. Develop a plan with specific milestones to obtain an unqualified auditopinion on Defense’s financial statement.
Defense .............................................. Increase outsourcing and privatization of military department infra-structure functions closely related to commercial enterprises, and ofDefense Logistics Agency, Defense Finance and Accounting Service,and Defense Health Program functions.
Education .......................................... Modernize the management of student aid benefit delivery by reform-ing contracting, system development, and program oversight prac-tices.
Energy ............................................... Use prudent contracting and business management approaches thatemphasize results, accountability, and competition; improve timeli-ness; minimize costs; and ensure customer satisfaction.
Housing and Urban Development ... Implement HUD’s 2020 Management Reform Plan to: (a) restore pub-lic trust by achieving and demonstrating competence in implement-ing HUD’s programs, and (b) restructure the way HUD operates toempower people and communities. Implementation of HUD’s man-agement reform plan began in June 1997 and will extend to 2002.HUD will periodically measure changes in its performance to assessthe impact of reform.
Interior: Bureau of Indian Affairs ... Seek to settle disputed tribal trust fund balances, make comprehen-sive reforms to the operation of tribal and individual Indian trustasset and trust funds management, and implement a recently intro-duced legislative proposal to consolidate ownership of highlyfractionated Indian lands.
Transportation: Federal AviationAdministration (FAA) ................... FAA Reform:
Implement a personnel system that, without increasing costs, em-powers managers to effectively hire, reward, promote, discipline, andremove employees, while at the same time protecting employee rights.
Implement a financial system that accurately relates services tocosts that can be reflected in user charges.
Reduce developmental risk and total life-cycle cost of FAA major in-formation technology investment/air traffic control modernizationsystems.
Treasury: Financial ManagementService (FMS) ................................ Implement a number of changes at FMS to increase electronic pay-
ments, collections, and debt collection; and improve the accuracyand timeliness of Government-wide accounting and reporting.
Treasury: Internal Revenue Service(IRS) ............................................... Position the IRS to move forward with the Modernization Blueprint
and undertake an incremental modernization, including year 2000conversion, resulting in centralized data bases that would stimulatesignificant improvements in customer service, compliance and finan-cial reporting.
Veterans Affairs ................................ Work to consolidate infrastructure (hospitals, regional offices, datacenters) where service improvements and efficiencies can beachieved.
Social Security Administration ....... Reduce the processing time for disability claims and appeals in theDisability Insurance and Supplemental Security Income programs atlower administrative cost with neutral impact on program costs.
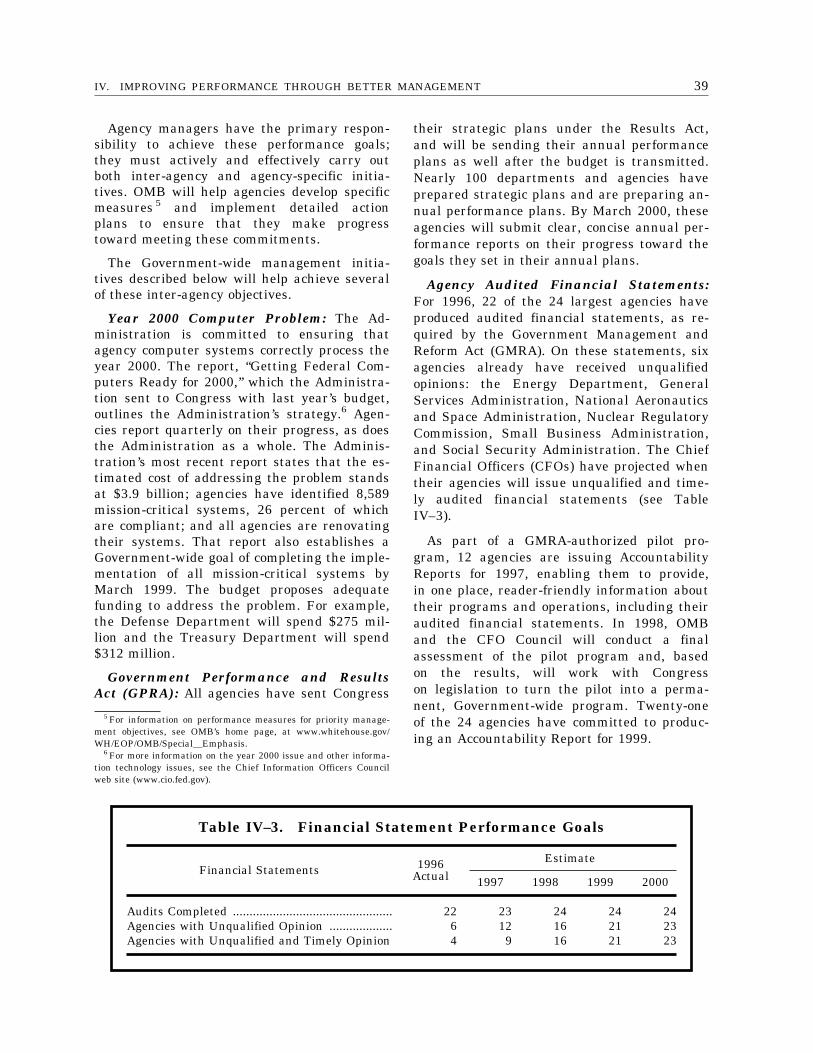
39IV. IMPROVING PERFORMANCE THROUGH BETTER MANAGEMENT
Table IV–3. Financial Statement Performance Goals
Financial Statements 1996Actual
Estimate
1997 1998 1999 2000
Audits Completed ................................................ 22 23 24 24 24Agencies with Unqualified Opinion ................... 6 12 16 21 23Agencies with Unqualified and Timely Opinion 4 9 16 21 23
5 For information on performance measures for priority manage-ment objectives, see OMB’s home page, at www.whitehouse.gov/WH/EOP/OMB/SpeciallEmphasis.
6 For more information on the year 2000 issue and other informa-tion technology issues, see the Chief Information Officers Councilweb site (www.cio.fed.gov).
Agency managers have the primary respon-sibility to achieve these performance goals;they must actively and effectively carry outboth inter-agency and agency-specific initia-tives. OMB will help agencies develop specificmeasures 5 and implement detailed actionplans to ensure that they make progresstoward meeting these commitments.
The Government-wide management initia-tives described below will help achieve severalof these inter-agency objectives.
Year 2000 Computer Problem: The Ad-ministration is committed to ensuring thatagency computer systems correctly process theyear 2000. The report, ‘‘Getting Federal Com-puters Ready for 2000,’’ which the Administra-tion sent to Congress with last year’s budget,outlines the Administration’s strategy.6 Agen-cies report quarterly on their progress, as doesthe Administration as a whole. The Adminis-tration’s most recent report states that the es-timated cost of addressing the problem standsat $3.9 billion; agencies have identified 8,589mission-critical systems, 26 percent of whichare compliant; and all agencies are renovatingtheir systems. That report also establishes aGovernment-wide goal of completing the imple-mentation of all mission-critical systems byMarch 1999. The budget proposes adequatefunding to address the problem. For example,the Defense Department will spend $275 mil-lion and the Treasury Department will spend$312 million.
Government Performance and ResultsAct (GPRA): All agencies have sent Congress
their strategic plans under the Results Act,and will be sending their annual performanceplans as well after the budget is transmitted.Nearly 100 departments and agencies haveprepared strategic plans and are preparing an-nual performance plans. By March 2000, theseagencies will submit clear, concise annual per-formance reports on their progress toward thegoals they set in their annual plans.
Agency Audited Financial Statements:For 1996, 22 of the 24 largest agencies haveproduced audited financial statements, as re-quired by the Government Management andReform Act (GMRA). On these statements, sixagencies already have received unqualifiedopinions: the Energy Department, GeneralServices Administration, National Aeronauticsand Space Administration, Nuclear RegulatoryCommission, Small Business Administration,and Social Security Administration. The ChiefFinancial Officers (CFOs) have projected whentheir agencies will issue unqualified and time-ly audited financial statements (see TableIV–3).
As part of a GMRA-authorized pilot pro-gram, 12 agencies are issuing AccountabilityReports for 1997, enabling them to provide,in one place, reader-friendly information abouttheir programs and operations, including theiraudited financial statements. In 1998, OMBand the CFO Council will conduct a finalassessment of the pilot program and, basedon the results, will work with Congresson legislation to turn the pilot into a perma-nent, Government-wide program. Twenty-oneof the 24 agencies have committed to produc-ing an Accountability Report for 1999.
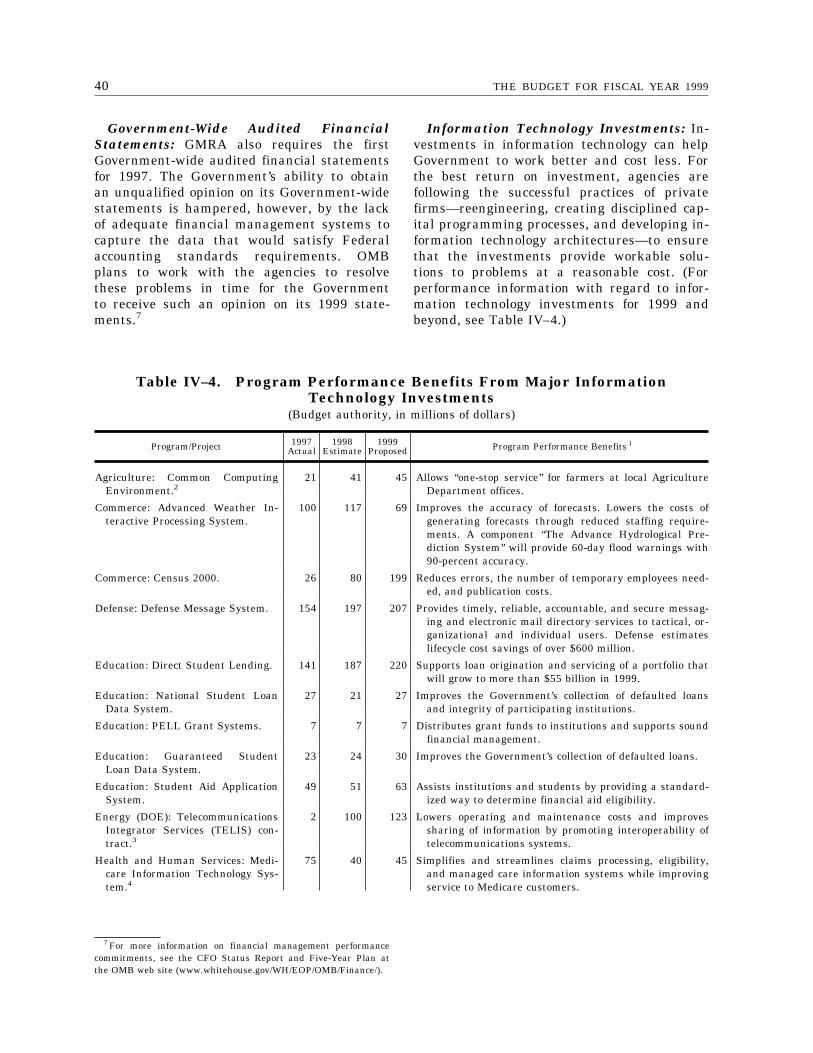
40 THE BUDGET FOR FISCAL YEAR 1999
7 For more information on financial management performancecommitments, see the CFO Status Report and Five-Year Plan atthe OMB web site (www.whitehouse.gov/WH/EOP/OMB/Finance/).
Government-Wide Audited FinancialStatements: GMRA also requires the firstGovernment-wide audited financial statementsfor 1997. The Government’s ability to obtainan unqualified opinion on its Government-widestatements is hampered, however, by the lackof adequate financial management systems tocapture the data that would satisfy Federalaccounting standards requirements. OMBplans to work with the agencies to resolvethese problems in time for the Governmentto receive such an opinion on its 1999 state-ments.7
Information Technology Investments: In-vestments in information technology can helpGovernment to work better and cost less. Forthe best return on investment, agencies arefollowing the successful practices of privatefirms—reengineering, creating disciplined cap-ital programming processes, and developing in-formation technology architectures—to ensurethat the investments provide workable solu-tions to problems at a reasonable cost. (Forperformance information with regard to infor-mation technology investments for 1999 andbeyond, see Table IV–4.)
Table IV–4. Program Performance Benefits From Major InformationTechnology Investments
(Budget authority, in millions of dollars)
Program/Project 1997Actual
1998Estimate
1999Proposed Program Performance Benefits 1
Agriculture: Common ComputingEnvironment.2
21 41 45 Allows ‘‘one-stop service’’ for farmers at local AgricultureDepartment offices.
Commerce: Advanced Weather In-teractive Processing System.
100 117 69 Improves the accuracy of forecasts. Lowers the costs ofgenerating forecasts through reduced staffing require-ments. A component ‘‘The Advance Hydrological Pre-diction System’’ will provide 60-day flood warnings with90-percent accuracy.
Commerce: Census 2000. 26 80 199 Reduces errors, the number of temporary employees need-ed, and publication costs.
Defense: Defense Message System. 154 197 207 Provides timely, reliable, accountable, and secure messag-ing and electronic mail directory services to tactical, or-ganizational and individual users. Defense estimateslifecycle cost savings of over $600 million.
Education: Direct Student Lending. 141 187 220 Supports loan origination and servicing of a portfolio thatwill grow to more than $55 billion in 1999.
Education: National Student LoanData System.
27 21 27 Improves the Government’s collection of defaulted loansand integrity of participating institutions.
Education: PELL Grant Systems. 7 7 7 Distributes grant funds to institutions and supports soundfinancial management.
Education: Guaranteed StudentLoan Data System.
23 24 30 Improves the Government’s collection of defaulted loans.
Education: Student Aid ApplicationSystem.
49 51 63 Assists institutions and students by providing a standard-ized way to determine financial aid eligibility.
Energy (DOE): TelecommunicationsIntegrator Services (TELIS) con-tract.3
2 100 123 Lowers operating and maintenance costs and improvessharing of information by promoting interoperability oftelecommunications systems.
Health and Human Services: Medi-care Information Technology Sys-tem.4
75 40 45 Simplifies and streamlines claims processing, eligibility,and managed care information systems while improvingservice to Medicare customers.
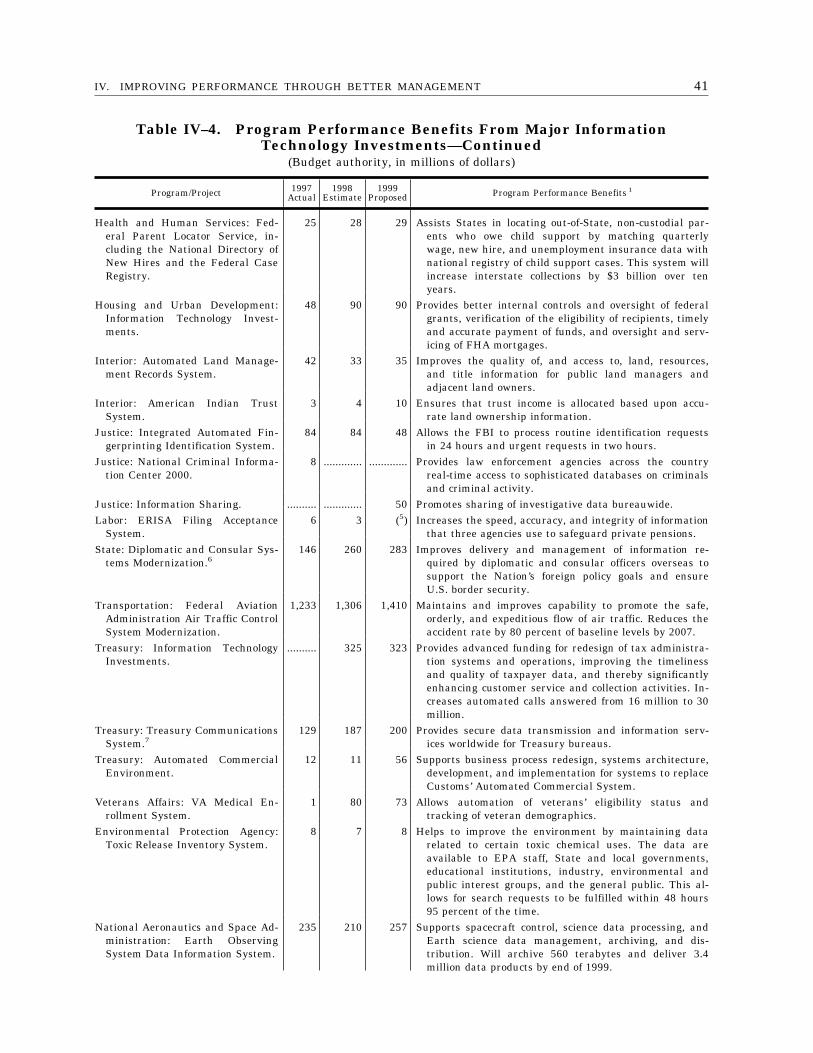
41IV. IMPROVING PERFORMANCE THROUGH BETTER MANAGEMENT
Table IV–4. Program Performance Benefits From Major InformationTechnology Investments—Continued
(Budget authority, in millions of dollars)
Program/Project 1997Actual
1998Estimate
1999Proposed Program Performance Benefits 1
Health and Human Services: Fed-eral Parent Locator Service, in-cluding the National Directory ofNew Hires and the Federal CaseRegistry.
25 28 29 Assists States in locating out-of-State, non-custodial par-ents who owe child support by matching quarterlywage, new hire, and unemployment insurance data withnational registry of child support cases. This system willincrease interstate collections by $3 billion over tenyears.
Housing and Urban Development:Information Technology Invest-ments.
48 90 90 Provides better internal controls and oversight of federalgrants, verification of the eligibility of recipients, timelyand accurate payment of funds, and oversight and serv-icing of FHA mortgages.
Interior: Automated Land Manage-ment Records System.
42 33 35 Improves the quality of, and access to, land, resources,and title information for public land managers andadjacent land owners.
Interior: American Indian TrustSystem.
3 4 10 Ensures that trust income is allocated based upon accu-rate land ownership information.
Justice: Integrated Automated Fin-gerprinting Identification System.
84 84 48 Allows the FBI to process routine identification requestsin 24 hours and urgent requests in two hours.
Justice: National Criminal Informa-tion Center 2000.
8 ............. ............. Provides law enforcement agencies across the countryreal-time access to sophisticated databases on criminalsand criminal activity.
Justice: Information Sharing. .......... ............. 50 Promotes sharing of investigative data bureauwide.Labor: ERISA Filing Acceptance
System.6 3 (5) Increases the speed, accuracy, and integrity of information
that three agencies use to safeguard private pensions.State: Diplomatic and Consular Sys-
tems Modernization.6146 260 283 Improves delivery and management of information re-
quired by diplomatic and consular officers overseas tosupport the Nation’s foreign policy goals and ensureU.S. border security.
Transportation: Federal AviationAdministration Air Traffic ControlSystem Modernization.
1,233 1,306 1,410 Maintains and improves capability to promote the safe,orderly, and expeditious flow of air traffic. Reduces theaccident rate by 80 percent of baseline levels by 2007.
Treasury: Information TechnologyInvestments.
.......... 325 323 Provides advanced funding for redesign of tax administra-tion systems and operations, improving the timelinessand quality of taxpayer data, and thereby significantlyenhancing customer service and collection activities. In-creases automated calls answered from 16 million to 30million.
Treasury: Treasury CommunicationsSystem.7
129 187 200 Provides secure data transmission and information serv-ices worldwide for Treasury bureaus.
Treasury: Automated CommercialEnvironment.
12 11 56 Supports business process redesign, systems architecture,development, and implementation for systems to replaceCustoms’ Automated Commercial System.
Veterans Affairs: VA Medical En-rollment System.
1 80 73 Allows automation of veterans’ eligibility status andtracking of veteran demographics.
Environmental Protection Agency:Toxic Release Inventory System.
8 7 8 Helps to improve the environment by maintaining datarelated to certain toxic chemical uses. The data areavailable to EPA staff, State and local governments,educational institutions, industry, environmental andpublic interest groups, and the general public. This al-lows for search requests to be fulfilled within 48 hours95 percent of the time.
National Aeronautics and Space Ad-ministration: Earth ObservingSystem Data Information System.
235 210 257 Supports spacecraft control, science data processing, andEarth science data management, archiving, and dis-tribution. Will archive 560 terabytes and deliver 3.4million data products by end of 1999.
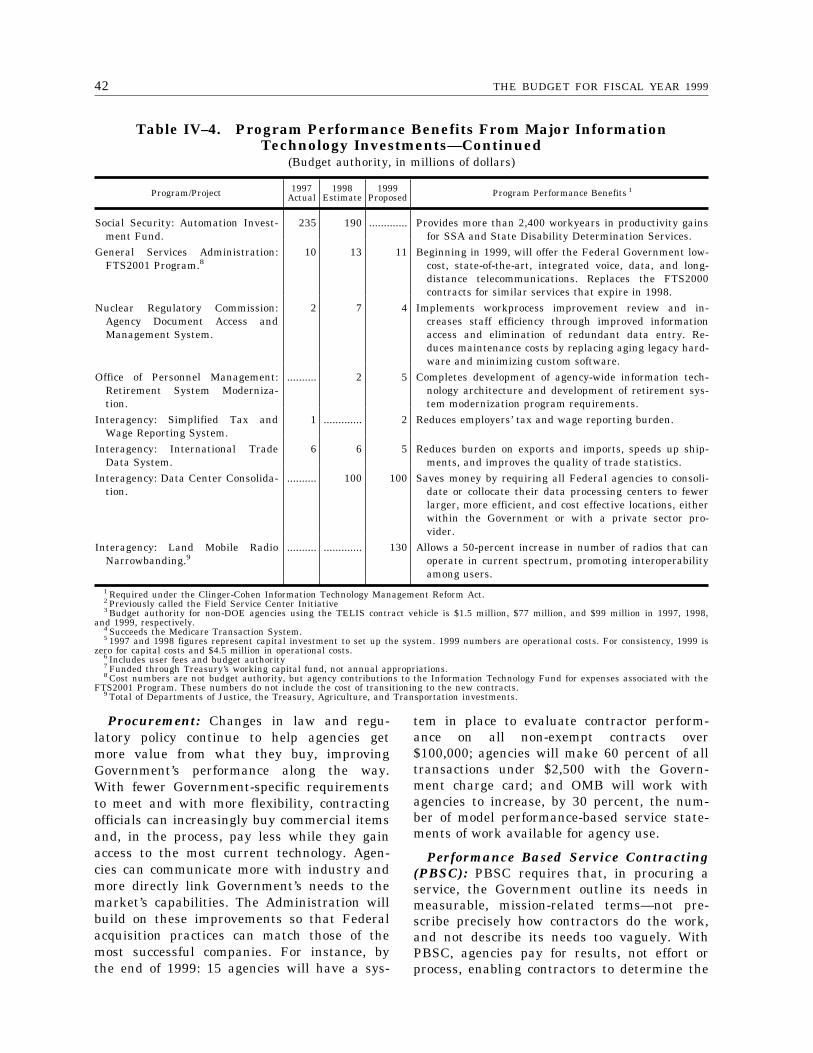
42 THE BUDGET FOR FISCAL YEAR 1999
Table IV–4. Program Performance Benefits From Major InformationTechnology Investments—Continued
(Budget authority, in millions of dollars)
Program/Project 1997Actual
1998Estimate
1999Proposed Program Performance Benefits 1
Social Security: Automation Invest-ment Fund.
235 190 ............. Provides more than 2,400 workyears in productivity gainsfor SSA and State Disability Determination Services.
General Services Administration:FTS2001 Program.8
10 13 11 Beginning in 1999, will offer the Federal Government low-cost, state-of-the-art, integrated voice, data, and long-distance telecommunications. Replaces the FTS2000contracts for similar services that expire in 1998.
Nuclear Regulatory Commission:Agency Document Access andManagement System.
2 7 4 Implements workprocess improvement review and in-creases staff efficiency through improved informationaccess and elimination of redundant data entry. Re-duces maintenance costs by replacing aging legacy hard-ware and minimizing custom software.
Office of Personnel Management:Retirement System Moderniza-tion.
.......... 2 5 Completes development of agency-wide information tech-nology architecture and development of retirement sys-tem modernization program requirements.
Interagency: Simplified Tax andWage Reporting System.
1 ............. 2 Reduces employers’ tax and wage reporting burden.
Interagency: International TradeData System.
6 6 5 Reduces burden on exports and imports, speeds up ship-ments, and improves the quality of trade statistics.
Interagency: Data Center Consolida-tion.
.......... 100 100 Saves money by requiring all Federal agencies to consoli-date or collocate their data processing centers to fewerlarger, more efficient, and cost effective locations, eitherwithin the Government or with a private sector pro-vider.
Interagency: Land Mobile RadioNarrowbanding.9
.......... ............. 130 Allows a 50-percent increase in number of radios that canoperate in current spectrum, promoting interoperabilityamong users.
1 Required under the Clinger-Cohen Information Technology Management Reform Act.2 Previously called the Field Service Center Initiative3 Budget authority for non-DOE agencies using the TELIS contract vehicle is $1.5 million, $77 million, and $99 million in 1997, 1998,
and 1999, respectively.4 Succeeds the Medicare Transaction System.5 1997 and 1998 figures represent capital investment to set up the system. 1999 numbers are operational costs. For consistency, 1999 is
zero for capital costs and $4.5 million in operational costs.6 Includes user fees and budget authority7 Funded through Treasury’s working capital fund, not annual appropriations.8 Cost numbers are not budget authority, but agency contributions to the Information Technology Fund for expenses associated with the
FTS2001 Program. These numbers do not include the cost of transitioning to the new contracts.9 Total of Departments of Justice, the Treasury, Agriculture, and Transportation investments.
Procurement: Changes in law and regu-latory policy continue to help agencies getmore value from what they buy, improvingGovernment’s performance along the way.With fewer Government-specific requirementsto meet and with more flexibility, contractingofficials can increasingly buy commercial itemsand, in the process, pay less while they gainaccess to the most current technology. Agen-cies can communicate more with industry andmore directly link Government’s needs to themarket’s capabilities. The Administration willbuild on these improvements so that Federalacquisition practices can match those of themost successful companies. For instance, bythe end of 1999: 15 agencies will have a sys-
tem in place to evaluate contractor perform-ance on all non-exempt contracts over$100,000; agencies will make 60 percent of alltransactions under $2,500 with the Govern-ment charge card; and OMB will work withagencies to increase, by 30 percent, the num-ber of model performance-based service state-ments of work available for agency use.
Performance Based Service Contracting(PBSC): PBSC requires that, in procuring aservice, the Government outline its needs inmeasurable, mission-related terms—not pre-scribe precisely how contractors do the work,and not describe its needs too vaguely. WithPBSC, agencies pay for results, not effort orprocess, enabling contractors to determine the
43IV. IMPROVING PERFORMANCE THROUGH BETTER MANAGEMENT
8 For further details, see www.gits.fed.gov.
best, most cost-effective ways to do the job.Preliminary results of a Government-widePBSC pilot project show that it cut prices 15to 20 percent while increasing Government’ssatisfaction with contractor performance. TheAdministration believes that PBSC offers greatpotential to reap savings and other benefitsin the roughly $100 billion that the Govern-ment spends a year on service contracts. Agen-cies plan to convert about 1,000 contracts, val-ued at $20 billion, to PBSC over several years.In 1999, agencies project that they will convertat least 700 contracts, worth $9 billion, toPBSC.
Loan Portfolio Management: Because theFederal Government is the Nation’s singlelargest source of credit, agency credit programsand performance measures should addresseach major phase of credit management—cred-it extension, account servicing, and special col-lection. For each phase of this new initiative,agencies will more widely use modern elec-tronic business processes to improve customerservice, cut costs, and improve collection. Forcredit extension, agencies will ensure that in-dividuals and entities applying for credit areeligible in terms of income and are not delin-quent on a Federal claim. For account servic-ing, agencies will work together to ensure thataccurate monthly information is available onthe status of loans. A consortium of single fam-ily loan programs run by the Departments ofHousing and Urban Development, Agriculture,and Veterans Affairs will provide a forum forits program delivery partners to speed theiruse of electronic reporting on the status of ac-counts.
Debt Collection Management: The 1996Debt Collection Improvement Act (DCIA) cre-ated more tools for the Treasury Departmentand individual agencies to reduce losses andincrease collections. In the special collectionphase, when a loan becomes seriously delin-quent—over 180 days overdue—Treasury willhelp the agency by intercepting other Federalpayments to the delinquent borrower and ap-plying them to the delinquent account. Treas-ury can also cross-service debts that are over180 days overdue by referring them to privatecollection agencies. A principle of sound creditmanagement for most Federal loan programsis that once a loan is delinquent for over oneyear, the agency should sell the debt or write
it off as uncollectible, as appropriate. The Fed-eral Credit Policy Working Group will reviewwrite-off practices and redesign loan sales pol-icy in order to cut the growth of delinquenciesand boost Federal collections of delinquentdebt. By January 1999, the Federal Credit Pol-icy Working Group, in cooperation with theCFO Council, will work to reduce delin-quencies by 10 percent and increase collectionsby $95 million from the 1997 level.
Management Support Initiatives
The activities described above do not encom-pass all of the Administration’s managementefforts. Indeed, the Administration continuesto work on a host of other initiatives—from providing more Federal services electroni-cally to improving the management of creditprograms—that will help reach the goal ofcreating a Government that ‘‘works betterand costs less.’’
Access America: This plan, which the VicePresident is spearheading, is designed to makeGovernment services available electronically toall Americans who seek them. More specifi-cally, the plan calls for, among other things,conducting electronically those transactionsthat individuals, States, localities, businesses,law enforcement agencies, and others mostoften request; ensuring high standards of pri-vacy and security for these transactions; andproviding the necessary infrastructure andskills in Government to support the vision. AGovernment-wide task force is leading imple-mentation efforts.8
Electronic Commerce Security: Electroniccommerce is the use of computers and net-works to buy and pay for goods and services,accept regulatory filings, and provide publicservices—making Government more conven-ient and cost-effective. For agencies and thepublic to enjoy those benefits, however, theymust be sure that their information is goingto whom it should—and to no one else. Animportant tool for providing that security isthe digital signature, but the private institu-tions and the rules for managing those signa-tures are just emerging. Through efforts of theGovernment Information Technology ServicesBoard and others, the Federal Government isaligning Federal electronic commerce security
44 THE BUDGET FOR FISCAL YEAR 1999
practices with this emerging private infra-structure.
Data Center Consolidation: The Govern-ment can save money by consolidating largecomputer centers, thereby eliminating duplica-tion in facilities, staff, computer hardware andsoftware, and related services. Large-scaledata processing service contracts, such asGSA’s Virtual Data Center contract, makeoutsourcing for the related services sensibleand cost-effective. OMB has directed agenciesto significantly reduce the number of agencydata centers to save substantial sums of moneyfor the Government.
Budgeting for Results: In preparing thebudget, the Administration had, for the firsttime, agency strategic plans, annual perform-ance plans, and performance measures to helpdecide how to allocate resources. In general,however, the budget structure and chargingpractices do not make it easy to match costswith a specific program. First, the budget doesnot charge all of a program’s resources to thatprogram; instead, the budget subsidizes pro-grams by paying for certain activities cen-trally. Second, not all budget accounts are aswell-aligned as they might be with the pro-grams they finance. As a result, in some cases,the quality of budgeting, management, and re-source acquisition all suffer.
Good budgeting is predicated on the abilityto compare costs and benefits, at least roughly,across all programs every year. In somecases, current practices distort such compari-sons. Good management requires that man-agers focus on, and are held accountablefor, getting the best results for the resourcesthey have. Managers should be free to allocateresources as they see fit, and to obtaincompetitive, performance-oriented procure-ment.
To better integrate budgeting with perform-ance planning and reporting, as GPRA envi-sions, OMB will work with agencies to reviewtheir budget account structures and, in con-sultation with the Budget Officers AdvisoryCouncil and the CFO Council, develop legisla-tion to enable agencies to charge programs’accounts uniformly and comprehensively forthe resources they use. As these proposalstake shape, OMB will consult with the Con-gressional Budget Office, the General Account-
ing Office, and congressional committees onnext steps.
Competition: Competition spurs efficiency.Federal agencies that provide administrativeand other support services need the stimulusof competition to sharpen their skills, improvetheir performance, and cut their costs. As aresult, for buying commercial goods and serv-ices, the Administration is encouraging agen-cies to consolidate common administrativeservices, and to compete those and other serv-ices with one another and with the privatesector on a level playing field to provide thebest deal for the taxpayer, in accordance withthe March 1996 revised OMB Circular A–76Supplemental Handbook. More competitionwill spur new technologies, new capital, andnew management techniques to help improveperformance, while creating greater opportuni-ties for Federal and private employees andtheir customers. The Secretary of Defense, forinstance, has announced that the departmentwill evaluate over 41,000 FTE positions fortheir possible conversion to the private sectoror other agencies in 1999, and evaluate over150,000 FTE through 2001.
Error Reduction: The Administration islaunching an effort to reduce errors in Federalprograms that lead to waste, fraud, or abuse.Federal agencies will work together to identifycommon sources of error and enable the Gov-ernment to develop more integrated solutions,thus saving money for the taxpayers. For 1999,the Administration will focus on increasing ac-curacy and efficiency in three areas: programeligibility verification; financial and programmanagement; and debt collection.
• Eligibility verification: Many agencies runbenefit and credit programs in which eligi-bility depends, at least in part, on anapplicant’s income or other financial re-sources, and other criteria, such as maritalstatus and number of dependents. Theseprograms include small business loans,student loans and grants, veterans pen-sions, rental housing assistance, incomemaintenance, nutrition support, andothers. Generally, applicants must submitfinancial and other data on forms thatagencies use to determine eligibility. Whenapplicants provide false or erroneous infor-mation about their income or personal sta-
45IV. IMPROVING PERFORMANCE THROUGH BETTER MANAGEMENT
tus, they may receive benefits for whichthey are ineligible, and may deprive eligi-ble applicants from the assistance they de-serve. A better verification process forcredit and benefit programs can reduce er-rors significantly and allocate resourcesmore fairly.
• Financial and program management:Agencies often can address the sources oferrors within programs by changing theirfinancial or management practices. For ex-ample, transaction analysis software canhelp agencies identify improper billingtrends or high-risk operations. In addition,agencies could recoup the interest lost dueto overpayments to vendors by chargingthe vendors for those funds, and the Ad-ministration is drafting legislation to en-able the Treasury Department to assessthose charges. Also, more audits and otherintegrity initiatives will help agenciesidentify errors earlier. The biggest payoffscome when agencies prevent errors upfront or quickly identify them before lossesmount.
• Debt collection: Although most efforts toimprove accuracy focus on prevention,some bad debt is inevitable. In trying tocollect, agencies face the major obstacle offinding both the debtor and his or her em-ployer. For example, the Education De-partment devotes about 70 percent of itscollection efforts to locating debtors. Agen-cies could collect debt more effectively bybetter using data, subject to appropriateprivacy protections, that’s already in Gov-ernment databases such as the NationalDirectory for New Hires, which should befully on line in early 1998 and which pro-vides some of the Federal Government’smost timely information for debt collectionpurposes.
Inter-Agency Working Groups: UsingNetwork Management for BetterPerformance
The Administration relies on inter-agencygroups to develop certain policies, and toidentify and implement ways to better manageFederal resources. The groups meet regularlyto initiate action, undertake projects, exchange
information, set priorities, and recommendpolicy direction.
In 1993, President Clinton established thePresident’s Management Council (PMC), com-prising the Chief Operating Officers of thelargest Federal departments and agencies,to improve management of the ExecutiveBranch. The PMC has undertaken a numberof initiatives, including:
• Rightsizing: Leading efforts to reduce thenumber of Federal civilian employeeswithout unnecessarily disrupting the workforce.
• Procurement reforms: Identifying perform-ance measures to help agencies assess im-provements in the procurement process,and supporting implementation of Elec-tronic Commerce and Performance-BasedService Contracting initiatives.
• Field office restructuring: Identifying ap-propriate criteria for restructuring activi-ties within agencies; and recommendingvarious approaches to restructuring.
• Overseas missions: Implementing a cost-sharing process for foreign missions.
• Labor-Management partnerships: Support-ing partnerships through continuous com-munication with union leaders; and foster-ing culture change at all organizationallevels.
• Customer service: Facilitating the develop-ment of customer service standards inagencies and the delivery of CustomerService Reports.
The President’s Council on Integrity andEfficiency (PCIE), comprising 27 Presiden-tially-appointed Inspectors General (IGs) andother key integrity officials, focuses on twomain objectives:
• mounting collaborative efforts to addressintegrity, economy, and effectiveness is-sues that transcend individual agencies;and
• increasing the professionalism and effec-tiveness of IG personnel across the Gov-ernment.
The PCIE, for example, has recommendedcontrols for Federal electronic benefits pro-
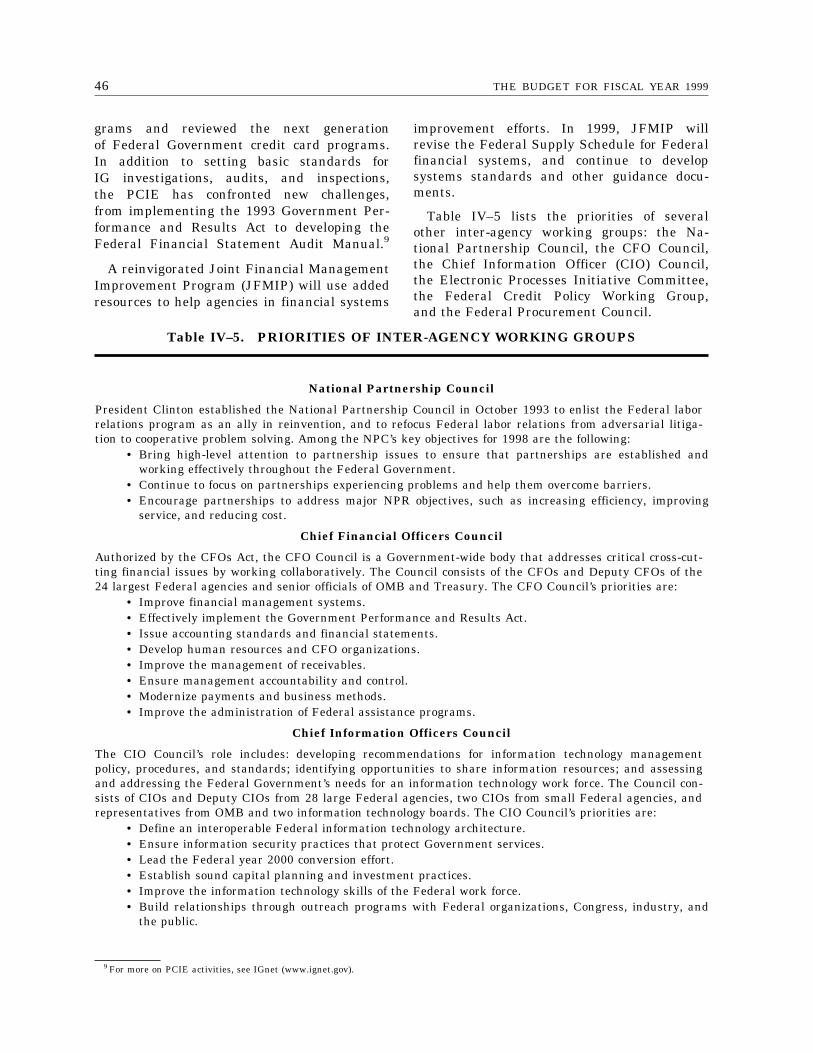
46 THE BUDGET FOR FISCAL YEAR 1999
9 For more on PCIE activities, see IGnet (www.ignet.gov).
grams and reviewed the next generationof Federal Government credit card programs.In addition to setting basic standards forIG investigations, audits, and inspections,the PCIE has confronted new challenges,from implementing the 1993 Government Per-formance and Results Act to developing theFederal Financial Statement Audit Manual.9
A reinvigorated Joint Financial ManagementImprovement Program (JFMIP) will use addedresources to help agencies in financial systems
improvement efforts. In 1999, JFMIP willrevise the Federal Supply Schedule for Federalfinancial systems, and continue to developsystems standards and other guidance docu-ments.
Table IV–5 lists the priorities of severalother inter-agency working groups: the Na-tional Partnership Council, the CFO Council,the Chief Information Officer (CIO) Council,the Electronic Processes Initiative Committee,the Federal Credit Policy Working Group,and the Federal Procurement Council.
Table IV–5. PRIORITIES OF INTER-AGENCY WORKING GROUPS
National Partnership Council
President Clinton established the National Partnership Council in October 1993 to enlist the Federal laborrelations program as an ally in reinvention, and to refocus Federal labor relations from adversarial litiga-tion to cooperative problem solving. Among the NPC’s key objectives for 1998 are the following:
• Bring high-level attention to partnership issues to ensure that partnerships are established andworking effectively throughout the Federal Government.
• Continue to focus on partnerships experiencing problems and help them overcome barriers.• Encourage partnerships to address major NPR objectives, such as increasing efficiency, improving
service, and reducing cost.
Chief Financial Officers Council
Authorized by the CFOs Act, the CFO Council is a Government-wide body that addresses critical cross-cut-ting financial issues by working collaboratively. The Council consists of the CFOs and Deputy CFOs of the24 largest Federal agencies and senior officials of OMB and Treasury. The CFO Council’s priorities are:
• Improve financial management systems.• Effectively implement the Government Performance and Results Act.• Issue accounting standards and financial statements.• Develop human resources and CFO organizations.• Improve the management of receivables.• Ensure management accountability and control.• Modernize payments and business methods.• Improve the administration of Federal assistance programs.
Chief Information Officers Council
The CIO Council’s role includes: developing recommendations for information technology managementpolicy, procedures, and standards; identifying opportunities to share information resources; and assessingand addressing the Federal Government’s needs for an information technology work force. The Council con-sists of CIOs and Deputy CIOs from 28 large Federal agencies, two CIOs from small Federal agencies, andrepresentatives from OMB and two information technology boards. The CIO Council’s priorities are:
• Define an interoperable Federal information technology architecture.• Ensure information security practices that protect Government services.• Lead the Federal year 2000 conversion effort.• Establish sound capital planning and investment practices.• Improve the information technology skills of the Federal work force.• Build relationships through outreach programs with Federal organizations, Congress, industry, and
the public.
47IV. IMPROVING PERFORMANCE THROUGH BETTER MANAGEMENT
Table IV–5. PRIORITIES OF INTER-AGENCY WORKING GROUPS—Continued
Electronic Processes Initiative Committee (EPIC)
The President’s Management Council established EPIC to integrate end-to-end business processes electroni-cally, with an emphasis on procurement and finance. EPIC consists of senior officials from DOD, theGeneral Services Administration, Treasury, and OMB. The EPIC priorities are:
• Use a multi-purpose smart card to support reengineering of business and administrative processes.• Integrate electronic buying and paying processes.• Efficiently and effectively process intra-governmental transfers that contribute to unqualfied finan-
cial statements.
Federal Credit Policy Working Group
This inter-agency forum provides advice and assistance to OMB, Treasury, and Justice in formulating andimplementing Government-wide credit management policy. Membership consists of representatives fromthe major credit and debt collection agencies and OMB. The Federal Credit Policy Working Group’s prior-ities are:
• Effective implementation of the Debt Collection Improvement Act.• Use of the Internet for credit management, especially for lending, underwriting, and portfolio status
reporting.• Sale of loan assets that are over a year delinquent.• Review agency write-off practices and Government-wide policy.• Improve prescreening of loan applications to validate eligibility and application data.
Federal Procurement Council
The Federal Procurement Council, which consists of the Senior Procurement Executives from major Federalagencies, meets regularly with OMB to discuss ways to improve the procurement process. The Federal Pro-curement Council’s priorities are:
• Promote agency use of commercial buying practices by increasing the use of performance-based serv-ice contracting, past performance in administering current contracts and selecting new contractors,electronic commerce as an enabler, and other innovative buying strategies.
• Promote the Federal procurement work force’s use of good business judgment within an adaptablesystem of flexible rules and procedures that allow professionals, working in a continuous learningenvironment, to use discretion.
• Collaborate with budget, financial, and information technology management offices to improveagency planning and management of capital asset procurement.
• Promote national socioeconomic procurement policies consistent with fostering the efficiency andeffectiveness of the procurement system.
• Promote the use of a globally competitive industrial base, integrating facilities and operations serv-ing the Government market with those serving the commercial market by reducing Government-unique requirements that restrict full integration.
• Increase customer satisfaction by routinely providing quality products and services, on time, andwithin budget.


49
V. PREPARING FOR THE 21STCENTURY

51
1. INVESTING IN EDUCATION ANDTRAINING
Americans want the best for our children. We want them to live out their dreams, empoweredwith the tools they need to make the most of their lives and to build a future where Americaremains the world’s beacon of hope and freedom and opportunity. To do this, we must all makeimproving the quality of education in America one of our highest priorities.
President ClintonSeptember 1997
In today’s fast-paced, increasingly competi-tive world economy, the most successful Ameri-cans are those with the skills to compete,making education more and more vital forall Americans. Tomorrow’s workers face aneven greater challenge. As technological inno-vations change the very nature of work,employers will demand even more highlyskilled and flexible workers. The best-payingjobs increasingly will go only to those witheducation and training beyond high school.
For the most part, our Nation places respon-sibility for education and training on Stateand local governments, families and individ-uals, and the private sector. Nevertheless,the Federal Government plays a crucial rolein supporting education and training, frompre-school through adulthood.
Over the last five years, the Presidenthas worked hard to expand Federal supportin ways that help families, communities,and States ensure that every boy and girlis prepared to make the best use of education;that the education system enables every childto learn to his or her potential; that thosewho need resources to pay for postsecondaryeducation and training can get them; thatthose who need a second chance at educationand training, or a chance to improve orlearn skills throughout their working lives,can get those opportunities; and that Statesand communities that receive Federal fundscan use them more flexibly, with fewer regula-tions and less paperwork.
The budget proposes to significantly increasefunding to help children, especially childrenin the poorest communities, reach challengingacademic standards, and it proposes to makefurther progress in implementing voluntarynational tests. At the same time, the budgetproposes major new initiatives to help familiesand caregivers more effectively begin children’seducation; to help high-poverty, low-achievingschool districts carry out reforms and holdschools accountable for improving studentachievement; to raise the rate of schoolconstruction and renovation; to fund 4,000school- and community-based sites for before-and after-school programs for children; toreduce class size by paying for 100,000 newteachers over the next seven years; to expandpublic school choice; to improve reading andmathematics achievement; and to improvethe quality of teaching and the use of tech-nology.
To ensure that Americans get the post-secondary education and training they needto succeed at work, the budget proposesto increase Pell Grants and other collegescholarship awards; to expand College Work-Study to a record one million students; tostreamline student loan programs and cutstudent fees; to continue implementing theWelfare-To-Work program; and to expand ac-cess to job placement services, training, andrelated services for dislocated workers andothers. In addition, the budget proposes newinitiatives to help colleges, high schools, andmiddle schools provide continuous mentoringand other services to encourage students
52 THE BUDGET FOR FISCAL YEAR 1999
in high-poverty areas to stay in school andprepare for college; to explain the benefitsof college and the availability of Federalstudent aid to students and their families;and to provide intensive help to joblessyouth in high-poverty areas (see Table 1–1).
Elementary and Secondary Education
Federal programs help all children, espe-cially those in high-poverty areas, achieveall they can. The budget increases supportfor most ongoing programs, and proposesnew programs with substantial resources tosupplement them. (For information on HeadStart and other important education-relatedprograms for young children, see Chapter2, ‘‘Supporting Working Families.’’)
Voluntary National Tests: The Presidenthas proposed tests—in fourth grade readingand eighth grade mathematics—with whichparents and schools can evaluate theirstudents’ achievement against challengingstandards of performance, and against theachievements of children across the countryand the world. The budget proposes $16 mil-lion to further develop the tests, which theStates would administer.
New Teachers and Smaller Class Sizes:Soaring school enrollments have caused severeteacher shortages and classroom overcrowding.The budget provides $7.3 billion over five yearsto help States reduce class size in the earlygrades by recruiting and training teachers toteach effectively in small-class settings. Re-search in Tennessee and Indiana shows thatreducing class size to 15–18 students in theearly grades improves student achievement,particularly among low-income and minoritystudents in inner cities.
Teacher Recruitment and Preparation:The budget provides $67 million, and $350 mil-lion over five years, to help improve the qual-ity of teacher preparation programs at collegesand universities and address shortages of well-prepared teachers, particularly in urban andrural schools. In 1999, the proposal would fund12 partnerships of exemplary teaching collegesand universities, urban and rural schools, andsubsidiary colleges and universities with teach-ing programs. It also would fund at least 7,000scholarships in 1999, and 35,000 over five
years, to help recruit and retain teachers forurban and rural schools.
Education Opportunity Zones: Mostschool districts with children who are thefurthest away from reaching challenging aca-demic standards serve the poorest commu-nities. The budget proposes new resources tohelp these districts if they adopt tough reformsto hold schools accountable for improving qual-ity, expanding public school choice, ending so-cial promotion, and showing real improve-ments in student achievement. About 50 high-poverty, low-achieving, urban and rural schooldistricts would receive funds for at least threeyears, and schools that show significant learn-ing gains could get funds for two more. Thebudget proposes $200 million for the initiative,and $1.5 billion over five years.
School Construction: A third of all schoolsacross the country, with 14 million students,have one or more buildings that need extensiverepair, according to the General AccountingOffice. School districts also face the cost of up-grading schools to accommodate computersand modern technology, and of constructingnew classrooms and schools to meet expectedrecord enrollment levels over the next decade.The President proposes $5 billion in tax incen-tives over five years, and more than $10 billionover 10 years, to help States and schooldistricts accelerate the pace of new construc-tion or renovation projects. States and schooldistricts will be able to leverage the Federalinvestment by amounts that are even greater.
Education Technology: In February 1996,the President challenged the public andprivate sectors to work together to ensure thatall children are technologically literate by thedawn of the 21st Century, and that schoolstake full advantage of the benefits oftechnology in raising student achievement.Achieving this goal will require progress infour areas: connecting every classroom to theInternet; expanding access to multimediacomputers; increasing the availability of high-quality educational software and content; andensuring that teachers can teach effectivelyusing technology.
The budget supports the following majorprograms that help achieve these goals, witha new focus on technology training for teach-ers, so that all new teachers entering the
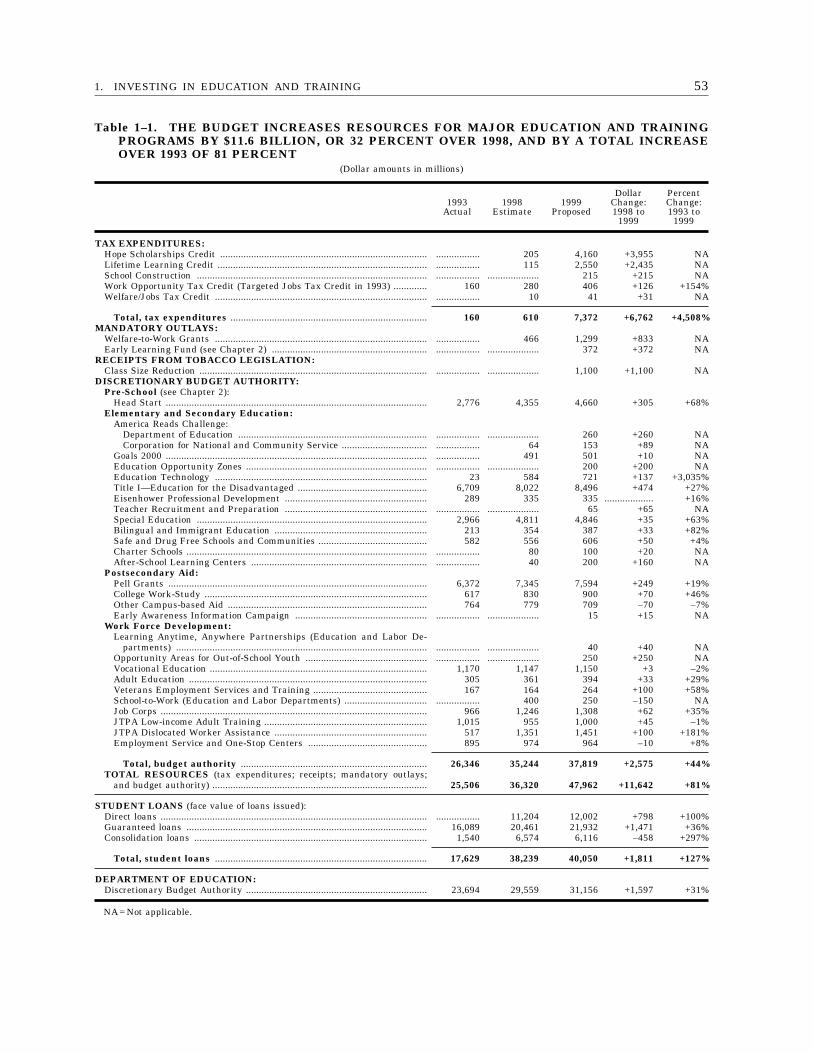
531. INVESTING IN EDUCATION AND TRAINING
Table 1–1. THE BUDGET INCREASES RESOURCES FOR MAJOR EDUCATION AND TRAININGPROGRAMS BY $11.6 BILLION, OR 32 PERCENT OVER 1998, AND BY A TOTAL INCREASEOVER 1993 OF 81 PERCENT
(Dollar amounts in millions)
1993Actual
1998Estimate
1999Proposed
DollarChange:1998 to
1999
PercentChange:1993 to
1999
TAX EXPENDITURES:Hope Scholarships Credit ................................................................................ ................. 205 4,160 +3,955 NALifetime Learning Credit ................................................................................. ................. 115 2,550 +2,435 NASchool Construction ......................................................................................... ................. .................... 215 +215 NAWork Opportunity Tax Credit (Targeted Jobs Tax Credit in 1993) ............. 160 280 406 +126 +154%Welfare/Jobs Tax Credit .................................................................................. ................. 10 41 +31 NA
Total, tax expenditures ............................................................................ 160 610 7,372 +6,762 +4,508%MANDATORY OUTLAYS:
Welfare-to-Work Grants .................................................................................. ................. 466 1,299 +833 NAEarly Learning Fund (see Chapter 2) ............................................................ ................. .................... 372 +372 NA
RECEIPTS FROM TOBACCO LEGISLATION:Class Size Reduction ........................................................................................ ................. .................... 1,100 +1,100 NA
DISCRETIONARY BUDGET AUTHORITY:Pre-School (see Chapter 2):
Head Start ..................................................................................................... 2,776 4,355 4,660 +305 +68%Elementary and Secondary Education:
America Reads Challenge:Department of Education ......................................................................... ................. .................... 260 +260 NACorporation for National and Community Service ................................. ................. 64 153 +89 NA
Goals 2000 ..................................................................................................... ................. 491 501 +10 NAEducation Opportunity Zones ...................................................................... ................. .................... 200 +200 NAEducation Technology .................................................................................. 23 584 721 +137 +3,035%Title I—Education for the Disadvantaged .................................................. 6,709 8,022 8,496 +474 +27%Eisenhower Professional Development ....................................................... 289 335 335 ................... +16%Teacher Recruitment and Preparation ....................................................... ................. .................... 65 +65 NASpecial Education ......................................................................................... 2,966 4,811 4,846 +35 +63%Bilingual and Immigrant Education ........................................................... 213 354 387 +33 +82%Safe and Drug Free Schools and Communities .......................................... 582 556 606 +50 +4%Charter Schools ............................................................................................. ................. 80 100 +20 NAAfter-School Learning Centers .................................................................... ................. 40 200 +160 NA
Postsecondary Aid:Pell Grants .................................................................................................... 6,372 7,345 7,594 +249 +19%College Work-Study ...................................................................................... 617 830 900 +70 +46%Other Campus-based Aid ............................................................................. 764 779 709 –70 –7%Early Awareness Information Campaign ................................................... ................. .................... 15 +15 NA
Work Force Development:Learning Anytime, Anywhere Partnerships (Education and Labor De-
partments) ................................................................................................. ................. .................... 40 +40 NAOpportunity Areas for Out-of-School Youth ............................................... ................. .................... 250 +250 NAVocational Education .................................................................................... 1,170 1,147 1,150 +3 –2%Adult Education ............................................................................................ 305 361 394 +33 +29%Veterans Employment Services and Training ............................................ 167 164 264 +100 +58%School-to-Work (Education and Labor Departments) ................................ ................. 400 250 –150 NAJob Corps ....................................................................................................... 966 1,246 1,308 +62 +35%JTPA Low-income Adult Training ............................................................... 1,015 955 1,000 +45 –1%JTPA Dislocated Worker Assistance ........................................................... 517 1,351 1,451 +100 +181%Employment Service and One-Stop Centers .............................................. 895 974 964 –10 +8%
Total, budget authority ........................................................................ 26,346 35,244 37,819 +2,575 +44%TOTAL RESOURCES (tax expenditures; receipts; mandatory outlays;
and budget authority) ................................................................................... 25,506 36,320 47,962 +11,642 +81%
STUDENT LOANS (face value of loans issued):Direct loans ....................................................................................................... ................. 11,204 12,002 +798 +100%Guaranteed loans ............................................................................................. 16,089 20,461 21,932 +1,471 +36%Consolidation loans .......................................................................................... 1,540 6,574 6,116 –458 +297%
Total, student loans .................................................................................. 17,629 38,239 40,050 +1,811 +127%
DEPARTMENT OF EDUCATION:Discretionary Budget Authority ...................................................................... 23,694 29,559 31,156 +1,597 +31%
NA = Not applicable.
54 THE BUDGET FOR FISCAL YEAR 1999
work force can use technology effectivelyin the classroom, and that there is at leastone teacher who can serve as a technologyexpert in every school to help other teachersuse technology.
• Technology Literacy Challenge Fund: In1996, the President committed to securing$2 billion over five years to support edu-cation technology goals. Through thisFund, States receive formula grants forbuying hardware, connecting to theInternet, training teachers, and developingand buying high-quality software. Through1998, the Fund has received $625 millionand, for 1999, the budget proposes another$475 million. In 1999, the Administrationwill encourage States to spend at least 30percent of the Fund on teacher trainingin technology use.
• Technology Innovation Challenge Grants:The budget proposes $106 million for thisprogram, which awards competitivematching funds to partnerships betweenschools and the private sector to imple-ment innovative applications of edu-cational technology.
• Technology Training for Teachers: Thebudget provides $75 million for new grantsto States, teacher colleges, and others tohelp ensure that all new teachers can usetechnology effectively.
• Community Computer Centers: The budgetproposes $10 million to help establish com-puter centers in low-income communitiesso that families that cannot afford to buycomputers at home still have access to thetechnology, and their children will not fallbehind classmates with home computers.These centers can help low-income fami-lies gain access to on-line job databasesand distance learning opportunities.
America Reads: Last year, the Presidentlaunched the America Reads Challenge, amulti-faceted effort to help States and commu-nities ensure that all children can read welland independently by the end of third grade.The budget provides $260 million for the Edu-cation Department to help train reading tutorsand coordinate after-school, weekend, andsummer reading programs that are linked toin-school instruction; help train teachers to
teach reading; and help parents help childrenprepare to learn to read. The budget also pro-poses a $89 million increase, to $153 million,for the Corporation for National and Commu-nity Service to recruit America Reads tutorsthrough its AmeriCorps and related programs.Responding to the President’s challenge, 838colleges have pledged to use tens of thousandsof federally-financed work-study positions fortutoring programs.
Mathematics Initiative: The Third Inter-national Mathematics and Science Studyrevealed that while the Nation’s fourth gradestudents are performing above average inmathematics, eighth graders are performingbelow average. In response, the Presidentasked the Education Department and theNational Science Foundation to develop aninitiative to help students meet challengingmathematics standards in the eighth grade.The budget proposes $37 million for this initia-tive, which will improve mathematics teachingthrough better teacher preparation and the useof effective instructional materials and tech-nology.
Goals 2000: Enacted in 1994, Goals 2000helps States set high standards for all chil-dren, and plan and implement steps to raiseeducational achievement. It builds on theNational Education Goals, first articulated bythe Nation’s governors (led by then-GovernorClinton) and President Bush in 1989, whichprovide national targets but encourage Statesto develop their own means to achieve them.The budget provides $501 million for Goals2000 (in which every State participates), $10million more than the 1998 level.
Charter Schools: Charter schools introducevariety and choice into the public school sys-tem. Parents, teachers, and communities cre-ate the schools, and States free them frommost rules and regulations. Charter schoolsnow number over 700, and some are alreadyproducing higher student test scores and lowerdrop-out rates. The budget proposes $100 mil-lion for public charter schools, a $20 millionincrease over the 1998 level, to fund start-upcosts for 1,300 to 1,500 schools and continueprogress toward the President’s goal of 3,000charter schools by 2001.
551. INVESTING IN EDUCATION AND TRAINING
Title I—Education for the Disadvan-taged: Title I provides funds to raise the edu-cational achievement of disadvantaged chil-dren. In 1994, the President proposed, andCongress adopted, legislation to focus Title Iresources more on low-income children, to setthe same high standards for those children asfor all others, to hold schools accountable forprogress toward achieving those standards,and to give States and schools greater flexibil-ity in using Title I funds. The budget provides$8.5 billion, six percent more than in 1998,including $7.8 billion for grants with whichschool districts can provide educational serv-ices to over 10 million children in poor commu-nities.
Comprehensive School Reform Demon-stration: This program, which Congress en-acted last year, will help nearly 3,500 schoolsNation-wide implement effective, research-based school improvement models. The budgetproposes $150 million for these demonstrationsin high-poverty schools, a $30 million increase,and $25 million for similar demonstrations inother schools.
Safe and Drug-Free Schools and Com-munities: Since 1993, this program has pro-vided a total of $3.1 billion to help 97 percentof all school districts implement anti-drug andanti-violence programs. The budget proposes$556 million, including $125 million in com-petitive grants for projects that use provenprogram designs in high-need areas. The budg-et also proposes $50 million for a new SchoolDrug Prevention Coordinators program to en-sure that half of all middle schools have adirector of drug and violence prevention pro-grams to monitor local programs and linkschool-based programs to community-basedprograms.
Special Education: Last year, the Presi-dent signed into law amendments to the Indi-viduals with Disabilities Education Act (IDEA)to help States improve educational results forchildren with disabilities by holding States ac-countable for performance and focusing re-sources on teaching and learning. The budgetprovides $4.8 billion for IDEA, including anincrease of $20 million for the Infants andFamilies program and an increase of $10 mil-lion to expand State Improvement Grants toreach 35 to 40 States.
Postsecondary Education and Training
High school is the first key step to agood job. But it is only a first step. Thosewith more years of schooling consistentlyearn more over their working careers thanthose with only a high school degree. Thecost of higher education can be imposingto many families, but Federal support throughPell Grants, work-study, student loans, HopeScholarship credits, Lifetime Learning Credits,other tax benefits, and other programs nowmake college affordable for every American.The budget proposes to help even moreyoung people go to college and to teachall families about the full range of Federalaid.
College Preparation and Attendance:The budget proposes a new $140 million initia-tive to help increase college participationamong low-income students. It also proposesa $15 million College and Financial Aid Infor-mation program—a Nation-wide informationcampaign on the benefits of higher educationand the availability of Federal resources.
Hope Scholarship Credits and LifetimeLearning Credits: Last year, the Presidentproposed, and Congress enacted, new tax bene-fits for postsecondary education for low- andmiddle-income families. With Hope Scholar-ships, students in the first two years of collegeor other eligible postsecondary training can geta tax credit of up to $1,500 for tuition andfees. In 1999, an estimated 5.5 million stu-dents will receive $4.2 billion in tax credits.Under the Lifetime Learning Credit, studentsbeyond the first two years of college, or thosetaking classes part-time to improve or upgradetheir job skills, will receive a 20-percent taxcredit for the first $5,000 of tuition and feeseach year through 2002, and a 20-percent cred-it for the first $10,000 thereafter. In 1999, anestimated 7.2 million students will receive $2.5billion in tax credits.
Pell Grants: The President proposes toraise the maximum Pell Grant award by $100,to $3,100—the highest ever—to reach 3.9 mil-lion low- and middle-income undergraduates.The budget provides $7.6 billion for PellGrants, a $249 million increase over the 1998level. In addition, in its reauthorizationproposals for 2000, the Administration will
56 THE BUDGET FOR FISCAL YEAR 1999
Investing in the Special Needs of Hispanic Americans
The education of Hispanic Americans requires special attention. Their high school drop-out rate,for example, is unacceptably high. Due in part to 1994 improvements in the way that childrenwith limited English proficiency are served, Latinos now receive 32 percent of services underTitle I (the largest elementary and secondary program), more than any other minority group. Ontop of other efforts to boost funding for programs that serve disadvantaged students, the budgettargets funding to programs that show particular promise in addressing these needs. The fund-ing increases include:
• $30 million, to a total of $150 million, for Comprehensive School Reform in high-povertyschools, providing grants for research-proven reform efforts to schools that have lowachievement and high drop-out rates;
• $25 million, to $50 million, for Bilingual Education Professional Development, givingteachers the skills they need to help their students learn English and meet challengingacademic standards;
• $53 million, to $583 million, for the TRIO programs that work with low-income highschool and college students to encourage them to complete high school and attend, andgraduate from, college;
• $16 million, to $28 million, for assistance for colleges and universities that serve largenumbers of Hispanic students;
• $5 million, to $15 million, for the High School Equivalency Program for migrants and theCollege Assistance Migrant Program;
• $33 million, to $394 million, for Adult Education to expand services and improve Englishas a Second Language programs by identifying and disseminating proven and promisingpractices;
• $50 million, to $355 million, for Title I-Migrant Education, which provides additional edu-cational assistance to migrant children; and
• $5 million for a Labor Department demonstration program to develop new training, andwork and learning opportunities to help young migrant farm workers qualify for other jobopportunities with career potential.
propose to expand Pell Grants to reach morelow-income independent students and others.
Work-Study: In 1996, the President commit-ted to expanding the Work-Study program toone million students by the year 2000. Thebudget reaches the goal one year early. In1999, one million needy students would earntheir work-study awards by helping theirschools or surrounding communities. Thebudget provides $900 million—the highestlevel ever—a $70 million increase over the1998 level.
Student Loans: An estimated 6.2 millionpeople will borrow $40 billion through theFederal student loan programs in 1999. TheAdministration proposes to improve financialincentives in the Federal Family EducationLoan program, which guarantees commercialloans through intermediaries known as
guaranty agencies, and ensure continuedinnovation in the Direct Loan program, whichprovides capital directly to schools and stu-dents. The budget proposes to streamline theGovernment-guaranty system, to save moneyfor students and families, and to improve serv-ices to both schools and borrowers.
A new interest rate structure for studentloans, scheduled to take effect on July 1,1998, may prompt some lenders in the Govern-ment-guaranteed loan system to withdrawrather than accept lower revenues. The Admin-istration plans to work with Congress ona rate structure that ensures that studentscontinue to enjoy access to loans but thatstill limits student costs.
571. INVESTING IN EDUCATION AND TRAINING
Improving Student Loan Programs
The budget proposes reforms in both the direct and guaranteed student loan programs that willbenefit students, taxpayers, and schools, as outlined below.
Providing More Benefits to Students• Cut origination fees on new loans to students and parents to three percent, from four per-
cent.• Phase out origination fees for needy students.• Require lenders to offer flexible repayment terms to borrowers.
Streamlining the Government-Guaranteed Loan System• Establish performance agreements with guaranty agencies, with compensation tied to the
amount and quality of work they perform.• Recapture unneeded Federal funds held by guaranty agencies.
Improving Loan Management• Ensure that both loan programs use private industry best practices, such as electronic
loan origination and access on the Internet to loan balance information, to improve cus-tomer service, minimize defaults, and improve loan servicing.
• Standardize processes and data formats as much as possible in both Federal loan pro-grams to increase efficiency and lower costs.
Innovations for Access and Retentionamong Low-Income Students, EspeciallyMinorities: Although the Federal Governmentprovides significant resources to finance highereducation for everyone who needs the help,some groups of Americans, especially some mi-norities, still attend college at lower rates thanothers and drop out at higher rates. The budg-et provides $20 million for rigorously designedexperiments to determine how to promotegreater college attendance and completionamong these groups.
Learning Anytime, Anywhere Partner-ships: The budget proposes $40 million ($30million in the Education Department, $10 mil-lion in the Labor Department) to enhance andpromote distance learning opportunities (i.e.,learning outside the usual classroom settings,via computers and other technology) for alladult learners. In Education, the programwould fund partnerships among educationalinstitutions, software developers, subject mat-ter specialists, and private employers todevelop new means of delivering distancelearning, and of assessing competencies of dis-tance learners. In Labor, the program wouldsupport information for job seekers, employers,and workers on the skills required for variousoccupations, and the training needed andavailable to acquire them.
Work Force Development
With college now affordable to every Amer-ican through the broad array of Federalassistance, the Administration seeks to ensurethat every adult has access to employmentand training services. Adults who lose jobsand need new jobs or new skills to getthose jobs, adults who are seeking jobs forthe first time, or adults who want newskills to advance or change their careersneed a broad array of financial and programsupports—especially as workers strive to suc-ceed in the fast-changing new economy.
To the extent that adults need resourcesfor traditional education and certain job train-ing, the major postsecondary programs (de-scribed earlier in this chapter) cover mostof their need. All adults can get loan assist-ance to finance postsecondary degrees orcertificates; all low-income adults seeking un-dergraduate degrees can get Pell Grants;and all low- and middle-income adults canget tax credits for job training and post-secondary education expenses under the HopeScholarship and Lifetime Learning Credits.
In addition, all adults working in jobscovered by the Unemployment Insurance sys-tem are eligible, in accord with State laws,for income support when they lose jobs.
58 THE BUDGET FOR FISCAL YEAR 1999
Many of them are also eligible for otherincome support if they lose jobs for specificreasons, such as the impact of certain tradepolicy. All adults can get job search assistancethrough One-Stop Career Centers, an Adminis-tration initiative of the last five years thathas greatly improved the core EmploymentService system and greatly improved employ-ment services and job and labor marketinformation. Adults also have increasinglygreater access to job information throughthe Internet and will have still greater oppor-tunities through the Learning Anytime, Any-where Partnerships described earlier in thischapter. Nevertheless, the system for adultsis not yet complete.
The budget proposes to build on the initia-tives, enacted in 1997, that began the processof ensuring that State unemployment insur-ance funds will be sufficiently solvent incase of an economic downturn. The budgetalso proposes to improve the mechanismsto supplement regular unemployment insur-ance with Extended Benefits when individualStates experience economic downturns.
Since 1993, the President has worked withCongress to more than double funding fordislocated worker training and employmentassistance and is proposing major new invest-ments in the employment and training needsof veterans. But, many adults need morethan financial help for training or incomesupport when they are between jobs. Thesystem of programmatic support for theseadults is primarily represented by the JobTraining Partnership Act (JTPA), includingits Dislocated Worker and Adult trainingprograms. The Administration continues tobelieve that it is critical to restructure andstreamline Federal work force programs sothey can better serve workers and thosewho want to work. The Administration firstproposed comprehensive reform in its 1995GI Bill for America’s Workers, and it isworking closely with Congress to fashionmajor reform and streamlining of job trainingprograms, vocational education, and adulteducation programs.
The Administration is committed to improvethe system for adults so that, in time,all adults will be able to afford, and haveaccess to, the training and job placement
and related services they need. The budgetproposes to make further progress towardthis goal through the work force developmentproposals described below.
• Dislocated Worker Training: The budgetproposes $1.5 billion, an increase of $100million and nearly three times the amountavailable when the President took office,to provide readjustment services, jobsearch assistance, training, and relatedservices to help dislocated workers findnew jobs as quickly as possible. Amongthe workers assisted by the program, andthe proposed increase, are those displacedby trade and related causes.
• Low-Income Adult Training: The budgetproposes $1 billion, an increase of $45 mil-lion, for the JTPA program that providestraining for disadvantaged and low-incomeunemployed adults, including welfare re-cipients.
• Welfare-To-Work: To help reach theTemporary Assistance for Needy Familiesprogram’s employment goal for welfare re-cipients, the Administration sought, andCongress provided, additional targetedfunds for a new Labor Department wel-fare-to-work grants program. It will pro-vide a total of $3 billion in 1998 and 1999for formula and competitive grants toStates and local communities to give long-term welfare recipients the job placementservices, transitional employment, and jobretention and support services they needto achieve economic self-sufficiency.
• Adult Education: This program helpsalmost four million educationally dis-advantaged adults, including welfare re-cipients and immigrants, develop basicskills (including literacy), achieve theircertification of high school equivalency,and learn English. The budget proposes$394 million, an increase of $33 millionover the 1998 level.
• One-Stop Employment Service: The budgetproposes $817 million for grants to theState Employment Service system, and$147 million to complete the initial devel-opment of the One-Stop Career Centersystem and to continue building America’sLabor Market Information System. By the
591. INVESTING IN EDUCATION AND TRAINING
end of 1999, all States will have receivedgrants to implement One-Stop systemsthat streamline re-employment and careerdevelopment activities by improving accessto services for job seekers and employers.
• Unemployment Insurance: Experiencedworkers who lose their jobs generally areeligible for up to 26 weeks of unemploy-ment benefits. Although benefits vary byState, the average benefit Nation-wide isnearly $200 a week. An estimated 8.3 mil-lion people will draw benefits in 1999. Tomake the system even more secure, theAdministration will propose legislation in1999 that will strengthen the unemploy-ment insurance safety net so that benefitsare available in the event of a recession,improve State administrative operations,and make the standby Extended Benefitsprogram more responsive to State unem-ployment.
• Trade Adjustment Assistance (TAA): Thebudget includes several proposals to carryout the President’s commitment to helptrade-impacted workers by providingbetter access to training and income sup-port: extending the TAA and NAFTA-Transitional Adjustment Assistance(NAFTA-TAA) programs for five years; ex-panding eligibility for TAA benefits tocover workers who lose jobs when plantsor production shifts abroad; raising thestatutory cap on training expenses; mak-ing training and income support more con-sistent across the TAA and NAFTA-TAAprograms; and adding a contingency provi-sion to ensure that the Federal Govern-ment has sufficient funds to finance anyunexpected increase in benefit costs for eli-gible workers. The budget proposes to in-crease TAA programs by $737 million overfive years.
• Montgomery GI Bill (MGIB) and VeteransTraining and Employment: Over 400,000veterans and reservists will receiveeducation benefits under the MGIB Active-Duty program, which helps servicemembers readjust to civilian life after mili-tary service, and the MGIB Reservist pro-gram. The budget proposes a 20-percentbenefit rate increase for MGIB trainees—the most significant increase since the pro-
gram’s inception—raising the Active-DutyMGIB benefit to over $500 a month in1999 for full-time enrollment, most ofwhich is in colleges. Along with the MGIBbenefit increase, for which the budget pro-vides $1 billion over five years, the budgetalso proposes an increase of $100 million,and $500 million over five years, to ex-pand the Labor Department’s veteransemployment and training programs.
Youth Programs: While continuing toimprove the education of young people andeliminate financial barriers to postsecondaryeducation and training for all, the budget con-tinues support for State development of school-to-work systems and for Labor Departmentprograms to help disadvantaged youth preparefor careers.
• School-to-Work: Funded and administeredby the Education and Labor Departments,this initiative makes competitive awardsto States and communities to buildcomprehensive systems that help youngpeople move from high school to careersor postsecondary training and education.School-to-Work supports school reformsand ties between schools and employers,enabling young people to prepare for high-skill, high-wage careers; receive top-qual-ity academic and occupational training;and pursue more postsecondary educationor training. The budget proposes $250 mil-lion, $150 million less than the 1998 level,reflecting the gradual sunsetting of theprogram as States implement and sustaintheir own systems.
• Youth Opportunity Areas: Recognizing thespecial problems of out-of-school youth,especially in inner-cities and other areaswhere jobless rates can top 50 percent, thebudget includes $250 million for competi-tive grants to selected high-poverty urbanand rural areas with major youth unem-ployment problems. The Labor Depart-ment will award funds to those high-pov-erty areas, including federally-designatedEmpowerment Zones and EnterpriseCommunities, that submit applicationsshowing that they have the best chanceof substantially increasing employmentamong out-of-school youth. These ‘‘seed’’funds will leverage State, local, and pri-
60 THE BUDGET FOR FISCAL YEAR 1999
vate resources to employ youth in privatesector jobs with good career opportunities.(For more information on EmpowermentZones and Enterprise Communities, seeChapter 8, ‘‘Strengthening the AmericanCommunity.’’)
• Summer and Year-Round Youth Employ-ment and Training: The summer jobs pro-gram gives hundreds of thousands ofurban and rural disadvantaged youth theirfirst work experience. The budget provides$871 million to finance 530,000 job oppor-tunities for the summer of 1999, assumingthat localities spend this flexible fundingentirely on summer jobs. The budget alsoincludes $130 million for the year-roundprogram to help low-income youth—manyof them in families on public assistance—who have dropped out of school, or areat risk of doing so, return to school oralternative learning programs. The budgetwould continue to permit local service de-livery areas that receive both types ofthese funds to shift resources between thesummer and year-round programs, as localneeds dictate.
• Job Corps: The Job Corps provides inten-sive, work-related vocational skills train-ing, integrated with academic and socialeducation, and support services to severelydisadvantaged young people in a struc-tured residential setting. The budget pro-poses $1.3 billion, an increase of $62 mil-lion over the 1998 level, to open three tofive new centers, fund opportunities for70,000 young people, and maintain prog-ress on quality improvements begun in1998.
Child Labor Abuses
Responding to growing concern for theworking conditions of children all over the
world, the budget proposes $89 million toaddress the issue. Along with the proposed$50 million increase for Title I—MigrantEducation, described earlier in this chapter,the budget proposes $39 million for a two-pronged attack on domestic and internationalchild labor abuses.
International Child Labor Activities: Thebudget proposes a $27 million increase, to $30million, for the Labor Department to enablethe International Labor Organization’s Inter-national Programme to Eliminate Child Laborto expand its work into more countries andindustries. The proposed five-year, $150 mil-lion investment will help ensure that goodsproduced abroad for the U.S. market are notmade with illegal child labor. The budget alsoproposes $3 million to enable the CustomsService to enforce the law banning the importof goods made with forced or bonded childlabor.
Domestic Child Labor Activities: Thebudget proposes $9 million for the Labor De-partment, including $4 million to help elimi-nate domestic violations of child labor laws,particularly in the agriculture sector, and $5million for demonstration programs to providealternatives to field work for migrant youth.
Education and Employment for Peoplewith Disabilities
The budget proposes to maintain or increasemost programs for people with disabilities,providing, for instance, a 16-percent increasefor certain activities that enforce the Ameri-cans with Disabilities Act. The Administrationwill continue to press Congress to enactits proposal to help more people leave thedisability rolls to return to work. In addition,the budget includes $2.4 million for an initia-tive to develop new policies to reduce barriersto employment for people with disabilities.
61
2. SUPPORTING WORKING FAMILIES
My friends, for centuries, over two now, the American Dream has represented a compact thatthose who work hard and play by the rules should be able to build better lives for themselves andfor their children. In this time, and even more into the future, child care that is too expensive, un-safe or unavailable will be a very stubborn obstacle to realizing that dream. So let us commitourselves to clearing the obstacle, to helping parents fulfill their most sacred duty, to keeping theAmerican Dream alive for them and most important, for their children.
President ClintonOctober 1997
The President has worked hard to improvethe lives of working families, financially andotherwise.
The new Child Credit, coupled with amajor expansion of the Earned Income TaxCredit (EITC) in 1993, provides significanttax relief for working families that are tryingto raise their children and make ends meet.The Child Credit will help 26 million familiesa year, while the EITC expansion is alreadyhelping 15 million. Together, the Child Creditand the EITC will provide nearly $250 billionin tax relief from 1999 to 2003. In addition,the minimum wage increase that the Presidentsuccessfully sought gives a big financial boostto full-time, full-year minimum wage workers,raising the pay of each by $1,800 a year.
Other new policies enable parents to meettheir families’ health needs without riskingtheir jobs, to change jobs without riskingtheir health insurance, and to find healthinsurance for their children when they couldnot otherwise afford it. The Family andMedical Leave Act allows workers to takeup to 12 weeks of unpaid leave to carefor a newborn or adopted child, or to attendto their own health needs or those of aseriously ill family member. The Health Insur-ance Portability and Accountability Act pro-tects an estimated 25 million Americans ayear, allowing them to switch jobs withoutlosing their health insurance. The self-em-ployed and those with pre-existing conditionsalso will have an easier time finding and
keeping their health insurance. The newChildren’s Health Insurance Program (CHIP),enacted as part of the 1997 Balanced BudgetAct (BBA), will enable millions of low-incomeworking families to more easily find healthinsurance for their children.
Nevertheless, one major area remains inwhich working families need more help—child care. For one thing, parents need morehelp when it comes to purchasing childcare. For another, when they go to work,they should know that their children arein safe, healthy environments. By helpingparents manage the twin demands of workand family, the President’s Child Care Initia-tive, with its array of new benefits, is thelogical next part of his agenda for workingfamilies.
In addition, the President proposes to ad-dress the problems faced by a particulargroup of working families—legal immigrants.The budget would restore Food Stamps to730,000 legal immigrants, and let Statesprovide health insurance under Medicaid andCHIP to the children of legal immigrants.As the President said at the time, theprovisions of the 1996 welfare reform lawthat stripped legal immigrants of basic safetynet protections were not only harsh andunnecessary, they also had nothing to dowith the fundamental goal of welfare reform—to move people from welfare to work whileprotecting children.
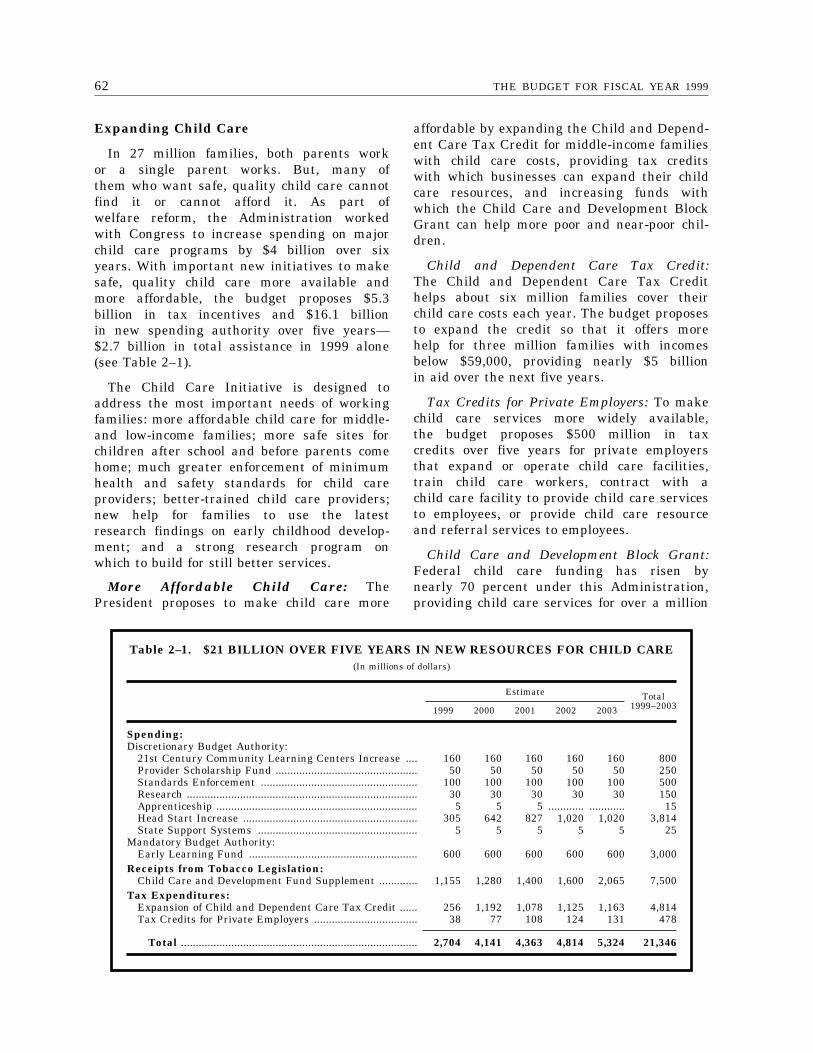
62 THE BUDGET FOR FISCAL YEAR 1999
Table 2–1. $21 BILLION OVER FIVE YEARS IN NEW RESOURCES FOR CHILD CARE(In millions of dollars)
Estimate Total1999–20031999 2000 2001 2002 2003
Spending:Discretionary Budget Authority:
21st Century Community Learning Centers Increase .... 160 160 160 160 160 800Provider Scholarship Fund ................................................ 50 50 50 50 50 250Standards Enforcement ..................................................... 100 100 100 100 100 500Research .............................................................................. 30 30 30 30 30 150Apprenticeship .................................................................... 5 5 5 ............ ............ 15Head Start Increase ........................................................... 305 642 827 1,020 1,020 3,814State Support Systems ...................................................... 5 5 5 5 5 25
Mandatory Budget Authority:Early Learning Fund ......................................................... 600 600 600 600 600 3,000
Receipts from Tobacco Legislation:Child Care and Development Fund Supplement ............. 1,155 1,280 1,400 1,600 2,065 7,500
Tax Expenditures:Expansion of Child and Dependent Care Tax Credit ...... 256 1,192 1,078 1,125 1,163 4,814Tax Credits for Private Employers ................................... 38 77 108 124 131 478
Total ................................................................................ 2,704 4,141 4,363 4,814 5,324 21,346
Expanding Child Care
In 27 million families, both parents workor a single parent works. But, many ofthem who want safe, quality child care cannotfind it or cannot afford it. As part ofwelfare reform, the Administration workedwith Congress to increase spending on majorchild care programs by $4 billion over sixyears. With important new initiatives to makesafe, quality child care more available andmore affordable, the budget proposes $5.3billion in tax incentives and $16.1 billionin new spending authority over five years—$2.7 billion in total assistance in 1999 alone(see Table 2–1).
The Child Care Initiative is designed toaddress the most important needs of workingfamilies: more affordable child care for middle-and low-income families; more safe sites forchildren after school and before parents comehome; much greater enforcement of minimumhealth and safety standards for child careproviders; better-trained child care providers;new help for families to use the latestresearch findings on early childhood develop-ment; and a strong research program onwhich to build for still better services.
More Affordable Child Care: ThePresident proposes to make child care more
affordable by expanding the Child and Depend-ent Care Tax Credit for middle-income familieswith child care costs, providing tax creditswith which businesses can expand their childcare resources, and increasing funds withwhich the Child Care and Development BlockGrant can help more poor and near-poor chil-dren.
Child and Dependent Care Tax Credit:The Child and Dependent Care Tax Credithelps about six million families cover theirchild care costs each year. The budget proposesto expand the credit so that it offers morehelp for three million families with incomesbelow $59,000, providing nearly $5 billionin aid over the next five years.
Tax Credits for Private Employers: To makechild care services more widely available,the budget proposes $500 million in taxcredits over five years for private employersthat expand or operate child care facilities,train child care workers, contract with achild care facility to provide child care servicesto employees, or provide child care resourceand referral services to employees.
Child Care and Development Block Grant:Federal child care funding has risen bynearly 70 percent under this Administration,providing child care services for over a million
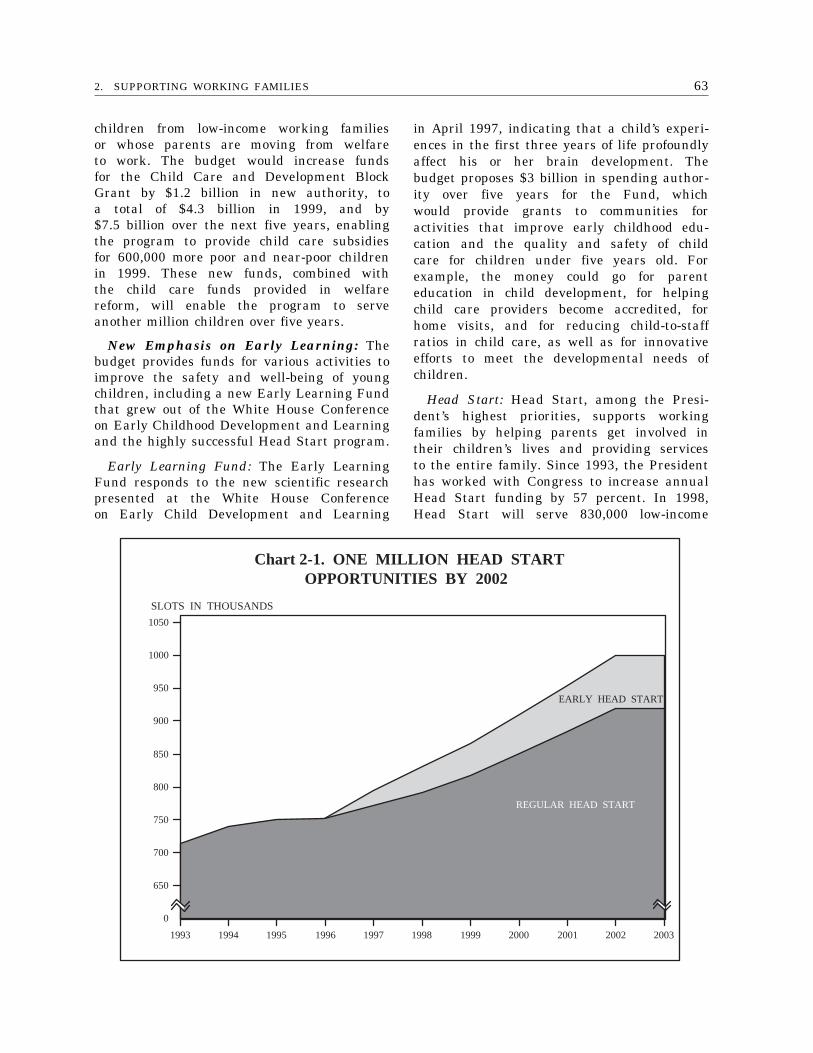
632. SUPPORTING WORKING FAMILIES
1993 1994 1995 1996 1997 1998 1999 2000 2001 2002 2003
600
650
700
750
800
850
900
950
1000
1050
Chart 2-1. ONE MILLION HEAD STARTOPPORTUNITIES BY 2002
SLOTS IN THOUSANDS
REGULAR HEAD START
EARLY HEAD START
children from low-income working familiesor whose parents are moving from welfareto work. The budget would increase fundsfor the Child Care and Development BlockGrant by $1.2 billion in new authority, toa total of $4.3 billion in 1999, and by$7.5 billion over the next five years, enablingthe program to provide child care subsidiesfor 600,000 more poor and near-poor childrenin 1999. These new funds, combined withthe child care funds provided in welfarereform, will enable the program to serveanother million children over five years.
New Emphasis on Early Learning: Thebudget provides funds for various activities toimprove the safety and well-being of youngchildren, including a new Early Learning Fundthat grew out of the White House Conferenceon Early Childhood Development and Learningand the highly successful Head Start program.
Early Learning Fund: The Early LearningFund responds to the new scientific researchpresented at the White House Conferenceon Early Child Development and Learning
in April 1997, indicating that a child’s experi-ences in the first three years of life profoundlyaffect his or her brain development. Thebudget proposes $3 billion in spending author-ity over five years for the Fund, whichwould provide grants to communities foractivities that improve early childhood edu-cation and the quality and safety of childcare for children under five years old. Forexample, the money could go for parenteducation in child development, for helpingchild care providers become accredited, forhome visits, and for reducing child-to-staffratios in child care, as well as for innovativeefforts to meet the developmental needs ofchildren.
Head Start: Head Start, among the Presi-dent’s highest priorities, supports workingfamilies by helping parents get involved intheir children’s lives and providing servicesto the entire family. Since 1993, the Presidenthas worked with Congress to increase annualHead Start funding by 57 percent. In 1998,Head Start will serve 830,000 low-income
64 THE BUDGET FOR FISCAL YEAR 1999
children, including up to 40,000 childrenunder age three in the Early Head Startcomponent that the President launched in1995. The budget proposes to add 20,000to 26,000 regular Head Start slots and 10,000Early Head Start slots in 1999, makingfurther progress toward the President’s goalof enrolling a million children in Head Startby 2002. The budget also would expandHead Start funding by $3.8 billion overfive years, providing $4.7 billion in 1999and doubling the number of slots in EarlyHead Start by 2002 (see Chart 2–1).
School-Age Care: The President workedwith Congress to expand 21st Century Com-munity Learning Centers, enabling 400 schoolsin 1998 to open their doors before the schoolday begins or keep them open after the schoolday ends. The budget proposes a further ex-pansion, and a requirement for matchingfunds, so that about 4,000 school-communitypartnerships across the country can implementbefore- and after-school programs. Instead ofreturning to empty houses, or playing on un-safe streets, up to 500,000 more children wouldbe able to participate in safe, drug-free pro-grams that combine learning, enrichment, andrecreational activities. The budget proposes$800 million in new funds over five years, fora total of $1 billion.
Safety and Quality: The budget proposesto increase funds to help States enforce childcare quality standards, and the President callsagain for Congress to pass legislation to im-prove the safety of children by making it easierfor States to conduct background checks onchild care workers.
Standards Enforcement: Research and expe-rience in the military child care programshow that diligent enforcement of standardsdramatically improves quality. The budgetproposes $500 million over five years tohelp States enforce State and local childcare health, safety, and quality standards.States would be able to help license andaccredit child care providers and centers,increase unannounced inspections of childcare centers and family day care homes,and develop local report cards that rankchild care providers.
National Crime Prevention and PrivacyCompact: The President has sent importantlegislation to Congress to improve the qualityof child care and protect children’s safety.This legislation—the National Crime Preven-tion and Privacy Compact—would make back-ground checks on child care providers moreefficient and accurate by eliminating Statebarriers to sharing criminal histories fornon-criminal purposes.
More and Better Training for Child CareStaff: The budget proposes $250 million overfive years for a new Child Care Provider Schol-arship Fund, which the President announcedat the White House Conference on Child Care.Along with State and local matching funds,the Scholarship Fund would provide over $300million in scholarships over the next five yearsfor up to 250,000 child care providers—improv-ing the quality of child care for over half amillion children. This proposal would boost thepay of providers who receive training and re-duce the problem of high turnover by requiringthat they stay in the field for at least a year.In addition, the budget would expand an ap-prenticeship program to finance the trainingof child care providers.
The Fund builds on the President’s historicachievements over the last five years topromote lifelong learning, which include secur-ing the largest increase in Pell Grant collegescholarships in over 20 years, creating Hopeand Lifetime Learning Tax Credits, expandingCollege Work-Study, creating the Direct Lend-ing program that lets students repay theirloans as a share of their income, and launch-ing AmeriCorps to enable young people toearn money for college while serving theircountry. Every individual who needs financialsupport for postsecondary education can getit through these programs.
Families of Children with Disabilities:The budget proposes $5 million to help thefamilies of children with disabilities. This newprogram would provide grants for States toexpand and modify their State-wide supportsystems to help these families address suchproblems as inadequate child care options,missed job training and job opportunities, theloss of medical assistance, and teen pregnancy.
652. SUPPORTING WORKING FAMILIES
Research on Childhood Developmentand Child Care: Research on child care, andits dissemination, is critical for policy makersto make decisions about child care and for par-ents to know where to find quality child careand what to look for. The budget proposes$150 million over five years for a new Re-search and Evaluation Fund, which would pro-vide consumer education, parent hotlines, andresearch activities to expand our knowledge ofgood policies and practices, including the typesof child care settings, parent activities, andprovider training that most benefit the earlydevelopment of children. This fund would alsosupport a National Center on Child Care Sta-tistics as well as demonstration projects to testapproaches to help new parents who chooseto stay home with their newborns or newlyadopted children.
Restoring Equity in Benefits for LegalImmigrants
The President believes that legal immigrantsshould have the same opportunity, and bearthe same responsibility, as other membersof society. Upon signing the 1996 welfarelaw, he pledged to work toward reversingthe harsh, unnecessary cuts in benefits tolegal immigrants that had nothing to dowith the goal of moving people from welfareto work. As part of last year’s BBA, thePresident worked with Congress to restoreMedicaid and Supplemental Security Income(SSI) to hundreds of thousands of disabledand elderly legal immigrants.
Due to the 1996 law, however, many legalimmigrants still cannot get Food Stampsand access to health care, including suchvulnerable groups as families with children,people with disabilities, the elderly, and refu-gees and asylees. The budget provides $2.7billion over five years to restore Food Stampsto vulnerable groups and to let States providehealth care to the children of legal immigrants.
Food Stamps: For legal immigrant familieswith children, the budget would restore bene-fits without regard to when they entered theUnited States. For the elderly or people withdisabilities, the budget would restore benefitsto those who entered before Congress enactedthe benefit cuts—similar to how the Presidentand Congress restored Medicaid and SSI to
legal immigrants last year. For refugees andasylees, the budget would lengthen their ex-emption to the Food Stamp ban from five toseven years. The Nation admits refugees andasylees for humanitarian reasons, and manymay need more time to naturalize than thelaw allows. The budget also would exemptfrom the ban Hmong refugees from Laos whoimmigrated to the United States after theVietnam conflict and certain Native Americansliving along the Canadian and Mexican bor-ders.
Health Care: The budget would let Statesprovide health coverage to legal immigrantchildren under Medicaid and CHIP. Currently,States can provide health coverage to immi-grant children who entered the country beforethe welfare law was enacted. But, immigrantchildren who entered after the law was en-acted cannot get benefits for five years. Underthis proposal, States could provide health cov-erage to those children through Medicaid orthrough their current CHIP allotment.
Continuing Support for Working Families
The Child Care Initiative and the proposalsto restore benefits to legal immigrants buildon a strong base of support for workingfamilies, which the President has workedwith Congress to achieve over the past fiveyears. That support includes a broad arrayof tax incentives to encourage and supportwork as well as legislation to, among otherthings, enable workers to care for a newbornand fulfill other family responsibilities; raisethe minimum wage; enable workers to retaintheir health insurance; and provide healthinsurance to up to five million uninsuredchildren. (For the broader discussion of thehealth care expansions, see Chapter 3,‘‘Strengthening Health Care.’’)
Support Through the Tax System: Overthe last five years, the Administration hasworked with Congress to expand the numberand size of tax incentives to encourage workand support working families (see Table 2–2).
• EITC: As an important part of movingpeople from welfare to work, the FederalGovernment can help ensure that thosewho work can support their children. TheEITC, a tax credit that Congress createdover 20 years ago, helps to meet this goal
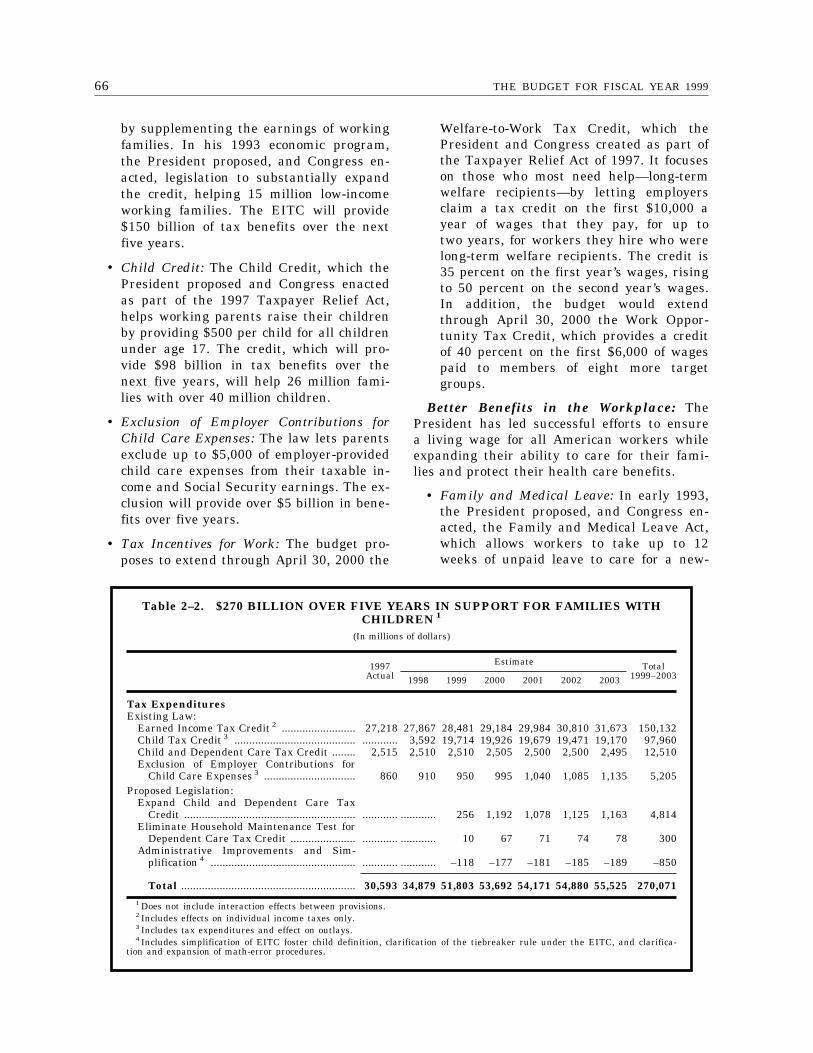
66 THE BUDGET FOR FISCAL YEAR 1999
Table 2–2. $270 BILLION OVER FIVE YEARS IN SUPPORT FOR FAMILIES WITHCHILDREN 1
(In millions of dollars)
1997Actual
Estimate Total1999–20031998 1999 2000 2001 2002 2003
Tax ExpendituresExisting Law:
Earned Income Tax Credit 2 ......................... 27,218 27,867 28,481 29,184 29,984 30,810 31,673 150,132Child Tax Credit 3 ......................................... ............ 3,592 19,714 19,926 19,679 19,471 19,170 97,960Child and Dependent Care Tax Credit ........ 2,515 2,510 2,510 2,505 2,500 2,500 2,495 12,510Exclusion of Employer Contributions for
Child Care Expenses 3 ............................... 860 910 950 995 1,040 1,085 1,135 5,205Proposed Legislation:
Expand Child and Dependent Care TaxCredit .......................................................... ............ ............ 256 1,192 1,078 1,125 1,163 4,814
Eliminate Household Maintenance Test forDependent Care Tax Credit ...................... ............ ............ 10 67 71 74 78 300
Administrative Improvements and Sim-plification 4 ................................................. ............ ............ –118 –177 –181 –185 –189 –850
Total ........................................................... 30,593 34,879 51,803 53,692 54,171 54,880 55,525 270,0711 Does not include interaction effects between provisions.2 Includes effects on individual income taxes only.3 Includes tax expenditures and effect on outlays.4 Includes simplification of EITC foster child definition, clarification of the tiebreaker rule under the EITC, and clarifica-
tion and expansion of math-error procedures.
by supplementing the earnings of workingfamilies. In his 1993 economic program,the President proposed, and Congress en-acted, legislation to substantially expandthe credit, helping 15 million low-incomeworking families. The EITC will provide$150 billion of tax benefits over the nextfive years.
• Child Credit: The Child Credit, which thePresident proposed and Congress enactedas part of the 1997 Taxpayer Relief Act,helps working parents raise their childrenby providing $500 per child for all childrenunder age 17. The credit, which will pro-vide $98 billion in tax benefits over thenext five years, will help 26 million fami-lies with over 40 million children.
• Exclusion of Employer Contributions forChild Care Expenses: The law lets parentsexclude up to $5,000 of employer-providedchild care expenses from their taxable in-come and Social Security earnings. The ex-clusion will provide over $5 billion in bene-fits over five years.
• Tax Incentives for Work: The budget pro-poses to extend through April 30, 2000 the
Welfare-to-Work Tax Credit, which thePresident and Congress created as part ofthe Taxpayer Relief Act of 1997. It focuseson those who most need help—long-termwelfare recipients—by letting employersclaim a tax credit on the first $10,000 ayear of wages that they pay, for up totwo years, for workers they hire who werelong-term welfare recipients. The credit is35 percent on the first year’s wages, risingto 50 percent on the second year’s wages.In addition, the budget would extendthrough April 30, 2000 the Work Oppor-tunity Tax Credit, which provides a creditof 40 percent on the first $6,000 of wagespaid to members of eight more targetgroups.
Better Benefits in the Workplace: ThePresident has led successful efforts to ensurea living wage for all American workers whileexpanding their ability to care for their fami-lies and protect their health care benefits.
• Family and Medical Leave: In early 1993,the President proposed, and Congress en-acted, the Family and Medical Leave Act,which allows workers to take up to 12weeks of unpaid leave to care for a new-
672. SUPPORTING WORKING FAMILIES
born or adopted child, attend to their ownserious health needs, or care for a seri-ously ill parent, child, or spouse—makingit less likely that employees will have tochoose between work and family.
• Minimum Wage: By 1996, the value of theminimum wage had neared a 40-year low.That year, however, the President workedwith Congress to raise the minimum wagefrom $4.25 to $5.15 an hour in two steps,over two years. The first step, a 50-centincrease, took effect in October 1996; thesecond, a 40-cent increase, took effect 11months later, on September 1, 1997. The90-cent raise means $1,800 a year in high-er earnings for full-time, full-year mini-mum wage workers. Millions of other low-wage workers making somewhat morethan the new minimum also will benefitif employers raise their paychecks in step
with the minimum wage increase—as theyhave done in the past.
• Health Insurance Portability and Account-ability Act: Working with Congress, thePresident in 1996 pushed through land-mark legislation, known as HIPAA, whichprovides important health insurance pro-tections for an estimated 25 million Ameri-cans who move from one job to anothereach year, as well as those who are self-employed or who have pre-existing medicalconditions. HIPAA reformed the privateinsurance market to ensure that workershave portable health benefits and insurersare less able to deny coverage due to pre-existing conditions. Combined with theTaxpayer Relief Act, HIPAA also made iteasier and cheaper for self-employed per-sons to get health insurance.

69
3. STRENGTHENING HEALTH CARE
[The Balanced Budget Act] strengthens our families by extending health insurance coverage toup to five million children . . . [The Act] honors our commitment to our parents by extending thelife of the Medicare Trust Fund for a decade. It also provides structural reforms that will giveMedicare beneficiaries more informed choices among competing health plans, authorizes a num-ber of new anti-fraud provisions, and establishes a wide array of new preventative benefits.
President ClintonAugust 1997
The past year has brought a number ofimprovements in health care that will benefitall Americans.
The 1997 Balanced Budget Act (BBA) rep-resents a major step forward in the President’seffort to improve and protect the Nation’shealth, especially for the almost 70 millionvulnerable Americans who rely on Medicareand Medicaid. It strengthened the guaranteeof quality health care for nearly 40 millionMedicare participants by extending the lifeof the Medicare Trust Fund until at least2010, investing in preventive benefits, intro-ducing more choice of health plans, andstrengthening our expanding array of activitiesto combat fraud and abuse. It strengthenedMedicaid managed care quality standardsand allowed States greater flexibility in de-signing their programs. And it provided anunprecedented $24 billion, through the StateChildren’s Health Insurance Program (CHIP)and new Medicaid options, to cover up tofive million children in working families—a population in which many have no insuranceat all.
These wide-ranging efforts came just ayear after the President and Congress enactedthe Health Insurance Portability and Account-ability Act (HIPAA), which the Administrationis now implementing. HIPAA reformed theprivate insurance market to help people keeptheir health insurance when they changejobs and limited the ability of insurers todeny coverage due to pre-existing conditions.It also simplified health care paperwork,clarified that certain long-term care insurancepolicies are tax deductible, and, for the first
time, created a new stable source of fundingto control fraud. Also, combined with the1997 Taxpayer Relief Act, HIPAA boostedthe tax deduction for the self-employed, mak-ing it cheaper for self-employed persons toget health insurance. In addition, the Adminis-tration and Congress enacted legislation thatensured parity in annual and lifetime limitsbetween mental and physical health benefitsand required health plans to allow newmothers and their babies to remain in thehospital at least 48 hours following mostdeliveries.
To ensure that consumers continue to re-ceive high-quality health care, the Presidentcreated the Advisory Commission on ConsumerProtection and Quality in the Health CareIndustry early last year to advise him onchanges occurring in the health care systemand to recommend steps to ensure quality.In the fall, the Commission approved andthe President endorsed a Health CareConsumer Bill of Rights, which includes theright to a choice of health care providers;access to emergency room treatments; partici-pation in treatment decisions; assurance thatpatients are respected and not discriminatedagainst; internal and external grievance andappeals processes; access to accurate, easilyunderstood information; and confidential medi-cal records.
These improvements occurred against abackdrop of dramatic change in the privatehealth care marketplace. After rapid inflationin the 1980s and early 1990s, national healthspending growth dropped to a record lowof 4.4 percent from 1995 to 1996. A strong
70 THE BUDGET FOR FISCAL YEAR 1999
economy, cost consciousness on the part ofemployers and consumers, and the shift tomanaged care contributed to this slowdown.In 1995, nearly 75 percent of workers withemployer-based insurance were enrolled inmanaged care, a 22-percent increase since1993. Nevertheless, the number of uninsuredhas continued to rise. Thus, the Nation’swork is not done; we must guard againstthe return of rapidly growing health carecosts and work to reduce the number ofuninsured, while maintaining a high standardof quality.
With this budget, the Administration buildson the recent legislative achievements bycommitting to work with Congress on biparti-san tobacco legislation; proposing to expandhealth care coverage for some of the mostvulnerable Americans aged 55 to 65; continu-ing the Administration’s aggressive anti-fraudand abuse enforcement activities in Medicareand Medicaid; launching an aggressive out-reach campaign to enroll eligible childrenwho are not enrolled in Medicaid; proposingan unprecedented investment in health re-search; expanding access to powerful AIDStherapies; expanding access to cancer clinicaltrials; increasing funds for substance abusetreatment and prevention; and helping toreduce health-related disparities across racialand ethnic groups.
Adopting Bipartisan National TobaccoLegislation
The Administration has focused on improv-ing public health—particularly children’shealth—by pursuing efforts to curtail tobaccouse. In 1998, the Administration will workwith Congress to enact comprehensive nationaltobacco legislation to reduce smoking, espe-cially by youth. The President has outlinedfive key principles that must be at theheart of any national tobacco legislation:
• A comprehensive plan to reduce youthsmoking, including: tough penalties on to-bacco firms that continue to market toyouths; price increases; public educationand counter advertising; and expanded ef-forts to restrict access and limit appeal.
• Full authority of the Food and Drug Ad-ministration (FDA) to regulate tobaccoproducts.
• Changes in how the tobacco industry doesbusiness, including an end to marketingand promotion to children and broad docu-ment disclosure.
• Progress towards other public goals, in-cluding a reduction of secondhand smoke;promotion of cessation programs; publichealth research; the strengthening ofinternational efforts to control tobacco;and other urgent priorities.
• Protection for tobacco farmers and theircommunities.
In its final form, the legislation will resultfrom extensive bipartisan negotiations betweenthe Administration and Congress. The Admin-istration proposes that the legislation providefor annual lump sum payments by tobaccomanufacturers, with the amounts paid byeach determined by formula. The budgetassumes net Federal receipts from this legisla-tion will total at least $10 billion in 1999,rising each subsequent year for a total of$65 billion between 1999 and 2003. Theseamounts are consistent with the President’scall for an increase in per-pack cigaretteprices of up to $1.50 (in constant dollars)over 10 years as necessary to meet thetargets set to reduce youth smoking.
The budget applies the receipts from tobaccolegislation to finance research into tobacco-related and other diseases through the Na-tional Institutes of Health; fund a cancerclinical trial demonstration project for Medi-care beneficiaries; support smoking preventionefforts by the Centers for Disease Control(CDC); strengthen the FDA’s enforcementprograms; fund smoking cessation programs;expand outreach efforts to ensure that childreneligible for health care coverage are enrolled;sponsor counter-advertising; protect tobaccofarmers; and support other initiatives associ-ated with national tobacco legislation. It pro-poses that States receive a substantial portionof the net receipts, partly through blockgrants that they can use to provide childcare and reduce class size in schools, andpartly through unrestricted funds. (For moreinformation on what the budget proposesto finance through national tobacco legislation,see Table S–7 in ‘‘Summary Tables.’’)
713. STRENGTHENING HEALTH CARE
Improving Access to Health CareCoverage
The budget proposes new initiatives toprovide access to health insurance for thenearly two million people between 62 and65 who do not have employer-sponsored insur-ance; those between 55 and 61 who havebeen displaced from their jobs; and retireeswho have had their insurance terminatedby a former employer. The budget also pro-poses to help States and small employerscreate voluntary health insurance purchasingcooperatives that will help individuals buyaffordable health insurance.
Expanding Health Insurance Optionsfor People Aged 55 to 65: The budget pro-poses three options to increase access to healthinsurance for people aged 55 to 65, who facespecial problems of access and affordability.They face greater risks of health problems,with twice the chances of heart disease,strokes, and cancer, as people aged 45 to 54.As people approach 65, many retire or shiftto part-time work or self-employment as abridge to retirement, sometimes involuntarily.Displaced workers aged 55 to 65 are much lesslikely than younger workers to be re-employedor re-insured through a new employer. As aresult, more of them rely on the individualhealth insurance market. Without the benefitsof having their costs averaged with otheryounger people, as with employer-based insur-ance, these people often face high premiums.
Such access problems will increase, dueto two trends: declines in retiree healthcoverage and the aging of the baby boomgeneration. Recently, businesses have cut backon offering health coverage to pre-65-year-old retirees; only 40 percent of large firmsnow do so. In several small but notablecases, businesses have dropped retirees’ healthbenefits after workers have retired. These‘‘broken promise’’ retirees lack access to em-ployer continuation coverage and could haveproblems finding affordable individual insur-ance. Finally, the number of people 55 to65 years old will rise from 22 million to35 million by 2010—or by 60 percent.
The budget proposes three options thatwill help an estimated 300,000 membersof this vulnerable population:
• Allowing Americans between 62 and 65 tobuy Medicare coverage: The budget pro-poses to allow Americans between 62 and65 to buy Medicare coverage by paying apremium based on an actuarially fair ratefor that age group. The proposal is self-financing, because, over time, participantspay the full cost of their coverage. Andit will give millions of older Americans thesecurity of knowing that they have ahealth insurance option.
• Expanding health insurance options fordisplaced workers: Along with the 62-to-65 age group, the budget offers access tohealth insurance to displaced workers be-tween 55 and 61—those who have lost orleft their jobs due to plant or companyclosings or moves, slack work, or the abol-ishment of their positions or shifts. Theseworkers often become uninsured, even ifthey had insurance on their last job. Thebudget proposes to allow displaced work-ers who were insured on their job but arenow uninsured to buy Medicare coverageby paying a premium.
• Protecting retirees whose retiree healthbenefits have been dropped: In addition, re-tirees 55 to 65 whose employers havedropped their retiree health coverage willbe allowed to buy in to employer continu-ation coverage (known as COBRA) by pay-ing a premium.
Creating Voluntary PurchasingCooperatives: The small group health insur-ance market does not function as efficientlyas the large group market. As a result, smallbusiness employees and their families willmore likely be uninsured and have more ex-pensive premiums. Small businesses also havehigher administrative costs and pay more forthe same benefits as larger firms.
To help small businesses overcome thesedisadvantages, the budget includes $100 mil-lion in seed money over five years for selectedStates to establish voluntary purchasing co-operatives that will allow small employers
72 THE BUDGET FOR FISCAL YEAR 1999
to pool their purchasing power and negotiatebetter rates for their employees.
Providing Cancer Clinical Trials forMedicare Beneficiaries
Less than three percent of cancer patientsparticipate in clinical trials of new therapies.Many scientists believe that higher participa-tion could lead to the faster developmentof therapies for more of those in need.
Moreover, the elderly, who are most likelyto get cancer, often cannot participate insuch trials because Medicare does not payfor such treatments until they are establishedas standard therapies. Americans over 65make up half of all cancer patients, andare 10 times more likely to get cancerthan younger Americans.
The budget would give more Americansaccess to these cutting-edge treatments andencourage higher participation in clinical trialsby establishing a three-year, $750 milliondemonstration program, specifically for Medi-care beneficiaries, to cover the patient carecosts for those who participate in certainfederally-sponsored cancer clinical trials.Although the Health Care Financing Adminis-tration (which administers Medicare) wouldrun the demonstration, it would be fundedby specified receipts from national tobaccolegislation and, thus, would not draw uponMedicare’s Hospital Insurance (HI) or Supple-mentary Medical Insurance (SMI) trust funds.The proposal includes an evaluation afterthree years to consider whether to expandthe demonstration.
Promoting Program Integrity in Medicareand Medicaid
The Administration has worked hard topromote competition, reduce errors, and elimi-nate fraud in Medicare and Medicaid. Thebudget proposes efforts to strengthen ourcommitment to eliminate fraud and abuseand promote competitive pricing, including:
• Initiatives to combat Medicare fraud andabuse and, in turn, extend the life of Medi-care’s trust funds by enabling Medicare topay market-oriented prices for prescriptiondrugs; eliminating overpayments that fa-cilities receive for drugs used to treat ane-mia; reforming outpatient mental health
benefits; and requiring insurance compa-nies to provide information to enable Med-icare to make payments only when it isthe primary payer.
• An initiative to expand Medicare’s abilityto use its market power to competitivelynegotiate rates with providers for selectedMedicare procedures. By creating ‘‘Centersof Excellence,’’ Medicare will be able toreduce its average cost while improvingquality.
The Administration is also considering Med-icaid incentive projects that measure errorsand fraud in State Medicaid programs anddevelop performance measures related to sucherrors and fraud. These projects would helpStates identify problem areas in their Medicaidprograms, target program integrity resourcesmore effectively, and measure the successof their efforts to reduce errors and combatfraud.
Expanding Access to Children’s HealthInsurance
The new Children’s Health Insurance Pro-gram enables States to extend health insur-ance coverage to as many as five millionuninsured children. It builds on an alreadystrong Medicaid program that the Administra-tion has worked hard to protect. But withover three million uninsured children eligiblefor Medicaid, but not enrolled, importantwork remains.
To achieve the President’s goal of workingwith the States to enroll as many childrenas possible, the budget contains several out-reach proposals, costing $900 million overfive years and financed by receipts fromtobacco legislation, including:
• Outreach in schools and child care sites:The budget would allow school and childcare center staff to enroll children intoMedicaid temporarily on the presumptionthat they are eligible. This proposal wouldincrease enrollment by expanding the net-work of individuals who can identify andenroll children, and inform families aboutthe potential eligibility of their children.It also would enable Medicaid to cover thecosts related to providing this temporary
733. STRENGTHENING HEALTH CARE
coverage, rather than requiring States tocover the costs from their CHIP allotment.
• Matching funds for outreach: The budgetproposes to expand the use of a special$500 million Medicaid fund—now aimed atoutreach for children losing welfare—tofund outreach to all children.
• Simpler enrollment: The budget proposesto streamline the Medicaid applicationprocess by simplifying eligibility and en-couraging the use of mail-in applications.
The budget contains other proposals tofurther promote the President’s goal of reduc-ing the number of uninsured children, includ-ing:
• Aid for the territories: The budget proposes$153 million in increased funding underCHIP for Puerto Rico and the other fourterritories, fulfilling the President’s prom-ise to provide more equitable funding forchildren’s health care in the insular areas.
• Health insurance for legal immigrant chil-dren: The budget would give States theoption to provide health coverage to legalimmigrant children under Medicaid andCHIP. Currently, States can providehealth coverage to legal immigrant chil-dren who entered the country before the1996 welfare reform law was enacted. Butimmigrant children who entered after thelaw was enacted cannot get benefits forfive years. Under this proposal, Statescould provide coverage to immigrant chil-dren through Medicaid or through theircurrent CHIP allotment.
Promoting Public Health
The budget continues the Administration’scommitment to invest in key public healthareas. In particular, the budget proposesto expand health research; increase accessto powerful AIDS therapies; discourage tobaccouse among young people; enhance food safety;help reduce disparities in disease rates acrossracial and ethnic groups; improve substanceabuse treatment and prevention; promotechildhood immunizations; provide voluntaryfamily planning to low-income women; reduceinfant mortality; and improve health carequality.
Increasing Biomedical Research:Progress in biomedical research has ensuredthat many diseases that Americans faced ageneration ago can now be prevented or treat-ed. Smallpox has been eradicated from theworld and polio is gone from the WesternHemisphere. Surgical procedures, such asorgan transplants or cardiac pacemakers, canrestore normal lives for those who once hadfew treatment options.
The scientific community is now poisedto make even more advances that, withsufficient investment, could dramatically alterand improve the way we treat diseases.Several new technologies in medical researchshow great promise. Specifically, importantstrides in imaging technologies make it pos-sible to visualize living cells and entireorgans, providing new insights into the struc-ture of disease; computer-based systems givescientists new tools to rapidly analyze vastamounts of new data; and the scientificcommunity stands on the cusp of a hostof breakthroughs in genetics that will enablescientists to map the entire human genomeand revolutionize how we understand, treat,and prevent some of our most devastatingdiseases.
The budget proposes an unprecedented com-mitment in biomedical research that willlay the foundation for new innovations toimprove health and prevent disease. It invests$1.15 billion in the National Institutes ofHealth (NIH)—the largest increase in history.Moreover, to ensure that the Nation continuesto make important investments in biomedicalresearch, the budget proposes—for the firsttime ever—sustained increases in the NIHover five years. By the year 2003, fundingfor biomedical research will increase to over$20 billion, or by nearly half.
Within the NIH increase, the budget pro-vides for increased funding on cancer-relatedresearch. In 1999, NIH’s cancer-related re-search will grow by 10 percent and, overthe next five years, by almost two thirds.Though the Nation’s death rate from cancerfell between 1991 and 1995—the first sus-tained decline since record-keeping began inthe 1930s—nearly one in five people in theUnited States dies from cancer. The proposedinvestment in cancer-related research over
74 THE BUDGET FOR FISCAL YEAR 1999
the next five years will enable NIH tomake further advances in cancer prevention,detection, and treatment.
Making Quality Direct Services and Pre-ventive Care Accessible to Special Popu-lations: Direct health services and preventionactivities translate the ground-breaking medi-cal advances often produced by biomedicalresearch into benefits such as disease preven-tion, medical cost reductions, and public healtheducation. The budget proposes fundingincreases for the following health service andprevention activities, many of which help servelow-income and other vulnerable populations:
• Ensuring access to powerful AIDS thera-pies through Ryan White HIV/AIDS Treat-ment Grants in partnership with theStates: The budget proposes a $100 millionincrease in Ryan White treatment grantsto help States provide AIDS treatment,especially the powerful ‘‘combination ther-apy’’ AIDS drugs. While combination ther-apy offers tremendous hope to people withHIV, it also presents a tremendouschallenge to AIDS services programs tomake this hope available to all Americansliving with HIV/AIDS. Many States spenda considerable amount of money on theAIDS Drug Assistance Program; otherscontribute little or nothing. The FederalGovernment, States, and the private sectorall must rise to the challenge of meetingthe future needs of people with AIDS. TheAdministration will work with Congress todevelop revised matching requirements orother means of encouraging more Stateparticipation on behalf of people livingwith HIV/AIDS. The budget also includesa $65 million increase for grants to cities,States, and clinics for medical care, criticalsupport services, and new ways to helppeople who are HIV-positive. In total, thebudget proposes $1.3 billion in Federalspending for activities authorized by theRyan White CARE Act, a 14-percent in-crease over 1998 levels and a 241-percentincrease over comparable 1993 levels.
• Reducing tobacco use among young people:Tobacco is linked to over 400,000 deathsa year from cancer, respiratory illness,heart disease, and other health problems.Each year, a million young people become
regular smokers, 300,000 of whom will dieearlier as a result. In August 1996, theAdministration approved an FDA regula-tion to cut tobacco use among young peo-ple in half over seven years. The budgetincludes $146 million of additional fundsfor tobacco-related activities in the CDCand the FDA—$46 million of which willpay for expanding CDC’s existing State-based tobacco prevention activities, and$100 million of which will support FDA’soutreach and enforcement activities.
• Improving substance abuse prevention andtreatment: The budget continues to expandsubstance abuse prevention and treatmentactivities, enabling hundreds of thousandsof pregnant women, high-risk youth, andother under-served Americans to get drugtreatment and prevention services. TheSubstance Abuse and Mental Health Serv-ices Administration’s Substance AbuseBlock Grant (SABG) funds 40 percent ofall the Nation’s publicly-provided sub-stance abuse treatment. To narrow thegap between those who are seeking treat-ment and those who can be accommodatedby the public treatment system, the budg-et proposes a $200 million increase for theSABG. Along with continued support fromthe States, this increase would allow an-other 50,000 individuals a year to receivesubstance abuse treatment. This proposalalso would help reduce the spread of AIDSby giving intravenous drug users increasedaccess to substance abuse treatment pro-grams.
• Enhancing food safety: American consum-ers enjoy the world’s safest food supply,but too many Americans get sick from pre-ventable food-borne diseases. The budgetincreases funding by $101 million, or 12percent, over the 1998 level for the Admin-istration’s inter-agency food safety initia-tive, which created a national early warn-ing system for food-borne illnesses andimproved Federal-State coordination whenfood-borne disease outbreaks occur. Thebudget increase also expands food safetyresearch, risk assessment capabilities,education, and surveillance activities, aswell as food import inspections. Further-more, the budget proposes to expandFDA’s international inspection force to en-
753. STRENGTHENING HEALTH CARE
sure that imported fruits and vegetablesare as safe as those produced in the Unit-ed States.
• Helping to reduce racial disparities inhealth status: Despite improvements in theNation’s overall health, continuing dispari-ties remain in the burden of death andillness that certain minority groups experi-ence. For example, the infant mortalityrate for African-Americans is twice thatof Caucasians. American Indian and Alas-ka Natives are about three times as likelyto die from diabetes as other Americans.To address these and other disparities, thebudget includes $80 million for health edu-cation, prevention, and treatment servicesfor minority populations. Working withminority public health providers,advocates, and other consumer representa-tives, CDC will begin a new $30 milliondemonstration program to enable selectedcommunities to develop innovative and ef-fective approaches to address these dis-parities. Each community, chosen througha competitive grant process, would beginan intensive program to address one ormore health areas with major disparities,such as infant mortality. The remaining$50 million will go to various public healthprograms that serve mostly minority andlow-income populations.
• Enhancing family planning: The budgetprovides a $15 million increase, to $218million, to support over 4,000 family plan-ning clinics, a primary source of voluntaryfamily planning services for low-incomewomen Nation-wide. The increase wouldexpand services to adolescents and enablegrantees to better meet the rising demandfor comprehensive services, such as screen-ing, prevention, and education and coun-seling. Publicly subsidized family planningservices help American women preventover a million unintended pregnancieseach year. The budget also includes $50million in mandatory funding for Statesto conduct abstinence education projects tohelp reduce out-of-wedlock pregnancies.
• Promoting full participation in the Women,Infants, and Children (WIC) program:
WIC reaches nearly 7.5 million women, in-fants, and children a year, providing nutri-tion assistance, nutrition education andcounseling, and health and immunizationreferrals. WIC provides for prenatal careto those who would not otherwise get it,reducing the incidence of premature birthand infant death. As a result, Medicaidsaves significant sums that it would other-wise spend in the first 60 days after child-birth. Largely because of funding increasesin the last five years, WIC participationhas grown by 30 percent, and the programnow helps half of America’s infants. Thebudget proposes $4.1 billion to serve 7.5million people through 1999, fulfilling thePresident’s goal of full participation inWIC.
• Promoting childhood immunizations: Thebudget proposes $973 million for theChildhood Immunizations Initiative, in-cluding the Vaccines for Children programand CDC’s discretionary immunizationprogram. As a result of the Administra-tion’s Childhood Immunization Initiative,the Nation exceeded its childhood vaccina-tion goals for 1996, with 90 percent ormore of America’s toddlers receiving eachbasic childhood vaccine. The incidence ofvaccine-preventable diseases among chil-dren, such as diphtheria, tetanus, measles,and polio, are at all-time lows. The budgetalso includes $47 million to eradicatepolio—preventable through immunizationthroughout the world.
• Improving health care quality: The budgetwould double, to $30 million, the Depart-ment of Health and Human Services’health care quality activities to expand re-search on quality and put into practice therecommendations of the President’s Advi-sory Commission on Consumer Protectionand Quality in the Health Care Industry.The research will increase knowledgeabout how best to measure and improvethe outcomes and quality of medical serv-ices, and reveal ways to encourage healthcare providers to use this information intheir work.

76 THE BUDGET FOR FISCAL YEAR 1999
• Caring for veterans health needs throughveterans medical care: Continuing its com-mitment to veterans programs, the Admin-istration proposes $17.7 billion for the De-partment of Veterans Affairs’ (VA) health
system. The funds will enable the VA tocontinue to restructure its health care sys-tem by increasing access and deliveringquality care to our Nation’s veterans.
77
4. PROTECTING THE ENVIRONMENT
There is a new understanding today in the world between the bonds that connect human beingsand their natural environment. We know we have to preserve them, and we know that in the endeconomic development itself cannot occur unless the environment is preserved.
President ClintonMay 1997
With the historic December 1997 inter-national agreement in Kyoto calling for cutsin greenhouse gas emissions, the Administra-tion capped a remarkable year of environ-mental successes. History has shown thatthe Nation does not have to choose betweena strong economy and a clean environment.The President’s policies have contributed tofive years of both strong economic growthand a cleaner, healthier environment.
Along with the Kyoto Protocol, the Adminis-tration has issued new, more protective airquality standards to better safeguard publichealth and the environment, and has strength-ened our citizens’ right to know about toxicchemical releases. It has continued its effortsto protect our natural treasures, such asYellowstone National Park, the Everglades,Grand Staircase National Monument, andthe Headwaters redwoods, from environmentalthreats. It has secured $699 million in theLand and Water Conservation Fund for acquir-ing Headwaters Forest, the New World Minenear Yellowstone, and other high-priority landacquisitions to protect key natural, cultural,and historic resources. It has cleaned upmore toxic waste sites in its first four yearsthan the previous two administrations didin 12, and it is continuing to advance towardthe President’s goal of 900 site cleanupsby the end of year 2001.
While Americans want a Government thathelps protect the environment and our naturalresources, they do not want to burden businessunduly, choke innovation, or waste taxpayerdollars. If sensibly designed and flexibly imple-mented, environmental initiatives can costless while providing unforeseen economic op-
portunities. Americans have met environ-mental challenges because we innovate, wecompete, and we find solutions to problemsin ways that promote entrepreneurship andstrengthen the economy.
To implement his vision for the environmentand our natural resources, the Presidentis proposing an Environmental ResourcesFund for America to support increases formany of the Nation’s key environmental pro-grams. The Fund provides for enhanced con-struction, maintenance, and land acquisitionfor national parks, forests, refuges and otherpublic lands; a new multi-agency initiativeto improve our Nation’s water quality; infra-structure funding for community drinkingwater and wastewater facilities; and resourcesto clean up abandoned hazardous waste sites.The budget also includes a new, five-year$6.3 billion program to implement the Presi-dent’s commitment to prevent global warming,as well as increased resources to protectendangered species, carry out pollution controlprograms, and preserve the global environ-ment.
Approaches for Environmental Success
Preventing Global Warming: In Decem-ber, the United States reached an historicagreement with other nations to meet the chal-lenge of global warming. The Kyoto Protocolestablishes realistic, achievable, and bindingcommitments to reduce greenhouse gas emis-sions and reflects the Administration’s commit-ment to use market mechanisms to tackle theproblem in innovative and flexible ways.
Improving Air Quality: In July 1997, theAdministration took the most far-reaching
78 THE BUDGET FOR FISCAL YEAR 1999
steps in 20 years to improve our air qualityby cutting smog levels and, for the first timeever, setting standards to lower the levels offine particles in the atmosphere. These stand-ards will prevent adverse health effects forpeople of all ages and may prevent up to15,000 premature deaths a year.
Reflecting the Administration’s approach toregulatory decision making, however, thePresident directed that the EnvironmentalProtection Agency (EPA) implement the stand-ards in ways that will maximize commonsense, flexibility, and cost-effectiveness. Hedirected that implementation maintain theprogress underway toward cleaner air, rewardearly action to reduce air pollution, employregulatory flexibility to minimize economicimpacts, and recognize the substantial leadtime needed to implement the new fineparticle standard. Further, the President di-rected EPA to complete a new science reviewof the standard before imposing any newcontrols to meet it.
Restoring the Everglades: The budget sup-ports the continued Federal, State, local andTribal efforts to implement the restorationproject for the South Florida ecosystem, whichthe Administration began in 1993 and Con-gress authorized in the 1996 Water ResourcesDevelopment Act. In 1999, the Army Corps ofEngineers will complete the Central andSouthern Florida Comprehensive ReviewStudy, providing long-term direction for res-toration efforts.
In December 1997, Vice President Goreannounced the Government’s intent to pur-chase (with non-Federal partners) 50,000 acresof land (known as the ‘‘Talisman’’ tract)on the northern edge of Everglades NationalPark. This land, formerly used for sugarfarming, will serve as a critical buffer zonebetween the Everglades and the sugar planta-tions to the north, helping to re-establishthe essential natural flow of water intothe Everglades and improve water quality.
Along with better water flows and watermanagement, the budget recognizes the needfor scientific guidance and land acquisitionto restore the Everglades’ hydrologic functions,providing a steady funding source for theseneeds. The budget proposes $282 million,24 percent more than Congress approved
in 1998, continuing the Administration’s sup-port for the Everglades Restoration Initiativeto accelerate the restoration effort and providethe steady funding source for land acquisition,science, and modified water delivery.
Saving Yellowstone Park: To protect Yel-lowstone National Park, the Federal Govern-ment agreed in August 1996 to acquire CrownButte, Inc.’s interest in the New World Mine,whose development posed a severe environ-mental threat to Yellowstone’s unique land-scape and wildlife resources. In 1998, theAdministration sought, and Congress provided,$65 million to proceed with this agreement,which will preserve one of the crown jewelsof the National Park System. Crown Butte willdedicate $22 million to clean up contaminationat the site from earlier mining activities. TheAdministration is working with Crown Butteand other parties to complete the acquisition.
Protecting Headwaters Forest: In 1998,the Administration sought, and Congress pro-vided, $250 million to acquire the HeadwatersForest in northern California, the largestprivately-owned stand of ancient redwoods. Aspart of the acquisition, the Administration iscommitted to ensuring that Headwaters andits threatened and endangered inhabitantspecies are protected. As a result, the Adminis-tration is developing, and has made significantprogress on, a scientifically and technicallysound habitat conservation plan and an envi-ronmental impact statement. The Federal Gov-ernment and State of California expect to ac-quire Headwaters by March 1999.
Preserving Other Natural Resources: Aspart of last year’s budget agreement with Con-gress, the Administration secured $699 millionin 1998 for priority Federal land acquisitionsand exchanges. After financing the top twopriorities—protecting the Headwaters Forestand saving Yellowstone—$362 million re-mained to invest in other priorities for parks,forests, refuges, and public lands. The Admin-istration is considering potential acquisitionsto restore the Elwha River in Olympic Na-tional Park, protect bison winter habitat out-side Yellowstone, acquire the Baca Ranch inNew Mexico, add lands to the Santa MonicaMountains National Recreation Area, completethe Appalachian Trail, and preserve key CivilWar battlefields.
794. PROTECTING THE ENVIRONMENT
Targeting the Conservation Reserve Pro-gram (CRP): In this Agriculture Department(USDA) program, landowners establish long-term conservation practices on erodible and en-vironmentally sensitive land in exchange for10 to 15 years of rental payments. The 16.1million acres accepted into the CRP in March1997, out of 23.2 million acres that farmersbid, will increase the environmental benefitsby nearly 85 percent for every dollar spent,compared with earlier CRP sign-ups. At thesame time, program costs are falling, with theDepartment paying 21 percent less per acre—saving over $1.6 billion over the life of theprogram. Within the CRP, the ConservationReserve Enhancement Program targets prior-ity lands to better address water pollution andprotect endangered species.
Protecting Roadless Areas and Improv-ing the Forest Road System: The 73 millionacres without roads in our National Forestshave outstanding ecological, aesthetic, and so-cial value. They are often the refuge of lastresort for rare species and the source areasof municipal water supplies. The Forest Serv-ice is working to meet public access needs inan ecologically sensitive manner, ensuring thatwe protect these roadless areas for future gen-erations. At the same time, the extensive For-est Service road system is rapidly eroding—risking public safety and contributing to envi-ronmental damage in some national forests.The budget proposes $218 million, a 20-percentincrease over the 1998 level, for investmentsin road maintenance and reconstruction, roadclosures and obliteration, and watershed im-provements that are critically important tosalmon, water quality, and other resourcemanagement goals. The budget also proposesto eliminate the timber purchaser road creditprogram, and provide a stable payment tocounties that is not linked to timber harvestvolume.
Enhancing Citizens’ Right to Know: TheAdministration continues to expand the infor-mation available to citizens on substancesbeing released into their neighborhoods. In thedecade since community right-to-know legisla-tion went into effect, the law has helped spura 43-percent cut in toxic emissions by industry.In April 1997, the Administration increased by30 percent the number of facilities covered byadding seven sectors that must report under
the program. This expansion comes on top ofa 1995 rule that nearly doubled the numberof toxic chemicals that facilities must report.
Redeveloping Contaminated Land: TheAdministration has established a BrownfieldsNational Partnership, bringing together the re-sources of over 15 Federal agencies to helpempower and revitalize communities. ThePartnership is just one piece of the Adminis-tration’s efforts to help thousands of commu-nities clean up and redevelop Brownfields—abandoned pieces of land, usually in innercities, that are highly contaminated from pre-vious industrial use. The Partnership—whichincludes a $300 million Federal investment—will leverage an expected $5 billion to $28 bil-lion in private investment, support up to196,000 jobs, and protect up to 34,000 acresof undeveloped ‘‘greenfield’’ areas outside ofcities.
Restoring the Presidio of San Francisco:The Administration has established a Govern-ment corporation, known as the Presidio Trust,to rehabilitate and lease hundreds of unusedbuildings in the Presidio of San Francisco,once a military base and now a national park.The Presidio Trust will restore these housesand offices in a manner consistent with parkpurposes, then lease them to families and busi-nesses. To cut taxpayer costs, the budget pro-vides for the Presidio Trust to borrow $25 mil-lion from the Treasury in both 1999 and 2000to fund these improvements, and repay themoney through future lease receipts.
Making the Endangered Species Act(ESA) Work: Administration reforms have im-proved the way the ESA works. Habitat Con-servation Plans (HCPs), for example, giveState, local, and Tribal governments and theprivate sector the flexibility to protect endan-gered species and conserve habitat, whileallowing for development. HCPs will cover anestimated 7.3 million acres by the end of 1998.The Administration is also providing earlierprotection for species to preclude their listingas endangered. For instance, the Federal Gov-ernment has entered into 40 Candidate Con-servation Agreements (CCAs) with privatelandowners or State and local governments,providing benefits to over 200 species and pre-venting the listing of five.
80 THE BUDGET FOR FISCAL YEAR 1999
Environmental and Natural ResourceInvestments
The budget proposes to boost funding forhigh-priority environmental and natural re-sources programs by five percent, comparedto 1998 levels (see Table 4–1).
Reducing Greenhouse Gases and Pro-moting Energy Efficiency: Last fall, thePresident announced a nine-point plan tobegin addressing climate change, including afive-year package of tax incentives and re-search and development spending to spur en-ergy efficiency and help develop low-carbon en-ergy sources. With the historic agreement inDecember 1997 to reduce greenhouse gas emis-sions, the President now proposes a $6.3 bil-lion package of tax incentives and researchspending. The budget provides $1.7 billion in1999 for the Climate Change Technology Ini-tiative, nearly doubling the 1998 level, as adown-payment on the President’s five-yearcommitment. (For a more detailed discussionof the Administration’s climate change efforts,see Chapter 6, ‘‘Promoting Research.’’)
Creating the Environmental ResourcesFund for America: The budget proposes theEnvironmental Resources Fund for America,an innovative financing mechanism for envi-ronmental initiatives. It provides $7.7 billion,14 percent more than in 1998, for many keyenvironmental restoration programs and is fi-nanced, in part, by the proposed renewal oftaxes that support the Superfund program.The Fund includes:
• Land, Water, and Facility Restoration Ini-tiative: National parks, refuges, forests,and public lands are the heart of theNation’s natural, cultural, and historicallegacy. As custodians of these resources,Federal land management agencies facegrowing demands to invest more to restorelands and rehabilitate an aging infrastruc-ture of public facilities and trails. Theseneeded investments would protect wildlifehabitat, maintain historic sites, and pre-serve the many national treasures, fromthe Acadia National Park in Maine toIndependence Hall to the CaliforniaDesert, that constitute our legacy for fu-ture generations. The budget proposes a$92 million, or eight percent, increase forconstruction and maintenance for national
parks, forests, refuges, public lands, andIndian schools, with which the agencieswill focus on top priorities and controlcosts through better management. It alsoincludes a broad initiative to invest morein land acquisition and historic preserva-tion—a 43-percent increase in spendingover the next five years from the Landand Water Conservation Fund and a 12-percent increase from the Historic Preser-vation Fund.
• Clean Water and Watershed RestorationInitiative: Commemorating the 25th anni-versary of the Clean Water Act, the VicePresident last October announced a CleanWater Initiative—an action plan to focuson three remaining challenges to restoreand protect the Nation’s waterways: (1)preventing polluted runoff; (2) protectingpublic health; and (3) ensuring commu-nity-based watershed management. USDAand EPA are leading an inter-agency taskforce to develop the plan by February 14,1998, relying on better coordination andtargeting of Federal activities and re-sources, public participation, and innova-tive approaches to pollution control.
The budget includes $568 million, a 35-percent increase over the 1998 level, forthis multi-agency initiative, includingmore mandatory funding for USDA’s Envi-ronmental Quality Incentives Program tohelp farmers prevent polluted runoff; forthe Forest Service and the InteriorDepartment to better address water qual-ity problems on Federal lands; for EPAto provide grants to States to implementwater quality improvement projects; forthe National Oceanic and Atmospheric Ad-ministration (NOAA) to help States andlocal communities protect their coasts fromthe pollution that leads to degradation; forInterior’s U.S. Geological Survey andUSDA to increase water quality monitor-ing and research, with a focus on nutrientpollution; and for the Army Corps of Engi-neers to begin a new riverine ecosysteminitiative—‘‘Challenge 21’’—to plan andimplement projects that restore water-sheds while providing flood hazard mitiga-tion for communities.
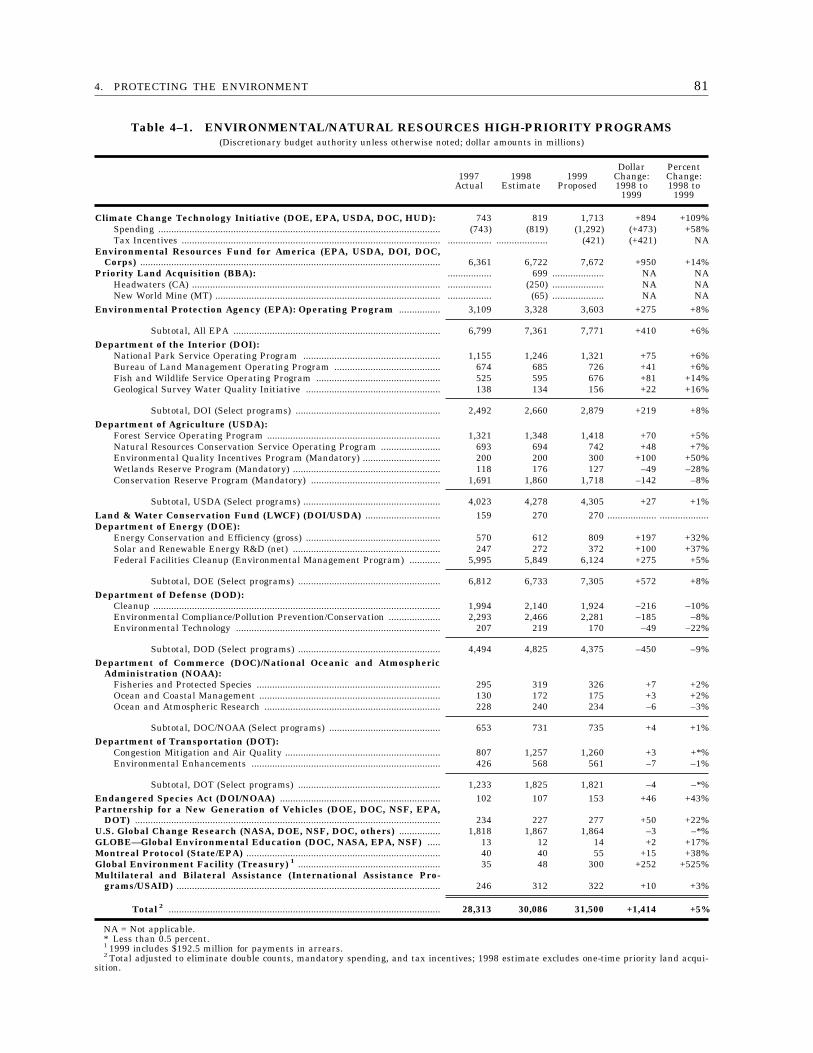
814. PROTECTING THE ENVIRONMENT
Table 4–1. ENVIRONMENTAL/NATURAL RESOURCES HIGH-PRIORITY PROGRAMS(Discretionary budget authority unless otherwise noted; dollar amounts in millions)
1997Actual
1998Estimate
1999Proposed
DollarChange:1998 to
1999
PercentChange:1998 to
1999
Climate Change Technology Initiative (DOE, EPA, USDA, DOC, HUD): 743 819 1,713 +894 +109%Spending ............................................................................................................. (743) (819) (1,292) (+473) +58%Tax Incentives .................................................................................................... ................. .................... (421) (+421) NA
Environmental Resources Fund for America (EPA, USDA, DOI, DOC,Corps) .................................................................................................................... 6,361 6,722 7,672 +950 +14%
Priority Land Acquisition (BBA): ................. 699 .................... NA NAHeadwaters (CA) ................................................................................................ ................. (250) .................... NA NANew World Mine (MT) ....................................................................................... ................. (65) .................... NA NA
Environmental Protection Agency (EPA): Operating Program ................ 3,109 3,328 3,603 +275 +8%
Subtotal, All EPA ................................................................................ 6,799 7,361 7,771 +410 +6%Department of the Interior (DOI):
National Park Service Operating Program ..................................................... 1,155 1,246 1,321 +75 +6%Bureau of Land Management Operating Program ......................................... 674 685 726 +41 +6%Fish and Wildlife Service Operating Program ................................................ 525 595 676 +81 +14%Geological Survey Water Quality Initiative .................................................... 138 134 156 +22 +16%
Subtotal, DOI (Select programs) ........................................................ 2,492 2,660 2,879 +219 +8%Department of Agriculture (USDA):
Forest Service Operating Program ................................................................... 1,321 1,348 1,418 +70 +5%Natural Resources Conservation Service Operating Program ....................... 693 694 742 +48 +7%Environmental Quality Incentives Program (Mandatory) .............................. 200 200 300 +100 +50%Wetlands Reserve Program (Mandatory) ......................................................... 118 176 127 –49 –28%Conservation Reserve Program (Mandatory) .................................................. 1,691 1,860 1,718 –142 –8%
Subtotal, USDA (Select programs) ..................................................... 4,023 4,278 4,305 +27 +1%Land & Water Conservation Fund (LWCF) (DOI/USDA) ............................. 159 270 270 ................... ...................Department of Energy (DOE):
Energy Conservation and Efficiency (gross) .................................................... 570 612 809 +197 +32%Solar and Renewable Energy R&D (net) ......................................................... 247 272 372 +100 +37%Federal Facilities Cleanup (Environmental Management Program) ............ 5,995 5,849 6,124 +275 +5%
Subtotal, DOE (Select programs) ....................................................... 6,812 6,733 7,305 +572 +8%Department of Defense (DOD):
Cleanup ............................................................................................................... 1,994 2,140 1,924 –216 –10%Environmental Compliance/Pollution Prevention/Conservation .................... 2,293 2,466 2,281 –185 –8%Environmental Technology ............................................................................... 207 219 170 –49 –22%
Subtotal, DOD (Select programs) ....................................................... 4,494 4,825 4,375 –450 –9%Department of Commerce (DOC)/National Oceanic and Atmospheric
Administration (NOAA):Fisheries and Protected Species ....................................................................... 295 319 326 +7 +2%Ocean and Coastal Management ...................................................................... 130 172 175 +3 +2%Ocean and Atmospheric Research .................................................................... 228 240 234 –6 –3%
Subtotal, DOC/NOAA (Select programs) ........................................... 653 731 735 +4 +1%Department of Transportation (DOT):
Congestion Mitigation and Air Quality ............................................................ 807 1,257 1,260 +3 +*%Environmental Enhancements ......................................................................... 426 568 561 –7 –1%
Subtotal, DOT (Select programs) ....................................................... 1,233 1,825 1,821 –4 –*%Endangered Species Act (DOI/NOAA) .............................................................. 102 107 153 +46 +43%Partnership for a New Generation of Vehicles (DOE, DOC, NSF, EPA,
DOT) ...................................................................................................................... 234 227 277 +50 +22%U.S. Global Change Research (NASA, DOE, NSF, DOC, others) ................ 1,818 1,867 1,864 –3 –*%GLOBE—Global Environmental Education (DOC, NASA, EPA, NSF) ..... 13 12 14 +2 +17%Montreal Protocol (State/EPA) ........................................................................... 40 40 55 +15 +38%Global Environment Facility (Treasury) 1 ....................................................... 35 48 300 +252 +525%Multilateral and Bilateral Assistance (International Assistance Pro-
grams/USAID) ...................................................................................................... 246 312 322 +10 +3%
Total 2 ......................................................................................................... 28,313 30,086 31,500 +1,414 +5%
NA = Not applicable.* Less than 0.5 percent.1 1999 includes $192.5 million for payments in arrears.2 Total adjusted to eliminate double counts, mandatory spending, and tax incentives; 1998 estimate excludes one-time priority land acqui-
sition.
82 THE BUDGET FOR FISCAL YEAR 1999
In addition, the budget proposes $143 mil-lion for California Bay-Delta watershedrestoration activities, the fully authorizedamount and a 69-percent increase over1998 funding. The program will continuefocusing on basic investments to begin re-storing this important ecosystem, with aspecial emphasis on acquiring critical wet-lands habitat, managing flood plains, en-hancing fish passage, and improving habi-tat along the Sacramento River.
• Water Quality Infrastructure: The budgetproposes $775 million in capitalizationgrants for Drinking Water State RevolvingFunds (SRFs), which make low-interestloans to help municipalities meet the re-quirements of the Safe Drinking WaterAct Amendments. These funds will helpensure that Americans have a safe, cleandrinking water supply—our first line of de-fense in protecting public health. EPA alsoproposes $1.1 billion in capitalizationgrants to Clean Water SRFs to help mu-nicipalities comply with the Clean WaterAct, thus helping to reduce beach closuresand keeping our waterways safe and clean.
These levels for the two SRFs makeprogress toward the Administration’s goalof providing sufficient capital for the fundsto offer $2.5 billion a year in financial as-sistance to municipalities over the longrun. In addition, the budget proposes tar-geted wastewater funds for areas facingunique circumstances—$50 million forBoston Harbor, $100 million for Mexicanborder projects, and $15 million for Alas-kan Native villages.
• USDA Water 2000: The budget providesfunds for USDA’s Water 2000 initiative—to bring safe drinking water to rural com-munities with some of the Nation’s mostserious problems of water availability, de-pendability, and quality—within its $1.3billion for rural water and wastewaterloans and grants. With proposed RuralCommunity Advancement Program fund-ing four percent above the 1998 levels, theAdministration expects to fund 250 sys-tems in 1999. Since the effort began in1994, USDA has invested almost $1.3 bil-lion in loans and grants on high-priorityWater 2000 projects Nation-wide.
• Superfund Cleanups: The budget proposes$2.1 billion for Superfund, a 40-percent in-crease over the 1998 level. Combined withcontinuing administrative reforms, thesefunds will help meet the President’spledge to double the pace of Superfundcleanups. The Administration proposes toclean up another 400 sites within the nextfour years, meaning that about two-thirdsof the Nation’s worst toxic waste dumpswould be cleaned up by the end of theyear 2001 (see Chart 4–1).
Extending the Brownfields Redevelop-ment Initiative: The budget proposes to ex-tend the President’s Brownfields initiative,which promotes local cleanup and redevelop-ment, bringing jobs to blighted areas. First,EPA would receive $91 million for grants tocommunities for site assessment and redevel-opment planning and for revolving loan fundsto finance clean-up efforts at the local level.Second, the Department of Housing and UrbanDevelopment would receive $50 million, $25million more than in 1998, to leverage State,local, and private funds for redeveloping thecleaned-up sites and creating jobs. The Presi-dent also proposes to extend the targeted taxincentive to spur Brownfields cleanup.
Enhancing Endangered Species Act Ef-forts: The budget proposes a $36 million in-crease, to $113 million, for the Interior Depart-ment’s endangered species program, mainly forthe Administration’s new reforms to encourageprivate landowners to protect species. The pro-gram is designed to increase the number ofcooperative partnerships between the FederalGovernment and States, localities, and privateparties to recover listed species and preventthe need to list more. The budget also proposesa $10 million increase, to $40 million, forNOAA’s endangered species program, mainlyfocused on habitat conservation planning.
The budget increases funds to develop HCPs,make grants to States for land acquisitiontied to HCPs, and provide incentive paymentsto landowners for safe harbor agreements.The funds will double the acreage that HCPscover; improve the way HCPs are developedand implemented; extend CCAs between theFederal Government and landowners or Stateand local governments to protect 80 morespecies; keep 20 species off the endangered
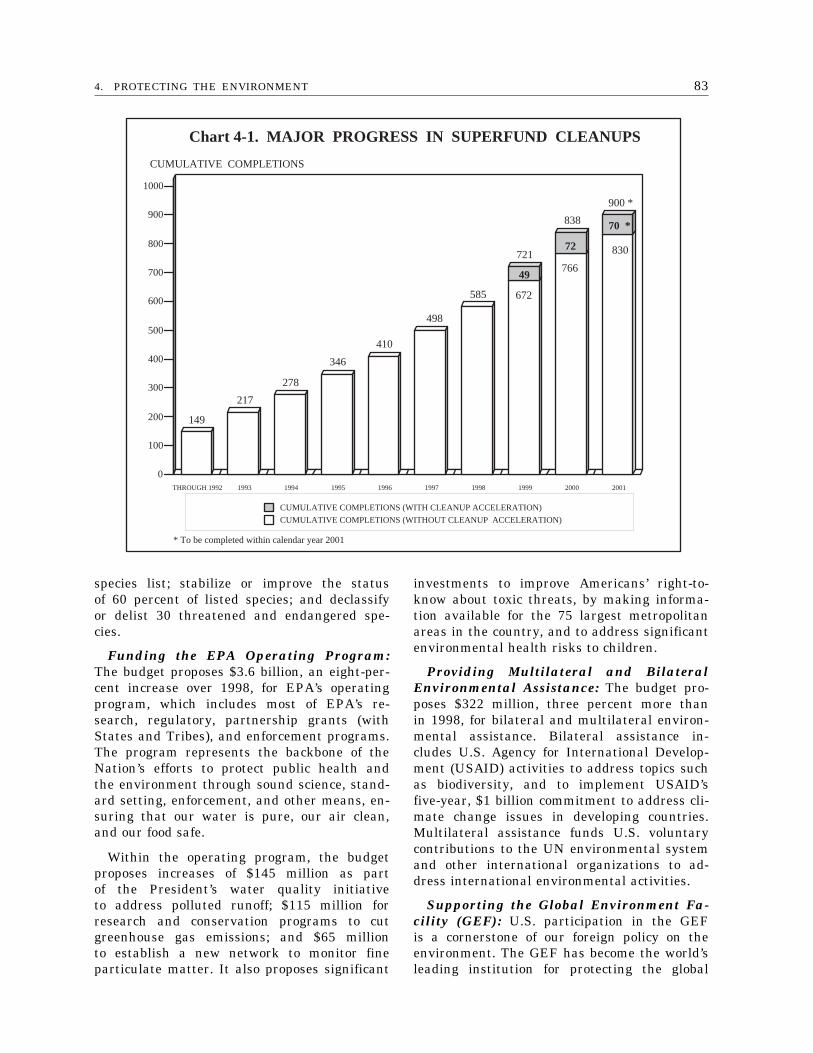
834. PROTECTING THE ENVIRONMENT
THROUGH 1992 1993 1994 1995 1996 1997 1998 1999 2000 2001
0
100
200
300
400
500
600
700
800
900
1000
CUMULATIVE COMPLETIONS (WITH CLEANUP ACCELERATION)
CUMULATIVE COMPLETIONS (WITHOUT CLEANUP ACCELERATION)
CUMULATIVE COMPLETIONS
Chart 4-1. MAJOR PROGRESS IN SUPERFUND CLEANUPS
149
217
278
585
838
346
410
498
766
70 *
830
900 *
72172
49
672
* To be completed within calendar year 2001
species list; stabilize or improve the statusof 60 percent of listed species; and declassifyor delist 30 threatened and endangered spe-cies.
Funding the EPA Operating Program:The budget proposes $3.6 billion, an eight-per-cent increase over 1998, for EPA’s operatingprogram, which includes most of EPA’s re-search, regulatory, partnership grants (withStates and Tribes), and enforcement programs.The program represents the backbone of theNation’s efforts to protect public health andthe environment through sound science, stand-ard setting, enforcement, and other means, en-suring that our water is pure, our air clean,and our food safe.
Within the operating program, the budgetproposes increases of $145 million as partof the President’s water quality initiativeto address polluted runoff; $115 million forresearch and conservation programs to cutgreenhouse gas emissions; and $65 millionto establish a new network to monitor fineparticulate matter. It also proposes significant
investments to improve Americans’ right-to-know about toxic threats, by making informa-tion available for the 75 largest metropolitanareas in the country, and to address significantenvironmental health risks to children.
Providing Multilateral and BilateralEnvironmental Assistance: The budget pro-poses $322 million, three percent more thanin 1998, for bilateral and multilateral environ-mental assistance. Bilateral assistance in-cludes U.S. Agency for International Develop-ment (USAID) activities to address topics suchas biodiversity, and to implement USAID’sfive-year, $1 billion commitment to address cli-mate change issues in developing countries.Multilateral assistance funds U.S. voluntarycontributions to the UN environmental systemand other international organizations to ad-dress international environmental activities.
Supporting the Global Environment Fa-cility (GEF): U.S. participation in the GEFis a cornerstone of our foreign policy on theenvironment. The GEF has become the world’sleading institution for protecting the global
84 THE BUDGET FOR FISCAL YEAR 1999
environment and avoiding economic disruptionfrom climate change, massive extinction of val-uable species, and dramatic collapse of theoceans’ fish population. The $300 million pro-posal for 1999 includes $193 million for con-tributions previously due and $107 million forthe initial contribution to the GEF’s secondfour-year replenishment program, from 1999to 2002. U.S. funding for these items is crucialif the Nation hopes to continue influencingGEF’s policies and lending strategies.
Expanding the Federal Facilities Clean-up and Compliance: The Federal Govern-ment continues to address the huge challengeof cleaning up Federal facilities contaminatedwith radioactive or hazardous waste. The En-ergy Department (DOE) faces the most com-plex and costly problems from over 40 yearsof research, production, and testing of nuclearweapons and reactors. The Defense Depart-ment’s (DOD) problems, meanwhile, includehazardous wastes like those found at indus-trial and commercial sites.
The budget proposes $6.1 billion for DOE’sEnvironmental Management program, includ-ing $277 million for the Uranium EnrichmentDecontamination and Decommissioning Fund.
The budget also proposes $517 million tocontinue to privatize waste remediation atsuch sites as the Hanford (WA) and Idahofacilities, through which DOE pays for thedelivery of treated waste that meets approvedspecifications. Privatization will help speedcleanups, reduce health risks, and cut costsat these sites.
DOD, which operates one of America’smost diverse and successful environmentalprograms, is focusing its efforts on reducingrelative risk at its active and closing installa-tions. As of early 1998, it is conductingstudies or clean-ups at 688 military installa-tions and 2,721 formerly-used properties.Moreover, it has determined that 14,399sites require no further action. DOD alsois making progress in its compliance andpollution prevention, conservation, and envi-ronmental technology programs. The budgetproposes $4.4 billion for all DOD environ-mental activities; the decrease compared tothe 1998 level is largely due to the completionof several one-time projects and of clean-ups at several closed bases. The Administra-tion is committed to making all currentand former DOD property safe and clean.
85
5. INVESTING IN INFRASTRUCTURE
I think it’s important also to point out that as we invest in . . . bridges and roads and transitsystems, we are also building a bridge to a cleaner environment. We’re building a bridge fromwelfare to work. We’re building a bridge to sustainable communities that can last and grow andbring people together over the long run.
President ClintonMarch 1997
For America to continue prospering in the21st Century, its transportation infrastructuremust be safe, integrated, and efficient enoughto serve the Nation’s growing commerce andmobility demands.
This Nation has the world’s most extensivetransportation system, with a transportationinfrastructure that includes 3.9 million milesof public roads, 180,000 miles of railroadtrack operated by freight railroads, 25,000miles of commercially navigable waterways,5,500 public use airports, 1.4 million milesof privately operated oil and gas pipelines,and over 6,000 transit systems.
Investment in infrastructure is good forAmerica, spurring economic growth; improvingsafety and public health; enhancing U.S.competitiveness globally; increasing mobility,access, and transportation choice for all Ameri-cans; and supporting our national security.To ensure that our national transportationsystem can meet the demands of the 21stCentury, we must build upon the infrastruc-ture we have today and improve its qualityto meet tomorrow’s need for a system thatis intermodal, cleaner, and safer, and thatpromotes sustainable and inclusive commu-nities. And we must focus our resourcesthrough innovative mechanisms, such as thePresident’s new Transportation Fund forAmerica.
Creating the Transportation Fund forAmerica
The budget proposes a new TransportationFund for America to highlight the importanceof investing in transportation and maintainingthe Administration’s record levels of transpor-
tation spending. The Fund includes all ofthe Transportation Department’s highway,highway safety, transit, and air transportationprograms.
• Highways and Bridges: The Fund includes$21.5 billion for the Federal-aid Highwaysprogram to maintain and improve thenearly 955,550 miles of eligible roads andbridges. The increased highway and bridgefunding in recent years has kept pace withmaintenance requirements and reversedthe deterioration of our transportation sys-tem. On the Interstate system, for exam-ple, both pavement and bridge conditionshave improved in the 1990s. In additionto traditional grant programs, the Fundprovides the resources for innovative ap-proaches to address infrastructure needs.Under the State Infrastructure Banks pro-gram, the Federal Government helpsStates underwrite debt issuance for high-way and transit projects. The new Trans-portation Infrastructure Credit Enhance-ment Program provides grants to improvethe financing for nationally significantprojects, including public-private partner-ships.
• Environment: The Federal Highway Ad-ministration’s Transportation Enhance-ments and Congestion Mitigation and AirQuality Improvement Programs, for whichthe Fund includes a combined $1.8 billion,address the environmental impacts oftransportation by funding bike trails, tran-sit projects, pedestrian facilities, historicpreservation projects, water pollution miti-gation, beautification projects, and more.These efforts can improve air quality and
86 THE BUDGET FOR FISCAL YEAR 1999
Table 5–1. AVERAGE ANNUAL TRANSPORTATIONINFRASTRUCTURE INVESTMENT
(Appropriations, obligation limitations and exempt obligations; dollar amounts in millions)
1990–1993AnnualAverage
1994–1998AnnualAverage
1999Proposed
PercentChange:
1990–1993Averageto 1999
PercentChange:
1994–1998Averageto 1999
Infrastructure Investment ............................ 21,145 26,575 29,982 +42% +13%
help reduce the number of days when airpollution exceeds National Ambient AirQuality Standards.
• Highway Safety: The Fund includes $406million for the National Highway TrafficSafety Administration (NHTSA), a 22-per-cent increase over the 1998 level, whichwill fully fund the Presidential Initiativeto Increase Seat Belt Use Nation-wide; thePresident’s Initiative on Drugs, Drivingand Youth; and the President’s Partner-ship for a New Generation of Vehicles.These programs help fulfill the President’sgoal of promoting public health and safetyby reducing transportation-related deathsand injuries, and the proposed fundingwill enable NHTSA to expand the FederalGovernment’s partnership with other lev-els of government, private organizations,and citizens. NHTSA will continue to workwith the medical and health communitiesto focus on the significant public healthimplications of highway fatalities and inju-ries and the associated economic costs tosociety.
• Transit: The Fund provides $4.6 billion fortransit infrastructure, including $3.7 bil-lion in formula grant funds to maintainand expand transit systems in urban,small urban, and rural areas. Nation-wide,the elderly, people with disabilities, andeconomically disadvantaged individualsrely heavily on these systems. The Fundincludes $876 million for major capital in-vestments, providing the resources to meetthe Administration’s full funding grantcommitments to construct new, or expandexisting, transit systems.
• Air Transportation: The Fund includes$9.7 billion for Federal Aviation Adminis-tration (FAA) programs, a seven-percentincrease over the 1998 level. It includes$5.6 billion, a six-percent increase, to con-tinue operating the world’s safest air traf-fic control system; $2.1 billion, a 14-per-cent increase, to buy next generationequipment for the system; and $290 mil-lion, a 46-percent increase, to researchways to make the system safer, more se-cure, and more efficient. It also provides$1.7 billion in grants to improve the Na-tion’s airports.
Building an Intermodal System
Americans do not view transportationthrough the lens of individual modes, suchas highways, trains, or marine or air travel.Rather, they expect transportation to deliverresults—moving people and goods from pointto point. Infrastructure investment builds andmaintains the individual links in the transpor-tation chain and forges them together intoan effective intermodal network.
The budget proposes a record Federal invest-ment of nearly $30 billion in transportationinfrastructure—airports, highways, transit,and trains—continuing the trend of risinginvestments in infrastructure under this Ad-ministration. In 1999, infrastructure invest-ment would rise to a level that is 42percent higher than the annual average of$21.1 billion from 1990 to 1993, and 13percent higher than the annual average of$26.6 billion from 1994 to 1998 (see Table5–1). These increases have helped addressdemands arising from the greater movementof people and goods in a growing economy.
875. INVESTING IN INFRASTRUCTURE
Surface Transportation: Surface transpor-tation programs account for much of the Fed-eral, State, and local transportation infrastruc-ture investment dollar. The 1991 IntermodalSurface Transportation Efficiency Act (ISTEA)broke new ground by giving States and local-ities more flexible and innovative funds forthese programs. Over the past six years, theresults have become clear:
• The percentage of pavement in poor condi-tion on the National Highway System fellfrom 11.3 percent in 1993 to 8.9 percentin 1996.
• State and local officials have used flexiblefunds to target improvements in mobility,economic development, and air qualitythrough projects that selectively foster pe-destrian, bicycle, and transit-supportiveland uses. Local decisions have directed$3.2 billion into transit investments—funds that might otherwise have been re-stricted to highways, regardless of localneeds.
• Overall, the expansion of transit systemsand purchase of transit vehicles expandedtransit capacity by 3.5 percent from 1993to 1995. Transit investments also have le-veraged local development and redevelop-ment by improving public access to majorjob centers and fostering land use thatsupports commercial activity. Transit alsoeases congestion and pollution by slowingthe rate of growth of auto traffic.
The Administration’s proposed National Eco-nomic Crossroads Transportation EfficiencyAct (NEXTEA) builds on these successesand significantly enhances the Nation’s abilityto promote intermodal development. NEXTEAauthorizes $175 billion for surface transpor-tation programs from 1998 to 2003, andincreases core highway program authorizationsby more than 30 percent over ISTEA levels.NEXTEA provides even greater flexibility forStates and localities to target funds toprojects—such as passenger rail, intercitybus, and transit—that best meet communityneeds.
The budget and reauthorization proposalsfor the Federal Highway Administration giveState and local officials maximum flexibilityto meet their local priorities. The budget
provides $22.4 billion to maintain the high-ways critical to interstate transportation. Inaddition, it proposes $250 million to leverageprivate financing for new transportation infra-structure projects. Of the $250 million, $150million would capitalize State InfrastructureBanks that enable States to underwrite bonds,enhance credit, and make loans. The other$100 million would fund the InfrastructureCredit Enhancement grants to improve thefinancing of public-private projects of nationalsignificance. The Alameda Corridor, first fund-ed in 1997, is an example of a public-private project that will improve nationalcompetitiveness by contributing to efficiencyin domestic handling of international ship-ments in and out of the Ports of Los Angelesand Long Beach.
The budget also proposes a $4.6 billioninvestment in transit infrastructure. Relyingon the NEXTEA program structure, the Ad-ministration proposes to combine the Discre-tionary Bus and Fixed Guideway Moderniza-tion programs with the Formula Grants pro-gram, giving transit properties maximum flexi-bility to meet their capital needs. Of thetransit investments, $100 million would gofor the new Access to Jobs and TrainingProgram, designed to establish partnershipsbetween transportation and human serviceproviders to support new transportation linksto entry-level jobs.
Border Gateway Pilot Program: InNEXTEA, the Administration proposes a spe-cial border program to improve transportationat international border crossings and alongmajor trade transportation corridors. The pro-posed $540 million Border Gateway Pilot Pro-gram ($90 million a year) would develop andimplement coordinated, comprehensive bordercrossing plans and programs, thus promotingthe efficient and safe use of border crossingswithin defined international gateways.
Passenger Rail: Investments in passengerrail are a critical piece of our Nation’s trans-portation infrastructure. The Administrationproposes over $600 million to fund the Na-tional Railroad Passenger Corporation, knownas Amtrak. This discretionary funding, com-bined with over $2.2 billion available to Am-trak under the Taxpayer Relief Act, represents
88 THE BUDGET FOR FISCAL YEAR 1999
historic levels of Federal capital support forpassenger rail.
The 1998 Amtrak Reform and AccountabilityAct, Amtrak’s first reauthorization since 1992,provides for its most comprehensive restructur-ing since the early 1980s. Amtrak is avital component of our national transportationservices in densely populated corridors, suchas the Northeast; on medium- and short-haul routes; and on trans-continental routeslinking cities across the Nation. In manyareas of rural America, it is the only transpor-tation alternative to the automobile. Withthe available funds, Amtrak would be ableto make needed capital improvements, includ-ing replacing its aging car fleet, upgradingits tracks, and rehabilitating stations andmaintenance facilities Nation-wide. With theseimprovements, Amtrak would be able to at-tract new customers and better serve theones it has. The budget also maintains theAdministration’s commitment to end Federaloperating assistance to Amtrak by the year2002.
New high-speed operations in the Northeastcorridor between Boston and Washington area key part of this greatly improved railservice. As part of its $621 million requestfor Amtrak, the Administration proposes $200million for the Northeast Corridor Improve-ment Project to significantly expand the flexi-bility that travelers enjoy. By the end of1999, with the completion of electrificationbetween New Haven and Boston, the entireBoston-to-Washington corridor would operateas high-speed rail. In 2000, the Washington-New York market would have two-hour-and-45-minute service, while the New York-Bostonmarket would have three-hour service, com-pared to current service times of three hoursand four-hours-and-20-minutes, respectively.Travelers accustomed to the surface-airport-surface intermodal connections to and fromurban centers along the Northeast corridorwould have a realistic alternative of walk-aboard, business-center-to-business-center railservice.
Air Transportation—National AirspaceSystem (NAS) Modernization: As air travelgrows from 600 million to an estimated onebillion passengers a year by 2010, demand forair traffic control (ATC) services will outstrip
the NAS’ current capacity. At the same time,equipment for the ATC system, although stillsafe, is reaching the end of its useful life. Asa result, ATC modernization is one of the Ad-ministration’s highest transportation infra-structure priorities.
In its February 1997 report to the President,the White House Commission on AviationSafety and Security, led by Vice PresidentGore and known as the Gore Commission,highlighted the need for increased aviationinvestment. It noted that ‘‘inefficiencies inthe system cost airlines in excess of $3billion in 1995—costs ultimately paid bypassengers.’’ To address these inefficiencies,the Commission recommended that a ‘‘modern-ized system (be) fully operational by theyear 2005.’’
The budget is an important step towardachieving this goal. It proposes about 10percent average annual increases in aviationcapital modernization funding over the nextfive years. For 1999, the budget invests$2.1 billion in modernization, compared tothe $1.9 billion that Congress enacted in1998. It supports continued replacement ofair traffic control computers at the Nation’sbusiest airports and en-route centers, andmaintains the safety and integrity of existingsystems until they are replaced. It alsopromotes the development of prototype soft-ware tools to allow air traffic controllersto route traffic more efficiently. By 2003,the projected capital modernization budgettotals $3.2 billion (see Table 5–2).
The budget makes longer-term investmentsin developing advanced navigation, commu-nications, and decision support technologyin pursuit of a revolutionary operational con-cept known as ‘‘free-flight.’’ It includes morethan $300 million over five years for theFlight 2000 Demonstration Program to testand validate the equipment and proceduresneeded to shift from traditional ground-basedair traffic control to more collaborative airtraffic management. Also, as the Gore Com-mission recommended, the budget proposes$100 million in 1999 to purchase 88 explosivesdetection systems, 125 trace detection devices,85 carry-on-baggage x-ray machines, and asmany as 100 hardened cargo containers forpassenger jets.
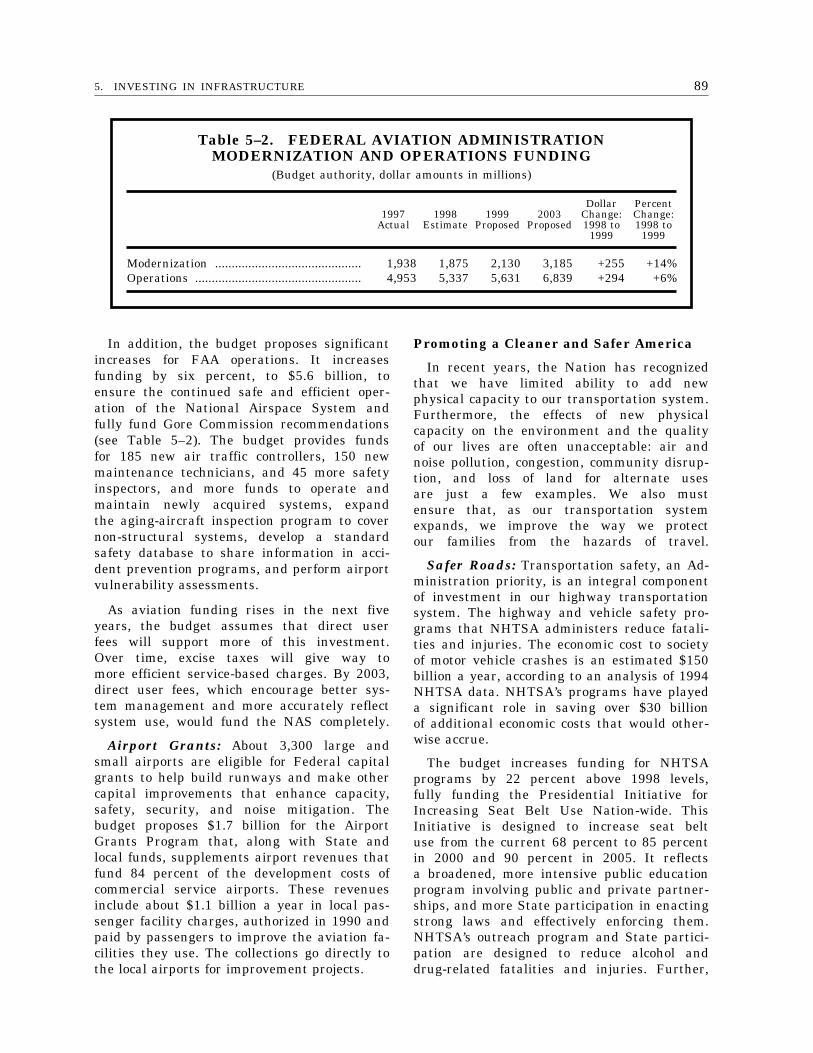
895. INVESTING IN INFRASTRUCTURE
Table 5–2. FEDERAL AVIATION ADMINISTRATIONMODERNIZATION AND OPERATIONS FUNDING
(Budget authority, dollar amounts in millions)
1997Actual
1998Estimate
1999Proposed
2003Proposed
DollarChange:1998 to
1999
PercentChange:1998 to
1999
Modernization ............................................ 1,938 1,875 2,130 3,185 +255 +14%Operations .................................................. 4,953 5,337 5,631 6,839 +294 +6%
In addition, the budget proposes significantincreases for FAA operations. It increasesfunding by six percent, to $5.6 billion, toensure the continued safe and efficient oper-ation of the National Airspace System andfully fund Gore Commission recommendations(see Table 5–2). The budget provides fundsfor 185 new air traffic controllers, 150 newmaintenance technicians, and 45 more safetyinspectors, and more funds to operate andmaintain newly acquired systems, expandthe aging-aircraft inspection program to covernon-structural systems, develop a standardsafety database to share information in acci-dent prevention programs, and perform airportvulnerability assessments.
As aviation funding rises in the next fiveyears, the budget assumes that direct userfees will support more of this investment.Over time, excise taxes will give way tomore efficient service-based charges. By 2003,direct user fees, which encourage better sys-tem management and more accurately reflectsystem use, would fund the NAS completely.
Airport Grants: About 3,300 large andsmall airports are eligible for Federal capitalgrants to help build runways and make othercapital improvements that enhance capacity,safety, security, and noise mitigation. Thebudget proposes $1.7 billion for the AirportGrants Program that, along with State andlocal funds, supplements airport revenues thatfund 84 percent of the development costs ofcommercial service airports. These revenuesinclude about $1.1 billion a year in local pas-senger facility charges, authorized in 1990 andpaid by passengers to improve the aviation fa-cilities they use. The collections go directly tothe local airports for improvement projects.
Promoting a Cleaner and Safer America
In recent years, the Nation has recognizedthat we have limited ability to add newphysical capacity to our transportation system.Furthermore, the effects of new physicalcapacity on the environment and the qualityof our lives are often unacceptable: air andnoise pollution, congestion, community disrup-tion, and loss of land for alternate usesare just a few examples. We also mustensure that, as our transportation systemexpands, we improve the way we protectour families from the hazards of travel.
Safer Roads: Transportation safety, an Ad-ministration priority, is an integral componentof investment in our highway transportationsystem. The highway and vehicle safety pro-grams that NHTSA administers reduce fatali-ties and injuries. The economic cost to societyof motor vehicle crashes is an estimated $150billion a year, according to an analysis of 1994NHTSA data. NHTSA’s programs have playeda significant role in saving over $30 billionof additional economic costs that would other-wise accrue.
The budget increases funding for NHTSAprograms by 22 percent above 1998 levels,fully funding the Presidential Initiative forIncreasing Seat Belt Use Nation-wide. ThisInitiative is designed to increase seat beltuse from the current 68 percent to 85 percentin 2000 and 90 percent in 2005. It reflectsa broadened, more intensive public educationprogram involving public and private partner-ships, and more State participation in enactingstrong laws and effectively enforcing them.NHTSA’s outreach program and State partici-pation are designed to reduce alcohol anddrug-related fatalities and injuries. Further,
90 THE BUDGET FOR FISCAL YEAR 1999
NHTSA’s research and vehicle programs em-ploy engineering and marketing approachesto improve vehicle safety and enhance ourhighway safety and infrastructure.
Intelligent Transportation Systems(ITS): In our surface modes, the broad rangeof technologies that the Administration is de-veloping, testing, and installing under the ITSprogram hold the promise of meeting greatertraffic demand with existing facilities; reducingcongestion; and improving safety. ITS pro-grams can also increase personal mobility, cutfreight costs, and allow firms to develop cus-tomized transportation solutions. Togetherwith the local flexibility that ISTEA offers,these programs helped hold peak-hour conges-tion growth on urban interstate highways to2.5 percent from 1990 to 1995, despite greaterannual increases in vehicle travel.
Congestion Mitigation and Air QualityImprovements (CMAQ): To make America’stransportation system more environmentallysensitive, the budget proposes $1.3 billion forthe CMAQ program, which funds many inno-vative infrastructure projects to improve theNation’s air quality and reduce congestion.Transit investment and bicycle- and pedes-trian-oriented infrastructure projects have pro-vided commuting and recreation alternativesin many of our heavily populated urban areas,and coordinated responses to congestion haveenabled local communities to reduce emissions.
Maritime Efficiency: America’s roads andrailways stop at the border, but our economicand national security interests extend acrossthe globe. Our ports and waterways tie Amer-ica to the rest of the world. The Coast Guardis developing the Port and Waterway SafetySystem to improve shipping control and in-crease safety in major U.S. ports. Investmentsin maritime Differential Global PositioningSystems and in the national VHF-FM commu-nication system will move vessels more safelyand efficiently through our waterways. TheCoast Guard is also modernizing its capitalassets by replacing 37 World War II-era buoytenders with 30 technically advanced, mini-mally-manned vessels that can more efficientlymaintain our 50,000 public navigational aidsas well as respond to oil spills.
Further, the Maritime Administration ad-ministers the Title XI loan guarantee program
that, since 1994, has guaranteed the construc-tion of 296 ships and six shipyard moderniza-tion projects, totaling over $2.1 billion. Thebudget, which proposes over $500 millionfor Title XI loan guarantees, reflects theAdministration’s support for this valuableprogram and represents the President’s contin-ued commitment to maintain a strong, viableU.S. merchant marine and shipbuilding indus-try.
Investing in Sustainable and InclusiveCommunities
Americans use their transportation systemmore and more because our infrastructureinvestment, in the form of transit, passengerrail, and bus systems, gives them a hostof options. It particularly benefits those whocannot travel by automobile or other privatevehicle due to income, disability, or age.
Community-Oriented Transportation:Since 1993, the Administration has provided$52 million in transit funding to 21 commu-nities in order to foster community-oriented,customer-friendly transportation facilities andservices. The Livable Communities Initiative(LCI) enhances the impact of transportationinvestments by leveraging State and localfunds, using flexible highway funds and othereligible sources. For example:
• One successful LCI initiative in Atlantaled to better pedestrian access to transitstations and the construction of three newgateways to the Atlanta University Cen-ter, improving ridership, safety, and accessto jobs, and providing new communityservice and educational opportunities.
• Another LCI project, the Los AngelesNeighborhood Initiative, led to transit-re-lated improvements that attracted neigh-borhood investment, played a leading rolein the city’s redevelopment, and helped cutthe crime rate by 19 percent.
In addition, from 1994 to 1998, the Adminis-tration has provided $2.1 billion to the Statesto fund Transportation Enhancement projects,and the budget proposes $561 million for1999. This funding supports transportation-related recreational trails, historic preser-vation, water pollution mitigation, and eco-nomic development activities designed to im-
915. INVESTING IN INFRASTRUCTURE
prove the quality of life in our communities.Other Federal grants will continue to relieveaircraft noise problems by helping to sound-proof or relocate residences and public build-ings in runway approach zones.
Welfare-to-Work: Transportation infrastruc-ture plays a critical role in welfare reform.The Administration seeks to strengthen thevital connection between transportation and
employment through its Access to Jobs andTraining Initiative. The budget provides $100million to develop new and supplementarytransportation to enhance the access that wel-fare recipients and other economically dis-advantaged persons have to jobs and supportactivities. More generally, the Administrationseeks to forge public-private partnerships thatcan help get people to the jobs that may lieoutside their immediate neighborhoods.

93
6. PROMOTING RESEARCH
I ask you to simply imagine that new century full of its promise, molded by science, shaped bytechnology, powered by knowledge. These potent transforming forces can give us lives fuller andricher than we have ever known . . . If we are to make the most of this century, we—all of us, eachand every one of us, regardless of our background—must work to master these forces with visionand wisdom and determination. The past half-century has seen mankind split the atom, splicegenes, create the microchip, explore the heavens. We enter the next century propelled by new andstunning developments.
President ClintonMay 1997
Scientific and technological advances haveleft few facets of life untouched. Great leapsin the speed and economy of transportation,enormous increases in farm productivity, glob-al flows of information and services, advancesin health treatment and prevention and inenvironmental protection—all these changeshave created a world at the dawn of the21st Century that is vastly different fromthe world our grandparents knew. As numer-ous studies show, technological innovationand scientific discovery have been responsiblefor at least half of the Nation’s productivitygrowth in the last 50 years, generated millionsof high-skill, high-wage jobs, and substantiallyimproved the quality of life in America.
The Federal Government has played animportant role in spurring and sustainingthis scientific and technological advance.Among other feats, Government-sponsored re-search and development (R&D) has put Ameri-cans on the moon, explored the oceans, har-nessed the atom, devised more effective treat-ments for cancers, found the remains oflost civilizations, tracked weather patternsand earthquake faults, and discovered thechemistry of life. No other country in historycan match America’s record of achievementin science and technology.
Because these investments have paid suchrich dividends, and because the next centurywill bring new challenges, opportunities, andproblems that science and technology canhelp address, continued U.S. leadership inscience and technology is a cornerstone of
the President’s and the Vice President’s visionfor America. Thus, the budget strengthensthese vital investments, contributing substan-tially to many of the Administration’s broadergoals by creating new knowledge, trainingmore workers, catalyzing new jobs and indus-tries, addressing health challenges, enhancingour understanding of and ability to addressenvironmental problems, improving the edu-cation of our children, and maintaining astrong national defense. The centerpiece ofthe Administration’s continuing commitmentis the proposed Research Fund for America,from which many of the research dollarswill now flow.
But Federal funds are not limitless. Thus,agencies are working to make smarter, betterscience and technology investments, guidedby two fundamental principles.
• First, agencies are focusing on potentiallyhigh-payoff research that could have sub-stantial public benefit, but is too high-riskor long-term for the private sector. TheFederal Government, in partnership withStates, universities, and industry, sup-ports a balanced mix of basic and appliedresearch and technology development,given that scientific discovery and techno-logical innovation are intricately inter-woven. The Federal Government alsosupports international partnerships thatbenefit our scientists, leverage our invest-ments, and address complex, globalproblems.
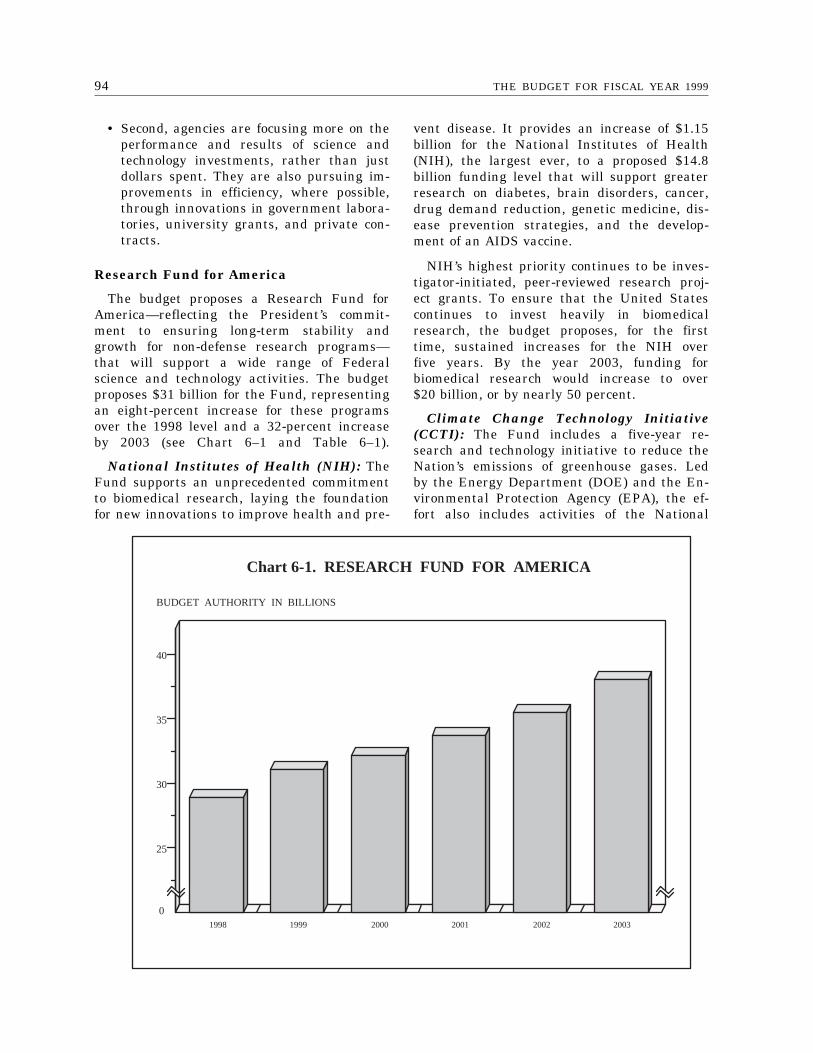
94 THE BUDGET FOR FISCAL YEAR 1999
1998 1999 2000 2001 2002 2003
25
30
35
40
BUDGET AUTHORITY IN BILLIONS
Chart 6-1. RESEARCH FUND FOR AMERICA
0
• Second, agencies are focusing more on theperformance and results of science andtechnology investments, rather than justdollars spent. They are also pursuing im-provements in efficiency, where possible,through innovations in government labora-tories, university grants, and private con-tracts.
Research Fund for America
The budget proposes a Research Fund forAmerica—reflecting the President’s commit-ment to ensuring long-term stability andgrowth for non-defense research programs—that will support a wide range of Federalscience and technology activities. The budgetproposes $31 billion for the Fund, representingan eight-percent increase for these programsover the 1998 level and a 32-percent increaseby 2003 (see Chart 6–1 and Table 6–1).
National Institutes of Health (NIH): TheFund supports an unprecedented commitmentto biomedical research, laying the foundationfor new innovations to improve health and pre-
vent disease. It provides an increase of $1.15billion for the National Institutes of Health(NIH), the largest ever, to a proposed $14.8billion funding level that will support greaterresearch on diabetes, brain disorders, cancer,drug demand reduction, genetic medicine, dis-ease prevention strategies, and the develop-ment of an AIDS vaccine.
NIH’s highest priority continues to be inves-tigator-initiated, peer-reviewed research proj-ect grants. To ensure that the United Statescontinues to invest heavily in biomedicalresearch, the budget proposes, for the firsttime, sustained increases for the NIH overfive years. By the year 2003, funding forbiomedical research would increase to over$20 billion, or by nearly 50 percent.
Climate Change Technology Initiative(CCTI): The Fund includes a five-year re-search and technology initiative to reduce theNation’s emissions of greenhouse gases. Ledby the Energy Department (DOE) and the En-vironmental Protection Agency (EPA), the ef-fort also includes activities of the National
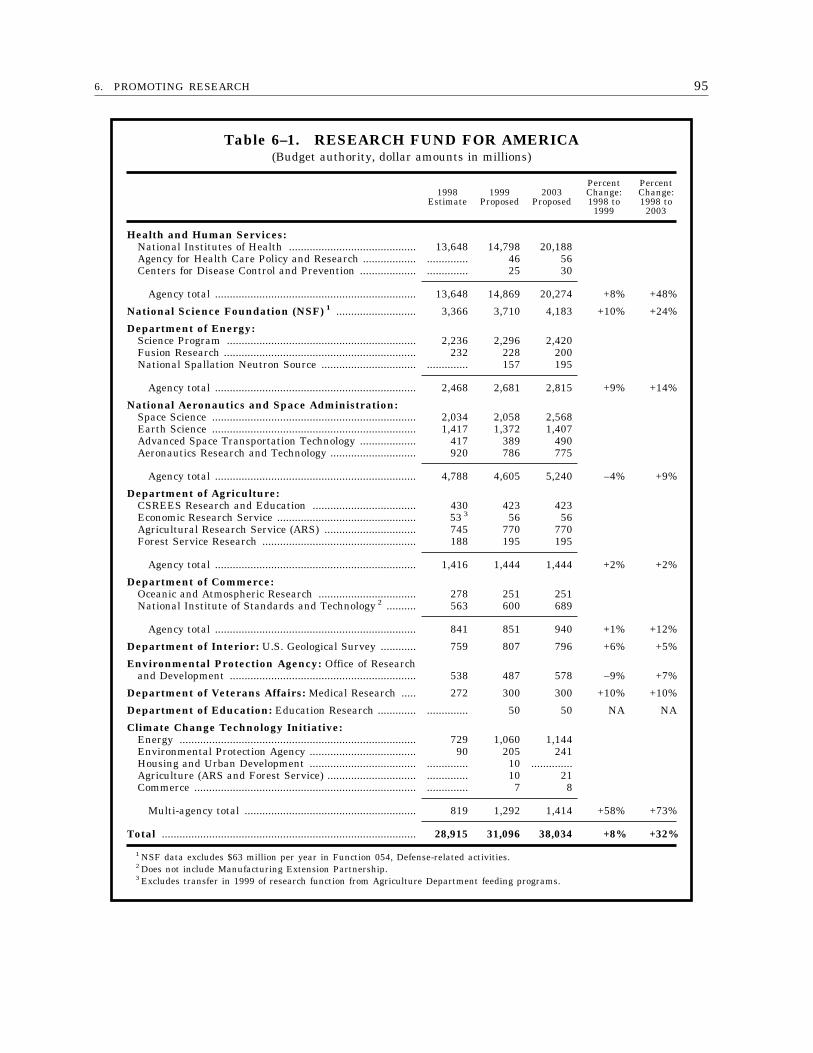
956. PROMOTING RESEARCH
Table 6–1. RESEARCH FUND FOR AMERICA(Budget authority, dollar amounts in millions)
1998Estimate
1999Proposed
2003Proposed
PercentChange:1998 to
1999
PercentChange:1998 to
2003
Health and Human Services:National Institutes of Health ........................................... 13,648 14,798 20,188Agency for Health Care Policy and Research .................. .............. 46 56Centers for Disease Control and Prevention ................... .............. 25 30
Agency total .................................................................... 13,648 14,869 20,274 +8% +48%
National Science Foundation (NSF) 1 ........................... 3,366 3,710 4,183 +10% +24%
Department of Energy:Science Program ................................................................ 2,236 2,296 2,420Fusion Research ................................................................. 232 228 200National Spallation Neutron Source ................................ .............. 157 195
Agency total .................................................................... 2,468 2,681 2,815 +9% +14%
National Aeronautics and Space Administration:Space Science ..................................................................... 2,034 2,058 2,568Earth Science ..................................................................... 1,417 1,372 1,407Advanced Space Transportation Technology ................... 417 389 490Aeronautics Research and Technology ............................. 920 786 775
Agency total .................................................................... 4,788 4,605 5,240 –4% +9%
Department of Agriculture:CSREES Research and Education ................................... 430 423 423Economic Research Service ............................................... 53 3 56 56Agricultural Research Service (ARS) ............................... 745 770 770Forest Service Research .................................................... 188 195 195
Agency total .................................................................... 1,416 1,444 1,444 +2% +2%
Department of Commerce:Oceanic and Atmospheric Research ................................. 278 251 251National Institute of Standards and Technology 2 .......... 563 600 689
Agency total .................................................................... 841 851 940 +1% +12%
Department of Interior: U.S. Geological Survey ............ 759 807 796 +6% +5%
Environmental Protection Agency: Office of Researchand Development ............................................................... 538 487 578 –9% +7%
Department of Veterans Affairs: Medical Research ..... 272 300 300 +10% +10%
Department of Education: Education Research ............. .............. 50 50 NA NA
Climate Change Technology Initiative:Energy ................................................................................ 729 1,060 1,144Environmental Protection Agency .................................... 90 205 241Housing and Urban Development .................................... .............. 10 ..............Agriculture (ARS and Forest Service) .............................. .............. 10 21Commerce ........................................................................... .............. 7 8
Multi-agency total .......................................................... 819 1,292 1,414 +58% +73%
Total ...................................................................................... 28,915 31,096 38,034 +8% +32%
1 NSF data excludes $63 million per year in Function 054, Defense-related activities.2 Does not include Manufacturing Extension Partnership.3 Excludes transfer in 1999 of research function from Agriculture Department feeding programs.
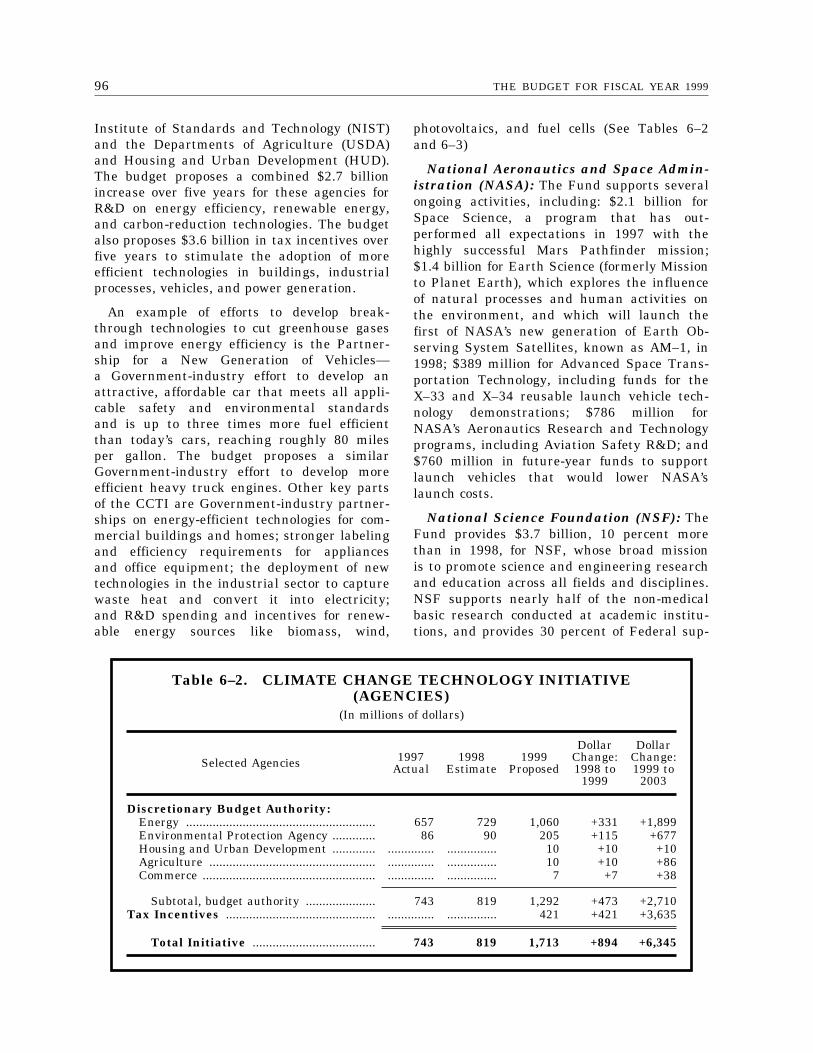
96 THE BUDGET FOR FISCAL YEAR 1999
Table 6–2. CLIMATE CHANGE TECHNOLOGY INITIATIVE(AGENCIES)
(In millions of dollars)
Selected Agencies 1997Actual
1998Estimate
1999Proposed
DollarChange:1998 to
1999
DollarChange:1999 to
2003
Discretionary Budget Authority:Energy ......................................................... 657 729 1,060 +331 +1,899Environmental Protection Agency ............. 86 90 205 +115 +677Housing and Urban Development ............. .............. ............... 10 +10 +10Agriculture .................................................. .............. ............... 10 +10 +86Commerce .................................................... .............. ............... 7 +7 +38
Subtotal, budget authority ..................... 743 819 1,292 +473 +2,710Tax Incentives ............................................. .............. ............... 421 +421 +3,635
Total Initiative ..................................... 743 819 1,713 +894 +6,345
Institute of Standards and Technology (NIST)and the Departments of Agriculture (USDA)and Housing and Urban Development (HUD).The budget proposes a combined $2.7 billionincrease over five years for these agencies forR&D on energy efficiency, renewable energy,and carbon-reduction technologies. The budgetalso proposes $3.6 billion in tax incentives overfive years to stimulate the adoption of moreefficient technologies in buildings, industrialprocesses, vehicles, and power generation.
An example of efforts to develop break-through technologies to cut greenhouse gasesand improve energy efficiency is the Partner-ship for a New Generation of Vehicles—a Government-industry effort to develop anattractive, affordable car that meets all appli-cable safety and environmental standardsand is up to three times more fuel efficientthan today’s cars, reaching roughly 80 milesper gallon. The budget proposes a similarGovernment-industry effort to develop moreefficient heavy truck engines. Other key partsof the CCTI are Government-industry partner-ships on energy-efficient technologies for com-mercial buildings and homes; stronger labelingand efficiency requirements for appliancesand office equipment; the deployment of newtechnologies in the industrial sector to capturewaste heat and convert it into electricity;and R&D spending and incentives for renew-able energy sources like biomass, wind,
photovoltaics, and fuel cells (See Tables 6–2and 6–3)
National Aeronautics and Space Admin-istration (NASA): The Fund supports severalongoing activities, including: $2.1 billion forSpace Science, a program that has out-performed all expectations in 1997 with thehighly successful Mars Pathfinder mission;$1.4 billion for Earth Science (formerly Missionto Planet Earth), which explores the influenceof natural processes and human activities onthe environment, and which will launch thefirst of NASA’s new generation of Earth Ob-serving System Satellites, known as AM–1, in1998; $389 million for Advanced Space Trans-portation Technology, including funds for theX–33 and X–34 reusable launch vehicle tech-nology demonstrations; $786 million forNASA’s Aeronautics Research and Technologyprograms, including Aviation Safety R&D; and$760 million in future-year funds to supportlaunch vehicles that would lower NASA’slaunch costs.
National Science Foundation (NSF): TheFund provides $3.7 billion, 10 percent morethan in 1998, for NSF, whose broad missionis to promote science and engineering researchand education across all fields and disciplines.NSF supports nearly half of the non-medicalbasic research conducted at academic institu-tions, and provides 30 percent of Federal sup-
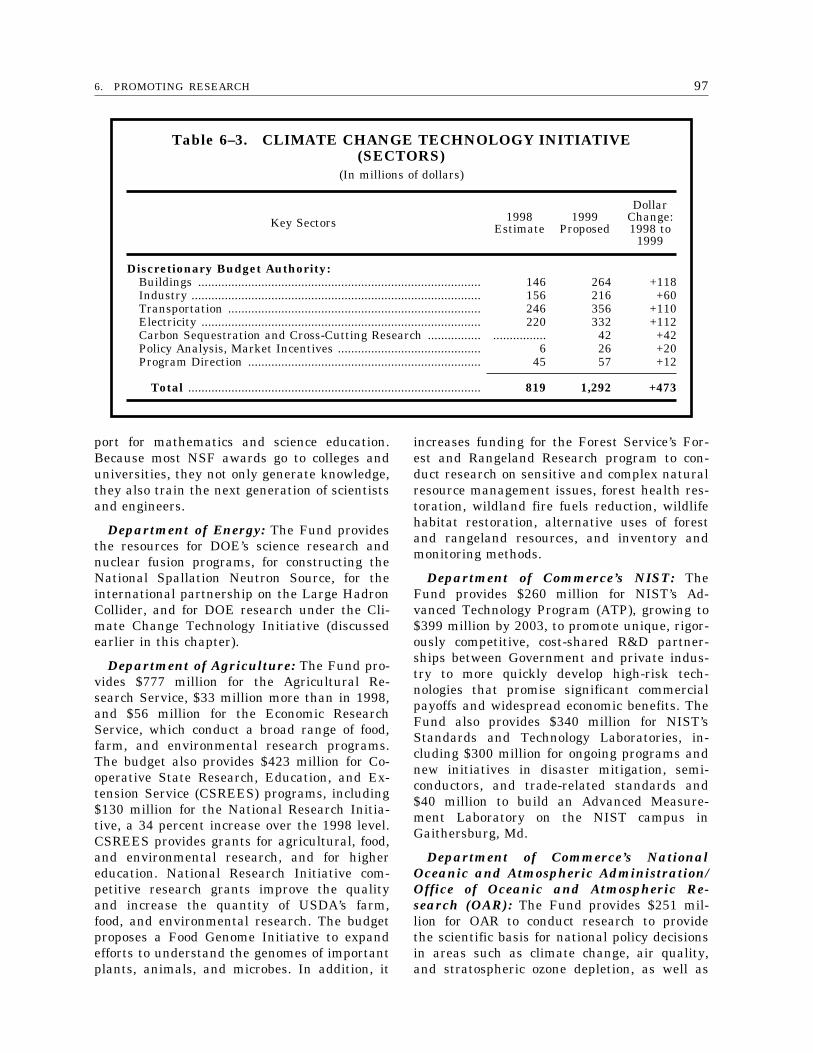
976. PROMOTING RESEARCH
Table 6–3. CLIMATE CHANGE TECHNOLOGY INITIATIVE(SECTORS)
(In millions of dollars)
Key Sectors 1998Estimate
1999Proposed
DollarChange:1998 to
1999
Discretionary Budget Authority:Buildings ..................................................................................... 146 264 +118Industry ....................................................................................... 156 216 +60Transportation ............................................................................ 246 356 +110Electricity .................................................................................... 220 332 +112Carbon Sequestration and Cross-Cutting Research ................ ................ 42 +42Policy Analysis, Market Incentives ........................................... 6 26 +20Program Direction ...................................................................... 45 57 +12
Total ........................................................................................ 819 1,292 +473
port for mathematics and science education.Because most NSF awards go to colleges anduniversities, they not only generate knowledge,they also train the next generation of scientistsand engineers.
Department of Energy: The Fund providesthe resources for DOE’s science research andnuclear fusion programs, for constructing theNational Spallation Neutron Source, for theinternational partnership on the Large HadronCollider, and for DOE research under the Cli-mate Change Technology Initiative (discussedearlier in this chapter).
Department of Agriculture: The Fund pro-vides $777 million for the Agricultural Re-search Service, $33 million more than in 1998,and $56 million for the Economic ResearchService, which conduct a broad range of food,farm, and environmental research programs.The budget also provides $423 million for Co-operative State Research, Education, and Ex-tension Service (CSREES) programs, including$130 million for the National Research Initia-tive, a 34 percent increase over the 1998 level.CSREES provides grants for agricultural, food,and environmental research, and for highereducation. National Research Initiative com-petitive research grants improve the qualityand increase the quantity of USDA’s farm,food, and environmental research. The budgetproposes a Food Genome Initiative to expandefforts to understand the genomes of importantplants, animals, and microbes. In addition, it
increases funding for the Forest Service’s For-est and Rangeland Research program to con-duct research on sensitive and complex naturalresource management issues, forest health res-toration, wildland fire fuels reduction, wildlifehabitat restoration, alternative uses of forestand rangeland resources, and inventory andmonitoring methods.
Department of Commerce’s NIST: TheFund provides $260 million for NIST’s Ad-vanced Technology Program (ATP), growing to$399 million by 2003, to promote unique, rigor-ously competitive, cost-shared R&D partner-ships between Government and private indus-try to more quickly develop high-risk tech-nologies that promise significant commercialpayoffs and widespread economic benefits. TheFund also provides $340 million for NIST’sStandards and Technology Laboratories, in-cluding $300 million for ongoing programs andnew initiatives in disaster mitigation, semi-conductors, and trade-related standards and$40 million to build an Advanced Measure-ment Laboratory on the NIST campus inGaithersburg, Md.
Department of Commerce’s NationalOceanic and Atmospheric Administration/Office of Oceanic and Atmospheric Re-search (OAR): The Fund provides $251 mil-lion for OAR to conduct research to providethe scientific basis for national policy decisionsin areas such as climate change, air quality,and stratospheric ozone depletion, as well as
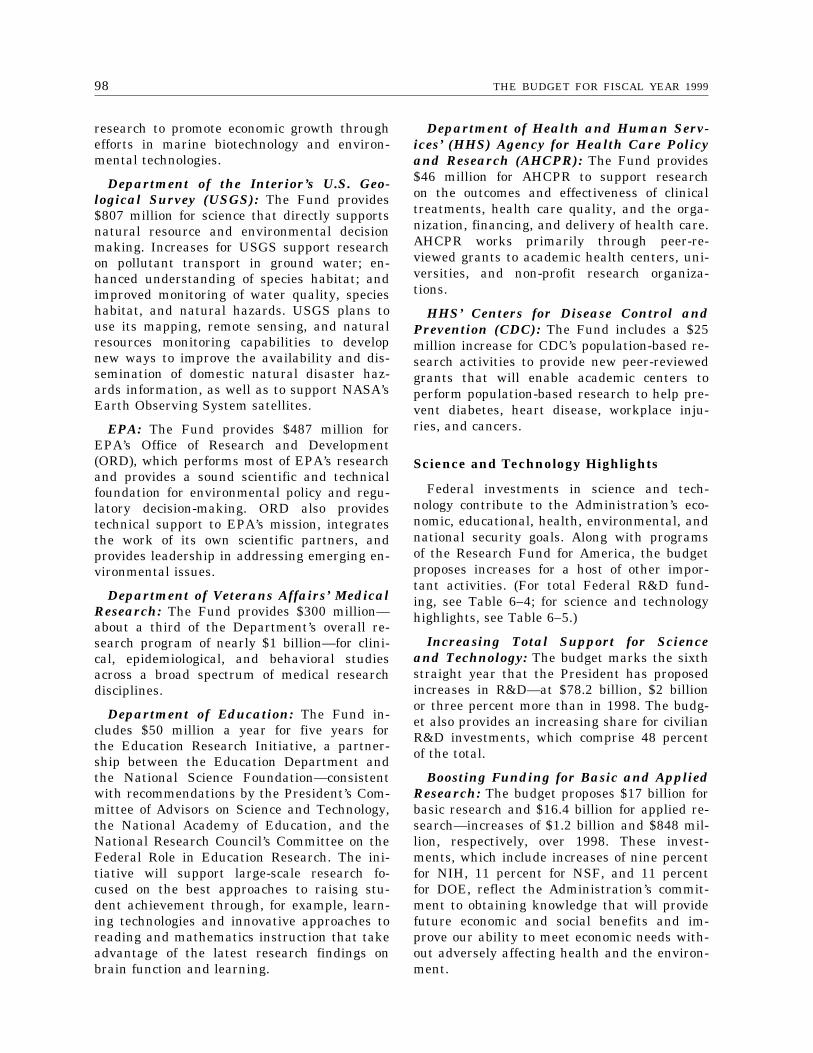
98 THE BUDGET FOR FISCAL YEAR 1999
research to promote economic growth throughefforts in marine biotechnology and environ-mental technologies.
Department of the Interior’s U.S. Geo-logical Survey (USGS): The Fund provides$807 million for science that directly supportsnatural resource and environmental decisionmaking. Increases for USGS support researchon pollutant transport in ground water; en-hanced understanding of species habitat; andimproved monitoring of water quality, specieshabitat, and natural hazards. USGS plans touse its mapping, remote sensing, and naturalresources monitoring capabilities to developnew ways to improve the availability and dis-semination of domestic natural disaster haz-ards information, as well as to support NASA’sEarth Observing System satellites.
EPA: The Fund provides $487 million forEPA’s Office of Research and Development(ORD), which performs most of EPA’s researchand provides a sound scientific and technicalfoundation for environmental policy and regu-latory decision-making. ORD also providestechnical support to EPA’s mission, integratesthe work of its own scientific partners, andprovides leadership in addressing emerging en-vironmental issues.
Department of Veterans Affairs’ MedicalResearch: The Fund provides $300 million—about a third of the Department’s overall re-search program of nearly $1 billion—for clini-cal, epidemiological, and behavioral studiesacross a broad spectrum of medical researchdisciplines.
Department of Education: The Fund in-cludes $50 million a year for five years forthe Education Research Initiative, a partner-ship between the Education Department andthe National Science Foundation—consistentwith recommendations by the President’s Com-mittee of Advisors on Science and Technology,the National Academy of Education, and theNational Research Council’s Committee on theFederal Role in Education Research. The ini-tiative will support large-scale research fo-cused on the best approaches to raising stu-dent achievement through, for example, learn-ing technologies and innovative approaches toreading and mathematics instruction that takeadvantage of the latest research findings onbrain function and learning.
Department of Health and Human Serv-ices’ (HHS) Agency for Health Care Policyand Research (AHCPR): The Fund provides$46 million for AHCPR to support researchon the outcomes and effectiveness of clinicaltreatments, health care quality, and the orga-nization, financing, and delivery of health care.AHCPR works primarily through peer-re-viewed grants to academic health centers, uni-versities, and non-profit research organiza-tions.
HHS’ Centers for Disease Control andPrevention (CDC): The Fund includes a $25million increase for CDC’s population-based re-search activities to provide new peer-reviewedgrants that will enable academic centers toperform population-based research to help pre-vent diabetes, heart disease, workplace inju-ries, and cancers.
Science and Technology Highlights
Federal investments in science and tech-nology contribute to the Administration’s eco-nomic, educational, health, environmental, andnational security goals. Along with programsof the Research Fund for America, the budgetproposes increases for a host of other impor-tant activities. (For total Federal R&D fund-ing, see Table 6–4; for science and technologyhighlights, see Table 6–5.)
Increasing Total Support for Scienceand Technology: The budget marks the sixthstraight year that the President has proposedincreases in R&D—at $78.2 billion, $2 billionor three percent more than in 1998. The budg-et also provides an increasing share for civilianR&D investments, which comprise 48 percentof the total.
Boosting Funding for Basic and AppliedResearch: The budget proposes $17 billion forbasic research and $16.4 billion for applied re-search—increases of $1.2 billion and $848 mil-lion, respectively, over 1998. These invest-ments, which include increases of nine percentfor NIH, 11 percent for NSF, and 11 percentfor DOE, reflect the Administration’s commit-ment to obtaining knowledge that will providefuture economic and social benefits and im-prove our ability to meet economic needs with-out adversely affecting health and the environ-ment.
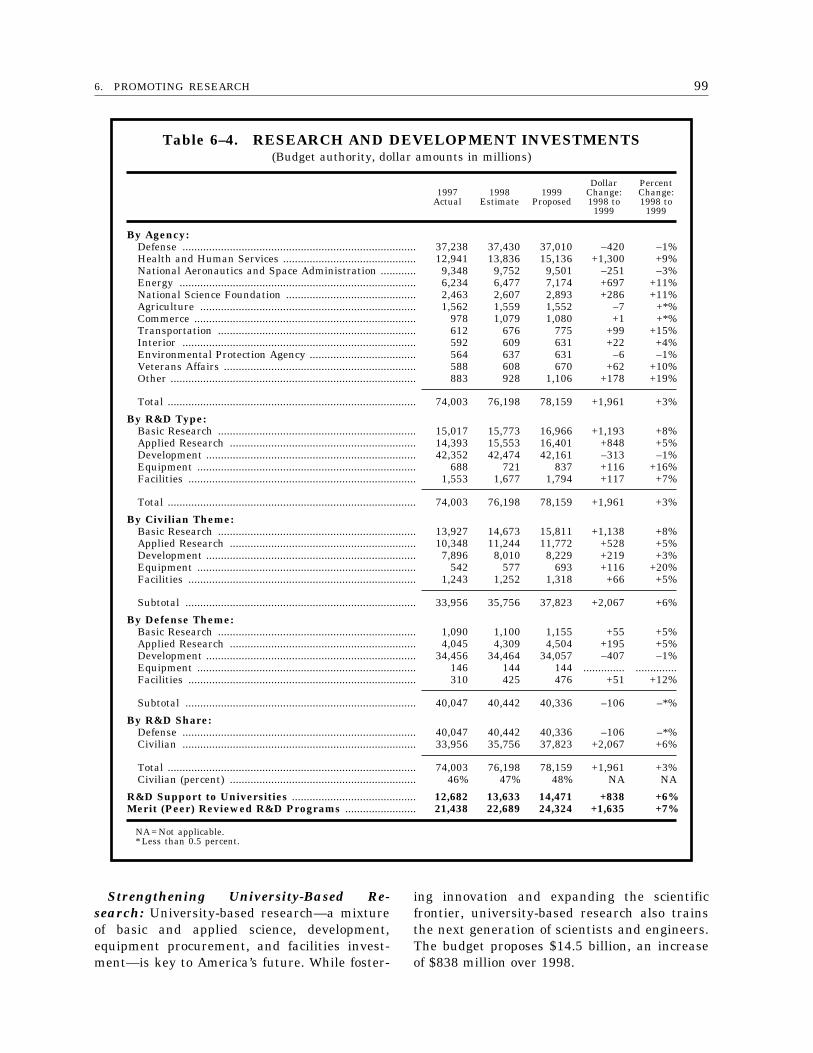
996. PROMOTING RESEARCH
Table 6–4. RESEARCH AND DEVELOPMENT INVESTMENTS(Budget authority, dollar amounts in millions)
1997Actual
1998Estimate
1999Proposed
DollarChange:1998 to
1999
PercentChange:1998 to
1999
By Agency:Defense ............................................................................... 37,238 37,430 37,010 –420 –1%Health and Human Services ............................................. 12,941 13,836 15,136 +1,300 +9%National Aeronautics and Space Administration ............ 9,348 9,752 9,501 –251 –3%Energy ................................................................................ 6,234 6,477 7,174 +697 +11%National Science Foundation ............................................ 2,463 2,607 2,893 +286 +11%Agriculture ......................................................................... 1,562 1,559 1,552 –7 +*%Commerce ........................................................................... 978 1,079 1,080 +1 +*%Transportation ................................................................... 612 676 775 +99 +15%Interior ............................................................................... 592 609 631 +22 +4%Environmental Protection Agency .................................... 564 637 631 –6 –1%Veterans Affairs ................................................................. 588 608 670 +62 +10%Other ................................................................................... 883 928 1,106 +178 +19%
Total .................................................................................... 74,003 76,198 78,159 +1,961 +3%
By R&D Type:Basic Research ................................................................... 15,017 15,773 16,966 +1,193 +8%Applied Research ............................................................... 14,393 15,553 16,401 +848 +5%Development ....................................................................... 42,352 42,474 42,161 –313 –1%Equipment .......................................................................... 688 721 837 +116 +16%Facilities ............................................................................. 1,553 1,677 1,794 +117 +7%
Total .................................................................................... 74,003 76,198 78,159 +1,961 +3%
By Civilian Theme:Basic Research ................................................................... 13,927 14,673 15,811 +1,138 +8%Applied Research ............................................................... 10,348 11,244 11,772 +528 +5%Development ....................................................................... 7,896 8,010 8,229 +219 +3%Equipment .......................................................................... 542 577 693 +116 +20%Facilities ............................................................................. 1,243 1,252 1,318 +66 +5%
Subtotal .............................................................................. 33,956 35,756 37,823 +2,067 +6%
By Defense Theme:Basic Research ................................................................... 1,090 1,100 1,155 +55 +5%Applied Research ............................................................... 4,045 4,309 4,504 +195 +5%Development ....................................................................... 34,456 34,464 34,057 –407 –1%Equipment .......................................................................... 146 144 144 .............. ..............Facilities ............................................................................. 310 425 476 +51 +12%
Subtotal .............................................................................. 40,047 40,442 40,336 –106 –*%
By R&D Share:Defense ............................................................................... 40,047 40,442 40,336 –106 –*%Civilian ............................................................................... 33,956 35,756 37,823 +2,067 +6%
Total .................................................................................... 74,003 76,198 78,159 +1,961 +3%Civilian (percent) ............................................................... 46% 47% 48% NA NA
R&D Support to Universities .......................................... 12,682 13,633 14,471 +838 +6%Merit (Peer) Reviewed R&D Programs ........................ 21,438 22,689 24,324 +1,635 +7%
NA = Not applicable.* Less than 0.5 percent.
Strengthening University-Based Re-search: University-based research—a mixtureof basic and applied science, development,equipment procurement, and facilities invest-ment—is key to America’s future. While foster-
ing innovation and expanding the scientificfrontier, university-based research also trainsthe next generation of scientists and engineers.The budget proposes $14.5 billion, an increaseof $838 million over 1998.
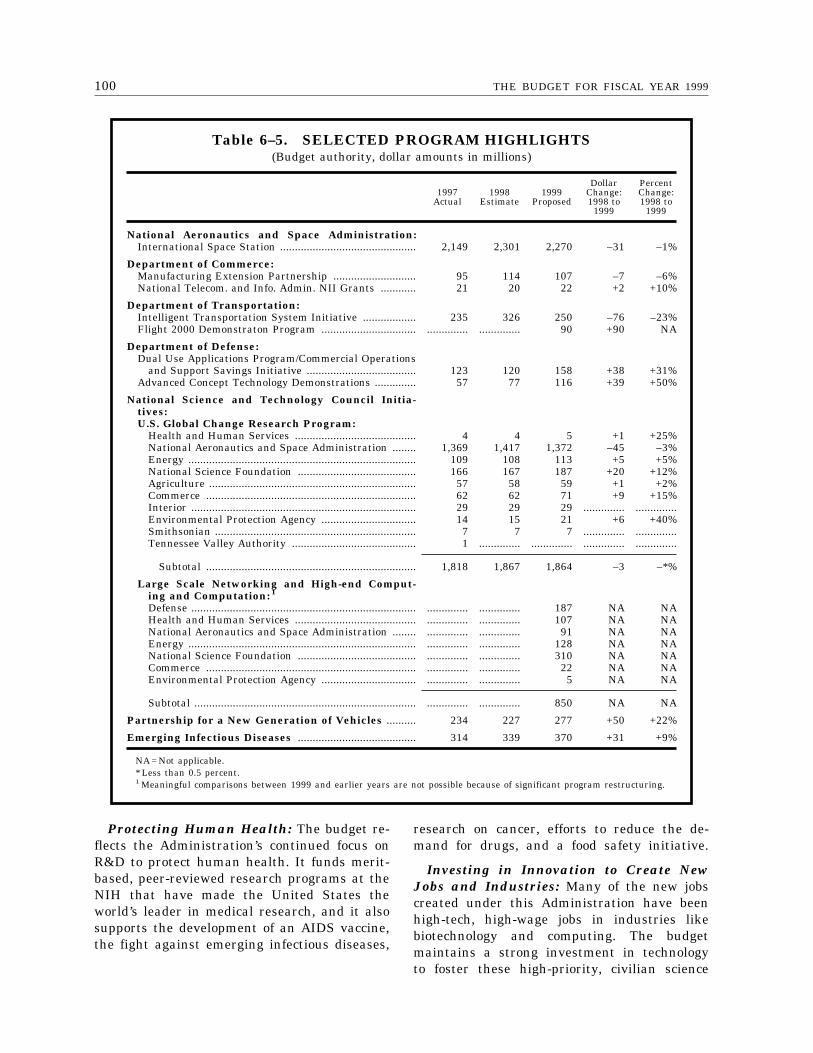
100 THE BUDGET FOR FISCAL YEAR 1999
Table 6–5. SELECTED PROGRAM HIGHLIGHTS(Budget authority, dollar amounts in millions)
1997Actual
1998Estimate
1999Proposed
DollarChange:1998 to
1999
PercentChange:1998 to
1999
National Aeronautics and Space Administration:International Space Station .............................................. 2,149 2,301 2,270 –31 –1%
Department of Commerce:Manufacturing Extension Partnership ............................ 95 114 107 –7 –6%National Telecom. and Info. Admin. NII Grants ............ 21 20 22 +2 +10%
Department of Transportation:Intelligent Transportation System Initiative .................. 235 326 250 –76 –23%Flight 2000 Demonstraton Program ................................ .............. .............. 90 +90 NA
Department of Defense:Dual Use Applications Program/Commercial Operations
and Support Savings Initiative ..................................... 123 120 158 +38 +31%Advanced Concept Technology Demonstrations .............. 57 77 116 +39 +50%
National Science and Technology Council Initia-tives:U.S. Global Change Research Program:
Health and Human Services ......................................... 4 4 5 +1 +25%National Aeronautics and Space Administration ........ 1,369 1,417 1,372 –45 –3%Energy ............................................................................. 109 108 113 +5 +5%National Science Foundation ........................................ 166 167 187 +20 +12%Agriculture ...................................................................... 57 58 59 +1 +2%Commerce ....................................................................... 62 62 71 +9 +15%Interior ............................................................................ 29 29 29 .............. ..............Environmental Protection Agency ................................ 14 15 21 +6 +40%Smithsonian .................................................................... 7 7 7 .............. ..............Tennessee Valley Authority .......................................... 1 .............. .............. .............. ..............
Subtotal ....................................................................... 1,818 1,867 1,864 –3 –*%
Large Scale Networking and High-end Comput-ing and Computation: 1
Defense ............................................................................ .............. .............. 187 NA NAHealth and Human Services ......................................... .............. .............. 107 NA NANational Aeronautics and Space Administration ........ .............. .............. 91 NA NAEnergy ............................................................................. .............. .............. 128 NA NANational Science Foundation ........................................ .............. .............. 310 NA NACommerce ....................................................................... .............. .............. 22 NA NAEnvironmental Protection Agency ................................ .............. .............. 5 NA NA
Subtotal ........................................................................... .............. .............. 850 NA NA
Partnership for a New Generation of Vehicles .......... 234 227 277 +50 +22%
Emerging Infectious Diseases ........................................ 314 339 370 +31 +9%
NA = Not applicable.* Less than 0.5 percent.1 Meaningful comparisons between 1999 and earlier years are not possible because of significant program restructuring.
Protecting Human Health: The budget re-flects the Administration’s continued focus onR&D to protect human health. It funds merit-based, peer-reviewed research programs at theNIH that have made the United States theworld’s leader in medical research, and it alsosupports the development of an AIDS vaccine,the fight against emerging infectious diseases,
research on cancer, efforts to reduce the de-mand for drugs, and a food safety initiative.
Investing in Innovation to Create NewJobs and Industries: Many of the new jobscreated under this Administration have beenhigh-tech, high-wage jobs in industries likebiotechnology and computing. The budgetmaintains a strong investment in technologyto foster these high-priority, civilian science
1016. PROMOTING RESEARCH
and technology industries and jobs. Along withfunding the ATP program as part of the Re-search Fund for America, the budget continuesfunding for Manufacturing Extension Partner-ships to help small businesses become morecompetitive by adopting modern technologiesand production techniques, and for high per-formance computing research.
Investing in Environmental Research:Environmental research is critical for develop-ing the scientific understanding and techno-logical tools to allow the Nation to enhanceenvironmental quality for current and futuregenerations. The budget supports vital re-search on safe and clean food, air, and water,and on ecosystem management, biological di-versity, and ozone depletion. The budget in-creases support for energy efficiency and re-newable energy programs, and for programsto help us understand, prepare for, and miti-gate the effects of changing climate conditionsand natural disasters. These investments pro-vide a scientific basis for developing cost-effec-tive environmental policies, create the knowl-edge base for citizens to make wise environ-mental decisions, and enable new and betterapproaches to environmental protection.
Investing in a 21st-Century Education:Information technology has revolutionizedAmerica’s businesses, but has not yet had asprofound an effect in America’s classrooms.Through the President’s Education TechnologyInitiative, the Federal Government is helpingto ensure that America’s classrooms areequipped with modern computers and con-nected to the Internet, that educational soft-ware becomes an integral part of the curricu-lum, and that teachers will be ready to useand teach with technology. Federal science andtechnology investments contribute to thesegoals; they include the Education Research Ini-tiative—a joint Education Department andNSF partnership (described earlier in thischapter)—and NSF’s activities in Knowledgeand Distributed Intelligence. (For more discus-sion of education technology, see Chapter 1,‘‘Investing in Education and Training.’’)
Investing in Research to Keep Our Na-tion Secure: The budget furthers the Admin-istration’s investments in defense research toensure that our military maintains its techno-logical superiority. The budget also supports
programs to keep nuclear weapons out of thehands of terrorists, use science-based tech-niques to ensure the safety and reliability ofour nuclear weapons stockpiles, support re-search in critical infrastructure protection, andpromote global stability by bolstering stronginternational science and technology partner-ships. The budget also supports the Dual UseApplications Program (DUAP), which putscommercial industry’s technical know-how andeconomies of scale at the service of nationaldefense.
Other Program Highlights
The Administration continues to supporta wide variety of science and technologyprograms at individual agencies.
NASA International Space Station: Withthe first launch to assemble this unique orbitallaboratory only a few months away, the budgetincludes $2.3 billion to keep subsequent assem-bly missions on schedule. It also includes fundsin later years to minimize the risk and costof the project. NASA is developing the SpaceStation with the European Space Agency,Japan, Canada, and Russia.
Department of Commerce:
Manufacturing Extension Partnership: Thebudget proposes $107 million for this Nation-wide network of 75 centers and 300 fieldoffices that offer technical assistance andinformation about the newest business prac-tices to help the Nation’s 382,000 smallermanufacturers compete more effectively, lead-ing to stronger economic growth and jobcreation.
National Telecommunications and Informa-tion Administration’s National Information In-frastructure Grants Program: The budget pro-poses $22 million for grants to fund innovativeprojects that demonstrate how informationtechnology can improve the delivery of edu-cational, health, and other social services.These grants are highly competitive andhave stimulated several hundred million dol-lars in non-Federal matching funds.
Department of Transportation:
Intelligent Transportation System (ITS) Ini-tiative: The budget proposes $250 millionfor the ITS initiative—a package of tech-
102 THE BUDGET FOR FISCAL YEAR 1999
nologies to enhance the safety and efficiencyof our surface transportation infrastructure.The budget includes $100 million for theDeployment Incentives program, which willbegin the Nation-wide deployment of ‘‘intel-ligent infrastructure,’’ such as interactive traf-fic signals and traveler information systems.
Flight 2000 Demonstration Program: Re-sponding to recommendations of the WhiteHouse Commission on Aviation Safety andSecurity, the budget proposes $90 millionfor the Flight 2000 Demonstration Program,which will test and validate equipment andoperating procedures over Alaska and Hawaii.The program will lead to a revolution inair traffic control known as ‘‘free-flight,’’ whichpromises significant savings and will allowtravelers to reach their destinations moresafely, quickly, and efficiently.
Department of Defense (DOD):
DUAP and Commercial Operations and Sup-port Savings Initiative (COSSI): The budgetproposes $158 million to develop dual-usetechnologies and adapt cost-saving commercialtechnology for military uses, enabling DODto use commercial technologies, products, andservices more widely. The military serviceswould fund most of DUAP and COSSI directly,reflecting Administration efforts to increasethe services’ direct involvement in all phasesof the programs.
Advanced Concept Technology Demonstra-tions (ACTDs): The budget proposes $116million for demonstrations to quickly harnesstechnology and innovation for military use,at less cost. ACTDs bring technology expertsand military operators together early in sys-tem development to eliminate communicationbarriers, improve the management of develop-ment programs, and address key warfighterchallenges. ACTDs focus on three key objec-tives: to evaluate the military utility ofnew technology applications before committingto buy them; to develop corresponding battle-field operation concepts and doctrine in orderto use new capabilities as wisely as possible;and to provide new capabilities to combatforces. Forty ACTDs are now under way,while six have been completed.
National Science and Technology CouncilInteragency Initiatives
Science and technology is a primary focusof many Federal agencies. The NationalScience and Technology Council provides themanagement oversight that will ensure effi-cient and effective inter-agency coordinationfor key science and technology initiativesthat involve multiple agencies, such as:
U.S. Global Change Research Program(USGCRP): The budget proposes $1.9 billionto increase understanding of climate changeand variability, atmospheric chemistry, andecosystems. USGCRP results help develop cli-mate change policies. The 1997 launch of theTropical Rainfall Measurement Mission sat-ellite will provide previously unavailable, de-tailed, and accurate rainfall measurements,filling a significant gap in our understandingof the Earth system. In 1998 and 1999,USGCRP will launch more satellites, and willfocus on investigating regional climatechanges.
Large Scale Networking and High-endComputing and Computation: The budgetprovides $850 million for this R&D effort,originally called High Performance Computingand Communications, which the Administra-tion has restructured to focus on clearer goals,milestones, and performance measures. Aspart of this effort, the budget provides $110million for the Next Generation Internet Ini-tiative, which will create a research networkthat is 100 to 1,000 times faster than today’sInternet, and invests in R&D for smarter, fast-er networks that support new applications,such as telemedicine, distance learning, andreal-time collaboration.
Partnership for a New Generation of Ve-hicles: The budget proposes $277 million, a22-percent increase over 1998, for this cost-shared, industry partnership, which centers onthree research goals: to develop advanced man-ufacturing techniques; to use new technologiesfor near-term emissions improvements; and todevelop production prototype vehicles threetimes more fuel-efficient than today’s cars,with no sacrifice in comfort, performance, orprice. Federal funding focuses mainly on thethird goal. The program will lead to ‘‘conceptcars’’ in the year 2000 and production proto-types in 2004.

1036. PROMOTING RESEARCH
Emerging Infectious Diseases: The budgetproposes $370 million, nine percent over the1998 level, for research on new tools to detect
and control emerging infectious diseases andon the biology and pathology of infectiousagents.

105
7. ENFORCING THE LAW
We said that we had to keep being tough on criminals, but we had to do some intelligentthings. We said that we had to punish people more, but we have to give children something to sayyes to, and we’ve had five years of declining crime rates and last year the biggest drop in violentcrime in 35 years.
President ClintonJuly 1997
Over the past five years, the Administrationhas made significant progress in cutting crimeacross the Nation. The strategy has beensimple: put more community police officerson the streets to involve citizens in partner-ships with the law enforcement authorities;impose punishments that fit the crime forpeople who break the law; and develop preven-tion programs to give children alternativesto crime and drugs and a chance for apositive future. The results have been extraor-dinary—five years of falling crime rates and,in 1996, the biggest drop in violent crimein 35 years.
Although crime remains mainly a Stateand local responsibility, the last five yearsshow that the Federal Government can playan important role in reducing crime. Thebudget continues the Administration’s aggres-sive anti-crime efforts, with a particular em-phasis on reducing juvenile crime and violence.It builds on the success of community-basedefforts such as the Community Oriented Polic-ing Services (COPS) program, which willput 100,000 more police officers on the streetby the year 2000, with a new CommunityProsecutors Initiative to help prosecutors reori-ent their emphasis from simply processingcases to addressing quality-of-life issues andpreventing crimes from occurring in the firstplace. The budget also proposes funds toprevent violence against women, help Statesand Indian Tribes build prisons, and addressthe growing law enforcement crisis on Indianlands.
The budget strengthens the Administration’saggressive efforts to control illegal immigrationby targeting resources to stop those whowant to enter the United States illegally,detain and quickly remove those who slipby, and make it harder for illegal immigrantsto get jobs. It proposes to strengthen borderenforcement in the South and West, increaseefforts to identify and remove incarceratedillegal aliens, and expand efforts to verifythe employment eligibility of newly hirednon-citizens.
The budget also continues the Administra-tion’s commitment to combat drug use, particu-larly among young people. It devotes resourcesto youth prevention programs in order tochange permissive attitudes toward drugsand reverse the trend of increased druguse by youth. The budget proposes to expandprograms that stress treatment and preven-tion, domestic law enforcement, internationalassistance, and interdiction. It continues tobuild on the innovative Drug Courts initiative,provides $50 million for a new School DrugPrevention Coordinators initiative, and pro-poses $85 million for drug testing and treat-ment of those in the criminal justice system.It also provides increased funds for targetedinterdiction efforts that enhance port andborder security and disrupt drug traffickingoverseas. The budget increases spending fordrug control efforts by about $1.1 billion,to $17.1 billion.
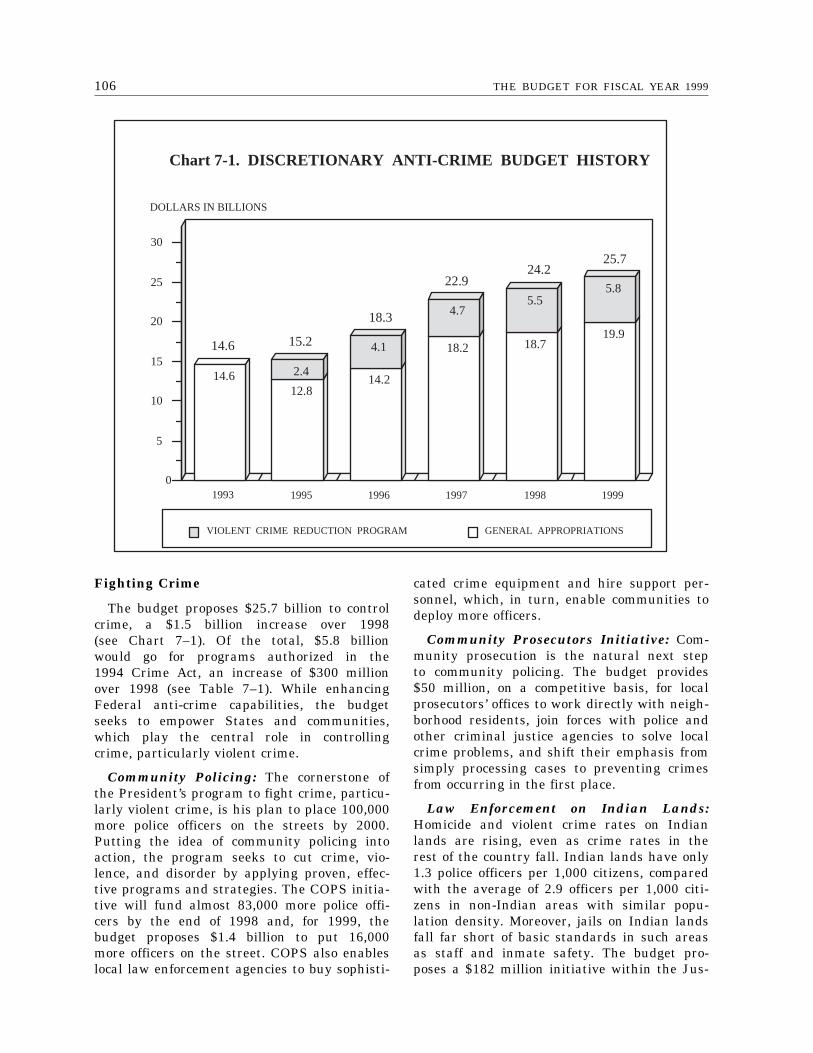
106 THE BUDGET FOR FISCAL YEAR 1999
14.612.8
2.414.2
4.1 18.2
4.7
18.7
5.5
19.9
5.8
1993 1995 1996 1997 1998 19990
5
10
15
20
25
30
GENERAL APPROPRIATIONSVIOLENT CRIME REDUCTION PROGRAM
Chart 7-1. DISCRETIONARY ANTI-CRIME BUDGET HISTORY
DOLLARS IN BILLIONS
14.6 15.2
18.3
22.924.2
25.7
Fighting Crime
The budget proposes $25.7 billion to controlcrime, a $1.5 billion increase over 1998(see Chart 7–1). Of the total, $5.8 billionwould go for programs authorized in the1994 Crime Act, an increase of $300 millionover 1998 (see Table 7–1). While enhancingFederal anti-crime capabilities, the budgetseeks to empower States and communities,which play the central role in controllingcrime, particularly violent crime.
Community Policing: The cornerstone ofthe President’s program to fight crime, particu-larly violent crime, is his plan to place 100,000more police officers on the streets by 2000.Putting the idea of community policing intoaction, the program seeks to cut crime, vio-lence, and disorder by applying proven, effec-tive programs and strategies. The COPS initia-tive will fund almost 83,000 more police offi-cers by the end of 1998 and, for 1999, thebudget proposes $1.4 billion to put 16,000more officers on the street. COPS also enableslocal law enforcement agencies to buy sophisti-
cated crime equipment and hire support per-sonnel, which, in turn, enable communities todeploy more officers.
Community Prosecutors Initiative: Com-munity prosecution is the natural next stepto community policing. The budget provides$50 million, on a competitive basis, for localprosecutors’ offices to work directly with neigh-borhood residents, join forces with police andother criminal justice agencies to solve localcrime problems, and shift their emphasis fromsimply processing cases to preventing crimesfrom occurring in the first place.
Law Enforcement on Indian Lands:Homicide and violent crime rates on Indianlands are rising, even as crime rates in therest of the country fall. Indian lands have only1.3 police officers per 1,000 citizens, comparedwith the average of 2.9 officers per 1,000 citi-zens in non-Indian areas with similar popu-lation density. Moreover, jails on Indian landsfall far short of basic standards in such areasas staff and inmate safety. The budget pro-poses a $182 million initiative within the Jus-
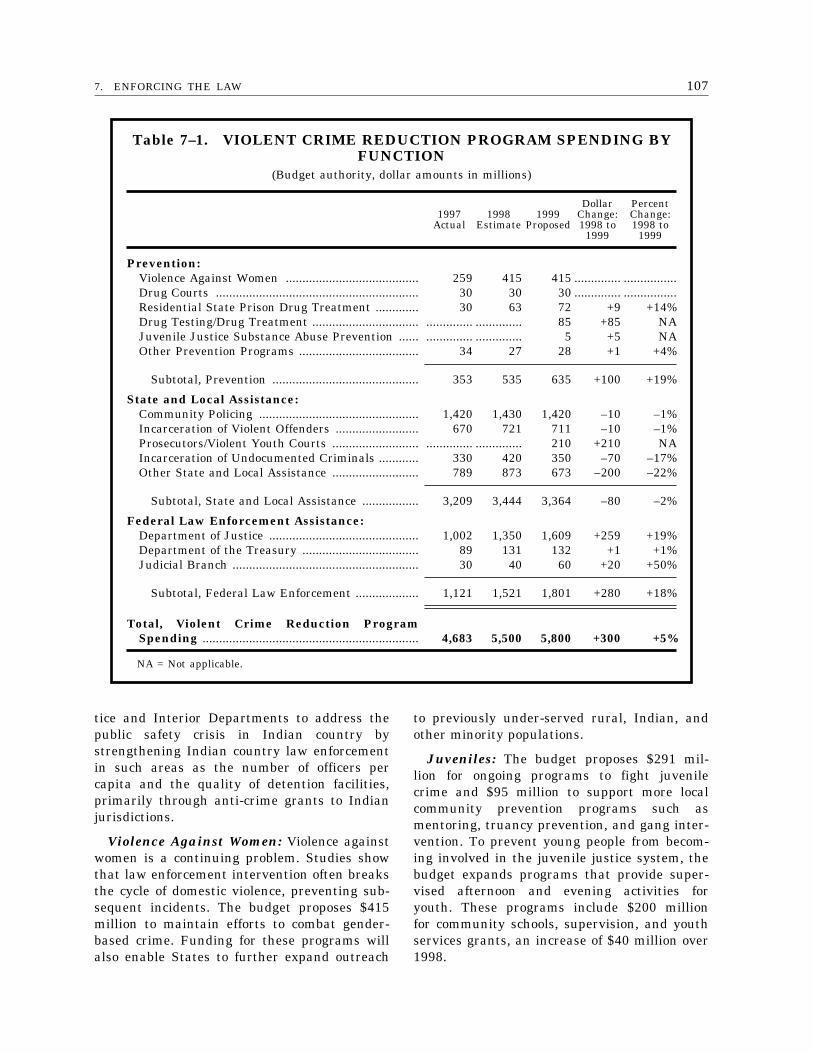
1077. ENFORCING THE LAW
Table 7–1. VIOLENT CRIME REDUCTION PROGRAM SPENDING BYFUNCTION
(Budget authority, dollar amounts in millions)
1997Actual
1998Estimate
1999Proposed
DollarChange:1998 to
1999
PercentChange:1998 to
1999
Prevention:Violence Against Women ........................................ 259 415 415 .............. ................Drug Courts ............................................................. 30 30 30 .............. ................Residential State Prison Drug Treatment ............. 30 63 72 +9 +14%Drug Testing/Drug Treatment ................................ .............. .............. 85 +85 NAJuvenile Justice Substance Abuse Prevention ...... .............. .............. 5 +5 NAOther Prevention Programs .................................... 34 27 28 +1 +4%
Subtotal, Prevention ............................................ 353 535 635 +100 +19%
State and Local Assistance:Community Policing ................................................ 1,420 1,430 1,420 –10 –1%Incarceration of Violent Offenders ......................... 670 721 711 –10 –1%Prosecutors/Violent Youth Courts .......................... .............. .............. 210 +210 NAIncarceration of Undocumented Criminals ............ 330 420 350 –70 –17%Other State and Local Assistance .......................... 789 873 673 –200 –22%
Subtotal, State and Local Assistance ................. 3,209 3,444 3,364 –80 –2%
Federal Law Enforcement Assistance:Department of Justice ............................................. 1,002 1,350 1,609 +259 +19%Department of the Treasury ................................... 89 131 132 +1 +1%Judicial Branch ........................................................ 30 40 60 +20 +50%
Subtotal, Federal Law Enforcement ................... 1,121 1,521 1,801 +280 +18%
Total, Violent Crime Reduction ProgramSpending ................................................................. 4,683 5,500 5,800 +300 +5%
NA = Not applicable.
tice and Interior Departments to address thepublic safety crisis in Indian country bystrengthening Indian country law enforcementin such areas as the number of officers percapita and the quality of detention facilities,primarily through anti-crime grants to Indianjurisdictions.
Violence Against Women: Violence againstwomen is a continuing problem. Studies showthat law enforcement intervention often breaksthe cycle of domestic violence, preventing sub-sequent incidents. The budget proposes $415million to maintain efforts to combat gender-based crime. Funding for these programs willalso enable States to further expand outreach
to previously under-served rural, Indian, andother minority populations.
Juveniles: The budget proposes $291 mil-lion for ongoing programs to fight juvenilecrime and $95 million to support more localcommunity prevention programs such asmentoring, truancy prevention, and gang inter-vention. To prevent young people from becom-ing involved in the juvenile justice system, thebudget expands programs that provide super-vised afternoon and evening activities foryouth. These programs include $200 millionfor community schools, supervision, and youthservices grants, an increase of $40 million over1998.
108 THE BUDGET FOR FISCAL YEAR 1999
Gangs: The President has worked hard tocrack down on violent youth gangs and to keepguns out of the hands of criminals and awayfrom children. He launched a tough Anti-Gangand Youth Violence Strategy to help commu-nities hire more prosecutors and probation offi-cers, and to keep schools open later whenyouth crime rates peak. The budget provides$100 million for prosecutorial initiatives to tar-get gangs and $50 million for court-related ac-tivities such as more probation and parole offi-cers and special court programs to expediteyouth violence and gun cases.
• Youth Crime Gun Interdiction Initiative:The budget provides $28 million to crackdown on illegal gun traffickers in 27 cities.Of the $28 million, $12 million would goto trace firearms used by youth in crimesand give law enforcement the crucial in-vestigative leads about the sources ofthese firearms, and $16 million would goto hire over 160 new agents of the Treas-ury Department’s Bureau of Alcohol, To-bacco, and Firearms to help follow up onthese leads.
• Safe Streets Task Forces: The budget pro-poses $105 million to continue the SafeStreets program, which blends the effortsof the FBI and other Federal law enforce-ment agencies with those of State andlocal police departments to investigatestreet crime and violence.
Crime in Public Housing: The budget alsotargets violence in public housing, proposing$310 million to support anti-drug and anti-crime activities, including Operation SafeHome and the One Strike, You’re Out pro-gram.
• Operation Safe Home: The Department ofHousing and Urban Development’s Officesof Public and Indian Housing and Inspec-tor General jointly administer OperationSafe Home, which brings together resi-dents, managers, and various Federal andlocal law enforcement agencies to rid pub-lic housing communities of crime.
• One Strike, You’re Out: The President be-lieves that public housing is a privilege,not a right, and residents who commitcrime and peddle drugs should be evictedimmediately.
Fraud in Agriculture (USDA) Programs:USDA estimates that over $50 million a yearin Food Stamps go illegally to convicted felonsand prison inmates, and that a sizable numberof retailers who accept Food Stamps makemoney off of them illegally. The budget in-cludes $23 million to crack down on fraud andabuse in Food Stamps and other USDA pro-grams, such as child nutrition, rural rentalhousing, and emergency and disaster assist-ance payments.
Violent Offenders: The Administrationseeks to ensure that convicted violent offendersserve at least 85 percent of their sentencesbehind bars. The budget proposes $711 millionin State and Tribal grants to build new prisonsand jail cells under the Violent Offender Incar-ceration and Truth in Sentencing (VOI/TIS)Program; the 1999 funding level financesabout 9,500 new prison beds. The VOI/TIS pro-posal also would provide $150 million to reim-burse States for the costs of incarceratingcriminal aliens and $25 million to improveState and local correctional facilities that holdFederal prisoners and detained illegal aliens.
Terrorism: While acts of domestic terrorismhave been isolated events, such as the Okla-homa City and World Trade Center bombings,the Administration has sought more Federalresources to ensure the safety and security ofthe public and the Government from these vio-lent and devastating criminal acts. The budgetbuilds on the President’s 1997 Antiterrorism/Counterterrorism/Security initiative by provid-ing $6.7 billion to combat terrorism, of which$4.3 billion would support the Defense Depart-ment’s (DOD) terrorism-related and force pro-tection efforts. While much of the proposedfunding continues current terrorism-relatedprograms in physical protection and law en-forcement activities, the budget also funds ini-tiatives in the following high-priority areas:
• Weapons of Mass Destruction Terrorism:The budget proposes $16 million for theJustice Department to improve State andlocal response capabilities to weapons ofmass destruction, and increases of $49million for DOD domestic preparednessand response capabilities; $7 million forthe Energy Department’s emergency re-sponse capabilities for nuclear terroristevents; and $2 million for the Department
1097. ENFORCING THE LAW
of Health and Human Services’ Metropoli-tan Medical Strike Teams, which handlethe medical response to an incident involv-ing weapons of mass destruction.
• Cyber Crime/Critical Infrastructure: Toimprove the Government’s ability to detectand counter cyber crime and other threatsto the Nation’s critical infrastructure, thebudget proposes $27 million to enhancethe investigative and prosecutorial effortsof the FBI, the U.S. Attorneys, and theJustice Department’s Criminal Division,and $37 million to enable the Justice De-partment’s Counterterrorism Fund to sup-port critical infrastructure protection ef-forts. The budget also supports DOD’s andother agencies’ critical infrastructure-related research and development pro-grams.
• Aviation Security: The budget provides anincrease of over $110 million to the Fed-eral Aviation Administration for explosivesdetection security equipment and cargoscreening research and development—sup-porting recommendations of the WhiteHouse Commission on Aviation Securityand Safety.
Technology Improvements: Technology im-provements give law enforcement agencies thetools to fight crime. The Communications As-sistance for Law Enforcement Act ensures thatlaw enforcement agencies can conduct court-authorized wiretaps as the Nation convertsfrom analog to digital communications tech-nology. With $114 million available in 1998to help develop the technology changes to pro-vide this capability, the budget proposes $100million in 1999 to continue the effort. Thebudget also proposes $100 million to enablethe Treasury and Justice Departments to up-grade their wireless communications systems’efficiency, security, and compatibility with theradio systems of State and local public safetyagencies.
Meeting the Challenges of Immigration
The Administration has sought to controlour Nation’s borders and stop illegal entry.Working through the Immigration and Natu-ralization Service (INS), it has reversed dec-ades of neglect with an aggressive bordercontrol strategy. Since 1993, the Administra-
tion has added over 3,800 new Border Patrolagents—almost doubling the agent workforce—and introduced innovative border deterrentsand advanced technology to stop illegal entryalong the Nation’s Southwest border.
As a Nation of immigrants, the UnitedStates will continue to welcome those whoseek legal entry and refugees who seekprotection. In 1997, the Nation welcomednearly one million new naturalized U.S. citi-zens. INS is redesigning the naturalizationprocess to meet the challenges of processingover a million new applications for citizenshipa year in a way that ensures uncompromisingintegrity.
Since 1993, working with Congress, theAdministration has increased INS fundingby 148 percent. The budget, which proposes$4.2 billion for INS, 10 percent more thanin 1998, continues to support efforts to ad-vance border control, improve illegal aliendetention and removal capabilities, andachieve efficient processing of those seekingcitizenship (see Table 7–2).
Border Control and Enforcement: By theend of 1998, Border Patrol agents will numberover 7,800, a 98-percent increase over the3,965 who patrolled the Nation’s 5,000 milesof border in 1993. With more agents neededto fill enforcement gaps and enhance BorderPatrol presence along the Southwest border—especially in border States like Texas, NewMexico, and Arizona—the budget proposes toadd 1,000 new Border Patrol agents (see Chart7–2).
The budget maintains the Administration’scommitment to ‘‘force-multiplying’’ technolo-gies, including ground sensors, high-resolutioncolor and infrared cameras, and state-of-the-art command centers, which will increasethe effectiveness of these agents and enableINS to better control the border. Agentswill be able to shift their focus from observingthe border to responding to known borderincursions and raiding smuggler operationsand holding areas. Multi-year funding forthese force-multiplying technologies will havethe equivalent effect of adding over 1,300agents to the Southwest border.
The budget provides funds to expand borderfencing and barriers, install permanent light-
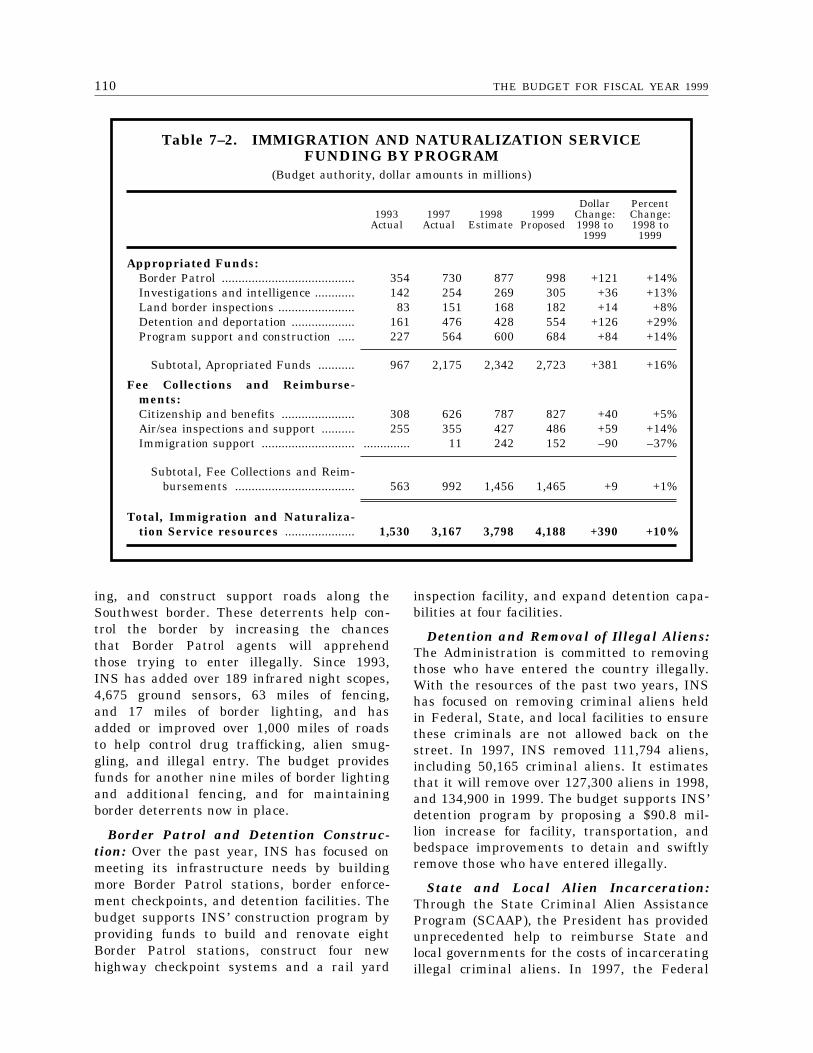
110 THE BUDGET FOR FISCAL YEAR 1999
Table 7–2. IMMIGRATION AND NATURALIZATION SERVICEFUNDING BY PROGRAM
(Budget authority, dollar amounts in millions)
1993Actual
1997Actual
1998Estimate
1999Proposed
DollarChange:1998 to
1999
PercentChange:1998 to
1999
Appropriated Funds:Border Patrol ........................................ 354 730 877 998 +121 +14%Investigations and intelligence ............ 142 254 269 305 +36 +13%Land border inspections ....................... 83 151 168 182 +14 +8%Detention and deportation ................... 161 476 428 554 +126 +29%Program support and construction ..... 227 564 600 684 +84 +14%
Subtotal, Apropriated Funds ........... 967 2,175 2,342 2,723 +381 +16%
Fee Collections and Reimburse-ments:Citizenship and benefits ...................... 308 626 787 827 +40 +5%Air/sea inspections and support .......... 255 355 427 486 +59 +14%Immigration support ............................ .............. 11 242 152 –90 –37%
Subtotal, Fee Collections and Reim-bursements .................................... 563 992 1,456 1,465 +9 +1%
Total, Immigration and Naturaliza-tion Service resources ..................... 1,530 3,167 3,798 4,188 +390 +10%
ing, and construct support roads along theSouthwest border. These deterrents help con-trol the border by increasing the chancesthat Border Patrol agents will apprehendthose trying to enter illegally. Since 1993,INS has added over 189 infrared night scopes,4,675 ground sensors, 63 miles of fencing,and 17 miles of border lighting, and hasadded or improved over 1,000 miles of roadsto help control drug trafficking, alien smug-gling, and illegal entry. The budget providesfunds for another nine miles of border lightingand additional fencing, and for maintainingborder deterrents now in place.
Border Patrol and Detention Construc-tion: Over the past year, INS has focused onmeeting its infrastructure needs by buildingmore Border Patrol stations, border enforce-ment checkpoints, and detention facilities. Thebudget supports INS’ construction program byproviding funds to build and renovate eightBorder Patrol stations, construct four newhighway checkpoint systems and a rail yard
inspection facility, and expand detention capa-bilities at four facilities.
Detention and Removal of Illegal Aliens:The Administration is committed to removingthose who have entered the country illegally.With the resources of the past two years, INShas focused on removing criminal aliens heldin Federal, State, and local facilities to ensurethese criminals are not allowed back on thestreet. In 1997, INS removed 111,794 aliens,including 50,165 criminal aliens. It estimatesthat it will remove over 127,300 aliens in 1998,and 134,900 in 1999. The budget supports INS’detention program by proposing a $90.8 mil-lion increase for facility, transportation, andbedspace improvements to detain and swiftlyremove those who have entered illegally.
State and Local Alien Incarceration:Through the State Criminal Alien AssistanceProgram (SCAAP), the President has providedunprecedented help to reimburse State andlocal governments for the costs of incarceratingillegal criminal aliens. In 1997, the Federal
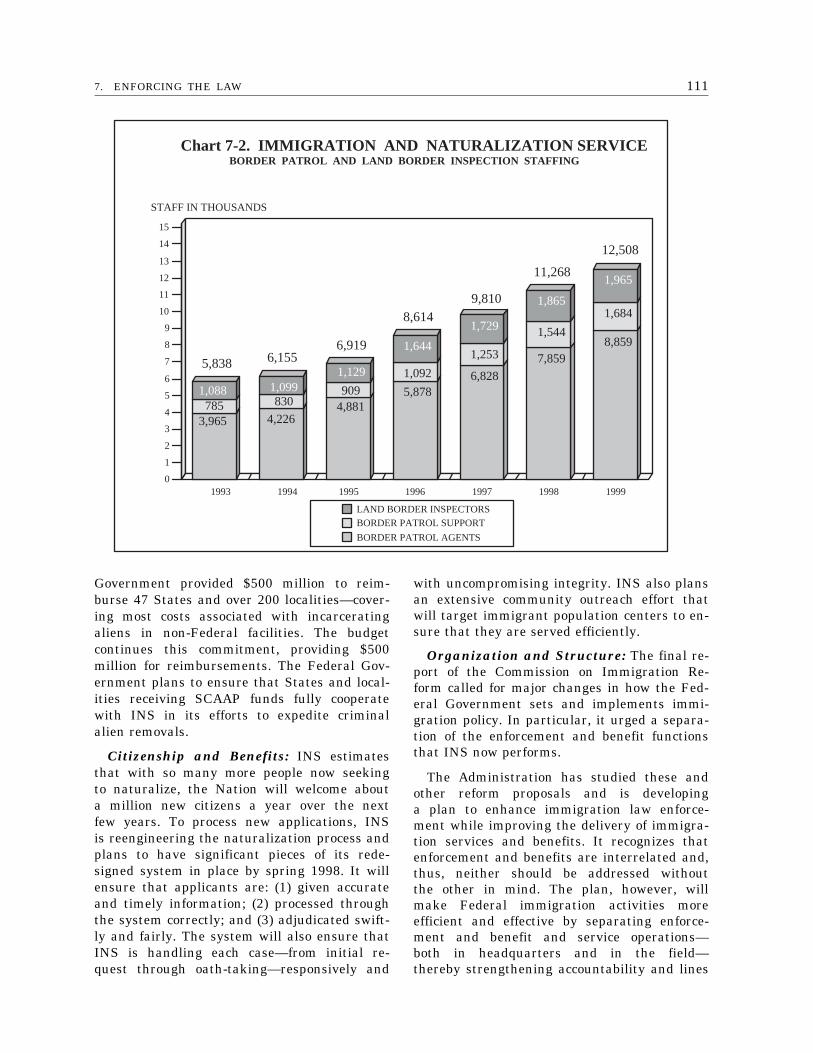
1117. ENFORCING THE LAW
3,965785
1,088
4,226
8301,099
4,881909
1,129
5,878
1,092
1,644
6,828
1,253
1,729
7,859
1,544
1,865
8,859
1,684
1,965
1993 1994 1995 1996 1997 1998 19990
1
2
3
4
5
6
7
8
9
10
11
12
13
14
15
LAND BORDER INSPECTORSBORDER PATROL SUPPORT
BORDER PATROL AGENTS
Chart 7-2. IMMIGRATION AND NATURALIZATION SERVICEBORDER PATROL AND LAND BORDER INSPECTION STAFFING
STAFF IN THOUSANDS
5,838 6,1556,919
8,6149,810
11,268
12,508
Government provided $500 million to reim-burse 47 States and over 200 localities—cover-ing most costs associated with incarceratingaliens in non-Federal facilities. The budgetcontinues this commitment, providing $500million for reimbursements. The Federal Gov-ernment plans to ensure that States and local-ities receiving SCAAP funds fully cooperatewith INS in its efforts to expedite criminalalien removals.
Citizenship and Benefits: INS estimatesthat with so many more people now seekingto naturalize, the Nation will welcome abouta million new citizens a year over the nextfew years. To process new applications, INSis reengineering the naturalization process andplans to have significant pieces of its rede-signed system in place by spring 1998. It willensure that applicants are: (1) given accurateand timely information; (2) processed throughthe system correctly; and (3) adjudicated swift-ly and fairly. The system will also ensure thatINS is handling each case—from initial re-quest through oath-taking—responsively and
with uncompromising integrity. INS also plansan extensive community outreach effort thatwill target immigrant population centers to en-sure that they are served efficiently.
Organization and Structure: The final re-port of the Commission on Immigration Re-form called for major changes in how the Fed-eral Government sets and implements immi-gration policy. In particular, it urged a separa-tion of the enforcement and benefit functionsthat INS now performs.
The Administration has studied these andother reform proposals and is developinga plan to enhance immigration law enforce-ment while improving the delivery of immigra-tion services and benefits. It recognizes thatenforcement and benefits are interrelated and,thus, neither should be addressed withoutthe other in mind. The plan, however, willmake Federal immigration activities moreefficient and effective by separating enforce-ment and benefit and service operations—both in headquarters and in the field—thereby strengthening accountability and lines
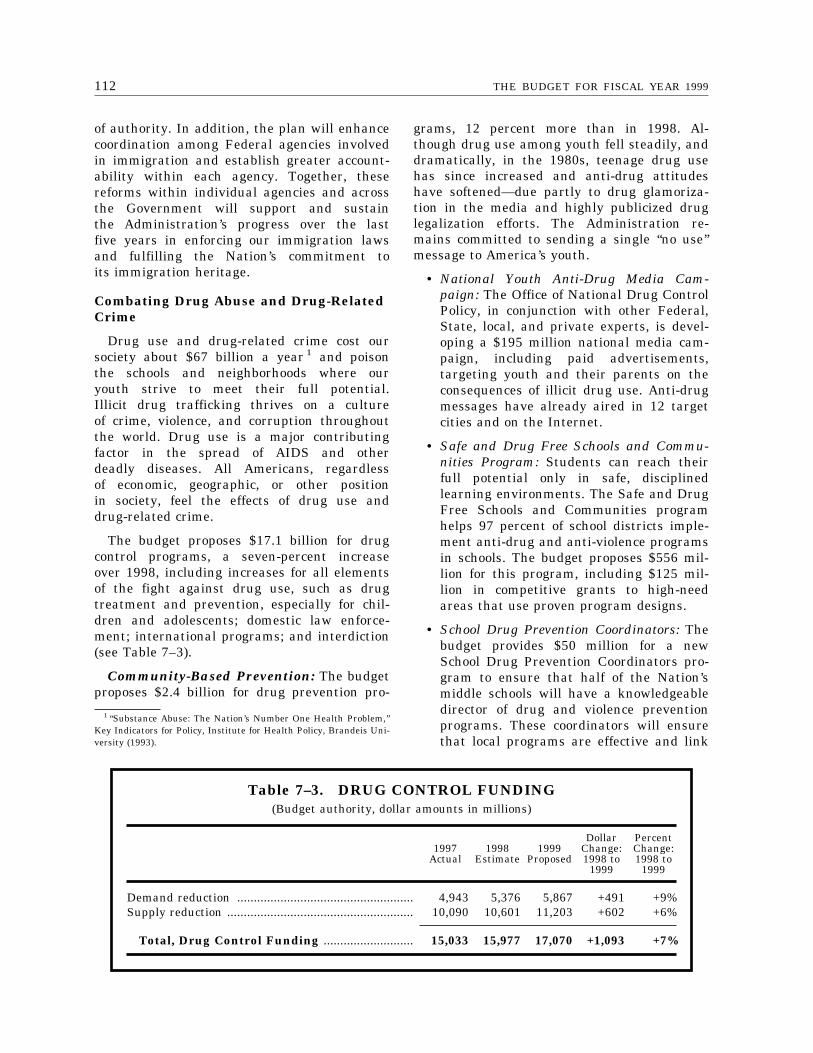
112 THE BUDGET FOR FISCAL YEAR 1999
Table 7–3. DRUG CONTROL FUNDING(Budget authority, dollar amounts in millions)
1997Actual
1998Estimate
1999Proposed
DollarChange:1998 to
1999
PercentChange:1998 to
1999
Demand reduction ..................................................... 4,943 5,376 5,867 +491 +9%Supply reduction ........................................................ 10,090 10,601 11,203 +602 +6%
Total, Drug Control Funding ........................... 15,033 15,977 17,070 +1,093 +7%
1 ‘‘Substance Abuse: The Nation’s Number One Health Problem,’’Key Indicators for Policy, Institute for Health Policy, Brandeis Uni-versity (1993).
of authority. In addition, the plan will enhancecoordination among Federal agencies involvedin immigration and establish greater account-ability within each agency. Together, thesereforms within individual agencies and acrossthe Government will support and sustainthe Administration’s progress over the lastfive years in enforcing our immigration lawsand fulfilling the Nation’s commitment toits immigration heritage.
Combating Drug Abuse and Drug-RelatedCrime
Drug use and drug-related crime cost oursociety about $67 billion a year 1 and poisonthe schools and neighborhoods where ouryouth strive to meet their full potential.Illicit drug trafficking thrives on a cultureof crime, violence, and corruption throughoutthe world. Drug use is a major contributingfactor in the spread of AIDS and otherdeadly diseases. All Americans, regardlessof economic, geographic, or other positionin society, feel the effects of drug use anddrug-related crime.
The budget proposes $17.1 billion for drugcontrol programs, a seven-percent increaseover 1998, including increases for all elementsof the fight against drug use, such as drugtreatment and prevention, especially for chil-dren and adolescents; domestic law enforce-ment; international programs; and interdiction(see Table 7–3).
Community-Based Prevention: The budgetproposes $2.4 billion for drug prevention pro-
grams, 12 percent more than in 1998. Al-though drug use among youth fell steadily, anddramatically, in the 1980s, teenage drug usehas since increased and anti-drug attitudeshave softened—due partly to drug glamoriza-tion in the media and highly publicized druglegalization efforts. The Administration re-mains committed to sending a single ‘‘no use’’message to America’s youth.
• National Youth Anti-Drug Media Cam-paign: The Office of National Drug ControlPolicy, in conjunction with other Federal,State, local, and private experts, is devel-oping a $195 million national media cam-paign, including paid advertisements,targeting youth and their parents on theconsequences of illicit drug use. Anti-drugmessages have already aired in 12 targetcities and on the Internet.
• Safe and Drug Free Schools and Commu-nities Program: Students can reach theirfull potential only in safe, disciplinedlearning environments. The Safe and DrugFree Schools and Communities programhelps 97 percent of school districts imple-ment anti-drug and anti-violence programsin schools. The budget proposes $556 mil-lion for this program, including $125 mil-lion in competitive grants to high-needareas that use proven program designs.
• School Drug Prevention Coordinators: Thebudget provides $50 million for a newSchool Drug Prevention Coordinators pro-gram to ensure that half of the Nation’smiddle schools will have a knowledgeabledirector of drug and violence preventionprograms. These coordinators will ensurethat local programs are effective and link
1137. ENFORCING THE LAW
school-based prevention programs to com-munity-based programs.
• Drug Free Communities Act: The budgetproposes $20 million for activities underthis Act, which helps increase citizen par-ticipation in our efforts to reduce sub-stance abuse among youth and providesfunds to help community anti-drug coali-tions carry out their important missions.
Drug Intervention: The budget proposes$3.4 billion to treat drug abuse, seven percentmore than in 1998. The Administration real-izes that an effective treatment system mustconfront drug abuse where the challenge is thehardest—in the streets of urban, suburban,and rural drug markets, and in the criminaljustice system. Closing the treatment gap be-tween those who could benefit from substanceabuse treatment and the current capacity ofthe public treatment system remains a top pri-ority. These chronic drug users consume a dis-proportionate amount of illicit drugs and inflicta disproportionate share of drug-related costson society.
• Substance Abuse Treatment: The budgetprovides $3.4 billion for substance abusetreatment activity, seven percent morethan in 1998. The increase is based notonly on the need to close the treatmentgap, but on a body of evidence showingthat treatment is the most cost-effectiveway to reduce drug abuse. These effortswill enable hundreds of thousands of preg-nant women, high-risk youth, and otherunder-served Americans to get drug treat-ment services.
• Drug Courts: The budget proposes $30 mil-lion for Drug Courts. In an effort to breakthe cycle of drugs, crime, and violence,these courts present an alternative toincarceration for people who commit non-violent crimes and express a desire toparticipate in, and would benefit from, re-habilitative drug treatment. Drug Courtsencourage serious commitment to thetreatment process through graduatedsanctions such as increased drug-testingand supervision, and, when necessary, in-carceration.
Domestic Drug Law Enforcement: Thebudget proposes $8.8 billion for drug-related
domestic law enforcement, four percent morethan in 1998, to help bolster community-basedlaw enforcement efforts, shield the Southwestborder from illicit drugs, target major domesticorganizations trafficking in heroin, and en-hance coordination among Federal, State, andlocal law enforcement agencies. The budgetproposes an increase of $13 million, or 30 per-cent, for the Drug Enforcement Agency (DEA)to enhance domestic anti-heroin efforts. TheFederal Government will continue its focus onproviding leadership and training; facilitatingmulti-agency cooperative efforts through theHigh Intensity Drug Trafficking Areas pro-gram, the Southwest border initiative, andother efforts; and offering incentives to Statesand localities to use the most effective drugcontrol methods.
• Methamphetamine: Methamphetamine isquickly becoming the growth drug of the1990s. The DEA trains its agents, as wellas State and local law enforcement agen-cies, to seize clandestine methamphet-amine laboratories. The budget proposesto continue the DEA’s anti-methamphet-amine efforts with a $25 million increase,more than doubling the 1998 figure.
International Programs and Interdic-tion: The Administration’s comprehensive ap-proach to combating drug use includes an en-hanced international strategy, making it hard-er for drug-criminals to smuggle illicit drugsinto the United States. The budget includesfunds to upgrade interdiction efforts along theSouthwest border and in the Caribbean, andto provide heightened assistance to foreigngovernments to curtail drug cultivation andproduction.
• Source Nation Efforts: Internationally, theUnited States focuses primarily on inter-diction in source countries and transitzones, disrupting the drug organizationsand their production, marketing, andmoney laundering structures. The budgetproposes to increase funding for counter-narcotics programs in Peru to $50 million,66 percent more than in 1998, to continueillicit coca crop eradication efforts andsupport alternative crop development. Itproposes increased funding for counternar-cotics programs in Colombia to $45million, 50 percent more than in 1998, to
114 THE BUDGET FOR FISCAL YEAR 1999
continue enhanced coca, opium poppy, andmarijuana crop eradication efforts. And itproposes $247 million, 20 percent morethan in 1998, to provide training, logistics,equipment, intelligence, and communica-tions support to source nations, mainlyColumbia, Peru, and Bolivia.
• Southern Tier of the United States: TheAdministration remains committed toshielding the Nation’s Southern tier fromthe drug threat. The budget proposes to
enhance the Customs Service’s border en-forcement efforts at land and sea ports-of-entry by providing $54 million for ad-vanced technology, which includes auto-mated targeting systems and non-intrusiveinspection systems, to improve narcoticsinterdiction. The budget further solidifiesthe interdiction effort by providing $104million for another 1,000 border patrolagents and an increase of $36 million, ornine percent over the 1998 level, for theCoast Guard’s interdiction activities.
115
8. STRENGTHENING THE AMERICANCOMMUNITY
We need to say that in the poorest neighborhoods of this country, people still have a chance tostart a business, free enterprise still has a chance to take hold, people still have a chance to builda framework of community. And if we can’t do that when the economy is strong, when can we dothat? We have to do that.
President ClintonAugust 1997
Most Americans are enjoying the fruitsof our strong economy. Poverty, welfare, andunemployment are down. Incomes and home-ownership are up.
But progress is not uniform. While manyurban and rural areas are doing better,too many others have grown disconnectedfrom opportunity and prosperity, and theirisolation—the poor from the well-off, thejobless from those who work, those fromone race or ethnicity from those of another—threatens to fray the fabric of our culture.
In the early 20th Century, cities fueledAmerica’s economic growth. Still today, theirfuture, and that of rural areas, remainscentral to our future as a Nation and,thus, to the future of all Americans, nomatter where they live or work. We mustconnect residents of distressed neighborhoodsto the jobs and opportunities of the regionalmarketplace, and replace economic distresswith opportunity.
The Administration believes the FederalGovernment can, and should, work withStates, localities, businesses, non-profits,schools, families, and individuals to helpcreate opportunities and offer incentives foraddressing local problems. Across the Nation,the Government is working in partnershipwith other governments and institutions,whether to encourage volunteerism throughthe National Service program or providecommunities with economic and tax incentivesto encourage private investment through theEmpowerment Zones and Enterprise Commu-nities initiative.
In the Nation’s capital, the Administrationis making a special effort to make Washington,D.C. a city of which all Americans canbe proud. Having worked with Congress torestructure the Federal Government’s relation-ship to the District last year, the Administra-tion is focusing on how Federal departmentsand agencies can provide the District withtechnical help in such areas as educationand law enforcement.
National Service
National Service builds strong communities,educates children, develops citizen responsibil-ity, and expands educational opportunity. TheCorporation for National and Community Serv-ice, established in 1993, encourages Americansof all ages and backgrounds to help solvecommunity problems and provides opportuni-ties to engage in community-based service.The budget proposes $781 million for theCorporation, a 14-percent increase over 1998,with the increase targeted to the President’sAmerica Reads initiative—an effort throughwhich volunteer tutors will help childrenread well and independently by the endof the third grade.
AmeriCorps enables young Americans ofall backgrounds to serve in local communitiesthrough programs sponsored by local andnational nonprofits. Participants serve full-or part-time, generally for at least a year.In return, they earn a minimum living allow-ance set at about the poverty level of asingle individual and, when they completetheir service, they earn an education awardto help pay for postsecondary education or
116 THE BUDGET FOR FISCAL YEAR 1999
repay student loans. Over 100,000 individualswill participate through AmeriCorps’s firstfour years, and the budget supports anAmeriCorps program of 56,000 members in1999. The AmeriCorps program includes Vol-unteers in Service to America (VISTA) andthe National Civilian Community Corps(NCCC).
Among other national service programs:
• Service-learning programs supported byLearn and Serve America grants engagestudents from kindergarten through col-lege to serve their communities and learncitizenship. The budget proposes to fundopportunities for more than a million stu-dents.
• The National Senior Service Corps pro-vides opportunities for citizens age 55 andolder to use their time and talents to meetcommunity needs. The budget funds theRetired and Senior Volunteer Program,the Foster Grandparent Program, and theSenior Companion Program, enablingmore than half a million older Americansto serve.
Most important of all, national serviceparticipants are getting things done.
• In one Tennessee project, AmeriCorpsmembers helped improve the health of 500children by advising parents on proper nu-trition and early childhood health, assess-ing family health risks, and increasing ac-cess to health education.
• In Washington State, AmeriCorps mem-bers helped cut violent crime in one hous-ing project by 30 percent through a pro-gram that addresses juvenile crime, gangactivity, school success, and youth home-lessness. The program offers a late-nightprogram for 400 high-risk youth, a streetschool that operates six days a week, out-of-school time activities for K–12 youth,and a program to enhance student successin schools.
• In New York City, a team of 30 olderAmericans that works directly with chil-dren through tutoring and mentoring hasdeveloped literacy programs, encouragedparent and grandparent involvement, ledcommunity service events for the children,
organized afterschool and summer pro-grams, and recruited additional volun-teers.
Empowerment Zones (EZs) andEnterprise Communities (ECs)
As part of his 1993 economic program,the President proposed, and Congress enacted,the Empowerment Zones and Enterprise Com-munities program. Communities develop astrategic plan to help spur economic andcommunity development and expand opportu-nities for their residents, and in returnthey receive Federal tax benefits, social servicegrants, technical assistance, and more flexibil-ity in how they use Federal funds.
EZs and ECs are parts of urban or ruralareas with high unemployment and highpoverty rates. For EZs, the Federal Govern-ment provides tax benefits for businesses,and offers grants to community groups forjob training, day care, and other purposes.For ECs, the Government provides grantsto community groups for the same arrayof purposes. Both EZs and ECs can applyfor waivers from Federal regulations, enablingthem to better address their local needs.In addition, special set-asides from AgricultureDepartment rural development programs areavailable to rural EZ/ECs.
The 1994 competition for the first roundof EZ and EC designations generated over500 applications and created new local part-nerships for community revitalization—evenin communities not chosen. The 105 selectedcommunities made well over $8 billion inprivate-public commitments (in addition tothe promised Federal resources), bringinggreater economic opportunity to both dis-tressed urban and rural areas.
The Kentucky Highlands rural EZ, forinstance, is using $11 million of EZ fundsto expand the amount of development venturecapital available in its borders. From the$5.6 million obligated to date, the EZ hasleveraged $38 million in additional capitalfor 11 new manufacturing enterprises thathave created 575 jobs and committed tocreate another 1,600. In the six urban EZs,the private sector has made or committedover $2 billion in new investment, bringinggreater opportunity to those cities. The Detroit
1178. STRENGTHENING THE AMERICAN COMMUNITY
Celebrating the Millennium and America’s TreasuresThe new White House Millennium Council will lead the country in a celebration of the new
millennium—initiating and recognizing national and local projects and efforts that contribute tothe celebration in educational, creative, and productive ways. By stressing the creative achieve-ments and accomplishments of Americans in exploration, innovation, and discovery, and by edu-cating Americans, especially children, about our history, democracy, and civil society, the Coun-cil can help ensure that these values and traditions endure into the next century. The Councilwill work with Federal agencies, Congress, States, Tribes, elected officials, communities, citi-zens, and private and non-profit organizations to recognize the Nation’s historical accomplish-ments, reflect on the forces shaping our society, and encourage thoughtful planning for the fu-ture.
The budget proposes $50 million for the National Park Service Historic Preservation Fund,working with the Council, to help public and private entities to commemorate the Millennium.These funds will support one of the most important tasks facing America at the turn of the cen-tury—to preserve America’s treasures for future generations. These treasures include the his-toric buildings, sites, documents, objects, manuscripts, photographs, works of art, maps, jour-nals, still and moving images, and sound recordings that document and illuminate our Nation’shistory and our cultural heritage.
The budget also funds important cultural institutions and programs. It provides the resourcesto complete the Mall Museum of the National Museum of the American Indian, a public-privatepartnership between the Federal Government and the Native American community that willopen to the public in 2002. It also provides increased funds to help the Smithsonian address thebacklog of needed repairs at several of its major museums, such as the National Museum ofNatural History. In addition, the budget provides funds for the Kennedy Center to continuemajor interior renovations that will permit greater access by the disabled persons and better useof its space. Finally, the budget provides increases for cultural institutions, such as the Smith-sonian and the National Endowment of the Arts, to digitize portions of collections and, in turn,enhance public access to them.
EZ alone has supported thousands of newjobs, helping to drop the city’s jobless ratefrom 11 percent to 8.7 percent since 1994.In a recent report card on EZs in general,Standard and Poor’s, the credit rating agency,concluded that, ‘‘when executed successfully,[EZs] can contribute to the local economyand lead to an improvement in the issuer’scredit rating.’’
But many communities that were not des-ignated as EZs or ECs lack the seed capitalto begin their revitalization efforts. Thus,in last year’s budget, the President proposeda second round of EZs/ECs to stimulatefurther private investment and economic op-portunity in distressed urban and rural com-munities and to connect residents to availablelocal jobs. Congress authorized 22 additionalEZs, and made qualified businesses in theseEZs eligible for tax incentives, including up-front deductions for qualifying capital invest-ments, new tax-exempt facility bonds, a newdeduction for environmental remediation costs,
and a new tax credit for holders of qualifiedZone education ‘‘academy’’ bonds. This budgetproposes flexible block grant funds, $100million per urban EZ and $40 million perrural EZ over 10 years, to complement thetax incentives and encourage comprehensiveplanning to revitalize these distressed areas.
The program will continue to challengecommunities to develop their own comprehen-sive, strategic plans for revitalization, withinput from residents and a wide array ofcommunity partners. The Administration willinvest in communities that develop the mostinnovative plans and secure significant localcommitments. It will offer a competitive appli-cation process to stimulate the public-privatepartnerships needed for large-scale job cre-ation, business opportunities, and job connec-tions for families in distressed communities.Also, communities will receive priority consid-eration for funds from Federal economic devel-opment programs and for waivers of Federalrequirements from the President’s Community
118 THE BUDGET FOR FISCAL YEAR 1999
Empowerment Board, which the Vice Presi-dent chairs. The upcoming competition willbuild on the President’s Brownfields initiative,which promotes the clean-up and redevelop-ment of contaminated industrial and commer-cial sites. (For more information on theBrownfields program, see Chapter 4, ‘‘Protect-ing the Environment.’’)
Community Development Lending
The Community Development Financial In-stitutions (CDFI) Fund, which the Presidentproposed and Congress established in 1994,expands the availability of credit, investmentcapital, financial services, and other develop-ment services in distressed urban and ruralcommunities. By creating and expanding adiverse set of CDFIs, the Fund helps developnew private markets, create healthy localeconomies, promote entrepreneurship, restoreneighborhoods, generate tax revenues, andempower residents. The Fund represents anew approach to community development thatuses limited Federal resources to leveragesignificant private sector and local resources,promotes self-sustaining CDFIs, and catalyzesnew community lending and investment activ-ity by conventional financial institutions.
CDFIs provide a wide range of financialproducts and services, such as mortgage fi-nancing to first-time home buyers, commercialloans to start or expand small businesses,loans to rehabilitate rental housing, andbasic financial services. CDFIs include abroad range of institutions—e.g., communitydevelopment banks, low-income credit unions,community development loan and venturecapital funds, and microenterprise loan funds.
The budget proposes $125 million for theCDFI Fund, a $45 million increase overthe 1998 level; the new funds would expanda training and technical assistance initiativeand, in part, help accelerate the developmentof a secondary market for community develop-ment loans. To date, the CDFI Fund hasreceived requests for almost $500 millionin assistance—over six times the amountavailable—from over 400 applicants. In 1997,the Fund chose 48 CDFIs to receive $38.3million in financial and technical assistance.In addition, the Fund awarded $17 millionto 55 traditional banks and thrifts for increas-
ing their activities in economically distressedcommunities and investing in CDFIs.
The Fund can dramatically leverage privatefunds in distressed communities. For example,its $3 million investment in Self-Help ofDurham, N.C., helped leverage $24 millionin mortgage financing and commercial lending.In addition, the Fund can strengthen CDFIsthemselves and expand their ability to lendand invest. The Santa Cruz Community CreditUnion is using $1 million from the Fundto open a new branch to serve mostly low-income, Hispanic residents of Watsonville,California. With a $1 million loan fromthe Fund, the Tlingit-Haida Regional HousingAuthority will begin home mortgage lendingin southeast Alaska’s three urban areas—providing one of the first sources of affordablemortgage loans to Alaska Natives in thesemarkets.
The budget also provides $400 million forthe Department of Housing and Urban Devel-opment’s (HUD) Economic Development Initia-tive, including the resources for a new Commu-nity Empowerment Fund to support economicdevelopment efforts and help create a second-ary market for HUD’s Community Develop-ment Loan Guarantee (Section 108) program.Through grants and loans, this new programwould help State and local governments stand-ardize the underwriting and documentationof loans to businesses in distressed areas,and expand credit for economic and communitydevelopment lending.
Urban and Rural Development
The Administration has worked to givecommunities flexible tools to develop affordablehousing, revitalize their economies, and pro-mote equal housing opportunity for all.
Hoping to reverse a decline in homeowner-ship, for instance, the Administration in 1994launched an unprecedented partnership with58 key public and private organizations toform a National Homeownership Strategy.The partners are reducing barriers to home-ownership by cutting mortgage closing costsand down payment requirements; simplifyingthe process of financing home purchases andrepairs; and opening markets for women,minorities, central-city home buyers, and oth-ers traditionally locked out of conventional
1198. STRENGTHENING THE AMERICAN COMMUNITY
Enforcing Civil RightsFederal civil rights laws reflect the Nation’s respect for core values that bind together diverse
segments of the American community. These laws protect Americans’ rights to equal access toeducational opportunities and equal opportunity in the workplace, and their rights to live wherethey want and practice the religious faith they choose. As the population grows more and morediverse, the Nation must continue to ensure that all of its citizens have the same chance to pros-per.
Federal civil rights agencies enforce our laws against discrimination. Effective enforcementpromotes the economic well-being of Americans who seek good jobs, a better education for theirchildren, and the chance to become self-sufficient. The Nation must enforce its civil rights lawsfairly, consistently, and aggressively, and that requires adequate funding for these agencies.
The budget proposes $602 million for civil rights enforcement agencies, an increase of $86million, or 17 percent, over the 1998 level, including the necessary funds to improve compliance;expand the use of alternative dispute resolution methods; improve information systems; anddevelop better data collection capabilities for research and enforcement.
The budget provides a 15-percent increase, to $279 million, for the Equal Employment Oppor-tunity Commission to more quickly resolve private sector complaints; a 70-percent increase, to$52 million, for the Department of Housing and Urban Development to crack down on housingdiscrimination; and a 10-percent increase, to $72 million, for the Justice Department’s CivilRights Division to better coordinate Federal civil rights enforcement and to expand investiga-tions and prosecutions of police brutality and violations of the Americans with Disabilities Act.(For more information on these initiatives, see Chapter 12 of Analytical Perspectives, ‘‘CivilRights Enforcement Funding.’’)
lending markets. Along with a strong economyand low interest rates, this effort has helpedboost homeownership to 66 percent—an all-time high; 5.8 million Americans have becomehomeowners under this Administration, in-cluding record numbers of minorities.
But the job is not done. Homeownershipin central cities and among women, minorities,and lower-income Americans hovers at orbelow 50 percent. Consequently, to boosthomeownership among these groups, the budg-et proposes $25 million for a NeighborhoodReinvestment Corporation pilot program tohelp renters with solid payment track recordsown their own homes. The budget also pro-poses a Home Loan Guarantee program toallow States to use HOME funds to leverageprivate loans for large-scale, affordable hous-ing developments in distressed areas. Toexpand housing opportunities and combatdiscrimination, the budget proposes that HUDfund fair housing enforcement using pairedtesters—a proven method to detect discrimina-tion—in 20 communities in order to developlocal indices of discrimination, identify andpursue violations of fair housing laws, and
promote new community fair housing enforce-ment initiatives.
To spur the private sector to develop moreaffordable rental housing for low-income Amer-icans, the budget proposes a major expansionof the Low Income Housing Tax Credit,which will help develop another 150,000 to180,000 affordable housing units over thenext five years. Currently, the credit helpsdevelop 75,000 to 90,000 affordable unitsa year. The proposal, which will cost $1.6billion over the next five years, will restorethe value of the tax credit, which has erodedover the last decade due to an increasein building costs. The credit helps to reducethe cost of rent by an average of $450a month for the average housing creditrenter who, in turn, earns $13,300 a year.
For public housing, the Administration hasadvanced the most profound changes in overa generation, replacing the most dilapidateddevelopments with smaller scale, affordablehousing and portable vouchers; restoring man-agement excellence to troubled housing agen-cies; providing incentives for tenant self-sufficiency; and strengthening occupancy and
120 THE BUDGET FOR FISCAL YEAR 1999
Investing in the Delta RegionThe budget proposes $26 million to apply the successful economic development model of the
Appalachian Regional Commission (ARC) to help 219 distressed counties in the seven-StateLower Mississippi Delta Region, which has suffered from persistently high poverty and low eco-nomic growth for much of the past 40 years.
The ARC’s Federal-State partnership is a proven economic development tool that embodiesbalanced, equitable fiscal decision-making and that could dramatically improve the economicviability of the Delta Region.
eviction rules. The budget builds on theprogress by supporting efforts to demolish54,000 of the worst public housing unitsin the next three years and replace themwith portable subsidies or newly constructedmixed income housing. The budget also pro-poses $283 million for 50,000 portable housingvouchers for families seeking to move fromwelfare to work. Local housing agencies thatwork in partnership with State and localwelfare agencies will get the flexibility todesign programs to serve welfare familiesfor whom housing assistance is critical forgetting and retaining jobs.
Because their needs are so different, nosingle approach will help both urban andrural communities. The Administration hasproposed to give States, localities, and Tribesmore flexibility in how they use USDA’sRural Development grants and loans for busi-nesses, water and wastewater facilities, andcommunity facilities such as day care centersand health clinics. The 1996 Farm Bill author-ized this approach through a new RuralCommunity Assistance Program (RCAP), com-bining 12 separate USDA programs into aPerformance Partnership that can tailor assist-ance to the unique economic developmentneeds of each rural community. The budgetproposes $2.9 billion in loans and grantsfor RCAP, four percent more than in 1998,and the full flexibility that the 1996 FarmBill envisioned.
The budget also boosts funding for theCommerce Department’s Economic Develop-ment Administration (EDA). The EDA wouldcreate an Office of Community and EconomicAdjustment Assistance to work directly withcommunities adversely affected by major plantclosings and international trade agreements
and increase the number of grants availableto communities.
Government-to-Government Commitmentto Native Americans
The Administration honors its government-to-government relationship with Tribes byprotecting critical, reservation-level programs,turning back congressional threats to Tribalsovereignty, and bringing together governmentleaders and resources to address importantTribal concerns. The budget protects thesepriorities and proposes more assistance tocombat crime, foster educational opportunities,and promote environmental conservation. Thebudget proposes $7.8 billion, four percentmore than in 1998, for Government-wideprograms addressing basic Tribal needs andencouraging self-determination (see Table 8–1).
A joint law enforcement initiative of theInterior (DOI) and Justice Departments, forwhich the budget proposes $182 million in1999, will address sharply increasing crimerates in Indian country with more resourcesfor drug and youth crime prevention programs,police investigators and officers, Tribal courts,and detention facilities. The Administrationalso proposes a new school construction initia-tive and more resources for school operations;education opportunity zones; early interventionpartnerships; child care; technology to linkschools, classrooms, and libraries; and teacherpreparation and recruitment. Finally, the Inte-rior and Commerce Departments recently is-sued a Secretarial Order to assist Tribesin promoting healthy ecosystems and develop-ing conservation measures.
DOI’s Bureau of Indian Affairs (BIA) andthe Health and Human Services Department’sIndian Health Service (IHS) comprise nearly
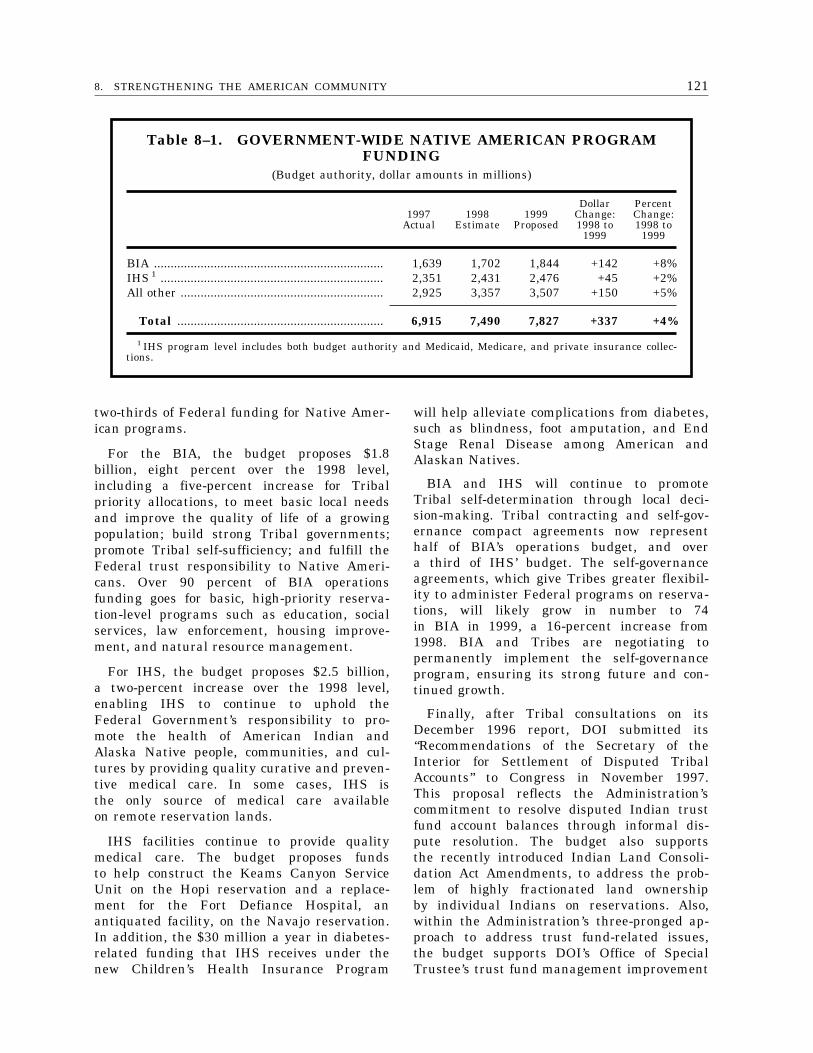
1218. STRENGTHENING THE AMERICAN COMMUNITY
Table 8–1. GOVERNMENT-WIDE NATIVE AMERICAN PROGRAMFUNDING
(Budget authority, dollar amounts in millions)
1997Actual
1998Estimate
1999Proposed
DollarChange:1998 to
1999
PercentChange:1998 to
1999
BIA ..................................................................... 1,639 1,702 1,844 +142 +8%IHS 1 ................................................................... 2,351 2,431 2,476 +45 +2%All other ............................................................. 2,925 3,357 3,507 +150 +5%
Total .............................................................. 6,915 7,490 7,827 +337 +4%
1 IHS program level includes both budget authority and Medicaid, Medicare, and private insurance collec-tions.
two-thirds of Federal funding for Native Amer-ican programs.
For the BIA, the budget proposes $1.8billion, eight percent over the 1998 level,including a five-percent increase for Tribalpriority allocations, to meet basic local needsand improve the quality of life of a growingpopulation; build strong Tribal governments;promote Tribal self-sufficiency; and fulfill theFederal trust responsibility to Native Ameri-cans. Over 90 percent of BIA operationsfunding goes for basic, high-priority reserva-tion-level programs such as education, socialservices, law enforcement, housing improve-ment, and natural resource management.
For IHS, the budget proposes $2.5 billion,a two-percent increase over the 1998 level,enabling IHS to continue to uphold theFederal Government’s responsibility to pro-mote the health of American Indian andAlaska Native people, communities, and cul-tures by providing quality curative and preven-tive medical care. In some cases, IHS isthe only source of medical care availableon remote reservation lands.
IHS facilities continue to provide qualitymedical care. The budget proposes fundsto help construct the Keams Canyon ServiceUnit on the Hopi reservation and a replace-ment for the Fort Defiance Hospital, anantiquated facility, on the Navajo reservation.In addition, the $30 million a year in diabetes-related funding that IHS receives under thenew Children’s Health Insurance Program
will help alleviate complications from diabetes,such as blindness, foot amputation, and EndStage Renal Disease among American andAlaskan Natives.
BIA and IHS will continue to promoteTribal self-determination through local deci-sion-making. Tribal contracting and self-gov-ernance compact agreements now representhalf of BIA’s operations budget, and overa third of IHS’ budget. The self-governanceagreements, which give Tribes greater flexibil-ity to administer Federal programs on reserva-tions, will likely grow in number to 74in BIA in 1999, a 16-percent increase from1998. BIA and Tribes are negotiating topermanently implement the self-governanceprogram, ensuring its strong future and con-tinued growth.
Finally, after Tribal consultations on itsDecember 1996 report, DOI submitted its‘‘Recommendations of the Secretary of theInterior for Settlement of Disputed TribalAccounts’’ to Congress in November 1997.This proposal reflects the Administration’scommitment to resolve disputed Indian trustfund account balances through informal dis-pute resolution. The budget also supportsthe recently introduced Indian Land Consoli-dation Act Amendments, to address the prob-lem of highly fractionated land ownershipby individual Indians on reservations. Also,within the Administration’s three-pronged ap-proach to address trust fund-related issues,the budget supports DOI’s Office of SpecialTrustee’s trust fund management improvement
122 THE BUDGET FOR FISCAL YEAR 1999
project to resolve problems in individual In-dian accounts, convert to a commercial-gradeaccounting system, and strengthen the man-agement of the underlying trust assets.
The District of Columbia
As President Clinton told congregants atMetropolitan Baptist Church in Washington,D.C. recently, the Administration is committedto being ‘‘a better neighbor’’ to the Districtof Columbia.
The President’s comprehensive plan for theDistrict, which Congress largely funded lastyear, was an important step along the way.By relieving the District of major financialburdens that it should never have had,the plan lays the groundwork for the Districtto restore its fiscal health.
Under the plan, the Federal Governmentassumed certain functions in which it hasa clear interest.
• Criminal Justice: The Federal Governmentnow funds D.C.’s Court System and otherkey elements of the District criminal jus-tice system, including the incarceration ofsentenced felons and supervision of alladult offenders.
• Medicaid: The Federal Government hasassumed the role typically played by bothFederal and State governments under thishealth insurance program, paying 70 per-cent of Medicaid spending in the District(compared to the previous 50 percent).
• Pensions: The Federal Government is re-suming responsibility for an estimated$5.9 billion unfunded pension liability thatit transferred to the District in 1979.
In exchange, the Federal Government elimi-nated its annual payment to D.C., whichtotaled $660 million in 1997, though it pro-vided a one-time, $190 million payment forDistrict operations in 1998.
Under the President’s plan, the Districtgovernment estimates that it will save about$200 million in 1998 alone. To balance itsbudget in 1998 and maintain balance there-after, the District plans to launch majormanagement reforms, cut spending, and fi-nance part of its $528 million accumulateddeficit.
The Administration—through its depart-ments and agencies—will continue to providetechnical help and other assistance to theDistrict in specific areas, such as educationand law enforcement. The budget, for instance,proposes $20 million to help D.C. publicschools implement reforms that hold thepromise of improving student achievement,including expanding summer school, trainingteachers and principals, and placing readingspecialists in every school.
The upcoming year is a pivotal one forthe Federal and District governments to imple-ment the landmark changes in their relation-ship, and for D.C. to implement vital manage-ment reforms. The Administration, whichstrongly supports the District’s right to self-governance, is committed to do its part,and it proposes to pay for certain specialexpenses that arise from District implementa-tion of the President’s plan in the areasof District Corrections, Courts, and OffenderServices Agency operations.
Moreover, the budget proposes to buildon last year’s plan by providing $100 millionfor economic development initiatives, including$50 million to fund an economic developmententity created by the District; $25 millionto make the proposed Washington ConventionCenter more accessible to the public throughWashington’s Metro subway system; and $25million to fund management reform initiativesto improve the city’s economic developmentinfrastructure.
1238. STRENGTHENING THE AMERICAN COMMUNITY
Expanding Public TelevisionThe budget provides $450 million over five years to help the public broadcasting system make
the transition to digital technology, which will greatly expand educational, community service,and cultural programming. New digital technology will set the stage for four to six more chan-nels and new innovative television applications, including high definition and interactive tele-vision.
These funds—for the Corporation for Public Broadcasting and the Commerce Department—will ensure that public broadcasting can take advantage of the transition while continuing tomeet four core principles: education, non-commercialism, universal access, and localism in thedigital era.

125
9. ADVANCING UNITED STATESLEADERSHIP IN THE WORLD
Nations are now setting the international ground rules for the 21st Century, laying a founda-tion for security and prosperity for those who live within them, while isolating those whochallenge them from the outside. This system will develop and endure only if those who follow therules of peace and freedom fully reap their rewards. Only then will our people believe that theyhave a stake in supporting and shaping the emerging international system.
President ClintonSeptember 1997
Americans have a tremendous stake inworld events. The establishment of democracyand market economies in the former Sovietbloc, the safe disposal or storage of weaponsof mass destruction in Russia and elsewhere,the identification and control of deadly tropicaldiseases in Africa, and the maintenance ofhealthy economies in Asia and Latin Amer-ica—all of these are important to the security,health, and prosperity of the American people.
American diplomacy, implemented throughinternational affairs programs, is the meansby which the United States leads abroadon many important issues. For several years,the resources that Congress provided wereinadequate to ensure that leadership. In1998, however, the Administration and Con-gress worked successfully to build major bipar-tisan support for an increase in internationalaffairs spending, including special legislativeprovisions to facilitate support of internationalfinancial institutions and the United Nations(UN) and other international organizations.
Despite welcome congressional action oninternational affairs programs, an unfinishedagenda remains in areas critical to U.S.national interests. Most striking, the FederalGovernment must provide more resourcesfor key programs. To support continued U.S.economic growth, Congress should continueto support the decisive action of the Inter-national Monetary Fund (IMF) and U.S. lead-ership in that institution by providing the
supplementary contingent IMF funding thatthe Administration sought and replenishingthe IMF’s basic financial resources. For theUN, whose Security Council deals with secu-rity issues from Iraq to Bosnia, and forrelated international organizations dealingwith such issues as health and labor condi-tions, Congress should take steps to pay$1 billion in U.S. arrears on treaty-mandatedcontributions. Congress should also continueto pay off arrears to the multinational develop-ment banks and the Global EnvironmentFacility (GEF), which total $638 million.
In the area of trade, where the growthin exports has been so critical to our recenteconomic prosperity, Congress should givethe President traditional negotiating authorityto help fuel our surging exports into thenext century. Congress also should enactlegislation promoting trade with Africa andthe Caribbean Basin. The Administration pro-poses more export financing to take advantageof opportunities emerging in regions suchas the New Independent States (NIS) ofthe former Soviet Union and to match thegovernment financing offers of other countries.The Administration also proposes to maintainor expand programs that support democracyand free market economic systems in theformer communist countries and in Africaby encouraging trade and investment, notonly for America’s security but also for creat-ing sources of future export demand.
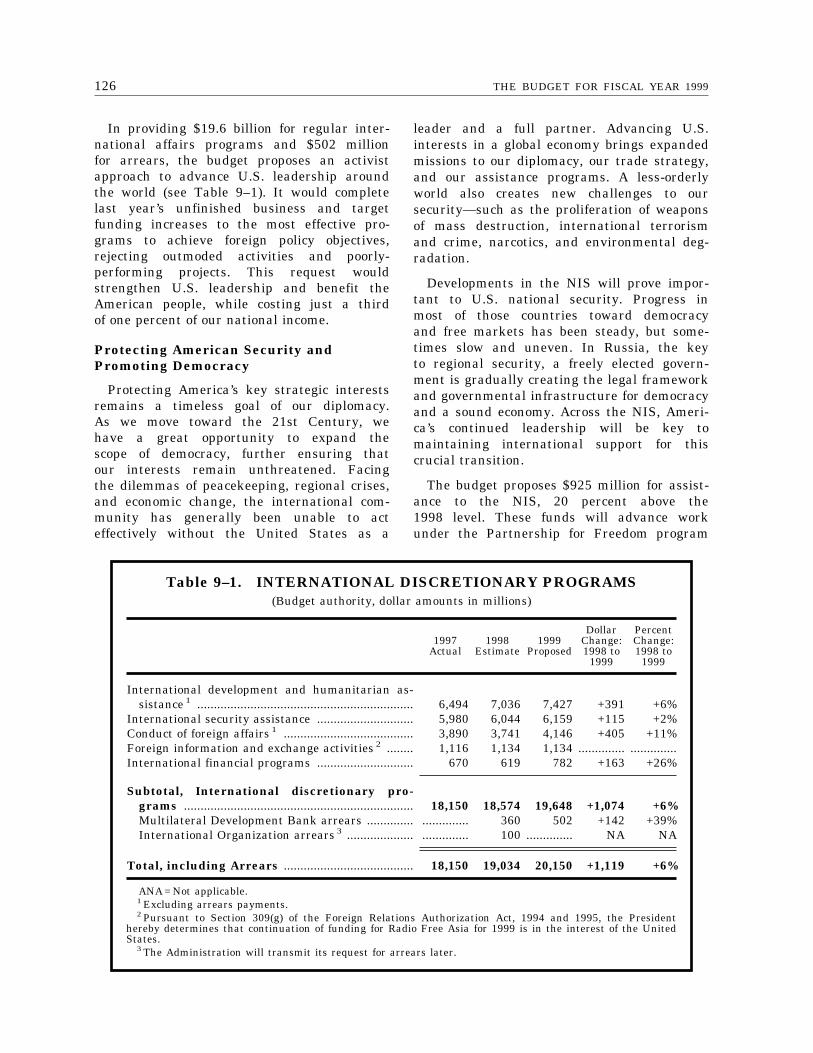
126 THE BUDGET FOR FISCAL YEAR 1999
Table 9–1. INTERNATIONAL DISCRETIONARY PROGRAMS(Budget authority, dollar amounts in millions)
1997Actual
1998Estimate
1999Proposed
DollarChange:1998 to
1999
PercentChange:1998 to
1999
International development and humanitarian as-sistance 1 ................................................................. 6,494 7,036 7,427 +391 +6%
International security assistance ............................. 5,980 6,044 6,159 +115 +2%Conduct of foreign affairs 1 ....................................... 3,890 3,741 4,146 +405 +11%Foreign information and exchange activities 2 ........ 1,116 1,134 1,134 .............. ..............International financial programs ............................. 670 619 782 +163 +26%
Subtotal, International discretionary pro-grams ..................................................................... 18,150 18,574 19,648 +1,074 +6%Multilateral Development Bank arrears .............. .............. 360 502 +142 +39%International Organization arrears 3 .................... .............. 100 .............. NA NA
Total, including Arrears ....................................... 18,150 19,034 20,150 +1,119 +6%
ANA = Not applicable.1 Excluding arrears payments.2 Pursuant to Section 309(g) of the Foreign Relations Authorization Act, 1994 and 1995, the President
hereby determines that continuation of funding for Radio Free Asia for 1999 is in the interest of the UnitedStates.
3 The Administration will transmit its request for arrears later.
In providing $19.6 billion for regular inter-national affairs programs and $502 millionfor arrears, the budget proposes an activistapproach to advance U.S. leadership aroundthe world (see Table 9–1). It would completelast year’s unfinished business and targetfunding increases to the most effective pro-grams to achieve foreign policy objectives,rejecting outmoded activities and poorly-performing projects. This request wouldstrengthen U.S. leadership and benefit theAmerican people, while costing just a thirdof one percent of our national income.
Protecting American Security andPromoting Democracy
Protecting America’s key strategic interestsremains a timeless goal of our diplomacy.As we move toward the 21st Century, wehave a great opportunity to expand thescope of democracy, further ensuring thatour interests remain unthreatened. Facingthe dilemmas of peacekeeping, regional crises,and economic change, the international com-munity has generally been unable to acteffectively without the United States as a
leader and a full partner. Advancing U.S.interests in a global economy brings expandedmissions to our diplomacy, our trade strategy,and our assistance programs. A less-orderlyworld also creates new challenges to oursecurity—such as the proliferation of weaponsof mass destruction, international terrorismand crime, narcotics, and environmental deg-radation.
Developments in the NIS will prove impor-tant to U.S. national security. Progress inmost of those countries toward democracyand free markets has been steady, but some-times slow and uneven. In Russia, the keyto regional security, a freely elected govern-ment is gradually creating the legal frameworkand governmental infrastructure for democracyand a sound economy. Across the NIS, Ameri-ca’s continued leadership will be key tomaintaining international support for thiscrucial transition.
The budget proposes $925 million for assist-ance to the NIS, 20 percent above the1998 level. These funds will advance workunder the Partnership for Freedom program
1279. ADVANCING UNITED STATES LEADERSHIP IN THE WORLD
to use trade and investment measures, privatesector partnerships, and cooperation with non-governmental organizations to stimulate freemarket economic growth. One new activityis the Presidential Management Training Ini-tiative, to which Presidents Clinton andYeltsin recently agreed, that will enable NISbusiness managers to receive training andinternships with U.S. firms, benefitting themanagers, the firms, NIS economies, andU.S. foreign policy.
After nearly a decade of U.S. and inter-national support, the transition to democracyand free markets in Central and EasternEurope has been remarkably successful. Ourassistance to the governments of most ofthe countries in the northern portion ofthe region has ended, or will soon. Thesecountries are moving toward economic integra-tion with the United States and WesternEurope. Last year’s highlight was NATO’sdecision to accept three countries—the CzechRepublic, Hungary, and Poland—as members.As a result, the budget will provide over$100 million in security assistance to helpintegrate these countries’ military forces andto aid other potential candidates for NATOmembership. In addition, this budget projectsincreases in NATO’s three common-fundedbudgets for the coming years to reflect certaincosts associated with NATO’s enlargement.In December, NATO estimated that the costsof enlargement that it will bear within thesethree budgets will be about $1.5 billionover the next 10 years, of which the UnitedStates will pay about one-quarter, or lessthan $40 million a year on average duringthis period, from Defense Department funds.
The budget proposes $465 million in eco-nomic aid for Eastern Europe and the BalticStates, $225 million of which would supportthe firm U.S. commitment to see the DaytonAccords fully implemented for Bosnia. Assist-ance to Bosnia will complement the continu-ation of U.S. troops in that troubled nation,particularly by financing training and othersupport for local police to foster effective,fair, and professional public safety forces.Economic assistance will strengthen the emer-gence of a vital private sector. The Bosnians
are beginning to realize the benefits of freemarkets, and we must strongly foster theirnascent prosperity to demonstrate that areturn to hostilities will hurt all Bosnians.
For the other southern-tier countries ofEastern Europe, U.S. assistance will applythe lessons learned elsewhere in the regionto accelerate economic reform, particularlyin Romania, where the United States hasoffered a reform-oriented partnership withthe newly elected government. During theCold War, private civil institutions in EasternEurope eroded greatly, and fully reconstructingthem within the short time since then hasnot been easy. Thus, the budget proposesto create an innovative $100 million CivilSociety Trust Fund, financed half by Federalfunds and half by private contributions, mainlyfrom foundations. In countries where ourofficial aid has ended, the Fund will fostergrass roots political activity and viable non-governmental organizations.
Our strategic interest in peace in theMiddle East is as strong as ever. The peaceprocess has achieved much already. The needfor reconciliation remains urgent, and Americacontinues to play a unique leadership rolein the effort to craft a durable, comprehensiveregional peace. The budget proposes $5.3billion for security assistance to sustain theMiddle East peace process. The assistanceprogram provides $100 million for the thirdyear of a Middle East Peace and StabilityFund that will provide aid mainly to Jordanin recognition of that country’s needs andKing Hussein’s important continuing contribu-tions toward peace and reconciliation.
The rest of our security assistance programsare designed to support peace and democracyin countries and regions where our leadershiphas helped those processes emerge. Underthe budget, economic support funding forHaiti would double, to $140 million, to ensurethe success of that country’s hard-won democ-racy. The budget also would support reconcili-ation and peace in Guatemala and strengthenthe capacity of African governments to provideregional peacekeeping on that troubled con-tinent.
128 THE BUDGET FOR FISCAL YEAR 1999
Ensuring America’s Leadership in theInternational Community
Following World War II, the United Statesassumed a unique leadership role in buildinginternational institutions to bring the world’snations together to meet mutual security,economic, and humanitarian needs. We spon-sored and provided significant funding forthe UN, NATO, the IMF, and the WorldBank, along with other specialized regionalsecurity and financial institutions that becamethe foundation of international cooperationduring the Cold War.
To ensure financial stability for this inter-national community, members of many ofthe UN and related international organizations(IOs) entered into treaties or similar instru-ments committing them to pay specified shares(or, ‘‘assessments’’) of IO budgets. Congressratified these agreements, making them bind-ing on the United States. For the multilateraldevelopment banks (MDBs—that is, the WorldBank, its regional development bank partners,and the GEF), the developed countries, includ-ing the United States, make firm commitmentsto regular replenishments of their resources,in our case subject to the congressionalauthorization and appropriations processes.
By 1997, America’s leadership in this inter-national institutional network had seriouslyeroded due to past congressional cuts inappropriations needed to meet our assess-ments and commitments. The resulting arrearsto the IOs had accumulated to almost $1.5billion, and arrears to the MDBs were nearly$900 million. In the 1998 budget, the Adminis-tration proposed to pay off the bulk ofour arrears on assessments over two yearsif the IOs undertook budget and managementreforms, including lowering the U.S. annualassessment percentage in the future. It alsoproposed to pay off MDB arrears over threeyears in light of program and managementreforms already under way.
As part of last year’s bipartisan budgetagreement, Congress provided room in thebudget resolution to pay most of the accumu-lated arrears while still funding ongoinginternational affairs programs at an adequatelevel. Under this arrangement, Congresscleared over a third of the Nation’s MDB
arrears. The Administration and Congressalso developed bipartisan support for authoriz-ing legislation to clear many of the assessmentarrears over three years in return for specifiedIO reforms, and Congress passed an initial1998 appropriation of $100 million, subjectto enacting the authorization. But the legisla-tion stalled, thus undermining U.S. diplomaticefforts to achieve budgetary reforms andleading to a serious loss of U.S. credibilityin the UN and other IOs.
With the U.S. failure to address its sizablearrears, the UN General Assembly in Decem-ber 1997 established assessment rates forthe next three years without reducing theU.S. percentage. Due to a major U.S. diplo-matic effort, however, UN members agreedto reconsider the three-year decision in June1998—provided that the United States resolvesits arrears situation. To effect UN ratechanges, the Administration and Congressmust enact legislation by May 1998. TheAdministration will shortly transmit a pro-posal that seeks early legislative action topay over $1 billion of the $1.5 billion ofaccumulated arrears. The proposal will givethe Administration the statutory flexibilityit needs in June to reduce our assessmentrates and achieve other key reforms overthe next two years. The Administration isprepared to work with Congress to shapethe legislation. In addition, Congress mustappropriate $931 million to meet 1999 assess-ments—more than would have been requiredif Congress had passed last year’s authorizingpackage.
In addition, the budget proposes $502 mil-lion to continue the planned payoff of MDBand GEF arrears and $1.15 billion to paycurrent commitments to these institutions,which provide most of the assistance tothose poor countries around the world thatare undertaking promising economic reforms.The United Sates has convinced the MDBsto do more, while asking less from theAmerican taxpayer. As a result of recentnegotiations, U.S. commitments for all theMDBs have been cut by 40 percent andare now below what we once paid for theWorld Bank’s International Development Asso-ciation affiliate alone.
1299. ADVANCING UNITED STATES LEADERSHIP IN THE WORLD
Supporting International MonetaryPrograms
As the world becomes more economicallyintegrated, the smooth functioning of its mone-tary system becomes more critical to everynation’s economy. Severe disruptions in Asianeconomies demonstrate the world-wide impactof crises in major economies. Even the U.S.economy is not immune, despite its size,strength, and depth. The Administration ishaving urgent consultations with Congresson the most effective means to foster anearly, tenable return to more stable inter-national monetary conditions.
For 1998, the Administration proposed aone-time appropriation to a special inter-national facility, the New Arrangements toBorrow (NAB). With credit commitments from24 other nations, including most industrializedcountries and several emerging market econo-mies, NAB would provide a set of contingentcredit lines to supplement IMF resources,if necessary, when a monetary crisis inone or more countries threatens the entiresystem. Congress did not enact the appropria-tion. These funds are urgently needed asa reserve in case the emergency demandson IMF quota resources deplete the IMF’sliquidity so much that it cannot maintaininternational monetary stability.
As the global economy and capital marketsexpand, the IMF’s basic (quota) resourcesmust rise so that it can carry out itsongoing responsibilities to promote monetarystability and healthy economies. Since itsinception in 1945, the IMF has played amajor role in fostering the unprecedentedgrowth in world prosperity. Recent IMF pro-grams to provide crisis assistance in Asiahave drawn heavily on the Fund’s quotaresources. The United States needs to provideits share of the IMF’s proposed $87 billionincrease in regular resources so that theIMF can continue to meet members’ antici-pated demands while coping with additionalexceptional calls under current crisis condi-tions should they arise. In consultation withCongress, the Administration expects to re-quest a 1998 supplemental appropriation of$14.5 billion for a U.S. quota increase forthe IMF and of $3.4 billion for the U.S.credit commitment to the NAB. Because they
are monetary exchanges, neither the quotaincrease nor the credit commitment to theNAB would entail budget outlays.
Increasing American Prosperity ThroughTrade
The Administration remains committed toopening global markets and integrating theglobal economic system, which has becomea key element of continuing economic prosper-ity here at home. This goal is increasinglycentral to America’s diplomatic activities. TheAdministration is helping to lay the ground-work for sustained, non-inflationary growthinto the next century by implementing theNorth American Free Trade Agreement andthe multilateral trade agreements concludedduring the Uruguay Round. Specifically, theAdministration is working hard to ensurethat America receives the full benefit ofthese agreements, as recently illustrated bythe December 1997 conclusion of a key agree-ment on financial services.
To promote more mutually-beneficial traderelationships, the Administration last yearproposed fast track legislation to give thePresident authority to negotiate trade agree-ments on which Congress would get a simpleup-or-down vote, without amendments thatwould require renegotiation. Such trade agree-ments would further promote U.S. exportgrowth, creating high-wage jobs for Americans.Congress should give the President this tradi-tional negotiating authority.
The Administration also will propose toextend the Generalized System of Preferences,which cuts tariffs on many imports fromthe developing countries, beyond its currentexpiration date of June 30, 1998, and togive expanded trade benefits to the eligiblecountries under the Caribbean Basin Initia-tive. Also, as part of a larger trade andinvestment initiative for Africa, the Adminis-tration will propose special trade benefitsto African countries that are reforming theireconomies to encourage economic growth.
As various trade agreements offer opportuni-ties for exports, the demand for trade financeand investment support increases. The mainU.S. trade finance agency, the Export-ImportBank, has expanded its direct and guaranteedloans and export insurance to countries that
130 THE BUDGET FOR FISCAL YEAR 1999
Investing in Trade PromotionTrade plays a growing role in the U.S. economy. A third of America’s economic growth of the
last five years has come from trade, while exports of manufactured goods, high-technology prod-ucts, and agricultural goods have risen by over 40 percent. Exports grew to 11.4 percent ofGross Domestic Product (GDP) in 1996, compared to 4.8 percent in 1960, while imports grew to12.6 percent in 1996, compared to 4.3 percent in 1960. Today, exports support over 11 millionU.S. jobs—including one in five manufacturing jobs—and have generated nearly two million newjobs in the past four years alone.
But the Nation has huge opportunities for further growth. While America accounts for 22 per-cent of the world’s wealth, it has only four percent of its consumers. The greatest export oppor-tunities lie in the emerging market economies of Latin America, Asia, the Middle East, Africa,Central and Southern Europe, and the New Independent States of the former Soviet Union.Middle- and lower-income countries accounted for 80 percent of the rapid U.S. export growth ofthe past eight years.
Trade barriers in these new markets often remain high, however, while some developed na-tions provide export subsidies to their home-grown businesses. U.S. trade promotion programsare designed to open foreign markets, combat foreign subsidies, finance and insure U.S. tradeand investment where the private sector does not, provide information, develop foreign markets,and provide government-to-government advocacy.
This budget invests heavily in trade promotion. It provides substantial increases for theExport-Import Bank, which finances U.S. exports, and funds the Overseas Private InvestmentCorporation, which insures U.S. investments abroad. In addition, the budget proposes increasesfor the Commerce Department’s International Trade Administration, which promotes U.S. tradethrough its Export Assistance Centers and overseas foreign commercial offices. The multi-agen-cy Africa Initiative and higher funding for the Agency for International Development will helpfoster growing economies and future trading partners. Also, the budget proposes to extend theGeneralized System of Preferences and to provide expanded trade benefits for Caribbean BasinInitiative countries.
cannot get import financing at reasonableterms and to match the government exportfinancing offers of other industrialized coun-tries. The Bank expects particularly heavydemand from the NIS for exports that willbenefit both the U.S. and the countriesthat receive them, and contribute to economicand political reform across the NIS. Thebudget proposes $825 million for the Bank,18 percent above the 1998 level. It alsocontinues support for the investment insuranceand finance programs of the Overseas PrivateInvestment Corporation, which also increaseexports, and for the Trade and DevelopmentAgency’s (TDA) grants for feasibility studiesof capital investments abroad that can gen-erate follow-on exports. A special TDA pro-gram will focus on creating trading opportuni-ties in China. In addition, the budget providesan 18-percent increase, to $20 million, forthe Commerce Department’s Market Accessand Compliance Unit, whose members monitor
trade agreements and identify complianceproblems.
Supporting Development Assistance
Development assistance through the MDBsand, bilaterally, through the U.S. Agencyfor International Development (USAID) helpsmany of the poorest countries give theirpeoples more effective governments and higherliving standards. This assistance, includingprojects that create the conditions for economicgrowth, promote democracy, enhance humanhealth, and provide basic education, serveslong-term U.S. interests and diminishes theneed for short-term crisis intervention.
The Administration has streamlined USAIDlending as well, focusing it on countriesmost vigorously committed to the reformsthat will generate sustainable development.The budget proposes $1.8 billion for USAID’sdevelopment assistance programs. Along withongoing African aid programs, the budgetproposes $30 million of special development
1319. ADVANCING UNITED STATES LEADERSHIP IN THE WORLD
aid programs to support the broader tradeand investment initiative for the continent.In addition, the budget proposes $35 millionin special debt relief to African countrieseligible for the initiative. Complementing theseprograms, another $35 million of securityassistance will go to the Great Lakes regionin the interior of Africa to promote therule of law and conflict prevention amongthe warring parties there, thus creating politi-cal conditions favorable to achieving the eco-nomic growth that the area so badly needs.
The Peace Corps has helped spur thedevelopment of many countries while promot-ing better understanding among nations, andthe American people strongly support theprogram. The budget proposes $270 million,20 percent more than in 1998, to enablethe agency to begin increasing the numberof volunteers abroad—with the goal of 10,000volunteers by the year 2000.
Leading the Response to NewInternational Challenges
Another fundamental goal, and an increas-ing focus of our diplomacy, is meeting thenew transnational threats to U.S. and globalsecurity—the proliferation of weapons of massdestruction, drug trafficking and the spreadof crime and terrorism on an internationalscale, unrestrained population growth, andenvironmental degradation.
In 1997, the Administration sought andobtained Senate ratification of the ChemicalWeapons Convention, which will begin impos-ing controls on a class of destructive weaponsnot well regulated in the past. Congresshas not ratified the Comprehensive NuclearTest Ban Treaty, which the Administrationtransmitted in September 1997 and whichis so important to our national security.U.S. diplomacy and law enforcement activitiesare playing a key role in preventing thespread of weapons of mass destruction tooutlaw states such as Libya, Iraq, Iran,Syria, and North Korea. In addition, U.S.support for such organizations as the Inter-national Atomic Energy Agency and the Ko-rean Peninsula Energy Development Organiza-tion is critical to meeting our non-proliferationgoals.
U.S. bilateral assistance programs are criti-cal to tackling other important transnationalproblems. Our international counter-narcoticsefforts are making continued progress indrug-producing countries. After several yearsof cutting deeply the Administration’s fundingproposals for counter-narcotics, Congress hasbegun providing the requested increases inorder to cut the supply of illegal drugs,particularly cocaine. The budget proposes a20-percent increase in anti-drug funding, to$255 million, which will permit the UnitedStates to intensify its efforts to curb cocaineproduction in the Andean countries by offeringgrowers attractive economic alternatives.
In addition, USAID development assistanceand U.S. contributions to international efforts,such as the GEF, support large and successfulprograms to improve the environment andreduce population growth. The GEF worksclosely with the MDBs, promoting soundresponses to climate change, depletion ofthe ozone layer, and the extinction of species.The United States is the recognized worldleader in promoting safe, effective familyplanning projects.
Conducting and Administering Diplomacy
Effective diplomacy is the critical foundationfor meeting our foreign policy goals. Thebudget supports a strong U.S. presence atover 250 embassies and other posts overseas,promoting U.S. interests abroad and protectingand serving Americans by providing consularservices. The basic work of diplomacy atthese posts—the reporting, analysis, negotia-tions, and other efforts that often go unno-ticed—are at the core of all U.S. foreignpolicy achievements, allowing us, among otherthings, to anticipate and prevent threatsto our national security as well as discovernew opportunities to promote American inter-ests. The overseas posts also serve as theadministrative platform for the many otherU.S. agencies with personnel abroad, fromUSAID to the Departments of Defense, Justice,and the Treasury.
In 1997, the Administration took two majorsteps to improve the management of ourdiplomacy. First, a new management system,the International Cooperative AdministrativeSupport Services, will more fairly allocate—
132 THE BUDGET FOR FISCAL YEAR 1999
among all agencies with an overseas pres-ence—the administrative costs that the StateDepartment used to bear on its own. Agencies,in turn, will be able to use the administrativeservices that most suit them. Second, theState Department will reengineer its procure-ment system, eliminating cumbersome proce-dures, providing services much quicker, andsignificantly cutting costs.
The budget proposes $2.8 billion for theState Department to maintain its world-wide operations, take major steps to modernizeits information technology and communicationssystems and ensure year 2000 compliance,and accommodate security and facility require-ments at posts abroad. It proposes two majorinitiatives—construction of a new embassy
building in Berlin, where U.S. personnelhave been in temporary facilities since theirmove to the new German capital, and anembassy and related facilities in Beijing,where current arrangements are inadequateto house the representation appropriate todiplomacy with an important world powerand to ensure security.
Finally, the Administration expects Congressto enact legislation in early 1998 to implementits proposal to consolidate the Arms Controland Disarmament Agency and the U.S. Infor-mation Agency into the State Department,thus better integrating arms control andpublic diplomacy into the mainstream offoreign policy.
133
10. SUPPORTING THE WORLD’SSTRONGEST MILITARY FORCE
There will always be threats to our well-being, to the peaceful community of nations to whichwe belong. Indeed, in the years ahead, we will see more and more threats that cross national bor-ders—terrorism, weapons of mass destruction proliferating around the world, the growth of orga-nized crime and drug trafficking. We will have to find new ways to meet these security threats.
President ClintonNovember 1997
As the world’s most powerful fighting force,our Nation’s military serves as the backboneof U.S. national security strategy, safeguardingAmerica’s interests, deterring conflict, andsecuring the peace. Maintaining a strongand capable military remains essential toprotecting our freedoms and ensuring Ameri-ca’s global leadership role as we approachthe 21st Century.
As the security partner of choice for manycountries in all regions of the world, Americaremains the ‘‘indispensable nation’’ of thepost-Cold War era. Consistent with our globalresponsibilities, the U.S. military must deterour adversaries and reassure our friendsand allies that America is prepared to putforce behind the defense of its interests.American forces must prevail when committedto combat: they must be ready to meetthe threat of major theater war; they mustbe prepared for newly emerging threats, suchas the proliferation of weapons of massdestruction; they must be able to undertakedemanding contingency or humanitarian oper-ations; and they must be supported by amodern defense infrastructure that utilizesefficient management and business practices.
This Nation has built, and the Administra-tion continues to support, a military secondto none. But while the United States remainsthe only nation with the combat, logistical,mobility, intelligence, and communications ca-pabilities to conduct effective military oper-ations worldwide, we must continue to preparefor tomorrow’s challenges. The Departmentof Defense (DOD) recently completed the
Quadrennial Defense Review (QDR), a strate-gic plan to ensure that our forces remaincapable of executing the full range of globalmilitary operations into the next century.Consistent with the QDR, the defense programembraces three key elements:
• Shaping the international environment:Along with diplomacy and economic initia-tives, the U.S. military plays an essentialrole in shaping the international securityenvironment. U.S. forces are involved ina wide variety of activities that bolster ourown national security and the security ofothers. Such activities include overseas de-ployments and programs that reduce oreliminate the nuclear, biological, andchemical capabilities of other countries.These important efforts, which the budgetsupports, make it less likely that our mili-tary will be committed to combat.
• Responding to the full spectrum of crises:Despite U.S. efforts to prevent conflict, ourforces at times must respond to crises inorder to protect our national interests,demonstrate U.S. resolve, and reaffirm theNation’s role as global leader. As Chart10–1 shows, U.S. forces must be able toaddress the full spectrum of possible mili-tary crises, including smaller-scale contin-gency missions, counterterrorism opera-tions, and major theater wars.
• Preparing now for an uncertain future:While maintaining the capability toconfront today’s dangers, we must con-tinue to transform our military to meet
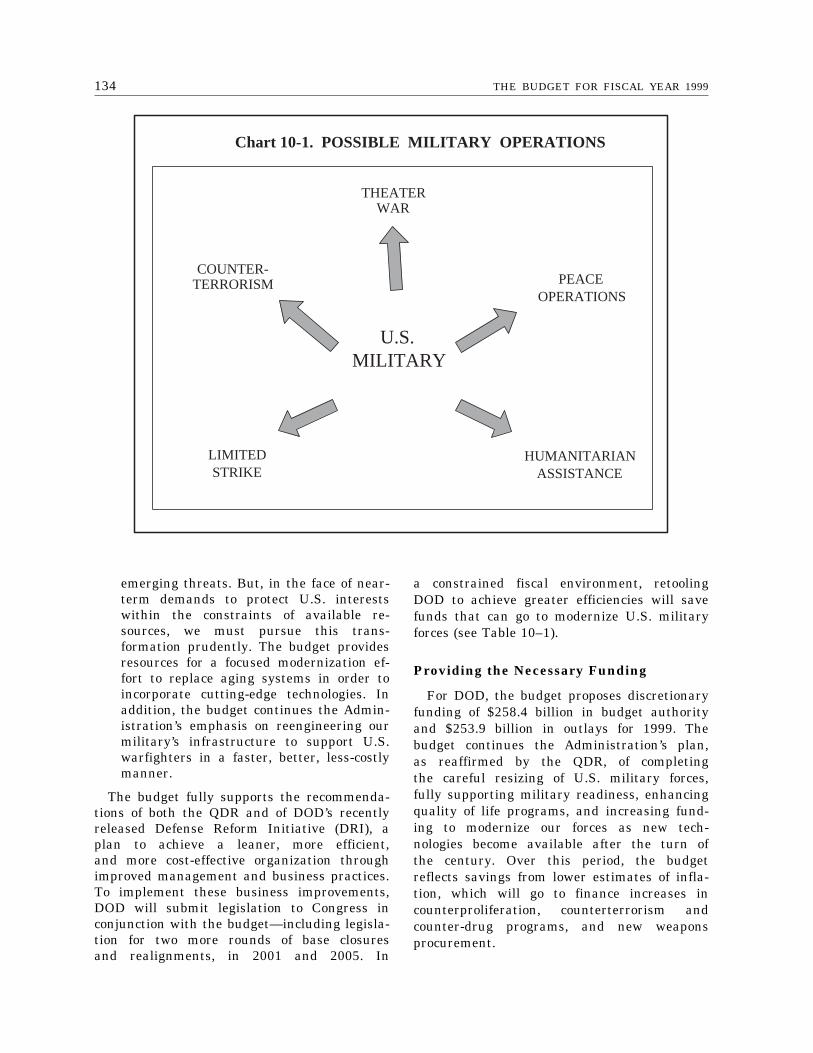
134 THE BUDGET FOR FISCAL YEAR 1999
Chart 10-1. POSSIBLE MILITARY OPERATIONS
U.S.MILITARY
LIMITEDSTRIKE
HUMANITARIANASSISTANCE
PEACEOPERATIONS
COUNTER- TERRORISM
THEATER WAR
emerging threats. But, in the face of near-term demands to protect U.S. interestswithin the constraints of available re-sources, we must pursue this trans-formation prudently. The budget providesresources for a focused modernization ef-fort to replace aging systems in order toincorporate cutting-edge technologies. Inaddition, the budget continues the Admin-istration’s emphasis on reengineering ourmilitary’s infrastructure to support U.S.warfighters in a faster, better, less-costlymanner.
The budget fully supports the recommenda-tions of both the QDR and of DOD’s recentlyreleased Defense Reform Initiative (DRI), aplan to achieve a leaner, more efficient,and more cost-effective organization throughimproved management and business practices.To implement these business improvements,DOD will submit legislation to Congress inconjunction with the budget—including legisla-tion for two more rounds of base closuresand realignments, in 2001 and 2005. In
a constrained fiscal environment, retoolingDOD to achieve greater efficiencies will savefunds that can go to modernize U.S. militaryforces (see Table 10–1).
Providing the Necessary Funding
For DOD, the budget proposes discretionaryfunding of $258.4 billion in budget authorityand $253.9 billion in outlays for 1999. Thebudget continues the Administration’s plan,as reaffirmed by the QDR, of completingthe careful resizing of U.S. military forces,fully supporting military readiness, enhancingquality of life programs, and increasing fund-ing to modernize our forces as new tech-nologies become available after the turn ofthe century. Over this period, the budgetreflects savings from lower estimates of infla-tion, which will go to finance increases incounterproliferation, counterterrorism andcounter-drug programs, and new weaponsprocurement.
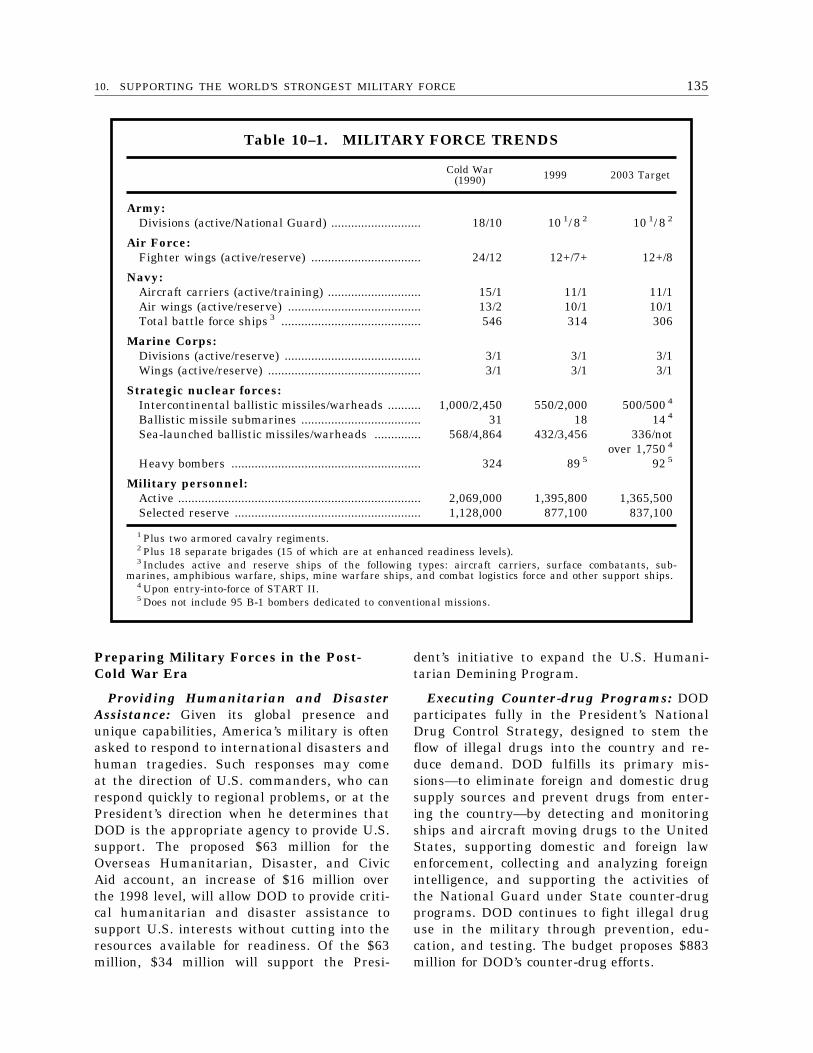
13510. SUPPORTING THE WORLD’S STRONGEST MILITARY FORCE
Table 10–1. MILITARY FORCE TRENDS
Cold War(1990) 1999 2003 Target
Army:Divisions (active/National Guard) ........................... 18/10 10 1/ 8 2 10 1/ 8 2
Air Force:Fighter wings (active/reserve) ................................. 24/12 12+/7+ 12+/8
Navy:Aircraft carriers (active/training) ............................ 15/1 11/1 11/1Air wings (active/reserve) ........................................ 13/2 10/1 10/1Total battle force ships 3 .......................................... 546 314 306
Marine Corps:Divisions (active/reserve) ......................................... 3/1 3/1 3/1Wings (active/reserve) .............................................. 3/1 3/1 3/1
Strategic nuclear forces:Intercontinental ballistic missiles/warheads .......... 1,000/2,450 550/2,000 500/500 4
Ballistic missile submarines .................................... 31 18 14 4
Sea-launched ballistic missiles/warheads .............. 568/4,864 432/3,456 336/notover 1,750 4
Heavy bombers ......................................................... 324 89 5 92 5
Military personnel:Active ......................................................................... 2,069,000 1,395,800 1,365,500Selected reserve ........................................................ 1,128,000 877,100 837,100
1 Plus two armored cavalry regiments.2 Plus 18 separate brigades (15 of which are at enhanced readiness levels).3 Includes active and reserve ships of the following types: aircraft carriers, surface combatants, sub-
marines, amphibious warfare, ships, mine warfare ships, and combat logistics force and other support ships.4 Upon entry-into-force of START II.5 Does not include 95 B-1 bombers dedicated to conventional missions.
Preparing Military Forces in the Post-Cold War Era
Providing Humanitarian and DisasterAssistance: Given its global presence andunique capabilities, America’s military is oftenasked to respond to international disasters andhuman tragedies. Such responses may comeat the direction of U.S. commanders, who canrespond quickly to regional problems, or at thePresident’s direction when he determines thatDOD is the appropriate agency to provide U.S.support. The proposed $63 million for theOverseas Humanitarian, Disaster, and CivicAid account, an increase of $16 million overthe 1998 level, will allow DOD to provide criti-cal humanitarian and disaster assistance tosupport U.S. interests without cutting into theresources available for readiness. Of the $63million, $34 million will support the Presi-
dent’s initiative to expand the U.S. Humani-tarian Demining Program.
Executing Counter-drug Programs: DODparticipates fully in the President’s NationalDrug Control Strategy, designed to stem theflow of illegal drugs into the country and re-duce demand. DOD fulfills its primary mis-sions—to eliminate foreign and domestic drugsupply sources and prevent drugs from enter-ing the country—by detecting and monitoringships and aircraft moving drugs to the UnitedStates, supporting domestic and foreign lawenforcement, collecting and analyzing foreignintelligence, and supporting the activities ofthe National Guard under State counter-drugprograms. DOD continues to fight illegal druguse in the military through prevention, edu-cation, and testing. The budget proposes $883million for DOD’s counter-drug efforts.
136 THE BUDGET FOR FISCAL YEAR 1999
Shaping the Environment Through ArmsControl and Cooperative Threat Reduc-tion: The Cooperative Threat Reduction Pro-gram (also called the Nunn-Lugar Program)helps build a safer world by dismantling nu-clear forces, securing nuclear weapons and ma-terials, and destroying chemical weapons inthe former Soviet Union. The budget proposes$442 million to continue this vital program.The President also remains strongly committedto reducing the threat from weapons of massdestruction through existing or anticipatedarms control agreements. Over the past fiveyears, the Administration has worked hard toimplement the START I treaty; bring theSTART II treaty into force; oversee the ratifi-cation of, and begin to implement, the Chemi-cal Weapons Convention; indefinitely and un-conditionally extend the Nuclear Nonprolifera-tion Treaty; and obtain the signing of the Com-prehensive Test Ban Treaty (CTBT). TheSTART II treaty awaits Russia’s approval,after which the President plans to seek a sub-sequent agreement to further reduce warheadlevels.
Ensuring Successful Contingency Oper-ations: U.S. forces have provided leadershipin contingency operations that support ourinterests. As in previous years, the budget pro-poses funding for ongoing contingency oper-ations in Southwest Asia in the Overseas Con-tingency Operations Transfer Fund; for 1999,the budget proposes $747 million to fund theSouthwest Asia operations. Congressional ap-proval would allow DOD to avoid redirectingfunds from operations and maintenance pro-grams to contingency operations, thereby help-ing to maintain the readiness of our force.
While the President has announced hisintention that United States forces participatein a NATO follow-on force in Bosnia, startingin July 1998, NATO has not yet finalizedthe exact structure required for the force.Consequently, DOD has not been able todetermine the specific American contributionto that force. Once NATO makes these forcestructure decisions, the Administration willsend Congress a supplemental funding requestto cover the additional costs, as prescribedby the 1998 National Defense Authorizationand DOD Appropriations Acts.
Countering the Proliferation of, andDefending Against, Weapons of Mass De-struction: The President remains committedto developing capabilities to locate and neu-tralize nuclear, biological, and chemical weap-ons before they can be used, and to protectU.S. troops against their effects. The budgetproposes over $800 million for the effort. High-priority activities include gaining the meansto identify and destroy underground produc-tion and storage sites, refining methods todetect and track weapons shipments, and im-proving the means to detect and identify bio-logical warfare agents. In response to theemerging terrorist threat of chemical or bio-logical attacks on American cities, the budgetalso funds improvements to domestic prepared-ness and response capabilities.
Protecting our Forces and CombatingTerrorism: The protection of U.S. servicemembers, deployed or at home, against thethreat of terrorism is a fundamental task. Thebudget proposes $3.9 billion to fully fundDOD’s programs to combat terrorism, includ-ing routine force protection. The resources willimprove our preparedness to respond to a ter-rorist attack that employs weapons of massdestruction, and enable DOD to continue acomprehensive vulnerability assessment pro-gram to identify additional force protectionneeds.
Developing Technologies to DefendAgainst Strategic Ballistic Missiles: Thebudget proposes $963 million to continue de-veloping a national missile defense to protectthe United States from a limited ballistic mis-sile attack. This contingency capability willallow DOD to deploy an effective system rap-idly if a threat should emerge sooner than U.S.intelligence now estimates.
Developing and Deploying DefensesAgainst Theater Ballistic Missiles: Thebudget proposes over $2.4 billion to developand deploy systems to defend against missilesthat directly threaten U.S. and allied forcesdeployed to specific theaters. While the fund-ing is primarily for research and developmentof advanced systems to meet future threats,it includes $343 million to procure an ad-vanced version of the Patriot missile and $43million for the Navy’s Area Theater Missile
13710. SUPPORTING THE WORLD’S STRONGEST MILITARY FORCE
Defense System that can be deployed imme-diately.
Maintaining the Nation’s Nuclear Deter-rent: Although funding for nuclear forces isat its lowest level in over 30 years, these forcesremain an essential component of our militarycapability. Within treaty-imposed limits, theirprimary mission is to deter nuclear attackagainst the United States and its allies, andto convince potential adversaries that they willnever gain a nuclear advantage against ourNation.
The budget proposes $4.5 billion for theDepartment of Energy (DOE) to maintainconfidence in the safety, reliability, and per-formance of the nuclear weapons stockpile.DOE will perform this mission without under-ground nuclear testing to comply with theproposed CTBT. To make up for the lossof testing, DOE plans to build new non-nuclear test facilities while upgrading thecomputer models it uses to predict the per-formance of nuclear weapons. The budgetincludes: $284 million to continue constructionof the National Ignition Facility at the Law-rence Livermore National Laboratory; $518million, $140 million more than in 1998,for the Advanced Strategic Computing Initia-tive; and $157 million for a new sourceof tritium for nuclear weapons.
Modernizing Our Military Forces
Addressing the Modernization Impera-tive: Modernizing weapons systems is criticalto the future readiness of U.S. military forces.In the 1970s and 1980s, the Nation investedheavily in a wide range of equipment—includ-ing fighter aircraft, attack submarines, surfaceships, attack helicopters, and armored vehi-cles—enabling us to reduce weapons pur-chases, and total defense spending, in theearly 1990s as we cut the size of U.S. forcesafter the Cold War. But the equipment boughtin the prior two decades, the backbone of to-day’s forces, is aging and must be replaced.When complex military equipment ages, it be-comes costlier and more difficult to maintainand operate. More importantly, the decisivemilitary advantage that new, superior equip-ment provides will help reduce casualties andmay permit a quick, successful resolution ofconflict. For these reasons, weapons system
modernization continues to be a high Adminis-tration priority.
The QDR determined that the Nation needsroughly $60 billion a year in weapons procure-ment funding, beginning in 2001, to modernizeU.S. forces. The budget provides $48.7 billionfor the 1999 procurement program, $3.9 billionmore than the 1998 level, and achievesthe $60 billion goal by 2001. In addition,the budget funds basic and applied researchand development of advanced technologiesthat will lay the groundwork for procuringnext-generation systems and that are vitalto the Nation’s engineering, mathematics,and computer science efforts.
Modernizing Ground Forces: In the nearterm, Army modernization emphasizes digiti-zation of battlefield systems (discussed laterin this chapter) and upgrades to existing com-bat equipment so that our ground forces willhave a clear advantage over potential oppo-nents. The Army will extend the useful lifeand improve battlefield performance of pri-mary combat systems, such as the Abramstank, the Bradley Fighting Vehicle and theApache Longbow helicopter, by integratingnew navigation and data transfer technology,improving weapons and targeting systems, andincreasing vehicle protection systems.
The centerpiece of the Marine Corps mod-ernization program is the V–22 tilt-rotoraircraft that will replace the CH–46 andCH–53A/D helicopters now used to transporttroops and equipment. The V–22’s increasedrange, payload, and speed will significantlyenhance Marine Corps tactical operations.
A sometimes overlooked, but no less impor-tant, part of ground force modernization isthe replacement of aging combat supportsystems such as trucks. The Army is replacingits fleet of medium trucks by procuringnew models, while the Marines have under-taken a truck remanufacturing program.
In the long term, ground force researchand development programs aim to take advan-tage of leaps in technology to enhance mission-essential equipment. Critical programs, whichwill lead to procurement in the middle ofthe next decade, include the Army’s Comanchehelicopter for armed reconnaissance, the Cru-sader self-propelled artillery howitzer, and
138 THE BUDGET FOR FISCAL YEAR 1999
the Marines’ Advanced Amphibious AssaultVehicle.
Modernizing Naval Forces: The budgetcontinues procurement of several ship classes,including three DDG–51 Aegis destroyers, aNew Attack Submarine, and an LPD–17 Am-phibious Transport Dock Ship. The Navy budg-et continues advance funding for the major re-fueling overhaul of the second Nimitz-class nu-clear aircraft carrier to enable the ship to stayin service another 25 years. The Navy alsowill procure long-lead material to construct thelast Nimitz-class nuclear aircraft carrier. Inaddition, the Navy is undertaking long-termdevelopment efforts to design next generationdestroyers and carriers, to be procured in themiddle of the next decade. Both of these newship classes will operate at lower costs andwill be more capable than their predecessorsby taking advantage of innovative tech-nologies.
Along with new ships, the Navy will con-tinue to develop and procure highly-capableweapons for a number of missions. For defenseagainst missiles and aircraft, the budgetcontinues procurement of Standard Missiles.It also continues procurement of Tomahawkcruise missiles for use against land targets.The budget supports investments in the ShipSelf-Defense System to provide close anti-air defense for surface ships, and in gunand missile technologies to improve the Navy’sdelivery of fire support for marines andsoldiers ashore.
Modernizing Air Forces: For the UnitedStates to maintain its ability to dominate bat-tles in the next century, substantial invest-ment in new tactical combat aircraft is nec-essary. The budget supports three new aircraftprograms. First, it continues low rate produc-tion of the F/A–18E/F Super Hornet, whichwill become the Navy’s principal fighter/attackaircraft in the next decade. Second, the pro-curement of the first two F–22 Raptors, theAir Force’s new air superiority fighter, willbegin in 1999. Full-rate production of the F–22should come early in the next century. Third,research and development into new materialsand manufacturing processes for the JointStrike Fighter (JSF) will continue. The JSFis DOD’s largest, most ambitious tactical air-craft program and is designed to produce a
family of aircraft for the Air Force, Navy, andMarine Corps. It is scheduled to startreplacing about 3,000 aging aircraft(F–16s, F/A–18C/Ds and AV–8Bs) in 2005.
The budget also funds a major effort toimprove the weapons carried by combat air-craft. Joint missile procurement programsinclude the Advanced Medium Range Air-to-Air Missile and the Joint Standoff Weapon.Procurement continues for the Joint DirectAttack Munition—an inexpensive guidance kit,which transforms unguided bombs into preci-sion guided munitions. In addition, the Navy’sprogram to upgrade existing Harpoon missilesinto Standoff Land Attack Missiles ExpandedResponse continues in 1999. The budget alsofunds research and development into variousmunitions programs of the future, such asthe AIM-9X Sidewinder missile for shortrange air-to-air combat, and the Joint Air-to-Surface Standoff Missile.
To help ensure continued access to space,DOD plans to develop the Evolved ExpendableLaunch Vehicle program with industry, en-hancing U.S. competitiveness in the spacelaunch market and providing DOD with moreefficient, economical access to space.
Establishing Information Dominance:America’s preeminence in using information onthe battlefield has helped us establish theworld’s strongest military. The commanderwho can better observe and analyze the battlewhile disseminating highly accurate informa-tion to his forces has a powerful advantageover the adversary. Joint Vision 2010, DOD’svision for the future, focuses on the continueddevelopment of command, control, communica-tions, computers, intelligence, surveillance,and reconnaissance capabilities. This effortwill enhance the accuracy of weapons andallow for the more effective use of forces. TheArmy plans to ‘‘digitize’’ a division by the year2000—that is, equip it so that accurate, timelyinformation about the battle can be transferredrapidly between U.S. forces. The budgetincludes funding for Navy and Air Force auto-mated command and control systems and landand space-based communications networks. Italso includes funds for battlefield surveillanceassets, such as unmanned aerial vehicles, andnavigation systems, like the Global PositioningSystem for all military departments. The
13910. SUPPORTING THE WORLD’S STRONGEST MILITARY FORCE
budget provides funds to purchase nationalsensors (e.g., satellites) to help our leaders bet-ter anticipate, monitor, and respond to crises.These assets will play a key role in both mili-tary operations and national security decision-making, and will enable commanders to moreeffectively direct the battle and respond tothreats.
Supporting the President’s Initiatives onLandmines: To implement the policy that thePresident outlined last September, DOD is ac-celerating its research and development ondemining technology and on alternatives toanti-personnel landmines. The budget proposes$40 million for these efforts.
Maintaining Military Readiness
Ensuring Adequate Resources for Readi-ness: Maintaining high levels of readiness isour top defense priority. To allow U.S. forcesto accomplish a wide range of missions, thebudget provides full funding for key operationsand support programs, including unit trainingactivities, recruiting and retention programs,joint exercises, and equipment maintenance. Inaddition, DOD continues to monitor its currentand future military readiness through the Sen-ior Readiness Oversight Council and the JointMonthly Readiness Review process. These ef-forts enhance the Department’s ability to en-sure that critical readiness programs receivesufficient resources and that our forces remainprepared to accomplish their missions andachieve our Nation’s military strategy.
Enhancing the Quality of Life of Mili-tary Personnel: The Administration is strong-ly committed to strengthening the quality oflife of military personnel, which is importantfor retaining and recruiting high-quality per-sonnel. The budget proposes a 3.1 percent payraise, effective January 1999, to help ensurethat military compensation remains competi-tive with private sector wages. The budget in-cludes substantial funding to improve thequality of health care, military housing, andchild care programs. Enhancements to familysupport programs can help reduce the stressesassociated with military life, such as frequentfamily separations. The budget also increasesfunding for improving educational activities formilitary and eligible civilian dependents, in-cluding the construction and maintenance of
schools and support for the President’s SchoolTechnology Initiative, which has the long-range goal of putting one computer in everyclassroom for every four students and one forevery teacher.
Managing Our Defense Resources MoreEfficiently
Implementing Management and Busi-ness Practice Reform: Under the DRI andother efforts, DOD continues to implement im-provements to its management and businesspractices, including increased privatization andoutsourcing of support functions, personnel re-ductions associated with infrastructure andsupport activities, greater use of electroniccommerce, and expanded use of governmentpurchase cards. A new inter-agency workinggroup will help to identify and eliminate im-pediments to business practice reform.
Outsourcing and Privatizing: DOD hasbegun to implement an aggressive outsourcingand privatization program for its infrastruc-ture and support activities, including base util-ity services, general base operations, familyhousing, logistics support, training, propertymaintenance, and distribution depots. Theseefforts will save an estimated $6.4 billion overthe next five years and improve support forU.S. troops.
Eliminating Excess Infrastructure: DODhas facilities that it no longer needs becauseinfrastructure reductions have lagged behindforce reductions. Excess facilities drain re-sources that could otherwise go to moderniza-tion, readiness, and quality of life. To addressthe problem, DOD will send legislation to Con-gress to seek two more rounds of base closuresand realignments, in 2001 and 2005.
Improving Financial Management: TheAdministration remains committed to reform-ing DOD’s financial management activities andsystems, and has developed a comprehensivestrategy to do so. The Administration has iden-tified shortcomings in such areas as contractoroverpayments, fraud detection and controls,and standardized finance and accounting sys-tems. The Department is taking significantsteps to improve the integrity of its financialpractices. For example, DOD has cut the cat-egory known as problem disbursements froma total of $34.3 billion in June 1993 to $9.2
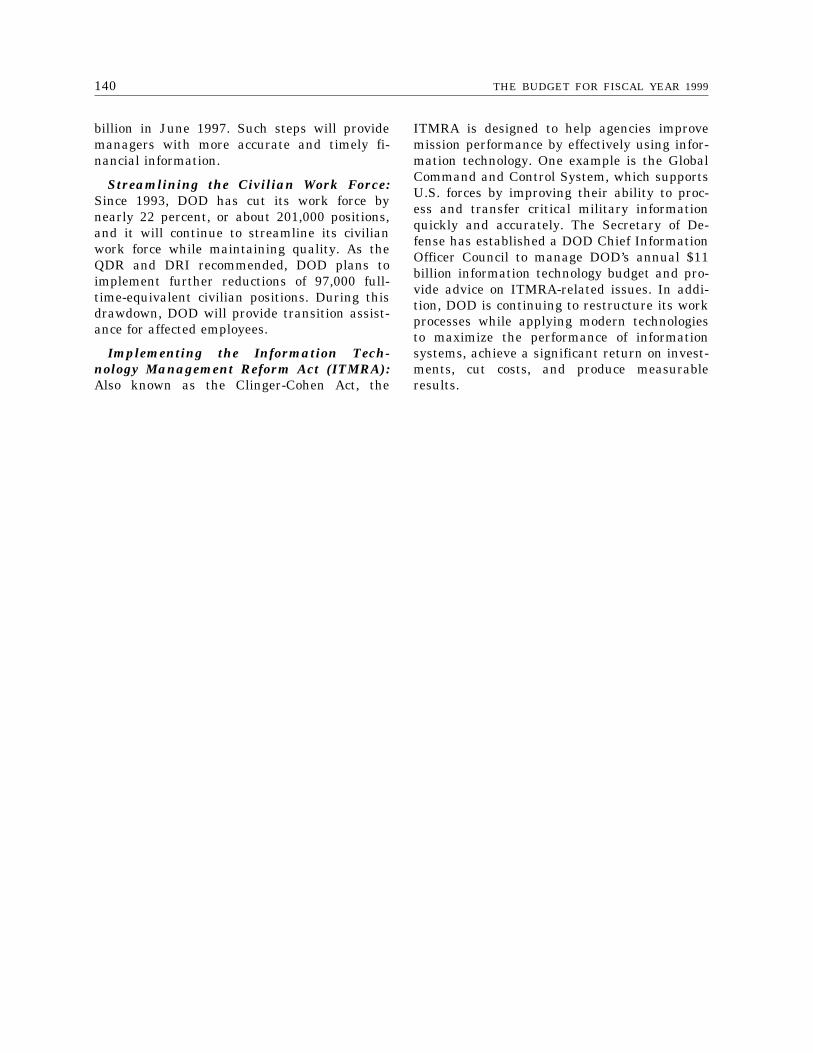
140 THE BUDGET FOR FISCAL YEAR 1999
billion in June 1997. Such steps will providemanagers with more accurate and timely fi-nancial information.
Streamlining the Civilian Work Force:Since 1993, DOD has cut its work force bynearly 22 percent, or about 201,000 positions,and it will continue to streamline its civilianwork force while maintaining quality. As theQDR and DRI recommended, DOD plans toimplement further reductions of 97,000 full-time-equivalent civilian positions. During thisdrawdown, DOD will provide transition assist-ance for affected employees.
Implementing the Information Tech-nology Management Reform Act (ITMRA):Also known as the Clinger-Cohen Act, the
ITMRA is designed to help agencies improvemission performance by effectively using infor-mation technology. One example is the GlobalCommand and Control System, which supportsU.S. forces by improving their ability to proc-ess and transfer critical military informationquickly and accurately. The Secretary of De-fense has established a DOD Chief InformationOfficer Council to manage DOD’s annual $11billion information technology budget and pro-vide advice on ITMRA-related issues. In addi-tion, DOD is continuing to restructure its workprocesses while applying modern technologiesto maximize the performance of informationsystems, achieve a significant return on invest-ments, cut costs, and produce measurableresults.
141
VI. INVESTING IN THE COMMONGOOD: PROGRAM PERFORMANCE
IN FEDERAL FUNCTIONS

143
11. OVERVIEWThe commitment of the President and Con-
gress to balance the budget—and keep itin balance—means that, if all Federal pro-grams want to continue receiving funds, theywill have to distinguish themselves by dem-onstrating good, measurable performance. Pol-icy makers will have to allocate resourcesto programs that can prove they are well-run and can successfully produce results.
The Administration’s focus on results isnot new. As the Administration said inlast year’s budget:
Led by Vice President Gore’s National Perform-ance Review, the Administration has made realprogress in creating a Government that, in thewords of the NPR, ‘‘works better and costs less.’’We have eliminated layers of bureaucracy, cut pa-perwork burdens, scrapped thousands of pages ofregulations and, most important, improved serviceto Government’s customers—the American people.
The President’s commitment to better per-formance was a key reason that he activelysupported, and eagerly signed, the 1993 Gov-ernment Performance and Results Act (GPRA).In this budget, the Administration highlightsthree aspects of performance:
• Fiscal performance (see Section III, ‘‘Cre-ating a Bright Economic Future’’);
• Management performance (see Section IV,‘‘Improving Performance Through BetterManagement’’); and
• Program performance, which is containedin this section.
Together, these sections constitute whatGPRA contemplated—the Nation’s first com-prehensive, Government-wide PerformancePlan.
The performance of Government programsis inextricably linked to the fiscal and eco-
nomic environment and the managementframework in which they operate. The Presi-dent’s commitment to not only balance thebudget but to invest in the future whileimproving public management—to do morewith less—has prompted the Administrationto maintain or expand programs that dem-onstrate good performance.
Often, experts look at performance onlyacross single organizational units, such asdepartments or agencies. In this section,the budget categorizes activities accordingto budget ‘‘functions’’ in order to group similarprograms together and begin to present therelationship between their goals. This year,for the first time, the Administration reliedheavily on key performance measures andannual performance goals that were drawnfrom agency Annual Performance Plans. Theywere first articulated in the context of thelong-term goals and objectives in the StrategicPlans that agencies submitted to OMB andto Congress in September 1997.
In preparing this budget, the Administrationstudied the measures and goals of the AnnualPerformance Plans and took a hard lookat what the public is getting for what itis financing. Thus, the Administration hasmade a good start on the process thatGPRA envisioned. Nevertheless, more workremains. Agencies will modify Annual Per-formance Plans to reflect changing circum-stances and resource levels, the plans willprovide a backdrop for further discussionabout allocating resources, and the President’sfuture budgets will contain new and betterinformation.
The Administration looks forward to workingwith Congress and other stakeholders touse these tools to create better performance.
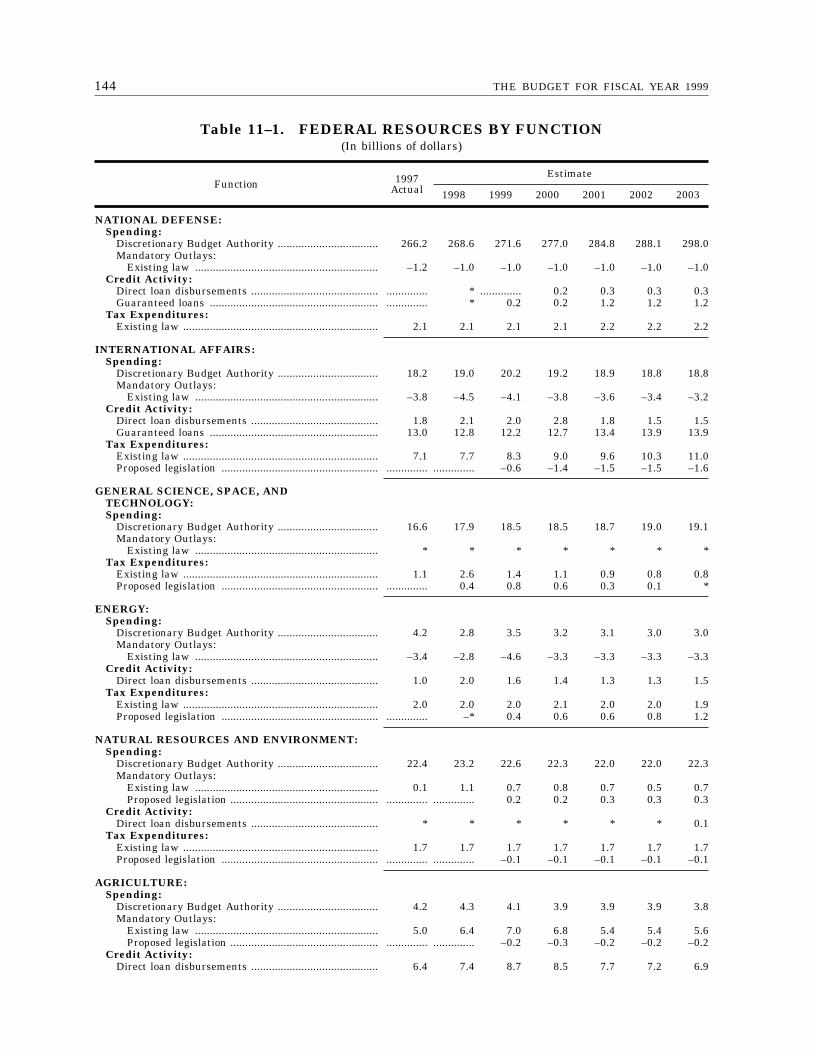
144 THE BUDGET FOR FISCAL YEAR 1999
Table 11–1. FEDERAL RESOURCES BY FUNCTION(In billions of dollars)
Function 1997Actual
Estimate
1998 1999 2000 2001 2002 2003
NATIONAL DEFENSE:Spending:
Discretionary Budget Authority .................................. 266.2 268.6 271.6 277.0 284.8 288.1 298.0Mandatory Outlays:
Existing law .............................................................. –1.2 –1.0 –1.0 –1.0 –1.0 –1.0 –1.0Credit Activity:
Direct loan disbursements ........................................... .............. * .............. 0.2 0.3 0.3 0.3Guaranteed loans ......................................................... .............. * 0.2 0.2 1.2 1.2 1.2
Tax Expenditures:Existing law .................................................................. 2.1 2.1 2.1 2.1 2.2 2.2 2.2
INTERNATIONAL AFFAIRS:Spending:
Discretionary Budget Authority .................................. 18.2 19.0 20.2 19.2 18.9 18.8 18.8Mandatory Outlays:
Existing law .............................................................. –3.8 –4.5 –4.1 –3.8 –3.6 –3.4 –3.2Credit Activity:
Direct loan disbursements ........................................... 1.8 2.1 2.0 2.8 1.8 1.5 1.5Guaranteed loans ......................................................... 13.0 12.8 12.2 12.7 13.4 13.9 13.9
Tax Expenditures:Existing law .................................................................. 7.1 7.7 8.3 9.0 9.6 10.3 11.0Proposed legislation ..................................................... .............. .............. –0.6 –1.4 –1.5 –1.5 –1.6
GENERAL SCIENCE, SPACE, ANDTECHNOLOGY:Spending:
Discretionary Budget Authority .................................. 16.6 17.9 18.5 18.5 18.7 19.0 19.1Mandatory Outlays:
Existing law .............................................................. * * * * * * *Tax Expenditures:
Existing law .................................................................. 1.1 2.6 1.4 1.1 0.9 0.8 0.8Proposed legislation ..................................................... .............. 0.4 0.8 0.6 0.3 0.1 *
ENERGY:Spending:
Discretionary Budget Authority .................................. 4.2 2.8 3.5 3.2 3.1 3.0 3.0Mandatory Outlays:
Existing law .............................................................. –3.4 –2.8 –4.6 –3.3 –3.3 –3.3 –3.3Credit Activity:
Direct loan disbursements ........................................... 1.0 2.0 1.6 1.4 1.3 1.3 1.5Tax Expenditures:
Existing law .................................................................. 2.0 2.0 2.0 2.1 2.0 2.0 1.9Proposed legislation ..................................................... .............. –* 0.4 0.6 0.6 0.8 1.2
NATURAL RESOURCES AND ENVIRONMENT:Spending:
Discretionary Budget Authority .................................. 22.4 23.2 22.6 22.3 22.0 22.0 22.3Mandatory Outlays:
Existing law .............................................................. 0.1 1.1 0.7 0.8 0.7 0.5 0.7Proposed legislation .................................................. .............. .............. 0.2 0.2 0.3 0.3 0.3
Credit Activity:Direct loan disbursements ........................................... * * * * * * 0.1
Tax Expenditures:Existing law .................................................................. 1.7 1.7 1.7 1.7 1.7 1.7 1.7Proposed legislation ..................................................... .............. .............. –0.1 –0.1 –0.1 –0.1 –0.1
AGRICULTURE:Spending:
Discretionary Budget Authority .................................. 4.2 4.3 4.1 3.9 3.9 3.9 3.8Mandatory Outlays:
Existing law .............................................................. 5.0 6.4 7.0 6.8 5.4 5.4 5.6Proposed legislation .................................................. .............. .............. –0.2 –0.3 –0.2 –0.2 –0.2
Credit Activity:Direct loan disbursements ........................................... 6.4 7.4 8.7 8.5 7.7 7.2 6.9
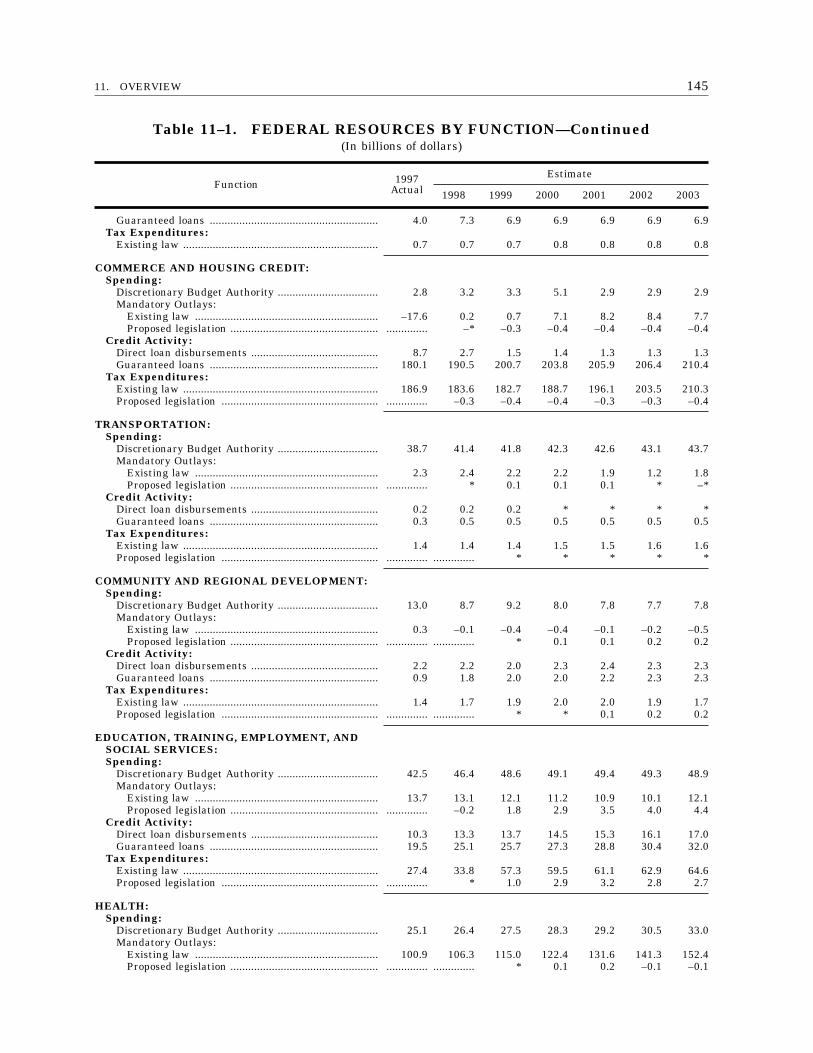
14511. OVERVIEW
Table 11–1. FEDERAL RESOURCES BY FUNCTION—Continued(In billions of dollars)
Function 1997Actual
Estimate
1998 1999 2000 2001 2002 2003
Guaranteed loans ......................................................... 4.0 7.3 6.9 6.9 6.9 6.9 6.9Tax Expenditures:
Existing law .................................................................. 0.7 0.7 0.7 0.8 0.8 0.8 0.8
COMMERCE AND HOUSING CREDIT:Spending:
Discretionary Budget Authority .................................. 2.8 3.2 3.3 5.1 2.9 2.9 2.9Mandatory Outlays:
Existing law .............................................................. –17.6 0.2 0.7 7.1 8.2 8.4 7.7Proposed legislation .................................................. .............. –* –0.3 –0.4 –0.4 –0.4 –0.4
Credit Activity:Direct loan disbursements ........................................... 8.7 2.7 1.5 1.4 1.3 1.3 1.3Guaranteed loans ......................................................... 180.1 190.5 200.7 203.8 205.9 206.4 210.4
Tax Expenditures:Existing law .................................................................. 186.9 183.6 182.7 188.7 196.1 203.5 210.3Proposed legislation ..................................................... .............. –0.3 –0.4 –0.4 –0.3 –0.3 –0.4
TRANSPORTATION:Spending:
Discretionary Budget Authority .................................. 38.7 41.4 41.8 42.3 42.6 43.1 43.7Mandatory Outlays:
Existing law .............................................................. 2.3 2.4 2.2 2.2 1.9 1.2 1.8Proposed legislation .................................................. .............. * 0.1 0.1 0.1 * –*
Credit Activity:Direct loan disbursements ........................................... 0.2 0.2 0.2 * * * *Guaranteed loans ......................................................... 0.3 0.5 0.5 0.5 0.5 0.5 0.5
Tax Expenditures:Existing law .................................................................. 1.4 1.4 1.4 1.5 1.5 1.6 1.6Proposed legislation ..................................................... .............. .............. * * * * *
COMMUNITY AND REGIONAL DEVELOPMENT:Spending:
Discretionary Budget Authority .................................. 13.0 8.7 9.2 8.0 7.8 7.7 7.8Mandatory Outlays:
Existing law .............................................................. 0.3 –0.1 –0.4 –0.4 –0.1 –0.2 –0.5Proposed legislation .................................................. .............. .............. * 0.1 0.1 0.2 0.2
Credit Activity:Direct loan disbursements ........................................... 2.2 2.2 2.0 2.3 2.4 2.3 2.3Guaranteed loans ......................................................... 0.9 1.8 2.0 2.0 2.2 2.3 2.3
Tax Expenditures:Existing law .................................................................. 1.4 1.7 1.9 2.0 2.0 1.9 1.7Proposed legislation ..................................................... .............. .............. * * 0.1 0.2 0.2
EDUCATION, TRAINING, EMPLOYMENT, ANDSOCIAL SERVICES:Spending:
Discretionary Budget Authority .................................. 42.5 46.4 48.6 49.1 49.4 49.3 48.9Mandatory Outlays:
Existing law .............................................................. 13.7 13.1 12.1 11.2 10.9 10.1 12.1Proposed legislation .................................................. .............. –0.2 1.8 2.9 3.5 4.0 4.4
Credit Activity:Direct loan disbursements ........................................... 10.3 13.3 13.7 14.5 15.3 16.1 17.0Guaranteed loans ......................................................... 19.5 25.1 25.7 27.3 28.8 30.4 32.0
Tax Expenditures:Existing law .................................................................. 27.4 33.8 57.3 59.5 61.1 62.9 64.6Proposed legislation ..................................................... .............. * 1.0 2.9 3.2 2.8 2.7
HEALTH:Spending:
Discretionary Budget Authority .................................. 25.1 26.4 27.5 28.3 29.2 30.5 33.0Mandatory Outlays:
Existing law .............................................................. 100.9 106.3 115.0 122.4 131.6 141.3 152.4Proposed legislation .................................................. .............. .............. * 0.1 0.2 –0.1 –0.1
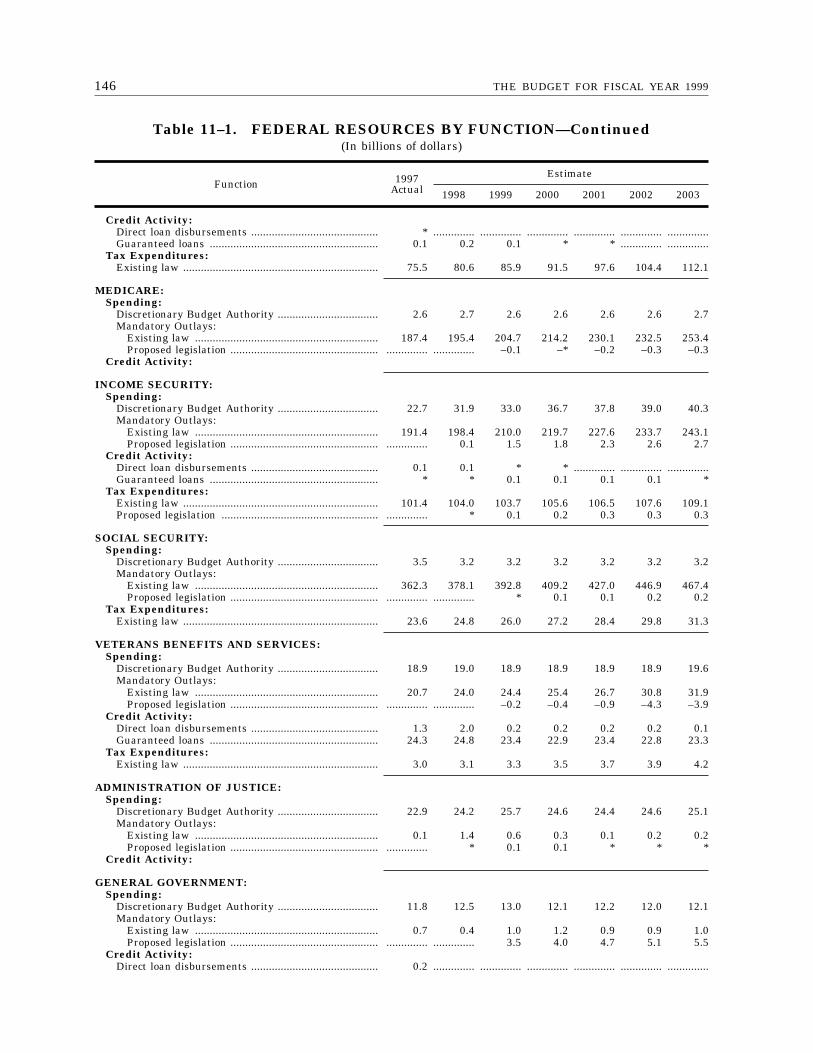
146 THE BUDGET FOR FISCAL YEAR 1999
Table 11–1. FEDERAL RESOURCES BY FUNCTION—Continued(In billions of dollars)
Function 1997Actual
Estimate
1998 1999 2000 2001 2002 2003
Credit Activity:Direct loan disbursements ........................................... * .............. .............. .............. .............. .............. ..............Guaranteed loans ......................................................... 0.1 0.2 0.1 * * .............. ..............
Tax Expenditures:Existing law .................................................................. 75.5 80.6 85.9 91.5 97.6 104.4 112.1
MEDICARE:Spending:
Discretionary Budget Authority .................................. 2.6 2.7 2.6 2.6 2.6 2.6 2.7Mandatory Outlays:
Existing law .............................................................. 187.4 195.4 204.7 214.2 230.1 232.5 253.4Proposed legislation .................................................. .............. .............. –0.1 –* –0.2 –0.3 –0.3
Credit Activity:
INCOME SECURITY:Spending:
Discretionary Budget Authority .................................. 22.7 31.9 33.0 36.7 37.8 39.0 40.3Mandatory Outlays:
Existing law .............................................................. 191.4 198.4 210.0 219.7 227.6 233.7 243.1Proposed legislation .................................................. .............. 0.1 1.5 1.8 2.3 2.6 2.7
Credit Activity:Direct loan disbursements ........................................... 0.1 0.1 * * .............. .............. ..............Guaranteed loans ......................................................... * * 0.1 0.1 0.1 0.1 *
Tax Expenditures:Existing law .................................................................. 101.4 104.0 103.7 105.6 106.5 107.6 109.1Proposed legislation ..................................................... .............. * 0.1 0.2 0.3 0.3 0.3
SOCIAL SECURITY:Spending:
Discretionary Budget Authority .................................. 3.5 3.2 3.2 3.2 3.2 3.2 3.2Mandatory Outlays:
Existing law .............................................................. 362.3 378.1 392.8 409.2 427.0 446.9 467.4Proposed legislation .................................................. .............. .............. * 0.1 0.1 0.2 0.2
Tax Expenditures:Existing law .................................................................. 23.6 24.8 26.0 27.2 28.4 29.8 31.3
VETERANS BENEFITS AND SERVICES:Spending:
Discretionary Budget Authority .................................. 18.9 19.0 18.9 18.9 18.9 18.9 19.6Mandatory Outlays:
Existing law .............................................................. 20.7 24.0 24.4 25.4 26.7 30.8 31.9Proposed legislation .................................................. .............. .............. –0.2 –0.4 –0.9 –4.3 –3.9
Credit Activity:Direct loan disbursements ........................................... 1.3 2.0 0.2 0.2 0.2 0.2 0.1Guaranteed loans ......................................................... 24.3 24.8 23.4 22.9 23.4 22.8 23.3
Tax Expenditures:Existing law .................................................................. 3.0 3.1 3.3 3.5 3.7 3.9 4.2
ADMINISTRATION OF JUSTICE:Spending:
Discretionary Budget Authority .................................. 22.9 24.2 25.7 24.6 24.4 24.6 25.1Mandatory Outlays:
Existing law .............................................................. 0.1 1.4 0.6 0.3 0.1 0.2 0.2Proposed legislation .................................................. .............. * 0.1 0.1 * * *
Credit Activity:
GENERAL GOVERNMENT:Spending:
Discretionary Budget Authority .................................. 11.8 12.5 13.0 12.1 12.2 12.0 12.1Mandatory Outlays:
Existing law .............................................................. 0.7 0.4 1.0 1.2 0.9 0.9 1.0Proposed legislation .................................................. .............. .............. 3.5 4.0 4.7 5.1 5.5
Credit Activity:Direct loan disbursements ........................................... 0.2 .............. .............. .............. .............. .............. ..............
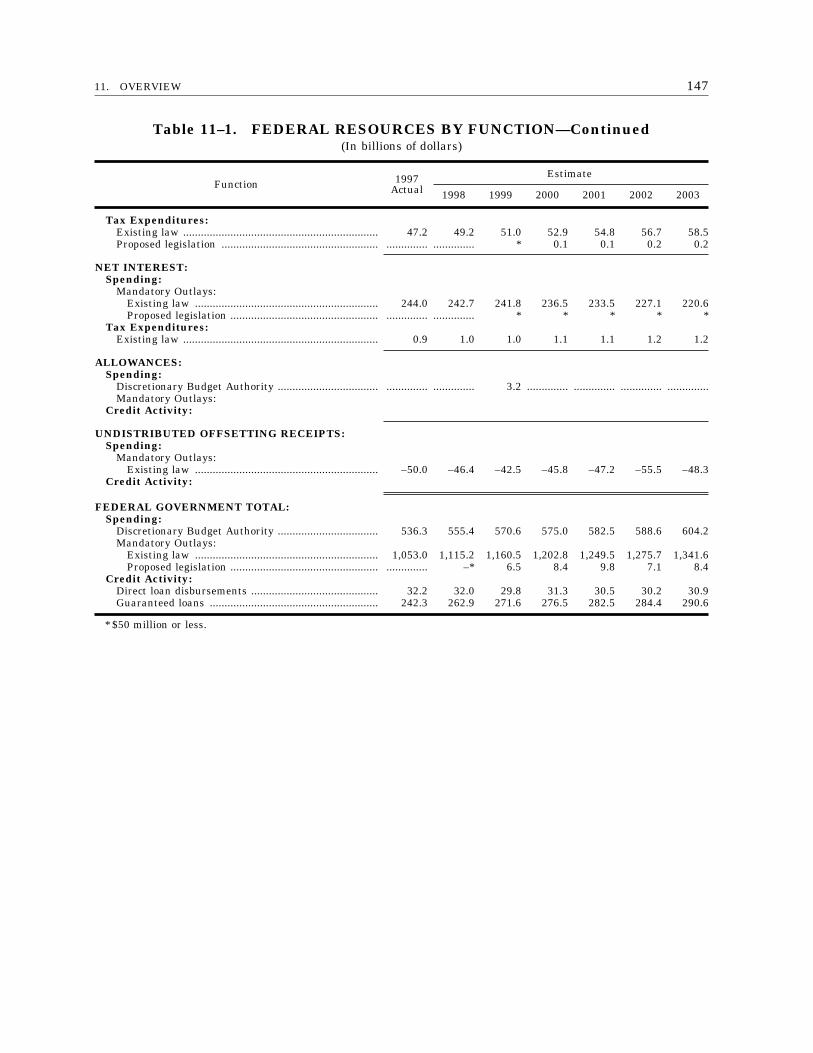
14711. OVERVIEW
Table 11–1. FEDERAL RESOURCES BY FUNCTION—Continued(In billions of dollars)
Function 1997Actual
Estimate
1998 1999 2000 2001 2002 2003
Tax Expenditures:Existing law .................................................................. 47.2 49.2 51.0 52.9 54.8 56.7 58.5Proposed legislation ..................................................... .............. .............. * 0.1 0.1 0.2 0.2
NET INTEREST:Spending:
Mandatory Outlays:Existing law .............................................................. 244.0 242.7 241.8 236.5 233.5 227.1 220.6Proposed legislation .................................................. .............. .............. * * * * *
Tax Expenditures:Existing law .................................................................. 0.9 1.0 1.0 1.1 1.1 1.2 1.2
ALLOWANCES:Spending:
Discretionary Budget Authority .................................. .............. .............. 3.2 .............. .............. .............. ..............Mandatory Outlays:
Credit Activity:
UNDISTRIBUTED OFFSETTING RECEIPTS:Spending:
Mandatory Outlays:Existing law .............................................................. –50.0 –46.4 –42.5 –45.8 –47.2 –55.5 –48.3
Credit Activity:
FEDERAL GOVERNMENT TOTAL:Spending:
Discretionary Budget Authority .................................. 536.3 555.4 570.6 575.0 582.5 588.6 604.2Mandatory Outlays:
Existing law .............................................................. 1,053.0 1,115.2 1,160.5 1,202.8 1,249.5 1,275.7 1,341.6Proposed legislation .................................................. .............. –* 6.5 8.4 9.8 7.1 8.4
Credit Activity:Direct loan disbursements ........................................... 32.2 32.0 29.8 31.3 30.5 30.2 30.9Guaranteed loans ......................................................... 242.3 262.9 271.6 276.5 282.5 284.4 290.6
* $50 million or less.

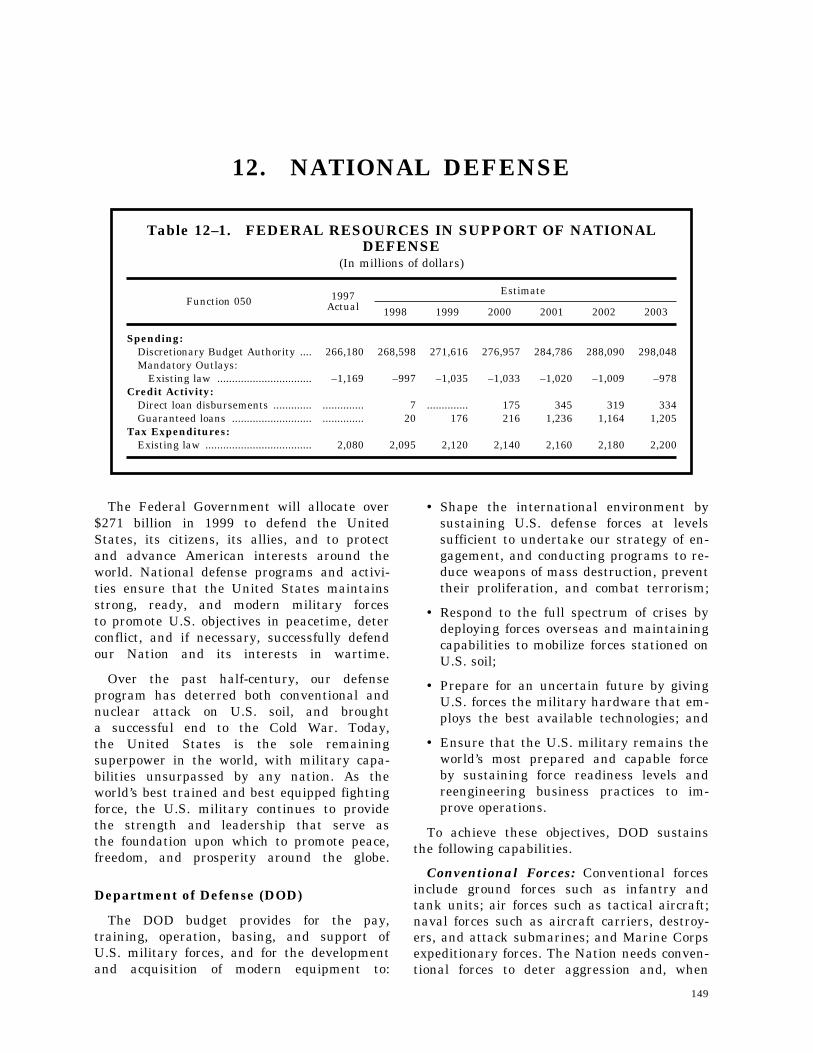
149
12. NATIONAL DEFENSE
Table 12–1. FEDERAL RESOURCES IN SUPPORT OF NATIONALDEFENSE
(In millions of dollars)
Function 050 1997Actual
Estimate
1998 1999 2000 2001 2002 2003
Spending:Discretionary Budget Authority .... 266,180 268,598 271,616 276,957 284,786 288,090 298,048Mandatory Outlays:
Existing law ................................ –1,169 –997 –1,035 –1,033 –1,020 –1,009 –978Credit Activity:
Direct loan disbursements ............. .............. 7 .............. 175 345 319 334Guaranteed loans ........................... .............. 20 176 216 1,236 1,164 1,205
Tax Expenditures:Existing law .................................... 2,080 2,095 2,120 2,140 2,160 2,180 2,200
The Federal Government will allocate over$271 billion in 1999 to defend the UnitedStates, its citizens, its allies, and to protectand advance American interests around theworld. National defense programs and activi-ties ensure that the United States maintainsstrong, ready, and modern military forcesto promote U.S. objectives in peacetime, deterconflict, and if necessary, successfully defendour Nation and its interests in wartime.
Over the past half-century, our defenseprogram has deterred both conventional andnuclear attack on U.S. soil, and broughta successful end to the Cold War. Today,the United States is the sole remainingsuperpower in the world, with military capa-bilities unsurpassed by any nation. As theworld’s best trained and best equipped fightingforce, the U.S. military continues to providethe strength and leadership that serve asthe foundation upon which to promote peace,freedom, and prosperity around the globe.
Department of Defense (DOD)
The DOD budget provides for the pay,training, operation, basing, and support ofU.S. military forces, and for the developmentand acquisition of modern equipment to:
• Shape the international environment bysustaining U.S. defense forces at levelssufficient to undertake our strategy of en-gagement, and conducting programs to re-duce weapons of mass destruction, preventtheir proliferation, and combat terrorism;
• Respond to the full spectrum of crises bydeploying forces overseas and maintainingcapabilities to mobilize forces stationed onU.S. soil;
• Prepare for an uncertain future by givingU.S. forces the military hardware that em-ploys the best available technologies; and
• Ensure that the U.S. military remains theworld’s most prepared and capable forceby sustaining force readiness levels andreengineering business practices to im-prove operations.
To achieve these objectives, DOD sustainsthe following capabilities.
Conventional Forces: Conventional forcesinclude ground forces such as infantry andtank units; air forces such as tactical aircraft;naval forces such as aircraft carriers, destroy-ers, and attack submarines; and Marine Corpsexpeditionary forces. The Nation needs conven-tional forces to deter aggression and, when
150 THE BUDGET FOR FISCAL YEAR 1999
that fails, to defeat it. Funds to support theseforces cover pay and benefits for military per-sonnel; the purchase, operation, and mainte-nance of conventional systems such as tanks,aircraft, and ships; the purchase of ammuni-tion and spare parts; and training.
Mobility Forces: Mobility forces provide theairlift and sealift that transport military per-sonnel and materiel throughout the world.They play a critical role in U.S. defense strat-egy and are a vital part of America’s responseto contingencies that range from humanitarianrelief efforts to major theater wars. Airlift air-craft provide a flexible, rapid way to deployforces and supplies quickly to distant regions,while sealift ships allow the deployment oflarge numbers of heavy forces together withtheir fuel and supplies. The mobility programalso includes prepositioning equipment andsupplies at sea or on land near the locationof a potential crisis, allowing U.S. forces thatmust respond rapidly to crises overseas toquickly draw upon these prepositioned items.
Strategic Nuclear Forces: Strategic nu-clear forces are also important to our militarycapability. They include land-based interconti-nental ballistic missiles, submarine launchedballistic missiles, and long-range strategicbombers. Within treaty-imposed limits, the pri-mary mission of strategic forces is to deternuclear attack against the United States andits allies, and to convince potential adversariesthat they will never gain a nuclear advantageagainst our Nation.
Supporting Activities: Supporting activi-ties include research and development, com-munications, intelligence, training and medicalservices, central supply and maintenance, andother logistics activities. In particular, the De-fense Health Program provides health carethrough DOD facilities as well as through theCHAMPUS medical insurance program andTRICARE—its companion program.
DOD Performance
DOD has identified broad objectives andkey performance indicators and quantitativemeasures that will determine whether itis achieving its major goals.
Shaping the International Environment:DOD’s first goal is to shape the international
environment by participating in internationalsecurity organizations, such as NATO, and im-proving our ability to work cooperatively withour friends and allies. Such efforts are de-signed to promote regional stability and secu-rity, and reduce the threat of war. Their fail-ure could lead to a major conflict affecting U.S.interests.
Evaluating DOD’s performance in this areaincludes an assessment of:
• The ability of U.S. forces to enhance andsustain security relationships with friendsand allies, enhance coalition warfighting,promote regional stability and supportU.S. regional security objectives, deter ag-gression, and prevent or reduce the threatof conflict. For example, in 1999, the Unit-ed States and Russia will conduct oneJoint Theater Ballistic Missile Defensecommand post exercise.
• DOD’s success in implementing threat re-duction programs and arms control agree-ments, including inspection, verification,and monitoring programs.
• DOD’s achievement of the force structureobjectives of the Quadrennial Defense Re-view (QDR).
Responding to the Full Spectrum of Cri-ses: DOD must be able to respond to the fullspectrum of crises, from small-scale contin-gencies to two nearly simultaneous major thea-ter wars.
In 1999, DOD and the relevant serviceswill meet the following performance goals:
• The Air Force will maintain 20 Air ForceFighter wing equivalents, four air defensesquadrons, 89 strategic bombers, and 550intercontinental ballistic missiles.
• The Navy will maintain 11 aircraft wingsand 314 battle force ships, including 12aircraft carriers and 18 ballistic-missilesubmarines.
• The Army will maintain four active corpsheadquarters, 18 active and NationalGuard divisions, two active armored cav-alry regiments, and 15 National Guard en-hanced readiness brigades.
• The Marine Corps will maintain three ac-tive and one reserve divisions, three active
15112. NATIONAL DEFENSE
and one reserve wings, and three activeand one reserve force service supportgroups.
Overseas presence, mobility, and the sus-taining of a capable force structure are allkey to DOD’s ability to respond effectivelyto crises. DOD’s effectiveness will be deter-mined, in part, by the ability of U.S. forces‘‘forward deployed’’ (that is, on site aroundthe world) and those deploying from U.S.bases to rapidly converge at the scene ofa potential conflict to deter hostilities andprotect U.S. citizens and interests in timesof crisis.
• In the Pacific, DOD will deploy one Armydivision, one Marine expeditionary force,two Air Force fighter wing equivalents,one Navy carrier battle group, and oneamphibious ready group with an embarkedMarine expeditionary unit.
• In Europe, DOD will maintain one Armyarmor division and one Army mechanizedinfantry division, two Air Force fighterwing equivalents, one carrier battle group,and one amphibious ready group with anembarked Marine expeditionary unit.
• In Southwest Asia, DOD will deploy atleast one Air Force fighter wing equiva-lent, one carrier battle group, and one am-phibious ready group with an embarkedMarine expeditionary unit, in addition tomateriel prepositioned in the region.
The amount of sealift and airlift capacitymust be sufficient to meet deploymenttimelines for deterring and defeating large-scale, cross-border aggression in two distanttheaters in overlapping time frames, andto sustain U.S. forces engaged in two majortheater wars.
• In 1999, DOD will attain an organic stra-tegic airlift capability of 26.5 million tonmiles a day and will attain a surge sealiftcapacity of 7.8 million square feet.
Preparing Now for an Uncertain Future:U.S. forces must maintain a qualitative superi-ority over potential adversaries by pursuinga focused procurement and research and devel-opment program. Achieving this goal dependson ensuring that:
• DOD will acquire modern and capableweapon systems and will deliver them toU.S. forces in 25 percent less time, whileensuring that costs do not grow more thanone percent a year by the year 2000 andmeeting required performance specifica-tions.
Remaining the World’s Most Ready andCapable Force: Attaining this goal dependson four elements: ensuring the readiness ofmilitary units; retaining and recruiting high-quality personnel; strengthening and enhanc-ing quality of life programs for military mem-bers and their families; and providing equalopportunity throughout the armed services.
DOD has identified specific milestones tomeasure progress in each area, such asthe amount of training that individual unitsaccomplish, the availability and operabilityof equipment, and the achievement of recruit-ing and retention goals.
• Several factors determine overall unitreadiness, such as training, quality andavailability of equipment, and number ofpersonnel and, in 1999, DOD will ensurethat all of its units meet their specifiedreadiness goals.
• On average, the Army will attain 800 tankmiles a year; the Air Force will achieve20 flying hours per crew a month; the Ma-rine Corps will fully execute its missiontraining syllabus; and the Navy will exe-cute 50.5 deployed and 28 non-deployedship steaming days per quarter.
In 1999, DOD also will:
• Recruit 191,300 new members of thearmed services, obtain 60 percent of re-cruits from the top half of those testedfor service, and achieve a 50 percent en-listed retention rate after the first term.
• Achieve all of its projected targets for itscivilian work force reductions.
Exploiting the Revolution in Military Af-fairs: DOD will follow the strategy of JointVision 2010, developed by the Chairman of theJoint Chiefs of Staff, to transform U.S. forcesfor the future, and it will exploit emerging in-formation technologies to reshape the way itfights and prepares for war.
152 THE BUDGET FOR FISCAL YEAR 1999
Reengineering DOD’s Infrastructure:DOD must develop new, innovative approachesto manage and reduce infrastructure costs.Following the end of the Cold War, the UnitedStates began a major reduction of its militaryforces. DOD’s cuts in infrastructure costs, how-ever, have not kept pace. To make furthercuts, DOD plans to adopt innovative manage-ment techniques and technological practices.In addition, DOD will submit legislation toCongress proposing two more rounds of baseclosures and realignments in 2001 and 2005.
DOD has identified specific goals aroundwhich to focus the reform of business affairs.
By 1999, DOD will:
• Produce a Facility Strategic Plan to guidethe acquisition, operation, maintenance,repair, renovation, and replacement of itsphysical plant.
By 2000, DOD will:
• Ensure that U.S. forces can achieve visi-bility of 90 percent of DOD materiel as-sets, while resupplying military peace-keepers and warfighters and reducing the1997 average order-to-receipt time by half.
• Dispose of $2.2 billion in excess NationalDefense Stockpile inventories and $3 bil-lion in unneeded Government personalproperty, while reducing supply inventoryby $12 billion.
• Simplify purchasing and payment by usingpurchase card transactions for 90 percentof all DOD micropurchases, while re-engineering the requisitioning, funding,and ordering processes.
• Create a world-class learning organizationby offering 40 or more hours a year ofcontinuing education and training toDOD’s acquisition-related work force.
• Complete the disposal of half of the sur-plus real property, while privatizing30,000 housing units.
• Cut paper acquisition transactions by halffrom 1997 levels through electronic com-merce and electronic data interchange.
• Eliminate layers of management bystreamlining processes, while cutting
DOD’s acquisition-related work force by 15percent.
Department of Energy (DOE)Performance
DOE contributes to our national securitymainly by reducing the global danger fromnuclear weapons and other weapons of massdestruction. DOE is committed to maintainingconfidence in the nuclear weapons stockpilewithout testing, as required under the Com-prehensive Test Ban Treaty; to strengthenthe nuclear nonproliferation regime; to workwith states of the former Soviet Union toimprove control of nuclear materials; to de-velop improved technologies to detect, identify,and respond to the proliferation of weaponsof mass destruction and illicit materials traf-ficking; and to aggressively clean up theenvironmental legacy of nuclear weapons pro-grams.
The budget proposes $12.1 billion to meetDOE’s national security objectives, of which$6.1 billion is for ongoing national securitymissions to support DOD and other agencies.
DOE will achieve the following performancegoals:
• Maintain and refurbish specific warheadsin 1999, and certify that standards forsafety, reliability, and performance of thenuclear weapons stockpile are met.
• Develop advanced simulation, modeling,and experimentation technologies to re-place underground testing by 2004, includ-ing installing a computer system capableof three trillion operations per second in1999.
• Dismantle about 500 nuclear weapons.
• Jointly, with Russia, test and demonstratetechnologies to dispose of surplus weaponsplutonium and begin to develop a pilotscale plutonium conversion system in Rus-sia, design a full-scale pit disassembly andconversion facility, and procure mixed-oxide irradiation services in the UnitedStates.
• Complete 85 percent of the developmentof the next generation nuclear reactorplant for the Navy’s new attack sub-marine.
15312. NATIONAL DEFENSE
The remaining $6 billion of DOE’s nationalsecurity funding addresses the environmentallegacy of nuclear weapons activities.
DOE will meet the following performancegoals:
• Reduce the number of geographical sitesrequiring high-risk environmental cleanupfrom 87 to 42 by the end of 1999.
• Close one high-level waste storage tankat the Savannah River site; and
• Stabilize and safely store or dispose of ra-dioactive and hazardous wastes, including37 tons of spent fuel, 134,000 cubic metersof low-level waste, about 150 canisters ofhigh-level waste, 0.3 tons of plutonium atthe Hanford site, and initial shipments oftransuranic wastes at the Waste IsolationPilot Plant, which will be opened for dis-posal in May 1998.
Other Defense-Related Activities
Other activities that support national de-fense and that are implementing performancemeasurement include programs involving the:
• Coast Guard, which supports the defensemission through overseas deployments for
engagements with friends and allies, portsecurity teams, boarding and inspectionteams for enforcing U.N. sanctions, train-ing, aids to navigation, internationalicebraking, equipment maintenance, andsupport of the Coast Guard Reserve;
• Federal Bureau of Investigation, whichconducts counterintelligence and surveil-lance activities;
• Maritime Administration, which helpsmaintain a fleet of active, military useful,privately owned U.S. vessels that wouldbe available in times of national emer-gency;
• Arlington National Cemetery, which is de-veloping an expansion plan for using con-tiguous land sites that will be vacated bythe Army, Navy, and Marine Corps; and
• Selective Service System, which is mod-ernizing its registration process to promotemilitary recruiting among registrants.This spirit of volunteerism will beachieved in partnership with the Ameri-ca’s Promise group, private corporations,and the armed services.
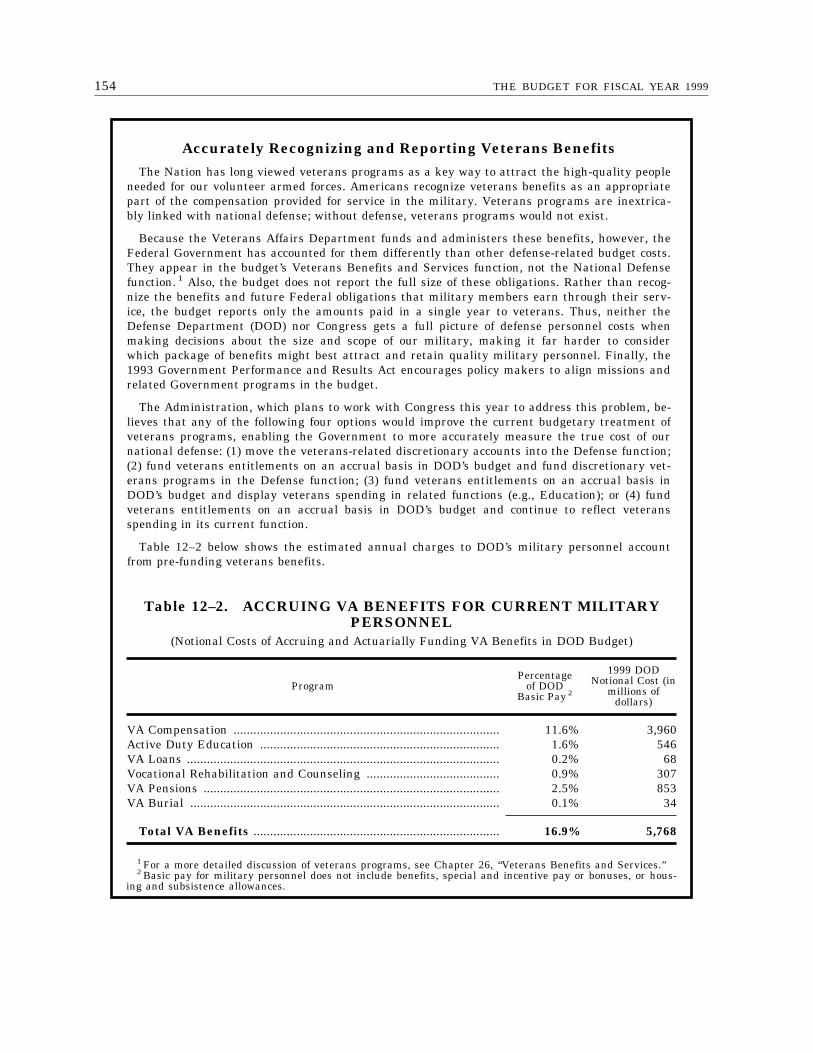
154 THE BUDGET FOR FISCAL YEAR 1999
Accurately Recognizing and Reporting Veterans BenefitsThe Nation has long viewed veterans programs as a key way to attract the high-quality people
needed for our volunteer armed forces. Americans recognize veterans benefits as an appropriatepart of the compensation provided for service in the military. Veterans programs are inextrica-bly linked with national defense; without defense, veterans programs would not exist.
Because the Veterans Affairs Department funds and administers these benefits, however, theFederal Government has accounted for them differently than other defense-related budget costs.They appear in the budget’s Veterans Benefits and Services function, not the National Defensefunction. 1 Also, the budget does not report the full size of these obligations. Rather than recog-nize the benefits and future Federal obligations that military members earn through their serv-ice, the budget reports only the amounts paid in a single year to veterans. Thus, neither theDefense Department (DOD) nor Congress gets a full picture of defense personnel costs whenmaking decisions about the size and scope of our military, making it far harder to considerwhich package of benefits might best attract and retain quality military personnel. Finally, the1993 Government Performance and Results Act encourages policy makers to align missions andrelated Government programs in the budget.
The Administration, which plans to work with Congress this year to address this problem, be-lieves that any of the following four options would improve the current budgetary treatment ofveterans programs, enabling the Government to more accurately measure the true cost of ournational defense: (1) move the veterans-related discretionary accounts into the Defense function;(2) fund veterans entitlements on an accrual basis in DOD’s budget and fund discretionary vet-erans programs in the Defense function; (3) fund veterans entitlements on an accrual basis inDOD’s budget and display veterans spending in related functions (e.g., Education); or (4) fundveterans entitlements on an accrual basis in DOD’s budget and continue to reflect veteransspending in its current function.
Table 12–2 below shows the estimated annual charges to DOD’s military personnel accountfrom pre-funding veterans benefits.
Table 12–2. ACCRUING VA BENEFITS FOR CURRENT MILITARYPERSONNEL
(Notional Costs of Accruing and Actuarially Funding VA Benefits in DOD Budget)
ProgramPercentage
of DODBasic Pay 2
1999 DODNotional Cost (in
millions ofdollars)
VA Compensation ................................................................................ 11.6% 3,960Active Duty Education ........................................................................ 1.6% 546VA Loans .............................................................................................. 0.2% 68Vocational Rehabilitation and Counseling ........................................ 0.9% 307VA Pensions ......................................................................................... 2.5% 853VA Burial ............................................................................................. 0.1% 34
Total VA Benefits .......................................................................... 16.9% 5,768
1 For a more detailed discussion of veterans programs, see Chapter 26, ‘‘Veterans Benefits and Services.’’2 Basic pay for military personnel does not include benefits, special and incentive pay or bonuses, or hous-
ing and subsistence allowances.
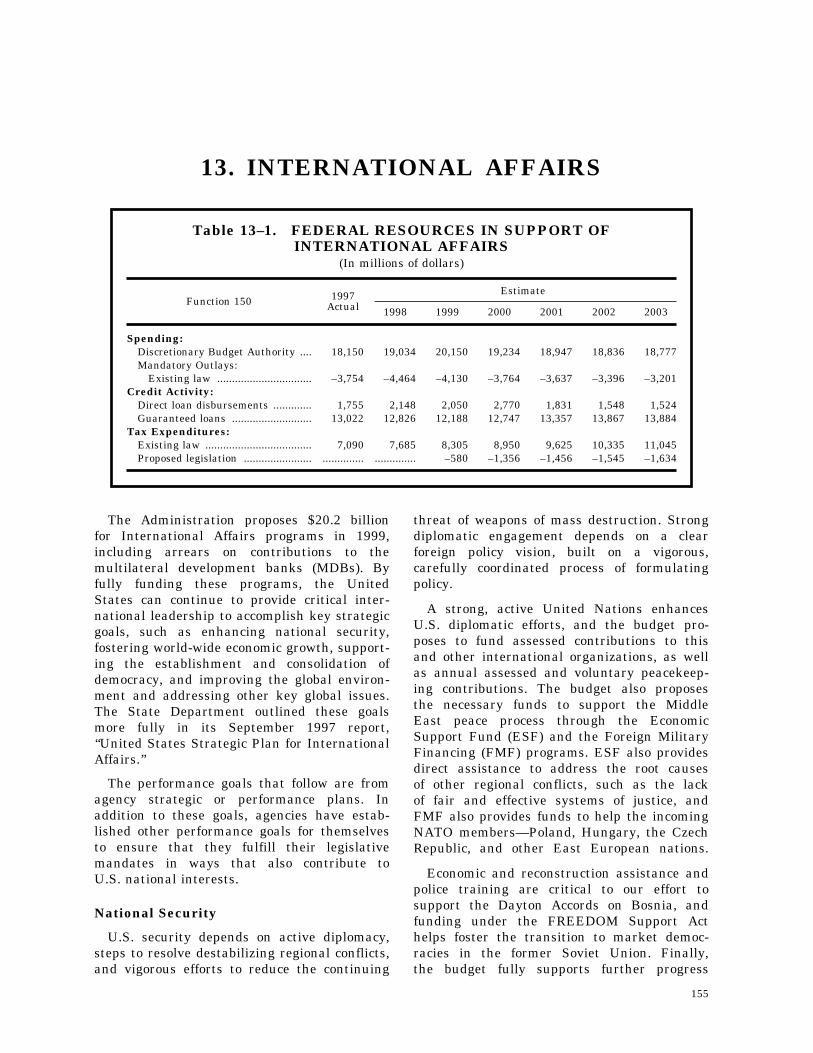
155
13. INTERNATIONAL AFFAIRS
Table 13–1. FEDERAL RESOURCES IN SUPPORT OFINTERNATIONAL AFFAIRS
(In millions of dollars)
Function 150 1997Actual
Estimate
1998 1999 2000 2001 2002 2003
Spending:Discretionary Budget Authority .... 18,150 19,034 20,150 19,234 18,947 18,836 18,777Mandatory Outlays:
Existing law ................................ –3,754 –4,464 –4,130 –3,764 –3,637 –3,396 –3,201Credit Activity:
Direct loan disbursements ............. 1,755 2,148 2,050 2,770 1,831 1,548 1,524Guaranteed loans ........................... 13,022 12,826 12,188 12,747 13,357 13,867 13,884
Tax Expenditures:Existing law .................................... 7,090 7,685 8,305 8,950 9,625 10,335 11,045Proposed legislation ....................... .............. .............. –580 –1,356 –1,456 –1,545 –1,634
The Administration proposes $20.2 billionfor International Affairs programs in 1999,including arrears on contributions to themultilateral development banks (MDBs). Byfully funding these programs, the UnitedStates can continue to provide critical inter-national leadership to accomplish key strategicgoals, such as enhancing national security,fostering world-wide economic growth, support-ing the establishment and consolidation ofdemocracy, and improving the global environ-ment and addressing other key global issues.The State Department outlined these goalsmore fully in its September 1997 report,‘‘United States Strategic Plan for InternationalAffairs.’’
The performance goals that follow are fromagency strategic or performance plans. Inaddition to these goals, agencies have estab-lished other performance goals for themselvesto ensure that they fulfill their legislativemandates in ways that also contribute toU.S. national interests.
National Security
U.S. security depends on active diplomacy,steps to resolve destabilizing regional conflicts,and vigorous efforts to reduce the continuing
threat of weapons of mass destruction. Strongdiplomatic engagement depends on a clearforeign policy vision, built on a vigorous,carefully coordinated process of formulatingpolicy.
A strong, active United Nations enhancesU.S. diplomatic efforts, and the budget pro-poses to fund assessed contributions to thisand other international organizations, as wellas annual assessed and voluntary peacekeep-ing contributions. The budget also proposesthe necessary funds to support the MiddleEast peace process through the EconomicSupport Fund (ESF) and the Foreign MilitaryFinancing (FMF) programs. ESF also providesdirect assistance to address the root causesof other regional conflicts, such as the lackof fair and effective systems of justice, andFMF also provides funds to help the incomingNATO members—Poland, Hungary, the CzechRepublic, and other East European nations.
Economic and reconstruction assistance andpolice training are critical to our effort tosupport the Dayton Accords on Bosnia, andfunding under the FREEDOM Support Acthelps foster the transition to market democ-racies in the former Soviet Union. Finally,the budget fully supports further progress
156 THE BUDGET FOR FISCAL YEAR 1999
on our efforts to control weapons of massdestruction by funding the Arms Controland Disarmament Agency (ACDA) and otherprograms that seek to negotiate cuts in,or the elimination of, such weapons.
Relevant agencies will meet the followingperformance goals in 1999:
• The State Department, in seeking to ad-vance the Middle East peace process, willachieve significant progress towards fulfill-ing the goals of the Oslo Accord.
• The State Department will avert or defuseregional conflicts where critical nationalinterests are at stake through bilateralU.S. assistance and U.N. peacekeeping ac-tivities.
• The State and Defense Departments willensure that the armed forces of NATO’s‘‘candidate countries’’ can operate in afully integrated manner with other NATOforces upon their planned entry intoNATO.
• The State and Defense Departments andthe Agency for International Development(USAID) will achieve significant progresstoward implementing the Dayton Accordsin Bosnia.
• The State Department and USAID willhelp Russia and the other former Sovietrepublics strive to achieve a per capitaGross Domestic Product (GDP) growthrate, a share of GDP generated by the pri-vate sector, and an average of Freedom-House indicators of democratic and politi-cal liberties higher than the comparable1997 levels.
• The State Department and ACDA willachieve full compliance with, and verifica-tion of, treaties regarding weapons of massdestruction and, if necessary, combat sus-pected development programs.
• The State Department will fully certifymission critical systems for year 2000 com-pliance and complete a world-wide up-grade of the information technology infra-structure that supports U.S. embassiesand consulates.
Economic Prosperity
International affairs activities increase U.S.economic prosperity in four ways.
First, the U.S. Trade Representative(USTR), supported by the State Departmentand other agencies, works to reduce barriersto trade in U.S. goods, services, and invest-ments by negotiating new trade liberalizingagreements and strictly enforcing existingagreements.
Second, the Export-Import Bank (Eximbank)and the Trade and Development Agency (TDA)provide grant and credit financing to correctmarket distortions that can put U.S. exportsat a competitive disadvantage, and the budgetprovides a major increase in Eximbank fund-ing to cover increased demand from U.S.exporters. The Overseas Private InvestmentCorporation (OPIC) provides investment insur-ance and financing for development projectswith U.S. trade benefits.
Third, development assistance from theMDBs and USAID, along with debt reduction,help increase economic growth in developingand transitioning countries, creating new mar-kets for U.S. goods and services and reducingthe economic causes of instability in theseregions.
Fourth, the International Monetary Fund(IMF) is instrumental in maintaining theunderlying economic prerequisites for prosper-ity world wide by mitigating the effectsof country and regional financial crises, suchas those recently experienced in Asia, whilehelping individual developing countries tocreate and maintain stable market-orientedeconomies.
Relevant agencies will meet the followingperformance goals in 1999:
• USTR will negotiate cuts in specific, iden-tified barriers to U.S. and global trade,and will effectively enforce internationaltrade agreements.
• The Export-Import Bank will develop newmechanisms to expand the availability offinancing for U.S. exports by pioneeringjoint ventures with the private sector, aswell as innovative financing programs that
15713. INTERNATIONAL AFFAIRS
will increase the Bank’s support for smalland medium-sized exporters.
• OPIC will increase, from 1997 levels, theamount of U.S. investment in developingcountries assisted through OPIC-spon-sored projects.
• TDA will increase, from 1997 levels, theratio of TDA-supported exports to TDA ex-penditures and the percentage of TDAprojects that ultimately yield U.S. exports.
• USAID, through bilateral assistance, andthe Treasury Department, through its con-tributions to the MDBs, will provide as-sistance that helps to increase the real an-nual per capita GDP growth rate from1997 levels in developing countries.
• Treasury will work to provide the IMFwith sufficient resources to address mone-tary crises in Asia and other parts of theworld and reduce the amount of supple-mental U.S. bilateral resources needed toaddress these crises.
American Citizens and U.S. Borders
The State Department, through the U.S.passport office and the network of embassiesand consulates overseas, helps and protectsAmericans who travel and reside abroad—most directly through various consular serv-ices, including citizenship documentation andhelp in emergencies. The Department alsohelps to control how immigrants and foreignvisitors enter and remain in the U.S. byeffectively and fairly administering U.S. immi-gration laws overseas and screening appli-cants, in order to deter illegal immigrationand prevent terrorists, narcotics traffickers,and other criminals from entering the UnitedStates.
The State Department will meet the follow-ing performance goals in 1999:
• Improve U.S. passport security by issuingU.S. passports with a digitized passportphoto.
• Maintain uninterrupted screening capa-bilities to ensure that only qualified appli-cants receive visas for travel to the UnitedStates.
• Complete the world-wide modernization ofconsular systems and meet year 2000 re-quirements, thus ensuring border security.
Law Enforcement
The expansion and rising sophisticationof transnational crime represents a growingthreat to the property and well-being ofU.S. citizens. In particular, the threat ofterrorism and the continued supply of illegaldrugs to the United States represent directthreats to our national security. The budgetfunds the State Department’s diplomatic ef-forts to convince other countries to workcooperatively to address international criminalthreats; it also funds assistance and trainingthat helps other countries combat corruption,terrorism, and illegal narcotics, and providesthe developing countries with economic alter-natives to narcotics cultivation and export.
The State Department, working with theDepartments of Justice, Treasury, and De-fense, will meet the following performancegoals in 1999:
• Increase, from 1997 levels, the number offoreign governments that enact and en-force legislation to combat corruption,money laundering, and other transna-tional criminal activities.
• Reduce, from 1997 levels, the hectares ofcoca and opium poppies being cultivatedin producing countries.
Democracy
Advancing U.S. interests in the post-ColdWar world often requires efforts to supportdemocratic transitions, address human rightsviolations, and promote U.S. democratic val-ues. The budget supports these efforts intwo ways. First, it funds the State Depart-ment’s diplomatic efforts that discourage othernations’ interference with the basic democraticand human rights of their citizens, andit funds direct foreign assistance throughUSAID and other agencies that helps countriesdevelop the institutions and legal structuresfor the transition to democracy. Second, itpromotes democracy by funding exchangesof people and ideas with other countries.The exchange, training, and foreign broadcast-ing programs of the U.S. Information Agency(USIA) seek to spread U.S. democratic values
158 THE BUDGET FOR FISCAL YEAR 1999
throughout the world and ensure that Ameri-cans understand and value the peoples andcultures of other nations.
Relevant agencies will meet the followingperformance goals for 1999:
• The State Department, USAID, and USIAwill provide assistance that lead to the im-provement of Freedom House ratings ofcountries in which the United States isassisting the transition to democracy.
• As a result of State Department diplomacyand direct assistance, the instances ofhuman rights abuses as reported by theState Department in the annual U.S. Re-port on Human Rights will be reducedfrom 1997 levels.
• USIA will increase, from 1997 levels, thesupport for democracy, democratic institu-tions, and human rights in selected coun-tries that participate in USIA programs,as measured through polling.
Humanitarian Response
U.S. values demand that we help alleviatehuman suffering from foreign crises, whetherman-made or natural, even in cases withno direct threat to U.S. security interests.The budget provides the necessary fundsto address and, where possible, try to prevent,humanitarian crises through USAID’s ForeignDisaster Assistance and Transition Initiativesprograms, through the State Department’sMigration and Refugee Assistance program,and through food aid provided under ‘‘PublicLaw 480’’ authorities. Much of this fundingis implemented through U.S. private voluntaryorganizations that provide humanitarian, aswell as development, assistance overseas. Thebudget also funds a significant contributionto the UNICEF program of the United Na-tions, and a significant increase for U.S.bilateral demining efforts to address the grow-ing humanitarian crisis caused by landminesin areas of former conflict.
Relevant agencies will meet the followingperformance goals for 1999:
• USAID, in conjunction with other publicand private donors, will provide humani-tarian assistance that will maintain thenutritional status of children aged five or
under living in regions affected by human-itarian emergencies.
• The State Department will reduce refugeepopulations, from 1997 levels, throughU.S.-sponsored integration, repatriation,and resettlement activities.
• The State Department will increase, from1997 levels, the number of mines detectedand neutralized.
Global Issues
The global problems of environmental deg-radation, population growth, and the spreadof communicable diseases directly affect futureU.S. security and prosperity. As a result,the Nation has targeted significant diplomaticand assistance efforts to address these issues.For example, the State Department’s negotia-tion of the Kyoto global climate changetreaty and USAID’s five-year, $1 billion globalclimate change assistance effort will reducethe threat of this global problem. Full fundingof current commitments and arrears to theGlobal Environment Facility remains criticalto this effort.
Similarly, U.S. leadership, USAID assistanceefforts, and funding of the U.N. PopulationFund are critical to maintain the rate ofincrease in global prosperity, reduce the pres-sures of illegal immigration on the U.S.economy, and help alleviate the causes ofregional conflict. U.S. support, mainly throughUSAID, for bilateral and multilateral activitiesto reduce the global threat of AIDS, malaria,tuberculosis, and other communicable diseasesnot only saves the lives of millions of childrenworld-wide but also reduces the direct threatto the United States that these diseasespose if they spread unchecked.
Finally, the volunteer programs of the PeaceCorps serve U.S. national interests by promot-ing mutual understanding between Americansand the people of developing or transitionalnations and providing technical assistanceon a range of issues to interested countriesthat request it.
Relevant agencies will meet the followingperformance goals in 1999:
• The State Department and USAID, work-ing with the Environmental Protection
15913. INTERNATIONAL AFFAIRS
Agency and with other bilateral and multi-lateral donors, through diplomacy and for-eign assistance will slow the rate of in-crease, from 1997 levels, of climate changegas emissions among key developing na-tion emitters.
• USAID will provide assistance in conjunc-tion with other donors that will cut, from1997 levels, the total fertility rates in de-veloping countries.
• USAID, working with the Department ofHealth and Human Services and withother bilateral and multilateral donors,will provide assistance that will reduce,from 1997 levels, the infant mortality rate
and the rate of new cases of AIDS, ma-laria, tuberculosis and other critical com-municable diseases in developing coun-tries.
• The Peace Corps will provide opportunitiesfor 50 percent more Americans than in1997 to enter service as new volunteers.
• The Peace Corps will increase Americans’understanding of other peoples by tripling,from 1997 levels, the number of Americanteachers participating in the World WiseSchools partnership with Peace Corps vol-unteers, bringing the total number ofteachers to 10,000.

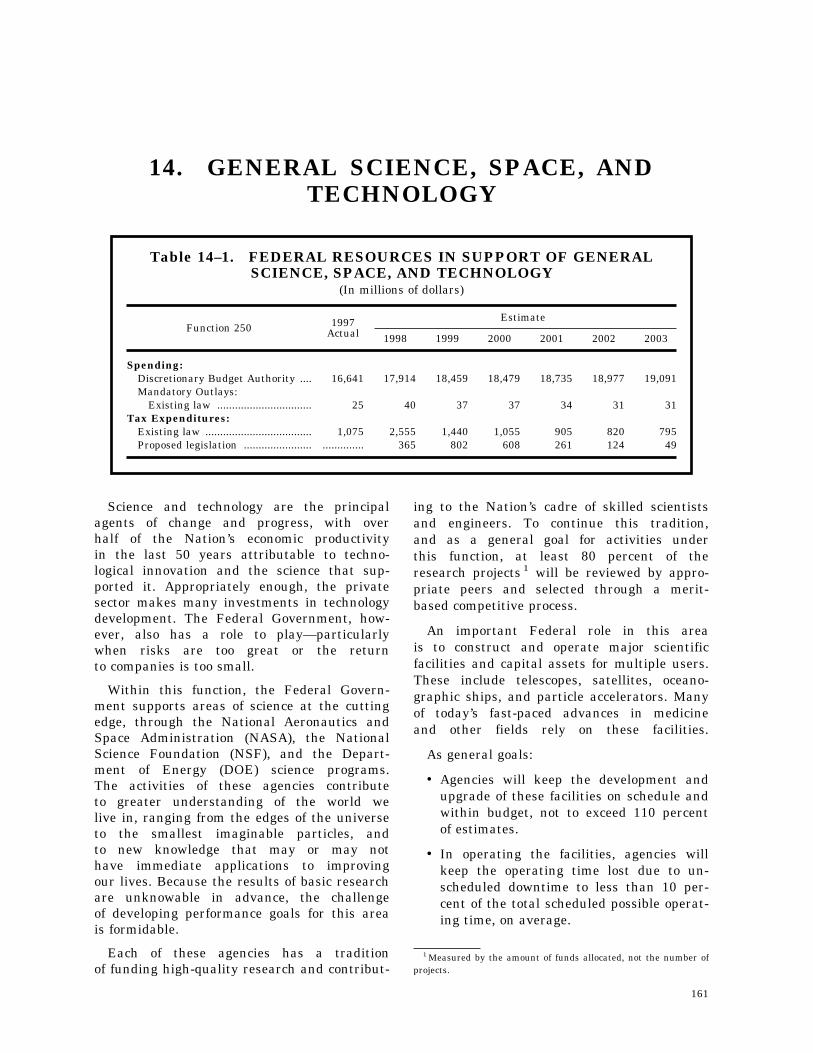
161
1 Measured by the amount of funds allocated, not the number ofprojects.
14. GENERAL SCIENCE, SPACE, ANDTECHNOLOGY
Table 14–1. FEDERAL RESOURCES IN SUPPORT OF GENERALSCIENCE, SPACE, AND TECHNOLOGY
(In millions of dollars)
Function 250 1997Actual
Estimate
1998 1999 2000 2001 2002 2003
Spending:Discretionary Budget Authority .... 16,641 17,914 18,459 18,479 18,735 18,977 19,091Mandatory Outlays:
Existing law ................................ 25 40 37 37 34 31 31Tax Expenditures:
Existing law .................................... 1,075 2,555 1,440 1,055 905 820 795Proposed legislation ....................... .............. 365 802 608 261 124 49
Science and technology are the principalagents of change and progress, with overhalf of the Nation’s economic productivityin the last 50 years attributable to techno-logical innovation and the science that sup-ported it. Appropriately enough, the privatesector makes many investments in technologydevelopment. The Federal Government, how-ever, also has a role to play—particularlywhen risks are too great or the returnto companies is too small.
Within this function, the Federal Govern-ment supports areas of science at the cuttingedge, through the National Aeronautics andSpace Administration (NASA), the NationalScience Foundation (NSF), and the Depart-ment of Energy (DOE) science programs.The activities of these agencies contributeto greater understanding of the world welive in, ranging from the edges of the universeto the smallest imaginable particles, andto new knowledge that may or may nothave immediate applications to improvingour lives. Because the results of basic researchare unknowable in advance, the challengeof developing performance goals for this areais formidable.
Each of these agencies has a traditionof funding high-quality research and contribut-
ing to the Nation’s cadre of skilled scientistsand engineers. To continue this tradition,and as a general goal for activities underthis function, at least 80 percent of theresearch projects 1 will be reviewed by appro-priate peers and selected through a merit-based competitive process.
An important Federal role in this areais to construct and operate major scientificfacilities and capital assets for multiple users.These include telescopes, satellites, oceano-graphic ships, and particle accelerators. Manyof today’s fast-paced advances in medicineand other fields rely on these facilities.
As general goals:
• Agencies will keep the development andupgrade of these facilities on schedule andwithin budget, not to exceed 110 percentof estimates.
• In operating the facilities, agencies willkeep the operating time lost due to un-scheduled downtime to less than 10 per-cent of the total scheduled possible operat-ing time, on average.
162 THE BUDGET FOR FISCAL YEAR 1999
The budget proposes $18.5 billion to conductthese activities. The Government also seeksto stimulate private investment in these activi-ties through over $2 billion a year in taxcredits and other preferences for researchand development (R&D).
National Aeronautics and SpaceAdministration
The budget proposes $12.3 billion for NASAactivities in this function. While NASA’sfunding represents just 12 percent of totalFederal funds for R&D, NASA serves asthe lead Federal agency for R&D in civilspace activities, working to expand frontiersin air and space to serve America andimprove the quality of life on Earth. NASApursues this vision through balanced invest-ment in space science, Earth science, spacetransportation technology, and human explo-ration and development of space.
The 1999 goals for these enterprises follow.
Space Science programs, for which thebudget proposes $2.1 billion, are designedto enhance our understanding of how theuniverse was created, the formation of planets,and the possible existence of life beyondEarth. NASA has enjoyed major successesof late, including the landing on Mars withMars Pathfinder.
• NASA space science will successfullylaunch its four planned spacecraft mis-sions—Mars 98 lander, Stardust, and twoExplorer missions—within 10 percent ofits schedule and budget.
• NASA space science will increase its con-tribution to the general knowledge baseand to education, as reflected by its con-tributions to a college space science text-book, to a level at least equal to the 1996level of 27 percent.
• The NASA Advisory Council will rate allnear-term space science objectives as beingmet or on schedule. Examples of objectivesinclude: investigate the composition, evo-lution and resources of Mars, the Moon,and small solar system bodies such as as-teroids and comets; identify planetsaround other stars; and observe the evo-lution of galaxies and the intergalactic me-dium.
Earth Science programs, for which thebudget proposes $1.4 billion, focus on increas-ing our understanding of the total Earthsystem and the effects of natural and human-induced changes on the global environmentthrough long-term, space-based observationof Earth’s land, oceans, and atmosphericprocesses. NASA will launch the first ina new series of Earth Science spacecraftin 1998.
• NASA Earth Science will successfullylaunch its four planned spacecraft mis-sions—Quikscat, the Advanced LandImager, a Geostationary Operational Envi-ronmental Satellite, and the Shuttle RadarTopography mission—within 10 percent ofits schedule and budget.
• NASA will obtain new data on precipita-tion, land surface, and climate, and willdeliver the data to users within five days.
• NASA’s Advisory Council will rate allnear-term earth science objectives as beingmet or on schedule. Examples of objectivesinclude: observe and document land coverand land use change and impacts on sus-tained resource productivity; and under-stand the causes and impacts of long-termclimate variations on global and regionalscales.
Space Transportation Technology programs,for which the budget proposes $400 million,work with the private sector to developand test experimental launch vehicles thatcut the cost of access to space.
• The X-33 program will begin flight testsin 1999 and demonstrate, by year-end, keytechnologies to cut the cost of space trans-portation. These technologies will be di-rectly scaleable to the mass fraction (lessthan 10 percent empty vehicle weight) re-quired for future reusable launch vehiclesand meet the following operational re-quirements: flights faster than Mach 13;48-hour and seven-day ground turn-arounds; and 50-person maintenancecrews.
• The X-34 program will perform 25 flighttests in one year, starting no later thanMarch 1999, to demonstrate the oper-ational parameters of future reusablelaunch vehicles. These parameters include:
16314. GENERAL SCIENCE, SPACE, AND TECHNOLOGY
recurring costs under $500,000; 24-hourground turnarounds; safe abort landings;landings in cross winds up to 20 knots;and flights through rain and fog.
Human Exploration and Development ofSpace (HEDS) programs, for which the budgetproposes $5.8 billion, focus on human spaceexploration. In 1997, HEDS programs sup-ported the successful launch of eight SpaceShuttle flights, a continuous U.S. presenceon the Russian Mir space station, and contin-ued construction of the International SpaceStation. In 1998, assembly of the InternationalSpace Station will begin in Earth orbit.
For 1999, the performance goals includethe following:
• NASA will successfully complete Phase 2(the first ten assembly flights) of the Inter-national Space Station within perform-ance, schedule, and budget targets.
• NASA will ensure that space shuttle safe-ty, reliability and cost will improve, byachieving seven or fewer flight anomaliesper mission, successful on-time launches85 percent of the time, and a 13-monthflight manifest preparation time.
• NASA will expand human presence andscientific resources in space by increasingthe amount of crew time in orbit to 185weeks.
• NASA-supported scientific research in lifeand microgravity sciences will broaden, asindicated by a rise in the number of re-sulting journal publications to 1,600.
National Science Foundation
NSF-supported activities have led to break-throughs and advances in many areas, includ-ing superconducting materials, Doppler radar,the Internet and World Wide Web, medicalimaging systems, computer-assisted-design, ge-netics, polymers, plate tectonics, and globalclimate change. While NSF represents justthree percent of Federal R&D spending, itsupports nearly half of the non-medical basicresearch conducted at academic institutions.NSF also provides 30 percent of Federalsupport for mathematics and science edu-cation. NSF programs involve over 25,000senior scientists; 50,000 other professionals,
graduate students, and undergraduate stu-dents; and 120,000 K-12 teachers.
The budget proposes $3.7 billion in 1999for NSF, which it would invest in fourkey program functions:
Research Project Support: Over half of NSF’sresources support research projects performedby individuals and small groups, instrumenta-tion, and centers.
• An independent assessment will judgeNSF’s portfolio of research programs tohave the highest scientific quality and anappropriate balance of projects character-ized as high-risk, multidisciplinary, or in-novative.
• NSF will ensure that all of its new an-nouncements of research opportunities andproposal solicitations will contain an ex-plicit statement encouraging proposers tointegrate their research activities with im-proving education or public understandingof science.
• NSF will increase the percentage of com-petitive awards going to new investigatorsto at least 30 percent, a 2.6-percent riseover a baseline of 27.4 percent.
Facilities: Facilities such as observatories,particle accelerators, research stations, andoceanographic research vessels provide theplatforms for research in fields such asastronomy, physics, and oceanography. About20 percent of NSF’s budget supports large,multi-user facilities required for cutting-edgeresearch. NSF facilities will meet the function-wide goals to remain within cost and schedule,and to operate efficiently.
Education and Training: Education andtraining activities, accounting for 20 percentof NSF’s budget, revolve around efforts toimprove teaching and learning in science,mathematics, engineering, and technology atall education levels. Education and trainingprojects develop curriculum, enhance teachertraining, and provide educational opportunitiesfor students from pre-K through undergradu-ate degrees. NSF also contributes to theeducation of future scientists and engineersby supporting graduate students and postdoc-toral programs.
164 THE BUDGET FOR FISCAL YEAR 1999
• Over 80 percent of schools participatingin a systemic initiative program will: 1)implement a standards-based curriculumin science and mathematics; 2) furtherprofessional development of the instruc-tional workforce; and 3) improve studentachievement on a selected battery of tests,after three years of NSF support.
• NSF will fund intensive professional devel-opment experiences for at least 75,000 pre-college teachers.
Administration and Management: NSF doesnot operate programs or laboratories; rather,the agency supports research and educationactivities, conducted primarily at colleges anduniversities, selected through a competitive,merit-based process.
Performance goals for 1999 include:
• processing 70 percent of grant proposalswithin six months of receipt, and
• publishing 95 percent of program an-nouncements at least three months beforeproposals are due.
Department of Energy
DOE provides major scientific user facilitiesand sponsors basic scientific research in spe-cific fields, such as high energy and nuclearphysics and materials, chemical, biological,and environmental sciences. It supports over60 percent of federally-funded research inthe physical sciences.
The budget proposes $2.5 billion for DOEscience programs, which include high energyand nuclear physics, basic energy sciences,biological and environmental research, andcomputational technology research. These pro-grams support scientific facilities for highenergy and nuclear physics, and also supportthe research performed by the users of thefacilities. They also provide and operate syn-chrotron light sources, neutron sources, super-computers, high-speed networks, and otherinstruments that researchers use in fieldsranging from biomedicine to agriculture, geo-science, materials, and physics. These state-of-the-art scientific facilities provide the cut-ting edge experimental and theoretical tech-niques that provide insights into dozens ofapplications, and they are available, on a
competitive basis, to researchers funded byNSF, other Federal agencies, and public andprivate entities. DOE’s facilities will meetthe function-wide goals to remain withincost and schedule, and to operate efficiently.
The 1999 goals for these programs follow.
Basic Energy Sciences (BES) supports basicresearch in the natural sciences for newand improved energy techniques and tech-nologies, and to understand and mitigatethe environmental impacts of energy tech-nologies.
• BES will start construction of the Spal-lation Neutron Source to provide beamsof neutrons used to probe and understandthe physical, chemical, and biological prop-erties of materials at an atomic level—leading to better fibers, plastics, catalysts,and magnets and improvements in phar-maceuticals, computing equipment, andelectric motors.
• An independent assessment will judgeBES research programs to have high sci-entific quality.
Computational Technology Research (CTR)performs long-term computational, technology,and advanced energy projects research throughan integrated program in applied mathemati-cal sciences, high performance computing andcommunications, information infrastructure,advanced energy projects research, and labora-tory technology research.
• CTR will complete prototype developmentof the ‘‘virtual lab’’ approach and imple-ment at least three program trial applica-tions.
• Users will judge that computer facilitiesand networks have met 75 percent of theirrequirements.
Biological and Environmental Research(BER) provides fundamental science to developthe knowledge to identify, understand, andanticipate the long-term health and environ-mental consequences of energy production,development, and use.
• BER will complete sequencing of 40 mil-lion subunits of human DNA to submitto publicly accessible databases.
16514. GENERAL SCIENCE, SPACE, AND TECHNOLOGY
• BER will complete 70 percent of the ge-netic sequencing of over 10 additional mi-crobes with significant potential for wastecleanup and energy production.
High Energy and Nuclear Physics (HENP)strives to deepen understanding of the natureof matter and energy at the most fundamentallevel, as well as understanding of the structureand interactions of atomic nuclei.
• An independent assessment will judgeHENP research programs to have high sci-entific quality.
• HENP will begin operating the B-factoryat the Stanford Linear Accelerator Center,the Main Injector for the Tevatron atFermilab, and the Relativistic Heavy IonCollider at Brookhaven National Labora-tory, and will deliver on the 1999 U.S./DOE commitments to the internationalLarge Hadron Collider project. These fa-cilities will provide cutting-edge scientificcapabilities to further study the fun-damental constituents of matter. For ex-ample, the B-factory will illuminate the
basic question of why matter exists in theuniverse.
Tax Incentives
Along with direct spending on R&D, theFederal Government has sought to stimulateprivate investment in these activities withtax preferences. The law provides a 20-percent tax credit for private research andexperimentation expenditures above a certainbase amount. The credit, which was extendedin 1997, is due to expire on June 30,1998. The President proposes to extend itfor one year—that is, through June 1999.Under current law, the credit will cost $2.1billion in 1998 and $860 million in 1999.
A permanent tax provision also lets compa-nies deduct, up front, the costs of certainkinds of research and experimentation, ratherthan capitalize these costs; this tax expendi-ture will cost $580 million in 1999. Finally,equipment used for research benefits fromrelatively rapid cost recovery; the cost ofthis tax preference is calculated in the taxexpenditure estimate for accelerated deprecia-tion of machinery and equipment.

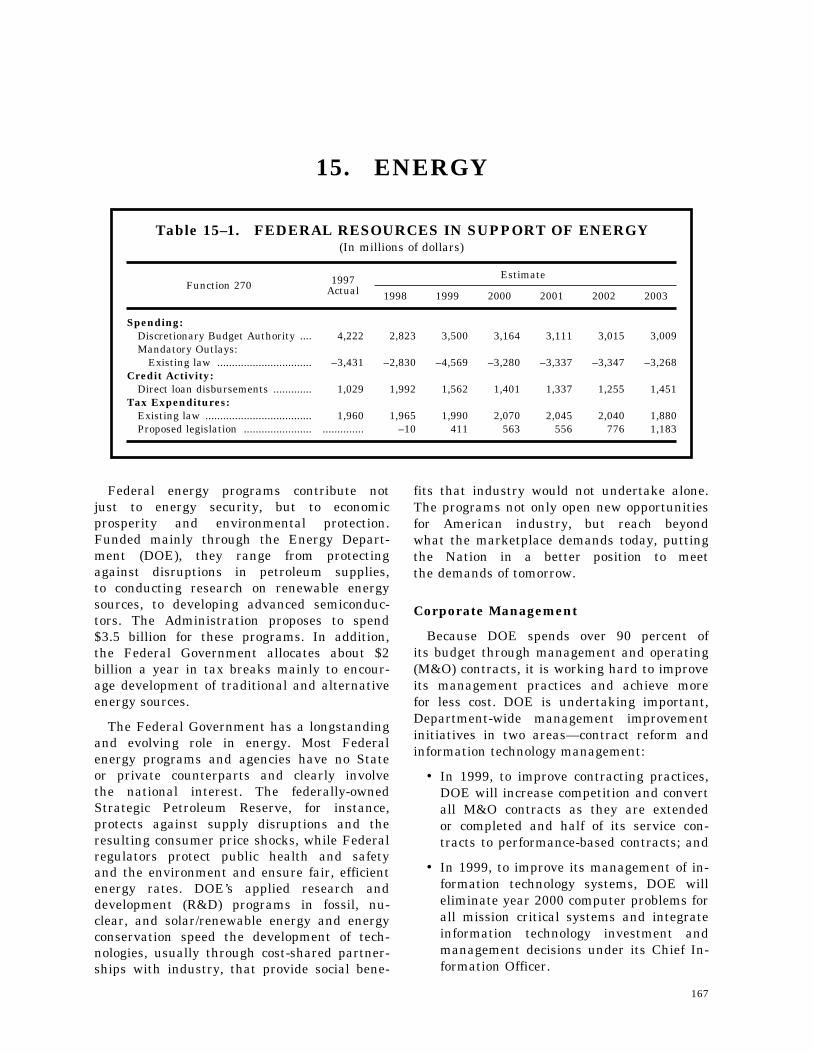
167
15. ENERGY
Table 15–1. FEDERAL RESOURCES IN SUPPORT OF ENERGY(In millions of dollars)
Function 270 1997Actual
Estimate
1998 1999 2000 2001 2002 2003
Spending:Discretionary Budget Authority .... 4,222 2,823 3,500 3,164 3,111 3,015 3,009Mandatory Outlays:
Existing law ................................ –3,431 –2,830 –4,569 –3,280 –3,337 –3,347 –3,268Credit Activity:
Direct loan disbursements ............. 1,029 1,992 1,562 1,401 1,337 1,255 1,451Tax Expenditures:
Existing law .................................... 1,960 1,965 1,990 2,070 2,045 2,040 1,880Proposed legislation ....................... .............. –10 411 563 556 776 1,183
Federal energy programs contribute notjust to energy security, but to economicprosperity and environmental protection.Funded mainly through the Energy Depart-ment (DOE), they range from protectingagainst disruptions in petroleum supplies,to conducting research on renewable energysources, to developing advanced semiconduc-tors. The Administration proposes to spend$3.5 billion for these programs. In addition,the Federal Government allocates about $2billion a year in tax breaks mainly to encour-age development of traditional and alternativeenergy sources.
The Federal Government has a longstandingand evolving role in energy. Most Federalenergy programs and agencies have no Stateor private counterparts and clearly involvethe national interest. The federally-ownedStrategic Petroleum Reserve, for instance,protects against supply disruptions and theresulting consumer price shocks, while Federalregulators protect public health and safetyand the environment and ensure fair, efficientenergy rates. DOE’s applied research anddevelopment (R&D) programs in fossil, nu-clear, and solar/renewable energy and energyconservation speed the development of tech-nologies, usually through cost-shared partner-ships with industry, that provide social bene-
fits that industry would not undertake alone.The programs not only open new opportunitiesfor American industry, but reach beyondwhat the marketplace demands today, puttingthe Nation in a better position to meetthe demands of tomorrow.
Corporate Management
Because DOE spends over 90 percent ofits budget through management and operating(M&O) contracts, it is working hard to improveits management practices and achieve morefor less cost. DOE is undertaking important,Department-wide management improvementinitiatives in two areas—contract reform andinformation technology management:
• In 1999, to improve contracting practices,DOE will increase competition and convertall M&O contracts as they are extendedor completed and half of its service con-tracts to performance-based contracts; and
• In 1999, to improve its management of in-formation technology systems, DOE willeliminate year 2000 computer problems forall mission critical systems and integrateinformation technology investment andmanagement decisions under its Chief In-formation Officer.
168 THE BUDGET FOR FISCAL YEAR 1999
DOE corporate management also ensuresthat its work is done with a concern forthe environment, safety, and health (ES&H)of its workers and the public. DOE is shiftingfrom a reactive approach to ES&H mattersto one that stresses prevention and integratessound ES&H management practices intoDOE’s day-to-day work.
• In 1999, DOE will implement integratedsafety management systems at 10 priorityfacilities and in all major M&O contracts.
• In 1999, DOE will conduct self-assess-ments at all DOE sites to identify ES&Hdeficiencies and vulnerabilities, and de-velop and pursue corrective action plans.
Energy Resources
DOE maintains the Strategic PetroleumReserve (SPR) and operates various R&Dinvestments to protect against petroleum sup-ply disruptions and reduce the environmentalimpacts of energy production and use. Createdin 1975, the SPR now has 563 millionbarrels of crude oil in underground saltcaverns at four Gulf Coast sites. The SPRhelps protect the economy and provide flexibil-ity for the Nation’s foreign policy in caseof a severe energy supply disruption. Asthe United States entered the Persian GulfWar in 1991, for instance, President Bushannounced an energy emergency, promptinga SPR draw-down that—along with the Alliednations’ early, overwhelming military suc-cess—caused oil prices to drop by $10 perbarrel (or, by about a third of their price).
• In 1999, DOE will maintain its capabilityto reach its SPR drawdown rate of aboutfour million barrels a day within 15 daysand to maintain this rate for at least 90days.
DOE’s energy R&D investments cover abroad array of resources and technologiesto make the production and use of all formsof energy—including solar and renewables,fossil, and nuclear—more efficient and lessenvironmentally damaging. As the President’sCommittee of Advisors on Science and Tech-nology has noted, Federal R&D support canhelp develop these technologies that benefitsociety by cutting emission rates of greenhousegases, acid rain precursors, and air pollutants.
These investments not only lay the foundationfor a more sustainable energy future butalso open major international markets formanufacturers of advanced U.S. technology.
Energy conservation programs, for whichthe budget proposes $809 million, are designedto improve the fuel economy of various trans-portation modes, increase the productivityof our most energy-intensive industries, andimprove the energy efficiency of buildingsand appliances. They also include grantsto States to fund energy-efficiency programs,low-income home weatherization, and the ad-ministration of minimum energy-efficiencystandards for many major home appliances.Each of these activities benefits our economyand reduces emissions of carbon dioxide andother greenhouse gases. Many of the programsrely on partnerships with the private sectorto leverage Federal spending with industrycost-sharing and to increase the likelihoodthat the technologies will be used commer-cially. Energy-efficiency technologies that havealready come to market include heat-reflectingwindows, high-efficiency lights, geothermalheat pumps, high-efficiency electric motorsand compressors, and software for designingenergy-efficient buildings. Meanwhile, fiveother technologies available for at least fiveyears have generated over $11 billion intotal consumer and business energy savingsto date.
In 1999, DOE’s Energy Conservation pro-gram will:
• Expand the Clean Cities program to createcontinuous corridors of alternative trans-portation fuel availability in and between10 major urban centers;
• Bring together over 600 utility partnersin a Climate Challenge forum in whichthe utilities exchange lessons-learned onvoluntary efforts to reduce greenhouse gasemissions; and
• Weatherize 77,000 low-income homes.
Solar and renewable energy programs, forwhich the budget proposes $372 million, focuson technologies that will help the Nationuse its abundant renewable resources suchas wind, solar, and biomass to produce low-cost, clean energy that contributes no netcarbon dioxide to the atmosphere. The United
16915. ENERGY
States is the world’s technology leader inwind energy, with a growing export marketand production costs that have fallen belowfive cents per kilowatt-hour. In addition,photovoltaics are becoming more useful inremote power applications, and constructionis beginning on the first large-scale facilitiesto produce ethanol from cellulosic agriculturalwaste. DOE also is coordinating the Presi-dent’s Million Solar Roofs initiative, andStates, cities, and Federal agencies to datehave pledged 470,000 solar roof installations(a mixture of solar heat/hot water andphotovoltaics) over the next 10 years.
In 1999, DOE’s Solar and Renewable Energyprogram will:
• Support the President’s Million SolarRoofs initiative through partnerships andtechnical assistance so that at least 7,000solar roofs will be installed in 1999;
• Complete five commercial-scale dem-onstrations of the use of biofuels in power-plants by co-firing coal with at least fivepercent biomass fuel; and
• Install 20 manufacturing prototype andfour advanced prototype 25-kW dish/en-gine solar thermal systems at utility/fieldsites through the Utility-Scale Joint Ven-ture Program.
Both the energy-efficiency and renewableenergy (EERE) programs have establishedgoals to ensure that their research programsare cost-effective and high quality.
Performance measures include:
• Continued use of cost-sharing as a majorprogram criterion in cooperative agree-ments and industry partnerships. In 1999,DOE/EERE will maintain an industrycost-share level of over 40 percent, whenaveraged across all work with industry.
• Every EERE program will develop prog-ress milestones and estimates of energy-related program benefits annually. Atleast 25 percent of the milestones and esti-mated benefits will undergo external peerreview each year, with a goal of havingall milestones and estimated benefits peer-reviewed at least once every four years.
• Cumulative consumer economic savingsfrom past and current EERE programswill exceed $11 billion in 1999.
DOE’s energy efficiency and renewable en-ergy programs form a major part of theAdministration’s Climate Change TechnologyInitiative, which aims to find ways to reduceemissions of carbon dioxide and other green-house gases in ways that benefit our economyrather than constrain it. (For more details,see Chapter 6, ‘‘Promoting Research.’’) Formost of this century, America’s comparativeadvantage in international competition hasbeen technology, and DOE’s research anddevelopment programs are designed to main-tain that advantage into the next century.
Fossil fuel energy R&D programs, for whichthe budget proposes $383.4 million, helpindustry develop advanced technologies toproduce and use coal, oil, and gas resourcesmore efficiently and cleanly. Federally-fundeddevelopment of clean, highly-efficient gas-fired and coal-fired generating systems aimto reduce greenhouse gas emission rates,while reducing electricity costs compared tocurrently available technologies. The programsalso help boost the domestic production ofoil and natural gas by funding R&D projectswith industry to cut exploration, development,and production costs.
In 1999, DOE will:
• Demonstrate four advanced drilling andcompletion technology systems that couldultimately add six trillion cubic feet (TCF)of domestic gas reserves, including oneTCF through 1999;
• Demonstrate four advanced production en-hancement technologies that could ulti-mately add 190 million barrels of domesticoil reserves, including 30 million barrelsduring 1999; and
• Complete full-scale component testing oftwo advanced, utility-scale turbines withover 60 percent efficiency when used incombined cycles and with ultra-low nitro-gen oxides emissions.
Nuclear fission power is a widely usedtechnology, with the potential for furthergrowth, particularly in Asia. Fission tech-nology provides over 20 percent of the electric
170 THE BUDGET FOR FISCAL YEAR 1999
power consumed in the United States andabout 17 percent worldwide without generat-ing greenhouse gases. If fossil plants wereused to produce the amount of electricitygenerated by these nuclear plants, more than300 million additional metric tons of carbonwould be emitted each year. Since WorldWar II, the United States has been theinternational leader in all nuclear energymatters. World leadership in nuclear tech-nologies and the underlying science is vitalto the United States from the perspectivesof national security, international influence,and global stability. R&D will help determinewhether nuclear fission can fulfill its potentialas a contributor to the goal of reducinggreenhouse gas emissions. In 1999, DOEwill:
• Work with its laboratories, universitiesand industry to develop a competitiveR&D program to address problems thatmay prevent continued operation of cur-rent nuclear plants and fund the initiativeat $10 million a year, to be matched byindustry.
• Establish a peer-reviewed Nuclear EnergyResearch Initiative, initially funded at $25million a year, for investigator-initiatedideas to address the difficult issues ofwaste, safety, proliferation, and cost.
• Complete a demonstration of electrometal-lurgical methods to permanently immo-bilize spent nuclear fuel from the shut-down Experimental Breeder Reactor-IIand evaluate whether the technology is acost-effective means of processing DOEspent nuclear fuels.
Environmental Quality
DOE manages the Nation’s most complexenvironmental cleanup program, the resultof over four decades of research and productionof nuclear energy technology and materialsat both Federal and private sector locations.(For information on DOE’s Defense Environ-mental Management program, see Chapter12, ‘‘National Defense.’’) The Department mustalso develop a long-term solution to theproblem that the Nation’s commercial spentnuclear fuel poses.
In the area of Environmental Management,the budget proposes $934 million to reduceenvironmental risk and manage the wasteat: (1) sites run by DOE’s predecessor agenciesthat involved researching and producing ura-nium and thorium; (2) sites contaminatedwith uranium production from the 1950sto the 1970s; and (3) DOE’s uranium process-ing plants that the United States EnrichmentCorporation runs. In recent years, the clean-up and safe disposal of radioactive and hazard-ous wastes and materials has progressedsubstantially.
In 1999, DOE will:
• Have over 60 percent of the contaminatedsites associated with 11 large facilitiescleaned up, allowing these sites and facili-ties to return to productive use;
• Make ready for disposal about 70 percentof the high-level waste at its West Valley,New York site; and
• Complete surface remediation of the eightremaining Uranium Mill Tailings Reme-dial Action (UMTRA) sites to complete thispart of the UMTRA project.
DOE’s Civilian Radioactive Waste Manage-ment Program oversees the management anddisposal of spent nuclear fuel from commercialnuclear reactors and high-level radioactivewaste from Federal cleanup sites. With thecompletion of the viability assessment forYucca Mountain in 1998, DOE expects toemphasize data syntheses and analysis andengineering and design in 1999.
In particular, in 1999, DOE will:
• Complete a draft Environmental ImpactStatement for the Yucca Mountain site forpublic review and comment, develop amore complete design for a mined geologicdisposal system at Yucca Mountain, andcomplete independent expert reviews ofoverall repository system performancemodels—further crucial steps in the longprocess that eventually will produce aDOE site recommendation to the Presidentand a DOE license application to the Nu-clear Regulatory Commission.
17115. ENERGY
Energy Production and Power Marketing
The Federal Government is reshaping pro-grams that produce, distribute, and financeoil, gas, and electric power. The Naval Petro-leum Reserve, commonly known as Elk Hills,is a federally-owned oil and gas field locatedin California. Set aside early this centuryto provide an oil reserve for Navy ships,Elk Hills is no longer needed for that purpose,and Congress voted in 1996 to require itssale. In October 1997, DOE opened private-sector bids for Elk Hills and identified Occi-dental Petroleum’s offer of $3.7 billion asthe high offer. Following notification of Con-gress, the sale should be completed by Feb-ruary 1998, marking the largest privatizationin U.S. history. It will allow DOE to maximizethe productivity of Federal oil fields, oneof its 1998 performance objectives.
The five Federal Power Marketing Adminis-trations, or PMAs, (Alaska, Bonneville, South-eastern, Southwestern, and Western) marketelectricity generated at 129 multi-purposeFederal dams over 33,000 miles of federally-owned transmission lines, in 35 States. ThePMAs sell about six percent of the Nation’selectricity, primarily to preferred customerssuch as counties, cities, and publicly-ownedutilities and power authorities. The PMAsface growing challenges as the electricityindustry moves toward open, competitive mar-kets. Concerns focus on fundamental changesthat may be required to integrate the PMAsinto a deregulated industry. As authorizedby Congress, the sale of the Alaska PowerAdministration to current customers and theState of Alaska will be completed in 1998.
• In 1999, each PMA will operate its trans-mission system to ensure that service iscontinuous and reliable (that is, that thesystem achieves a ‘‘pass’’ rating eachmonth under North American ReliabilityCouncil performance standards).
The Tennessee Valley Authority (TVA) isa Federal Government corporation and theNation’s single largest electric power genera-tor. It generates four percent of the electricpower in the country and transmits thatpower over its 15,000 mile transmission net-work to 159 municipal utilities and ruralelectric cooperatives that serve some eightmillion customers in seven States.
• The budget reflects specific cost-cuttingmeasures that TVA is taking to implementits 10-Year Business Plan and improve itsability to supply power at competitiveprices. For example, TVA will cut costsby reducing its outstanding debt by $2 bil-lion by the end of 1999. It will cut its$28 billion debt in half by 2007.
• TVA is working closely with regionalstakeholders to develop and recommend toDOE reform proposals to include in theAdministration’s legislation to restructurethe Nation’s electric power industry. Theproposals will redefine TVA’s role, whilepreserving the value of the Government’sinvestment in TVA.
(For information on TVA’s non-power activi-ties, see Chapter 20, ‘‘Community and Re-gional Development.’’)
In 1999, the Agriculture Department’s RuralUtilities Service (RUS) will make $1.7 billionin direct loans to nonprofit associations, ruralelectric cooperatives, public bodies, and otherutilities in rural areas for generating, trans-mitting, and distributing electricity. Its maingoal is to provide modern, affordable electricservice to rural communities.
In 1999, the RUS will:
• Ensure that RUS borrowers continue toprovide service in 523 of the 540 poorestcounties in rural America and 655 of 700counties suffering the most from popu-lation out-migration;
• Upgrade 116 rural electric systems, bene-fitting over 1.6 million customers and gen-erating about 21,000 jobs; and
• Continue to cut the high cost of electricservice to rural customers that resultsfrom low customer density in rural areasby charging interest at or below Treasuryrates for debt of comparable maturity.
Energy Regulation
The Federal Government’s regulation ofenergy industries is designed to protect publichealth and safety and promote fair andefficient interstate energy markets. For exam-ple, DOE seeks to improve the Nation’suse of energy resources through its applianceenergy efficiency program. Federal regulations
172 THE BUDGET FOR FISCAL YEAR 1999
specify minimum levels of energy efficiencyfor all major home appliances, such as waterheaters, air conditioners, and refrigerators.
The Federal Energy Regulatory Commission(FERC), an independent agency within DOE,regulates the transmission and wholesaleprices of electric power, including non-Federalhydro-electric power, and the transportationof oil and natural gas by pipeline in interstatecommerce. Over the long run, FERC seeksto increase economic efficiency by promotingcompetition in the natural gas industry andin wholesale electric power markets. FERC’srecent reforms give consumers competitivechoices in services and suppliers that werenot available just a few years ago. Its actionswill cut consumer energy bills by $3 billionto $5 billion a year.
In 1999, to evaluate the success of itsinitiative to restructure interstate naturalgas and electricity markets, FERC will meas-ure:
• Increases in the number of new productsand range of suppliers customers maychoose from in both the natural gas andelectric industries;
• The extent to which natural gas and elec-tricity prices more clearly and quickly re-flect changing supply and demand condi-tions;
• The extent to which natural gas priceswithin each trading region will tend toconverge, except where there are demon-strable transportation constraints or costs;and
• The reduction in wholesale electricity pricedifferences among regions.
The Nuclear Regulatory Commission (NRC),an independent agency, regulates the Nation’scivilian nuclear reactors, the medical andindustrial use of nuclear materials, and thetransport and disposal of nuclear waste toensure public health and safety and to protectthe environment. Safety performance reflectsthe collective efforts of the NRC and theregulated nuclear community.
The NRC has the following 1999 goalsfor safety performance:
• No civilian nuclear reactor accidents, andno deaths due to radiation or radioactivityreleases from civilian nuclear reactors;
• No radiation-related deaths due to civilianuse of source, byproduct, and special nu-clear materials, no increase in significantradiation exposures due to the loss of suchmaterials, and no increase in misadminis-tration events causing significant radi-ation exposure;
• No significant accidental releases of radio-active material from storage and transpor-tation of nuclear waste, and no offsite re-lease of radioactivity beyond regulatorylimits from low-level waste disposal sites;
• The establishment of the regulatoryframework for high-level waste disposalconsistent with current national policy;
• No loss or theft of special nuclear mate-rials; and
• No offsite releases from operating facilitiesof radioactive material that may adverselyimpact the environment, and no releaseof sites until satisfactorily remediated inaccordance with NRC criteria.
Tax Incentives
Federal tax incentives are mainly designedto encourage the domestic production or useof fossil and other fuels, and to promotethe vitality of our energy industries anddiversification of our domestic energy supplies.The largest incentive lets certain fuel produc-ers cut their taxable income as their fuelresources are depleted. An income tax credithelps promote the development of certainnon-conventional fuels. It applies to oil pro-duced from shale and tar sands, gas producedfrom a number of unconventional sources(including coal seams), some fuels processedfrom wood, and steam produced from solidagricultural byproducts. Another tax provisionprovides a credit to producers who makealcohol fuels—mainly ethanol—from biomassmaterials. The law also allows a partialexemption from Federal gasoline taxes forgasolines blended with ethanol. The ClimateChange Technology Initiative proposes $3.6billion in new tax incentives over five yearsto help reduce greenhouse gases (see TableS–6 in ‘‘Summary Tables.’’)
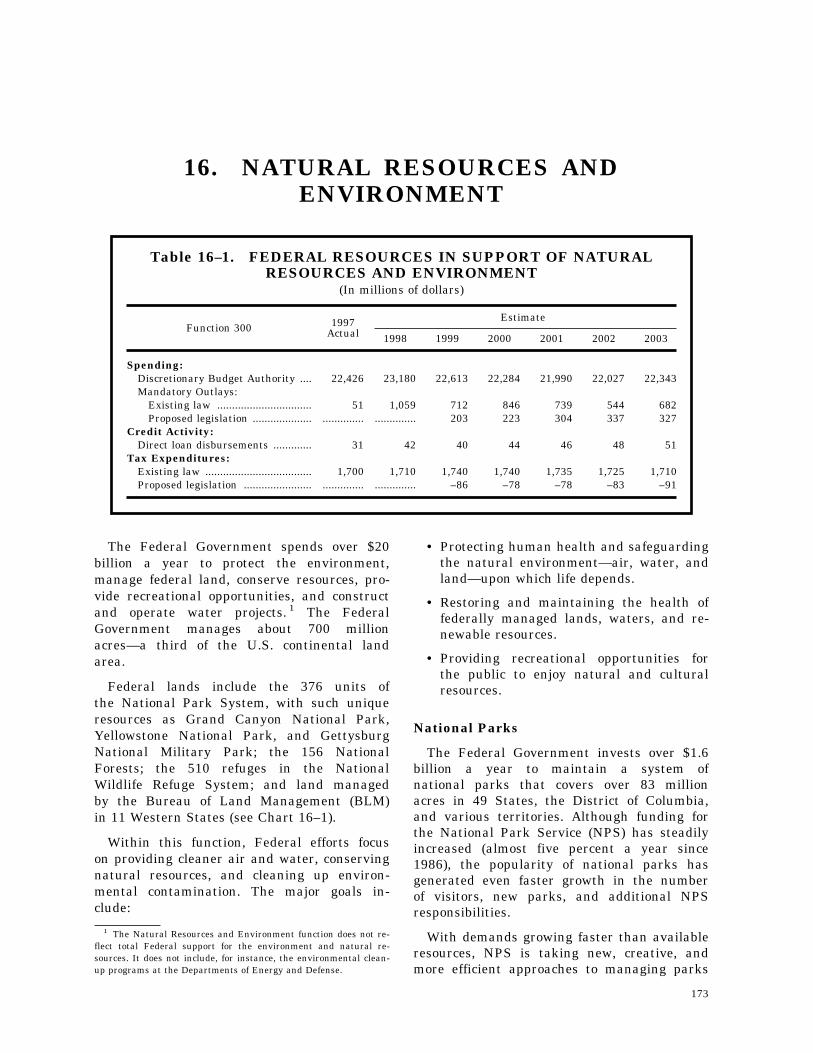
173
1 The Natural Resources and Environment function does not re-flect total Federal support for the environment and natural re-sources. It does not include, for instance, the environmental clean-up programs at the Departments of Energy and Defense.
16. NATURAL RESOURCES ANDENVIRONMENT
Table 16–1. FEDERAL RESOURCES IN SUPPORT OF NATURALRESOURCES AND ENVIRONMENT
(In millions of dollars)
Function 300 1997Actual
Estimate
1998 1999 2000 2001 2002 2003
Spending:Discretionary Budget Authority .... 22,426 23,180 22,613 22,284 21,990 22,027 22,343Mandatory Outlays:
Existing law ................................ 51 1,059 712 846 739 544 682Proposed legislation .................... .............. .............. 203 223 304 337 327
Credit Activity:Direct loan disbursements ............. 31 42 40 44 46 48 51
Tax Expenditures:Existing law .................................... 1,700 1,710 1,740 1,740 1,735 1,725 1,710Proposed legislation ....................... .............. .............. –86 –78 –78 –83 –91
The Federal Government spends over $20billion a year to protect the environment,manage federal land, conserve resources, pro-vide recreational opportunities, and constructand operate water projects. 1 The FederalGovernment manages about 700 millionacres—a third of the U.S. continental landarea.
Federal lands include the 376 units ofthe National Park System, with such uniqueresources as Grand Canyon National Park,Yellowstone National Park, and GettysburgNational Military Park; the 156 NationalForests; the 510 refuges in the NationalWildlife Refuge System; and land managedby the Bureau of Land Management (BLM)in 11 Western States (see Chart 16–1).
Within this function, Federal efforts focuson providing cleaner air and water, conservingnatural resources, and cleaning up environ-mental contamination. The major goals in-clude:
• Protecting human health and safeguardingthe natural environment—air, water, andland—upon which life depends.
• Restoring and maintaining the health offederally managed lands, waters, and re-newable resources.
• Providing recreational opportunities forthe public to enjoy natural and culturalresources.
National Parks
The Federal Government invests over $1.6billion a year to maintain a system ofnational parks that covers over 83 millionacres in 49 States, the District of Columbia,and various territories. Although funding forthe National Park Service (NPS) has steadilyincreased (almost five percent a year since1986), the popularity of national parks hasgenerated even faster growth in the numberof visitors, new parks, and additional NPSresponsibilities.
With demands growing faster than availableresources, NPS is taking new, creative, andmore efficient approaches to managing parks
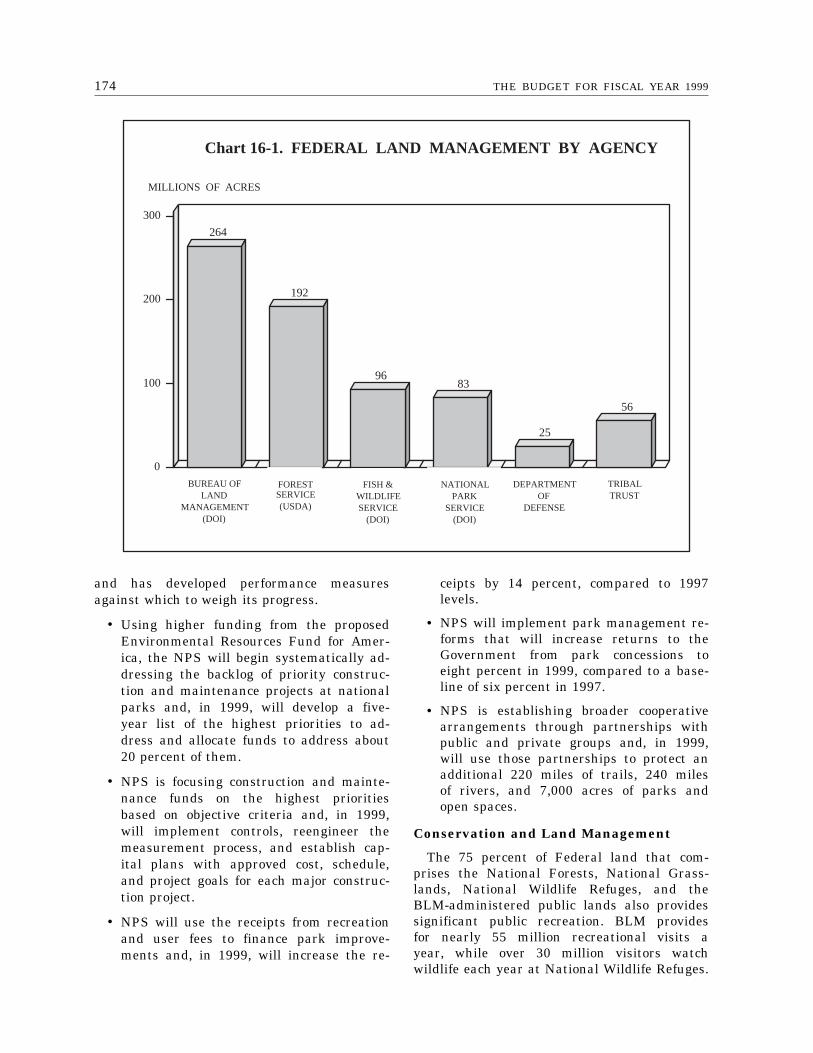
174 THE BUDGET FOR FISCAL YEAR 1999
264
192
9683
25
56
0
100
200
300
MILLIONS OF ACRES
Chart 16-1. FEDERAL LAND MANAGEMENT BY AGENCY
BUREAU OFLAND
MANAGEMENT(DOI)
FORESTSERVICE(USDA)
FISH &WILDLIFESERVICE
(DOI)
NATIONALPARK
SERVICE(DOI)
DEPARTMENTOF
DEFENSE
TRIBALTRUST
and has developed performance measuresagainst which to weigh its progress.
• Using higher funding from the proposedEnvironmental Resources Fund for Amer-ica, the NPS will begin systematically ad-dressing the backlog of priority construc-tion and maintenance projects at nationalparks and, in 1999, will develop a five-year list of the highest priorities to ad-dress and allocate funds to address about20 percent of them.
• NPS is focusing construction and mainte-nance funds on the highest prioritiesbased on objective criteria and, in 1999,will implement controls, reengineer themeasurement process, and establish cap-ital plans with approved cost, schedule,and project goals for each major construc-tion project.
• NPS will use the receipts from recreationand user fees to finance park improve-ments and, in 1999, will increase the re-
ceipts by 14 percent, compared to 1997levels.
• NPS will implement park management re-forms that will increase returns to theGovernment from park concessions toeight percent in 1999, compared to a base-line of six percent in 1997.
• NPS is establishing broader cooperativearrangements through partnerships withpublic and private groups and, in 1999,will use those partnerships to protect anadditional 220 miles of trails, 240 milesof rivers, and 7,000 acres of parks andopen spaces.
Conservation and Land Management
The 75 percent of Federal land that com-prises the National Forests, National Grass-lands, National Wildlife Refuges, and theBLM-administered public lands also providessignificant public recreation. BLM providesfor nearly 55 million recreational visits ayear, while over 30 million visitors watchwildlife each year at National Wildlife Refuges.
17516. NATURAL RESOURCES AND ENVIRONMENT
With its 125,000 miles of trails, the ForestService is the largest single supplier of publicoutdoor recreation, providing 348 million rec-reational visitor days last year.
Federal lands provide other benefits. BLMand the Forest Service, with combined annualbudgets of about $4.4 billion, manage formultiple purposes. Federal laws require thatthe Forest Service manage the National For-ests for outdoor recreation, range, timber,watershed, wildlife and fish, and wilderness,and that the BLM manage the public landsthat it administers for multiple uses.
The agencies concentrate on the long-termgoal of providing sustainable levels of multipleuses while ensuring and enhancing ecologicalintegrity. Their performance measures includethe following:
• The Forest Service will target its higherfunding to needed watershed restorationwork by increasing acres of watershed res-toration work by 43 percent (to 40,000acres) over 1998 levels of 28,000 acres; in-creasing the acres of range restoration by24 percent (to 42,000 acres) over 1998 lev-els of 34,000 acres; increasing the numberof miles of road obliterated to 3,500 miles,as compared to a 1998 baseline of 1,200miles in 1998; and increasing the numberof acres treated for fire hazard reductionto 1.6 million, compared to a 1998 plannedlevel of 1.3 million.
• For priority watersheds, BLM will en-hance the ecological integrity of 25 percentmore miles of riparian areas and 35 per-cent more acres of wetlands in 1999, com-pared to 1996, and increase the numberof acres treated for fire hazard reductionby prescribed fire and mechanical meansby 12 percent.
The Interior Department’s Fish and WildlifeService (FWS), with a budget of $1.3 billion,manages 93 million acres of refuges and,with the Commerce Department’s NationalMarine Fisheries Service (NMFS), protectsspecies on Federal and non-Federal lands.
• Proposed 1999 funding increases will en-able the refuge system to protect, enhance,and restore 661,000 more acres, over the1997 baseline of 96 million acres.
• FWS’ 1999 funding increase will doublethe number of acres covered by HabitatConservation Plans (HCPs); improve thedevelopment and implementation of HCPsthrough increased public participation,monitoring, and adaptive management; ex-tend Candidate Conservation Agreementprotections to another 80 species; keep 20candidate species off the endangered spe-cies list; and help ensure that 60 percentof listed species are stabilized or improvedin status.
• NMFS will implement programs in 1999to continue fully assessing 79 percent offish stocks, cutting commercial by-catch by15 percent, and increasing the number oflisted species that improve in status to 15,over a baseline of 12.
Half the continental United States is crop,pasture, and range land owned and managedby two percent of Americans—farmers andranchers. The Agriculture Department’s(USDA) Natural Resources Conservation Serv-ice provides technical assistance to ensuresound management of this land:
Under USDA’s Wetlands Reserve Program(WRP), the Federal Government buys long-term or permanent easements from land-owners for cropland, which is taken outof production and restored to wetlands. Land-owners receive fair market value for theland and cost-share assistance to cover therestoration expenses. The budget proposesto enroll another 164,000 acres, bringingtotal cumulative enrollment to over 655,000by the end of 1999. The Administration’sgoal for WRP remains one of reaching totalenrollment of 975,000 acres by the end ofcalendar 2000.
• To enhance water quality along streamsand lakes, and provide important new ri-parian wildlife and fish habitat, USDAwill retire at least 50,000 miles of con-servation buffers in 1999, the same highlevel as in 1998.
• In 1999, USDA will restore two millionacres of native grassland vegetation (thesame as the 1998 level), and complete con-servation management systems for grazinglands, which help control erosion and
176 THE BUDGET FOR FISCAL YEAR 1999
benefit habitat, on 6.4 million acres, com-pared to six million acres in 1998.
In 1999, the Environmental Quality Incen-tives Program, which provides funds to farm-ers and ranchers to adopt sound conservationpractices and comply with environmental re-quirements, will better target areas of environ-mental need requiring that funding be allo-cated in conservation priority areas.
Federal and non-Federal agencies are carry-ing out long-term restoration plans for severalnationally significant ecosystems, such asthose in South Florida and the CaliforniaBay-Delta. The South Florida ecosystem isa national treasure that includes the Ever-glades and Florida Bay. Its long-term viabilityis critical for the tourism and fishing indus-tries, and for the water supply, economy,and quality of life for South Florida’s sixmillion people. Low water quality in theSan Francisco Bay-San Joaquin Delta eco-system has degraded wildlife habitat, endan-gered several species, and reduced theestuary’s reliability as a water source.
• The U.S. Army Corps of Engineers willcomplete its comprehensive review of thecentral and southern Florida project byJuly 1, 1999, thus providing a master planfor restoring the Everglades while accom-modating other demands for water and re-lated resources in South Florida. By Sep-tember 30, 2002, 10 percent of all knownfederally endangered and threatened spe-cies in South Florida will be able to be‘‘down listed.’’
The Bay-Delta program is undergoing Na-tional Environmental Policy Act review ofthree major alternatives for the Bay-Delta,and it will develop specific, measurable goalsafter the analysis is complete and an alter-native is selected.
The Land and Water Conservation Fund(LWCF) is an important tool for speciesand habitat conservation. It uses the royaltiesof offshore oil and gas leases to help Federal,State, and local governments acquire landfor conservation and outdoor recreation.
• In 1999, LWCF funds will provide for theacquisition of parcels to enhance NationalParks, provide habitat for species, protectour natural and cultural resource heritage,
and improve land ownership patterns forgreater efficiency.
The management of lands, the availabilityand quality of water, and improvements inthe protection of resources is based on soundnatural resources science. The U.S. GeologicalSurvey (USGS) provides research and informa-tion to land managers and the public tobetter understand ecosystems and specieshabitat, land and water resources, and naturalhazards.
• In 1999, USGS, in partnership with otherFederal natural hazards information pro-viders, will develop an integrated disasterinformation network to improve mitigationand preparedness for natural disasters.
• In 1999, USGS will provide water quantityand quality information on 1,000 U.S. wa-tersheds that the Clean Water Action Planidentified as impaired (half of the Nation’swatersheds). These data, together withcompleted water quality assessments, willhelp develop water quality managementmodels that resource managers need toforecast results from changing land use.
The Commerce Department’s National Oce-anic and Atmospheric Administration (NOAA)manages ocean and coastal resources in the20-mile Exclusive Economic Zone. Its NationalOcean Service and National Marine FisheriesService manages 201 fish stocks and 163marine mammal populations. NOAA’s NationalWeather Service (NWS), using data collectedby the National Environmental Satellite andData Information Service, provides weatherforecasts and flood warnings. Its Office ofOceanic and Atmospheric Research providesscience for policy decisions in areas suchas climate change, air quality and ozonedepletion.
• In 1999, NWS’ ongoing modernization willincrease the lead time of flash floodwarnings to 32 minutes and the accuracyof flash flood warnings to 82 percent; in-crease the lead time of severe thunder-storm warnings to 19 minutes and the ac-curacy of severe thunderstorm warnings to84 percent, and achieve a six-month leadtime for El Nino Southern Oscillation fore-casts.
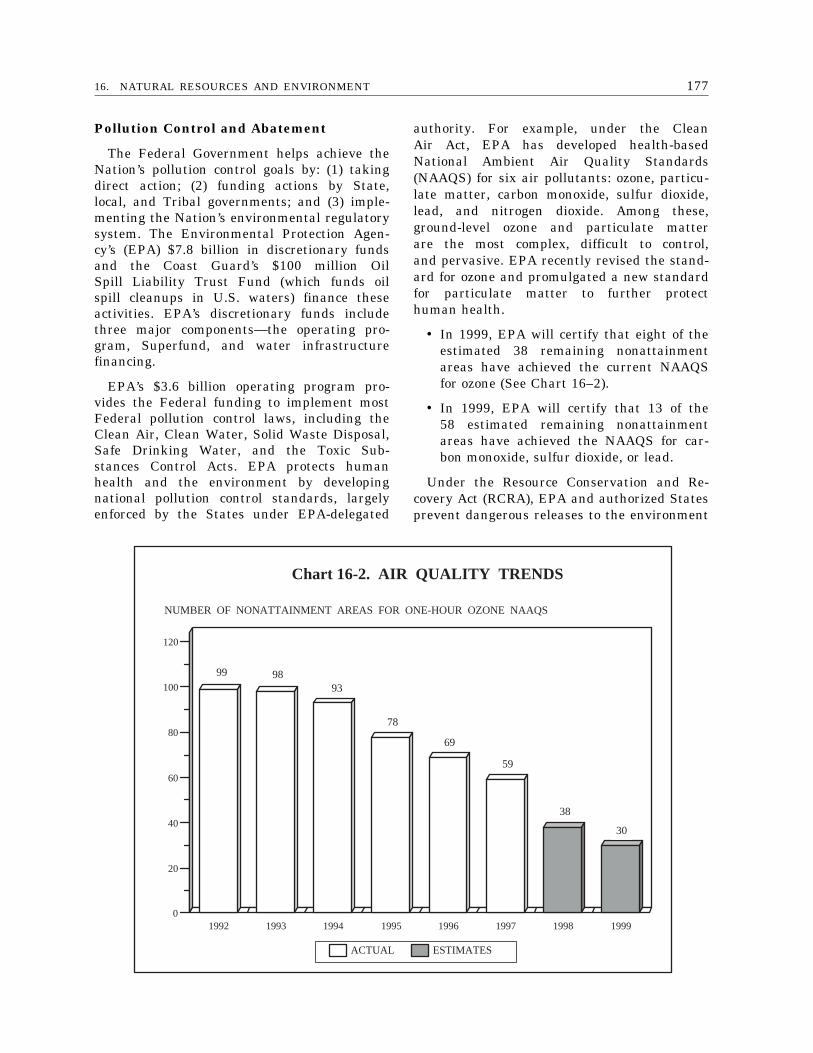
17716. NATURAL RESOURCES AND ENVIRONMENT
1992 1993 1994 1995 1996 1997 1998 19990
20
40
60
80
100
120
NUMBER OF NONATTAINMENT AREAS FOR ONE-HOUR OZONE NAAQS
Chart 16-2. AIR QUALITY TRENDS
ACTUAL ESTIMATES
99 9893
78
69
59
38
30
Pollution Control and Abatement
The Federal Government helps achieve theNation’s pollution control goals by: (1) takingdirect action; (2) funding actions by State,local, and Tribal governments; and (3) imple-menting the Nation’s environmental regulatorysystem. The Environmental Protection Agen-cy’s (EPA) $7.8 billion in discretionary fundsand the Coast Guard’s $100 million OilSpill Liability Trust Fund (which funds oilspill cleanups in U.S. waters) finance theseactivities. EPA’s discretionary funds includethree major components—the operating pro-gram, Superfund, and water infrastructurefinancing.
EPA’s $3.6 billion operating program pro-vides the Federal funding to implement mostFederal pollution control laws, including theClean Air, Clean Water, Solid Waste Disposal,Safe Drinking Water, and the Toxic Sub-stances Control Acts. EPA protects humanhealth and the environment by developingnational pollution control standards, largelyenforced by the States under EPA-delegated
authority. For example, under the CleanAir Act, EPA has developed health-basedNational Ambient Air Quality Standards(NAAQS) for six air pollutants: ozone, particu-late matter, carbon monoxide, sulfur dioxide,lead, and nitrogen dioxide. Among these,ground-level ozone and particulate matterare the most complex, difficult to control,and pervasive. EPA recently revised the stand-ard for ozone and promulgated a new standardfor particulate matter to further protecthuman health.
• In 1999, EPA will certify that eight of theestimated 38 remaining nonattainmentareas have achieved the current NAAQSfor ozone (See Chart 16–2).
• In 1999, EPA will certify that 13 of the58 estimated remaining nonattainmentareas have achieved the NAAQS for car-bon monoxide, sulfur dioxide, or lead.
Under the Resource Conservation and Re-covery Act (RCRA), EPA and authorized Statesprevent dangerous releases to the environment
178 THE BUDGET FOR FISCAL YEAR 1999
of hazardous, industrial nonhazardous, andmunicipal solid wastes by requiring properfacility management. EPA and authorizedStates also implement the RCRA correctiveaction program to clean up environmentalcontamination at sites where hazardous wastesare being stored, treated, or disposed.
• In 1999, 153 more hazardous waste man-agement facilities will have approved con-trols in place to prevent dangerous re-leases to air, soil, and groundwater, fora total of 2,080 facilities (62 percent ofthe total outstanding).
Superfund’s $2.1 billion program pays toclean up hazardous spills and abandonedhazardous waste sites, and to compel respon-sible parties to clean up. The Coast Guardimplements a smaller but similar programto clean up oil spills. Superfund also supportsthe Federal ‘‘Brownfields’’ program, designedto assess, clean up, and re-use formerlycontaminated sites.
• In 1999, EPA will complete 136 cleanups,in order to reach 900 completed cleanups(60 percent of those outstanding) by theend of 2001.
• In 1999, EPA will fund Brownfields siteassessments in 100 more communities, inorder to reach 300 communities by the endof 2000.
• In 1999, the Coast Guard will reduce theamount of oil that marine sources spillinto the water by 20 percent below the1993 level of 7.76 gallons per million gal-lons shipped.
Federal water infrastructure funds providecapitalization grants to State revolving funds,which make low-interest loans to help munici-palities pay for wastewater and drinkingwater treatment systems required by Federallaw. The Administration plans to capitalizethese funds to the point where the CleanWater State Revolving Funds and the Drink-ing Water State Revolving Funds providea total of $2.5 billion in average annualassistance. The more than $68 billion inFederal assistance since passage of the 1972Clean Water Act has dramatically increasedthe portion of Americans enjoying betterquality water.
• In 1999, another three million people willreceive the benefits of secondary treatmentof wastewater, for a total of 183 million.
• In 1999, 85 percent of the populationserved by community water systems willreceive drinking water meeting all health-based standards, up from 81 percent in1994.
USDA gives financial assistance to ruralcommunities to provide safe drinking waterand adequate wastewater treatment facilitiesto rural communities. The budget proposes$1.3 billion in combined grant, loan, andloan guarantees for this assistance.
• The Water 2000 initiative is bringing in-door plumbing and safe drinking water tounder-served rural communities, andUSDA plans to fund 250 Water 2000 facili-ties in 1999.
Water Resources
The Federal Government builds and man-ages water projects for navigation, flood con-trol, irrigation, and hydropower generation.The Army Corps of Engineers operates Nation-wide, while Interior’s Bureau of Reclamationoperates in the 17 Western States. Thebudget proposes $4.1 billion for the agenciesin 1999—$3.2 billion for the Corps, $0.9billion for the Bureau. The Administrationwill work with Congress to address theproblem of project delays and growing futureliabilities that result from Congress’ additionof many new projects in 1998.
While navigation and flood damage reduc-tion remain the Corps’ major focus, itsprojects, programs, and regulatory responsibil-ities increasingly address environmental objec-tives, including wetlands protection.
• In 1999, the Corps expects to maintainits commercial navigation and flood dam-age facilities so that they will be fullyoperational at least 95 percent of the time.
• In 1999, the Corps’ regulatory program ex-pects to achieve ‘‘no net loss’’ of wetlandsby creating, enhancing, and restoring wet-lands functions and values that are com-parable to those lost when the Corps al-lows wetlands to be developed.
17916. NATURAL RESOURCES AND ENVIRONMENT
Congress created the Bureau of Reclamationto support economic development in the Westby financing and constructing reliable watersupplies for irrigation and power generation.The West is now developed, and the Bureauis remaking itself into a customer-oriented‘‘water resources management’’ agency by pro-viding expertise on improved water manage-ment practices. The budget also proposesfunding for several local projects that reclaimand reuse wastewater in urban areas inorder to demonstrate the benefits of thisalternative to constructing more dams andreservoirs.
• In 1999, the Bureau plans to completeevaluations of current practices on at leastone project in each of its 26 area offices,with the goal of finding ways to more ef-fectively manage competing demands forwater.
Tax Incentives
State and local governments (and privatecompanies) benefit from a tax break, costingabout $600 million in 1999, that allowsState and local governments to constructprivate waste disposal facilities with tax-exempt bonds. The tax code also offers incen-tives for natural resource industries, especiallytimber and mining. The timber industry candeduct certain costs for growing timber, paylower capital gains rates on profits, takea credit for investments, and quickly write-off reforestation costs—in total, costing about$600 million in 1999. The mining industrybenefits from percentage depletion provisions(which allow deductions that exceed the eco-nomic value of resource depletion) and candeduct certain exploration and developmentcosts—together, costing about $400 millionin 1999.

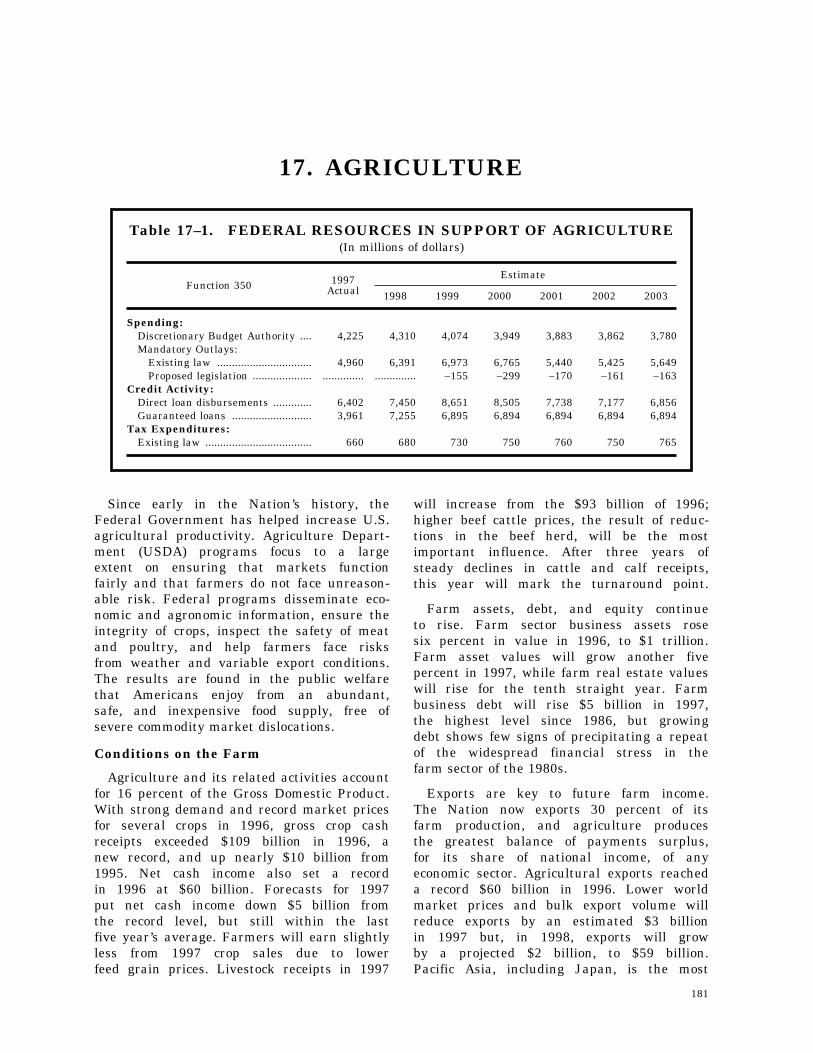
181
17. AGRICULTURE
Table 17–1. FEDERAL RESOURCES IN SUPPORT OF AGRICULTURE(In millions of dollars)
Function 350 1997Actual
Estimate
1998 1999 2000 2001 2002 2003
Spending:Discretionary Budget Authority .... 4,225 4,310 4,074 3,949 3,883 3,862 3,780Mandatory Outlays:
Existing law ................................ 4,960 6,391 6,973 6,765 5,440 5,425 5,649Proposed legislation .................... .............. .............. –155 –299 –170 –161 –163
Credit Activity:Direct loan disbursements ............. 6,402 7,450 8,651 8,505 7,738 7,177 6,856Guaranteed loans ........................... 3,961 7,255 6,895 6,894 6,894 6,894 6,894
Tax Expenditures:Existing law .................................... 660 680 730 750 760 750 765
Since early in the Nation’s history, theFederal Government has helped increase U.S.agricultural productivity. Agriculture Depart-ment (USDA) programs focus to a largeextent on ensuring that markets functionfairly and that farmers do not face unreason-able risk. Federal programs disseminate eco-nomic and agronomic information, ensure theintegrity of crops, inspect the safety of meatand poultry, and help farmers face risksfrom weather and variable export conditions.The results are found in the public welfarethat Americans enjoy from an abundant,safe, and inexpensive food supply, free ofsevere commodity market dislocations.
Conditions on the Farm
Agriculture and its related activities accountfor 16 percent of the Gross Domestic Product.With strong demand and record market pricesfor several crops in 1996, gross crop cashreceipts exceeded $109 billion in 1996, anew record, and up nearly $10 billion from1995. Net cash income also set a recordin 1996 at $60 billion. Forecasts for 1997put net cash income down $5 billion fromthe record level, but still within the lastfive year’s average. Farmers will earn slightlyless from 1997 crop sales due to lowerfeed grain prices. Livestock receipts in 1997
will increase from the $93 billion of 1996;higher beef cattle prices, the result of reduc-tions in the beef herd, will be the mostimportant influence. After three years ofsteady declines in cattle and calf receipts,this year will mark the turnaround point.
Farm assets, debt, and equity continueto rise. Farm sector business assets rosesix percent in value in 1996, to $1 trillion.Farm asset values will grow another fivepercent in 1997, while farm real estate valueswill rise for the tenth straight year. Farmbusiness debt will rise $5 billion in 1997,the highest level since 1986, but growingdebt shows few signs of precipitating a repeatof the widespread financial stress in thefarm sector of the 1980s.
Exports are key to future farm income.The Nation now exports 30 percent of itsfarm production, and agriculture producesthe greatest balance of payments surplus,for its share of national income, of anyeconomic sector. Agricultural exports reacheda record $60 billion in 1996. Lower worldmarket prices and bulk export volume willreduce exports by an estimated $3 billionin 1997 but, in 1998, exports will growby a projected $2 billion, to $59 billion.Pacific Asia, including Japan, is the most
182 THE BUDGET FOR FISCAL YEAR 1999
important region for U.S. farm exports, ac-counting for 42 percent of total U.S. exportsales in 1996. Consequently, the financialturmoil in certain Asian countries could affectU.S. exports.
The 1996 Farm Bill
Known officially as the Federal AgricultureImprovement and Reform Act (FAIR) of 1996,the Farm Bill was a milestone in U.S.agricultural policy. The bill, effective through2002, fundamentally redesigns Federal incomesupport and supply management programsfor producers of wheat, corn, grain sorghum,barley, oats, rice, and cotton. It expandsthe market-oriented policies of the previoustwo major farm bills, which have graduallyreduced the Federal influence in the agricul-tural sector.
Under previous laws dating to the 1930s,farmers who reduced plantings when priceswere low could get income support payments,but farmers had to plant specific crops inorder to receive support payments. Evenwhen market signals might have suggestedplanting a different crop, farmers had limitedflexibility to do so. By contrast, the 1996Farm Bill eliminated most such restrictionsand, instead, provides fixed, but decliningpayments to eligible farmers through 2002,regardless of market prices or productionvolume. Thus, the law ‘‘decouples’’ Federalincome support from planting decisions andmarket prices. Not surprisingly, the law hasbrought significant changes in cropped acreagein response to market signals. In 1997,wheat acreage fell by seven percent, or almostfive million acres, from the previous year,while soybean acreage rose by 10 percent,or almost seven million acres.
Federal Programs
USDA seeks to enhance the quality oflife for the American people by supportingproduction agriculture; ensuring a safe, afford-able, nutritious, and accessible food supply;caring for agricultural, forest, and rangelands; supporting sound development of ruralcommunities; providing economic opportunitiesfor farm and rural residents; expanding globalmarkets for agricultural and forest productsand services; and working to reduce hungerin America and throughout the world. (Some
of these missions fall within other budgetfunctions and, thus, are described in otherchapters.)
Farming is a risky business. Farmers notonly face the normal vagaries of supplyand demand, but also uncontrollable riskfrom Mother Nature. Federal programs aredesigned to accomplish two key economicgoals: (1) enhance the economic safety netfor farmers and ranchers; and (2) open,expand, and maintain global market opportu-nities for agricultural producers.
The Government mitigates risk througha variety of programs:
Farm Commodity Programs: Since Fed-eral payments are now fixed, farm incomecould fluctuate more from year to year dueto supply and demand changes. Farmers willneed to rely more on marketing alternatives.To better use Federal assistance to protectagainst risk and stabilize farm income, produc-ers should set aside funds from, or otherwisedevelop strategies to utilize, the income-sup-port payments, allocating savings from yearsof high income for use when income falls. (SeeChart 17–1 for the estimated increased Fed-eral income-support payments due to the 1996Farm Bill.) The Federal Government, however,continues to provide other safety-net protec-tions, such as the marketing assistance loansthat guarantee a minimum price for majorcommodities.
Insurance: USDA helps farmers managetheir risks by providing subsidized crop insur-ance, delivered through the private sector.Farmers pay no premiums for coverage againstcatastrophic production losses, and the Gov-ernment subsidizes their premiums for addi-tional coverage. Over the past three years, anaverage 80 percent of eligible acres have beeninsured, with an average gain of $0.10 forevery $1 in insurance premiums—down fromthe historical average of $0.40 loss for every$1 in premium. Crop insurance costs the Fed-eral Government about $1.4 billion a year, in-cluding USDA payments to private companiesfor costs tied to administering Federal crop in-surance. Since the Farm Bill ended major ele-ments of USDA’s traditional price and incomesupport programs, producers now bear mostof the price risk. In 1997, USDA expandedseveral insurance products that mitigate ‘‘reve-
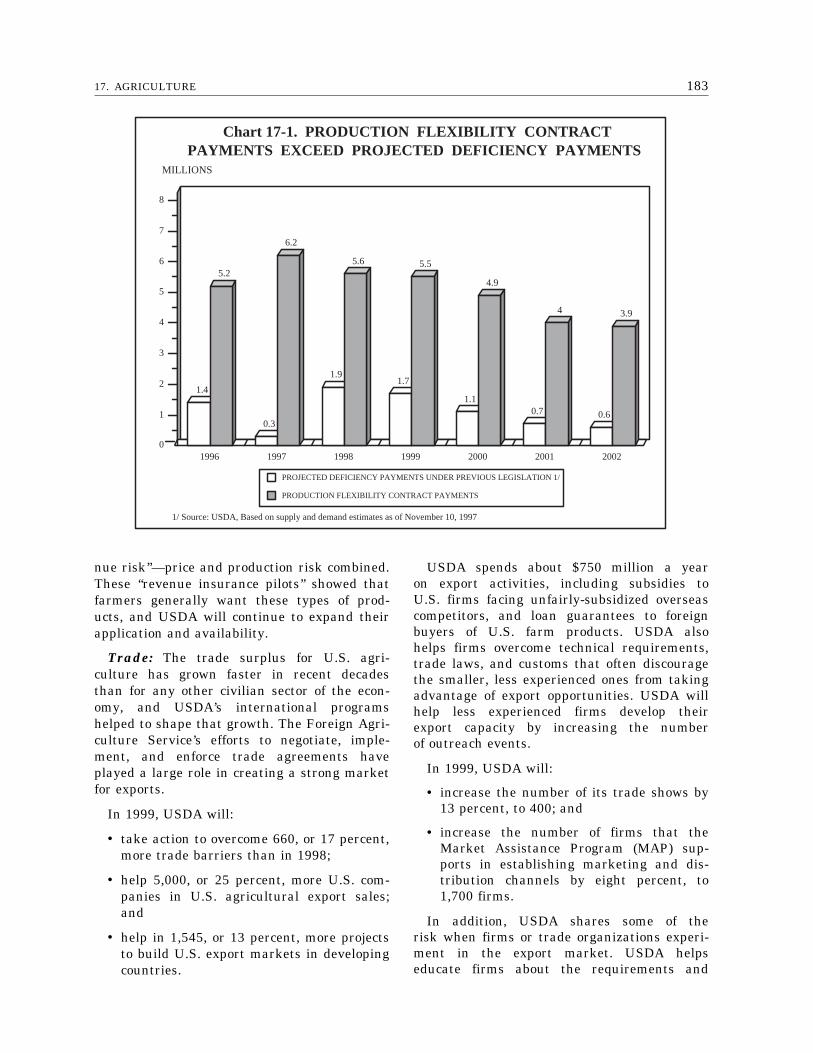
18317. AGRICULTURE
1.4
5.2
0.3
6.2
1.9
5.6
1.7
5.5
1.1
4.9
0.7
4
0.6
3.9
1996 1997 1998 1999 2000 2001 20020
1
2
3
4
5
6
7
8
MILLIONS
PROJECTED DEFICIENCY PAYMENTS UNDER PREVIOUS LEGISLATION 1/
PRODUCTION FLEXIBILITY CONTRACT PAYMENTS
1/ Source: USDA, Based on supply and demand estimates as of November 10, 1997
Chart 17-1. PRODUCTION FLEXIBILITY CONTRACT PAYMENTS EXCEED PROJECTED DEFICIENCY PAYMENTS
nue risk’’—price and production risk combined.These ‘‘revenue insurance pilots’’ showed thatfarmers generally want these types of prod-ucts, and USDA will continue to expand theirapplication and availability.
Trade: The trade surplus for U.S. agri-culture has grown faster in recent decadesthan for any other civilian sector of the econ-omy, and USDA’s international programshelped to shape that growth. The Foreign Agri-culture Service’s efforts to negotiate, imple-ment, and enforce trade agreements haveplayed a large role in creating a strong marketfor exports.
In 1999, USDA will:
• take action to overcome 660, or 17 percent,more trade barriers than in 1998;
• help 5,000, or 25 percent, more U.S. com-panies in U.S. agricultural export sales;and
• help in 1,545, or 13 percent, more projectsto build U.S. export markets in developingcountries.
USDA spends about $750 million a yearon export activities, including subsidies toU.S. firms facing unfairly-subsidized overseascompetitors, and loan guarantees to foreignbuyers of U.S. farm products. USDA alsohelps firms overcome technical requirements,trade laws, and customs that often discouragethe smaller, less experienced ones from takingadvantage of export opportunities. USDA willhelp less experienced firms develop theirexport capacity by increasing the numberof outreach events.
In 1999, USDA will:
• increase the number of its trade shows by13 percent, to 400; and
• increase the number of firms that theMarket Assistance Program (MAP) sup-ports in establishing marketing and dis-tribution channels by eight percent, to1,700 firms.
In addition, USDA shares some of therisk when firms or trade organizations experi-ment in the export market. USDA helpseducate firms about the requirements and
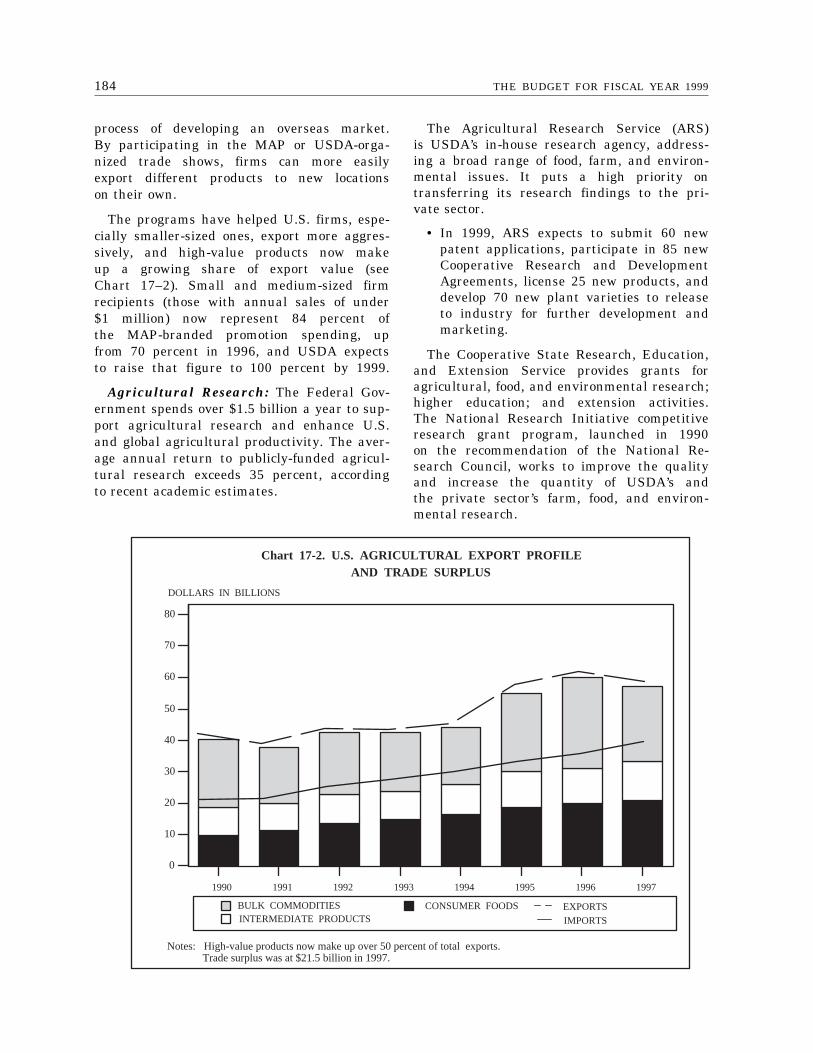
184 THE BUDGET FOR FISCAL YEAR 1999
1990 1991 1992 1993 1994 1995 1996 1997
0
10
20
30
40
50
60
70
80
DOLLARS IN BILLIONS
BULK COMMODITIESINTERMEDIATE PRODUCTS
CONSUMER FOODS
Chart 17-2. U.S. AGRICULTURAL EXPORT PROFILE AND TRADE SURPLUS
IMPORTS
EXPORTS
Notes: High-value products now make up over 50 percent of total exports. Trade surplus was at $21.5 billion in 1997.
process of developing an overseas market.By participating in the MAP or USDA-orga-nized trade shows, firms can more easilyexport different products to new locationson their own.
The programs have helped U.S. firms, espe-cially smaller-sized ones, export more aggres-sively, and high-value products now makeup a growing share of export value (seeChart 17–2). Small and medium-sized firmrecipients (those with annual sales of under$1 million) now represent 84 percent ofthe MAP-branded promotion spending, upfrom 70 percent in 1996, and USDA expectsto raise that figure to 100 percent by 1999.
Agricultural Research: The Federal Gov-ernment spends over $1.5 billion a year to sup-port agricultural research and enhance U.S.and global agricultural productivity. The aver-age annual return to publicly-funded agricul-tural research exceeds 35 percent, accordingto recent academic estimates.
The Agricultural Research Service (ARS)is USDA’s in-house research agency, address-ing a broad range of food, farm, and environ-mental issues. It puts a high priority ontransferring its research findings to the pri-vate sector.
• In 1999, ARS expects to submit 60 newpatent applications, participate in 85 newCooperative Research and DevelopmentAgreements, license 25 new products, anddevelop 70 new plant varieties to releaseto industry for further development andmarketing.
The Cooperative State Research, Education,and Extension Service provides grants foragricultural, food, and environmental research;higher education; and extension activities.The National Research Initiative competitiveresearch grant program, launched in 1990on the recommendation of the National Re-search Council, works to improve the qualityand increase the quantity of USDA’s andthe private sector’s farm, food, and environ-mental research.

18517. AGRICULTURE
Economic Research and Statistics: TheFederal Government spends about $160 mil-lion to improve U.S. agricultural competitive-ness by reporting and analyzing economic in-formation. The Economic Research Service pro-vides economic and other social science infor-mation and analysis for decision-making on ag-riculture, food, natural resources, and ruralAmerica. The National Agricultural StatisticsService (NASS) develops estimates of produc-tion, supply, price, and other aspects of thefarm economy.
• In 1999, NASS will include over 95 per-cent of national agricultural production inits annual commodities program, up from92 percent in 1997.
Inspection and Market Regulation: TheGovernment spends a half-billion dollars ayear to secure U.S. cropland from pests anddiseases and make U.S. crops more market-able. In addition, USDA’s Food Safety and In-spection Service ensures that U.S. meat andpoultry do not threaten consumers’ health. TheAnimal and Plant Health Inspection Service(APHIS) inspects agricultural products thatenter the country; controls and eradicates dis-eases and infestations; helps control damageto livestock and crops from animals; and mon-itors plant and animal health and welfare. TheAgricultural Marketing Service (AMS) and theGrain Inspection, Packers, and Stockyards Ad-ministration help market U.S. farm productsin domestic and global markets, ensure fairtrading practices, and promote a competitive,efficient marketplace.
In 1999, APHIS will:
• make about 48 million inspections of air-line passengers, aircraft, commercial ves-sels, trucks, and rail cars to prevent theentry of illegal plants and animals thatcould endanger U.S. agriculture, a slightincrease over estimated 1998 levels.
• clear most international air passengersthrough its inspection process in 30 min-utes or less, an estimated 20-percent im-provement over 1997 rates.
• clear most passengers crossing U.S. landborders in non-peak traffic periods in 20minutes or less on the northern border,
and 30 minutes or less on the southernborder.
In 1999, the AMS Pesticide Data Programwill:
• initiate a microbiological surveillance pro-gram on domestic and imported fruits andvegetables as part of the President’s FoodSafety Initiative.
• perform about 55,000 analyses on 14 dif-ferent commodities, collecting 9,200 sam-ples to measure pesticide residues, an in-crease from the estimated 1998 activitiesof 51,000 analyses, 13 commodities, and8,900 samples.
Conservation: The 1996 Farm Bill is themost conservation-oriented farm bill in history,enabling USDA to provide incentives to farm-ers to protect the natural resource base of U.S.agriculture. Farmers can now use crop rota-tions, which earlier price support programshad severely limited. Also, the bill created sev-eral new programs. The Environmental Qual-ity Incentives Program (EQIP), with $200 mil-lion in annual spending (and another $100 mil-lion proposed for 1999) provides cost-share andincentive payments to encourage farmers toadopt new and improved farming practices ortechnology, and it reduces the environmentalimpact of livestock operations. Farmers mayuse different nutrient management or pest pro-tection approaches, with USDA offering finan-cial assistance to offset some of the risk. TheConservation Farm Option program helpslandowners adopt innovative approaches to im-proving environmental quality; groups of farm-ers may submit proposals to create comprehen-sive conservation farm plans, with a host ofdifferent land use and funding alternatives.
USDA’s conservation programs give tech-nical and financial help to farmers andcommunities. They include the Conservationand Wetlands Reserve Programs, which re-move land from farm uses; and the Conserva-tion Operations program, which provides tech-nical assistance.
In 1999, USDA will:
• increase the number of acres enrolled eachyear for riparian buffers and filter stripsto 3.76 million, from an estimated 3.36million acres in 1998; and
186 THE BUDGET FOR FISCAL YEAR 1999
• increase the acreage of restored wetlandsto 1.34 million acres, from an estimated1.2 million acres in 1998.
For more information on conservation, andUSDA’s investments in public land manage-ment, see Chapter 16, ‘‘Natural Resourcesand Environment.’’ USDA programs also helpto maintain vital rural communities, as de-scribed in Chapter 20, ‘‘Community and Re-gional Development.’’
Agricultural Credit: USDA provides about$600 million a year in direct loans and over$2.5 billion in guaranteed loans for farm oper-ating and ownership. Direct loans, which carryinterest rates at or below those on Treasurysecurities, generally go to beginning or sociallydisadvantaged farmers who cannot secure pri-vate credit.
In 1999, USDA will:
• increase the proportion of loans made tobeginning and socially-disadvantagedfarmers to 14.4 percent, from an estimated12.6 percent in 1998 and nine percent in1996; and
• reduce the delinquency rate on farm loansto 17 percent, from an estimated 18 per-cent in 1998 and 20 percent in 1996.
The Farm Credit System and ‘‘FarmerMac’’—both Government-Sponsored Enter-prises—enhance the supply of farm creditthrough ties to national and global credit
markets. The Farm Credit System (whichlends directly to farmers) has recovered strong-ly from its financial problems of the 1980s,in part through Federal help. Farmer Macincreases the liquidity of commercial banksand the Farm Credit System by purchasingagricultural loans. In 1996, Congress gavethe institution authority to pool loans aswell as more years to attain required capitalstandards, which it has largely achieved al-ready.
Personnel, Infrastructure, and the Regu-latory Burden: USDA administers its manyfarm programs through 2,500 county officeswith over 17,000 staff. The Farm Bill signifi-cantly cut USDA’s workload, prompting the de-partment to re-examine its staff-intensive fieldoffice-based infrastructure. In 1998, USDAwill: (1) conduct a study to find ways to oper-ate more efficiently; (2) continue an Adminis-tration initiative to scrap duplicative and un-necessary regulations and paperwork; and (3)review and upgrade its computer systems tostreamline its collection of information fromfarmers and better disseminate informationacross USDA agencies.
In 1999, USDA will:
• merge the headquarters and State officeadministrative support staffs for its fieldoffice agencies (Farm Services Agency,Natural Resources Conservation Service,Rural Development) to provide more effi-cient and coordinated support services.
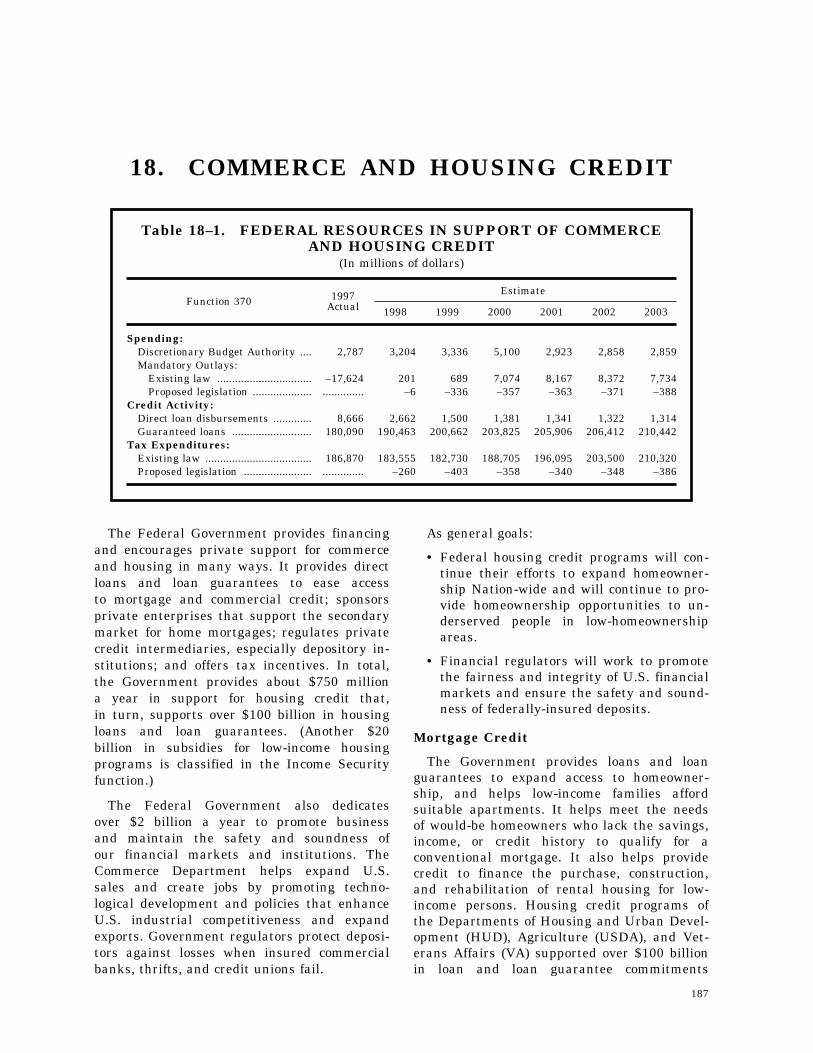
187
18. COMMERCE AND HOUSING CREDIT
Table 18–1. FEDERAL RESOURCES IN SUPPORT OF COMMERCEAND HOUSING CREDIT
(In millions of dollars)
Function 370 1997Actual
Estimate
1998 1999 2000 2001 2002 2003
Spending:Discretionary Budget Authority .... 2,787 3,204 3,336 5,100 2,923 2,858 2,859Mandatory Outlays:
Existing law ................................ –17,624 201 689 7,074 8,167 8,372 7,734Proposed legislation .................... .............. –6 –336 –357 –363 –371 –388
Credit Activity:Direct loan disbursements ............. 8,666 2,662 1,500 1,381 1,341 1,322 1,314Guaranteed loans ........................... 180,090 190,463 200,662 203,825 205,906 206,412 210,442
Tax Expenditures:Existing law .................................... 186,870 183,555 182,730 188,705 196,095 203,500 210,320Proposed legislation ....................... .............. –260 –403 –358 –340 –348 –386
The Federal Government provides financingand encourages private support for commerceand housing in many ways. It provides directloans and loan guarantees to ease accessto mortgage and commercial credit; sponsorsprivate enterprises that support the secondarymarket for home mortgages; regulates privatecredit intermediaries, especially depository in-stitutions; and offers tax incentives. In total,the Government provides about $750 milliona year in support for housing credit that,in turn, supports over $100 billion in housingloans and loan guarantees. (Another $20billion in subsidies for low-income housingprograms is classified in the Income Securityfunction.)
The Federal Government also dedicatesover $2 billion a year to promote businessand maintain the safety and soundness ofour financial markets and institutions. TheCommerce Department helps expand U.S.sales and create jobs by promoting techno-logical development and policies that enhanceU.S. industrial competitiveness and expandexports. Government regulators protect deposi-tors against losses when insured commercialbanks, thrifts, and credit unions fail.
As general goals:
• Federal housing credit programs will con-tinue their efforts to expand homeowner-ship Nation-wide and will continue to pro-vide homeownership opportunities to un-derserved people in low-homeownershipareas.
• Financial regulators will work to promotethe fairness and integrity of U.S. financialmarkets and ensure the safety and sound-ness of federally-insured deposits.
Mortgage Credit
The Government provides loans and loanguarantees to expand access to homeowner-ship, and helps low-income families affordsuitable apartments. It helps meet the needsof would-be homeowners who lack the savings,income, or credit history to qualify for aconventional mortgage. It also helps providecredit to finance the purchase, construction,and rehabilitation of rental housing for low-income persons. Housing credit programs ofthe Departments of Housing and Urban Devel-opment (HUD), Agriculture (USDA), and Vet-erans Affairs (VA) supported over $100 billionin loan and loan guarantee commitments
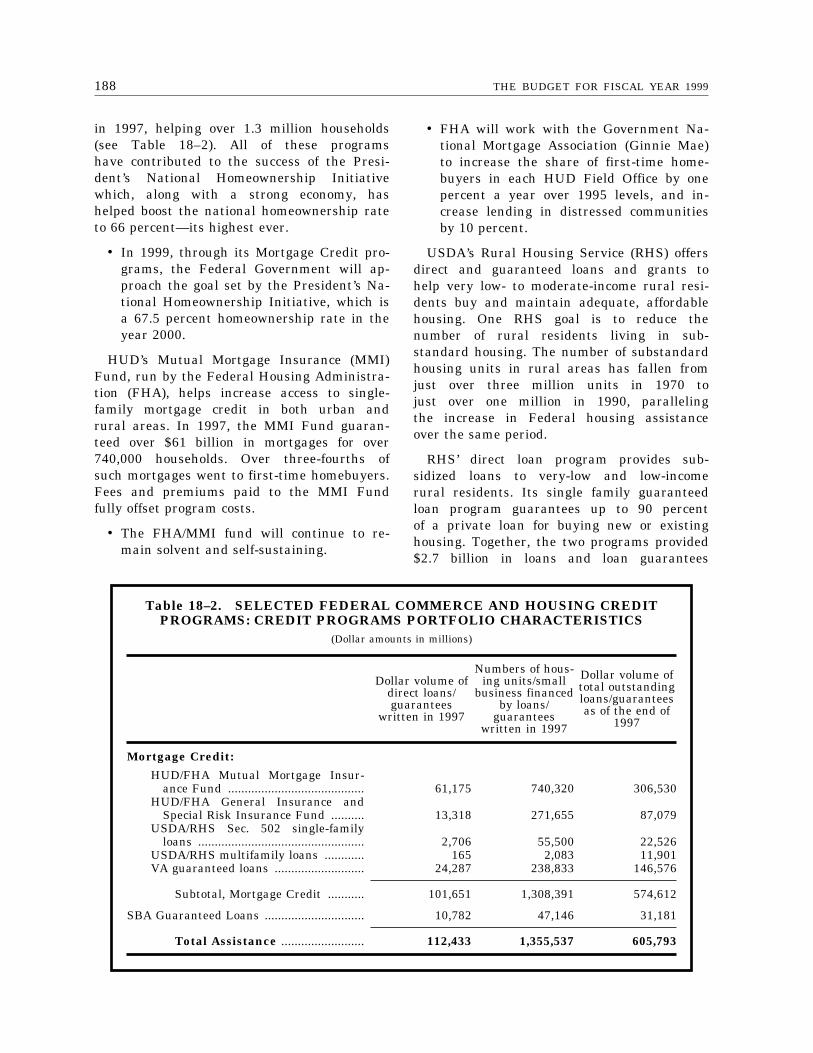
188 THE BUDGET FOR FISCAL YEAR 1999
Table 18–2. SELECTED FEDERAL COMMERCE AND HOUSING CREDITPROGRAMS: CREDIT PROGRAMS PORTFOLIO CHARACTERISTICS
(Dollar amounts in millions)
Dollar volume ofdirect loans/guarantees
written in 1997
Numbers of hous-ing units/small
business financedby loans/
guaranteeswritten in 1997
Dollar volume oftotal outstandingloans/guaranteesas of the end of
1997
Mortgage Credit:
HUD/FHA Mutual Mortgage Insur-ance Fund ......................................... 61,175 740,320 306,530
HUD/FHA General Insurance andSpecial Risk Insurance Fund .......... 13,318 271,655 87,079
USDA/RHS Sec. 502 single-familyloans .................................................. 2,706 55,500 22,526
USDA/RHS multifamily loans ............ 165 2,083 11,901VA guaranteed loans ........................... 24,287 238,833 146,576
Subtotal, Mortgage Credit ........... 101,651 1,308,391 574,612
SBA Guaranteed Loans .............................. 10,782 47,146 31,181
Total Assistance ......................... 112,433 1,355,537 605,793
in 1997, helping over 1.3 million households(see Table 18–2). All of these programshave contributed to the success of the Presi-dent’s National Homeownership Initiativewhich, along with a strong economy, hashelped boost the national homeownership rateto 66 percent—its highest ever.
• In 1999, through its Mortgage Credit pro-grams, the Federal Government will ap-proach the goal set by the President’s Na-tional Homeownership Initiative, which isa 67.5 percent homeownership rate in theyear 2000.
HUD’s Mutual Mortgage Insurance (MMI)Fund, run by the Federal Housing Administra-tion (FHA), helps increase access to single-family mortgage credit in both urban andrural areas. In 1997, the MMI Fund guaran-teed over $61 billion in mortgages for over740,000 households. Over three-fourths ofsuch mortgages went to first-time homebuyers.Fees and premiums paid to the MMI Fundfully offset program costs.
• The FHA/MMI fund will continue to re-main solvent and self-sustaining.
• FHA will work with the Government Na-tional Mortgage Association (Ginnie Mae)to increase the share of first-time home-buyers in each HUD Field Office by onepercent a year over 1995 levels, and in-crease lending in distressed communitiesby 10 percent.
USDA’s Rural Housing Service (RHS) offersdirect and guaranteed loans and grants tohelp very low- to moderate-income rural resi-dents buy and maintain adequate, affordablehousing. One RHS goal is to reduce thenumber of rural residents living in sub-standard housing. The number of substandardhousing units in rural areas has fallen fromjust over three million units in 1970 tojust over one million in 1990, parallelingthe increase in Federal housing assistanceover the same period.
RHS’ direct loan program provides sub-sidized loans to very-low and low-incomerural residents. Its single family guaranteedloan program guarantees up to 90 percentof a private loan for buying new or existinghousing. Together, the two programs provided$2.7 billion in loans and loan guarantees
18918. COMMERCE AND HOUSING CREDIT
in 1997, providing 55,500 decent, safe afford-able homes for rural Americans.
In 1999, RHS will continue to reducethe number of rural residents living in sub-standard housing by:
• providing $4 billion in loan and loan guar-antees for 65,000 new or improved homes,a 9,500, or 14.6 percent, increase over1997.
VA recognizes the service that veteransand active duty personnel provide to theNation by helping them buy and retainhomes. The Government partially guaranteesthe loans from private lenders, providing$26 billion in loan guarantees in 1997.
• To meet the goal of ensuring that the pro-gram meets veterans’ needs, VA will im-prove credit and program management. In1999, VA will begin implementing elec-tronic data interchange in loan originationand servicing.
• To meet the goal of improving opportuni-ties for veterans to achieve homeowner-ship, VA will collaborate with interestedagencies to provide more and better oppor-tunities to finance veteran home pur-chases. In 1999, VA will collaborate withthe Departments of Housing and UrbanDevelopment and of Defense.
Congress created Ginnie Mae in 1968 tosupport the secondary market for FHA, VA,and USDA mortgages. Ginnie Mae guaranteesthe timely payment of principal and intereston securities backed by pools of mortgagesissued by private institutions. The programraises liquidity in the secondary market andattracts new sources of capital for loans.To date, Ginnie Mae has originated over$1.3 trillion in securities, of which over$530 billion remain outstanding. It has helpedover 20 million low- and moderate-incomefamilies buy homes.
• In 1999, Ginnie Mae will continue to pool95 percent of FHA and VA loans for saleto investors, increasing the efficiency ofthe mortgage markets and lowering fi-nancing costs for home buyers.
The Federal National Mortgage Association(Fannie Mae), the Federal Home Loan Mort-gage Corporation (Freddie Mac), and the
Federal Home Loan Bank System (FHLBS)are congressionally chartered, shareholder-owned corporations known as GovernmentSponsored Enterprises (GSEs). GSEs werechartered to provide stability in the secondarymarket for residential mortgages, and promoteaccess to mortgage credit throughout theNation, including under-served areas. FannieMae and Freddie Mac issue and guaranteemortgage-backed securities (MBS), and theyhold debt-financed portfolios of mortgages,MBS, and other mortgage-related securities.The FHLBS provides liquidity to mortgagelenders by making collateralized loans, calledadvances, which totaled $182 billion at theend of 1997. Because they are classifiedas private, the Federal Government doesnot include GSEs in the budget totals.
Each year, HUD sets housing goals forFannie Mae and Freddie Mac with regardto lower-income families and under-servedcommunities. For a discussion of these goals,see Chapter 8, ‘‘Underwriting Federal Creditand Insurance,’’ in Analytical Perspectives.
Rental Housing and Homeless Assistance
The Federal Government provides housingassistance through a number of HUD pro-grams in the Income Security function. HUD’srental programs provided subsidies for over4.8 million low-income households in 1997—1.4 million for units in conventional publichousing projects; 1.8 million in rental subsidiesattached to privately-owned multifamily hous-ing projects; and 1.6 million in rental vouchersnot tied to specific projects. In addition,USDA’s RHS rental assistance grants tolow-income rural households provided $524million to support 39,860 new and existingrental units in 1997.
For 1999, agencies will meet the followingperformance goals:
• Continue RHS’ commitment of 40,000 newand existing units in 1999.
• Increase the percentage of families withchildren in public housing deriving mostof their income from work from 37 percentin 1997 to 43 percent by 2000.
• Reduce the isolation of low-income groupswithin a community or geographic area byincreasing the percentage of Section 8
190 THE BUDGET FOR FISCAL YEAR 1999
families with children living in low-pov-erty Census tracts from 60 percent in 1997to 65 percent in 2000.
The Federal Government also makes grantsto help the homeless, supporting emergencyshelters and transitional and permanent hous-ing. Four agencies—HUD, VA, the Departmentof Health and Human Services (HHS), andthe Federal Emergency Management Agency—provide 98 percent of the Federal help targetedto the homeless. For 1997, HUD provided$823 million in homeless assistance grants,representing 58 percent of the $1.42 billiontargeted Government-wide funding total.
• In 1999, HHS will expand its outreach ofservices from 80,000 persons contacted in1997 to 92,000 in 1999.
Housing Tax Incentives
The Government provides significant sup-port for housing through tax preferences.The two largest tax benefits are the mortgageinterest deduction for owner-occupied homes(which will cost the Government $299 billionfrom 1999 to 2003) and the deductibilityof State and local property tax on owner-occupied homes (costing $100 billion overthe same five years).
Other tax provisions also encourage invest-ment in housing: (1) capital gains of upto $500,000 on home sales are exempt fromtaxes (costing $51 billion from 1999 to 2003);(2) States and localities can issue tax-exemptmortgage revenue bonds, whose proceeds sub-sidize purchases by first-time, low- and mod-erate-income home buyers; and (3) installmentsales provisions let some real estate sellersdefer taxes. Finally, the low-income housingtax credit provides incentives for constructingor renovating rental housing that helps low-income tenants for at least 15 years. Thistax expenditure costs about $2.4 billion ayear. The President proposes to raise thevolume cap on the low-income housing taxcredit, thus providing more credits and morehousing for low-income families.
Commerce, Technology, and InternationalTrade
The Commerce Department promotes thedevelopment of technology and advocatessound technology policies. Commerce’s Patent
and Trademark Office (PTO) protects U.S.intellectual property rights around the worldthrough bilateral and multilateral negotiation,and through its domestic patent and trade-mark system.
• In 1999, PTO will issue over 120,000 pat-ents, and reduce the average pendencytime for each invention from 22.7 monthsto an average of 20.9 months.
• In 1999, PTO will reduce the averagependency for each trademark from the cur-rent 16.5 months to an average of 15.5months.
• To promote intellectual property protectionoverseas, PTO will provide technical as-sistance to 52 developing countries.
Commerce’s National Institute of Standardsand Technology (NIST) works with industryto develop and apply technology, measure-ments, and standards. NIST administers theManufacturing Extension Partnership (MEP),which provides technological information andexpertise to its clients among the Nation’s382,000 smaller manufacturers.
• In 1999, NIST will increase sales of itscollected standard reference materials to38,142, and its labs will perform 8,900calibrations and tests, yielding $7 millionin revenue.
• In 1999, MEP will improve its coverageof small business by supporting 33,473completed provider activities, and increaseclient sales by $389 million.
The International Trade Administration(ITA) strives to promote an improved tradeposture for U.S. industry and develop theexport potential of U.S. firms in a mannerconsistent with U.S. foreign and economicpolicy.
• In 1999, ITA estimates that it will review15 more applications for free trade zonesthan in 1998, supporting a gross increaseof 25,000 jobs.
• ITA’s U.S. Foreign Commercial Servicewill increase the number of companiesthat receive export assistance from 11,500in 1997 to about 14,000 by the end of1999.
19118. COMMERCE AND HOUSING CREDIT
Commerce’s Census Bureau collects, tab-ulates, and distributes a wide variety ofstatistical information about Americans andthe economy, including the constitutionally-mandated decennial census. In 2000, theCensus Bureau will conduct a decennial censusthat will reduce the net undercount by almost1.6 percent, compared to the 1990 Census.In addition, Commerce’s Bureau of EconomicAnalysis (BEA) prepares and interprets U.S.economic accounts, including the Gross Domes-tic Product (GDP), wealth accounts, and theU.S. balance of payments.
• In preparation for the 2000 Census, theCensus Bureau will canvass 94 millioncity-style addresses in 1999.
• In 1999, BEA will ensure the timely dis-semination of economic data by publishing12 monthly Surveys of Current Businessand 32 national GDP and personal incomenews releases.
Small Business Administration (SBA)
SBA, which Congress created in 1953 toaid, counsel, assist, and promote small busi-ness, expands access to capital by guarantee-ing private loans. The loans carry longerterms and lower interest rates than smallbusinesses would otherwise receive. SBA guar-anteed over $10.8 billion in small businessloans in 1997.
• In 1999, SBA will work to increase thenumber of small businesses receivingcounseling and training to 1.2 million, a10-percent increase over the estimated1998 level.
• SBA will guarantee 56,400 new Sec. 7(a)and Sec. 504 business loans in 1999, aseven-percent increase over the expected1998 volume of 52,500.
Financial Regulation
The Government protects depositors againstlosses when insured commercial banks, thrifts,and credit unions fail. Deposit insurancealso wards off widespread disruption in finan-cial markets by making it less likely thatone institution’s failure will cause a financialpanic and a cascade of other failures. From1985 to 1995, Federal deposit insurance pro-tected depositors in over 1,400 failed banks
and 1,100 savings associations, with totaldeposits of over $700 billion.
The Federal Deposit Insurance Corporation(FDIC) insures the deposits of banks andsavings associations (thrifts) through two sepa-rate insurance funds, the Bank InsuranceFund and the Savings Association InsuranceFund. The National Credit Union Administra-tion (NCUA) insures deposits at credit unions.These varied kinds of deposits are insuredfor up to $100,000 per account. The FDICinsures deposits at over 9,200 commercialbanks and over 1,800 savings institutions,with a total value of $2.7 trillion. TheNCUA insures deposits in 11,300 credit unionswith a total value of $290 billion.
Because the Government bears the riskof losses, it regulates banks, thrifts, andcredit unions to ensure that they operatein a safe and sound manner. Five agenciesregulate federally-insured depository institu-tions: The Office of the Comptroller of theCurrency regulates national banks; the Officeof Thrift Supervision regulates thrifts; theFederal Reserve regulates State-charteredbanks that are Federal Reserve members;the FDIC regulates other State-charteredbanks; and the NCUA regulates credit unions.
• In calendar 1998, the FDIC will perform3,081 safety and soundness inspections.
Other financial regulatory institutions in-clude the Securities and Exchange Commission(SEC) and the Commodity Futures TradingCommission (CFTC). The SEC oversees U.S.capital markets and regulates the securitiesindustry, protecting investors and maintainingthe fairness and integrity of domestic securi-ties markets by preventing fraud and abuseand ensuring the adequate disclosure of infor-mation. The CFTC regulates U.S. futuresand options markets, protecting market usersand the public from fraud and abuse andfostering open, competitive, and financiallysound commodity futures and options markets.
• The SEC will work to examine every in-vestment company complex and every in-vestment advisor at least once every fiveyears.
• The CFTC will work to ensure 100-percentcompliance from market professionals, fi-nancial intermediaries, and Self-Regu-
192 THE BUDGET FOR FISCAL YEAR 1999
latory Organizations with CFTC standardsfor registration, sound financial practices,and effective enforcement programs.
• The CFTC will review every designationapplication and rule change request, withthe exception of stock index futures (whichrequire SEC approval) within 10 to 45days and respond to trading exchanges(e.g., Chicago Board of Trade) with an ap-proval or deficiency letter.
Federal Trade Commission (FTC)
The FTC enforces various consumer protec-tion and antitrust laws that prohibit fraud,deception, anticompetitive mergers, and otherunfair and anticompetitive business practicesin the marketplace.
• In 1999, the FTC will save consumers$200 million by stopping fraud and otherunfair practices, and another $200 millionby stopping anticompetitive behavior.
Federal Communications Commission(FCC)
The FCC works to encourage competitionin communications and to promote and supportevery American’s access to telecommunicationsservices. The FCC executes its mission throughfour main activities: Authorization of Service,Policy and Rulemaking, Enforcement, andPublic Information Services.
• In 1999, the FCC will work to achieve 90percent of customer speed of disposal proc-essing goals to improve its authorization
of services activities. The Commission willre-engineer and integrate licensingdatabases and implement electronic filingto further increase efficiency in the licens-ing process.
• In 1999, the FCC will improve the connec-tion of classrooms and libraries and ruralhealthcare facilities to the Internet whilemaintaining affordable service to ruralAmericans. The FCC will also strive tomake telecommunications services moreaccessible to persons with disabilities.
Commerce Tax Incentives
The tax law provides incentives to encouragebusiness investment. It taxes capital gainsat a lower rate than other income, whichwill cost the Government $139 billion from1999 to 2003. In addition, the law doesnot tax gains on inherited capital assetsthat accrue during the lifetime of the originalowner, which will cost $51 billion from 1999to 2003. The law also provides more generousdepreciation allowances for machinery, equip-ment, and buildings. Other tax provisionsbenefit small firms generally, including thegraduated corporate income tax rates, pref-erential capital gains treatment for smallcorporation stock, and write-offs of certaininvestments. Credit unions, small insurancecompanies, and insurance companies ownedby certain tax-exempt organizations also enjoytax preferences. Tax benefits for other kindsof businesses are described in other chaptersin Section VI.
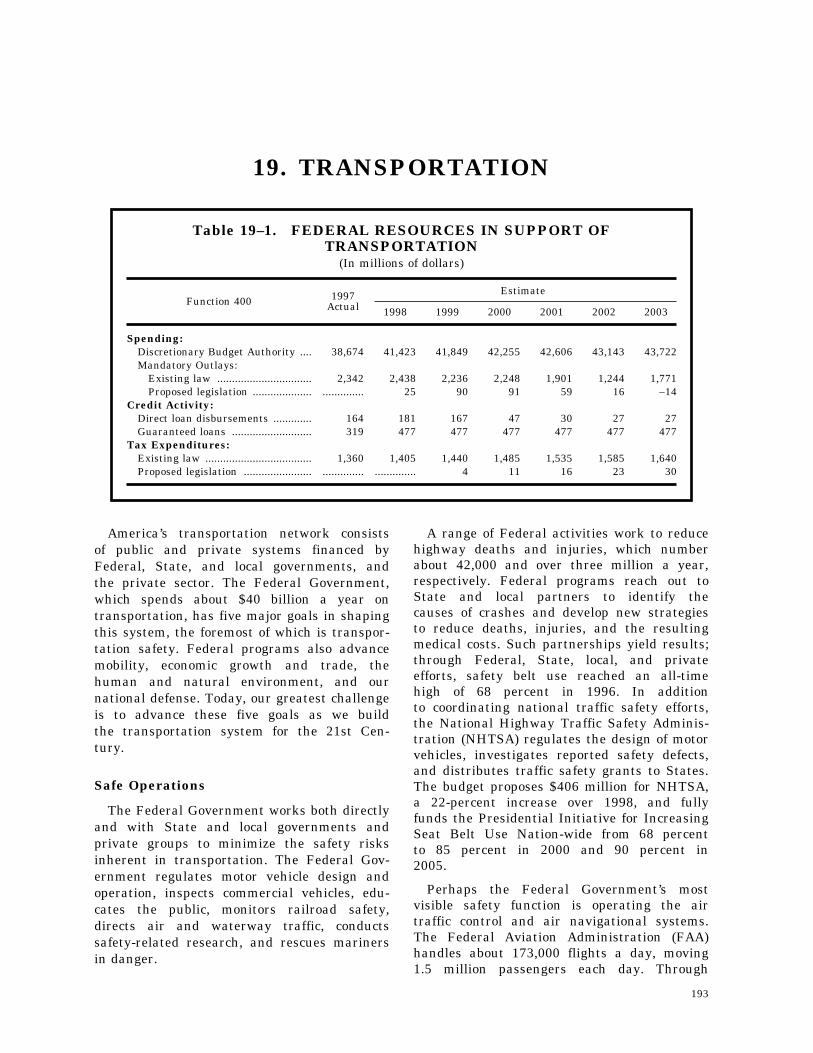
193
19. TRANSPORTATION
Table 19–1. FEDERAL RESOURCES IN SUPPORT OFTRANSPORTATION
(In millions of dollars)
Function 400 1997Actual
Estimate
1998 1999 2000 2001 2002 2003
Spending:Discretionary Budget Authority .... 38,674 41,423 41,849 42,255 42,606 43,143 43,722Mandatory Outlays:
Existing law ................................ 2,342 2,438 2,236 2,248 1,901 1,244 1,771Proposed legislation .................... .............. 25 90 91 59 16 –14
Credit Activity:Direct loan disbursements ............. 164 181 167 47 30 27 27Guaranteed loans ........................... 319 477 477 477 477 477 477
Tax Expenditures:Existing law .................................... 1,360 1,405 1,440 1,485 1,535 1,585 1,640Proposed legislation ....................... .............. .............. 4 11 16 23 30
America’s transportation network consistsof public and private systems financed byFederal, State, and local governments, andthe private sector. The Federal Government,which spends about $40 billion a year ontransportation, has five major goals in shapingthis system, the foremost of which is transpor-tation safety. Federal programs also advancemobility, economic growth and trade, thehuman and natural environment, and ournational defense. Today, our greatest challengeis to advance these five goals as we buildthe transportation system for the 21st Cen-tury.
Safe Operations
The Federal Government works both directlyand with State and local governments andprivate groups to minimize the safety risksinherent in transportation. The Federal Gov-ernment regulates motor vehicle design andoperation, inspects commercial vehicles, edu-cates the public, monitors railroad safety,directs air and waterway traffic, conductssafety-related research, and rescues marinersin danger.
A range of Federal activities work to reducehighway deaths and injuries, which numberabout 42,000 and over three million a year,respectively. Federal programs reach out toState and local partners to identify thecauses of crashes and develop new strategiesto reduce deaths, injuries, and the resultingmedical costs. Such partnerships yield results;through Federal, State, local, and privateefforts, safety belt use reached an all-timehigh of 68 percent in 1996. In additionto coordinating national traffic safety efforts,the National Highway Traffic Safety Adminis-tration (NHTSA) regulates the design of motorvehicles, investigates reported safety defects,and distributes traffic safety grants to States.The budget proposes $406 million for NHTSA,a 22-percent increase over 1998, and fullyfunds the Presidential Initiative for IncreasingSeat Belt Use Nation-wide from 68 percentto 85 percent in 2000 and 90 percent in2005.
Perhaps the Federal Government’s mostvisible safety function is operating the airtraffic control and air navigational systems.The Federal Aviation Administration (FAA)handles about 173,000 flights a day, moving1.5 million passengers each day. Through
194 THE BUDGET FOR FISCAL YEAR 1999
its regulatory and certification authorities,the FAA also promotes aviation safety. In1999, the FAA will perform over 340,000safety-related inspections. To meet safetyneeds in 1999, the Administration plans tospend $7.8 billion on FAA operations andcapital, eight percent more than in 1998.
The National Motor Carriers Program, forwhich the budget proposes $100 million in1999, provides grants to States to enforceFederal and compatible State standards forcommercial motor vehicle safety inspections,traffic enforcement, and compliance reviews.Uniform standards help coordinate law en-forcement activities, and simplify the safetyrequirements of interstate trucking.
The Federal Government also plays a keysafety role on our waterways. The CoastGuard is recognized as the world leaderin maritime search and rescue, saving over5,000 lives in 1997 alone. It operates radiodistress systems, guides vessels through busyports, regulates vessel design and operation,provides boating safety grants to States, andsupports a 35,000-member voluntary auxiliarythat educates boaters. The budget proposes$3.2 billion for Coast Guard operations andcapital.
The Federal railroad safety program, forwhich the budget proposes $62 million in1999, works in partnership with the railindustry. The Safety Assurance and Compli-ance Program brings together rail labor, man-agement, and the Federal Government todetermine root causes of problems. From1993 to 1996, railroad-related fatalities, on-the-job casualties, and the train incidentrate fell by 19, 42, and 17 percent, respec-tively.
Similarly, in 1999, the Federal pipelinesafety program will have in progress severalrisk management projects, whose goal isto provide safety and environmental protectionbetter than under existing Federal regulations.
For each of these areas, the Federal Govern-ment seeks to promote public health andsafety by working to eliminate transportation-related deaths and injuries. To measureprogress towards these goals, the Departmentof Transportation (DOT) will seek to:
• reduce the total number of transportation-related fatalities in calendar 1999 to below43,549, the 1995 level, despite increasedpassenger miles traveled; and
• reduce the total number of transportation-related injuries in calendar 1999 to below3,438,000, the 1995 level, despite in-creased passenger miles traveled.
Infrastructure and Efficiency
America has about four million miles ofroads, 580,000 bridges, 180,000 miles of rail-road track, 5,500 public-use airports, over6,000 transit systems, 350 commercial ports,and 25,000 miles of commercially-navigablewaterways. This extensive, intermodal networkis essential to the Nation’s commerce, andenhancing its efficiency advances economicgrowth and international competitiveness.
The Federal Government has helped developlarge parts of the system, with fundingmainly through user fees and transportationtaxes. The total Federal investment representsabout half of all public investment in transpor-tation—that is, $27 billion of the $54 billionof total Federal, State, and local spendingon transportation infrastructure in 1994. In1999, infrastructure investment would riseto a level 42 percent higher than the annualaverage of $21.1 billion from 1990 to 1993,with the rising investment of recent yearstargeted to advance the safety, quality, effi-ciency, and intermodal character of transpor-tation infrastructure.
Highways and Bridges: About 955,550miles of roads and all bridges are eligible forFederal support, including the National High-way System (NHS) and Federal lands roads.In 1999, the Federal Government plans tospend over $23 billion to maintain and expandthese roads, with funding from motor fuelstaxes, mainly the gasoline tax. The Federalgas tax is 18.4 cents a gallon, of which 15.45cents goes to the Highway Trust Fund’s high-way account to finance formula grants toStates for highway-related repair and improve-ment.
State and local governments provide 58percent of total highway and bridge infrastruc-ture spending, most of which they generatethrough their own fuel and vehicle taxes.
19519. TRANSPORTATION
The average State gasoline tax was 19.6cents per gallon in 1996. State and localgovernments accelerate their infrastructureprojects through debt financing, such as bondsand revolving loan funds. Under the StateInfrastructure Banks program, the FederalGovernment provides funds to help Statesunderwrite debt issuance for highway andtransit projects. Under the new TransportationInfrastructure Credit Enhancement Program,the Federal Government would provide grants,which could be supplemented by non-Federalcontributions, to create Revenue StabilizationFunds to help secure private debt financingfor nationally significant projects.
In 1999, the Federal Government will workwith State and local governments to:
• increase the percentage of NHS miles thatmeet pavement performance standards foracceptable ride quality (based on the Inter-national Roughness Index) to 91.5 percent,from the 1996 baseline of 91.1 percent, toreach the overall goal of ensuring that 93percent of NHS pavement has acceptableride quality by 2008; and
• reduce the percentage of NHS bridges thatare classified as deficient to 24.3 percent,from the 1996 base level of 25.8 percent,to reach the overall goal of ensuring thatless than 20 percent of NHS bridges aredeficient by 2008.
Transit: As with highways, the FederalGovernment works with State and local gov-ernments to improve mass transit. Of the Fed-eral motor fuels tax, 2.85 cents a gallon goesto the Highway Trust Fund’s Mass Transit Ac-count, which funds transit grants to Statesand urban and rural areas. Federal capitalgrants comprise about half of total spendingeach year to maintain and expand the Nation’s6,000 bus, rail, trolley, van, and ferry systems.Together, States and localities invest over $3billion a year on transit infrastructure andequipment.
In 1999, the Federal Government plansto spend $4.6 billion on transit capital. Inparticular, the Federal Government financescapital-intensive urban bus and rail transitsystems and rural bus and van networks.About 80 million Americans depend on publictransportation due to age, disability, or in-
come. Furthermore, transit use by commuterseases roadway congestion and reduces pollut-ing emissions. Capital investment cuts mainte-nance and operating costs and gives moremobility to Americans.
In 1999, to improve the quality and avail-ability of transit services, DOT will seekto:
• reduce the average age of the motor busfleet from a calendar 1995 base level of8.1 years to 7.6 years by calendar year2002 while increasing bus service, and
• maintain the average age of the rapid railfleet at 19.3 years through calendar year2002.
Passenger Rail: The Federal Governmentwill invest $621 million in 1999 to supportthe Nation’s passenger rail system (in additionto the $2.2 billion that the 1997 Taxpayer Re-lief Act provides for capital improvements andequipment maintenance). The extension of theNortheast Corridor high-speed rail servicefrom New York to Boston highlights the Fed-eral-private partnership to improve passengerrail service. The Federal Government fundsthe electrification of the rail line, while theprivate sector helps to finance the high-speedtrainsets that will begin operating in late1999.
To improve Amtrak’s Northeast Corridor,in 1999 the Federal Government will striveto complete electrification of the New York-Boston segment and introduce new high-speed trainsets, reducing travel time betweenNew York and Boston from the four-hours-and-45-minutes of today to three hours inthe year 2000.
Aviation and Airports: The Federal Gov-ernment seeks to ensure that the aviation sys-tem is accessible, integrated, efficient, andflexible. To reach those goals, and to beginto address a White House Commission onAviation Safety and Security recommendationto modernize the air traffic control system by2005, the budget proposes to increase invest-ments in aviation facilities and equipment byabout 10 percent a year for five years. In addi-tion, about 3,300 airports throughout the coun-try are eligible for the Airport ImprovementProgram (AIP), which funds projects that en-hance capacity, safety, security, and noise miti-
196 THE BUDGET FOR FISCAL YEAR 1999
gation. These funds augment other airportfunding sources, such as bond proceeds, Stateand local grants, and passenger facilitycharges. With 98 percent of the population liv-ing within 20 miles of one of these airports,most citizens have excellent access to airtransportation.
• In 1999, DOT will seek to reduce the num-ber of volume- and equipment-relateddelays to 30.7 per 100,000 flight oper-ations, from a 1994 base level of 36.9delays per 100,000 flight operations.
Other Transportation: For the Nation’scommercial shipping infrastructure, Federalloan guarantees make it easier to build andrenovate vessels. Port development is leftlargely to State and local authorities, whichhave invested over $14 billion in infrastructureimprovements over the past 50 years.
• To help make the shipyard industry morecompetitive, the Federal Government willstrive to attain two percent growth in U.S.commercial shipbuilding (measured bytonnage) in 1999, compared to 1998.
Research and Technology
The Federal Government helps advancetransportation technology. Federal researchfocuses on building stronger roads and bridges,designing safer cars, reducing human errorin operations, and improving the efficiencyof the existing infrastructure. In 1999, theFederal Government will spend over $1 billionon transportation research and technology.
DOT’s Intelligent Transportation Systems(ITS) program is developing and deployingtechnologies to help States and localitiesimprove safety, increase capacity, and enhancetraffic flow on their streets and highways.In an era of constrained Federal resources,ITS provides a cost-effective way to improvethe management of our infrastructure, boost-ing efficiency and capacity. The private sector,which works closely with the ITS program,will initially deploy many of the technologiesthat it develops jointly with Federal funding.
FAA’s research, engineering, and develop-ment programs help improve safety, security,capacity, and efficiency in the National Air-space System. For example, the developmentof an advanced traffic management system
and the demonstration of revolutionary routingand navigation procedures will enhance notonly safety, but air system capacity andefficiency. In 1999, the budget proposes theFlight 2000 free-flight demonstration program,which promises operational improvements todeliver passengers and cargo more quicklyand safely. Free-flight improves aviation sys-tem efficiency by giving pilots the toolsto plot their own flight paths. Other FAAresearch will focus on the causes of humanerror, aircraft safety, fire protection, aviationweather, engine noise, aircraft emissions, andsecurity and explosives detection systems.
The National Aeronautics and Space Admin-istration’s (NASA) Aeronautical Research andTechnology Program funds partnerships withindustry that may revolutionize the nextgeneration of planes, making them safer,faster, more efficient, and more compatiblewith the environment.
The Federal Government seeks to balancenew physical capacity with the efficiencyand safety of the existing infrastructure.With this goal in mind:
• DOT will seek to expand the integrationof ITS technology in six metropolitan areasby 20 percent in 1999, compared to a 1997survey baseline, and
• DOT, NASA, the Defense Department, andprivate industry will work together on re-search to reduce the fatal aviation acci-dent rate by a factor of five in 10 years;the 1995 baseline is 0.35 per 100,000 de-partures. Research will focus on prevent-ing equipment malfunctions, reducinghuman error, and ensuring the separationbetween aircraft and potential hazards.
Transportation Regulation
Federal rules greatly influence transpor-tation. In the past two decades, deregulationof the domestic railroad, airline, and interstateand intrastate trucking industries has boostedeconomic growth.
The Federal Government also issues regula-tions to spur safer and cleaner transportation.The safety regulations—of cars, trucks, ships,trains, and airplanes—have substantially cutthe number of transportation-related deaths
19719. TRANSPORTATION
and injuries—for example, saving over 100,000lives since 1966.
The Federal Government has taken regu-latory steps to meet transportation-relatedenvironmental and safety goals in a cost-effective manner. For example, during thetransition to double hulled tank vessels be-tween now and 2015, the costs of meetingoil pollution requirements will decline dueto ‘‘lightering zone’’ regulations that tempo-rarily permit older, single-hull vessels tooffload oil under stringent, environmentallysafe conditions within certain areas in theGulf of Mexico.
Tax Expenditures
For the most part, employees do not payincome taxes on what their employers payfor parking and transit passes. These taxexpenditures will cost the Government anestimated $7.1 billion from 1999 to 2003.To finance infrastructure, State and localgovernments issue tax-exempt bonds; the Fed-eral costs in lost revenues are includedin the calculations for Function 450, ‘‘Commu-nity and Regional Development,’’ and Function800, ‘‘General Government.’’

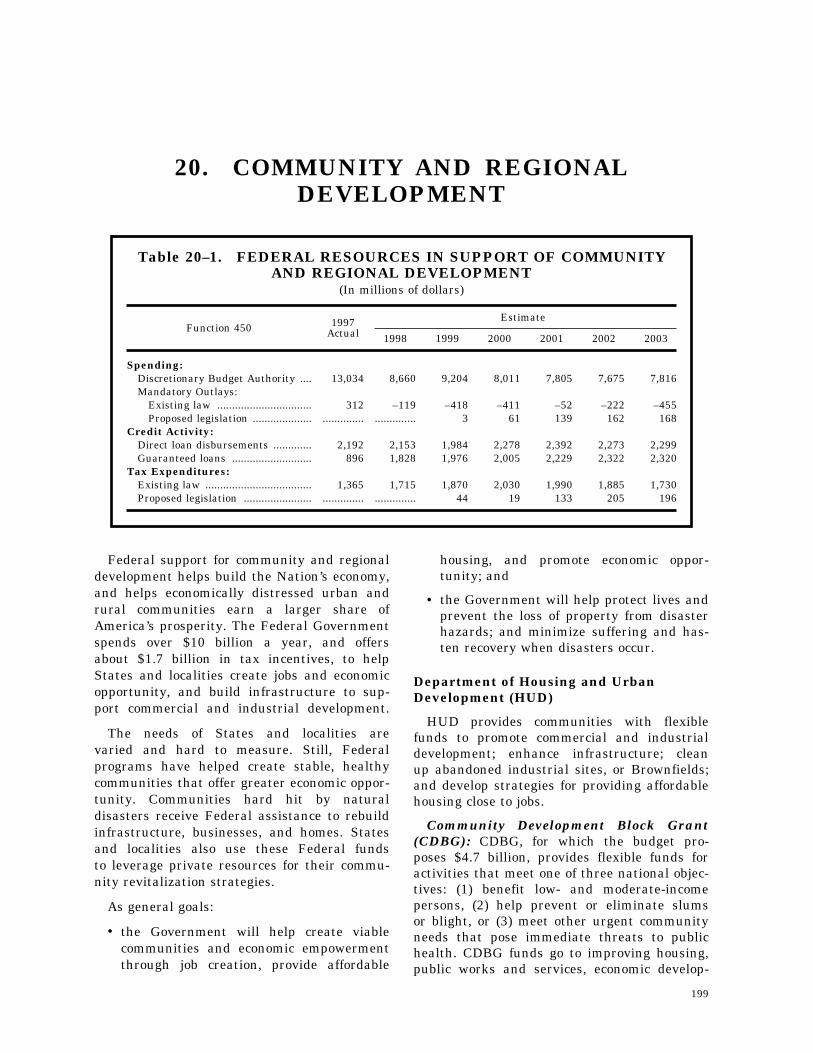
199
20. COMMUNITY AND REGIONALDEVELOPMENT
Table 20–1. FEDERAL RESOURCES IN SUPPORT OF COMMUNITYAND REGIONAL DEVELOPMENT
(In millions of dollars)
Function 450 1997Actual
Estimate
1998 1999 2000 2001 2002 2003
Spending:Discretionary Budget Authority .... 13,034 8,660 9,204 8,011 7,805 7,675 7,816Mandatory Outlays:
Existing law ................................ 312 –119 –418 –411 –52 –222 –455Proposed legislation .................... .............. .............. 3 61 139 162 168
Credit Activity:Direct loan disbursements ............. 2,192 2,153 1,984 2,278 2,392 2,273 2,299Guaranteed loans ........................... 896 1,828 1,976 2,005 2,229 2,322 2,320
Tax Expenditures:Existing law .................................... 1,365 1,715 1,870 2,030 1,990 1,885 1,730Proposed legislation ....................... .............. .............. 44 19 133 205 196
Federal support for community and regionaldevelopment helps build the Nation’s economy,and helps economically distressed urban andrural communities earn a larger share ofAmerica’s prosperity. The Federal Governmentspends over $10 billion a year, and offersabout $1.7 billion in tax incentives, to helpStates and localities create jobs and economicopportunity, and build infrastructure to sup-port commercial and industrial development.
The needs of States and localities arevaried and hard to measure. Still, Federalprograms have helped create stable, healthycommunities that offer greater economic oppor-tunity. Communities hard hit by naturaldisasters receive Federal assistance to rebuildinfrastructure, businesses, and homes. Statesand localities also use these Federal fundsto leverage private resources for their commu-nity revitalization strategies.
As general goals:
• the Government will help create viablecommunities and economic empowermentthrough job creation, provide affordable
housing, and promote economic oppor-tunity; and
• the Government will help protect lives andprevent the loss of property from disasterhazards; and minimize suffering and has-ten recovery when disasters occur.
Department of Housing and UrbanDevelopment (HUD)
HUD provides communities with flexiblefunds to promote commercial and industrialdevelopment; enhance infrastructure; cleanup abandoned industrial sites, or Brownfields;and develop strategies for providing affordablehousing close to jobs.
Community Development Block Grant(CDBG): CDBG, for which the budget pro-poses $4.7 billion, provides flexible funds foractivities that meet one of three national objec-tives: (1) benefit low- and moderate-incomepersons, (2) help prevent or eliminate slumsor blight, or (3) meet other urgent communityneeds that pose immediate threats to publichealth. CDBG funds go to improving housing,public works and services, economic develop-
200 THE BUDGET FOR FISCAL YEAR 1999
ment, and acquiring or clearing land. Seventypercent of CDBG funds go to over 950 centralcities and urban counties, the remaining 30percent to States to award to smaller localities.CDBG’s Section 108 Loan Guarantee Program,along with Economic Development InitiativeGrants, gives Federal guarantees to private in-vestors who buy debt obligations issued bylocal governments, thus giving communities ef-ficient financing for housing rehabilitation,economic development, and large-scale phys-ical development projects. The Indian CDBGprogram focuses mainly on public infrastruc-ture, community facilities, and economic devel-opment. In 1997, 131 Tribes received a totalof $67 million in CDBG grants through com-petition.
HOME: The budget proposes $1.5 billion inflexible grants to States and communities toaddress their most severe housing needs. Eligi-ble activities of this program (which is classi-fied in the Income Security function) includenew construction, rehabilitation, acquisition ofstandard housing, assistance to home buyers,and tenant-based rental assistance. From itsinception in 1992 through June 1997, the pro-gram’s recipients have committed or usedHOME funds to build or rehabilitate 262,000housing units and to help 37,000 families paytheir rent.
The 1999 goals for the CDBG and HOMEprograms include:
• Increasing the number of CDBG granteeswho incorporate milestones with time-tables in Consolidated Plans that can helpdemonstrate progress in improving locallydefined conditions in their neighborhoodsand communities.
• Developing a standardized HUD assess-ment of Consolidated Plans.
• Ensuring that communities keep HOMErental housing affordable to low-incomefamilies during the affordability periodthat the program requires.
Also by the end of 1999, HUD will establishbaseline measures against which to judgethe contributions these programs make tocommunity development and affordable hous-ing.
Empowerment Zones (EZs) andEmpowerment Communities (ECs): The EZprogram provides tax incentives and grants tocarry out 10-year, community-wide strategicplans to revitalize designated areas. In Decem-ber 1994, six urban areas and three ruralareas were designated as EZs. Two supple-mental urban Zones were designated to receivea combination of Economic Development Initia-tive grants, grants, and new tax-exempt bondfinancing. In addition, 65 urban and 30 ruralcommunities were designated as ECs. TheseEZs and ECs have begun to leverage resourcesto attract private investment, generate jobgrowth, stimulate business openings and ex-pansions, construct new housing, expandhomeownership opportunities, and stabilizeneighborhoods.
• In 1999, practically all EZs and ECs willshow satisfactory progress toward locallydefined benchmarks consistent with na-tional policy goals (e.g., increasing employ-ment, improving safety, improving edu-cation levels).
Department of Agriculture
The Agriculture Department (USDA) givesfinancial assistance to rural communities andbusinesses to boost employment and furtherdiversify the rural economy, and the budgetproposes $1.5 billion in such assistance. TheRural Community Advancement Program’sgrants, loans, and loan guarantees help buildrural community facilities, such as healthclinics and day care centers, and createor expand rural businesses. USDA also pro-vides loans through the Intermediary Relend-ing Program (IRP), which provides fundsto an intermediary such as a State or localgovernment that, in turn, provides fundsfor economic and community developmentprojects in rural areas.
• In 1999, USDA will provide 49,000 newjobs, compared to 37,000 in 1997, throughthe IRP and community facilities pro-grams.
Department of the Interior
The Interior Department’s Bureau of IndianAffairs (BIA) helps Tribes manage and gen-erate significant revenues from mineral, agri-cultural and forestry resources; a recent inde-
20120. COMMUNITY AND REGIONAL DEVELOPMENT
pendent study estimates that timber harvests,reforestation, pest management, and fire con-trol activities provided 49,000 jobs on ornear reservations. BIA also promotes Tribaland individual self-sufficiency by developingTribal resources and obtaining capital invest-ments. Finally, BIA maintains housing forneedy Tribal members; over 7,000 other build-ings, including 185 schools and 3,000 housingunits for BIA and Tribal staff; over 100high-hazard dams, and (with the Transpor-tation Department and State and local govern-ments) about 50,000 miles of roads and745 bridges.
• BIA will measure the success of its eco-nomic development program by guarantee-ing about $35 million in loans to establish,expand, and refinance businesses andboosting their success rate to 91 percent.
• BIA will measure the success of its facili-ties programs by providing a 60-percentincrease in high-priority school repairs andnew school construction; its roads programby implementing a maintenance manage-ment system and inspections of at leasthalf of all bridges and 80 percent of roads;and its dam safety program by repairingor planning repairs on seven dams andinspecting at least 25 dams.
• BIA will measure the success of its trustprograms by implementing or maintainingabout 150 Tribal resource managementplans, projects, co-management programs,and fishing access sites; supporting 15 irri-gation projects; developing 46 million acresfor farming and grazing; completing thefirst phase of a comprehensive environ-mental audit; funding 20 water rights ne-gotiation teams; and reducing probate andland title backlogs by at least 20 percent.
Tennessee Valley Authority (TVA)
TVA operates an important set of integratednavigation, flood control, water supply, andrecreation programs that, with TVA’s electricpower program, contributes to the prosperityof the seven-State region it serves. Thebudget provides $77 million for the agency’snon-power programs, ensuring that they retainfunding as the Administration and Congressconsider alternatives for the agency in boththe power and non-power areas.
• TVA will maximize the number of daysthe Tennessee River is open to commercialnavigation from Knoxville, Tennessee toPaducah, Kentucky, with a 1999 perform-ance target of full availability 93 percentof the time.
• TVA will minimize flood damage by oper-ating the river system with flood controlas a priority, maintaining a 1999 targetof 79 percent of flood storage availability.
Commerce Department’s EconomicDevelopment Administration (EDA)
EDA creates jobs and stimulates commercialand industrial growth in economically dis-tressed areas—rural and urban areas withhigh unemployment, high poverty rates, orsudden and severe distress. EDA’s publicworks grants help build or expand publicfacilities to stimulate and foster industrialand commercial growth, such as industrialparks, business incubators, access roads, waterand sewer lines, and port and terminaldevelopments. EDA, working with State andlocal governments and the private sector,has completed over 40,000 projects, creatingor retaining over three million private sectorjobs. EDA has invested over $16 billionin grants and generated over $36 billionin private investment. From 1992 to 1997,EDA awarded 1,006 public works grants,totaling $975 million, to economically dis-tressed communities to build these typesof infrastructure projects.
EDA works with State and local govern-ments, businesses, economic development dis-tricts, and non-profit organizations to identifyand fund high-priority projects in the neediestcommunities. The grants also provide technicalassistance to communities and firms on prob-lems that stifle economic growth. In addition,EDA’s economic adjustment assistance grantshelp communities solve severe adjustmentproblems, such as those resulting from naturaldisasters and industry relocations or majordownsizings. To date, EDA has providedalmost $500 million in disaster recovery grantsto help speed the recovery of disaster-impactedcommunities Nation-wide.
• In 1999, EDA projects that it will createor retain 22,500 jobs directly and 7,500jobs indirectly, for a total of 30,000 jobs.
202 THE BUDGET FOR FISCAL YEAR 1999
Disaster Relief and Insurance
The Federal Government provides financialhelp to cover a large share of the Nation’slosses from natural hazards. In recent years,spending from the two major Federal disasterassistance programs—the Federal EmergencyManagement Agency’s (FEMA) Disaster ReliefFund and the Small Business Administration’s(SBA) Disaster Loan program—has risen sig-nificantly, largely because demographic andeconomic growth has been great in hurricane-and earthquake-prone areas. The Federal Gov-ernment shares the costs with States forinfrastructure rebuilding; makes disaster loansto individuals and businesses; and providesgrants for emergency needs and housingassistance, unemployment assistance, and cri-sis counseling. In addition, the National FloodInsurance Program enables property ownersto purchase flood insurance that the commer-cial market does not offer. To mitigate futurelosses, and in exchange for flood insurance,communities must adopt and enforce floodplainmanagement measures that protect lives andnew construction from flooding.
In 1997, FEMA began Project Impact, anational effort to shift the focus of emergencymanagement from post-disaster response topre-disaster activities that reduce potentialfuture damage. FEMA is expanding the pro-gram in 1998, and will strive for at leastone ‘‘disaster resistant community’’ in eachState by the end of 1999. In 1999, SBAproposes to support FEMA’s mitigation projectby making available disaster loans for smallbusinesses in the targeted communities tofinance mitigation improvements for perma-nent or fixed business properties.
FEMA’s 1999 goals include:
• Decreasing, by 10 percent, the averagetime from disaster declaration to HazardMitigation Grant Program grant obliga-tion, using the average grant delivery timethrough 1997 as a baseline;
• Completing 12 hurricane evacuation stud-ies and achieving 60 percent of the man-dated review of community flood mapneeds; and
• Answering 95 percent of claimant ques-tions on the first call and cutting, in half,
disaster claimant transcription time andcosts billable to the disaster relief fund.
SBA’s 1999 goals include:
• Increasing the number of disaster loansprocessed within 21 days from 85 percentto 90 percent of applications.
• Increasing the percentage of disasters inwhich effective field presence is estab-lished within three days of a declarationfrom 85 percent to 90 percent.
Appalachian Regional Commission (ARC)
Established in 1965, ARC targets its re-sources to highly distressed areas, focusingon critical development issues on a regionalscale, and making strategic investments thatencourage other Federal, State, local andprivate participation and dollars. When com-pared with ‘‘twin counties’’ outside the 13-State region, ARC counties have grown 17times faster in private sector employment,seven times faster in population, and 34times faster in per capita income. From1950 to 1960, before the ARC was in place,employment fell 1.5 percent in Appalachiabut grew 15 percent Nation-wide. Duringthe most recent reporting period, 1988 to1996, Appalachian employment grew at thenational rate of 10.6 percent.
In 1999:
• As a result of ARC training, 7,500 peoplewill retain or get jobs; and
• ARC will place 100 physicians in the re-gion’s health professional shortage areas,to serve another 50,000 patients a year.
The Administration proposes to apply theproven ARC model to the Mississippi DeltaRegion, an adjoining section with tremendousand wide-ranging needs, in order to: (1)target the Nation’s truly poor; (2) provideeconomic development opportunities in a re-gional, multi-State context; (3) provide flexibleassistance to address local economic develop-ment decision-making; (4) create a partnershipthat links communities, States, and the Fed-eral Government in a coordinated responseto economic distress; and (5) leverage otherresources to foster self-sustaining economies.The budget proposes a Delta Region Develop-ment Program, under the auspices of the
20320. COMMUNITY AND REGIONAL DEVELOPMENT
ARC that would establish the Delta RegionalCommission to assist in the Region’s economicdevelopment.
Tax Expenditures
The Federal Government provides severaltax incentives to encourage community andregional development activities: (1) tax-exemptbonds for airports, docks, high-speed railfacilities, and sports and convention facilities(costing $5.6 billion from 1999 to 2003);(2) tax incentives for qualifying businessesin economically distressed areas that qualifyas Empowerment Zones—including an em-ployer wage credit, higher up-front deductionsfor investments in equipment, tax-exempt
financing, and accelerated depreciation—aswell as capital gains preferences for certaininvestments in the District of Columbia andincentives for first-time buyers of a principalresidence in D.C. (costing $3 billion overthe five years); (3) a 10-percent investmenttax credit for rehabilitating buildings thatwere built before 1936 for non-residentialpurposes (costing $335 million over the fiveyears); (4) tax exemptions for qualifying mu-tual and cooperative telephone and electriccompanies (costing $335 million over thefive years); and (5) up-front deductions ofenvironmental remediation costs at qualifiedsites (costing $305 million over the fiveyears).

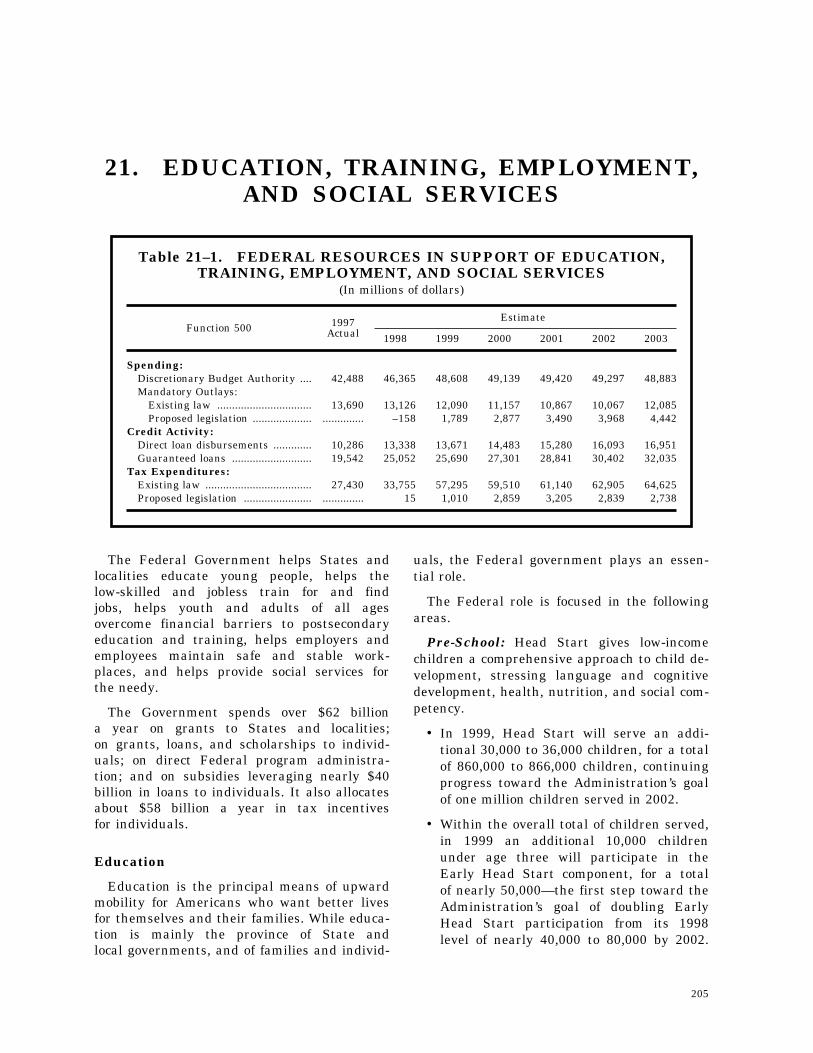
205
21. EDUCATION, TRAINING, EMPLOYMENT,AND SOCIAL SERVICES
Table 21–1. FEDERAL RESOURCES IN SUPPORT OF EDUCATION,TRAINING, EMPLOYMENT, AND SOCIAL SERVICES
(In millions of dollars)
Function 500 1997Actual
Estimate
1998 1999 2000 2001 2002 2003
Spending:Discretionary Budget Authority .... 42,488 46,365 48,608 49,139 49,420 49,297 48,883Mandatory Outlays:
Existing law ................................ 13,690 13,126 12,090 11,157 10,867 10,067 12,085Proposed legislation .................... .............. –158 1,789 2,877 3,490 3,968 4,442
Credit Activity:Direct loan disbursements ............. 10,286 13,338 13,671 14,483 15,280 16,093 16,951Guaranteed loans ........................... 19,542 25,052 25,690 27,301 28,841 30,402 32,035
Tax Expenditures:Existing law .................................... 27,430 33,755 57,295 59,510 61,140 62,905 64,625Proposed legislation ....................... .............. 15 1,010 2,859 3,205 2,839 2,738
The Federal Government helps States andlocalities educate young people, helps thelow-skilled and jobless train for and findjobs, helps youth and adults of all agesovercome financial barriers to postsecondaryeducation and training, helps employers andemployees maintain safe and stable work-places, and helps provide social services forthe needy.
The Government spends over $62 billiona year on grants to States and localities;on grants, loans, and scholarships to individ-uals; on direct Federal program administra-tion; and on subsidies leveraging nearly $40billion in loans to individuals. It also allocatesabout $58 billion a year in tax incentivesfor individuals.
Education
Education is the principal means of upwardmobility for Americans who want better livesfor themselves and their families. While educa-tion is mainly the province of State andlocal governments, and of families and individ-
uals, the Federal government plays an essen-tial role.
The Federal role is focused in the followingareas.
Pre-School: Head Start gives low-incomechildren a comprehensive approach to child de-velopment, stressing language and cognitivedevelopment, health, nutrition, and social com-petency.
• In 1999, Head Start will serve an addi-tional 30,000 to 36,000 children, for a totalof 860,000 to 866,000 children, continuingprogress toward the Administration’s goalof one million children served in 2002.
• Within the overall total of children served,in 1999 an additional 10,000 childrenunder age three will participate in theEarly Head Start component, for a totalof nearly 50,000—the first step toward theAdministration’s goal of doubling EarlyHead Start participation from its 1998level of nearly 40,000 to 80,000 by 2002.
206 THE BUDGET FOR FISCAL YEAR 1999
National evaluation studies of both theregular Head Start program and the EarlyHead Start component are under way, forwhich preliminary results are expected inthe spring and summer of 1998.
Elementary and Secondary Education:Federal spending for elementary and second-ary education targets important nationalneeds, such as equal opportunity and higheracademic standards to improve studentachievement. For example, most low-perform-ing children in low-income schools get extraeducational assistance through the Title I-Edu-cation for the Disadvantaged program. Otherprograms provide related support for childrenwith disabilities and limited English proficientchildren; support teacher and administratortraining; help finance and encourage State,school, and system reforms; and support re-search and technical assistance.
The Administration’s long-term goal is tohelp all children, and especially low-incomeand minority children, make steady gainsover time. Federal programs make a signifi-cant contribution to improved learning results.
• Citing Title I, as well as Head Start andchild nutrition programs, a 1994 RANDstudy found that ‘‘the most plausible’’ wayto explain big education gains of low-in-come and minority children in the past30 years is ‘‘some combination of increasedpublic investment in education and socialprograms and changed social policiesaimed at equalizing educational opportuni-ties.’’
• Minority students have made substantialgains in science, math, and reading sincethe 1970s, narrowing the gap between mi-nority and Caucasian student achievementby about a third.
The Federal focus began to change in1994 from supporting individual programsto emphasizing school-wide and school systemreforms, through the President’s Goals 2000Educate America Act and his Improving Amer-ica’s Schools Act. These laws support Stateand local standards-based reform efforts andspeed the use of technology in educationto help raise learning gains. Overall, thesenew approaches freed States and schoolsfrom Federal restrictions, providing greater
flexibility while requiring more accountabilityfor results. Early results show that thenew approaches are having a significant im-pact:
• A 1997 review of State plans showed that44 had content standards in at least read-ing and math, and 26 States had perform-ance standards.
• All States have established school supportteams that provide high-quality guidanceto Title I schools.
• All States now have plans to ensure that(1) classrooms are equipped with moderncomputers and connected to the Internet,(2) software is an integral part of the cur-riculum, and (3) teachers are ready to useand teach with technology.
• Business-school partnerships are develop-ing new software and new ways to usetechnology to raise student achievement.
• By the end of the 1998–1999 school year,nearly all States will have challengingcontent and performance standards inplace for two or more core subjects, andby 2001 nearly all States will have assess-ments aligned to the standards. BeforeGoals 2000, almost no States had chal-lenging academic standards in place.
• In 1999, Title I grants to school districtswill provide educational services to over10 million students in high poverty com-munities, over half a million more childrenthan in 1998.
• Each year, the National Assessment ofEducation Progress (NAEP) will helpmeasure progress toward achieving thegoal that rising percentages of all studentswill meet or exceed basic, proficient, andadvanced performance levels in nationaland State assessments of reading, math,and other core subjects, and the goal thatstudents in high-poverty schools will showimprovement gains comparable to thosefor all students.
Title VI Education Block Grant: This pro-gram provides general resources for education.It does not have clear, measurable goals andis not designed in law to produce specific re-sults in terms of student achievement gains.Evaluations of the program show that school
20721. EDUCATION, TRAINING, EMPLOYMENT, AND SOCIAL SERVICES
districts generally use the funds for routineactivities that do not improve teaching andlearning. As a result, the budget eliminatesfunding for this program in order to supportother programs, such as Title I, for whichthere are strong indicators of results in termsof student achievement gains.
Individuals with Disabilities: Under theIndividuals with Disabilities Education Act,the Education Department works with Statesto ensure that children with disabilities benefitfrom the Act’s requirement for a ‘‘free appro-priate public education’’ and are part of allaccountability systems. The Education Depart-ment and the States actively work to monitorand improve the performance of those stu-dents. In 1998, all States will have perform-ance goals and strategies in place for childrenwith disabilities aged three to 21, and willbegin to report their progress toward meetingthose goals.
• In 1999, all States will participate in regu-lar assessments of children with disabil-ities and in reporting the results.
Limited English-Proficient Children:With regard to the growing population of chil-dren with limited English proficiency, the Ad-ministration proposes that rising percentagesof teachers and other staff have the skillsneeded to enable these students to meet chal-lenging standards.
• In 1999, the Administration will helpStates hire and train 4,000 new teachersfor children with limited English pro-ficiency.
Reading: A student’s most basic skill tomaster is reading. Although reading problemsare particularly severe for disadvantaged stu-dents, students with reading difficulties rep-resent a cross-section of American children. In1994, only 30 percent of 4th graders scoredat the proficient level in reading on NAEP,while 40 percent scored below the basic level.In 1998, the President launched the AmericaReads Challenge to provide extra help to meetthe goal that every child will read well andindependently by the end of the third grade.
• In 1999, America Reads will continue tohelp increase the percentages of fourth-graders that meet basic, proficient, andadvanced levels in reading on the 4th
grade NAEP (administered in 1998 andevery two years thereafter).
Public School Choice: Charter schools in-troduce innovation and choice into publicschools. In 1997, about 700 charter schoolswere operating around the Nation, of whichabout 420 received Federal funding. In 1999,at least 1,500 charter schools will be operating,continuing progress toward the President’sgoal of 3,000 charter schools by 2001.
Voluntary National Tests: The Adminis-tration’s proposed voluntary national 4th gradereading and 8th grade mathematics tests forstudents will help students and their parentsand teachers know, for the first time, how wellstudents perform compared to other studentsnationally and internationally. They will alsoprovide important information about how welleducation reform efforts are working.
Postsecondary Education: The economicreturns to a college education are dramatic.Full-time male workers over 25 years old withat least a bachelor’s degree earned 89 percentmore in 1993 than comparable workers withjust a high school degree. Moreover, the bene-fits of college extend beyond the college grad-uates themselves. The resulting higher socio-economic status of parents with college degreesleads to greater educational achievement bytheir children.
Since the 1960s, the Federal Governmenthas played a growing role in helping Ameri-cans go to college. Federal programs financetwo-thirds of all direct student aid (i.e.,excluding general State and local supportfor public higher education). From 1964 to1993, these programs have helped nearlytriple college enrollment, increasing by athird the share of high school graduateswho attended college, and raise college enroll-ment rates for minority high school graduatesby nearly two-thirds.
• In 1999, the Education Department willhelp an estimated 8.8 million studentsunder its student aid programs.
• In 1999, an estimated 12.6 million stu-dents will receive college tax credits.
Scholarships for Low-Income Students:Research shows that, at the levels of medianincome and below, Pell Grant recipients are
208 THE BUDGET FOR FISCAL YEAR 1999
twice as likely to earn a bachelor’s degree asare non-recipients. The President has pro-posed, and Congress has enacted, increases inthe maximum Pell Grant award from $2,300in 1993 to $3,000 in 1998. In 1998, an esti-mated 3.9 million needy students will receivePell Grants to finance their college educations.
• In 1999, the Pell Grant maximum awardwill total $3,100 and 3.9 million studentswill receive Pell grants.
Easing Loan Repayment: The Presidentproposed, and Congress enacted, the 1993 Stu-dent Loan Reform Amendments that createdthe Income Contingent Repayment (ICR) op-tion for loans. With ICR, students who havesignificant debt burdens and who want to takelower-paying community service jobs can maketheir payments affordable through ICR. In ad-dition, students who have trouble repayingloans under other schedules can switch to ICR.By the end of calendar 1997, the third yearICR was available, 65,000 borrowers had al-ready signed up for this repayment option.
• In 1999, ICR will continue to be availableto as many students who want it.
Modernization of the Student Aid Deliv-ery System: The Education Department man-ages the delivery of student aid benefits toover seven million students in nearly 7,000postsecondary schools, and oversees the directand guaranteed loan systems affecting 37million individuals, 4,800 lenders, and 36guarantee agencies. The Department has mademodernization of student financial aid manage-ment one of its highest priorities. Major partsof the effort include improving customer serv-ice at lower cost through better contractingpractices and using new information tech-nology. For example, students can now applyfor student financial aid electronically and ac-cess their direct student loan information overthe Internet.
In 1999, the Department expects to continueto make progress toward the goals it hasset for 2000, including to:
• increase, to three million, the annual num-ber of students applying for Federal aidelectronically;
• enable students and families applying forFederal aid electronically to have their eli-
gibility determined in four days, cuttingin half the current processing time;
• make the Department’s website the mostcomprehensive and efficient source of in-formation on Federal student aid and pro-gram requirements, reducing hard copiesof materials that now must be printed andmailed by at least a third;
• test a multi-year promissory note for stu-dent loans to streamline application proce-dures, minimize delays in receiving funds,and provide better consumer informationfor borrowers; and
• establish, with its partners in the financialaid community, mutually agreed upon in-dustry-wide standards for data exchangesneeded in administering student aid.
Student Loan Defaults: In recent years,the Education Department has made greatprogress in reducing defaults and increasingcollections from defaulters. The national stu-dent loan cohort default rate used for institu-tional eligibility dropped for the fifth straightyear to 10.4 percent for 1995, down from 10.7percent for 1994. The 1995 rate represents thegroup of borrowers whose first loan repay-ments came due in 1995 and who defaultedbefore October 1, 1996.
Over the most recent five-year period, thedefault rate has fallen by over half, from22.4 percent in 1990. This dramatic reductionis due, in large part, to the EducationDepartment’s improved institutional oversightthat has, in turn, led to the removal of875 schools, including 672 schools from allstudent aid programs and 203 schools fromthe Federal loan programs. In addition, thedepartment has implemented rigorous recer-tification standards for institutions to partici-pate in the student aid programs. As aresult, it has rejected about a third ofinitial applications to participate in the stu-dent aid programs over the last three years—twice the rate in 1990.
• In 1999, the default rate will continue todecline toward the goal of 10 percent orless by 2002.
Direct Loan Consolidations: By relyingmore on performance-based contracting, theEducation Department is ensuring the smooth
20921. EDUCATION, TRAINING, EMPLOYMENT, AND SOCIAL SERVICES
running of the loan consolidation contract. TheDepartment is also improving the loan consoli-dation process by improving the accuracy ofits data, strengthening managerial controlsthrough better tracking and reporting, increas-ing the number and expertise of consolidationcontractor staff, and speeding up the loan cer-tification process. As a result of new proce-dures in 1998, the department will averageno more than 60 to 90 days to complete aloan consolidation application.
• In 1999, average time to complete a loanconsolidation application will continue todecline.
• In 1999, surveys of borrowers will showthat applicants for loan consolidation arehighly satisfied with the timeliness andaccuracy of the loan consolidation process.
Education Department Year 2000 Com-pliance: The Department has launched amajor effort to ensure that its systems are notadversely affected by the year 2000 datechange.
• In March 1999, all of the Education De-partment’s mission-critical and mission-important systems will be verified as year2000 compliant.
Labor
Elementary, secondary, and postsecondaryinvestments enable Americans to acquire theskills to get good jobs in an increasinglycompetitive global economy. In addition, mostworkers acquire more skills on the job orthrough billions of dollars that employersspend to enhance worker skills and productiv-ity.
Some workers however, also benefit fromspecial, targeted assistance. In addition toPell Grants, student loans, and tax credits,the Federal Government spends nearly $7billion a year through Department of Labor(DOL) programs that finance job training.In addition, workers who want to learnabout job openings can tap into the StateEmployment Service and One-Stop CareerCenter System, a labor exchange that’s univer-sally available through DOL’s popular Ameri-ca’s Job Bank (AJB) website, which listsover 750,000 job vacancies every day andreceives 40 to 45 million ‘‘hits’’ a month.
DOL has launched several longitudinal eval-uations of its job training programs overthe past two decades, including major impactevaluations of the Job Corps and DislocatedWorker Assistance programs. Past studieshave found mixed, but generally positive,results for the DOL job training programs.
While impact evaluations are the best meas-ure of program effectiveness, DOL also setsannual performance goals for its major jobtraining programs. Performance goals for 1999will continue to emphasize job placement,employment retention, and earnings levels.
The Job Training Partnership Act’s(JTPA) Dislocated Worker Assistance: Thisprogram provides training and employmentservices to about 685,000 displaced workers ayear.
• In 1999, about 76 percent of those whoreceive services will be working threemonths after leaving the program, earningan average hourly wage that represents97 percent of the wage in their previousjob.
JTPA’s Adult Training Grants: This pro-gram helps over 400,000 low-income individ-uals get training, support services, and jobplacement assistance.
• In 1999, about 60 percent of those whoreceive services will be working threemonths after leaving the program, withweekly earnings averaging $270.
Job Corps: The Corps provides skill train-ing, academic and social education, and sup-port services in a structured, residential set-ting to nearly 70,000 very disadvantaged youtha year at 118 centers.
• In 1999, about 75 percent of those wholeave the program will get jobs or pursuefurther education, while those beginningwork will start at an average hourly wageof $6.25.
Employment Service/One-Stop CareerCenters: The Employment Service provides afree labor exchange for all workers and jobseekers, and is growing more and more effec-tive by expanding its implementation of One-Stop Career Centers.
210 THE BUDGET FOR FISCAL YEAR 1999
• In 1999, DOL will continue to expand theOne-Stop Career Center System to include40 percent of all local employment serviceand JTPA offices, compared to 16 percentin 1997, and increase the number of em-ployers listing jobs with the AJB websiteby 20 percent over the 1997 level.
School-to-Work: All States are implement-ing school-to-work systems, using the five-yearFederal ‘‘venture capital’’ grants to devise newcollaborations between schools and the privatesector. In 1996, the program, which began in1994, was serving one million youth and 23percent of schools.
• In 1999, 1.5 million youth will be activelyengaged in school-to-work activities, and25 percent of high schools will offer keyschool-to-work components.
Workplace Protections
DOL regulates compliance with various lawsthat give workers certain workplace protec-tions—a minimum wage for virtually all work-ers, prevailing wages and equal employmentopportunity for workers on government con-tracts, overtime pay, restrictions on childlabor, and time off for family illness orchildbirth. In these areas, the Federal Govern-ment is working to increase industry’s compli-ance with labor protections through voluntarycompliance initiatives (coupled with continuedstrong enforcement), outreach to new andsmall business, and targeted enforcement inspecific industries, with specific measurablegoals.
• In 1999, compared to 1997, labor law com-pliance will increase by five percentagepoints in such industries as domestic gar-ments in certain targeted cities, and inpoultry processing.
National Service
The Corporation for National and Commu-nity Service supports programs providing serv-ice opportunities Nation-wide for Americansof all ages and backgrounds. Through Corpora-tion-supported projects, over 1.5 million par-ticipants work to address the Nation’s unmet,critical needs. The Corporation organizes itsprograms into three streams of service, withvarious annual performance goals.
AmeriCorps: AmeriCorps will engage56,000 Americans of all ages and backgroundsin community service, and provide educationawards in return for such service.
• In 1999, AmeriCorps VISTA members willgenerate cash and in-kind resources fortheir sponsoring organizations at a rateof $2.50 for every $1 of Federal funds.
Learn and Serve America: This programprovides opportunities for one million studentsto improve their academic learning while par-ticipating in service-learning projects inschools, universities, and communities.
• In 1999, 200,000 high school and collegestudents in Learn and Serve projects willprovide literacy tutoring to children ingrades K–3.
National Senior Service Corps: TheCorps, comprising over 500,000 people age 55and older, encourages seniors to use their ex-perience, skills and talents while serving asFoster Grandparents, Senior Companions, andthe Retired and Senior Volunteers.
• In 1999, the program will serve 150,000special needs youth and frail elderly.
Social Services
Vocational Rehabilitation Services: TheVocational Rehabilitation program providesfunds to States to help about 750,000 individ-uals with disabilities prepare for independentliving or gainful employment each year. In1997, the program helped to rehabilitate217,500 individuals with disabilities. The pro-gram has not had consistent performance goalsand measures of progress.
• In 1999, under proposed legislation, allStates will develop challenging State-spe-cific goals based on a comprehensive as-sessment of the vocational rehabilitationneeds of individuals with disabilities inthe State, describe the strategies it willuse to address those needs, and report onprogress made towards those goals.
Social Services Block Grant: The budgettargets funding to programs that can betterdemonstrate positive performance. The SocialServices Block Grant supports a broad rangeof social service programs, but without statu-tory performance goals or measures of prog-
21121. EDUCATION, TRAINING, EMPLOYMENT, AND SOCIAL SERVICES
ress. As a result, the budget reduces fundingfor this program in order to help provide fund-ing for other higher priority programs withgreater demonstrated outcomes, such as HeadStart and child care.
Tax Incentives
The Federal Government helps individuals,families, and employers (on behalf of theiremployees) plan for and buy education andtraining through numerous tax benefits, whichwill cost an estimated $57.3 billion in 1999.Along with the new Hope and Lifetime Learn-ing tax credits for college costs, the taxcode provides other ways to pay for education
and training. State and local governments,for instance, can issue tax-exempt debt tofinance student loans or to build the facilitiesof non-profit educational institutions. Interestfrom certain U.S. Savings Bonds is tax-free if the bonds go solely to pay for education.Many employers provide employee benefitsthat do not count as income. Starting in1998, many taxpayers can deduct the intereston student loans. Finally, the tax code givesemployers a Work Opportunity Tax Creditand a Welfare-to-Work Tax Credit, lettingthem claim a tax credit for part of thewages they pay to certain hard-to-employpeople who work for them for a minimumperiod.

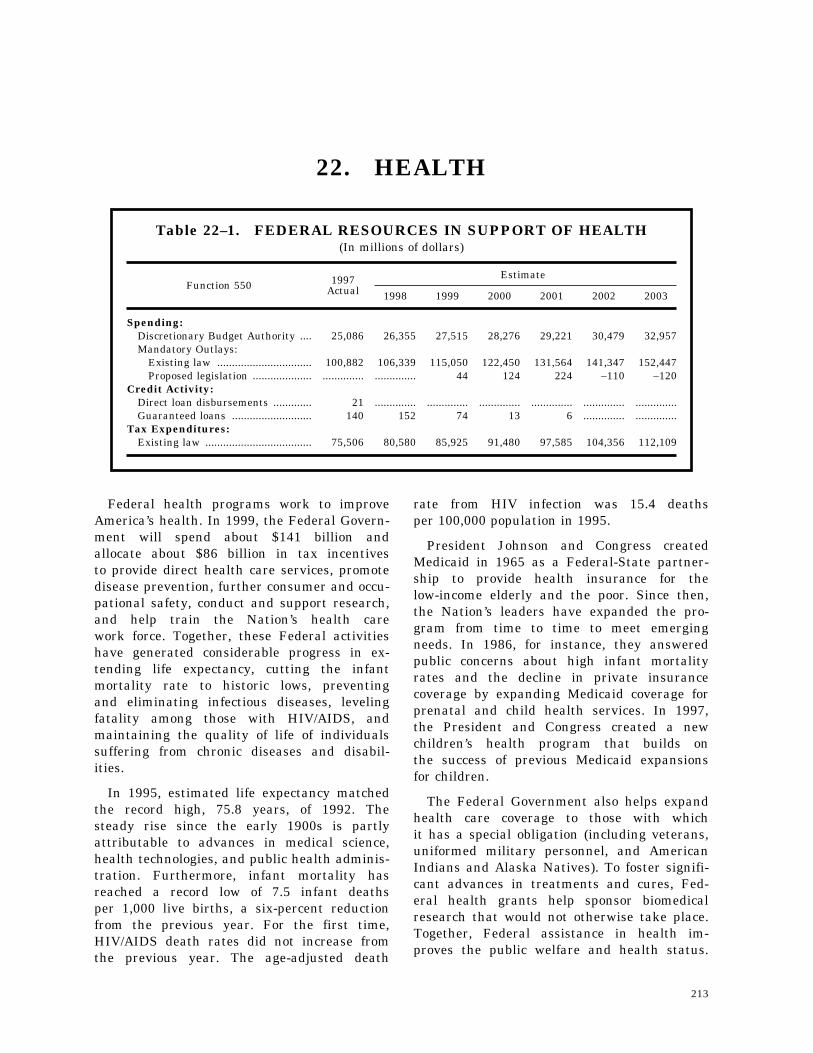
213
22. HEALTH
Table 22–1. FEDERAL RESOURCES IN SUPPORT OF HEALTH(In millions of dollars)
Function 550 1997Actual
Estimate
1998 1999 2000 2001 2002 2003
Spending:Discretionary Budget Authority .... 25,086 26,355 27,515 28,276 29,221 30,479 32,957Mandatory Outlays:
Existing law ................................ 100,882 106,339 115,050 122,450 131,564 141,347 152,447Proposed legislation .................... .............. .............. 44 124 224 –110 –120
Credit Activity:Direct loan disbursements ............. 21 .............. .............. .............. .............. .............. ..............Guaranteed loans ........................... 140 152 74 13 6 .............. ..............
Tax Expenditures:Existing law .................................... 75,506 80,580 85,925 91,480 97,585 104,356 112,109
Federal health programs work to improveAmerica’s health. In 1999, the Federal Govern-ment will spend about $141 billion andallocate about $86 billion in tax incentivesto provide direct health care services, promotedisease prevention, further consumer and occu-pational safety, conduct and support research,and help train the Nation’s health carework force. Together, these Federal activitieshave generated considerable progress in ex-tending life expectancy, cutting the infantmortality rate to historic lows, preventingand eliminating infectious diseases, levelingfatality among those with HIV/AIDS, andmaintaining the quality of life of individualssuffering from chronic diseases and disabil-ities.
In 1995, estimated life expectancy matchedthe record high, 75.8 years, of 1992. Thesteady rise since the early 1900s is partlyattributable to advances in medical science,health technologies, and public health adminis-tration. Furthermore, infant mortality hasreached a record low of 7.5 infant deathsper 1,000 live births, a six-percent reductionfrom the previous year. For the first time,HIV/AIDS death rates did not increase fromthe previous year. The age-adjusted death
rate from HIV infection was 15.4 deathsper 100,000 population in 1995.
President Johnson and Congress createdMedicaid in 1965 as a Federal-State partner-ship to provide health insurance for thelow-income elderly and the poor. Since then,the Nation’s leaders have expanded the pro-gram from time to time to meet emergingneeds. In 1986, for instance, they answeredpublic concerns about high infant mortalityrates and the decline in private insurancecoverage by expanding Medicaid coverage forprenatal and child health services. In 1997,the President and Congress created a newchildren’s health program that builds onthe success of previous Medicaid expansionsfor children.
The Federal Government also helps expandhealth care coverage to those with whichit has a special obligation (including veterans,uniformed military personnel, and AmericanIndians and Alaska Natives). To foster signifi-cant advances in treatments and cures, Fed-eral health grants help sponsor biomedicalresearch that would not otherwise take place.Together, Federal assistance in health im-proves the public welfare and health status.
214 THE BUDGET FOR FISCAL YEAR 1999
1 Excluding Medicare and the military and veterans medical pro-grams.
The Department of Health and HumanServices (HHS) is the Federal Government’slead agency for health programs. HHS’ Strate-gic Plan states the agency mission as: ‘‘toenhance the health and well-being of Ameri-cans by providing for effective health andhuman services and by fostering strong, sus-tained advances in the sciences underlyingmedicine, public health, and social services.’’
HHS’ Strategic Plan includes six goals:
(1) Reduce the major threats to healthand productivity of all Americans;
(2) Improve the economic and social well-being of individuals, families, and com-munities in the United States;
(3) Improve access to health services andensure the integrity of the Nation’shealth entitlement and safety net pro-grams;
(4) Improve the quality of health care andhuman services;
(5) Improve public health systems; and
(6) Strengthen the Nation’s health sciencesresearch enterprise and enhance its pro-ductivity.
Health Care Services and Financing
Of the estimated $141 billion in Federalhealth care outlays in 1999,1 88 percentfinances or supports direct health care servicesto individuals.
Medicaid: This Federal-State health careprogram served about 33 million low-incomeAmericans in 1997, with the Federal Govern-ment spending $95.6 billion (57 percent of thetotal) while States spent $72 billion (43 per-cent). States that participate in Medicaid mustcover several categories of eligible people, in-cluding certain low-income elderly, people withdisabilities, low-income women and children,and several mandated services, including hos-pital care, nursing home care, and physicianservices. States also may cover optional popu-lations and services. Under current law, Fed-eral experts expect total Medicaid spending togrow an average of 7.2 percent a year from1998 to 2003.
Medicaid covers a fourth of the Nation’schildren and is the largest single purchaserof maternity care as well as of nursinghome services and other long-term care serv-ices; the program covers almost two-thirdsof nursing home residents. The elderly anddisabled made up less than a third of Medicaidbeneficiaries in 1996, but accounted for almosttwo-thirds of spending on benefits. Otheradults and children made up over two-thirdsof recipients, but accounted for less thana third of spending on benefits. Medicaidserves at least half of all adults livingwith AIDS (and up to 90 percent of childrenwith AIDS), and is the largest single payerof direct medical services to adults livingwith AIDS.
States increasingly rely on managed carearrangements to provide health care throughMedicaid, with enrollment in such arrange-ments rising from 7.8 million in 1994 to13 million in 1996.
The 1997 Balanced Budget Act (BBA) madeimportant changes to Medicaid in order toreduce spending, mainly by reducing theDisproportionate Share Hospital program, andgiving States more flexibility. Specifically,the Act gave States the option of requiringmost beneficiaries to enroll in managed careplans without seeking a Federal waiver. Itrepealed the Boren Amendment, giving Statesmore flexibility to set hospital and nursinghome reimbursement rates. It added a Stateoption of guaranteeing Medicaid eligibilityto children for 12 months, regardless ofchanges in the child’s family income, andrestored Medicaid benefits for certain groupsof immigrants who would otherwise lose themunder the 1996 welfare law.
The Health Care Financing Administration(HCFA), which administers Medicaid, willwork with the States to develop and testMedicaid performance goals in accordancewith the 1993 Government Performance andResults Act. Because Medicaid’s success isintegrally related to States’ decisions on eligi-bility, reimbursement rates, delivery systems,and services, HCFA must select performancegoals in consultation with States to ensurethat they are compatible with State goalsand objectives.
21522. HEALTH
In 1998, HCFA and the National Associationof State Medicaid Directors will conduct threeformal consultation meetings to:
• identify areas of performance measure-ment;
• identify potential performance measures;and
• reach consensus on performance measuresfor HCFA’s 2000 Annual PerformancePlan.
In 1999, HCFA will work with the Statesto establish performance measurement base-lines and performance targets.
Medicaid supports HHS’ first three strategicgoals.
Children’s Health Insurance Program:Ten million American children lack health in-surance. To increase the number of childrenwith insurance, the BBA established the StateChildren’s Health Insurance Program (CHIP),which provides $24 billion over the next fiveyears for States to expand health insurancecoverage to low-income, uninsured children.The new program strikes a balance betweenproviding States with broad flexibility in pro-gram design and protecting beneficiariesthrough basic Federal standards. States havegreat flexibility to choose to expand Medicaid,create a separate State program, or use a com-bination of the two. At the same time, thenew law ensures that States provide a mean-ingful benefit package, limit cost sharing,maintain their current Medicaid programs,and provide accountability.
Each State may receive CHIP funding afterHCFA approves its child health plan. Statechild health plans must describe the strategicobjectives, performance goals, and performancemeasures used to assess the effectivenessof the plan. In preparation for its 2000Annual Performance Plan, HCFA will workwith the States to develop a consensus fora performance measure related to cuttingthe number of uninsured children and increas-ing the enrollment of eligible children inCHIP and Medicaid.
In developing such a measure, HCFA andthe States likely will consider such factorsas:
• How much CHIP has increased the num-ber of children with creditable health cov-erage;
• The characteristics of the children andfamilies who were helped;
• The quality of coverage and types of bene-fits provided;
• The level of State contributions; and
• Recommendations to improve the program.
HCFA will work with the States to identifypossible sources of data for performance meas-urement. In 2002, the Secretary of Healthand Human Services will issue a report,based on State evaluations, with conclusionsand recommendations.
HHS also is working to develop performancemeasures for CHIP. As does Medicaid, CHIPsupports HHS’ first three strategic goals.
Other Health Care Services: HHS supple-ments Medicare and Medicaid with a numberof ‘‘gap-filling’’ grant activities to supporthealth services for low-income or specific popu-lations, including Consolidated Health Centergrants, Ryan White AIDS treatment grants,the Maternal and Child Health block grant,Family Planning grants, and the SubstanceAbuse block grant. In addition, the IndianHealth Service (IHS) delivers direct care toabout 1.3 million American Indians and Alas-ka Natives as a part of the Federal Govern-ment’s trust obligations. The IHS system, lo-cated primarily on or near reservations, in-cludes 49 hospitals, 195 health centers, andalmost 300 other clinics.
HHS agencies have sought to ensure thatspecific populations have access to high-qualityFederal health services. Similar to healthinsurance programs, these supplementalhealth service programs support HHS’ firstthree strategic goals. HHS agencies havedeveloped performance measures to help plan,track, and evaluate program effectiveness.
In 1999, HHS agencies will work to meetthe following goals:
• IHS: Cut the incidence of amputation andblindness linked to diabetic neuropathyand retinopathy by five percent in the Na-tive American and Alaska Native diabeticpopulations, compared to the 1996 rate,
216 THE BUDGET FOR FISCAL YEAR 1999
which varies from 45 percent among theSioux to 18 percent among the Pima Indi-ans.
• Substance Abuse and Mental Health Serv-ices Administration: Reverse the upwardtrend and cut monthly marijuana useamong 12 to 17-year-olds by 25 percent,from the 1995 baseline of 8.2 percent to6.2 percent, by the end of 2002.
• Health Resources and Services Administra-tion (HRSA): Increase the percent of in-fants born to pregnant women receivingprenatal care, beginning in the first tri-mester, from the 1995 rate of 81.3 percent.
• HRSA: Cut, by eight percent, the numberof AIDS cases in children as a result ofperinatal transmission, compared to the1996 baseline of 678 cases.
• Agency for Health Care Policy and Re-search: Release and disseminate MedicalExpenditure Panel Survey data and asso-ciated products to the public within nineto 12 months of data collection.
• Office for Civil Rights: Increase the num-ber of managed care plans in compliancewith Title VI, Section 504 and the Ameri-cans with Disabilities Act.
Also in 1999, the Consumer Product SafetyCommission will reduce product-related headinjuries to children by 10 percent.
Prevention Services: Prevention can go farto improve Americans’ health. Measures toprotect public health can be as basic as provid-ing good sanitation and as sophisticated aspreventing bacteria from developing resistanceto antibiotics. State and local health depart-ments traditionally lead such efforts, but theFederal Government—through HHS’ Centersfor Disease Control and Prevention (CDC)—also provides financial and technical support.For a half-century, CDC has worked withState and local governments to prevent syphi-lis and eliminate smallpox and other commu-nicable diseases.
More recently, CDC has focused on prevent-ing a host of diseases, including breast cancer,prostate cancer, lead poisoning among chil-dren, and HIV/AIDS. Furthermore, CDC isworking to reduce the prevalence of chlamydiaamong high-risk women under age 25 in
federally-funded family planning and SexuallyTransmitted Disease (STD) clinics from ninepercent in 1996 to below six percent. HHS’prevention programs support its first, fourth,and fifth strategic goals.
• Working with HCFA, CDC will continueto help States ensure that, by age two,at least 90 percent of all U.S. children re-ceive each recommended basic childhoodvaccine.
Biomedical Research: The National Insti-tutes of Health (NIH) is among the world’sforemost biomedical research centers and theFederal focal point for the Nation’s biomedicalresearch. NIH research is designed to gainknowledge to help prevent, detect, diagnose,and treat disease and disability. NIH conductsresearch in its own laboratories and clinicalfacilities; supports research by non-Federal sci-entists in universities, medical schools, hos-pitals, and research institutions across the Na-tion and around the world; helps train re-search investigators; and fosters communica-tion of biomedical information.
NIH supports over 50,000 grants to univer-sities, medical schools, and other researchand research training institutions while con-ducting over 1,200 projects in its own labora-tories and clinical facilities. NIH-supportedresearch has helped to achieve many ofthe Nation’s most important public healthadvances. Examples of recent research ad-vances include the identification of a genethat predisposes men to prostate cancer;the development of potentially life-saving newtherapies for HIV-infected individuals; theidentification of certain risk factors for breastcancer which result from mutated genes;and the development of new technology fordetecting defects in human chromosomes.
In continuing to make new discoveriesin these and other research areas, NIHhas set forth its vision of biomedical andbehavioral research in the HHS strategicplan. Also, as a steward of public fundingfor research, NIH helps grantee institutionsimprove their internal business systems sothey can more easily comply with Federalgrant requirements. NIH programs supportHHS’ first, fourth, and sixth strategic goals.
21722. HEALTH
NIH has set bold performance goals forthe next century of research, such as:
• completing the sequencing of the humangenome project by 2005 by initially reach-ing a production rate of 100 million basepairs in 1999, growing to a production rateof over 300 base pairs a year by 2003;and
• leading the national effort to meet thePresident’s goal of developing an AIDSvaccine by 2007.
Public Health Regulation and Safety In-spection: The Food and Drug Administration(FDA) spends $1 billion a year to promote pub-lic health by helping to ensure through pre-market review and post-market surveillancethat foods are safe, wholesome, and sanitary;human and veterinary drugs, biological prod-ucts, and medical devices are safe and effec-tive; and cosmetics and electronic productsthat emit radiation are safe. FDA also helpsthe public gain access to important new life-saving drugs, biological products, and medicaldevices. It leads Federal efforts to ensure thetimely review of products and ensure that reg-ulations enhance public health, not serve asan unnecessary regulatory burden. In addition,the FDA supports research, consumer edu-cation, and the development of both voluntaryand regulatory measures to ensure the safetyand efficacy of drugs, medical devices, andfoods. With the 1997 reauthorization of thePrescription Drug User Fee Act, FDA will con-tinue to collect pharmaceutical industry feesto accelerate the review of drug applications.
FDA programs support HHS’ first andfifth strategic goals.
To speed the review process, FDA hasset the following performance goals for 1999:
• review and process 90 percent of completenew drug applications within a year ofsubmission;
• review and process 90 percent of completenew drug applications for priority drugswithin six months of submission; and
• review and process 75 percent of new med-ical device applications (know as pre-mar-ket applications) within 180 days, com-pared to 54 percent in 1996.
To give the public useful health information,FDA has set the following performance goal:
• Ensure that, by the year 2000, 75 percentof consumers receiving drug prescriptionswill get more useful and readable informa-tion about their product.
FDA will define the term ‘‘usefulness’’ interms of: scientific accuracy, unbiased contentand tone, specificity and comprehensiveness,and timeliness. Based on the FDA’s ownnational surveys, only 32 percent of consumersreceived useful information on new drugprescriptions in 1992.
The Food Safety and Inspection Service(FSIS) inspects the Nation’s meat, poultry,and egg products, ensuring that they aresafe, wholesome, and not adulterated. With$600 million in annual funding, agency staffinspect all domestic livestock and poultryin slaughter plants; conduct at least dailyinspections of meat, poultry, and egg productprocessing plants; and inspect imported meat,poultry, and egg products. In 1996, FSISissued a major regulation that will beginshifting responsibility for ensuring meat andpoultry safety from FSIS to the industry.The regulation should allow FSIS to bettertarget its inspection resources to the higher-risk elements of the meat and poultry produc-tion, slaughter, and marketing processes.
• By 1999, 92 percent of all federally-in-spected meat and poultry products will beunder a Hazard Analysis Critical ControlPoint (HACCP) system and, by 2000, allplants will produce products underHACCP.
Workplace Safety and Health
The Federal Government spends $550 mil-lion a year to promote safe and healthyworkplaces for over 100 million workers insix million workplaces, mainly through theLabor Department’s Occupational Safety andHealth Administration (OSHA) and Mine Safe-ty and Health Administration (MSHA). Regu-lations that help businesses create and main-tain safe and healthy workplaces have signifi-cantly cut illness, injury, and death fromexposure to hazardous substances and dan-gerous employment. In 1996 (the most recentyear for which data are available), workplace
218 THE BUDGET FOR FISCAL YEAR 1999
injuries and illnesses fell to the lowest rateon record. OSHA and MSHA will work tocontinue this trend by enforcing their regula-tions and helping employers and workers.
• By focusing on the most hazardous indus-tries and workplaces and the most preva-lent workplace injuries and illnesses,OSHA over the next two years will reduceworkplace injuries and illnesses by 20 per-cent in 50,000 workplaces.
• MSHA will, in 1999, reduce fatalities andlost workdays in all mines to below theaverage number recorded for the previousfive years.
Tax Expenditures
Federal tax laws help finance health insur-ance and care. Most notably, employer con-tributions for health insurance premiums areexcluded from employees’ taxable income. In
addition, self-employed people may deducta part (45 percent in 1998, rising to 100percent in 2007 and beyond) of what theypay for health insurance for themselves andtheir families. Individuals who itemize alsomay deduct certain health-related expenses—such as insurance premiums that employersdo not pay; expenses to diagnose, treat,or prevent disease; and expenses for certainlong-term care services and insurance poli-cies—to the extent that they exceed 7.5percent of the individuals’ adjusted grossincome. Total health-related tax expenditures,including other provisions, will reach an esti-mated $86 billion in 1999, and $491 billionfrom 1999 to 2003; the exclusion for employer-provided insurance and related benefits (in-cluding deductions by the self employed)accounts for most of these costs ($76 billionin 1999 and $438 billion from 1999 to2003).
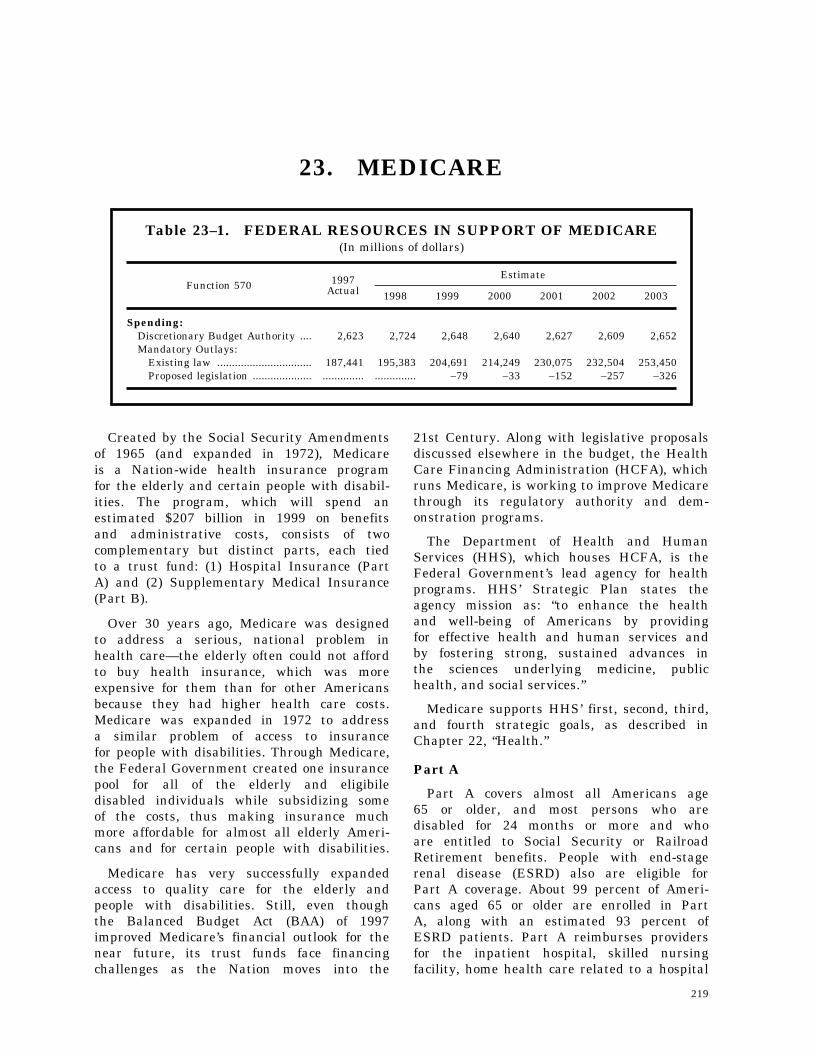
219
23. MEDICARE
Table 23–1. FEDERAL RESOURCES IN SUPPORT OF MEDICARE(In millions of dollars)
Function 570 1997Actual
Estimate
1998 1999 2000 2001 2002 2003
Spending:Discretionary Budget Authority .... 2,623 2,724 2,648 2,640 2,627 2,609 2,652Mandatory Outlays:
Existing law ................................ 187,441 195,383 204,691 214,249 230,075 232,504 253,450Proposed legislation .................... .............. .............. –79 –33 –152 –257 –326
Created by the Social Security Amendmentsof 1965 (and expanded in 1972), Medicareis a Nation-wide health insurance programfor the elderly and certain people with disabil-ities. The program, which will spend anestimated $207 billion in 1999 on benefitsand administrative costs, consists of twocomplementary but distinct parts, each tiedto a trust fund: (1) Hospital Insurance (PartA) and (2) Supplementary Medical Insurance(Part B).
Over 30 years ago, Medicare was designedto address a serious, national problem inhealth care—the elderly often could not affordto buy health insurance, which was moreexpensive for them than for other Americansbecause they had higher health care costs.Medicare was expanded in 1972 to addressa similar problem of access to insurancefor people with disabilities. Through Medicare,the Federal Government created one insurancepool for all of the elderly and eligibiledisabled individuals while subsidizing someof the costs, thus making insurance muchmore affordable for almost all elderly Ameri-cans and for certain people with disabilities.
Medicare has very successfully expandedaccess to quality care for the elderly andpeople with disabilities. Still, even thoughthe Balanced Budget Act (BAA) of 1997improved Medicare’s financial outlook for thenear future, its trust funds face financingchallenges as the Nation moves into the
21st Century. Along with legislative proposalsdiscussed elsewhere in the budget, the HealthCare Financing Administration (HCFA), whichruns Medicare, is working to improve Medicarethrough its regulatory authority and dem-onstration programs.
The Department of Health and HumanServices (HHS), which houses HCFA, is theFederal Government’s lead agency for healthprograms. HHS’ Strategic Plan states theagency mission as: ‘‘to enhance the healthand well-being of Americans by providingfor effective health and human services andby fostering strong, sustained advances inthe sciences underlying medicine, publichealth, and social services.’’
Medicare supports HHS’ first, second, third,and fourth strategic goals, as described inChapter 22, ‘‘Health.’’
Part A
Part A covers almost all Americans age65 or older, and most persons who aredisabled for 24 months or more and whoare entitled to Social Security or RailroadRetirement benefits. People with end-stagerenal disease (ESRD) also are eligible forPart A coverage. About 99 percent of Ameri-cans aged 65 or older are enrolled in PartA, along with an estimated 93 percent ofESRD patients. Part A reimburses providersfor the inpatient hospital, skilled nursingfacility, home health care related to a hospital
220 THE BUDGET FOR FISCAL YEAR 1999
stay, and hospice services provided to bene-ficiaries. Part A’s Hospital Insurance (HI)Trust Fund receives most of its income fromthe HI payroll tax—2.9 percent of payroll,split evenly between employers and employees.
Part B
Part B coverage is optional, and it isavailable to almost all resident citizens age65 or older and to people with disabilitieswho are entitled to Part A. About 96 percentof those enrolled in Part A have chosento enroll in Part B. Enrollees pay monthlypremiums that cover about 25 percent ofPart B costs, while general taxpayer dollarssubsidize the remaining costs. For most bene-ficiaries, the Government simply deducts thePart B premium from their monthly SocialSecurity checks.
Part B pays for medically necessary physi-cian services; outpatient hospital services;diagnostic clinical laboratory tests; certaindurable medical equipment (e.g., wheelchairs)and medical supplies (e.g., oxygen); homehealth care; physical and occupational therapy;speech pathology services; and outpatient men-tal health services. Part B also covers kidneydialysis and other services for ESRD patients.
Fee-for-Service vs. Managed Care
Beneficiaries can choose the coverage theyprefer. Under the ‘‘traditional,’’ fee-for-serviceoption, beneficiaries can go to virtually anyprovider in the country. Medicare pays provid-ers primarily based on prospective payment,an established fee schedule, or reasonablecosts. About 87 percent of Medicare bene-ficiaries now opt for fee-for-service coverage.
Alternatively, beneficiaries can enroll ina Medicare managed care plan, and the13 percent who do are concentrated in severalgeographic areas. Generally, enrollees receivecare from a network of providers, althoughMedicare managed care plans may offer apoint-of-service benefit, allowing beneficiariesto receive certain services from non-networkproviders. Most managed care plans receivea monthly, per-enrollee ‘‘capitated’’ paymentthat covers the cost of Part A and B services.As of June 1997, 67 percent of all Medicarebeneficiaries lived in a county served byat least one Medicare managed care plan.
Due to the BBA, Medicare managed care(renamed ‘‘Medicare+Choice’’ or Part C) willprovide new health plan options for Medicarebeneficiaries, including provider-sponsored or-ganizations (PSOs) and preferred providerorganizations (PPOs). Part C also will featureimproved beneficiary information and willbe fully operational by January 1, 1999.
Successes
Medicare has dramatically increased accessto health care for the elderly—from slightlyover 50 percent of the elderly in 1966 toalmost 100 percent today.
According to the Physician Payment ReviewCommission’s latest report, 96 percent ofMedicare beneficiaries reported no troubleobtaining care. Further, less than 1 percentof beneficiaries reported trouble getting carebecause a physician would not accept Medicarepatients. Medicare beneficiaries have accessto the most up-to-date medical technologyand procedures.
Medicare also gives beneficiaries an attrac-tive choice of managed care plans. Today,managed care is a major, and growing, partof Medicare. As of December 1, 1997, over5.2 million beneficiaries have enrolled in307 Medicare managed care plans. Duringthe 12-month period ending December 1,1997, enrollment in the capitated managedcare plans called ‘‘risk contracts’’ grew by27 percent. Managed care plans can providecoordinated care that is focused on preventionand wellness.
In addition, Medicare is working to protectthe integrity of its payment systems. Buildingon the success of Operation Restore Trust,a five-State demonstration aimed at cuttingfraud and abuse in home health agencies,nursing homes, and durable medical equip-ment suppliers, Medicare is increasing itsefforts to root out fraud and abuse. Recentlegislation provides mandatory Federal fundsand greater authority to prevent inappropriatepayments to fraudulent providers, and toseek out and prosecute providers who continueto defraud Medicare and other health careprograms.
22123. MEDICARE
1 These figures cover Federal spending on Medicare benefits, butdo not include spending financed by beneficiaries’ premium pay-ments or administrative costs.
Spending and Enrollment
Net Medicare outlays will rise by an esti-mated 30 percent from 1998 to 2003—from$194.2 billion to $252 billion.1 Part A outlayswill grow by an estimated 23 percent overthe period—from $130.3 billion to $160 bil-lion—or an average of 4.2 percent a year.Part B outlays will grow by an estimated44 percent—from $63.8 billion to $92 billion—or an average of 7.6 percent a year.
Medicare is consuming a growing shareof the budget. In 1980, Federal spendingon Medicare benefits was $31 billion, compris-ing 5.2 percent of all Federal outlays. In1995, Federal spending on Medicare benefitswas $156.6 billion, or just over 10 percentof all Federal outlays. By 2003, assumingno changes in current law, Federal spendingon Medicare benefits will total an estimated$252 billion, or almost 13 percent of allFederal outlays.
Medicare enrollment will grow slowly until2010, then explode as the baby boom genera-tion begins to reach age 65. From 1995to 2010, enrollment will grow at an estimatedaverage annual rate of 1.5 percent, from37.6 million enrollees in 1995 to 46.9 millionin 2010. But after 2010, average annualgrowth will almost double, with enrollmentreaching an estimated 61.3 million in 2020.
The Two Trust Funds
HI Trust Fund: As noted earlier in thischapter, the HI Trust Fund is financed by a2.9 percent payroll tax, split evenly betweenemployers and employees. In 1995, HI expend-itures began to exceed the annual income tothe Trust Fund and, as a result, Medicarebegan drawing down the Trust Fund’s ac-counts to help finance Part A spending. Priorto the BBA, the Government’s actuaries pre-dicted that the HI Trust Fund would becomeinsolvent in 2001. The BBA, however, ensuredthe solvency of the Trust Fund for anothernine years—until 2010.
Medicare Part A still faces a longer-termfinancing challenge. Since current benefitsare paid by current workers, Medicare costs
associated with the retirement of the babyboomers, starting in 2010, will be borneby the relatively small number of peopleborn after the baby boom. As a result,only 2.2 workers will be available to supporteach beneficiary in 2030—compared to today’sfour workers per beneficiary. The Presidentplans to work with Congress and the MedicareCommission to develop a long-term solutionto this financing challenge.
SMI Trust Fund: The SMI Trust Fund re-ceives about 75 percent of its income from gen-eral Federal revenues and about 25 percentfrom beneficiary premiums. Unlike HI, theSMI Trust Fund is really a trust fund in nameonly; the law lets the SMI Trust Fund tapdirectly into general revenues to ensure its an-nual solvency.
Demonstrations and Regulations
HCFA also conducts demonstration pro-grams to determine the efficacy of new servicedelivery or payment approaches. For example,Phase II of the Social Health MaintenanceOrganization demonstration project is testingalternative mechanisms for adjusting the man-aged care capitated payment, including thebeneficiary’s functional status. In another dem-onstration project, Centers of Excellence,HCFA has experimented with bundled pay-ments for hospital and physician costs forselected procedures performed at certain high-quality facilities.
Through its regulatory authority, HCFAcontinually improves Medicare. For example,HCFA has finalized regulations specifyingadditional standards that home health agen-cies must meet to participate in Medicare,including securing surety bonds, and it expectsto issue similar regulations for durable medicalequipment suppliers this year. By reducingthe amount of fraud and abuse in the program,the Administration is making importantchanges to strengthen Medicare.
Performance Plan
HCFA has developed a comprehensive setof performance goals to measure its progressin ensuring that Medicare beneficiaries receivethe highest quality health care. HCFA’s 22performance goals relate to quality assurance,access to care for the elderly and disabled,
222 THE BUDGET FOR FISCAL YEAR 1999
administrative efficiency, and a reduction infraud and abuse—four areas critical to theadministration of Medicare.
For example, HCFA’s 1999 goals include:
• Increasing the percentage of Medicarebeneficiaries who receive a mammogramonce every two years from 49 percent in1994 to 59 percent in 1999 and 60 percentin 2000;
• Increasing the number of Medicare bene-ficiaries receiving vaccinations for influ-enza from 41 percent in 1995 to 59 per-cent;
• Reducing the payment error rate underMedicare’s fee-for-service program from 14percent in 1996 to 13 percent, with a five-year goal of 10 percent;
• Continuing to shift Medicare contractors’nine different claims processing systemsto one Part A and one Part B standardsystem (by the end of 1999, HCFA willhave one Part A system and two Part Bsystems, with the final Part B transitioncoming later); and
• Ensuring that no significant interruptionsto Medicare claims payments occur be-cause information systems under HCFA’scontrol were not year 2000 compliant. Forsystems not under HCFA’s direct control,HCFA will continue to work with its Medi-care contractor community and performoversight activities directing them toachieve and verify compliance. HCFA willagain seek legislative changes to increaseits control over contractor systems.
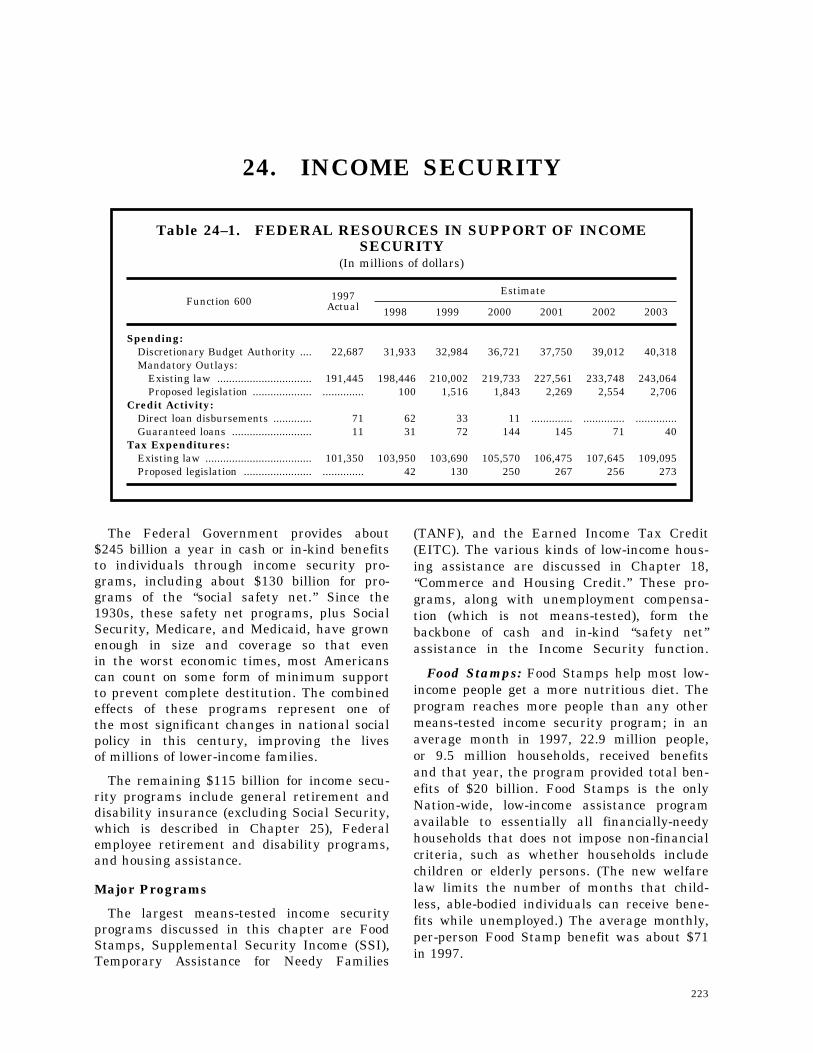
223
24. INCOME SECURITY
Table 24–1. FEDERAL RESOURCES IN SUPPORT OF INCOMESECURITY
(In millions of dollars)
Function 600 1997Actual
Estimate
1998 1999 2000 2001 2002 2003
Spending:Discretionary Budget Authority .... 22,687 31,933 32,984 36,721 37,750 39,012 40,318Mandatory Outlays:
Existing law ................................ 191,445 198,446 210,002 219,733 227,561 233,748 243,064Proposed legislation .................... .............. 100 1,516 1,843 2,269 2,554 2,706
Credit Activity:Direct loan disbursements ............. 71 62 33 11 .............. .............. ..............Guaranteed loans ........................... 11 31 72 144 145 71 40
Tax Expenditures:Existing law .................................... 101,350 103,950 103,690 105,570 106,475 107,645 109,095Proposed legislation ....................... .............. 42 130 250 267 256 273
The Federal Government provides about$245 billion a year in cash or in-kind benefitsto individuals through income security pro-grams, including about $130 billion for pro-grams of the ‘‘social safety net.’’ Since the1930s, these safety net programs, plus SocialSecurity, Medicare, and Medicaid, have grownenough in size and coverage so that evenin the worst economic times, most Americanscan count on some form of minimum supportto prevent complete destitution. The combinedeffects of these programs represent one ofthe most significant changes in national socialpolicy in this century, improving the livesof millions of lower-income families.
The remaining $115 billion for income secu-rity programs include general retirement anddisability insurance (excluding Social Security,which is described in Chapter 25), Federalemployee retirement and disability programs,and housing assistance.
Major Programs
The largest means-tested income securityprograms discussed in this chapter are FoodStamps, Supplemental Security Income (SSI),Temporary Assistance for Needy Families
(TANF), and the Earned Income Tax Credit(EITC). The various kinds of low-income hous-ing assistance are discussed in Chapter 18,‘‘Commerce and Housing Credit.’’ These pro-grams, along with unemployment compensa-tion (which is not means-tested), form thebackbone of cash and in-kind ‘‘safety net’’assistance in the Income Security function.
Food Stamps: Food Stamps help most low-income people get a more nutritious diet. Theprogram reaches more people than any othermeans-tested income security program; in anaverage month in 1997, 22.9 million people,or 9.5 million households, received benefitsand that year, the program provided total ben-efits of $20 billion. Food Stamps is the onlyNation-wide, low-income assistance programavailable to essentially all financially-needyhouseholds that does not impose non-financialcriteria, such as whether households includechildren or elderly persons. (The new welfarelaw limits the number of months that child-less, able-bodied individuals can receive bene-fits while unemployed.) The average monthly,per-person Food Stamp benefit was about $71in 1997.
224 THE BUDGET FOR FISCAL YEAR 1999
• In 1999, the program will provide an aver-age projected benefit of $76 to 21.6 millionpersons a month.
Child Nutrition Programs: The NationalSchool Lunch and Breakfast Programs providefree or low-cost nutritious meals to childrenin participating schools.
• In 1999, the programs will serve an esti-mated 27 million lunches daily.
Supplemental Security Income: SSI pro-vides benefits to the needy aged, blind, anddisabled adults and children. In 1997, 6.3 mil-lion individuals received $26.2 billion in bene-fits. Eligibility rules and payment standardsare uniform across the Nation. Average month-ly benefit payments range from $234 for agedadults to $450 for blind and disabled children.Most States supplement the SSI benefit.
• In 1999, SSI will serve an estimated 6.3million respondents, costing $28 billion inbenefits.
Temporary Assistance for Needy Fami-lies: In the 1996 welfare reform law, the Presi-dent and Congress enacted TANF as the suc-cessor to the 60-year-old Aid to Families withDependent Children (AFDC) program. TANF,on which the Federal Government will spendabout $16.5 billion in 1999, is designed to meetthe President’s goal of dramatically changingthe focus of welfare—from a system focusedon determining eligibility to one that helps re-cipients move from welfare to work. TANFgrants give States broad flexibility to deter-mine eligibility for assistance and the kind ofcash, in-kind, and work-related assistance theyprovide.
• States cannot yet project the number ofpersons who will receive TANF assistancein 1999.
Earned Income Tax Credit: The EITC, arefundable tax credit for low-income workingfamilies, has two broad goals: (1) to encouragefamilies to move from welfare to work by mak-ing work pay; and (2) to reward work so par-ents who work full-time do not have to raisetheir children in poverty. In 1997, the EITCprovided $27.9 billion of credits, includingspending on tax refunds and lower tax receiptsfor non-refunded portions of the credit. Forevery dollar that low-income workers earn—
up to certain limits—they receive betweenseven and 40 cents as a tax credit. In 1997,the EITC provided an average credit of nearly$1,470 to nearly 19 million workers and theirfamilies.
• In 1999, an estimated 19 million house-holds will receive an average credit of$1,500.
Unemployment Compensation: Unemploy-ment compensation provides benefits, whichare taxable, to individuals who are temporarilyout of work and whose employer has pre-viously paid payroll taxes to the program. TheState payroll taxes finance the basic benefitsout of a dedicated trust fund. States set benefitlevels and eligibility criteria, which are notmeans-tested. Regular benefits are typicallyavailable for up to 26 weeks of unemployment.In 1997, about 7.6 million persons claimed un-employment benefits that averaged $185 week-ly.
• In 1999, an estimated 8.3 million personswill receive an average benefit of $199 aweek.
By design, benefits are available to experi-enced workers who lose their jobs throughno fault of their own. Thus, unemploymentcompensation does not cover all of the unem-ployed in any given month. In 1997, onaverage, the ‘‘insured unemployed’’ representedabout 35 percent of the estimated total numberof unemployed. Those who are not coveredinclude new labor force entrants, re-entrantswith no recent job experience, and thosewho quit their jobs voluntarily without goodcause and, thus, are not eligible for benefits.
Other important income security programsinclude the Special Supplemental NutritionProgram for Women, Infants, and Children(known as WIC); child care assistance; refugeeassistance; and low-income home energy as-sistance.
Recent Changes in Income SecurityCaseloads
Due largely to a strong economy and signifi-cant changes to Federal welfare and FoodStamp programs, the caseload in each hascontinued to fall in the past year. Mostdetailed analyses have attributed these case-load reductions to the strong economy and
22524. INCOME SECURITY
new efforts to move people from welfareto work. Indeed, welfare caseloads, whichfell by a record 1.9 million in the President’sfirst three-and-a-half years in office, droppedby more than two million in the year afterhe signed the new welfare reform law. Thelaw created TANF, repealed AFDC, increasedchild care payments, and created a newtime-limited work-oriented public assistanceprogram. States must now require and rewardwork, impose time limits, and demand per-sonal responsibility.
In addition, the welfare reform law alsolimited Food Stamp benefits for able-bodiedchildless adults to three months of assistancein a 36-month period. The 1997 BalancedBudget Agreement provided funds to providequalifying work slots to individuals facingthe time limits, but only enough to servea portion of affected individuals. The welfarereform law banned most legal immigrantsfrom receiving Food Stamps. The budgetwould restore these benefits for families withchildren, and for disabled and elderly legalimmigrants who entered the country beforethe law was signed.
Like TANF, Food Stamp caseloads havecontinued to fall. In September 1997, theFood Stamp program recorded its 41st straightmonth of declining enrollment, reflecting alongstanding trend: Food Stamp enrollmentsrise and fall with the poverty rate. Atits peak in March 1993, Food Stamps served27.4 million participants a month, or onein every 10 Americans. By September 1997,participation had fallen to 20.9 million, orone in every 13 Americans.
Due also to the economy and low unemploy-ment, the unemployment insurance (UI) case-load has fallen significantly. Between 1993and 1997, the average weekly number ofindividuals claiming UI benefits declined from4.4 million to 2.4 million.
While caseloads have fallen in varioussafety net programs, the Administration hascontinued to target resources at infants andchildren. WIC, for example, reaches nearly7.5 million persons a year, providing nutritionassistance, nutrition education and counseling,and health and immunization referrals. WICfunding increases since 1993 have enabledparticipation to grow by nearly 30 percent.
The budget proposes $4.1 billion to serve7.5 million through 1999, fulfilling the Presi-dent’s goal of full participation in WIC.
Effects of Income Security Programs
What effect do safety net programs haveon poverty, and to what extent do theytarget assistance to the poor? Chapter 25,‘‘Social Security,’’ explores the impact of SocialSecurity alone on the income and povertyof the elderly. This chapter looks at thecumulative impact across the major programs.
For purposes of this discussion, ‘‘means-tested benefits’’ include AFDC, SSI, certainveterans pensions, Food Stamps, child nutri-tion meals subsidies, rental assistance, andState-funded general assistance. Medicare andMedicaid greatly help eligible families whoneed medical services during the year, butexperts do not agree about how much addi-tional income Medicare or Medicaid coveragerepresents to the covered. Consequently, thesebenefits are not included in the analysisthat follows. ‘‘Social insurance programs’’ in-clude Social Security, railroad retirement,veterans compensation, unemployment com-pensation, Pell Grants, and workers’ com-pensation. The definition of income for thisdiscussion (cash and in-kind benefits), andthe notion of pre- and post-Government trans-fers, do not match the Census Bureau’sdefinitions for developing official poverty sta-tistics. Census counts income from cash alone,including Government transfers.
Effectiveness in Reducing Poverty: Basedon special tabulations from the March 1997Current Population Survey (CPS), 57.5 millionpeople were poor in 1996 before accounting forthe effect of Government programs. After ac-counting for Government transfer programs,the number of poor fell to 30.3 million, a dropof 47 percent.
After large declines in poverty in 1994and 1995, 1997 CPS data suggests thatthe poverty rate did not fall significantlyin 1996. Some experts were surprised, givenlarge declines in the unemployment rate,increases in real weekly wages of productionand nonsupervisory employees, and a higherminimum wage that took effect in October.But, while the overall poverty rate did notfall, the strong economy lowered the pre-
226 THE BUDGET FOR FISCAL YEAR 1999
transfer poverty rate and has enabled morepeople to leave welfare for work. Thus, fewerindividuals have had to rely on safety netprograms to pull themselves out of poverty.
Efficiency in Reducing Poverty: The pov-erty gap is the amount by which the incomesof all poor people fall below the poverty line.‘‘Efficiency’’ in reducing poverty is defined asthe percentage of Government benefits of aparticular type (e.g., social insurance pro-grams) that help cut the poverty gap. For ex-ample, if $1 out of every $2 in Category Ahelps cut the poverty gap, the ‘‘efficiency’’ ofCategory A is 50 percent.
Before counting Government benefits, thepoverty gap was $194.5 billion in 1995.Benefits from Government programs cut itby $135 billion, or 69 percent. Of the $135billion cut, social insurance programs ac-counted for $90 billion, means-tested benefitsfor $43 billion, and Federal tax provisionsfor $2 billion.
All told, according to Census Bureau data,social insurance benefits totaled $338 billionin 1995. Thus, 26 percent of their funding(the $90 billion, above) helped cut the povertygap. Means-tested benefits totaled $78 billion,according to Census data. Thus, 56 percentof the funding (the $43 billion, above) helpedcut the poverty gap.
The evidence is clear: whether measuredby their impact on poverty gaps, or onmoving families out of poverty, income securityprograms largely succeed. Social insuranceprograms play the largest role in cuttingpoverty, but means-tested programs—targetedmore narrowly on the poor—are more efficient.
Employee Retirement Benefits
Federal Employee Retirement Benefits:The Civil Service Retirement and DisabilityProgram provides a defined benefit pension for1.8 million Federal civilian employees and800,000 U.S. Postal Service employees. In1997, the program paid $42 billion in benefitsto 1.7 million retirees and 600,000 survivors.Along with the defined benefit, employees canparticipate in a defined contribution plan—theThrift Savings Plan (TSP). Employees hiredsince 1983 are also covered by Social Security.(For a discussion of military retirement pro-
grams, see Chapter 26, ‘‘Veterans Benefits andServices.’’)
Private Pensions: The Pension and WelfareBenefits Administration (PWBA) establishesand enforces safeguards to protect the roughly$3.5 trillion in pension assets. The PensionBenefit Guaranty Corporation (PBGC) protectsthe pension benefits of nearly 42 million work-ers and retirees who earn traditional (i.e., ‘‘de-fined benefit’’) pensions. Through its earlywarning program, PBGC also works with sol-vent companies to more fully fund their pen-sion promises, protecting the benefits of 1.2million people in 1996 alone. To encourage re-tirement savings, the President signed legisla-tion in 1996 that establishes a new, simplifiedpension plan for small businesses.
In 1999, the PWBA will:
• reduce, to 12 percent, the percentage ofemployee benefit plan audits that do notcomply with professional accounting andauditing standards, compared to 1996; and
• increase, by 2.5 percent, the number offiduciary investigations closed in whichplan assets are restored, compared to1996.
Tax Treatment of Retirement Savings:The Federal Government encourages retire-ment savings by providing income tax benefits.Generally, earnings devoted to workplace pen-sion plans and to many individual retirementaccounts (IRAs) are exempt from taxes whenearned and ordinarily are taxed only in retire-ment, when lower tax rates usually prevail.Moreover, taxpayers can defer taxes on the in-terest and other gains that add value of theseretirement accounts, including all forms ofIRAs. These tax incentives amount to $84 bil-lion a year—one of the three largest sets ofpreferences in the income-tax system.
Child Support Enforcement Financing:The Federal Government has a strong interestin ensuring that the national child supportsystem is effective. Funding of the Child Sup-port Enforcement (CSE) program, however, re-mains complicated. States get Federal pay-ments to cover administrative costs at severaldifferent matching rates. States also get Fed-eral incentive payments, levy user fees, keepa portion of TANF-related collections, and re-turn a portion to the Federal Government.
22724. INCOME SECURITY
Federal retention of TANF-related paymentsis a legacy of the old AFDC program inwhich States and the Federal Governmentshared in funding AFDC and, thus, in collect-ing child support for AFDC recipients. Withwelfare reform, States have great freedomto design assistance for families with depend-ent children. States, however, must continueto share a portion of child support collectionswith the Federal Government. The need toshare collections may serve as a disincentivefor States to pass through the full amountof child support to families, and it createsan unintended incentive for States to serveneedy families through programs funded onlywith State dollars. Spending on these ‘‘State-only’’ programs continues to count underthe TANF maintenance-of-effort requirement,but child support collections on behalf ofthese families do not need to be sharedwith the Federal Government.
The Administration will hold a dialoguewith the stakeholders of the child supportprogram to look at ways to address theseproblems and, working with Congress, willprepare legislation. The budget takes a firststep towards simplifying the child supportfunding structure by 1) conforming the matchrate for paternity testing with the basicadministrative match rate; and 2) repealingthe hold harmless provision established underthe welfare reform law.
Under current law, States have resourcesequal to about 110 percent of the amountthat they spend on their State Child Supportprograms. The proposed changes would reducethe State windfall by less than two percentof program costs and save the Federal Govern-ment about $300 million over five years.
Finally, the Administration supports cost-neutral changes to the pending Child Support
Incentives legislation, as the Department ofHealth and Human Services proposed inits 1997 report to Congress, mandated bythe welfare reform law.
Allocation of Administrative CostsAmong Welfare Programs: The budget pro-poses to address projected Federal cost in-creases in Food Stamps and Medicaid thatarise from changes in the way States chargecosts to the Federal Government to administerthese programs as well as TANF.
Before welfare reform, States charged mostcommon costs of the three programs to AFDC.With TANF—which consolidated cash welfareassistance and related programs and limitedthe amount of funds that could go for adminis-trative purposes—many States have soughtto charge fewer of their expenses to TANFand more to Food Stamps and Medicaid,which still provide open-ended matching fundsfor State administrative costs.
To date, HHS has not approved Staterequests to change their cost allocation plansin order to increase administrative reimburse-ments under Food Stamp and Medicaid. Nei-ther the Administration nor Congress envi-sioned such cost increases—which would ex-ceed a projected $500 million a year—incrafting welfare reform.
In 1999, the Administration plans to letStates change their cost allocation plansto charge more of their common administrativecosts to Food Stamps and Medicaid. Butto prevent Federal costs from rising, thebudget proposes Food Stamp and Medicaidchanges that would cover the costs. Specifi-cally, it would cut the matching rates foradministrative costs in Food Stamps andMedicaid from 50 percent to 47 percent.

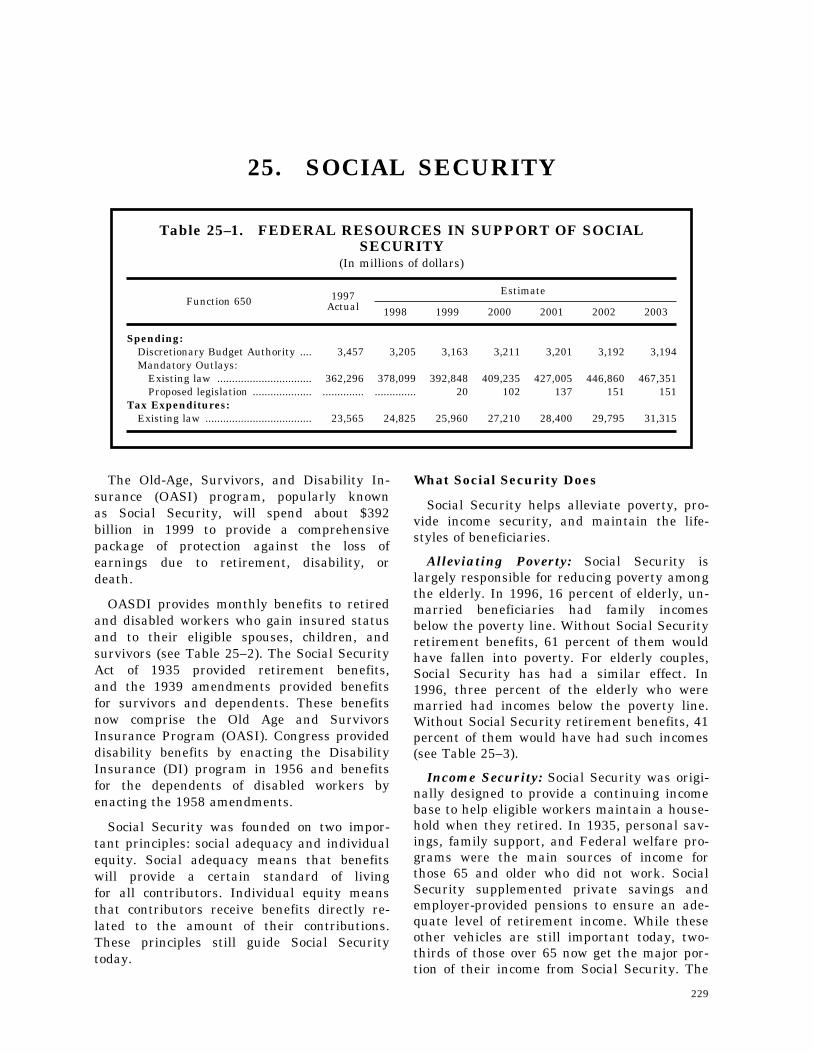
229
25. SOCIAL SECURITY
Table 25–1. FEDERAL RESOURCES IN SUPPORT OF SOCIALSECURITY
(In millions of dollars)
Function 650 1997Actual
Estimate
1998 1999 2000 2001 2002 2003
Spending:Discretionary Budget Authority .... 3,457 3,205 3,163 3,211 3,201 3,192 3,194Mandatory Outlays:
Existing law ................................ 362,296 378,099 392,848 409,235 427,005 446,860 467,351Proposed legislation .................... .............. .............. 20 102 137 151 151
Tax Expenditures:Existing law .................................... 23,565 24,825 25,960 27,210 28,400 29,795 31,315
The Old-Age, Survivors, and Disability In-surance (OASI) program, popularly knownas Social Security, will spend about $392billion in 1999 to provide a comprehensivepackage of protection against the loss ofearnings due to retirement, disability, ordeath.
OASDI provides monthly benefits to retiredand disabled workers who gain insured statusand to their eligible spouses, children, andsurvivors (see Table 25–2). The Social SecurityAct of 1935 provided retirement benefits,and the 1939 amendments provided benefitsfor survivors and dependents. These benefitsnow comprise the Old Age and SurvivorsInsurance Program (OASI). Congress provideddisability benefits by enacting the DisabilityInsurance (DI) program in 1956 and benefitsfor the dependents of disabled workers byenacting the 1958 amendments.
Social Security was founded on two impor-tant principles: social adequacy and individualequity. Social adequacy means that benefitswill provide a certain standard of livingfor all contributors. Individual equity meansthat contributors receive benefits directly re-lated to the amount of their contributions.These principles still guide Social Securitytoday.
What Social Security Does
Social Security helps alleviate poverty, pro-vide income security, and maintain the life-styles of beneficiaries.
Alleviating Poverty: Social Security islargely responsible for reducing poverty amongthe elderly. In 1996, 16 percent of elderly, un-married beneficiaries had family incomesbelow the poverty line. Without Social Securityretirement benefits, 61 percent of them wouldhave fallen into poverty. For elderly couples,Social Security has had a similar effect. In1996, three percent of the elderly who weremarried had incomes below the poverty line.Without Social Security retirement benefits, 41percent of them would have had such incomes(see Table 25–3).
Income Security: Social Security was origi-nally designed to provide a continuing incomebase to help eligible workers maintain a house-hold when they retired. In 1935, personal sav-ings, family support, and Federal welfare pro-grams were the main sources of income forthose 65 and older who did not work. SocialSecurity supplemented private savings andemployer-provided pensions to ensure an ade-quate level of retirement income. While theseother vehicles are still important today, two-thirds of those over 65 now get the major por-tion of their income from Social Security. The
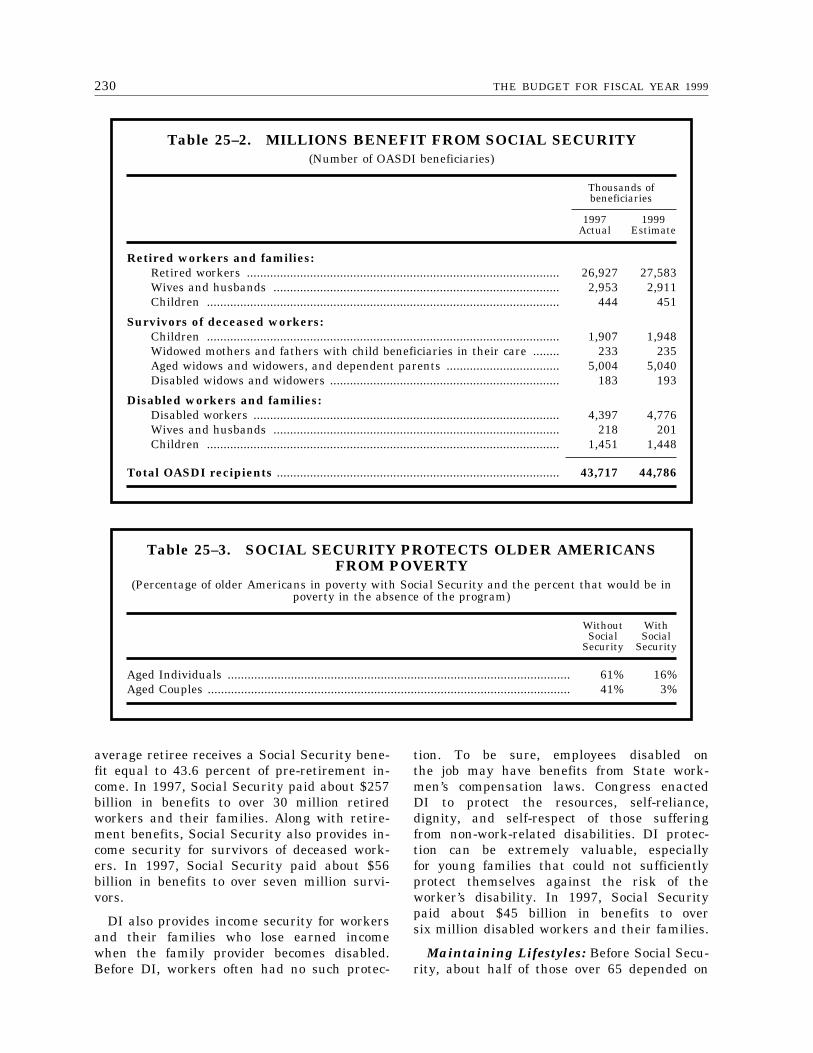
230 THE BUDGET FOR FISCAL YEAR 1999
Table 25–2. MILLIONS BENEFIT FROM SOCIAL SECURITY(Number of OASDI beneficiaries)
Thousands ofbeneficiaries
1997Actual
1999Estimate
Retired workers and families:Retired workers .............................................................................................. 26,927 27,583Wives and husbands ...................................................................................... 2,953 2,911Children .......................................................................................................... 444 451
Survivors of deceased workers:Children .......................................................................................................... 1,907 1,948Widowed mothers and fathers with child beneficiaries in their care ........ 233 235Aged widows and widowers, and dependent parents .................................. 5,004 5,040Disabled widows and widowers ..................................................................... 183 193
Disabled workers and families:Disabled workers ............................................................................................ 4,397 4,776Wives and husbands ...................................................................................... 218 201Children .......................................................................................................... 1,451 1,448
Total OASDI recipients ..................................................................................... 43,717 44,786
Table 25–3. SOCIAL SECURITY PROTECTS OLDER AMERICANSFROM POVERTY
(Percentage of older Americans in poverty with Social Security and the percent that would be inpoverty in the absence of the program)
WithoutSocial
Security
WithSocial
Security
Aged Individuals ....................................................................................................... 61% 16%Aged Couples ............................................................................................................. 41% 3%
average retiree receives a Social Security bene-fit equal to 43.6 percent of pre-retirement in-come. In 1997, Social Security paid about $257billion in benefits to over 30 million retiredworkers and their families. Along with retire-ment benefits, Social Security also provides in-come security for survivors of deceased work-ers. In 1997, Social Security paid about $56billion in benefits to over seven million survi-vors.
DI also provides income security for workersand their families who lose earned incomewhen the family provider becomes disabled.Before DI, workers often had no such protec-
tion. To be sure, employees disabled onthe job may have benefits from State work-men’s compensation laws. Congress enactedDI to protect the resources, self-reliance,dignity, and self-respect of those sufferingfrom non-work-related disabilities. DI protec-tion can be extremely valuable, especiallyfor young families that could not sufficientlyprotect themselves against the risk of theworker’s disability. In 1997, Social Securitypaid about $45 billion in benefits to oversix million disabled workers and their families.
Maintaining Lifestyles: Before Social Secu-rity, about half of those over 65 depended on
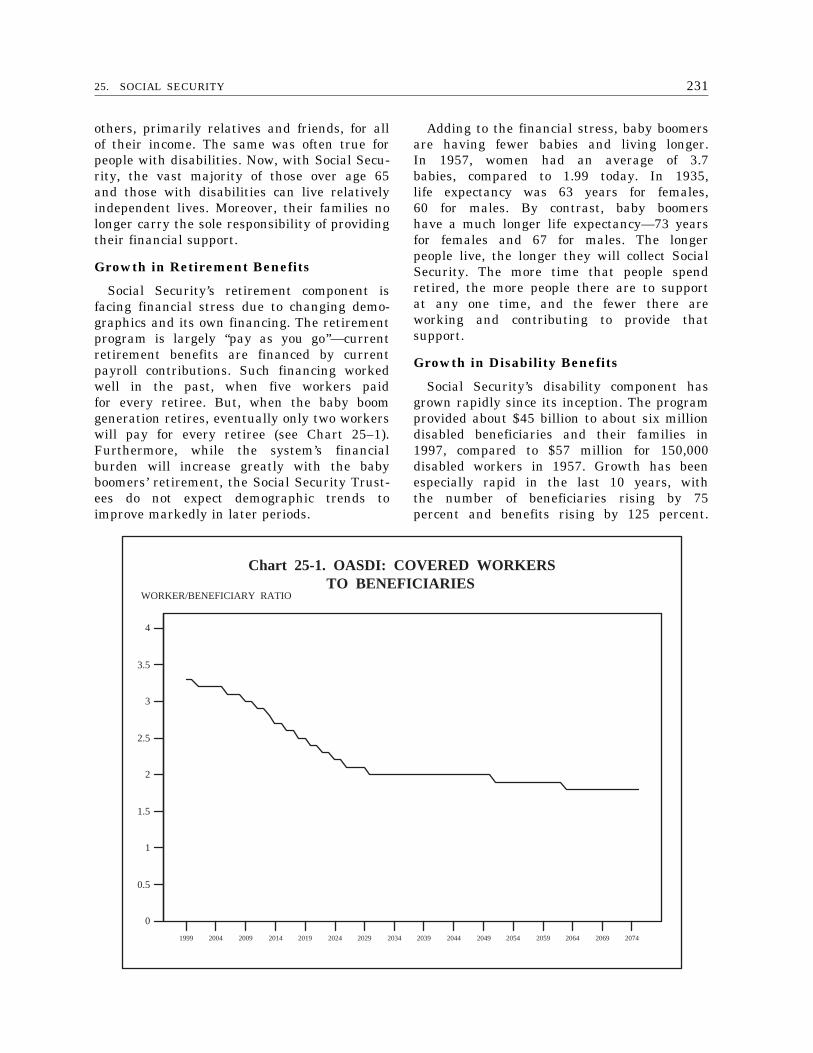
23125. SOCIAL SECURITY
1999 2004 2009 2014 2019 2024 2029 2034 2039 2044 2049 2054 2059 2064 2069 2074
0
0.5
1
1.5
2
2.5
3
3.5
4
WORKER/BENEFICIARY RATIO
Chart 25-1. OASDI: COVERED WORKERS TO BENEFICIARIES
others, primarily relatives and friends, for allof their income. The same was often true forpeople with disabilities. Now, with Social Secu-rity, the vast majority of those over age 65and those with disabilities can live relativelyindependent lives. Moreover, their families nolonger carry the sole responsibility of providingtheir financial support.
Growth in Retirement Benefits
Social Security’s retirement component isfacing financial stress due to changing demo-graphics and its own financing. The retirementprogram is largely ‘‘pay as you go’’—currentretirement benefits are financed by currentpayroll contributions. Such financing workedwell in the past, when five workers paidfor every retiree. But, when the baby boomgeneration retires, eventually only two workerswill pay for every retiree (see Chart 25–1).Furthermore, while the system’s financialburden will increase greatly with the babyboomers’ retirement, the Social Security Trust-ees do not expect demographic trends toimprove markedly in later periods.
Adding to the financial stress, baby boomersare having fewer babies and living longer.In 1957, women had an average of 3.7babies, compared to 1.99 today. In 1935,life expectancy was 63 years for females,60 for males. By contrast, baby boomershave a much longer life expectancy—73 yearsfor females and 67 for males. The longerpeople live, the longer they will collect SocialSecurity. The more time that people spendretired, the more people there are to supportat any one time, and the fewer there areworking and contributing to provide thatsupport.
Growth in Disability Benefits
Social Security’s disability component hasgrown rapidly since its inception. The programprovided about $45 billion to about six milliondisabled beneficiaries and their families in1997, compared to $57 million for 150,000disabled workers in 1957. Growth has beenespecially rapid in the last 10 years, withthe number of beneficiaries rising by 75percent and benefits rising by 125 percent.
232 THE BUDGET FOR FISCAL YEAR 1999
What has caused the growth? More andmore baby boomers are reaching the ageat which they are increasingly prone todisabilities; the number of women insuredhas risen; and laws, regulations, and courtdecisions have expanded eligibility for benefits.In addition, the annual share of beneficiariesleaving the rolls has fallen steadily, makingit more important to ensure that those remain-ing on the rolls are all, in fact, eligiblefor benefits. To maintain DI’s integrity, theAdministration proposes to maintain supportfor continuing disability reviews (CDRs)—a periodic review of individual cases thatensures that only those eligible continueto receive benefits.
The budget proposes a Ticket to Independ-ence pilot program to encourage DI bene-ficiaries and Supplemental Security Income(SSI) disabled recipients to re-enter theworkforce. Currently, the Social Security Ad-ministration (SSA) refers these beneficiariesto State and, in limited cases, private Voca-tional Rehabilitation agencies. Under thisproposal, beneficiaries could choose their ownpublic or private vocational rehabilitation pro-vider—and the provider could keep a shareof the DI and SSI benefits that the FederalGovernment no longer pays to these individ-uals after they leave the rolls.
A Long-range Problem, but No Crisis
The OASDI trust funds are not in balanceover the next 75 years—the period overwhich the Social Security Trustees have tradi-tionally measured Social Security’s well-being.In their 1997 report, the Trustees estimatedthat the combined OASDI trust funds wouldhave a cash imbalance in 2012 and beinsolvent in 2029. Much of the deteriorationarises from changes described above in demo-graphics over the measurement period. ThePresident wants to work with Congress ona bipartisan basis to develop a long-termsolution to the financing challenge. Actingsooner rather than later to address thelong-term inadequacies of OASDI financingwill reduce the magnitude of changes needed.
Social Security Administration (SSA)
SSA administers OASI and DI as wellas SSI, which is part of the Income Securityfunction. SSA also provides services to Medi-care on behalf of the Health Care FinancingAdministration, which is part of the Medicarefunction.
SSA’s Performance Plan for 1999 generallyreflects its commitment to maintain the qual-ity of its program administration, reflectedin terms of customer service delivery, oper-ational efficiency, and program integrity. SSA’skey performance measures and commitmentsfor 1999 include the following.
For customer service delivery:
• SSA will maintain its current performancelevel of ensuring that 95 percent of callersaccess the 800-number within five minutesof their first call.
• The average processing time for complet-ing hearings on appeals of disabilityclaims decisions will be 284 days by year-end, compared to 398 days at the end of1997.
For operational efficiency:
• SSA will process 3,143,000 claims forSocial Security retirement and survivorsbenefits, compared to 3,129,000 in 1997.
For program integrity:
• SSA will process 1,637,000 reviews of theeligibility of recipients of DI and SSI disa-bility benefits, compared to 690,000 dis-ability reviews in 1997.
Tax Expenditures
Social Security recipients pay taxes ontheir Social Security benefits only when theiroverall income, including Social Security, ex-ceeds certain income thresholds. These thresh-olds reduce total Social Security beneficiarytaxes by $26 billion in 1999 and $143 billionfrom 1999 to 2003.
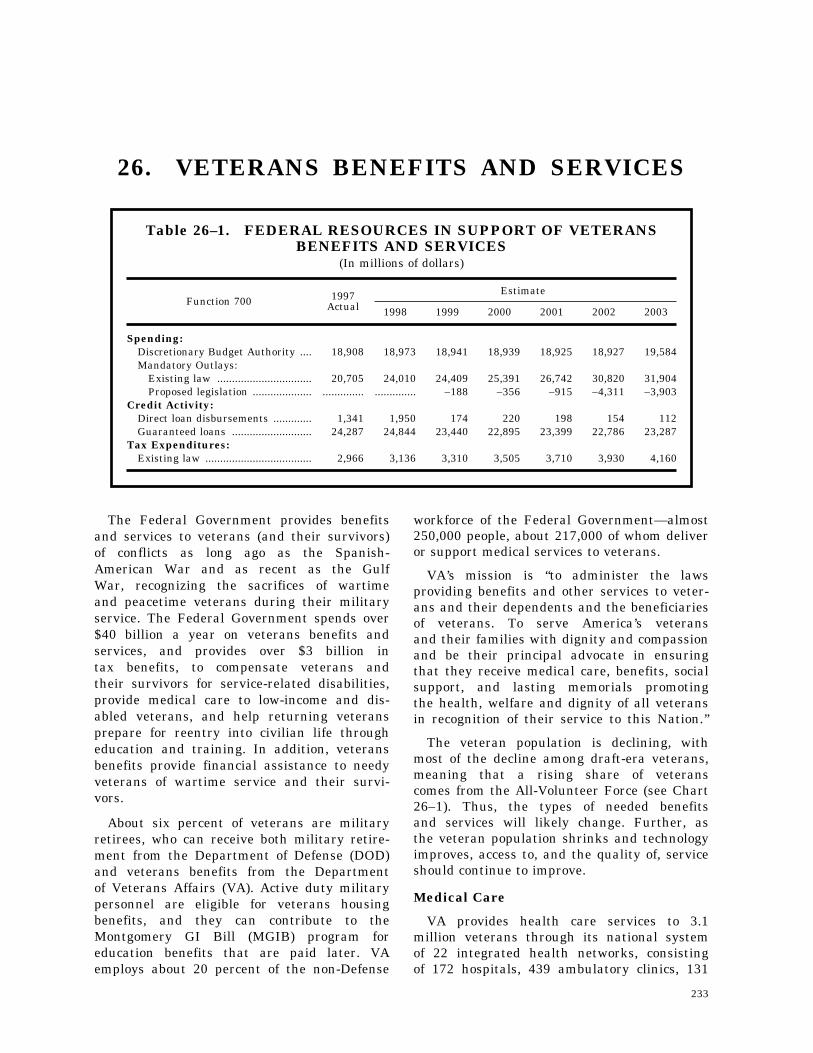
233
26. VETERANS BENEFITS AND SERVICES
Table 26–1. FEDERAL RESOURCES IN SUPPORT OF VETERANSBENEFITS AND SERVICES
(In millions of dollars)
Function 700 1997Actual
Estimate
1998 1999 2000 2001 2002 2003
Spending:Discretionary Budget Authority .... 18,908 18,973 18,941 18,939 18,925 18,927 19,584Mandatory Outlays:
Existing law ................................ 20,705 24,010 24,409 25,391 26,742 30,820 31,904Proposed legislation .................... .............. .............. –188 –356 –915 –4,311 –3,903
Credit Activity:Direct loan disbursements ............. 1,341 1,950 174 220 198 154 112Guaranteed loans ........................... 24,287 24,844 23,440 22,895 23,399 22,786 23,287
Tax Expenditures:Existing law .................................... 2,966 3,136 3,310 3,505 3,710 3,930 4,160
The Federal Government provides benefitsand services to veterans (and their survivors)of conflicts as long ago as the Spanish-American War and as recent as the GulfWar, recognizing the sacrifices of wartimeand peacetime veterans during their militaryservice. The Federal Government spends over$40 billion a year on veterans benefits andservices, and provides over $3 billion intax benefits, to compensate veterans andtheir survivors for service-related disabilities,provide medical care to low-income and dis-abled veterans, and help returning veteransprepare for reentry into civilian life througheducation and training. In addition, veteransbenefits provide financial assistance to needyveterans of wartime service and their survi-vors.
About six percent of veterans are militaryretirees, who can receive both military retire-ment from the Department of Defense (DOD)and veterans benefits from the Departmentof Veterans Affairs (VA). Active duty militarypersonnel are eligible for veterans housingbenefits, and they can contribute to theMontgomery GI Bill (MGIB) program foreducation benefits that are paid later. VAemploys about 20 percent of the non-Defense
workforce of the Federal Government—almost250,000 people, about 217,000 of whom deliveror support medical services to veterans.
VA’s mission is ‘‘to administer the lawsproviding benefits and other services to veter-ans and their dependents and the beneficiariesof veterans. To serve America’s veteransand their families with dignity and compassionand be their principal advocate in ensuringthat they receive medical care, benefits, socialsupport, and lasting memorials promotingthe health, welfare and dignity of all veteransin recognition of their service to this Nation.’’
The veteran population is declining, withmost of the decline among draft-era veterans,meaning that a rising share of veteranscomes from the All-Volunteer Force (see Chart26–1). Thus, the types of needed benefitsand services will likely change. Further, asthe veteran population shrinks and technologyimproves, access to, and the quality of, serviceshould continue to improve.
Medical Care
VA provides health care services to 3.1million veterans through its national systemof 22 integrated health networks, consistingof 172 hospitals, 439 ambulatory clinics, 131
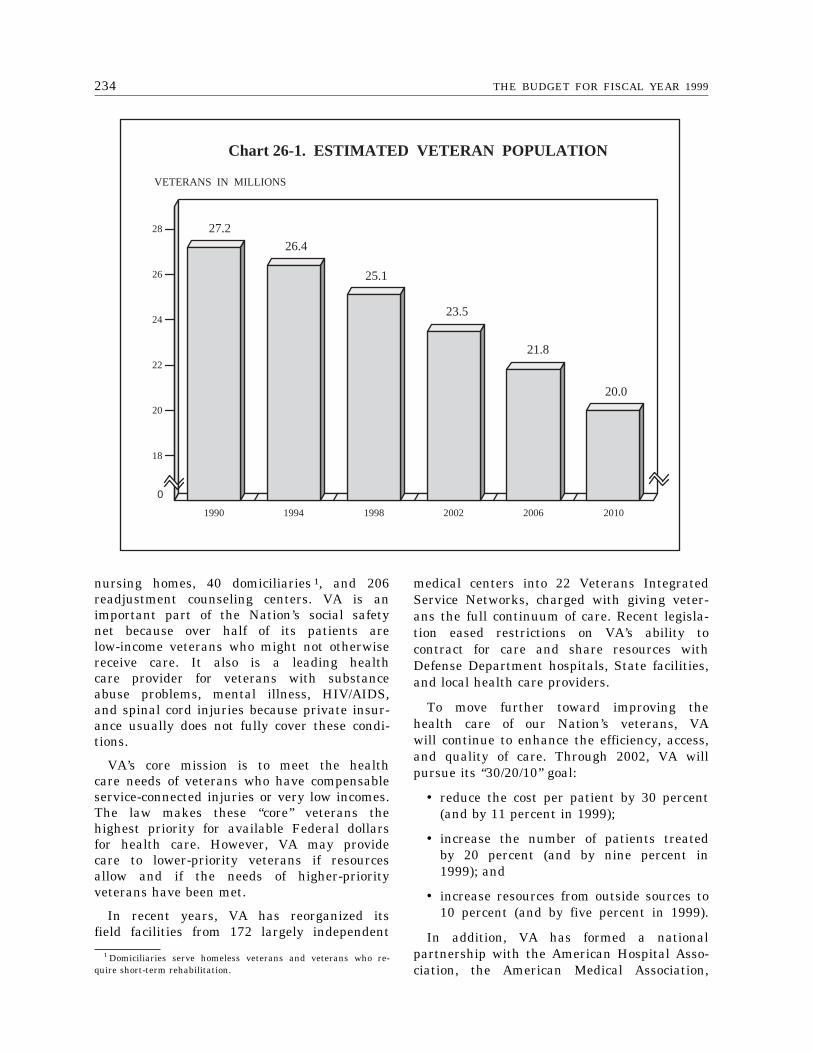
234 THE BUDGET FOR FISCAL YEAR 1999
1990 1994 1998 2002 2006 201016
18
20
22
24
26
28
VETERANS IN MILLIONS
Chart 26-1. ESTIMATED VETERAN POPULATION
0
27.2
25.1
23.5
21.8
26.4
20.0
1 Domiciliaries serve homeless veterans and veterans who re-quire short-term rehabilitation.
nursing homes, 40 domiciliaries 1, and 206readjustment counseling centers. VA is animportant part of the Nation’s social safetynet because over half of its patients arelow-income veterans who might not otherwisereceive care. It also is a leading healthcare provider for veterans with substanceabuse problems, mental illness, HIV/AIDS,and spinal cord injuries because private insur-ance usually does not fully cover these condi-tions.
VA’s core mission is to meet the healthcare needs of veterans who have compensableservice-connected injuries or very low incomes.The law makes these ‘‘core’’ veterans thehighest priority for available Federal dollarsfor health care. However, VA may providecare to lower-priority veterans if resourcesallow and if the needs of higher-priorityveterans have been met.
In recent years, VA has reorganized itsfield facilities from 172 largely independent
medical centers into 22 Veterans IntegratedService Networks, charged with giving veter-ans the full continuum of care. Recent legisla-tion eased restrictions on VA’s ability tocontract for care and share resources withDefense Department hospitals, State facilities,and local health care providers.
To move further toward improving thehealth care of our Nation’s veterans, VAwill continue to enhance the efficiency, access,and quality of care. Through 2002, VA willpursue its ‘‘30/20/10’’ goal:
• reduce the cost per patient by 30 percent(and by 11 percent in 1999);
• increase the number of patients treatedby 20 percent (and by nine percent in1999); and
• increase resources from outside sources to10 percent (and by five percent in 1999).
In addition, VA has formed a nationalpartnership with the American Hospital Asso-ciation, the American Medical Association,
23526. VETERANS BENEFITS AND SERVICES
the American Nurses Association, and othernational associations to ensure patient qualityof care.
By 2003, VA plans to:
• increase the number of patients with highvolume common disease entities who aretreated using clinical guidelines to 90 per-cent (and to 60 percent in 1999);
• increase the scores on the Chronic DiseaseIndex to 95 percent (and to 91 percentin 1999); and
• increase the scores on the PreventionIndex to 95 percent (and to 87 percentin 1999).
Medical Research: VA’s research programprovides about $300 million to conduct basic,clinical, epidemiological, and behavioral stud-ies across the entire spectrum of scientific dis-ciplines, seeking to improve veterans medicalcare and health and enhancing our knowledgeof disease and disability. VA is reorganizingits research to ensure that all projects clearlyrelate to the health care of veterans. In 1999,VA will focus its research efforts on aging,chronic diseases, mental illness, substanceabuse, sensory loss, trauma related impair-ment, health systems research, special popu-lations (including Persian Gulf veterans), andmilitary occupational and environmental expo-sures.
• At least 99 percent of funded projects willbe relevant to VA’s mission in 1999,achieving the VA’s goal.
Health Care Education and Training:The Veterans Health Administration is theNation’s largest trainer of health care profes-sionals, with about 107,000 students a yearwho get some or all of their training in VAfacilities through affiliations with over 1,000educational institutions. The program trainsmedical, dental, nursing, and associated healthprofessions students to ensure an adequatesupply of clinical care providers for veteransand the Nation as a whole. The program willcontinue to realign its academic training andupdate its curriculum, focusing more on pri-mary care to better meet the needs of the Vet-erans Health Administration and its patients,students, and academic partners.
• In 1999, VA will train 44 percent of itsresidents in primary care and, in 2003,increase that figure to 48 percent.
Veterans Benefits Administration (VBA)
VBA processes veterans claims for benefitsin 58 regional offices across the country.Its workload peaked in 1993 and 1994, whenit needed 214 days to process a claim.As the veteran population declines, the num-ber of new claims and appeals will alsolikely decline. In 1997, the number of daysto process a new claim averaged 133. VBAis developing a comprehensive strategic planto further improve processing performance.Its current strategic goals include:
• improving responsiveness to customerneeds and expectations;
• improving service delivery and benefitclaims processing;
• ensuring best value for the available tax-payers’ dollar; and
• ensuring a satisfying and rewarding workenvironment.
Income Security
Several VA programs help veterans andtheir survivors maintain their income whenthe veteran is disabled or deceased. TheFederal Government will spend over $21billion for these programs in 1999, includingthe funds Congress approves each year tosubsidize life insurance for veterans whoare too disabled to get affordable coveragefrom private insurance. Veterans can receivethese benefits along with the income securitythat goes to all Americans, such as SocialSecurity and unemployment insurance.
Compensation: Veterans with disabilitiesresulting from, or coincident with, militaryservice receive monthly compensation pay-ments, based on the degree of disability. Thepayment does not depend on the veteran’s in-come or age, or on whether the disability isthe result of combat or a natural-life affliction.It does, however, depend on the average fallin earnings capacity that the Government pre-sumes for veterans with the same degree ofdisability. Survivors of veterans who die fromservice-connected injuries receive payments inthe form of dependency and indemnity com-
236 THE BUDGET FOR FISCAL YEAR 1999
pensation. Benefits are indexed annually bythe same cost-of-living adjustment (COLA) asSocial Security, which is an estimated 2.2 per-cent for 1999.
The number of veterans and survivorsof deceased veterans receiving compensationbenefits will total an estimated 2.7 millionin 1999. While the veteran population willdecline, the compensation caseload will remainrelatively constant due to changes in eligibilityand better outreach efforts. COLAs and in-creased payments to aging veterans will in-crease compensation spending by about $3billion from 1999 to 2003.
• In 1999, VA will process original com-pensation claims in 106 days, dropping to53 days in 2002.
Pensions: The Government provides pen-sions to lower-income, wartime-service veter-ans, or veterans who became permanently andtotally disabled after their military service.Survivors of wartime-service veterans mayqualify for pension benefits based on financialneed. Veterans pensions, which also increaseannually with COLAs, will cost over $3 billionin 1999. The number of pension recipients willcontinue to fall from an estimated 673,000 in1999 to less than 600,000 in 2003, as the num-ber of veterans drops.
• In 1999, VA will process original pensionclaims in 80 days, dropping to 29 daysin 2002.
Insurance: VA has provided life insurancecoverage to service members and veteranssince 1917 and now directly administers or su-pervises eight distinct programs. Six of theprograms are self-supporting, with the costscovered by premium payments from the policy-holders and earnings from investments inTreasury securities. The other two programs,designed for service-disabled veterans, requireannual congressional appropriations to meetthe costs of claims. Together, these eight pro-grams will provide $488 billion in insurancecoverage to over 4.7 million veterans and serv-ice members in 1999. The program is designedto provide insurance protection and best-in-class service to veterans who can’t purchasecommercial policies at standard rates becauseof their service-connected disabilities. To reachthis goal, the program is designed to provide
disbursements (death claims, policy loans, cashsurrenders) quickly and accurately, meeting orexceeding customer expectations.
• In 1999, VA will pay insurance claims inthree and a half days, dropping to 2.8 daysin 2002.
Veterans Education, Training, andRehabilitation
Several Federal programs support job train-ing and finance education for veterans andothers. The Labor Department runs severalprograms just for veterans. In addition, severalVA programs provide education, training, andrehabilitation benefits to veterans and militarypersonnel who meet specific criteria, includingthe Montgomery GI bill (the largest of theseprograms), the post-Vietnam-era educationprogram, the Vocational Rehabilitation pro-gram, and the Work-Study program. Spendingfor all VA programs in this area will totalan estimated $1.5 billion in 1999.
The Montgomery GI Bill: The Governmentoriginally created MGIB as a test program,with more generous benefits than the post-Vietnam-era education program, to help veter-ans move to civilian life as well as to helpthe armed forces with recruitment. Servicemembers who choose to enter the programhave their pay reduced by $100 a month intheir first year of military service. The VA ad-ministers the program, paying basic benefitsonce the service member leaves the military.Basic benefits now total over $16,000 (about13 times the original reduction in the servicemember’s pay).
MGIB beneficiaries receive a monthly checkbased on whether they are enrolled in schoolon a full- or part-time basis. They canget 36 months worth of payments, but theymust certify monthly that they are in school.DOD may provide additional benefits to helprecruit certain specialties and critical skills.Nearly 310,000 veterans and service memberswill use these benefits in 1999. The MGIBalso provides education benefits to reservistswhile they are in service. DOD pays thesebenefits, and the VA administers the program.In 1999, over 76,000 reservists will usethe program. Over 90 percent of MGIB bene-ficiaries use their benefits to attend a collegeor university. The Administration will propose
23726. VETERANS BENEFITS AND SERVICES
legislation to enact a one-time, 20-percentrate increase for all MGIB beneficiaries, de-pendents, and survivors.
• In 1999, VA will increase the participationrate of eligible veterans in the MGIB fromits current 37 percent to 45 percent, andincrease the figure to 69 percent in 2003.
Veterans Housing
Along with the mortgage assistance thatveterans can get through the Federal HousingAdministration insurance program, the VA-guaranteed loan program in 1999 will helpan estimated 222,000 veterans get mortgages,totaling almost $24 billion. The Federal Gov-ernment will spend an estimated $264 millionon this program in 1999, reflecting the Federalsubsidies implicit in loans issued during theyear. Slightly over 40 percent of veteranswho have owned homes have used the VAloan guaranty program. To increase veteranhome ownership and the program’s efficiency,VA will cut its administrative costs.
• In 1999, VA will reduce the servicing costof each loan to $193, from its 1997 levelof $334.
National Cemetery System
The VA provides burial in its NationalCemetery System for eligible veterans, activeduty military personnel, and their depend-ents—with the VA managing 115 nationalcemeteries across the country. VA will spendover $90 million in 1999 for VA cemeteryoperations, excluding reimbursements fromother accounts. Over 73,000 veterans andtheir family members were buried in NationalCemeteries in 1997. The system is workingto ensure that all eligible veterans have
reasonable access to a burial option. Theprogram will complete construction of fournew national cemeteries, expand existingcemeteries, develop more effective use ofavailable burial space, and encourage States’participation in the State Cemetery GrantsProgram.
• In 1999, VA will increase the percentageof veterans served by a burial option with-in a reasonable distance to 75 percent.
Related Programs
Many veterans get help from other Federalincome security, health, housing credit, edu-cation, training, employment, and social serv-ice programs that are available to the generalpopulation. In addition, a number of theseprograms have components specifically de-signed for veterans. Some veterans also receivepreference for Federal jobs. Starting in 1999,the children of Vietnam veterans will receivecompensation if they are afflicted with spinabifida, which the Government will presumewas caused by a veteran parent’s exposureto herbicides.
Tax Incentives
Along with direct Federal funding, certaintax benefits help veterans. The law keepsall cash benefits that the VA administers(disability compensation, pension, and GI billbenefits) free from tax. Together, these threeexclusions will cost about $3 billion in 1999.The Federal Government also helps veteransobtain housing through veterans bonds thatState and local governments issue, the intereston which is not subject to Federal tax.In 1999, this provision will cost the Govern-ment an estimated $75 million.

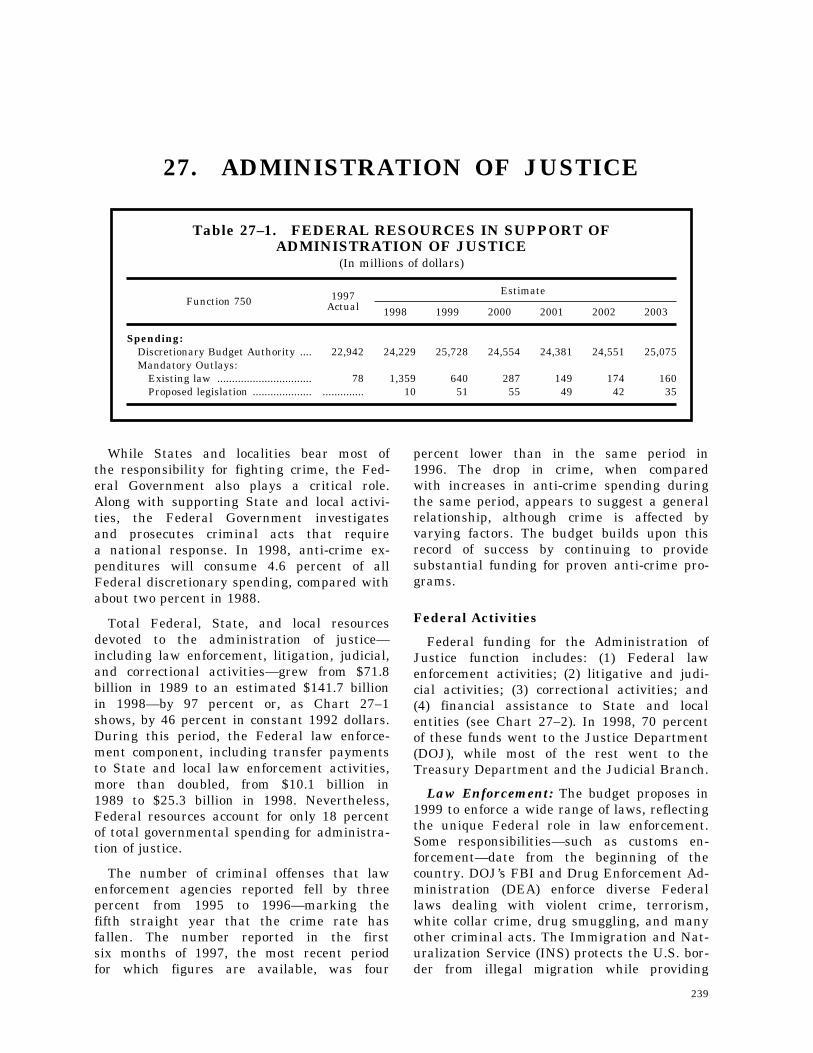
239
27. ADMINISTRATION OF JUSTICE
Table 27–1. FEDERAL RESOURCES IN SUPPORT OFADMINISTRATION OF JUSTICE
(In millions of dollars)
Function 750 1997Actual
Estimate
1998 1999 2000 2001 2002 2003
Spending:Discretionary Budget Authority .... 22,942 24,229 25,728 24,554 24,381 24,551 25,075Mandatory Outlays:
Existing law ................................ 78 1,359 640 287 149 174 160Proposed legislation .................... .............. 10 51 55 49 42 35
While States and localities bear most ofthe responsibility for fighting crime, the Fed-eral Government also plays a critical role.Along with supporting State and local activi-ties, the Federal Government investigatesand prosecutes criminal acts that requirea national response. In 1998, anti-crime ex-penditures will consume 4.6 percent of allFederal discretionary spending, compared withabout two percent in 1988.
Total Federal, State, and local resourcesdevoted to the administration of justice—including law enforcement, litigation, judicial,and correctional activities—grew from $71.8billion in 1989 to an estimated $141.7 billionin 1998—by 97 percent or, as Chart 27–1shows, by 46 percent in constant 1992 dollars.During this period, the Federal law enforce-ment component, including transfer paymentsto State and local law enforcement activities,more than doubled, from $10.1 billion in1989 to $25.3 billion in 1998. Nevertheless,Federal resources account for only 18 percentof total governmental spending for administra-tion of justice.
The number of criminal offenses that lawenforcement agencies reported fell by threepercent from 1995 to 1996—marking thefifth straight year that the crime rate hasfallen. The number reported in the firstsix months of 1997, the most recent periodfor which figures are available, was four
percent lower than in the same period in1996. The drop in crime, when comparedwith increases in anti-crime spending duringthe same period, appears to suggest a generalrelationship, although crime is affected byvarying factors. The budget builds upon thisrecord of success by continuing to providesubstantial funding for proven anti-crime pro-grams.
Federal Activities
Federal funding for the Administration ofJustice function includes: (1) Federal lawenforcement activities; (2) litigative and judi-cial activities; (3) correctional activities; and(4) financial assistance to State and localentities (see Chart 27–2). In 1998, 70 percentof these funds went to the Justice Department(DOJ), while most of the rest went to theTreasury Department and the Judicial Branch.
Law Enforcement: The budget proposes in1999 to enforce a wide range of laws, reflectingthe unique Federal role in law enforcement.Some responsibilities—such as customs en-forcement—date from the beginning of thecountry. DOJ’s FBI and Drug Enforcement Ad-ministration (DEA) enforce diverse Federallaws dealing with violent crime, terrorism,white collar crime, drug smuggling, and manyother criminal acts. The Immigration and Nat-uralization Service (INS) protects the U.S. bor-der from illegal migration while providing
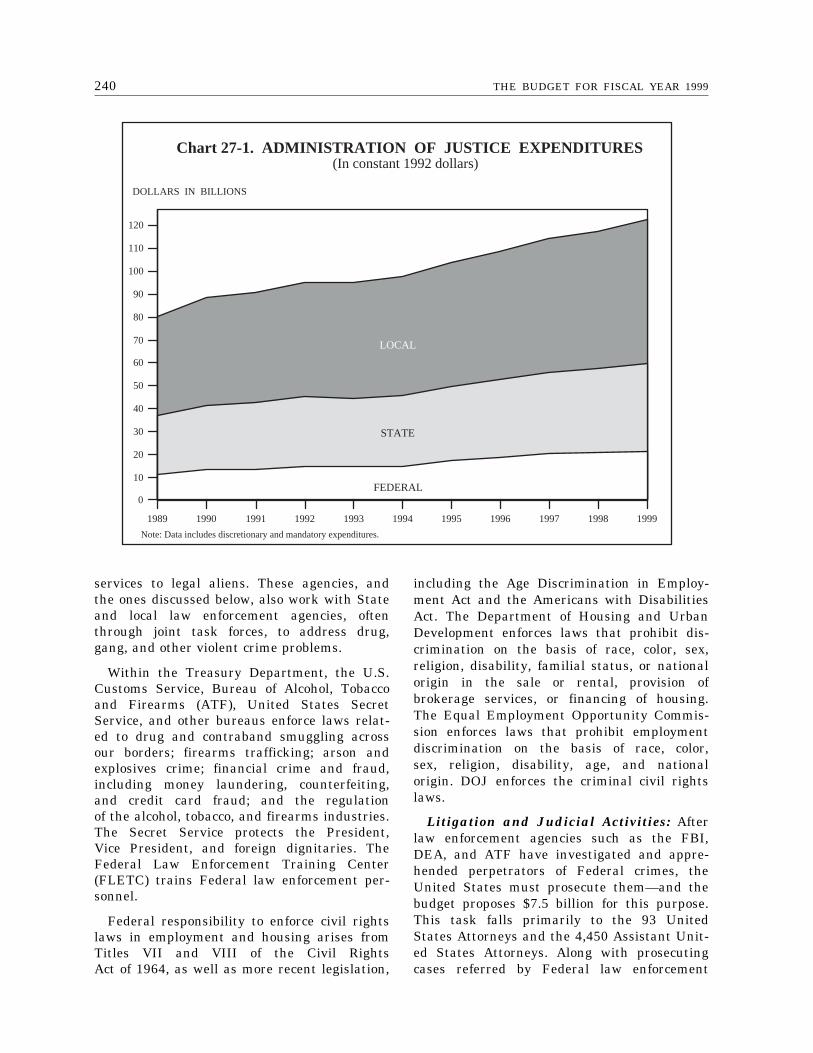
240 THE BUDGET FOR FISCAL YEAR 1999
1989 1990 1991 1992 1993 1994 1995 1996 1997 1998 1999
0
10
20
30
40
50
60
70
80
90
100
110
120
DOLLARS IN BILLIONS
Chart 27-1. ADMINISTRATION OF JUSTICE EXPENDITURES
LOCAL
STATE
FEDERAL
(In constant 1992 dollars)
Note: Data includes discretionary and mandatory expenditures.
services to legal aliens. These agencies, andthe ones discussed below, also work with Stateand local law enforcement agencies, oftenthrough joint task forces, to address drug,gang, and other violent crime problems.
Within the Treasury Department, the U.S.Customs Service, Bureau of Alcohol, Tobaccoand Firearms (ATF), United States SecretService, and other bureaus enforce laws relat-ed to drug and contraband smuggling acrossour borders; firearms trafficking; arson andexplosives crime; financial crime and fraud,including money laundering, counterfeiting,and credit card fraud; and the regulationof the alcohol, tobacco, and firearms industries.The Secret Service protects the President,Vice President, and foreign dignitaries. TheFederal Law Enforcement Training Center(FLETC) trains Federal law enforcement per-sonnel.
Federal responsibility to enforce civil rightslaws in employment and housing arises fromTitles VII and VIII of the Civil RightsAct of 1964, as well as more recent legislation,
including the Age Discrimination in Employ-ment Act and the Americans with DisabilitiesAct. The Department of Housing and UrbanDevelopment enforces laws that prohibit dis-crimination on the basis of race, color, sex,religion, disability, familial status, or nationalorigin in the sale or rental, provision ofbrokerage services, or financing of housing.The Equal Employment Opportunity Commis-sion enforces laws that prohibit employmentdiscrimination on the basis of race, color,sex, religion, disability, age, and nationalorigin. DOJ enforces the criminal civil rightslaws.
Litigation and Judicial Activities: Afterlaw enforcement agencies such as the FBI,DEA, and ATF have investigated and appre-hended perpetrators of Federal crimes, theUnited States must prosecute them—and thebudget proposes $7.5 billion for this purpose.This task falls primarily to the 93 UnitedStates Attorneys and the 4,450 Assistant Unit-ed States Attorneys. Along with prosecutingcases referred by Federal law enforcement
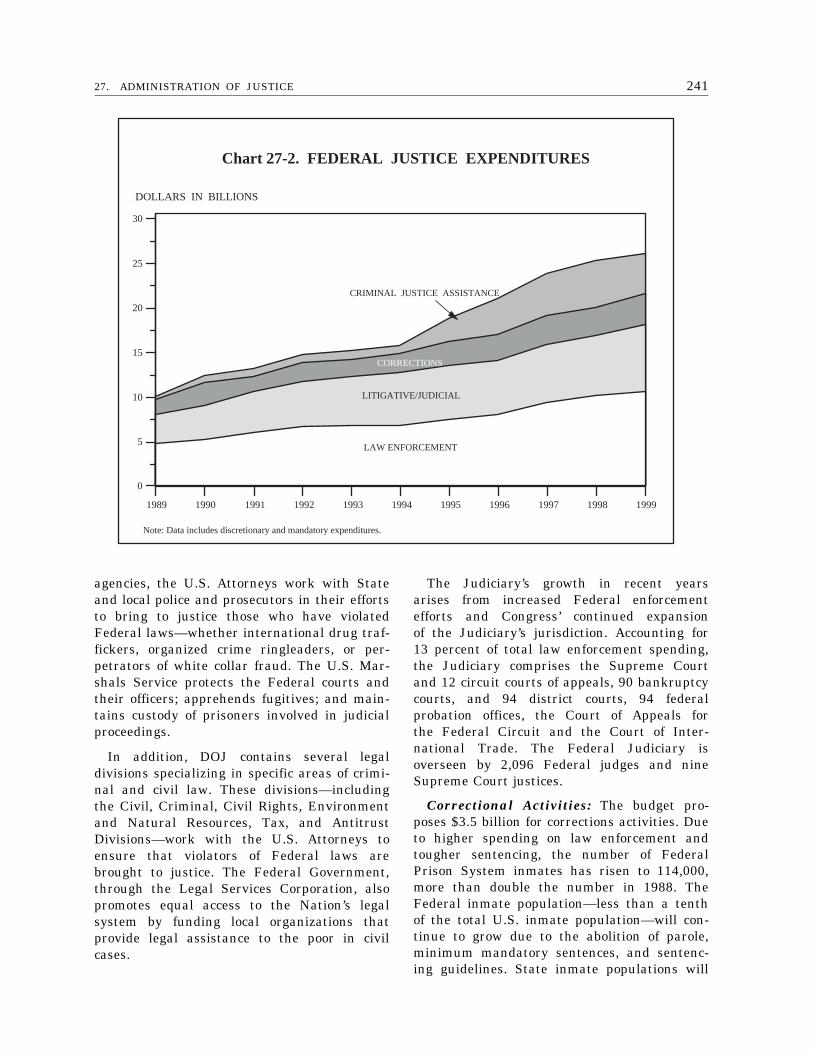
24127. ADMINISTRATION OF JUSTICE
1989 1990 1991 1992 1993 1994 1995 1996 1997 1998 1999
0
5
10
15
20
25
30
DOLLARS IN BILLIONS
Chart 27-2. FEDERAL JUSTICE EXPENDITURES
CORRECTIONS
LITIGATIVE/JUDICIAL
LAW ENFORCEMENT
CRIMINAL JUSTICE ASSISTANCE
Note: Data includes discretionary and mandatory expenditures.
agencies, the U.S. Attorneys work with Stateand local police and prosecutors in their effortsto bring to justice those who have violatedFederal laws—whether international drug traf-fickers, organized crime ringleaders, or per-petrators of white collar fraud. The U.S. Mar-shals Service protects the Federal courts andtheir officers; apprehends fugitives; and main-tains custody of prisoners involved in judicialproceedings.
In addition, DOJ contains several legaldivisions specializing in specific areas of crimi-nal and civil law. These divisions—includingthe Civil, Criminal, Civil Rights, Environmentand Natural Resources, Tax, and AntitrustDivisions—work with the U.S. Attorneys toensure that violators of Federal laws arebrought to justice. The Federal Government,through the Legal Services Corporation, alsopromotes equal access to the Nation’s legalsystem by funding local organizations thatprovide legal assistance to the poor in civilcases.
The Judiciary’s growth in recent yearsarises from increased Federal enforcementefforts and Congress’ continued expansionof the Judiciary’s jurisdiction. Accounting for13 percent of total law enforcement spending,the Judiciary comprises the Supreme Courtand 12 circuit courts of appeals, 90 bankruptcycourts, and 94 district courts, 94 federalprobation offices, the Court of Appeals forthe Federal Circuit and the Court of Inter-national Trade. The Federal Judiciary isoverseen by 2,096 Federal judges and nineSupreme Court justices.
Correctional Activities: The budget pro-poses $3.5 billion for corrections activities. Dueto higher spending on law enforcement andtougher sentencing, the number of FederalPrison System inmates has risen to 114,000,more than double the number in 1988. TheFederal inmate population—less than a tenthof the total U.S. inmate population—will con-tinue to grow due to the abolition of parole,minimum mandatory sentences, and sentenc-ing guidelines. State inmate populations will
242 THE BUDGET FOR FISCAL YEAR 1999
grow, in part, due to sentencing requirementstied to Federal prison grant funds. In the Fed-eral system, about 62 percent of inmates serv-ing time were convicted on drug-relatedcharges.
Criminal Justice Assistance: The budgetproposes $4.6 billion to help State and localgovernments fight crime. The Administrationis encouraging the adoption of community po-licing practices through the Community Ori-ented Policing Services (COPS) program. TheTruth-in-Sentencing/Violent Offender Incarcer-ation grant program seeks to ensure that con-victed violent offenders are incarcerated andserve at least 85 percent of their sentences.Similar changes in law from 1984 for Federalprisoners increased the time served by 60 per-cent.
To combat the significant problem of violenceagainst women, the budget proposes $271million to enhance the States’ abilities torespond, and to further expand access topreviously under-served rural, Indian, andother minority populations. To promote in-creased drug testing and treatment for individ-uals under the supervision of the criminaljustice system, the budget proposes a $94million increase over the 1998 level for drugtesting and treatment and Drug Courts. Inaddition, the budget continues to provide$553 million in law enforcement assistancegrants under the Edward Byrne MemorialState and Local Law Enforcement AssistanceProgram.
To prevent young people from becominginvolved in the juvenile justice system, thebudget continues juvenile justice programs,including those that provide supervised after-noon and evening activities for youth. Thebudget also provides additional assistanceto State and local prosecutors’ offices toaddress gang violence and other juvenilecrime, and to courts and court-related entitiesto expedite the handling of violent juvenilecases. Finally, the budget provides a $6million increase for ‘‘Weed and Seed,’’ whichhelps communities develop and implementcomprehensive strategies to ‘‘weed’’ out violentcrime, illegal drugs, and gang activity, and
to ‘‘seed’’ their communities with programsthat prevent crime.
Performance Goals
Federal agencies, as cited below, will workto achieve the following performance goalswith the proposed budget funds:
With regard to violent crime:
• The Justice Department will maintain theFederal Government’s commitment to re-ducing the incidence of violent crime belowthe 1996 level of 634 offenses per 100,000population.
• The Justice Department will provide fund-ing for communities to hire and deploy16,000 more officers in 1999.
• The Treasury Department will help solveviolent crimes and reduce firearms traf-ficking by tracing up to 275,000 firearmsused in criminal activities, compared to116,674 in 1996.
• The Justice Department will reduce spe-cific areas of organized crime and its influ-ence on unions and industries from the1997 level, while intensifying its efforts toprevent emerging organized crime enter-prises from gaining a permanent footholdin particular areas.
• The Treasury Department will ensure thephysical protection of the President, VicePresident, visiting foreign dignitaries, andothers protected by the Secret Service.
• The Justice Department will ensure thatno judge, witness, or other court partici-pant is the victim of an assault stemmingfrom his or her involvement in a Federalcourt proceeding.
• The U.S. Marshals Service will apprehend80 percent of violent offenders within oneyear of a warrant’s issuance, and will re-duce the fugitive backlog from 1998 by fivepercent.
• The Interior and Justice Departments willwork to increase the number of law en-forcement officers for Indian Tribes fromthe current level of 1.3 officers per 1,000citizens to 2.9 officers per 1,000 citizens.
24327. ADMINISTRATION OF JUSTICE
With regard to drug abuse:
• Federal and non-Federal entities will worktogether to reduce the availability andabuse of illegal drugs.
Separately, the Office of National DrugControl Policy will present a comprehen-sive set of societal performance measuresfor anti-drug programs, recognizing thatachieving national drug control objectivesdepends critically on the actions of notonly the Federal Government, but of State,local, and foreign governments and on thebehavior of individuals.
With regard to immigration and bordercontrol:
• The Justice Department will reduce theaverage time between application and nat-uralization of qualified candidates from anestimated 24 months in 1997 to six to 10months in 1999.
• The Treasury, Justice and Agriculture De-partments will increase the percent of le-gitimate air passengers cleared throughprimary inspection in 30 minutes or lessfrom an estimated 31 percent in 1997 to39 percent in 1999; and will work to proc-ess legitimate land border travelersthrough the primary inspection process onthe Mexico border in 30 minutes or lessin 1999.
• The Justice Department will increase thenumber of removals of aliens who are ille-gally in the United States from 111,794in 1997 to about 134,900 in 1999.
• The Justice Department will identify over38,500 unauthorized workers, therebyopening up potential jobs for U.S. citizensand other legally authorized workers.
• The Treasury Department will increasetrade revenue from duties collected andenhance the accuracy of trade data by im-proving importers’ compliance with tradelaws (e.g., quotas, trademarks, and copy-rights) from 83 percent in 1997 to 85 per-cent in 1999.
With regard to civil rights and other mat-ters:
• The Equal Employment Opportunity Com-mission will reduce the average time toprocess private sector equal employmentcomplaints by doubling the number ofcomplaints eligible for the mediation-basedalternative dispute resolution program.
• The Department of Housing and UrbanDevelopment (HUD) will ensure that HUDgrantees in 20 communities undertake fairhousing audit-based enforcement, using aHUD-developed standardized methodology,to develop local indices of discrimination,to identify and pursue violations of fairhousing laws, and to promote new fairhousing enforcement initiatives at thelocal level.
• The Treasury Department will step up itsefforts to disrupt and dismantle the illegalactivities of major violators of Federal fi-nancial crimes laws (e.g., counterfeiting,forgery, money laundering, and credit cardfraud).

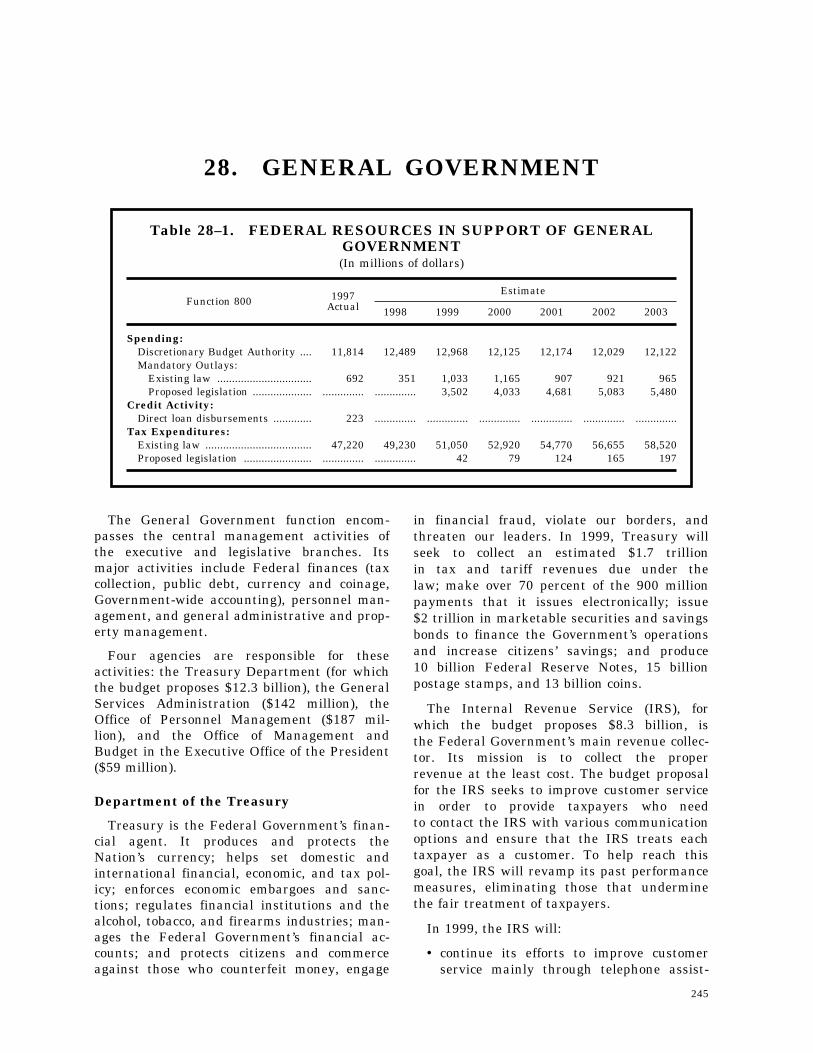
245
28. GENERAL GOVERNMENT
Table 28–1. FEDERAL RESOURCES IN SUPPORT OF GENERALGOVERNMENT(In millions of dollars)
Function 800 1997Actual
Estimate
1998 1999 2000 2001 2002 2003
Spending:Discretionary Budget Authority .... 11,814 12,489 12,968 12,125 12,174 12,029 12,122Mandatory Outlays:
Existing law ................................ 692 351 1,033 1,165 907 921 965Proposed legislation .................... .............. .............. 3,502 4,033 4,681 5,083 5,480
Credit Activity:Direct loan disbursements ............. 223 .............. .............. .............. .............. .............. ..............
Tax Expenditures:Existing law .................................... 47,220 49,230 51,050 52,920 54,770 56,655 58,520Proposed legislation ....................... .............. .............. 42 79 124 165 197
The General Government function encom-passes the central management activities ofthe executive and legislative branches. Itsmajor activities include Federal finances (taxcollection, public debt, currency and coinage,Government-wide accounting), personnel man-agement, and general administrative and prop-erty management.
Four agencies are responsible for theseactivities: the Treasury Department (for whichthe budget proposes $12.3 billion), the GeneralServices Administration ($142 million), theOffice of Personnel Management ($187 mil-lion), and the Office of Management andBudget in the Executive Office of the President($59 million).
Department of the Treasury
Treasury is the Federal Government’s finan-cial agent. It produces and protects theNation’s currency; helps set domestic andinternational financial, economic, and tax pol-icy; enforces economic embargoes and sanc-tions; regulates financial institutions and thealcohol, tobacco, and firearms industries; man-ages the Federal Government’s financial ac-counts; and protects citizens and commerceagainst those who counterfeit money, engage
in financial fraud, violate our borders, andthreaten our leaders. In 1999, Treasury willseek to collect an estimated $1.7 trillionin tax and tariff revenues due under thelaw; make over 70 percent of the 900 millionpayments that it issues electronically; issue$2 trillion in marketable securities and savingsbonds to finance the Government’s operationsand increase citizens’ savings; and produce10 billion Federal Reserve Notes, 15 billionpostage stamps, and 13 billion coins.
The Internal Revenue Service (IRS), forwhich the budget proposes $8.3 billion, isthe Federal Government’s main revenue collec-tor. Its mission is to collect the properrevenue at the least cost. The budget proposalfor the IRS seeks to improve customer servicein order to provide taxpayers who needto contact the IRS with various communicationoptions and ensure that the IRS treats eachtaxpayer as a customer. To help reach thisgoal, the IRS will revamp its past performancemeasures, eliminating those that underminethe fair treatment of taxpayers.
In 1999, the IRS will:
• continue its efforts to improve customerservice mainly through telephone assist-
246 THE BUDGET FOR FISCAL YEAR 1999
ance, answering at least 86 percent of tax-payer calls, up from 65 percent in 1997,with an accuracy rate of 96 percent fortax law inquires;
• expand its problem resolution program bydecreasing the number of days it takes toresolve a taxpayer’s account problem indistrict offices to 35, from 36 in 1997;
• collect over $1.64 trillion in net revenue—78 percent of it electronically, a substan-tial increase from 41 percent in 1997;
• electronically process 19.5 percent of theexpected 212 million total returns, both in-dividual and business; (Of those, 5.9 mil-lion will use Telefile, which allows tax-payers to file a simple tax return over thetelephone in under 10 minutes.)
• process electronic returns with a 99 per-cent accuracy rate while processing paperreturns with a 95 percent accuracy rate;
• process refunds on paper returns in 40days and electronic returns in 21 days;and
• ensure that its computers can process theyear 2000 change by converting, testing,and certifying its computer code by Octo-ber 1999.
In 1999, Treasury’s Financial ManagementService will:
• continue working to improve the manage-ment of the Nation’s finances, saving $33million by reducing the number of paperchecks issued, and process 65 percent ofall collections electronically and increasethe Government-wide collection of delin-quent debt by $95 million compared to1995.
In 1999, Treasury’s Bureau of Public Debtwill:
• introduce a new series of inflation-indexedsavings bonds of various denominations;
• automate the securities auction processand announce auction results within onehour 90 percent of the time; and
• maintain a 10-year average holding periodfor savings bonds.
In 1999, Treasury’s Bureau of Engravingand Printing and U.S. Mint will:
• introduce a redesigned dollar coin and anew series of quarters featuring emblem-atic images of the States;
• incorporate new security features into thetwenty dollar bill;
• ship all numismatic coins within fourweeks of order date; and
• maintain a stamp spoilage rate of no morethan 11 percent.
General Services Administration (GSA)
GSA has traditionally focused on its roleas the central provider of supplies, generaladministrative services, telecommunicationservices, and office space to Federal agencies.In 1999, revenues from its various businesslines will approach an estimated $13 billion.Under the Federal Property and Administra-tive Services Act of 1949 and subsequentlaws, GSA also plays a policy leadershiprole with respect to property managementand general administrative services.
Over the past two years, GSA has givengreater attention to that leadership role.It has developed a new Federal managementmodel, focusing on performance measurement,accountability for agencies and employees,and the effective use of technology in changingwork environments. GSA has establishedinter-agency groups to advise it on the policies,best practices, and performance benchmarksappropriate for each administrative serviceand on the information systems to reportperformance. GSA’s ultimate goal is a FederalGovernment in which agencies receive theadministrative services they need accordingto the best practices known and at theleast cost, internal regulation, and burden.When fully developed, GSA’s policy role canpotentially influence over $50 billion a yearfor property management and administrativeservices and the management of assets valuedat nearly $500 billion.
GSA also provides expertly managed space,products, and services to support the adminis-trative needs of Federal agencies. It hasaggressively responded to the changing needsof its customer agencies by working to trans-

24728. GENERAL GOVERNMENT
form itself into a market-driven, customer-oriented agency. GSA will seek to exceedall Government-wide performance goals andindustry benchmarks for administrative serv-ices as they are developed or identified.In the meantime, its overall goals as aservice provider are to exceed its customeragencies’ expectations for price, service andquality.
In 1999,
• the Public Buildings Service will deliver88 percent of its construction and repairprojects on schedule and within budget,up from 80 percent in 1997;
• the percentage of GSA-sponsored childcare centers that meet national accredita-tion standards will increase to 75 percent,compared to an average national accredi-tation percentage of less than 10 percent;
• the Federal Technology Service projects amonthly line charge for local telephoneservice of $20.77, a 28-percent cut from1994 rates; and
• the Federal Supply Service will lease auto-mobiles and other motor vehicles to Fed-eral agencies at rates that average 20 per-cent below comparable commercial leaserates.
Because GSA provides services on a reim-bursable basis, the budgets of the agenciesfund most of GSA’s activities. In 1999, forexample, the budget proposes an appropriationof $142 million for GSA, principally forits Office of Government-wide Policy andthe Office of the Inspector General, butit projects obligations of nearly $14 billionthrough GSA’s revolving funds. In addition,GSA will administer contracts through whichagencies will buy over $14 billion in goodsand services outside of GSA’s revolving funds.
Office of Personnel Management (OPM)
OPM provides human resource managementleadership and services, based on merit prin-ciples, to Federal agencies and employees.It provides policy guidance, advice, and directpersonnel services and systems to the agencies.OPM also operates a Nation-wide job informa-tion and application system every hour ofevery day, publicly available through the
Internet and other electronic and traditionalsources at convenient and accessible locations.OPM develops and administers compensationsystems for both blue-collar and white-collaremployees. In addition, OPM provides fast,friendly, accurate, and cost effective retire-ment, health benefit, and life insurance serv-ices to Federal employees, annuitants, andagencies.
• OPM reduced the average time to processan annuity application from 83 days in1994 to 39 days in 1997, and has targeteda goal of 35 days by 1999.
• OPM reduced customer call wait time forannuity inquiries from 5.1 minutes in1996 to 3.3 minutes in 1997 and will striveto make further reductions in 1999.
But perhaps OPM’s most important functionis administering the Federal civil servicemerit systems, covering nearly 1.5 millionemployees, which includes recruiting, examin-ing, and promoting people on the basis oftheir knowledge and skills—regardless of race,religion, sex, political influence, or other non-merit factors. OPM runs an aggressive over-sight program, identifying opportunities forimproving Federal personnel policies and pro-grams and helping agencies meet missiongoals by effectively recruiting, developing,and utilizing employees. In 1997, OPM con-ducted Nation-wide reviews of eight majoragencies, finding few serious problems anddiscovering many ‘‘best practices’’ that wereshared with other agencies. OPM encouragesmaximum employment and advancement op-portunities in the Federal service for disabledveterans and those qualified for veteran’spreference (26 percent of today’s employees).OPM’s policies and programs seek to encour-age diversity in the Federal workforce.
• In 1999, OPM will help agencies raise thelevels of under-represented groups by twopercent over the 1997–1998 levels.
Likewise, OPM helps dislocated and surplusemployees by assisting agencies with careertransition planning and, when vacancies arise,ensuring that dislocated and surplus employ-ees receive hiring preference. In 1996, over11,000 employees found employment throughthis process. With its Director chairing theNational Partnership Council, OPM supports
248 THE BUDGET FOR FISCAL YEAR 1999
and promotes labor-management partnershipsthroughout the Executive branch—partner-ships that help agencies deliver the highest-quality services to the American people. In1996, such partnership councils represented70 percent of Federal employees in bargainingunits, and 1997 survey data indicate continuedgrowth and positive perceptions of such part-nerships.
• In 1999, OPM will continue to foster moresuch partnerships and help those that arehaving problems.
Finally, OPM helps Federal program man-agers carry out their personnel managementresponsibilities through a range of programs,training, and performance management de-signed to develop the most effective Federalemployee. Other Federal agencies with person-nel management responsibilities are the MeritSystems Protection Board, the Office of SpecialCounsel, the Office of Government Ethics,and the Federal Labor Relations Authority.
Office of Management and Budget (OMB)
OMB helps the President carry out hisconstitutional and statutory duties. It helpsthe President create policy relating to receiptsand expenditures, regulations, information,and legislation; and manage the ExecutiveBranch in the faithful execution of laws,policies, and programs. OMB also providesthe President with the highest-quality analysisand advice on a broad range of topics.
OMB advocates the appropriate allocationand effective use of Government resources.OMB helps the President prepare the Federalbudget and oversee its execution in thedepartments and agencies. In helping formu-late the President’s spending plans, OMBexamines the effectiveness of agency programs,policies, and procedures; assesses competingfunding demands among agencies; and pro-vides policy options. OMB works to ensurethat proposed legislation, and agency testi-mony, reports, and policies are consistentwith Administration policies. OMB focusesparticular attention on managing the processesfor coordinating and integrating policies for
interagency programs. On behalf of the Presi-dent, OMB often presents and justifies majorpolicies and initiatives related to the budgetand Government management before Con-gress.
OMB has a central role in developing,overseeing, coordinating, and implementingFederal procurement, financial management,information, and regulatory policies. OMBhelps to strengthen administrative manage-ment, develop better performance measures,and improve coordination among ExecutiveBranch agencies.
In 1999, OMB will
• produce the President’s annual budgetdocuments in a timely, accurate manner;and
• ensure that agencies meet a number ofkey objectives, including: achieving compli-ance with year 2000 computer changes; re-ceiving clean audit opinions on annual fi-nancial statements; improving the analysisof regulatory alternatives; ensuring thatannual performance plans are fully inte-grated with budget submissions; and effec-tively using inter-agency working groupson a wide range of Government functions.
Tax Incentives
The Federal Government provides signifi-cant tax benefits for State and local govern-ments. It permits tax-exempt borrowing forpublic purposes, costing $77 billion in Federalrevenue losses over five years, from 1999to 2003 (the budget describes tax-exemptborrowing for non-public purposes in thewrite-ups on other Government functions).In addition, taxpayers can deduct State andlocal income taxes against their Federal in-come tax, costing $182 billion over five years.Corporations with business in Puerto Ricoreceive a special tax credit, costing an esti-mated $15 billion over five years. Finally,up to certain limits, taxpayers can creditState death taxes against Federal estatetaxes, costing $24 billion over five years.
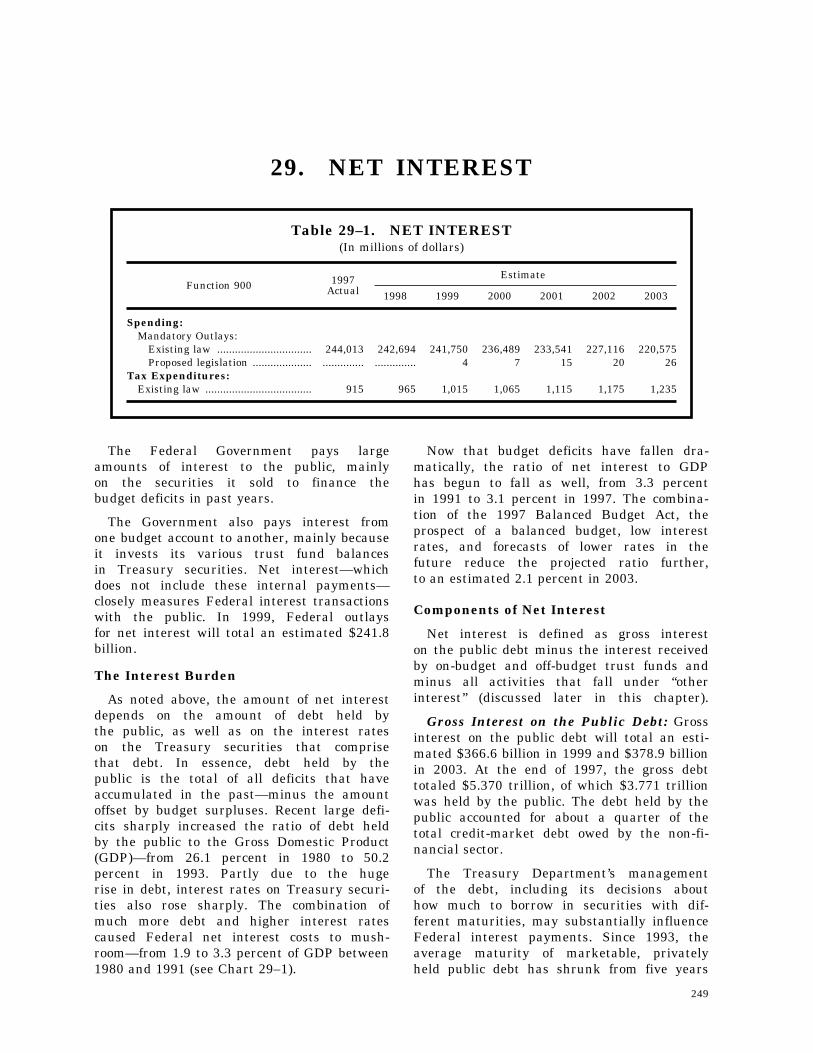
249
29. NET INTEREST
Table 29–1. NET INTEREST(In millions of dollars)
Function 900 1997Actual
Estimate
1998 1999 2000 2001 2002 2003
Spending:Mandatory Outlays:
Existing law ................................ 244,013 242,694 241,750 236,489 233,541 227,116 220,575Proposed legislation .................... .............. .............. 4 7 15 20 26
Tax Expenditures:Existing law .................................... 915 965 1,015 1,065 1,115 1,175 1,235
The Federal Government pays largeamounts of interest to the public, mainlyon the securities it sold to finance thebudget deficits in past years.
The Government also pays interest fromone budget account to another, mainly becauseit invests its various trust fund balancesin Treasury securities. Net interest—whichdoes not include these internal payments—closely measures Federal interest transactionswith the public. In 1999, Federal outlaysfor net interest will total an estimated $241.8billion.
The Interest Burden
As noted above, the amount of net interestdepends on the amount of debt held bythe public, as well as on the interest rateson the Treasury securities that comprisethat debt. In essence, debt held by thepublic is the total of all deficits that haveaccumulated in the past—minus the amountoffset by budget surpluses. Recent large defi-cits sharply increased the ratio of debt heldby the public to the Gross Domestic Product(GDP)—from 26.1 percent in 1980 to 50.2percent in 1993. Partly due to the hugerise in debt, interest rates on Treasury securi-ties also rose sharply. The combination ofmuch more debt and higher interest ratescaused Federal net interest costs to mush-room—from 1.9 to 3.3 percent of GDP between1980 and 1991 (see Chart 29–1).
Now that budget deficits have fallen dra-matically, the ratio of net interest to GDPhas begun to fall as well, from 3.3 percentin 1991 to 3.1 percent in 1997. The combina-tion of the 1997 Balanced Budget Act, theprospect of a balanced budget, low interestrates, and forecasts of lower rates in thefuture reduce the projected ratio further,to an estimated 2.1 percent in 2003.
Components of Net Interest
Net interest is defined as gross intereston the public debt minus the interest receivedby on-budget and off-budget trust funds andminus all activities that fall under ‘‘otherinterest’’ (discussed later in this chapter).
Gross Interest on the Public Debt: Grossinterest on the public debt will total an esti-mated $366.6 billion in 1999 and $378.9 billionin 2003. At the end of 1997, the gross debttotaled $5.370 trillion, of which $3.771 trillionwas held by the public. The debt held by thepublic accounted for about a quarter of thetotal credit-market debt owed by the non-fi-nancial sector.
The Treasury Department’s managementof the debt, including its decisions abouthow much to borrow in securities with dif-ferent maturities, may substantially influenceFederal interest payments. Since 1993, theaverage maturity of marketable, privatelyheld public debt has shrunk from five years
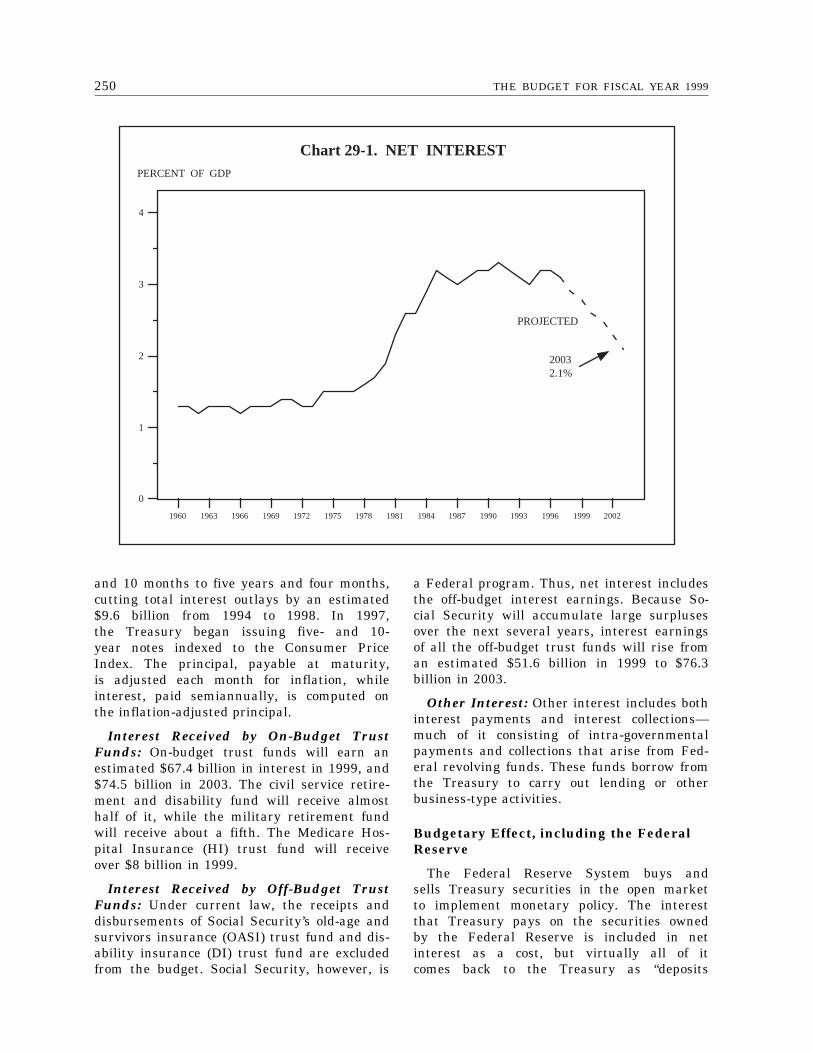
250 THE BUDGET FOR FISCAL YEAR 1999
1960 1963 1966 1969 1972 1975 1978 1981 1984 1987 1990 1993 1996 1999 2002
0
1
2
3
4
Chart 29-1. NET INTERESTPERCENT OF GDP
PROJECTED
2003 2.1%
and 10 months to five years and four months,cutting total interest outlays by an estimated$9.6 billion from 1994 to 1998. In 1997,the Treasury began issuing five- and 10-year notes indexed to the Consumer PriceIndex. The principal, payable at maturity,is adjusted each month for inflation, whileinterest, paid semiannually, is computed onthe inflation-adjusted principal.
Interest Received by On-Budget TrustFunds: On-budget trust funds will earn anestimated $67.4 billion in interest in 1999, and$74.5 billion in 2003. The civil service retire-ment and disability fund will receive almosthalf of it, while the military retirement fundwill receive about a fifth. The Medicare Hos-pital Insurance (HI) trust fund will receiveover $8 billion in 1999.
Interest Received by Off-Budget TrustFunds: Under current law, the receipts anddisbursements of Social Security’s old-age andsurvivors insurance (OASI) trust fund and dis-ability insurance (DI) trust fund are excludedfrom the budget. Social Security, however, is
a Federal program. Thus, net interest includesthe off-budget interest earnings. Because So-cial Security will accumulate large surplusesover the next several years, interest earningsof all the off-budget trust funds will rise froman estimated $51.6 billion in 1999 to $76.3billion in 2003.
Other Interest: Other interest includes bothinterest payments and interest collections—much of it consisting of intra-governmentalpayments and collections that arise from Fed-eral revolving funds. These funds borrow fromthe Treasury to carry out lending or otherbusiness-type activities.
Budgetary Effect, including the FederalReserve
The Federal Reserve System buys andsells Treasury securities in the open marketto implement monetary policy. The interestthat Treasury pays on the securities ownedby the Federal Reserve is included in netinterest as a cost, but virtually all of itcomes back to the Treasury as ‘‘deposits

25129. NET INTEREST
of earnings of the Federal Reserve System.’’These budget receipts will total an estimated
$24.6 billion in 1999 and $26.9 billion in2003.

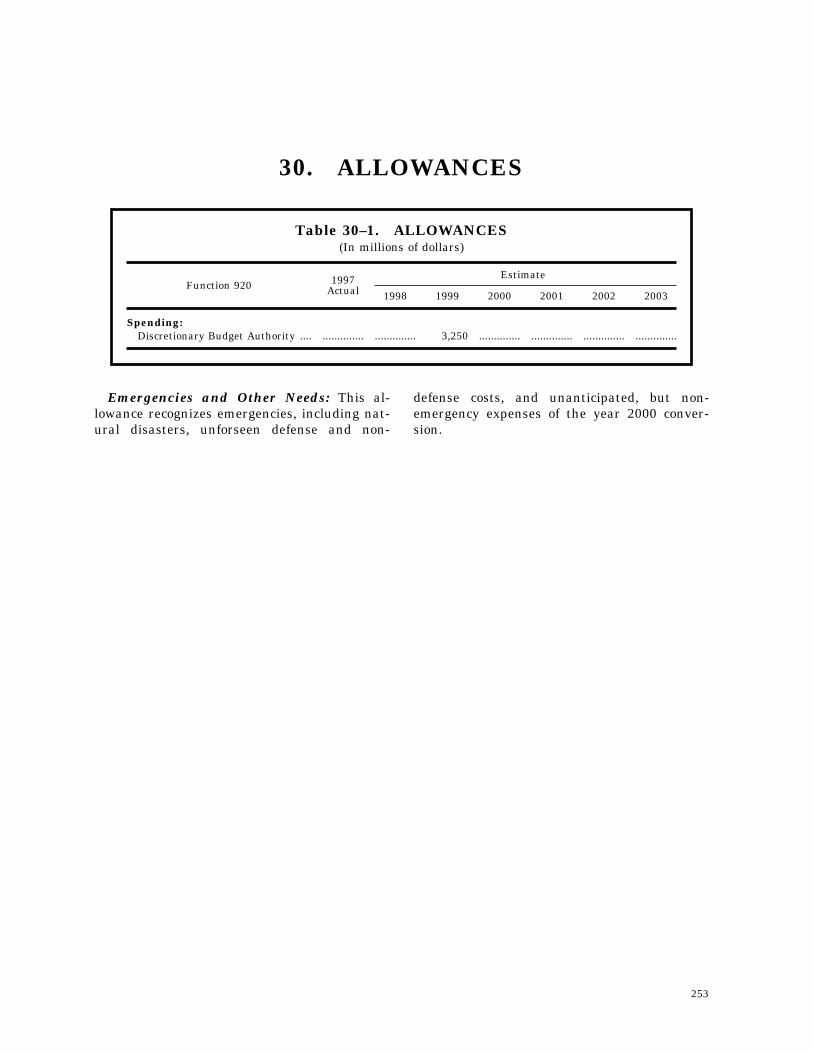
253
30. ALLOWANCES
Table 30–1. ALLOWANCES(In millions of dollars)
Function 920 1997Actual
Estimate
1998 1999 2000 2001 2002 2003
Spending:Discretionary Budget Authority .... .............. .............. 3,250 .............. .............. .............. ..............
Emergencies and Other Needs: This al-lowance recognizes emergencies, including nat-ural disasters, unforseen defense and non-
defense costs, and unanticipated, but non-emergency expenses of the year 2000 conver-sion.

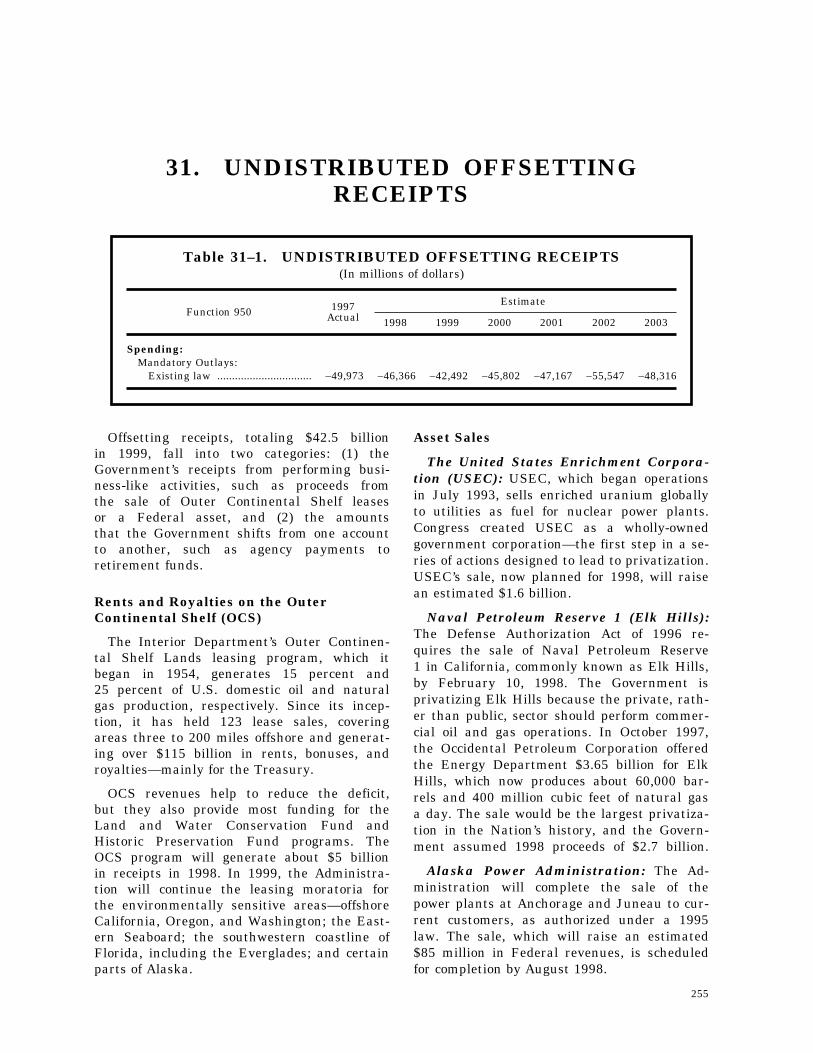
255
31. UNDISTRIBUTED OFFSETTINGRECEIPTS
Table 31–1. UNDISTRIBUTED OFFSETTING RECEIPTS(In millions of dollars)
Function 950 1997Actual
Estimate
1998 1999 2000 2001 2002 2003
Spending:Mandatory Outlays:
Existing law ................................ –49,973 –46,366 –42,492 –45,802 –47,167 –55,547 –48,316
Offsetting receipts, totaling $42.5 billionin 1999, fall into two categories: (1) theGovernment’s receipts from performing busi-ness-like activities, such as proceeds fromthe sale of Outer Continental Shelf leasesor a Federal asset, and (2) the amountsthat the Government shifts from one accountto another, such as agency payments toretirement funds.
Rents and Royalties on the OuterContinental Shelf (OCS)
The Interior Department’s Outer Continen-tal Shelf Lands leasing program, which itbegan in 1954, generates 15 percent and25 percent of U.S. domestic oil and naturalgas production, respectively. Since its incep-tion, it has held 123 lease sales, coveringareas three to 200 miles offshore and generat-ing over $115 billion in rents, bonuses, androyalties—mainly for the Treasury.
OCS revenues help to reduce the deficit,but they also provide most funding for theLand and Water Conservation Fund andHistoric Preservation Fund programs. TheOCS program will generate about $5 billionin receipts in 1998. In 1999, the Administra-tion will continue the leasing moratoria forthe environmentally sensitive areas—offshoreCalifornia, Oregon, and Washington; the East-ern Seaboard; the southwestern coastline ofFlorida, including the Everglades; and certainparts of Alaska.
Asset Sales
The United States Enrichment Corpora-tion (USEC): USEC, which began operationsin July 1993, sells enriched uranium globallyto utilities as fuel for nuclear power plants.Congress created USEC as a wholly-ownedgovernment corporation—the first step in a se-ries of actions designed to lead to privatization.USEC’s sale, now planned for 1998, will raisean estimated $1.6 billion.
Naval Petroleum Reserve 1 (Elk Hills):The Defense Authorization Act of 1996 re-quires the sale of Naval Petroleum Reserve1 in California, commonly known as Elk Hills,by February 10, 1998. The Government isprivatizing Elk Hills because the private, rath-er than public, sector should perform commer-cial oil and gas operations. In October 1997,the Occidental Petroleum Corporation offeredthe Energy Department $3.65 billion for ElkHills, which now produces about 60,000 bar-rels and 400 million cubic feet of natural gasa day. The sale would be the largest privatiza-tion in the Nation’s history, and the Govern-ment assumed 1998 proceeds of $2.7 billion.
Alaska Power Administration: The Ad-ministration will complete the sale of thepower plants at Anchorage and Juneau to cur-rent customers, as authorized under a 1995law. The sale, which will raise an estimated$85 million in Federal revenues, is scheduledfor completion by August 1998.
256 THE BUDGET FOR FISCAL YEAR 1999
1 The major programs are the Military Retirement System, theCivil Service Retirement System, and the Federal Employee Retire-ment System.
Employee Retirement
In 1999, Federal agencies will pay anestimated $35.1 billion on behalf of theiremployees to the Federal retirement funds 1,the Medicare health insurance trust fund,and the Social Security trust funds. As civilianemployee pay rises, agencies must makecommensurate increases in their paymentsto recognize the rising cost of retirement.
Other Undistributed Offsetting Receipts
Beginning in 1993, the President and Con-gress gave the Federal Communications Com-mission authority to assign spectrum licensesthrough competitive bidding, which has provenan extremely efficient and effective way toallocate this scarce public resource. As author-ized by the 1997 Balanced Budget Act, thebudget continues this successful policy. TheGovernment will auction spectrum made avail-able from the transition to digital broadcasttechnology as well as 120 MHZ of reallocatedspectrum, raising an estimated over $30 billionover the next 10 years, helping to balancethe budget while compensating the publicfor the use of this valuable resource.
257
32. REGULATION: COSTS AND BENEFITSAlong with taxing and spending, the Federal
Government makes policy through regulat-ing—that is, generally, through ExecutiveBranch actions to interpret or implementlegislation. As with taxing and spending,the Administration carefully designs and im-plements regulations to provide the mostpublic benefit for the least cost. The Officeof Management and Budget (OMB), the WhiteHouse office that sets regulatory policy, hasadopted the following objective in its StrategicPlan: ‘‘Maximize social benefits of regulationwhile minimizing the costs and burdens ofregulation.’’
The Government is still learning how toaccurately estimate regulatory costs, suchas how much the private sector spends tocomply with regulations, and benefits, suchas safer cars and food. For over 20 years,a series of Executive Orders has chargedOMB with reviewing regulations and providinginformation on their costs and benefits. ThePresident’s September 1993 Executive Order,‘‘Regulatory Planning and Review,’’ directsagencies to assess the costs and benefitsof available regulatory alternatives and toissue only regulations that maximize netbenefits (benefits minus costs), unless a lawrequires another approach.
Developing and evaluating the best possibledata on benefits and costs are central tothe Government’s ability to assess how wellthe regulatory system functions to fulfillpublic needs. To meet that goal, OMB workswith the agencies to improve the qualityof the data and analyses they use in makingregulatory decisions for both proposed andexisting regulations, and to promote the useof standardized assumptions and methodolo-gies uniformly across regulatory programs.
Difficulties in Estimation: Estimating reg-ulatory costs and benefits is hard for two rea-sons: the ‘‘baseline’’ problem and the ‘‘applesand oranges’’ problem.
To estimate how regulations affect societyand the economy, the Government must deter-mine the baseline against which to measure
costs and benefits; that is, what would havehappened if the Government had not issuedthe regulation? But, several problems arise.First, no one can craft such a hypotheticalbaseline with certainty. Second, measuresof costs and benefits often vary, dependingon who is measuring. Agencies generallysupport their regulatory programs and, thus,may understate costs or overstate the likelybenefits; at the same time, businesses andothers who bear the costs will likely dothe opposite. Third, the timing of estimatesalso may make a difference. Most estimatesare made before the regulation takes effect,but evidence exists that once regulationsare in place, the affected entities find lesscostly ways to comply.
The ‘‘apples and oranges’’ problem derivesfrom the nature and diversity of regulationitself. Over 60 Federal agencies regulateover 4,000 times a year for a wide arrayof public purposes. The Government mustmake decisions about the chemical compositionand temperature of the atmosphere, the acces-sibility of public transportation, and safetyof the Nation’s food supply. Estimating thecosts of such diverse activities is hard; estimat-ing the benefits is even harder. Fortunately,the Government is working on this issueand is making steady progress on methodologyand data collection.
Costs and Benefits of Regulation: A re-cent OMB survey, Report to Congress on theCosts and Benefits of Federal Regulations, pre-sents estimates of the aggregate costs and ben-efits of Federal regulation, as well as the costsand benefits of major individual regulations is-sued in the last year. Despite the inherentproblems, the report represents a good firststep toward developing a system to track OMBand agency performance in minimizing costswhile achieving social benefits.
The report uses information on costs andbenefits that was published in peer-reviewedjournals, or published for public commentby agencies and reviewed by OMB, to estimateaggregate costs and benefits for four cat-
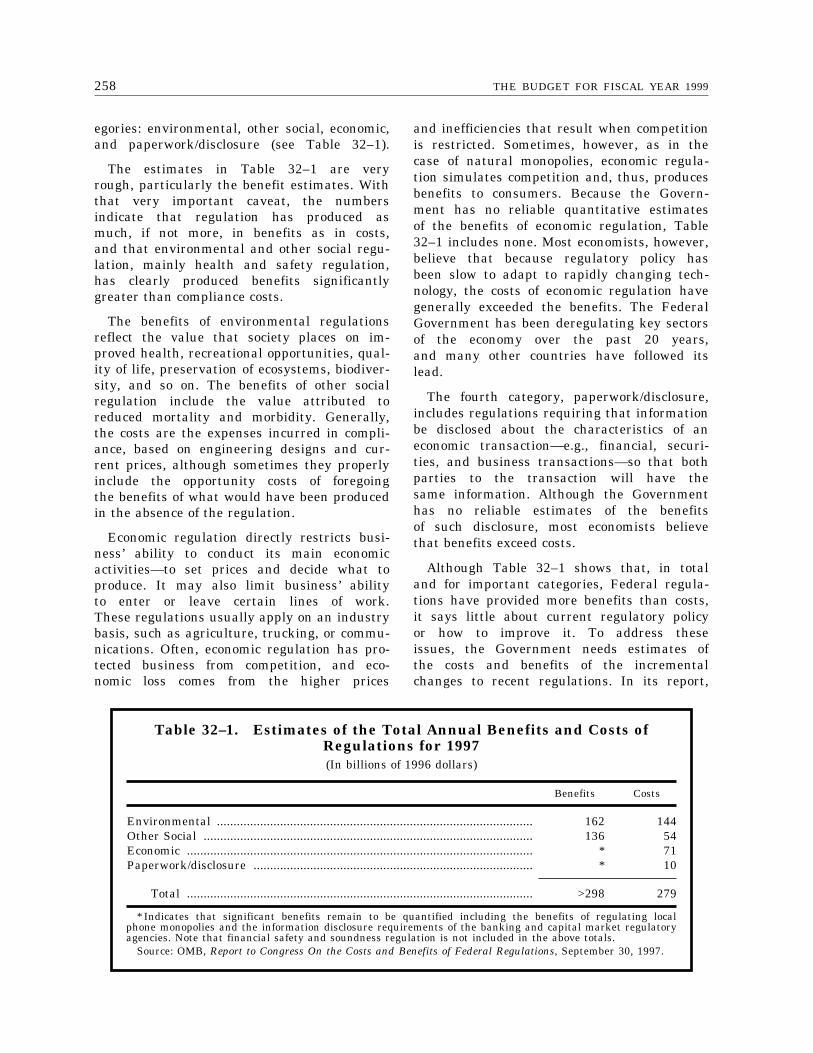
258 THE BUDGET FOR FISCAL YEAR 1999
Table 32–1. Estimates of the Total Annual Benefits and Costs ofRegulations for 1997(In billions of 1996 dollars)
Benefits Costs
Environmental ............................................................................................... 162 144Other Social ................................................................................................... 136 54Economic ........................................................................................................ * 71Paperwork/disclosure .................................................................................... * 10
Total ........................................................................................................ >298 279
* Indicates that significant benefits remain to be quantified including the benefits of regulating localphone monopolies and the information disclosure requirements of the banking and capital market regulatoryagencies. Note that financial safety and soundness regulation is not included in the above totals.
Source: OMB, Report to Congress On the Costs and Benefits of Federal Regulations, September 30, 1997.
egories: environmental, other social, economic,and paperwork/disclosure (see Table 32–1).
The estimates in Table 32–1 are veryrough, particularly the benefit estimates. Withthat very important caveat, the numbersindicate that regulation has produced asmuch, if not more, in benefits as in costs,and that environmental and other social regu-lation, mainly health and safety regulation,has clearly produced benefits significantlygreater than compliance costs.
The benefits of environmental regulationsreflect the value that society places on im-proved health, recreational opportunities, qual-ity of life, preservation of ecosystems, biodiver-sity, and so on. The benefits of other socialregulation include the value attributed toreduced mortality and morbidity. Generally,the costs are the expenses incurred in compli-ance, based on engineering designs and cur-rent prices, although sometimes they properlyinclude the opportunity costs of foregoingthe benefits of what would have been producedin the absence of the regulation.
Economic regulation directly restricts busi-ness’ ability to conduct its main economicactivities—to set prices and decide what toproduce. It may also limit business’ abilityto enter or leave certain lines of work.These regulations usually apply on an industrybasis, such as agriculture, trucking, or commu-nications. Often, economic regulation has pro-tected business from competition, and eco-nomic loss comes from the higher prices
and inefficiencies that result when competitionis restricted. Sometimes, however, as in thecase of natural monopolies, economic regula-tion simulates competition and, thus, producesbenefits to consumers. Because the Govern-ment has no reliable quantitative estimatesof the benefits of economic regulation, Table32–1 includes none. Most economists, however,believe that because regulatory policy hasbeen slow to adapt to rapidly changing tech-nology, the costs of economic regulation havegenerally exceeded the benefits. The FederalGovernment has been deregulating key sectorsof the economy over the past 20 years,and many other countries have followed itslead.
The fourth category, paperwork/disclosure,includes regulations requiring that informationbe disclosed about the characteristics of aneconomic transaction—e.g., financial, securi-ties, and business transactions—so that bothparties to the transaction will have thesame information. Although the Governmenthas no reliable estimates of the benefitsof such disclosure, most economists believethat benefits exceed costs.
Although Table 32–1 shows that, in totaland for important categories, Federal regula-tions have provided more benefits than costs,it says little about current regulatory policyor how to improve it. To address theseissues, the Government needs estimates ofthe costs and benefits of the incrementalchanges to recent regulations. In its report,
25932. REGULATION: COSTS AND BENEFITS
1 For a copy of this report, see the web site http://www.whitehouse.gov/WH/EOP/OMB/html/rcongress.htm.
OMB provided information on the costs andbenefits of the 41 economically significantfinal regulations that it reviewed from April1, 1996 to March 31, 1997. 1
Twenty-one of these rules require substan-tial private sector spending, provide significantnew social benefits, or both. The Environ-mental Protection Agency (EPA) issued sevenof these rules; the Agriculture Department(USDA) issued four; the Health and HumanServices (HHS) and Transportation Depart-ments each issued three; and the remainingfour were spread among the Commerce, Inte-rior (DOI), and Labor (DOL) Departments.
For seven of the 21 rules, monetized benefitsexceeded costs. For example, the Food andDrug Administration (FDA) estimated thatits tobacco rule would provide net benefitsof $9 billion to $10.2 billion a year. EPAestimated that its Accidental Release Preven-tion rule would generate $77 million a yearin net benefits. For the remaining 15 rules,agencies did not provide enough informationto estimate monetized net benefits. For fiveof the 15, the agencies quantified the expectedbenefits (e.g., tons of emissions reduced, num-ber of injuries avoided), but they did notassign dollar values to these effects and,thus, could not calculate monetized net bene-fits. For five others, the agencies identifiedqualitative benefits associated with the rule,but did not develop any quantified estimatesof the likely effects. For the remaining five,agencies had very little economic data onthe effects of the rule.
Of the remaining economically significantfinal rules, 19 were needed to implementFederal budget programs. These rules gen-erally create ‘‘transfers’’—that is, paymentsfrom one group to another, such as fromthe Federal Government to beneficiaries, thatredistribute wealth. Eight were USDA rulesto implement Federal laws on agriculturaland Food Stamp policies; seven were HHSand Social Security Administration rules toimplement Medicare, Medicaid, and SocialSecurity policy; two were Department of Hous-ing and Urban Development rules linkedto Federal mortgage protections; one wasa DOL rule tied to Federal service contracts;
and one was a joint HHS-Treasury-DOL rulesetting standards for health insurance port-ability group health plans.
In the most basic case, transfers do notdirectly impose social costs or create socialbenefits, and do not reflect the ‘‘opportunitycost’’ of resources used or benefits foregone.Thus, OMB did not include transfers inTable 32–1 estimates of costs and benefits.Nevertheless, transfers can have importanteffects on the distribution of income. Theymay cause indirect social costs because theymust be financed—for example, by incomeand payroll taxes—in ways that affect theuse of real income. Similarly, transfers maygenerate social benefits if beneficiaries realizemarginal benefits from the payments thatare greater than the losses for taxpayerswho finance them.
Further Action: The Government needsbetter data and analysis to determine whetherproposed regulations maximize social benefitswhile minimizing cost. But agencies have le-gitimate reasons for their often incomplete es-timates. In some cases, they face significanttechnical problems in assessing costs and bene-fits. In others, legal or judicial deadlines forcethe agencies to act within time frames thatdo not allow for adequate analysis. In still oth-ers, agencies may need to allocate their limitedfinancial and human resources to higher prior-ities. Finally, in cases of emergencies, the pub-lic expects its elected leaders to respond with-out the delay that careful analysis would en-tail.
OMB is committed to improving the indica-tors to assess its performance in meetingthe goal of ensuring that it is faithfullyexecuting and managing regulatory policy.It will lead an inter-agency effort to raisethe quality of analyses that agencies usein developing regulations, such as by offeringtechnical outreach programs and training ses-sions on using OMB’s ‘‘Best Practices’’ oneconomic analysis.
OMB also will:
• subject a select set of agency regulatoryanalyses to peer review in order to iden-tify—based on actual experience—themethodological approaches that need im-
260 THE BUDGET FOR FISCAL YEAR 1999
provement and to stimulate the develop-ment of better estimation techniques;
• continue to develop a database on benefitsand costs of major rules, using consistentassumptions and better estimation tech-niques to refine agency estimates of incre-mental costs and benefits; and
• work on developing appropriate meth-odologies to evaluate whether to reform or
eliminate existing regulatory programs ortheir elements.
Regulation and regulatory reform can domuch good for society, depending on whetherthe Government has the needed informationand analysis for wise decision-making. Thesteps outlined above are designed to continuethe Government’s efforts to improve its abilityto make better regulatory decisions.
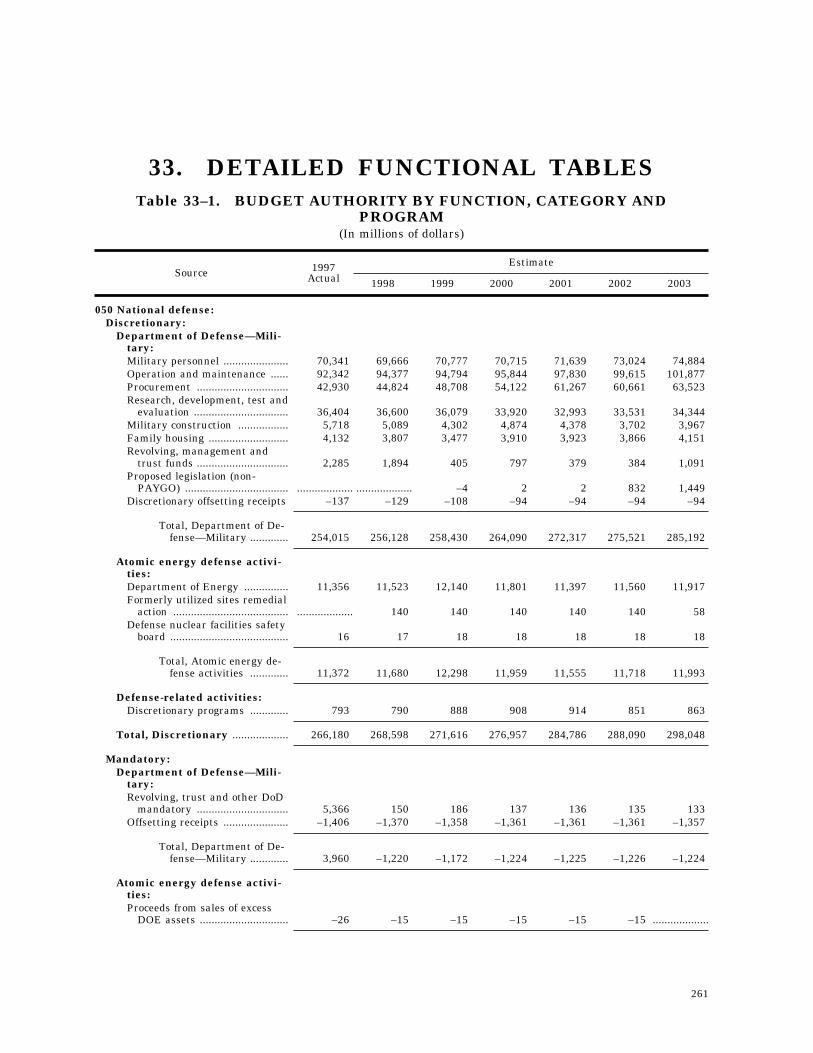
261
33. DETAILED FUNCTIONAL TABLESTable 33–1. BUDGET AUTHORITY BY FUNCTION, CATEGORY AND
PROGRAM(In millions of dollars)
Source 1997Actual
Estimate
1998 1999 2000 2001 2002 2003
050 National defense:Discretionary:
Department of Defense—Mili-tary:Military personnel ...................... 70,341 69,666 70,777 70,715 71,639 73,024 74,884Operation and maintenance ...... 92,342 94,377 94,794 95,844 97,830 99,615 101,877Procurement ............................... 42,930 44,824 48,708 54,122 61,267 60,661 63,523Research, development, test and
evaluation ................................ 36,404 36,600 36,079 33,920 32,993 33,531 34,344Military construction ................. 5,718 5,089 4,302 4,874 4,378 3,702 3,967Family housing ........................... 4,132 3,807 3,477 3,910 3,923 3,866 4,151Revolving, management and
trust funds ............................... 2,285 1,894 405 797 379 384 1,091Proposed legislation (non-
PAYGO) ................................... ................... ................... –4 2 2 832 1,449Discretionary offsetting receipts –137 –129 –108 –94 –94 –94 –94
Total, Department of De-fense—Military ............. 254,015 256,128 258,430 264,090 272,317 275,521 285,192
Atomic energy defense activi-ties:Department of Energy ............... 11,356 11,523 12,140 11,801 11,397 11,560 11,917Formerly utilized sites remedial
action ....................................... ................... 140 140 140 140 140 58Defense nuclear facilities safety
board ........................................ 16 17 18 18 18 18 18
Total, Atomic energy de-fense activities ............. 11,372 11,680 12,298 11,959 11,555 11,718 11,993
Defense-related activities:Discretionary programs ............. 793 790 888 908 914 851 863
Total, Discretionary ................... 266,180 268,598 271,616 276,957 284,786 288,090 298,048
Mandatory:Department of Defense—Mili-
tary:Revolving, trust and other DoD
mandatory ............................... 5,366 150 186 137 136 135 133Offsetting receipts ...................... –1,406 –1,370 –1,358 –1,361 –1,361 –1,361 –1,357
Total, Department of De-fense—Military ............. 3,960 –1,220 –1,172 –1,224 –1,225 –1,226 –1,224
Atomic energy defense activi-ties:Proceeds from sales of excess
DOE assets .............................. –26 –15 –15 –15 –15 –15 ...................
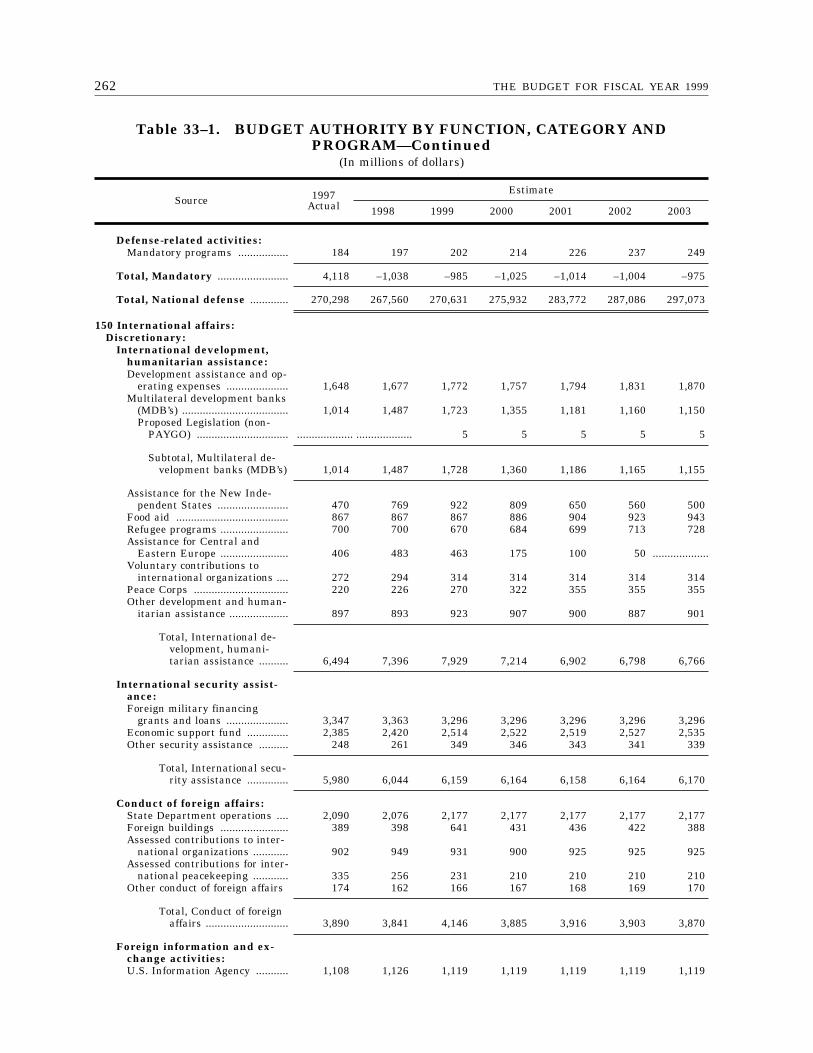
262 THE BUDGET FOR FISCAL YEAR 1999
Table 33–1. BUDGET AUTHORITY BY FUNCTION, CATEGORY ANDPROGRAM—Continued
(In millions of dollars)
Source 1997Actual
Estimate
1998 1999 2000 2001 2002 2003
Defense-related activities:Mandatory programs ................. 184 197 202 214 226 237 249
Total, Mandatory ........................ 4,118 –1,038 –985 –1,025 –1,014 –1,004 –975
Total, National defense ............. 270,298 267,560 270,631 275,932 283,772 287,086 297,073
150 International affairs:Discretionary:
International development,humanitarian assistance:Development assistance and op-
erating expenses ..................... 1,648 1,677 1,772 1,757 1,794 1,831 1,870Multilateral development banks
(MDB’s) .................................... 1,014 1,487 1,723 1,355 1,181 1,160 1,150Proposed Legislation (non-
PAYGO) ............................... ................... ................... 5 5 5 5 5
Subtotal, Multilateral de-velopment banks (MDB’s) 1,014 1,487 1,728 1,360 1,186 1,165 1,155
Assistance for the New Inde-pendent States ........................ 470 769 922 809 650 560 500
Food aid ...................................... 867 867 867 886 904 923 943Refugee programs ....................... 700 700 670 684 699 713 728Assistance for Central and
Eastern Europe ....................... 406 483 463 175 100 50 ...................Voluntary contributions to
international organizations .... 272 294 314 314 314 314 314Peace Corps ................................ 220 226 270 322 355 355 355Other development and human-
itarian assistance .................... 897 893 923 907 900 887 901
Total, International de-velopment, humani-tarian assistance .......... 6,494 7,396 7,929 7,214 6,902 6,798 6,766
International security assist-ance:Foreign military financing
grants and loans ..................... 3,347 3,363 3,296 3,296 3,296 3,296 3,296Economic support fund .............. 2,385 2,420 2,514 2,522 2,519 2,527 2,535Other security assistance .......... 248 261 349 346 343 341 339
Total, International secu-rity assistance .............. 5,980 6,044 6,159 6,164 6,158 6,164 6,170
Conduct of foreign affairs:State Department operations .... 2,090 2,076 2,177 2,177 2,177 2,177 2,177Foreign buildings ....................... 389 398 641 431 436 422 388Assessed contributions to inter-
national organizations ............ 902 949 931 900 925 925 925Assessed contributions for inter-
national peacekeeping ............ 335 256 231 210 210 210 210Other conduct of foreign affairs 174 162 166 167 168 169 170
Total, Conduct of foreignaffairs ............................ 3,890 3,841 4,146 3,885 3,916 3,903 3,870
Foreign information and ex-change activities:U.S. Information Agency ........... 1,108 1,126 1,119 1,119 1,119 1,119 1,119
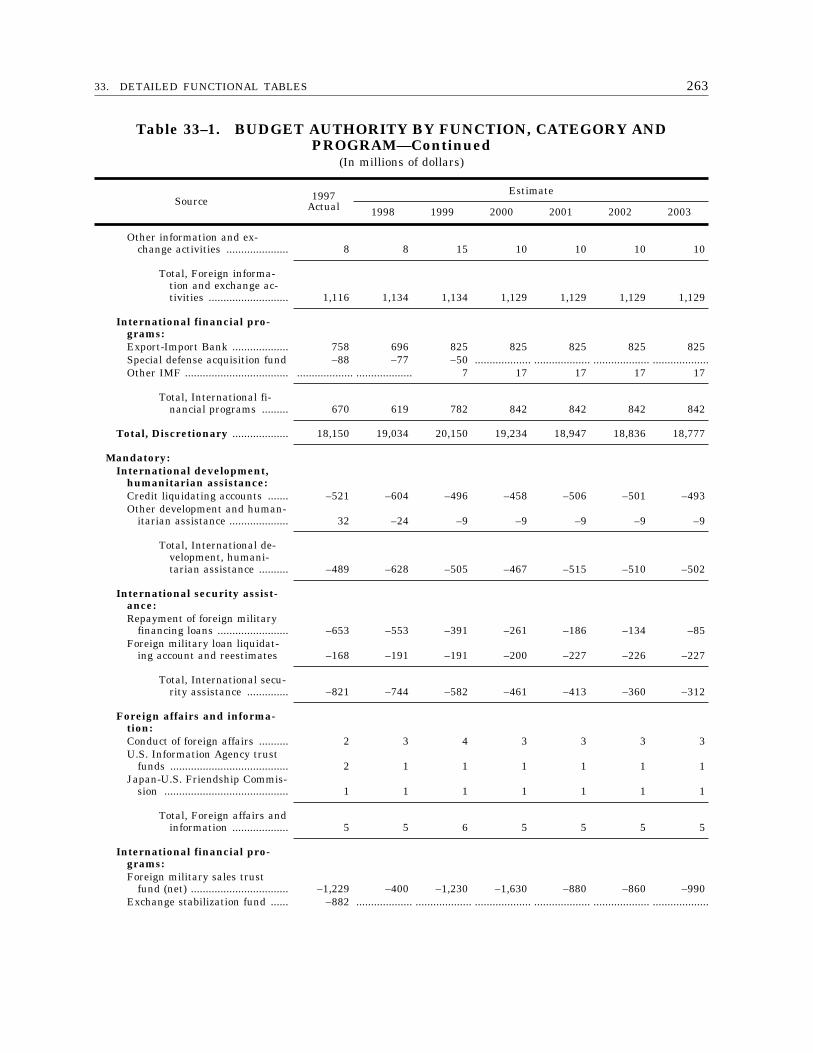
26333. DETAILED FUNCTIONAL TABLES
Table 33–1. BUDGET AUTHORITY BY FUNCTION, CATEGORY ANDPROGRAM—Continued
(In millions of dollars)
Source 1997Actual
Estimate
1998 1999 2000 2001 2002 2003
Other information and ex-change activities ..................... 8 8 15 10 10 10 10
Total, Foreign informa-tion and exchange ac-tivities ........................... 1,116 1,134 1,134 1,129 1,129 1,129 1,129
International financial pro-grams:Export-Import Bank ................... 758 696 825 825 825 825 825Special defense acquisition fund –88 –77 –50 ................... ................... ................... ...................Other IMF ................................... ................... ................... 7 17 17 17 17
Total, International fi-nancial programs ......... 670 619 782 842 842 842 842
Total, Discretionary ................... 18,150 19,034 20,150 19,234 18,947 18,836 18,777
Mandatory:International development,
humanitarian assistance:Credit liquidating accounts ....... –521 –604 –496 –458 –506 –501 –493Other development and human-
itarian assistance .................... 32 –24 –9 –9 –9 –9 –9
Total, International de-velopment, humani-tarian assistance .......... –489 –628 –505 –467 –515 –510 –502
International security assist-ance:Repayment of foreign military
financing loans ........................ –653 –553 –391 –261 –186 –134 –85Foreign military loan liquidat-
ing account and reestimates –168 –191 –191 –200 –227 –226 –227
Total, International secu-rity assistance .............. –821 –744 –582 –461 –413 –360 –312
Foreign affairs and informa-tion:Conduct of foreign affairs .......... 2 3 4 3 3 3 3U.S. Information Agency trust
funds ........................................ 2 1 1 1 1 1 1Japan-U.S. Friendship Commis-
sion .......................................... 1 1 1 1 1 1 1
Total, Foreign affairs andinformation ................... 5 5 6 5 5 5 5
International financial pro-grams:Foreign military sales trust
fund (net) ................................. –1,229 –400 –1,230 –1,630 –880 –860 –990Exchange stabilization fund ...... –882 ................... ................... ................... ................... ................... ...................
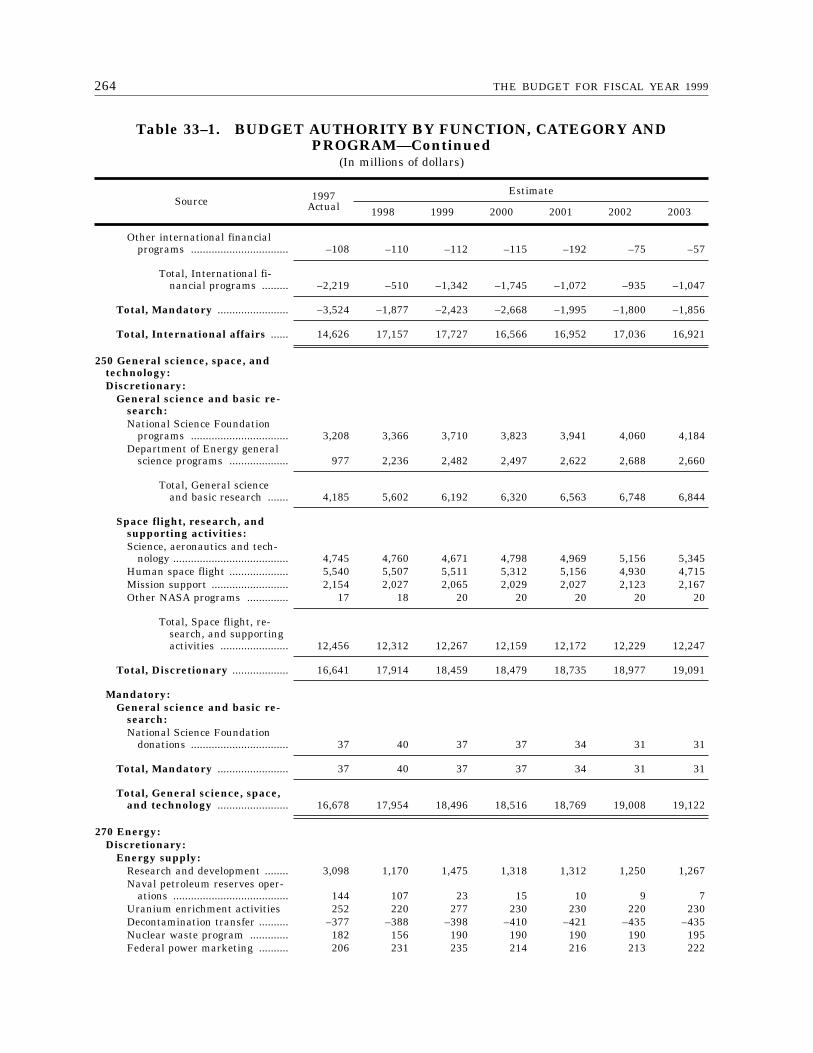
264 THE BUDGET FOR FISCAL YEAR 1999
Table 33–1. BUDGET AUTHORITY BY FUNCTION, CATEGORY ANDPROGRAM—Continued
(In millions of dollars)
Source 1997Actual
Estimate
1998 1999 2000 2001 2002 2003
Other international financialprograms ................................. –108 –110 –112 –115 –192 –75 –57
Total, International fi-nancial programs ......... –2,219 –510 –1,342 –1,745 –1,072 –935 –1,047
Total, Mandatory ........................ –3,524 –1,877 –2,423 –2,668 –1,995 –1,800 –1,856
Total, International affairs ...... 14,626 17,157 17,727 16,566 16,952 17,036 16,921
250 General science, space, andtechnology:Discretionary:
General science and basic re-search:National Science Foundation
programs ................................. 3,208 3,366 3,710 3,823 3,941 4,060 4,184Department of Energy general
science programs .................... 977 2,236 2,482 2,497 2,622 2,688 2,660
Total, General scienceand basic research ....... 4,185 5,602 6,192 6,320 6,563 6,748 6,844
Space flight, research, andsupporting activities:Science, aeronautics and tech-
nology ....................................... 4,745 4,760 4,671 4,798 4,969 5,156 5,345Human space flight .................... 5,540 5,507 5,511 5,312 5,156 4,930 4,715Mission support .......................... 2,154 2,027 2,065 2,029 2,027 2,123 2,167Other NASA programs .............. 17 18 20 20 20 20 20
Total, Space flight, re-search, and supportingactivities ....................... 12,456 12,312 12,267 12,159 12,172 12,229 12,247
Total, Discretionary ................... 16,641 17,914 18,459 18,479 18,735 18,977 19,091
Mandatory:General science and basic re-
search:National Science Foundation
donations ................................. 37 40 37 37 34 31 31
Total, Mandatory ........................ 37 40 37 37 34 31 31
Total, General science, space,and technology ........................ 16,678 17,954 18,496 18,516 18,769 19,008 19,122
270 Energy:Discretionary:
Energy supply:Research and development ........ 3,098 1,170 1,475 1,318 1,312 1,250 1,267Naval petroleum reserves oper-
ations ....................................... 144 107 23 15 10 9 7Uranium enrichment activities 252 220 277 230 230 220 230Decontamination transfer .......... –377 –388 –398 –410 –421 –435 –435Nuclear waste program ............. 182 156 190 190 190 190 195Federal power marketing .......... 206 231 235 214 216 213 222
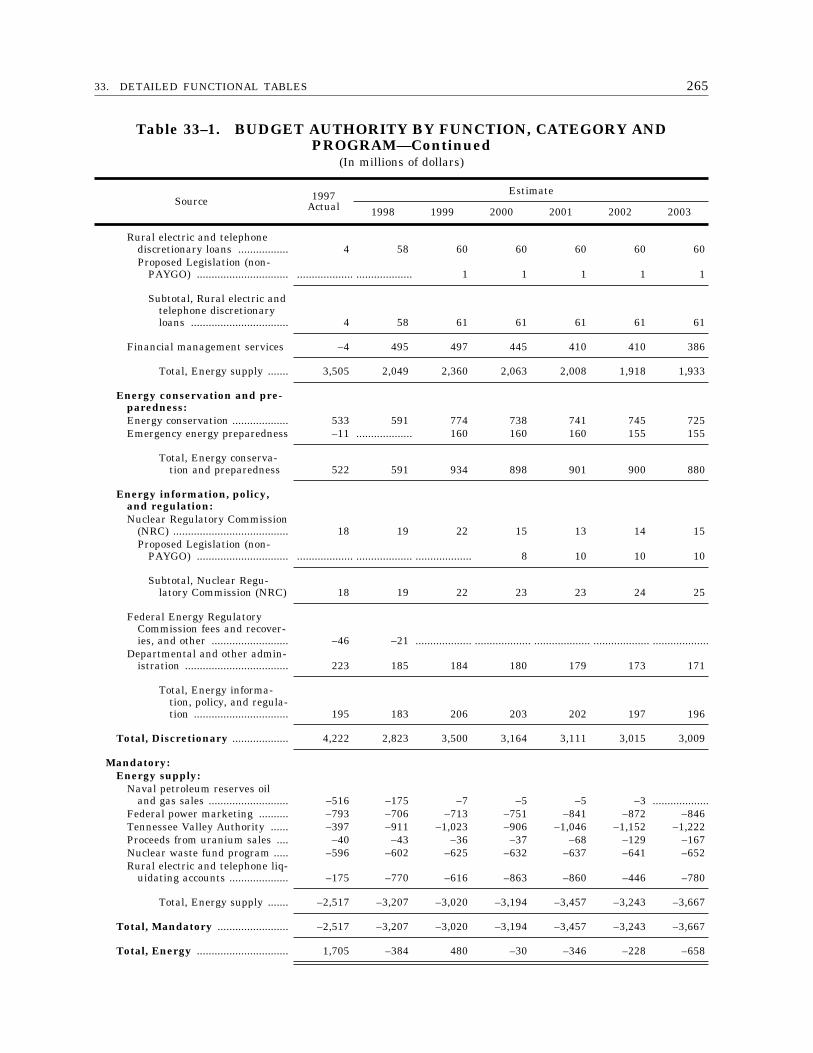
26533. DETAILED FUNCTIONAL TABLES
Table 33–1. BUDGET AUTHORITY BY FUNCTION, CATEGORY ANDPROGRAM—Continued
(In millions of dollars)
Source 1997Actual
Estimate
1998 1999 2000 2001 2002 2003
Rural electric and telephonediscretionary loans ................. 4 58 60 60 60 60 60Proposed Legislation (non-
PAYGO) ............................... ................... ................... 1 1 1 1 1
Subtotal, Rural electric andtelephone discretionaryloans ................................. 4 58 61 61 61 61 61
Financial management services –4 495 497 445 410 410 386
Total, Energy supply ....... 3,505 2,049 2,360 2,063 2,008 1,918 1,933
Energy conservation and pre-paredness:Energy conservation ................... 533 591 774 738 741 745 725Emergency energy preparedness –11 ................... 160 160 160 155 155
Total, Energy conserva-tion and preparedness 522 591 934 898 901 900 880
Energy information, policy,and regulation:Nuclear Regulatory Commission
(NRC) ....................................... 18 19 22 15 13 14 15Proposed Legislation (non-
PAYGO) ............................... ................... ................... ................... 8 10 10 10
Subtotal, Nuclear Regu-latory Commission (NRC) 18 19 22 23 23 24 25
Federal Energy RegulatoryCommission fees and recover-ies, and other .......................... –46 –21 ................... ................... ................... ................... ...................
Departmental and other admin-istration ................................... 223 185 184 180 179 173 171
Total, Energy informa-tion, policy, and regula-tion ................................ 195 183 206 203 202 197 196
Total, Discretionary ................... 4,222 2,823 3,500 3,164 3,111 3,015 3,009
Mandatory:Energy supply:
Naval petroleum reserves oiland gas sales ........................... –516 –175 –7 –5 –5 –3 ...................
Federal power marketing .......... –793 –706 –713 –751 –841 –872 –846Tennessee Valley Authority ...... –397 –911 –1,023 –906 –1,046 –1,152 –1,222Proceeds from uranium sales .... –40 –43 –36 –37 –68 –129 –167Nuclear waste fund program ..... –596 –602 –625 –632 –637 –641 –652Rural electric and telephone liq-
uidating accounts .................... –175 –770 –616 –863 –860 –446 –780
Total, Energy supply ....... –2,517 –3,207 –3,020 –3,194 –3,457 –3,243 –3,667
Total, Mandatory ........................ –2,517 –3,207 –3,020 –3,194 –3,457 –3,243 –3,667
Total, Energy ............................... 1,705 –384 480 –30 –346 –228 –658
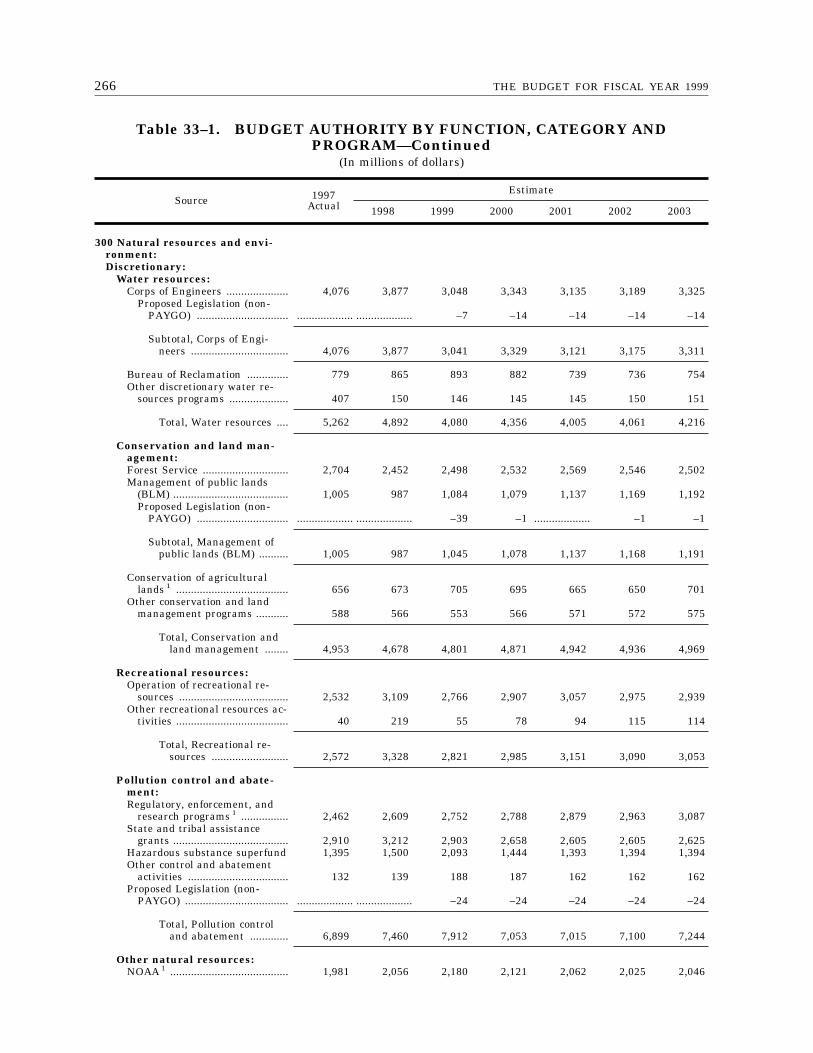
266 THE BUDGET FOR FISCAL YEAR 1999
Table 33–1. BUDGET AUTHORITY BY FUNCTION, CATEGORY ANDPROGRAM—Continued
(In millions of dollars)
Source 1997Actual
Estimate
1998 1999 2000 2001 2002 2003
300 Natural resources and envi-ronment:Discretionary:
Water resources:Corps of Engineers ..................... 4,076 3,877 3,048 3,343 3,135 3,189 3,325
Proposed Legislation (non-PAYGO) ............................... ................... ................... –7 –14 –14 –14 –14
Subtotal, Corps of Engi-neers ................................. 4,076 3,877 3,041 3,329 3,121 3,175 3,311
Bureau of Reclamation .............. 779 865 893 882 739 736 754Other discretionary water re-
sources programs .................... 407 150 146 145 145 150 151
Total, Water resources .... 5,262 4,892 4,080 4,356 4,005 4,061 4,216
Conservation and land man-agement:Forest Service ............................. 2,704 2,452 2,498 2,532 2,569 2,546 2,502Management of public lands
(BLM) ....................................... 1,005 987 1,084 1,079 1,137 1,169 1,192Proposed Legislation (non-
PAYGO) ............................... ................... ................... –39 –1 ................... –1 –1
Subtotal, Management ofpublic lands (BLM) .......... 1,005 987 1,045 1,078 1,137 1,168 1,191
Conservation of agriculturallands 1 ...................................... 656 673 705 695 665 650 701
Other conservation and landmanagement programs ........... 588 566 553 566 571 572 575
Total, Conservation andland management ........ 4,953 4,678 4,801 4,871 4,942 4,936 4,969
Recreational resources:Operation of recreational re-
sources ..................................... 2,532 3,109 2,766 2,907 3,057 2,975 2,939Other recreational resources ac-
tivities ...................................... 40 219 55 78 94 115 114
Total, Recreational re-sources .......................... 2,572 3,328 2,821 2,985 3,151 3,090 3,053
Pollution control and abate-ment:Regulatory, enforcement, and
research programs 1 ................ 2,462 2,609 2,752 2,788 2,879 2,963 3,087State and tribal assistance
grants ....................................... 2,910 3,212 2,903 2,658 2,605 2,605 2,625Hazardous substance superfund 1,395 1,500 2,093 1,444 1,393 1,394 1,394Other control and abatement
activities .................................. 132 139 188 187 162 162 162Proposed Legislation (non-
PAYGO) ................................... ................... ................... –24 –24 –24 –24 –24
Total, Pollution controland abatement ............. 6,899 7,460 7,912 7,053 7,015 7,100 7,244
Other natural resources:NOAA 1 ........................................ 1,981 2,056 2,180 2,121 2,062 2,025 2,046
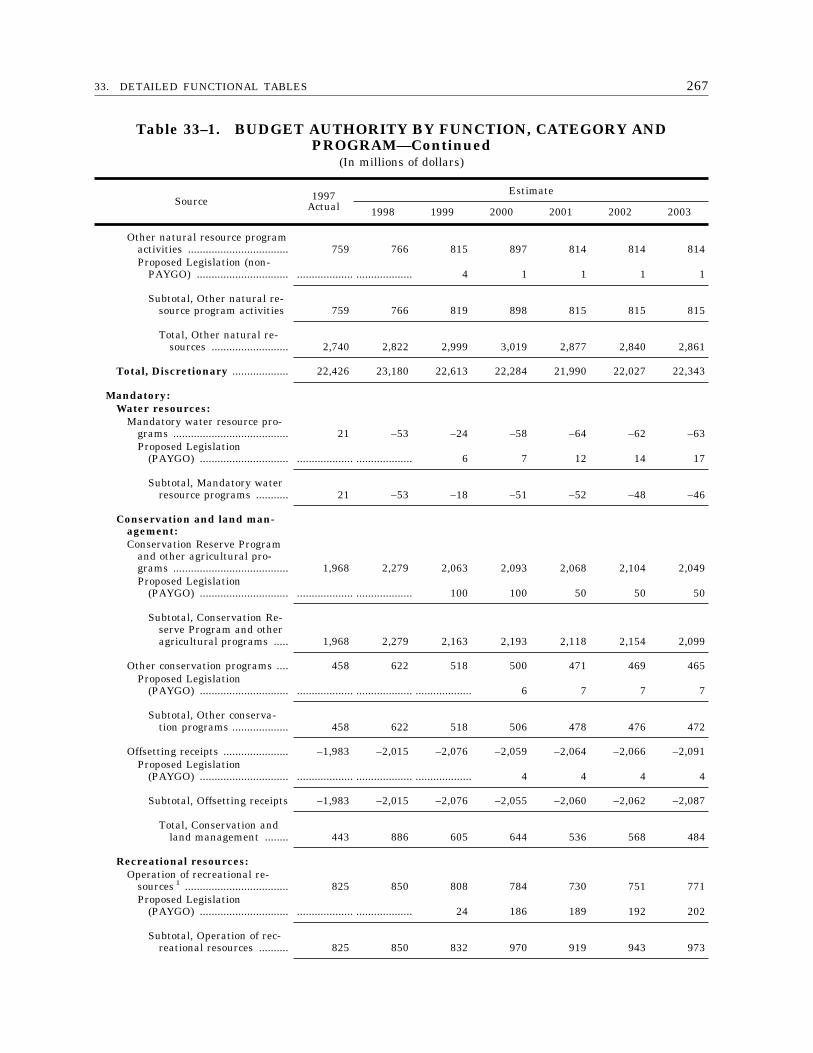
26733. DETAILED FUNCTIONAL TABLES
Table 33–1. BUDGET AUTHORITY BY FUNCTION, CATEGORY ANDPROGRAM—Continued
(In millions of dollars)
Source 1997Actual
Estimate
1998 1999 2000 2001 2002 2003
Other natural resource programactivities .................................. 759 766 815 897 814 814 814Proposed Legislation (non-
PAYGO) ............................... ................... ................... 4 1 1 1 1
Subtotal, Other natural re-source program activities 759 766 819 898 815 815 815
Total, Other natural re-sources .......................... 2,740 2,822 2,999 3,019 2,877 2,840 2,861
Total, Discretionary ................... 22,426 23,180 22,613 22,284 21,990 22,027 22,343
Mandatory:Water resources:
Mandatory water resource pro-grams ....................................... 21 –53 –24 –58 –64 –62 –63Proposed Legislation
(PAYGO) .............................. ................... ................... 6 7 12 14 17
Subtotal, Mandatory waterresource programs ........... 21 –53 –18 –51 –52 –48 –46
Conservation and land man-agement:Conservation Reserve Program
and other agricultural pro-grams ....................................... 1,968 2,279 2,063 2,093 2,068 2,104 2,049Proposed Legislation
(PAYGO) .............................. ................... ................... 100 100 50 50 50
Subtotal, Conservation Re-serve Program and otheragricultural programs ..... 1,968 2,279 2,163 2,193 2,118 2,154 2,099
Other conservation programs .... 458 622 518 500 471 469 465Proposed Legislation
(PAYGO) .............................. ................... ................... ................... 6 7 7 7
Subtotal, Other conserva-tion programs ................... 458 622 518 506 478 476 472
Offsetting receipts ...................... –1,983 –2,015 –2,076 –2,059 –2,064 –2,066 –2,091Proposed Legislation
(PAYGO) .............................. ................... ................... ................... 4 4 4 4
Subtotal, Offsetting receipts –1,983 –2,015 –2,076 –2,055 –2,060 –2,062 –2,087
Total, Conservation andland management ........ 443 886 605 644 536 568 484
Recreational resources:Operation of recreational re-
sources 1 ................................... 825 850 808 784 730 751 771Proposed Legislation
(PAYGO) .............................. ................... ................... 24 186 189 192 202
Subtotal, Operation of rec-reational resources .......... 825 850 832 970 919 943 973
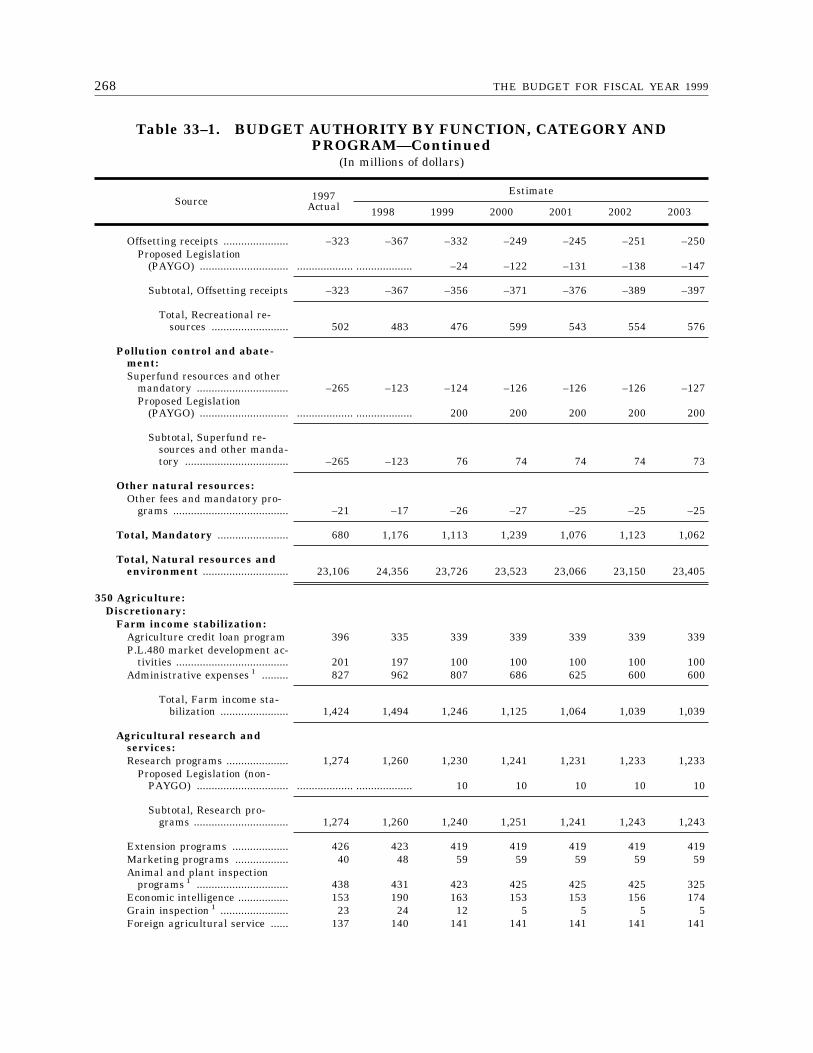
268 THE BUDGET FOR FISCAL YEAR 1999
Table 33–1. BUDGET AUTHORITY BY FUNCTION, CATEGORY ANDPROGRAM—Continued
(In millions of dollars)
Source 1997Actual
Estimate
1998 1999 2000 2001 2002 2003
Offsetting receipts ...................... –323 –367 –332 –249 –245 –251 –250Proposed Legislation
(PAYGO) .............................. ................... ................... –24 –122 –131 –138 –147
Subtotal, Offsetting receipts –323 –367 –356 –371 –376 –389 –397
Total, Recreational re-sources .......................... 502 483 476 599 543 554 576
Pollution control and abate-ment:Superfund resources and other
mandatory ............................... –265 –123 –124 –126 –126 –126 –127Proposed Legislation
(PAYGO) .............................. ................... ................... 200 200 200 200 200
Subtotal, Superfund re-sources and other manda-tory ................................... –265 –123 76 74 74 74 73
Other natural resources:Other fees and mandatory pro-
grams ....................................... –21 –17 –26 –27 –25 –25 –25
Total, Mandatory ........................ 680 1,176 1,113 1,239 1,076 1,123 1,062
Total, Natural resources andenvironment ............................. 23,106 24,356 23,726 23,523 23,066 23,150 23,405
350 Agriculture:Discretionary:
Farm income stabilization:Agriculture credit loan program 396 335 339 339 339 339 339P.L.480 market development ac-
tivities ...................................... 201 197 100 100 100 100 100Administrative expenses 1 ......... 827 962 807 686 625 600 600
Total, Farm income sta-bilization ....................... 1,424 1,494 1,246 1,125 1,064 1,039 1,039
Agricultural research andservices:Research programs ..................... 1,274 1,260 1,230 1,241 1,231 1,233 1,233
Proposed Legislation (non-PAYGO) ............................... ................... ................... 10 10 10 10 10
Subtotal, Research pro-grams ................................ 1,274 1,260 1,240 1,251 1,241 1,243 1,243
Extension programs ................... 426 423 419 419 419 419 419Marketing programs .................. 40 48 59 59 59 59 59Animal and plant inspection
programs 1 ............................... 438 431 423 425 425 425 325Economic intelligence ................. 153 190 163 153 153 156 174Grain inspection 1 ....................... 23 24 12 5 5 5 5Foreign agricultural service ...... 137 140 141 141 141 141 141
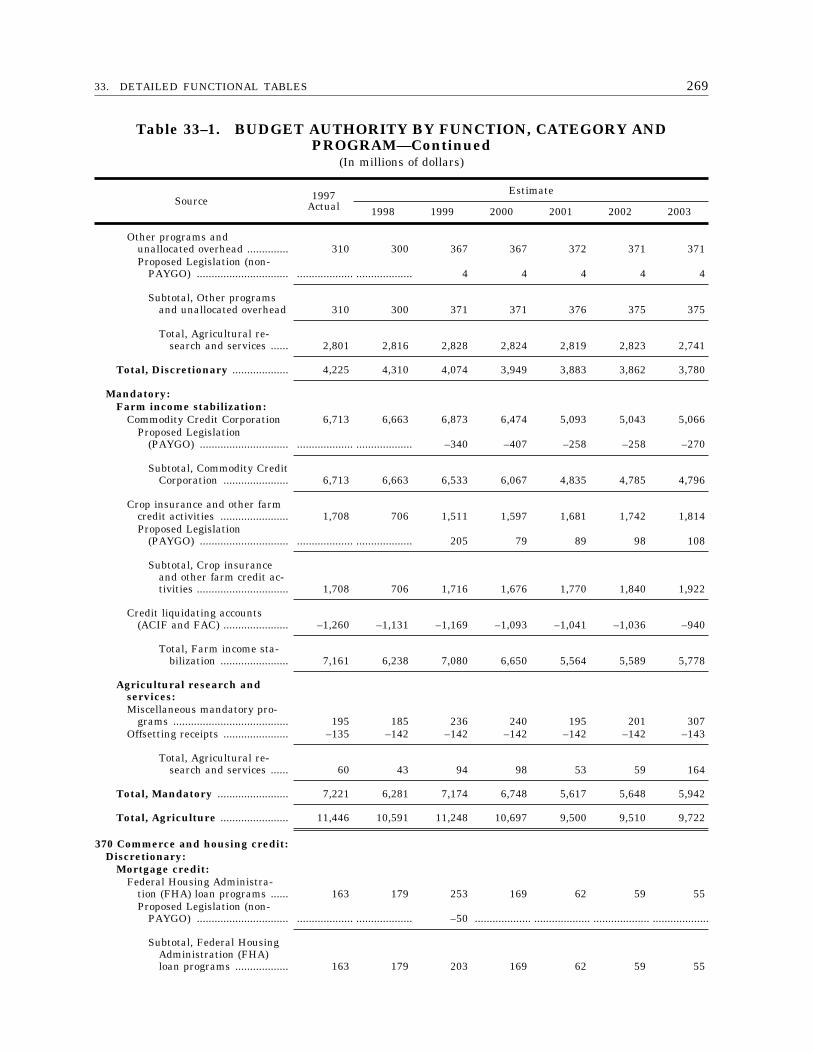
26933. DETAILED FUNCTIONAL TABLES
Table 33–1. BUDGET AUTHORITY BY FUNCTION, CATEGORY ANDPROGRAM—Continued
(In millions of dollars)
Source 1997Actual
Estimate
1998 1999 2000 2001 2002 2003
Other programs andunallocated overhead .............. 310 300 367 367 372 371 371Proposed Legislation (non-
PAYGO) ............................... ................... ................... 4 4 4 4 4
Subtotal, Other programsand unallocated overhead 310 300 371 371 376 375 375
Total, Agricultural re-search and services ...... 2,801 2,816 2,828 2,824 2,819 2,823 2,741
Total, Discretionary ................... 4,225 4,310 4,074 3,949 3,883 3,862 3,780
Mandatory:Farm income stabilization:
Commodity Credit Corporation 6,713 6,663 6,873 6,474 5,093 5,043 5,066Proposed Legislation
(PAYGO) .............................. ................... ................... –340 –407 –258 –258 –270
Subtotal, Commodity CreditCorporation ...................... 6,713 6,663 6,533 6,067 4,835 4,785 4,796
Crop insurance and other farmcredit activities ....................... 1,708 706 1,511 1,597 1,681 1,742 1,814Proposed Legislation
(PAYGO) .............................. ................... ................... 205 79 89 98 108
Subtotal, Crop insuranceand other farm credit ac-tivities ............................... 1,708 706 1,716 1,676 1,770 1,840 1,922
Credit liquidating accounts(ACIF and FAC) ...................... –1,260 –1,131 –1,169 –1,093 –1,041 –1,036 –940
Total, Farm income sta-bilization ....................... 7,161 6,238 7,080 6,650 5,564 5,589 5,778
Agricultural research andservices:Miscellaneous mandatory pro-
grams ....................................... 195 185 236 240 195 201 307Offsetting receipts ...................... –135 –142 –142 –142 –142 –142 –143
Total, Agricultural re-search and services ...... 60 43 94 98 53 59 164
Total, Mandatory ........................ 7,221 6,281 7,174 6,748 5,617 5,648 5,942
Total, Agriculture ....................... 11,446 10,591 11,248 10,697 9,500 9,510 9,722
370 Commerce and housing credit:Discretionary:
Mortgage credit:Federal Housing Administra-
tion (FHA) loan programs ...... 163 179 253 169 62 59 55Proposed Legislation (non-
PAYGO) ............................... ................... ................... –50 ................... ................... ................... ...................
Subtotal, Federal HousingAdministration (FHA)loan programs .................. 163 179 203 169 62 59 55
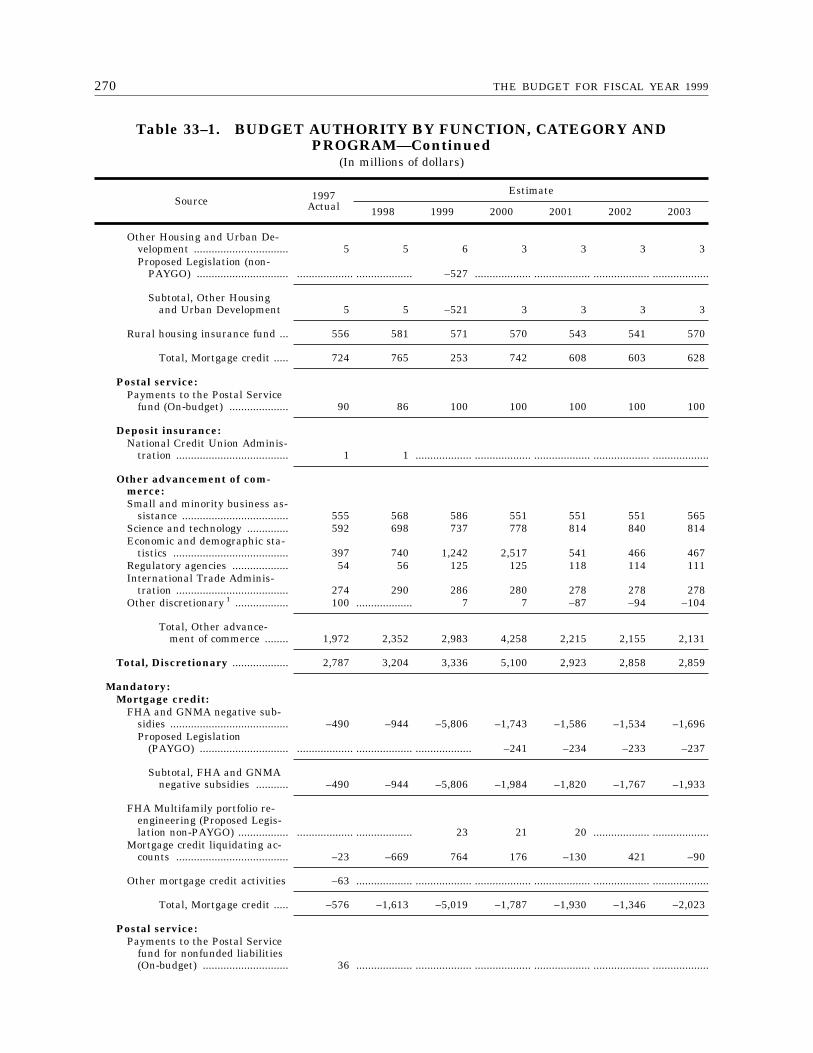
270 THE BUDGET FOR FISCAL YEAR 1999
Table 33–1. BUDGET AUTHORITY BY FUNCTION, CATEGORY ANDPROGRAM—Continued
(In millions of dollars)
Source 1997Actual
Estimate
1998 1999 2000 2001 2002 2003
Other Housing and Urban De-velopment ................................ 5 5 6 3 3 3 3Proposed Legislation (non-
PAYGO) ............................... ................... ................... –527 ................... ................... ................... ...................
Subtotal, Other Housingand Urban Development 5 5 –521 3 3 3 3
Rural housing insurance fund ... 556 581 571 570 543 541 570
Total, Mortgage credit ..... 724 765 253 742 608 603 628
Postal service:Payments to the Postal Service
fund (On-budget) .................... 90 86 100 100 100 100 100
Deposit insurance:National Credit Union Adminis-
tration ...................................... 1 1 ................... ................... ................... ................... ...................
Other advancement of com-merce:Small and minority business as-
sistance .................................... 555 568 586 551 551 551 565Science and technology .............. 592 698 737 778 814 840 814Economic and demographic sta-
tistics ....................................... 397 740 1,242 2,517 541 466 467Regulatory agencies ................... 54 56 125 125 118 114 111International Trade Adminis-
tration ...................................... 274 290 286 280 278 278 278Other discretionary 1 .................. 100 ................... 7 7 –87 –94 –104
Total, Other advance-ment of commerce ........ 1,972 2,352 2,983 4,258 2,215 2,155 2,131
Total, Discretionary ................... 2,787 3,204 3,336 5,100 2,923 2,858 2,859
Mandatory:Mortgage credit:
FHA and GNMA negative sub-sidies ........................................ –490 –944 –5,806 –1,743 –1,586 –1,534 –1,696Proposed Legislation
(PAYGO) .............................. ................... ................... ................... –241 –234 –233 –237
Subtotal, FHA and GNMAnegative subsidies ........... –490 –944 –5,806 –1,984 –1,820 –1,767 –1,933
FHA Multifamily portfolio re-engineering (Proposed Legis-lation non-PAYGO) ................. ................... ................... 23 21 20 ................... ...................
Mortgage credit liquidating ac-counts ...................................... –23 –669 764 176 –130 421 –90
Other mortgage credit activities –63 ................... ................... ................... ................... ................... ...................
Total, Mortgage credit ..... –576 –1,613 –5,019 –1,787 –1,930 –1,346 –2,023
Postal service:Payments to the Postal Service
fund for nonfunded liabilities(On-budget) ............................. 36 ................... ................... ................... ................... ................... ...................
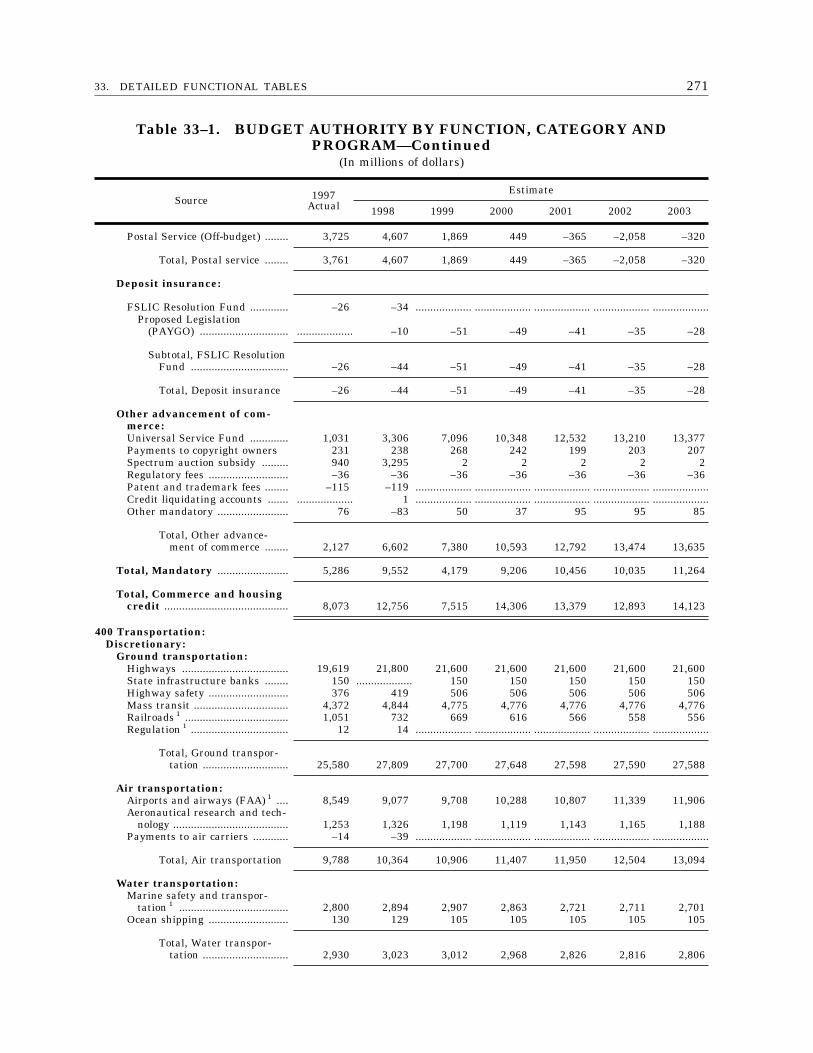
27133. DETAILED FUNCTIONAL TABLES
Table 33–1. BUDGET AUTHORITY BY FUNCTION, CATEGORY ANDPROGRAM—Continued
(In millions of dollars)
Source 1997Actual
Estimate
1998 1999 2000 2001 2002 2003
Postal Service (Off-budget) ........ 3,725 4,607 1,869 449 –365 –2,058 –320
Total, Postal service ........ 3,761 4,607 1,869 449 –365 –2,058 –320
Deposit insurance:
FSLIC Resolution Fund ............. –26 –34 ................... ................... ................... ................... ...................Proposed Legislation
(PAYGO) .............................. ................... –10 –51 –49 –41 –35 –28
Subtotal, FSLIC ResolutionFund ................................. –26 –44 –51 –49 –41 –35 –28
Total, Deposit insurance –26 –44 –51 –49 –41 –35 –28
Other advancement of com-merce:Universal Service Fund ............. 1,031 3,306 7,096 10,348 12,532 13,210 13,377Payments to copyright owners 231 238 268 242 199 203 207Spectrum auction subsidy ......... 940 3,295 2 2 2 2 2Regulatory fees ........................... –36 –36 –36 –36 –36 –36 –36Patent and trademark fees ........ –115 –119 ................... ................... ................... ................... ...................Credit liquidating accounts ....... ................... 1 ................... ................... ................... ................... ...................Other mandatory ........................ 76 –83 50 37 95 95 85
Total, Other advance-ment of commerce ........ 2,127 6,602 7,380 10,593 12,792 13,474 13,635
Total, Mandatory ........................ 5,286 9,552 4,179 9,206 10,456 10,035 11,264
Total, Commerce and housingcredit .......................................... 8,073 12,756 7,515 14,306 13,379 12,893 14,123
400 Transportation:Discretionary:
Ground transportation:Highways .................................... 19,619 21,800 21,600 21,600 21,600 21,600 21,600State infrastructure banks ........ 150 ................... 150 150 150 150 150Highway safety ........................... 376 419 506 506 506 506 506Mass transit ................................ 4,372 4,844 4,775 4,776 4,776 4,776 4,776Railroads 1 ................................... 1,051 732 669 616 566 558 556Regulation 1 ................................. 12 14 ................... ................... ................... ................... ...................
Total, Ground transpor-tation ............................. 25,580 27,809 27,700 27,648 27,598 27,590 27,588
Air transportation:Airports and airways (FAA) 1 .... 8,549 9,077 9,708 10,288 10,807 11,339 11,906Aeronautical research and tech-
nology ....................................... 1,253 1,326 1,198 1,119 1,143 1,165 1,188Payments to air carriers ............ –14 –39 ................... ................... ................... ................... ...................
Total, Air transportation 9,788 10,364 10,906 11,407 11,950 12,504 13,094
Water transportation:Marine safety and transpor-
tation 1 ..................................... 2,800 2,894 2,907 2,863 2,721 2,711 2,701Ocean shipping ........................... 130 129 105 105 105 105 105
Total, Water transpor-tation ............................. 2,930 3,023 3,012 2,968 2,826 2,816 2,806
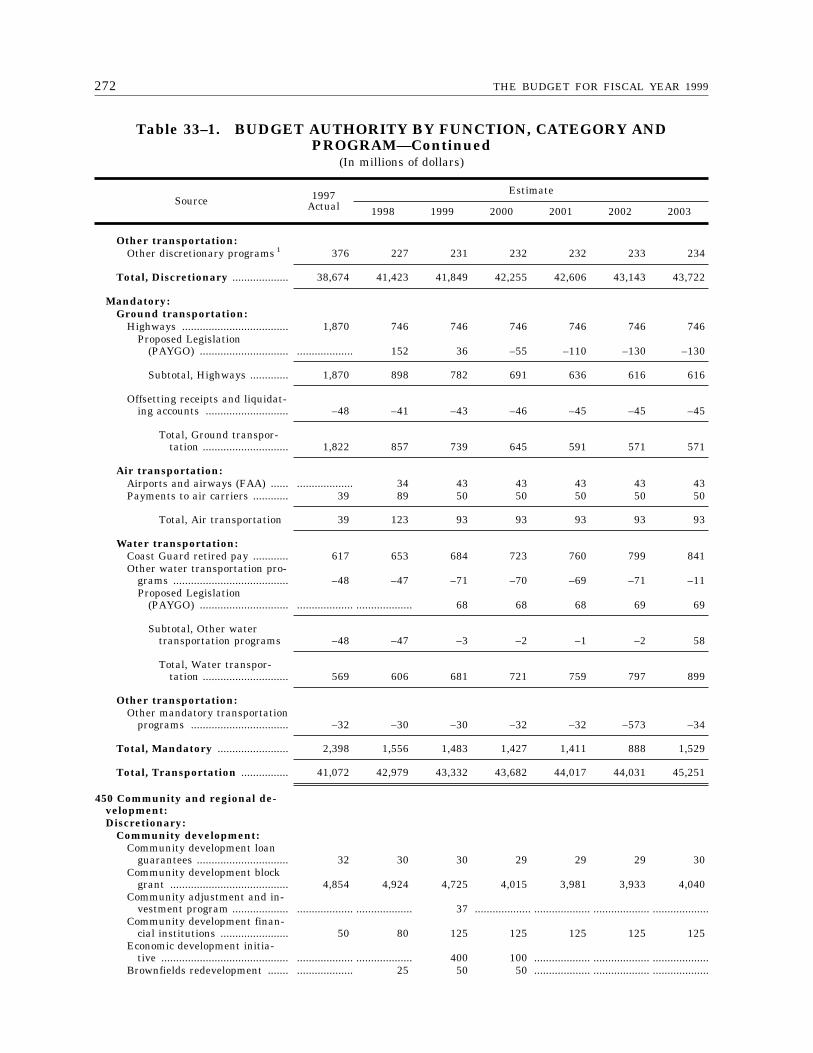
272 THE BUDGET FOR FISCAL YEAR 1999
Table 33–1. BUDGET AUTHORITY BY FUNCTION, CATEGORY ANDPROGRAM—Continued
(In millions of dollars)
Source 1997Actual
Estimate
1998 1999 2000 2001 2002 2003
Other transportation:Other discretionary programs 1 376 227 231 232 232 233 234
Total, Discretionary ................... 38,674 41,423 41,849 42,255 42,606 43,143 43,722
Mandatory:Ground transportation:
Highways .................................... 1,870 746 746 746 746 746 746Proposed Legislation
(PAYGO) .............................. ................... 152 36 –55 –110 –130 –130
Subtotal, Highways ............. 1,870 898 782 691 636 616 616
Offsetting receipts and liquidat-ing accounts ............................ –48 –41 –43 –46 –45 –45 –45
Total, Ground transpor-tation ............................. 1,822 857 739 645 591 571 571
Air transportation:Airports and airways (FAA) ...... ................... 34 43 43 43 43 43Payments to air carriers ............ 39 89 50 50 50 50 50
Total, Air transportation 39 123 93 93 93 93 93
Water transportation:Coast Guard retired pay ............ 617 653 684 723 760 799 841Other water transportation pro-
grams ....................................... –48 –47 –71 –70 –69 –71 –11Proposed Legislation
(PAYGO) .............................. ................... ................... 68 68 68 69 69
Subtotal, Other watertransportation programs –48 –47 –3 –2 –1 –2 58
Total, Water transpor-tation ............................. 569 606 681 721 759 797 899
Other transportation:Other mandatory transportation
programs ................................. –32 –30 –30 –32 –32 –573 –34
Total, Mandatory ........................ 2,398 1,556 1,483 1,427 1,411 888 1,529
Total, Transportation ................ 41,072 42,979 43,332 43,682 44,017 44,031 45,251
450 Community and regional de-velopment:Discretionary:
Community development:Community development loan
guarantees ............................... 32 30 30 29 29 29 30Community development block
grant ........................................ 4,854 4,924 4,725 4,015 3,981 3,933 4,040Community adjustment and in-
vestment program ................... ................... ................... 37 ................... ................... ................... ...................Community development finan-
cial institutions ....................... 50 80 125 125 125 125 125Economic development initia-
tive ........................................... ................... ................... 400 100 ................... ................... ...................Brownfields redevelopment ....... ................... 25 50 50 ................... ................... ...................
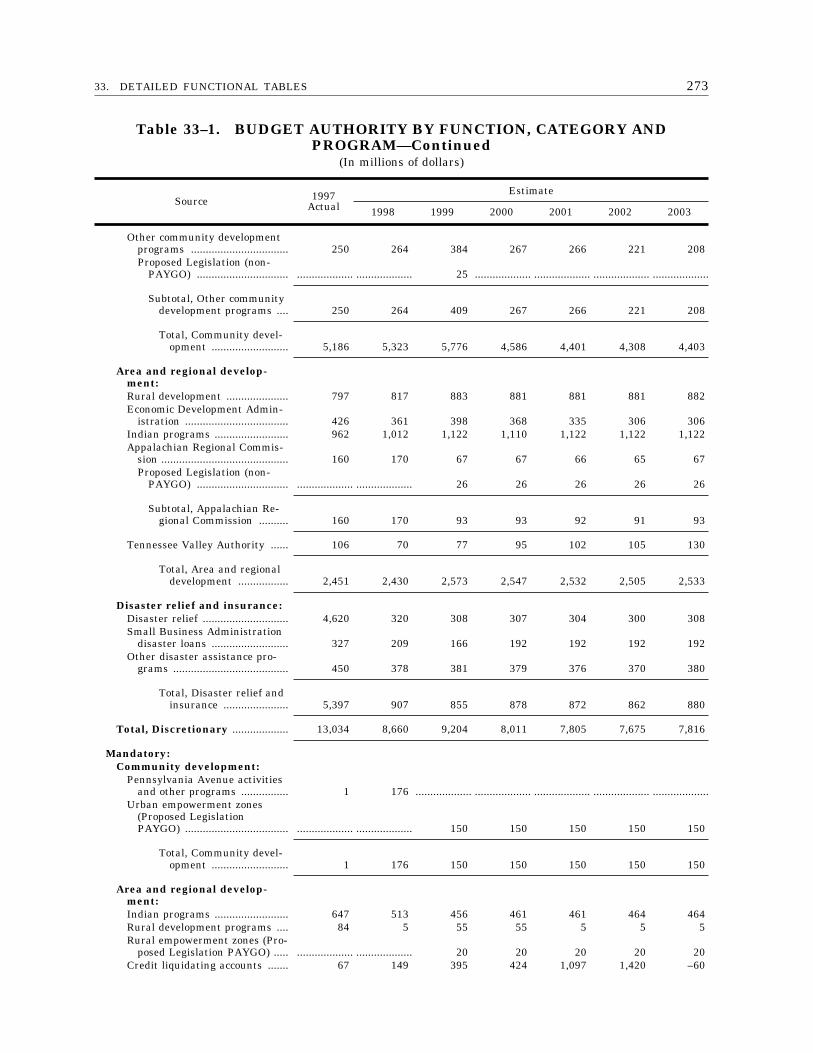
27333. DETAILED FUNCTIONAL TABLES
Table 33–1. BUDGET AUTHORITY BY FUNCTION, CATEGORY ANDPROGRAM—Continued
(In millions of dollars)
Source 1997Actual
Estimate
1998 1999 2000 2001 2002 2003
Other community developmentprograms ................................. 250 264 384 267 266 221 208Proposed Legislation (non-
PAYGO) ............................... ................... ................... 25 ................... ................... ................... ...................
Subtotal, Other communitydevelopment programs .... 250 264 409 267 266 221 208
Total, Community devel-opment .......................... 5,186 5,323 5,776 4,586 4,401 4,308 4,403
Area and regional develop-ment:Rural development ..................... 797 817 883 881 881 881 882Economic Development Admin-
istration ................................... 426 361 398 368 335 306 306Indian programs ......................... 962 1,012 1,122 1,110 1,122 1,122 1,122Appalachian Regional Commis-
sion ........................................... 160 170 67 67 66 65 67Proposed Legislation (non-
PAYGO) ............................... ................... ................... 26 26 26 26 26
Subtotal, Appalachian Re-gional Commission .......... 160 170 93 93 92 91 93
Tennessee Valley Authority ...... 106 70 77 95 102 105 130
Total, Area and regionaldevelopment ................. 2,451 2,430 2,573 2,547 2,532 2,505 2,533
Disaster relief and insurance:Disaster relief ............................. 4,620 320 308 307 304 300 308Small Business Administration
disaster loans .......................... 327 209 166 192 192 192 192Other disaster assistance pro-
grams ....................................... 450 378 381 379 376 370 380
Total, Disaster relief andinsurance ...................... 5,397 907 855 878 872 862 880
Total, Discretionary ................... 13,034 8,660 9,204 8,011 7,805 7,675 7,816
Mandatory:Community development:
Pennsylvania Avenue activitiesand other programs ................ 1 176 ................... ................... ................... ................... ...................
Urban empowerment zones(Proposed LegislationPAYGO) ................................... ................... ................... 150 150 150 150 150
Total, Community devel-opment .......................... 1 176 150 150 150 150 150
Area and regional develop-ment:Indian programs ......................... 647 513 456 461 461 464 464Rural development programs .... 84 5 55 55 5 5 5Rural empowerment zones (Pro-
posed Legislation PAYGO) ..... ................... ................... 20 20 20 20 20Credit liquidating accounts ....... 67 149 395 424 1,097 1,420 –60
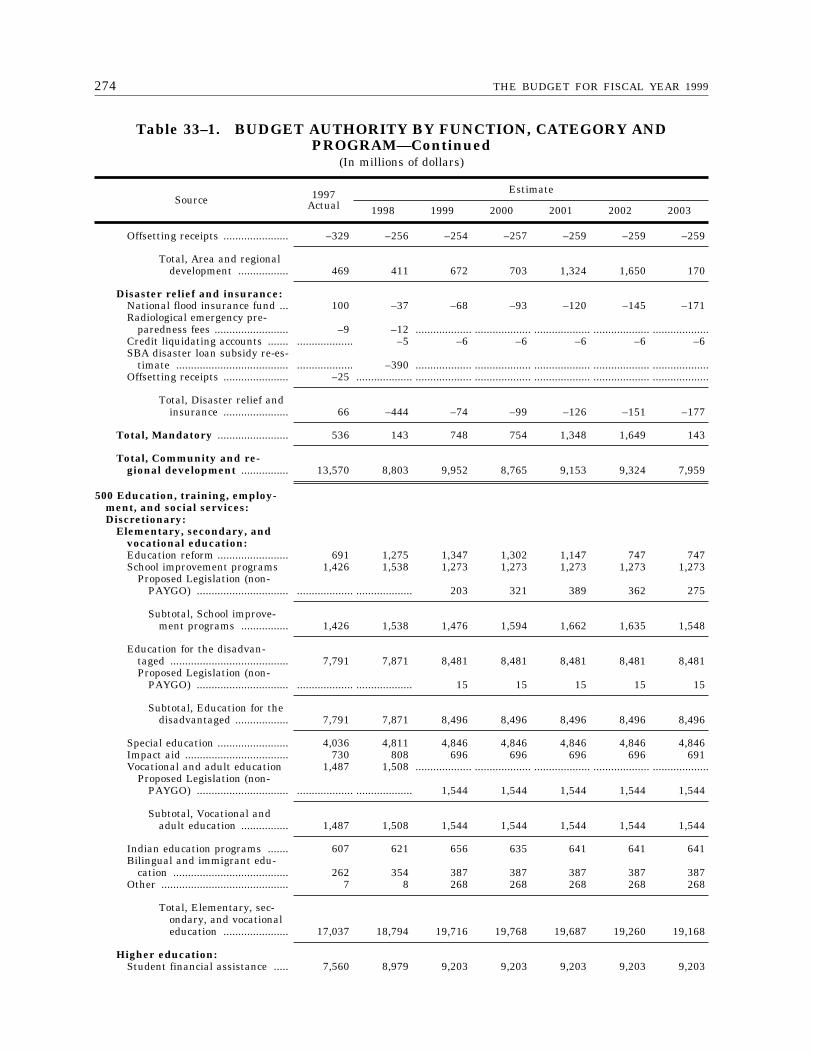
274 THE BUDGET FOR FISCAL YEAR 1999
Table 33–1. BUDGET AUTHORITY BY FUNCTION, CATEGORY ANDPROGRAM—Continued
(In millions of dollars)
Source 1997Actual
Estimate
1998 1999 2000 2001 2002 2003
Offsetting receipts ...................... –329 –256 –254 –257 –259 –259 –259
Total, Area and regionaldevelopment ................. 469 411 672 703 1,324 1,650 170
Disaster relief and insurance:National flood insurance fund ... 100 –37 –68 –93 –120 –145 –171Radiological emergency pre-
paredness fees ......................... –9 –12 ................... ................... ................... ................... ...................Credit liquidating accounts ....... ................... –5 –6 –6 –6 –6 –6SBA disaster loan subsidy re-es-
timate ...................................... ................... –390 ................... ................... ................... ................... ...................Offsetting receipts ...................... –25 ................... ................... ................... ................... ................... ...................
Total, Disaster relief andinsurance ...................... 66 –444 –74 –99 –126 –151 –177
Total, Mandatory ........................ 536 143 748 754 1,348 1,649 143
Total, Community and re-gional development ................ 13,570 8,803 9,952 8,765 9,153 9,324 7,959
500 Education, training, employ-ment, and social services:Discretionary:
Elementary, secondary, andvocational education:Education reform ........................ 691 1,275 1,347 1,302 1,147 747 747School improvement programs 1,426 1,538 1,273 1,273 1,273 1,273 1,273
Proposed Legislation (non-PAYGO) ............................... ................... ................... 203 321 389 362 275
Subtotal, School improve-ment programs ................ 1,426 1,538 1,476 1,594 1,662 1,635 1,548
Education for the disadvan-taged ........................................ 7,791 7,871 8,481 8,481 8,481 8,481 8,481Proposed Legislation (non-
PAYGO) ............................... ................... ................... 15 15 15 15 15
Subtotal, Education for thedisadvantaged .................. 7,791 7,871 8,496 8,496 8,496 8,496 8,496
Special education ........................ 4,036 4,811 4,846 4,846 4,846 4,846 4,846Impact aid ................................... 730 808 696 696 696 696 691Vocational and adult education 1,487 1,508 ................... ................... ................... ................... ...................
Proposed Legislation (non-PAYGO) ............................... ................... ................... 1,544 1,544 1,544 1,544 1,544
Subtotal, Vocational andadult education ................ 1,487 1,508 1,544 1,544 1,544 1,544 1,544
Indian education programs ....... 607 621 656 635 641 641 641Bilingual and immigrant edu-
cation ....................................... 262 354 387 387 387 387 387Other ........................................... 7 8 268 268 268 268 268
Total, Elementary, sec-ondary, and vocationaleducation ...................... 17,037 18,794 19,716 19,768 19,687 19,260 19,168
Higher education:Student financial assistance ..... 7,560 8,979 9,203 9,203 9,203 9,203 9,203
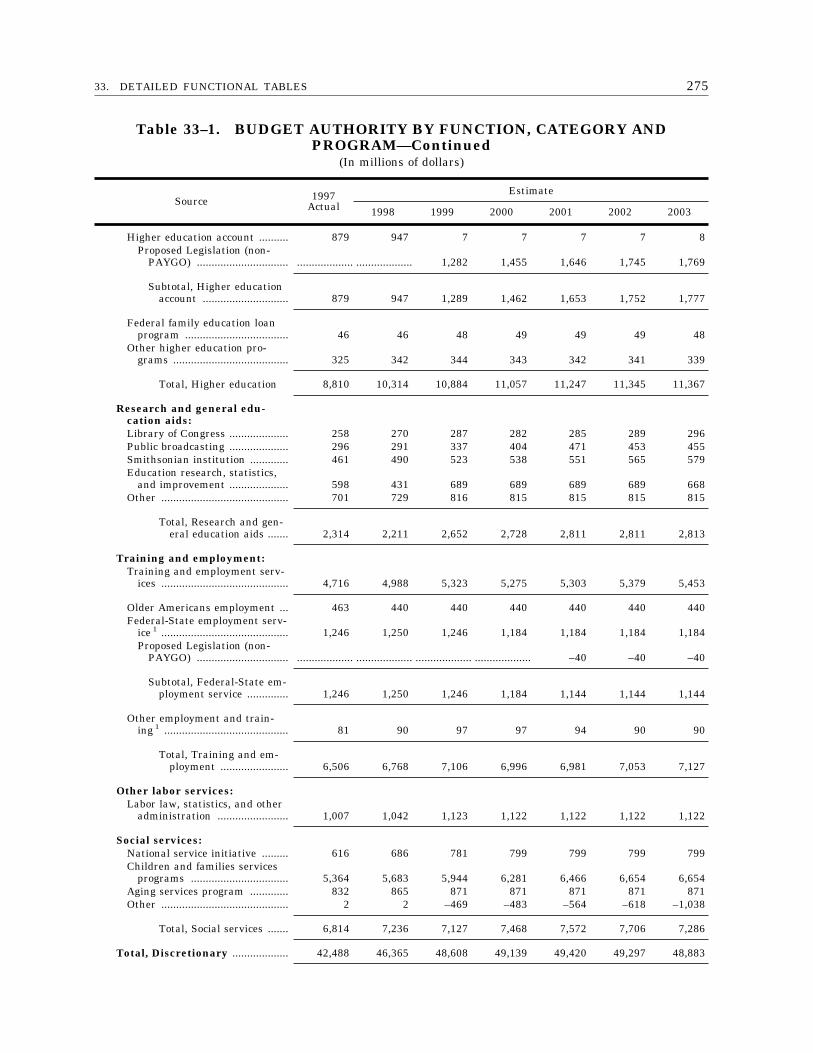
27533. DETAILED FUNCTIONAL TABLES
Table 33–1. BUDGET AUTHORITY BY FUNCTION, CATEGORY ANDPROGRAM—Continued
(In millions of dollars)
Source 1997Actual
Estimate
1998 1999 2000 2001 2002 2003
Higher education account .......... 879 947 7 7 7 7 8Proposed Legislation (non-
PAYGO) ............................... ................... ................... 1,282 1,455 1,646 1,745 1,769
Subtotal, Higher educationaccount ............................. 879 947 1,289 1,462 1,653 1,752 1,777
Federal family education loanprogram ................................... 46 46 48 49 49 49 48
Other higher education pro-grams ....................................... 325 342 344 343 342 341 339
Total, Higher education 8,810 10,314 10,884 11,057 11,247 11,345 11,367
Research and general edu-cation aids:Library of Congress .................... 258 270 287 282 285 289 296Public broadcasting .................... 296 291 337 404 471 453 455Smithsonian institution ............. 461 490 523 538 551 565 579Education research, statistics,
and improvement .................... 598 431 689 689 689 689 668Other ........................................... 701 729 816 815 815 815 815
Total, Research and gen-eral education aids ....... 2,314 2,211 2,652 2,728 2,811 2,811 2,813
Training and employment:Training and employment serv-
ices ........................................... 4,716 4,988 5,323 5,275 5,303 5,379 5,453
Older Americans employment ... 463 440 440 440 440 440 440Federal-State employment serv-
ice 1 ........................................... 1,246 1,250 1,246 1,184 1,184 1,184 1,184Proposed Legislation (non-
PAYGO) ............................... ................... ................... ................... ................... –40 –40 –40
Subtotal, Federal-State em-ployment service .............. 1,246 1,250 1,246 1,184 1,144 1,144 1,144
Other employment and train-ing 1 .......................................... 81 90 97 97 94 90 90
Total, Training and em-ployment ....................... 6,506 6,768 7,106 6,996 6,981 7,053 7,127
Other labor services:Labor law, statistics, and other
administration ........................ 1,007 1,042 1,123 1,122 1,122 1,122 1,122
Social services:National service initiative ......... 616 686 781 799 799 799 799Children and families services
programs ................................. 5,364 5,683 5,944 6,281 6,466 6,654 6,654Aging services program ............. 832 865 871 871 871 871 871Other ........................................... 2 2 –469 –483 –564 –618 –1,038
Total, Social services ....... 6,814 7,236 7,127 7,468 7,572 7,706 7,286
Total, Discretionary ................... 42,488 46,365 48,608 49,139 49,420 49,297 48,883
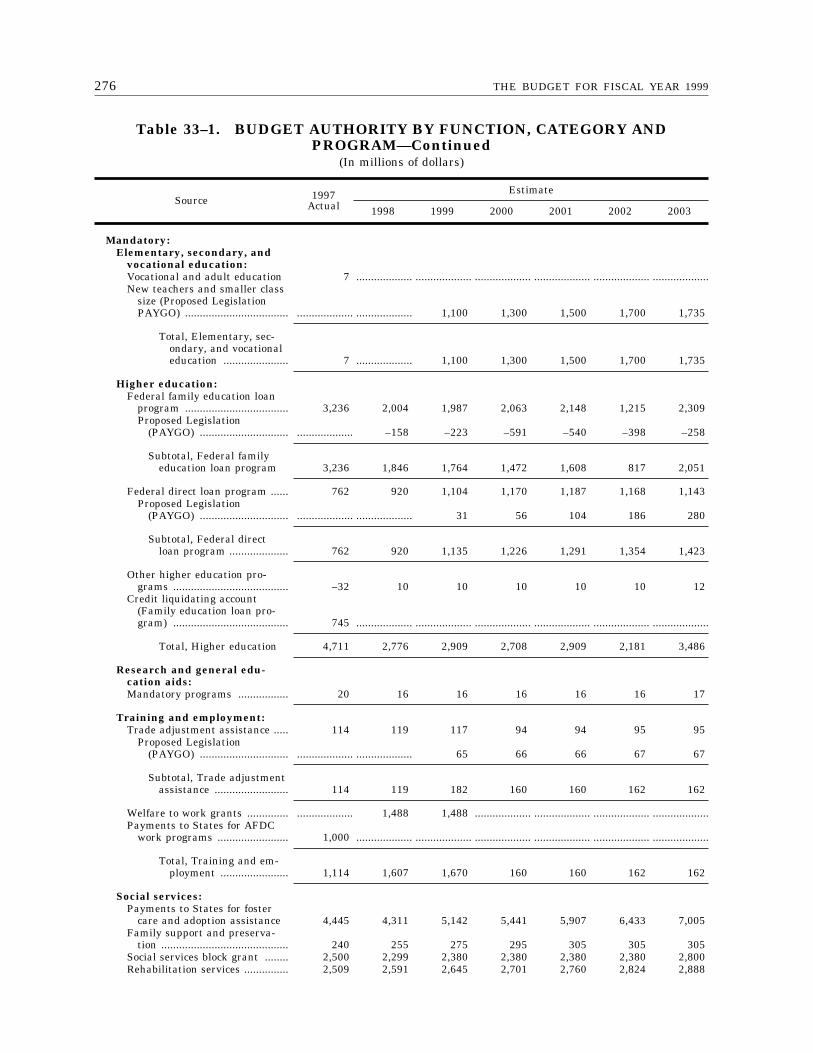
276 THE BUDGET FOR FISCAL YEAR 1999
Table 33–1. BUDGET AUTHORITY BY FUNCTION, CATEGORY ANDPROGRAM—Continued
(In millions of dollars)
Source 1997Actual
Estimate
1998 1999 2000 2001 2002 2003
Mandatory:Elementary, secondary, and
vocational education:Vocational and adult education 7 ................... ................... ................... ................... ................... ...................New teachers and smaller class
size (Proposed LegislationPAYGO) ................................... ................... ................... 1,100 1,300 1,500 1,700 1,735
Total, Elementary, sec-ondary, and vocationaleducation ...................... 7 ................... 1,100 1,300 1,500 1,700 1,735
Higher education:Federal family education loan
program ................................... 3,236 2,004 1,987 2,063 2,148 1,215 2,309Proposed Legislation
(PAYGO) .............................. ................... –158 –223 –591 –540 –398 –258
Subtotal, Federal familyeducation loan program 3,236 1,846 1,764 1,472 1,608 817 2,051
Federal direct loan program ...... 762 920 1,104 1,170 1,187 1,168 1,143Proposed Legislation
(PAYGO) .............................. ................... ................... 31 56 104 186 280
Subtotal, Federal directloan program .................... 762 920 1,135 1,226 1,291 1,354 1,423
Other higher education pro-grams ....................................... –32 10 10 10 10 10 12
Credit liquidating account(Family education loan pro-gram) ....................................... 745 ................... ................... ................... ................... ................... ...................
Total, Higher education 4,711 2,776 2,909 2,708 2,909 2,181 3,486
Research and general edu-cation aids:Mandatory programs ................. 20 16 16 16 16 16 17
Training and employment:Trade adjustment assistance ..... 114 119 117 94 94 95 95
Proposed Legislation(PAYGO) .............................. ................... ................... 65 66 66 67 67
Subtotal, Trade adjustmentassistance ......................... 114 119 182 160 160 162 162
Welfare to work grants .............. ................... 1,488 1,488 ................... ................... ................... ...................Payments to States for AFDC
work programs ........................ 1,000 ................... ................... ................... ................... ................... ...................
Total, Training and em-ployment ....................... 1,114 1,607 1,670 160 160 162 162
Social services:Payments to States for foster
care and adoption assistance 4,445 4,311 5,142 5,441 5,907 6,433 7,005Family support and preserva-
tion ........................................... 240 255 275 295 305 305 305Social services block grant ........ 2,500 2,299 2,380 2,380 2,380 2,380 2,800Rehabilitation services ............... 2,509 2,591 2,645 2,701 2,760 2,824 2,888
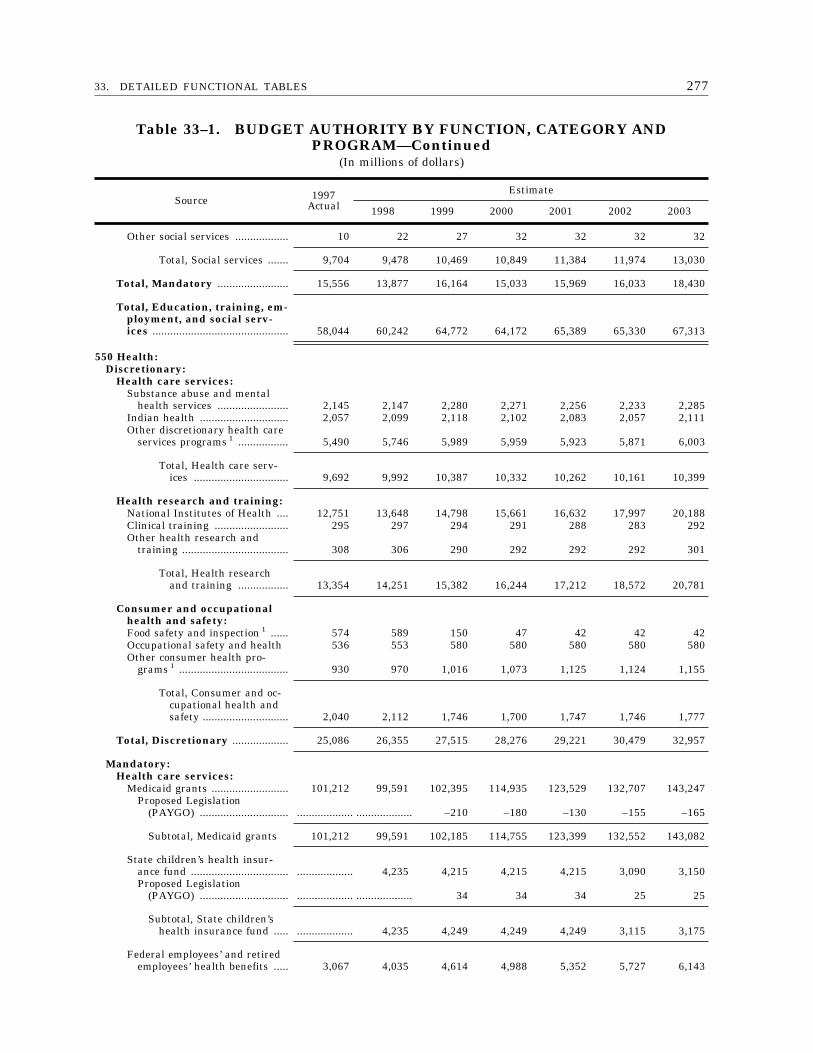
27733. DETAILED FUNCTIONAL TABLES
Table 33–1. BUDGET AUTHORITY BY FUNCTION, CATEGORY ANDPROGRAM—Continued
(In millions of dollars)
Source 1997Actual
Estimate
1998 1999 2000 2001 2002 2003
Other social services .................. 10 22 27 32 32 32 32
Total, Social services ....... 9,704 9,478 10,469 10,849 11,384 11,974 13,030
Total, Mandatory ........................ 15,556 13,877 16,164 15,033 15,969 16,033 18,430
Total, Education, training, em-ployment, and social serv-ices .............................................. 58,044 60,242 64,772 64,172 65,389 65,330 67,313
550 Health:Discretionary:
Health care services:Substance abuse and mental
health services ........................ 2,145 2,147 2,280 2,271 2,256 2,233 2,285Indian health .............................. 2,057 2,099 2,118 2,102 2,083 2,057 2,111Other discretionary health care
services programs 1 ................. 5,490 5,746 5,989 5,959 5,923 5,871 6,003
Total, Health care serv-ices ................................ 9,692 9,992 10,387 10,332 10,262 10,161 10,399
Health research and training:National Institutes of Health .... 12,751 13,648 14,798 15,661 16,632 17,997 20,188Clinical training ......................... 295 297 294 291 288 283 292Other health research and
training .................................... 308 306 290 292 292 292 301
Total, Health researchand training ................. 13,354 14,251 15,382 16,244 17,212 18,572 20,781
Consumer and occupationalhealth and safety:Food safety and inspection 1 ...... 574 589 150 47 42 42 42Occupational safety and health 536 553 580 580 580 580 580Other consumer health pro-
grams 1 ..................................... 930 970 1,016 1,073 1,125 1,124 1,155
Total, Consumer and oc-cupational health andsafety ............................. 2,040 2,112 1,746 1,700 1,747 1,746 1,777
Total, Discretionary ................... 25,086 26,355 27,515 28,276 29,221 30,479 32,957
Mandatory:Health care services:
Medicaid grants .......................... 101,212 99,591 102,395 114,935 123,529 132,707 143,247Proposed Legislation
(PAYGO) .............................. ................... ................... –210 –180 –130 –155 –165
Subtotal, Medicaid grants 101,212 99,591 102,185 114,755 123,399 132,552 143,082
State children’s health insur-ance fund ................................. ................... 4,235 4,215 4,215 4,215 3,090 3,150Proposed Legislation
(PAYGO) .............................. ................... ................... 34 34 34 25 25
Subtotal, State children’shealth insurance fund ..... ................... 4,235 4,249 4,249 4,249 3,115 3,175
Federal employees’ and retiredemployees’ health benefits ..... 3,067 4,035 4,614 4,988 5,352 5,727 6,143
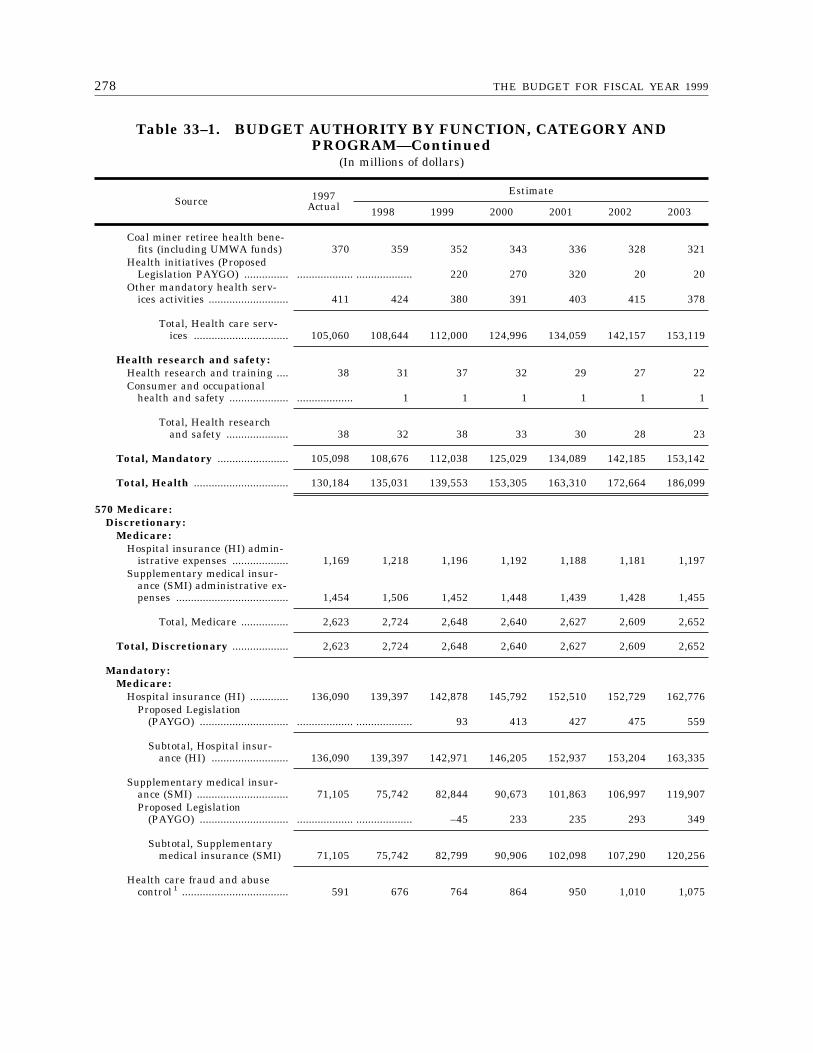
278 THE BUDGET FOR FISCAL YEAR 1999
Table 33–1. BUDGET AUTHORITY BY FUNCTION, CATEGORY ANDPROGRAM—Continued
(In millions of dollars)
Source 1997Actual
Estimate
1998 1999 2000 2001 2002 2003
Coal miner retiree health bene-fits (including UMWA funds) 370 359 352 343 336 328 321
Health initiatives (ProposedLegislation PAYGO) ............... ................... ................... 220 270 320 20 20
Other mandatory health serv-ices activities ........................... 411 424 380 391 403 415 378
Total, Health care serv-ices ................................ 105,060 108,644 112,000 124,996 134,059 142,157 153,119
Health research and safety:Health research and training .... 38 31 37 32 29 27 22Consumer and occupational
health and safety .................... ................... 1 1 1 1 1 1
Total, Health researchand safety ..................... 38 32 38 33 30 28 23
Total, Mandatory ........................ 105,098 108,676 112,038 125,029 134,089 142,185 153,142
Total, Health ................................ 130,184 135,031 139,553 153,305 163,310 172,664 186,099
570 Medicare:Discretionary:
Medicare:Hospital insurance (HI) admin-
istrative expenses ................... 1,169 1,218 1,196 1,192 1,188 1,181 1,197Supplementary medical insur-
ance (SMI) administrative ex-penses ...................................... 1,454 1,506 1,452 1,448 1,439 1,428 1,455
Total, Medicare ................ 2,623 2,724 2,648 2,640 2,627 2,609 2,652
Total, Discretionary ................... 2,623 2,724 2,648 2,640 2,627 2,609 2,652
Mandatory:Medicare:
Hospital insurance (HI) ............. 136,090 139,397 142,878 145,792 152,510 152,729 162,776Proposed Legislation
(PAYGO) .............................. ................... ................... 93 413 427 475 559
Subtotal, Hospital insur-ance (HI) .......................... 136,090 139,397 142,971 146,205 152,937 153,204 163,335
Supplementary medical insur-ance (SMI) ............................... 71,105 75,742 82,844 90,673 101,863 106,997 119,907Proposed Legislation
(PAYGO) .............................. ................... ................... –45 233 235 293 349
Subtotal, Supplementarymedical insurance (SMI) 71,105 75,742 82,799 90,906 102,098 107,290 120,256
Health care fraud and abusecontrol 1 .................................... 591 676 764 864 950 1,010 1,075
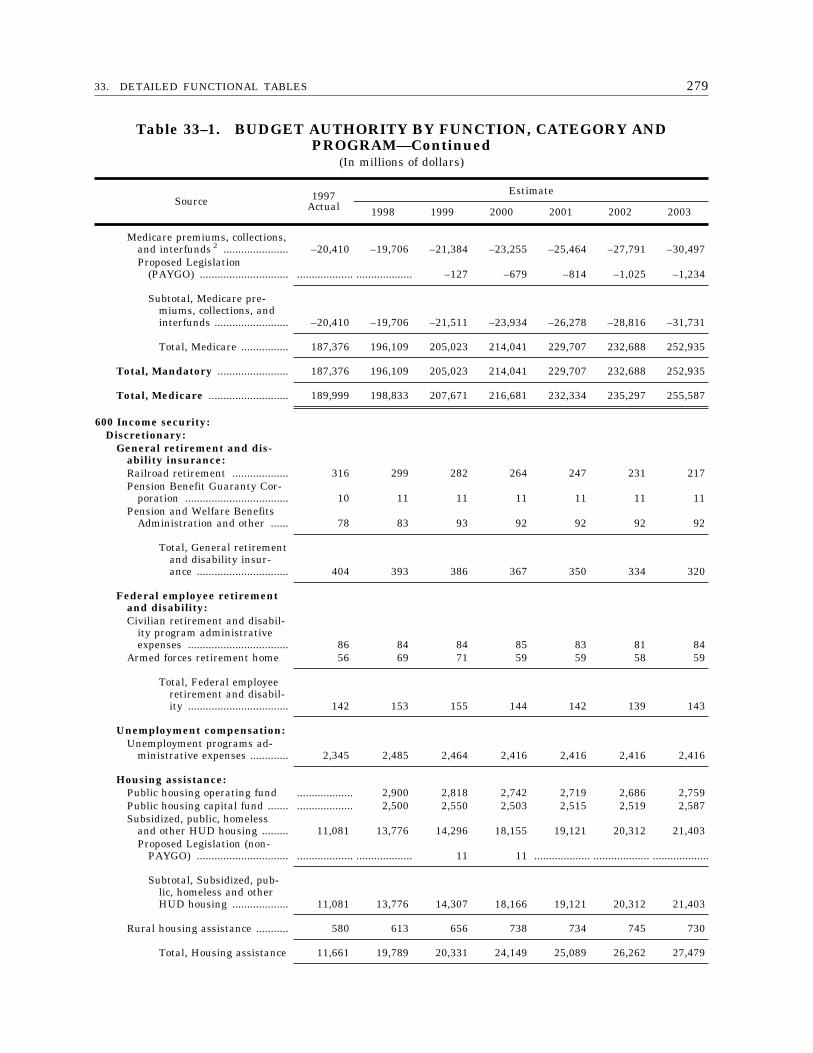
27933. DETAILED FUNCTIONAL TABLES
Table 33–1. BUDGET AUTHORITY BY FUNCTION, CATEGORY ANDPROGRAM—Continued
(In millions of dollars)
Source 1997Actual
Estimate
1998 1999 2000 2001 2002 2003
Medicare premiums, collections,and interfunds 2 ...................... –20,410 –19,706 –21,384 –23,255 –25,464 –27,791 –30,497Proposed Legislation
(PAYGO) .............................. ................... ................... –127 –679 –814 –1,025 –1,234
Subtotal, Medicare pre-miums, collections, andinterfunds ......................... –20,410 –19,706 –21,511 –23,934 –26,278 –28,816 –31,731
Total, Medicare ................ 187,376 196,109 205,023 214,041 229,707 232,688 252,935
Total, Mandatory ........................ 187,376 196,109 205,023 214,041 229,707 232,688 252,935
Total, Medicare ........................... 189,999 198,833 207,671 216,681 232,334 235,297 255,587
600 Income security:Discretionary:
General retirement and dis-ability insurance:Railroad retirement ................... 316 299 282 264 247 231 217Pension Benefit Guaranty Cor-
poration ................................... 10 11 11 11 11 11 11Pension and Welfare Benefits
Administration and other ...... 78 83 93 92 92 92 92
Total, General retirementand disability insur-ance ............................... 404 393 386 367 350 334 320
Federal employee retirementand disability:Civilian retirement and disabil-
ity program administrativeexpenses .................................. 86 84 84 85 83 81 84
Armed forces retirement home 56 69 71 59 59 58 59
Total, Federal employeeretirement and disabil-ity .................................. 142 153 155 144 142 139 143
Unemployment compensation:Unemployment programs ad-
ministrative expenses ............. 2,345 2,485 2,464 2,416 2,416 2,416 2,416
Housing assistance:Public housing operating fund ................... 2,900 2,818 2,742 2,719 2,686 2,759Public housing capital fund ....... ................... 2,500 2,550 2,503 2,515 2,519 2,587Subsidized, public, homeless
and other HUD housing ......... 11,081 13,776 14,296 18,155 19,121 20,312 21,403Proposed Legislation (non-
PAYGO) ............................... ................... ................... 11 11 ................... ................... ...................
Subtotal, Subsidized, pub-lic, homeless and otherHUD housing ................... 11,081 13,776 14,307 18,166 19,121 20,312 21,403
Rural housing assistance ........... 580 613 656 738 734 745 730
Total, Housing assistance 11,661 19,789 20,331 24,149 25,089 26,262 27,479
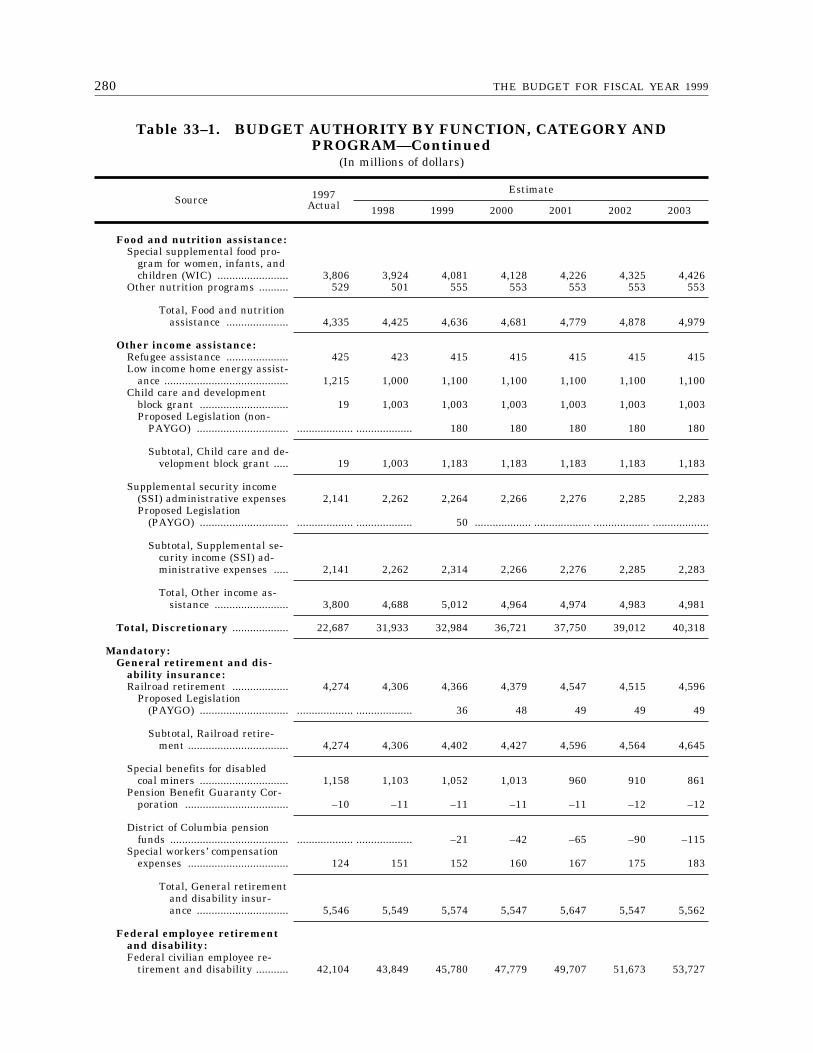
280 THE BUDGET FOR FISCAL YEAR 1999
Table 33–1. BUDGET AUTHORITY BY FUNCTION, CATEGORY ANDPROGRAM—Continued
(In millions of dollars)
Source 1997Actual
Estimate
1998 1999 2000 2001 2002 2003
Food and nutrition assistance:Special supplemental food pro-
gram for women, infants, andchildren (WIC) ........................ 3,806 3,924 4,081 4,128 4,226 4,325 4,426
Other nutrition programs .......... 529 501 555 553 553 553 553
Total, Food and nutritionassistance ..................... 4,335 4,425 4,636 4,681 4,779 4,878 4,979
Other income assistance:Refugee assistance ..................... 425 423 415 415 415 415 415Low income home energy assist-
ance .......................................... 1,215 1,000 1,100 1,100 1,100 1,100 1,100Child care and development
block grant .............................. 19 1,003 1,003 1,003 1,003 1,003 1,003Proposed Legislation (non-
PAYGO) ............................... ................... ................... 180 180 180 180 180
Subtotal, Child care and de-velopment block grant ..... 19 1,003 1,183 1,183 1,183 1,183 1,183
Supplemental security income(SSI) administrative expenses 2,141 2,262 2,264 2,266 2,276 2,285 2,283Proposed Legislation
(PAYGO) .............................. ................... ................... 50 ................... ................... ................... ...................
Subtotal, Supplemental se-curity income (SSI) ad-ministrative expenses ..... 2,141 2,262 2,314 2,266 2,276 2,285 2,283
Total, Other income as-sistance ......................... 3,800 4,688 5,012 4,964 4,974 4,983 4,981
Total, Discretionary ................... 22,687 31,933 32,984 36,721 37,750 39,012 40,318
Mandatory:General retirement and dis-
ability insurance:Railroad retirement ................... 4,274 4,306 4,366 4,379 4,547 4,515 4,596
Proposed Legislation(PAYGO) .............................. ................... ................... 36 48 49 49 49
Subtotal, Railroad retire-ment .................................. 4,274 4,306 4,402 4,427 4,596 4,564 4,645
Special benefits for disabledcoal miners .............................. 1,158 1,103 1,052 1,013 960 910 861
Pension Benefit Guaranty Cor-poration ................................... –10 –11 –11 –11 –11 –12 –12
District of Columbia pensionfunds ........................................ ................... ................... –21 –42 –65 –90 –115
Special workers’ compensationexpenses .................................. 124 151 152 160 167 175 183
Total, General retirementand disability insur-ance ............................... 5,546 5,549 5,574 5,547 5,647 5,547 5,562
Federal employee retirementand disability:Federal civilian employee re-
tirement and disability ........... 42,104 43,849 45,780 47,779 49,707 51,673 53,727
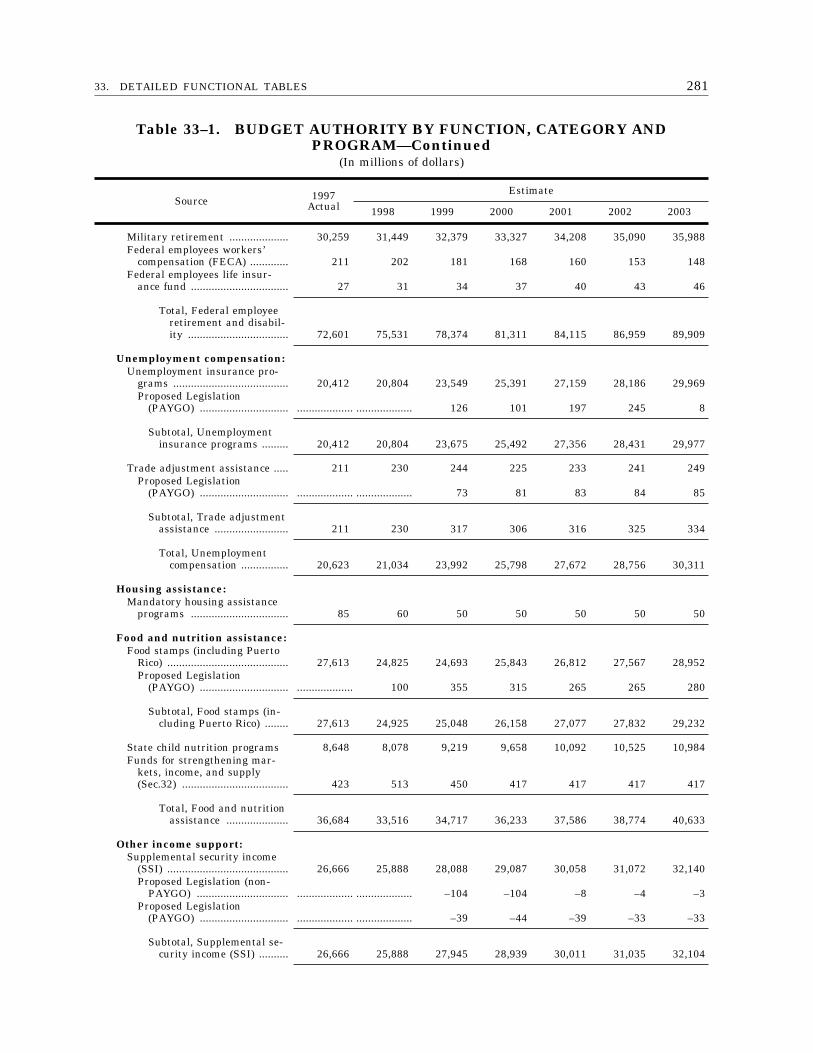
28133. DETAILED FUNCTIONAL TABLES
Table 33–1. BUDGET AUTHORITY BY FUNCTION, CATEGORY ANDPROGRAM—Continued
(In millions of dollars)
Source 1997Actual
Estimate
1998 1999 2000 2001 2002 2003
Military retirement .................... 30,259 31,449 32,379 33,327 34,208 35,090 35,988Federal employees workers’
compensation (FECA) ............. 211 202 181 168 160 153 148Federal employees life insur-
ance fund ................................. 27 31 34 37 40 43 46
Total, Federal employeeretirement and disabil-ity .................................. 72,601 75,531 78,374 81,311 84,115 86,959 89,909
Unemployment compensation:Unemployment insurance pro-
grams ....................................... 20,412 20,804 23,549 25,391 27,159 28,186 29,969Proposed Legislation
(PAYGO) .............................. ................... ................... 126 101 197 245 8
Subtotal, Unemploymentinsurance programs ......... 20,412 20,804 23,675 25,492 27,356 28,431 29,977
Trade adjustment assistance ..... 211 230 244 225 233 241 249Proposed Legislation
(PAYGO) .............................. ................... ................... 73 81 83 84 85
Subtotal, Trade adjustmentassistance ......................... 211 230 317 306 316 325 334
Total, Unemploymentcompensation ................ 20,623 21,034 23,992 25,798 27,672 28,756 30,311
Housing assistance:Mandatory housing assistance
programs ................................. 85 60 50 50 50 50 50
Food and nutrition assistance:Food stamps (including Puerto
Rico) ......................................... 27,613 24,825 24,693 25,843 26,812 27,567 28,952Proposed Legislation
(PAYGO) .............................. ................... 100 355 315 265 265 280
Subtotal, Food stamps (in-cluding Puerto Rico) ........ 27,613 24,925 25,048 26,158 27,077 27,832 29,232
State child nutrition programs 8,648 8,078 9,219 9,658 10,092 10,525 10,984Funds for strengthening mar-
kets, income, and supply(Sec.32) .................................... 423 513 450 417 417 417 417
Total, Food and nutritionassistance ..................... 36,684 33,516 34,717 36,233 37,586 38,774 40,633
Other income support:Supplemental security income
(SSI) ......................................... 26,666 25,888 28,088 29,087 30,058 31,072 32,140Proposed Legislation (non-
PAYGO) ............................... ................... ................... –104 –104 –8 –4 –3Proposed Legislation
(PAYGO) .............................. ................... ................... –39 –44 –39 –33 –33
Subtotal, Supplemental se-curity income (SSI) .......... 26,666 25,888 27,945 28,939 30,011 31,035 32,104
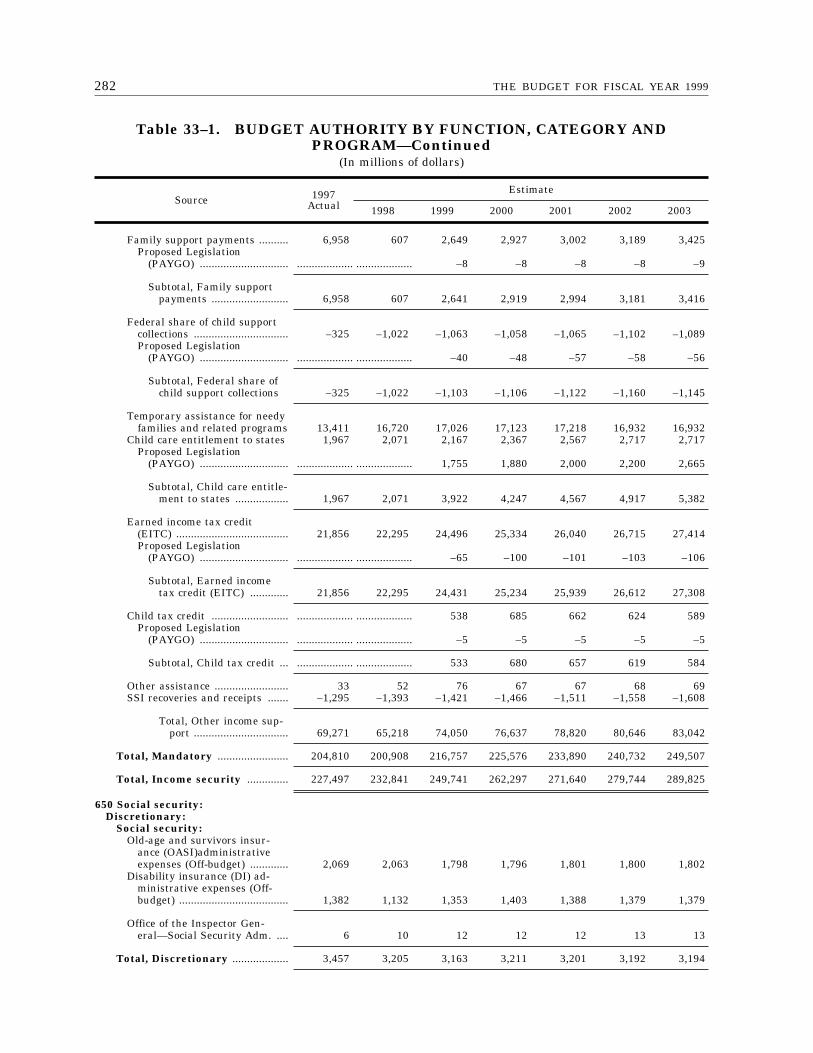
282 THE BUDGET FOR FISCAL YEAR 1999
Table 33–1. BUDGET AUTHORITY BY FUNCTION, CATEGORY ANDPROGRAM—Continued
(In millions of dollars)
Source 1997Actual
Estimate
1998 1999 2000 2001 2002 2003
Family support payments .......... 6,958 607 2,649 2,927 3,002 3,189 3,425Proposed Legislation
(PAYGO) .............................. ................... ................... –8 –8 –8 –8 –9
Subtotal, Family supportpayments .......................... 6,958 607 2,641 2,919 2,994 3,181 3,416
Federal share of child supportcollections ................................ –325 –1,022 –1,063 –1,058 –1,065 –1,102 –1,089Proposed Legislation
(PAYGO) .............................. ................... ................... –40 –48 –57 –58 –56
Subtotal, Federal share ofchild support collections –325 –1,022 –1,103 –1,106 –1,122 –1,160 –1,145
Temporary assistance for needyfamilies and related programs 13,411 16,720 17,026 17,123 17,218 16,932 16,932
Child care entitlement to states 1,967 2,071 2,167 2,367 2,567 2,717 2,717Proposed Legislation
(PAYGO) .............................. ................... ................... 1,755 1,880 2,000 2,200 2,665
Subtotal, Child care entitle-ment to states .................. 1,967 2,071 3,922 4,247 4,567 4,917 5,382
Earned income tax credit(EITC) ...................................... 21,856 22,295 24,496 25,334 26,040 26,715 27,414Proposed Legislation
(PAYGO) .............................. ................... ................... –65 –100 –101 –103 –106
Subtotal, Earned incometax credit (EITC) ............. 21,856 22,295 24,431 25,234 25,939 26,612 27,308
Child tax credit .......................... ................... ................... 538 685 662 624 589Proposed Legislation
(PAYGO) .............................. ................... ................... –5 –5 –5 –5 –5
Subtotal, Child tax credit ... ................... ................... 533 680 657 619 584
Other assistance ......................... 33 52 76 67 67 68 69SSI recoveries and receipts ....... –1,295 –1,393 –1,421 –1,466 –1,511 –1,558 –1,608
Total, Other income sup-port ................................ 69,271 65,218 74,050 76,637 78,820 80,646 83,042
Total, Mandatory ........................ 204,810 200,908 216,757 225,576 233,890 240,732 249,507
Total, Income security .............. 227,497 232,841 249,741 262,297 271,640 279,744 289,825
650 Social security:Discretionary:
Social security:Old-age and survivors insur-
ance (OASI)administrativeexpenses (Off-budget) ............. 2,069 2,063 1,798 1,796 1,801 1,800 1,802
Disability insurance (DI) ad-ministrative expenses (Off-budget) ..................................... 1,382 1,132 1,353 1,403 1,388 1,379 1,379
Office of the Inspector Gen-eral—Social Security Adm. .... 6 10 12 12 12 13 13
Total, Discretionary ................... 3,457 3,205 3,163 3,211 3,201 3,192 3,194
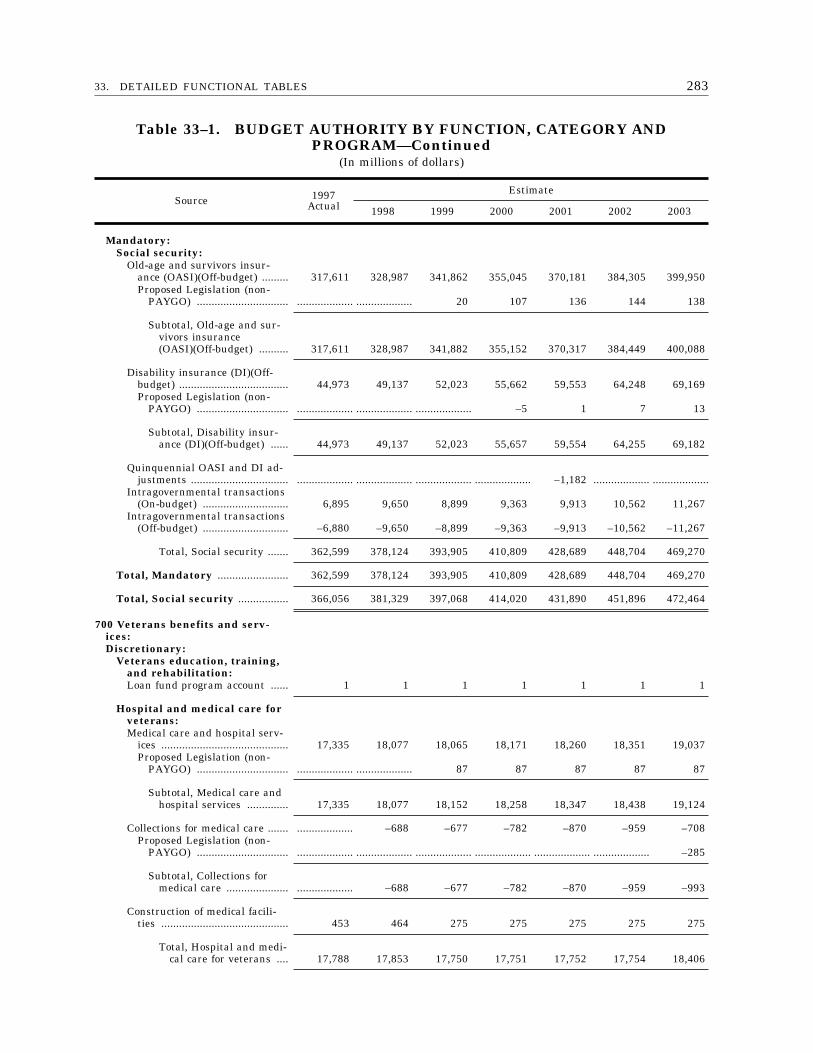
28333. DETAILED FUNCTIONAL TABLES
Table 33–1. BUDGET AUTHORITY BY FUNCTION, CATEGORY ANDPROGRAM—Continued
(In millions of dollars)
Source 1997Actual
Estimate
1998 1999 2000 2001 2002 2003
Mandatory:Social security:
Old-age and survivors insur-ance (OASI)(Off-budget) ......... 317,611 328,987 341,862 355,045 370,181 384,305 399,950Proposed Legislation (non-
PAYGO) ............................... ................... ................... 20 107 136 144 138
Subtotal, Old-age and sur-vivors insurance(OASI)(Off-budget) .......... 317,611 328,987 341,882 355,152 370,317 384,449 400,088
Disability insurance (DI)(Off-budget) ..................................... 44,973 49,137 52,023 55,662 59,553 64,248 69,169Proposed Legislation (non-
PAYGO) ............................... ................... ................... ................... –5 1 7 13
Subtotal, Disability insur-ance (DI)(Off-budget) ...... 44,973 49,137 52,023 55,657 59,554 64,255 69,182
Quinquennial OASI and DI ad-justments ................................. ................... ................... ................... ................... –1,182 ................... ...................
Intragovernmental transactions(On-budget) ............................. 6,895 9,650 8,899 9,363 9,913 10,562 11,267
Intragovernmental transactions(Off-budget) ............................. –6,880 –9,650 –8,899 –9,363 –9,913 –10,562 –11,267
Total, Social security ....... 362,599 378,124 393,905 410,809 428,689 448,704 469,270
Total, Mandatory ........................ 362,599 378,124 393,905 410,809 428,689 448,704 469,270
Total, Social security ................. 366,056 381,329 397,068 414,020 431,890 451,896 472,464
700 Veterans benefits and serv-ices:Discretionary:
Veterans education, training,and rehabilitation:Loan fund program account ...... 1 1 1 1 1 1 1
Hospital and medical care forveterans:Medical care and hospital serv-
ices ........................................... 17,335 18,077 18,065 18,171 18,260 18,351 19,037Proposed Legislation (non-
PAYGO) ............................... ................... ................... 87 87 87 87 87
Subtotal, Medical care andhospital services .............. 17,335 18,077 18,152 18,258 18,347 18,438 19,124
Collections for medical care ....... ................... –688 –677 –782 –870 –959 –708Proposed Legislation (non-
PAYGO) ............................... ................... ................... ................... ................... ................... ................... –285
Subtotal, Collections formedical care ..................... ................... –688 –677 –782 –870 –959 –993
Construction of medical facili-ties ........................................... 453 464 275 275 275 275 275
Total, Hospital and medi-cal care for veterans .... 17,788 17,853 17,750 17,751 17,752 17,754 18,406
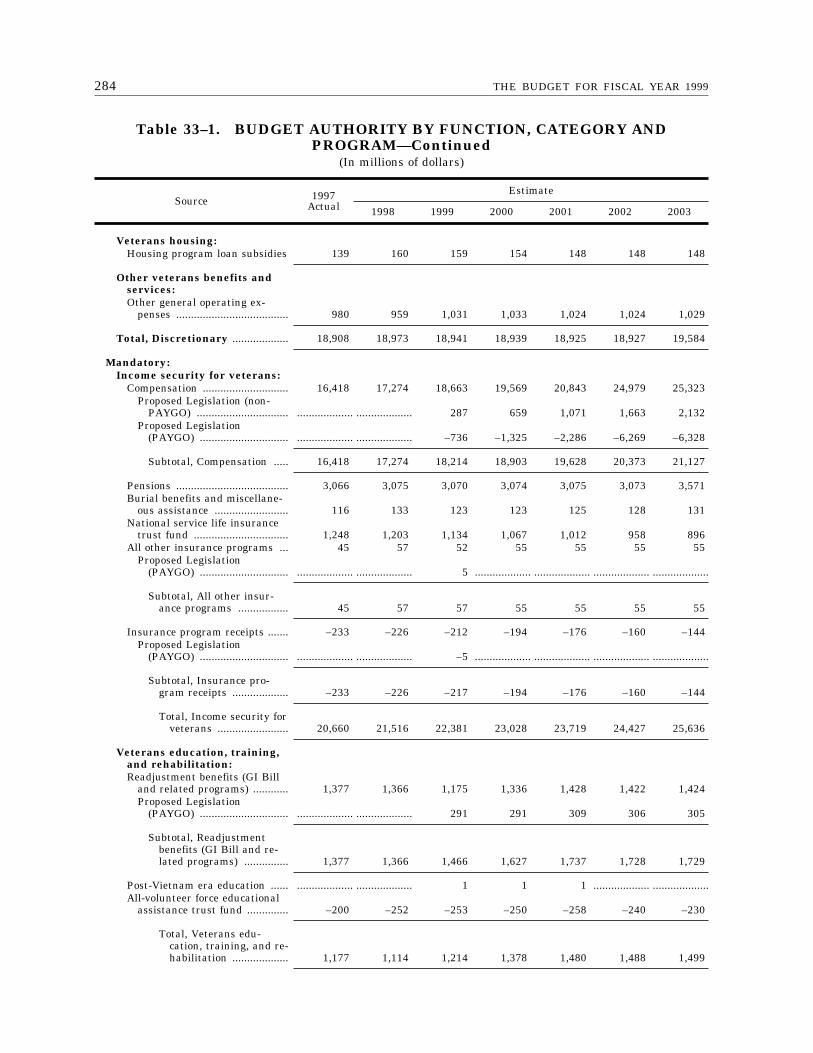
284 THE BUDGET FOR FISCAL YEAR 1999
Table 33–1. BUDGET AUTHORITY BY FUNCTION, CATEGORY ANDPROGRAM—Continued
(In millions of dollars)
Source 1997Actual
Estimate
1998 1999 2000 2001 2002 2003
Veterans housing:Housing program loan subsidies 139 160 159 154 148 148 148
Other veterans benefits andservices:Other general operating ex-
penses ...................................... 980 959 1,031 1,033 1,024 1,024 1,029
Total, Discretionary ................... 18,908 18,973 18,941 18,939 18,925 18,927 19,584
Mandatory:Income security for veterans:
Compensation ............................. 16,418 17,274 18,663 19,569 20,843 24,979 25,323Proposed Legislation (non-
PAYGO) ............................... ................... ................... 287 659 1,071 1,663 2,132Proposed Legislation
(PAYGO) .............................. ................... ................... –736 –1,325 –2,286 –6,269 –6,328
Subtotal, Compensation ..... 16,418 17,274 18,214 18,903 19,628 20,373 21,127
Pensions ...................................... 3,066 3,075 3,070 3,074 3,075 3,073 3,571Burial benefits and miscellane-
ous assistance ......................... 116 133 123 123 125 128 131National service life insurance
trust fund ................................ 1,248 1,203 1,134 1,067 1,012 958 896All other insurance programs ... 45 57 52 55 55 55 55
Proposed Legislation(PAYGO) .............................. ................... ................... 5 ................... ................... ................... ...................
Subtotal, All other insur-ance programs ................. 45 57 57 55 55 55 55
Insurance program receipts ....... –233 –226 –212 –194 –176 –160 –144Proposed Legislation
(PAYGO) .............................. ................... ................... –5 ................... ................... ................... ...................
Subtotal, Insurance pro-gram receipts ................... –233 –226 –217 –194 –176 –160 –144
Total, Income security forveterans ........................ 20,660 21,516 22,381 23,028 23,719 24,427 25,636
Veterans education, training,and rehabilitation:Readjustment benefits (GI Bill
and related programs) ............ 1,377 1,366 1,175 1,336 1,428 1,422 1,424Proposed Legislation
(PAYGO) .............................. ................... ................... 291 291 309 306 305
Subtotal, Readjustmentbenefits (GI Bill and re-lated programs) ............... 1,377 1,366 1,466 1,627 1,737 1,728 1,729
Post-Vietnam era education ...... ................... ................... 1 1 1 ................... ...................All-volunteer force educational
assistance trust fund .............. –200 –252 –253 –250 –258 –240 –230
Total, Veterans edu-cation, training, and re-habilitation ................... 1,177 1,114 1,214 1,378 1,480 1,488 1,499
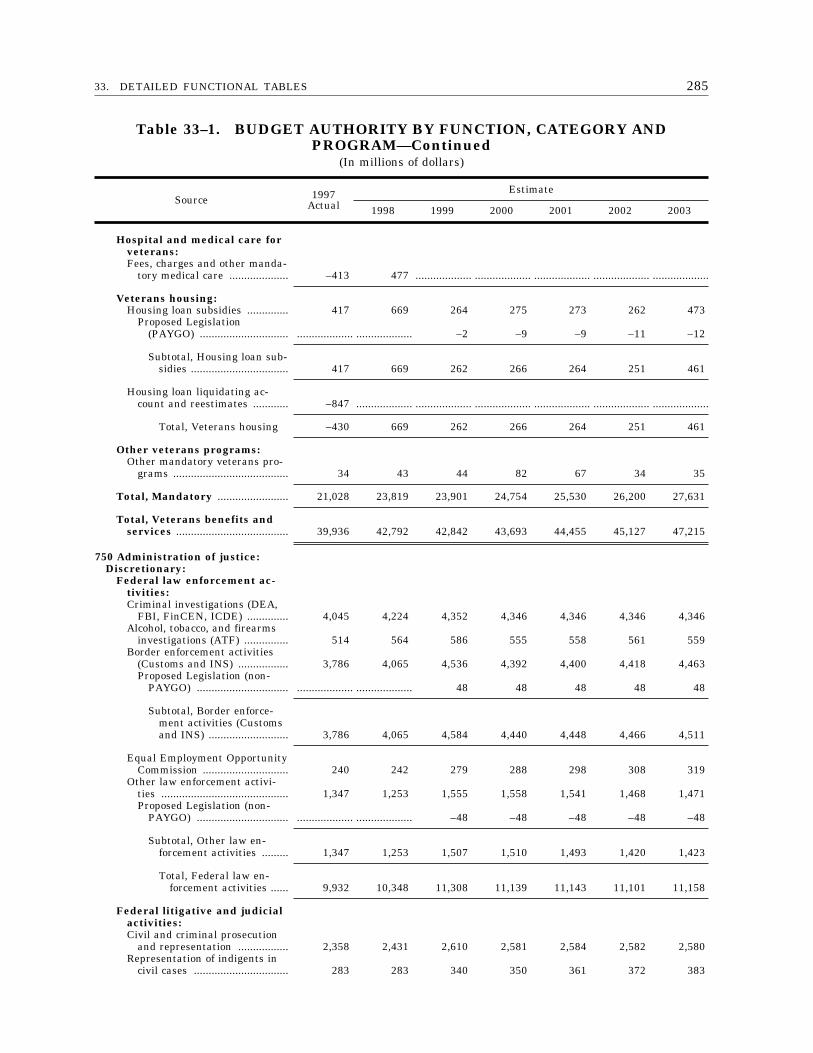
28533. DETAILED FUNCTIONAL TABLES
Table 33–1. BUDGET AUTHORITY BY FUNCTION, CATEGORY ANDPROGRAM—Continued
(In millions of dollars)
Source 1997Actual
Estimate
1998 1999 2000 2001 2002 2003
Hospital and medical care forveterans:Fees, charges and other manda-
tory medical care .................... –413 477 ................... ................... ................... ................... ...................
Veterans housing:Housing loan subsidies .............. 417 669 264 275 273 262 473
Proposed Legislation(PAYGO) .............................. ................... ................... –2 –9 –9 –11 –12
Subtotal, Housing loan sub-sidies ................................. 417 669 262 266 264 251 461
Housing loan liquidating ac-count and reestimates ............ –847 ................... ................... ................... ................... ................... ...................
Total, Veterans housing –430 669 262 266 264 251 461
Other veterans programs:Other mandatory veterans pro-
grams ....................................... 34 43 44 82 67 34 35
Total, Mandatory ........................ 21,028 23,819 23,901 24,754 25,530 26,200 27,631
Total, Veterans benefits andservices ...................................... 39,936 42,792 42,842 43,693 44,455 45,127 47,215
750 Administration of justice:Discretionary:
Federal law enforcement ac-tivities:Criminal investigations (DEA,
FBI, FinCEN, ICDE) .............. 4,045 4,224 4,352 4,346 4,346 4,346 4,346Alcohol, tobacco, and firearms
investigations (ATF) ............... 514 564 586 555 558 561 559Border enforcement activities
(Customs and INS) ................. 3,786 4,065 4,536 4,392 4,400 4,418 4,463Proposed Legislation (non-
PAYGO) ............................... ................... ................... 48 48 48 48 48
Subtotal, Border enforce-ment activities (Customsand INS) ........................... 3,786 4,065 4,584 4,440 4,448 4,466 4,511
Equal Employment OpportunityCommission ............................. 240 242 279 288 298 308 319
Other law enforcement activi-ties ........................................... 1,347 1,253 1,555 1,558 1,541 1,468 1,471Proposed Legislation (non-
PAYGO) ............................... ................... ................... –48 –48 –48 –48 –48
Subtotal, Other law en-forcement activities ......... 1,347 1,253 1,507 1,510 1,493 1,420 1,423
Total, Federal law en-forcement activities ...... 9,932 10,348 11,308 11,139 11,143 11,101 11,158
Federal litigative and judicialactivities:Civil and criminal prosecution
and representation ................. 2,358 2,431 2,610 2,581 2,584 2,582 2,580Representation of indigents in
civil cases ................................ 283 283 340 350 361 372 383
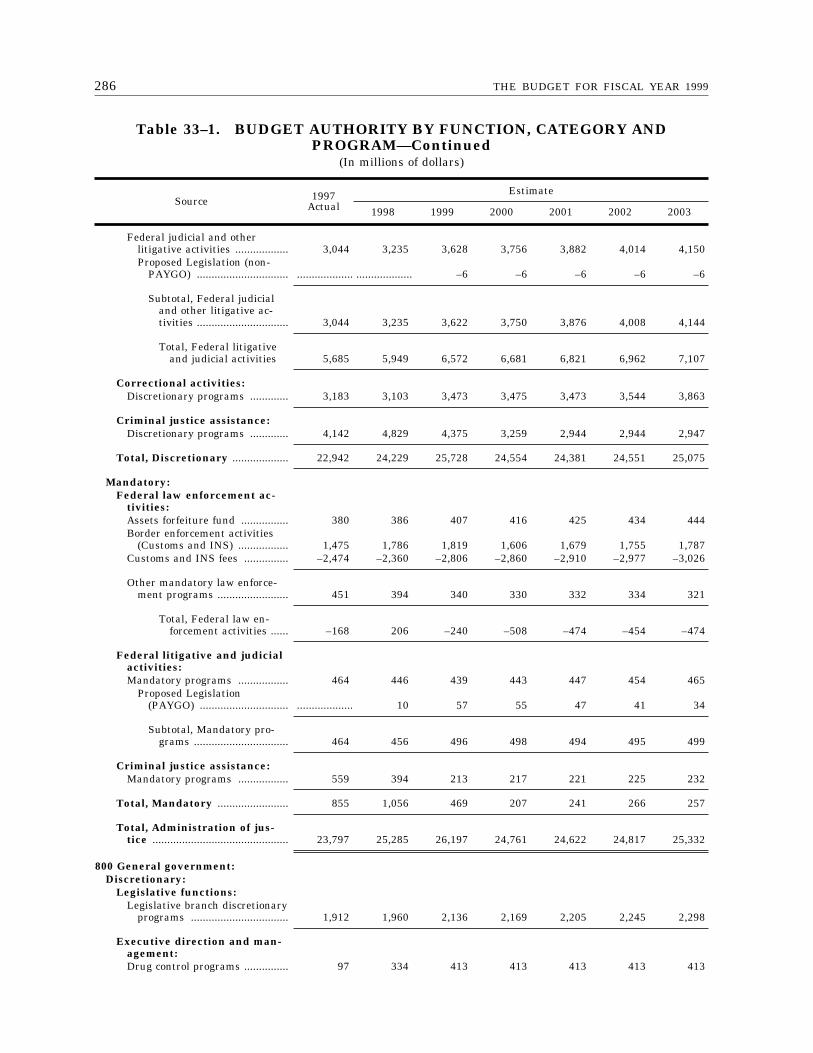
286 THE BUDGET FOR FISCAL YEAR 1999
Table 33–1. BUDGET AUTHORITY BY FUNCTION, CATEGORY ANDPROGRAM—Continued
(In millions of dollars)
Source 1997Actual
Estimate
1998 1999 2000 2001 2002 2003
Federal judicial and otherlitigative activities .................. 3,044 3,235 3,628 3,756 3,882 4,014 4,150Proposed Legislation (non-
PAYGO) ............................... ................... ................... –6 –6 –6 –6 –6
Subtotal, Federal judicialand other litigative ac-tivities ............................... 3,044 3,235 3,622 3,750 3,876 4,008 4,144
Total, Federal litigativeand judicial activities 5,685 5,949 6,572 6,681 6,821 6,962 7,107
Correctional activities:Discretionary programs ............. 3,183 3,103 3,473 3,475 3,473 3,544 3,863
Criminal justice assistance:Discretionary programs ............. 4,142 4,829 4,375 3,259 2,944 2,944 2,947
Total, Discretionary ................... 22,942 24,229 25,728 24,554 24,381 24,551 25,075
Mandatory:Federal law enforcement ac-
tivities:Assets forfeiture fund ................ 380 386 407 416 425 434 444Border enforcement activities
(Customs and INS) ................. 1,475 1,786 1,819 1,606 1,679 1,755 1,787Customs and INS fees ............... –2,474 –2,360 –2,806 –2,860 –2,910 –2,977 –3,026
Other mandatory law enforce-ment programs ........................ 451 394 340 330 332 334 321
Total, Federal law en-forcement activities ...... –168 206 –240 –508 –474 –454 –474
Federal litigative and judicialactivities:Mandatory programs ................. 464 446 439 443 447 454 465
Proposed Legislation(PAYGO) .............................. ................... 10 57 55 47 41 34
Subtotal, Mandatory pro-grams ................................ 464 456 496 498 494 495 499
Criminal justice assistance:Mandatory programs ................. 559 394 213 217 221 225 232
Total, Mandatory ........................ 855 1,056 469 207 241 266 257
Total, Administration of jus-tice .............................................. 23,797 25,285 26,197 24,761 24,622 24,817 25,332
800 General government:Discretionary:
Legislative functions:Legislative branch discretionary
programs ................................. 1,912 1,960 2,136 2,169 2,205 2,245 2,298
Executive direction and man-agement:Drug control programs ............... 97 334 413 413 413 413 413
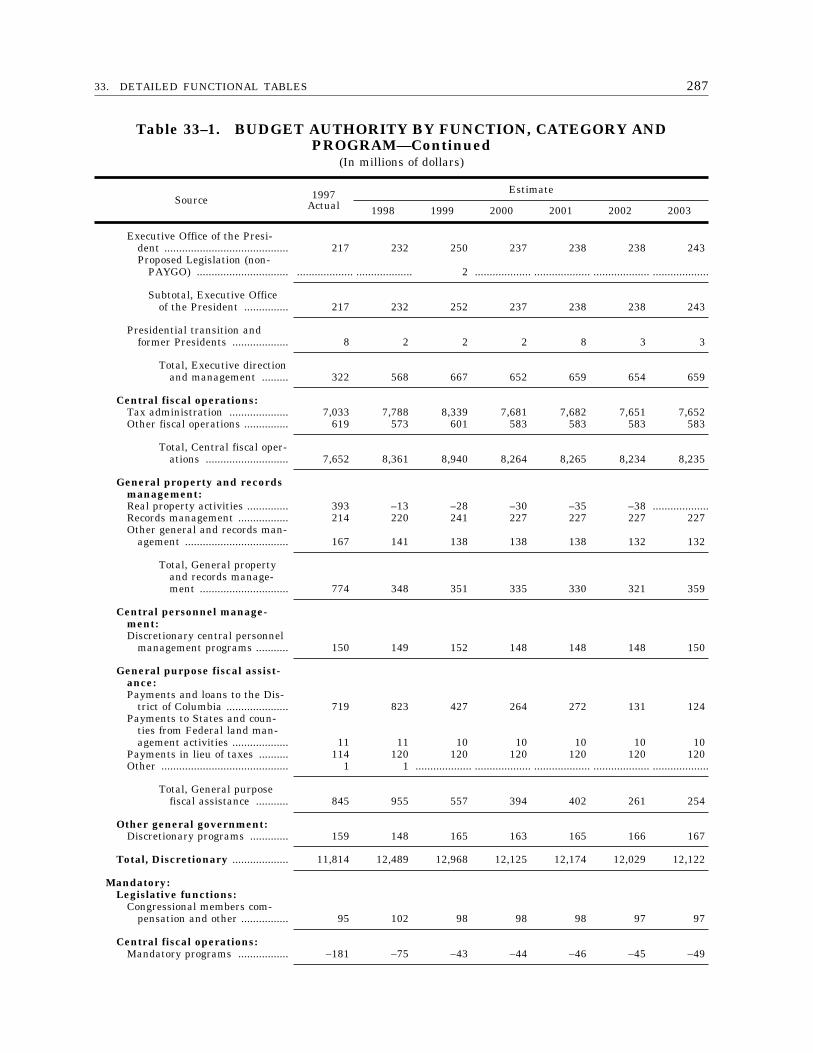
28733. DETAILED FUNCTIONAL TABLES
Table 33–1. BUDGET AUTHORITY BY FUNCTION, CATEGORY ANDPROGRAM—Continued
(In millions of dollars)
Source 1997Actual
Estimate
1998 1999 2000 2001 2002 2003
Executive Office of the Presi-dent .......................................... 217 232 250 237 238 238 243Proposed Legislation (non-
PAYGO) ............................... ................... ................... 2 ................... ................... ................... ...................
Subtotal, Executive Officeof the President ............... 217 232 252 237 238 238 243
Presidential transition andformer Presidents ................... 8 2 2 2 8 3 3
Total, Executive directionand management ......... 322 568 667 652 659 654 659
Central fiscal operations:Tax administration .................... 7,033 7,788 8,339 7,681 7,682 7,651 7,652Other fiscal operations ............... 619 573 601 583 583 583 583
Total, Central fiscal oper-ations ............................ 7,652 8,361 8,940 8,264 8,265 8,234 8,235
General property and recordsmanagement:Real property activities .............. 393 –13 –28 –30 –35 –38 ...................Records management ................. 214 220 241 227 227 227 227Other general and records man-
agement ................................... 167 141 138 138 138 132 132
Total, General propertyand records manage-ment .............................. 774 348 351 335 330 321 359
Central personnel manage-ment:Discretionary central personnel
management programs ........... 150 149 152 148 148 148 150
General purpose fiscal assist-ance:Payments and loans to the Dis-
trict of Columbia ..................... 719 823 427 264 272 131 124Payments to States and coun-
ties from Federal land man-agement activities ................... 11 11 10 10 10 10 10
Payments in lieu of taxes .......... 114 120 120 120 120 120 120Other ........................................... 1 1 ................... ................... ................... ................... ...................
Total, General purposefiscal assistance ........... 845 955 557 394 402 261 254
Other general government:Discretionary programs ............. 159 148 165 163 165 166 167
Total, Discretionary ................... 11,814 12,489 12,968 12,125 12,174 12,029 12,122
Mandatory:Legislative functions:
Congressional members com-pensation and other ................ 95 102 98 98 98 97 97
Central fiscal operations:Mandatory programs ................. –181 –75 –43 –44 –46 –45 –49
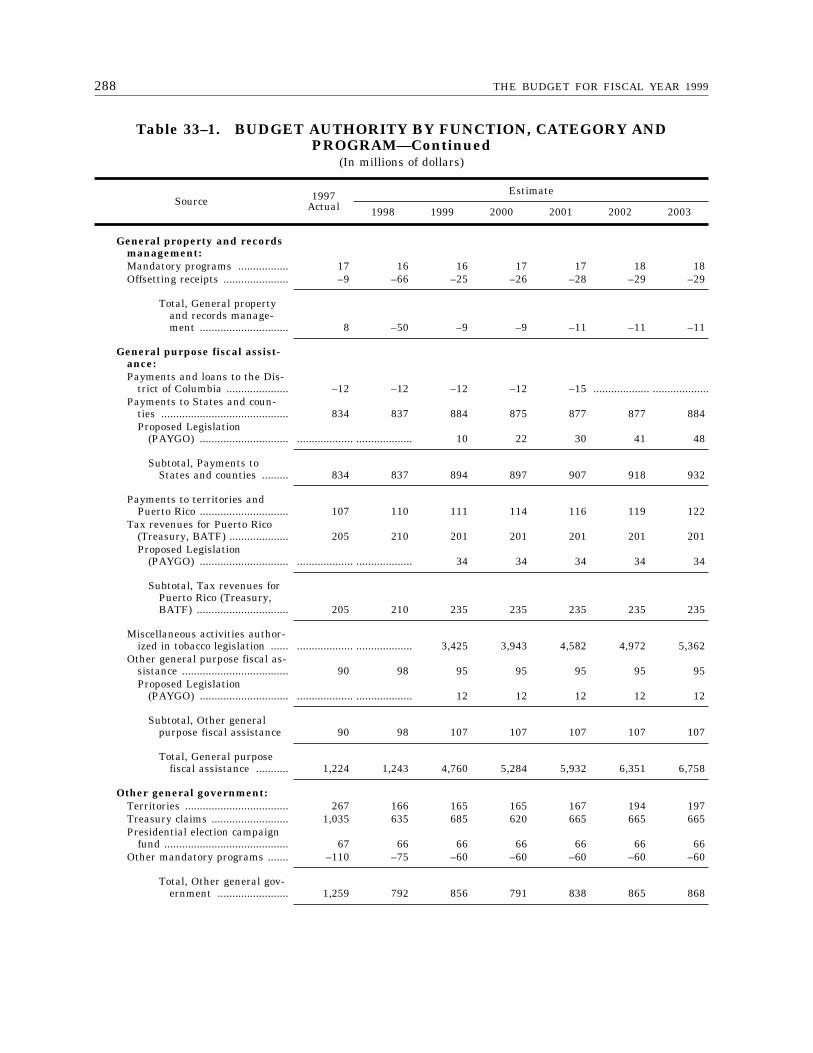
288 THE BUDGET FOR FISCAL YEAR 1999
Table 33–1. BUDGET AUTHORITY BY FUNCTION, CATEGORY ANDPROGRAM—Continued
(In millions of dollars)
Source 1997Actual
Estimate
1998 1999 2000 2001 2002 2003
General property and recordsmanagement:Mandatory programs ................. 17 16 16 17 17 18 18Offsetting receipts ...................... –9 –66 –25 –26 –28 –29 –29
Total, General propertyand records manage-ment .............................. 8 –50 –9 –9 –11 –11 –11
General purpose fiscal assist-ance:Payments and loans to the Dis-
trict of Columbia ..................... –12 –12 –12 –12 –15 ................... ...................Payments to States and coun-
ties ........................................... 834 837 884 875 877 877 884Proposed Legislation
(PAYGO) .............................. ................... ................... 10 22 30 41 48
Subtotal, Payments toStates and counties ......... 834 837 894 897 907 918 932
Payments to territories andPuerto Rico .............................. 107 110 111 114 116 119 122
Tax revenues for Puerto Rico(Treasury, BATF) .................... 205 210 201 201 201 201 201Proposed Legislation
(PAYGO) .............................. ................... ................... 34 34 34 34 34
Subtotal, Tax revenues forPuerto Rico (Treasury,BATF) ............................... 205 210 235 235 235 235 235
Miscellaneous activities author-ized in tobacco legislation ...... ................... ................... 3,425 3,943 4,582 4,972 5,362
Other general purpose fiscal as-sistance .................................... 90 98 95 95 95 95 95Proposed Legislation
(PAYGO) .............................. ................... ................... 12 12 12 12 12
Subtotal, Other generalpurpose fiscal assistance 90 98 107 107 107 107 107
Total, General purposefiscal assistance ........... 1,224 1,243 4,760 5,284 5,932 6,351 6,758
Other general government:Territories ................................... 267 166 165 165 167 194 197Treasury claims .......................... 1,035 635 685 620 665 665 665Presidential election campaign
fund .......................................... 67 66 66 66 66 66 66Other mandatory programs ....... –110 –75 –60 –60 –60 –60 –60
Total, Other general gov-ernment ........................ 1,259 792 856 791 838 865 868
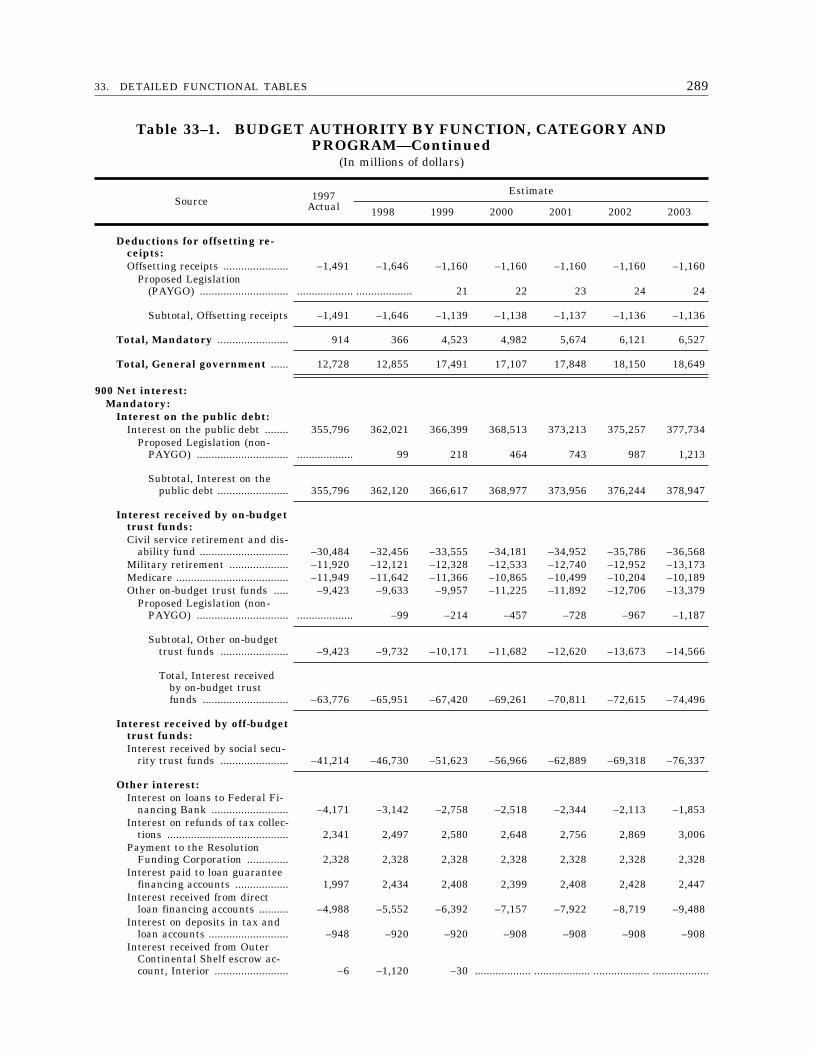
28933. DETAILED FUNCTIONAL TABLES
Table 33–1. BUDGET AUTHORITY BY FUNCTION, CATEGORY ANDPROGRAM—Continued
(In millions of dollars)
Source 1997Actual
Estimate
1998 1999 2000 2001 2002 2003
Deductions for offsetting re-ceipts:Offsetting receipts ...................... –1,491 –1,646 –1,160 –1,160 –1,160 –1,160 –1,160
Proposed Legislation(PAYGO) .............................. ................... ................... 21 22 23 24 24
Subtotal, Offsetting receipts –1,491 –1,646 –1,139 –1,138 –1,137 –1,136 –1,136
Total, Mandatory ........................ 914 366 4,523 4,982 5,674 6,121 6,527
Total, General government ...... 12,728 12,855 17,491 17,107 17,848 18,150 18,649
900 Net interest:Mandatory:
Interest on the public debt:Interest on the public debt ........ 355,796 362,021 366,399 368,513 373,213 375,257 377,734
Proposed Legislation (non-PAYGO) ............................... ................... 99 218 464 743 987 1,213
Subtotal, Interest on thepublic debt ........................ 355,796 362,120 366,617 368,977 373,956 376,244 378,947
Interest received by on-budgettrust funds:Civil service retirement and dis-
ability fund .............................. –30,484 –32,456 –33,555 –34,181 –34,952 –35,786 –36,568Military retirement .................... –11,920 –12,121 –12,328 –12,533 –12,740 –12,952 –13,173Medicare ...................................... –11,949 –11,642 –11,366 –10,865 –10,499 –10,204 –10,189Other on-budget trust funds ..... –9,423 –9,633 –9,957 –11,225 –11,892 –12,706 –13,379
Proposed Legislation (non-PAYGO) ............................... ................... –99 –214 –457 –728 –967 –1,187
Subtotal, Other on-budgettrust funds ....................... –9,423 –9,732 –10,171 –11,682 –12,620 –13,673 –14,566
Total, Interest receivedby on-budget trustfunds ............................. –63,776 –65,951 –67,420 –69,261 –70,811 –72,615 –74,496
Interest received by off-budgettrust funds:Interest received by social secu-
rity trust funds ....................... –41,214 –46,730 –51,623 –56,966 –62,889 –69,318 –76,337
Other interest:Interest on loans to Federal Fi-
nancing Bank .......................... –4,171 –3,142 –2,758 –2,518 –2,344 –2,113 –1,853Interest on refunds of tax collec-
tions ......................................... 2,341 2,497 2,580 2,648 2,756 2,869 3,006Payment to the Resolution
Funding Corporation .............. 2,328 2,328 2,328 2,328 2,328 2,328 2,328Interest paid to loan guarantee
financing accounts .................. 1,997 2,434 2,408 2,399 2,408 2,428 2,447Interest received from direct
loan financing accounts .......... –4,988 –5,552 –6,392 –7,157 –7,922 –8,719 –9,488Interest on deposits in tax and
loan accounts ........................... –948 –920 –920 –908 –908 –908 –908Interest received from Outer
Continental Shelf escrow ac-count, Interior ......................... –6 –1,120 –30 ................... ................... ................... ...................
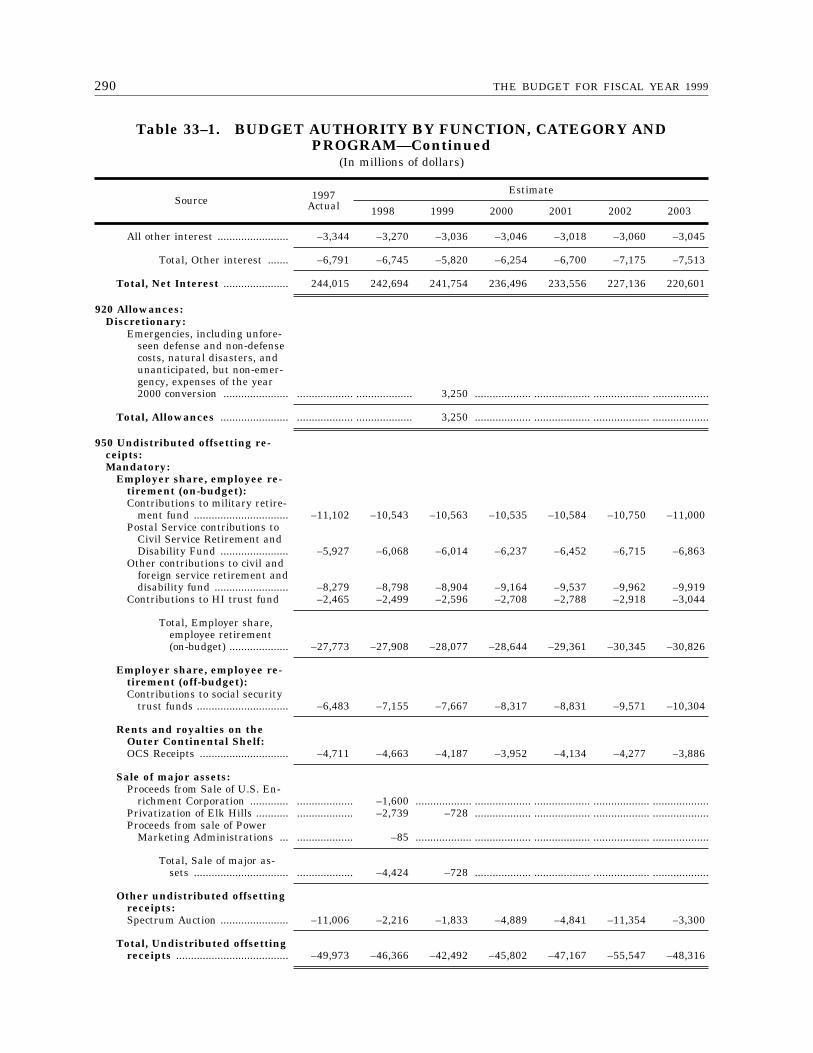
290 THE BUDGET FOR FISCAL YEAR 1999
Table 33–1. BUDGET AUTHORITY BY FUNCTION, CATEGORY ANDPROGRAM—Continued
(In millions of dollars)
Source 1997Actual
Estimate
1998 1999 2000 2001 2002 2003
All other interest ........................ –3,344 –3,270 –3,036 –3,046 –3,018 –3,060 –3,045
Total, Other interest ....... –6,791 –6,745 –5,820 –6,254 –6,700 –7,175 –7,513
Total, Net Interest ...................... 244,015 242,694 241,754 236,496 233,556 227,136 220,601
920 Allowances:Discretionary:
Emergencies, including unfore-seen defense and non-defensecosts, natural disasters, andunanticipated, but non-emer-gency, expenses of the year2000 conversion ...................... ................... ................... 3,250 ................... ................... ................... ...................
Total, Allowances ....................... ................... ................... 3,250 ................... ................... ................... ...................
950 Undistributed offsetting re-ceipts:Mandatory:
Employer share, employee re-tirement (on-budget):Contributions to military retire-
ment fund ................................ –11,102 –10,543 –10,563 –10,535 –10,584 –10,750 –11,000Postal Service contributions to
Civil Service Retirement andDisability Fund ....................... –5,927 –6,068 –6,014 –6,237 –6,452 –6,715 –6,863
Other contributions to civil andforeign service retirement anddisability fund ......................... –8,279 –8,798 –8,904 –9,164 –9,537 –9,962 –9,919
Contributions to HI trust fund –2,465 –2,499 –2,596 –2,708 –2,788 –2,918 –3,044
Total, Employer share,employee retirement(on-budget) .................... –27,773 –27,908 –28,077 –28,644 –29,361 –30,345 –30,826
Employer share, employee re-tirement (off-budget):Contributions to social security
trust funds ............................... –6,483 –7,155 –7,667 –8,317 –8,831 –9,571 –10,304
Rents and royalties on theOuter Continental Shelf:OCS Receipts .............................. –4,711 –4,663 –4,187 –3,952 –4,134 –4,277 –3,886
Sale of major assets:Proceeds from Sale of U.S. En-
richment Corporation ............. ................... –1,600 ................... ................... ................... ................... ...................Privatization of Elk Hills ........... ................... –2,739 –728 ................... ................... ................... ...................Proceeds from sale of Power
Marketing Administrations ... ................... –85 ................... ................... ................... ................... ...................
Total, Sale of major as-sets ................................ ................... –4,424 –728 ................... ................... ................... ...................
Other undistributed offsettingreceipts:Spectrum Auction ....................... –11,006 –2,216 –1,833 –4,889 –4,841 –11,354 –3,300
Total, Undistributed offsettingreceipts ...................................... –49,973 –46,366 –42,492 –45,802 –47,167 –55,547 –48,316
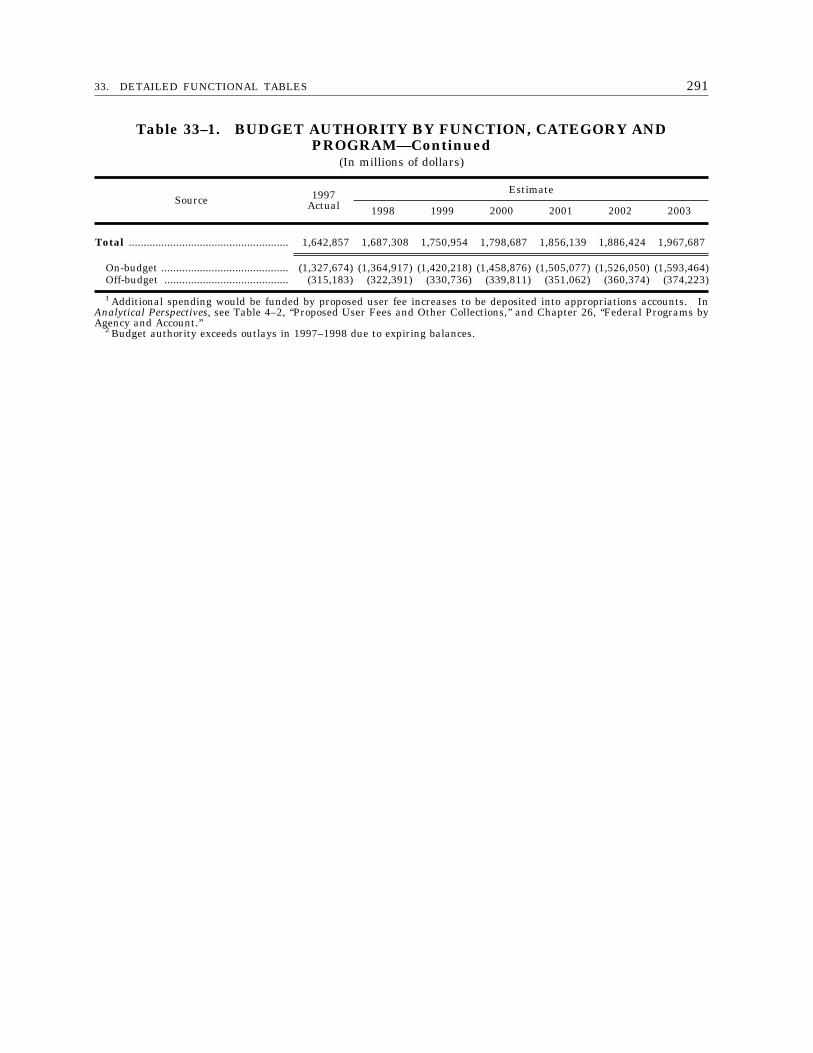
29133. DETAILED FUNCTIONAL TABLES
Table 33–1. BUDGET AUTHORITY BY FUNCTION, CATEGORY ANDPROGRAM—Continued
(In millions of dollars)
Source 1997Actual
Estimate
1998 1999 2000 2001 2002 2003
Total ...................................................... 1,642,857 1,687,308 1,750,954 1,798,687 1,856,139 1,886,424 1,967,687
On-budget ........................................... (1,327,674) (1,364,917) (1,420,218) (1,458,876) (1,505,077) (1,526,050) (1,593,464)Off-budget .......................................... (315,183) (322,391) (330,736) (339,811) (351,062) (360,374) (374,223)
1 Additional spending would be funded by proposed user fee increases to be deposited into appropriations accounts. InAnalytical Perspectives, see Table 4–2, ‘‘Proposed User Fees and Other Collections,’’ and Chapter 26, ‘‘Federal Programs byAgency and Account.’’
2 Budget authority exceeds outlays in 1997–1998 due to expiring balances.
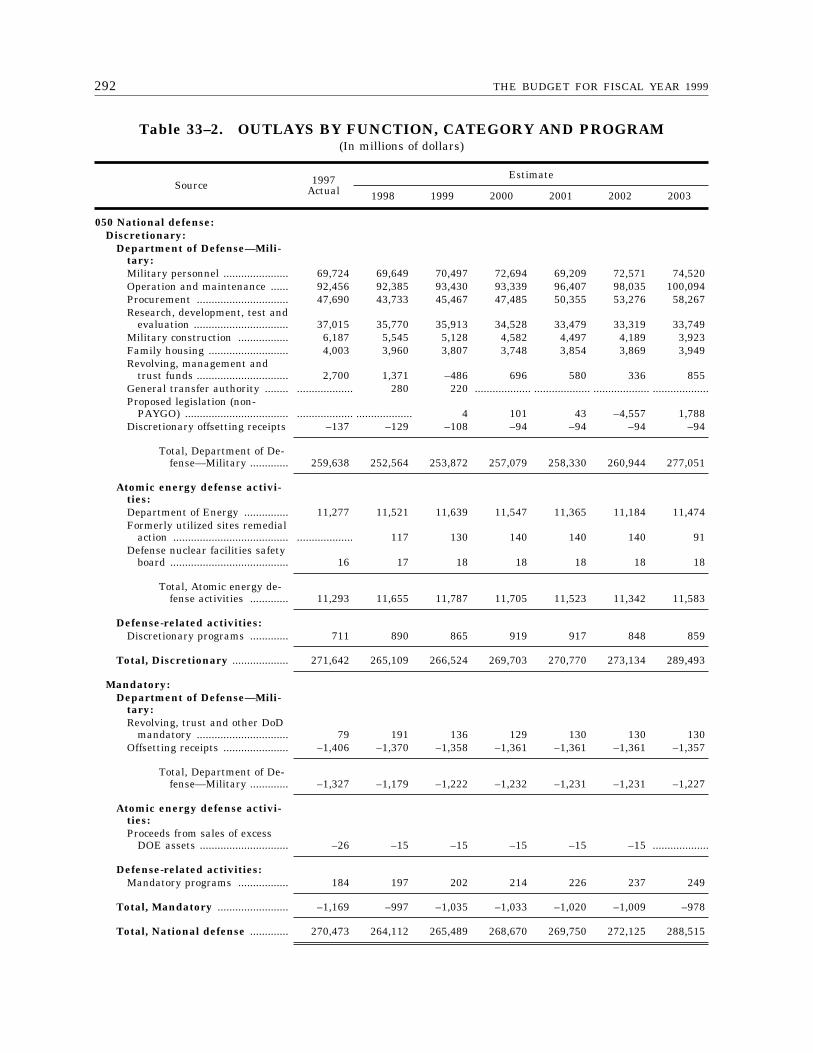
292 THE BUDGET FOR FISCAL YEAR 1999
Table 33–2. OUTLAYS BY FUNCTION, CATEGORY AND PROGRAM(In millions of dollars)
Source 1997Actual
Estimate
1998 1999 2000 2001 2002 2003
050 National defense:Discretionary:
Department of Defense—Mili-tary:Military personnel ...................... 69,724 69,649 70,497 72,694 69,209 72,571 74,520Operation and maintenance ...... 92,456 92,385 93,430 93,339 96,407 98,035 100,094Procurement ............................... 47,690 43,733 45,467 47,485 50,355 53,276 58,267Research, development, test and
evaluation ................................ 37,015 35,770 35,913 34,528 33,479 33,319 33,749Military construction ................. 6,187 5,545 5,128 4,582 4,497 4,189 3,923Family housing ........................... 4,003 3,960 3,807 3,748 3,854 3,869 3,949Revolving, management and
trust funds ............................... 2,700 1,371 –486 696 580 336 855General transfer authority ........ ................... 280 220 ................... ................... ................... ...................Proposed legislation (non-
PAYGO) ................................... ................... ................... 4 101 43 –4,557 1,788Discretionary offsetting receipts –137 –129 –108 –94 –94 –94 –94
Total, Department of De-fense—Military ............. 259,638 252,564 253,872 257,079 258,330 260,944 277,051
Atomic energy defense activi-ties:Department of Energy ............... 11,277 11,521 11,639 11,547 11,365 11,184 11,474Formerly utilized sites remedial
action ....................................... ................... 117 130 140 140 140 91Defense nuclear facilities safety
board ........................................ 16 17 18 18 18 18 18
Total, Atomic energy de-fense activities ............. 11,293 11,655 11,787 11,705 11,523 11,342 11,583
Defense-related activities:Discretionary programs ............. 711 890 865 919 917 848 859
Total, Discretionary ................... 271,642 265,109 266,524 269,703 270,770 273,134 289,493
Mandatory:Department of Defense—Mili-
tary:Revolving, trust and other DoD
mandatory ............................... 79 191 136 129 130 130 130Offsetting receipts ...................... –1,406 –1,370 –1,358 –1,361 –1,361 –1,361 –1,357
Total, Department of De-fense—Military ............. –1,327 –1,179 –1,222 –1,232 –1,231 –1,231 –1,227
Atomic energy defense activi-ties:Proceeds from sales of excess
DOE assets .............................. –26 –15 –15 –15 –15 –15 ...................
Defense-related activities:Mandatory programs ................. 184 197 202 214 226 237 249
Total, Mandatory ........................ –1,169 –997 –1,035 –1,033 –1,020 –1,009 –978
Total, National defense ............. 270,473 264,112 265,489 268,670 269,750 272,125 288,515
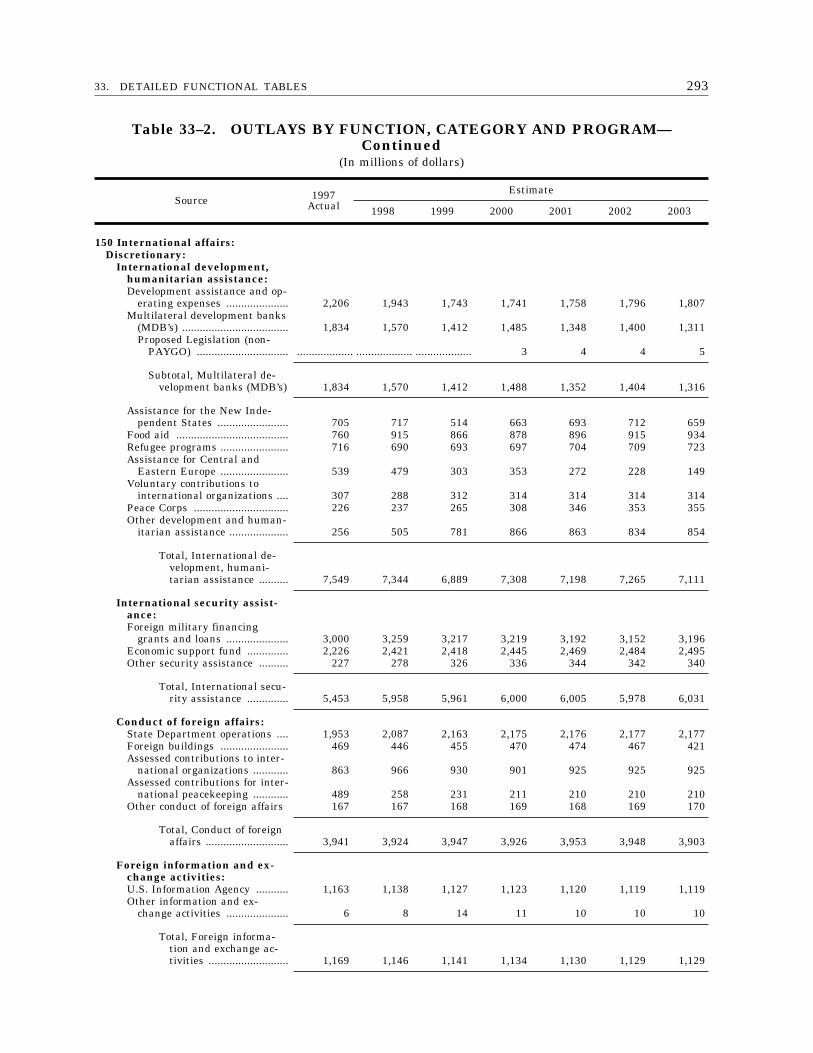
29333. DETAILED FUNCTIONAL TABLES
Table 33–2. OUTLAYS BY FUNCTION, CATEGORY AND PROGRAM—Continued
(In millions of dollars)
Source 1997Actual
Estimate
1998 1999 2000 2001 2002 2003
150 International affairs:Discretionary:
International development,humanitarian assistance:Development assistance and op-
erating expenses ..................... 2,206 1,943 1,743 1,741 1,758 1,796 1,807Multilateral development banks
(MDB’s) .................................... 1,834 1,570 1,412 1,485 1,348 1,400 1,311Proposed Legislation (non-
PAYGO) ............................... ................... ................... ................... 3 4 4 5
Subtotal, Multilateral de-velopment banks (MDB’s) 1,834 1,570 1,412 1,488 1,352 1,404 1,316
Assistance for the New Inde-pendent States ........................ 705 717 514 663 693 712 659
Food aid ...................................... 760 915 866 878 896 915 934Refugee programs ....................... 716 690 693 697 704 709 723Assistance for Central and
Eastern Europe ....................... 539 479 303 353 272 228 149Voluntary contributions to
international organizations .... 307 288 312 314 314 314 314Peace Corps ................................ 226 237 265 308 346 353 355Other development and human-
itarian assistance .................... 256 505 781 866 863 834 854
Total, International de-velopment, humani-tarian assistance .......... 7,549 7,344 6,889 7,308 7,198 7,265 7,111
International security assist-ance:Foreign military financing
grants and loans ..................... 3,000 3,259 3,217 3,219 3,192 3,152 3,196Economic support fund .............. 2,226 2,421 2,418 2,445 2,469 2,484 2,495Other security assistance .......... 227 278 326 336 344 342 340
Total, International secu-rity assistance .............. 5,453 5,958 5,961 6,000 6,005 5,978 6,031
Conduct of foreign affairs:State Department operations .... 1,953 2,087 2,163 2,175 2,176 2,177 2,177Foreign buildings ....................... 469 446 455 470 474 467 421Assessed contributions to inter-
national organizations ............ 863 966 930 901 925 925 925Assessed contributions for inter-
national peacekeeping ............ 489 258 231 211 210 210 210Other conduct of foreign affairs 167 167 168 169 168 169 170
Total, Conduct of foreignaffairs ............................ 3,941 3,924 3,947 3,926 3,953 3,948 3,903
Foreign information and ex-change activities:U.S. Information Agency ........... 1,163 1,138 1,127 1,123 1,120 1,119 1,119Other information and ex-
change activities ..................... 6 8 14 11 10 10 10
Total, Foreign informa-tion and exchange ac-tivities ........................... 1,169 1,146 1,141 1,134 1,130 1,129 1,129
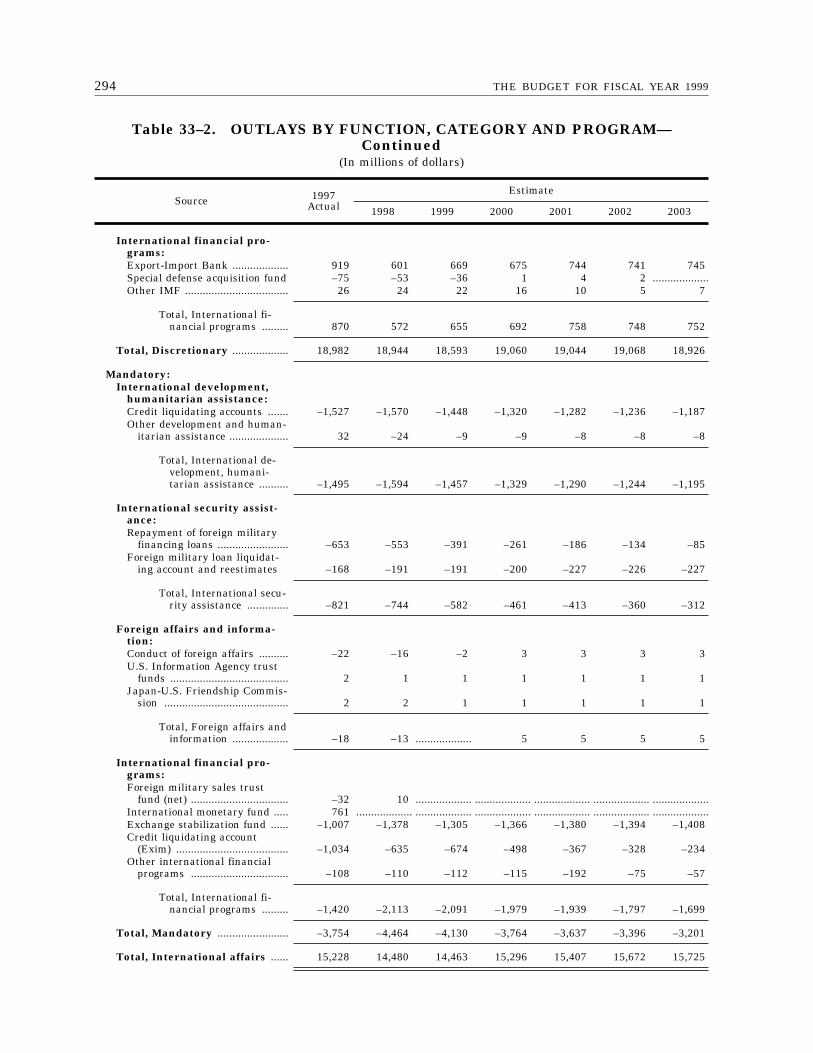
294 THE BUDGET FOR FISCAL YEAR 1999
Table 33–2. OUTLAYS BY FUNCTION, CATEGORY AND PROGRAM—Continued
(In millions of dollars)
Source 1997Actual
Estimate
1998 1999 2000 2001 2002 2003
International financial pro-grams:Export-Import Bank ................... 919 601 669 675 744 741 745Special defense acquisition fund –75 –53 –36 1 4 2 ...................Other IMF ................................... 26 24 22 16 10 5 7
Total, International fi-nancial programs ......... 870 572 655 692 758 748 752
Total, Discretionary ................... 18,982 18,944 18,593 19,060 19,044 19,068 18,926
Mandatory:International development,
humanitarian assistance:Credit liquidating accounts ....... –1,527 –1,570 –1,448 –1,320 –1,282 –1,236 –1,187Other development and human-
itarian assistance .................... 32 –24 –9 –9 –8 –8 –8
Total, International de-velopment, humani-tarian assistance .......... –1,495 –1,594 –1,457 –1,329 –1,290 –1,244 –1,195
International security assist-ance:Repayment of foreign military
financing loans ........................ –653 –553 –391 –261 –186 –134 –85Foreign military loan liquidat-
ing account and reestimates –168 –191 –191 –200 –227 –226 –227
Total, International secu-rity assistance .............. –821 –744 –582 –461 –413 –360 –312
Foreign affairs and informa-tion:Conduct of foreign affairs .......... –22 –16 –2 3 3 3 3U.S. Information Agency trust
funds ........................................ 2 1 1 1 1 1 1Japan-U.S. Friendship Commis-
sion .......................................... 2 2 1 1 1 1 1
Total, Foreign affairs andinformation ................... –18 –13 ................... 5 5 5 5
International financial pro-grams:Foreign military sales trust
fund (net) ................................. –32 10 ................... ................... ................... ................... ...................International monetary fund ..... 761 ................... ................... ................... ................... ................... ...................Exchange stabilization fund ...... –1,007 –1,378 –1,305 –1,366 –1,380 –1,394 –1,408Credit liquidating account
(Exim) ...................................... –1,034 –635 –674 –498 –367 –328 –234Other international financial
programs ................................. –108 –110 –112 –115 –192 –75 –57
Total, International fi-nancial programs ......... –1,420 –2,113 –2,091 –1,979 –1,939 –1,797 –1,699
Total, Mandatory ........................ –3,754 –4,464 –4,130 –3,764 –3,637 –3,396 –3,201
Total, International affairs ...... 15,228 14,480 14,463 15,296 15,407 15,672 15,725
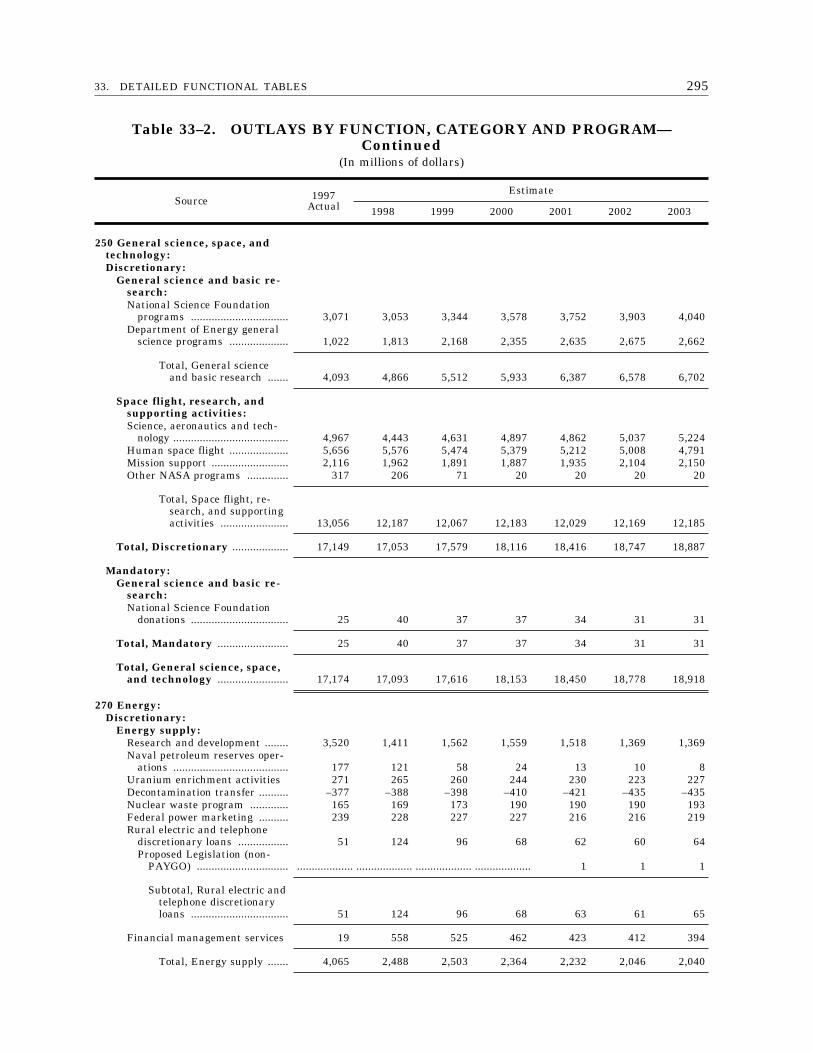
29533. DETAILED FUNCTIONAL TABLES
Table 33–2. OUTLAYS BY FUNCTION, CATEGORY AND PROGRAM—Continued
(In millions of dollars)
Source 1997Actual
Estimate
1998 1999 2000 2001 2002 2003
250 General science, space, andtechnology:Discretionary:
General science and basic re-search:National Science Foundation
programs ................................. 3,071 3,053 3,344 3,578 3,752 3,903 4,040Department of Energy general
science programs .................... 1,022 1,813 2,168 2,355 2,635 2,675 2,662
Total, General scienceand basic research ....... 4,093 4,866 5,512 5,933 6,387 6,578 6,702
Space flight, research, andsupporting activities:Science, aeronautics and tech-
nology ....................................... 4,967 4,443 4,631 4,897 4,862 5,037 5,224Human space flight .................... 5,656 5,576 5,474 5,379 5,212 5,008 4,791Mission support .......................... 2,116 1,962 1,891 1,887 1,935 2,104 2,150Other NASA programs .............. 317 206 71 20 20 20 20
Total, Space flight, re-search, and supportingactivities ....................... 13,056 12,187 12,067 12,183 12,029 12,169 12,185
Total, Discretionary ................... 17,149 17,053 17,579 18,116 18,416 18,747 18,887
Mandatory:General science and basic re-
search:National Science Foundation
donations ................................. 25 40 37 37 34 31 31
Total, Mandatory ........................ 25 40 37 37 34 31 31
Total, General science, space,and technology ........................ 17,174 17,093 17,616 18,153 18,450 18,778 18,918
270 Energy:Discretionary:
Energy supply:Research and development ........ 3,520 1,411 1,562 1,559 1,518 1,369 1,369Naval petroleum reserves oper-
ations ....................................... 177 121 58 24 13 10 8Uranium enrichment activities 271 265 260 244 230 223 227Decontamination transfer .......... –377 –388 –398 –410 –421 –435 –435Nuclear waste program ............. 165 169 173 190 190 190 193Federal power marketing .......... 239 228 227 227 216 216 219Rural electric and telephone
discretionary loans ................. 51 124 96 68 62 60 64Proposed Legislation (non-
PAYGO) ............................... ................... ................... ................... ................... 1 1 1
Subtotal, Rural electric andtelephone discretionaryloans ................................. 51 124 96 68 63 61 65
Financial management services 19 558 525 462 423 412 394
Total, Energy supply ....... 4,065 2,488 2,503 2,364 2,232 2,046 2,040
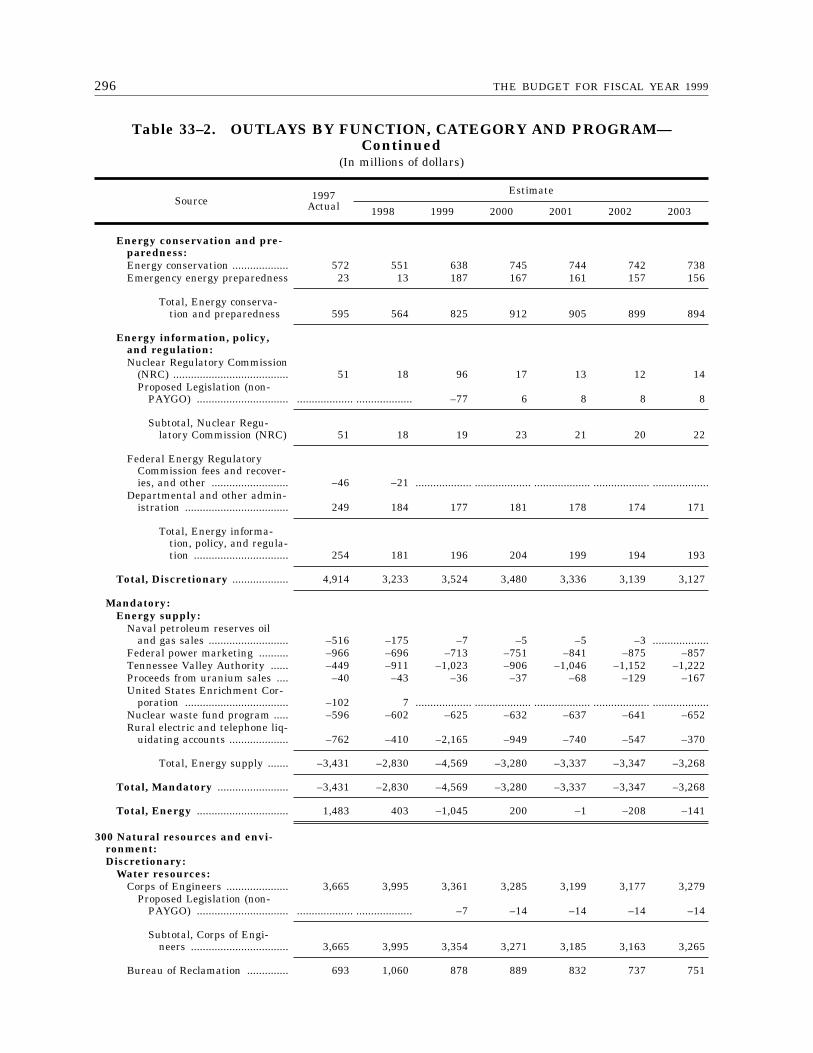
296 THE BUDGET FOR FISCAL YEAR 1999
Table 33–2. OUTLAYS BY FUNCTION, CATEGORY AND PROGRAM—Continued
(In millions of dollars)
Source 1997Actual
Estimate
1998 1999 2000 2001 2002 2003
Energy conservation and pre-paredness:Energy conservation ................... 572 551 638 745 744 742 738Emergency energy preparedness 23 13 187 167 161 157 156
Total, Energy conserva-tion and preparedness 595 564 825 912 905 899 894
Energy information, policy,and regulation:Nuclear Regulatory Commission
(NRC) ....................................... 51 18 96 17 13 12 14Proposed Legislation (non-
PAYGO) ............................... ................... ................... –77 6 8 8 8
Subtotal, Nuclear Regu-latory Commission (NRC) 51 18 19 23 21 20 22
Federal Energy RegulatoryCommission fees and recover-ies, and other .......................... –46 –21 ................... ................... ................... ................... ...................
Departmental and other admin-istration ................................... 249 184 177 181 178 174 171
Total, Energy informa-tion, policy, and regula-tion ................................ 254 181 196 204 199 194 193
Total, Discretionary ................... 4,914 3,233 3,524 3,480 3,336 3,139 3,127
Mandatory:Energy supply:
Naval petroleum reserves oiland gas sales ........................... –516 –175 –7 –5 –5 –3 ...................
Federal power marketing .......... –966 –696 –713 –751 –841 –875 –857Tennessee Valley Authority ...... –449 –911 –1,023 –906 –1,046 –1,152 –1,222Proceeds from uranium sales .... –40 –43 –36 –37 –68 –129 –167United States Enrichment Cor-
poration ................................... –102 7 ................... ................... ................... ................... ...................Nuclear waste fund program ..... –596 –602 –625 –632 –637 –641 –652Rural electric and telephone liq-
uidating accounts .................... –762 –410 –2,165 –949 –740 –547 –370
Total, Energy supply ....... –3,431 –2,830 –4,569 –3,280 –3,337 –3,347 –3,268
Total, Mandatory ........................ –3,431 –2,830 –4,569 –3,280 –3,337 –3,347 –3,268
Total, Energy ............................... 1,483 403 –1,045 200 –1 –208 –141
300 Natural resources and envi-ronment:Discretionary:
Water resources:Corps of Engineers ..................... 3,665 3,995 3,361 3,285 3,199 3,177 3,279
Proposed Legislation (non-PAYGO) ............................... ................... ................... –7 –14 –14 –14 –14
Subtotal, Corps of Engi-neers ................................. 3,665 3,995 3,354 3,271 3,185 3,163 3,265
Bureau of Reclamation .............. 693 1,060 878 889 832 737 751
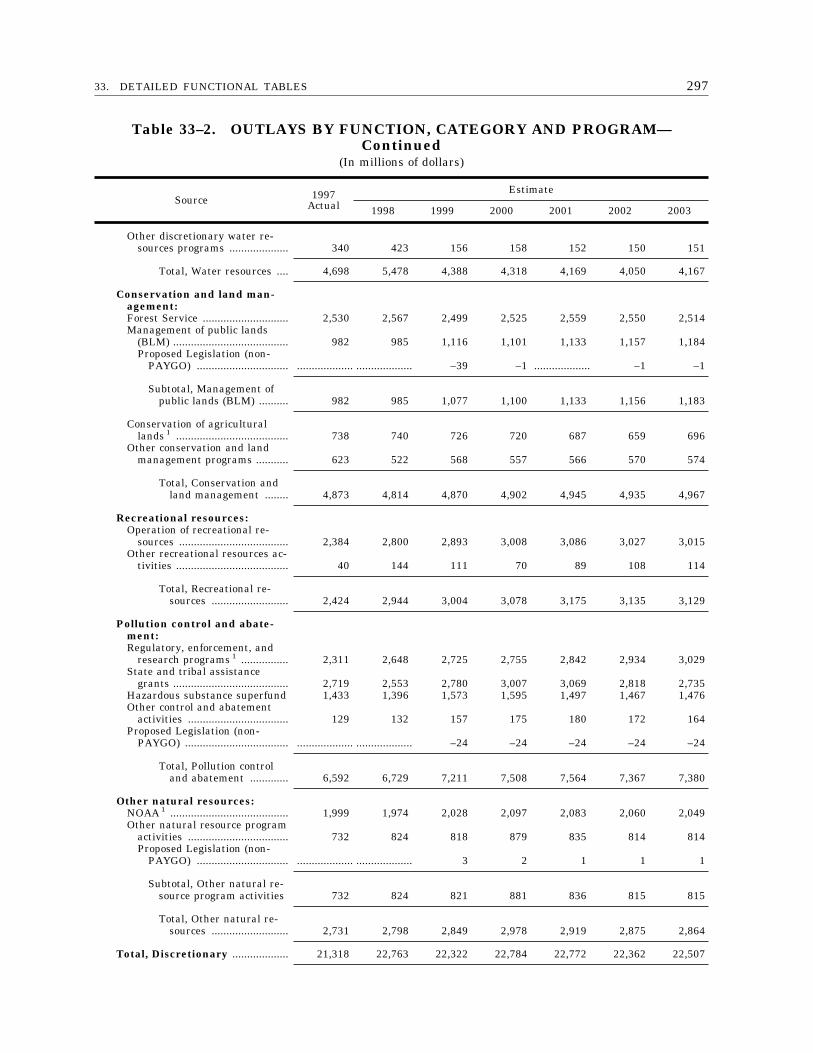
29733. DETAILED FUNCTIONAL TABLES
Table 33–2. OUTLAYS BY FUNCTION, CATEGORY AND PROGRAM—Continued
(In millions of dollars)
Source 1997Actual
Estimate
1998 1999 2000 2001 2002 2003
Other discretionary water re-sources programs .................... 340 423 156 158 152 150 151
Total, Water resources .... 4,698 5,478 4,388 4,318 4,169 4,050 4,167
Conservation and land man-agement:Forest Service ............................. 2,530 2,567 2,499 2,525 2,559 2,550 2,514Management of public lands
(BLM) ....................................... 982 985 1,116 1,101 1,133 1,157 1,184Proposed Legislation (non-
PAYGO) ............................... ................... ................... –39 –1 ................... –1 –1
Subtotal, Management ofpublic lands (BLM) .......... 982 985 1,077 1,100 1,133 1,156 1,183
Conservation of agriculturallands 1 ...................................... 738 740 726 720 687 659 696
Other conservation and landmanagement programs ........... 623 522 568 557 566 570 574
Total, Conservation andland management ........ 4,873 4,814 4,870 4,902 4,945 4,935 4,967
Recreational resources:Operation of recreational re-
sources ..................................... 2,384 2,800 2,893 3,008 3,086 3,027 3,015Other recreational resources ac-
tivities ...................................... 40 144 111 70 89 108 114
Total, Recreational re-sources .......................... 2,424 2,944 3,004 3,078 3,175 3,135 3,129
Pollution control and abate-ment:Regulatory, enforcement, and
research programs 1 ................ 2,311 2,648 2,725 2,755 2,842 2,934 3,029State and tribal assistance
grants ....................................... 2,719 2,553 2,780 3,007 3,069 2,818 2,735Hazardous substance superfund 1,433 1,396 1,573 1,595 1,497 1,467 1,476Other control and abatement
activities .................................. 129 132 157 175 180 172 164Proposed Legislation (non-
PAYGO) ................................... ................... ................... –24 –24 –24 –24 –24
Total, Pollution controland abatement ............. 6,592 6,729 7,211 7,508 7,564 7,367 7,380
Other natural resources:NOAA 1 ........................................ 1,999 1,974 2,028 2,097 2,083 2,060 2,049Other natural resource program
activities .................................. 732 824 818 879 835 814 814Proposed Legislation (non-
PAYGO) ............................... ................... ................... 3 2 1 1 1
Subtotal, Other natural re-source program activities 732 824 821 881 836 815 815
Total, Other natural re-sources .......................... 2,731 2,798 2,849 2,978 2,919 2,875 2,864
Total, Discretionary ................... 21,318 22,763 22,322 22,784 22,772 22,362 22,507
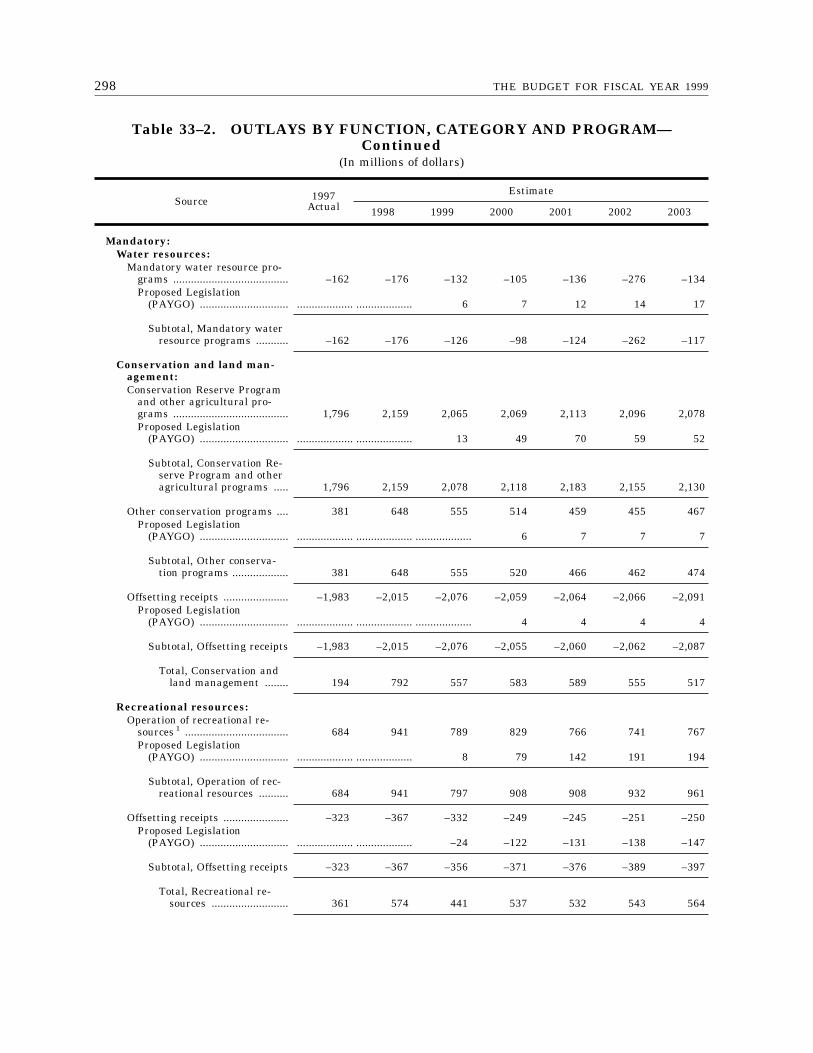
298 THE BUDGET FOR FISCAL YEAR 1999
Table 33–2. OUTLAYS BY FUNCTION, CATEGORY AND PROGRAM—Continued
(In millions of dollars)
Source 1997Actual
Estimate
1998 1999 2000 2001 2002 2003
Mandatory:Water resources:
Mandatory water resource pro-grams ....................................... –162 –176 –132 –105 –136 –276 –134Proposed Legislation
(PAYGO) .............................. ................... ................... 6 7 12 14 17
Subtotal, Mandatory waterresource programs ........... –162 –176 –126 –98 –124 –262 –117
Conservation and land man-agement:Conservation Reserve Program
and other agricultural pro-grams ....................................... 1,796 2,159 2,065 2,069 2,113 2,096 2,078Proposed Legislation
(PAYGO) .............................. ................... ................... 13 49 70 59 52
Subtotal, Conservation Re-serve Program and otheragricultural programs ..... 1,796 2,159 2,078 2,118 2,183 2,155 2,130
Other conservation programs .... 381 648 555 514 459 455 467Proposed Legislation
(PAYGO) .............................. ................... ................... ................... 6 7 7 7
Subtotal, Other conserva-tion programs ................... 381 648 555 520 466 462 474
Offsetting receipts ...................... –1,983 –2,015 –2,076 –2,059 –2,064 –2,066 –2,091Proposed Legislation
(PAYGO) .............................. ................... ................... ................... 4 4 4 4
Subtotal, Offsetting receipts –1,983 –2,015 –2,076 –2,055 –2,060 –2,062 –2,087
Total, Conservation andland management ........ 194 792 557 583 589 555 517
Recreational resources:Operation of recreational re-
sources 1 ................................... 684 941 789 829 766 741 767Proposed Legislation
(PAYGO) .............................. ................... ................... 8 79 142 191 194
Subtotal, Operation of rec-reational resources .......... 684 941 797 908 908 932 961
Offsetting receipts ...................... –323 –367 –332 –249 –245 –251 –250Proposed Legislation
(PAYGO) .............................. ................... ................... –24 –122 –131 –138 –147
Subtotal, Offsetting receipts –323 –367 –356 –371 –376 –389 –397
Total, Recreational re-sources .......................... 361 574 441 537 532 543 564
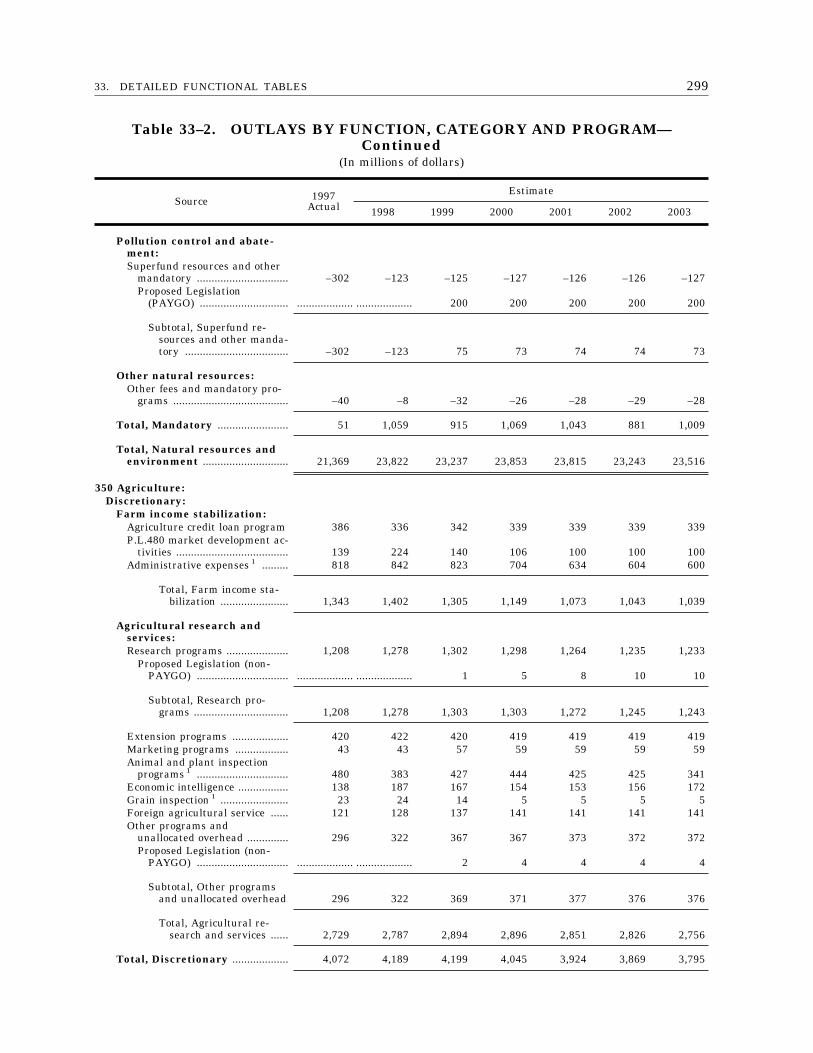
29933. DETAILED FUNCTIONAL TABLES
Table 33–2. OUTLAYS BY FUNCTION, CATEGORY AND PROGRAM—Continued
(In millions of dollars)
Source 1997Actual
Estimate
1998 1999 2000 2001 2002 2003
Pollution control and abate-ment:Superfund resources and other
mandatory ............................... –302 –123 –125 –127 –126 –126 –127Proposed Legislation
(PAYGO) .............................. ................... ................... 200 200 200 200 200
Subtotal, Superfund re-sources and other manda-tory ................................... –302 –123 75 73 74 74 73
Other natural resources:Other fees and mandatory pro-
grams ....................................... –40 –8 –32 –26 –28 –29 –28
Total, Mandatory ........................ 51 1,059 915 1,069 1,043 881 1,009
Total, Natural resources andenvironment ............................. 21,369 23,822 23,237 23,853 23,815 23,243 23,516
350 Agriculture:Discretionary:
Farm income stabilization:Agriculture credit loan program 386 336 342 339 339 339 339P.L.480 market development ac-
tivities ...................................... 139 224 140 106 100 100 100Administrative expenses 1 ......... 818 842 823 704 634 604 600
Total, Farm income sta-bilization ....................... 1,343 1,402 1,305 1,149 1,073 1,043 1,039
Agricultural research andservices:Research programs ..................... 1,208 1,278 1,302 1,298 1,264 1,235 1,233
Proposed Legislation (non-PAYGO) ............................... ................... ................... 1 5 8 10 10
Subtotal, Research pro-grams ................................ 1,208 1,278 1,303 1,303 1,272 1,245 1,243
Extension programs ................... 420 422 420 419 419 419 419Marketing programs .................. 43 43 57 59 59 59 59Animal and plant inspection
programs 1 ............................... 480 383 427 444 425 425 341Economic intelligence ................. 138 187 167 154 153 156 172Grain inspection 1 ....................... 23 24 14 5 5 5 5Foreign agricultural service ...... 121 128 137 141 141 141 141Other programs and
unallocated overhead .............. 296 322 367 367 373 372 372Proposed Legislation (non-
PAYGO) ............................... ................... ................... 2 4 4 4 4
Subtotal, Other programsand unallocated overhead 296 322 369 371 377 376 376
Total, Agricultural re-search and services ...... 2,729 2,787 2,894 2,896 2,851 2,826 2,756
Total, Discretionary ................... 4,072 4,189 4,199 4,045 3,924 3,869 3,795
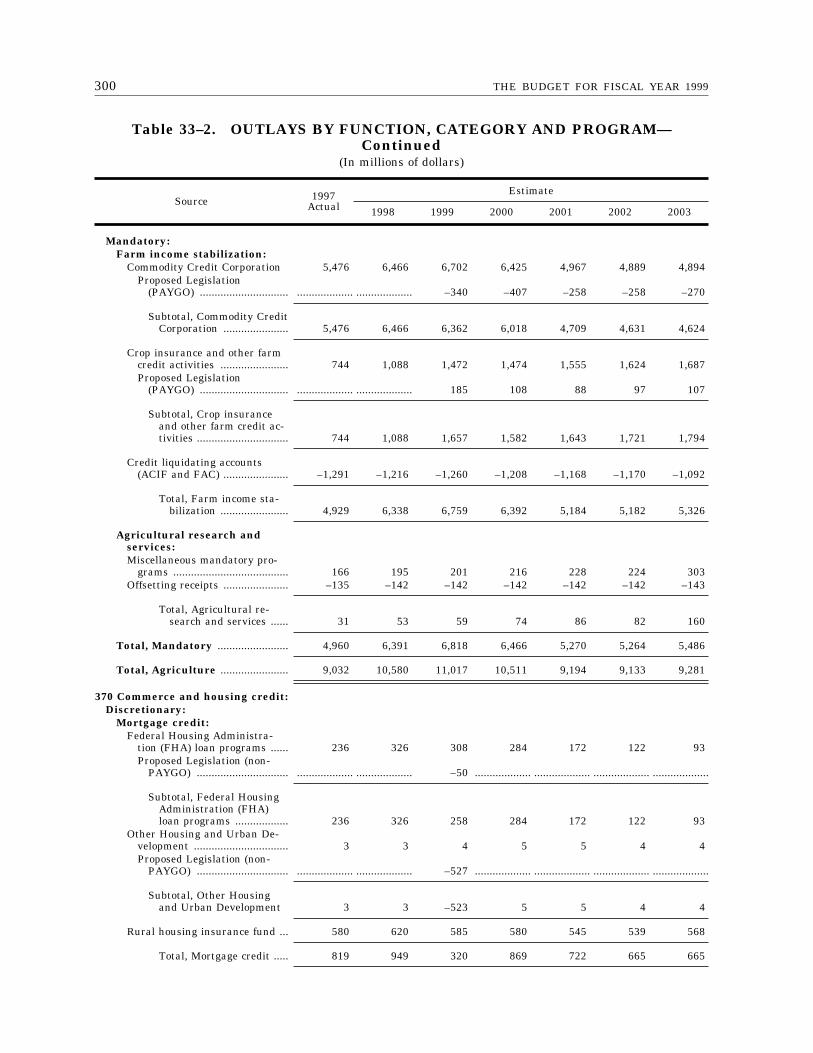
300 THE BUDGET FOR FISCAL YEAR 1999
Table 33–2. OUTLAYS BY FUNCTION, CATEGORY AND PROGRAM—Continued
(In millions of dollars)
Source 1997Actual
Estimate
1998 1999 2000 2001 2002 2003
Mandatory:Farm income stabilization:
Commodity Credit Corporation 5,476 6,466 6,702 6,425 4,967 4,889 4,894Proposed Legislation
(PAYGO) .............................. ................... ................... –340 –407 –258 –258 –270
Subtotal, Commodity CreditCorporation ...................... 5,476 6,466 6,362 6,018 4,709 4,631 4,624
Crop insurance and other farmcredit activities ....................... 744 1,088 1,472 1,474 1,555 1,624 1,687Proposed Legislation
(PAYGO) .............................. ................... ................... 185 108 88 97 107
Subtotal, Crop insuranceand other farm credit ac-tivities ............................... 744 1,088 1,657 1,582 1,643 1,721 1,794
Credit liquidating accounts(ACIF and FAC) ...................... –1,291 –1,216 –1,260 –1,208 –1,168 –1,170 –1,092
Total, Farm income sta-bilization ....................... 4,929 6,338 6,759 6,392 5,184 5,182 5,326
Agricultural research andservices:Miscellaneous mandatory pro-
grams ....................................... 166 195 201 216 228 224 303Offsetting receipts ...................... –135 –142 –142 –142 –142 –142 –143
Total, Agricultural re-search and services ...... 31 53 59 74 86 82 160
Total, Mandatory ........................ 4,960 6,391 6,818 6,466 5,270 5,264 5,486
Total, Agriculture ....................... 9,032 10,580 11,017 10,511 9,194 9,133 9,281
370 Commerce and housing credit:Discretionary:
Mortgage credit:Federal Housing Administra-
tion (FHA) loan programs ...... 236 326 308 284 172 122 93Proposed Legislation (non-
PAYGO) ............................... ................... ................... –50 ................... ................... ................... ...................
Subtotal, Federal HousingAdministration (FHA)loan programs .................. 236 326 258 284 172 122 93
Other Housing and Urban De-velopment ................................ 3 3 4 5 5 4 4Proposed Legislation (non-
PAYGO) ............................... ................... ................... –527 ................... ................... ................... ...................
Subtotal, Other Housingand Urban Development 3 3 –523 5 5 4 4
Rural housing insurance fund ... 580 620 585 580 545 539 568
Total, Mortgage credit ..... 819 949 320 869 722 665 665
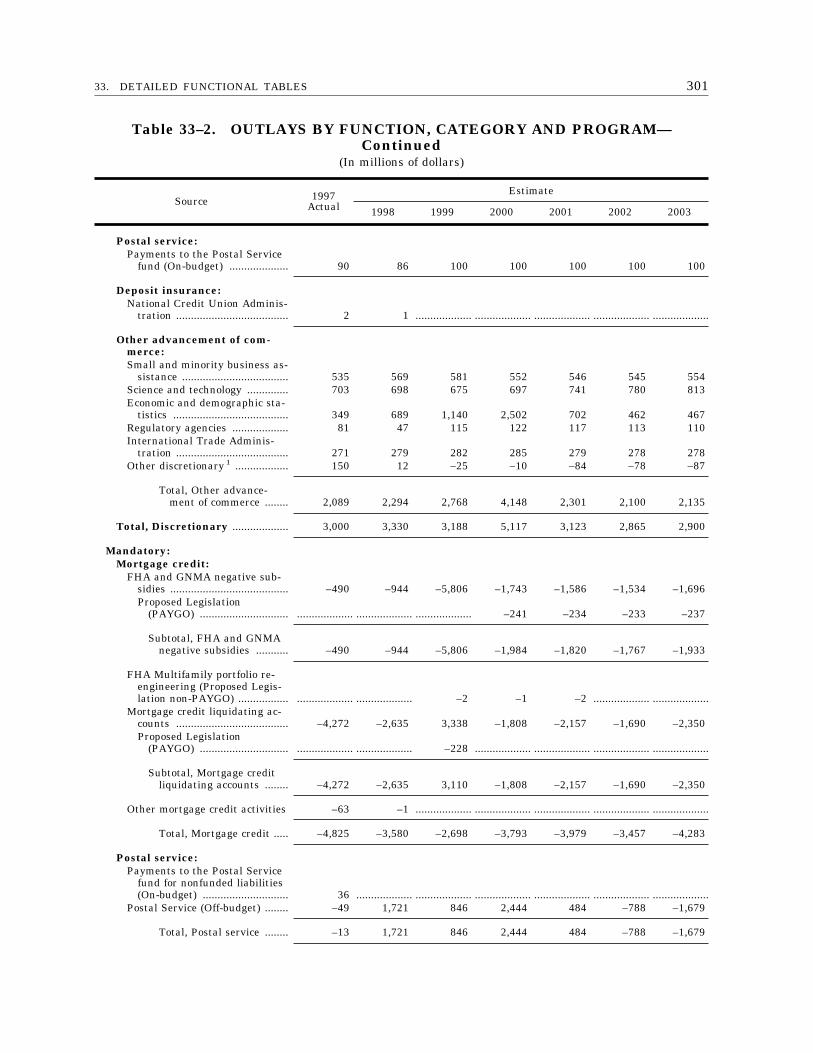
30133. DETAILED FUNCTIONAL TABLES
Table 33–2. OUTLAYS BY FUNCTION, CATEGORY AND PROGRAM—Continued
(In millions of dollars)
Source 1997Actual
Estimate
1998 1999 2000 2001 2002 2003
Postal service:Payments to the Postal Service
fund (On-budget) .................... 90 86 100 100 100 100 100
Deposit insurance:National Credit Union Adminis-
tration ...................................... 2 1 ................... ................... ................... ................... ...................
Other advancement of com-merce:Small and minority business as-
sistance .................................... 535 569 581 552 546 545 554Science and technology .............. 703 698 675 697 741 780 813Economic and demographic sta-
tistics ....................................... 349 689 1,140 2,502 702 462 467Regulatory agencies ................... 81 47 115 122 117 113 110International Trade Adminis-
tration ...................................... 271 279 282 285 279 278 278Other discretionary 1 .................. 150 12 –25 –10 –84 –78 –87
Total, Other advance-ment of commerce ........ 2,089 2,294 2,768 4,148 2,301 2,100 2,135
Total, Discretionary ................... 3,000 3,330 3,188 5,117 3,123 2,865 2,900
Mandatory:Mortgage credit:
FHA and GNMA negative sub-sidies ........................................ –490 –944 –5,806 –1,743 –1,586 –1,534 –1,696Proposed Legislation
(PAYGO) .............................. ................... ................... ................... –241 –234 –233 –237
Subtotal, FHA and GNMAnegative subsidies ........... –490 –944 –5,806 –1,984 –1,820 –1,767 –1,933
FHA Multifamily portfolio re-engineering (Proposed Legis-lation non-PAYGO) ................. ................... ................... –2 –1 –2 ................... ...................
Mortgage credit liquidating ac-counts ...................................... –4,272 –2,635 3,338 –1,808 –2,157 –1,690 –2,350Proposed Legislation
(PAYGO) .............................. ................... ................... –228 ................... ................... ................... ...................
Subtotal, Mortgage creditliquidating accounts ........ –4,272 –2,635 3,110 –1,808 –2,157 –1,690 –2,350
Other mortgage credit activities –63 –1 ................... ................... ................... ................... ...................
Total, Mortgage credit ..... –4,825 –3,580 –2,698 –3,793 –3,979 –3,457 –4,283
Postal service:Payments to the Postal Service
fund for nonfunded liabilities(On-budget) ............................. 36 ................... ................... ................... ................... ................... ...................
Postal Service (Off-budget) ........ –49 1,721 846 2,444 484 –788 –1,679
Total, Postal service ........ –13 1,721 846 2,444 484 –788 –1,679
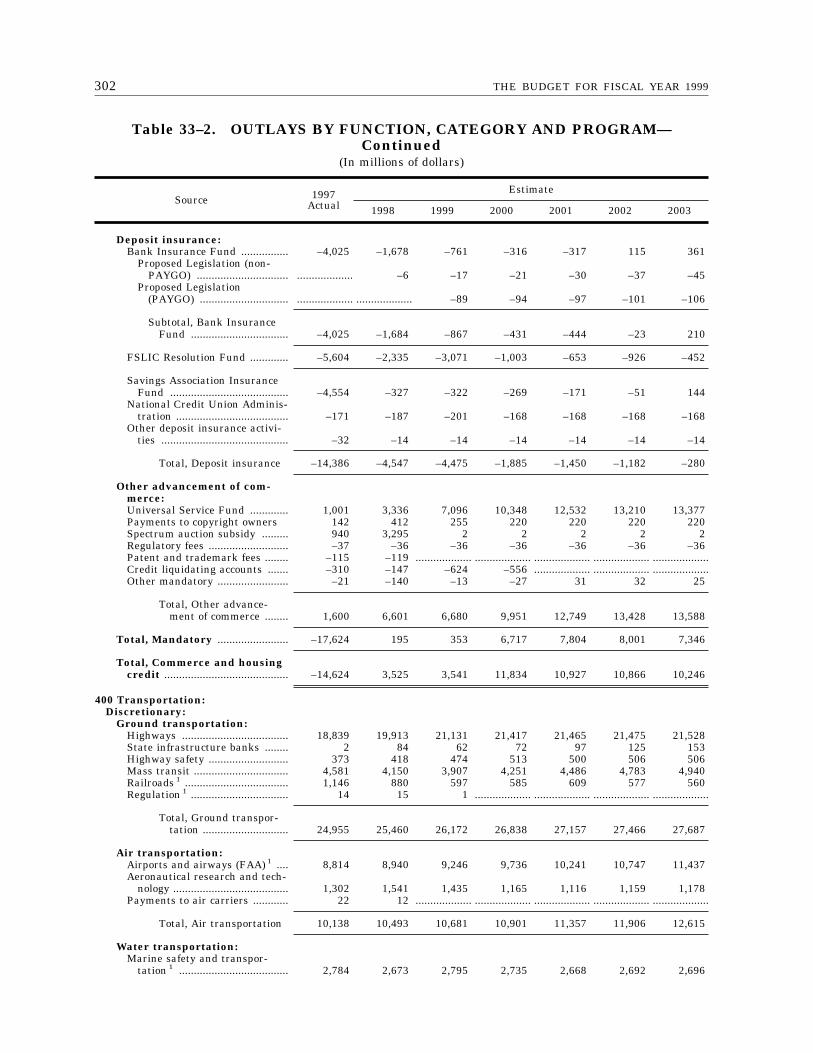
302 THE BUDGET FOR FISCAL YEAR 1999
Table 33–2. OUTLAYS BY FUNCTION, CATEGORY AND PROGRAM—Continued
(In millions of dollars)
Source 1997Actual
Estimate
1998 1999 2000 2001 2002 2003
Deposit insurance:Bank Insurance Fund ................ –4,025 –1,678 –761 –316 –317 115 361
Proposed Legislation (non-PAYGO) ............................... ................... –6 –17 –21 –30 –37 –45
Proposed Legislation(PAYGO) .............................. ................... ................... –89 –94 –97 –101 –106
Subtotal, Bank InsuranceFund ................................. –4,025 –1,684 –867 –431 –444 –23 210
FSLIC Resolution Fund ............. –5,604 –2,335 –3,071 –1,003 –653 –926 –452
Savings Association InsuranceFund ........................................ –4,554 –327 –322 –269 –171 –51 144
National Credit Union Adminis-tration ...................................... –171 –187 –201 –168 –168 –168 –168
Other deposit insurance activi-ties ........................................... –32 –14 –14 –14 –14 –14 –14
Total, Deposit insurance –14,386 –4,547 –4,475 –1,885 –1,450 –1,182 –280
Other advancement of com-merce:Universal Service Fund ............. 1,001 3,336 7,096 10,348 12,532 13,210 13,377Payments to copyright owners 142 412 255 220 220 220 220Spectrum auction subsidy ......... 940 3,295 2 2 2 2 2Regulatory fees ........................... –37 –36 –36 –36 –36 –36 –36Patent and trademark fees ........ –115 –119 ................... ................... ................... ................... ...................Credit liquidating accounts ....... –310 –147 –624 –556 ................... ................... ...................Other mandatory ........................ –21 –140 –13 –27 31 32 25
Total, Other advance-ment of commerce ........ 1,600 6,601 6,680 9,951 12,749 13,428 13,588
Total, Mandatory ........................ –17,624 195 353 6,717 7,804 8,001 7,346
Total, Commerce and housingcredit .......................................... –14,624 3,525 3,541 11,834 10,927 10,866 10,246
400 Transportation:Discretionary:
Ground transportation:Highways .................................... 18,839 19,913 21,131 21,417 21,465 21,475 21,528State infrastructure banks ........ 2 84 62 72 97 125 153Highway safety ........................... 373 418 474 513 500 506 506Mass transit ................................ 4,581 4,150 3,907 4,251 4,486 4,783 4,940Railroads 1 ................................... 1,146 880 597 585 609 577 560Regulation 1 ................................. 14 15 1 ................... ................... ................... ...................
Total, Ground transpor-tation ............................. 24,955 25,460 26,172 26,838 27,157 27,466 27,687
Air transportation:Airports and airways (FAA) 1 .... 8,814 8,940 9,246 9,736 10,241 10,747 11,437Aeronautical research and tech-
nology ....................................... 1,302 1,541 1,435 1,165 1,116 1,159 1,178Payments to air carriers ............ 22 12 ................... ................... ................... ................... ...................
Total, Air transportation 10,138 10,493 10,681 10,901 11,357 11,906 12,615
Water transportation:Marine safety and transpor-
tation 1 ..................................... 2,784 2,673 2,795 2,735 2,668 2,692 2,696
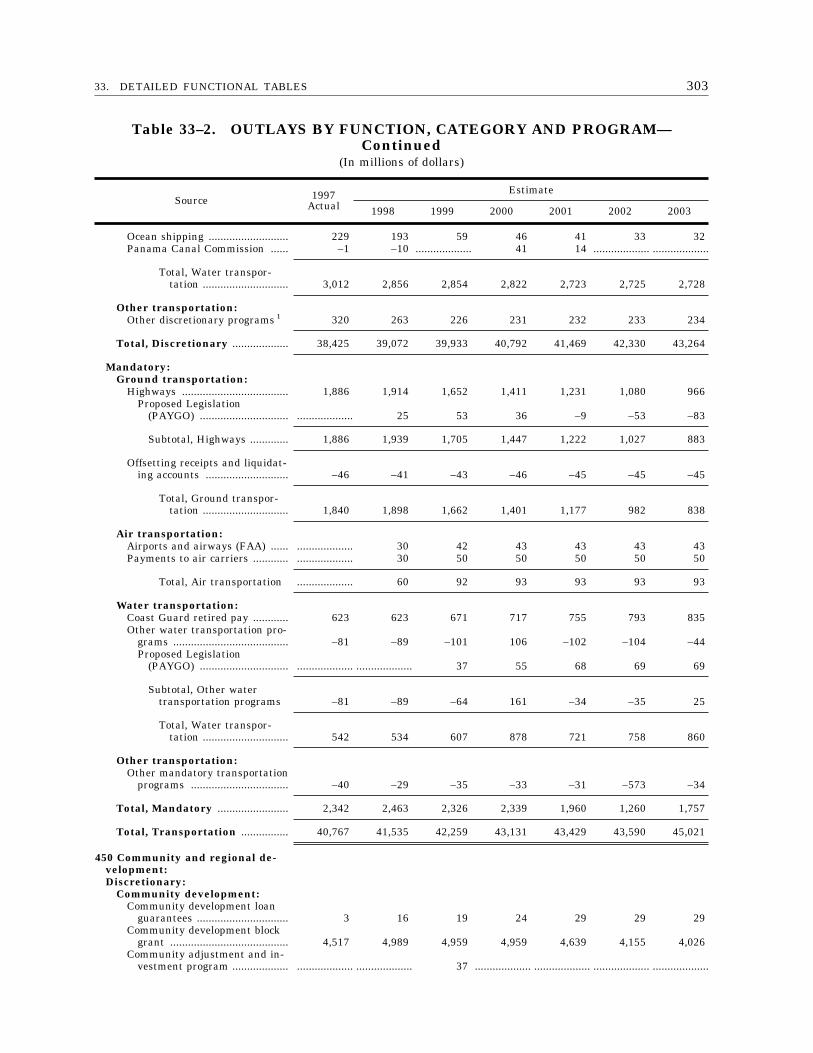
30333. DETAILED FUNCTIONAL TABLES
Table 33–2. OUTLAYS BY FUNCTION, CATEGORY AND PROGRAM—Continued
(In millions of dollars)
Source 1997Actual
Estimate
1998 1999 2000 2001 2002 2003
Ocean shipping ........................... 229 193 59 46 41 33 32Panama Canal Commission ...... –1 –10 ................... 41 14 ................... ...................
Total, Water transpor-tation ............................. 3,012 2,856 2,854 2,822 2,723 2,725 2,728
Other transportation:Other discretionary programs 1 320 263 226 231 232 233 234
Total, Discretionary ................... 38,425 39,072 39,933 40,792 41,469 42,330 43,264
Mandatory:Ground transportation:
Highways .................................... 1,886 1,914 1,652 1,411 1,231 1,080 966Proposed Legislation
(PAYGO) .............................. ................... 25 53 36 –9 –53 –83
Subtotal, Highways ............. 1,886 1,939 1,705 1,447 1,222 1,027 883
Offsetting receipts and liquidat-ing accounts ............................ –46 –41 –43 –46 –45 –45 –45
Total, Ground transpor-tation ............................. 1,840 1,898 1,662 1,401 1,177 982 838
Air transportation:Airports and airways (FAA) ...... ................... 30 42 43 43 43 43Payments to air carriers ............ ................... 30 50 50 50 50 50
Total, Air transportation ................... 60 92 93 93 93 93
Water transportation:Coast Guard retired pay ............ 623 623 671 717 755 793 835Other water transportation pro-
grams ....................................... –81 –89 –101 106 –102 –104 –44Proposed Legislation
(PAYGO) .............................. ................... ................... 37 55 68 69 69
Subtotal, Other watertransportation programs –81 –89 –64 161 –34 –35 25
Total, Water transpor-tation ............................. 542 534 607 878 721 758 860
Other transportation:Other mandatory transportation
programs ................................. –40 –29 –35 –33 –31 –573 –34
Total, Mandatory ........................ 2,342 2,463 2,326 2,339 1,960 1,260 1,757
Total, Transportation ................ 40,767 41,535 42,259 43,131 43,429 43,590 45,021
450 Community and regional de-velopment:Discretionary:
Community development:Community development loan
guarantees ............................... 3 16 19 24 29 29 29Community development block
grant ........................................ 4,517 4,989 4,959 4,959 4,639 4,155 4,026Community adjustment and in-
vestment program ................... ................... ................... 37 ................... ................... ................... ...................
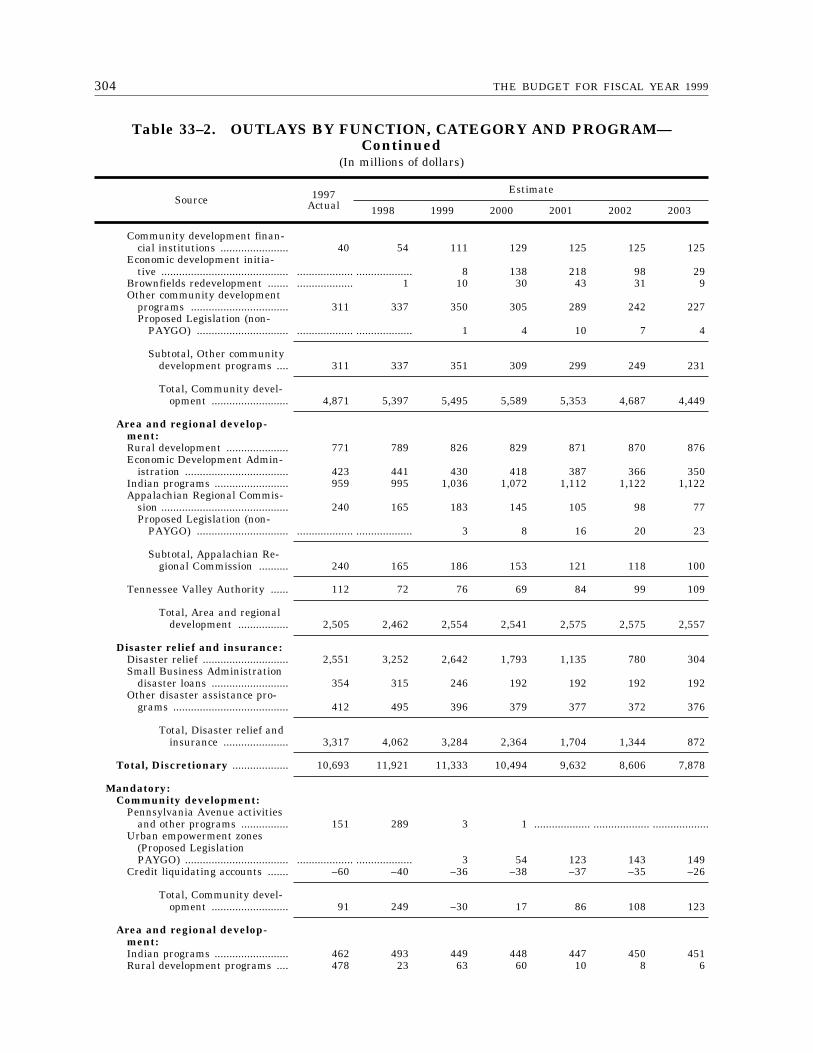
304 THE BUDGET FOR FISCAL YEAR 1999
Table 33–2. OUTLAYS BY FUNCTION, CATEGORY AND PROGRAM—Continued
(In millions of dollars)
Source 1997Actual
Estimate
1998 1999 2000 2001 2002 2003
Community development finan-cial institutions ....................... 40 54 111 129 125 125 125
Economic development initia-tive ........................................... ................... ................... 8 138 218 98 29
Brownfields redevelopment ....... ................... 1 10 30 43 31 9Other community development
programs ................................. 311 337 350 305 289 242 227Proposed Legislation (non-
PAYGO) ............................... ................... ................... 1 4 10 7 4
Subtotal, Other communitydevelopment programs .... 311 337 351 309 299 249 231
Total, Community devel-opment .......................... 4,871 5,397 5,495 5,589 5,353 4,687 4,449
Area and regional develop-ment:Rural development ..................... 771 789 826 829 871 870 876Economic Development Admin-
istration ................................... 423 441 430 418 387 366 350Indian programs ......................... 959 995 1,036 1,072 1,112 1,122 1,122Appalachian Regional Commis-
sion ........................................... 240 165 183 145 105 98 77Proposed Legislation (non-
PAYGO) ............................... ................... ................... 3 8 16 20 23
Subtotal, Appalachian Re-gional Commission .......... 240 165 186 153 121 118 100
Tennessee Valley Authority ...... 112 72 76 69 84 99 109
Total, Area and regionaldevelopment ................. 2,505 2,462 2,554 2,541 2,575 2,575 2,557
Disaster relief and insurance:Disaster relief ............................. 2,551 3,252 2,642 1,793 1,135 780 304Small Business Administration
disaster loans .......................... 354 315 246 192 192 192 192Other disaster assistance pro-
grams ....................................... 412 495 396 379 377 372 376
Total, Disaster relief andinsurance ...................... 3,317 4,062 3,284 2,364 1,704 1,344 872
Total, Discretionary ................... 10,693 11,921 11,333 10,494 9,632 8,606 7,878
Mandatory:Community development:
Pennsylvania Avenue activitiesand other programs ................ 151 289 3 1 ................... ................... ...................
Urban empowerment zones(Proposed LegislationPAYGO) ................................... ................... ................... 3 54 123 143 149
Credit liquidating accounts ....... –60 –40 –36 –38 –37 –35 –26
Total, Community devel-opment .......................... 91 249 –30 17 86 108 123
Area and regional develop-ment:Indian programs ......................... 462 493 449 448 447 450 451Rural development programs .... 478 23 63 60 10 8 6
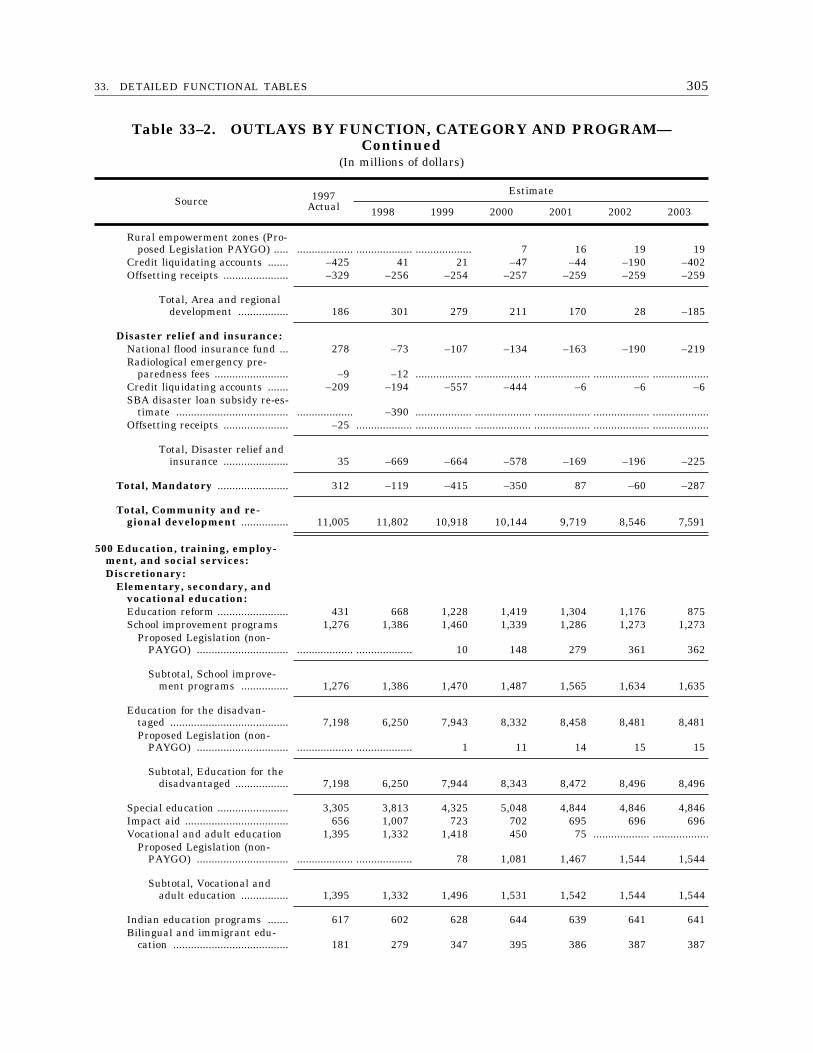
30533. DETAILED FUNCTIONAL TABLES
Table 33–2. OUTLAYS BY FUNCTION, CATEGORY AND PROGRAM—Continued
(In millions of dollars)
Source 1997Actual
Estimate
1998 1999 2000 2001 2002 2003
Rural empowerment zones (Pro-posed Legislation PAYGO) ..... ................... ................... ................... 7 16 19 19
Credit liquidating accounts ....... –425 41 21 –47 –44 –190 –402Offsetting receipts ...................... –329 –256 –254 –257 –259 –259 –259
Total, Area and regionaldevelopment ................. 186 301 279 211 170 28 –185
Disaster relief and insurance:National flood insurance fund ... 278 –73 –107 –134 –163 –190 –219Radiological emergency pre-
paredness fees ......................... –9 –12 ................... ................... ................... ................... ...................Credit liquidating accounts ....... –209 –194 –557 –444 –6 –6 –6SBA disaster loan subsidy re-es-
timate ...................................... ................... –390 ................... ................... ................... ................... ...................Offsetting receipts ...................... –25 ................... ................... ................... ................... ................... ...................
Total, Disaster relief andinsurance ...................... 35 –669 –664 –578 –169 –196 –225
Total, Mandatory ........................ 312 –119 –415 –350 87 –60 –287
Total, Community and re-gional development ................ 11,005 11,802 10,918 10,144 9,719 8,546 7,591
500 Education, training, employ-ment, and social services:Discretionary:
Elementary, secondary, andvocational education:Education reform ........................ 431 668 1,228 1,419 1,304 1,176 875School improvement programs 1,276 1,386 1,460 1,339 1,286 1,273 1,273
Proposed Legislation (non-PAYGO) ............................... ................... ................... 10 148 279 361 362
Subtotal, School improve-ment programs ................ 1,276 1,386 1,470 1,487 1,565 1,634 1,635
Education for the disadvan-taged ........................................ 7,198 6,250 7,943 8,332 8,458 8,481 8,481Proposed Legislation (non-
PAYGO) ............................... ................... ................... 1 11 14 15 15
Subtotal, Education for thedisadvantaged .................. 7,198 6,250 7,944 8,343 8,472 8,496 8,496
Special education ........................ 3,305 3,813 4,325 5,048 4,844 4,846 4,846Impact aid ................................... 656 1,007 723 702 695 696 696Vocational and adult education 1,395 1,332 1,418 450 75 ................... ...................
Proposed Legislation (non-PAYGO) ............................... ................... ................... 78 1,081 1,467 1,544 1,544
Subtotal, Vocational andadult education ................ 1,395 1,332 1,496 1,531 1,542 1,544 1,544
Indian education programs ....... 617 602 628 644 639 641 641Bilingual and immigrant edu-
cation ....................................... 181 279 347 395 386 387 387
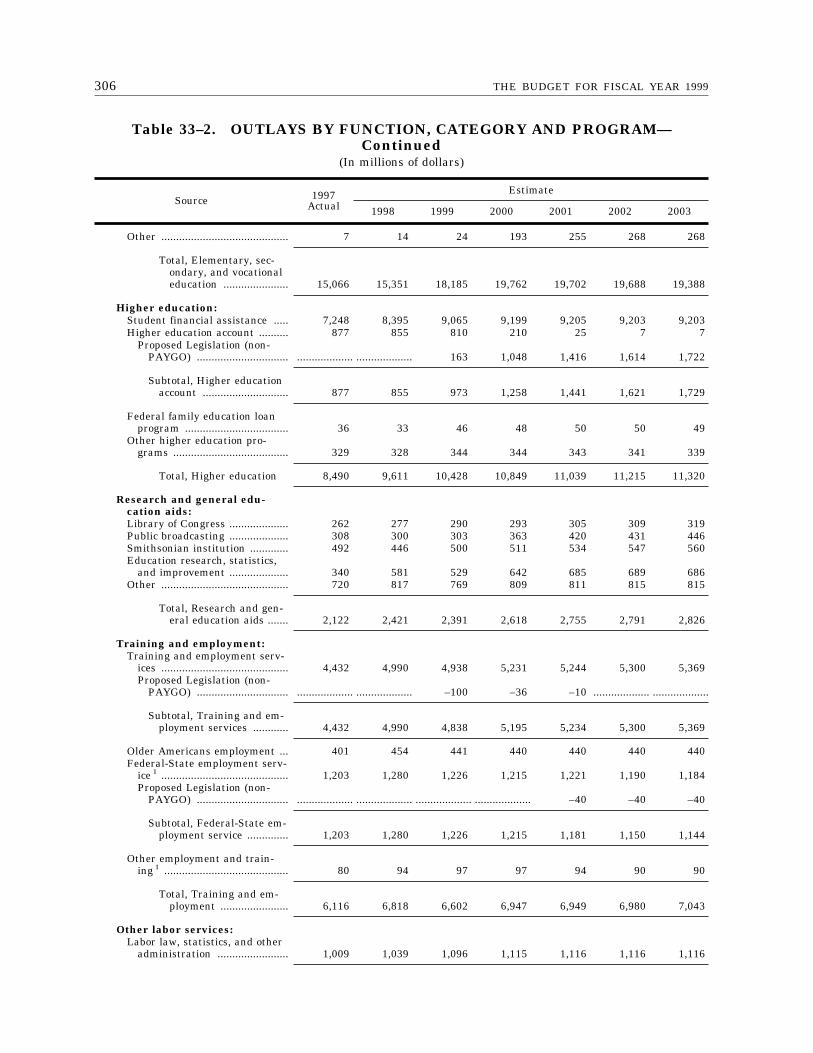
306 THE BUDGET FOR FISCAL YEAR 1999
Table 33–2. OUTLAYS BY FUNCTION, CATEGORY AND PROGRAM—Continued
(In millions of dollars)
Source 1997Actual
Estimate
1998 1999 2000 2001 2002 2003
Other ........................................... 7 14 24 193 255 268 268
Total, Elementary, sec-ondary, and vocationaleducation ...................... 15,066 15,351 18,185 19,762 19,702 19,688 19,388
Higher education:Student financial assistance ..... 7,248 8,395 9,065 9,199 9,205 9,203 9,203Higher education account .......... 877 855 810 210 25 7 7
Proposed Legislation (non-PAYGO) ............................... ................... ................... 163 1,048 1,416 1,614 1,722
Subtotal, Higher educationaccount ............................. 877 855 973 1,258 1,441 1,621 1,729
Federal family education loanprogram ................................... 36 33 46 48 50 50 49
Other higher education pro-grams ....................................... 329 328 344 344 343 341 339
Total, Higher education 8,490 9,611 10,428 10,849 11,039 11,215 11,320
Research and general edu-cation aids:Library of Congress .................... 262 277 290 293 305 309 319Public broadcasting .................... 308 300 303 363 420 431 446Smithsonian institution ............. 492 446 500 511 534 547 560Education research, statistics,
and improvement .................... 340 581 529 642 685 689 686Other ........................................... 720 817 769 809 811 815 815
Total, Research and gen-eral education aids ....... 2,122 2,421 2,391 2,618 2,755 2,791 2,826
Training and employment:Training and employment serv-
ices ........................................... 4,432 4,990 4,938 5,231 5,244 5,300 5,369Proposed Legislation (non-
PAYGO) ............................... ................... ................... –100 –36 –10 ................... ...................
Subtotal, Training and em-ployment services ............ 4,432 4,990 4,838 5,195 5,234 5,300 5,369
Older Americans employment ... 401 454 441 440 440 440 440Federal-State employment serv-
ice 1 ........................................... 1,203 1,280 1,226 1,215 1,221 1,190 1,184Proposed Legislation (non-
PAYGO) ............................... ................... ................... ................... ................... –40 –40 –40
Subtotal, Federal-State em-ployment service .............. 1,203 1,280 1,226 1,215 1,181 1,150 1,144
Other employment and train-ing 1 .......................................... 80 94 97 97 94 90 90
Total, Training and em-ployment ....................... 6,116 6,818 6,602 6,947 6,949 6,980 7,043
Other labor services:Labor law, statistics, and other
administration ........................ 1,009 1,039 1,096 1,115 1,116 1,116 1,116

30733. DETAILED FUNCTIONAL TABLES
Table 33–2. OUTLAYS BY FUNCTION, CATEGORY AND PROGRAM—Continued
(In millions of dollars)
Source 1997Actual
Estimate
1998 1999 2000 2001 2002 2003
Social services:National service initiative ......... 565 550 683 711 742 768 789Children and families services
programs ................................. 5,122 5,500 5,786 6,089 6,344 6,525 6,642Aging services program ............. 828 851 860 878 871 871 871Other ........................................... ................... 5 –422 –479 –556 –612 –996
Total, Social services ....... 6,515 6,906 6,907 7,199 7,401 7,552 7,306
Total, Discretionary ................... 39,318 42,146 45,609 48,490 48,962 49,342 48,999
Mandatory:Elementary, secondary, and
vocational education:Vocational and adult education 7 6 2 ................... ................... ................... ...................New teachers and smaller class
size (Proposed LegislationPAYGO) ................................... ................... ................... 55 780 1,195 1,440 1,632
Total, Elementary, sec-ondary, and vocationaleducation ...................... 7 6 57 780 1,195 1,440 1,632
Higher education:Federal family education loan
program ................................... 2,857 2,283 1,788 1,828 1,902 968 2,044Proposed Legislation
(PAYGO) .............................. ................... –158 –142 –538 –532 –432 –304
Subtotal, Federal familyeducation loan program 2,857 2,125 1,646 1,290 1,370 536 1,740
Federal direct loan program ...... 659 941 971 1,084 1,134 1,149 1,143Proposed Legislation
(PAYGO) .............................. ................... ................... 20 44 82 149 233
Subtotal, Federal directloan program .................... 659 941 991 1,128 1,216 1,298 1,376
Other higher education pro-grams ....................................... –80 –69 –61 –26 –24 –21 –18
Credit liquidating account(Family education loan pro-gram) ....................................... 372 –190 –534 –785 –912 –964 –967Proposed Legislation
(PAYGO) .............................. ................... ................... –17 –66 –62 –58 –53
Subtotal, Credit liquidatingaccount (Family edu-cation loan program) ....... 372 –190 –551 –851 –974 –1,022 –1,020
Total, Higher education 3,808 2,807 2,025 1,541 1,588 791 2,078
Research and general edu-cation aids:Mandatory programs ................. 14 13 13 13 15 15 16
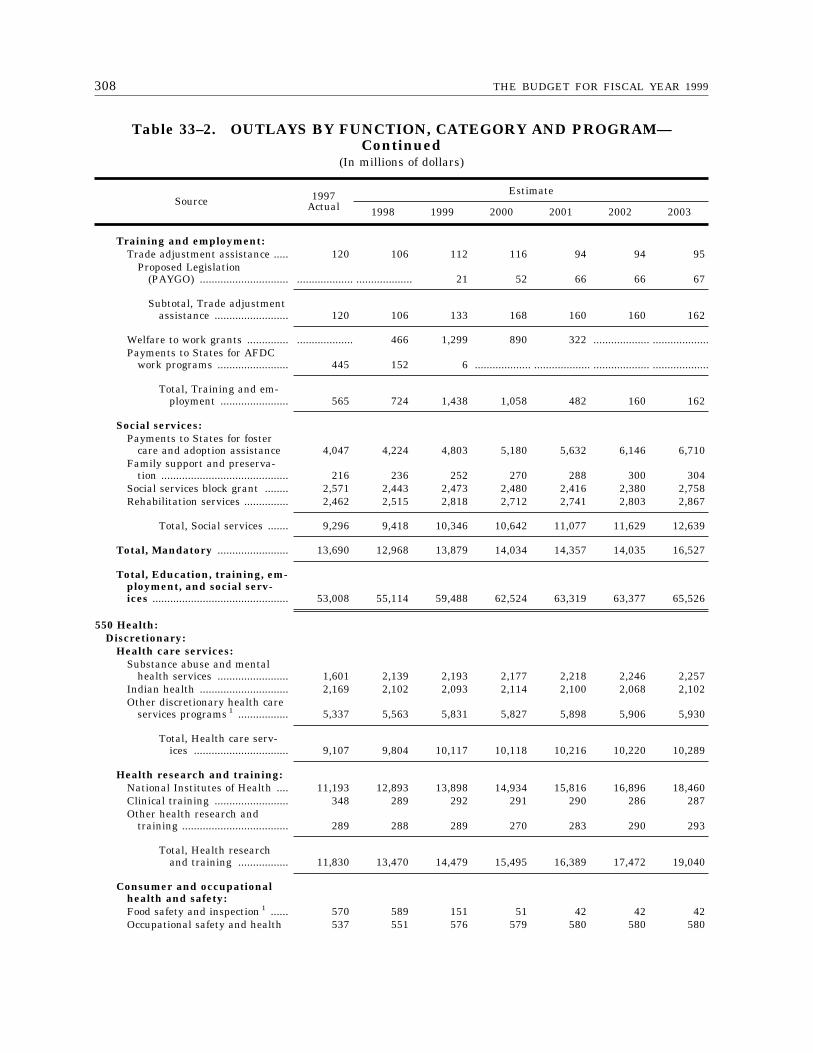
308 THE BUDGET FOR FISCAL YEAR 1999
Table 33–2. OUTLAYS BY FUNCTION, CATEGORY AND PROGRAM—Continued
(In millions of dollars)
Source 1997Actual
Estimate
1998 1999 2000 2001 2002 2003
Training and employment:Trade adjustment assistance ..... 120 106 112 116 94 94 95
Proposed Legislation(PAYGO) .............................. ................... ................... 21 52 66 66 67
Subtotal, Trade adjustmentassistance ......................... 120 106 133 168 160 160 162
Welfare to work grants .............. ................... 466 1,299 890 322 ................... ...................Payments to States for AFDC
work programs ........................ 445 152 6 ................... ................... ................... ...................
Total, Training and em-ployment ....................... 565 724 1,438 1,058 482 160 162
Social services:Payments to States for foster
care and adoption assistance 4,047 4,224 4,803 5,180 5,632 6,146 6,710Family support and preserva-
tion ........................................... 216 236 252 270 288 300 304Social services block grant ........ 2,571 2,443 2,473 2,480 2,416 2,380 2,758Rehabilitation services ............... 2,462 2,515 2,818 2,712 2,741 2,803 2,867
Total, Social services ....... 9,296 9,418 10,346 10,642 11,077 11,629 12,639
Total, Mandatory ........................ 13,690 12,968 13,879 14,034 14,357 14,035 16,527
Total, Education, training, em-ployment, and social serv-ices .............................................. 53,008 55,114 59,488 62,524 63,319 63,377 65,526
550 Health:Discretionary:
Health care services:Substance abuse and mental
health services ........................ 1,601 2,139 2,193 2,177 2,218 2,246 2,257Indian health .............................. 2,169 2,102 2,093 2,114 2,100 2,068 2,102Other discretionary health care
services programs 1 ................. 5,337 5,563 5,831 5,827 5,898 5,906 5,930
Total, Health care serv-ices ................................ 9,107 9,804 10,117 10,118 10,216 10,220 10,289
Health research and training:National Institutes of Health .... 11,193 12,893 13,898 14,934 15,816 16,896 18,460Clinical training ......................... 348 289 292 291 290 286 287Other health research and
training .................................... 289 288 289 270 283 290 293
Total, Health researchand training ................. 11,830 13,470 14,479 15,495 16,389 17,472 19,040
Consumer and occupationalhealth and safety:Food safety and inspection 1 ...... 570 589 151 51 42 42 42Occupational safety and health 537 551 576 579 580 580 580
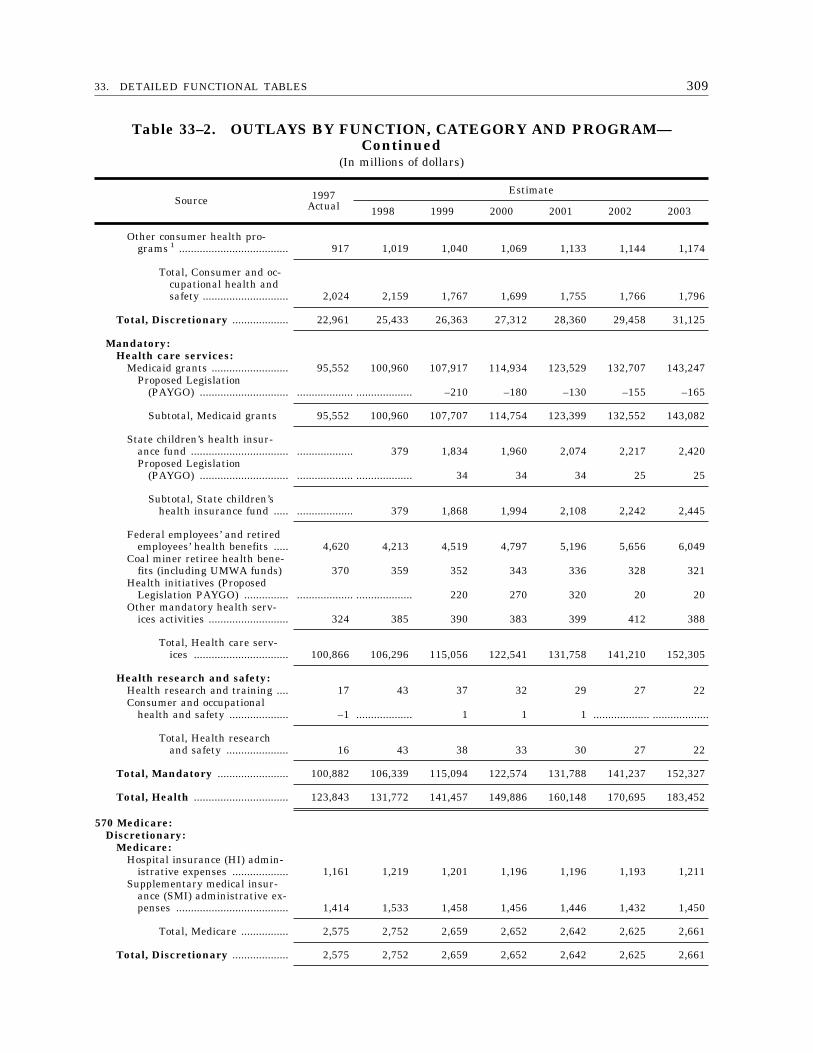
30933. DETAILED FUNCTIONAL TABLES
Table 33–2. OUTLAYS BY FUNCTION, CATEGORY AND PROGRAM—Continued
(In millions of dollars)
Source 1997Actual
Estimate
1998 1999 2000 2001 2002 2003
Other consumer health pro-grams 1 ..................................... 917 1,019 1,040 1,069 1,133 1,144 1,174
Total, Consumer and oc-cupational health andsafety ............................. 2,024 2,159 1,767 1,699 1,755 1,766 1,796
Total, Discretionary ................... 22,961 25,433 26,363 27,312 28,360 29,458 31,125
Mandatory:Health care services:
Medicaid grants .......................... 95,552 100,960 107,917 114,934 123,529 132,707 143,247Proposed Legislation
(PAYGO) .............................. ................... ................... –210 –180 –130 –155 –165
Subtotal, Medicaid grants 95,552 100,960 107,707 114,754 123,399 132,552 143,082
State children’s health insur-ance fund ................................. ................... 379 1,834 1,960 2,074 2,217 2,420Proposed Legislation
(PAYGO) .............................. ................... ................... 34 34 34 25 25
Subtotal, State children’shealth insurance fund ..... ................... 379 1,868 1,994 2,108 2,242 2,445
Federal employees’ and retiredemployees’ health benefits ..... 4,620 4,213 4,519 4,797 5,196 5,656 6,049
Coal miner retiree health bene-fits (including UMWA funds) 370 359 352 343 336 328 321
Health initiatives (ProposedLegislation PAYGO) ............... ................... ................... 220 270 320 20 20
Other mandatory health serv-ices activities ........................... 324 385 390 383 399 412 388
Total, Health care serv-ices ................................ 100,866 106,296 115,056 122,541 131,758 141,210 152,305
Health research and safety:Health research and training .... 17 43 37 32 29 27 22Consumer and occupational
health and safety .................... –1 ................... 1 1 1 ................... ...................
Total, Health researchand safety ..................... 16 43 38 33 30 27 22
Total, Mandatory ........................ 100,882 106,339 115,094 122,574 131,788 141,237 152,327
Total, Health ................................ 123,843 131,772 141,457 149,886 160,148 170,695 183,452
570 Medicare:Discretionary:
Medicare:Hospital insurance (HI) admin-
istrative expenses ................... 1,161 1,219 1,201 1,196 1,196 1,193 1,211Supplementary medical insur-
ance (SMI) administrative ex-penses ...................................... 1,414 1,533 1,458 1,456 1,446 1,432 1,450
Total, Medicare ................ 2,575 2,752 2,659 2,652 2,642 2,625 2,661
Total, Discretionary ................... 2,575 2,752 2,659 2,652 2,642 2,625 2,661
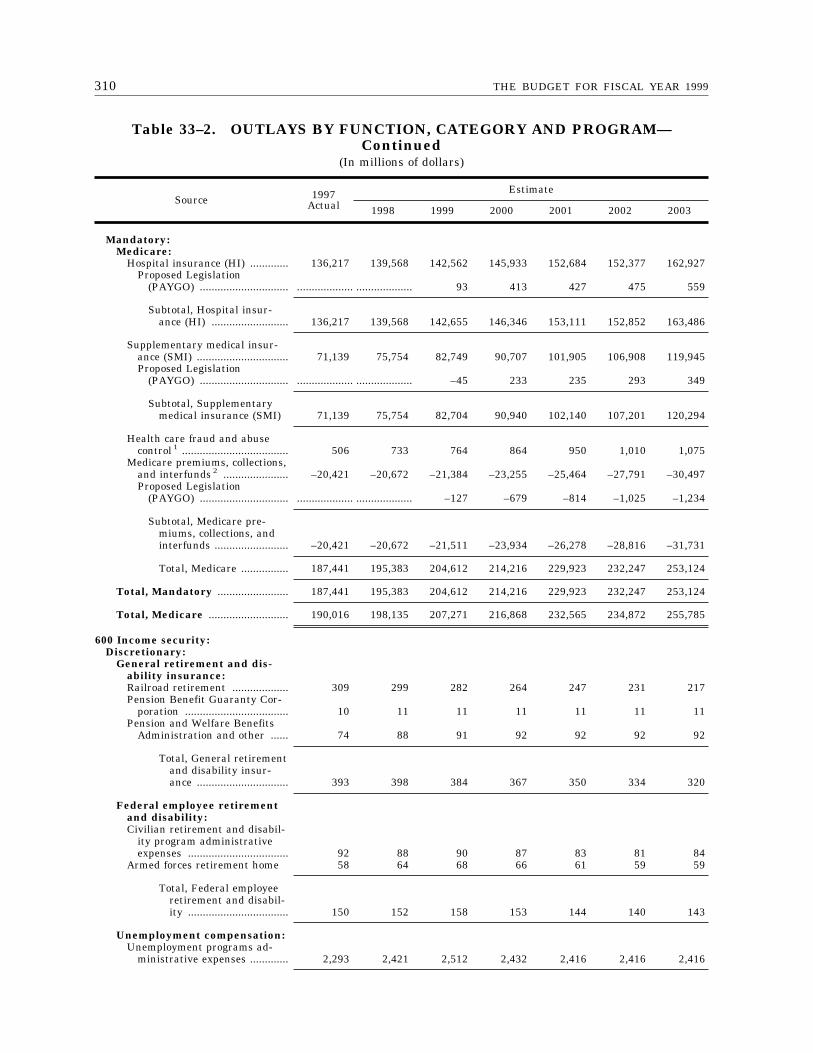
310 THE BUDGET FOR FISCAL YEAR 1999
Table 33–2. OUTLAYS BY FUNCTION, CATEGORY AND PROGRAM—Continued
(In millions of dollars)
Source 1997Actual
Estimate
1998 1999 2000 2001 2002 2003
Mandatory:Medicare:
Hospital insurance (HI) ............. 136,217 139,568 142,562 145,933 152,684 152,377 162,927Proposed Legislation
(PAYGO) .............................. ................... ................... 93 413 427 475 559
Subtotal, Hospital insur-ance (HI) .......................... 136,217 139,568 142,655 146,346 153,111 152,852 163,486
Supplementary medical insur-ance (SMI) ............................... 71,139 75,754 82,749 90,707 101,905 106,908 119,945Proposed Legislation
(PAYGO) .............................. ................... ................... –45 233 235 293 349
Subtotal, Supplementarymedical insurance (SMI) 71,139 75,754 82,704 90,940 102,140 107,201 120,294
Health care fraud and abusecontrol 1 .................................... 506 733 764 864 950 1,010 1,075
Medicare premiums, collections,and interfunds 2 ...................... –20,421 –20,672 –21,384 –23,255 –25,464 –27,791 –30,497Proposed Legislation
(PAYGO) .............................. ................... ................... –127 –679 –814 –1,025 –1,234
Subtotal, Medicare pre-miums, collections, andinterfunds ......................... –20,421 –20,672 –21,511 –23,934 –26,278 –28,816 –31,731
Total, Medicare ................ 187,441 195,383 204,612 214,216 229,923 232,247 253,124
Total, Mandatory ........................ 187,441 195,383 204,612 214,216 229,923 232,247 253,124
Total, Medicare ........................... 190,016 198,135 207,271 216,868 232,565 234,872 255,785
600 Income security:Discretionary:
General retirement and dis-ability insurance:Railroad retirement ................... 309 299 282 264 247 231 217Pension Benefit Guaranty Cor-
poration ................................... 10 11 11 11 11 11 11Pension and Welfare Benefits
Administration and other ...... 74 88 91 92 92 92 92
Total, General retirementand disability insur-ance ............................... 393 398 384 367 350 334 320
Federal employee retirementand disability:Civilian retirement and disabil-
ity program administrativeexpenses .................................. 92 88 90 87 83 81 84
Armed forces retirement home 58 64 68 66 61 59 59
Total, Federal employeeretirement and disabil-ity .................................. 150 152 158 153 144 140 143
Unemployment compensation:Unemployment programs ad-
ministrative expenses ............. 2,293 2,421 2,512 2,432 2,416 2,416 2,416
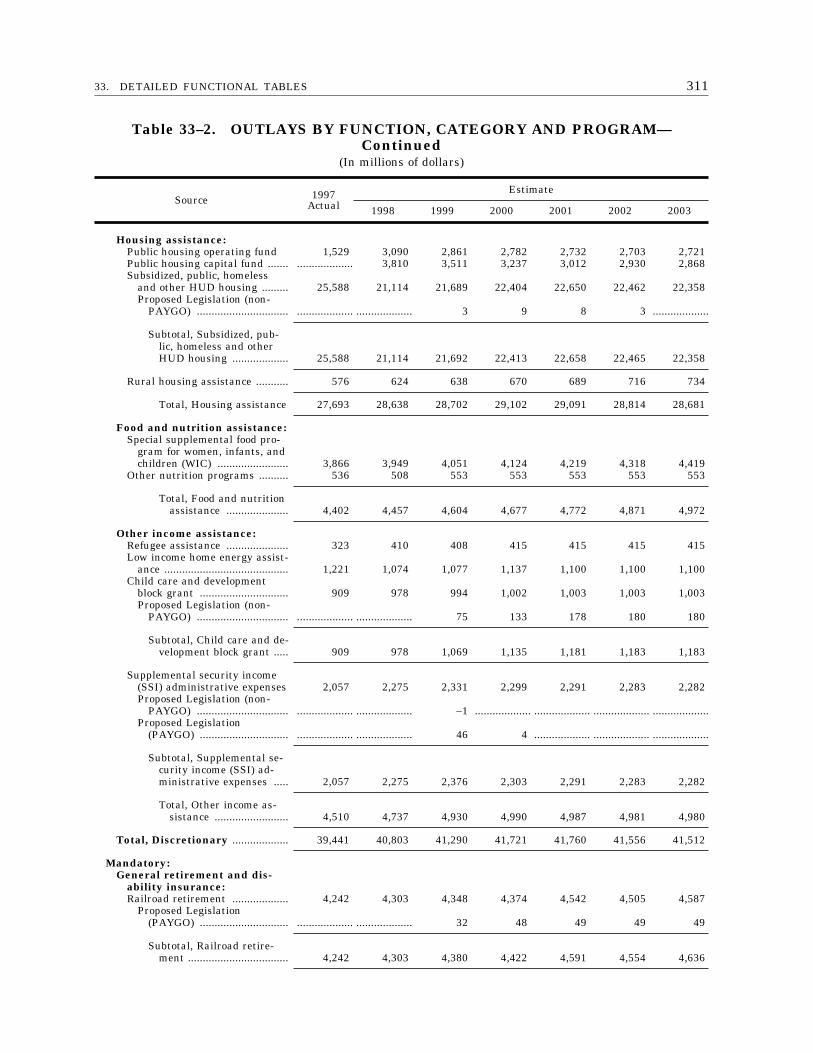
31133. DETAILED FUNCTIONAL TABLES
Table 33–2. OUTLAYS BY FUNCTION, CATEGORY AND PROGRAM—Continued
(In millions of dollars)
Source 1997Actual
Estimate
1998 1999 2000 2001 2002 2003
Housing assistance:Public housing operating fund 1,529 3,090 2,861 2,782 2,732 2,703 2,721Public housing capital fund ....... ................... 3,810 3,511 3,237 3,012 2,930 2,868Subsidized, public, homeless
and other HUD housing ......... 25,588 21,114 21,689 22,404 22,650 22,462 22,358Proposed Legislation (non-
PAYGO) ............................... ................... ................... 3 9 8 3 ...................
Subtotal, Subsidized, pub-lic, homeless and otherHUD housing ................... 25,588 21,114 21,692 22,413 22,658 22,465 22,358
Rural housing assistance ........... 576 624 638 670 689 716 734
Total, Housing assistance 27,693 28,638 28,702 29,102 29,091 28,814 28,681
Food and nutrition assistance:Special supplemental food pro-
gram for women, infants, andchildren (WIC) ........................ 3,866 3,949 4,051 4,124 4,219 4,318 4,419
Other nutrition programs .......... 536 508 553 553 553 553 553
Total, Food and nutritionassistance ..................... 4,402 4,457 4,604 4,677 4,772 4,871 4,972
Other income assistance:Refugee assistance ..................... 323 410 408 415 415 415 415Low income home energy assist-
ance .......................................... 1,221 1,074 1,077 1,137 1,100 1,100 1,100Child care and development
block grant .............................. 909 978 994 1,002 1,003 1,003 1,003Proposed Legislation (non-
PAYGO) ............................... ................... ................... 75 133 178 180 180
Subtotal, Child care and de-velopment block grant ..... 909 978 1,069 1,135 1,181 1,183 1,183
Supplemental security income(SSI) administrative expenses 2,057 2,275 2,331 2,299 2,291 2,283 2,282Proposed Legislation (non-
PAYGO) ............................... ................... ................... –1 ................... ................... ................... ...................Proposed Legislation
(PAYGO) .............................. ................... ................... 46 4 ................... ................... ...................
Subtotal, Supplemental se-curity income (SSI) ad-ministrative expenses ..... 2,057 2,275 2,376 2,303 2,291 2,283 2,282
Total, Other income as-sistance ......................... 4,510 4,737 4,930 4,990 4,987 4,981 4,980
Total, Discretionary ................... 39,441 40,803 41,290 41,721 41,760 41,556 41,512
Mandatory:General retirement and dis-
ability insurance:Railroad retirement ................... 4,242 4,303 4,348 4,374 4,542 4,505 4,587
Proposed Legislation(PAYGO) .............................. ................... ................... 32 48 49 49 49
Subtotal, Railroad retire-ment .................................. 4,242 4,303 4,380 4,422 4,591 4,554 4,636
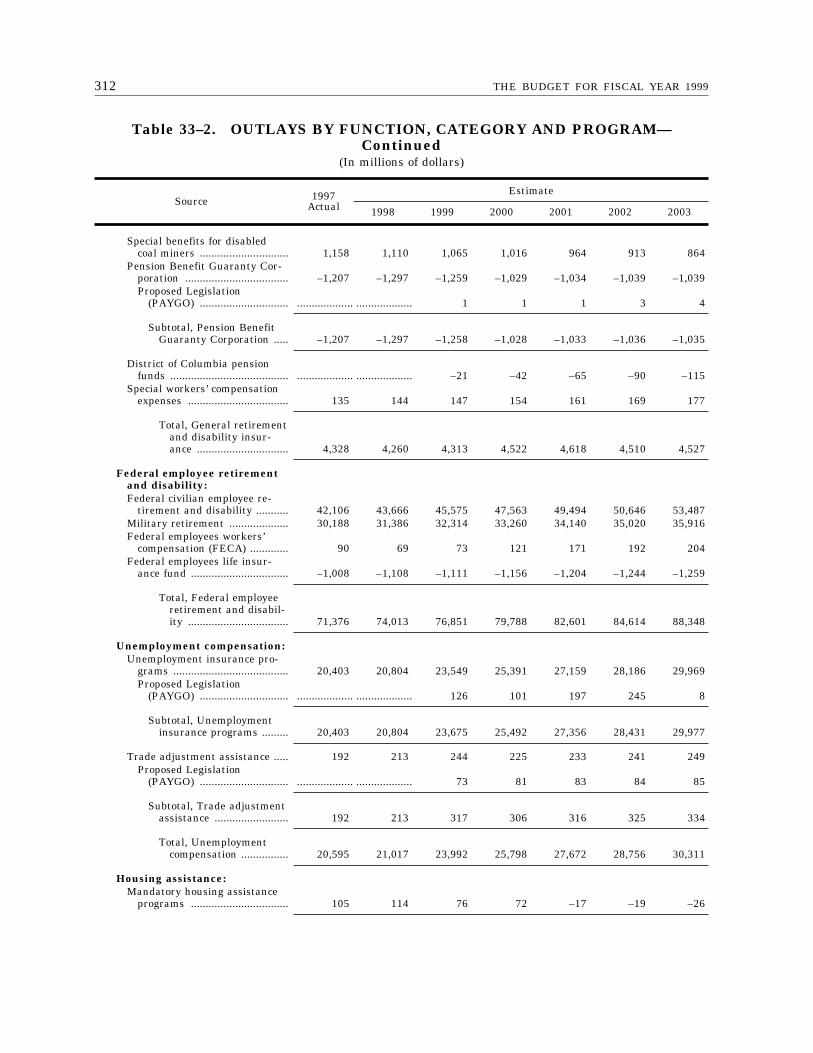
312 THE BUDGET FOR FISCAL YEAR 1999
Table 33–2. OUTLAYS BY FUNCTION, CATEGORY AND PROGRAM—Continued
(In millions of dollars)
Source 1997Actual
Estimate
1998 1999 2000 2001 2002 2003
Special benefits for disabledcoal miners .............................. 1,158 1,110 1,065 1,016 964 913 864
Pension Benefit Guaranty Cor-poration ................................... –1,207 –1,297 –1,259 –1,029 –1,034 –1,039 –1,039Proposed Legislation
(PAYGO) .............................. ................... ................... 1 1 1 3 4
Subtotal, Pension BenefitGuaranty Corporation ..... –1,207 –1,297 –1,258 –1,028 –1,033 –1,036 –1,035
District of Columbia pensionfunds ........................................ ................... ................... –21 –42 –65 –90 –115
Special workers’ compensationexpenses .................................. 135 144 147 154 161 169 177
Total, General retirementand disability insur-ance ............................... 4,328 4,260 4,313 4,522 4,618 4,510 4,527
Federal employee retirementand disability:Federal civilian employee re-
tirement and disability ........... 42,106 43,666 45,575 47,563 49,494 50,646 53,487Military retirement .................... 30,188 31,386 32,314 33,260 34,140 35,020 35,916Federal employees workers’
compensation (FECA) ............. 90 69 73 121 171 192 204Federal employees life insur-
ance fund ................................. –1,008 –1,108 –1,111 –1,156 –1,204 –1,244 –1,259
Total, Federal employeeretirement and disabil-ity .................................. 71,376 74,013 76,851 79,788 82,601 84,614 88,348
Unemployment compensation:Unemployment insurance pro-
grams ....................................... 20,403 20,804 23,549 25,391 27,159 28,186 29,969Proposed Legislation
(PAYGO) .............................. ................... ................... 126 101 197 245 8
Subtotal, Unemploymentinsurance programs ......... 20,403 20,804 23,675 25,492 27,356 28,431 29,977
Trade adjustment assistance ..... 192 213 244 225 233 241 249Proposed Legislation
(PAYGO) .............................. ................... ................... 73 81 83 84 85
Subtotal, Trade adjustmentassistance ......................... 192 213 317 306 316 325 334
Total, Unemploymentcompensation ................ 20,595 21,017 23,992 25,798 27,672 28,756 30,311
Housing assistance:Mandatory housing assistance
programs ................................. 105 114 76 72 –17 –19 –26
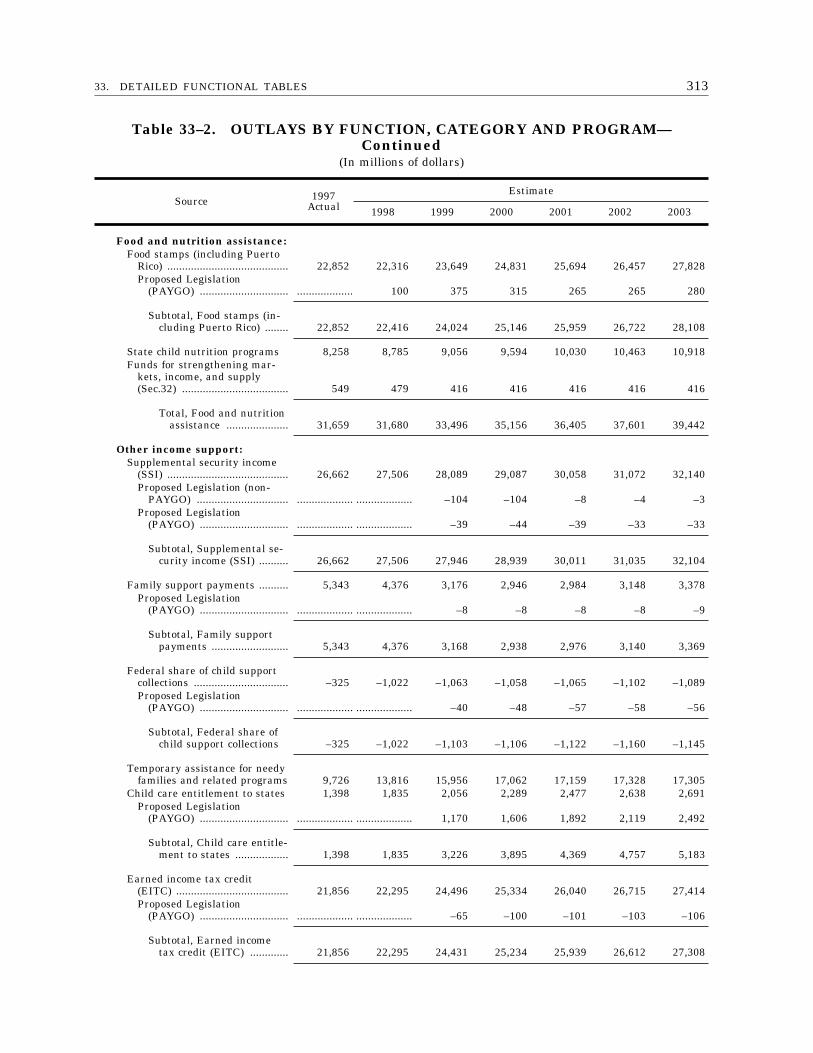
31333. DETAILED FUNCTIONAL TABLES
Table 33–2. OUTLAYS BY FUNCTION, CATEGORY AND PROGRAM—Continued
(In millions of dollars)
Source 1997Actual
Estimate
1998 1999 2000 2001 2002 2003
Food and nutrition assistance:Food stamps (including Puerto
Rico) ......................................... 22,852 22,316 23,649 24,831 25,694 26,457 27,828Proposed Legislation
(PAYGO) .............................. ................... 100 375 315 265 265 280
Subtotal, Food stamps (in-cluding Puerto Rico) ........ 22,852 22,416 24,024 25,146 25,959 26,722 28,108
State child nutrition programs 8,258 8,785 9,056 9,594 10,030 10,463 10,918Funds for strengthening mar-
kets, income, and supply(Sec.32) .................................... 549 479 416 416 416 416 416
Total, Food and nutritionassistance ..................... 31,659 31,680 33,496 35,156 36,405 37,601 39,442
Other income support:Supplemental security income
(SSI) ......................................... 26,662 27,506 28,089 29,087 30,058 31,072 32,140Proposed Legislation (non-
PAYGO) ............................... ................... ................... –104 –104 –8 –4 –3Proposed Legislation
(PAYGO) .............................. ................... ................... –39 –44 –39 –33 –33
Subtotal, Supplemental se-curity income (SSI) .......... 26,662 27,506 27,946 28,939 30,011 31,035 32,104
Family support payments .......... 5,343 4,376 3,176 2,946 2,984 3,148 3,378Proposed Legislation
(PAYGO) .............................. ................... ................... –8 –8 –8 –8 –9
Subtotal, Family supportpayments .......................... 5,343 4,376 3,168 2,938 2,976 3,140 3,369
Federal share of child supportcollections ................................ –325 –1,022 –1,063 –1,058 –1,065 –1,102 –1,089Proposed Legislation
(PAYGO) .............................. ................... ................... –40 –48 –57 –58 –56
Subtotal, Federal share ofchild support collections –325 –1,022 –1,103 –1,106 –1,122 –1,160 –1,145
Temporary assistance for needyfamilies and related programs 9,726 13,816 15,956 17,062 17,159 17,328 17,305
Child care entitlement to states 1,398 1,835 2,056 2,289 2,477 2,638 2,691Proposed Legislation
(PAYGO) .............................. ................... ................... 1,170 1,606 1,892 2,119 2,492
Subtotal, Child care entitle-ment to states .................. 1,398 1,835 3,226 3,895 4,369 4,757 5,183
Earned income tax credit(EITC) ...................................... 21,856 22,295 24,496 25,334 26,040 26,715 27,414Proposed Legislation
(PAYGO) .............................. ................... ................... –65 –100 –101 –103 –106
Subtotal, Earned incometax credit (EITC) ............. 21,856 22,295 24,431 25,234 25,939 26,612 27,308
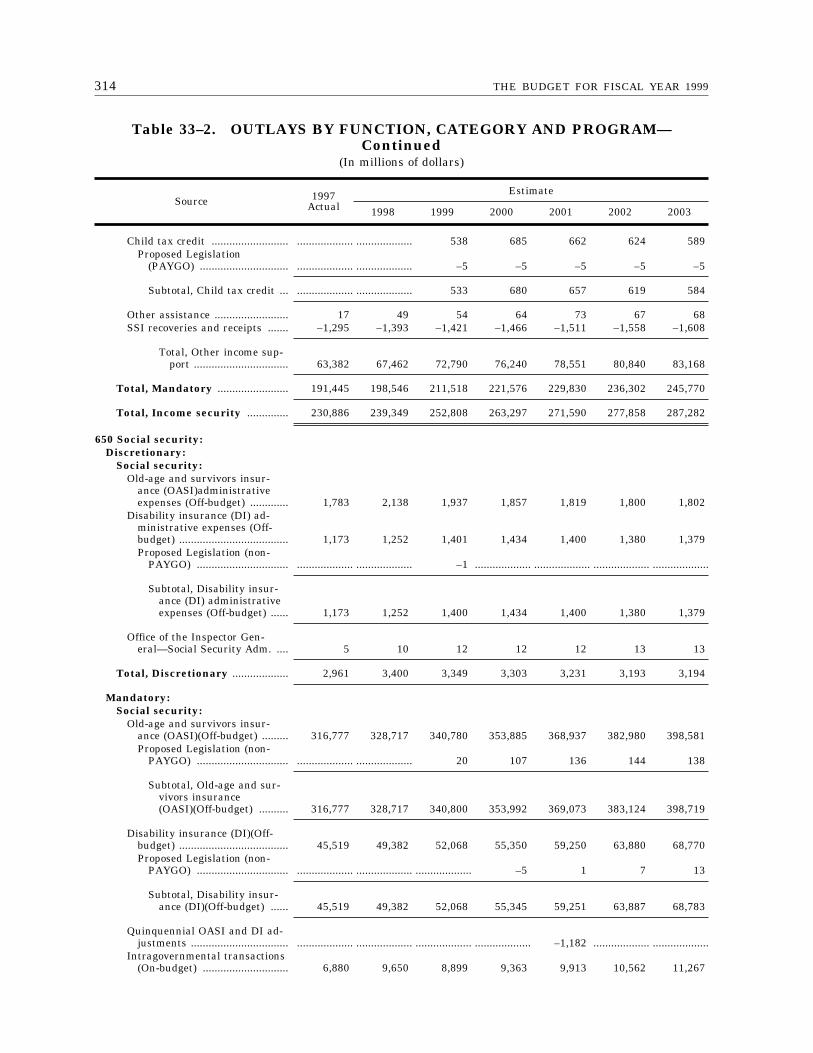
314 THE BUDGET FOR FISCAL YEAR 1999
Table 33–2. OUTLAYS BY FUNCTION, CATEGORY AND PROGRAM—Continued
(In millions of dollars)
Source 1997Actual
Estimate
1998 1999 2000 2001 2002 2003
Child tax credit .......................... ................... ................... 538 685 662 624 589Proposed Legislation
(PAYGO) .............................. ................... ................... –5 –5 –5 –5 –5
Subtotal, Child tax credit ... ................... ................... 533 680 657 619 584
Other assistance ......................... 17 49 54 64 73 67 68SSI recoveries and receipts ....... –1,295 –1,393 –1,421 –1,466 –1,511 –1,558 –1,608
Total, Other income sup-port ................................ 63,382 67,462 72,790 76,240 78,551 80,840 83,168
Total, Mandatory ........................ 191,445 198,546 211,518 221,576 229,830 236,302 245,770
Total, Income security .............. 230,886 239,349 252,808 263,297 271,590 277,858 287,282
650 Social security:Discretionary:
Social security:Old-age and survivors insur-
ance (OASI)administrativeexpenses (Off-budget) ............. 1,783 2,138 1,937 1,857 1,819 1,800 1,802
Disability insurance (DI) ad-ministrative expenses (Off-budget) ..................................... 1,173 1,252 1,401 1,434 1,400 1,380 1,379Proposed Legislation (non-
PAYGO) ............................... ................... ................... –1 ................... ................... ................... ...................
Subtotal, Disability insur-ance (DI) administrativeexpenses (Off-budget) ...... 1,173 1,252 1,400 1,434 1,400 1,380 1,379
Office of the Inspector Gen-eral—Social Security Adm. .... 5 10 12 12 12 13 13
Total, Discretionary ................... 2,961 3,400 3,349 3,303 3,231 3,193 3,194
Mandatory:Social security:
Old-age and survivors insur-ance (OASI)(Off-budget) ......... 316,777 328,717 340,780 353,885 368,937 382,980 398,581Proposed Legislation (non-
PAYGO) ............................... ................... ................... 20 107 136 144 138
Subtotal, Old-age and sur-vivors insurance(OASI)(Off-budget) .......... 316,777 328,717 340,800 353,992 369,073 383,124 398,719
Disability insurance (DI)(Off-budget) ..................................... 45,519 49,382 52,068 55,350 59,250 63,880 68,770Proposed Legislation (non-
PAYGO) ............................... ................... ................... ................... –5 1 7 13
Subtotal, Disability insur-ance (DI)(Off-budget) ...... 45,519 49,382 52,068 55,345 59,251 63,887 68,783
Quinquennial OASI and DI ad-justments ................................. ................... ................... ................... ................... –1,182 ................... ...................
Intragovernmental transactions(On-budget) ............................. 6,880 9,650 8,899 9,363 9,913 10,562 11,267
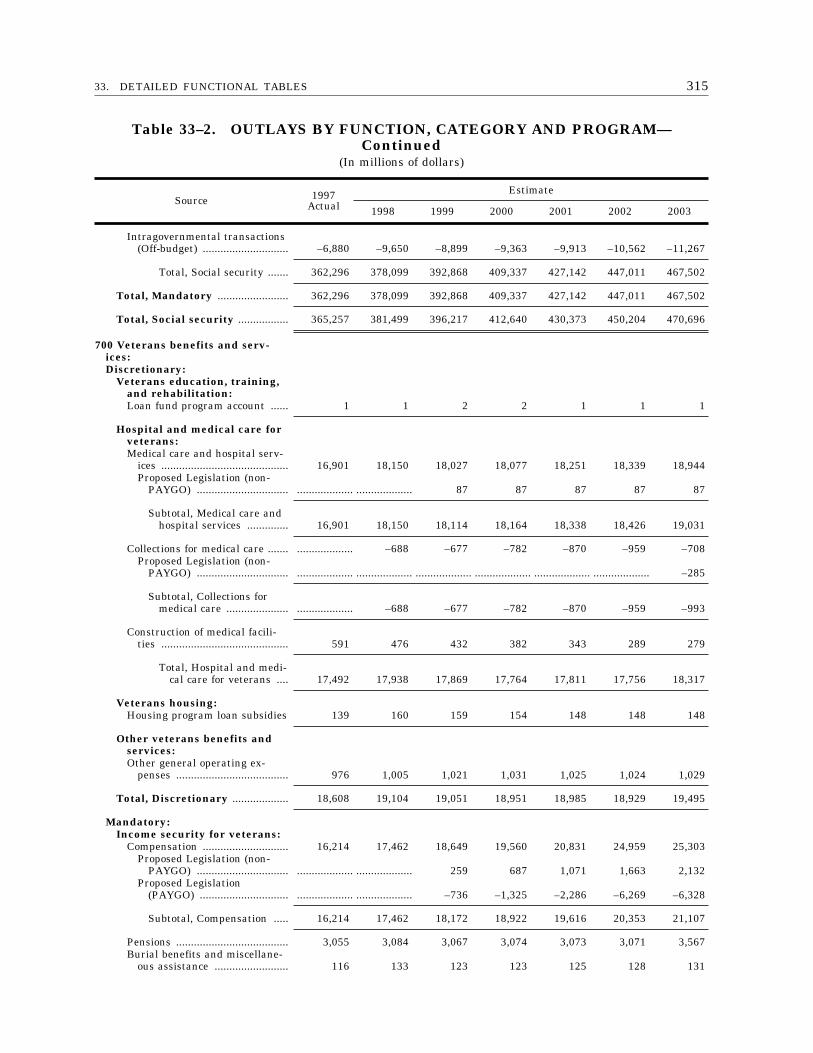
31533. DETAILED FUNCTIONAL TABLES
Table 33–2. OUTLAYS BY FUNCTION, CATEGORY AND PROGRAM—Continued
(In millions of dollars)
Source 1997Actual
Estimate
1998 1999 2000 2001 2002 2003
Intragovernmental transactions(Off-budget) ............................. –6,880 –9,650 –8,899 –9,363 –9,913 –10,562 –11,267
Total, Social security ....... 362,296 378,099 392,868 409,337 427,142 447,011 467,502
Total, Mandatory ........................ 362,296 378,099 392,868 409,337 427,142 447,011 467,502
Total, Social security ................. 365,257 381,499 396,217 412,640 430,373 450,204 470,696
700 Veterans benefits and serv-ices:Discretionary:
Veterans education, training,and rehabilitation:Loan fund program account ...... 1 1 2 2 1 1 1
Hospital and medical care forveterans:Medical care and hospital serv-
ices ........................................... 16,901 18,150 18,027 18,077 18,251 18,339 18,944Proposed Legislation (non-
PAYGO) ............................... ................... ................... 87 87 87 87 87
Subtotal, Medical care andhospital services .............. 16,901 18,150 18,114 18,164 18,338 18,426 19,031
Collections for medical care ....... ................... –688 –677 –782 –870 –959 –708Proposed Legislation (non-
PAYGO) ............................... ................... ................... ................... ................... ................... ................... –285
Subtotal, Collections formedical care ..................... ................... –688 –677 –782 –870 –959 –993
Construction of medical facili-ties ........................................... 591 476 432 382 343 289 279
Total, Hospital and medi-cal care for veterans .... 17,492 17,938 17,869 17,764 17,811 17,756 18,317
Veterans housing:Housing program loan subsidies 139 160 159 154 148 148 148
Other veterans benefits andservices:Other general operating ex-
penses ...................................... 976 1,005 1,021 1,031 1,025 1,024 1,029
Total, Discretionary ................... 18,608 19,104 19,051 18,951 18,985 18,929 19,495
Mandatory:Income security for veterans:
Compensation ............................. 16,214 17,462 18,649 19,560 20,831 24,959 25,303Proposed Legislation (non-
PAYGO) ............................... ................... ................... 259 687 1,071 1,663 2,132Proposed Legislation
(PAYGO) .............................. ................... ................... –736 –1,325 –2,286 –6,269 –6,328
Subtotal, Compensation ..... 16,214 17,462 18,172 18,922 19,616 20,353 21,107
Pensions ...................................... 3,055 3,084 3,067 3,074 3,073 3,071 3,567Burial benefits and miscellane-
ous assistance ......................... 116 133 123 123 125 128 131
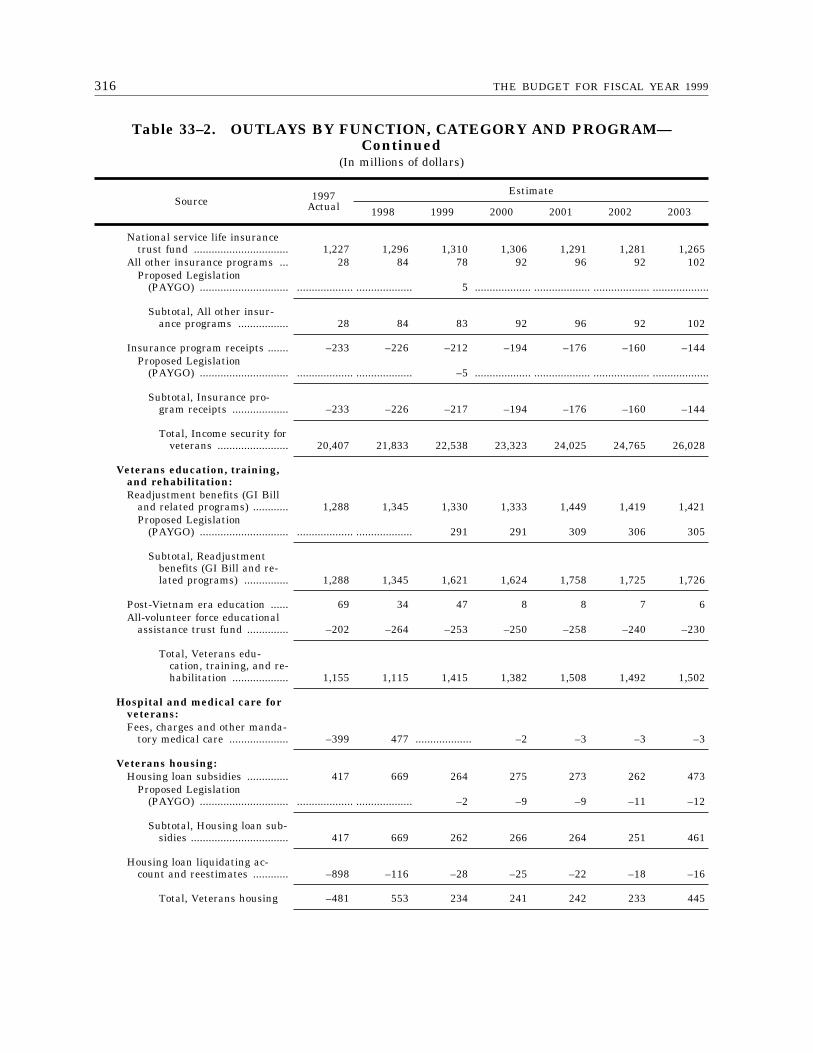
316 THE BUDGET FOR FISCAL YEAR 1999
Table 33–2. OUTLAYS BY FUNCTION, CATEGORY AND PROGRAM—Continued
(In millions of dollars)
Source 1997Actual
Estimate
1998 1999 2000 2001 2002 2003
National service life insurancetrust fund ................................ 1,227 1,296 1,310 1,306 1,291 1,281 1,265
All other insurance programs ... 28 84 78 92 96 92 102Proposed Legislation
(PAYGO) .............................. ................... ................... 5 ................... ................... ................... ...................
Subtotal, All other insur-ance programs ................. 28 84 83 92 96 92 102
Insurance program receipts ....... –233 –226 –212 –194 –176 –160 –144Proposed Legislation
(PAYGO) .............................. ................... ................... –5 ................... ................... ................... ...................
Subtotal, Insurance pro-gram receipts ................... –233 –226 –217 –194 –176 –160 –144
Total, Income security forveterans ........................ 20,407 21,833 22,538 23,323 24,025 24,765 26,028
Veterans education, training,and rehabilitation:Readjustment benefits (GI Bill
and related programs) ............ 1,288 1,345 1,330 1,333 1,449 1,419 1,421Proposed Legislation
(PAYGO) .............................. ................... ................... 291 291 309 306 305
Subtotal, Readjustmentbenefits (GI Bill and re-lated programs) ............... 1,288 1,345 1,621 1,624 1,758 1,725 1,726
Post-Vietnam era education ...... 69 34 47 8 8 7 6All-volunteer force educational
assistance trust fund .............. –202 –264 –253 –250 –258 –240 –230
Total, Veterans edu-cation, training, and re-habilitation ................... 1,155 1,115 1,415 1,382 1,508 1,492 1,502
Hospital and medical care forveterans:Fees, charges and other manda-
tory medical care .................... –399 477 ................... –2 –3 –3 –3
Veterans housing:Housing loan subsidies .............. 417 669 264 275 273 262 473
Proposed Legislation(PAYGO) .............................. ................... ................... –2 –9 –9 –11 –12
Subtotal, Housing loan sub-sidies ................................. 417 669 262 266 264 251 461
Housing loan liquidating ac-count and reestimates ............ –898 –116 –28 –25 –22 –18 –16
Total, Veterans housing –481 553 234 241 242 233 445
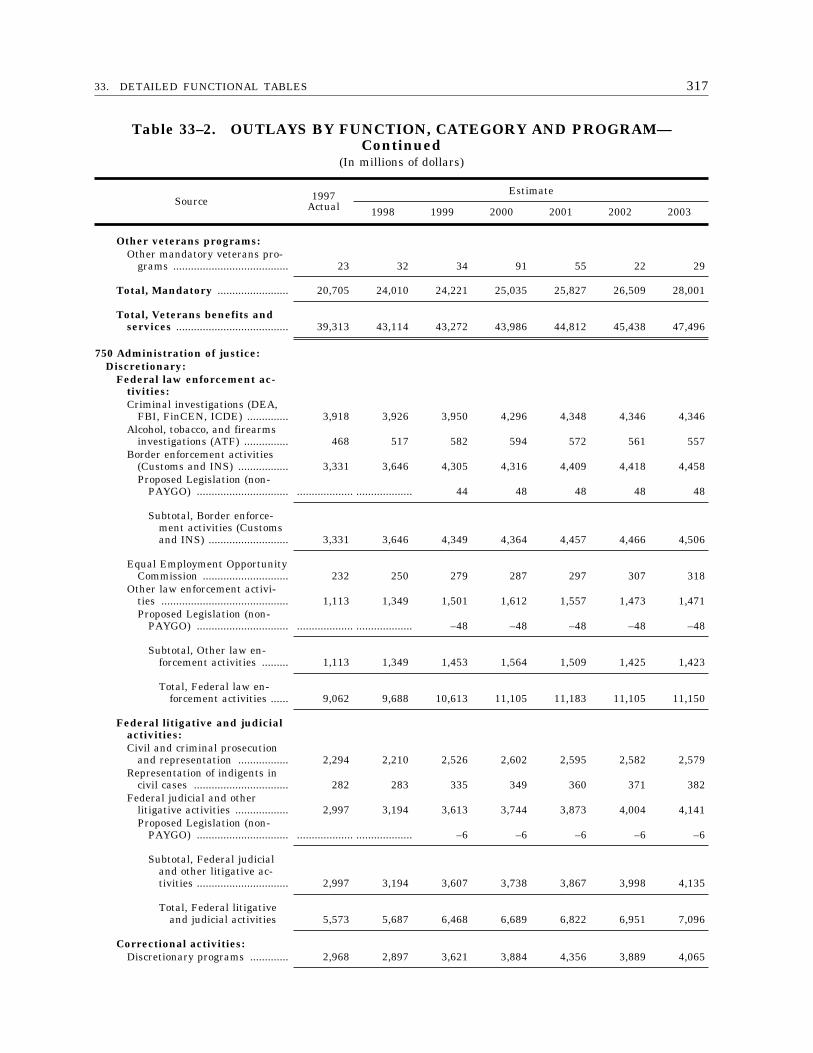
31733. DETAILED FUNCTIONAL TABLES
Table 33–2. OUTLAYS BY FUNCTION, CATEGORY AND PROGRAM—Continued
(In millions of dollars)
Source 1997Actual
Estimate
1998 1999 2000 2001 2002 2003
Other veterans programs:Other mandatory veterans pro-
grams ....................................... 23 32 34 91 55 22 29
Total, Mandatory ........................ 20,705 24,010 24,221 25,035 25,827 26,509 28,001
Total, Veterans benefits andservices ...................................... 39,313 43,114 43,272 43,986 44,812 45,438 47,496
750 Administration of justice:Discretionary:
Federal law enforcement ac-tivities:Criminal investigations (DEA,
FBI, FinCEN, ICDE) .............. 3,918 3,926 3,950 4,296 4,348 4,346 4,346Alcohol, tobacco, and firearms
investigations (ATF) ............... 468 517 582 594 572 561 557Border enforcement activities
(Customs and INS) ................. 3,331 3,646 4,305 4,316 4,409 4,418 4,458Proposed Legislation (non-
PAYGO) ............................... ................... ................... 44 48 48 48 48
Subtotal, Border enforce-ment activities (Customsand INS) ........................... 3,331 3,646 4,349 4,364 4,457 4,466 4,506
Equal Employment OpportunityCommission ............................. 232 250 279 287 297 307 318
Other law enforcement activi-ties ........................................... 1,113 1,349 1,501 1,612 1,557 1,473 1,471Proposed Legislation (non-
PAYGO) ............................... ................... ................... –48 –48 –48 –48 –48
Subtotal, Other law en-forcement activities ......... 1,113 1,349 1,453 1,564 1,509 1,425 1,423
Total, Federal law en-forcement activities ...... 9,062 9,688 10,613 11,105 11,183 11,105 11,150
Federal litigative and judicialactivities:Civil and criminal prosecution
and representation ................. 2,294 2,210 2,526 2,602 2,595 2,582 2,579Representation of indigents in
civil cases ................................ 282 283 335 349 360 371 382Federal judicial and other
litigative activities .................. 2,997 3,194 3,613 3,744 3,873 4,004 4,141Proposed Legislation (non-
PAYGO) ............................... ................... ................... –6 –6 –6 –6 –6
Subtotal, Federal judicialand other litigative ac-tivities ............................... 2,997 3,194 3,607 3,738 3,867 3,998 4,135
Total, Federal litigativeand judicial activities 5,573 5,687 6,468 6,689 6,822 6,951 7,096
Correctional activities:Discretionary programs ............. 2,968 2,897 3,621 3,884 4,356 3,889 4,065
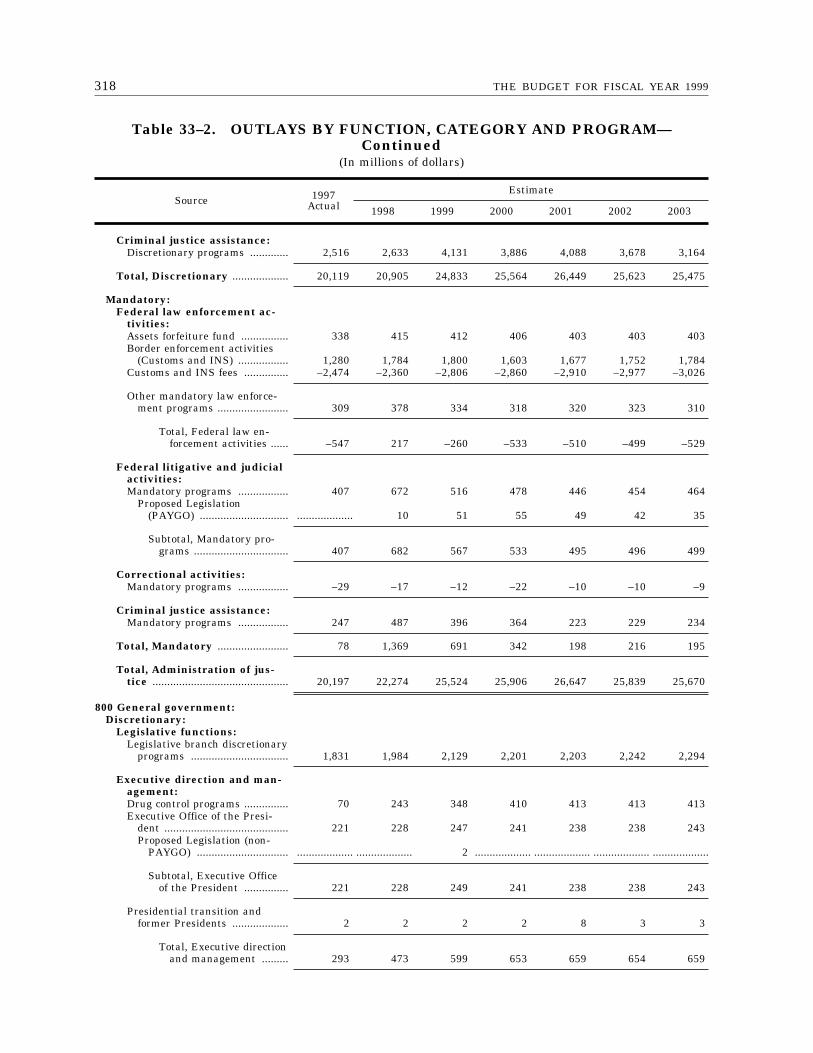
318 THE BUDGET FOR FISCAL YEAR 1999
Table 33–2. OUTLAYS BY FUNCTION, CATEGORY AND PROGRAM—Continued
(In millions of dollars)
Source 1997Actual
Estimate
1998 1999 2000 2001 2002 2003
Criminal justice assistance:Discretionary programs ............. 2,516 2,633 4,131 3,886 4,088 3,678 3,164
Total, Discretionary ................... 20,119 20,905 24,833 25,564 26,449 25,623 25,475
Mandatory:Federal law enforcement ac-
tivities:Assets forfeiture fund ................ 338 415 412 406 403 403 403Border enforcement activities
(Customs and INS) ................. 1,280 1,784 1,800 1,603 1,677 1,752 1,784Customs and INS fees ............... –2,474 –2,360 –2,806 –2,860 –2,910 –2,977 –3,026
Other mandatory law enforce-ment programs ........................ 309 378 334 318 320 323 310
Total, Federal law en-forcement activities ...... –547 217 –260 –533 –510 –499 –529
Federal litigative and judicialactivities:Mandatory programs ................. 407 672 516 478 446 454 464
Proposed Legislation(PAYGO) .............................. ................... 10 51 55 49 42 35
Subtotal, Mandatory pro-grams ................................ 407 682 567 533 495 496 499
Correctional activities:Mandatory programs ................. –29 –17 –12 –22 –10 –10 –9
Criminal justice assistance:Mandatory programs ................. 247 487 396 364 223 229 234
Total, Mandatory ........................ 78 1,369 691 342 198 216 195
Total, Administration of jus-tice .............................................. 20,197 22,274 25,524 25,906 26,647 25,839 25,670
800 General government:Discretionary:
Legislative functions:Legislative branch discretionary
programs ................................. 1,831 1,984 2,129 2,201 2,203 2,242 2,294
Executive direction and man-agement:Drug control programs ............... 70 243 348 410 413 413 413Executive Office of the Presi-
dent .......................................... 221 228 247 241 238 238 243Proposed Legislation (non-
PAYGO) ............................... ................... ................... 2 ................... ................... ................... ...................
Subtotal, Executive Officeof the President ............... 221 228 249 241 238 238 243
Presidential transition andformer Presidents ................... 2 2 2 2 8 3 3
Total, Executive directionand management ......... 293 473 599 653 659 654 659
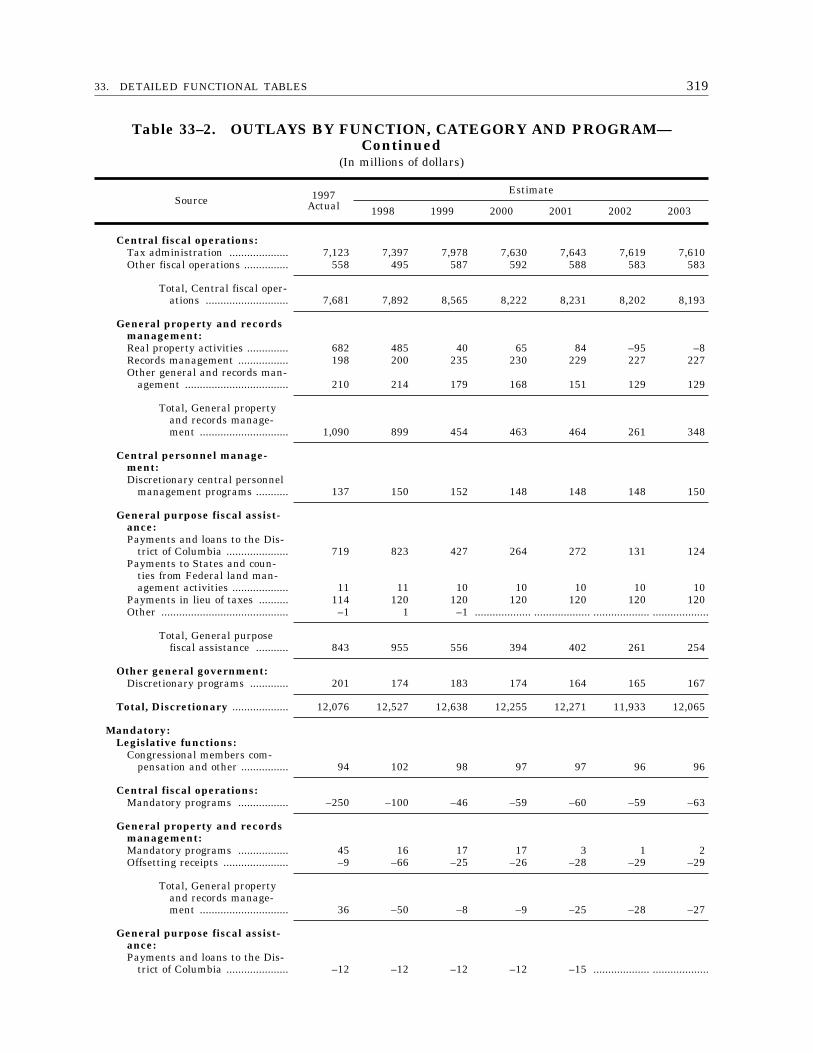
31933. DETAILED FUNCTIONAL TABLES
Table 33–2. OUTLAYS BY FUNCTION, CATEGORY AND PROGRAM—Continued
(In millions of dollars)
Source 1997Actual
Estimate
1998 1999 2000 2001 2002 2003
Central fiscal operations:Tax administration .................... 7,123 7,397 7,978 7,630 7,643 7,619 7,610Other fiscal operations ............... 558 495 587 592 588 583 583
Total, Central fiscal oper-ations ............................ 7,681 7,892 8,565 8,222 8,231 8,202 8,193
General property and recordsmanagement:Real property activities .............. 682 485 40 65 84 –95 –8Records management ................. 198 200 235 230 229 227 227Other general and records man-
agement ................................... 210 214 179 168 151 129 129
Total, General propertyand records manage-ment .............................. 1,090 899 454 463 464 261 348
Central personnel manage-ment:Discretionary central personnel
management programs ........... 137 150 152 148 148 148 150
General purpose fiscal assist-ance:Payments and loans to the Dis-
trict of Columbia ..................... 719 823 427 264 272 131 124Payments to States and coun-
ties from Federal land man-agement activities ................... 11 11 10 10 10 10 10
Payments in lieu of taxes .......... 114 120 120 120 120 120 120Other ........................................... –1 1 –1 ................... ................... ................... ...................
Total, General purposefiscal assistance ........... 843 955 556 394 402 261 254
Other general government:Discretionary programs ............. 201 174 183 174 164 165 167
Total, Discretionary ................... 12,076 12,527 12,638 12,255 12,271 11,933 12,065
Mandatory:Legislative functions:
Congressional members com-pensation and other ................ 94 102 98 97 97 96 96
Central fiscal operations:Mandatory programs ................. –250 –100 –46 –59 –60 –59 –63
General property and recordsmanagement:Mandatory programs ................. 45 16 17 17 3 1 2Offsetting receipts ...................... –9 –66 –25 –26 –28 –29 –29
Total, General propertyand records manage-ment .............................. 36 –50 –8 –9 –25 –28 –27
General purpose fiscal assist-ance:Payments and loans to the Dis-
trict of Columbia ..................... –12 –12 –12 –12 –15 ................... ...................
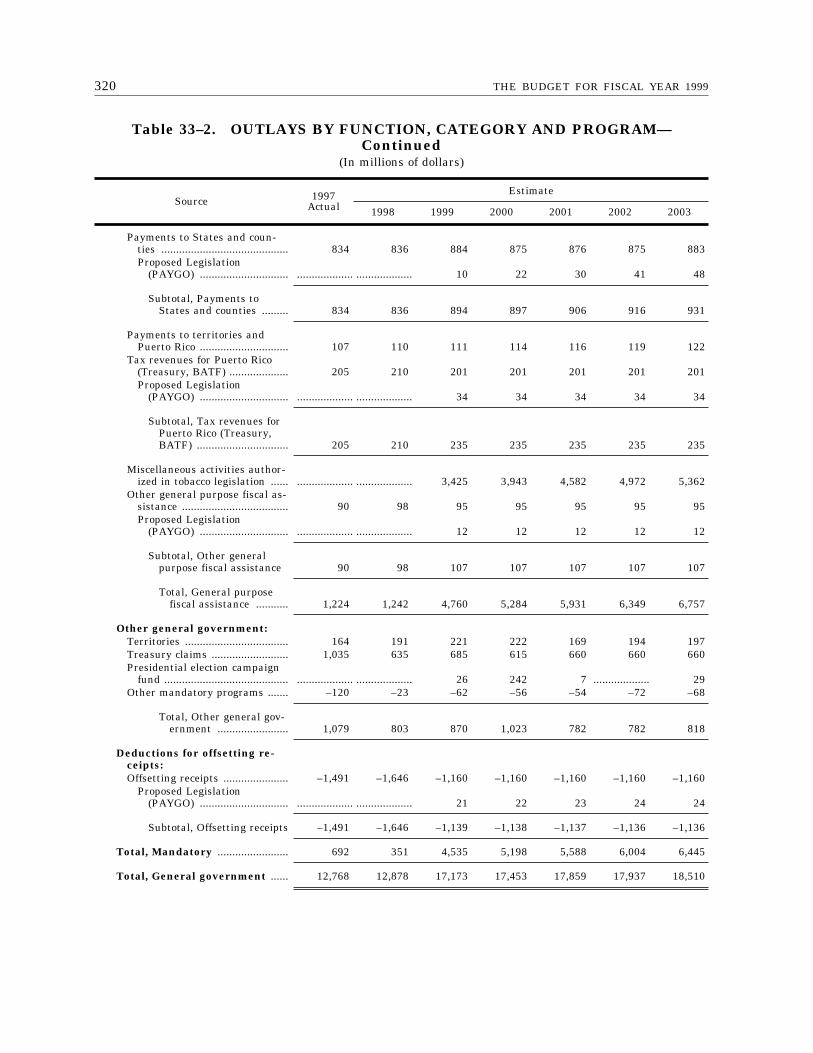
320 THE BUDGET FOR FISCAL YEAR 1999
Table 33–2. OUTLAYS BY FUNCTION, CATEGORY AND PROGRAM—Continued
(In millions of dollars)
Source 1997Actual
Estimate
1998 1999 2000 2001 2002 2003
Payments to States and coun-ties ........................................... 834 836 884 875 876 875 883Proposed Legislation
(PAYGO) .............................. ................... ................... 10 22 30 41 48
Subtotal, Payments toStates and counties ......... 834 836 894 897 906 916 931
Payments to territories andPuerto Rico .............................. 107 110 111 114 116 119 122
Tax revenues for Puerto Rico(Treasury, BATF) .................... 205 210 201 201 201 201 201Proposed Legislation
(PAYGO) .............................. ................... ................... 34 34 34 34 34
Subtotal, Tax revenues forPuerto Rico (Treasury,BATF) ............................... 205 210 235 235 235 235 235
Miscellaneous activities author-ized in tobacco legislation ...... ................... ................... 3,425 3,943 4,582 4,972 5,362
Other general purpose fiscal as-sistance .................................... 90 98 95 95 95 95 95Proposed Legislation
(PAYGO) .............................. ................... ................... 12 12 12 12 12
Subtotal, Other generalpurpose fiscal assistance 90 98 107 107 107 107 107
Total, General purposefiscal assistance ........... 1,224 1,242 4,760 5,284 5,931 6,349 6,757
Other general government:Territories ................................... 164 191 221 222 169 194 197Treasury claims .......................... 1,035 635 685 615 660 660 660Presidential election campaign
fund .......................................... ................... ................... 26 242 7 ................... 29Other mandatory programs ....... –120 –23 –62 –56 –54 –72 –68
Total, Other general gov-ernment ........................ 1,079 803 870 1,023 782 782 818
Deductions for offsetting re-ceipts:Offsetting receipts ...................... –1,491 –1,646 –1,160 –1,160 –1,160 –1,160 –1,160
Proposed Legislation(PAYGO) .............................. ................... ................... 21 22 23 24 24
Subtotal, Offsetting receipts –1,491 –1,646 –1,139 –1,138 –1,137 –1,136 –1,136
Total, Mandatory ........................ 692 351 4,535 5,198 5,588 6,004 6,445
Total, General government ...... 12,768 12,878 17,173 17,453 17,859 17,937 18,510
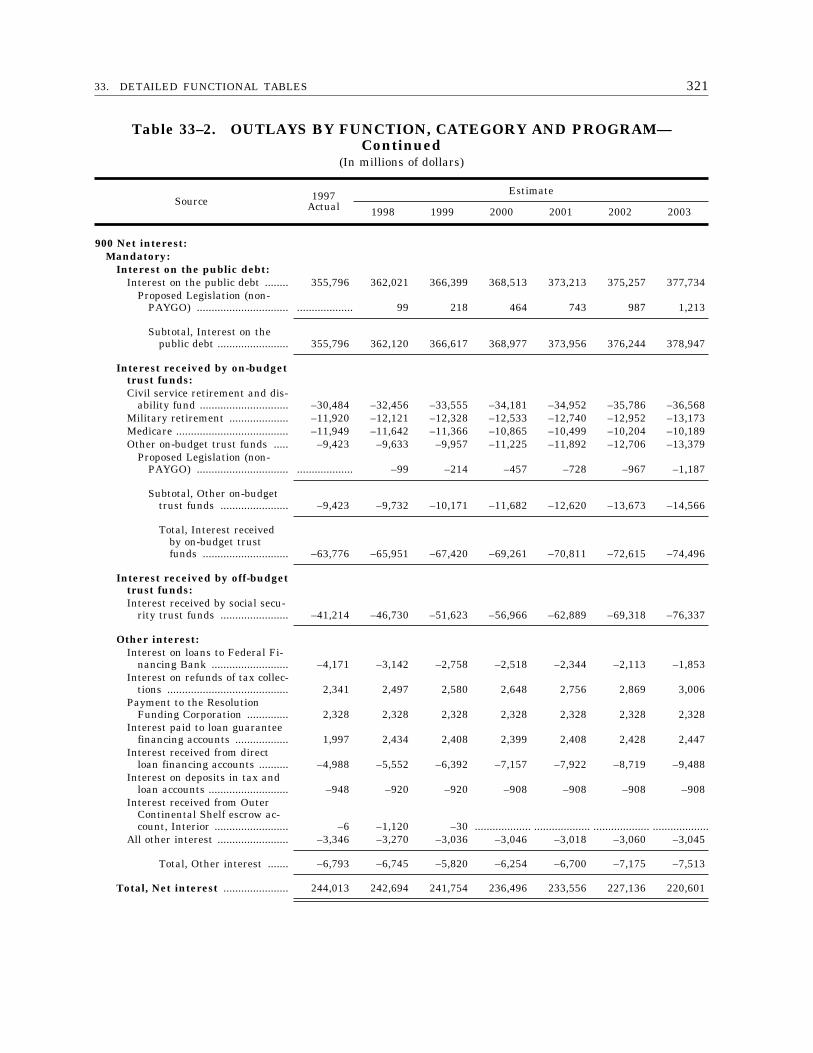
32133. DETAILED FUNCTIONAL TABLES
Table 33–2. OUTLAYS BY FUNCTION, CATEGORY AND PROGRAM—Continued
(In millions of dollars)
Source 1997Actual
Estimate
1998 1999 2000 2001 2002 2003
900 Net interest:Mandatory:
Interest on the public debt:Interest on the public debt ........ 355,796 362,021 366,399 368,513 373,213 375,257 377,734
Proposed Legislation (non-PAYGO) ............................... ................... 99 218 464 743 987 1,213
Subtotal, Interest on thepublic debt ........................ 355,796 362,120 366,617 368,977 373,956 376,244 378,947
Interest received by on-budgettrust funds:Civil service retirement and dis-
ability fund .............................. –30,484 –32,456 –33,555 –34,181 –34,952 –35,786 –36,568Military retirement .................... –11,920 –12,121 –12,328 –12,533 –12,740 –12,952 –13,173Medicare ...................................... –11,949 –11,642 –11,366 –10,865 –10,499 –10,204 –10,189Other on-budget trust funds ..... –9,423 –9,633 –9,957 –11,225 –11,892 –12,706 –13,379
Proposed Legislation (non-PAYGO) ............................... ................... –99 –214 –457 –728 –967 –1,187
Subtotal, Other on-budgettrust funds ....................... –9,423 –9,732 –10,171 –11,682 –12,620 –13,673 –14,566
Total, Interest receivedby on-budget trustfunds ............................. –63,776 –65,951 –67,420 –69,261 –70,811 –72,615 –74,496
Interest received by off-budgettrust funds:Interest received by social secu-
rity trust funds ....................... –41,214 –46,730 –51,623 –56,966 –62,889 –69,318 –76,337
Other interest:Interest on loans to Federal Fi-
nancing Bank .......................... –4,171 –3,142 –2,758 –2,518 –2,344 –2,113 –1,853Interest on refunds of tax collec-
tions ......................................... 2,341 2,497 2,580 2,648 2,756 2,869 3,006Payment to the Resolution
Funding Corporation .............. 2,328 2,328 2,328 2,328 2,328 2,328 2,328Interest paid to loan guarantee
financing accounts .................. 1,997 2,434 2,408 2,399 2,408 2,428 2,447Interest received from direct
loan financing accounts .......... –4,988 –5,552 –6,392 –7,157 –7,922 –8,719 –9,488Interest on deposits in tax and
loan accounts ........................... –948 –920 –920 –908 –908 –908 –908Interest received from Outer
Continental Shelf escrow ac-count, Interior ......................... –6 –1,120 –30 ................... ................... ................... ...................
All other interest ........................ –3,346 –3,270 –3,036 –3,046 –3,018 –3,060 –3,045
Total, Other interest ....... –6,793 –6,745 –5,820 –6,254 –6,700 –7,175 –7,513
Total, Net interest ...................... 244,013 242,694 241,754 236,496 233,556 227,136 220,601
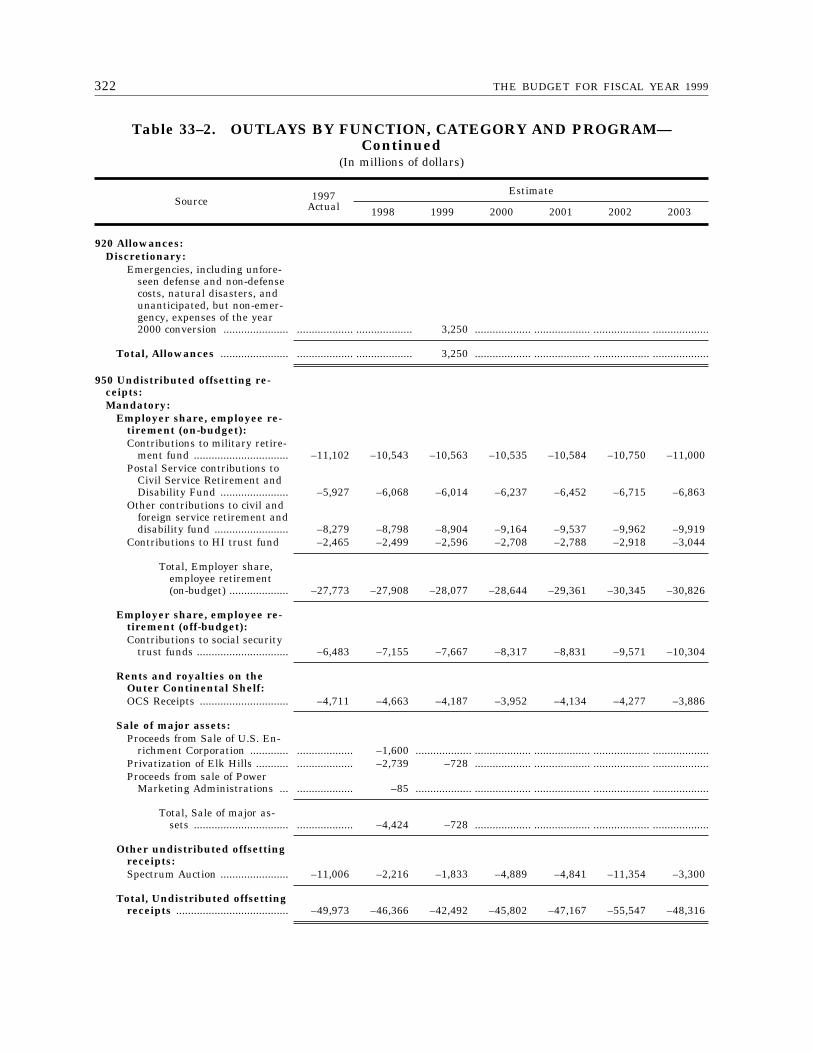
322 THE BUDGET FOR FISCAL YEAR 1999
Table 33–2. OUTLAYS BY FUNCTION, CATEGORY AND PROGRAM—Continued
(In millions of dollars)
Source 1997Actual
Estimate
1998 1999 2000 2001 2002 2003
920 Allowances:Discretionary:
Emergencies, including unfore-seen defense and non-defensecosts, natural disasters, andunanticipated, but non-emer-gency, expenses of the year2000 conversion ...................... ................... ................... 3,250 ................... ................... ................... ...................
Total, Allowances ....................... ................... ................... 3,250 ................... ................... ................... ...................
950 Undistributed offsetting re-ceipts:Mandatory:
Employer share, employee re-tirement (on-budget):Contributions to military retire-
ment fund ................................ –11,102 –10,543 –10,563 –10,535 –10,584 –10,750 –11,000Postal Service contributions to
Civil Service Retirement andDisability Fund ....................... –5,927 –6,068 –6,014 –6,237 –6,452 –6,715 –6,863
Other contributions to civil andforeign service retirement anddisability fund ......................... –8,279 –8,798 –8,904 –9,164 –9,537 –9,962 –9,919
Contributions to HI trust fund –2,465 –2,499 –2,596 –2,708 –2,788 –2,918 –3,044
Total, Employer share,employee retirement(on-budget) .................... –27,773 –27,908 –28,077 –28,644 –29,361 –30,345 –30,826
Employer share, employee re-tirement (off-budget):Contributions to social security
trust funds ............................... –6,483 –7,155 –7,667 –8,317 –8,831 –9,571 –10,304
Rents and royalties on theOuter Continental Shelf:OCS Receipts .............................. –4,711 –4,663 –4,187 –3,952 –4,134 –4,277 –3,886
Sale of major assets:Proceeds from Sale of U.S. En-
richment Corporation ............. ................... –1,600 ................... ................... ................... ................... ...................Privatization of Elk Hills ........... ................... –2,739 –728 ................... ................... ................... ...................Proceeds from sale of Power
Marketing Administrations ... ................... –85 ................... ................... ................... ................... ...................
Total, Sale of major as-sets ................................ ................... –4,424 –728 ................... ................... ................... ...................
Other undistributed offsettingreceipts:Spectrum Auction ....................... –11,006 –2,216 –1,833 –4,889 –4,841 –11,354 –3,300
Total, Undistributed offsettingreceipts ...................................... –49,973 –46,366 –42,492 –45,802 –47,167 –55,547 –48,316
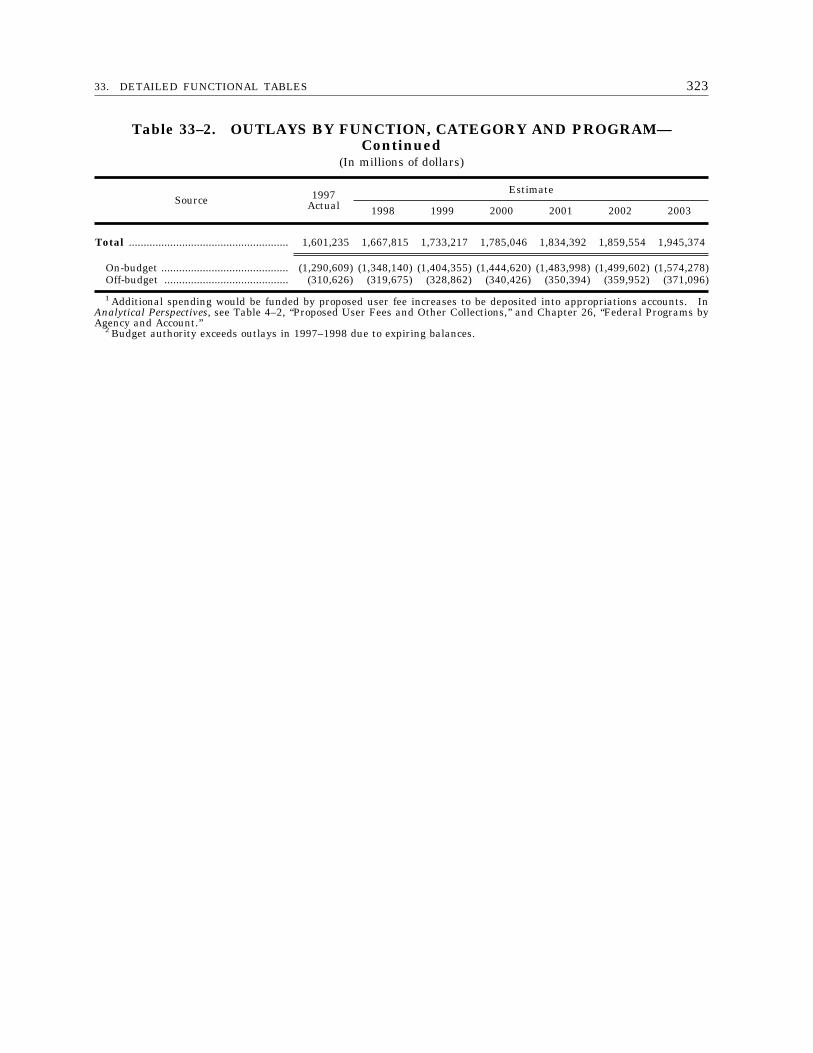
32333. DETAILED FUNCTIONAL TABLES
Table 33–2. OUTLAYS BY FUNCTION, CATEGORY AND PROGRAM—Continued
(In millions of dollars)
Source 1997Actual
Estimate
1998 1999 2000 2001 2002 2003
Total ...................................................... 1,601,235 1,667,815 1,733,217 1,785,046 1,834,392 1,859,554 1,945,374
On-budget ........................................... (1,290,609) (1,348,140) (1,404,355) (1,444,620) (1,483,998) (1,499,602) (1,574,278)Off-budget .......................................... (310,626) (319,675) (328,862) (340,426) (350,394) (359,952) (371,096)
1 Additional spending would be funded by proposed user fee increases to be deposited into appropriations accounts. InAnalytical Perspectives, see Table 4–2, ‘‘Proposed User Fees and Other Collections,’’ and Chapter 26, ‘‘Federal Programs byAgency and Account.’’
2 Budget authority exceeds outlays in 1997–1998 due to expiring balances.
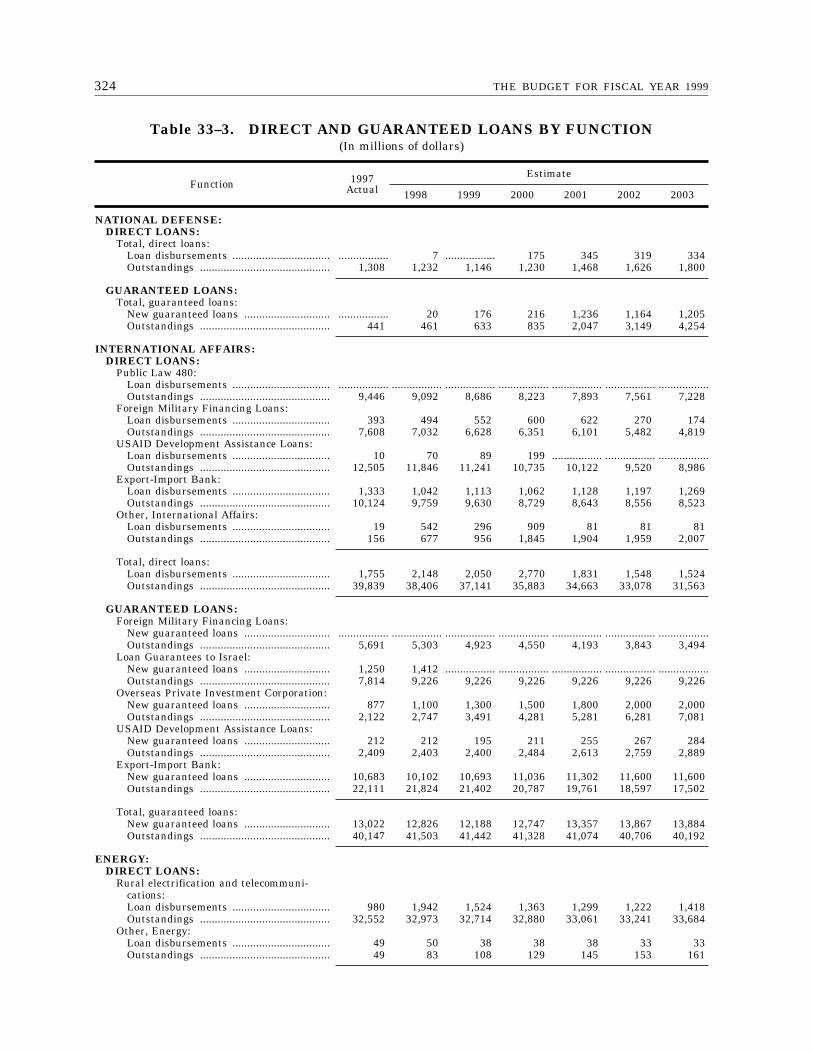
324 THE BUDGET FOR FISCAL YEAR 1999
Table 33–3. DIRECT AND GUARANTEED LOANS BY FUNCTION(In millions of dollars)
Function 1997Actual
Estimate
1998 1999 2000 2001 2002 2003
NATIONAL DEFENSE:DIRECT LOANS:
Total, direct loans:Loan disbursements ................................. ................. 7 ................. 175 345 319 334Outstandings ............................................ 1,308 1,232 1,146 1,230 1,468 1,626 1,800
GUARANTEED LOANS:Total, guaranteed loans:
New guaranteed loans ............................. ................. 20 176 216 1,236 1,164 1,205Outstandings ............................................ 441 461 633 835 2,047 3,149 4,254
INTERNATIONAL AFFAIRS:DIRECT LOANS:
Public Law 480:Loan disbursements ................................. ................. ................. ................. ................. ................. ................. .................Outstandings ............................................ 9,446 9,092 8,686 8,223 7,893 7,561 7,228
Foreign Military Financing Loans:Loan disbursements ................................. 393 494 552 600 622 270 174Outstandings ............................................ 7,608 7,032 6,628 6,351 6,101 5,482 4,819
USAID Development Assistance Loans:Loan disbursements ................................. 10 70 89 199 ................. ................. .................Outstandings ............................................ 12,505 11,846 11,241 10,735 10,122 9,520 8,986
Export-Import Bank:Loan disbursements ................................. 1,333 1,042 1,113 1,062 1,128 1,197 1,269Outstandings ............................................ 10,124 9,759 9,630 8,729 8,643 8,556 8,523
Other, International Affairs:Loan disbursements ................................. 19 542 296 909 81 81 81Outstandings ............................................ 156 677 956 1,845 1,904 1,959 2,007
Total, direct loans:Loan disbursements ................................. 1,755 2,148 2,050 2,770 1,831 1,548 1,524Outstandings ............................................ 39,839 38,406 37,141 35,883 34,663 33,078 31,563
GUARANTEED LOANS:Foreign Military Financing Loans:
New guaranteed loans ............................. ................. ................. ................. ................. ................. ................. .................Outstandings ............................................ 5,691 5,303 4,923 4,550 4,193 3,843 3,494
Loan Guarantees to Israel:New guaranteed loans ............................. 1,250 1,412 ................. ................. ................. ................. .................Outstandings ............................................ 7,814 9,226 9,226 9,226 9,226 9,226 9,226
Overseas Private Investment Corporation:New guaranteed loans ............................. 877 1,100 1,300 1,500 1,800 2,000 2,000Outstandings ............................................ 2,122 2,747 3,491 4,281 5,281 6,281 7,081
USAID Development Assistance Loans:New guaranteed loans ............................. 212 212 195 211 255 267 284Outstandings ............................................ 2,409 2,403 2,400 2,484 2,613 2,759 2,889
Export-Import Bank:New guaranteed loans ............................. 10,683 10,102 10,693 11,036 11,302 11,600 11,600Outstandings ............................................ 22,111 21,824 21,402 20,787 19,761 18,597 17,502
Total, guaranteed loans:New guaranteed loans ............................. 13,022 12,826 12,188 12,747 13,357 13,867 13,884Outstandings ............................................ 40,147 41,503 41,442 41,328 41,074 40,706 40,192
ENERGY:DIRECT LOANS:
Rural electrification and telecommuni-cations:Loan disbursements ................................. 980 1,942 1,524 1,363 1,299 1,222 1,418Outstandings ............................................ 32,552 32,973 32,714 32,880 33,061 33,241 33,684
Other, Energy:Loan disbursements ................................. 49 50 38 38 38 33 33Outstandings ............................................ 49 83 108 129 145 153 161
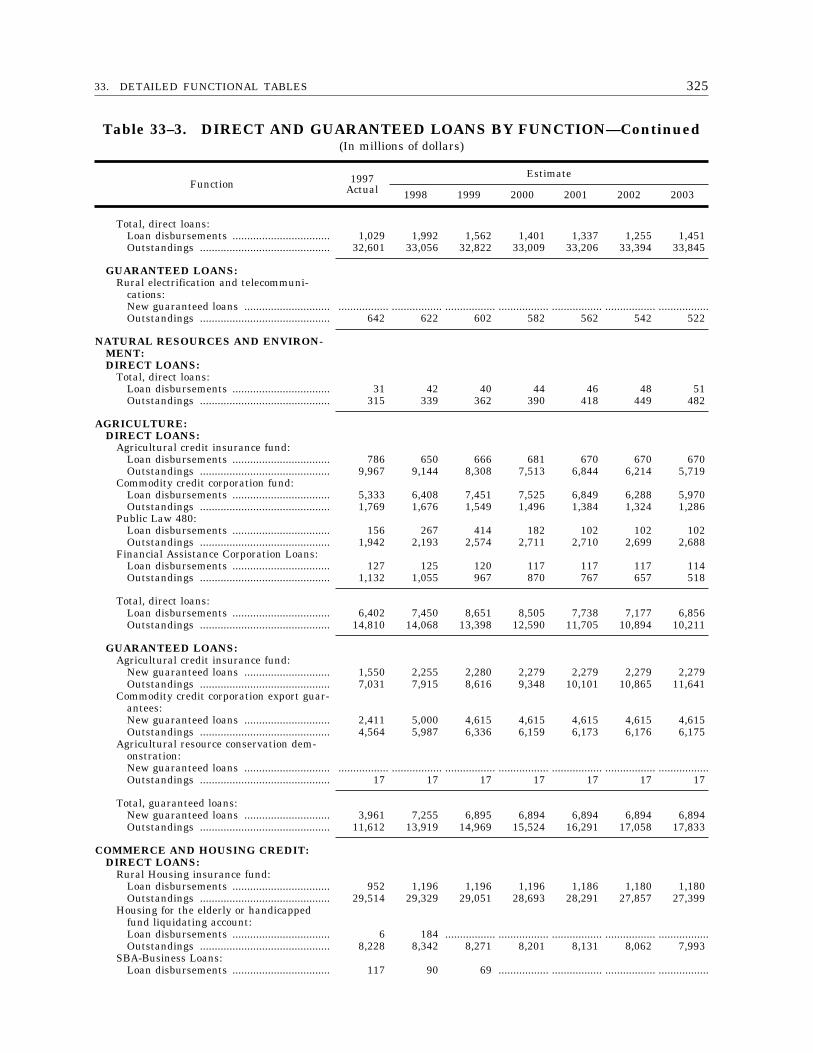
32533. DETAILED FUNCTIONAL TABLES
Table 33–3. DIRECT AND GUARANTEED LOANS BY FUNCTION—Continued(In millions of dollars)
Function 1997Actual
Estimate
1998 1999 2000 2001 2002 2003
Total, direct loans:Loan disbursements ................................. 1,029 1,992 1,562 1,401 1,337 1,255 1,451Outstandings ............................................ 32,601 33,056 32,822 33,009 33,206 33,394 33,845
GUARANTEED LOANS:Rural electrification and telecommuni-
cations:New guaranteed loans ............................. ................. ................. ................. ................. ................. ................. .................Outstandings ............................................ 642 622 602 582 562 542 522
NATURAL RESOURCES AND ENVIRON-MENT:DIRECT LOANS:
Total, direct loans:Loan disbursements ................................. 31 42 40 44 46 48 51Outstandings ............................................ 315 339 362 390 418 449 482
AGRICULTURE:DIRECT LOANS:
Agricultural credit insurance fund:Loan disbursements ................................. 786 650 666 681 670 670 670Outstandings ............................................ 9,967 9,144 8,308 7,513 6,844 6,214 5,719
Commodity credit corporation fund:Loan disbursements ................................. 5,333 6,408 7,451 7,525 6,849 6,288 5,970Outstandings ............................................ 1,769 1,676 1,549 1,496 1,384 1,324 1,286
Public Law 480:Loan disbursements ................................. 156 267 414 182 102 102 102Outstandings ............................................ 1,942 2,193 2,574 2,711 2,710 2,699 2,688
Financial Assistance Corporation Loans:Loan disbursements ................................. 127 125 120 117 117 117 114Outstandings ............................................ 1,132 1,055 967 870 767 657 518
Total, direct loans:Loan disbursements ................................. 6,402 7,450 8,651 8,505 7,738 7,177 6,856Outstandings ............................................ 14,810 14,068 13,398 12,590 11,705 10,894 10,211
GUARANTEED LOANS:Agricultural credit insurance fund:
New guaranteed loans ............................. 1,550 2,255 2,280 2,279 2,279 2,279 2,279Outstandings ............................................ 7,031 7,915 8,616 9,348 10,101 10,865 11,641
Commodity credit corporation export guar-antees:New guaranteed loans ............................. 2,411 5,000 4,615 4,615 4,615 4,615 4,615Outstandings ............................................ 4,564 5,987 6,336 6,159 6,173 6,176 6,175
Agricultural resource conservation dem-onstration:New guaranteed loans ............................. ................. ................. ................. ................. ................. ................. .................Outstandings ............................................ 17 17 17 17 17 17 17
Total, guaranteed loans:New guaranteed loans ............................. 3,961 7,255 6,895 6,894 6,894 6,894 6,894Outstandings ............................................ 11,612 13,919 14,969 15,524 16,291 17,058 17,833
COMMERCE AND HOUSING CREDIT:DIRECT LOANS:
Rural Housing insurance fund:Loan disbursements ................................. 952 1,196 1,196 1,196 1,186 1,180 1,180Outstandings ............................................ 29,514 29,329 29,051 28,693 28,291 27,857 27,399
Housing for the elderly or handicappedfund liquidating account:Loan disbursements ................................. 6 184 ................. ................. ................. ................. .................Outstandings ............................................ 8,228 8,342 8,271 8,201 8,131 8,062 7,993
SBA-Business Loans:Loan disbursements ................................. 117 90 69 ................. ................. ................. .................
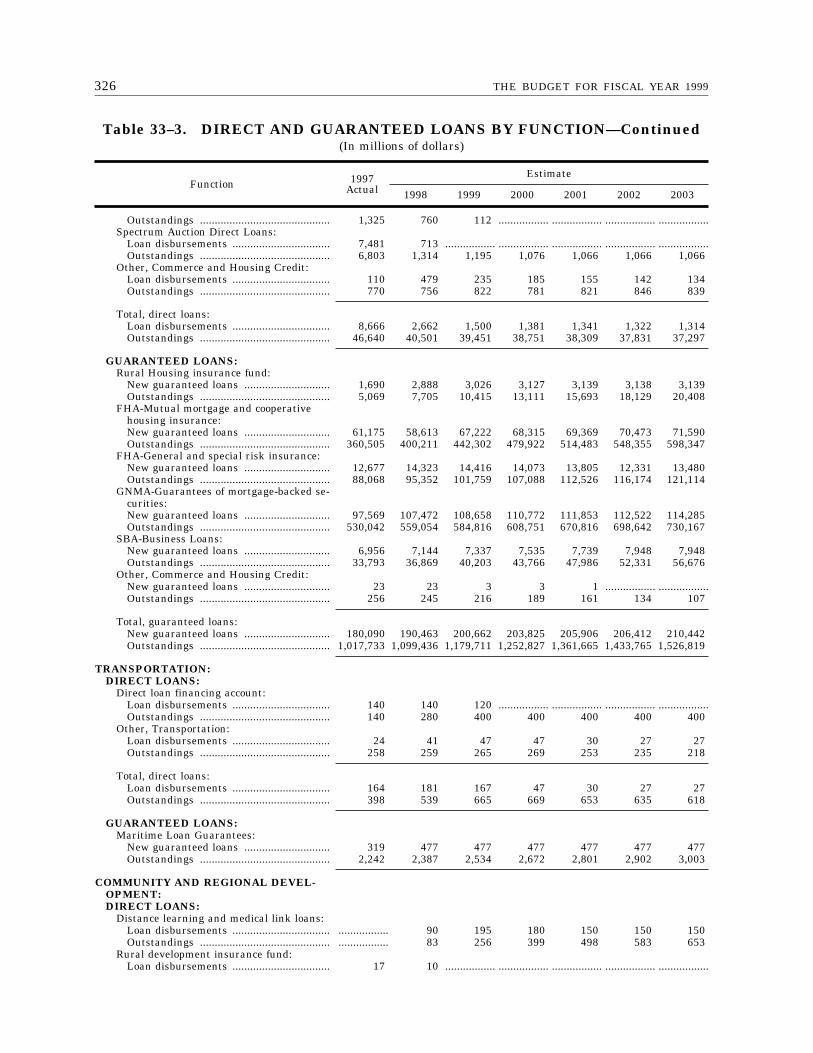
326 THE BUDGET FOR FISCAL YEAR 1999
Table 33–3. DIRECT AND GUARANTEED LOANS BY FUNCTION—Continued(In millions of dollars)
Function 1997Actual
Estimate
1998 1999 2000 2001 2002 2003
Outstandings ............................................ 1,325 760 112 ................. ................. ................. .................Spectrum Auction Direct Loans:
Loan disbursements ................................. 7,481 713 ................. ................. ................. ................. .................Outstandings ............................................ 6,803 1,314 1,195 1,076 1,066 1,066 1,066
Other, Commerce and Housing Credit:Loan disbursements ................................. 110 479 235 185 155 142 134Outstandings ............................................ 770 756 822 781 821 846 839
Total, direct loans:Loan disbursements ................................. 8,666 2,662 1,500 1,381 1,341 1,322 1,314Outstandings ............................................ 46,640 40,501 39,451 38,751 38,309 37,831 37,297
GUARANTEED LOANS:Rural Housing insurance fund:
New guaranteed loans ............................. 1,690 2,888 3,026 3,127 3,139 3,138 3,139Outstandings ............................................ 5,069 7,705 10,415 13,111 15,693 18,129 20,408
FHA-Mutual mortgage and cooperativehousing insurance:New guaranteed loans ............................. 61,175 58,613 67,222 68,315 69,369 70,473 71,590Outstandings ............................................ 360,505 400,211 442,302 479,922 514,483 548,355 598,347
FHA-General and special risk insurance:New guaranteed loans ............................. 12,677 14,323 14,416 14,073 13,805 12,331 13,480Outstandings ............................................ 88,068 95,352 101,759 107,088 112,526 116,174 121,114
GNMA-Guarantees of mortgage-backed se-curities:New guaranteed loans ............................. 97,569 107,472 108,658 110,772 111,853 112,522 114,285Outstandings ............................................ 530,042 559,054 584,816 608,751 670,816 698,642 730,167
SBA-Business Loans:New guaranteed loans ............................. 6,956 7,144 7,337 7,535 7,739 7,948 7,948Outstandings ............................................ 33,793 36,869 40,203 43,766 47,986 52,331 56,676
Other, Commerce and Housing Credit:New guaranteed loans ............................. 23 23 3 3 1 ................. .................Outstandings ............................................ 256 245 216 189 161 134 107
Total, guaranteed loans:New guaranteed loans ............................. 180,090 190,463 200,662 203,825 205,906 206,412 210,442Outstandings ............................................ 1,017,733 1,099,436 1,179,711 1,252,827 1,361,665 1,433,765 1,526,819
TRANSPORTATION:DIRECT LOANS:
Direct loan financing account:Loan disbursements ................................. 140 140 120 ................. ................. ................. .................Outstandings ............................................ 140 280 400 400 400 400 400
Other, Transportation:Loan disbursements ................................. 24 41 47 47 30 27 27Outstandings ............................................ 258 259 265 269 253 235 218
Total, direct loans:Loan disbursements ................................. 164 181 167 47 30 27 27Outstandings ............................................ 398 539 665 669 653 635 618
GUARANTEED LOANS:Maritime Loan Guarantees:
New guaranteed loans ............................. 319 477 477 477 477 477 477Outstandings ............................................ 2,242 2,387 2,534 2,672 2,801 2,902 3,003
COMMUNITY AND REGIONAL DEVEL-OPMENT:DIRECT LOANS:
Distance learning and medical link loans:Loan disbursements ................................. ................. 90 195 180 150 150 150Outstandings ............................................ ................. 83 256 399 498 583 653
Rural development insurance fund:Loan disbursements ................................. 17 10 ................. ................. ................. ................. .................
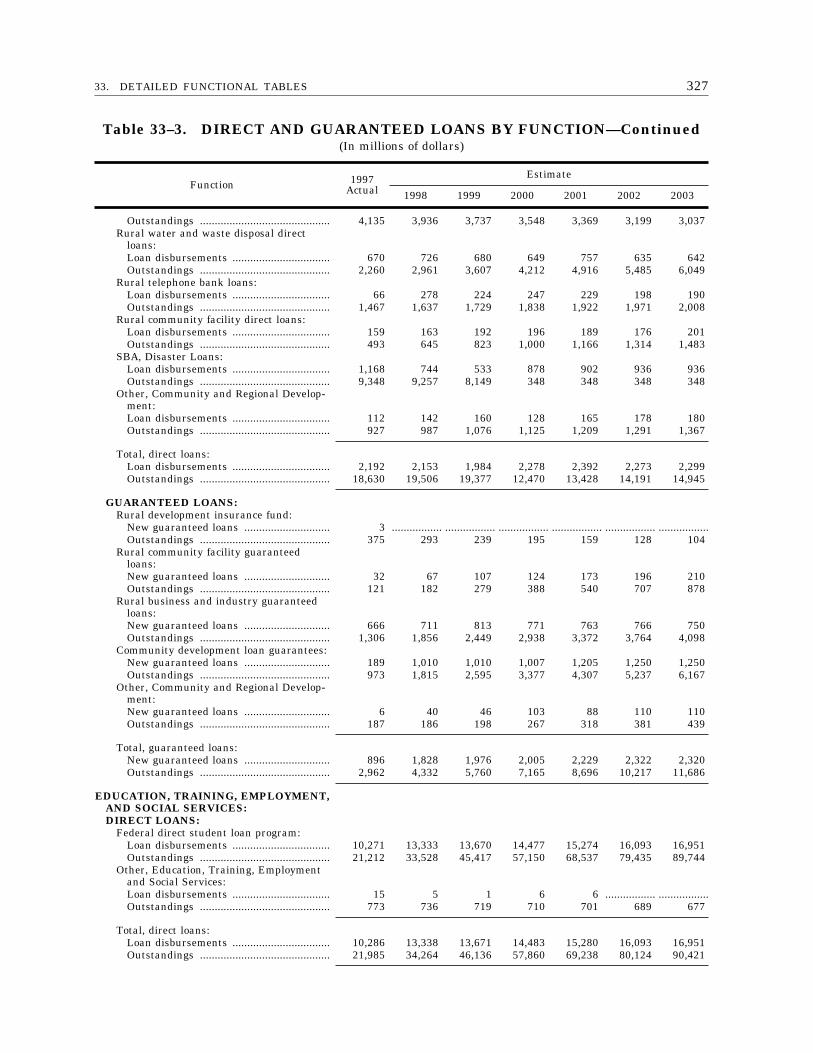
32733. DETAILED FUNCTIONAL TABLES
Table 33–3. DIRECT AND GUARANTEED LOANS BY FUNCTION—Continued(In millions of dollars)
Function 1997Actual
Estimate
1998 1999 2000 2001 2002 2003
Outstandings ............................................ 4,135 3,936 3,737 3,548 3,369 3,199 3,037Rural water and waste disposal direct
loans:Loan disbursements ................................. 670 726 680 649 757 635 642Outstandings ............................................ 2,260 2,961 3,607 4,212 4,916 5,485 6,049
Rural telephone bank loans:Loan disbursements ................................. 66 278 224 247 229 198 190Outstandings ............................................ 1,467 1,637 1,729 1,838 1,922 1,971 2,008
Rural community facility direct loans:Loan disbursements ................................. 159 163 192 196 189 176 201Outstandings ............................................ 493 645 823 1,000 1,166 1,314 1,483
SBA, Disaster Loans:Loan disbursements ................................. 1,168 744 533 878 902 936 936Outstandings ............................................ 9,348 9,257 8,149 348 348 348 348
Other, Community and Regional Develop-ment:Loan disbursements ................................. 112 142 160 128 165 178 180Outstandings ............................................ 927 987 1,076 1,125 1,209 1,291 1,367
Total, direct loans:Loan disbursements ................................. 2,192 2,153 1,984 2,278 2,392 2,273 2,299Outstandings ............................................ 18,630 19,506 19,377 12,470 13,428 14,191 14,945
GUARANTEED LOANS:Rural development insurance fund:
New guaranteed loans ............................. 3 ................. ................. ................. ................. ................. .................Outstandings ............................................ 375 293 239 195 159 128 104
Rural community facility guaranteedloans:New guaranteed loans ............................. 32 67 107 124 173 196 210Outstandings ............................................ 121 182 279 388 540 707 878
Rural business and industry guaranteedloans:New guaranteed loans ............................. 666 711 813 771 763 766 750Outstandings ............................................ 1,306 1,856 2,449 2,938 3,372 3,764 4,098
Community development loan guarantees:New guaranteed loans ............................. 189 1,010 1,010 1,007 1,205 1,250 1,250Outstandings ............................................ 973 1,815 2,595 3,377 4,307 5,237 6,167
Other, Community and Regional Develop-ment:New guaranteed loans ............................. 6 40 46 103 88 110 110Outstandings ............................................ 187 186 198 267 318 381 439
Total, guaranteed loans:New guaranteed loans ............................. 896 1,828 1,976 2,005 2,229 2,322 2,320Outstandings ............................................ 2,962 4,332 5,760 7,165 8,696 10,217 11,686
EDUCATION, TRAINING, EMPLOYMENT,AND SOCIAL SERVICES:DIRECT LOANS:
Federal direct student loan program:Loan disbursements ................................. 10,271 13,333 13,670 14,477 15,274 16,093 16,951Outstandings ............................................ 21,212 33,528 45,417 57,150 68,537 79,435 89,744
Other, Education, Training, Employmentand Social Services:Loan disbursements ................................. 15 5 1 6 6 ................. .................Outstandings ............................................ 773 736 719 710 701 689 677
Total, direct loans:Loan disbursements ................................. 10,286 13,338 13,671 14,483 15,280 16,093 16,951Outstandings ............................................ 21,985 34,264 46,136 57,860 69,238 80,124 90,421
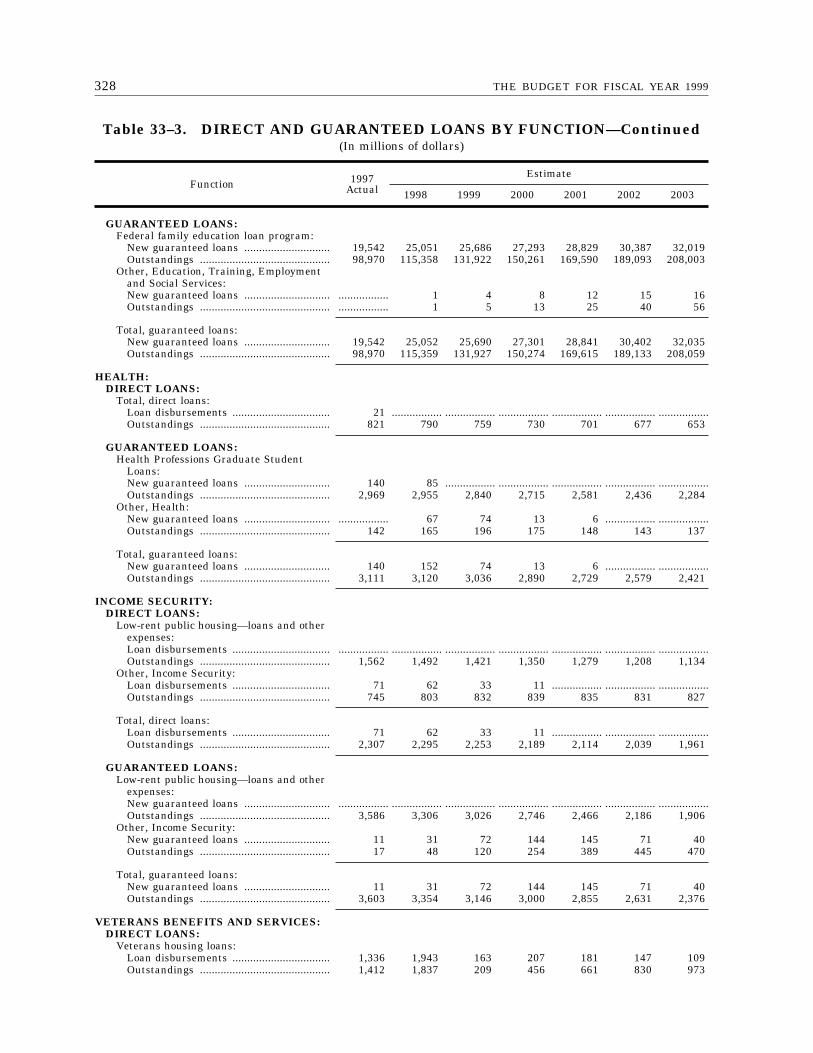
328 THE BUDGET FOR FISCAL YEAR 1999
Table 33–3. DIRECT AND GUARANTEED LOANS BY FUNCTION—Continued(In millions of dollars)
Function 1997Actual
Estimate
1998 1999 2000 2001 2002 2003
GUARANTEED LOANS:Federal family education loan program:
New guaranteed loans ............................. 19,542 25,051 25,686 27,293 28,829 30,387 32,019Outstandings ............................................ 98,970 115,358 131,922 150,261 169,590 189,093 208,003
Other, Education, Training, Employmentand Social Services:New guaranteed loans ............................. ................. 1 4 8 12 15 16Outstandings ............................................ ................. 1 5 13 25 40 56
Total, guaranteed loans:New guaranteed loans ............................. 19,542 25,052 25,690 27,301 28,841 30,402 32,035Outstandings ............................................ 98,970 115,359 131,927 150,274 169,615 189,133 208,059
HEALTH:DIRECT LOANS:
Total, direct loans:Loan disbursements ................................. 21 ................. ................. ................. ................. ................. .................Outstandings ............................................ 821 790 759 730 701 677 653
GUARANTEED LOANS:Health Professions Graduate Student
Loans:New guaranteed loans ............................. 140 85 ................. ................. ................. ................. .................Outstandings ............................................ 2,969 2,955 2,840 2,715 2,581 2,436 2,284
Other, Health:New guaranteed loans ............................. ................. 67 74 13 6 ................. .................Outstandings ............................................ 142 165 196 175 148 143 137
Total, guaranteed loans:New guaranteed loans ............................. 140 152 74 13 6 ................. .................Outstandings ............................................ 3,111 3,120 3,036 2,890 2,729 2,579 2,421
INCOME SECURITY:DIRECT LOANS:
Low-rent public housing—loans and otherexpenses:Loan disbursements ................................. ................. ................. ................. ................. ................. ................. .................Outstandings ............................................ 1,562 1,492 1,421 1,350 1,279 1,208 1,134
Other, Income Security:Loan disbursements ................................. 71 62 33 11 ................. ................. .................Outstandings ............................................ 745 803 832 839 835 831 827
Total, direct loans:Loan disbursements ................................. 71 62 33 11 ................. ................. .................Outstandings ............................................ 2,307 2,295 2,253 2,189 2,114 2,039 1,961
GUARANTEED LOANS:Low-rent public housing—loans and other
expenses:New guaranteed loans ............................. ................. ................. ................. ................. ................. ................. .................Outstandings ............................................ 3,586 3,306 3,026 2,746 2,466 2,186 1,906
Other, Income Security:New guaranteed loans ............................. 11 31 72 144 145 71 40Outstandings ............................................ 17 48 120 254 389 445 470
Total, guaranteed loans:New guaranteed loans ............................. 11 31 72 144 145 71 40Outstandings ............................................ 3,603 3,354 3,146 3,000 2,855 2,631 2,376
VETERANS BENEFITS AND SERVICES:DIRECT LOANS:
Veterans housing loans:Loan disbursements ................................. 1,336 1,943 163 207 181 147 109Outstandings ............................................ 1,412 1,837 209 456 661 830 973
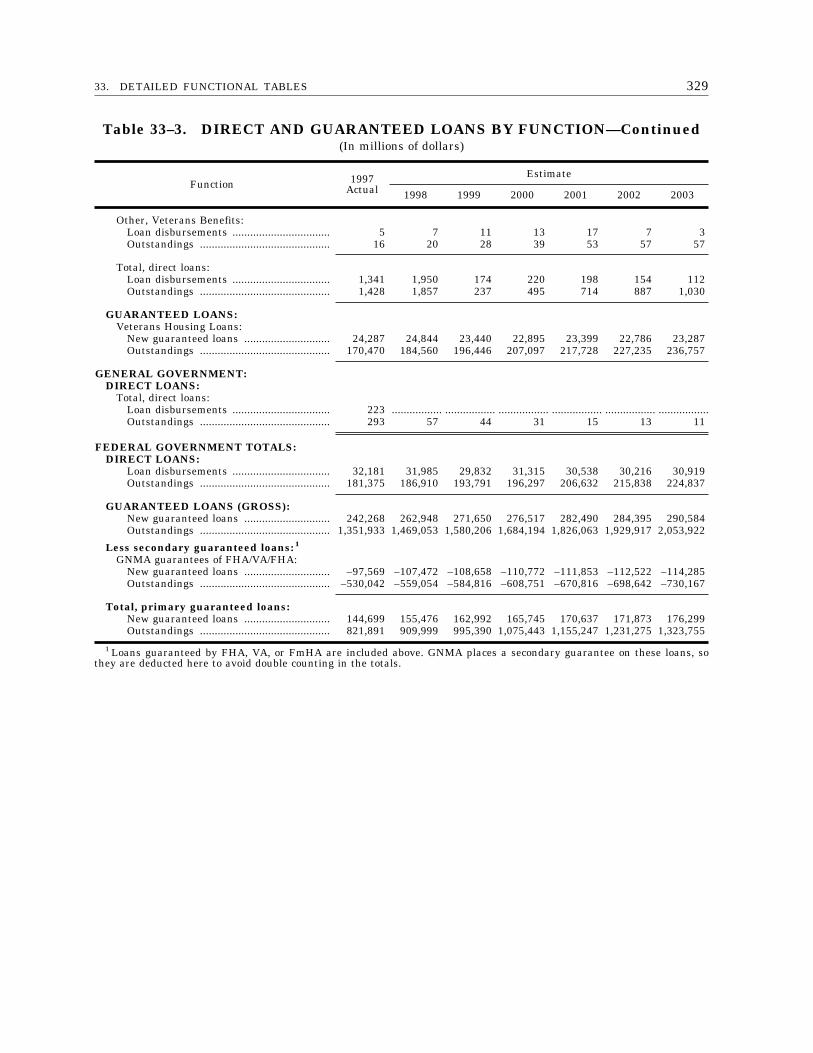
32933. DETAILED FUNCTIONAL TABLES
Table 33–3. DIRECT AND GUARANTEED LOANS BY FUNCTION—Continued(In millions of dollars)
Function 1997Actual
Estimate
1998 1999 2000 2001 2002 2003
Other, Veterans Benefits:Loan disbursements ................................. 5 7 11 13 17 7 3Outstandings ............................................ 16 20 28 39 53 57 57
Total, direct loans:Loan disbursements ................................. 1,341 1,950 174 220 198 154 112Outstandings ............................................ 1,428 1,857 237 495 714 887 1,030
GUARANTEED LOANS:Veterans Housing Loans:
New guaranteed loans ............................. 24,287 24,844 23,440 22,895 23,399 22,786 23,287Outstandings ............................................ 170,470 184,560 196,446 207,097 217,728 227,235 236,757
GENERAL GOVERNMENT:DIRECT LOANS:
Total, direct loans:Loan disbursements ................................. 223 ................. ................. ................. ................. ................. .................Outstandings ............................................ 293 57 44 31 15 13 11
FEDERAL GOVERNMENT TOTALS:DIRECT LOANS:
Loan disbursements ................................. 32,181 31,985 29,832 31,315 30,538 30,216 30,919Outstandings ............................................ 181,375 186,910 193,791 196,297 206,632 215,838 224,837
GUARANTEED LOANS (GROSS):New guaranteed loans ............................. 242,268 262,948 271,650 276,517 282,490 284,395 290,584Outstandings ............................................ 1,351,933 1,469,053 1,580,206 1,684,194 1,826,063 1,929,917 2,053,922
Less secondary guaranteed loans: 1
GNMA guarantees of FHA/VA/FHA:New guaranteed loans ............................. –97,569 –107,472 –108,658 –110,772 –111,853 –112,522 –114,285Outstandings ............................................ –530,042 –559,054 –584,816 –608,751 –670,816 –698,642 –730,167
Total, primary guaranteed loans:New guaranteed loans ............................. 144,699 155,476 162,992 165,745 170,637 171,873 176,299Outstandings ............................................ 821,891 909,999 995,390 1,075,443 1,155,247 1,231,275 1,323,755
1 Loans guaranteed by FHA, VA, or FmHA are included above. GNMA places a secondary guarantee on these loans, sothey are deducted here to avoid double counting in the totals.
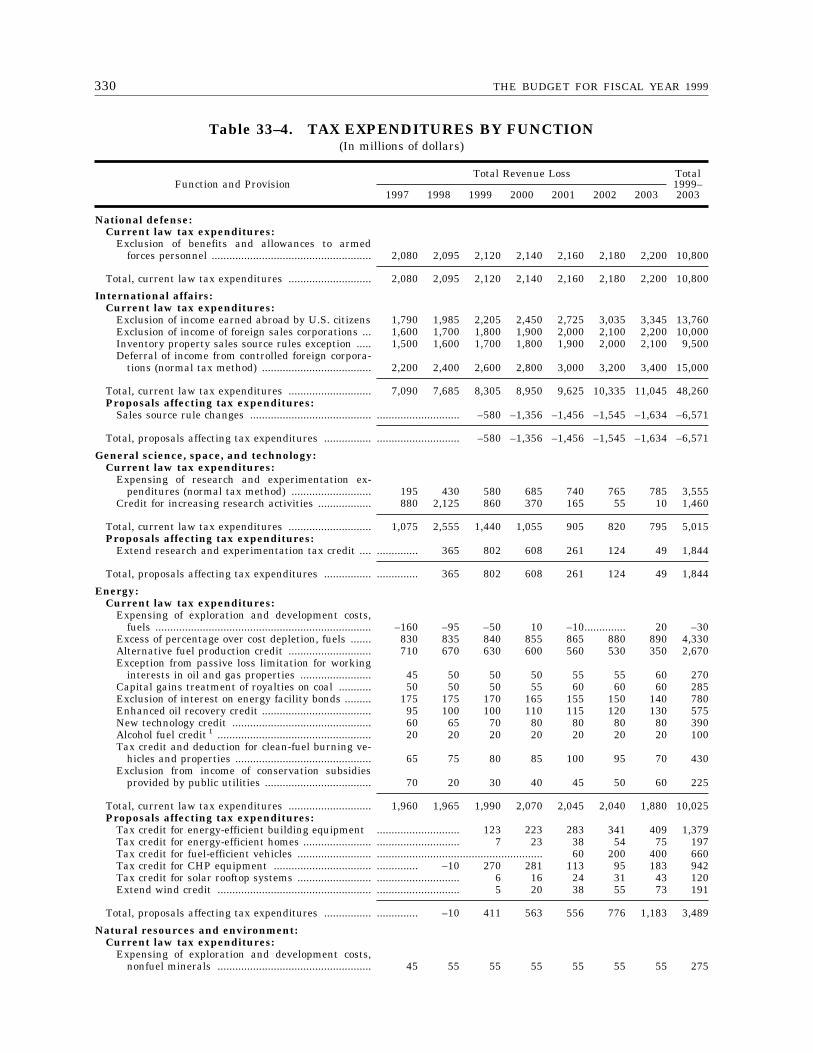
330 THE BUDGET FOR FISCAL YEAR 1999
Table 33–4. TAX EXPENDITURES BY FUNCTION(In millions of dollars)
Function and ProvisionTotal Revenue Loss Total
1999–20031997 1998 1999 2000 2001 2002 2003
National defense:Current law tax expenditures:
Exclusion of benefits and allowances to armedforces personnel ...................................................... 2,080 2,095 2,120 2,140 2,160 2,180 2,200 10,800
Total, current law tax expenditures ............................ 2,080 2,095 2,120 2,140 2,160 2,180 2,200 10,800
International affairs:Current law tax expenditures:
Exclusion of income earned abroad by U.S. citizens 1,790 1,985 2,205 2,450 2,725 3,035 3,345 13,760Exclusion of income of foreign sales corporations ... 1,600 1,700 1,800 1,900 2,000 2,100 2,200 10,000Inventory property sales source rules exception ..... 1,500 1,600 1,700 1,800 1,900 2,000 2,100 9,500Deferral of income from controlled foreign corpora-
tions (normal tax method) ..................................... 2,200 2,400 2,600 2,800 3,000 3,200 3,400 15,000
Total, current law tax expenditures ............................ 7,090 7,685 8,305 8,950 9,625 10,335 11,045 48,260Proposals affecting tax expenditures:
Sales source rule changes ......................................... ............................ –580 –1,356 –1,456 –1,545 –1,634 –6,571
Total, proposals affecting tax expenditures ................ ............................ –580 –1,356 –1,456 –1,545 –1,634 –6,571
General science, space, and technology:Current law tax expenditures:
Expensing of research and experimentation ex-penditures (normal tax method) ........................... 195 430 580 685 740 765 785 3,555
Credit for increasing research activities .................. 880 2,125 860 370 165 55 10 1,460
Total, current law tax expenditures ............................ 1,075 2,555 1,440 1,055 905 820 795 5,015Proposals affecting tax expenditures:
Extend research and experimentation tax credit .... .............. 365 802 608 261 124 49 1,844
Total, proposals affecting tax expenditures ................ .............. 365 802 608 261 124 49 1,844
Energy:Current law tax expenditures:
Expensing of exploration and development costs,fuels ......................................................................... –160 –95 –50 10 –10.............. 20 –30
Excess of percentage over cost depletion, fuels ....... 830 835 840 855 865 880 890 4,330Alternative fuel production credit ............................ 710 670 630 600 560 530 350 2,670Exception from passive loss limitation for working
interests in oil and gas properties ........................ 45 50 50 50 55 55 60 270Capital gains treatment of royalties on coal ........... 50 50 50 55 60 60 60 285Exclusion of interest on energy facility bonds ......... 175 175 170 165 155 150 140 780Enhanced oil recovery credit ..................................... 95 100 100 110 115 120 130 575New technology credit ............................................... 60 65 70 80 80 80 80 390Alcohol fuel credit 1 .................................................... 20 20 20 20 20 20 20 100Tax credit and deduction for clean-fuel burning ve-
hicles and properties .............................................. 65 75 80 85 100 95 70 430Exclusion from income of conservation subsidies
provided by public utilities .................................... 70 20 30 40 45 50 60 225
Total, current law tax expenditures ............................ 1,960 1,965 1,990 2,070 2,045 2,040 1,880 10,025Proposals affecting tax expenditures:
Tax credit for energy-efficient building equipment ............................ 123 223 283 341 409 1,379Tax credit for energy-efficient homes ....................... ............................ 7 23 38 54 75 197Tax credit for fuel-efficient vehicles ......................... ........................................................ 60 200 400 660Tax credit for CHP equipment ................................. .............. –10 270 281 113 95 183 942Tax credit for solar rooftop systems ......................... ............................ 6 16 24 31 43 120Extend wind credit .................................................... ............................ 5 20 38 55 73 191
Total, proposals affecting tax expenditures ................ .............. –10 411 563 556 776 1,183 3,489
Natural resources and environment:Current law tax expenditures:
Expensing of exploration and development costs,nonfuel minerals .................................................... 45 55 55 55 55 55 55 275
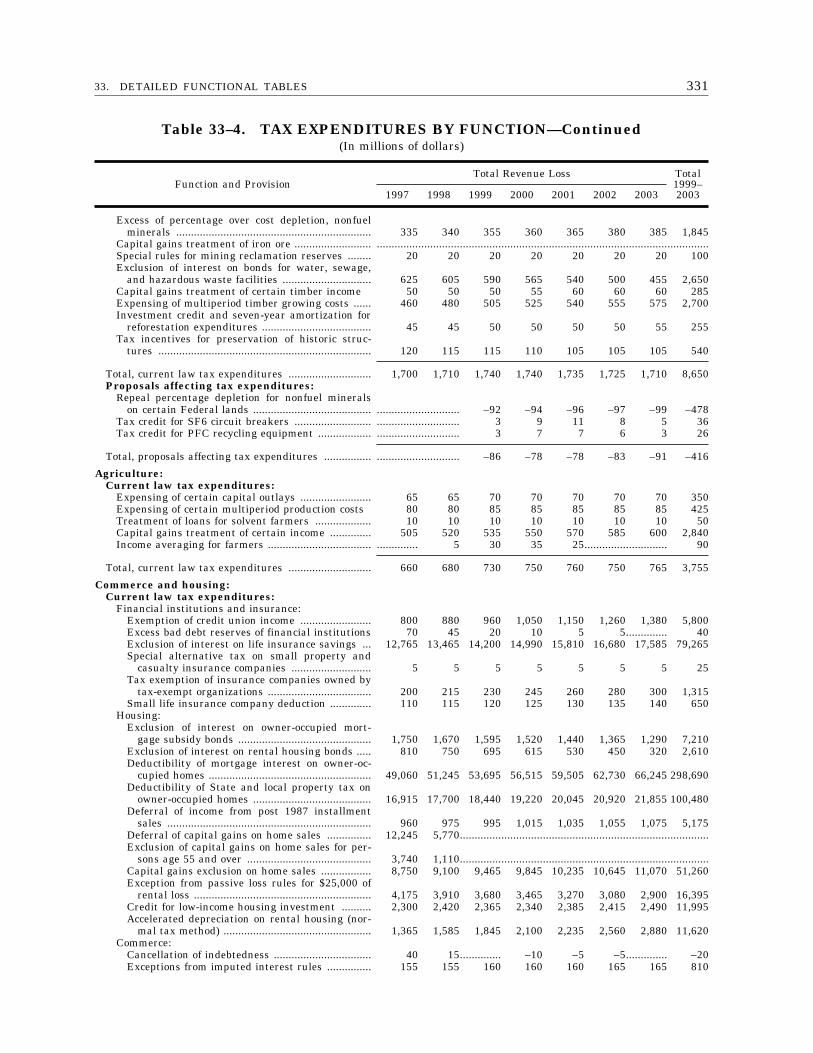
33133. DETAILED FUNCTIONAL TABLES
Table 33–4. TAX EXPENDITURES BY FUNCTION—Continued(In millions of dollars)
Function and ProvisionTotal Revenue Loss Total
1999–20031997 1998 1999 2000 2001 2002 2003
Excess of percentage over cost depletion, nonfuelminerals .................................................................. 335 340 355 360 365 380 385 1,845
Capital gains treatment of iron ore .......................... ................................................................................................................Special rules for mining reclamation reserves ........ 20 20 20 20 20 20 20 100Exclusion of interest on bonds for water, sewage,
and hazardous waste facilities .............................. 625 605 590 565 540 500 455 2,650Capital gains treatment of certain timber income 50 50 50 55 60 60 60 285Expensing of multiperiod timber growing costs ...... 460 480 505 525 540 555 575 2,700Investment credit and seven-year amortization for
reforestation expenditures ..................................... 45 45 50 50 50 50 55 255Tax incentives for preservation of historic struc-
tures ........................................................................ 120 115 115 110 105 105 105 540
Total, current law tax expenditures ............................ 1,700 1,710 1,740 1,740 1,735 1,725 1,710 8,650Proposals affecting tax expenditures:
Repeal percentage depletion for nonfuel mineralson certain Federal lands ........................................ ............................ –92 –94 –96 –97 –99 –478
Tax credit for SF6 circuit breakers .......................... ............................ 3 9 11 8 5 36Tax credit for PFC recycling equipment .................. ............................ 3 7 7 6 3 26
Total, proposals affecting tax expenditures ................ ............................ –86 –78 –78 –83 –91 –416
Agriculture:Current law tax expenditures:
Expensing of certain capital outlays ........................ 65 65 70 70 70 70 70 350Expensing of certain multiperiod production costs 80 80 85 85 85 85 85 425Treatment of loans for solvent farmers ................... 10 10 10 10 10 10 10 50Capital gains treatment of certain income .............. 505 520 535 550 570 585 600 2,840Income averaging for farmers ................................... .............. 5 30 35 25............................ 90
Total, current law tax expenditures ............................ 660 680 730 750 760 750 765 3,755
Commerce and housing:Current law tax expenditures:
Financial institutions and insurance:Exemption of credit union income ........................ 800 880 960 1,050 1,150 1,260 1,380 5,800Excess bad debt reserves of financial institutions 70 45 20 10 5 5.............. 40Exclusion of interest on life insurance savings ... 12,765 13,465 14,200 14,990 15,810 16,680 17,585 79,265Special alternative tax on small property and
casualty insurance companies ........................... 5 5 5 5 5 5 5 25Tax exemption of insurance companies owned by
tax-exempt organizations ................................... 200 215 230 245 260 280 300 1,315Small life insurance company deduction .............. 110 115 120 125 130 135 140 650
Housing:Exclusion of interest on owner-occupied mort-
gage subsidy bonds ............................................. 1,750 1,670 1,595 1,520 1,440 1,365 1,290 7,210Exclusion of interest on rental housing bonds ..... 810 750 695 615 530 450 320 2,610Deductibility of mortgage interest on owner-oc-
cupied homes ....................................................... 49,060 51,245 53,695 56,515 59,505 62,730 66,245 298,690Deductibility of State and local property tax on
owner-occupied homes ........................................ 16,915 17,700 18,440 19,220 20,045 20,920 21,855 100,480Deferral of income from post 1987 installment
sales ..................................................................... 960 975 995 1,015 1,035 1,055 1,075 5,175Deferral of capital gains on home sales ............... 12,245 5,770....................................................................................Exclusion of capital gains on home sales for per-
sons age 55 and over .......................................... 3,740 1,110....................................................................................Capital gains exclusion on home sales ................. 8,750 9,100 9,465 9,845 10,235 10,645 11,070 51,260Exception from passive loss rules for $25,000 of
rental loss ............................................................ 4,175 3,910 3,680 3,465 3,270 3,080 2,900 16,395Credit for low-income housing investment .......... 2,300 2,420 2,365 2,340 2,385 2,415 2,490 11,995Accelerated depreciation on rental housing (nor-
mal tax method) .................................................. 1,365 1,585 1,845 2,100 2,235 2,560 2,880 11,620Commerce:
Cancellation of indebtedness ................................. 40 15.............. –10 –5 –5.............. –20Exceptions from imputed interest rules ............... 155 155 160 160 160 165 165 810
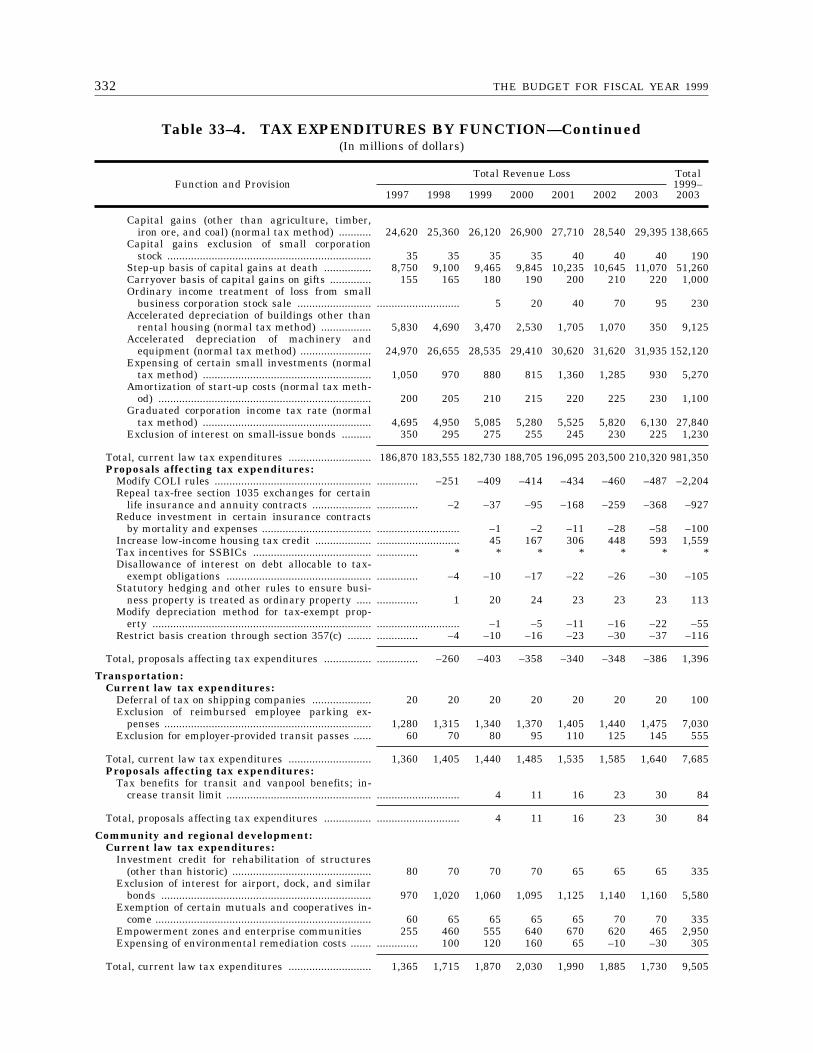
332 THE BUDGET FOR FISCAL YEAR 1999
Table 33–4. TAX EXPENDITURES BY FUNCTION—Continued(In millions of dollars)
Function and ProvisionTotal Revenue Loss Total
1999–20031997 1998 1999 2000 2001 2002 2003
Capital gains (other than agriculture, timber,iron ore, and coal) (normal tax method) ........... 24,620 25,360 26,120 26,900 27,710 28,540 29,395 138,665
Capital gains exclusion of small corporationstock ..................................................................... 35 35 35 35 40 40 40 190
Step-up basis of capital gains at death ................ 8,750 9,100 9,465 9,845 10,235 10,645 11,070 51,260Carryover basis of capital gains on gifts .............. 155 165 180 190 200 210 220 1,000Ordinary income treatment of loss from small
business corporation stock sale ......................... ............................ 5 20 40 70 95 230Accelerated depreciation of buildings other than
rental housing (normal tax method) ................. 5,830 4,690 3,470 2,530 1,705 1,070 350 9,125Accelerated depreciation of machinery and
equipment (normal tax method) ........................ 24,970 26,655 28,535 29,410 30,620 31,620 31,935 152,120Expensing of certain small investments (normal
tax method) ......................................................... 1,050 970 880 815 1,360 1,285 930 5,270Amortization of start-up costs (normal tax meth-
od) ........................................................................ 200 205 210 215 220 225 230 1,100Graduated corporation income tax rate (normal
tax method) ......................................................... 4,695 4,950 5,085 5,280 5,525 5,820 6,130 27,840Exclusion of interest on small-issue bonds .......... 350 295 275 255 245 230 225 1,230
Total, current law tax expenditures ............................ 186,870 183,555 182,730 188,705 196,095 203,500 210,320 981,350Proposals affecting tax expenditures:
Modify COLI rules ..................................................... .............. –251 –409 –414 –434 –460 –487 –2,204Repeal tax-free section 1035 exchanges for certain
life insurance and annuity contracts .................... .............. –2 –37 –95 –168 –259 –368 –927Reduce investment in certain insurance contracts
by mortality and expenses ..................................... ............................ –1 –2 –11 –28 –58 –100Increase low-income housing tax credit ................... ............................ 45 167 306 448 593 1,559Tax incentives for SSBICs ........................................ .............. * * * * * * *Disallowance of interest on debt allocable to tax-
exempt obligations ................................................. .............. –4 –10 –17 –22 –26 –30 –105Statutory hedging and other rules to ensure busi-
ness property is treated as ordinary property ..... .............. 1 20 24 23 23 23 113Modify depreciation method for tax-exempt prop-
erty .......................................................................... ............................ –1 –5 –11 –16 –22 –55Restrict basis creation through section 357(c) ........ .............. –4 –10 –16 –23 –30 –37 –116
Total, proposals affecting tax expenditures ................ .............. –260 –403 –358 –340 –348 –386 1,396
Transportation:Current law tax expenditures:
Deferral of tax on shipping companies .................... 20 20 20 20 20 20 20 100Exclusion of reimbursed employee parking ex-
penses ...................................................................... 1,280 1,315 1,340 1,370 1,405 1,440 1,475 7,030Exclusion for employer-provided transit passes ...... 60 70 80 95 110 125 145 555
Total, current law tax expenditures ............................ 1,360 1,405 1,440 1,485 1,535 1,585 1,640 7,685Proposals affecting tax expenditures:
Tax benefits for transit and vanpool benefits; in-crease transit limit ................................................. ............................ 4 11 16 23 30 84
Total, proposals affecting tax expenditures ................ ............................ 4 11 16 23 30 84
Community and regional development:Current law tax expenditures:
Investment credit for rehabilitation of structures(other than historic) ............................................... 80 70 70 70 65 65 65 335
Exclusion of interest for airport, dock, and similarbonds ....................................................................... 970 1,020 1,060 1,095 1,125 1,140 1,160 5,580
Exemption of certain mutuals and cooperatives in-come ......................................................................... 60 65 65 65 65 70 70 335
Empowerment zones and enterprise communities 255 460 555 640 670 620 465 2,950Expensing of environmental remediation costs ....... .............. 100 120 160 65 –10 –30 305
Total, current law tax expenditures ............................ 1,365 1,715 1,870 2,030 1,990 1,885 1,730 9,505
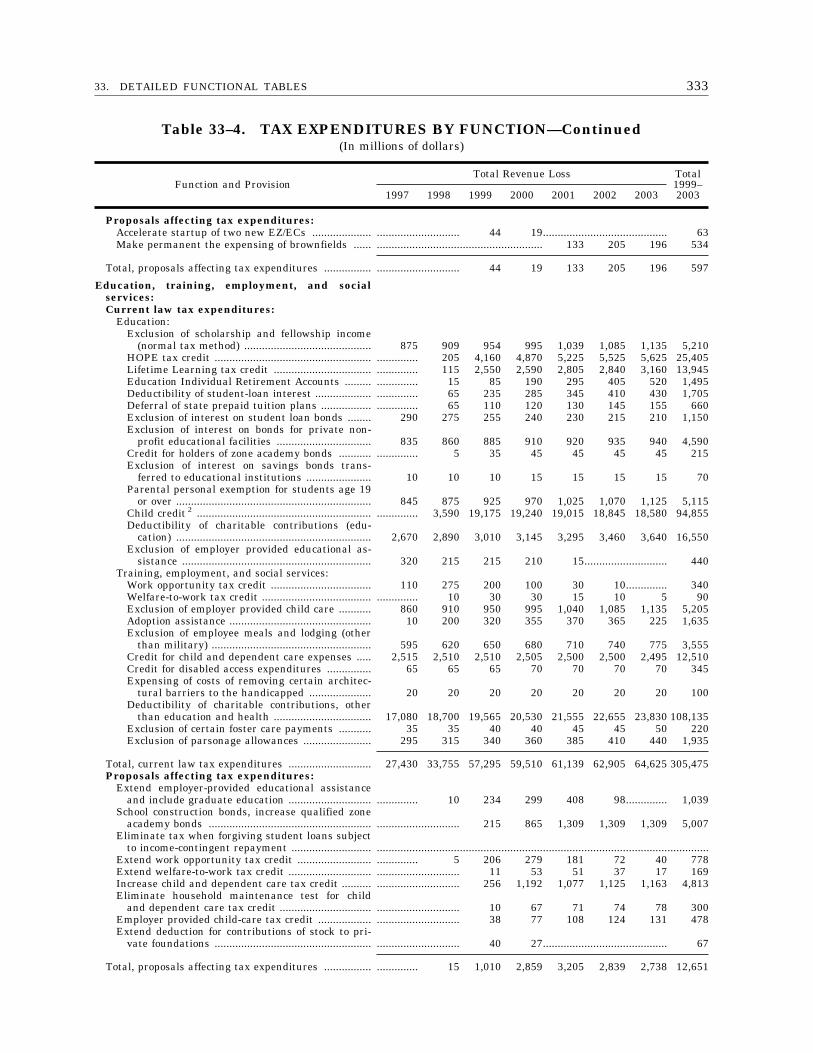
33333. DETAILED FUNCTIONAL TABLES
Table 33–4. TAX EXPENDITURES BY FUNCTION—Continued(In millions of dollars)
Function and ProvisionTotal Revenue Loss Total
1999–20031997 1998 1999 2000 2001 2002 2003
Proposals affecting tax expenditures:Accelerate startup of two new EZ/ECs .................... ............................ 44 19.......................................... 63Make permanent the expensing of brownfields ...... ........................................................ 133 205 196 534
Total, proposals affecting tax expenditures ................ ............................ 44 19 133 205 196 597
Education, training, employment, and socialservices:Current law tax expenditures:
Education:Exclusion of scholarship and fellowship income
(normal tax method) ........................................... 875 909 954 995 1,039 1,085 1,135 5,210HOPE tax credit ..................................................... .............. 205 4,160 4,870 5,225 5,525 5,625 25,405Lifetime Learning tax credit ................................. .............. 115 2,550 2,590 2,805 2,840 3,160 13,945Education Individual Retirement Accounts ......... .............. 15 85 190 295 405 520 1,495Deductibility of student-loan interest ................... .............. 65 235 285 345 410 430 1,705Deferral of state prepaid tuition plans ................. .............. 65 110 120 130 145 155 660Exclusion of interest on student loan bonds ........ 290 275 255 240 230 215 210 1,150Exclusion of interest on bonds for private non-
profit educational facilities ................................ 835 860 885 910 920 935 940 4,590Credit for holders of zone academy bonds ........... .............. 5 35 45 45 45 45 215Exclusion of interest on savings bonds trans-
ferred to educational institutions ...................... 10 10 10 15 15 15 15 70Parental personal exemption for students age 19
or over .................................................................. 845 875 925 970 1,025 1,070 1,125 5,115Child credit 2 ........................................................... .............. 3,590 19,175 19,240 19,015 18,845 18,580 94,855Deductibility of charitable contributions (edu-
cation) .................................................................. 2,670 2,890 3,010 3,145 3,295 3,460 3,640 16,550Exclusion of employer provided educational as-
sistance ................................................................ 320 215 215 210 15............................ 440Training, employment, and social services:
Work opportunity tax credit .................................. 110 275 200 100 30 10.............. 340Welfare-to-work tax credit ..................................... .............. 10 30 30 15 10 5 90Exclusion of employer provided child care ........... 860 910 950 995 1,040 1,085 1,135 5,205Adoption assistance ................................................ 10 200 320 355 370 365 225 1,635Exclusion of employee meals and lodging (other
than military) ...................................................... 595 620 650 680 710 740 775 3,555Credit for child and dependent care expenses ..... 2,515 2,510 2,510 2,505 2,500 2,500 2,495 12,510Credit for disabled access expenditures ............... 65 65 65 70 70 70 70 345Expensing of costs of removing certain architec-
tural barriers to the handicapped ..................... 20 20 20 20 20 20 20 100Deductibility of charitable contributions, other
than education and health ................................. 17,080 18,700 19,565 20,530 21,555 22,655 23,830 108,135Exclusion of certain foster care payments ........... 35 35 40 40 45 45 50 220Exclusion of parsonage allowances ....................... 295 315 340 360 385 410 440 1,935
Total, current law tax expenditures ............................ 27,430 33,755 57,295 59,510 61,139 62,905 64,625 305,475Proposals affecting tax expenditures:
Extend employer-provided educational assistanceand include graduate education ............................ .............. 10 234 299 408 98.............. 1,039
School construction bonds, increase qualified zoneacademy bonds ....................................................... ............................ 215 865 1,309 1,309 1,309 5,007
Eliminate tax when forgiving student loans subjectto income-contingent repayment ........................... ................................................................................................................
Extend work opportunity tax credit ......................... .............. 5 206 279 181 72 40 778Extend welfare-to-work tax credit ............................ ............................ 11 53 51 37 17 169Increase child and dependent care tax credit .......... ............................ 256 1,192 1,077 1,125 1,163 4,813Eliminate household maintenance test for child
and dependent care tax credit ............................... ............................ 10 67 71 74 78 300Employer provided child-care tax credit .................. ............................ 38 77 108 124 131 478Extend deduction for contributions of stock to pri-
vate foundations ..................................................... ............................ 40 27.......................................... 67
Total, proposals affecting tax expenditures ................ .............. 15 1,010 2,859 3,205 2,839 2,738 12,651
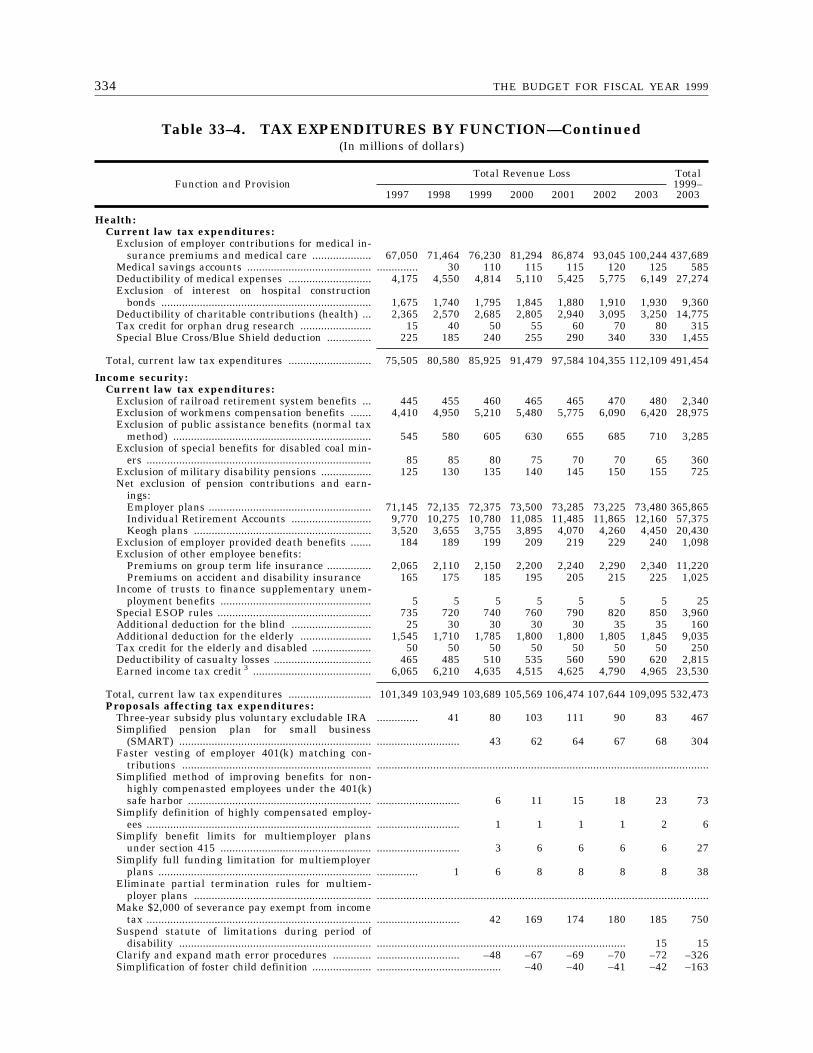
334 THE BUDGET FOR FISCAL YEAR 1999
Table 33–4. TAX EXPENDITURES BY FUNCTION—Continued(In millions of dollars)
Function and ProvisionTotal Revenue Loss Total
1999–20031997 1998 1999 2000 2001 2002 2003
Health:Current law tax expenditures:
Exclusion of employer contributions for medical in-surance premiums and medical care .................... 67,050 71,464 76,230 81,294 86,874 93,045 100,244 437,689
Medical savings accounts .......................................... .............. 30 110 115 115 120 125 585Deductibility of medical expenses ............................ 4,175 4,550 4,814 5,110 5,425 5,775 6,149 27,274Exclusion of interest on hospital construction
bonds ....................................................................... 1,675 1,740 1,795 1,845 1,880 1,910 1,930 9,360Deductibility of charitable contributions (health) ... 2,365 2,570 2,685 2,805 2,940 3,095 3,250 14,775Tax credit for orphan drug research ........................ 15 40 50 55 60 70 80 315Special Blue Cross/Blue Shield deduction ............... 225 185 240 255 290 340 330 1,455
Total, current law tax expenditures ............................ 75,505 80,580 85,925 91,479 97,584 104,355 112,109 491,454
Income security:Current law tax expenditures:
Exclusion of railroad retirement system benefits ... 445 455 460 465 465 470 480 2,340Exclusion of workmens compensation benefits ....... 4,410 4,950 5,210 5,480 5,775 6,090 6,420 28,975Exclusion of public assistance benefits (normal tax
method) ................................................................... 545 580 605 630 655 685 710 3,285Exclusion of special benefits for disabled coal min-
ers ............................................................................ 85 85 80 75 70 70 65 360Exclusion of military disability pensions ................. 125 130 135 140 145 150 155 725Net exclusion of pension contributions and earn-
ings:Employer plans ....................................................... 71,145 72,135 72,375 73,500 73,285 73,225 73,480 365,865Individual Retirement Accounts ........................... 9,770 10,275 10,780 11,085 11,485 11,865 12,160 57,375Keogh plans ............................................................ 3,520 3,655 3,755 3,895 4,070 4,260 4,450 20,430
Exclusion of employer provided death benefits ....... 184 189 199 209 219 229 240 1,098Exclusion of other employee benefits:
Premiums on group term life insurance ............... 2,065 2,110 2,150 2,200 2,240 2,290 2,340 11,220Premiums on accident and disability insurance 165 175 185 195 205 215 225 1,025
Income of trusts to finance supplementary unem-ployment benefits ................................................... 5 5 5 5 5 5 5 25
Special ESOP rules .................................................... 735 720 740 760 790 820 850 3,960Additional deduction for the blind ........................... 25 30 30 30 30 35 35 160Additional deduction for the elderly ........................ 1,545 1,710 1,785 1,800 1,800 1,805 1,845 9,035Tax credit for the elderly and disabled .................... 50 50 50 50 50 50 50 250Deductibility of casualty losses ................................. 465 485 510 535 560 590 620 2,815Earned income tax credit 3 ........................................ 6,065 6,210 4,635 4,515 4,625 4,790 4,965 23,530
Total, current law tax expenditures ............................ 101,349 103,949 103,689 105,569 106,474 107,644 109,095 532,473Proposals affecting tax expenditures:
Three-year subsidy plus voluntary excludable IRA .............. 41 80 103 111 90 83 467Simplified pension plan for small business
(SMART) ................................................................. ............................ 43 62 64 67 68 304Faster vesting of employer 401(k) matching con-
tributions ................................................................ ................................................................................................................Simplified method of improving benefits for non-
highly compenasted employees under the 401(k)safe harbor .............................................................. ............................ 6 11 15 18 23 73
Simplify definition of highly compensated employ-ees ............................................................................ ............................ 1 1 1 1 2 6
Simplify benefit limits for multiemployer plansunder section 415 ................................................... ............................ 3 6 6 6 6 27
Simplify full funding limitation for multiemployerplans ........................................................................ .............. 1 6 8 8 8 8 38
Eliminate partial termination rules for multiem-ployer plans ............................................................ ................................................................................................................
Make $2,000 of severance pay exempt from incometax ............................................................................ ............................ 42 169 174 180 185 750
Suspend statute of limitations during period ofdisability ................................................................. .................................................................................... 15 15
Clarify and expand math error procedures ............. ............................ –48 –67 –69 –70 –72 –326Simplification of foster child definition .................... .......................................... –40 –40 –41 –42 –163
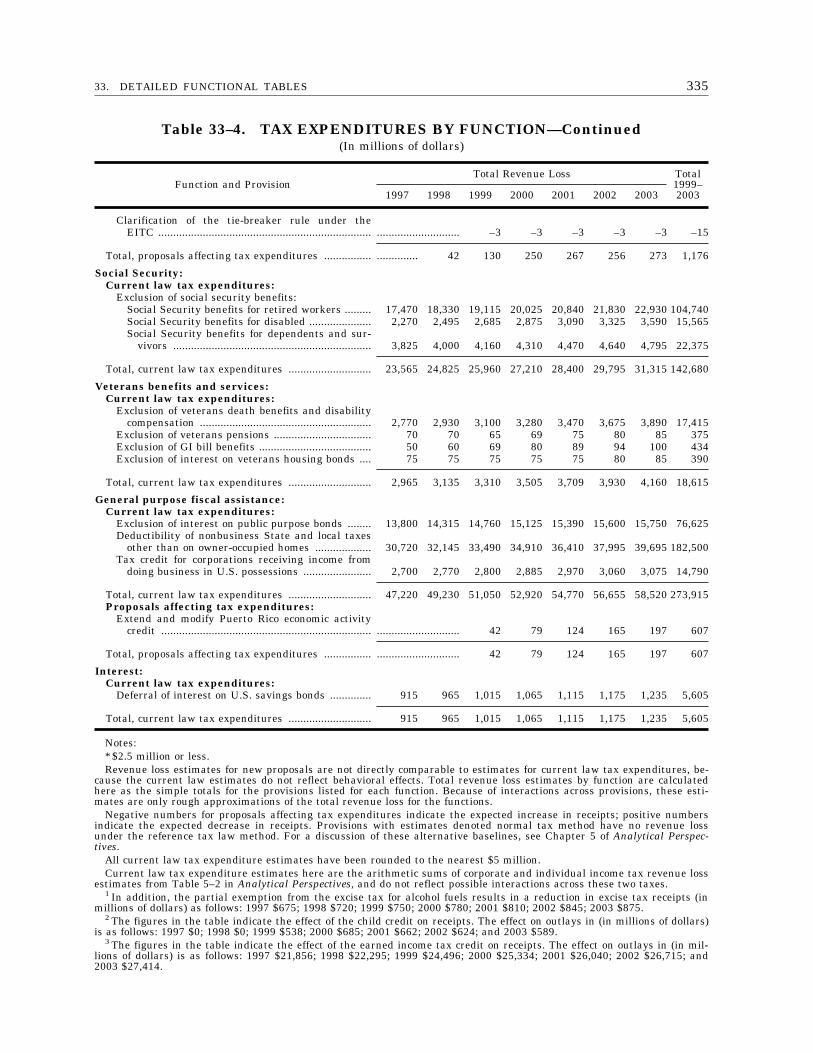
33533. DETAILED FUNCTIONAL TABLES
Table 33–4. TAX EXPENDITURES BY FUNCTION—Continued(In millions of dollars)
Function and ProvisionTotal Revenue Loss Total
1999–20031997 1998 1999 2000 2001 2002 2003
Clarification of the tie-breaker rule under theEITC ........................................................................ ............................ –3 –3 –3 –3 –3 –15
Total, proposals affecting tax expenditures ................ .............. 42 130 250 267 256 273 1,176
Social Security:Current law tax expenditures:
Exclusion of social security benefits:Social Security benefits for retired workers ......... 17,470 18,330 19,115 20,025 20,840 21,830 22,930 104,740Social Security benefits for disabled ..................... 2,270 2,495 2,685 2,875 3,090 3,325 3,590 15,565Social Security benefits for dependents and sur-
vivors ................................................................... 3,825 4,000 4,160 4,310 4,470 4,640 4,795 22,375
Total, current law tax expenditures ............................ 23,565 24,825 25,960 27,210 28,400 29,795 31,315 142,680
Veterans benefits and services:Current law tax expenditures:
Exclusion of veterans death benefits and disabilitycompensation .......................................................... 2,770 2,930 3,100 3,280 3,470 3,675 3,890 17,415
Exclusion of veterans pensions ................................. 70 70 65 69 75 80 85 375Exclusion of GI bill benefits ...................................... 50 60 69 80 89 94 100 434Exclusion of interest on veterans housing bonds .... 75 75 75 75 75 80 85 390
Total, current law tax expenditures ............................ 2,965 3,135 3,310 3,505 3,709 3,930 4,160 18,615
General purpose fiscal assistance:Current law tax expenditures:
Exclusion of interest on public purpose bonds ........ 13,800 14,315 14,760 15,125 15,390 15,600 15,750 76,625Deductibility of nonbusiness State and local taxes
other than on owner-occupied homes ................... 30,720 32,145 33,490 34,910 36,410 37,995 39,695 182,500Tax credit for corporations receiving income from
doing business in U.S. possessions ....................... 2,700 2,770 2,800 2,885 2,970 3,060 3,075 14,790
Total, current law tax expenditures ............................ 47,220 49,230 51,050 52,920 54,770 56,655 58,520 273,915Proposals affecting tax expenditures:
Extend and modify Puerto Rico economic activitycredit ....................................................................... ............................ 42 79 124 165 197 607
Total, proposals affecting tax expenditures ................ ............................ 42 79 124 165 197 607
Interest:Current law tax expenditures:
Deferral of interest on U.S. savings bonds .............. 915 965 1,015 1,065 1,115 1,175 1,235 5,605
Total, current law tax expenditures ............................ 915 965 1,015 1,065 1,115 1,175 1,235 5,605
Notes:* $2.5 million or less.Revenue loss estimates for new proposals are not directly comparable to estimates for current law tax expenditures, be-
cause the current law estimates do not reflect behavioral effects. Total revenue loss estimates by function are calculatedhere as the simple totals for the provisions listed for each function. Because of interactions across provisions, these esti-mates are only rough approximations of the total revenue loss for the functions.
Negative numbers for proposals affecting tax expenditures indicate the expected increase in receipts; positive numbersindicate the expected decrease in receipts. Provisions with estimates denoted normal tax method have no revenue lossunder the reference tax law method. For a discussion of these alternative baselines, see Chapter 5 of Analytical Perspec-tives.
All current law tax expenditure estimates have been rounded to the nearest $5 million.Current law tax expenditure estimates here are the arithmetic sums of corporate and individual income tax revenue loss
estimates from Table 5–2 in Analytical Perspectives, and do not reflect possible interactions across these two taxes.1 In addition, the partial exemption from the excise tax for alcohol fuels results in a reduction in excise tax receipts (in
millions of dollars) as follows: 1997 $675; 1998 $720; 1999 $750; 2000 $780; 2001 $810; 2002 $845; 2003 $875.2 The figures in the table indicate the effect of the child credit on receipts. The effect on outlays in (in millions of dollars)
is as follows: 1997 $0; 1998 $0; 1999 $538; 2000 $685; 2001 $662; 2002 $624; and 2003 $589.3 The figures in the table indicate the effect of the earned income tax credit on receipts. The effect on outlays in (in mil-
lions of dollars) is as follows: 1997 $21,856; 1998 $22,295; 1999 $24,496; 2000 $25,334; 2001 $26,040; 2002 $26,715; and2003 $27,414.


337
VII. SUMMARY TABLES

339
1999 Budget Proposals

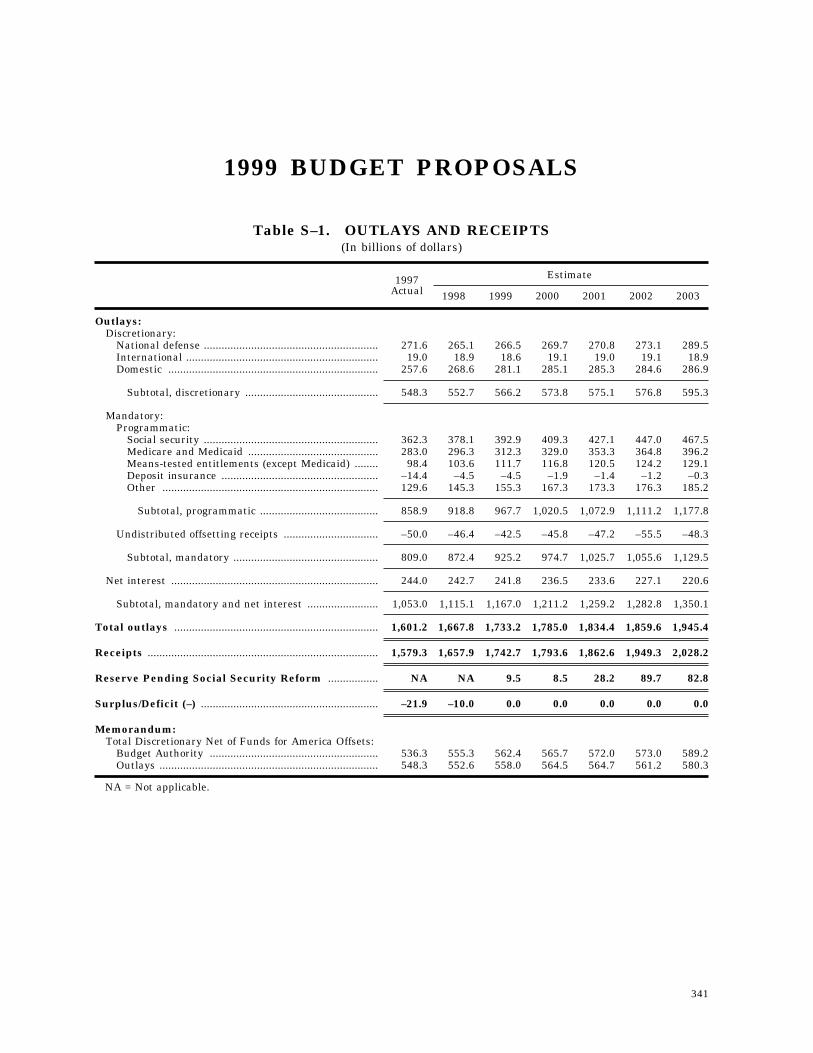
341
1999 BUDGET PROPOSALS
Table S–1. OUTLAYS AND RECEIPTS(In billions of dollars)
1997Actual
Estimate
1998 1999 2000 2001 2002 2003
Outlays:Discretionary:
National defense ........................................................... 271.6 265.1 266.5 269.7 270.8 273.1 289.5International ................................................................. 19.0 18.9 18.6 19.1 19.0 19.1 18.9Domestic ....................................................................... 257.6 268.6 281.1 285.1 285.3 284.6 286.9
Subtotal, discretionary ............................................. 548.3 552.7 566.2 573.8 575.1 576.8 595.3
Mandatory:Programmatic:
Social security ........................................................... 362.3 378.1 392.9 409.3 427.1 447.0 467.5Medicare and Medicaid ............................................ 283.0 296.3 312.3 329.0 353.3 364.8 396.2Means-tested entitlements (except Medicaid) ........ 98.4 103.6 111.7 116.8 120.5 124.2 129.1Deposit insurance ..................................................... –14.4 –4.5 –4.5 –1.9 –1.4 –1.2 –0.3Other ......................................................................... 129.6 145.3 155.3 167.3 173.3 176.3 185.2
Subtotal, programmatic ........................................ 858.9 918.8 967.7 1,020.5 1,072.9 1,111.2 1,177.8
Undistributed offsetting receipts ................................ –50.0 –46.4 –42.5 –45.8 –47.2 –55.5 –48.3
Subtotal, mandatory ................................................. 809.0 872.4 925.2 974.7 1,025.7 1,055.6 1,129.5
Net interest ...................................................................... 244.0 242.7 241.8 236.5 233.6 227.1 220.6
Subtotal, mandatory and net interest ........................ 1,053.0 1,115.1 1,167.0 1,211.2 1,259.2 1,282.8 1,350.1
Total outlays ..................................................................... 1,601.2 1,667.8 1,733.2 1,785.0 1,834.4 1,859.6 1,945.4
Receipts .............................................................................. 1,579.3 1,657.9 1,742.7 1,793.6 1,862.6 1,949.3 2,028.2
Reserve Pending Social Security Reform ................. NA NA 9.5 8.5 28.2 89.7 82.8
Surplus/Deficit (–) ............................................................ –21.9 –10.0 0.0 0.0 0.0 0.0 0.0
Memorandum:Total Discretionary Net of Funds for America Offsets:
Budget Authority ......................................................... 536.3 555.3 562.4 565.7 572.0 573.0 589.2Outlays .......................................................................... 548.3 552.6 558.0 564.5 564.7 561.2 580.3
NA = Not applicable.
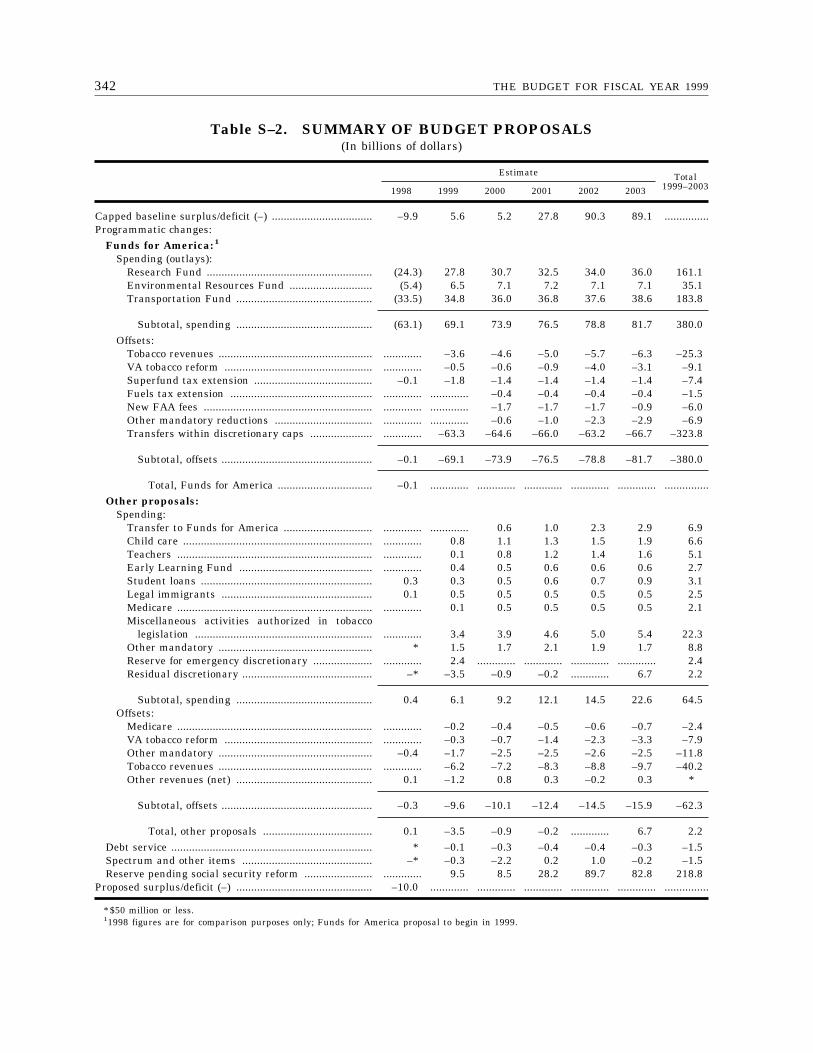
342 THE BUDGET FOR FISCAL YEAR 1999
Table S–2. SUMMARY OF BUDGET PROPOSALS(In billions of dollars)
Estimate Total1999–20031998 1999 2000 2001 2002 2003
Capped baseline surplus/deficit (–) .................................. –9.9 5.6 5.2 27.8 90.3 89.1 ...............Programmatic changes:
Funds for America: 1
Spending (outlays):Research Fund ........................................................ (24.3) 27.8 30.7 32.5 34.0 36.0 161.1Environmental Resources Fund ............................ (5.4) 6.5 7.1 7.2 7.1 7.1 35.1Transportation Fund .............................................. (33.5) 34.8 36.0 36.8 37.6 38.6 183.8
Subtotal, spending .............................................. (63.1) 69.1 73.9 76.5 78.8 81.7 380.0Offsets:
Tobacco revenues .................................................... ............. –3.6 –4.6 –5.0 –5.7 –6.3 –25.3VA tobacco reform .................................................. ............. –0.5 –0.6 –0.9 –4.0 –3.1 –9.1Superfund tax extension ........................................ –0.1 –1.8 –1.4 –1.4 –1.4 –1.4 –7.4Fuels tax extension ................................................ ............. ............. –0.4 –0.4 –0.4 –0.4 –1.5New FAA fees ......................................................... ............. ............. –1.7 –1.7 –1.7 –0.9 –6.0Other mandatory reductions ................................. ............. ............. –0.6 –1.0 –2.3 –2.9 –6.9Transfers within discretionary caps ..................... ............. –63.3 –64.6 –66.0 –63.2 –66.7 –323.8
Subtotal, offsets ................................................... –0.1 –69.1 –73.9 –76.5 –78.8 –81.7 –380.0
Total, Funds for America ................................ –0.1 ............. ............. ............. ............. ............. ...............Other proposals:
Spending:Transfer to Funds for America .............................. ............. ............. 0.6 1.0 2.3 2.9 6.9Child care ................................................................ ............. 0.8 1.1 1.3 1.5 1.9 6.6Teachers .................................................................. ............. 0.1 0.8 1.2 1.4 1.6 5.1Early Learning Fund ............................................. ............. 0.4 0.5 0.6 0.6 0.6 2.7Student loans .......................................................... 0.3 0.3 0.5 0.6 0.7 0.9 3.1Legal immigrants ................................................... 0.1 0.5 0.5 0.5 0.5 0.5 2.5Medicare .................................................................. ............. 0.1 0.5 0.5 0.5 0.5 2.1Miscellaneous activities authorized in tobacco
legislation ............................................................ ............. 3.4 3.9 4.6 5.0 5.4 22.3Other mandatory .................................................... * 1.5 1.7 2.1 1.9 1.7 8.8Reserve for emergency discretionary .................... ............. 2.4 ............. ............. ............. ............. 2.4Residual discretionary ............................................ –* –3.5 –0.9 –0.2 ............. 6.7 2.2
Subtotal, spending .............................................. 0.4 6.1 9.2 12.1 14.5 22.6 64.5Offsets:
Medicare .................................................................. ............. –0.2 –0.4 –0.5 –0.6 –0.7 –2.4VA tobacco reform .................................................. ............. –0.3 –0.7 –1.4 –2.3 –3.3 –7.9Other mandatory .................................................... –0.4 –1.7 –2.5 –2.5 –2.6 –2.5 –11.8Tobacco revenues .................................................... ............. –6.2 –7.2 –8.3 –8.8 –9.7 –40.2Other revenues (net) .............................................. 0.1 –1.2 0.8 0.3 –0.2 0.3 *
Subtotal, offsets ................................................... –0.3 –9.6 –10.1 –12.4 –14.5 –15.9 –62.3
Total, other proposals ..................................... 0.1 –3.5 –0.9 –0.2 ............. 6.7 2.2Debt service .................................................................... * –0.1 –0.3 –0.4 –0.4 –0.3 –1.5Spectrum and other items ............................................ –* –0.3 –2.2 0.2 1.0 –0.2 –1.5Reserve pending social security reform ....................... ............. 9.5 8.5 28.2 89.7 82.8 218.8
Proposed surplus/deficit (–) .............................................. –10.0 ............. ............. ............. ............. ............. ...............
* $50 million or less.11998 figures are for comparison purposes only; Funds for America proposal to begin in 1999.
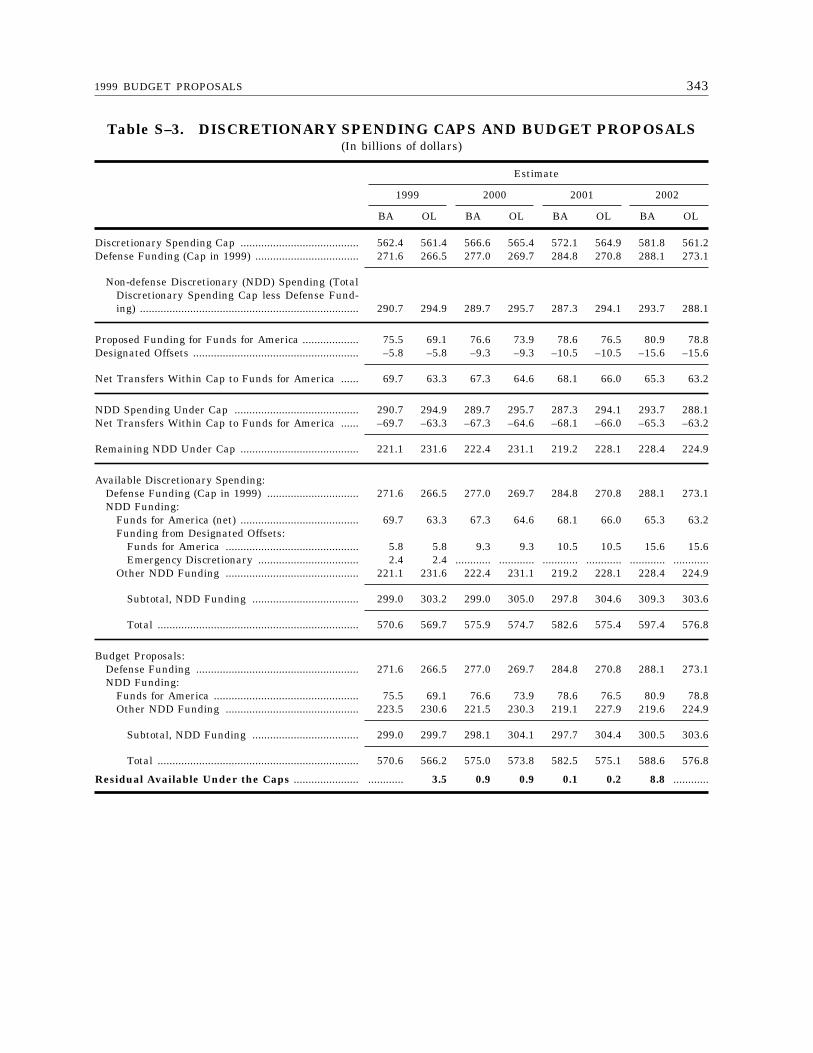
3431999 BUDGET PROPOSALS
Table S–3. DISCRETIONARY SPENDING CAPS AND BUDGET PROPOSALS(In billions of dollars)
Estimate
1999 2000 2001 2002
BA OL BA OL BA OL BA OL
Discretionary Spending Cap ........................................ 562.4 561.4 566.6 565.4 572.1 564.9 581.8 561.2Defense Funding (Cap in 1999) ................................... 271.6 266.5 277.0 269.7 284.8 270.8 288.1 273.1
Non-defense Discretionary (NDD) Spending (TotalDiscretionary Spending Cap less Defense Fund-ing) .......................................................................... 290.7 294.9 289.7 295.7 287.3 294.1 293.7 288.1
Proposed Funding for Funds for America ................... 75.5 69.1 76.6 73.9 78.6 76.5 80.9 78.8Designated Offsets ........................................................ –5.8 –5.8 –9.3 –9.3 –10.5 –10.5 –15.6 –15.6
Net Transfers Within Cap to Funds for America ...... 69.7 63.3 67.3 64.6 68.1 66.0 65.3 63.2
NDD Spending Under Cap .......................................... 290.7 294.9 289.7 295.7 287.3 294.1 293.7 288.1Net Transfers Within Cap to Funds for America ...... –69.7 –63.3 –67.3 –64.6 –68.1 –66.0 –65.3 –63.2
Remaining NDD Under Cap ........................................ 221.1 231.6 222.4 231.1 219.2 228.1 228.4 224.9
Available Discretionary Spending:Defense Funding (Cap in 1999) ............................... 271.6 266.5 277.0 269.7 284.8 270.8 288.1 273.1NDD Funding:
Funds for America (net) ........................................ 69.7 63.3 67.3 64.6 68.1 66.0 65.3 63.2Funding from Designated Offsets:
Funds for America ............................................. 5.8 5.8 9.3 9.3 10.5 10.5 15.6 15.6Emergency Discretionary .................................. 2.4 2.4 ............ ............ ............ ............ ............ ............
Other NDD Funding ............................................. 221.1 231.6 222.4 231.1 219.2 228.1 228.4 224.9
Subtotal, NDD Funding .................................... 299.0 303.2 299.0 305.0 297.8 304.6 309.3 303.6
Total .................................................................... 570.6 569.7 575.9 574.7 582.6 575.4 597.4 576.8
Budget Proposals:Defense Funding ....................................................... 271.6 266.5 277.0 269.7 284.8 270.8 288.1 273.1NDD Funding:
Funds for America ................................................. 75.5 69.1 76.6 73.9 78.6 76.5 80.9 78.8Other NDD Funding ............................................. 223.5 230.6 221.5 230.3 219.1 227.9 219.6 224.9
Subtotal, NDD Funding .................................... 299.0 299.7 298.1 304.1 297.7 304.4 300.5 303.6
Total .................................................................... 570.6 566.2 575.0 573.8 582.5 575.1 588.6 576.8
Residual Available Under the Caps ...................... ............ 3.5 0.9 0.9 0.1 0.2 8.8 ............
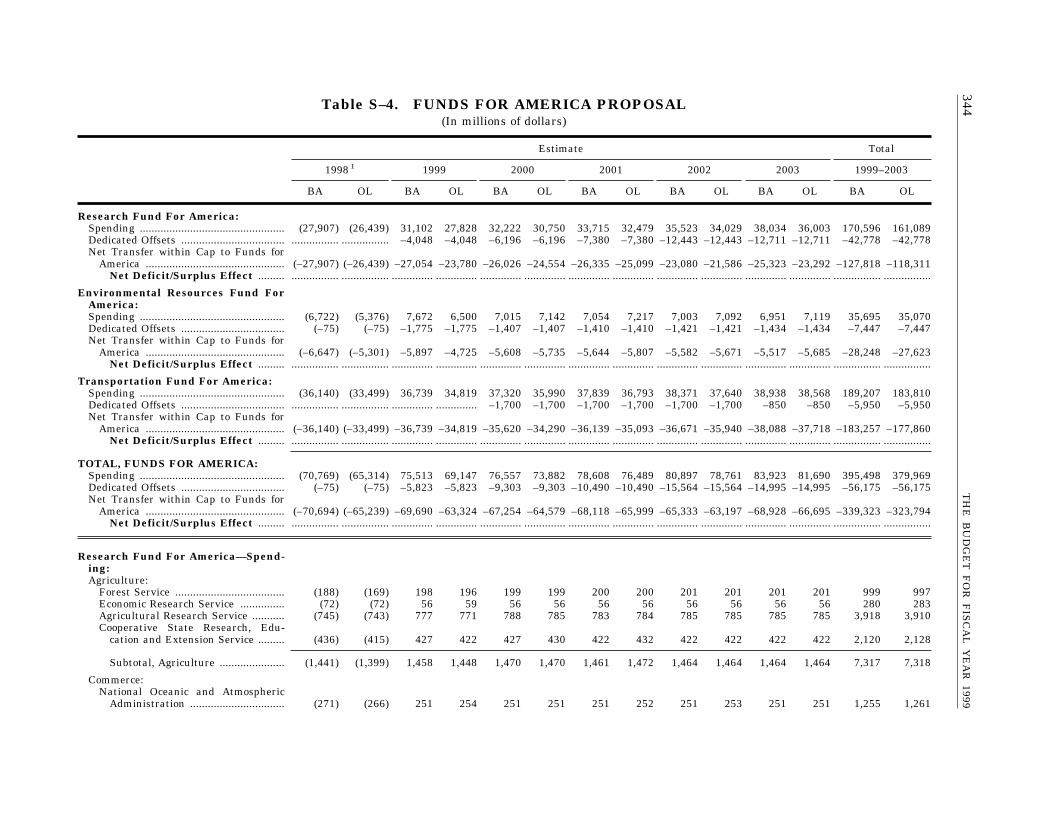
344T
HE
BU
DG
ET
FO
R F
ISC
AL
YE
AR
1999
Table S–4. FUNDS FOR AMERICA PROPOSAL(In millions of dollars)
Estimate Total
1998 1 1999 2000 2001 2002 2003 1999–2003
BA OL BA OL BA OL BA OL BA OL BA OL BA OL
Research Fund For America:Spending ................................................. (27,907) (26,439) 31,102 27,828 32,222 30,750 33,715 32,479 35,523 34,029 38,034 36,003 170,596 161,089Dedicated Offsets ................................... ................ ................ –4,048 –4,048 –6,196 –6,196 –7,380 –7,380 –12,443 –12,443 –12,711 –12,711 –42,778 –42,778Net Transfer within Cap to Funds for
America ............................................... (–27,907) (–26,439) –27,054 –23,780 –26,026 –24,554 –26,335 –25,099 –23,080 –21,586 –25,323 –23,292 –127,818 –118,311Net Deficit/Surplus Effect ......... ................ ................ .............. .............. .............. .............. .............. .............. .............. .............. .............. .............. ................ ................
Environmental Resources Fund ForAmerica:Spending ................................................. (6,722) (5,376) 7,672 6,500 7,015 7,142 7,054 7,217 7,003 7,092 6,951 7,119 35,695 35,070Dedicated Offsets ................................... (–75) (–75) –1,775 –1,775 –1,407 –1,407 –1,410 –1,410 –1,421 –1,421 –1,434 –1,434 –7,447 –7,447Net Transfer within Cap to Funds for
America ............................................... (–6,647) (–5,301) –5,897 –4,725 –5,608 –5,735 –5,644 –5,807 –5,582 –5,671 –5,517 –5,685 –28,248 –27,623Net Deficit/Surplus Effect ......... ................ ................ .............. .............. .............. .............. .............. .............. .............. .............. .............. .............. ................ ................
Transportation Fund For America:Spending ................................................. (36,140) (33,499) 36,739 34,819 37,320 35,990 37,839 36,793 38,371 37,640 38,938 38,568 189,207 183,810Dedicated Offsets ................................... ................ ................ .............. .............. –1,700 –1,700 –1,700 –1,700 –1,700 –1,700 –850 –850 –5,950 –5,950Net Transfer within Cap to Funds for
America ............................................... (–36,140) (–33,499) –36,739 –34,819 –35,620 –34,290 –36,139 –35,093 –36,671 –35,940 –38,088 –37,718 –183,257 –177,860Net Deficit/Surplus Effect ......... ................ ................ .............. .............. .............. .............. .............. .............. .............. .............. .............. .............. ................ ................
TOTAL, FUNDS FOR AMERICA:Spending ................................................. (70,769) (65,314) 75,513 69,147 76,557 73,882 78,608 76,489 80,897 78,761 83,923 81,690 395,498 379,969Dedicated Offsets ................................... (–75) (–75) –5,823 –5,823 –9,303 –9,303 –10,490 –10,490 –15,564 –15,564 –14,995 –14,995 –56,175 –56,175Net Transfer within Cap to Funds for
America ............................................... (–70,694) (–65,239) –69,690 –63,324 –67,254 –64,579 –68,118 –65,999 –65,333 –63,197 –68,928 –66,695 –339,323 –323,794Net Deficit/Surplus Effect ......... ................ ................ .............. .............. .............. .............. .............. .............. .............. .............. .............. .............. ................ ................
Research Fund For America—Spend-ing:Agriculture:
Forest Service ..................................... (188) (169) 198 196 199 199 200 200 201 201 201 201 999 997Economic Research Service ............... (72) (72) 56 59 56 56 56 56 56 56 56 56 280 283Agricultural Research Service ........... (745) (743) 777 771 788 785 783 784 785 785 785 785 3,918 3,910Cooperative State Research, Edu-
cation and Extension Service ......... (436) (415) 427 422 427 430 422 432 422 422 422 422 2,120 2,128
Subtotal, Agriculture ...................... (1,441) (1,399) 1,458 1,448 1,470 1,470 1,461 1,472 1,464 1,464 1,464 1,464 7,317 7,318
Commerce:National Oceanic and Atmospheric
Administration ................................ (271) (266) 251 254 251 251 251 252 251 253 251 251 1,255 1,261
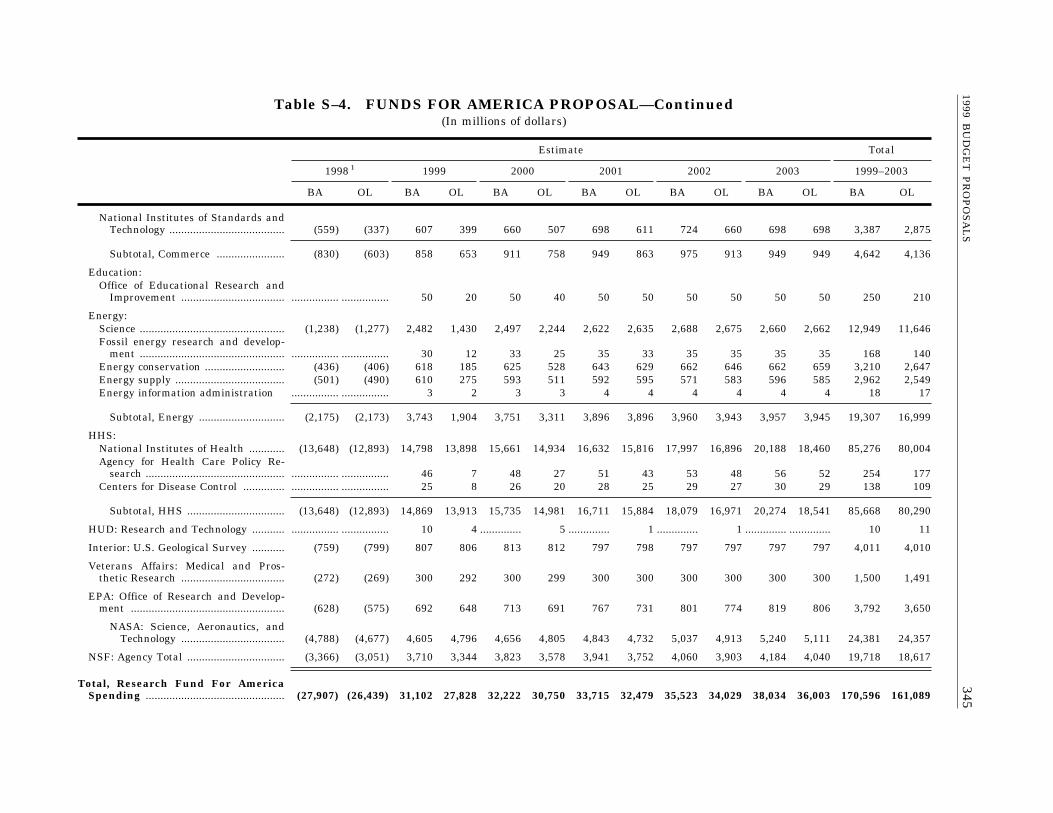
3451999 B
UD
GE
T P
RO
PO
SA
LS
Table S–4. FUNDS FOR AMERICA PROPOSAL—Continued(In millions of dollars)
Estimate Total
1998 1 1999 2000 2001 2002 2003 1999–2003
BA OL BA OL BA OL BA OL BA OL BA OL BA OL
National Institutes of Standards andTechnology ....................................... (559) (337) 607 399 660 507 698 611 724 660 698 698 3,387 2,875
Subtotal, Commerce ....................... (830) (603) 858 653 911 758 949 863 975 913 949 949 4,642 4,136
Education:Office of Educational Research and
Improvement ................................... ................ ................ 50 20 50 40 50 50 50 50 50 50 250 210
Energy:Science ................................................. (1,238) (1,277) 2,482 1,430 2,497 2,244 2,622 2,635 2,688 2,675 2,660 2,662 12,949 11,646Fossil energy research and develop-
ment ................................................. ................ ................ 30 12 33 25 35 33 35 35 35 35 168 140Energy conservation ........................... (436) (406) 618 185 625 528 643 629 662 646 662 659 3,210 2,647Energy supply ..................................... (501) (490) 610 275 593 511 592 595 571 583 596 585 2,962 2,549Energy information administration ................ ................ 3 2 3 3 4 4 4 4 4 4 18 17
Subtotal, Energy ............................. (2,175) (2,173) 3,743 1,904 3,751 3,311 3,896 3,896 3,960 3,943 3,957 3,945 19,307 16,999
HHS:National Institutes of Health ............ (13,648) (12,893) 14,798 13,898 15,661 14,934 16,632 15,816 17,997 16,896 20,188 18,460 85,276 80,004Agency for Health Care Policy Re-
search ............................................... ................ ................ 46 7 48 27 51 43 53 48 56 52 254 177Centers for Disease Control .............. ................ ................ 25 8 26 20 28 25 29 27 30 29 138 109
Subtotal, HHS ................................. (13,648) (12,893) 14,869 13,913 15,735 14,981 16,711 15,884 18,079 16,971 20,274 18,541 85,668 80,290
HUD: Research and Technology ........... ................ ................ 10 4 .............. 5 .............. 1 .............. 1 .............. .............. 10 11
Interior: U.S. Geological Survey ........... (759) (799) 807 806 813 812 797 798 797 797 797 797 4,011 4,010
Veterans Affairs: Medical and Pros-thetic Research ................................... (272) (269) 300 292 300 299 300 300 300 300 300 300 1,500 1,491
EPA: Office of Research and Develop-ment .................................................... (628) (575) 692 648 713 691 767 731 801 774 819 806 3,792 3,650
NASA: Science, Aeronautics, andTechnology ................................... (4,788) (4,677) 4,605 4,796 4,656 4,805 4,843 4,732 5,037 4,913 5,240 5,111 24,381 24,357
NSF: Agency Total ................................. (3,366) (3,051) 3,710 3,344 3,823 3,578 3,941 3,752 4,060 3,903 4,184 4,040 19,718 18,617
Total, Research Fund For AmericaSpending ............................................... (27,907) (26,439) 31,102 27,828 32,222 30,750 33,715 32,479 35,523 34,029 38,034 36,003 170,596 161,089
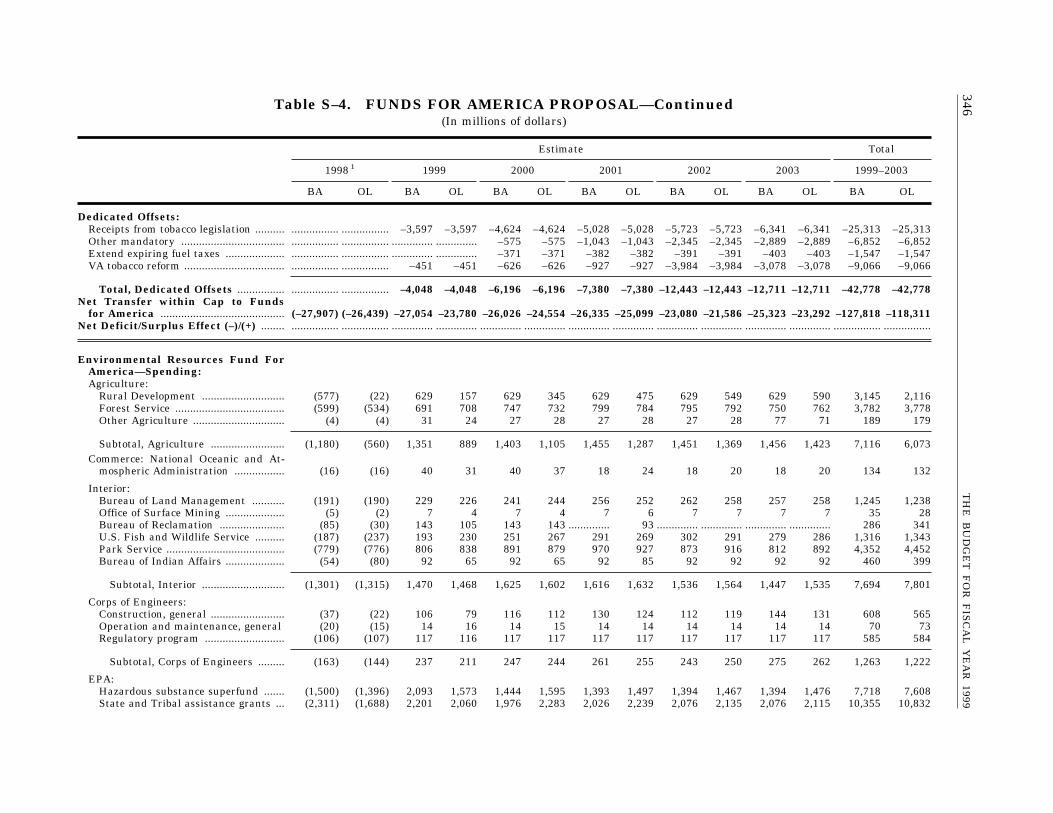
346T
HE
BU
DG
ET
FO
R F
ISC
AL
YE
AR
1999
Table S–4. FUNDS FOR AMERICA PROPOSAL—Continued(In millions of dollars)
Estimate Total
1998 1 1999 2000 2001 2002 2003 1999–2003
BA OL BA OL BA OL BA OL BA OL BA OL BA OL
Dedicated Offsets:Receipts from tobacco legislation .......... ................ ................ –3,597 –3,597 –4,624 –4,624 –5,028 –5,028 –5,723 –5,723 –6,341 –6,341 –25,313 –25,313Other mandatory ................................... ................ ................ .............. .............. –575 –575 –1,043 –1,043 –2,345 –2,345 –2,889 –2,889 –6,852 –6,852Extend expiring fuel taxes .................... ................ ................ .............. .............. –371 –371 –382 –382 –391 –391 –403 –403 –1,547 –1,547VA tobacco reform .................................. ................ ................ –451 –451 –626 –626 –927 –927 –3,984 –3,984 –3,078 –3,078 –9,066 –9,066
Total, Dedicated Offsets ................ ................ ................ –4,048 –4,048 –6,196 –6,196 –7,380 –7,380 –12,443 –12,443 –12,711 –12,711 –42,778 –42,778Net Transfer within Cap to Funds
for America .......................................... (–27,907) (–26,439) –27,054 –23,780 –26,026 –24,554 –26,335 –25,099 –23,080 –21,586 –25,323 –23,292 –127,818 –118,311Net Deficit/Surplus Effect (–)/(+) ........ ................ ................ .............. .............. .............. .............. .............. .............. .............. .............. .............. .............. ................ ................
Environmental Resources Fund ForAmerica—Spending:Agriculture:
Rural Development ............................ (577) (22) 629 157 629 345 629 475 629 549 629 590 3,145 2,116Forest Service ..................................... (599) (534) 691 708 747 732 799 784 795 792 750 762 3,782 3,778Other Agriculture ............................... (4) (4) 31 24 27 28 27 28 27 28 77 71 189 179
Subtotal, Agriculture ......................... (1,180) (560) 1,351 889 1,403 1,105 1,455 1,287 1,451 1,369 1,456 1,423 7,116 6,073Commerce: National Oceanic and At-
mospheric Administration ................. (16) (16) 40 31 40 37 18 24 18 20 18 20 134 132
Interior:Bureau of Land Management ........... (191) (190) 229 226 241 244 256 252 262 258 257 258 1,245 1,238Office of Surface Mining .................... (5) (2) 7 4 7 4 7 6 7 7 7 7 35 28Bureau of Reclamation ...................... (85) (30) 143 105 143 143 .............. 93 .............. .............. .............. .............. 286 341U.S. Fish and Wildlife Service .......... (187) (237) 193 230 251 267 291 269 302 291 279 286 1,316 1,343Park Service ........................................ (779) (776) 806 838 891 879 970 927 873 916 812 892 4,352 4,452Bureau of Indian Affairs .................... (54) (80) 92 65 92 65 92 85 92 92 92 92 460 399
Subtotal, Interior ............................ (1,301) (1,315) 1,470 1,468 1,625 1,602 1,616 1,632 1,536 1,564 1,447 1,535 7,694 7,801
Corps of Engineers:Construction, general ......................... (37) (22) 106 79 116 112 130 124 112 119 144 131 608 565Operation and maintenance, general (20) (15) 14 16 14 15 14 14 14 14 14 14 70 73Regulatory program ........................... (106) (107) 117 116 117 117 117 117 117 117 117 117 585 584
Subtotal, Corps of Engineers ......... (163) (144) 237 211 247 244 261 255 243 250 275 262 1,263 1,222
EPA:Hazardous substance superfund ....... (1,500) (1,396) 2,093 1,573 1,444 1,595 1,393 1,497 1,394 1,467 1,394 1,476 7,718 7,608State and Tribal assistance grants ... (2,311) (1,688) 2,201 2,060 1,976 2,283 2,026 2,239 2,076 2,135 2,076 2,115 10,355 10,832
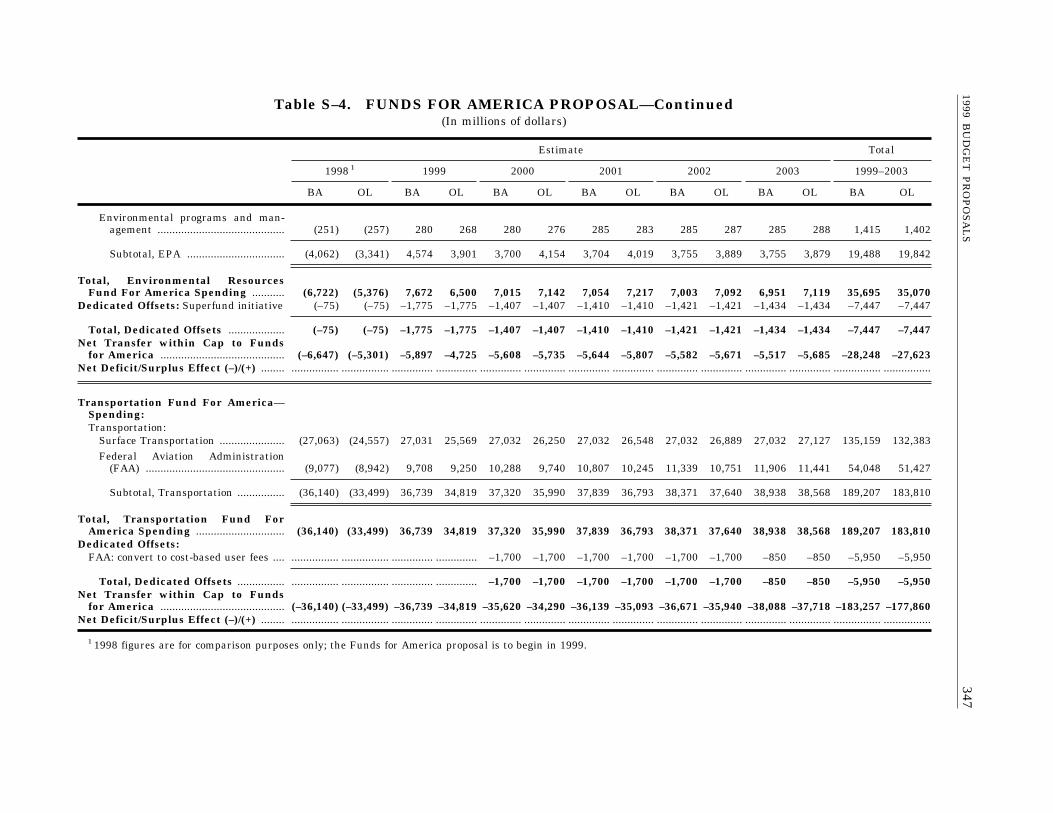
3471999 B
UD
GE
T P
RO
PO
SA
LS
Table S–4. FUNDS FOR AMERICA PROPOSAL—Continued(In millions of dollars)
Estimate Total
1998 1 1999 2000 2001 2002 2003 1999–2003
BA OL BA OL BA OL BA OL BA OL BA OL BA OL
Environmental programs and man-agement ........................................... (251) (257) 280 268 280 276 285 283 285 287 285 288 1,415 1,402
Subtotal, EPA ................................. (4,062) (3,341) 4,574 3,901 3,700 4,154 3,704 4,019 3,755 3,889 3,755 3,879 19,488 19,842
Total, Environmental ResourcesFund For America Spending ........... (6,722) (5,376) 7,672 6,500 7,015 7,142 7,054 7,217 7,003 7,092 6,951 7,119 35,695 35,070
Dedicated Offsets: Superfund initiative (–75) (–75) –1,775 –1,775 –1,407 –1,407 –1,410 –1,410 –1,421 –1,421 –1,434 –1,434 –7,447 –7,447
Total, Dedicated Offsets ................... (–75) (–75) –1,775 –1,775 –1,407 –1,407 –1,410 –1,410 –1,421 –1,421 –1,434 –1,434 –7,447 –7,447Net Transfer within Cap to Funds
for America .......................................... (–6,647) (–5,301) –5,897 –4,725 –5,608 –5,735 –5,644 –5,807 –5,582 –5,671 –5,517 –5,685 –28,248 –27,623Net Deficit/Surplus Effect (–)/(+) ........ ................ ................ .............. .............. .............. .............. .............. .............. .............. .............. .............. .............. ................ ................
Transportation Fund For America—Spending:Transportation:
Surface Transportation ...................... (27,063) (24,557) 27,031 25,569 27,032 26,250 27,032 26,548 27,032 26,889 27,032 27,127 135,159 132,383Federal Aviation Administration
(FAA) ............................................... (9,077) (8,942) 9,708 9,250 10,288 9,740 10,807 10,245 11,339 10,751 11,906 11,441 54,048 51,427
Subtotal, Transportation ................ (36,140) (33,499) 36,739 34,819 37,320 35,990 37,839 36,793 38,371 37,640 38,938 38,568 189,207 183,810
Total, Transportation Fund ForAmerica Spending .............................. (36,140) (33,499) 36,739 34,819 37,320 35,990 37,839 36,793 38,371 37,640 38,938 38,568 189,207 183,810
Dedicated Offsets:FAA: convert to cost-based user fees .... ................ ................ .............. .............. –1,700 –1,700 –1,700 –1,700 –1,700 –1,700 –850 –850 –5,950 –5,950
Total, Dedicated Offsets ................ ................ ................ .............. .............. –1,700 –1,700 –1,700 –1,700 –1,700 –1,700 –850 –850 –5,950 –5,950Net Transfer within Cap to Funds
for America .......................................... (–36,140) (–33,499) –36,739 –34,819 –35,620 –34,290 –36,139 –35,093 –36,671 –35,940 –38,088 –37,718 –183,257 –177,860Net Deficit/Surplus Effect (–)/(+) ........ ................ ................ .............. .............. .............. .............. .............. .............. .............. .............. .............. .............. ................ ................
1 1998 figures are for comparison purposes only; the Funds for America proposal is to begin in 1999.
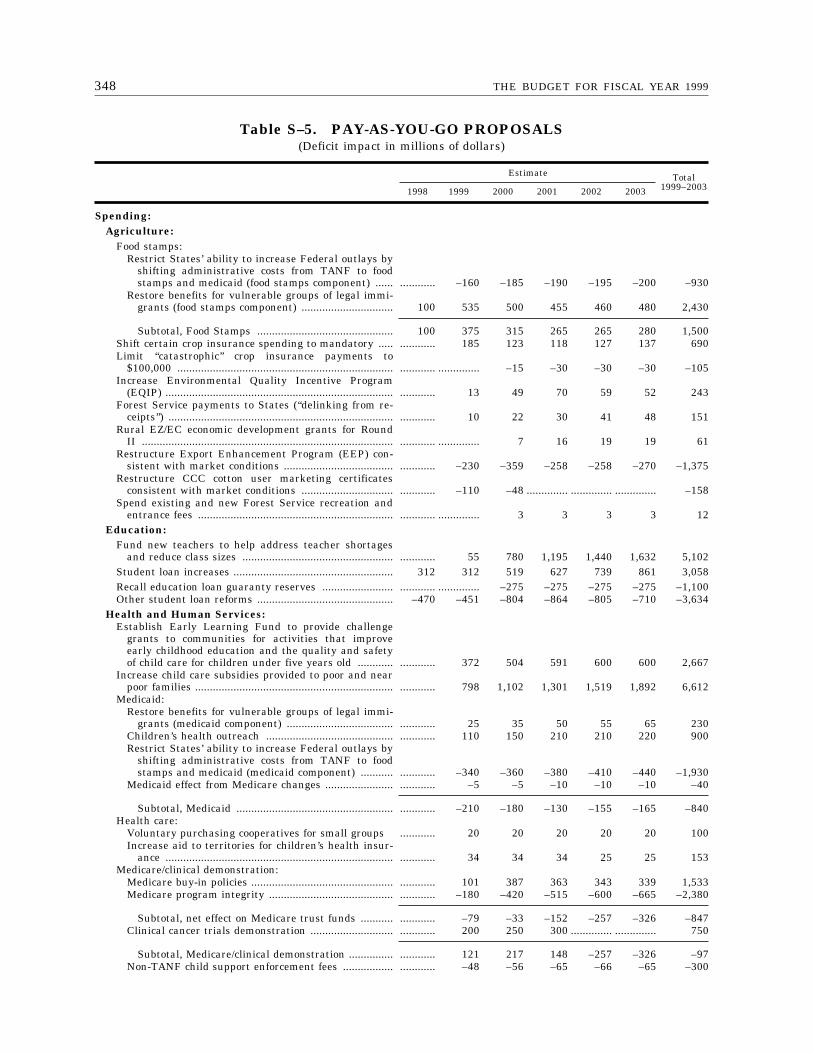
348 THE BUDGET FOR FISCAL YEAR 1999
Table S–5. PAY-AS-YOU-GO PROPOSALS(Deficit impact in millions of dollars)
Estimate Total1999–20031998 1999 2000 2001 2002 2003
Spending:Agriculture:
Food stamps:Restrict States’ ability to increase Federal outlays by
shifting administrative costs from TANF to foodstamps and medicaid (food stamps component) ...... ............ –160 –185 –190 –195 –200 –930
Restore benefits for vulnerable groups of legal immi-grants (food stamps component) ............................... 100 535 500 455 460 480 2,430
Subtotal, Food Stamps .............................................. 100 375 315 265 265 280 1,500Shift certain crop insurance spending to mandatory ..... ............ 185 123 118 127 137 690Limit ‘‘catastrophic’’ crop insurance payments to
$100,000 ......................................................................... ............ .............. –15 –30 –30 –30 –105Increase Environmental Quality Incentive Program
(EQIP) ............................................................................. ............ 13 49 70 59 52 243Forest Service payments to States (‘‘delinking from re-
ceipts’’) ............................................................................ ............ 10 22 30 41 48 151Rural EZ/EC economic development grants for Round
II ..................................................................................... ............ .............. 7 16 19 19 61Restructure Export Enhancement Program (EEP) con-
sistent with market conditions ..................................... ............ –230 –359 –258 –258 –270 –1,375Restructure CCC cotton user marketing certificates
consistent with market conditions ............................... ............ –110 –48 .............. .............. .............. –158Spend existing and new Forest Service recreation and
entrance fees .................................................................. ............ .............. 3 3 3 3 12Education:
Fund new teachers to help address teacher shortagesand reduce class sizes ................................................... ............ 55 780 1,195 1,440 1,632 5,102
Student loan increases ...................................................... 312 312 519 627 739 861 3,058Recall education loan guaranty reserves ........................ ............ .............. –275 –275 –275 –275 –1,100Other student loan reforms .............................................. –470 –451 –804 –864 –805 –710 –3,634
Health and Human Services:Establish Early Learning Fund to provide challenge
grants to communities for activities that improveearly childhood education and the quality and safetyof child care for children under five years old ............ ............ 372 504 591 600 600 2,667
Increase child care subsidies provided to poor and nearpoor families ................................................................... ............ 798 1,102 1,301 1,519 1,892 6,612
Medicaid:Restore benefits for vulnerable groups of legal immi-
grants (medicaid component) .................................... ............ 25 35 50 55 65 230Children’s health outreach ........................................... ............ 110 150 210 210 220 900Restrict States’ ability to increase Federal outlays by
shifting administrative costs from TANF to foodstamps and medicaid (medicaid component) ........... ............ –340 –360 –380 –410 –440 –1,930
Medicaid effect from Medicare changes ....................... ............ –5 –5 –10 –10 –10 –40
Subtotal, Medicaid ..................................................... ............ –210 –180 –130 –155 –165 –840Health care:
Voluntary purchasing cooperatives for small groups ............ 20 20 20 20 20 100Increase aid to territories for children’s health insur-
ance ............................................................................. ............ 34 34 34 25 25 153Medicare/clinical demonstration:
Medicare buy-in policies ................................................ ............ 101 387 363 343 339 1,533Medicare program integrity .......................................... ............ –180 –420 –515 –600 –665 –2,380
Subtotal, net effect on Medicare trust funds ........... ............ –79 –33 –152 –257 –326 –847Clinical cancer trials demonstration ............................ ............ 200 250 300 .............. .............. 750
Subtotal, Medicare/clinical demonstration ............... ............ 121 217 148 –257 –326 –97Non-TANF child support enforcement fees ................. ............ –48 –56 –65 –66 –65 –300
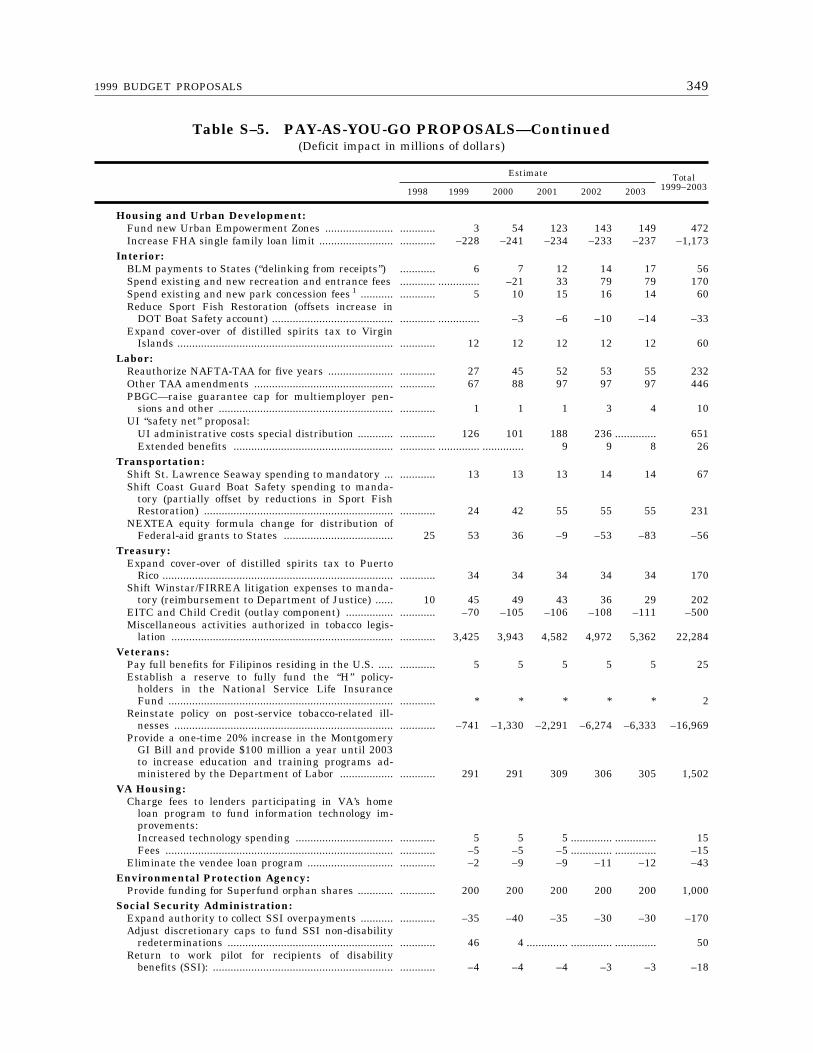
3491999 BUDGET PROPOSALS
Table S–5. PAY-AS-YOU-GO PROPOSALS—Continued(Deficit impact in millions of dollars)
Estimate Total1999–20031998 1999 2000 2001 2002 2003
Housing and Urban Development:Fund new Urban Empowerment Zones ....................... ............ 3 54 123 143 149 472Increase FHA single family loan limit ......................... ............ –228 –241 –234 –233 –237 –1,173
Interior:BLM payments to States (‘‘delinking from receipts’’) ............ 6 7 12 14 17 56Spend existing and new recreation and entrance fees ............ .............. –21 33 79 79 170Spend existing and new park concession fees 1 ........... ............ 5 10 15 16 14 60Reduce Sport Fish Restoration (offsets increase in
DOT Boat Safety account) ......................................... ............ .............. –3 –6 –10 –14 –33Expand cover-over of distilled spirits tax to Virgin
Islands ......................................................................... ............ 12 12 12 12 12 60Labor:
Reauthorize NAFTA-TAA for five years ...................... ............ 27 45 52 53 55 232Other TAA amendments ............................................... ............ 67 88 97 97 97 446PBGC—raise guarantee cap for multiemployer pen-
sions and other ........................................................... ............ 1 1 1 3 4 10UI ‘‘safety net’’ proposal:
UI administrative costs special distribution ............ ............ 126 101 188 236 .............. 651Extended benefits ...................................................... ............ .............. .............. 9 9 8 26
Transportation:Shift St. Lawrence Seaway spending to mandatory ... ............ 13 13 13 14 14 67Shift Coast Guard Boat Safety spending to manda-
tory (partially offset by reductions in Sport FishRestoration) ................................................................ ............ 24 42 55 55 55 231
NEXTEA equity formula change for distribution ofFederal-aid grants to States ..................................... 25 53 36 –9 –53 –83 –56
Treasury:Expand cover-over of distilled spirits tax to Puerto
Rico .............................................................................. ............ 34 34 34 34 34 170Shift Winstar/FIRREA litigation expenses to manda-
tory (reimbursement to Department of Justice) ...... 10 45 49 43 36 29 202EITC and Child Credit (outlay component) ................ ............ –70 –105 –106 –108 –111 –500Miscellaneous activities authorized in tobacco legis-
lation ........................................................................... ............ 3,425 3,943 4,582 4,972 5,362 22,284Veterans:
Pay full benefits for Filipinos residing in the U.S. ..... ............ 5 5 5 5 5 25Establish a reserve to fully fund the ‘‘H’’ policy-
holders in the National Service Life InsuranceFund ............................................................................ ............ * * * * * 2
Reinstate policy on post-service tobacco-related ill-nesses .......................................................................... ............ –741 –1,330 –2,291 –6,274 –6,333 –16,969
Provide a one-time 20% increase in the MontgomeryGI Bill and provide $100 million a year until 2003to increase education and training programs ad-ministered by the Department of Labor .................. ............ 291 291 309 306 305 1,502
VA Housing:Charge fees to lenders participating in VA’s home
loan program to fund information technology im-provements:Increased technology spending ................................. ............ 5 5 5 .............. .............. 15Fees ............................................................................. ............ –5 –5 –5 .............. .............. –15
Eliminate the vendee loan program ............................. ............ –2 –9 –9 –11 –12 –43Environmental Protection Agency:
Provide funding for Superfund orphan shares ............ ............ 200 200 200 200 200 1,000Social Security Administration:
Expand authority to collect SSI overpayments ........... ............ –35 –40 –35 –30 –30 –170Adjust discretionary caps to fund SSI non-disability
redeterminations ........................................................ ............ 46 4 .............. .............. .............. 50Return to work pilot for recipients of disability
benefits (SSI): ............................................................. ............ –4 –4 –4 –3 –3 –18
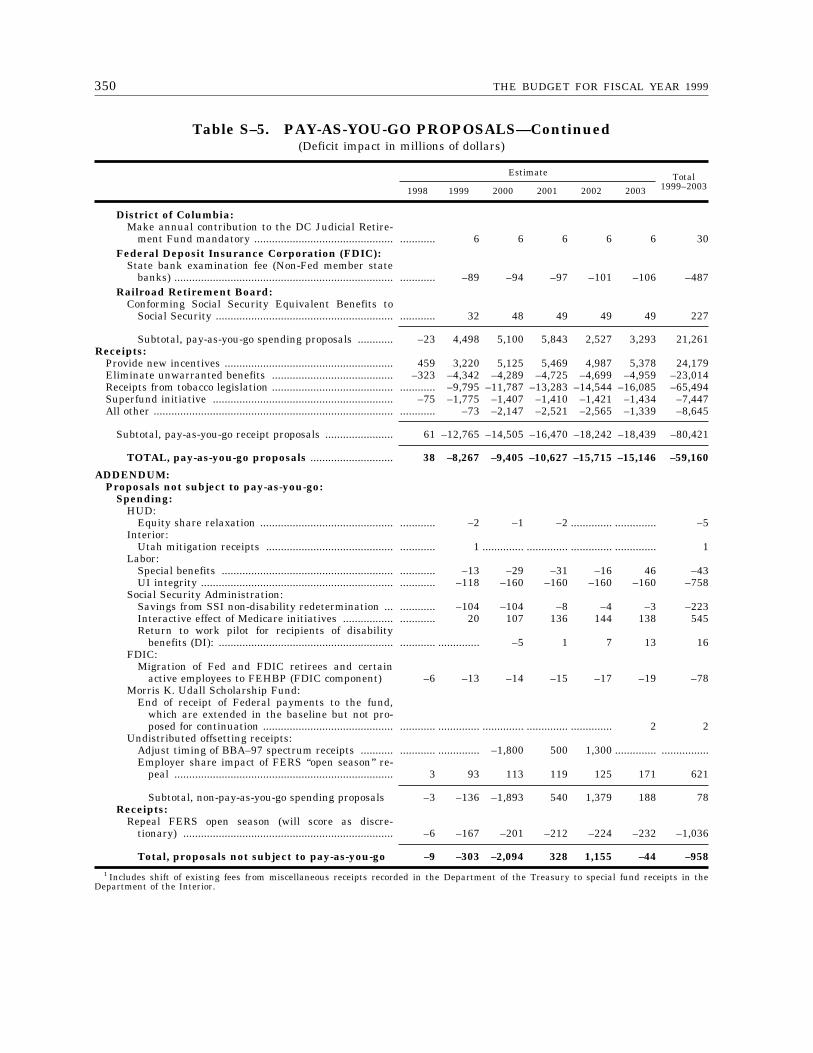
350 THE BUDGET FOR FISCAL YEAR 1999
Table S–5. PAY-AS-YOU-GO PROPOSALS—Continued(Deficit impact in millions of dollars)
Estimate Total1999–20031998 1999 2000 2001 2002 2003
District of Columbia:Make annual contribution to the DC Judicial Retire-
ment Fund mandatory ............................................... ............ 6 6 6 6 6 30Federal Deposit Insurance Corporation (FDIC):
State bank examination fee (Non-Fed member statebanks) .......................................................................... ............ –89 –94 –97 –101 –106 –487
Railroad Retirement Board:Conforming Social Security Equivalent Benefits to
Social Security ............................................................ ............ 32 48 49 49 49 227
Subtotal, pay-as-you-go spending proposals ............ –23 4,498 5,100 5,843 2,527 3,293 21,261Receipts:
Provide new incentives ......................................................... 459 3,220 5,125 5,469 4,987 5,378 24,179Eliminate unwarranted benefits ......................................... –323 –4,342 –4,289 –4,725 –4,699 –4,959 –23,014Receipts from tobacco legislation ......................................... ............ –9,795 –11,787 –13,283 –14,544 –16,085 –65,494Superfund initiative ............................................................. –75 –1,775 –1,407 –1,410 –1,421 –1,434 –7,447All other ................................................................................. ............ –73 –2,147 –2,521 –2,565 –1,339 –8,645
Subtotal, pay-as-you-go receipt proposals ....................... 61 –12,765 –14,505 –16,470 –18,242 –18,439 –80,421
TOTAL, pay-as-you-go proposals ............................ 38 –8,267 –9,405 –10,627 –15,715 –15,146 –59,160
ADDENDUM:Proposals not subject to pay-as-you-go:
Spending:HUD:
Equity share relaxation ............................................. ............ –2 –1 –2 .............. .............. –5Interior:
Utah mitigation receipts ........................................... ............ 1 .............. .............. .............. .............. 1Labor:
Special benefits .......................................................... ............ –13 –29 –31 –16 46 –43UI integrity ................................................................. ............ –118 –160 –160 –160 –160 –758
Social Security Administration:Savings from SSI non-disability redetermination ... ............ –104 –104 –8 –4 –3 –223Interactive effect of Medicare initiatives ................. ............ 20 107 136 144 138 545Return to work pilot for recipients of disability
benefits (DI): ........................................................... ............ .............. –5 1 7 13 16FDIC:
Migration of Fed and FDIC retirees and certainactive employees to FEHBP (FDIC component) –6 –13 –14 –15 –17 –19 –78
Morris K. Udall Scholarship Fund:End of receipt of Federal payments to the fund,
which are extended in the baseline but not pro-posed for continuation ............................................ ............ .............. .............. .............. .............. 2 2
Undistributed offsetting receipts:Adjust timing of BBA–97 spectrum receipts ........... ............ .............. –1,800 500 1,300 .............. ................Employer share impact of FERS ‘‘open season’’ re-
peal .......................................................................... 3 93 113 119 125 171 621
Subtotal, non-pay-as-you-go spending proposals –3 –136 –1,893 540 1,379 188 78Receipts:
Repeal FERS open season (will score as discre-tionary) ....................................................................... –6 –167 –201 –212 –224 –232 –1,036
Total, proposals not subject to pay-as-you-go –9 –303 –2,094 328 1,155 –44 –9581 Includes shift of existing fees from miscellaneous receipts recorded in the Department of the Treasury to special fund receipts in the
Department of the Interior.
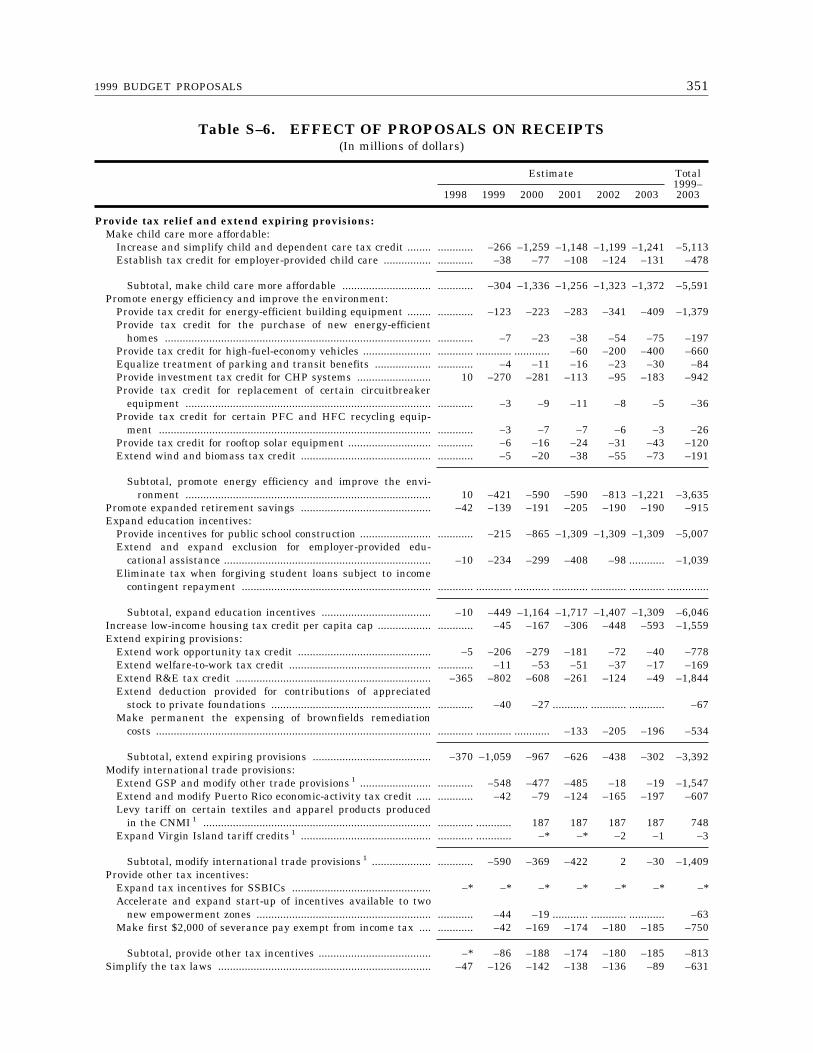
3511999 BUDGET PROPOSALS
Table S–6. EFFECT OF PROPOSALS ON RECEIPTS(In millions of dollars)
Estimate Total1999–20031998 1999 2000 2001 2002 2003
Provide tax relief and extend expiring provisions:Make child care more affordable:
Increase and simplify child and dependent care tax credit ........ ............ –266 –1,259 –1,148 –1,199 –1,241 –5,113Establish tax credit for employer-provided child care ................ ............ –38 –77 –108 –124 –131 –478
Subtotal, make child care more affordable .............................. ............ –304 –1,336 –1,256 –1,323 –1,372 –5,591Promote energy efficiency and improve the environment:
Provide tax credit for energy-efficient building equipment ........ ............ –123 –223 –283 –341 –409 –1,379Provide tax credit for the purchase of new energy-efficient
homes .......................................................................................... ............ –7 –23 –38 –54 –75 –197Provide tax credit for high-fuel-economy vehicles ....................... ............ ............ ............ –60 –200 –400 –660Equalize treatment of parking and transit benefits ................... ............ –4 –11 –16 –23 –30 –84Provide investment tax credit for CHP systems ......................... 10 –270 –281 –113 –95 –183 –942Provide tax credit for replacement of certain circuitbreaker
equipment ................................................................................... ............ –3 –9 –11 –8 –5 –36Provide tax credit for certain PFC and HFC recycling equip-
ment ............................................................................................ ............ –3 –7 –7 –6 –3 –26Provide tax credit for rooftop solar equipment ............................ ............ –6 –16 –24 –31 –43 –120Extend wind and biomass tax credit ............................................ ............ –5 –20 –38 –55 –73 –191
Subtotal, promote energy efficiency and improve the envi-ronment ................................................................................... 10 –421 –590 –590 –813 –1,221 –3,635
Promote expanded retirement savings ............................................ –42 –139 –191 –205 –190 –190 –915Expand education incentives:
Provide incentives for public school construction ........................ ............ –215 –865 –1,309 –1,309 –1,309 –5,007Extend and expand exclusion for employer-provided edu-
cational assistance ...................................................................... –10 –234 –299 –408 –98 ............ –1,039Eliminate tax when forgiving student loans subject to income
contingent repayment ................................................................ ............ ............ ............ ............ ............ ............ ..............
Subtotal, expand education incentives ..................................... –10 –449 –1,164 –1,717 –1,407 –1,309 –6,046Increase low-income housing tax credit per capita cap .................. ............ –45 –167 –306 –448 –593 –1,559Extend expiring provisions:
Extend work opportunity tax credit ............................................. –5 –206 –279 –181 –72 –40 –778Extend welfare-to-work tax credit ................................................ ............ –11 –53 –51 –37 –17 –169Extend R&E tax credit .................................................................. –365 –802 –608 –261 –124 –49 –1,844Extend deduction provided for contributions of appreciated
stock to private foundations ...................................................... ............ –40 –27 ............ ............ ............ –67Make permanent the expensing of brownfields remediation
costs ............................................................................................. ............ ............ ............ –133 –205 –196 –534
Subtotal, extend expiring provisions ........................................ –370 –1,059 –967 –626 –438 –302 –3,392Modify international trade provisions:
Extend GSP and modify other trade provisions 1 ........................ ............ –548 –477 –485 –18 –19 –1,547Extend and modify Puerto Rico economic-activity tax credit ..... ............ –42 –79 –124 –165 –197 –607Levy tariff on certain textiles and apparel products produced
in the CNMI 1 ............................................................................. ............ ............ 187 187 187 187 748Expand Virgin Island tariff credits 1 ............................................ ............ ............ –* –* –2 –1 –3
Subtotal, modify international trade provisions 1 .................... ............ –590 –369 –422 2 –30 –1,409Provide other tax incentives:
Expand tax incentives for SSBICs ............................................... –* –* –* –* –* –* –*Accelerate and expand start-up of incentives available to two
new empowerment zones ........................................................... ............ –44 –19 ............ ............ ............ –63Make first $2,000 of severance pay exempt from income tax .... ............ –42 –169 –174 –180 –185 –750
Subtotal, provide other tax incentives ...................................... –* –86 –188 –174 –180 –185 –813Simplify the tax laws ........................................................................ –47 –126 –142 –138 –136 –89 –631
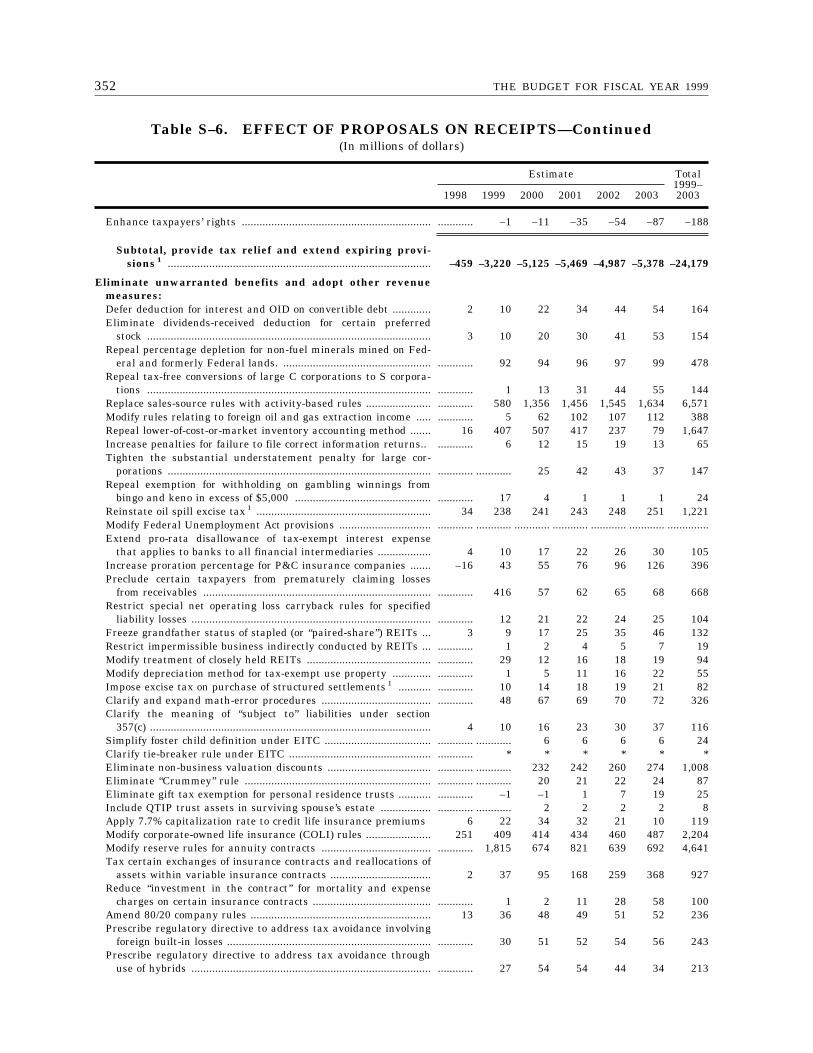
352 THE BUDGET FOR FISCAL YEAR 1999
Table S–6. EFFECT OF PROPOSALS ON RECEIPTS—Continued(In millions of dollars)
Estimate Total1999–20031998 1999 2000 2001 2002 2003
Enhance taxpayers’ rights ................................................................ ............ –1 –11 –35 –54 –87 –188
Subtotal, provide tax relief and extend expiring provi-sions 1 ......................................................................................... –459 –3,220 –5,125 –5,469 –4,987 –5,378 –24,179
Eliminate unwarranted benefits and adopt other revenuemeasures:Defer deduction for interest and OID on convertible debt ............. 2 10 22 34 44 54 164Eliminate dividends-received deduction for certain preferred
stock ................................................................................................ 3 10 20 30 41 53 154Repeal percentage depletion for non-fuel minerals mined on Fed-
eral and formerly Federal lands. .................................................. ............ 92 94 96 97 99 478Repeal tax-free conversions of large C corporations to S corpora-
tions ................................................................................................ ............ 1 13 31 44 55 144Replace sales-source rules with activity-based rules ...................... ............ 580 1,356 1,456 1,545 1,634 6,571Modify rules relating to foreign oil and gas extraction income ..... ............ 5 62 102 107 112 388Repeal lower-of-cost-or-market inventory accounting method ....... 16 407 507 417 237 79 1,647Increase penalties for failure to file correct information returns.. ............ 6 12 15 19 13 65Tighten the substantial understatement penalty for large cor-
porations ......................................................................................... ............ ............ 25 42 43 37 147Repeal exemption for withholding on gambling winnings from
bingo and keno in excess of $5,000 .............................................. ............ 17 4 1 1 1 24Reinstate oil spill excise tax 1 ........................................................... 34 238 241 243 248 251 1,221Modify Federal Unemployment Act provisions ............................... ............ ............ ............ ............ ............ ............ ..............Extend pro-rata disallowance of tax-exempt interest expense
that applies to banks to all financial intermediaries .................. 4 10 17 22 26 30 105Increase proration percentage for P&C insurance companies ....... –16 43 55 76 96 126 396Preclude certain taxpayers from prematurely claiming losses
from receivables ............................................................................. ............ 416 57 62 65 68 668Restrict special net operating loss carryback rules for specified
liability losses ................................................................................. ............ 12 21 22 24 25 104Freeze grandfather status of stapled (or ‘‘paired-share’’) REITs ... 3 9 17 25 35 46 132Restrict impermissible business indirectly conducted by REITs ... ............ 1 2 4 5 7 19Modify treatment of closely held REITs .......................................... ............ 29 12 16 18 19 94Modify depreciation method for tax-exempt use property ............. ............ 1 5 11 16 22 55Impose excise tax on purchase of structured settlements 1 ........... ............ 10 14 18 19 21 82Clarify and expand math-error procedures ..................................... ............ 48 67 69 70 72 326Clarify the meaning of ‘‘subject to’’ liabilities under section
357(c) ............................................................................................... 4 10 16 23 30 37 116Simplify foster child definition under EITC .................................... ............ ............ 6 6 6 6 24Clarify tie-breaker rule under EITC ................................................ ............ * * * * * *Eliminate non-business valuation discounts ................................... ............ ............ 232 242 260 274 1,008Eliminate ‘‘Crummey’’ rule ............................................................... ............ ............ 20 21 22 24 87Eliminate gift tax exemption for personal residence trusts ........... ............ –1 –1 1 7 19 25Include QTIP trust assets in surviving spouse’s estate ................. ............ ............ 2 2 2 2 8Apply 7.7% capitalization rate to credit life insurance premiums 6 22 34 32 21 10 119Modify corporate-owned life insurance (COLI) rules ...................... 251 409 414 434 460 487 2,204Modify reserve rules for annuity contracts ..................................... ............ 1,815 674 821 639 692 4,641Tax certain exchanges of insurance contracts and reallocations of
assets within variable insurance contracts .................................. 2 37 95 168 259 368 927Reduce ‘‘investment in the contract’’ for mortality and expense
charges on certain insurance contracts ........................................ ............ 1 2 11 28 58 100Amend 80/20 company rules ............................................................. 13 36 48 49 51 52 236Prescribe regulatory directive to address tax avoidance involving
foreign built-in losses ..................................................................... ............ 30 51 52 54 56 243Prescribe regulatory directive to address tax avoidance through
use of hybrids ................................................................................. ............ 27 54 54 44 34 213
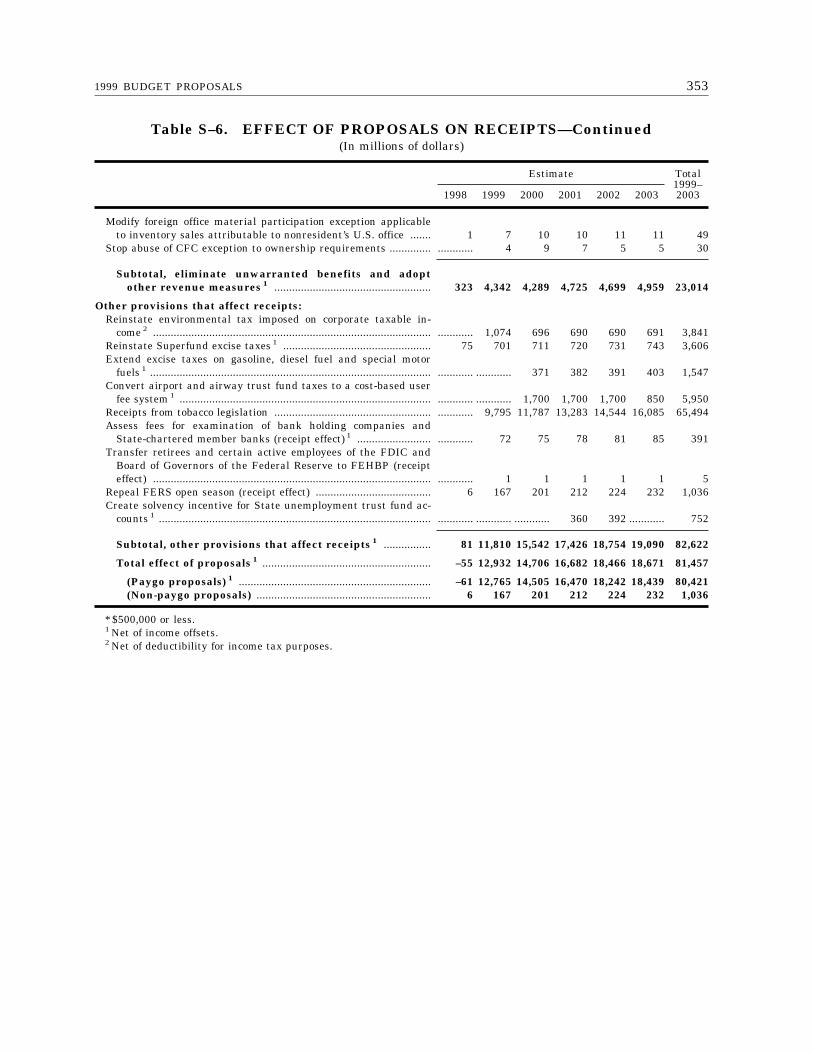
3531999 BUDGET PROPOSALS
Table S–6. EFFECT OF PROPOSALS ON RECEIPTS—Continued(In millions of dollars)
Estimate Total1999–20031998 1999 2000 2001 2002 2003
Modify foreign office material participation exception applicableto inventory sales attributable to nonresident’s U.S. office ....... 1 7 10 10 11 11 49
Stop abuse of CFC exception to ownership requirements .............. ............ 4 9 7 5 5 30
Subtotal, eliminate unwarranted benefits and adoptother revenue measures 1 ..................................................... 323 4,342 4,289 4,725 4,699 4,959 23,014
Other provisions that affect receipts:Reinstate environmental tax imposed on corporate taxable in-
come 2 .............................................................................................. ............ 1,074 696 690 690 691 3,841Reinstate Superfund excise taxes 1 .................................................. 75 701 711 720 731 743 3,606Extend excise taxes on gasoline, diesel fuel and special motor
fuels 1 ............................................................................................... ............ ............ 371 382 391 403 1,547Convert airport and airway trust fund taxes to a cost-based user
fee system 1 ..................................................................................... ............ ............ 1,700 1,700 1,700 850 5,950Receipts from tobacco legislation ..................................................... ............ 9,795 11,787 13,283 14,544 16,085 65,494Assess fees for examination of bank holding companies and
State-chartered member banks (receipt effect) 1 ......................... ............ 72 75 78 81 85 391Transfer retirees and certain active employees of the FDIC and
Board of Governors of the Federal Reserve to FEHBP (receipteffect) .............................................................................................. ............ 1 1 1 1 1 5
Repeal FERS open season (receipt effect) ....................................... 6 167 201 212 224 232 1,036Create solvency incentive for State unemployment trust fund ac-
counts 1 ............................................................................................ ............ ............ ............ 360 392 ............ 752
Subtotal, other provisions that affect receipts 1 ................ 81 11,810 15,542 17,426 18,754 19,090 82,622
Total effect of proposals 1 ......................................................... –55 12,932 14,706 16,682 18,466 18,671 81,457
(Paygo proposals) 1 ................................................................. –61 12,765 14,505 16,470 18,242 18,439 80,421(Non-paygo proposals) ........................................................... 6 167 201 212 224 232 1,036
* $500,000 or less.1 Net of income offsets.2 Net of deductibility for income tax purposes.
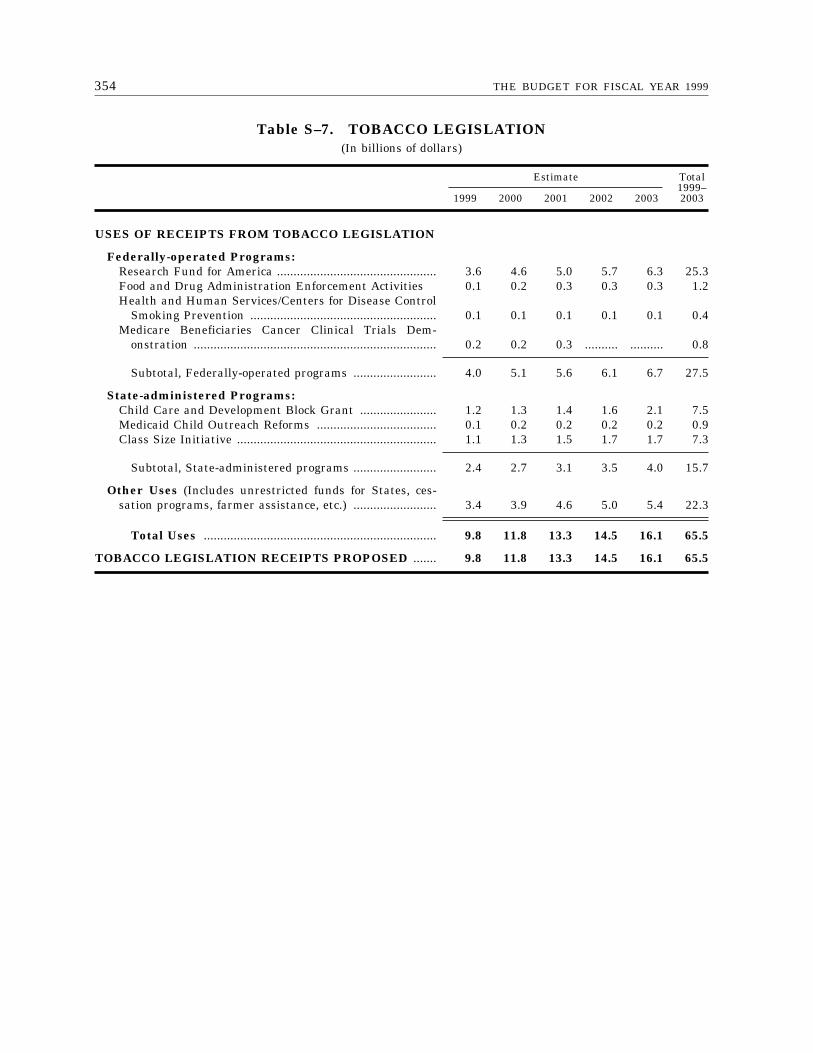
354 THE BUDGET FOR FISCAL YEAR 1999
Table S–7. TOBACCO LEGISLATION(In billions of dollars)
Estimate Total1999–20031999 2000 2001 2002 2003
USES OF RECEIPTS FROM TOBACCO LEGISLATION
Federally-operated Programs:Research Fund for America ................................................ 3.6 4.6 5.0 5.7 6.3 25.3Food and Drug Administration Enforcement Activities 0.1 0.2 0.3 0.3 0.3 1.2Health and Human Services/Centers for Disease Control
Smoking Prevention ........................................................ 0.1 0.1 0.1 0.1 0.1 0.4Medicare Beneficiaries Cancer Clinical Trials Dem-
onstration ......................................................................... 0.2 0.2 0.3 .......... .......... 0.8
Subtotal, Federally-operated programs ......................... 4.0 5.1 5.6 6.1 6.7 27.5
State-administered Programs:Child Care and Development Block Grant ....................... 1.2 1.3 1.4 1.6 2.1 7.5Medicaid Child Outreach Reforms .................................... 0.1 0.2 0.2 0.2 0.2 0.9Class Size Initiative ............................................................ 1.1 1.3 1.5 1.7 1.7 7.3
Subtotal, State-administered programs ......................... 2.4 2.7 3.1 3.5 4.0 15.7
Other Uses (Includes unrestricted funds for States, ces-sation programs, farmer assistance, etc.) ......................... 3.4 3.9 4.6 5.0 5.4 22.3
Total Uses ...................................................................... 9.8 11.8 13.3 14.5 16.1 65.5
TOBACCO LEGISLATION RECEIPTS PROPOSED ....... 9.8 11.8 13.3 14.5 16.1 65.5
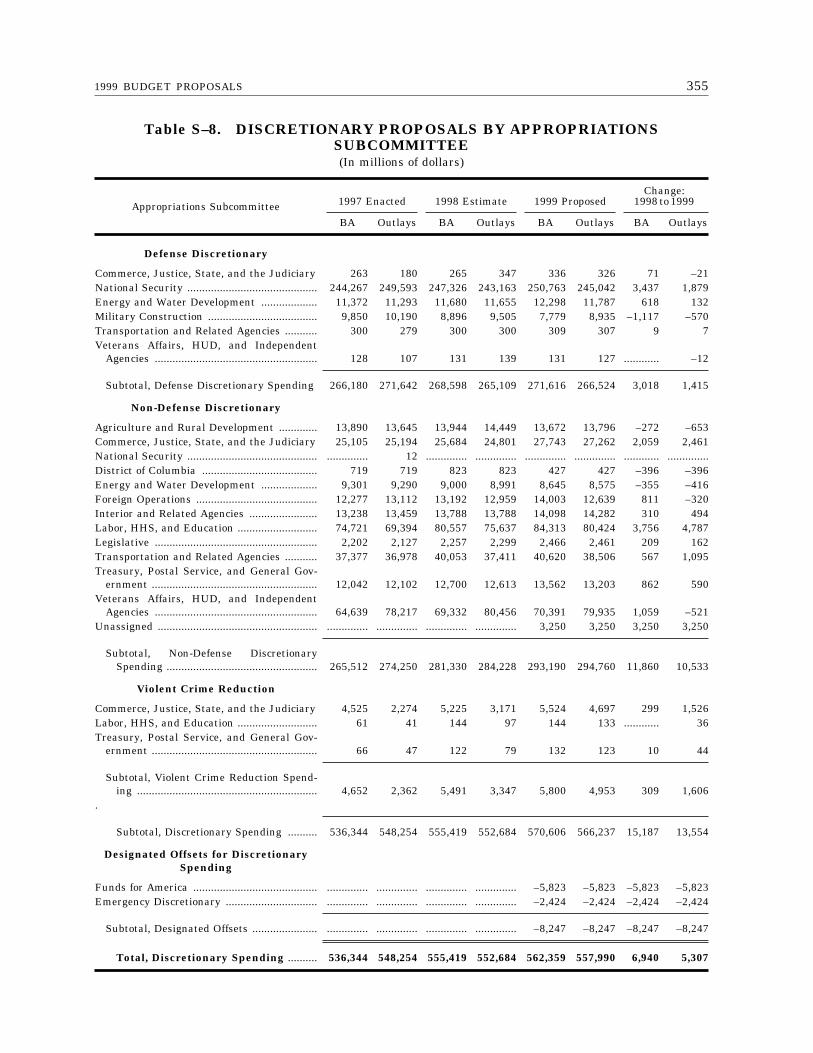
3551999 BUDGET PROPOSALS
Table S–8. DISCRETIONARY PROPOSALS BY APPROPRIATIONSSUBCOMMITTEE(In millions of dollars)
Appropriations Subcommittee 1997 Enacted 1998 Estimate 1999 ProposedChange:
1998 to 1999
BA Outlays BA Outlays BA Outlays BA Outlays
Defense Discretionary
Commerce, Justice, State, and the Judiciary 263 180 265 347 336 326 71 –21National Security ............................................ 244,267 249,593 247,326 243,163 250,763 245,042 3,437 1,879Energy and Water Development ................... 11,372 11,293 11,680 11,655 12,298 11,787 618 132Military Construction ..................................... 9,850 10,190 8,896 9,505 7,779 8,935 –1,117 –570Transportation and Related Agencies ........... 300 279 300 300 309 307 9 7Veterans Affairs, HUD, and Independent
Agencies ....................................................... 128 107 131 139 131 127 ............ –12
Subtotal, Defense Discretionary Spending 266,180 271,642 268,598 265,109 271,616 266,524 3,018 1,415
Non-Defense Discretionary
Agriculture and Rural Development ............. 13,890 13,645 13,944 14,449 13,672 13,796 –272 –653Commerce, Justice, State, and the Judiciary 25,105 25,194 25,684 24,801 27,743 27,262 2,059 2,461National Security ............................................ .............. 12 .............. .............. .............. .............. ............ ..............District of Columbia ....................................... 719 719 823 823 427 427 –396 –396Energy and Water Development ................... 9,301 9,290 9,000 8,991 8,645 8,575 –355 –416Foreign Operations ......................................... 12,277 13,112 13,192 12,959 14,003 12,639 811 –320Interior and Related Agencies ....................... 13,238 13,459 13,788 13,788 14,098 14,282 310 494Labor, HHS, and Education ........................... 74,721 69,394 80,557 75,637 84,313 80,424 3,756 4,787Legislative ....................................................... 2,202 2,127 2,257 2,299 2,466 2,461 209 162Transportation and Related Agencies ........... 37,377 36,978 40,053 37,411 40,620 38,506 567 1,095Treasury, Postal Service, and General Gov-
ernment ........................................................ 12,042 12,102 12,700 12,613 13,562 13,203 862 590Veterans Affairs, HUD, and Independent
Agencies ....................................................... 64,639 78,217 69,332 80,456 70,391 79,935 1,059 –521Unassigned ...................................................... .............. .............. .............. .............. 3,250 3,250 3,250 3,250
Subtotal, Non-Defense DiscretionarySpending ................................................... 265,512 274,250 281,330 284,228 293,190 294,760 11,860 10,533
Violent Crime Reduction
Commerce, Justice, State, and the Judiciary 4,525 2,274 5,225 3,171 5,524 4,697 299 1,526Labor, HHS, and Education ........................... 61 41 144 97 144 133 ............ 36Treasury, Postal Service, and General Gov-
ernment ........................................................ 66 47 122 79 132 123 10 44
Subtotal, Violent Crime Reduction Spend-ing ............................................................. 4,652 2,362 5,491 3,347 5,800 4,953 309 1,606
.
Subtotal, Discretionary Spending .......... 536,344 548,254 555,419 552,684 570,606 566,237 15,187 13,554
Designated Offsets for DiscretionarySpending
Funds for America .......................................... .............. .............. .............. .............. –5,823 –5,823 –5,823 –5,823Emergency Discretionary ............................... .............. .............. .............. .............. –2,424 –2,424 –2,424 –2,424
Subtotal, Designated Offsets ...................... .............. .............. .............. .............. –8,247 –8,247 –8,247 –8,247
Total, Discretionary Spending .......... 536,344 548,254 555,419 552,684 562,359 557,990 6,940 5,307


357
Summaries by Agency

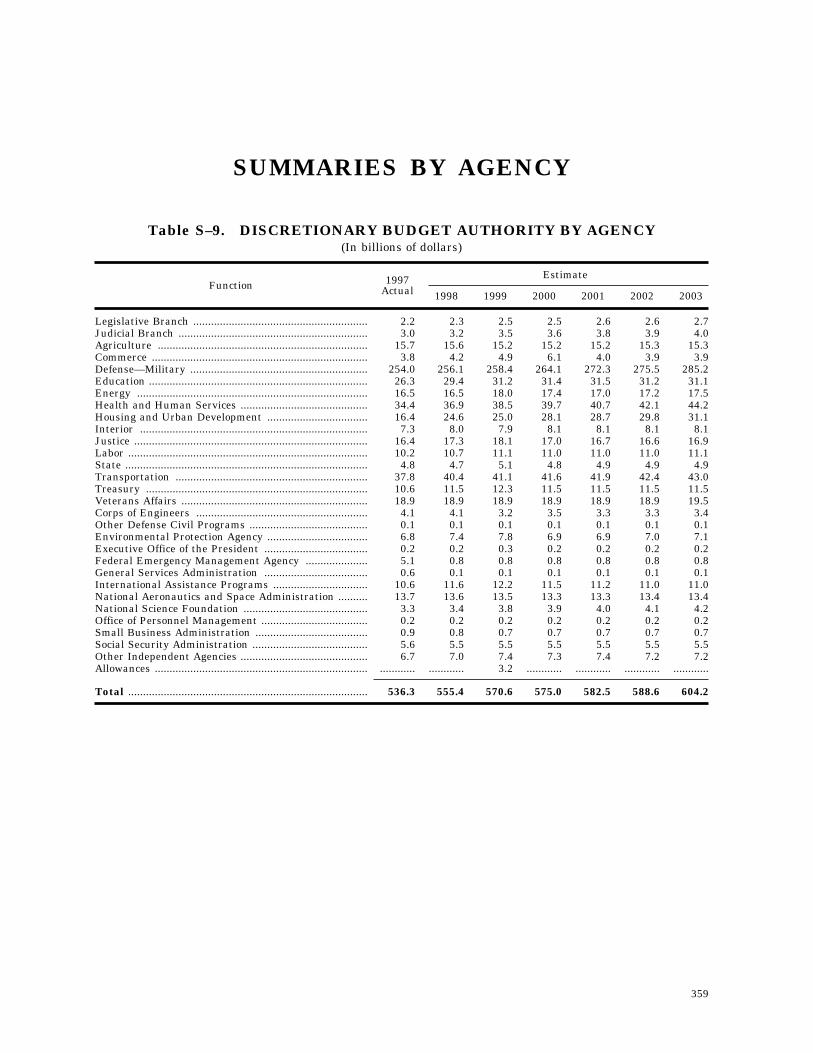
359
SUMMARIES BY AGENCY
Table S–9. DISCRETIONARY BUDGET AUTHORITY BY AGENCY(In billions of dollars)
Function 1997Actual
Estimate
1998 1999 2000 2001 2002 2003
Legislative Branch ........................................................... 2.2 2.3 2.5 2.5 2.6 2.6 2.7Judicial Branch ................................................................ 3.0 3.2 3.5 3.6 3.8 3.9 4.0Agriculture ....................................................................... 15.7 15.6 15.2 15.2 15.2 15.3 15.3Commerce ......................................................................... 3.8 4.2 4.9 6.1 4.0 3.9 3.9Defense—Military ............................................................ 254.0 256.1 258.4 264.1 272.3 275.5 285.2Education .......................................................................... 26.3 29.4 31.2 31.4 31.5 31.2 31.1Energy .............................................................................. 16.5 16.5 18.0 17.4 17.0 17.2 17.5Health and Human Services ........................................... 34.4 36.9 38.5 39.7 40.7 42.1 44.2Housing and Urban Development .................................. 16.4 24.6 25.0 28.1 28.7 29.8 31.1Interior ............................................................................. 7.3 8.0 7.9 8.1 8.1 8.1 8.1Justice ............................................................................... 16.4 17.3 18.1 17.0 16.7 16.6 16.9Labor ................................................................................. 10.2 10.7 11.1 11.0 11.0 11.0 11.1State .................................................................................. 4.8 4.7 5.1 4.8 4.9 4.9 4.9Transportation ................................................................. 37.8 40.4 41.1 41.6 41.9 42.4 43.0Treasury ........................................................................... 10.6 11.5 12.3 11.5 11.5 11.5 11.5Veterans Affairs ............................................................... 18.9 18.9 18.9 18.9 18.9 18.9 19.5Corps of Engineers .......................................................... 4.1 4.1 3.2 3.5 3.3 3.3 3.4Other Defense Civil Programs ........................................ 0.1 0.1 0.1 0.1 0.1 0.1 0.1Environmental Protection Agency .................................. 6.8 7.4 7.8 6.9 6.9 7.0 7.1Executive Office of the President ................................... 0.2 0.2 0.3 0.2 0.2 0.2 0.2Federal Emergency Management Agency ..................... 5.1 0.8 0.8 0.8 0.8 0.8 0.8General Services Administration ................................... 0.6 0.1 0.1 0.1 0.1 0.1 0.1International Assistance Programs ................................ 10.6 11.6 12.2 11.5 11.2 11.0 11.0National Aeronautics and Space Administration .......... 13.7 13.6 13.5 13.3 13.3 13.4 13.4National Science Foundation .......................................... 3.3 3.4 3.8 3.9 4.0 4.1 4.2Office of Personnel Management .................................... 0.2 0.2 0.2 0.2 0.2 0.2 0.2Small Business Administration ...................................... 0.9 0.8 0.7 0.7 0.7 0.7 0.7Social Security Administration ....................................... 5.6 5.5 5.5 5.5 5.5 5.5 5.5Other Independent Agencies ........................................... 6.7 7.0 7.4 7.3 7.4 7.2 7.2Allowances ........................................................................ ............ ............ 3.2 ............ ............ ............ ............
Total ................................................................................. 536.3 555.4 570.6 575.0 582.5 588.6 604.2
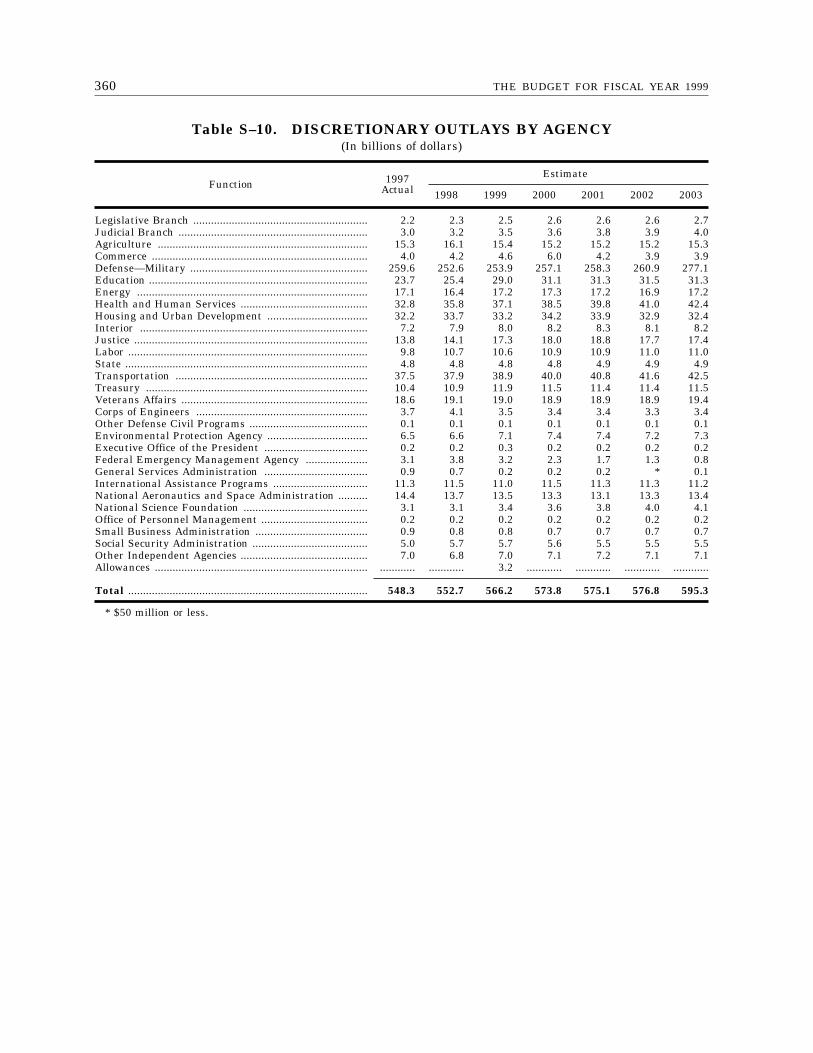
360 THE BUDGET FOR FISCAL YEAR 1999
Table S–10. DISCRETIONARY OUTLAYS BY AGENCY(In billions of dollars)
Function 1997Actual
Estimate
1998 1999 2000 2001 2002 2003
Legislative Branch ........................................................... 2.2 2.3 2.5 2.6 2.6 2.6 2.7Judicial Branch ................................................................ 3.0 3.2 3.5 3.6 3.8 3.9 4.0Agriculture ....................................................................... 15.3 16.1 15.4 15.2 15.2 15.2 15.3Commerce ......................................................................... 4.0 4.2 4.6 6.0 4.2 3.9 3.9Defense—Military ............................................................ 259.6 252.6 253.9 257.1 258.3 260.9 277.1Education .......................................................................... 23.7 25.4 29.0 31.1 31.3 31.5 31.3Energy .............................................................................. 17.1 16.4 17.2 17.3 17.2 16.9 17.2Health and Human Services ........................................... 32.8 35.8 37.1 38.5 39.8 41.0 42.4Housing and Urban Development .................................. 32.2 33.7 33.2 34.2 33.9 32.9 32.4Interior ............................................................................. 7.2 7.9 8.0 8.2 8.3 8.1 8.2Justice ............................................................................... 13.8 14.1 17.3 18.0 18.8 17.7 17.4Labor ................................................................................. 9.8 10.7 10.6 10.9 10.9 11.0 11.0State .................................................................................. 4.8 4.8 4.8 4.8 4.9 4.9 4.9Transportation ................................................................. 37.5 37.9 38.9 40.0 40.8 41.6 42.5Treasury ........................................................................... 10.4 10.9 11.9 11.5 11.4 11.4 11.5Veterans Affairs ............................................................... 18.6 19.1 19.0 18.9 18.9 18.9 19.4Corps of Engineers .......................................................... 3.7 4.1 3.5 3.4 3.4 3.3 3.4Other Defense Civil Programs ........................................ 0.1 0.1 0.1 0.1 0.1 0.1 0.1Environmental Protection Agency .................................. 6.5 6.6 7.1 7.4 7.4 7.2 7.3Executive Office of the President ................................... 0.2 0.2 0.3 0.2 0.2 0.2 0.2Federal Emergency Management Agency ..................... 3.1 3.8 3.2 2.3 1.7 1.3 0.8General Services Administration ................................... 0.9 0.7 0.2 0.2 0.2 * 0.1International Assistance Programs ................................ 11.3 11.5 11.0 11.5 11.3 11.3 11.2National Aeronautics and Space Administration .......... 14.4 13.7 13.5 13.3 13.1 13.3 13.4National Science Foundation .......................................... 3.1 3.1 3.4 3.6 3.8 4.0 4.1Office of Personnel Management .................................... 0.2 0.2 0.2 0.2 0.2 0.2 0.2Small Business Administration ...................................... 0.9 0.8 0.8 0.7 0.7 0.7 0.7Social Security Administration ....................................... 5.0 5.7 5.7 5.6 5.5 5.5 5.5Other Independent Agencies ........................................... 7.0 6.8 7.0 7.1 7.2 7.1 7.1Allowances ........................................................................ ............ ............ 3.2 ............ ............ ............ ............
Total ................................................................................. 548.3 552.7 566.2 573.8 575.1 576.8 595.3
* $50 million or less.
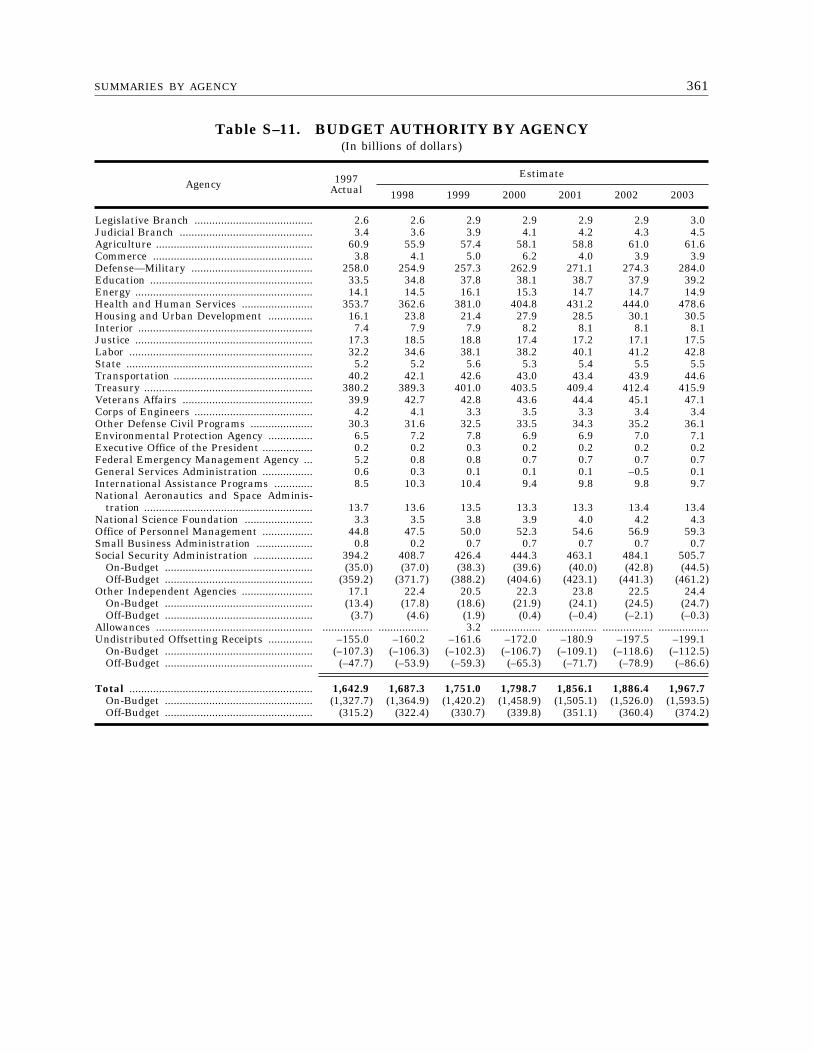
361SUMMARIES BY AGENCY
Table S–11. BUDGET AUTHORITY BY AGENCY(In billions of dollars)
Agency 1997Actual
Estimate
1998 1999 2000 2001 2002 2003
Legislative Branch ........................................ 2.6 2.6 2.9 2.9 2.9 2.9 3.0Judicial Branch ............................................. 3.4 3.6 3.9 4.1 4.2 4.3 4.5Agriculture ..................................................... 60.9 55.9 57.4 58.1 58.8 61.0 61.6Commerce ...................................................... 3.8 4.1 5.0 6.2 4.0 3.9 3.9Defense—Military ......................................... 258.0 254.9 257.3 262.9 271.1 274.3 284.0Education ....................................................... 33.5 34.8 37.8 38.1 38.7 37.9 39.2Energy ............................................................ 14.1 14.5 16.1 15.3 14.7 14.7 14.9Health and Human Services ........................ 353.7 362.6 381.0 404.8 431.2 444.0 478.6Housing and Urban Development ............... 16.1 23.8 21.4 27.9 28.5 30.1 30.5Interior ........................................................... 7.4 7.9 7.9 8.2 8.1 8.1 8.1Justice ............................................................ 17.3 18.5 18.8 17.4 17.2 17.1 17.5Labor .............................................................. 32.2 34.6 38.1 38.2 40.1 41.2 42.8State ............................................................... 5.2 5.2 5.6 5.3 5.4 5.5 5.5Transportation ............................................... 40.2 42.1 42.6 43.0 43.4 43.9 44.6Treasury ......................................................... 380.2 389.3 401.0 403.5 409.4 412.4 415.9Veterans Affairs ............................................ 39.9 42.7 42.8 43.6 44.4 45.1 47.1Corps of Engineers ........................................ 4.2 4.1 3.3 3.5 3.3 3.4 3.4Other Defense Civil Programs ..................... 30.3 31.6 32.5 33.5 34.3 35.2 36.1Environmental Protection Agency ............... 6.5 7.2 7.8 6.9 6.9 7.0 7.1Executive Office of the President ................. 0.2 0.2 0.3 0.2 0.2 0.2 0.2Federal Emergency Management Agency ... 5.2 0.8 0.8 0.7 0.7 0.7 0.7General Services Administration ................. 0.6 0.3 0.1 0.1 0.1 –0.5 0.1International Assistance Programs ............. 8.5 10.3 10.4 9.4 9.8 9.8 9.7National Aeronautics and Space Adminis-
tration ......................................................... 13.7 13.6 13.5 13.3 13.3 13.4 13.4National Science Foundation ....................... 3.3 3.5 3.8 3.9 4.0 4.2 4.3Office of Personnel Management ................. 44.8 47.5 50.0 52.3 54.6 56.9 59.3Small Business Administration ................... 0.8 0.2 0.7 0.7 0.7 0.7 0.7Social Security Administration .................... 394.2 408.7 426.4 444.3 463.1 484.1 505.7
On-Budget .................................................. (35.0) (37.0) (38.3) (39.6) (40.0) (42.8) (44.5)Off-Budget .................................................. (359.2) (371.7) (388.2) (404.6) (423.1) (441.3) (461.2)
Other Independent Agencies ........................ 17.1 22.4 20.5 22.3 23.8 22.5 24.4On-Budget .................................................. (13.4) (17.8) (18.6) (21.9) (24.1) (24.5) (24.7)Off-Budget .................................................. (3.7) (4.6) (1.9) (0.4) (–0.4) (–2.1) (–0.3)
Allowances ..................................................... ................. ................. 3.2 ................. ................. ................. .................Undistributed Offsetting Receipts ............... –155.0 –160.2 –161.6 –172.0 –180.9 –197.5 –199.1
On-Budget .................................................. (–107.3) (–106.3) (–102.3) (–106.7) (–109.1) (–118.6) (–112.5)Off-Budget .................................................. (–47.7) (–53.9) (–59.3) (–65.3) (–71.7) (–78.9) (–86.6)
Total .............................................................. 1,642.9 1,687.3 1,751.0 1,798.7 1,856.1 1,886.4 1,967.7On-Budget .................................................. (1,327.7) (1,364.9) (1,420.2) (1,458.9) (1,505.1) (1,526.0) (1,593.5)Off-Budget .................................................. (315.2) (322.4) (330.7) (339.8) (351.1) (360.4) (374.2)
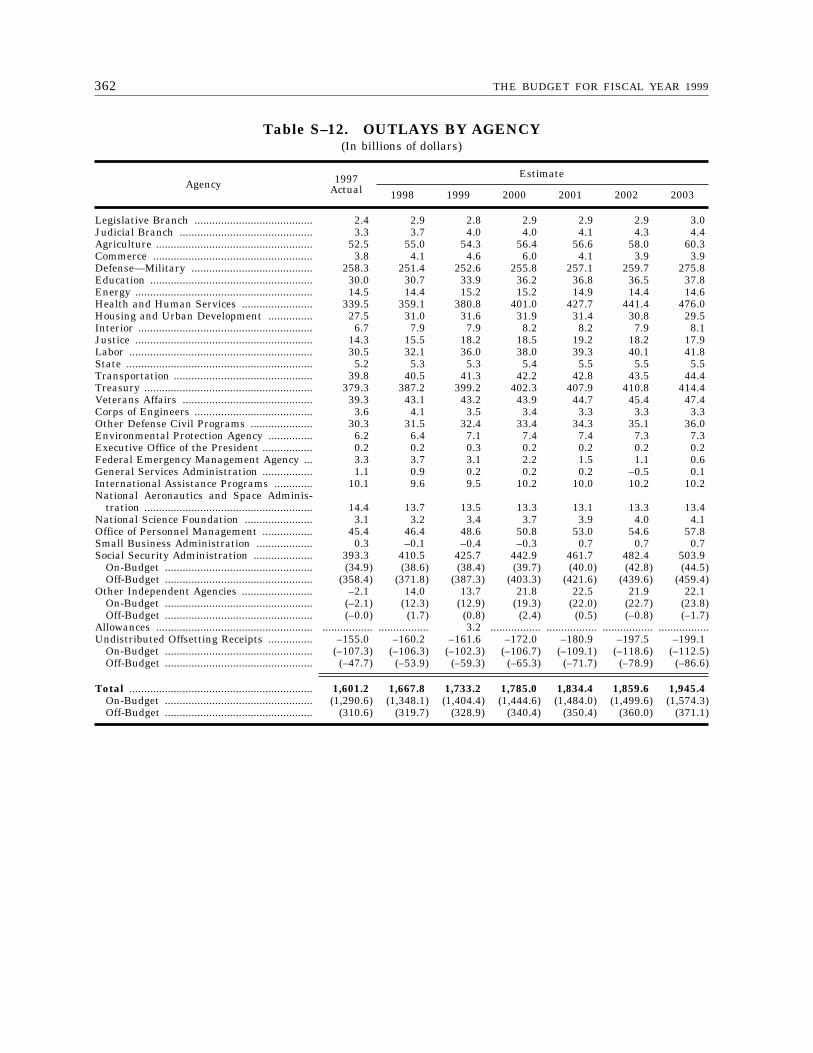
362 THE BUDGET FOR FISCAL YEAR 1999
Table S–12. OUTLAYS BY AGENCY(In billions of dollars)
Agency 1997Actual
Estimate
1998 1999 2000 2001 2002 2003
Legislative Branch ........................................ 2.4 2.9 2.8 2.9 2.9 2.9 3.0Judicial Branch ............................................. 3.3 3.7 4.0 4.0 4.1 4.3 4.4Agriculture ..................................................... 52.5 55.0 54.3 56.4 56.6 58.0 60.3Commerce ...................................................... 3.8 4.1 4.6 6.0 4.1 3.9 3.9Defense—Military ......................................... 258.3 251.4 252.6 255.8 257.1 259.7 275.8Education ....................................................... 30.0 30.7 33.9 36.2 36.8 36.5 37.8Energy ............................................................ 14.5 14.4 15.2 15.2 14.9 14.4 14.6Health and Human Services ........................ 339.5 359.1 380.8 401.0 427.7 441.4 476.0Housing and Urban Development ............... 27.5 31.0 31.6 31.9 31.4 30.8 29.5Interior ........................................................... 6.7 7.9 7.9 8.2 8.2 7.9 8.1Justice ............................................................ 14.3 15.5 18.2 18.5 19.2 18.2 17.9Labor .............................................................. 30.5 32.1 36.0 38.0 39.3 40.1 41.8State ............................................................... 5.2 5.3 5.3 5.4 5.5 5.5 5.5Transportation ............................................... 39.8 40.5 41.3 42.2 42.8 43.5 44.4Treasury ......................................................... 379.3 387.2 399.2 402.3 407.9 410.8 414.4Veterans Affairs ............................................ 39.3 43.1 43.2 43.9 44.7 45.4 47.4Corps of Engineers ........................................ 3.6 4.1 3.5 3.4 3.3 3.3 3.3Other Defense Civil Programs ..................... 30.3 31.5 32.4 33.4 34.3 35.1 36.0Environmental Protection Agency ............... 6.2 6.4 7.1 7.4 7.4 7.3 7.3Executive Office of the President ................. 0.2 0.2 0.3 0.2 0.2 0.2 0.2Federal Emergency Management Agency ... 3.3 3.7 3.1 2.2 1.5 1.1 0.6General Services Administration ................. 1.1 0.9 0.2 0.2 0.2 –0.5 0.1International Assistance Programs ............. 10.1 9.6 9.5 10.2 10.0 10.2 10.2National Aeronautics and Space Adminis-
tration ......................................................... 14.4 13.7 13.5 13.3 13.1 13.3 13.4National Science Foundation ....................... 3.1 3.2 3.4 3.7 3.9 4.0 4.1Office of Personnel Management ................. 45.4 46.4 48.6 50.8 53.0 54.6 57.8Small Business Administration ................... 0.3 –0.1 –0.4 –0.3 0.7 0.7 0.7Social Security Administration .................... 393.3 410.5 425.7 442.9 461.7 482.4 503.9
On-Budget .................................................. (34.9) (38.6) (38.4) (39.7) (40.0) (42.8) (44.5)Off-Budget .................................................. (358.4) (371.8) (387.3) (403.3) (421.6) (439.6) (459.4)
Other Independent Agencies ........................ –2.1 14.0 13.7 21.8 22.5 21.9 22.1On-Budget .................................................. (–2.1) (12.3) (12.9) (19.3) (22.0) (22.7) (23.8)Off-Budget .................................................. (–0.0) (1.7) (0.8) (2.4) (0.5) (–0.8) (–1.7)
Allowances ..................................................... ................. ................. 3.2 ................. ................. ................. .................Undistributed Offsetting Receipts ............... –155.0 –160.2 –161.6 –172.0 –180.9 –197.5 –199.1
On-Budget .................................................. (–107.3) (–106.3) (–102.3) (–106.7) (–109.1) (–118.6) (–112.5)Off-Budget .................................................. (–47.7) (–53.9) (–59.3) (–65.3) (–71.7) (–78.9) (–86.6)
Total .............................................................. 1,601.2 1,667.8 1,733.2 1,785.0 1,834.4 1,859.6 1,945.4On-Budget .................................................. (1,290.6) (1,348.1) (1,404.4) (1,444.6) (1,484.0) (1,499.6) (1,574.3)Off-Budget .................................................. (310.6) (319.7) (328.9) (340.4) (350.4) (360.0) (371.1)

363
Other Summary Tables

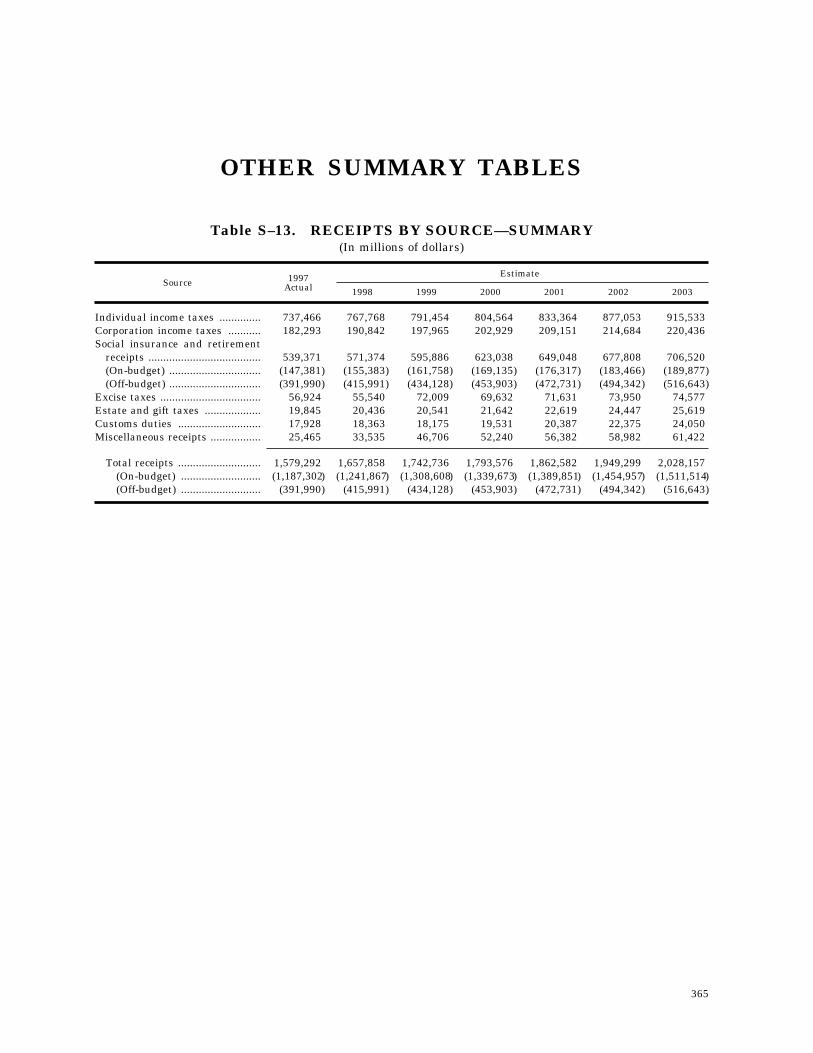
365
OTHER SUMMARY TABLES
Table S–13. RECEIPTS BY SOURCE—SUMMARY(In millions of dollars)
Source 1997Actual
Estimate
1998 1999 2000 2001 2002 2003
Individual income taxes .............. 737,466 767,768 791,454 804,564 833,364 877,053 915,533Corporation income taxes ........... 182,293 190,842 197,965 202,929 209,151 214,684 220,436Social insurance and retirement
receipts ...................................... 539,371 571,374 595,886 623,038 649,048 677,808 706,520(On-budget) ............................... (147,381) (155,383) (161,758) (169,135) (176,317) (183,466) (189,877)(Off-budget) ............................... (391,990) (415,991) (434,128) (453,903) (472,731) (494,342) (516,643)
Excise taxes .................................. 56,924 55,540 72,009 69,632 71,631 73,950 74,577Estate and gift taxes ................... 19,845 20,436 20,541 21,642 22,619 24,447 25,619Customs duties ............................ 17,928 18,363 18,175 19,531 20,387 22,375 24,050Miscellaneous receipts ................. 25,465 33,535 46,706 52,240 56,382 58,982 61,422
Total receipts ............................ 1,579,292 1,657,858 1,742,736 1,793,576 1,862,582 1,949,299 2,028,157(On-budget) ........................... (1,187,302) (1,241,867) (1,308,608) (1,339,673) (1,389,851) (1,454,957) (1,511,514)(Off-budget) ........................... (391,990) (415,991) (434,128) (453,903) (472,731) (494,342) (516,643)
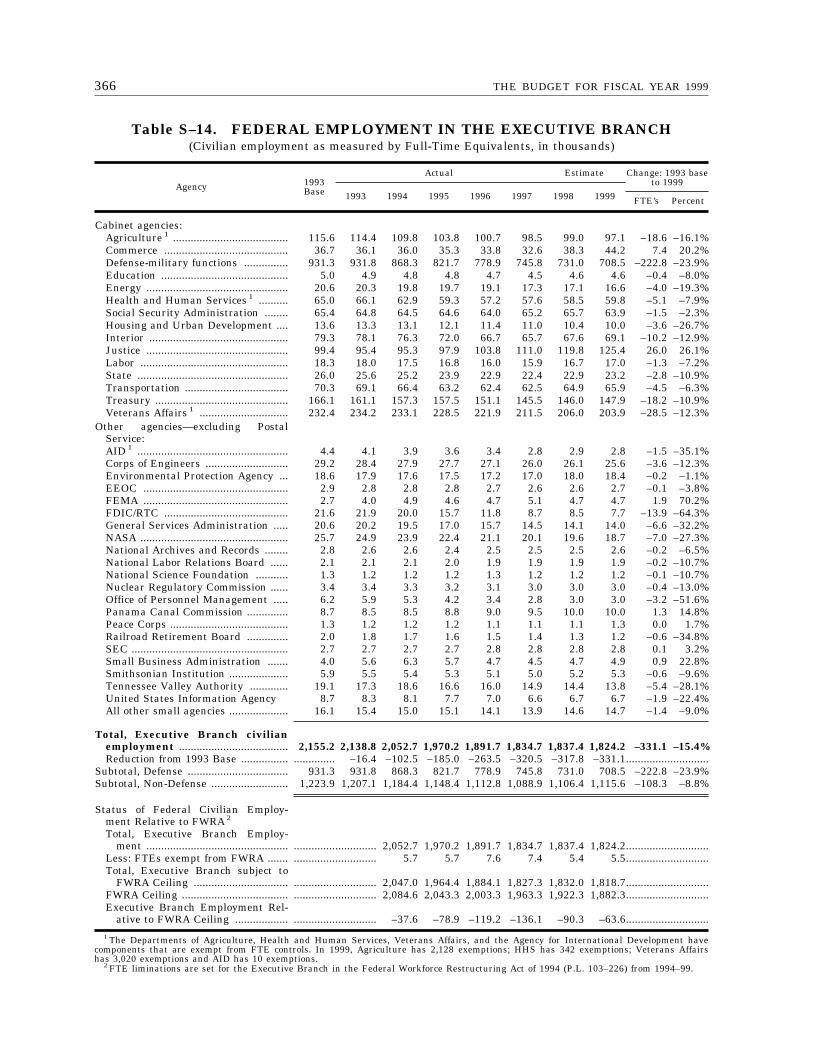
366 THE BUDGET FOR FISCAL YEAR 1999
Table S–14. FEDERAL EMPLOYMENT IN THE EXECUTIVE BRANCH(Civilian employment as measured by Full-Time Equivalents, in thousands)
Agency 1993Base
Actual Estimate Change: 1993 baseto 1999
1993 1994 1995 1996 1997 1998 1999 FTE’s Percent
Cabinet agencies:Agriculture 1 ....................................... 115.6 114.4 109.8 103.8 100.7 98.5 99.0 97.1 –18.6 –16.1%Commerce .......................................... 36.7 36.1 36.0 35.3 33.8 32.6 38.3 44.2 7.4 20.2%Defense-military functions ............... 931.3 931.8 868.3 821.7 778.9 745.8 731.0 708.5 –222.8 –23.9%Education ........................................... 5.0 4.9 4.8 4.8 4.7 4.5 4.6 4.6 –0.4 –8.0%Energy ................................................ 20.6 20.3 19.8 19.7 19.1 17.3 17.1 16.6 –4.0 –19.3%Health and Human Services 1 .......... 65.0 66.1 62.9 59.3 57.2 57.6 58.5 59.8 –5.1 –7.9%Social Security Administration ........ 65.4 64.8 64.5 64.6 64.0 65.2 65.7 63.9 –1.5 –2.3%Housing and Urban Development .... 13.6 13.3 13.1 12.1 11.4 11.0 10.4 10.0 –3.6 –26.7%Interior ............................................... 79.3 78.1 76.3 72.0 66.7 65.7 67.6 69.1 –10.2 –12.9%Justice ................................................ 99.4 95.4 95.3 97.9 103.8 111.0 119.8 125.4 26.0 26.1%Labor .................................................. 18.3 18.0 17.5 16.8 16.0 15.9 16.7 17.0 –1.3 –7.2%State ................................................... 26.0 25.6 25.2 23.9 22.9 22.4 22.9 23.2 –2.8 –10.9%Transportation ................................... 70.3 69.1 66.4 63.2 62.4 62.5 64.9 65.9 –4.5 –6.3%Treasury ............................................. 166.1 161.1 157.3 157.5 151.1 145.5 146.0 147.9 –18.2 –10.9%Veterans Affairs 1 .............................. 232.4 234.2 233.1 228.5 221.9 211.5 206.0 203.9 –28.5 –12.3%
Other agencies—excluding PostalService:AID 1 ................................................... 4.4 4.1 3.9 3.6 3.4 2.8 2.9 2.8 –1.5 –35.1%Corps of Engineers ............................ 29.2 28.4 27.9 27.7 27.1 26.0 26.1 25.6 –3.6 –12.3%Environmental Protection Agency ... 18.6 17.9 17.6 17.5 17.2 17.0 18.0 18.4 –0.2 –1.1%EEOC ................................................. 2.9 2.8 2.8 2.8 2.7 2.6 2.6 2.7 –0.1 –3.8%FEMA ................................................. 2.7 4.0 4.9 4.6 4.7 5.1 4.7 4.7 1.9 70.2%FDIC/RTC .......................................... 21.6 21.9 20.0 15.7 11.8 8.7 8.5 7.7 –13.9 –64.3%General Services Administration ..... 20.6 20.2 19.5 17.0 15.7 14.5 14.1 14.0 –6.6 –32.2%NASA .................................................. 25.7 24.9 23.9 22.4 21.1 20.1 19.6 18.7 –7.0 –27.3%National Archives and Records ........ 2.8 2.6 2.6 2.4 2.5 2.5 2.5 2.6 –0.2 –6.5%National Labor Relations Board ...... 2.1 2.1 2.1 2.0 1.9 1.9 1.9 1.9 –0.2 –10.7%National Science Foundation ........... 1.3 1.2 1.2 1.2 1.3 1.2 1.2 1.2 –0.1 –10.7%Nuclear Regulatory Commission ...... 3.4 3.4 3.3 3.2 3.1 3.0 3.0 3.0 –0.4 –13.0%Office of Personnel Management ..... 6.2 5.9 5.3 4.2 3.4 2.8 3.0 3.0 –3.2 –51.6%Panama Canal Commission .............. 8.7 8.5 8.5 8.8 9.0 9.5 10.0 10.0 1.3 14.8%Peace Corps ........................................ 1.3 1.2 1.2 1.2 1.1 1.1 1.1 1.3 0.0 1.7%Railroad Retirement Board .............. 2.0 1.8 1.7 1.6 1.5 1.4 1.3 1.2 –0.6 –34.8%SEC ..................................................... 2.7 2.7 2.7 2.7 2.8 2.8 2.8 2.8 0.1 3.2%Small Business Administration ....... 4.0 5.6 6.3 5.7 4.7 4.5 4.7 4.9 0.9 22.8%Smithsonian Institution .................... 5.9 5.5 5.4 5.3 5.1 5.0 5.2 5.3 –0.6 –9.6%Tennessee Valley Authority ............. 19.1 17.3 18.6 16.6 16.0 14.9 14.4 13.8 –5.4 –28.1%United States Information Agency 8.7 8.3 8.1 7.7 7.0 6.6 6.7 6.7 –1.9 –22.4%All other small agencies .................... 16.1 15.4 15.0 15.1 14.1 13.9 14.6 14.7 –1.4 –9.0%
Total, Executive Branch civilianemployment ..................................... 2,155.2 2,138.8 2,052.7 1,970.2 1,891.7 1,834.7 1,837.4 1,824.2 –331.1 –15.4%Reduction from 1993 Base ................ .............. –16.4 –102.5 –185.0 –263.5 –320.5 –317.8 –331.1............................
Subtotal, Defense .................................. 931.3 931.8 868.3 821.7 778.9 745.8 731.0 708.5 –222.8 –23.9%Subtotal, Non-Defense .......................... 1,223.9 1,207.1 1,184.4 1,148.4 1,112.8 1,088.9 1,106.4 1,115.6 –108.3 –8.8%
Status of Federal Civilian Employ-ment Relative to FWRA 2
Total, Executive Branch Employ-ment ................................................ ............................ 2,052.7 1,970.2 1,891.7 1,834.7 1,837.4 1,824.2............................
Less: FTEs exempt from FWRA ....... ............................ 5.7 5.7 7.6 7.4 5.4 5.5............................Total, Executive Branch subject to
FWRA Ceiling ................................ ............................ 2,047.0 1,964.4 1,884.1 1,827.3 1,832.0 1,818.7............................FWRA Ceiling .................................... ............................ 2,084.6 2,043.3 2,003.3 1,963.3 1,922.3 1,882.3............................Executive Branch Employment Rel-
ative to FWRA Ceiling .................. ............................ –37.6 –78.9 –119.2 –136.1 –90.3 –63.6............................
1 The Departments of Agriculture, Health and Human Services, Veterans Affairs, and the Agency for International Development havecomponents that are exempt from FTE controls. In 1999, Agriculture has 2,128 exemptions; HHS has 342 exemptions; Veterans Affairshas 3,020 exemptions and AID has 10 exemptions.
2 FTE liminations are set for the Executive Branch in the Federal Workforce Restructuring Act of 1994 (P.L. 103–226) from 1994–99.
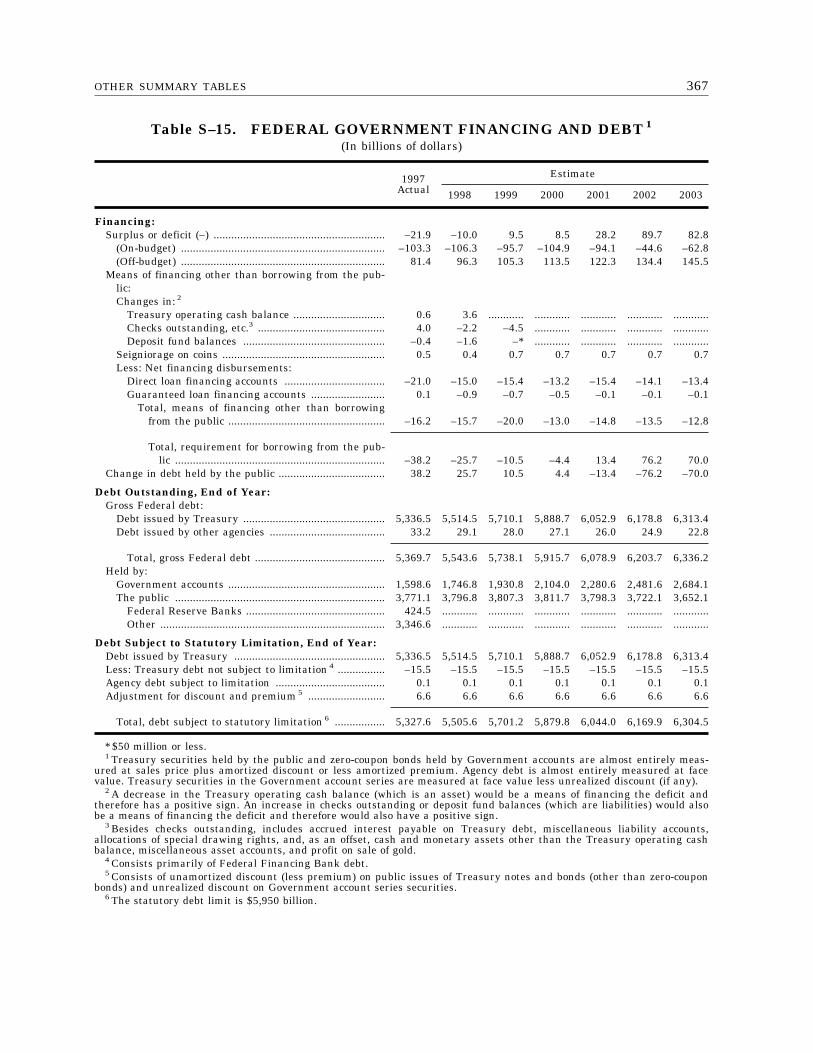
367OTHER SUMMARY TABLES
Table S–15. FEDERAL GOVERNMENT FINANCING AND DEBT 1
(In billions of dollars)
1997Actual
Estimate
1998 1999 2000 2001 2002 2003
Financing:Surplus or deficit (–) .......................................................... –21.9 –10.0 9.5 8.5 28.2 89.7 82.8
(On-budget) ..................................................................... –103.3 –106.3 –95.7 –104.9 –94.1 –44.6 –62.8(Off-budget) ..................................................................... 81.4 96.3 105.3 113.5 122.3 134.4 145.5
Means of financing other than borrowing from the pub-lic:Changes in: 2
Treasury operating cash balance ............................... 0.6 3.6 ............ ............ ............ ............ ............Checks outstanding, etc.3 ........................................... 4.0 –2.2 –4.5 ............ ............ ............ ............Deposit fund balances ................................................ –0.4 –1.6 –* ............ ............ ............ ............
Seigniorage on coins ....................................................... 0.5 0.4 0.7 0.7 0.7 0.7 0.7Less: Net financing disbursements:
Direct loan financing accounts .................................. –21.0 –15.0 –15.4 –13.2 –15.4 –14.1 –13.4Guaranteed loan financing accounts ......................... 0.1 –0.9 –0.7 –0.5 –0.1 –0.1 –0.1
Total, means of financing other than borrowingfrom the public ..................................................... –16.2 –15.7 –20.0 –13.0 –14.8 –13.5 –12.8
Total, requirement for borrowing from the pub-lic ....................................................................... –38.2 –25.7 –10.5 –4.4 13.4 76.2 70.0
Change in debt held by the public .................................... 38.2 25.7 10.5 4.4 –13.4 –76.2 –70.0
Debt Outstanding, End of Year:Gross Federal debt:
Debt issued by Treasury ................................................ 5,336.5 5,514.5 5,710.1 5,888.7 6,052.9 6,178.8 6,313.4Debt issued by other agencies ....................................... 33.2 29.1 28.0 27.1 26.0 24.9 22.8
Total, gross Federal debt ............................................ 5,369.7 5,543.6 5,738.1 5,915.7 6,078.9 6,203.7 6,336.2Held by:
Government accounts ..................................................... 1,598.6 1,746.8 1,930.8 2,104.0 2,280.6 2,481.6 2,684.1The public ....................................................................... 3,771.1 3,796.8 3,807.3 3,811.7 3,798.3 3,722.1 3,652.1
Federal Reserve Banks ............................................... 424.5 ............ ............ ............ ............ ............ ............Other ............................................................................ 3,346.6 ............ ............ ............ ............ ............ ............
Debt Subject to Statutory Limitation, End of Year:Debt issued by Treasury ................................................... 5,336.5 5,514.5 5,710.1 5,888.7 6,052.9 6,178.8 6,313.4Less: Treasury debt not subject to limitation 4 ................ –15.5 –15.5 –15.5 –15.5 –15.5 –15.5 –15.5Agency debt subject to limitation ..................................... 0.1 0.1 0.1 0.1 0.1 0.1 0.1Adjustment for discount and premium 5 .......................... 6.6 6.6 6.6 6.6 6.6 6.6 6.6
Total, debt subject to statutory limitation 6 ................. 5,327.6 5,505.6 5,701.2 5,879.8 6,044.0 6,169.9 6,304.5
* $50 million or less.1 Treasury securities held by the public and zero-coupon bonds held by Government accounts are almost entirely meas-
ured at sales price plus amortized discount or less amortized premium. Agency debt is almost entirely measured at facevalue. Treasury securities in the Government account series are measured at face value less unrealized discount (if any).
2 A decrease in the Treasury operating cash balance (which is an asset) would be a means of financing the deficit andtherefore has a positive sign. An increase in checks outstanding or deposit fund balances (which are liabilities) would alsobe a means of financing the deficit and therefore would also have a positive sign.
3 Besides checks outstanding, includes accrued interest payable on Treasury debt, miscellaneous liability accounts,allocations of special drawing rights, and, as an offset, cash and monetary assets other than the Treasury operating cashbalance, miscellaneous asset accounts, and profit on sale of gold.
4 Consists primarily of Federal Financing Bank debt.5 Consists of unamortized discount (less premium) on public issues of Treasury notes and bonds (other than zero-coupon
bonds) and unrealized discount on Government account series securities.6 The statutory debt limit is $5,950 billion.
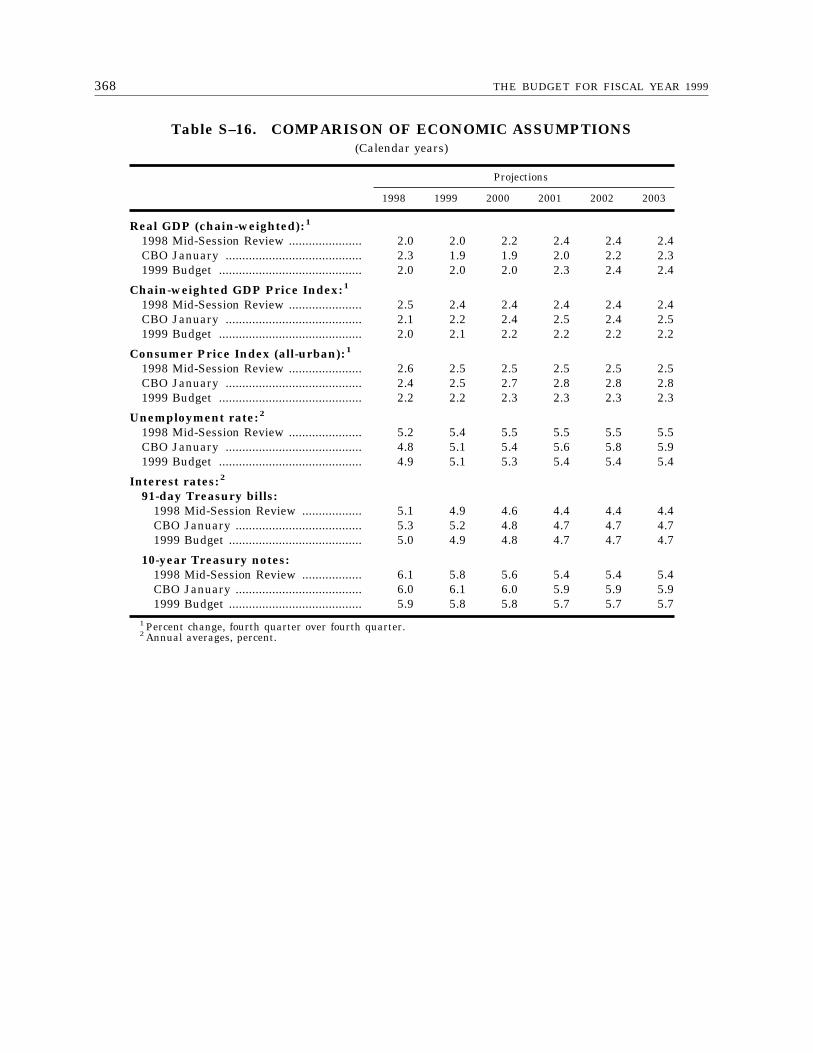
368 THE BUDGET FOR FISCAL YEAR 1999
Table S–16. COMPARISON OF ECONOMIC ASSUMPTIONS(Calendar years)
Projections
1998 1999 2000 2001 2002 2003
Real GDP (chain-weighted): 1
1998 Mid-Session Review ...................... 2.0 2.0 2.2 2.4 2.4 2.4CBO January ......................................... 2.3 1.9 1.9 2.0 2.2 2.31999 Budget ........................................... 2.0 2.0 2.0 2.3 2.4 2.4
Chain-weighted GDP Price Index: 1
1998 Mid-Session Review ...................... 2.5 2.4 2.4 2.4 2.4 2.4CBO January ......................................... 2.1 2.2 2.4 2.5 2.4 2.51999 Budget ........................................... 2.0 2.1 2.2 2.2 2.2 2.2
Consumer Price Index (all-urban): 1
1998 Mid-Session Review ...................... 2.6 2.5 2.5 2.5 2.5 2.5CBO January ......................................... 2.4 2.5 2.7 2.8 2.8 2.81999 Budget ........................................... 2.2 2.2 2.3 2.3 2.3 2.3
Unemployment rate: 2
1998 Mid-Session Review ...................... 5.2 5.4 5.5 5.5 5.5 5.5CBO January ......................................... 4.8 5.1 5.4 5.6 5.8 5.91999 Budget ........................................... 4.9 5.1 5.3 5.4 5.4 5.4
Interest rates: 2
91-day Treasury bills:1998 Mid-Session Review .................. 5.1 4.9 4.6 4.4 4.4 4.4CBO January ...................................... 5.3 5.2 4.8 4.7 4.7 4.71999 Budget ........................................ 5.0 4.9 4.8 4.7 4.7 4.7
10-year Treasury notes:1998 Mid-Session Review .................. 6.1 5.8 5.6 5.4 5.4 5.4CBO January ...................................... 6.0 6.1 6.0 5.9 5.9 5.91999 Budget ........................................ 5.9 5.8 5.8 5.7 5.7 5.7
1 Percent change, fourth quarter over fourth quarter.2 Annual averages, percent.

369
VIII. LIST OF CHARTS ANDTABLES

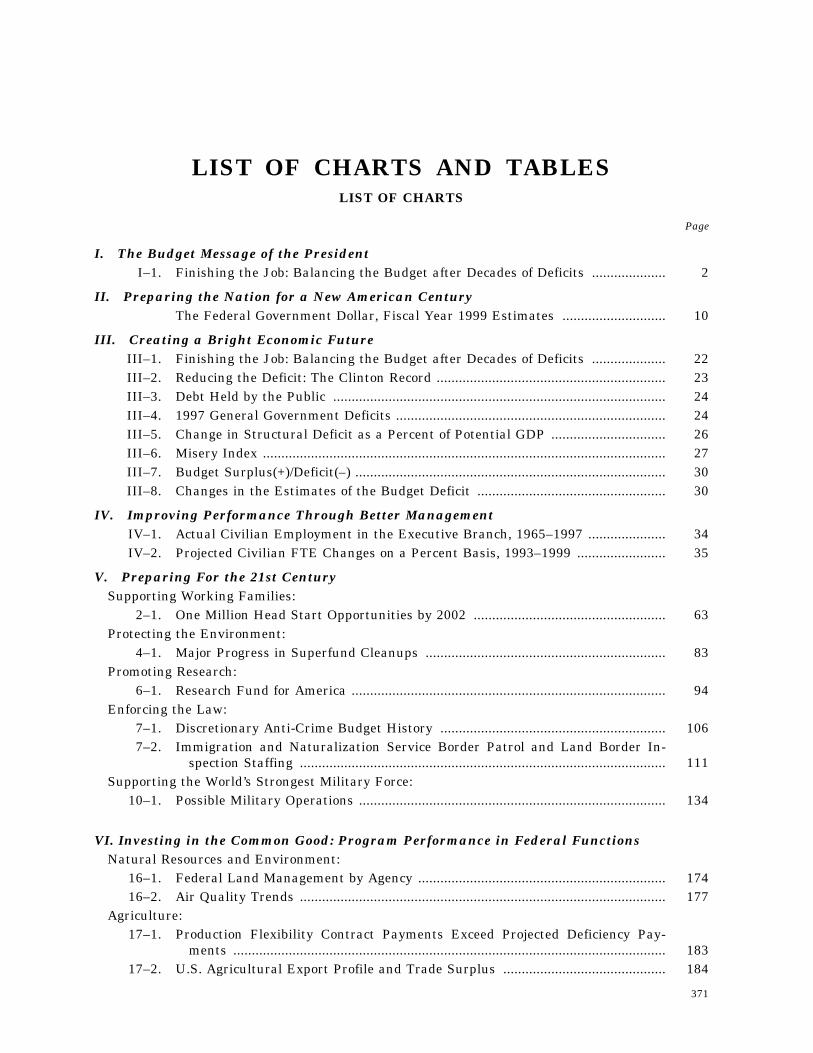
371
LIST OF CHARTS AND TABLESLIST OF CHARTS
Page
I. The Budget Message of the PresidentI–1. Finishing the Job: Balancing the Budget after Decades of Deficits .................... 2
II. Preparing the Nation for a New American CenturyThe Federal Government Dollar, Fiscal Year 1999 Estimates ............................ 10
III. Creating a Bright Economic FutureIII–1. Finishing the Job: Balancing the Budget after Decades of Deficits .................... 22III–2. Reducing the Deficit: The Clinton Record .............................................................. 23III–3. Debt Held by the Public .......................................................................................... 24III–4. 1997 General Government Deficits ......................................................................... 24III–5. Change in Structural Deficit as a Percent of Potential GDP ............................... 26III–6. Misery Index ............................................................................................................. 27III–7. Budget Surplus(+)/Deficit(–) .................................................................................... 30III–8. Changes in the Estimates of the Budget Deficit ................................................... 30
IV. Improving Performance Through Better ManagementIV–1. Actual Civilian Employment in the Executive Branch, 1965–1997 ..................... 34IV–2. Projected Civilian FTE Changes on a Percent Basis, 1993–1999 ........................ 35
V. Preparing For the 21st CenturySupporting Working Families:
2–1. One Million Head Start Opportunities by 2002 .................................................... 63Protecting the Environment:
4–1. Major Progress in Superfund Cleanups ................................................................. 83Promoting Research:
6–1. Research Fund for America ..................................................................................... 94Enforcing the Law:
7–1. Discretionary Anti-Crime Budget History ............................................................. 1067–2. Immigration and Naturalization Service Border Patrol and Land Border In-
spection Staffing ................................................................................................... 111Supporting the World’s Strongest Military Force:
10–1. Possible Military Operations ................................................................................... 134
VI. Investing in the Common Good: Program Performance in Federal FunctionsNatural Resources and Environment:
16–1. Federal Land Management by Agency ................................................................... 17416–2. Air Quality Trends ................................................................................................... 177
Agriculture:17–1. Production Flexibility Contract Payments Exceed Projected Deficiency Pay-
ments ..................................................................................................................... 18317–2. U.S. Agricultural Export Profile and Trade Surplus ............................................ 184
372 THE BUDGET FOR FISCAL YEAR 1999
LIST OF CHARTS—Continued
Page
Social Security:25–1. OASDI: Covered Workers to Beneficiaries ............................................................. 231
Veterans Benefits and Services:26–1. Estimated Veteran Population ................................................................................ 234
Administration of Justice:27–1. Administration of Justice Expenditures ................................................................. 24027–2. Federal Justice Expenditures ................................................................................. 241
Net Interest:29–1. Net Interest .............................................................................................................. 250
LIST OF TABLES
Page
I. The Budget Message of the PresidentI–1. Receipts, Outlays, and Surplus or Deficit .............................................................. 2
II. Preparing the Nation for a New American CenturyII–1. Receipts, Outlays, and Surplus or Deficit .............................................................. 10
III. Creating a Bright Economic FutureIII–1. Economic Assumptions ............................................................................................ 29
IV. Improving Performance Through Better ManagementIV–1. High Impact Agencies ............................................................................................. 36IV–2. Priority Management Objectives ............................................................................ 37IV–3. Financial Statement Performance Goals ............................................................... 39IV–4. Program Performance Benefits From Major Information Technology Invest-
ments ..................................................................................................................... 40IV–5. Priorities of Inter-Agency Working Groups ........................................................... 46
V. Preparing For the 21st CenturyInvesting in Education and Training:
1–1. The Budget Increases Resources for Major Education and Training Programsby $11.6 Billion, or 32 Percent over 1998, and by a Total Increase over 1993of 81 Percent ......................................................................................................... 53
Supporting Working Families:2–1. $21 Billion Over Five Years in New Resources for Child Care ........................... 622–2. $270 Billion Over Five Years in Support for Families with Children ................ 66
Protecting the Environment:4–1. Environmental/Natural Resources High-Priority Programs ................................ 81
Investing in Infrastructure:5–1. Average Annual Transportation Infrastructure Investment ................................ 865–2. Federal Aviation Administration Modernization and Operations Funding ........ 89
Promoting Research:6–1. Research Fund for America .................................................................................... 95
373LIST OF CHARTS AND TABLES
LIST OF TABLES—Continued
Page
6–2. Climate Change Technology Initiative (Agencies) ................................................ 966–3. Climate Change Technology Initiative (Sectors) ................................................... 976–4. Research and Development Investments ............................................................... 996–5. Selected Program Highlights .................................................................................. 100
Enforcing the Law:7–1. Violent Crime Reduction Program Spending By Function ................................... 1077–2. Immigration and Naturalization Service Funding by Program ........................... 1107–3. Drug Control Funding ............................................................................................. 112
Strengthening the American Community:8–1. Government-Wide Native American Program Funding ....................................... 121
Advancing United States Leadership in the World:9–1. International Discretionary Programs ................................................................... 126
Supporting the World’s Strongest Military Force:10–1. Military Force Trends .............................................................................................. 135
VI. Investing in the Common Good: Program Performance in Federal FunctionsOverview:
11–1. Federal Resources by Function ............................................................................... 144National Defense:
12–1. Federal Resources in Support of National Defense .............................................. 14912–2. Accruing VA Benefits for Current Military Personnel ......................................... 154
International Affairs:13–1. Federal Resources in Support of International Affairs ........................................ 155
General Science, Space, and Technology:14–1. Federal Resources in Support of General Science, Space, and Technology ........ 161
Energy:15–1. Federal Resources in Support of Energy ............................................................... 167
Natural Resources and Environment:16–1. Federal Resources in Support of Natural Resources and Environment ............. 173
Agriculture:17–1. Federal Resources in Support of Agriculture ........................................................ 181
Commerce and Housing Credit18–1. Federal Resources in Support of Commerce and Housing Credit ....................... 18718–2. Selected Federal Commerce and Housing Credit Programs: Credit Programs
Portfolio Characteristics ...................................................................................... 188Transportation:
19–1. Federal Resources in Support of Transportation .................................................. 193Community and Regional Development:
20–1. Federal Resources in Support of Community and Regional Development ......... 199Education, Training, Employment and Social Services:
21–1. Federal Resources in Support of Education, Training, Employment, and SocialServices ................................................................................................................. 205
Health:22–1. Federal Resources in Support of Health ................................................................ 213
374 THE BUDGET FOR FISCAL YEAR 1999
LIST OF TABLES—Continued
Page
Medicare:23–1. Federal Resources in Support of Medicare ............................................................ 219
Income Security:24–1. Federal Resources in Support of Income Security ................................................ 223
Social Security:25–1. Federal Resources in Support of Social Security .................................................. 22925–2. Millions Benefit from Social Security .................................................................... 23025–3. Social Security Protects Older Americans from Poverty ...................................... 230
Veterans Benefits and Services:26–1. Federal Resources in Support of Veterans Benefits and Services ....................... 233
Administration of Justice:27–1. Federal Resources in Support of Administration of Justice ................................. 239
General Government:28–1. Federal Resources in Support of General Government ........................................ 245
Net Interest:29–1. Net interest .............................................................................................................. 249
Allowances:30–1. Allowances ................................................................................................................ 253
Undistributed Offsetting Receipts:31–1. Undistributed Offsetting Receipts .......................................................................... 255
Regulation: Costs and Benefits:32–1. Estimates of the Total Annual Benefits and Costs of Regulations for 1997 ...... 258
Detailed Functional Tables:33–1. Budget Authority by Function, Category and Program ....................................... 26133–2. Outlays by Function, Category and Program ........................................................ 29233–3. Direct and Guaranteed Loans by Function ........................................................... 32433–4. Tax Expenditures by Function ............................................................................... 330
VII. Summary Tables1999 Budget Proposals:
S–1. Outlays and Receipts ............................................................................................... 341S–2. Summary of Budget Proposals ............................................................................... 342S–3. Discretionary Spending Caps and Budget Proposals ............................................ 343S–4. Funds for America Proposal ................................................................................... 344S–5. Pay-as-you-go Proposals .......................................................................................... 348S–6. Effect of Proposals on Receipts ............................................................................... 351S–7. Tobacco Legislation .................................................................................................. 354S–8. Discretionary Proposals by Appropriations Subcommittee .................................. 355
Summaries by Agency:S–9. Discretionary Budget Authority by Agency ........................................................... 359
S–10. Discretionary Outlays by Agency ........................................................................... 360S–11. Budget Authority by Agency ................................................................................... 361S–12. Outlays by Agency ................................................................................................... 362
375LIST OF CHARTS AND TABLES
LIST OF TABLES—Continued
Page
Other Summary Tables:S–13. Receipts by Source—Summary ............................................................................... 365S–14. Federal Employment in the Executive Branch ..................................................... 366S–15. Federal Government Financing and Debt ............................................................. 367S–16. Comparison of Economic Assumptions .................................................................. 368
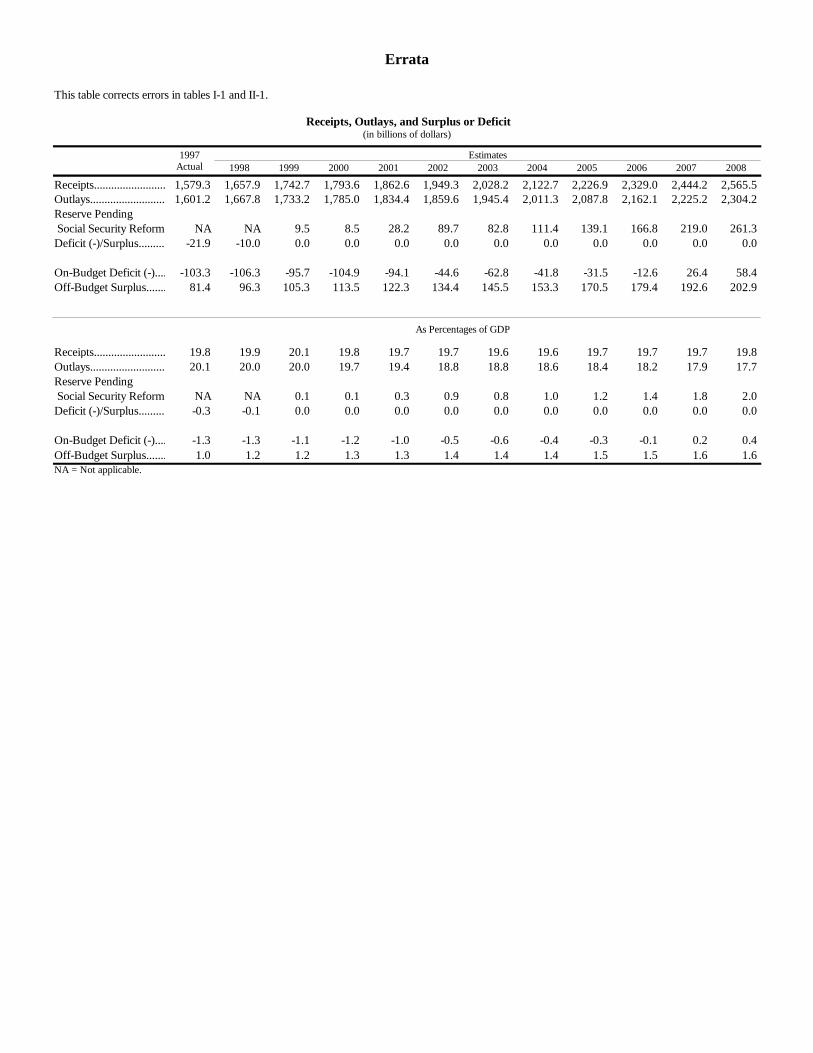
Errata
This table corrects errors in tables I-1 and II-1.
Receipts, Outlays, and Surplus or Deficit(in billions of dollars)
1997 EstimatesActual 1998 1999 2000 2001 2002 2003 2004 2005 2006 2007 2008
Receipts...........................................................................................1,579.3 1,657.9 1,742.7 1,793.6 1,862.6 1,949.3 2,028.2 2,122.7 2,226.9 2,329.0 2,444.2 2,565.5Outlays...........................................................................................1,601.2 1,667.8 1,733.2 1,785.0 1,834.4 1,859.6 1,945.4 2,011.3 2,087.8 2,162.1 2,225.2 2,304.2Reserve Pending Social Security Reform...........................................................................................NA NA 9.5 8.5 28.2 89.7 82.8 111.4 139.1 166.8 219.0 261.3Deficit (-)/Surplus...........................................................................................-21.9 -10.0 0.0 0.0 0.0 0.0 0.0 0.0 0.0 0.0 0.0 0.0
On-Budget Deficit (-)...........................................................................................-103.3 -106.3 -95.7 -104.9 -94.1 -44.6 -62.8 -41.8 -31.5 -12.6 26.4 58.4Off-Budget Surplus...........................................................................................81.4 96.3 105.3 113.5 122.3 134.4 145.5 153.3 170.5 179.4 192.6 202.9
As Percentages of GDP
Receipts...........................................................................................19.8 19.9 20.1 19.8 19.7 19.7 19.6 19.6 19.7 19.7 19.7 19.8Outlays...........................................................................................20.1 20.0 20.0 19.7 19.4 18.8 18.8 18.6 18.4 18.2 17.9 17.7Reserve Pending Social Security Reform...........................................................................................NA NA 0.1 0.1 0.3 0.9 0.8 1.0 1.2 1.4 1.8 2.0Deficit (-)/Surplus...........................................................................................-0.3 -0.1 0.0 0.0 0.0 0.0 0.0 0.0 0.0 0.0 0.0 0.0
On-Budget Deficit (-)...........................................................................................-1.3 -1.3 -1.1 -1.2 -1.0 -0.5 -0.6 -0.4 -0.3 -0.1 0.2 0.4Off-Budget Surplus...........................................................................................1.0 1.2 1.2 1.3 1.3 1.4 1.4 1.4 1.5 1.5 1.6 1.6NA = Not applicable.