Embed Size (px)
Citation preview
- ~ “nj
BUCKLING OF CONICAL SHELLS UNDER AXIAL COMPRESSION
by Johann Arbocz
Prepared by CALIFORNIA INSTITUTE OF TECHNOLOGY Pasadena, Calif.
for
N A T I O N A L A E R O N A U T I C S A N D S P A C E A D M I N I S T R A T I O N W A S H I N G T O N , D. C. SEPTEMBER 1968
IC-
NASA CR- 1162 TECH LIBRARY KAFB, NM
/ BUCKLING O F CONICAL SHELLS
UNDER AXIAL COMPRESSION ". ~
By Johann Arbocz _/
Distribution of this report is provided in the interest of information exchange. Responsibility for the contents resides in the author or organization that prepared it.
/Prepared under Grant No. NsG-18-59 by CALIFORNIA INST,- OF T E C V
Pasadena, Calif.
for
NATIONAL AERONAUTICS AND SPACE ADMINISTRATION
For sale by the Clearinghouse for Federal Scientific and Technical Information Springfield, Virginia 22151 - CFSTI price $3.00

ACKNOWLEDGMENT
The author wishes to express his sincere appreciation to
Dr . E. E. Sechler for his guidance of the work carried out in this
investigation. The advice and suggestions of o ther members of the
Department of Aeronautics, especially of Dr . C. D. Babcock is also
appreciated.
The help of Miss Helen Burrus for typing and Mrs.
Betty Wood with the graphs and figures was very much appreciated.
This study was supported by the National Aeronautics and
Space Administration under Research Grant NsG 59-18 and this aid
is gratefully acknowledged.
iii


TABLE OFCONTENTS
Page
ABSTRACT
INTRODUCTION
FABRICATION O F THE TEST SPECIMENS
A. Wal l Thickness
B. Mater ia l Proper t ies
TEST PROCEDURE
A. Buckling Procedure
B. Ini t ia l Imperfect ion Measurements
TEST RESULTS
' 'Perfect" Conical Shells
"Imperfect" Conical Shells
CONCLUSION
REFERENCES
TABLES
FIGURES
1
1
2
3
4
5
6 7
8
8
1 1
12
13
14
22
V
LIST O F FIGURES
Figure
1
2
3
4
5
6 7
8
9 10
11
12
13
14
15
16
17
18
19
20
21
22
23
Completed Test Specimen
Plating Installation
Thickness Distribution along the Generator of
Conical Shells
Thickness Distribution along the Generator of
Conical Shells
Thickness Distribution along the Generator of
Conical Shells
Stress Strain Curve for Plated Copper
Testing Machine
Details of Testing Machine Loading Screw
Load Cell
Conical Shell Testing Configuration
Init ial Imperfection Measuring Equipment
Init ial Imperfection Measuring Equipment in .
Position on a Cone
Shell 5A7 Load Distribution
Shell 10A6 Load Distribution
Shell 15A1 Load Distribution
Shell 20A4 Load Distribution
Shell 25A11 Load Distribution
Load Distribution near Buckling (Shells 5A5,
5A6, 5A7)
Load Distribution near Buckling (Shells 1OA1,
1 OA3 , 1 OA6)
Load Distribution near Buckling (Shells 15A1,
15A3, 15A6)
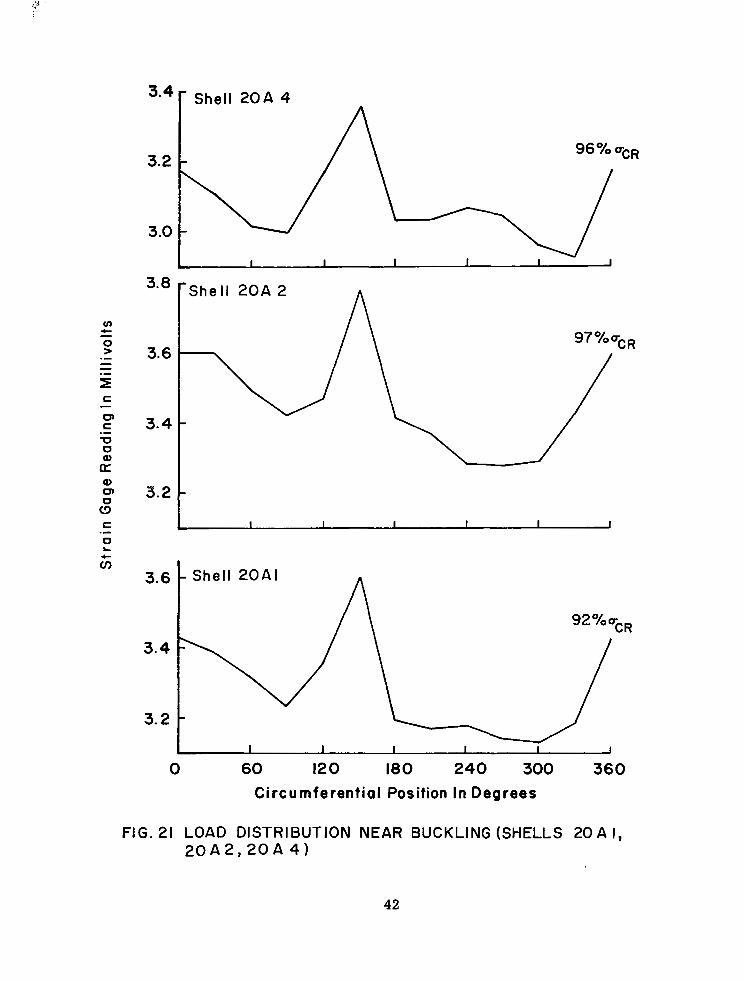
Load Distribution near Buckling (Shells 20A1,
2 OA2 , 2 OA4)
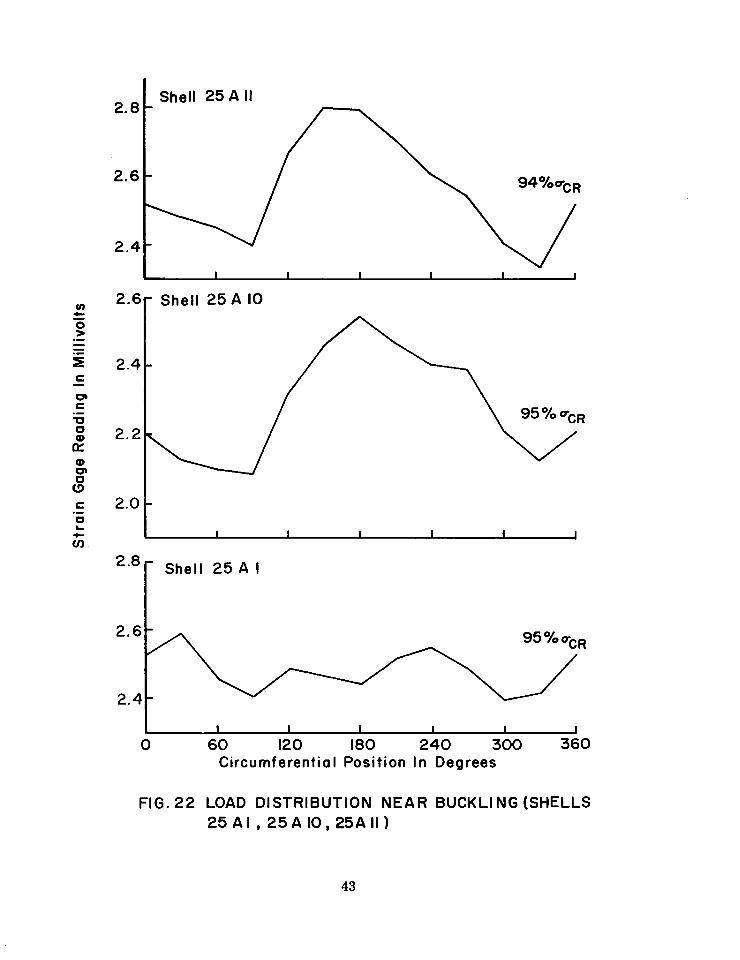
Load Distribution near Buckling (Shells 25A.1,
25A10, 25A11)
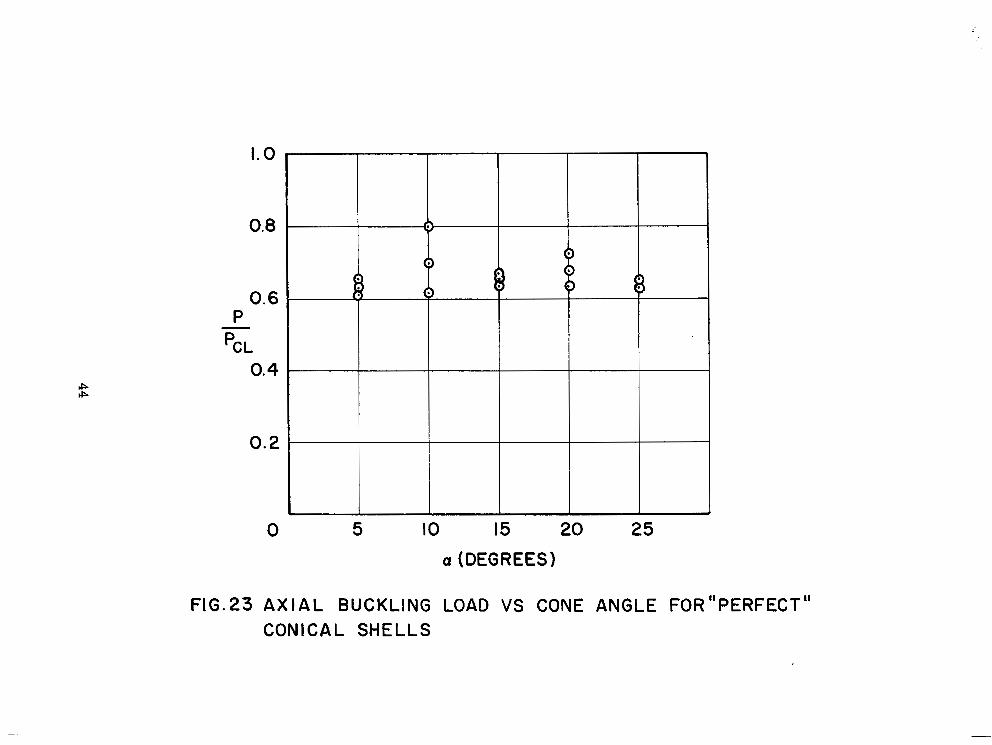
Axial Buckling Load vs Cone Angle for "Perfect"
Conical Shells
Page
22
23
24
25
26
27
28
29 30
31
32
33
34
35
' 36 37
38
39
40
41
42
43
44
vi
LIST O F FIGURES (Cont'd)
Figure
24
25
26
27
28
29 3 0
3 1
Page
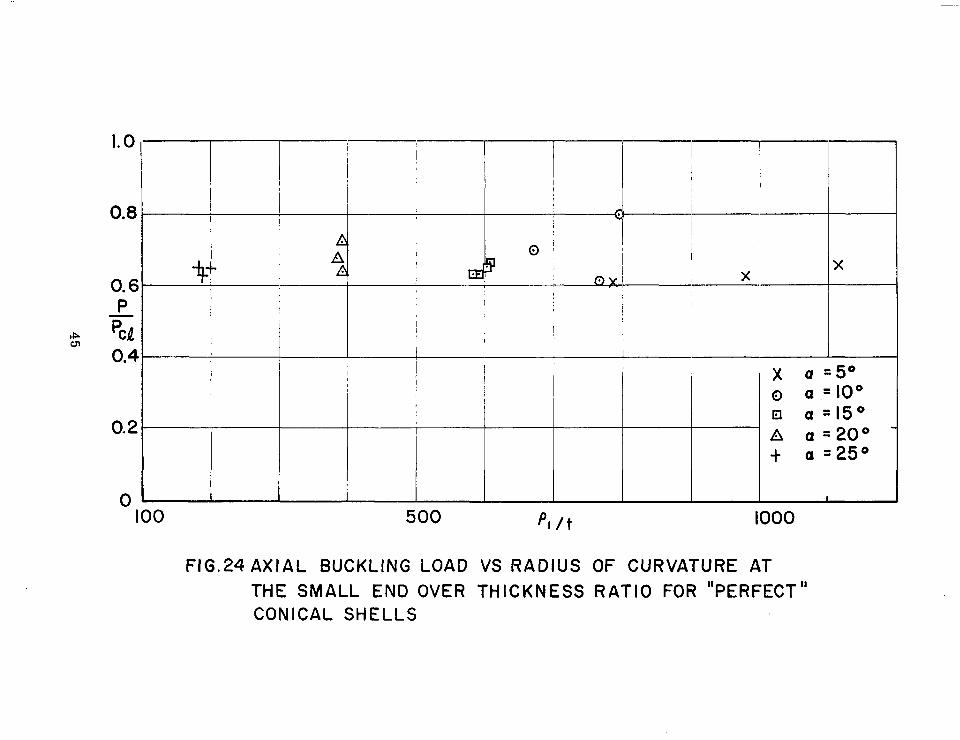
Axial Buckling Load vs Radius of Curvature at 45
the Small End over Thickness Ratio for "Perfect1'
Conical Shells
Comparison of Axial Buckling Load of Conical 46
Shells with Lower Bound Curve f o r Cylinders
Amplitude of the Initial Imperfection vs Buckling 47
Load
Shell 201 1 Initial Imperfection 48
Shell 2012 Initial Imperfection 49
Shell 2 0 13 Initial Imperfection 50
Axial Buckling Load vs Cone Angle f o r "Imperfect" 51
Conical Shells
Axial Buckling Load vs Radius of Curvature at the 52
Small End over Thickness Ratio for ttIrnperfectll
Conical Shells
vii
LIST O F TABLES
Table
I Thickness Distribution along the Generator
of the Cones
I1 Young's Modulus Tests for Plated Copper
I1 I Summary of Buckling Tests on "Perfect"
Conical Shells
IV Summary of Buckling Tests on "Imperfect"
Conical Shells
Page
14
16 18
2 0
v i i i
E
t
v
p 1
a
m
h
R1
LIST O F SYMBOLS
Young's Modulus
Shell thicknes s
Poisson 's ra t io
Radius of curvature at the small end of the cone
Semivertex angle of the cone
Circumferential wave number
Height of the truncated cone
Base radius a t the small end
ix
BUCKLING O F CONICAL SHELLS
UNDER AXIAL COMPRESSION
By Johann Arbocz
California Institute of Technology
ABSTRACT
An experimental investigation of the effect of the cone semi-
vertex angle a on the buckling load of a conical shell under axial
compression was carried out. The effect of a specific type of initial
imperfection was also investigated. The imperfection studied was
axial ly symmetr ic in shape.
The experiments were carried out with shells fabricated by a
copper e lectroforming process . The shel ls had no longitudinal seams.
Final results showed that the dependence of the buckling load on
the semivertex angle Q is adequately represented by the l inearized
theory. Also the upper bound to the experimental results of the cones
with known axisymmetric initial imperfections agreed well with previ-
ously published analytical values.
INTRODUCTION
The stability of conical shells under axial compression has been
studied in the past both theoretically and experimentally by several
investigators. Their work showed the same serious disagreement
between the experimental data and the results predicted by the small
deflection theories of buckling for conical shells as has been encountered
previously for cylindrical shells. Among the factors advanced for the
explanation of this discrepancy were the extreme sensi t ivi ty of the load
carrying capacity of shel ls toward ini t ia l imperfect ions of the o rder of a
fract ion of the wall thickness, the nonuniformity of loading around the
shell circumference, the influence of boundary conditions, the effect of
the prebuckling deformations due to edge constraints and nuclei of plast ic
s t ra in .
The purpose of the t e s t s e r i e s r epor t ed i n t h i s pape r was t o keep
the effect of the above factors and all but one of the shel l parameters
involved in the stability analysis constant and to investigate the depend-
ence of the buckling load on the remaining free parameter. Thus, in
the first part, the dependence of the buckling load on the cone semi-
ver tex angle (Y was studied, whereas in the second part the effect on the
buckling load of an ini t ia l axisymmetr ic imperfect ion of known shape
was investigated.
FABRICATION OF THE TEST SPECIMENS
The conical shells used for this testing program were fabricated
by electroforming on wax mandrels . This process was used previously
for the fabrication of cylindrical shells (Ref. 1).
About an inch thick layer of wax was first cast on water cooled
mandrels having the proper cone angle. The wax used was a two to one
mixture of refined paraffin and Mobile Cerese Wax 2305. This wax was
used because it had been shown by previous work with cylindrical shells
that it could be cast free of air bubbles and that it had the proper
machining characterist ics. After the wax had hardened it was machined
to the shape of the shell desired. A pivot type lathe tracer at tachment
made by the True Trace Corporat ion was used on a standard lathe to
machine both the init ially perfect conical mandrels and the conical
mandrels with an ini t ia l axisymmetr ic imperfect ion. After the desired
form was obtained the wax was spray painted with a silver paint thinned
with Tolune. Since the plate at the top of the mandrel was used to c a r r y
the e lectr ical current to the surface of the wax form, the paint had to
cover this plate.
The plating was carried out in a Copper Fluoborate bath.
Because of the previous experience with electroforming cylindrical
shells, copper was retained as the plating material . Also it has been
shown that of all the mater ia ls sui ted for this type of experimental work,
copper has the lowest internal stresses developed during the plating
process (Ref . 1). Control of the plating process consisted of a P H
measurement with calor imetr ic paper to control the acid content and a
2
densi ty measurement to control the copper concentrat ion. During the
plating, the bath was agitated both by the rotating cathode and by forced
air. The anodes were bagged with a Dyne1 fabric to collect the anode
sludge that would otherwise accumulate in the tank. Also the plating
solution was continuously f i l tered during the plating process. Occasion-
a l ly the bath was t reated with act ivated charcoal to remove organic
impurities that could cause a rough brit t le plate if not removed. A
s tandard t ransformer rec t i f ie r and powers ta t was used to g ive a uni-
formly var ied current up to 130 amps. At full power the current density
was about 55 amps per square foot. The plating t ime was approximately
20 minutes per 0. 001 inches of plate. The plating was carried out at
room temperature. The conical mandrels were rotated during the
plating so as to assure c i rcumferent ia l uniformity of plating of the
finished shell . Figure 2 shows the plating installation.
A.fter the plating was completed, the mandrel was rinsed thor-
oughly and the shell cut to the desired length while it was still on the
mandrel . In order to keep the large end radius constant extreme care
had to be observed for proper placement of these cuts . This was
accomplished by referring the initial cut to a premachined surface on
the upper plate of the mandrel. After the cutting operation the shells
were then removed f rom the mandrel by mel t ing out the wax. This was
accomplished by pouring hot wax over the shell so a s to melt a thin
layer of wax directly under the surface. Then the mandrel was immersed
in a bath of hot wax. The excess wax and silver paint was removed from
the finished shells with benzene. Figure 1 shows a completed test shell .
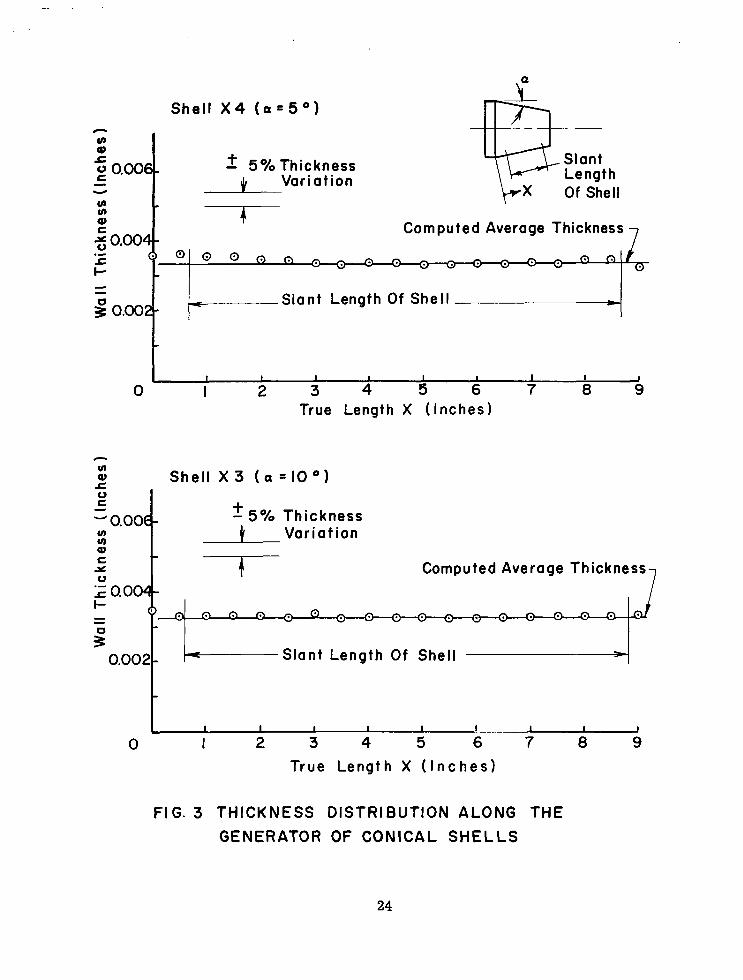
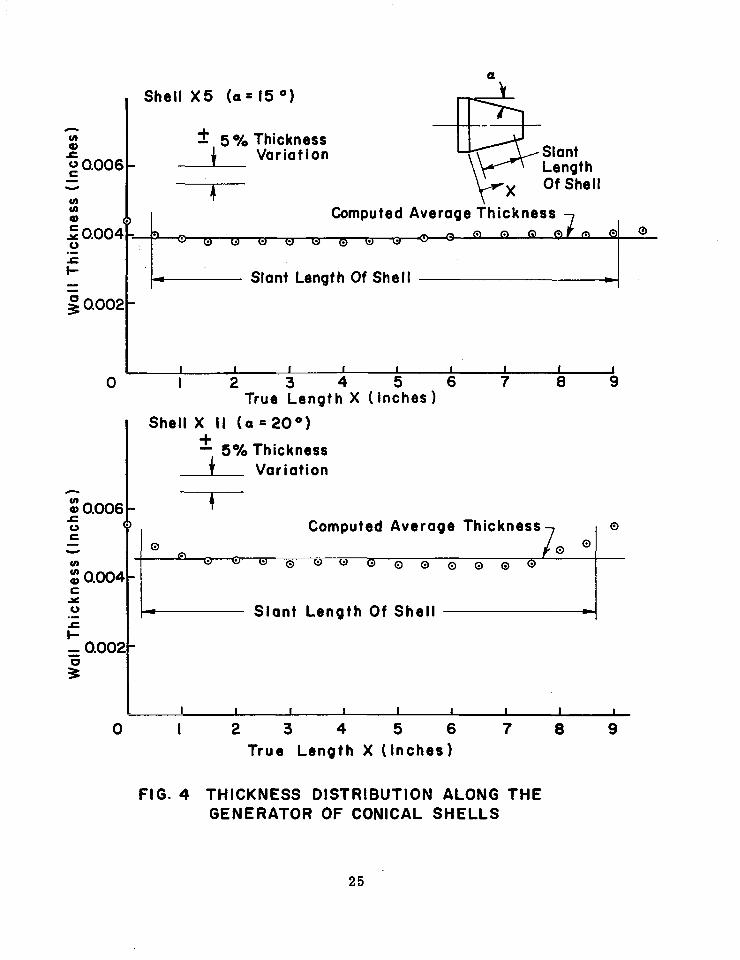
A. Wall Thickness
When switching from cylindrical to conical shells considerable
difficulty was encountered in trying to obtain a uniform thickness dis t r i -
bution along the generator of the conical shells. It was found that the
plate tended to build up to a greater thickness towards the ends of the
mandrel . This was especial ly severe for cones with semivertex angle
cy = 20° and ff = 25 . This problem has been solved by placing the ,
anodes properly inclined in the plating bath. By this method the thickness
0
3
variation was kept to - + 5 per cent of its nominal value. This compares
very favorably with the values published in reference 2 where thickness
variations up to - + 15 per cent of the nominal values were reported.
The average thickness of the tes t shel ls was determined before
the buckling test by weighing the shells. The specific gravity used in
the calculation of thickness was 8 . 9 . The thickness variation along the generator of the cones was
checked initially by cutting strips out of the first test specimens and
determining their th ickness by an opt ical comparator . Table I and Fig.
3 through 5 show some typical measurements of thickness distribution.
B. Mater ia l Proper t ies
Initially it was found that the plated copper had a very low yield
point. This was quite undesirable from the buckling part of the experi-
ment , especial ly a t h igher semivertex angles where the s t resses c lose
to the smaller end would exceed the yield strength of the mater ia l before
elastic buckling could occur. It was found that the adding of about 10 cc
of New Orleans black s t rap molasses per gal lon of plating solution would
not only raise the modulus of elasticity of the plated copper from 13. 10 6
psi to about 15. 5. 10 psi but at the same t ime the yield strength of the
plated copper would also improve considerably.
6
Tests to determine the character is t ic of the plated copper were
carried out in uniaxial tension. This was done by uti l izing long strips
of the plated copper which were soldered into 1 /8 inch thick plates that
were in turn clamped into the jaws of an Instron tes t ing machine. The
strips were cut from the upper straight portion of the conical mandrels.
The strips had length to width ratios of about 80. The head displace-
ment of the testing machine was used as the measure of strain and the
load read from the Instron load cell . A- typ ica l s t ress -s t ra in curve i s
shown in Fig. 6. The resul ts of the tes ts are shown in Table 11.
A determination of Poisson 's ra t io for each shel l was not
attempted since its influence in the reduction of the buckling data is of
secondary importance. A value of 0 . 3 was used for this purpose.
4
TEST PROCEDURE
To carry out the buckling tests of conical shells a controlled
end-displacement type testing machine was designed (see Fig. 7) . By
the use of matched pa i r s of high precision thrust bearings the axial
elastic displacement under load of the testing machine was kept to a
minimum thus making the testing machine r igid in comparison with the
tes t specimen. The re la t ive displacement of the two end plates of the
testing machine was controlled by four loading screws, which could be
adjusted independently to give the proper load distribution on the shell,
o r s imul taneous ly to increase the load up to the crit ical value. One
complete turn of the screws gave a displacement of 0 .025 inches.
Figure 8 shows the details of these displacement controll ing screws.
The springs shown in Fig. 7 were used to preload the testing machine
when installing the test specimen in the machine and securing it to the
upper end plate of the testing machine. The testing was carried out
when the machine was in the position shown in Fig. 7. The end plate
with the gear drive rested on pins and the opposite end rested on a se t
of ro l le rs . By this arrangement the f r ic t ional torque produced when
turning the gears was t ransmit ted through the pins into the base plate
on which the testing machine rested, and the test specimen was loaded
by axial compression only.
During the buckling tests the load distribution was monitored
and the total load was obtained by means of the load cell shown in Fig.
9. It consisted of a seamless , e lectroformed copper cyl inder which
was 0. 015 inches thick, 3 .00 inches long and 8 .000 inches in diameter.
Twenty-four foil type strain gages were mounted on the cylinder equally
spaced around the circumference. The ones on the inside were directly
opposite to those on the outside. The difficulty of adequate end support
for the cones with different semivertex angles was solved by providing
the upper ring on the load cell, which acts as a mount for the tes t speci-
men, with a removable inser t . Thus all the cones with different
semivertex angle could be installed into the same load cell by simply
using the proper inser t . However , in order to support the upper end of
5
the conical shells, a different end ring was used for every cone semi-
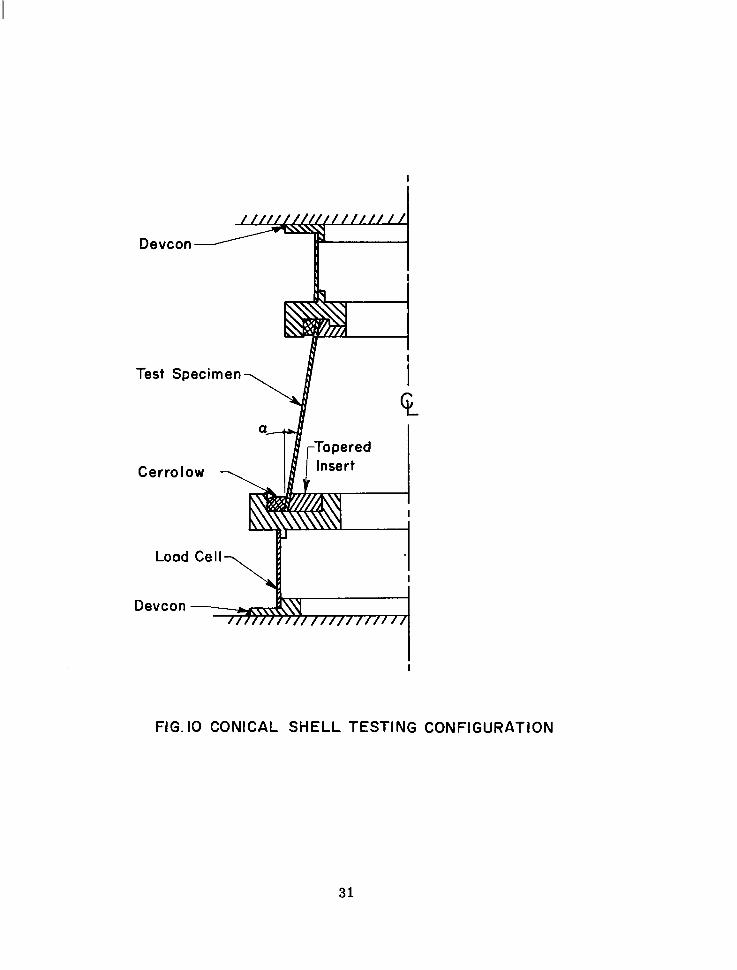
vertex angle. The load cell was secured to the end-plate of the testing
machine with a thin layer of Devcon. Devcon is a plast ic- l ike mater ia l
in a putty state which hardens in several hours after the addition of a
hardening agent. Finally the test shell was cast with the low melting
point alloy Cerrolow into an end ring and its other end was secured to
the load cell in the same manner. After this operation was completed
the end ring was secured to the upper end plate by a thin layer of
Devcon. Upon hardening of the Devcon the cone was ready for testing.
Figure 10 shows the complete conical shell testing configuration. It
has been shown in reference 1 tha t the s t ra in measured by th i s type of
arrangement represented very accurately the actual s t ra in in the tes t
shell .
Before carrying out the buckling tests the gages on the load-cell
were connected to a 24 channel bridge box which contained 24 Wheatstone
br idge c i rcui ts . In order to minimize the effect of temperature changes
an additional 24 strain gages were installed on a dummy cylinder and
connected to the same bridge box where they formed one of the branches
of the individual Wheatstone bridge circuits. The initial zero reading
could be adjusted individually through differential shunt balances. The
output of the bridge was monitored by a Cimron Digital Voltmeter. By
using the Data Control Unit connected between the bridge and the digital
voltmeter the readings of the 24 strain gages were recorded automatically
by means of an IBM card punch. The total compressive load in the load
cell was computed by averaging the readings of all gages and using a
previously determined calibration factor. The calibration of the load-
cell was carried out using a very accurate Schaevitz dynamometer-type
load ring.
A. Buckling Procedure
The buckling tests were carried out in the following manner.
The conical shells were init ially loaded to about one-sixth of the expected
buckling load and the circumferential load distribution was made as
uniform as possible by individually adjusting the four loading screws of
6
the testing machine. The load was then increased in small increments
by turning the four loading screws simultaneously. A.fter each increase
the load distribution was adjusted again. This was carried out up to
about two-tliirds of the expected buckling load. After this point the load
distribution was no longer adjusted so as to prevent buckling occurring .
during one of the adjustments. The load was increased in small incre-
ments and the strain gages monitored until buckling occurred.
B. Init ial Imperfection Measurements
In the tes t ser ies of imperfect conical shells the same form of
axisynmetr ic ini t ia l imperfect ion was machined into the conical
mandre ls by using the same template with the pivot type lathe tracer
attachment. The imperfection measurements on the cones already
installed in the testing machine were made with a reluctance type non-
contacting pick-up consisting of an iron core through which passed a
100.000 Hz signal. The impedance of the coil to this signal changes as
the electromagnetic f ield of the coil is disturbed by the eddy currents
generated in an external conducting surface. By determining the change
in impedance of the coil the position of the external surface relative to
the end of the pick-up could be measured quite accurately. The pick-up
signal was read on a Cimron digital voltmeter. The output of the pick-up
was about 1. 00 volt per 0. 001 inch with a working range of approximately
0. 150 inches. The noise level and drift were minimized so that a
deflection of 10 inches could be accurately read without making contact
with the measured surface.
- 4
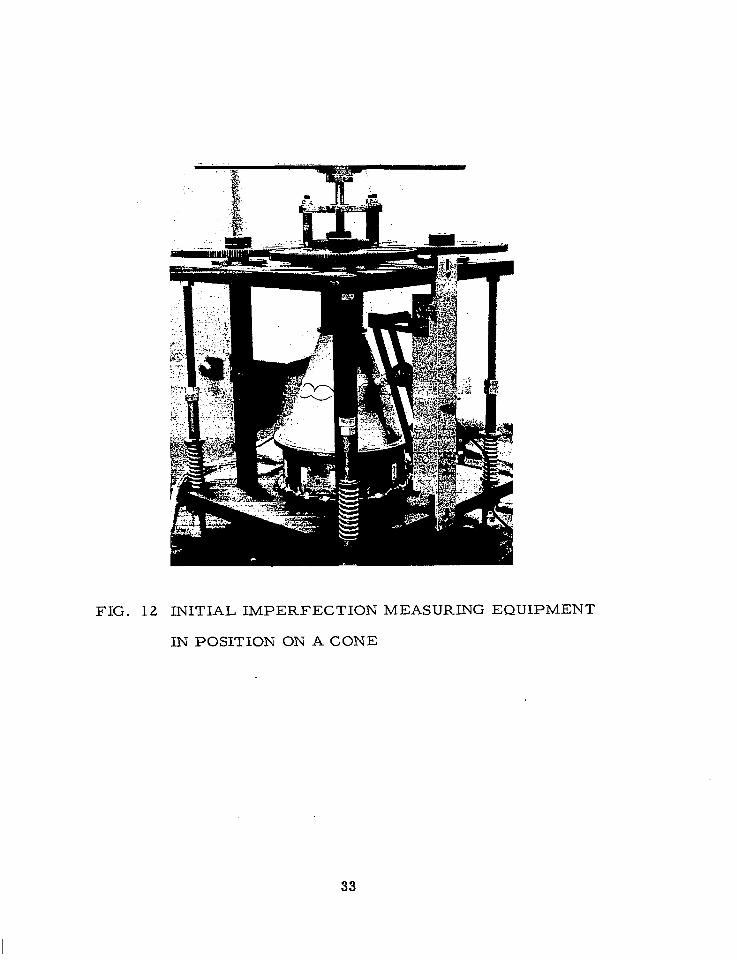
The measurements were carried out by mounting the sensing head
of the pick-up in a slide which traveled on an adjustable guide. The
guide was carefully lapped to insure that it was a s s t r a igh t a s poss ib l e .
Figure 11 shows the pick-up and the guide. The guide w a s attached to
the testing machine, its inclination adjusted so as to be parallel to the
surface of the cone to be measured and readings were taken at 25
stations along the generator. Thus in this series of tes ts the ini t ia l
imperfection that was measured was the deviation of the generator of
the she l l f rom a straight l ine. Figure 12 shows the initial imperfection
measuring equipment in position on a cone.
7
TEST RESULTS - "perfect" Conical Shells
Previously reported experimental investigations (Ref. 2 ) showed
that when compared with the results predicted by the l inearized, small
deflection theories of buckling the experimental values were much lower
and the data had a large scatter band. In the past decade the following
five factors found acceptance as an explanation of the discrepancy
between theory and experiments:
1. Initial geometrical imperfections of the o rder of a
fract ion of the wall thickness.
2. Nonuniformity of load distribution around the shell
c i rcumference.
3. Influeace of boundary conditions.
4. Effect of prebuckling deformation caused by edge
constraints .
5. Nuclei of plast ic s t ra in .
As noted in the introduction the purpose of these t es t se r ies was
to keep the effect of the above factors and all but one of the shell
parameters constant thus studying the dependence of the buckling load on
the remaining f ree parameter . By using electroformed copper shells
not only was the size of the init ial imperfections minimized but also
seamless t es t spec imens of great uniformity were obtained. W a l l thick-
ness was constant to within t 5 per cent and variations in the cone
geometry were less than 1 per cent. Also, by being able to adjust the
four loading screws individually, variation in the load distribution
around the circumference of the shell was kept to + 7 per cent. Since
all the cones were cast into end r ings with Cerrolow, and buckled
following exactly the same test procedure, hence we can expect equal
inf luence f rom i tems ( 3 ) , (4), and (5) on the final collapse load of each
individual shell.
-
-
For these t es t s the base rad ius R the height of the truncated
conical shells h and their wall thickness t were kept constant, while
the semivertex angle a of the cones was varied from 0 through 2 5 O .
Detailed results of the buckling tests for perfect conical shells are
summarized in Table 111. The buckling results for all those shells that
1'
8
had visible localized initial buckling were excluded from this list be-
cause there is every reason to bel ieve that all local bucklings were
caused by some pronounced localized defect in the test specimen.
These defects could have been caused during the removal of the shel l
from the wax mandrel or by the subsequent handling required for the
installation of the same in the testing machine. This local buckling
consisted of the formation of one o r more waves on the sur face of the
shell causing the load distribution to fall off in the neighborhood of
these waves without appreciably affecting the distribution over the rest
of the c i rcumference of the shell . After the init ial local buckling, the
load was increased unti l general collapse occurred without at tempting
to adjust the load distribution. General collapse occurred in the same
manner as for the cones that d id not have an ini t ia l local buckl ing, but
at lower values of axial loading.
General collapse consisted of a snap-through which is charac-
t e r i s t i c of this type of tes t . For all cases the postbuckling state
consisted of 2 to 3 rows of buckles that extended completely around the
circumference. The number of circumferential waves is noted in
Table 111. Closer to the smaller end seemed to be the preferred place
for the buckling to take place.
As stated in the previous section, the load distribution was
adjusted to be as uniform as possible with the four loading screws of
the testing machine. The adjustment was done by equalizing the strain
in the load cell at the 45O, 135O, 225O, and 315O positions. This
adjustment was not attempted after about 75 per cent of the expected
buckling load was obtained. Table 111 gives the maximum variation in
load distribution near buckling. The average m a x i m u m variation in
load distribution for all the shel ls tes ted was 13. 9 per cent. Figure 13
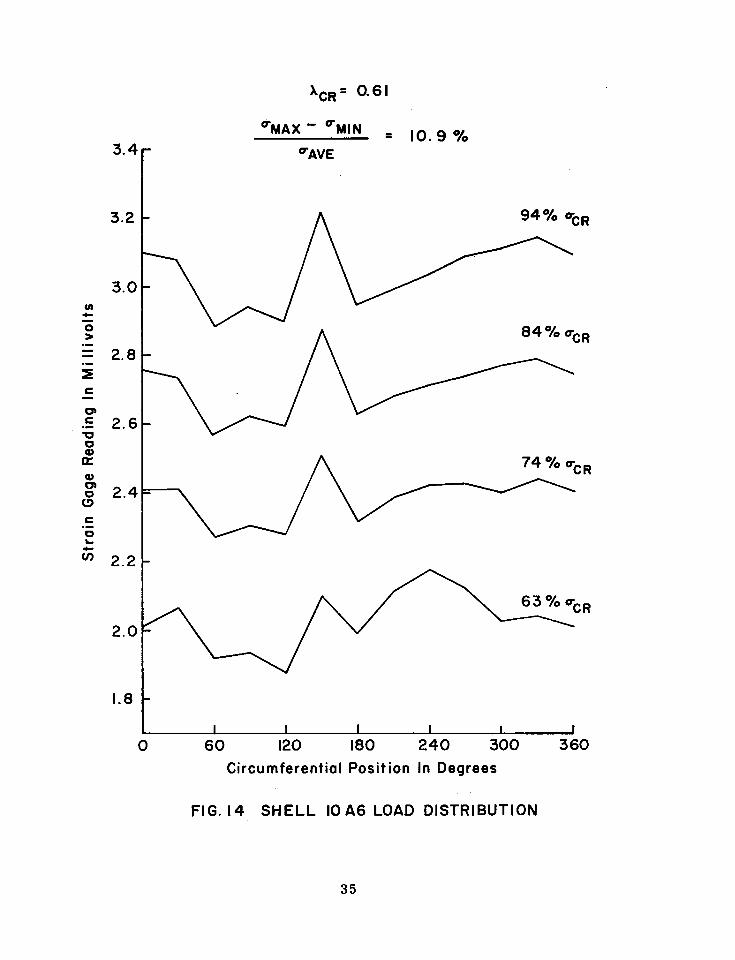
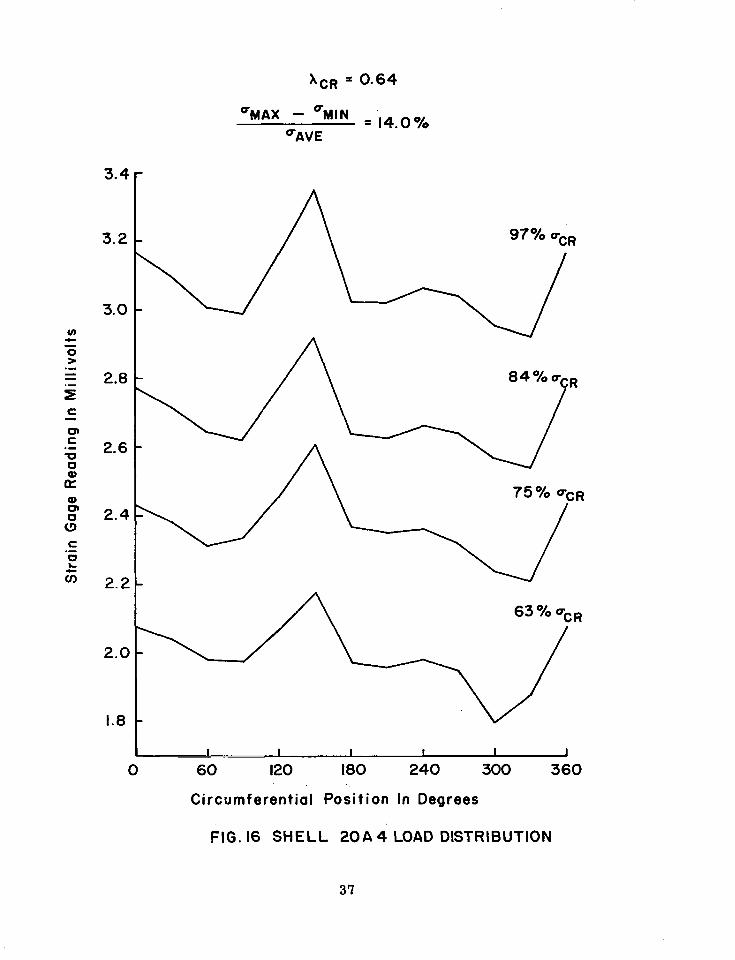
through 17 show typical load distributions as measured on the load cell .
Several distributions are given on these f igures as the load on the shell
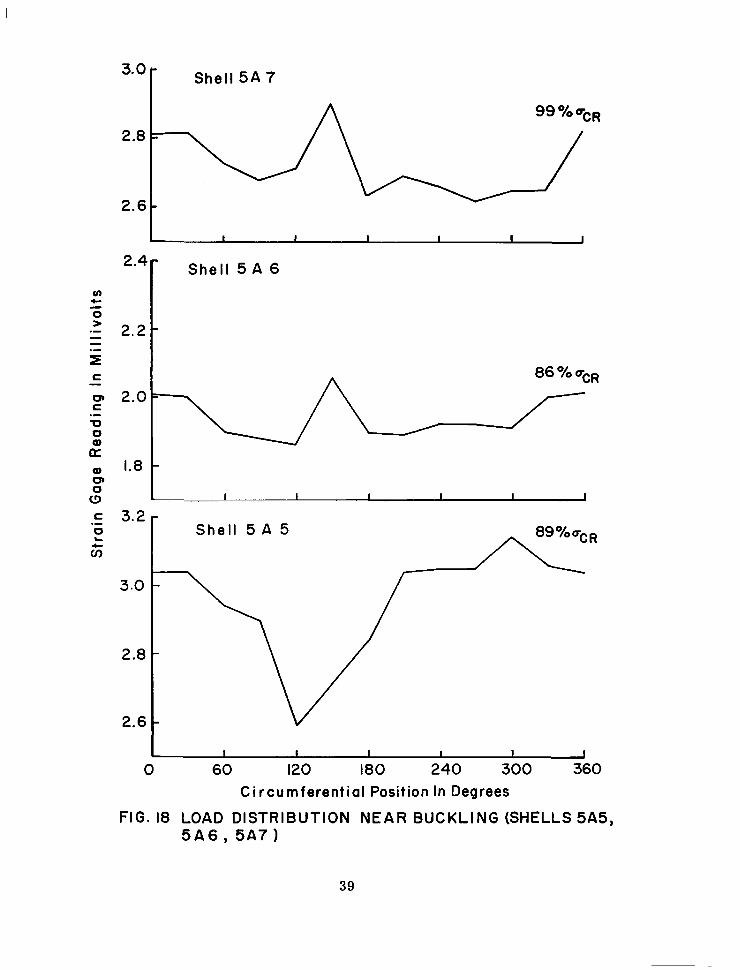
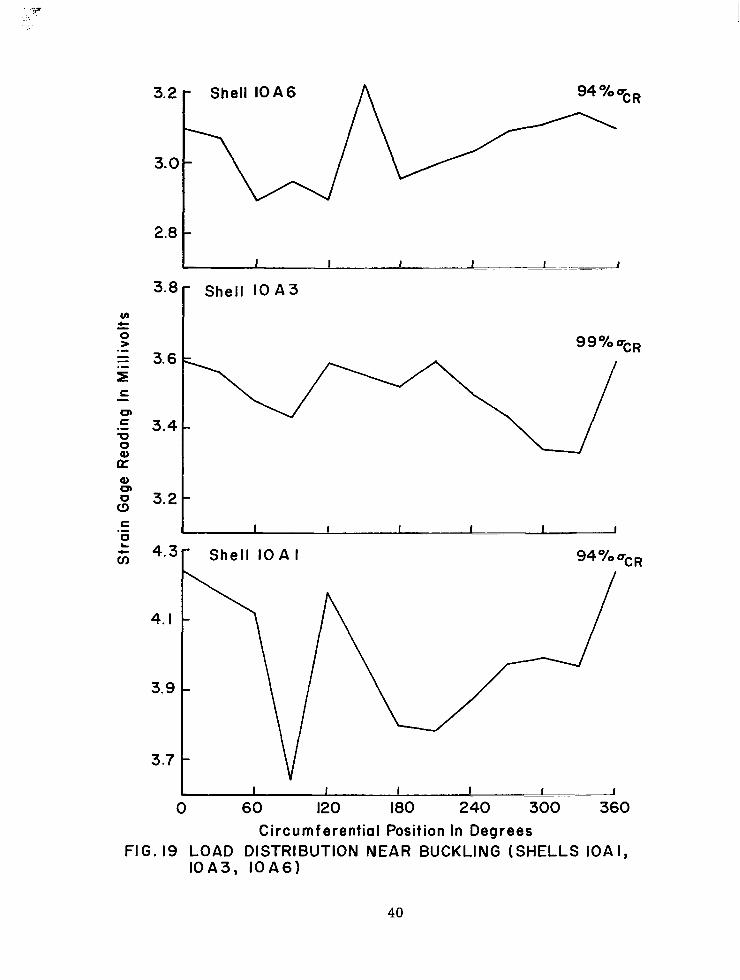
was increased. Figures 18 through 22 give the load distribution on the
shells at the last reading before buckling. It should be remarked here
that strain gage No 6 of the load cell turned out to be faulty which may
explain the consistently higher readings at the 150° position.
9
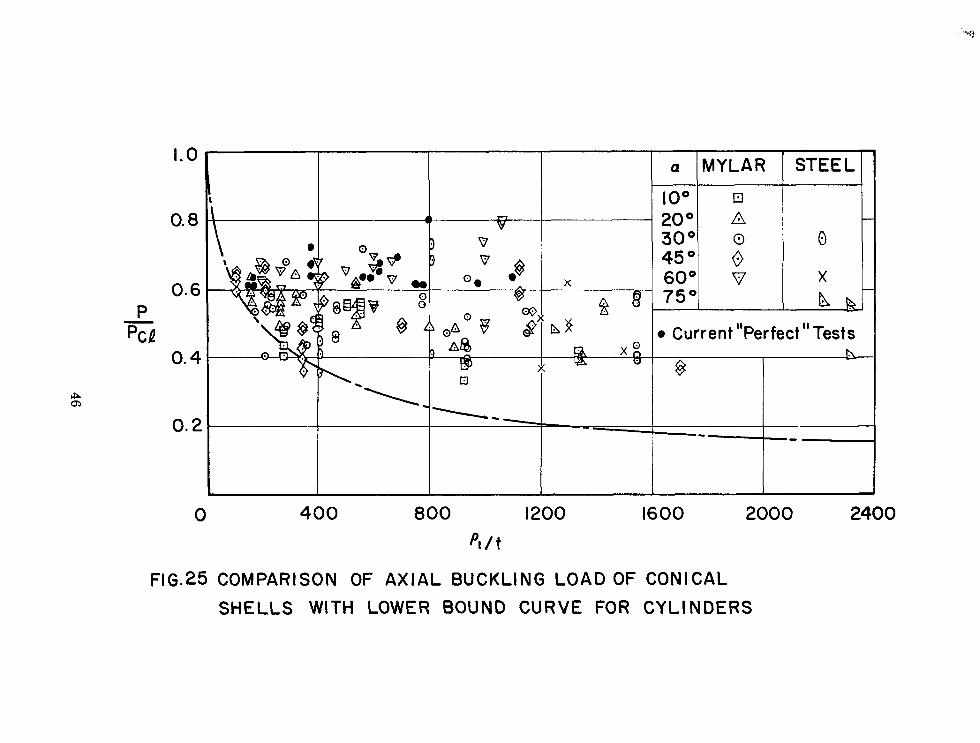
The f inal resul ts are summarized in Figs . 2 3 and 24 which show
the variations of P/Pc/ with cone semivertex angle (Y and with the
p /t ratio respectively. Both figures indicate that all of the shel ls
tested have a relatively small sca t te r band , mos t of the experimental
points lying between 0 .6 - 0.7. Also the lower bound of these experi-
mental values is considerably higher than those reported by other
investigators. For the sake of comparison, Fig. 25 shows a similar
plot reproduced from reference 2 , where the lower bound was about 0.33.
1
The reason for the high values of buckling load is not completely
understood, however they could be explained by the following items:
1. All of the cones had no seams. The effect of the seam on
the buckling load is an uninvestigated effect . In the tests carried out in
the past , it was usually assumed that i f the buckling did not appear to
initiate at the seam-, and the seam did not interfere with the postbuckling
s ta te then the seam had no effect. The validity of this assumption is not
known.
2. A l l of the cones had a thickness variation of t 5 per cent only
as compared to test specimens in reference 2 which had thickness varia-
tions of up to t 15 per cent.
-
- 3 . Variations in the circumferential load distribution were kept
to 13. 9 per cent. The influence of load distribution is actual ly a lso an
unknown factor. Very little data has been published on this aspec t of
buckling tests. The data that has been published by Babcock (Ref. l),
by Lo, Crate and Schwartz (Ref. 3 ) show a maximum variation of about
19 per cent.
4. All the cones tested were very sensitive to how their edges
were buil t into the end r ings. For satisfactory results the spacers had
to be fitted individually to every cone. If they were too tight or too
loose buckling would occur at very low values of axial loading.
5. Finally there is the effect of unwanted initial imperfections.
By the electroforming process and by extremely careful handling of the
finished test specimen it was possible to minimize the size of the un-
intended initial imperfections. No actual measurements were carr ied
out to determine their size so no comparison can be made with conical
shel ls tes ted in axial compression by other investigators.
10
TEST RESULTS - "imperfect" Conical Shells
As ment ioned ear l ier , the fact that the load carrying capaci ty
of cylinders was extremely sensit ive to init ial imperfections has found
acceptance as an explanation of the discrepancy between theory and
experiment. Recent work by several investigators (Refs. 2 and 4) have
shown that there exists the same discrepancy between theoretical and
experimental values when considering conical shells under axial
compression.
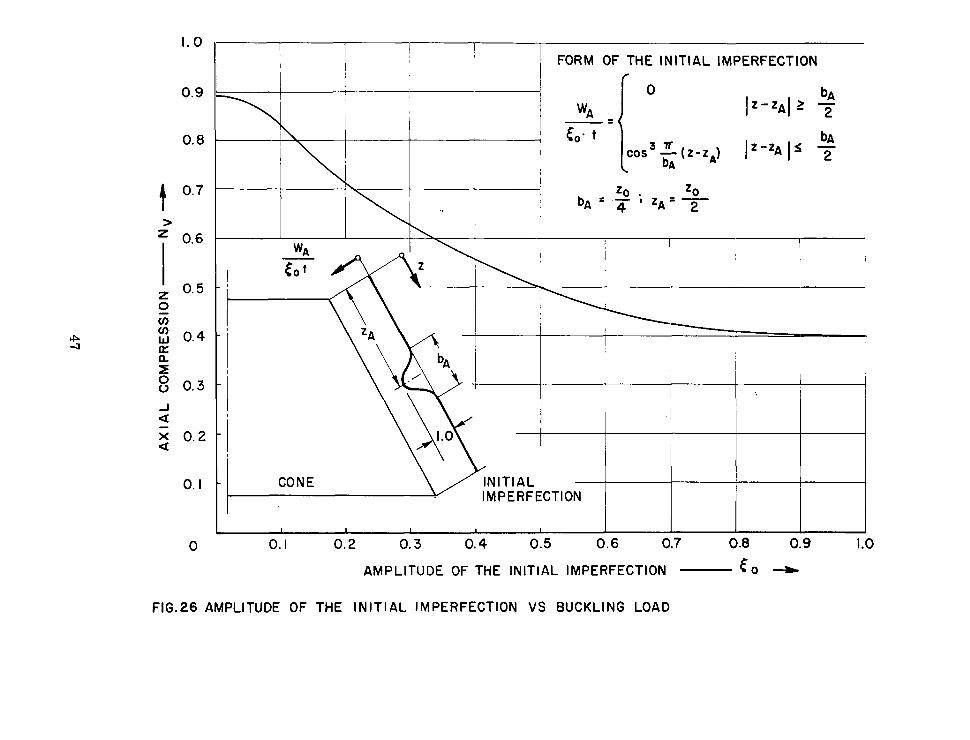
Thus motivated by the analytical results published by Schiffner
(Ref. 4), a tes t ser ies was carr ied out to invest igate the effect of an
axiglly symmetric imperfection on the buckling load under axial com-
pression. Figure 26 shows the intended imperfection of the conical
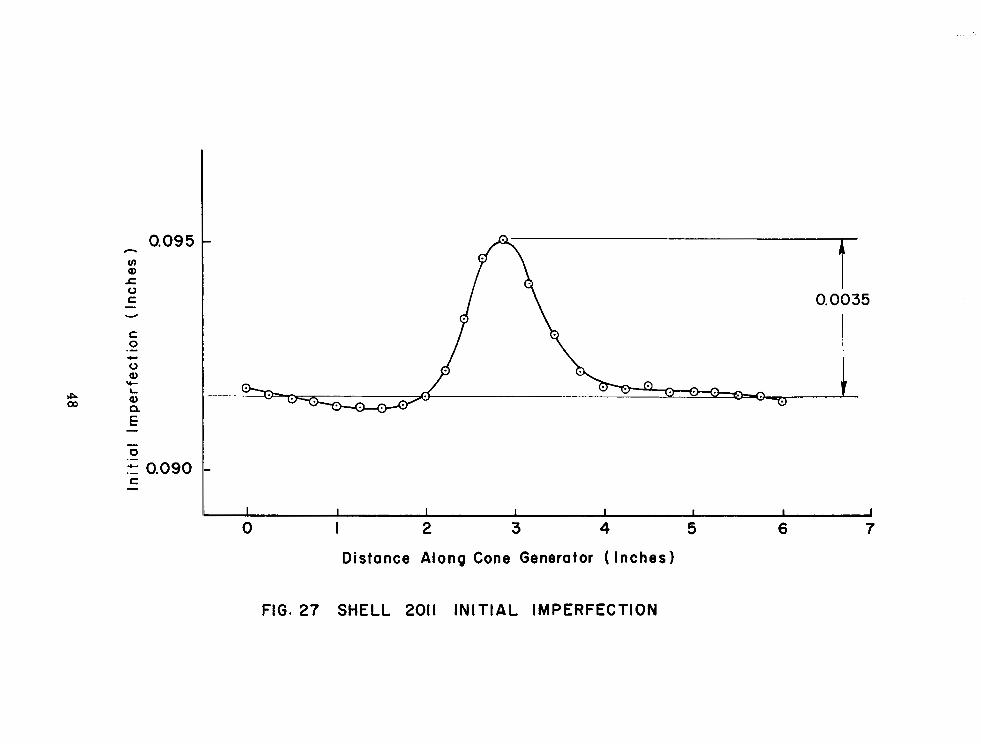
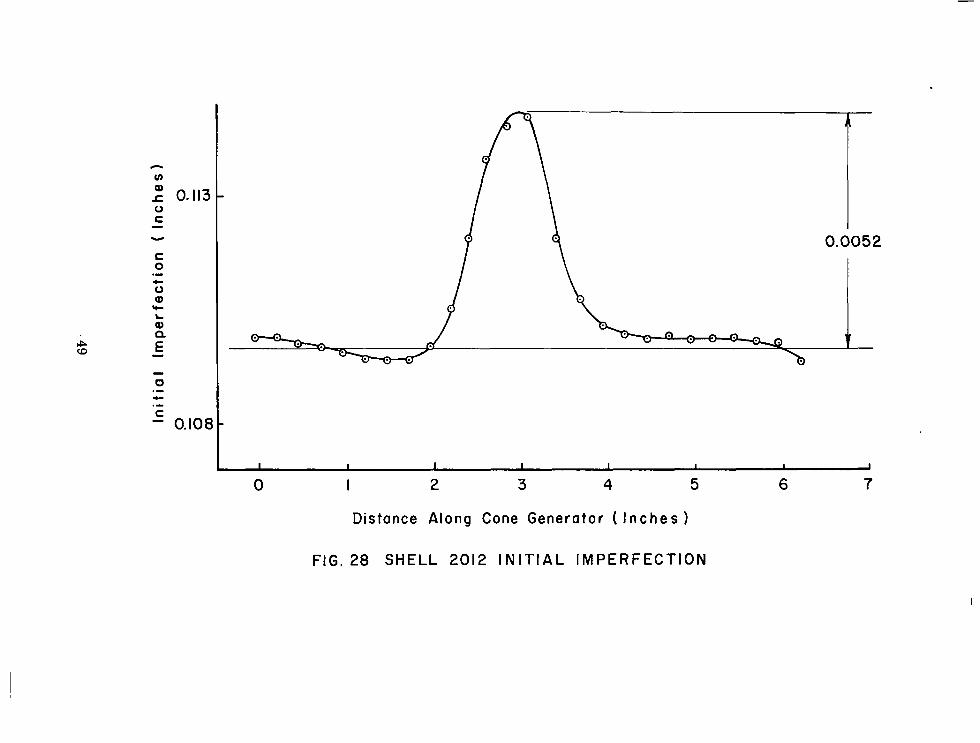
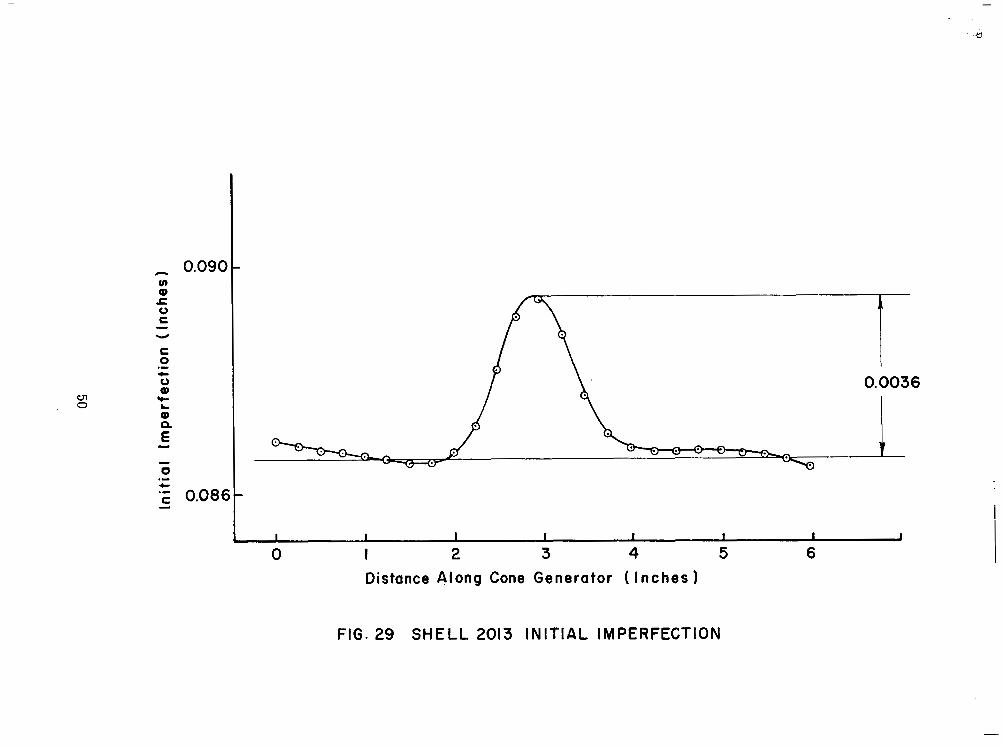
shel ls . It was taken direct ly f rom reference 4. Figures 27 through 29
show the measured imperfections of these shel ls af ter they had been
installed in the testing machine.
Detailed results of the buckling tests for imperfect conical shells
a re summar ized in Table IV. General collapse consisted of a snap-
through. In all cases where the cone semivertex angle a was less than
20° the postbuckling state consisted of one row of buckles that extended
completely around the circumference. The number of c i rcumferent ia l
waves is noted in Table IV. In all cases the buckling took place at the
central portion of the cone where the initial imperfection was located.
For the cones with semivertex angle a = 20 and = 2 5 the. post-
buckling state consisted of two distinct rows of buckles that extended
completely around the circumference, the additional row occurring to-
wards the larger end. It should also be noted here that localized initial
buckling was encountered with only one of the imperfect conical shells
tested. This can be explained by the fact that in the other cases the
degrading effect of the intended axially symmetric imperfections was
greater than the degrading effect of certain localized defects that might
have been present in the test specimen.
0 0
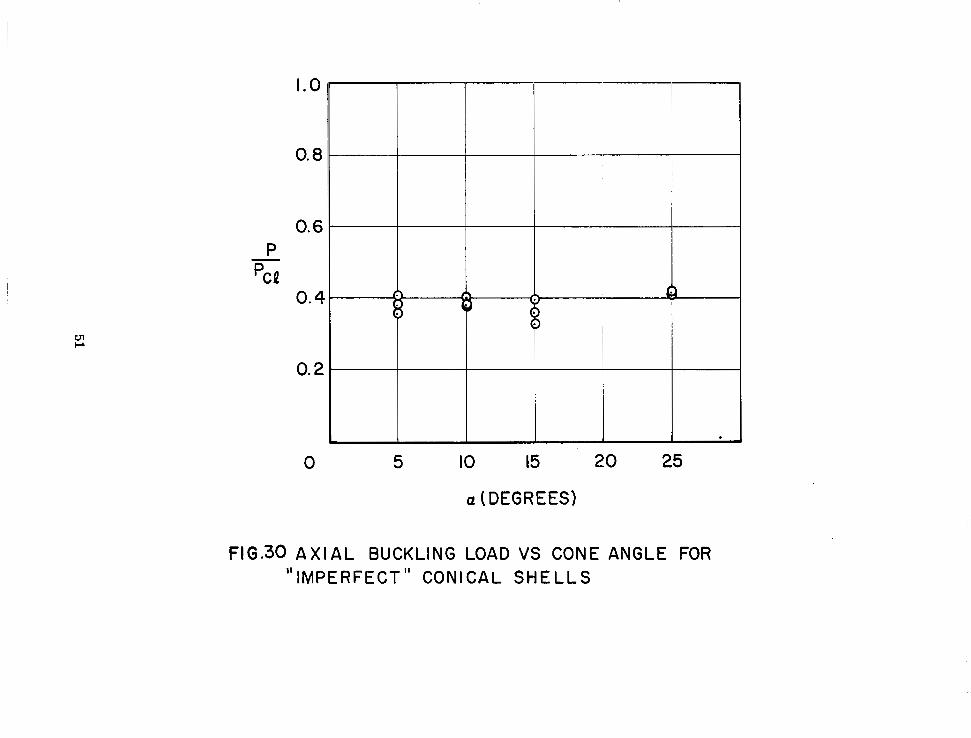
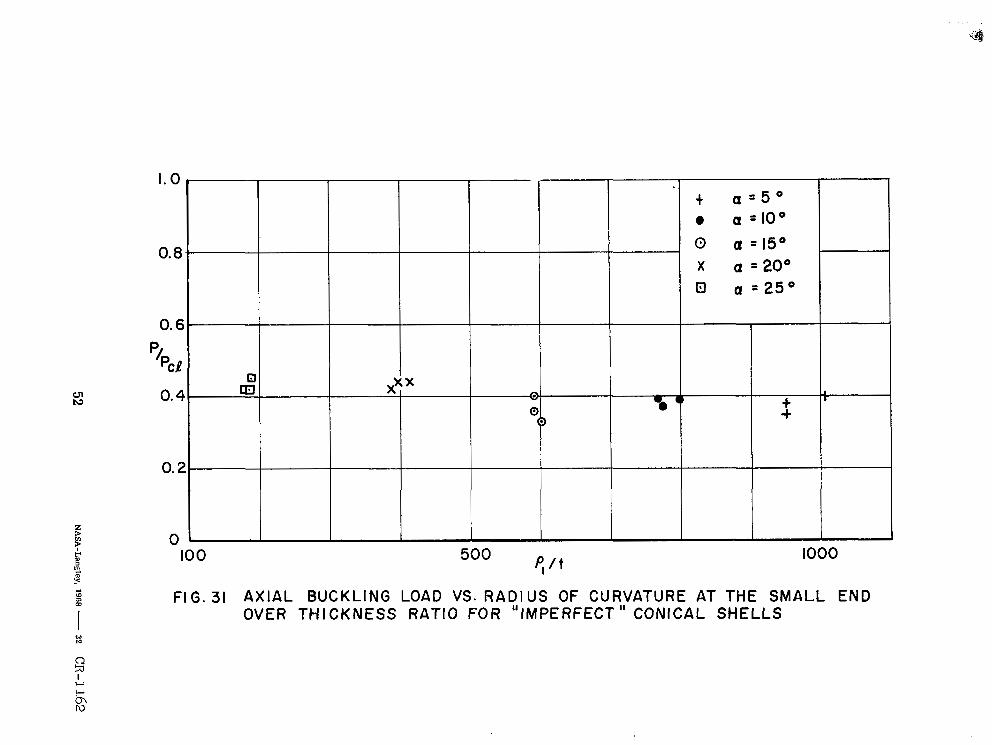
The f inal resul ts are summarized in Figs . 30 and 31 which show
the variations of P/Pce with cone semivertex angle and with the
p1 /t ratio respectively. Once again both figu.res indicate that all of the
shells tested have a relatively small scat ter band, most of the experi-
11
mental points lying between 0.35 - 0.4. The upper bound of these
experimental values is at 0.45.
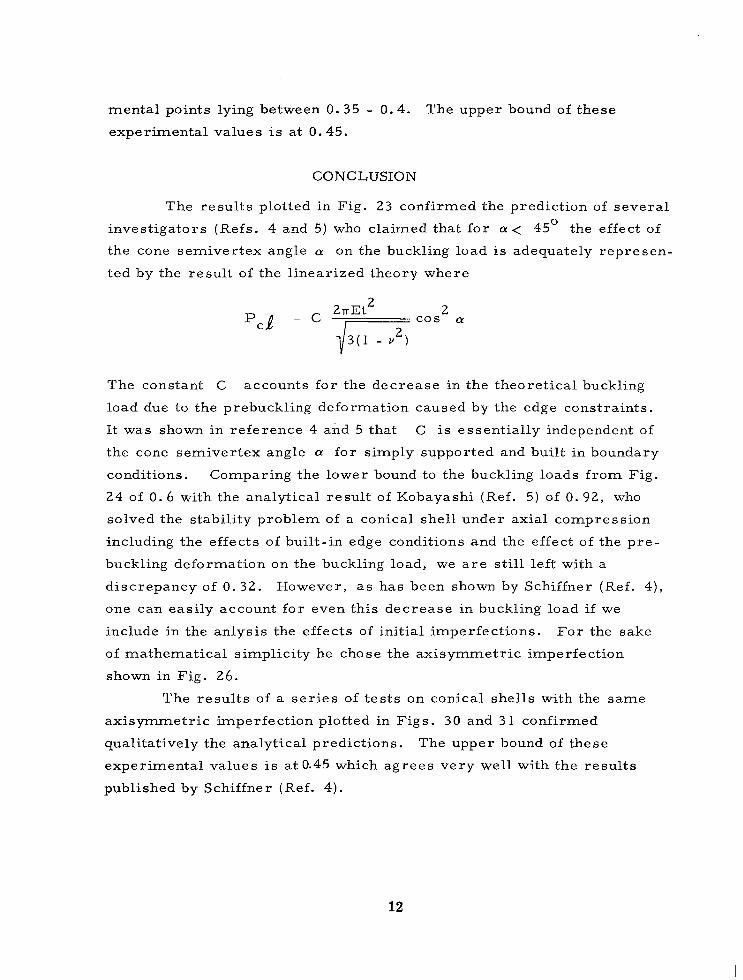
CONCLUSION
The results plotted in Fig. 2 3 confirmed the prediction of severa l
investigators (Refs. 4 and 5) who claimed that for a < 45O the effect of
the cone semivertex angle a on the buckling load is adequately represen-
ted by the result of the l inearized theory where
The constant C accounts for the decrease in the theoretical buckling
load due to the prebuckling deformation caused by the edge constraints.
It was shown in reference 4 and 5 that C is essentially independent of
the cone semivertex angle a for simply supported and built in boundary
conditions. Comparing the lower bound to the buckling loads from Fig.
24 of 0 . 6 with the analytical result of Kobayashi (Ref. 5) of 0.92, who
solved the stability problem of a conical shell under axial compression
including the effects of built-in edge conditions and the effect of the pre-
buckling deformation on the buckling load, we a r e still left with a
discrepancy of 0.32. However, as has been shown by Schiffner (Ref. 4),
one can easily account for even this decrease in buckling load if we
include in the anlysis the effects of init ial imperfections. For the sake
of mathematical s implici ty he chose the axisymmetr ic imperfect ion
shown in Fig. 26. The resu l t s of a s e r i e s of tests on conical shells with the same
axisy-mmetric imperfection plotted in F i g s . 30 and 31 confirmed
qualitatively the analytical predictions. The upper bound of these
experimental values is a t 0.45 which agrees very well with the results
published by Schiffne r (Ref. 4).
12
REFERENCES
1. Babcock, C. D. : The Buckling of Cylindrical Shells with an
Init ial Imperfection under A x i a l Compression Loading. Ph. D.
Thesis, California Insti tute of Technology, 1962.
2. Weingarten, V. I. ; Morgan, E. T. ; and Seide, P. : Final Report
on Development of Design Cri ter ia for Elast ic Stabi l i ty of Thin
Shell Structures. STL/TR-60-000- 19425, Space Technology
Laboratories, 1960.
3 . Lo, Hsu; Crate , M. ; and Schwartz, E. B. : Buckling of Thin
Walled Cylinder under Axial Compression and Internal Pressure.
NACA Report 1027, 1951.
4. Schiffner, K. : Spannungs-und Stabilitatsuntersuchungen an
Dunnwandigen Kegelschalen Bei Axialsymmetrischen
Randbedingungen. DLR F B 66-24, 1966.
5. Kobayashi, Shigeo: Influence of Prebuckling Deformation on the
Buckling Load of Truncated Conical Shells under Axial Compression,
NASA CR 707, 1967.
13
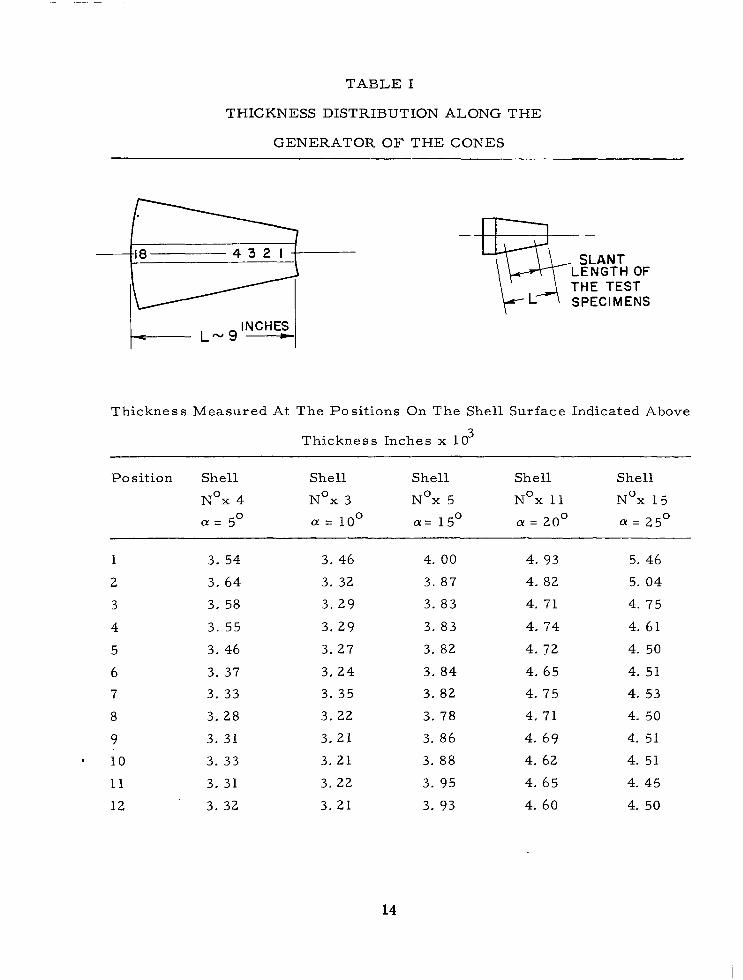
TABLE I
THICKNESS DISTRIBUTION ALONG THE
GENERATOROFTHECONES
-
SLANT LENGTH OF THE TEST SPECIMENS
L- L - 9 INCHES -1
Thickness Measured At The Posit ions On The Shell Surface Indicated Above
Thickness Inches x 10 3
Posit ion Shell Shell Shell Shell Shell
Nox 4 Nox 3 Nox 5 Nox 11 Nox 15
a = 10 a = 15 a = 2 0 a = 25 a = 5O 0 0 0 0
1
2
3
4
5
6 7
8
9 ' 10
11
12
3. 54
3. 64
3. 58
3. 55
3. 46
3. 37
3. 33
3. 28
3. 31
3. 33
3. 31
3. 32
3. 46
3. 32
3. 29
3. 29
3. 27
3. 24
3. 35
3. 22
3.21
3. 21
3. 22
3. 21
4. 00
3. 87
3. 83
3. 83
3. 82
3. 84
3. 82
3. 78
3. 86
3. 88
3. 95
3. 93
4. 93
4. 82
4. 71
4. 74
4. 72
4. 65
4. 75
4. 71
4. 69
4. 62
4. 65
4. 60
5. 46
5. 04
4. 75
4. 61
4. 50
4. 51
4. 53
4. 50
4. 51
4. 51
4. 45
4. 50
14
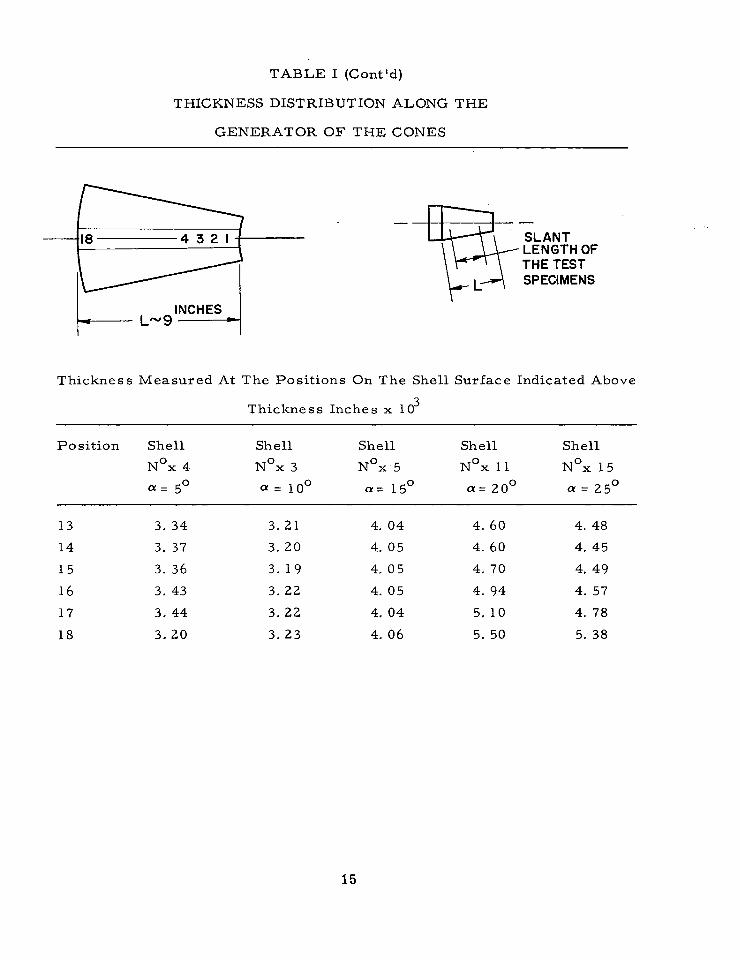
TABLE I (Cont'd)
THICKNESS DISTRIBUTION ALONG THE
GENERATOROFTHECONES
r -48 -%- SLANT
LENGTH OF THE TEST SPECIMENS
Thickness Measured At The Posit ions On The Shell Surface Indicated Above
Thickness Inches x 10 3
P o sition Shell Shell Shell Shell Shell
Nox 4 Nox 3 Nox 5 Nox 11 Nox 15 a = 5 0 a = 10 a = 15 0 0 u = 200 a = 25 0
13 3. 34 3. 21 4. 04 4. 60 4. 48
14 3. 37 3. 20 4. 05 4. 60 4. 45
15 3. 36 3. 19 4. 05 4. 70 4. 49
16 3. 43 3. 22 4. 05 4. 94 4. 57
17 3. 44 3. 22 4. 04 5. 10 4. 78
18 3. 20 3. 23 4. 06 5. 50 5. 38
15
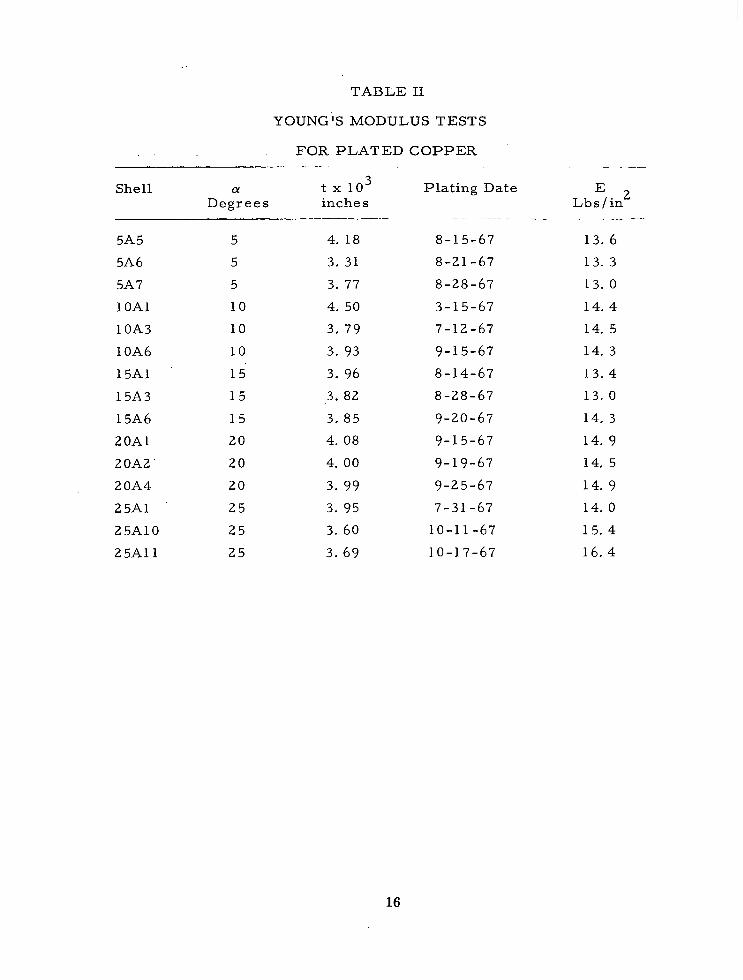
TABLE I1
YOUNG'S MODULUS TESTS
F O R P L A T E D C O P P E R
Shell a t x l O Plat ing Date 3
Degrees inches Lbs / in E 2
5A5
5A6
5A7
1 OAl
1 OA3
1 OA6
15A1
15A3
15A6
20A1
20A2'
20A4
25A1
25A10
25Al l
5
5
5
10
10
10
15
1 5
1 5
20
20
20
25
25
25
4. 18
3. 31
3 . 77
4. 50
3. 79
3. 93
3. 96
3. 82
3. 85
4. 08
4. 00
3. 99
3. 95
3. 60
3. 69
8-15-67
8-21 -67
8-28-67
3-15-67
7-12-67
9-1 5-67
8-14-67
8-28-67
9-20-67
9-1 5-67
9-19-67
9-25-67
7-31 -67
10-1 1-67
10-1 7-67
13. 6 13. 3
13. 0
14. 4
14. 5
14. 3
13. 4
13. 0
14. 3
14. 9 14, 5
14. 9
14, 0
15. 4
16, 4
16
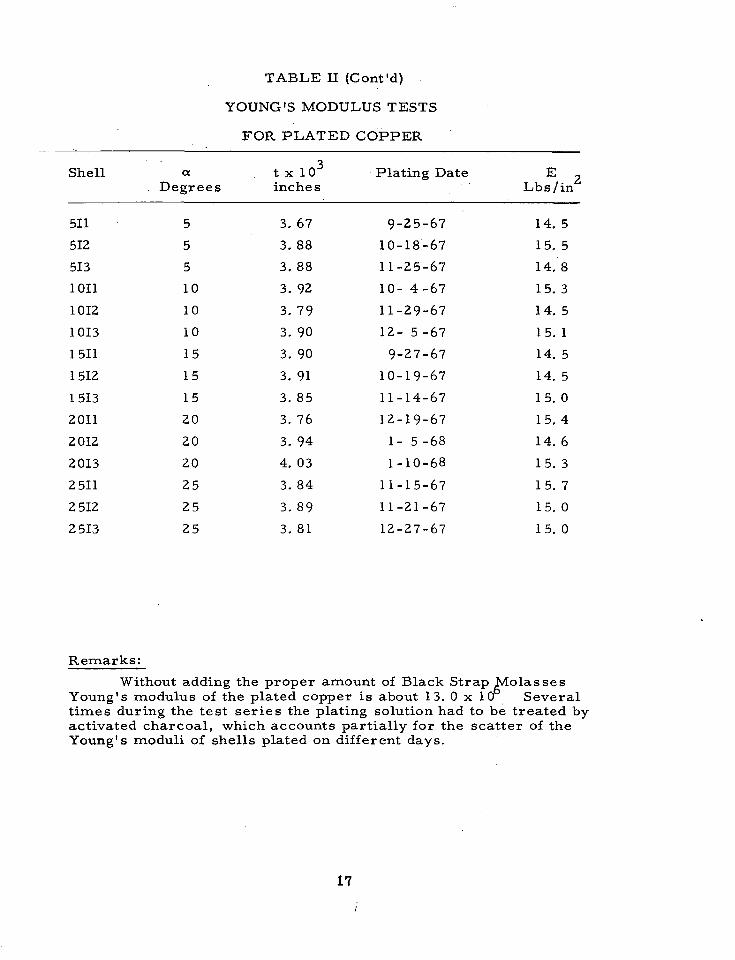
TABLE I1 (Cont'd)
YOUNG'S MODULUS TESTS
F O R P L A T E D C O P P E R . - -~
Shell a t x 10 Plating Date 3
Degrees inches Lbs / in E 2
51 1
512
513
1011
1012
1013
1511
1512
1 513
2011
2 012
2013
2 511
2 512
2 513
5
5
5
10
10
10
15
15
15
20
20
20
25
25
25
3. 67
3. 88 3. 88
3. 92
3. 79
3. 90
3. 90
3. 91
3. 85
3. 76
3. 94
4. 0 3
3. 84
3. 89
3. 81
9-25-67.
10-18.-67
11 -25-67
10- 4-67
11 -29-67
12- 5-67
9-27-67
10-19-67
11-14-67
12-19-67
1- 5-68
1-10-68
11 -1 5-67
11 -21 -67
12-27-67
14, 5 15, 5
14. 8 15. 3
14: 5
15. 1
14. 5
14. 5
15. 0
15. 4
14. 6
15. 3
15. 7 15. 0
15. 0
Remarks:
Without adding the proper amount of Black Strap o l a s s e s Young's modulus of the plated copper is about 13. 0 x 10 Several times during the test series the plating solution had to be treated by activated charcoal, which accounts partially for the scatter of the Young's moduli of shells plated on different days.
tY
17
I
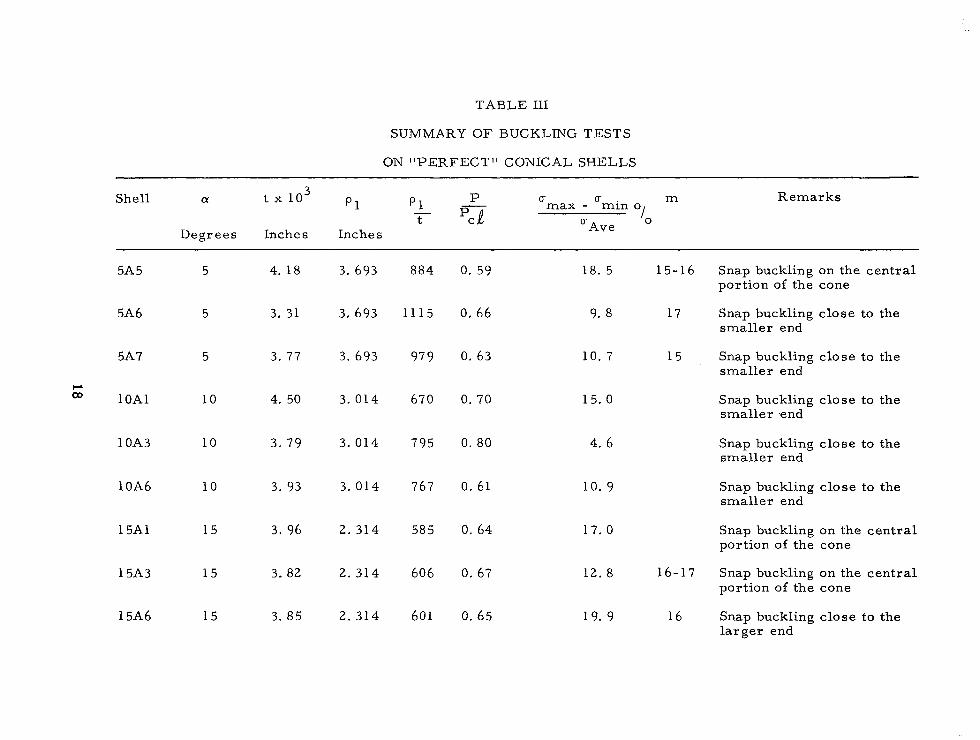
TABLE 111
SUMMARY OF BUCKLING TESTS
ON "PERFECT" CONICAL SHELLS
Remarks
5A 5
5A6
5A7
C'L
O3 lOAl
1 OA3
1 OA6
15A1
15A3
15A6
5
5
5
10
10
10
15
15
15
4. 18
3. 31
3. 77
4. 50
3. 79
3. 93
3. 96
3. 82
3. 85
3. 693
3. 693
3. 693
3. 014
3. 014
3. 014
2. 314
2. 314
2. 314
884
1115
97 9
670
795
767
58 5
606
601
0 . 59
0. 66
0. 63
0. 70
0 . 80
0. 61
0. 64
0. 67
0. 65
18. 5
9. 8
10. 7
15. 0
4. 6
10. 9
17. 0
12. 8
19. 9
15-1 6 Snap buckling on the central portion of the cone
17 Snap buckling close to the smaller end
l 5 Snap buckling close to the smaller end
Snap buckling close to the smaller .end
Snap buckling close to the smaller end
Snap buckling close to the smaller end
Snap buckling on the central portion of the cone
16-1 7 Snap buckling on the central portion of the cone
16 Snap buckling close to the larger end
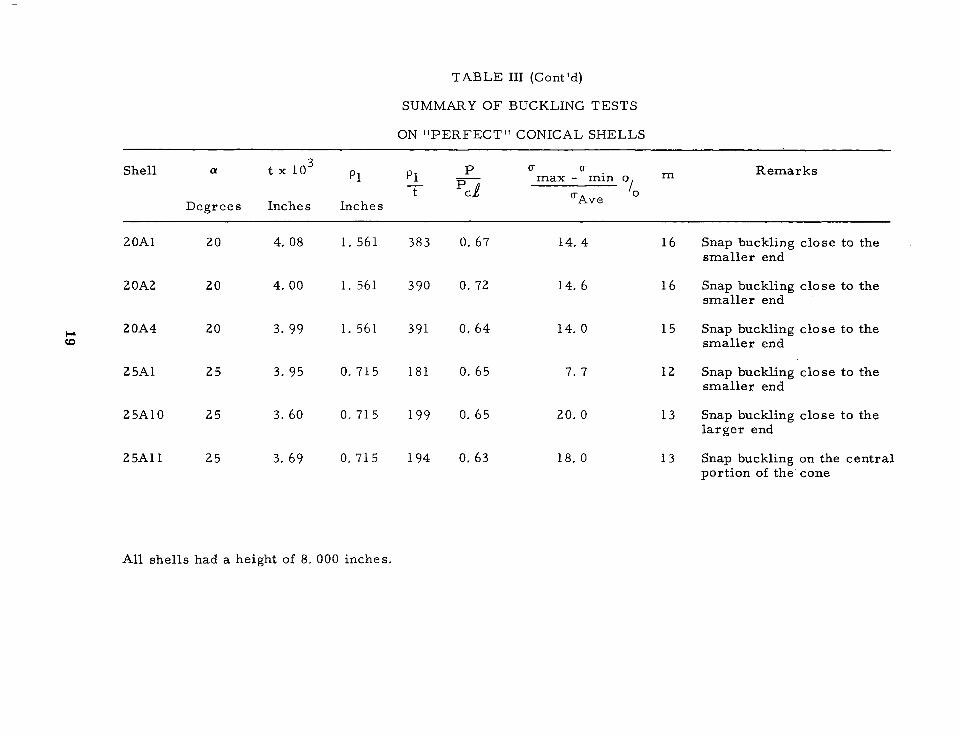
TABLE I11 (Cont Id)
SUMMARY O F BUCKLING TESTS
ON "PERFECT" CONICAL SHELLS
t x 10 3 P - 0- max - U min 0.
t - C L I
Degrees Inches Inches O-Ave
m Remarks
20A1 20 4. 08 1. 561 383 0 . 67 14. 4 16 Snap buckling close to the smaller end
2 OA2 20 4. 00 1. 561 390 0. 72 14. 6 16 Snap buckling close to the smaller end
2 OA4 20 3 . 99 1. 561 391 0, 64 14. 0 15 Snap buckling close to the smaller end
2 5A1 25 3. 95 0. 715 181 0. 65 7. 7 12 Snap buckling close to the smaller end
25A10 25 3. 60 0. 715 199 0. 65 20. 0 13 Snap buckling close to the larger end
2 5A11 25 3 . 69 0. 715 194 0. 63 18, 0 13 Snap buckling on the central portion of the cone
All shells had a height of 8. 000 inches.
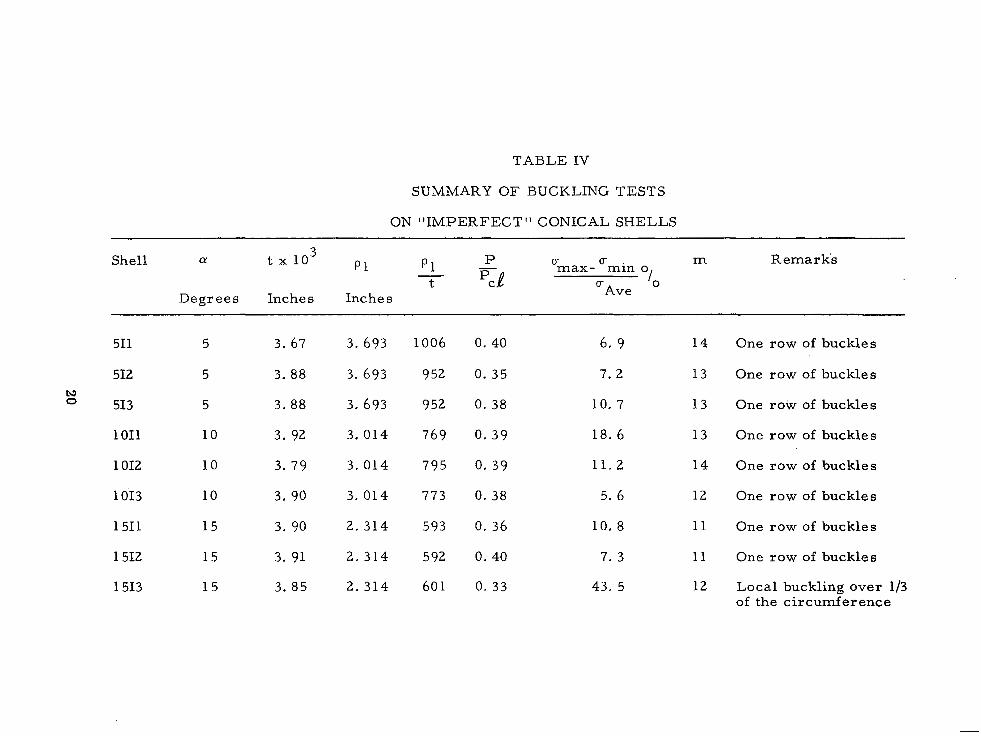
TABLE IV
SUMMARY OF BUCKLING TESTS
ON "IMPERFECT" CONICAL SHELLS
Shell a t x 10 3 P1 P 1 P ci 0- m Remarks - max- min o -
t ci 10 Degrees Inches Inches Ave
~~ ~~ ~~~ ~~ ~~~ ~~~
511 5 3. 67 3. 693 1006 0. 40 6. 9 14 One row of buckles
512
51 3
1011
1012
1013
1511
1512
1513
N Q
5
5
10
10
10
15
15
15
3. 88 3. 693 952 0. 35
3 . 88 3. 693 952 0. 38
3. 92 3,014 769 0. 39
3. 79 3, 014 795 0. 39
3. 90 3. 014 773 0. 38
3. 90 2. 314 593 0. 36
3. 91 2. 314 592 0. 40
3. 85 2. 314 601 0. 3 3
7. 2
10. 7
18. 6
11.2
5. 6
10. 8
7. 3
43. 5
13
13
13
14
12
11
11
12
One row of buckles
One row of buckles
One row of buckles
One row of buckles
One row of buckles
One row of buckles
One row of buckles
Local buckling over 1/3 of the circumference
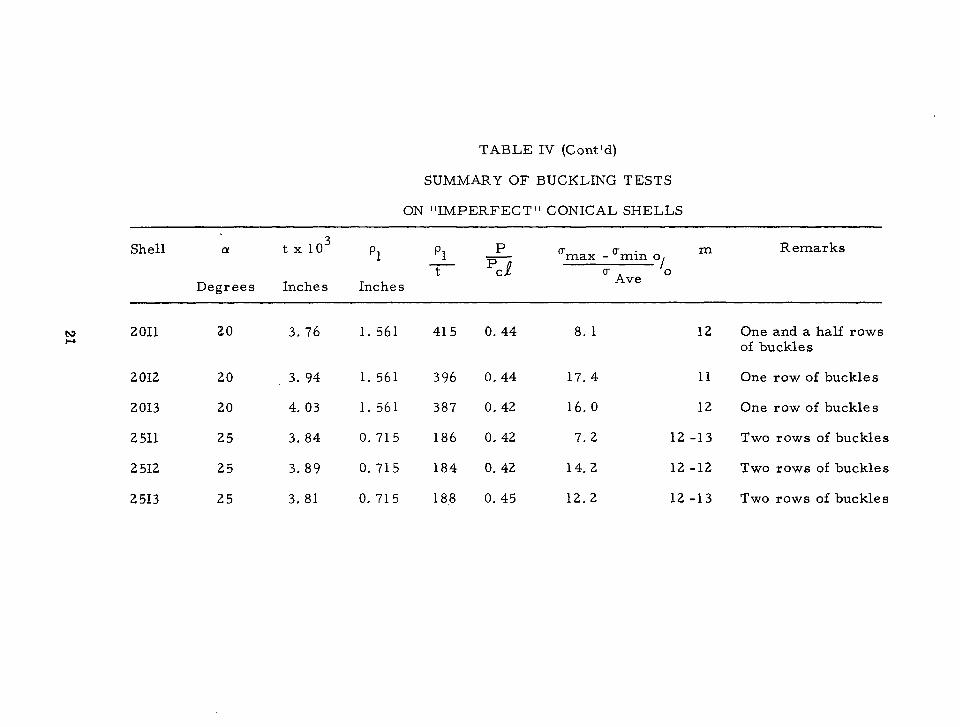
TABLE IV (Cont'd)
SUMMARY OF' BUCKLING TESTS
ON "IMPERFECT" CONICAL SHELLS
Shell t x 10 3 a p1 p1 P m Remarks - amax - urnin o -
t e 0- '0 Degrees Inches Inches Ave
2 011 20 3. 76 1. 561 415 0. 44 8. 1 12 One and a half rows of buckles
2 012 20 3. 94 1. 561 396 0.44 17. 4 11 One row of buckles
2 013 20 4. 03 1. 561 387 0. 42 16. 0 12 One row of buckles
2 511 25 3. 84 0. 715 186 0. 42 7.2 12 -13 Two rows of buckles
2 512 25 3. 89 0, 715 184 0. 42 14, 2 12 -12 Two rows of buckles
2 513 25 3. 81 0. 715 18.8 0. 45 12 ,2 12 -13 Two rows of buckles
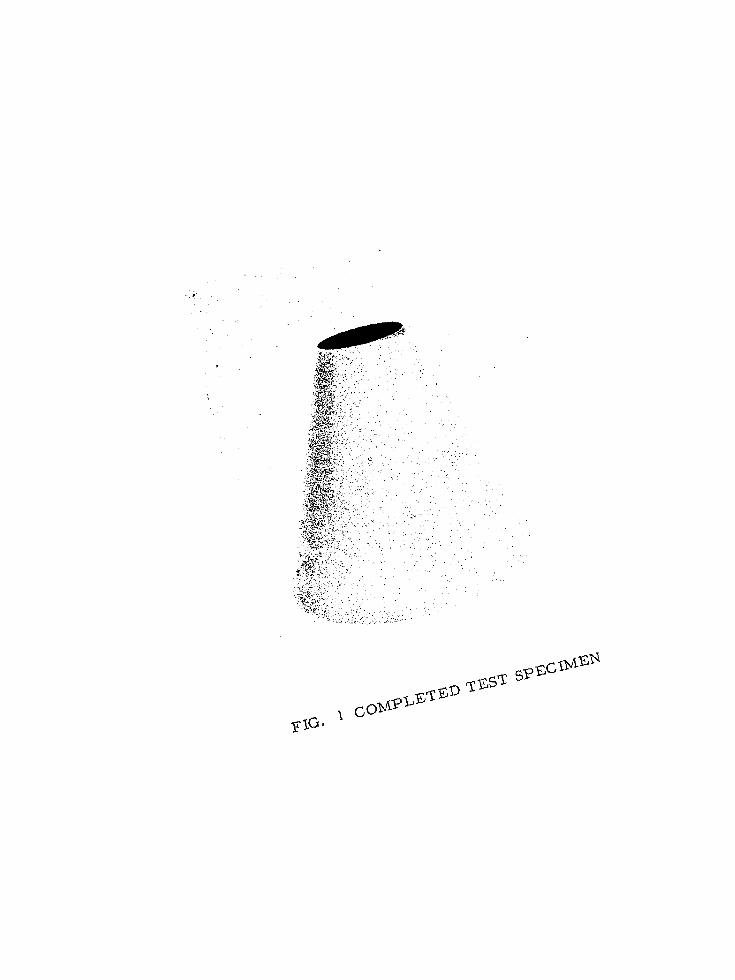

FIG. 2 PLATING INSTALLATION
23
Shel l X 4 ( a = 5 O ) cs m a3 c 2 0.006- 2 5 % Thickness c Variation
Slant Length -
Y
u) m - 01
p 0.002-
C . @ O O f i n ~ . " , , , , m m . * . ? c e m m r
7 C
I-
- 5 0.004 Computed Average Thickness
.- - - -
" - \ Slant Length Of Shell -
- I I I I I I I I
0 I 2 3 4 5 6 7 i3 9 True Length X ( Inches)
c v)
c 0
01 Shel l X 3 ( a = l O O )
5 % Thickness 1 Var iat ion u) cn
01
Computed Average Thickness 0
L
0.002 Slant Length Of Shell -
t 1 I I I I I I 1 I I
0 I 2 3 4 5 6 7 8 9 True Length X ( I n c h e s )
FIG. 3 THICKNESS D ISTRIBUTION ALONG THE GENERATOR OF C O N I C A L S H E L L S
24
Shell X 5 (a= 15 " 1 - u) Q) f 5 ?lo Thickness c .f Variation Slant - c Length 0 0.006 - Y 4 Of Shell u) u) 4) Computed Average Thickness
e m - - 0
c .- I- - 4 , 4 Slant Length Of Shell - p 0.002 -
L- I I I I
0 I 2 3 4 5 6 7 0 9 I I I 1 I
True Length X ( Inches
Shell X II ( a = 2 O o ) + - 5% Thickness t Variation
S l a n t L e n g t h Of Shel l
FIG. 4 THICKNESS DISTRIBUTION ALONG THE GENERATOR OF CONICAL SHELLS
25
Shell X 15 ( a = 2 5 ' )
h s u) 0) 0.006 0 - 0 Computed Average Thickness j p h Length Slant $1 I
0 c
- 0 v @ ~ ~ o w @ 0 ~ 0 @ ( 7 J -
- 0.004 - U
u) u) Q) E *
" Slant Length Of Shell - " 0.002 -
- 1 To Thickness Variation
c-c P
.-
- 0 I 2 3 4 5 6 7 0 9
True Length X ( Inches)
F IG. 5 THICKNESS DISTRIBUTION ALONG THE GENERATOR OF CONICAL SHELLS
26
20,000
15,000
U
I0,000
C I I I
0.001 0.002 E 0.003 FIG. 6 STRESS STRAIN CURVE FOR PLATED COPPER
FIG. 7 TESTING MACHINE
28
4 40
Threads Per
Inch Y
FIG. 8 DETAILS OF TESTING MACHINE LOADING SCREW
29
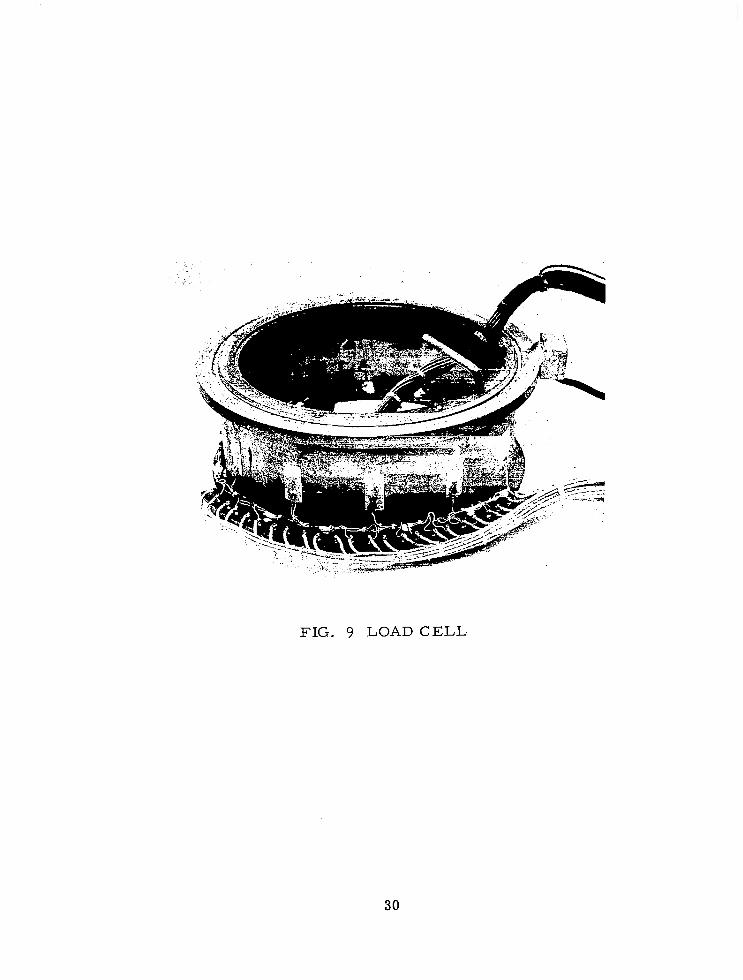
FIG. 9 LOAD CELL
30
I
Devcon
I
FIG. 10 CONICAL SHELL TESTING CONFIGURATION
31
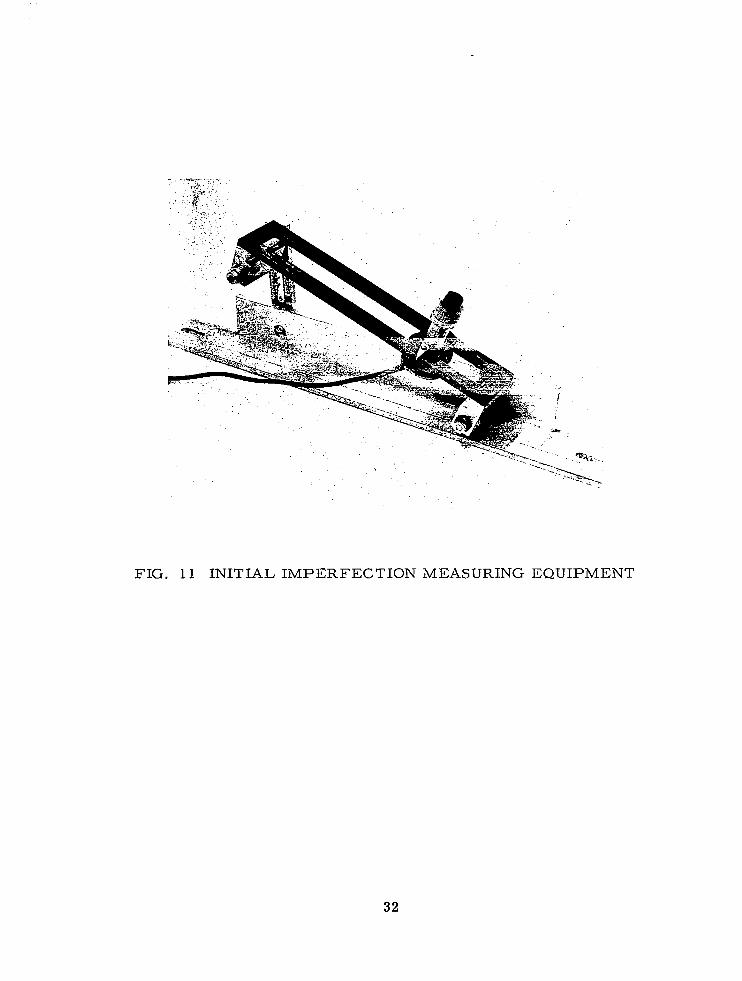
FIG. 11 INITIAL IMPERFECTION MEASURING EQUIPMENT
32
FIG, 12 INITIAL IMPERFECTION MEASURING EQUIPMENT
IN POSITION ON A CONE
33
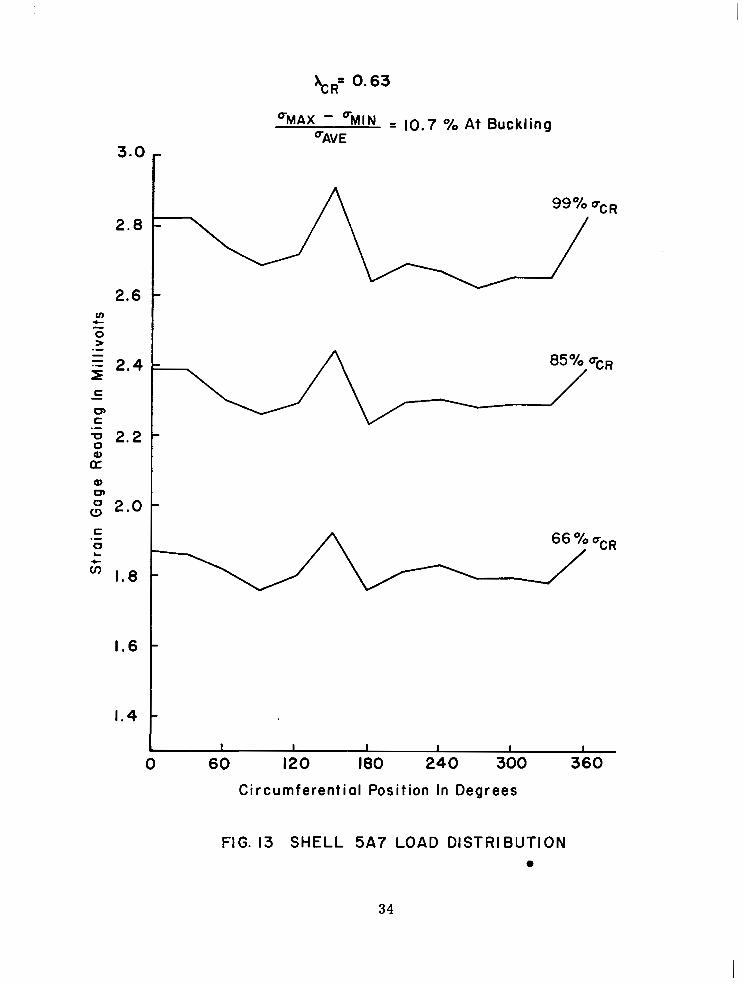
kR= 0.63
OMAX - %IN = 10.7 o/o At Buckling OAV E
3 .0 -
2.0 -
2.6 - 4- u)
0 > - .- - E 2.4 - - c 0, c
2.2 - Q) a Q) 0,
g 2.0 -
1.6 -
1.4 - I I I I I I
0 60 120 I80 240 300 360
Circumferential Posit ion In Degrees
FIG. 13 SHELL 5A7 L O A D D I S T R I B U T I O N 0
34
3.2
3.0
al 0)
W o 2.4
2.2
2 .0
0 60 120 180 240 300 360 Circumferential Position In Degrees
FIG. 14 SHELL 1 0 A 6 LOAD DISTRIBUTION
35
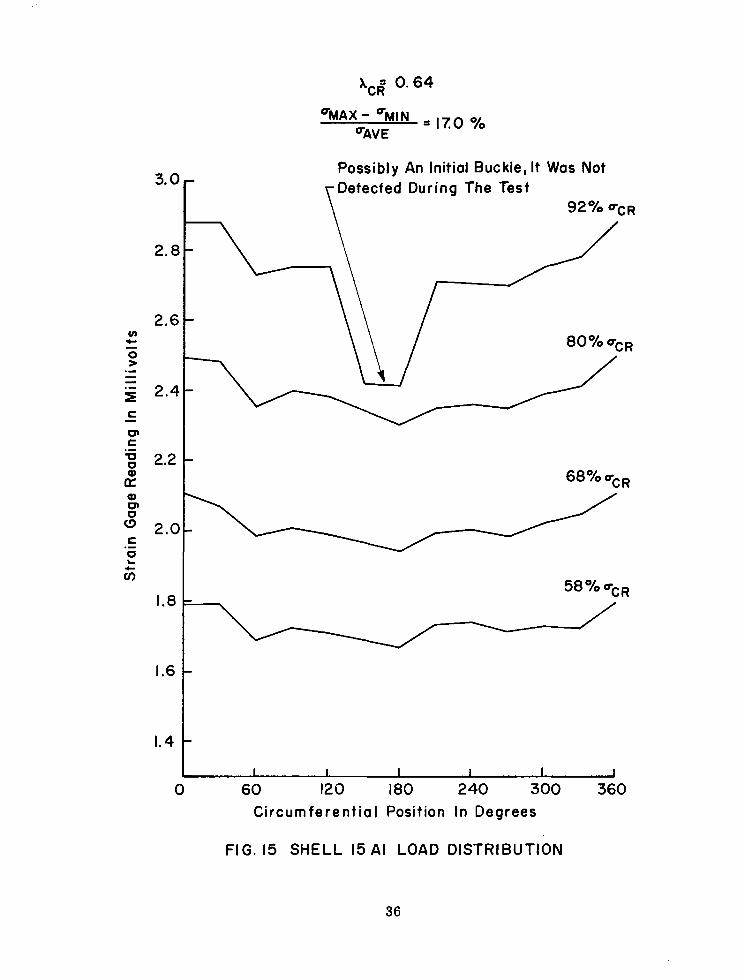
LC: 0.64
%AX- %IN = l l o '?AV E
Possibly An Initial Buckle, It Was Not Detected During The Tesf
2*2 t 68 O/o UC R
.- E
z 4-
Cn
1.8 -
1.6 -
1.4 - I I 1 I
0 60 120 I80 240 300 360 I ." A
Circumferential Position In Degrees
FIG. 15 SHELL 15 AI LOAD DISTRIBUTION
36
3.4
3.2
3.0
t v)
0 > - .- - - 2.8 r .-
- c CT c 0 0 Q)
.- 2.6
a
0 2.4 Q) CT
(3
.- c !? v, 2.2 c
2.0
1.8
0 60 120 180 240 300 360
Circumferential Position In Degrees
FIG. 16 SHELL 2 0 A 4 LOAD DISTRIBUTION
37
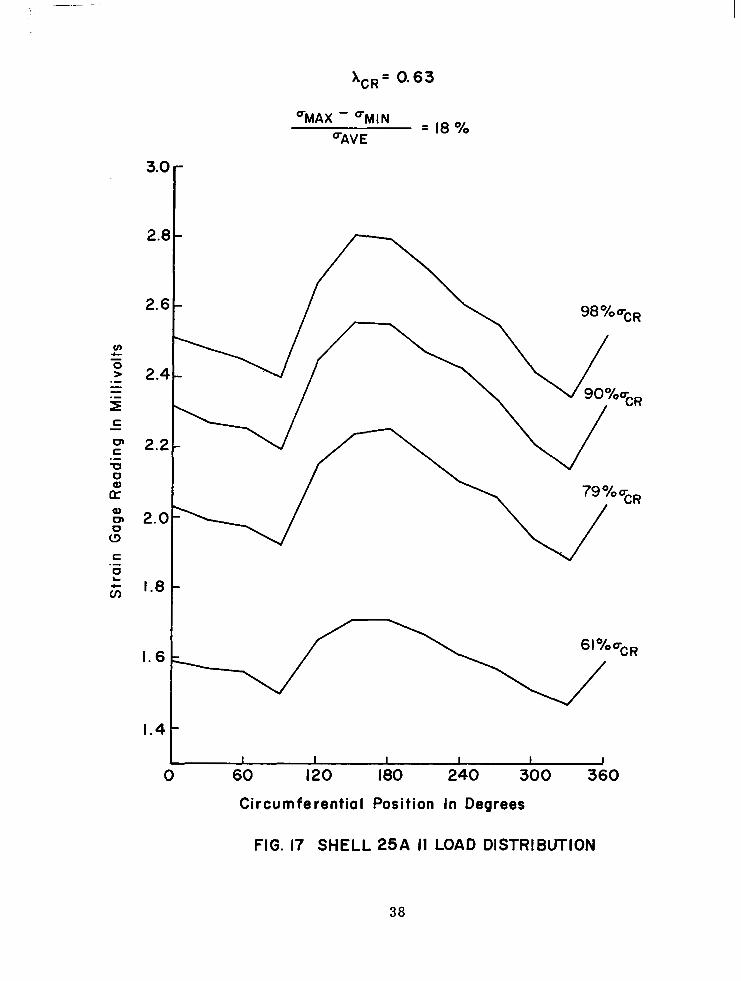
X,,= 0.63
3.0
2.8
2.6
2.4
2.2
2.0
I .8
I. 6
1.4
( 60 120 I80 240 300 360
Circumferential Position In Degrees
FIG. 17 SHELL 25A I1 LOAD DISTRIBUTION
38
a 0
.- c z zi'
3.2
3.0
2 . 8
2.6
0 60 120 180 240 300 360 Circumferent ial Position In Degrees
FIG. 18 LOAD DISTRIBUTION NEAR BUCKLING (SHELLS 5A5, 5 A 6 , 5A7 1
39
(I)
.- E 0 L cn c
FI
3.2 - Shell 1 0 A 6
2.8 - I I ~~~ ~ I I 1 .
3.8- Shell IO A 3
3.2 - I I ~ I I I~ ~~ I
4.3- Shell IO A I 94 O/O QC R
I I I I I ~ I
0 60 120 I80 240 300 360 Circumferential Position In Degrees
G. 19 LOAD DISTRIBUTION NEAR BUCKLING (SHELLS IOAI, 1 0 A 3 , I O A 6 )
40
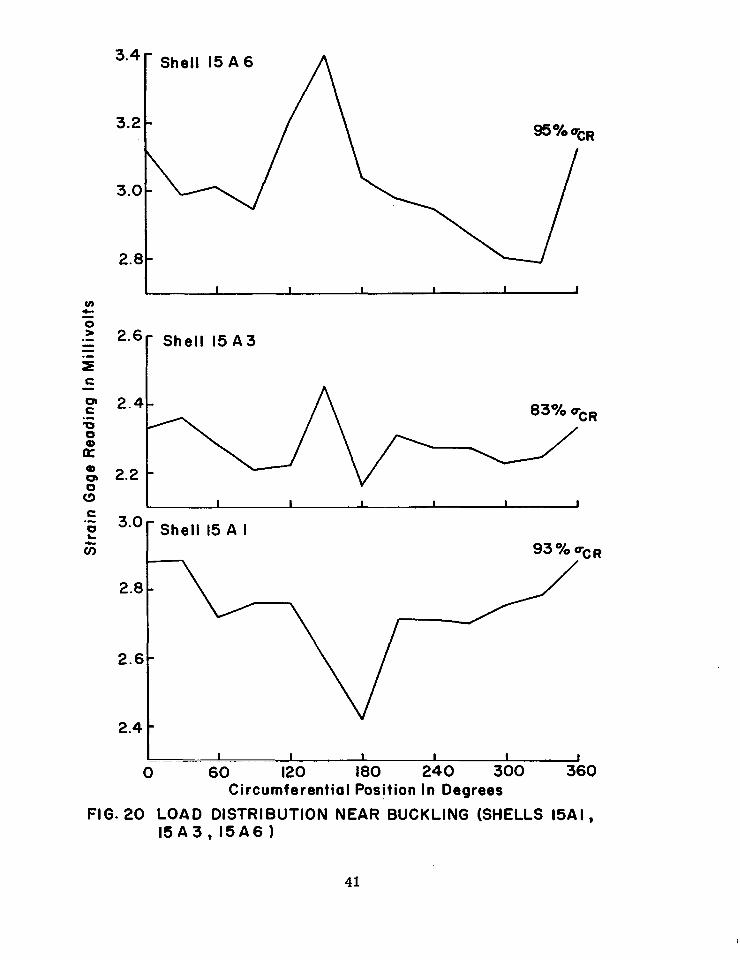
FIG. 20 LOAD DISTRIBUTION NEAR BUCKLING (SHELLS 15AI, 1 5 A 3 , l 5 A 6 )
41
3.8
3.6
3.4
3.2
3.6
3.4
3.2
0 60 120 180 240 300 360 Circumferential Position In Degrees
FIG. 21 LOAD DISTRIBUTION NEAR BUCKLING (SHELLS 20 A I , 2 0 A 2 , 2 0 A 4 )
42
- c
.- c
cn -I-
Shell 25 A ll 2.8 -
2.6 -
- I I I I I I
2.6- Shell 25 A IO
2.4 -
2.2
2.0 - I I I I i J
0 60 120 180 240 300 360 Circumferential Position In Degrees
FIG. 22 LOAD DISTRIBUTION NEAR BUCKLING (SHELLS 25AI ,25AlO,25AI I )
43
1.0
0.8
0.6 P -
pcL 0.4
0.2
0 I 1 I I
5 IO 15 20 25
a (DEGREES)
FIG.23 A X I A L BUCKLING LOAD VS CONE ANGLE FOR'IPERFECT" CONICAL SHELLS
1.0
0.8
0.6 P -
l.P Pcl cn
0.4
0.2
0
)( a = 5 O 0 a =IO" EI a =15" A a =20° + a =25O
100 500 PI / t 1000
F I G . 2 4 A X I A L B U C K L I N G L O A D VS R A D I U S OF CURVATURE AT T H E S M A L L END O V E R T H I C K N E S S R A T I O FOR "PERFECT" CONICAL SHELLS
1.0 Q MYLAR
I IO0 !Il
0.8 \I 1 h . 20° A w W
0.6 P -
PCL! 0.4
A Q,
0.2
I \ I
STEEL
-J 0 400 800 I200 1600 2000 2400
PI / t
FIG.25 COMPARISON OF AXIAL BUCKLING LOAD OF CONICAL SHELLS WITH LOWER BOUND CURVE FOR CYLINDERS
I. 0
0.9
0.8
i o.6
t 0.7 >
z 0 v) v)
E a. 5 8 0.3
0.5 - w 0.4
J a z 0.2 4
0. I
0
j ! ! I 1 1 FORM OF
! THE INITIAL IMPERFECTION
f
-"--- co* +
1 I
0. I 0.2 0.3 0.4 0.5 0.6 0.7 0.8 0.9 1.0
AMPLITUDE OF THE INITIAL IMPERFECTION € 0 d
FIG.26 AMPLITUDE OF THE INITIAL IMPERFECTION V S BUCKLING LOAD
0 I 2 3 4 5 6 7
Distance Along Cone Generator ( Inches)
FIG. 27 SHELL 2011 I N I T I A L I M P E R F E C T I O N
0. 113
0.108
0 I 2 3. 4 5
Distance Along Cone Generator ( I n c h e s 1
FIG. 28 S H E L L 2012 INITIAL I M P E R F E C T I O N
cn 0
n 0.090
I I I I I I I J
0 I 2 3 4 5 6 Distance Along Cone Generator ( I n c h e s )
FIG. 29 SHELL 2013 IN IT IAL IMPERFECTION
0 5 IO 15 20 25
a (DEGREES)
FIG.30 A X I A L BUCKLING LOAD VS CONE ANGLE FOR "IMPERFECT" CONICAL SHELLS
ul N
0.2
0 IO 0 500 p , / t 1000
FIG. 31 AXIAL BUCKLING LOAD VS. RADIUS OF CURVATURE AT THE SMALL END OVER THICKNESS RATIO FOR " IMPERFECT" CONICAL SHELLS