Embed Size (px)
Citation preview

Bucharest Stock Exchange Presentation
Page 2 www.bvb.ro
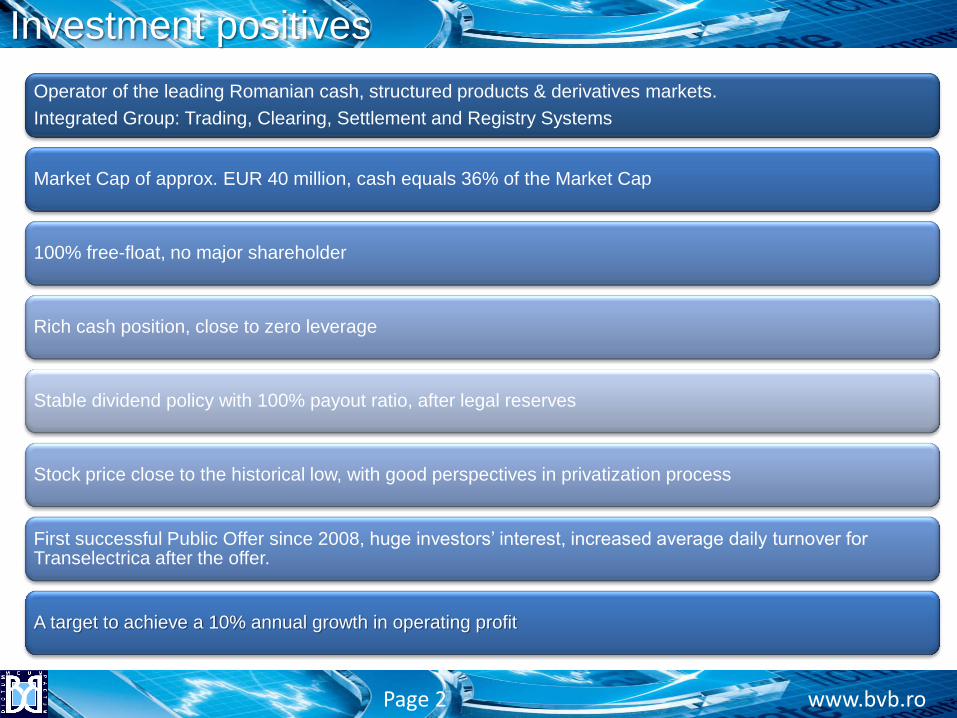
Investment positives
Operator of the leading Romanian cash, structured products & derivatives markets.
Integrated Group: Trading, Clearing, Settlement and Registry Systems
Market Cap of approx. EUR 40 million, cash equals 36% of the Market Cap
100% free-float, no major shareholder
Rich cash position, close to zero leverage
Stable dividend policy with 100% payout ratio, after legal reserves
Stock price close to the historical low, with good perspectives in privatization process
First successful Public Offer since 2008, huge investors’ interest, increased average daily turnover for Transelectrica after the offer.
A target to achieve a 10% annual growth in operating profit
Page 3 www.bvb.ro
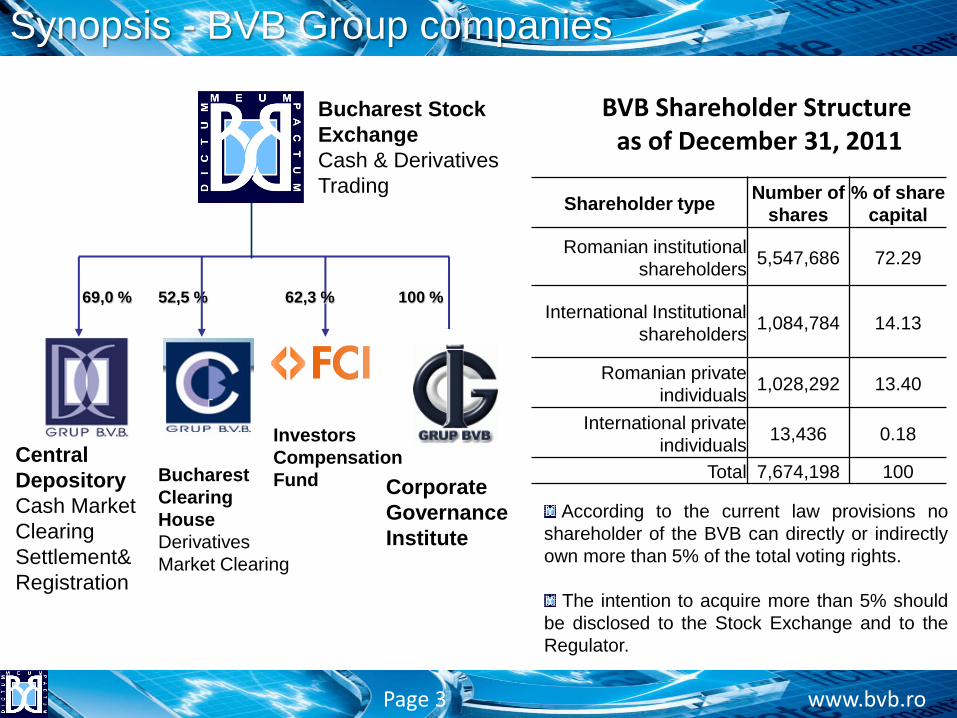
Synopsis - BVB Group companies
Shareholder type Number of
shares
% of share
capital
Romanian institutional
shareholders 5,547,686 72.29
International Institutional
shareholders 1,084,784 14.13
Romanian private
individuals 1,028,292 13.40
International private
individuals 13,436 0.18
Total 7,674,198 100
According to the current law provisions no
shareholder of the BVB can directly or indirectly
own more than 5% of the total voting rights.
The intention to acquire more than 5% should
be disclosed to the Stock Exchange and to the
Regulator.
BVB Shareholder Structure as of December 31, 2011
Central
Depository
Cash Market
Clearing
Settlement&
Registration
Bucharest Stock
Exchange
Cash & Derivatives
Trading
Corporate
Governance
Institute
52,5 % 62,3 % 69,0 % 100 %
Bucharest
Clearing
House
Derivatives
Market Clearing
Investors
Compensation
Fund
Page 4 www.bvb.ro
New Chief Executive Officer - Profile
Installed as CEO on September 7, 2012
One of the most experienced professionals on the Romanian
financial services market, with a very solid expertise in
investment banking
Involved in multiple M&As and privatizations, both on the
sellers' and on the buyers' side.
Starting 2007 he founded and became Managing
Director of AZ Capital Advisors, specialized in mergers
and acquisitions (M&A)
During 1998-2007 he occupied different top-executive
positions in Raiffeisen Capital and Investment and
Raiffeisen Financial Advisors Romania
Completed the joint EMBA Program Washington
University (Seattle, USA) and the Academy of Economic
Studies (Bucharest)
Holds the bachelor degree in physics, Faculty of Physics, University of Bucharest.
Positio
ns h
eld
P
ers
onal data

Page 5 www.bvb.ro
BVB Board of Governors
Lucian Anghel (BCR) – President
The new BoG was approved by
CNVM on January 30,
2012 and has the following
structure:
• Adrian Lupsan (SSIF Intercapital Invest) - Vice-President
• Dan Paul (Brokers’ Association) – Vice-President
• Robert Pana (SSIF Swiss Capital) – Secretary General
• Valerian Ionescu (BCR) - Member
• Matjaz Schroll (Franklin Templeton) - Member
• Narcisa Oprea (Schoenherr & Associates )- Member
• Stere Farmache (Alpha Bank) - Member
• Octavian Molnar (SSIF IFB Finwest) - Member
Page 6 www.bvb.ro
BVB Strategic Priorities
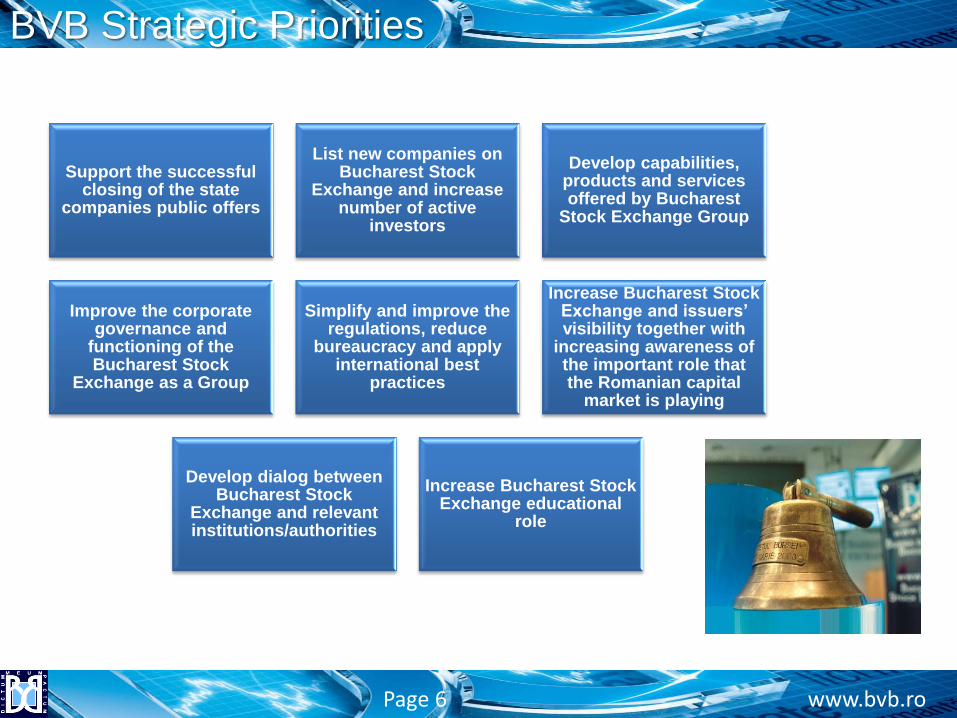
Support the successful closing of the state
companies public offers
List new companies on Bucharest Stock
Exchange and increase number of active
investors
Develop capabilities, products and services offered by Bucharest
Stock Exchange Group
Improve the corporate governance and
functioning of the Bucharest Stock
Exchange as a Group
Simplify and improve the regulations, reduce
bureaucracy and apply international best
practices
Increase Bucharest Stock Exchange and issuers’ visibility together with
increasing awareness of the important role that the Romanian capital
market is playing
Develop dialog between Bucharest Stock
Exchange and relevant institutions/authorities
Increase Bucharest Stock Exchange educational
role

Page 7 www.bvb.ro
BVB in the region
Source: BVB, Companies, FESE July Data
Exchange
% Change
in
Market Cap
in 2011
on previous
year end,
in EURO
% Change
in
Market Cap
YTD 2012
on previous
year end,
in EURO
Warsaw Stock
Exchange -24.5% 9.5%
CEESEG -
Budapest -29.1% 9.2%
CEESEG -
Vienna -30.1% 5.2%
Bucharest
Stock
Exchange 10.7% 2.4%
CEESEG -
Prague -8.5% -2.9%
Athens
Exchange -48.4% -9.6%
Bulgarian Stock
Exchange 15.6% -13.5%
CEESEG -
Ljubljana -30.7% -15.1%
4.1 5.5 11.1 16.0 23.5 28.3
69.1
117.7
CEESEG -Ljubljana
BulgarianStock
Exchange
BucharestStock
Exchange
CEESEG -Budapest
AthensExchange
CEESEG -Prague
CEESEG -Vienna
WarsawStock
Exchange
Domestic Market Cap (EUR bn) - Main Market
28 53 62 81 96 99
270
369
CEESEG -Prague
CEESEG -Budapest
CEESEG -Ljubljana
BucharestStock
Exchange
BulgarianStock
Exchange
CEESEG -Vienna
AthensExchange
WarsawStock
Exchange
Number of total listed companies-Main Market
0.8 1.1 7.0 35.4 41.4 48.5
77.8
203.7
BulgarianStock
Exchange
CEESEG -Ljubljana
BucharestStock
Exchange
CEESEG -Budapest
CEESEG -Prague
AthensExchange
CEESEG -Vienna
WarsawStock
Exchange
Main stock market turnover in 2012 (EUR m/day)
Page 8 www.bvb.ro
BVB Market Data
Source: BVB, Eurostat
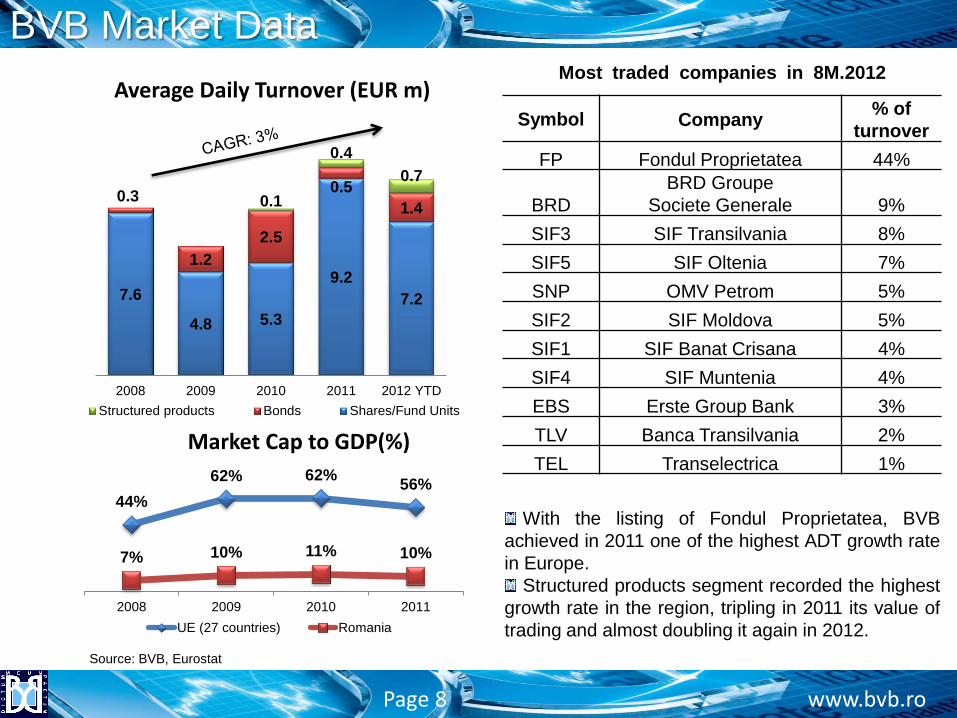
Most traded companies in 8M.2012
Symbol Company % of
turnover
FP Fondul Proprietatea 44%
BRD
BRD Groupe
Societe Generale 9%
SIF3 SIF Transilvania 8%
SIF5 SIF Oltenia 7%
SNP OMV Petrom 5%
SIF2 SIF Moldova 5%
SIF1 SIF Banat Crisana 4%
SIF4 SIF Muntenia 4%
EBS Erste Group Bank 3%
TLV Banca Transilvania 2%
TEL Transelectrica 1%
With the listing of Fondul Proprietatea, BVB
achieved in 2011 one of the highest ADT growth rate
in Europe.
Structured products segment recorded the highest
growth rate in the region, tripling in 2011 its value of
trading and almost doubling it again in 2012.
7.6
4.8 5.3
9.2
7.2
0.3
1.2
2.5
0.5
1.4 0.1
0.4
0.7
2008 2009 2010 2011 2012 YTD
Average Daily Turnover (EUR m)
Structured products Bonds Shares/Fund Units
44%
62% 62% 56%
7% 10% 11% 10%
2008 2009 2010 2011
Market Cap to GDP(%)
UE (27 countries) Romania
Page 9 www.bvb.ro
Romanian Government’s ambitious plan for 2012-2013
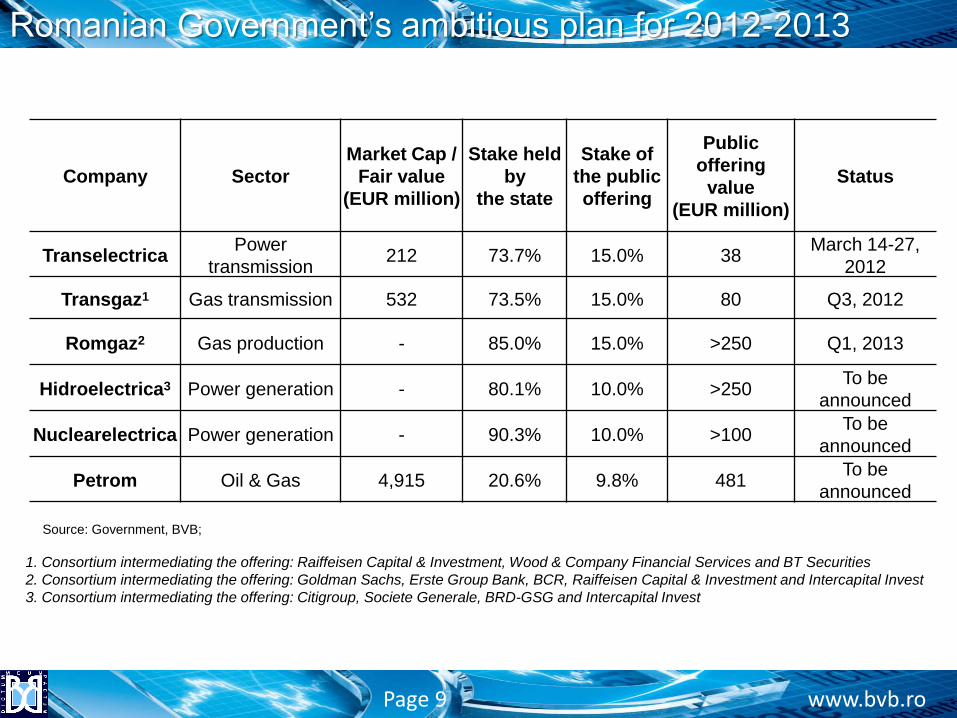
Company Sector
Market Cap /
Fair value
(EUR million)
Stake held
by
the state
Stake of
the public
offering
Public
offering
value
(EUR million)
Status
Transelectrica Power
transmission 212 73.7% 15.0% 38
March 14-27,
2012
Transgaz1 Gas transmission 532 73.5% 15.0% 80 Q3, 2012
Romgaz2 Gas production - 85.0% 15.0% >250 Q1, 2013
Hidroelectrica3 Power generation - 80.1% 10.0% >250 To be
announced
Nuclearelectrica Power generation - 90.3% 10.0% >100 To be
announced
Petrom Oil & Gas 4,915 20.6% 9.8% 481 To be
announced
Source: Government, BVB;
1. Consortium intermediating the offering: Raiffeisen Capital & Investment, Wood & Company Financial Services and BT Securities
2. Consortium intermediating the offering: Goldman Sachs, Erste Group Bank, BCR, Raiffeisen Capital & Investment and Intercapital Invest
3. Consortium intermediating the offering: Citigroup, Societe Generale, BRD-GSG and Intercapital Invest

Page 10 www.bvb.ro
BVB Market Data
Source: Investors Compensation Fund
Reporting 2012 and 2011 compensation ceiling is EUR 20,000, and EUR 15,000 for 2010
figures
Over 80% of investors’ accounts have portfolios bellow EUR 20,000 and are fully
compensated
The number of investors acccounts includes total number of accounts on the Romanian
capital market, no matter if an investor has accounts at several brokers.
65,304
87,664 92,865
101,254 94,545
86,453 88,143 90,621
31.12.2006 31.12.2007 31.12.2008 30.06.2009 31.12.2009 31.12.2010 31.12.2011 30.06.2012
Investor's accounts
Fully compensated investors Ceiling compensated investors Excluded investors Total investors

Page 11 www.bvb.ro
BVB Pricing Policy
Cash Equity Market Sell Buy*
Jan 2006 - May 2007 15 bps 7bps
June 2007 - Sep 2008 14bps 6bps
Oct 2008 - February
2009 13bps 5bps
After March 2009 11.7bps 4.5bps
*plus 8 bps CNVM fee on the value of a buy trade;
**plus RON 0.1 CNVM fee on each traded futures contract.
Note: Fees in basis points (bps) are charged on the value, to both counterparties (buy & sell);
BVB and CNVM fees do not refer to Market Makers.
Current pricing policy
Historical trading fees
Participants annual maintaining fee
RON 1,500,
including VAT
Issuers annual maintaining fee
btw. RON 3,600 and
RON 21,000,
without VAT
Trading fees Sell Buy
Shares, Fund Units
Main Market + Deal 11.7bps 4.5bps*
Structured products 12 bps 5bps*
Bonds 2.16 bps
T-bills 0.08bps,
btw RON 1 and 81
Futures An average of RON 0.1 per
contract **
Source: BVB

Page 12 www.bvb.ro
Growing operating performance
RON million
2008 2009 2010 2011 2012
Budget
2012
budget
vs.
2011
Sales revenue 20.9 12.4 13.1 21.7 25.2 16%
Operating Revenue 20.9 12.4 13.2 21.7 25.2 16%
Operating Expense 15.5 13.9 12.9 15.3 17.6 15%
EBITDA 7.2 -0.1 1.0 7.1 8.6 21%
Operating result 5.4 -1.5 0.3 6.4 7.6 20%
Financial Result 6.8 11.1 6.2 12.4 5.1 -59%
Net Income 10.6 8.5 5.7 17.0 11.1 -35%
EPS 1.4 1.1 0.7 2.2 1.5 -35%
RAS figures, acc. to EU
Directive No 4 Individual P&L overview
2011 was the best year since 2007, in terms of net profit, due to the listing of Fondul Proprietatea in
January 2011 which almost doubled ADT, and due to the one-off dividend received from the Central
Depository for the 2007 result.
BVB budget for 2012 is based on a 16% increase in sales revenue and a less than 15% advance in the
operating expenses.
Estimated financial result for 2012 is RON 5.1 million, down 59% than 2011, due to recording in 2011 of
dividends from Central Depository for the 2007 result – RON 4.3 million and 2010 result – RON 3.9 million,
compared to an estimated dividend for the 2011 result of RON 1.9 million (50% lower than 2010).

Page 13 www.bvb.ro
Key Financial results
• Sales revenue stood at RON 4.93 million in Q2.2012 despite a decrease of trading revenue, compensated
by the increase in data dissemination and listing revenues.
• Operating expense decreased by 12.5% in Q2.2012, mainly due to an almost 7% decrease in personnel
costs and lower expenses for promotion activities and functioning.
• The decrease of the financial result was mainly due to lower dividends to be received from the Central
Depository, of only RON 1.88 million in 2012 compared to RON 8.20 million in 2011. Last year Central
Depository’ dividends included an exceptional dividend for the 2007 result and a dividend for the strong
2010 result, influenced by the numerous transfers with Fondul Proprietatea shares before the listing.
Further weakening of RON against EURO and USD allowed BVB to record revenue from the revaluation of
BVB cash holdings and short-term investments in foreign currency.
*The financial data
are not audited and
represent the
individual results of
the Bucharest Stock
Exchange, in
accordance with the
Romanian standards
of accounting (RAS);
the financial
indicators are in
million lei and are
rounded.
RON million
Q2.2012 Q2.2011
Q2.2012
vs.
Q2.2011
H1.2012 H1.2011
H1.2012
vs.
H1.2011
Sales revenue 4.93 4.92 +0.5% 9.95 10.90 -9%
Operating expense,
out of which: 3.20 3.66 -12% 6.29 6.64 -5%
- Personnel expenses 1.54 1.66 -7% 3.14 3.17 -1%
Operating result 1.73 1.26 +37% 3.66 4.26 -14%
Financial result 3.67 9.52 -61% 4.91 9.14 -46%
Gross result 5.40 10.78 -50% 8.56 13.40 -36%
Net result 4.86 10.30 -53% 7.64 12.50 -39%
Net result per share (RON) 0.63 1.34 -53% 1.00 1.63 -39%

Page 14 www.bvb.ro
Revenues and expenses breakdown
Trading revenue, including public offers,
decreased by approx. 5%, despite a 30%
decline in trading revenue in equity and fund
units markets, compensated by higher
revenue from structured products trading and
supplemented by the Azomures offer.
Listing revenue was up due to increasing
number of companies paying maintenance to
trading fees and increase in price levels of
some companies which caused a higher level
of the fee for those companies.
Data vending revenue was up following
recording of monthly estimates for some data
vending contracts, according to accrual
recording method, applied starting 2012.
4.28
4.13
0.27
0.32
0.26
0.31
0.10 0.17
Q2.2011 Q2.2012
Breakdown of the operating revenue (RON m)
Alte venituri/ Other revenues
Vânzare date/ Data vending
Listare/ Listing
Tranzacționare/ Trading
Page 15 www.bvb.ro
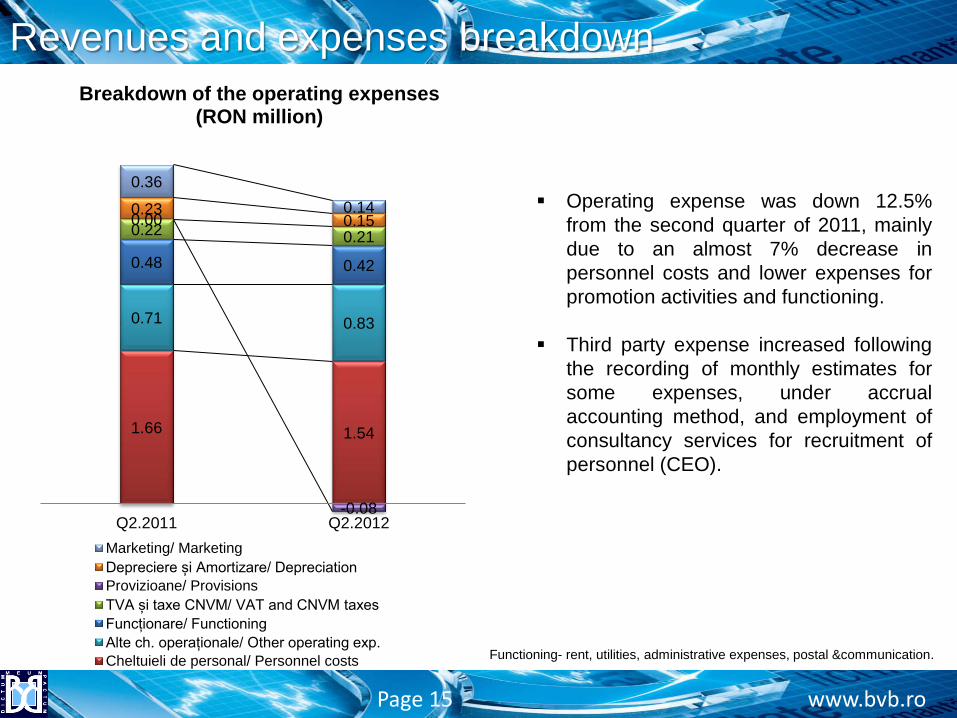
Revenues and expenses breakdown
Operating expense was down 12.5%
from the second quarter of 2011, mainly
due to an almost 7% decrease in
personnel costs and lower expenses for
promotion activities and functioning.
Third party expense increased following
the recording of monthly estimates for
some expenses, under accrual
accounting method, and employment of
consultancy services for recruitment of
personnel (CEO).
Functioning- rent, utilities, administrative expenses, postal &communication.
1.66 1.54
0.71 0.83
0.48 0.42
0.22 0.21 0.00
-0.08
0.23 0.15
0.36
0.14
Q2.2011 Q2.2012
Breakdown of the operating expenses (RON million)
Marketing/ Marketing
Depreciere și Amortizare/ Depreciation
Provizioane/ Provisions
TVA și taxe CNVM/ VAT and CNVM taxes
Funcționare/ Functioning
Alte ch. operaționale/ Other operating exp.
Cheltuieli de personal/ Personnel costs
Page 16 www.bvb.ro
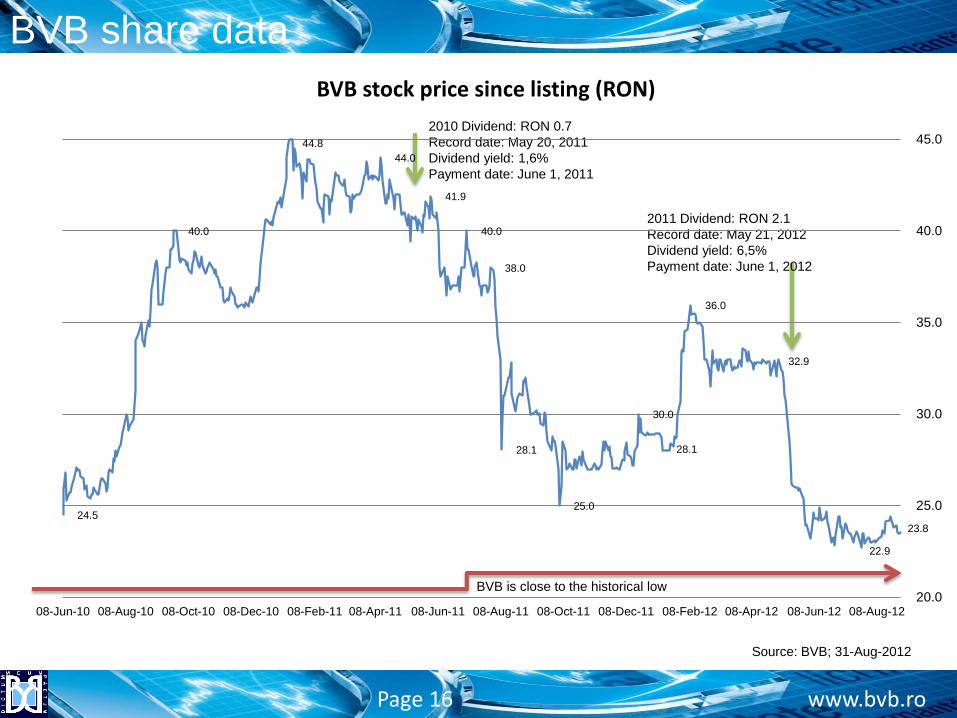
BVB share data
2010 Dividend: RON 0.7
Record date: May 20, 2011
Dividend yield: 1,6%
Payment date: June 1, 2011
BVB is close to the historical low
Source: BVB; 31-Aug-2012
2011 Dividend: RON 2.1
Record date: May 21, 2012
Dividend yield: 6,5%
Payment date: June 1, 2012
24.5
40.0
44.8
44.0
41.9
40.0
38.0
28.1
25.0
30.0
28.1
36.0
32.9
22.9
23.8
20.0
25.0
30.0
35.0
40.0
45.0
08-Jun-10 08-Aug-10 08-Oct-10 08-Dec-10 08-Feb-11 08-Apr-11 08-Jun-11 08-Aug-11 08-Oct-11 08-Dec-11 08-Feb-12 08-Apr-12 08-Jun-12 08-Aug-12
BVB stock price since listing (RON)
Page 17 www.bvb.ro
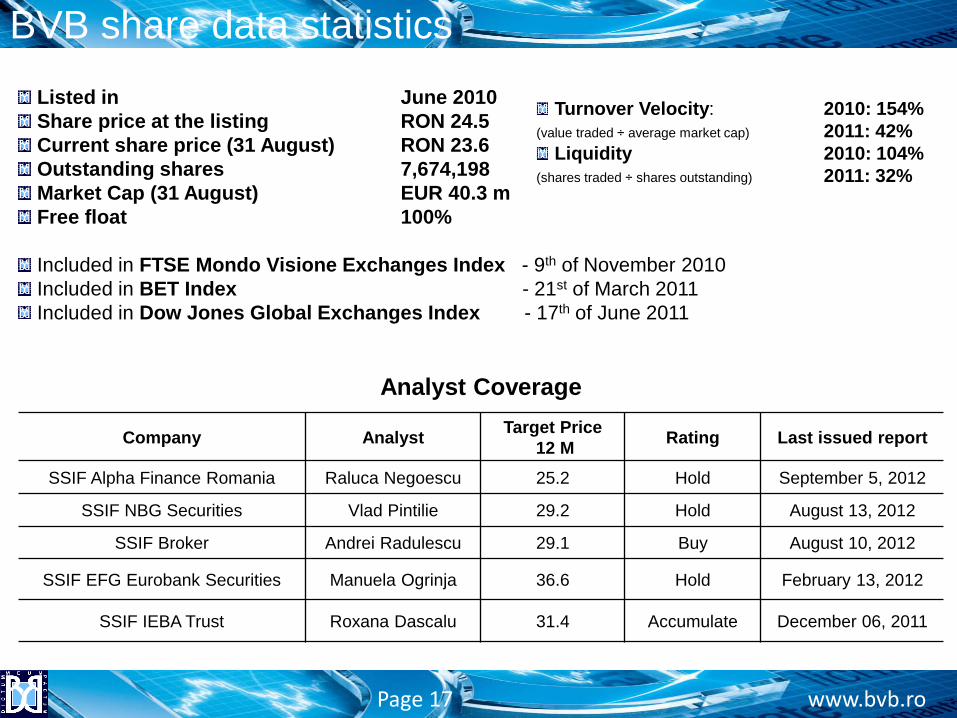
BVB share data statistics
Listed in June 2010
Share price at the listing RON 24.5
Current share price (31 August) RON 23.6
Outstanding shares 7,674,198
Market Cap (31 August) EUR 40.3 m
Free float 100%
Included in FTSE Mondo Visione Exchanges Index - 9th of November 2010
Included in BET Index - 21st of March 2011
Included in Dow Jones Global Exchanges Index - 17th of June 2011
Turnover Velocity: 2010: 154%
(value traded ÷ average market cap) 2011: 42%
Liquidity 2010: 104%
(shares traded ÷ shares outstanding) 2011: 32%
Analyst Coverage
Company Analyst Target Price
12 M Rating Last issued report
SSIF Alpha Finance Romania Raluca Negoescu 25.2 Hold September 5, 2012
SSIF NBG Securities Vlad Pintilie 29.2 Hold August 13, 2012
SSIF Broker Andrei Radulescu 29.1 Buy August 10, 2012
SSIF EFG Eurobank Securities Manuela Ogrinja 36.6 Hold February 13, 2012
SSIF IEBA Trust Roxana Dascalu 31.4 Accumulate December 06, 2011
Page 18 www.bvb.ro
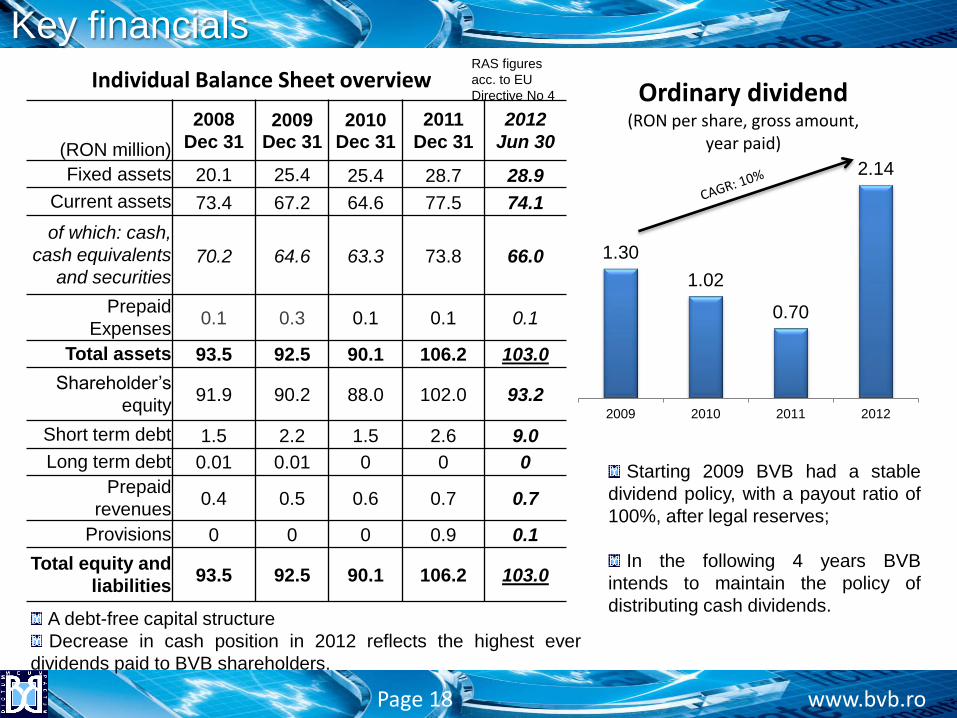
Key financials
(RON million)
2008
Dec 31 2009
Dec 31 2010
Dec 31
2011
Dec 31
2012
Jun 30
Fixed assets 20.1 25.4 25.4 28.7 28.9
Current assets 73.4 67.2 64.6 77.5 74.1
of which: cash,
cash equivalents
and securities 70.2 64.6 63.3 73.8 66.0
Prepaid
Expenses 0.1 0.3 0.1 0.1 0.1
Total assets 93.5 92.5 90.1 106.2 103.0
Shareholder’s
equity 91.9 90.2 88.0 102.0 93.2
Short term debt 1.5 2.2 1.5 2.6 9.0
Long term debt 0.01 0.01 0 0 0
Prepaid
revenues 0.4 0.5 0.6 0.7 0.7
Provisions 0 0 0 0.9 0.1
Total equity and
liabilities 93.5 92.5 90.1 106.2 103.0
RAS figures
acc. to EU
Directive No 4 Individual Balance Sheet overview
A debt-free capital structure
Decrease in cash position in 2012 reflects the highest ever
dividends paid to BVB shareholders.
1.30
1.02
0.70
2.14
2009 2010 2011 2012
Ordinary dividend (RON per share, gross amount,
year paid)
Starting 2009 BVB had a stable
dividend policy, with a payout ratio of
100%, after legal reserves;
In the following 4 years BVB
intends to maintain the policy of
distributing cash dividends.
Page 19 www.bvb.ro
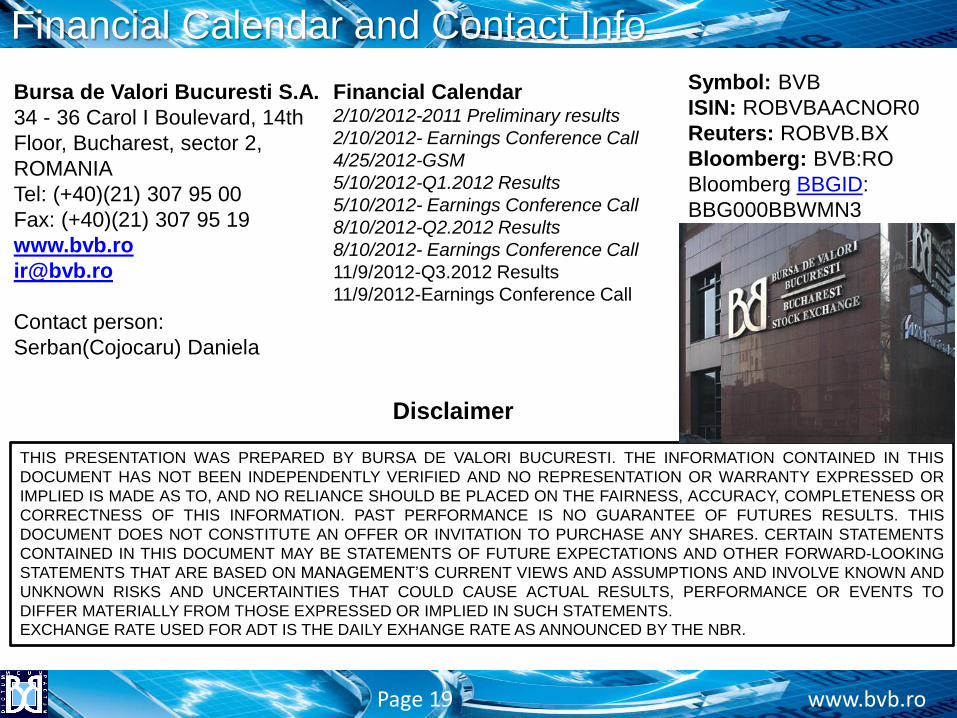
Financial Calendar and Contact Info
Bursa de Valori Bucuresti S.A.
34 - 36 Carol I Boulevard, 14th
Floor, Bucharest, sector 2,
ROMANIA
Tel: (+40)(21) 307 95 00
Fax: (+40)(21) 307 95 19
www.bvb.ro
Contact person:
Serban(Cojocaru) Daniela
Symbol: BVB
ISIN: ROBVBAACNOR0
Reuters: ROBVB.BX
Bloomberg: BVB:RO
Bloomberg BBGID:
BBG000BBWMN3
THIS PRESENTATION WAS PREPARED BY BURSA DE VALORI BUCURESTI. THE INFORMATION CONTAINED IN THIS
DOCUMENT HAS NOT BEEN INDEPENDENTLY VERIFIED AND NO REPRESENTATION OR WARRANTY EXPRESSED OR
IMPLIED IS MADE AS TO, AND NO RELIANCE SHOULD BE PLACED ON THE FAIRNESS, ACCURACY, COMPLETENESS OR
CORRECTNESS OF THIS INFORMATION. PAST PERFORMANCE IS NO GUARANTEE OF FUTURES RESULTS. THIS
DOCUMENT DOES NOT CONSTITUTE AN OFFER OR INVITATION TO PURCHASE ANY SHARES. CERTAIN STATEMENTS
CONTAINED IN THIS DOCUMENT MAY BE STATEMENTS OF FUTURE EXPECTATIONS AND OTHER FORWARD-LOOKING
STATEMENTS THAT ARE BASED ON MANAGEMENT’S CURRENT VIEWS AND ASSUMPTIONS AND INVOLVE KNOWN AND
UNKNOWN RISKS AND UNCERTAINTIES THAT COULD CAUSE ACTUAL RESULTS, PERFORMANCE OR EVENTS TO
DIFFER MATERIALLY FROM THOSE EXPRESSED OR IMPLIED IN SUCH STATEMENTS. EXCHANGE RATE USED FOR ADT IS THE DAILY EXHANGE RATE AS ANNOUNCED BY THE NBR.
Financial Calendar 2/10/2012-2011 Preliminary results
2/10/2012- Earnings Conference Call
4/25/2012-GSM
5/10/2012-Q1.2012 Results
5/10/2012- Earnings Conference Call
8/10/2012-Q2.2012 Results
8/10/2012- Earnings Conference Call
11/9/2012-Q3.2012 Results
11/9/2012-Earnings Conference Call
Disclaimer
Page 20 www.bvb.ro
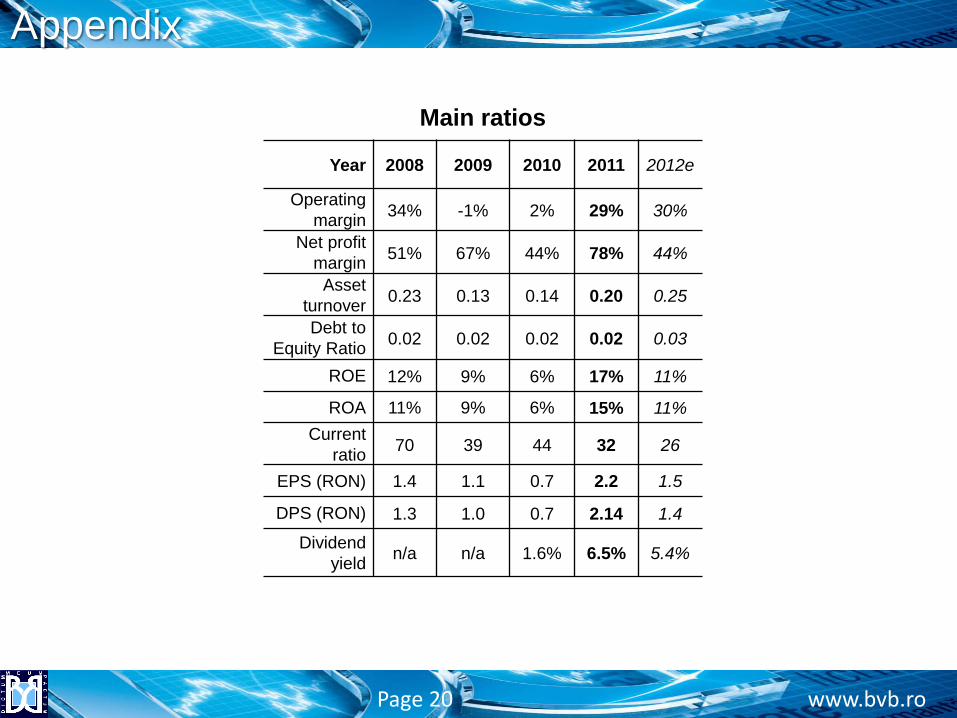
Appendix
Main ratios
Year 2008 2009 2010 2011 2012e
Operating
margin 34% -1% 2% 29% 30%
Net profit
margin 51% 67% 44% 78% 44%
Asset
turnover 0.23 0.13 0.14 0.20 0.25
Debt to
Equity Ratio 0.02 0.02 0.02 0.02 0.03
ROE 12% 9% 6% 17% 11%
ROA 11% 9% 6% 15% 11%
Current
ratio 70 39 44 32 26
EPS (RON) 1.4 1.1 0.7 2.2 1.5
DPS (RON) 1.3 1.0 0.7 2.14 1.4
Dividend
yield n/a n/a 1.6% 6.5% 5.4%


![[Bucharest] #DontTrustTheDarkSide](https://img.pdfslide.us/doc/110x75/58f138b31a28ab4e5d8b45b1/bucharest-donttrustthedarkside.jpg)