Embed Size (px)
Citation preview
Bubble behaviour in frother and
inorganic salt solutions
Jarrett Quinn
Department of Mining and Materials Engineering,
McGill University,
Montreal, Canada
A thesis submitted to McGill University in partial fulfillment of the
requirements of the degree of Doctor of Philosophy
© Jarrett Quinn
April 2014

i
Abstract
Bubble formation, coalescence and break-up processes coupled with bubble velocity determine
gas dispersion properties in a flotation cell. Frothers are typically added to inhibit bubble
coalescence (decrease bubble size) and reduce bubble rise velocity. If present at elevated
concentration the presence of certain inorganic salts has been shown to have a similar capability
to frother.
Much of the literature focuses on the role of bubble coalescence on the production of fine
bubbles. Researchers have hinted that the presence of frother may also affect bubble break-up.
For the most part, little attention has been paid to the role of frother in bubble break-up. A few
researchers have noted that bubble-bubble interactions may play a role in bubble break-up
processes.
The first study in the thesis examines bubble formation in water at a capillary using high-speed
photography and reviews the processes which lead to bubble break-up. Several authors have
noted bi-modal bubble size distributions (BSD) in flotation systems at low frother or inorganic
salt concentrations. The origin appears to be related to bubble-bubble interactions. The study
provides visual evidence of coalescence-related and wake-related mechanisms creating fine
bubbles and bi-modal distributions. Four coalescence mechanisms are identified: coalescence-
induced break-up, droplet formation and collision, liquid jet formation and collision, liquid jet
disruption to droplets and collision; and two wake-related events: distortion and break-up of
trailing bubble, and premature detachment. Comparing the fine/coarse mode ratio in water only
systems (ca. 1/10) the possible relevant mechanisms are suggested. Knowing that frothers
produce a mono-modal BSD and act to retard coalescence, the origin of the bi-modal BSD is
argued to be coalescence-related.
The second study uses a similar technique to quantify the effect of frothers and inorganic salts on
bubble regimes at a capillary. High-speed photography was used to determine the transition air
flow rate between non-coalescence, coalescence, and coalescence with fine bubble production
(break-up). The addition of solute inhibited bubble coalescence and delayed the onset of fine
bubble production. The tests allow for frother and salt strength characterization.
ii
The third set of experiments uses passive acoustic emission monitoring to study the role of solid
particles on bubble coalescence. The systems being opaque argue against the use of optical
techniques. The effect of 1 to 10% w/w talc (hydrophobic) or silica (hydrophilic) on air bubble
formation and coalescence at a capillary in the presence of MIBC or sodium chloride was
determined. Both solids slightly inhibited bubble coalescence while the silica created a larger
region of partial coalescence compared to talc. At 10% w/w the silica appeared to promote
coalescence at high MIBC concentration.
Frothers and certain inorganic salts not only inhibit bubble coalescence but also reduce bubble
rise velocity. Upon inspection of high-speed records of rising bubbles, it became clear that the
presence of solute affected bubble shape and rise velocity in tandem. A study was undertaken to
examine the relationship between bubble shape and rise velocity for a single rising bubble.
Individual bubbles ca. 2.3 mm in diameter were produced at a capillary in water containing an
inorganic salt (NaClO4, KCl, NaCl, Na2SO4, or CaCl2). Using high-speed photography and
image analysis techniques, bubble aspect ratio and rise velocity were measured at 1 ms time
intervals over a distance ca. 1.15 to 1.20 m above the capillary. All conditions showed
oscillations in bubble aspect ratio and velocity that were related. Increasing concentration, on
average, created more spherical bubbles that rose at lower velocities. The same observations
were made in the presence of MIBC frother. Results suggest a unique relationship between
bubble shape and rise velocity independent of solute type.
iii
Résumé
Les procédés de formation, coalescence et scission des bulles couplés à la vitesse d’ascension
déterminent la dispersion du gaz dans une cellule de flottation. Des agents moussants sont
généralement ajoutés à la pulpe afin d'éviter la coalescence et réduire la vitesse des bulles. Avec
une concentration élevée, certains composés inorganiques ont le même effet que les agents
moussants.
La documentation actuelle focus sur le rôle de l’inhibition de la coalescence dans la production
de bulles de tailles fines. Certaines recherches semblent montrer que la présence des agents
moussants peut aussi affecter la scission des bulles. Généralement, peu d’attention est accordée
au rôle de la scission de bulles. D’autres recherches ont aussi montré des liens entre la
coalescence et la scission.
La première étude présentée met l'emphase sur la formation des bulles au bout d'un tube
capillaire immergé dans l'eau en utilisant la photographie à haute vitesse afin de réexaminer les
procédés à l'origine de la scission. Plusieurs auteurs ont noté la présence d’une distribution de la
taille des bulles (DTB) qui est bimodale pour des systèmes de flottation ayant de faibles
concentrations d'agent moussant ou de composé inorganique. Cette distribution semble être
reliée à des interactions bulles-bulles. L’étude démontre visuellement des mécanismes reliés à la
coalescence et à la trainée d'une bulle créant des bulles plus fines et ainsi une distribution
bimodale. Quatre mécanismes reliés à la coalescence ont été identifiés : la scission causée par la
coalescence, la production de gouttelettes et collision, la formation de jet-liquide et collision
ainsi que la formation de liquide-jet suivi d'une fragmentation en gouttelettes et collision. Deux
mécanismes reliés à la trainée ont aussi été identifiés : la distorsion et la scission de la bulle de
trainée et le détachement prématuré. La comparaison des modes des petites et grosses bulles
(d’un rapport 1/10) révèle les mécanismes potentiels. Sachant que les agents moussants
produisent une DTB monomodal et que leurs rôles est de prévenir la coalescence, la création de
la DTB bimodal semble être relié à la coalescence.
La deuxième étude utilise une technique similaire pour quantifier l’effet des agents moussant et
des composés inorganiques sur le type de bulles produites au bout d'un tube capillaire. La
photographie à haute vitesse a été utilisée pour déterminer la transition entre la non-coalescence,
iv
la coalescence, et la coalescence avec scission. L’ajout d'un soluté inhibe la coalescence des
bulles et retarde le début de la production des petites bulles. Les résultats permettent la
caractérisation des agents moussants en termes de puissance.
Le troisième groupe d’expériences utilise l'enregistrement des signaux sonores passifs pour
étudier le rôle des particules (hydrophobes et hydrophiles) sur la coalescence des bulles.
Plusieurs études utilisent des techniques optiques pour mesurer directement ou indirectement
l’effet d'un soluté sur la coalescence des bulles. Les techniques optiques sont typiquement
limitées à l'étude de systèmes biphasés (solution-air) puisque les systèmes triphasés (solution-air-
particules) sont généralement opaques. L'enregistrement des signaux sonores passifs a été utilisé
pour déterminer l’effet des particules (en concentration de 1 à 10 % m/m de talc ou de silice), sur
la formation et la coalescence des bulles produites au bout d'un tube capillaire en présence de
MIBC ou chlorure de sodium. Les deux types de particules ont inhibé la coalescence de bulles et
la silice a crée la plus grande région de coalescence partielle en comparaison au talc. À 10 %
m/m de silice, la coalescence est favorisée s'il y a haute concentration de MIBC.
Non seulement les agents moussants et certains composés inorganiques inhibent la coalescence
des bulles, mais ils réduisent aussi la vitesse d’ascension. La photographie des bulles ascendantes
à clairement montré que la présence de soluté affectait la forme et la vitesse des bulles de façon
combinée. Une étude a donc été menée afin d’examiner la relation entre la forme et la vitesse des
bulles. Des bulles individuelles d'environ 2.3 mm de diamètre ont été produites au bout d'un tube
capillaire immergé dans de l'eau contenant un composé inorganique (NaClO4, KCl, NaCl,
Na2SO4, or CaCl2). À l'aide de la photographie à haute vitesse et de techniques d’analyse
d’image, le facteur de forme et la vitesse d’ascension de bulles ont été mesurés à un intervalle de
1 ms à une distance d'environ 1.15 à 1.20 m au-dessus du capillaire. Tous les mélanges ont
montré des oscillations du facteur de forme et de la vitesse d’ascension reliées. Généralement en
augmentant la concentration, on crée des bulles plus sphériques montant à une vitesse plus faible.
Les mêmes observations ont été faites en présence de MIBC. Les résultats suggèrent une
corrélation unique entre la forme et la vitesse d’ascension des bulles, indépendamment du type
de soluté présent. Les effets des composés inorganiques sur le comportement des bulles et la
dispersion du gaz dans un système de flottation sont aussi discuté.

v
Acknowledgements
It has been a pleasure to do my graduate studies under the supervision of Professor James A.
Finch. His encouragement, enthusiasm and wealth of knowledge have brought about this work. I
very much appreciate the many hours spent proof-reading and correcting this thesis and the
articles we have written.
Funding for this work was sponsored by Vale, Teck Resources, Xstrata Process Support, Barrick
Gold, Shell Canada, SGS Lakefield Research, COREM and Flottec through the Chair in Mineral
Processing under the Natural Sciences and Engineering Research Council of Canada (NSERC)
Collaborative Research and Development (CRD) program. I would also like to acknowledge the
Hydro-Quebec doctoral award and the Vadasz fellowship for financial support under the McGill
Engineering Doctoral Award (MEDA) program.
The McGill mineral processing group is ever changing and I would like to thank all my
colleagues past and present for their friendship. I would especially like to thank Dr. Miguel
Maldonado, Ray Langlois and Prof. Kristian Waters for their help.
I would also like to thank my family for all their encouragement and a very big thank you to
Vera for all her love and support.

vi
Table of contents
Abstract .................................................................................................................................... i
Acknowledgements ................................................................................................................. v
Table of contents .................................................................................................................... vi
List of figures .......................................................................................................................... x
Chapter 1 – Introduction ....................................................................................................... 1
1.1 Introduction ......................................................................................................... 1
1.2 Thesis objectives ................................................................................................. 4
1.3 Thesis structure ................................................................................................... 5
1.4 Contribution of authors ....................................................................................... 5
References ................................................................................................................. 6
Chapter 2 – Literature review ............................................................................................. 10
2.1 Frothers: Chemistries and classifications .......................................................... 10
2.1.1 Hydrophilic-lipophilic balance (HLB) .................................................. 12
2.2 Inorganic salts ................................................................................................... 13
2.3 Bubble formation, coalescence and break-up ................................................... 16
2.4 Frother characterization techniques .................................................................. 20
2.4.1 Bubble coalescence tests ....................................................................... 21
2.4.2 Critical coalescence concentration (CCC) ............................................ 22
2.4.3 Gas holdup vs. frother / salt concentration ........................................... 23
2.5 The behaviour of a single rising bubble ............................................................ 24
2.5.1 Surfactants, bubble rigidity and internal circulation ............................. 25
2.5.2 Bubble terminal velocity ....................................................................... 25
2.5.3 Forces acting on a rising bubble ........................................................... 28

vii
2.5.4 Dimensionless numbers ........................................................................ 28
2.5.5 Single bubble regimes ........................................................................... 30
2.5.6 Terminal velocity models ..................................................................... 33
2.5.7 Bubble shape, rise velocity and the effect of release condition ............ 36
2.6 Bubbles and sound ............................................................................................ 40
References ............................................................................................................... 42
Chapter 3 – Origin of bi-modal bubble size distributions in the absence of frother ...... 58
3.1 Introduction ....................................................................................................... 58
3.2 Experimental ..................................................................................................... 60
3.3 Results ............................................................................................................... 61
3.4 Discussion ......................................................................................................... 66
3.5 Conclusions ....................................................................................................... 68
References ............................................................................................................... 68
Chapter 4 – Effect of frother and inorganic salts on bubble regimes at a capillary ...... 71
4.1 Introduction ....................................................................................................... 71
4.1.1 Gas dispersion: Frothers and inorganic salts ........................................ 71
4.1.2 Effect of gas rate on bubble formation at a capillary ............................ 72
4.1.3 Motivation for the present study ........................................................... 73
4.2 Experimental ..................................................................................................... 75
4.2.1 Setup ..................................................................................................... 75
4.2.2 Determining bubble regime transitions ................................................. 75
4.2.3 Bubble sizing and image analysis ......................................................... 76
4.3 Results ............................................................................................................... 77
4.4 Discussion ......................................................................................................... 84
viii
4.5 Conclusions ....................................................................................................... 87
References ............................................................................................................... 87
Chapter 5 – Passive acoustic emission monitoring to detect bubble coalescence in
presence of solid particles ..................................................................................... 93
5.1 Introduction ....................................................................................................... 93
5.2 Experimental ..................................................................................................... 96
5.3 Results ............................................................................................................... 98
5.4 Discussion ....................................................................................................... 103
5.5 Conclusions ..................................................................................................... 104
References ............................................................................................................. 105
Chapter 6 – Experimental study on the shape - velocity relationship of an ellipsoidal
bubble in inorganic salt solutions ....................................................................... 109
6.1 Introduction ..................................................................................................... 109
6.2 Experimental ................................................................................................... 111
6.2.1 Setup and image collection ................................................................. 111
6.2.2 Image analysis ..................................................................................... 113
6.3 Results ............................................................................................................. 114
6.4 Discussion ....................................................................................................... 121
6.5 Conclusions ..................................................................................................... 123
References ............................................................................................................. 124
Chapter 7 – Unifying discussion ........................................................................................ 128
References ............................................................................................................. 130
Chapter 8 – Conclusions, contributions, and future work ............................................. 132
8.1 Conclusions ..................................................................................................... 132
8.2 Contributions to original knowledge .............................................................. 133
ix
8.3 Suggestions for future work ............................................................................ 134
References............................................................................................................................ 135
Appendices .......................................................................................................................... 154

x
List of figures
Figure 2.1 – Sketch of negative (A) and positive (B) adsorption at the air-water interface
(modified from Foulk and Miller, 1931) .............................................................................. 15
Figure 2.2 – A) Superior, B) intermediate and C) successor bubble coalescence which creates a
growing bubble which is susceptible to fragmentation (© IOP Publishing Ltd and European
Physical Society. Reproduced by permission of IOP Publishing. All rights reserved.
(Leighton et al., 1991)) ......................................................................................................... 18
Figure 2.3 – Schematic of bubble coalescence-induced break-up (Reprinted with permission
from Elsevier. (Tse et al., 2003)) .......................................................................................... 19
Figure 2.4 – Bubble coalescence-induced break-up (modified from Finch et al., 2008) ............. 19
Figure 2.5 – Schematic of a rising bubble depicting internal and external flow patterns and a
surface concentration gradient (Reprinted with permission from Elsevier. (Dukhin et al.,
1998)) .................................................................................................................................... 25
Figure 2.6 – Typical single bubble velocity profiles (Reprinted with permission from Elsevier.
(Zhang et al., 2001)) ............................................................................................................. 27
Figure 2.7 – Left: Terminal velocity of air bubbles in water at 20°C (Reprinted with permission
from Dover Publishing, Inc. (Clift et al., 2005)), Right: bubble shapes and the force
dominant regimes (modified from Tomiyama and Hayashi, 2002) ...................................... 31
Figure 2.8 – Bubble shape regimes (Reprinted with permission of Dover Publications , Inc. (Clift
et al., 2005) and Cambridge University Press (Bhaga and Weber, 1981)) ........................... 33
Figure 2.9 – Bubble terminal velocity models for water .............................................................. 35
Figure 2.10 – Rise velocities for fast and slow bubbles in tap water (Reprinted with permission
from Elsevier. (Peters and Els, 2012)) .................................................................................. 37
Figure 2.11 – A) Velocity and aspect ratio as a function of time and B) velocity as a function of
aspect ratio for various solution chemistries (Reprinted with permission from Elsevier.
(Kracht and Finch, 2010)) ..................................................................................................... 38
xi
Figure 2.12 – Bubble velocity as a function of aspect ratio for three bubble sizes (modified from
Gomez et al., 2010) ............................................................................................................... 38
Figure 2.13 – A) The effect of MIBC concentration on bubble rise velocity and aspect ratio
(shape), and B) rise velocity as a function of aspect ratio for various solute types (for all
concentrations tested) (Reprinted with permission from Elsevier. (Maldonado et al., 2013))
.............................................................................................................................................. 39
Figure 2.14 – Example hydrophone output showing sound emitted upon bubble formation
(modified from Leighton and Walton, 1987) ........................................................................ 41
Figure 3.1 – Left: Bubble size distribution (number frequency) in water and 10 ppm MIBC
solution, Right: Example image showing large irregular shaped bubbles and fine bubbles
(identified by dashed circle) in the water-only system (modified from Quinn et al., 2007) 58
Figure 3.2 – Experimental setup ................................................................................................... 60
Figure 3.3 – Coalescence-induced bubble break-up (note the reduced time interval - 0.5 ms - for
final three frames). Bubble produced at 500 µm capillary at 70 sccm. ................................ 62
Figure 3.4 – Coalescence-induced droplet formation (4 - 8 ms images) and subsequent bubble
expulsion (16 and 18 ms images). Bubble produced at 500 µm capillary at 70 sccm. ......... 63
Figure 3.5 – Coalescence-induced liquid jet formation and subsequent bubble expulsion. Bubble
produced at a 500 μm capillary with air flow rate 250 sccm. ............................................... 63
Figure 3.6 – Disruption of liquid jet inside bubble leads to droplet which upon impact with the
rear bubble wall expels fine bubbles (13 ms image - indicated with dashed circle). Bubbles
produced at 500 μm capillary at 250 sccm. .......................................................................... 64
Figure 3.7 – Wake-related force causes subsequent bubble deformation and break-up. Bubble
produced at 500 µm capillary at 250 sccm. .......................................................................... 65
Figure 3.8 – Fine bubble formed by premature detachment from the orifice due to the wake of a
previous bubble. Bubble produced at 500 µm capillary at 100 sccm. .................................. 65
Figure 3.9 – Schematics showing: a) coalescence-induced bubble break-up, b) coalescence-
induced droplet formation and, c) coalescence-induced droplet formation and subsequent
bubble break-up. ................................................................................................................... 67

xii
Figure 4.1 – Coalescence plot for 1-pentanol (Reprinted with permission from Elsevier. (Kracht
and Finch (2009b)) ................................................................................................................ 74
Figure 4.2 – Experimental set-up .................................................................................................. 75
Figure 4.3 – Example image sequence showing bubble formation, coalescence and/or fine bubble
production at A) 5 sccm, B) 15 sccm, C) 25 sccm ............................................................... 78
Figure 4.4 – Bubble regime plot for MIBC showing the three regimes and the two major
transitions (i.e., ignoring partial coalescence) (Kracht and Finch (2009b) coalescence data
shown as x’s) ........................................................................................................................ 79
Figure 4.5 – Bubble size distributions in water and 0.98 mM MIBC solution at various air flow
rates ....................................................................................................................................... 80
Figure 4.6 – Number frequency of bubbles below 1 mm and greater than 2.6 mm in water and
0.98 mM MIBC ..................................................................................................................... 81
Figure 4.7 – Bubble regime plots for commercial frothers (closed markers identify the transition
to coalescence and open markers identify the transition to fine bubble production)............ 82
Figure 4.8 – Bubble regime plots for 1-alcohols (closed symbols represent lower transition, open
symbols represent upper transition) ...................................................................................... 83
Figure 4.9 – Bubble regime plots for inorganic salts .................................................................... 84
Figure 4.10 – Bubble regime transitions for inorganic salts as a function of ionic strength ........ 85
Figure 4.11 – Example images of bubbles formed in water and in 0.98 mM MIBC ................... 87
Figure 5.1 – Coalescence plots for MIBC and sodium chloride (modified from Kracht and
Finch, 2009) .......................................................................................................................... 96
Figure 5.2 – Experimental set-up .................................................................................................. 97
Figure 5.3 – Example acoustic signals in 0.01 M NaCl at air flow rates of 8 sccm (non-
coalescence), 9 sccm (partial coalescence), and 10 sccm (complete coalescence) ............. 98
Figure 5.4 – Coalescence plot (transition flow rate vs. concentration) for MIBC (Kracht and
Finch (2009) data shown as closed triangles) ....................................................................... 99
xiii
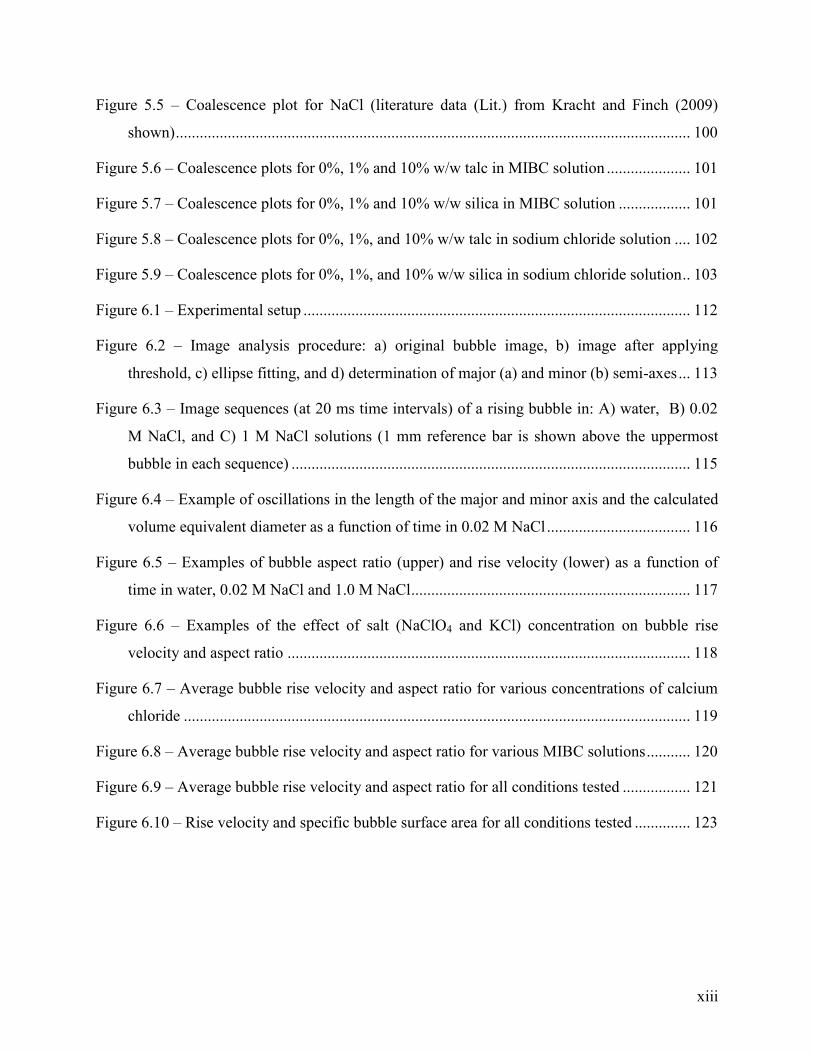
Figure 5.5 – Coalescence plot for NaCl (literature data (Lit.) from Kracht and Finch (2009)
shown) ................................................................................................................................. 100
Figure 5.6 – Coalescence plots for 0%, 1% and 10% w/w talc in MIBC solution ..................... 101
Figure 5.7 – Coalescence plots for 0%, 1% and 10% w/w silica in MIBC solution .................. 101
Figure 5.8 – Coalescence plots for 0%, 1%, and 10% w/w talc in sodium chloride solution .... 102
Figure 5.9 – Coalescence plots for 0%, 1%, and 10% w/w silica in sodium chloride solution .. 103
Figure 6.1 – Experimental setup ................................................................................................. 112
Figure 6.2 – Image analysis procedure: a) original bubble image, b) image after applying
threshold, c) ellipse fitting, and d) determination of major (a) and minor (b) semi-axes ... 113
Figure 6.3 – Image sequences (at 20 ms time intervals) of a rising bubble in: A) water, B) 0.02
M NaCl, and C) 1 M NaCl solutions (1 mm reference bar is shown above the uppermost
bubble in each sequence) .................................................................................................... 115
Figure 6.4 – Example of oscillations in the length of the major and minor axis and the calculated
volume equivalent diameter as a function of time in 0.02 M NaCl .................................... 116
Figure 6.5 – Examples of bubble aspect ratio (upper) and rise velocity (lower) as a function of
time in water, 0.02 M NaCl and 1.0 M NaCl ...................................................................... 117
Figure 6.6 – Examples of the effect of salt (NaClO4 and KCl) concentration on bubble rise
velocity and aspect ratio ..................................................................................................... 118
Figure 6.7 – Average bubble rise velocity and aspect ratio for various concentrations of calcium
chloride ............................................................................................................................... 119
Figure 6.8 – Average bubble rise velocity and aspect ratio for various MIBC solutions ........... 120
Figure 6.9 – Average bubble rise velocity and aspect ratio for all conditions tested ................. 121
Figure 6.10 – Rise velocity and specific bubble surface area for all conditions tested .............. 123
xiv
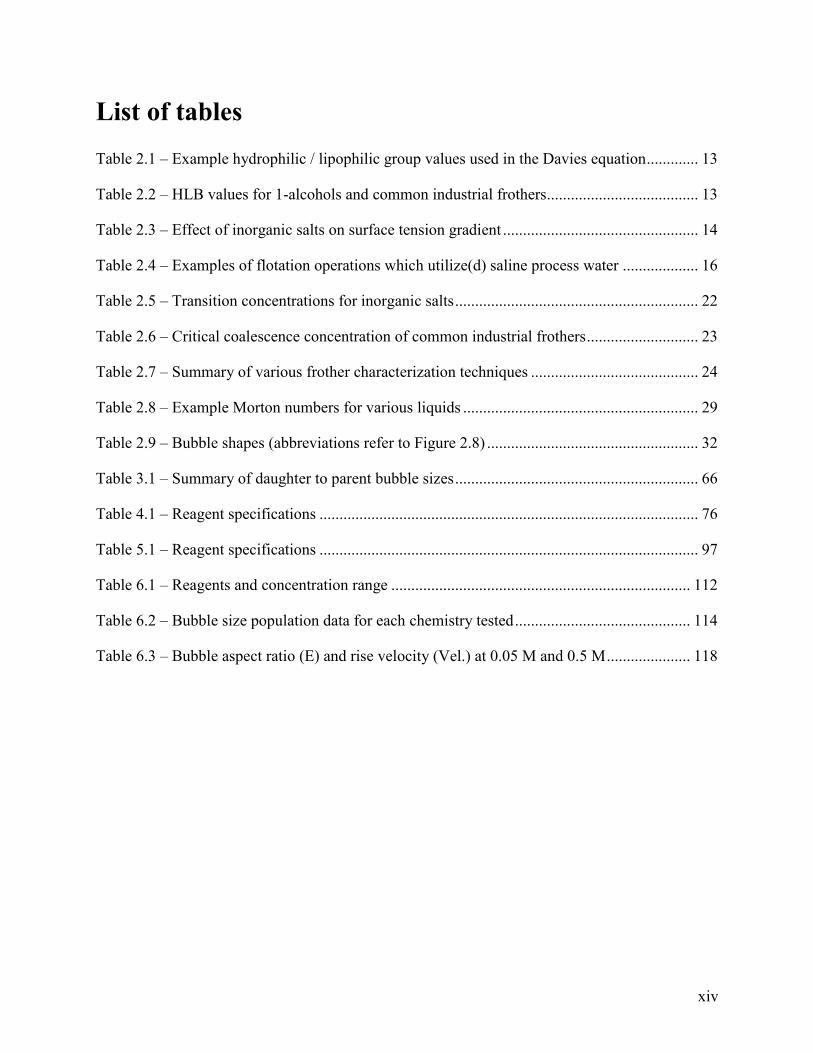
List of tables
Table 2.1 – Example hydrophilic / lipophilic group values used in the Davies equation ............. 13
Table 2.2 – HLB values for 1-alcohols and common industrial frothers ...................................... 13
Table 2.3 – Effect of inorganic salts on surface tension gradient ................................................. 14
Table 2.4 – Examples of flotation operations which utilize(d) saline process water ................... 16
Table 2.5 – Transition concentrations for inorganic salts ............................................................. 22
Table 2.6 – Critical coalescence concentration of common industrial frothers ............................ 23
Table 2.7 – Summary of various frother characterization techniques .......................................... 24
Table 2.8 – Example Morton numbers for various liquids ........................................................... 29
Table 2.9 – Bubble shapes (abbreviations refer to Figure 2.8) ..................................................... 32
Table 3.1 – Summary of daughter to parent bubble sizes ............................................................. 66
Table 4.1 – Reagent specifications ............................................................................................... 76
Table 5.1 – Reagent specifications ............................................................................................... 97
Table 6.1 – Reagents and concentration range ........................................................................... 112
Table 6.2 – Bubble size population data for each chemistry tested ............................................ 114
Table 6.3 – Bubble aspect ratio (E) and rise velocity (Vel.) at 0.05 M and 0.5 M ..................... 118

xv
Figures reproduced with permission
Figure 2.2 Reproduced from Leighton, T.G., Fagan K.J., and Field, J.E., 1991. Acoustic
and photographic studies of injected bubbles. European Journal of Physics 12,
77-85, with permission from IOP Publishing Ltd.
Figure 2.3 Reprinted from Chemical Engineering Science, 58, Tse, K.L., Martin, T.,
McFarlane, C.M., and Nienow, A.W., Small bubble formation via a
coalescence dependent break-up mechanism, 275-286, 2003, with permission
from Elsevier.
Figure 2.5 Reprinted from Studies in Interfacial Science, Drops and Bubbles in Interfacial
Research, Möbius, D., Miller, R. (Eds.), Elsevier Science, 6, Dukhin, S.S.,
Miller, R., and Loglio, G., Physico-chemical hydrodynamics of rising bubbles,
367-432, 1998, with permission from Elsevier. Reproduced from, 1998, with
permission from Elsevier.
Figure 2.6 Reprinted from Chemical Engineering Science, 56, Zhang, Y., McLaughlin,
J.B., and Finch, J.A., Bubble velocity profile and model of surfactant mass
transfer to bubble surface, 6605-6616, 2001, with permission from Elsevier.
Figure 2.7 Reprinted from Bubble, Drops, and Particles, Clift, R., Grace, J.R., and Weber,
M., 2005, with permission from Dover Publications Inc.
Figure 2.8 Reprinted from Bubble, Drops, and Particles, Clift, R., Grace, J.R., and Weber,
M., 2005, with permission from Dover Publications Inc.
Reprinted from Journal of Fluid Mechanics, 82, Bhaga, D., and Weber, M.E.,
Bubbles in viscous liquids: shapes, wakes and velocities, 61-85, 1981, with
permission from Cambridge University Press.

xvi
Figure 2.10 Reprinted from Chemical Engineering Science, 82, Peters, F., and Els, C., An
experimental study on slow and fast bubbles in tap water. 194-199, 2012, with
permission from Elsevier.
Figure 2.11 Reprinted from International Journal of Mineral Processing, 94, Kracht, W.,
and Finch, J.A., Effect of frother on initial bubble shape and velocity,
International Journal of Mineral Processing, 115-120, 2010, with permission
from Elsevier.
Figure 2.13 Reprinted from Chemical Engineering Science, 98, Maldonado, M., Quinn, J.J.,
Gomez, C.O., and Finch, J.A., An experimental study examining the
relationship between bubble shape and rise velocity, 7-11, 2013, with
permission from Elsevier.
Figure 4.1
Reprinted from Kracht, W., and Finch, J.A., Journal of Colloid and Interface
Science, 332, Using sound to study bubble coalescence, 237–245, 2009, with
permission from Elsevier.

1
Chapter 1 – Introduction
1.1 Introduction
Froth flotation is a process used to selectively separate particles based on surface hydrophobicity
and is widely used in the mining industry to separate minerals. Initially used to process base-
metal sulphide minerals, flotation is presently used for a wide variety of minerals (e.g., oxides,
silicates, salts) and energy resources such as coal and bitumen.
Frothers (surfactants) are typically added to flotation circuits to reduce bubble size in the
dispersion of gas (air) in the pulp phase and to promote frothing. Over the past decades, water
availability and quality has become a major issue facing the mining industry. The limited
availability of fresh water in many remote mining locales has forced flotation operations to
recycle water, or to use sea or hyper-saline bore water (Alexander et al., 2012). Research has
shown that the presence of certain soluble inorganic salts can replace the function of frother
(Quinn et al., 2007).
The flotation process evolved in the mid-to-late 1800’s. Much of the early flotation work
involved bulk-oil flotation (patented by William Haynes, 1860). These techniques employed
large amounts of oil that formed agglomerates with the desired mineral which rose through the
slurry due to buoyancy (due to the oil and most probably air entrained in the agglomerates).
Gebrueder Bessel patented a process in 1877 for the recovery of graphite which closely
resembles present-day flotation practice (Lynch et al., 2007). The process involved mixing
ground feed slurry with 1-10% non-polar oil and bringing it to a boil. The graphite particles
attached to the bubbles and rose to the surface where they were skimmed off.
A widely used bulk-oil process was patented by Francis and Alexander Elmore in 1898 for
processing of lead sulphide minerals. Advancements to the process were patented in 1905 and
employed a machine which applied vacuum to generate fine bubbles (Fuerstenau, 1999).
Techniques at the time employed various methods of bubble generation: boiling, air entrainment
during mixing, pressure reduction, or the addition of acid to carbonate bearing ore which would
generate carbon dioxide gas (Fuerstenau, 2007).
2
The modern flotation process is commonly attributed to a patent by Alcid Fromont in 1902
which utilized minute amounts of oil and gas bubbles (Lynch et al., 2007). The patent was later
purchased by Mineral Separations Ltd. (1903) who went on to patent several processes that
resemble current flotation practice (although pneumatic flotation machines, widely used today,
were only developed ca. 1915 (Nesset, 2008)).
The first major commercial flotation operation began in 1905 at Broken Hill, Australia (Broken
Hill Proprietary (BHP)) and produced sphalerite concentrate (Lynch et al., 2007). The flotation
process replaced traditional gravity circuits. Flotation spread and the Butte and Superior Copper
Company operated the first U.S. operation at Basin, Montana starting in 1911 (separating fine
sphalerite from galena) (Fuerstenau, 2007). The first use of flotation in Canada occurred at the
Britannia Beach Copper mine in 1912 which was the first application for copper minerals
(Nesset, 2008). It was noted that the widespread use of the flotation process was somewhat
impeded in the early days due to litigation surrounding patent infringement (Lynch et al., 2007).
Growth in the industry and the advent of chemical companies producing reagents specifically for
the flotation process greatly improved process performance. One major breakthrough was the
decoupling of the action of collectors and frothers. The introduction of water-soluble
thiocarbanilid as a collector improved the operability of the flotation circuit (Perkins and Sayre,
1921; Fuerstenau, 2007). One operator described the development: “thiocarbanilid for the first
time gave the laboring metallurgist something that he could add which would improve the
collection of the sought-for mineral without, at the same time, increasing the frothing to an
uncontrollable degree” (Bean, 1971).
Historically, natural oils (e.g., eucalyptus or pine oil) were used as frothers (Wills and Napier-
Munn, 2006). These reagents typically contained collecting properties which could interfere with
the separation process. The grade of the natural oils was not constant which complicated control.
In a similar fashion to the introduction of thiocarbanilid, the introduction of synthetic non-
collecting frothers (e.g., methyl isobutyl carbinol (MIBC, 4-methyl-2-pentanol) and the
Dowfroth line of frothers (polypropylene glycol (PPG) ether-type)) allowed for the independent
control of collecting and gas dispersion and frothing properties. MIBC and PPG ethers are the
most commonly used frothers and accounted for 80-90% of all frothers used in metallic ore

3
flotation (Pugh, 2007). Many types of synthetic frothers are now available and researchers
continue to develop new chemistries to better suit industry needs (Cappuccitti and Finch, 2007).
Early investigators noted the importance of bubbles in the flotation process. T.A. Rickard (1916)
stated “the key to the flotation process is to be found not in the oil, the acid, or the apparatus, but
in the bubbles.” Gaudin (1934) later said “it is not unlikely that control of flotation can be
exercised through control of the gas.”
The effect of reagent type on the process was noted: “An effective froth represents a multiplicity
of persistent bubbles. The relative stability of the bubbles depends also upon the kind of oil
employed. Pine-oil makes a brittle film: creosote yields an elastic envelope” (Rickard, 1916).
More recently, the terms ‘selective’, ‘powerful’, ‘weak’ or ‘strong’ have been used to
qualitatively characterize frother strength (Cho and Laskowski, 2002a,b; Cappuccitti and Finch,
2007). It was only in the mid-1970s that laboratory characterization techniques were developed
specifically to characterize flotation frothers based on gas dispersion (Pomianowski et al., 1973).
Since then, research has placed an emphasis on understanding the role gas dispersion plays in the
flotation process. The development of industrial gas dispersion sensors (Gomez and Finch, 2002,
2007), analytical techniques to measure frother concentration (Gélinas and Finch, 2005, 2007),
and procedures to quantify the effect of surfactants and inorganic salts (Cho and Laskowski,
2002a,b; Azgomi et al., 2007; Quinn et al., 2007) have allowed for improved understanding of
the role of gas dispersion. Gorain et al. (1997) systematically studied the role of gas dispersion
properties on particle collection and showed that the rate of flotation was directly related to the
available surface area of bubbles passing through the cell (bubble surface area flux, Sb). It is
evident that understanding bubble behaviour is fundamental as bubbles collect and transport
hydrophobic particles from the pulp phase to the froth phase (and then to the launder for
collection).
The mechanisms resulting in bubble formation at a gas dispersing device and the effect frothers
have on bubble formation are not well understood. Much of the research literature has focused on
frothers’ ability to hinder bubble coalescence. Few studies have considered the possible effect of
frothers on bubble break-up though several researchers (Crozier and Klimpel, 1989; Leighton et
al. 1991; Hofmeier et al., 1995; Grau and Laskowski, 2005; Finch et al., 2008; Kracht and Finch,
2009a) have hinted at the importance of break-up in dictating gas dispersion properties. Test
4
procedures are required that are able to discriminate between an anti-coalescence and a break-up
mechanism. This would help explain bubble size reduction in the presence of frother, inorganic
salt, or, indeed, solid particles. Researchers have linked break-up to a coalescence-induced
mechanism, meaning the two processes are possibly linked to one another (Tse et al., 2002;
Quinn et al., 2012). Bubble size and shape also appear to play a role in the break-up process.
Measuring gas dispersion properties in a 3-phase slurry can be difficult. Visual measurements are
typically impossible due to the opacity of the slurry. Special techniques have been developed to
measure gas dispersion properties using various signals (e.g., pressure or conductivity) or
specialized sampling methods (Gomez and Finch, 2002, 2007). Recently, the use of passive
acoustic emission monitoring has been implemented in the laboratory (Kracht and Finch, 2009b)
and in industry (Vanegas et al., 2010; Spencer et al., 2010) to measure properties related to gas
dispersion and particle collection. Bubbles produce sound when they coalesce and break-up and
acoustic monitoring enables detection of these events.
An often overlooked role of frother is the reduction in the rate at which bubbles rise through the
cell (Klimpel and Isherwood, 1991). For typical bubble sizes present in flotation systems (ca. 0.5
- 3 mm diameter), frothers and inorganic salts have been shown to reduce single bubble rise
velocity (Fuerstenau and Wayman, 1958; Detsch, 1991; Nesset et al., 2006). The reduction in
velocity has been linked to change in the shape of the rising bubble (Fuerstenau and Wayman,
1958; Jameson, 1984; Tomiyama et al., 2002; Clift et al., 2005). Investigations into how different
solute types affect this relationship will further our understanding of single bubble systems and
possibly provide clues as to the behaviour of bubbles in a swarm.
1.2 Thesis objectives
The objective of the thesis is to determine the effect of frothers and inorganic salts on bubble
coalescence and break-up, and the shape - rise velocity relationship. Specific objectives include:
1. Determination of the processes of bubble coalescence and break-up at a capillary
2. Determine the effect of frother and inorganic salts on bubble coalescence and break-up at
a capillary in a two-phase (solution-air) system
5
3. Determine coalescence behaviour using acoustic emission monitoring in the presence of
hydrophobic and hydrophilic particles (three-phase system, solution-air-solids) with
frother or inorganic salt present
4. Determine the relationship between bubble shape and rise velocity in frother and
inorganic salt solutions
1.3 Thesis structure
The thesis is presented as a ‘manuscript-based’ thesis. The thesis comprises eight chapters.
Chapter 1 gives an introduction to froth flotation, a brief history of the process and the role of
frothers and inorganic salts. Four of the chapters are manuscripts (chapters 3 - 6). Chapters 3 and
6 have been published in Minerals Engineering:
Quinn, J.J., and Finch, J.A., 2012. On the origin of bi-modal bubble size distributions in the
absence of frother. Minerals Engineering 36, 237-241.
Quinn, J.J., Maldonado, M., Gomez, C.O., and Finch, J.A., 2014. Experimental study on the
shape - velocity relationship of an ellipsoidal bubble in inorganic salt solutions. Minerals
Engineering 55, 5-10.
Chapters 4 and 5 will be submitted for publication. Chapter 7 presents a unifying discussion
which links the individual topics covered in each manuscript. Finally, Chapter 8 presents
conclusions, contributions to knowledge and suggestions for future work.
1.4 Contribution of authors
All the manuscripts are co-authored by Prof. James A. Finch in his capacity as research
supervisor. The manuscript entitled ‘Experimental study on the shape - velocity relationship of
an ellipsoidal bubble in inorganic salt solutions’ (Chapter 6) was also co-authored by Dr. Miguel
Maldonado (Post-doctoral fellow), and Dr. Cesar O. Gomez (Senior research associate), both of
McGill University. Dr. Maldonado aided in running the experiments (i.e., image acquisition) and
Dr. Gomez assisted in proofreading the manuscript. Jarrett Quinn performed the experiments,

6
image analysis, data tabulation and analysis for all the tests and wrote the first draft of each
chapter and considered the comments of the co-authors in preparation of the final manuscripts.
References
Alexander, S., Quinn, J., van der Spuy, J.E., and Finch, J.A., 2012. Correlation of graphite
flotation and gas holdup in saline solutions. In: Drelich, J. (Ed.), Water in Mineral Processing:
Proceedings of the First International Symposium, SME, 41-50.
Azgomi, F., Gomez, C.O., and Finch, J.A., 2007. Characterizing frothers using gas hold-up.
Canadian Metallurgical Quarterly 46, 3, 237-242.
Bean, J.J., May 1971. Tale of tails. Mining World, 59.
Cappuccitti, F., and Finch, J.A., 2007. Development of new frothers through hydrodynamic
characterization. In: Folinsbee, J. (Ed.), Proceedings 39th Annual Meeting of the Canadian
Mineral Processors of CIM, 399–412.
Cho, Y.S., and Laskowski, J.S., 2002a. Effect of flotation frothers on bubble size and foam
stability. International Journal of Minerals Processing 64, 69-80.
Cho, Y.S., and Laskowski, J.S., 2002b. Bubble coalescence and its effect on bubble size and
foam stability. Canadian Journal of Chemical Engineering 80, 299-305.
Crozier, R.D., and Klimpel, R.R., 1989. Frothers: Plant practice. Mineral Processing and
Extractive Metallurgy Review, 5, 1-4, 257-279.
Detsch, R.M., 1991. Small air bubbles in reagent grade water and seawater: Rise velocities of 20
to 1000-μm diameter bubbles. Journal of Geophysical Research 96, C5, 8901-8906.
Elmore, F.E., 1898. British Patent 21,948.
Fuerstenau, D.W., 1999. The froth flotation century. In: Parekh, B.K., and Miller, J.D.
(Eds.), Advances in Flotation Technology. SME, 3-21.
Fuerstenau, D.W., 2007. A century of developments in the chemistry of flotation processing. In:
Fuerstenau, M.C., Jameson, G.J., and Yoon, R.H. (Eds.), Froth Flotation: A Century of
Innovation. SME, 3-64.
7
Fuerstenau, D.W., and Wayman, C.H., 1958. Effect of chemical reagents on the motion of single
air bubbles in water. Mining Engineering, Transactions of AIME, 694-699.
Gaudin, A.M., 1934. Flotation’s future beset with difficult problems. Engineering and Mining
Journal 135, 1, 29.
Gebrueder Bessel, 1877. Verfahren zur Reinigung von Graphit (process for the purification of
graphite). German patent 42, Class 22.
Gelinas, S., and Finch, J.A., 2005. Colorimetric determination of common industrial frothers.
Minerals Engineering 18, 2, 263-266.
Gélinas, S., and Finch, J.A., 2007. Frother analysis: Some plant experience. Minerals
Engineering 20, 14, 1303-1308.
Gomez, C.O., and Finch, J.A., 2002. Gas dispersion measurements in flotation machines. CIM
Bulletin 95, 1066, 73-78.
Gomez, C.O., and Finch, J.A., 2007. Gas dispersion measurements in flotation cells.
International Journal of Mineral Processing 84, 1-4, 51-58.
Gorain, B.K., Franzidis, J.P., and Manlapig, E.V., 1997. Studies on impeller type, impeller speed
and air flow rate in an industrial flotation cell. Part 4: Effect of bubble surface area flux on
flotation performance. Minerals Engineering 10, 4, 367-379.
Haynes, W., 1860. British Patent 488.
Jameson, G.J., 1984. Physics and hydrodynamics of bubbles. In: Ives, K.J. (Ed.), The Scientific
Basis of Flotation. Series E: Applied Sciences – No. 75. Martinus Nijhoff Publishers, Boston,
53-78.
Klimpel, R.R, and Isherwood, S., 1991. Some industrial implications of changing frother
chemical structure. International Journal of Mineral Processing 33, 369-381.
Kracht, W., and Finch, J.A., 2009a. Bubble break-up and the role of frother and salt.
International Journal of Mineral Processing 92, 153–161.
Kracht, W., and Finch, J.A., 2009b. Using sound to study bubble coalescence. Journal of Colloid
and Interface Science 332, 237–245.
8
Lynch, A.J., Watt, J.S., Finch, J.A., and Harbort, G.E., 2007. History of flotation technology. In:
Fuerstenau, M. C., Jameson, G. J., and Yoon, R. H. (Eds.), Froth Flotation: A Century of
Innovation. SME, 65-92.
Nesset, J.E., Hernandez-Aguilar, J.R., Acuna, C., Gomez, C.O., and Finch, J.A., 2006. Some gas
dispersion characteristics of mechanical flotation machines. Minerals Engineering 19, 807-815.
Nesset, J.E., 2008. 100 years of blowing bubbles for profit (with an emphasis on the bubbles).
CIM Distinguished Lecturer 2008-2009.
Perkins, C.L., and Sayre, R.E., 1921. Flotation of Minerals, United States Patent Office, serial
number 284,981. Publication number US1364308 A.
Pomianowski, A., Malysa, K., and Para, G., 1973. Annual Report for the Institute of Nonferrous
Metals, 6.
Pugh, R.J., 2007. The physics and chemistry of frothers. In: Fuerstenau, M.C., Jameson, G., and
Yoon, R.-H. (Eds.), Froth Flotation: A Century of Innovation, SME, 259-281.
Quinn, J.J., and Finch, J.A., 2012. On the origin of bi-modal bubble size distributions in the
absence of frother. Minerals Engineering 36, 237-241.
Quinn, J.J., Kracht, W., Gomez, C.O., Gagnon, C., and Finch, J.A., 2007. Comparing the effects
of salts and frother (MIBC) on gas dispersion and froth properties. Minerals Engineering 20,
1296-1302.
Rickard, T.A. (Ed.), 1916. The Flotation Process, Mining and Scientific Press, Dewey Publishing
Company, San Francisco.
Spencer, S.J., Bruniges, R., Roberts, G., Sharp, V., Catanzano, A., Bruckard, W.J., Davey, K.J.,
and Zhang, W., 2012. An acoustic technique for measurement of bubble solids mass loading: (b)
Monitoring of Jameson cell flotation performance by passive acoustic emissions. Minerals
Engineering 36, 21-30.
Tomiyama, A., Celata, G.P., Hosokawa, S., and Yoshida, S., 2002. Terminal velocity of single
bubbles in surface tension force dominant regime. International Journal of Multiphase Flow 28,
1497-1519.

9
Vanegas, C., and Holtham, P., 2008. On-line froth acoustic emission measurements in industrial
sites. Minerals Engineering 21, 883–888.
Wills, B.A., and Napier-Munn, T., 2006. Wills' Mineral Processing Technology: An Introduction
to the Practical Aspects of Ore Treatment and Mineral Recovery. Butterworth-Heinemann,
Burlington, MA, USA.
10
Chapter 2 – Literature review
2.1 Frothers: Chemistries and classifications
Frothers are added to flotation systems to decrease bubble size in the pulp phase and promote
frothing. A frother is a surface active agent (surfactant) whose molecular structure is generally
hetero-polar. The molecule consists of a polar head group, which readily attracts water
molecules, and a non-polar hydrocarbon chain which has little interaction with water. The
hetero-polar nature of the molecules promotes adsorption at the air-water interface. Frothers
decrease bubble size in the pulp phase by inhibiting bubble coalescence. Coalescence occurs
when bubbles interact in such a way as to rupture the intervening water film between the
bubbles, thus forming a larger bubble from two (or more) smaller ones. A combination of
properties, Gibbs elasticity (which stabilizes a film in response to a mechanical disturbance) and
the Marangoni effect (which induces flow in liquid adjacent to the interface) form the basis for
understanding how frothers resist coalescence (Harris, 1982; Pugh, 1996; Finch et al., 2008). The
concentration of frother at the air-water interface determines the surface tension and thus
variations in concentration (e.g., due to mechanical disturbances) produce surface tension
gradients, i.e. a force which opposes film drainage.
Klimpel and Isherwood (1991) qualitatively summarized the role of frother in flotation
processes:
1) Enhanced froth formation
2) Increased air dispersion in the flotation cell
3) Reduction in the rate at which the bubbles rise to the surface (increased bubble residence
time)
4) Reduction in the coalescence of individual bubbles within the flotation pulp
The first frother used in mineral flotation was eucalyptus oil, widely available in Australia where
the first large-scale flotation process was operated in the early 1900’s (Wills and Napier-Munn,
2006). As flotation expanded to North America and Europe, pine oil (which contains aromatic
alcohols and whose main component is α-terpineol) became the most widely used frother
primarily due to its low cost and wide availability (Wills and Napier-Munn, 2006; Crozier and

11
Klimpel, 1989). Cresol (cresylic acid) has also seen wide use (Wills and Napier-Munn, 2006).
The use of natural oils diminished over the years due principally to the inability to maintain
quality. Some collecting properties of the natural oils also interfered with process selectivity
(Crozier and Klimpel, 1989; Wills and Napier-Munn, 2006). The presence of collecting and
frothing properties in the same reagent often makes selective flotation difficult (Wills and
Napier-Munn, 2006).
Methyl isobutyl carbinol, MIBC, a synthetic non-collecting reasonably soluble alcohol, has been
the most widely used frother for decades. Polypropylene glycol (PPG) ethers (e.g., Dowfroth
250) have also seen widespread use in industry since the early 1950’s. Pugh (2007) estimated
that MIBC and PPG ethers accounted for 80-90% of all frothers used in metallic ore flotation.
Many types of synthetic frothers are now available and reagent companies continue to develop
new frothers to better suit industry needs (Cappuccitti and Finch, 2007; Aston et al., 2013).
Availability and cost are still major drivers but many operations look to new frothers or frother
blends which are tailored to the operation (Riggs, 1986; Zhang et al., 2012b).
Alcohols are organic compounds which contain a hydroxyl (OH-) functional group bound to a
carbon atom in a hydrocarbon chain. There are three main categories of alcohols which are used
as frothers: aliphatic, cyclic and aromatic. Methyl isobutyl carbinol is a branched structure, with
the formal chemical name 4-methyl-2-pentanol. Alcohols are structurally related to water, H2O
(HOH), in that both possess a hydroxyl function (Roberts and Caserio, 1977). The OH- group is
polar, meaning molecules associate with one another which decreases volatility, raises melting
points and increases solubility in polar liquids (water). Water-solubility of alcohols falls off
rapidly with increasing length of the carbon chain. Once the hydrocarbon chain is sufficiently
long, typically six or more carbon atoms, the hydrocarbon (hydrophobic) nature becomes
dominant and dictates physical properties (Roberts and Caserio, 1977). Alcohols employed as
frothers in flotation contain 5 to 8 carbon atoms. Availability, cost, solubility and the fact that
alcohols have practically no collecting properties make them practical choices for industry (Wills
and Napier-Munn, 2006).
Polyglycols emerged in the early 1950’s (Dowfroth (DF) range of products) and usage as
frothers quickly grew. The term "glycol" indicates a diol, which is a substance with two
alcoholic hydroxyl groups. Polyhydric alcohols in which the hydroxyl groups are situated on

12
different carbons are relatively stable and have high boiling points and considerable water
solubility (Roberts and Caserio, 1977). The polyglycol group presents great flexibility with
varying molecular weight and chemical structure allowing for control of the flotation process
(Klimpel and Isherwood, 1991). Solubility of this group ranges from totally miscible to partially
soluble, depending on the nature of the molecule. Trade names for polyglycols include the
Dowfroth line of products, Cytec Oreprep 549 and Cytec Aerofroth 65 (Wills and Napier-Munn,
2006).
2.1.1 Hydrophilic-lipophilic balance (HLB)
The concept of hydrophilic-lipophilic balance (HLB) was developed to quantify the molecular
structure of surfactants (Griffin, 1949, 1954; Davies, 1957). The term lipophilic refers to an
affinity (-philic) for oil (lipo-). In relation to flotation frothers, the term lipophilic is analogous to
hydrophobic (water repellent or an affinity for air). The measure quantifies the degree of
hydrophobicity of surfactants (frothers) based on the nature of the molecule and the various
groups it contains. The most commonly used method of determining HLB is by Davies (1957)
developed to characterize surfactants used in the cosmetics industry. The method accounts for
the degree of hydrophobicity / hydrophilicity of each constituent group. High HLB values (>7)
indicate hydrophilic surfactants and low values (<7) hydrophobic compounds. The HLB
calculation is shown in Equation (2.1).
lh nHmHHLB 7 (2.1)
where: m = Number of hydrophilic groups in the molecule
Hh = Value of the hydrophilic group
n = Number of lipophilic groups in the molecule
Hl = Value of the lipophilic group
Example hydrophilic (Hh) / lipophilic (Hl) values for functional groups are given in Table 2.1.
13
Table 2.1 – Example hydrophilic / lipophilic group values used in the Davies equation
Group H Value
-OH Hydrophilic 1.9
-O- Hydrophilic 1.3
-CH-, CH2, -CH3-, =CH Lipophilic -0.475
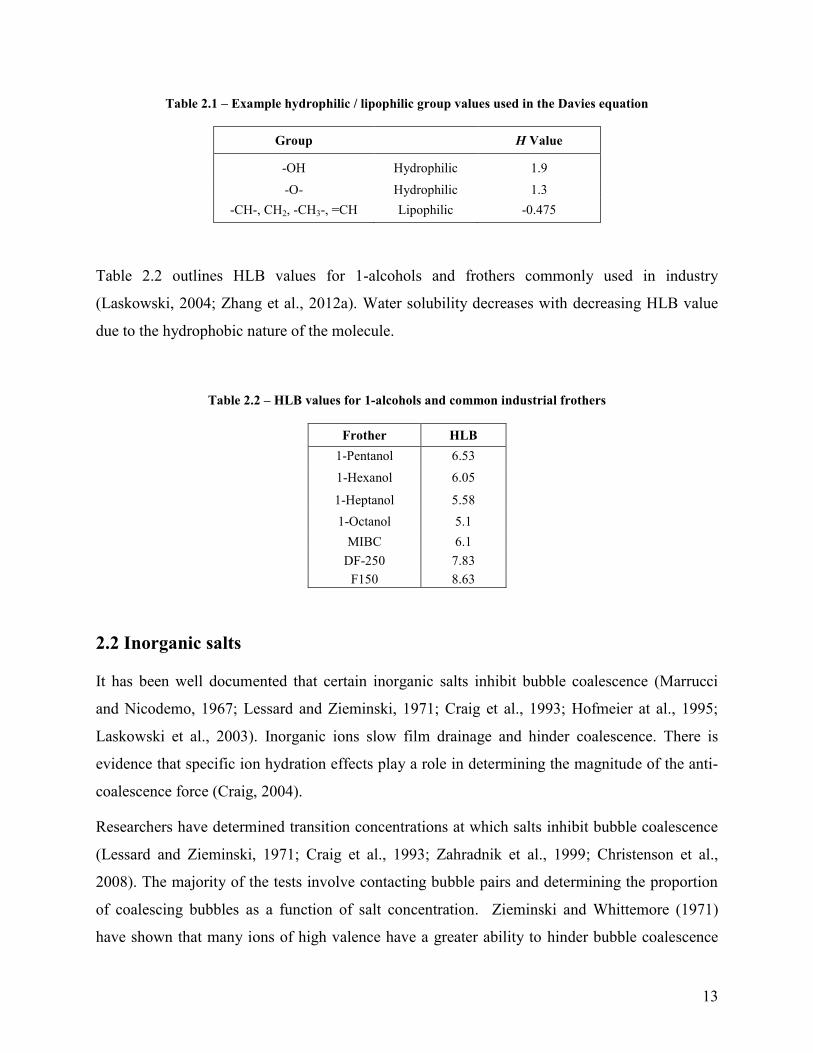
Table 2.2 outlines HLB values for 1-alcohols and frothers commonly used in industry
(Laskowski, 2004; Zhang et al., 2012a). Water solubility decreases with decreasing HLB value
due to the hydrophobic nature of the molecule.
Table 2.2 – HLB values for 1-alcohols and common industrial frothers
Frother HLB
1-Pentanol 6.53
1-Hexanol 6.05
1-Heptanol 5.58
1-Octanol 5.1
MIBC 6.1
DF-250 7.83
F150 8.63
2.2 Inorganic salts
It has been well documented that certain inorganic salts inhibit bubble coalescence (Marrucci
and Nicodemo, 1967; Lessard and Zieminski, 1971; Craig et al., 1993; Hofmeier at al., 1995;
Laskowski et al., 2003). Inorganic ions slow film drainage and hinder coalescence. There is
evidence that specific ion hydration effects play a role in determining the magnitude of the anti-
coalescence force (Craig, 2004).
Researchers have determined transition concentrations at which salts inhibit bubble coalescence
(Lessard and Zieminski, 1971; Craig et al., 1993; Zahradnik et al., 1999; Christenson et al.,
2008). The majority of the tests involve contacting bubble pairs and determining the proportion
of coalescing bubbles as a function of salt concentration. Zieminski and Whittemore (1971)
have shown that many ions of high valence have a greater ability to hinder bubble coalescence

14
compared to mono-valent ions. Craig et al. (1993) created a combining rule (table) which
assesses whether a given cation / anion pair would inhibit bubble coalescence. This table does
not predict the magnitude of anti-coalescence. Researchers have shown correlations between
ionic strength and bubble size (Zieminski and Whittemore, 1971; Onken and Kietel, 1982) and
gas holdup (Quinn et al., 2007).
The gas dispersion properties of certain inorganic salt solutions are similar to those produced by
frothers. Quinn et al. (2007) showed that a 0.4 M ionic strength solution behaved similarly to a
solution of 8 - 10 ppm MIBC in terms of increase in gas holdup and decrease in bubble size.
There are, however, significant differences between inorganic salts and frothers. The first is the
need for high salt concentrations (> 0.05 M) for coalescence inhibition (Lessard and Zieminski,
1971; Craig et al., 1993; Zahradnik et al., 1999) compared to a few parts per million (< 1 mM) of
frother.
The majority of inorganic ions in water, especially those containing multi-valent ions, have a net
attraction towards the bulk solution and away from the air-water interface as they favor being
fully hydrated and cause surface tension to increase. Surface tension typically increases linearly
with salt concentration, thus one can compare the change in surface tension with change in
concentration (d(Δγ)/dC) to compare inorganic salts (Table 2.3).
Table 2.3 – Effect of inorganic salts on surface tension gradient
Salt d(Δγ)/dC*
mN/m
NaClO4 0.73
KCl 1.60
NaCl 1.55
Na2SO4 2.96
CaCl2 3.22
MgSO4 2.24
*Pugh et al. (1997)
Ions are commonly referred to as ‘structure breaking’ or ‘structure making’ depending on their
propensity towards the air-water interface or towards the bulk solution, respectively (Bonner and

15
Jumper, 1973). The ion size, charge, and the presence of strong, specific interactions between
ions and water molecules seem to dictate their effect on water structure (Bonner and Jumper,
1973). As depicted in Figure 2.1, Foulk and Miller (1931) noted that both positive and negative
adsorption could lead to the formation of stable films. The schematic depicts: A) negative
adsorption where the interfacial solute concentration is lower than in the bulk solution, the case
for most inorganic salts; and B) positive adsorption where the interfacial concentration is higher
than the bulk solution, similar to the case of a frother.
Figure 2.1 – Sketch of negative (A) and positive (B) adsorption at the air-water interface (modified from
Foulk and Miller, 1931)
Given the large concentration of inorganic salts needed they will not be used in place of frothers.
However, several mineral flotation operations around the world use water with high inorganic
salt content such as sea or bore water, or as the result of processing soluble minerals. Water
recycling can also lead to increased salt content. Sea water contains roughly 35 g/L dissolved
salts. A number of operations (mostly in Australia) use hyper-saline bore water (higher salinity
than sea water) which can be saturated in dissolved salts. Table 2.4 gives examples of flotation
concentrators that utilize(d) highly saline process water and typical compositions (Haig-Smillie,
1972; George, 1996; Nesset et al., 2007; Laskowski et al. 2003b; Quinn et al., 2007; Cole, 2009;
Peng and Seaman, 2011; Castro, 2012; Dunne, 2012; Blin and Dion-Ortega, 2013). An extreme
case is potash processing where flotation occurs in a saturated brine solution.
An example of a flotation plant with high inorganic salt (Table 2.4) concentration is Xstrata’s
Raglan operation in northern Quebec. Major sources include the addition of calcium chloride in

16
the mine to prevent freezing and the use of soda ash for pH control. The mill has a closed-loop
recycle water system which causes the build-up of soluble inorganic species in the process water.
As an apparent consequence, the flotation circuit operates effectively without the use of frother
(Quinn et al., 2007). This observation corresponds to previous evidence suggesting that flotation
in salt water results in lower reagent consumption (Haig-Smillie, 1974; Yoon and Sabey, 1989).
Table 2.4 – Examples of flotation operations which utilize(d) saline process water
Operation Location Water
Type TDS
* (ppm) Major Elements
Texada (Texada Mines)
Black Angel (Angel Mining)
Las Luces (Grupo Cenizas)
PTNNT- Batu Hijau (Newmont)
Minera Esperanza (AMSA)
Canada
Greenland
Chile
Indonesia
Chile
Sea ~35 000 Na+, Cl
-
Raglan (Glencore Xstrata) Canada Recycle ~30 000 Na
+, Ca
2+, SO4
2-,
S2O32-
Mt. Keith (BHP-B)
Leinster (BHP-B)
Kanowna Belle (Barrick)
Fimiston (KCGM)
Australia Bore 60 000 –
120 000
Na+
, K+
, Ca
2+,
Mg2+
, Cl-, SO4
2-
Potash Various Brine ~ 450 000
saturated Na
+, K
+, Cl
-
* Total dissolved solids (TDS)
2.3 Bubble formation, coalescence and break-up
Hofmeier et al. (1995) discussed bubble interactions in bubble swarms produced at an orifice as a
function of gas flow rate:
1) At low gas flow rates bubbles are released individually. Anti-coalescence agents have
little effect on bubble generation.
2) At intermediate gas flow rate bubbles begin to interact in proximity to the orifice: In pure
liquids, bubbles are more likely to coalesce and create larger bubbles. In systems
containing anti-coalescence agents, bubbles are more likely to bounce creating a system
with finer bubbles.
17
3) At high gas flow rates the system becomes chaotic with large bubbles being formed
through coalescence and fine bubbles due to break-up. According to Hofmeier et al. the
nature of the solute no longer has significant influence on events at the orifice but does
influence the bubbles further away generally retarding coalescence. Fine bubbles are
produced by inertia from a preceding bubble causing subsequent bubbles to break away
from the tip prematurely (before they have grown to full size) and by the break-up of
large unstable bubbles.
At sufficiently low gas rate bubble size is determined by orifice dimensions and solution surface
tension, given by the Tate equation (Tate, 1864; Hernandez-Aguilar et al., 2006). At
concentrations of industrial interest frothers and salts have little impact on surface tension and
thus little impact on the size of a single bubble produced at a capillary as shown by several
authors (Hofmeier et al., 1995; Zhang and Shoji, 2001; Cho and Laskowski 2002a). The effect of
frothers or salts is only seen once bubbles begin to interact, typically close to the point of bubble
generation (Marrucci and Nicodemo, 1967). Bubble interactions at a capillary can be controlled
using gas flow rate.
Marrucci and Nicodemo (1967) ascribed increased coalescence at higher gas flow rates to the
increase in the number of bubbles produced which increases collision frequency and convection
forces which result in more effective coalescence-inducing impacts.
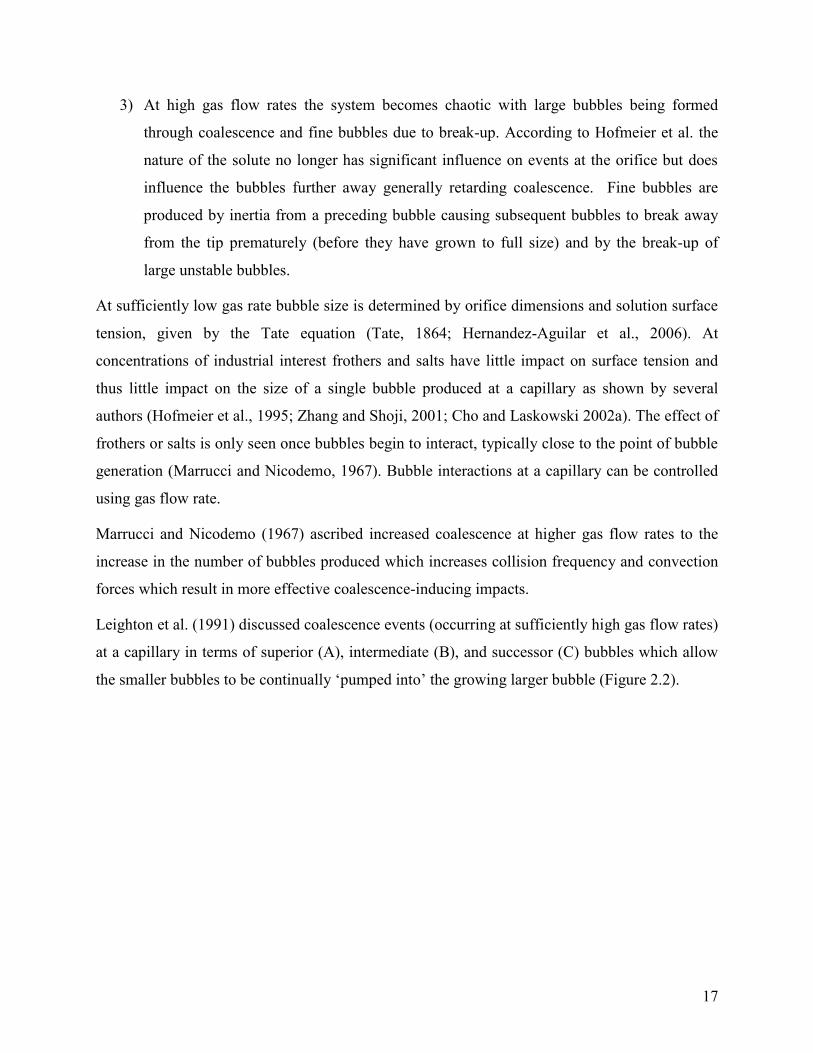
Leighton et al. (1991) discussed coalescence events (occurring at sufficiently high gas flow rates)
at a capillary in terms of superior (A), intermediate (B), and successor (C) bubbles which allow
the smaller bubbles to be continually ‘pumped into’ the growing larger bubble (Figure 2.2).
18
Figure 2.2 – A) Superior, B) intermediate and C) successor bubble coalescence which creates a growing
bubble which is susceptible to fragmentation (© IOP Publishing Ltd and European Physical Society.
Reproduced by permission of IOP Publishing. All rights reserved. (Leighton et al., 1991))
The process is repeatable several times until the growing bubble outpaces the subsequent ones
(Hofmeier et al., 1995). Coalescence events have been variously described as the formation of
secondary bubbles (Kupferberg and Jameson, 1969), bubble pairing and doubling (Miyahara et
al., 1982, 1984; Kyriakides et al., 1997) and a swallowing up process (Osterwegel and de Groot,
1980).
With increasing gas flow rate the surface tension force no longer determines bubble size and
bubbles become large, variable in shape (i.e., unstable) and prone to fragmentation (Leighton,
1994). It was noted that the range of bubble size produced at high gas flow rates can be very
wide. Ohnishi et al. (1999) discussed a mechanism for secondary bubble creation induced by
bubble coalescence. One possible explanation presented was that the rapid deformation process
upon coalescence produced one or two lobes at one or both ends of the bubble which could lead
break away.
Schäfer et al. (2002) showed visual evidence of bubble break-up at a nozzle. They noted that an
increase in pressure led to an increase in break-up and related the effect to inertia of the gas in
the fluctuating bubble.
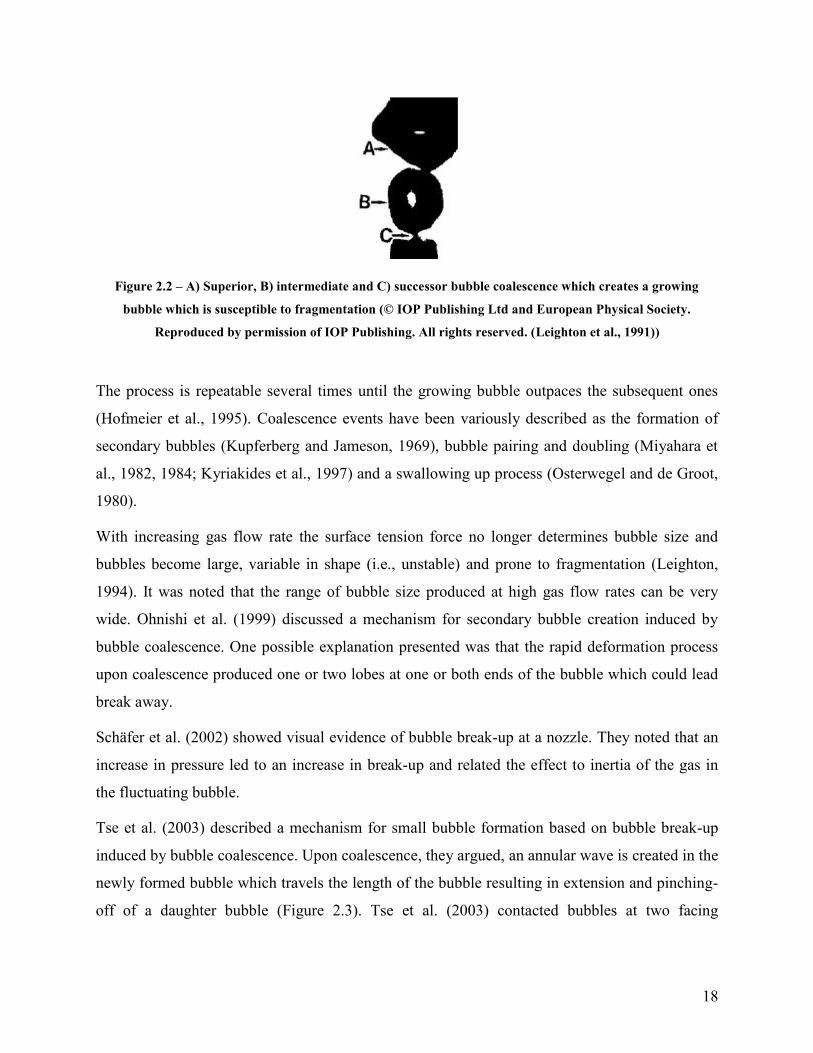
Tse et al. (2003) described a mechanism for small bubble formation based on bubble break-up
induced by bubble coalescence. Upon coalescence, they argued, an annular wave is created in the
newly formed bubble which travels the length of the bubble resulting in extension and pinching-
off of a daughter bubble (Figure 2.3). Tse et al. (2003) contacted bubbles at two facing
19
capillaries and noted this break-up mechanism. Bubble break-up was also shown to occur in the
swarm away from the bubble generation device.
Figure 2.3 – Schematic of bubble coalescence-induced break-up (Reprinted with permission from Elsevier.
(Tse et al., 2003))
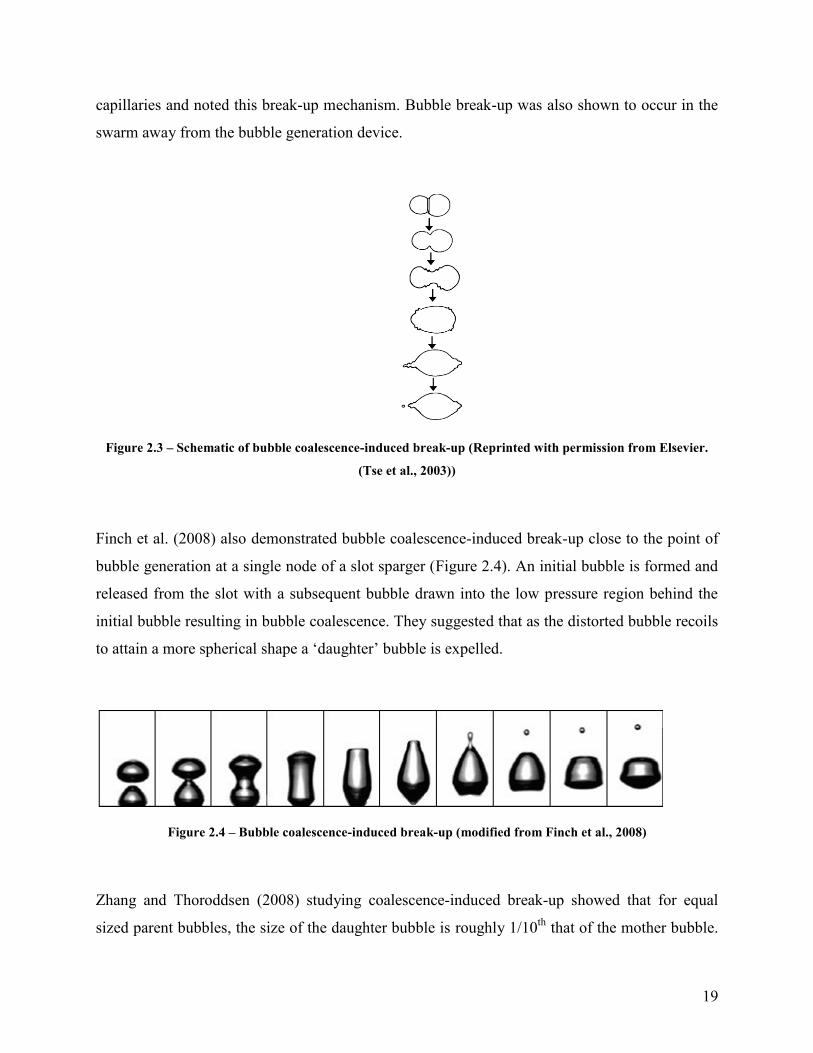
Finch et al. (2008) also demonstrated bubble coalescence-induced break-up close to the point of
bubble generation at a single node of a slot sparger (Figure 2.4). An initial bubble is formed and
released from the slot with a subsequent bubble drawn into the low pressure region behind the
initial bubble resulting in bubble coalescence. They suggested that as the distorted bubble recoils
to attain a more spherical shape a ‘daughter’ bubble is expelled.
Figure 2.4 – Bubble coalescence-induced break-up (modified from Finch et al., 2008)
Zhang and Thoroddsen (2008) studying coalescence-induced break-up showed that for equal
sized parent bubbles, the size of the daughter bubble is roughly 1/10th
that of the mother bubble.
20
The authors, using high-speed video imaging, characterized the capillary waves which converge
at the bubble apex and pinch off the daughter bubble.
The break-up of air bubbles in surfactant-free systems has been related to surface instabilities
initiated by turbulence. Several authors (Lee et al., 1987; Prince and Blanch, 1990; Miyahara et
al., 1991; Stewart, 1995) have attributed both coalescence and break-up events to wake forces
(turbulence or bubble wake eddy collisions). Coalescence, detachment and bubble collisions
(with or without coalescence) lead to bubble shape oscillations (Leighton et al., 1991; Leighton,
1994). Hofmeier et al. (1995) attributed the oscillations upon coalescence to the sudden release
of surface energy which could result in bubble break-up. Leighton (1994) demonstrated that
shape oscillations in one bubble could cause a bubble in close proximity to break-up. Martinez-
Bazan et al. (2000) and Hesketh et al. (1991) noted that bubble size was an important factor, and
that there was a critical size above which bubbles were prone to break-up. Several authors have
also attempted to determine a critical Weber number (which is a function of bubble size) above
which break-up occurs (Hinze, 1955; Sevik and Park, 1973; Lewis and Davidson, 1982;
Wilkinson et al., 1993).
2.4 Frother characterization techniques
In the early days of flotation it became evident that various reagents modified gas dispersion and
froth properties in different ways. T.A. Rickard (1916) in the classic monograph ‘The Flotation
Process’ noted “an effective froth represents a multiplicity of persistent bubbles. The relative
stability of the bubbles depends upon the kind of oil employed. Pine-oil makes a brittle film:
creosote yields an elastic envelope”. More recently, the terms selective and powerful were
common in the literature to describe frother strength, typically focusing on froth properties
(Crozier and Klimpel, 1989; Klimpel and Isherwood, 1991; Cytec, 2002; Laskowski, 2004; Wills
and Napier-Munn, 2006). MIBC and alcohol-type frothers are typically considered to be
selective while polyglycol-type frothers are considered powerful (Crozier and Klimpel 1989;
Cytec, 2002). The terms strong and weak have also been used, in a similar manner, to describe
how frother affects gas dispersion properties (Cappuccitti and Nesset, 2009).
The last three decades have seen the development of sensors and techniques to measure gas
dispersion properties (Finch and Dobby, 1990; Tucker et al., 1994; Chen et al., 2001; Hernandez-
21
Aguilar et al., 2002; Gomez and Finch, 2002, 2007;) which have allowed quantitative
characterization of frothers. Procedures have been designed to quantify the effect of solute on
gas dispersion using the following measurements: bubble coalescence (Foulk and Miller, 1931;
Lessard and Zieminski, 1971; Drogaris and Weiland, 1983), bubble size (Keitel and Onken,
1982; Cho and Laskowski, 2002a,b) and gas hold-up (Keitel and Onken, 1982; Azgomi et al.,
2007; Quinn et al., 2007).
2.4.1 Bubble coalescence tests
One of the simplest methods to study bubble interactions is to bring two bubbles together in
some manner. Foulk and Miller (1931) contacted bubbles at two vertically opposing capillaries.
Drogaris and Weiland (1983) contacted bubble pairs and measured the coalescence time
(induction time). Other researchers (Lessard and Zieminski, 1971; Cain and Lee, 1984;
Zahradnik et al., 1999; Christenson et al., 2008) have determined the transition concentration at
which inorganic salts inhibit bubble coalescence. The concentration at which 50% of the pairs
coalesced was termed the transition concentration. Similar experiments have been undertaken in
bubble swarms (Craig et al., 1993). For inorganic salts which affected coalescence, salts with
multi-valent ions showed lower transition concentrations than mono-valent salts. Table 2.5
shows literature transition concentrations for inorganic salts.
For 1-alcohols, Drogaris and Weiland (1983) showed that transition concentration decreased
with increasing chain length. It should be noted that bubble size and gas rate have been shown to
affect the transition concentration (Drogaris and Weiland, 1983; Tsang et al., 2004; Nguyen et
al., 2012). Kracht and Finch (2009b) developed a method which used acoustics to detect bubble
coalescence at a capillary. Frothers and salt were shown to delay the onset of coalescence.

22
Table 2.5 – Transition concentrations for inorganic salts
Salt Type
Transition Concentration, M
Bubble Pairs
Lessard and Zieminski Zahradnik et al. Christenson et al.
1971 1999 2008
Bubble Swarm
Craig et al.
1993
KCl
NaCl
Na2SO4
CaCl2
MgSO4
0.23
0.175
0.061
0.055
0.032
0.202
0.145
0.051
-
0.036
-
0.208
-
0.060
0.036
0.120
0.078
-
0.037
0.020
2.4.2 Critical coalescence concentration (CCC)
Cho and Laskowski (2002a) developed what is now probably the most widely used parameter to
quantify the effect of flotation frothers on bubble size namely the critical coalescence
concentration (CCC). From a plot of Sauter mean diameter (d32) vs. concentration, CCC
represents the concentration above which the d32 is minimum and constant. Laskowski and co-
workers used a graphical method to determine CCC by finding the intersection of the horizontal
asymptote to the d32 - concentration curve at high concentration with a sloped line approximating
the curve at lower concentrations (Grau et al., 2005). Comley et al. (2002) suggested fitting an
exponential decay function to model d32 vs. frother concentration. Nesset et al. (2007) similarly
applied a three-parameter model fitting to the d32 - concentration curve and estimated CCC using
the CCC95, the concentration achieving 95% of bubble size reduction from that of the water-
only system to the minimum bubble size.
Cho and Laskowski (2002a) conducted tests using both a 3-hole sparger and an open-top Leeds
flotation cell. The University of Cape Town (UCT) bubble size meter was used to measure
bubble size distributions and determine the d32 at increasing frother concentration. Sauter mean
bubble diameter decreased to a limiting value at a given frother concentration which was
attributed to complete coalescence prevention. Large bubbles obtained at frother concentrations
below the CCC were ascribed to bubble coalescence. Above the CCC, coalescence is prevented
and bubble size is dictated by sparger geometry and hydrodynamic conditions. Table 2.6 shows
literature CCC (or CCC95) values for common industrial frothers. Similar techniques have been

23
used to determine the effect of surfactants and inorganic electrolytes on bubble size in a swarm
(Marrucci and Nicodemo, 1967; Zieminski and Lessard, 1969; Zieminski and Whittemore, 1971;
Zieminski et al., 1976; Tucker et al., 1994).
Table 2.6 – Critical coalescence concentration of common industrial frothers
Frother
Type
Critical Coalescence Concentration, ppm (mg/l)
Cho and
Laskowski
2002a
Cho and
Laskowski
2002b
Grau
et al.
2005
Nesset
et al.
2007
Nesset
2011
Castro
et al.
2012
Zhang
et al.
2012
Quinn
et al.
2014
MIBC
DF250
F150
8.5
-
-
8.8
-
-
11.2
8.7 - 9.1
-
10.4
8.35
3.74
12.4 - 14.1
10.1 - 16.8
4.2 - 6.0
9
11.1
-
11
10
6
13.4
9.1
-
2.4.3 Gas holdup vs. frother / salt concentration
Finch and Dobby (1990) and Azgomi et al. (2007) used gas holdup measurements to characterize
frother strength. Finch and Dobby (1990) show various methods for measuring gas holdup in the
bubbly (pulp) zone. Azgomi et al. (2007) reviewed the effects of various frother types on gas
holdup in a 2-phase (solution/air) bubble column. For alcohols, gas hold-up was shown to
increase with hydrocarbon chain length and the effect is the same whether the chain is branched
or straight. For polyglycol frothers, gas hold-up increased with the number of propoxy groups
present on the molecule.
Similar test work has been used to characterize the effect of inorganic salts on gas holdup (Quinn
et al., 2007). Salts containing multi-valent ions increased gas holdup at lower concentration than
mono-valent salts. The researchers showed a correlation between ionic strength and gas holdup.
Table 2.7 summarizes results of the various frother characterization techniques, namely, bubble
coalescence (Kracht and Finch, 2009b), bubble size measurements (CCC determination) (Sweet
et al., 1997; Laskowski et al., 2003; Zhang et al., 2012a), gas holdup (Azgomi et al., 2007). The
results, in terms of classifying frothers from weak to strong, indicate that all the techniques show
a similar ranking.
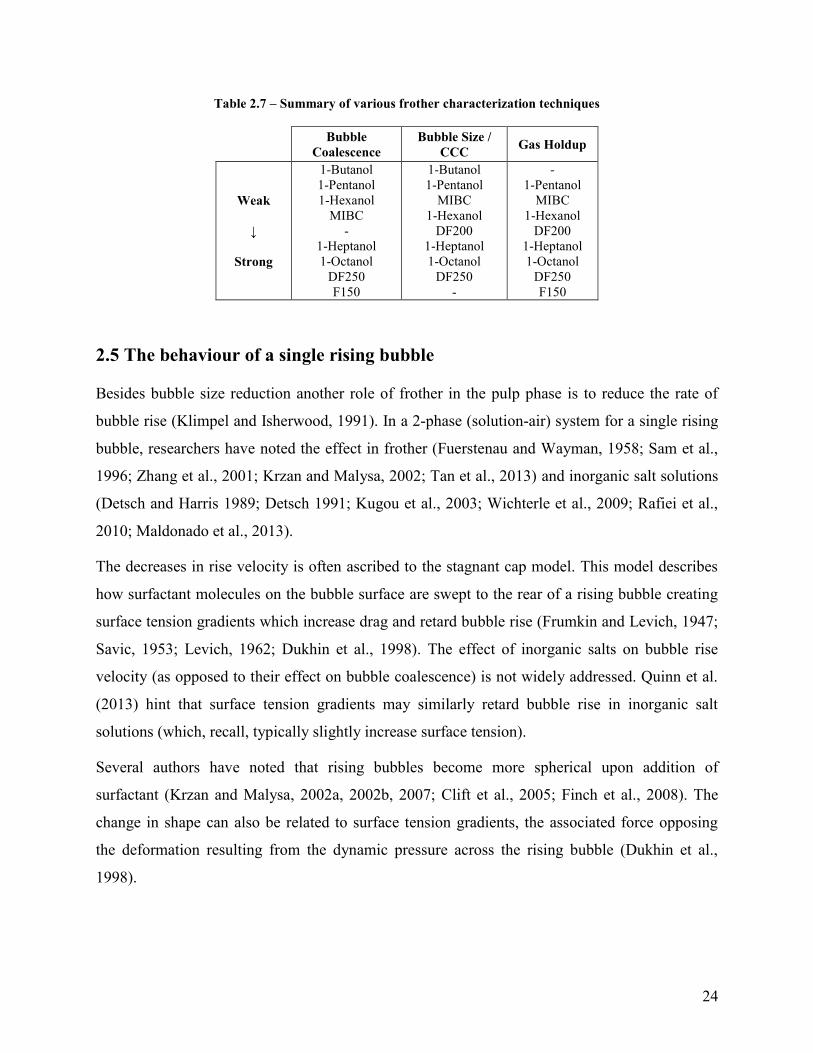
24
Table 2.7 – Summary of various frother characterization techniques
Bubble
Coalescence
Bubble Size /
CCC Gas Holdup
Weak
↓
Strong
1-Butanol
1-Pentanol
1-Hexanol
MIBC
-
1-Heptanol
1-Octanol
DF250
F150
1-Butanol
1-Pentanol
MIBC
1-Hexanol
DF200
1-Heptanol
1-Octanol
DF250
-
-
1-Pentanol
MIBC
1-Hexanol
DF200
1-Heptanol
1-Octanol
DF250
F150
2.5 The behaviour of a single rising bubble
Besides bubble size reduction another role of frother in the pulp phase is to reduce the rate of
bubble rise (Klimpel and Isherwood, 1991). In a 2-phase (solution-air) system for a single rising
bubble, researchers have noted the effect in frother (Fuerstenau and Wayman, 1958; Sam et al.,
1996; Zhang et al., 2001; Krzan and Malysa, 2002; Tan et al., 2013) and inorganic salt solutions
(Detsch and Harris 1989; Detsch 1991; Kugou et al., 2003; Wichterle et al., 2009; Rafiei et al.,
2010; Maldonado et al., 2013).
The decreases in rise velocity is often ascribed to the stagnant cap model. This model describes
how surfactant molecules on the bubble surface are swept to the rear of a rising bubble creating
surface tension gradients which increase drag and retard bubble rise (Frumkin and Levich, 1947;
Savic, 1953; Levich, 1962; Dukhin et al., 1998). The effect of inorganic salts on bubble rise
velocity (as opposed to their effect on bubble coalescence) is not widely addressed. Quinn et al.
(2013) hint that surface tension gradients may similarly retard bubble rise in inorganic salt
solutions (which, recall, typically slightly increase surface tension).
Several authors have noted that rising bubbles become more spherical upon addition of
surfactant (Krzan and Malysa, 2002a, 2002b, 2007; Clift et al., 2005; Finch et al., 2008). The
change in shape can also be related to surface tension gradients, the associated force opposing
the deformation resulting from the dynamic pressure across the rising bubble (Dukhin et al.,
1998).
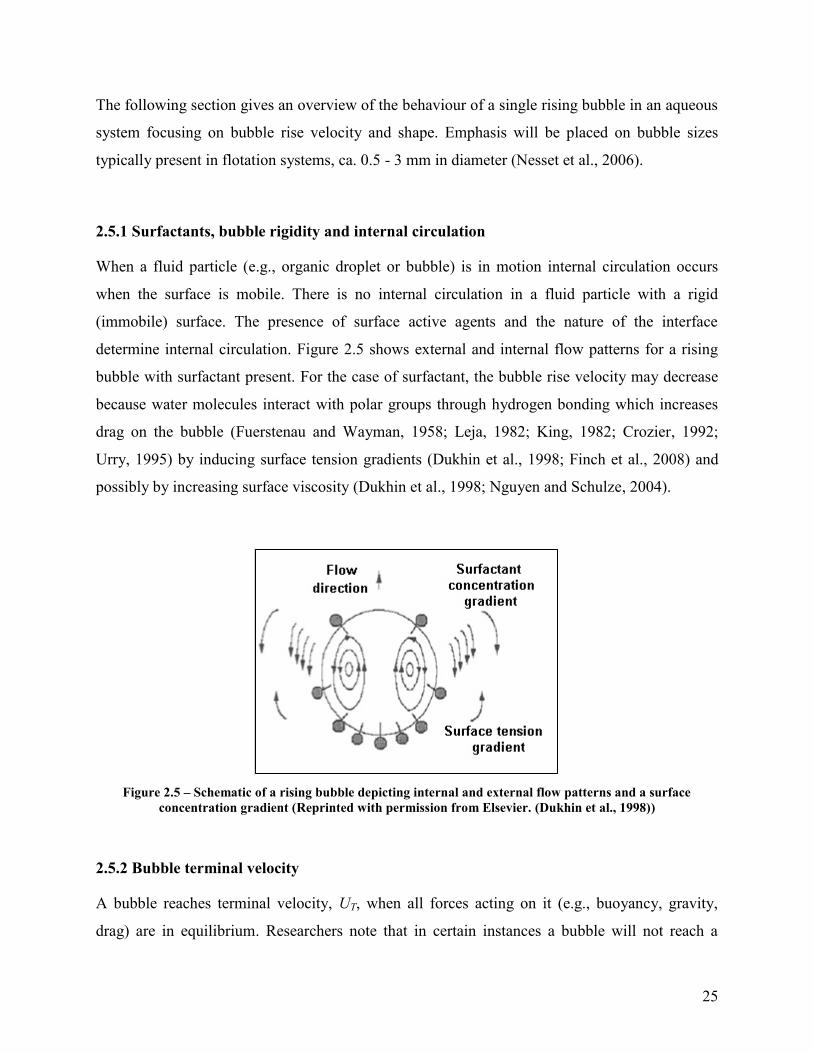
25
The following section gives an overview of the behaviour of a single rising bubble in an aqueous
system focusing on bubble rise velocity and shape. Emphasis will be placed on bubble sizes
typically present in flotation systems, ca. 0.5 - 3 mm in diameter (Nesset et al., 2006).
2.5.1 Surfactants, bubble rigidity and internal circulation
When a fluid particle (e.g., organic droplet or bubble) is in motion internal circulation occurs
when the surface is mobile. There is no internal circulation in a fluid particle with a rigid
(immobile) surface. The presence of surface active agents and the nature of the interface
determine internal circulation. Figure 2.5 shows external and internal flow patterns for a rising
bubble with surfactant present. For the case of surfactant, the bubble rise velocity may decrease
because water molecules interact with polar groups through hydrogen bonding which increases
drag on the bubble (Fuerstenau and Wayman, 1958; Leja, 1982; King, 1982; Crozier, 1992;
Urry, 1995) by inducing surface tension gradients (Dukhin et al., 1998; Finch et al., 2008) and
possibly by increasing surface viscosity (Dukhin et al., 1998; Nguyen and Schulze, 2004).
Figure 2.5 – Schematic of a rising bubble depicting internal and external flow patterns and a surface
concentration gradient (Reprinted with permission from Elsevier. (Dukhin et al., 1998))
2.5.2 Bubble terminal velocity
A bubble reaches terminal velocity, UT, when all forces acting on it (e.g., buoyancy, gravity,
drag) are in equilibrium. Researchers note that in certain instances a bubble will not reach a
26
constant velocity but oscillates (Aybers and Tapucu, 1969a; Bachhuber and Sanford, 1974; Fan
and Tsuchiya, 1990). In this case, the oscillations are either sufficiently small or an average
velocity over a given distance is taken as the terminal velocity.
Detwiler and Blanchard (1978) showed that a certain amount of time (or rise distance) is
required before the terminal condition is reached. These authors discuss how a 1 mm bubble may
rise several meters before terminal velocity is attained even in relatively clean water. Larger
bubbles were noted to take longer to reach terminal velocity. In contaminated water terminal
velocity would be achieved over a shorter distance, possibly after 1 m of rise. Researchers
(Aybers and Tapucu, 1969a,b; Detwiler and Blanchard; 1978) have related the time-dependent
behaviour to the accumulation of surfactants (even in relatively clean systems) at the rear
stagnation point on the bubble as it rises, a concept developed by Savic (1950) to help explain
reduced rise velocity in surfactant solutions. Malysa et al. (2007) propose that shape and velocity
variations relate to adsorption/desorption of solute as the bubble interfacial area oscillates
showing that the forces acting on the bubble are not constant.
Zhang and Finch (1999) illustrated the effect of solution type on single bubble rise velocity
(Figure 2.6). In pure water and concentrated solutions terminal velocity is achieved after a short
distance with the terminal velocity being higher in the pure water system. For dilute solutions or
tap water, bubbles quickly reach a maximum velocity after which velocity decreases with height
(also noted by Aybers and Tapucu (1969a)), and the velocity may or may not reach terminal
depending on distance travelled (height) and concentration. As illustrated, there appears to be
little effect of solution type in the early stages of bubble rise (acceleration stage), it is only after
maximum velocity is achieved that the effect of surfactants is seen (Acuña, 2007; Kracht and
Finch, 2010). This being said, Krzan and Malysa (2002, 2007) noted higher bubble acceleration
in the initial stage after release in water when compared to surfactant solutions.

27
Figure 2.6 – Typical single bubble velocity profiles (Reprinted with permission from Elsevier. (Zhang et al.,
2001))
Terminal velocity is a relatively straightforward concept but can be difficult to attain
experimentally. As shown in the literature, certain researchers claim terminal velocity is
achieved after 30 mm of rise (for a 1.45 mm bubble, Krzan et al. (2007)) while others note that
terminal velocity is not necessarily attained even after up to 4 m of rise (Sam et al., 1996).
The method of bubble production (release) has also been shown to affect bubble shape, velocity
and the time needed to achieve the terminal condition (Wu and Gharib, 2002; Tomiyama et al.,
2002; Peters and Els, 2012). This will be discussed later.
Detwiler and Blanchard (1978) noted that typical laboratory setups (1 - 2 m of rise) do not allow
sufficient time for terminal velocity to be reached. Many researchers seem to ignore the time-
dependent behaviour when choosing a height at which to measure terminal velocity which could
help explain certain discrepancies in the literature. It is clear that inconsistencies in terminal
velocity measurements in the literature could be attributed to inadequate rise time which depends
on bubble size, release mechanism and solution chemistry (presence of contaminants /
surfactants).

28
2.5.3 Forces acting on a rising bubble
Equation (2.2) gives the force acting on a spherical bubble due to buoyancy (FB) and gravity (FG)
which is a function of the density of the liquid and gas phases (ρL and ρg, respectively, with Δρ =
ρL - ρg), gravitational acceleration (g) and bubble volume (VB), which for a spherical bubble is:
3
3
4bBGB dggVF (2.2)
The drag force (FD) is given in Equation (2.3).
2
2
TLDD
UACF
(2.3)
where CD is the dimensionless drag coefficient and A the reference area (projected area
perpendicular to flow). The drag coefficient, CD, is defined as follows:
LT
b
DU
gdC
23
4 (2.4)
Re-arranging Equation (2.4), bubble terminal velocity is obtained (Equation (2.5)).
DL
b
TC
gdU
3
4 (2.5)
2.5.4 Dimensionless numbers
The concept of dimensionless groups arises from dynamic similarity (Massey, 1983). Dynamic
similarity implies that within two systems, the magnitude of forces acting at similar locations is
in fixed ratios. Typically two or more dimensionless groups are needed to characterize behaviour
of a system. As such it is useful to compare the relative forces acting on a bubble. Using
dimensional analysis this is accomplished by taking ratios of the various forces which determine
behaviour. As shown, buoyancy (Equation (2.2)) depends upon bubble diameter (db),
gravitational acceleration (g), gas and liquid density (ρL, ρg). As will be described, key variables
which affect drag include viscosity (µ) and surface tension (σ). Typically, the Morton number,
Mo, or Eӧtvӧs number, Eo is taken as the independent variable (Equations (2.6) and (2.7)). The
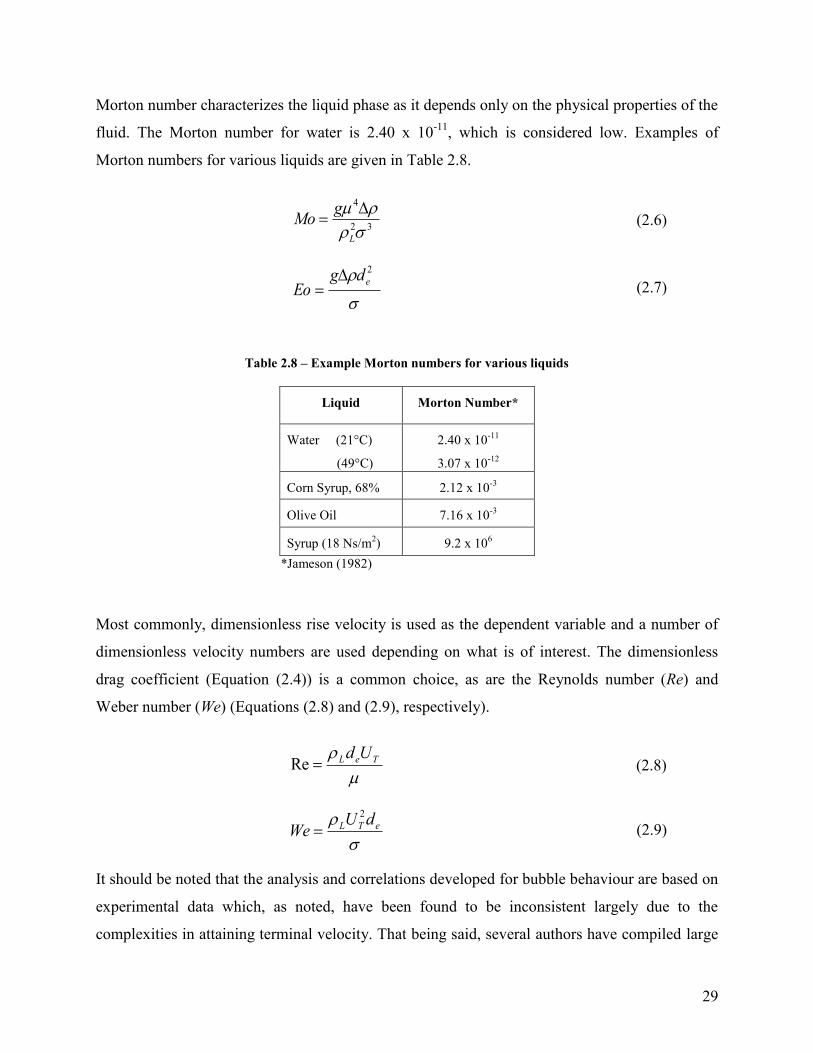
29
Morton number characterizes the liquid phase as it depends only on the physical properties of the
fluid. The Morton number for water is 2.40 x 10⁻¹¹
, which is considered low. Examples of
Morton numbers for various liquids are given in Table 2.8.
32
4
L
gMo
(2.6)
2
edgEo
(2.7)
Table 2.8 – Example Morton numbers for various liquids
Liquid Morton Number*
Water (21°C)
(49°C)
2.40 x 10⁻¹¹
3.07 x 10⁻¹²
Corn Syrup, 68% 2.12 x 10⁻³
Olive Oil 7.16 x 10⁻³
Syrup (18 Ns/m2) 9.2 x 10
6
*Jameson (1982)
Most commonly, dimensionless rise velocity is used as the dependent variable and a number of
dimensionless velocity numbers are used depending on what is of interest. The dimensionless
drag coefficient (Equation (2.4)) is a common choice, as are the Reynolds number (Re) and
Weber number (We) (Equations (2.8) and (2.9), respectively).
TeL UdRe (2.8)
eTL dUWe
2
(2.9)
It should be noted that the analysis and correlations developed for bubble behaviour are based on
experimental data which, as noted, have been found to be inconsistent largely due to the
complexities in attaining terminal velocity. That being said, several authors have compiled large
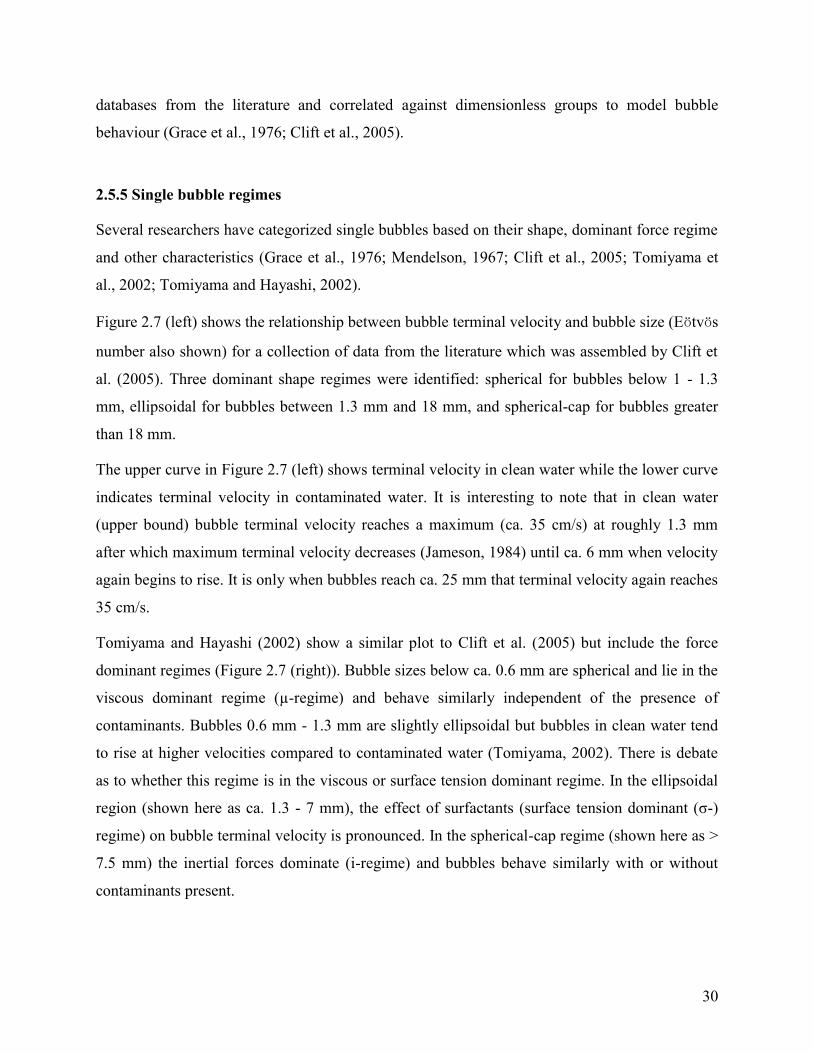
30
databases from the literature and correlated against dimensionless groups to model bubble
behaviour (Grace et al., 1976; Clift et al., 2005).
2.5.5 Single bubble regimes
Several researchers have categorized single bubbles based on their shape, dominant force regime
and other characteristics (Grace et al., 1976; Mendelson, 1967; Clift et al., 2005; Tomiyama et
al., 2002; Tomiyama and Hayashi, 2002).
Figure 2.7 (left) shows the relationship between bubble terminal velocity and bubble size (Eӧtvӧs
number also shown) for a collection of data from the literature which was assembled by Clift et
al. (2005). Three dominant shape regimes were identified: spherical for bubbles below 1 - 1.3
mm, ellipsoidal for bubbles between 1.3 mm and 18 mm, and spherical-cap for bubbles greater
than 18 mm.
The upper curve in Figure 2.7 (left) shows terminal velocity in clean water while the lower curve
indicates terminal velocity in contaminated water. It is interesting to note that in clean water
(upper bound) bubble terminal velocity reaches a maximum (ca. 35 cm/s) at roughly 1.3 mm
after which maximum terminal velocity decreases (Jameson, 1984) until ca. 6 mm when velocity
again begins to rise. It is only when bubbles reach ca. 25 mm that terminal velocity again reaches
35 cm/s.
Tomiyama and Hayashi (2002) show a similar plot to Clift et al. (2005) but include the force
dominant regimes (Figure 2.7 (right)). Bubble sizes below ca. 0.6 mm are spherical and lie in the
viscous dominant regime (µ-regime) and behave similarly independent of the presence of
contaminants. Bubbles 0.6 mm - 1.3 mm are slightly ellipsoidal but bubbles in clean water tend
to rise at higher velocities compared to contaminated water (Tomiyama, 2002). There is debate
as to whether this regime is in the viscous or surface tension dominant regime. In the ellipsoidal
region (shown here as ca. 1.3 - 7 mm), the effect of surfactants (surface tension dominant (σ-)
regime) on bubble terminal velocity is pronounced. In the spherical-cap regime (shown here as >
7.5 mm) the inertial forces dominate (i-regime) and bubbles behave similarly with or without
contaminants present.

31
Figure 2.7 – Left: Terminal velocity of air bubbles in water at 20°C (Reprinted with permission from Dover
Publishing, Inc. (Clift et al., 2005)), Right: bubble shapes and the force dominant regimes (modified from
Tomiyama and Hayashi, 2002)
The most recognized general graphical representation of bubble shape regimes is the plot of
Reynolds number versus Eӧtvӧs number (Figure 2.8) (typically lines of constant Morton number
are included). The position of the boundaries are somewhat arbitrary but the general trend is
clear: bubbles are spherical at low Reynolds number (independent of Eo) and low Eӧtvӧs number
(independent of Re), ellipsoidal at high Reynolds number and intermediate Eӧtvӧs number, and
spherical- or ellipsoidal-cap at high Re and Eo (Clift et al., 2005). Bhaga and Weber (1981)
extended the work of Grace (1976) and Grace et al. (1976) to include a range of ellipsoidal,
spherical cap and skirted shapes as outlined in Table 2.9.
32
Table 2.9 – Bubble shapes (abbreviations refer to Figure 2.8)
Bubble Shape Abbreviation Example Image
Spherical s (1)
Oblate ellipsoid oe (2)
Oblate ellipsoidal
(disk-like and wobbling) oed
(3)
Oblate ellipsoidal cap oec (1)
Spherical cap
with closed steady wake scc
(1)
Spherical cap
with open, unsteady wake sco
(1)
Skirted
with smooth, steady skirt sks
(1)
Skirted
with wavy, unsteady skirt skw
(1)
1 Modified from Bhaga and Weber, 1981
2 Modified from Maldonado et al., 2013
3 Modified from Raymond and Rosant, 2000
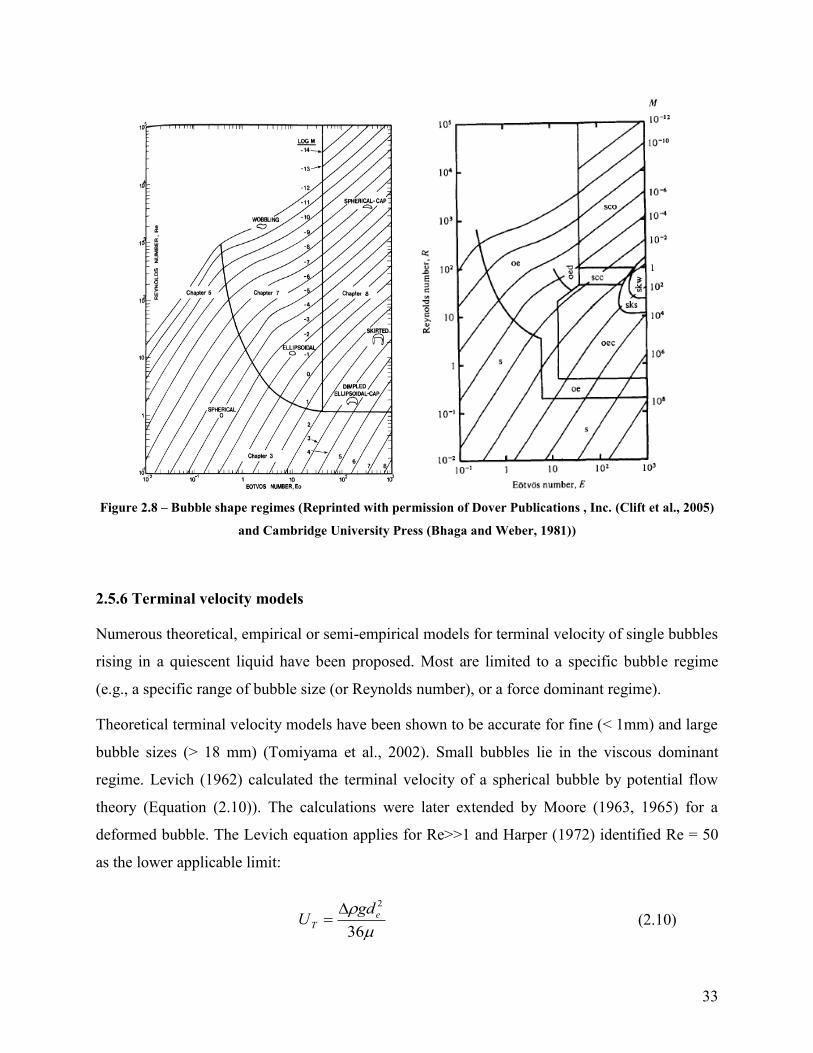
33
Figure 2.8 – Bubble shape regimes (Reprinted with permission of Dover Publications , Inc. (Clift et al., 2005)
and Cambridge University Press (Bhaga and Weber, 1981))
2.5.6 Terminal velocity models
Numerous theoretical, empirical or semi-empirical models for terminal velocity of single bubbles
rising in a quiescent liquid have been proposed. Most are limited to a specific bubble regime
(e.g., a specific range of bubble size (or Reynolds number), or a force dominant regime).
Theoretical terminal velocity models have been shown to be accurate for fine (< 1mm) and large
bubble sizes (> 18 mm) (Tomiyama et al., 2002). Small bubbles lie in the viscous dominant
regime. Levich (1962) calculated the terminal velocity of a spherical bubble by potential flow
theory (Equation (2.10)). The calculations were later extended by Moore (1963, 1965) for a
deformed bubble. The Levich equation applies for Re>>1 and Harper (1972) identified Re = 50
as the lower applicable limit:
36
2
eT
gdU
(2.10)

34
For large bubbles in the spherical-cap region inertial forces are dominant. Haberman and Morton
(1954) solved the Davies and Taylor (1950) equation which predicts terminal velocity based on
bubble size (Equation (2.11)).
eT gdU 72.0 (2.11)
Over the years, authors have noted the difficulties in estimating terminal velocity in the
ellipsoidal region (Grace et al., 1976; Tomiyama et al., 2002). Most models only trace the pure
water or fully contaminated cases (i.e., the upper and lower limits of terminal velocity).
Difficulties arise from the presence of surface active contaminants which affect bubble shape and
velocity. The degree of contamination was seen as an obstacle as each solute behaved in a
particular manner. More recently authors have linked behaviour to bubble shape or possibly the
method of formation/release.
Mendelson (1967) proposed a wave analogy to explain bubble behaviour in the ellipsoidal
regime (the relationship also predicts the spherical cap regime). The author suggested that the
bubble behaves like an interfacial disturbance similar to a surface wave propagating over deep
water with the rate of propagation being governed by wave motion. The relationship (Equation
(2.12)) correlated well with experimental data for the upper limit of the UT curve.
2
2 e
Le
T
gd
dU
(2.12)
Clift et al. (2005) modified Mendelson’s equation (2.12) and produced the empirical Equation
(2.13) to fit experimental data from the literature for the upper bound of the terminal velocity
curve in the ellipsoidal region.
e
Le
T gdd
U 505.014.2
(2.13)
Tomiyama and co-workers noted the limited understanding of bubble behaviour in the surface
tension dominant (ellipsoidal) regime and proposed a model for terminal velocity for ellipsoidal
bubbles which is a function of bubble aspect ratio, bubble size and fluid properties (Equation
(2.14)) (Tomiyama, 2002; Tomiyama et al., 2002). They showed the model fit well for bubbles
of various shapes and sizes in water.
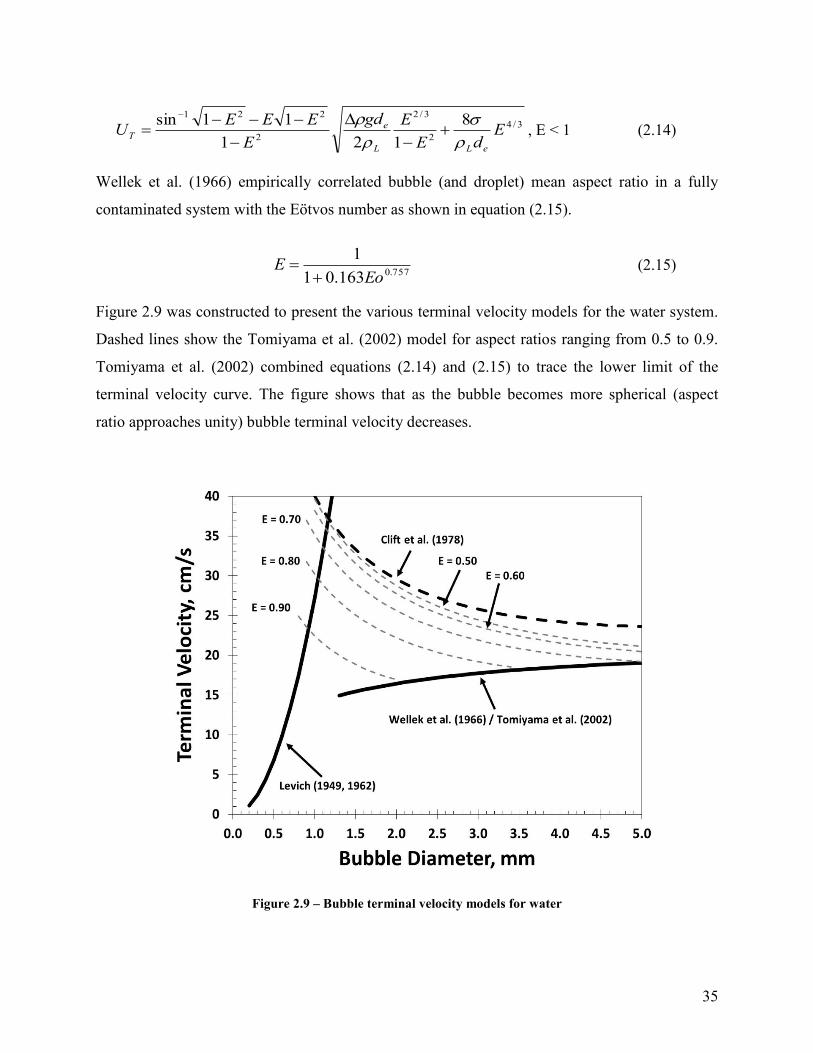
35
3/4
2
3/2
2
221 8
121
11sinE
dE
Egd
E
EEEU
eLL
eT
, E < 1 (2.14)
Wellek et al. (1966) empirically correlated bubble (and droplet) mean aspect ratio in a fully
contaminated system with the Eӧtvos number as shown in equation (2.15).
757.0163.01
1
EoE
(2.15)
Figure 2.9 was constructed to present the various terminal velocity models for the water system.
Dashed lines show the Tomiyama et al. (2002) model for aspect ratios ranging from 0.5 to 0.9.
Tomiyama et al. (2002) combined equations (2.14) and (2.15) to trace the lower limit of the
terminal velocity curve. The figure shows that as the bubble becomes more spherical (aspect
ratio approaches unity) bubble terminal velocity decreases.
Figure 2.9 – Bubble terminal velocity models for water
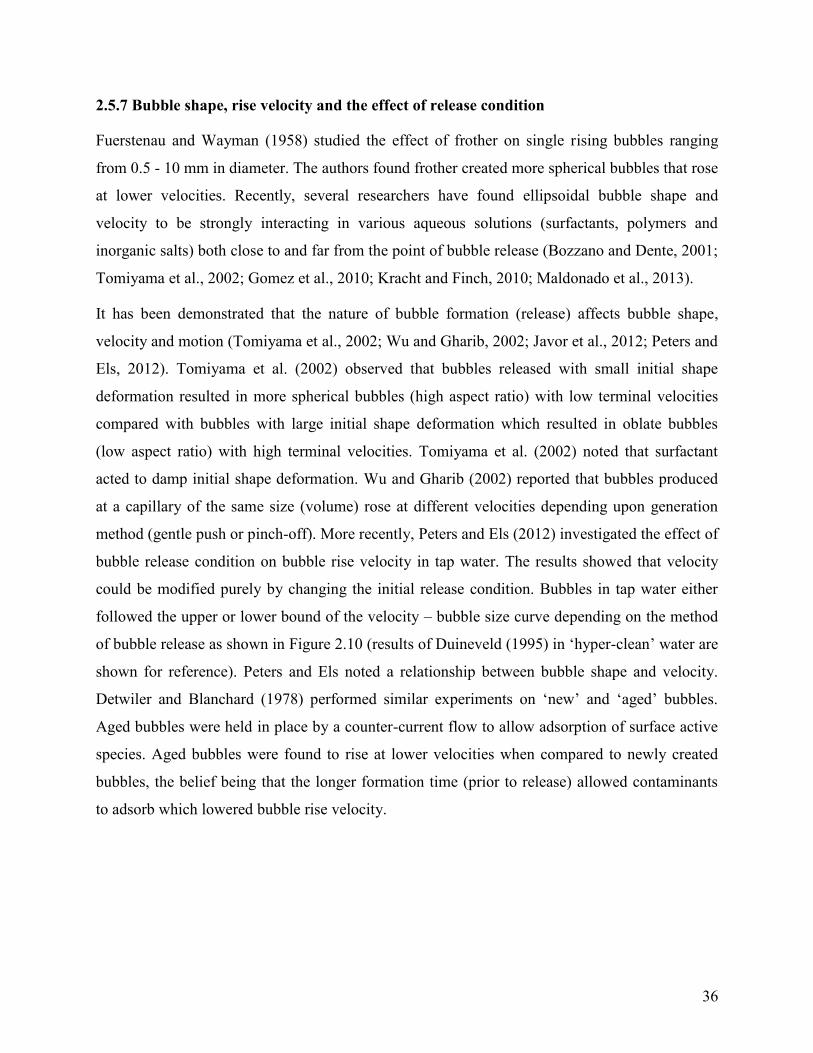
36
2.5.7 Bubble shape, rise velocity and the effect of release condition
Fuerstenau and Wayman (1958) studied the effect of frother on single rising bubbles ranging
from 0.5 - 10 mm in diameter. The authors found frother created more spherical bubbles that rose
at lower velocities. Recently, several researchers have found ellipsoidal bubble shape and
velocity to be strongly interacting in various aqueous solutions (surfactants, polymers and
inorganic salts) both close to and far from the point of bubble release (Bozzano and Dente, 2001;
Tomiyama et al., 2002; Gomez et al., 2010; Kracht and Finch, 2010; Maldonado et al., 2013).
It has been demonstrated that the nature of bubble formation (release) affects bubble shape,
velocity and motion (Tomiyama et al., 2002; Wu and Gharib, 2002; Javor et al., 2012; Peters and
Els, 2012). Tomiyama et al. (2002) observed that bubbles released with small initial shape
deformation resulted in more spherical bubbles (high aspect ratio) with low terminal velocities
compared with bubbles with large initial shape deformation which resulted in oblate bubbles
(low aspect ratio) with high terminal velocities. Tomiyama et al. (2002) noted that surfactant
acted to damp initial shape deformation. Wu and Gharib (2002) reported that bubbles produced
at a capillary of the same size (volume) rose at different velocities depending upon generation
method (gentle push or pinch-off). More recently, Peters and Els (2012) investigated the effect of
bubble release condition on bubble rise velocity in tap water. The results showed that velocity
could be modified purely by changing the initial release condition. Bubbles in tap water either
followed the upper or lower bound of the velocity – bubble size curve depending on the method
of bubble release as shown in Figure 2.10 (results of Duineveld (1995) in ‘hyper-clean’ water are
shown for reference). Peters and Els noted a relationship between bubble shape and velocity.
Detwiler and Blanchard (1978) performed similar experiments on ‘new’ and ‘aged’ bubbles.
Aged bubbles were held in place by a counter-current flow to allow adsorption of surface active
species. Aged bubbles were found to rise at lower velocities when compared to newly created
bubbles, the belief being that the longer formation time (prior to release) allowed contaminants
to adsorb which lowered bubble rise velocity.
37
Figure 2.10 – Rise velocities for fast and slow bubbles in tap water (Reprinted with permission from Elsevier.
(Peters and Els, 2012))
Kracht and Finch (2010) studied the relationship between ellipsoidal bubble shape and rise
velocity in various frother and sodium chloride solutions close to the point of release at a
capillary (first 400 ms of rise). They used high-speed photography (1000 fps) to capture single
bubble rise velocity and aspect ratio (which they defined as the ratio of major to minor axis) for
ca. 2.4 mm bubbles. Oscillations in shape and velocity were seen to be related (Figure 2.11A).
The results suggest a relationship between bubble velocity and aspect ratio (Figure 2.11B,
correlates data after the initial peak in velocity for various solutions). Sodium chloride was
shown to have a similar effect (at high concentration) to frother in terms of its ability to modify
bubble shape and velocity.
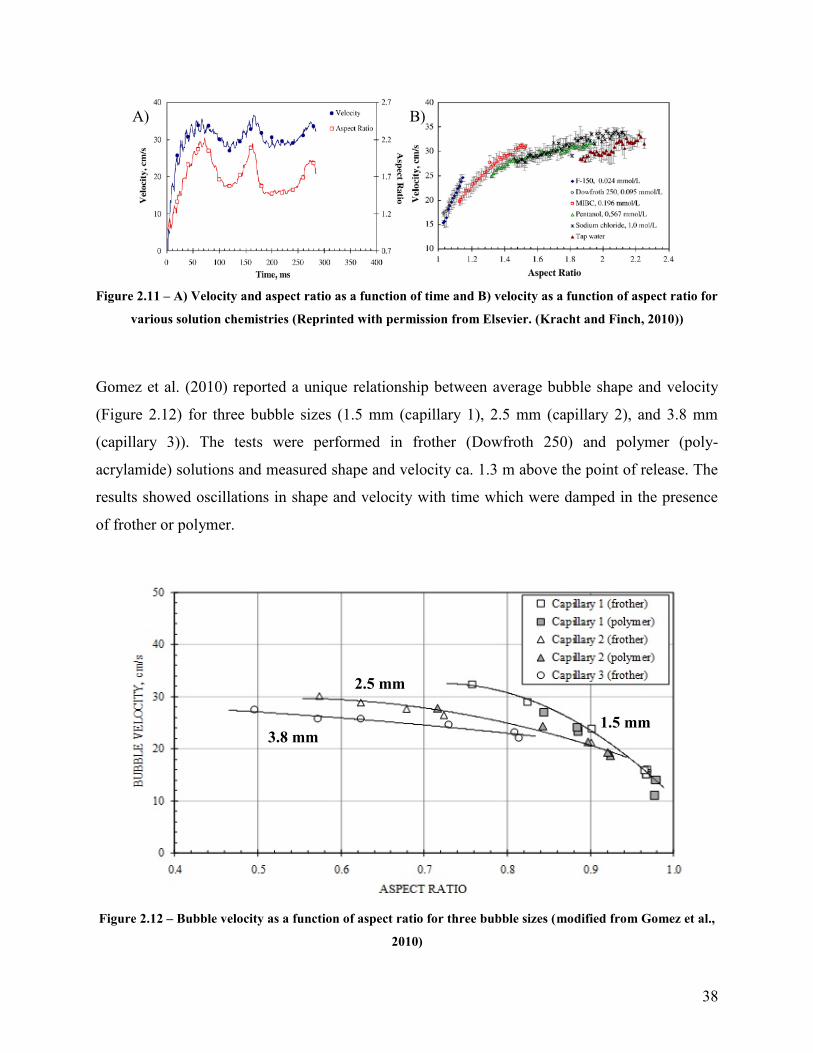
38
Figure 2.11 – A) Velocity and aspect ratio as a function of time and B) velocity as a function of aspect ratio for
various solution chemistries (Reprinted with permission from Elsevier. (Kracht and Finch, 2010))
Gomez et al. (2010) reported a unique relationship between average bubble shape and velocity
(Figure 2.12) for three bubble sizes (1.5 mm (capillary 1), 2.5 mm (capillary 2), and 3.8 mm
(capillary 3)). The tests were performed in frother (Dowfroth 250) and polymer (poly-
acrylamide) solutions and measured shape and velocity ca. 1.3 m above the point of release. The
results showed oscillations in shape and velocity with time which were damped in the presence
of frother or polymer.
Figure 2.12 – Bubble velocity as a function of aspect ratio for three bubble sizes (modified from Gomez et al.,
2010)
A) B)
3.8 mm
2.5 mm
1.5 mm

39
Maldonado et al. (2013) examined single bubbles of ca. 2.5 mm rising in presence of polymer
(poly-acrylamide), frother (1-pentanol, MIBC, Dowfroth 250, F150) and inorganic salts (NaCl
and Na2SO4). Rise velocity and aspect ratio were measured using high-speed photography ca. 1.2
m above the point of bubble release. Figure 2.13A shows the effect of MIBC concentration on
average rise velocity and aspect ratio: the presence of solute created more spherical bubbles
which rose at lower velocities. Figure 2.13B shows a unique relationship independent of solute
type (or concentration).
Figure 2.13 – A) The effect of MIBC concentration on bubble rise velocity and aspect ratio (shape), and B)
rise velocity as a function of aspect ratio for various solute types (for all concentrations tested) (Reprinted
with permission from Elsevier. (Maldonado et al., 2013))
There exists limited experimental data on bubble rise velocity in inorganic salt solutions. Much
of the data comes from oceanography and typically focuses on bubble diameters below 1 mm in
sea water or sodium chloride solutions (Detsch and Harris, 1989; Detsch, 1991; Kugou et al.,
2003; Henry et al., 2008; Sato et al., 2010). Studies on low inorganic salt concentration showed
little effect on rise velocity (Fuerstenau and Wayman, 1958; Okazaki, 1962).
Bozzano and Dente (2001, 2009) and van Wijngaarden and Veldhuis (2008) have attempted to
explain the shape and velocity variations through energy balances which incorporate surface and
kinetic energy.
A) B)
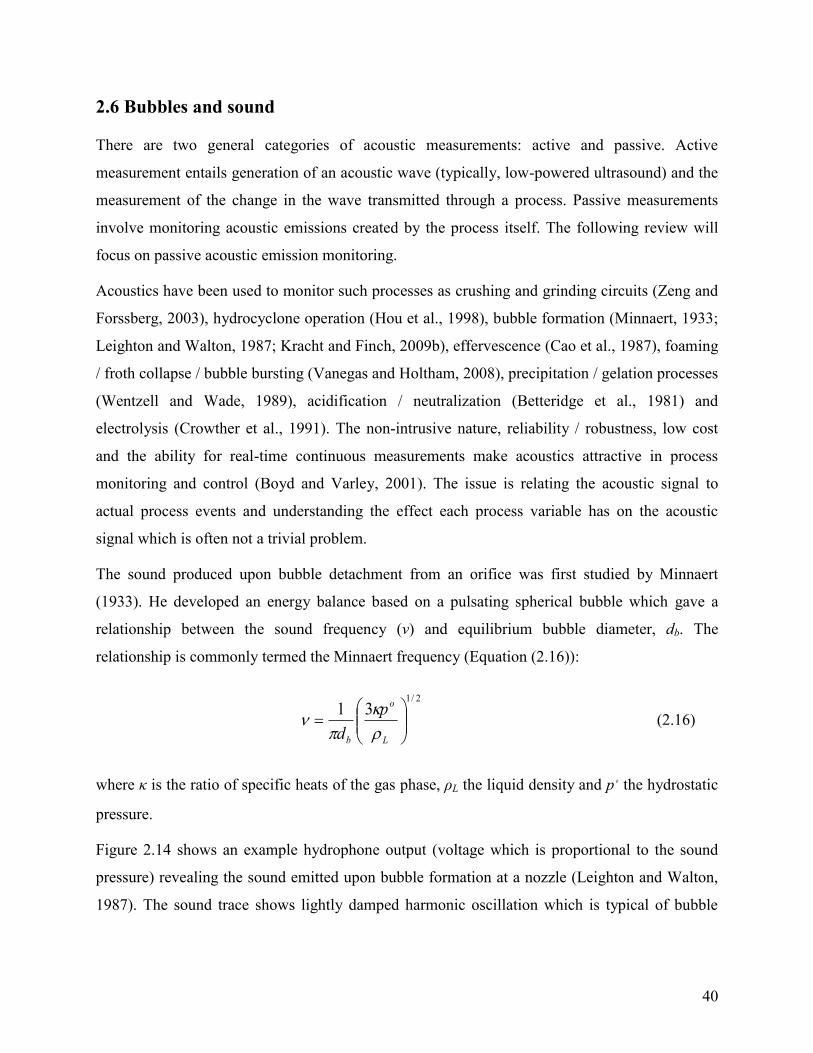
40
2.6 Bubbles and sound
There are two general categories of acoustic measurements: active and passive. Active
measurement entails generation of an acoustic wave (typically, low-powered ultrasound) and the
measurement of the change in the wave transmitted through a process. Passive measurements
involve monitoring acoustic emissions created by the process itself. The following review will
focus on passive acoustic emission monitoring.
Acoustics have been used to monitor such processes as crushing and grinding circuits (Zeng and
Forssberg, 2003), hydrocyclone operation (Hou et al., 1998), bubble formation (Minnaert, 1933;
Leighton and Walton, 1987; Kracht and Finch, 2009b), effervescence (Cao et al., 1987), foaming
/ froth collapse / bubble bursting (Vanegas and Holtham, 2008), precipitation / gelation processes
(Wentzell and Wade, 1989), acidification / neutralization (Betteridge et al., 1981) and
electrolysis (Crowther et al., 1991). The non-intrusive nature, reliability / robustness, low cost
and the ability for real-time continuous measurements make acoustics attractive in process
monitoring and control (Boyd and Varley, 2001). The issue is relating the acoustic signal to
actual process events and understanding the effect each process variable has on the acoustic
signal which is often not a trivial problem.
The sound produced upon bubble detachment from an orifice was first studied by Minnaert
(1933). He developed an energy balance based on a pulsating spherical bubble which gave a
relationship between the sound frequency (ν) and equilibrium bubble diameter, db. The
relationship is commonly termed the Minnaert frequency (Equation (2.16)):
2/1
31
L
o
b
p
d
(2.16)
where κ is the ratio of specific heats of the gas phase, ρL the liquid density and p₀ the hydrostatic
pressure.
Figure 2.14 shows an example hydrophone output (voltage which is proportional to the sound
pressure) revealing the sound emitted upon bubble formation at a nozzle (Leighton and Walton,
1987). The sound trace shows lightly damped harmonic oscillation which is typical of bubble
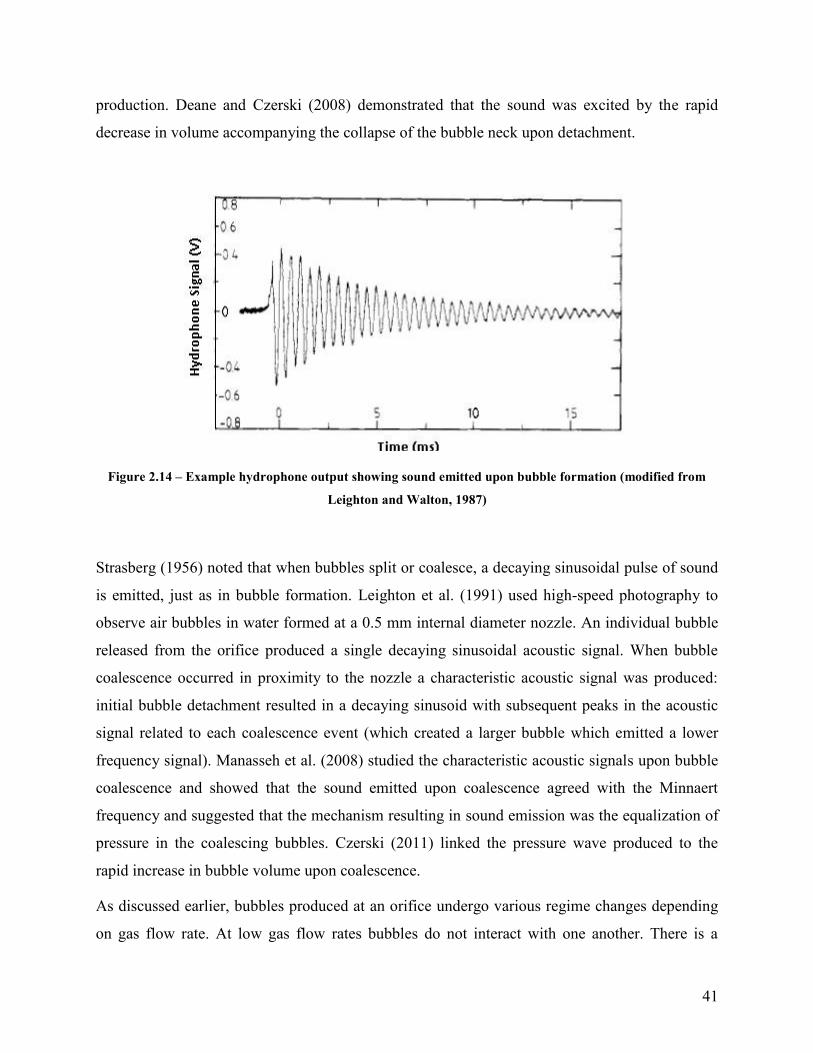
41
production. Deane and Czerski (2008) demonstrated that the sound was excited by the rapid
decrease in volume accompanying the collapse of the bubble neck upon detachment.
Figure 2.14 – Example hydrophone output showing sound emitted upon bubble formation (modified from
Leighton and Walton, 1987)
Strasberg (1956) noted that when bubbles split or coalesce, a decaying sinusoidal pulse of sound
is emitted, just as in bubble formation. Leighton et al. (1991) used high-speed photography to
observe air bubbles in water formed at a 0.5 mm internal diameter nozzle. An individual bubble
released from the orifice produced a single decaying sinusoidal acoustic signal. When bubble
coalescence occurred in proximity to the nozzle a characteristic acoustic signal was produced:
initial bubble detachment resulted in a decaying sinusoid with subsequent peaks in the acoustic
signal related to each coalescence event (which created a larger bubble which emitted a lower
frequency signal). Manasseh et al. (2008) studied the characteristic acoustic signals upon bubble
coalescence and showed that the sound emitted upon coalescence agreed with the Minnaert
frequency and suggested that the mechanism resulting in sound emission was the equalization of
pressure in the coalescing bubbles. Czerski (2011) linked the pressure wave produced to the
rapid increase in bubble volume upon coalescence.
As discussed earlier, bubbles produced at an orifice undergo various regime changes depending
on gas flow rate. At low gas flow rates bubbles do not interact with one another. There is a
42
critical gas flow rate above which bubbles begin to interact, either bouncing or coalescing.
Kracht and Finch (2009b) determined the transition flow rate between a non-coalescing and
coalescing system using passive acoustic emission monitoring. The authors showed that the
onset of coalescence could be detected by the characteristic sound wave produced when two
bubbles coalesce. The findings showed that coalescence was delayed in frother and sodium
chloride solutions (i.e., the transition flow rate between non-coalescence and coalescence
occurred at a higher gas flow rate).
References
Acuña Perez, C.A., 2007. Measurement techniques to characterize bubble motion in swarms.
Ph.D. Thesis, McGill University, Department of Mining and Materials Engineering.
Acuña, C.A., and Finch, J.A., 2010. Tracking velocity of multiple bubbles in a swarm,
International Journal of Mineral Processing 94, 147-158.
Agrawal, S.K., and Wasan, D.T., 1979. The effect of interfacial viscosities on the motion of
drops and bubbles, The Chemical Engineering Journal 18, 215-223.
Alexander, S., Quinn, J., van der Spuy, J.E., and Finch, J.A., 2012. Correlation of graphite
flotation and gas holdup in saline solutions, in Drelich, J. (Ed.), Water in Mineral Processing:
Proceedings of the First International Symposium, SME, 41-50.
Aston, J., Boskovic, S., Tindall, G., and Tsatouhas, G., 2013. Improving performance and
efficiency of copper and copper-gold circuits with POLYFROTH W22 frother, presentation
Flotation ’13, Cape Town, Nov 18-21, 2013.
Azgomi, F., Gomez, C.O., and Finch, J.A., 2007. Characterizing frothers using gas hold-up,
Canadian Metallurgical Quarterly 46, 3, 237-242.
Aybers N.M., and Tapucu, A., 1969a. The motion of gas bubbles rising through stagnant liquid.
Wärme- und Stoffübertragung Bd. 2, S. 118-128.
Aybers N.M., and Tapucu, A., 1969b. Studies on the drag and shape of gas bubbles rising
through a stagnant liquid. Wärme- und Stoffübertragung Bd. 2, S. 171-177.

43
Bachhuber, C., and Sanford, C., 1974. The rise of small bubbles in water. Journal of Applied
Physics 45, 2567-2569.
Bergman, T., and Mesler, R., 1981. Bubble nucleation studies. Part I: Formation of bubble nuclei
in superheated water by bursting bubbles, AIChE Journal 27, 851-853.
Betteridge, D., Joshlin, M.T., and Lilley, T., 1981. Acoustic emissions from chemical reactions,
Analytical Chemistry 53, 1064-1073.
Bhaga, D., and Weber, M.E., 1981. Bubbles in viscous liquids: shapes, wakes and velocities.
Journal of Fluid Mechanics 105, 61-85.
Bikerman, J.J., 1938. The unit of foaminess, Transactions of the Faraday Society 34, 634.
Blin, P., and Dion-Ortega, A., June/July 2013. High and dry: With water in short supply, some
are looking to the ocean for answers, CIM Magazine, 46-51.
Bonner, O.D., and Jumper, C.F., 1973. Effect of Ions on Water Structure, Infrared Physics 13,
233-242.
Boyd, J.W.R., and Varley, J., 2001. The use of passive measurement of acoustic emissions from
chemical engineering processes, Chemical Engineering Science 56, 1749-1767.
Bozzano, G., and Dente, M., 2001. Shape and terminal velocity of single bubble motion: a novel
approach, Computers and Chemical Engineering 25, 571-576.
Cain, F.W., and Lee, J.C., 1984. A technique for studying the drainage and rupture of unstable
liquid films formed between two captive bubbles: Measurement on KCl Solutions, Journal of
Colloid and Interface Science 106, 1, 70-85.
Cao, Z., Wang, B.-F., Wang, K.-M., Lin, H.-G., and Yu, R.-Q., 1998. Chemical acoustic
emissions from gas evolution processes recorded by a piezoelectric transducer, Sensors and
Actuators B 50, 27-37.
Cappuccitti, F., and Finch, J.A., 2007. Development of new frothers through hydrodynamic
characterization, In: Folinsbee, J. (Ed.), Proceedings 39th Annual Meeting of the Canadian
Mineral Processors of CIM, 399–412.
44
Cappuccitti, F., and Nesset, J.E., 2009. Frother and collector effects on flotation cell
hydrodynamics and their implication on circuit performance, Advances in Mineral Processing
Science and Technology - Conference of Metallurgists, Sudbury, 169-182.
Castro, S., 2012. Challenges in flotation of Cu-Mo sulfide ores in sea water. In: Drelich, J. (Ed.),
Water in Mineral Processing: Proceedings of the First International Symposium. SME,
Englewood, USA, 29-40.
Cole, R., 2009. KCGM News and Views, Issue 8, August 2009. 1-4.
Chen, F., Gomez, C.O., and Finch, J.A., 2001. Bubble size measurement in flotation machines,
Minerals Engineering 14, 427-432.
Cho, Y.S., and Laskowski, J.S., 2002a. Effect of flotation frothers on bubble size and foam
stability, International Journal Minerals Processing 64, 69-80.
Cho, Y.S., and Laskowski, J.S., 2002b. Bubble coalescence and its effect on bubble size and
foam stability, Canadian Journal of Chemical Engineering 80, 299-305.
Christenson, H.K., Bowen, R.E., Carlton, J.A., Denne, J.R.M., and Lu, Y., 2008. Electrolytes
that show transition to bubble coalescence inhibition at high concentrations. Journal of Physical
Chemistry C 112, 794-796.
Clift, R., Grace, J.R., and Weber, M., 2005. Bubble, Drops, and Particles. Dover Publications,
Inc., Mineola, New York.
Comley, B.A., Harris, P.J., Bradshaw, D.J., and Harris, M.C., 2002. Frother characterization
using dynamic surface tension measurements. International Journal of Mineral Processing, 64, 2,
81-100.
Craig, V.S.J., Ninham, B.W., and Pashley, R.M., 1993. The effect of electrolytes on bubble
coalescence in water, Journal of Physical Chemistry 97, 10192-10197.
Craig, V.S.J., 2004. Bubble coalescence and specific-ion effects, Current Opinion in Colloid and
Interface Science 9, 178-184.
Craig, V.S.J., 2011. Do hydration forces play a role in thin film drainage and rupture observed in
electrolyte solution? Current Opinion in Colloid and Interface Science 16, 597-600.
45
Crowther, T.G., Wade, A. P., Wentzell, P.D., and Gopal, R. 1991. Characterization of acoustic
emission from an electrolysis cell, Analytica Chimica Acta 254, 223-234.
Crozier, R.D., and Klimpel, R.R., 1989. Frothers: Plant Practice, Mineral Processing and
Extractive Metallurgy Review 5, 257-279.
Cytec Industries Inc., Mining Chemicals Handbook, Revised Edition, 2002.
Czarnecki, J., Malysa, K., and Pomianowski, A., 1982. Dynamic Frothability Index, Journal of
Colloid and Interface Science 86, 570–572.
Czerski, H., 2011. A candidate mechanism for exciting sound during bubble coalescence. The
Journal of the Acoustical Society of America, 129, 3, EL83-EL88.
Davies, J.T., 1957. A quantitative kinetic theory of emulsion type, In: Physical Chemistry of the
Emulsifying Agent, Gas/Liquid and Liquid/Liquid Interface. Proceedings of the International
Congress of Surface Activity, 426-438.
Davies, R.M., and Taylor, G., 1950. The mechanics of large bubbles rising through extended
liquids and through liquids in tubes. Proceedings of the Royal Society of London, Series A,
Mathematical and Physical Sciences 200, 1060, 375-390.
Deane, G.B., and Czerski, H., 2008. A mechanism stimulating sound production from air
bubbles released from a nozzle, Journal of the Acoustical Society of America 123, 6, EL126-
EL132.
Detsch, R.M., 1991. Small air bubbles in reagent grade water and seawater: Rise velocities of 20
to 1000-μm diameter bubbles. Journal of Geophysical Research 96, C5, 8901-8906.
Detsch R., and Harris, I., 1989. Dissolution and rise velocity of small air bubbles in water and
salt water, in Proceedings of OCEANS'89, 1, 286–291.
Detwiler, A., and Blanchard, D.C., 1978. Aging and Bursting bubbles in trace-contaminated
water. Chemical Engineering Science 33, 9-13.
Drogaris, G., and Weiland, P., 1983. Coalescence of gas bubbles in aqueous solutions of n-
alcohols and fatty acids, Chemical Engineering Science 38, 9, 1501-1506.
Duineveld, P.C., 1995. The rise velocity and shape of bubbles in pure water at high Reynolds
number. Journal of Fluid Mechanics 292, 325-332.
46
Dukhin, S.S., Miller, R., and Loglio, G., 1998. Physico-chemical hydrodynamics of rising
bubbles. In: Mubius, D., Miller, R. (Eds.), Studies in interfacial Science, Drops and Bubbles in
Interfacial Research, Elsevier Science 6, 367-432.
Dunne, R., 2012. Water water everywhere and not a drop to drink, nor do I know its
whereabouts. In: Drelich, J., Water in Mineral Processing: Proceedings of the First International
Symposium, Englewood, USA, 1-16.
Fan, L.S., and Tsuchiya, K., 1990. Bubble wake dynamics in liquids and liquid-solid
suspensions, Butterworth and Heinemann, 363.
Finch, J.A., and Dobby, G.S., 1990. Column Flotation, Permagnon Press, Toronto.
Finch, J.A., Gelinas, S., and Moyo, P., 2006. Frother-related research at McGill University,
Minerals Engineering 19, 726-733.
Finch, J.A., Nesset, J.E., and Acuna, C., 2008. Role of frother in bubble production and
behaviour in flotation, Minerals Engineering 21, 949–957.
Foulk, C.W., and Miller, J.N., 1931. Experimental evidence in support of the balanced-layer
theory of liquid film formation, Industrial and Engineering Chemistry 23, 11, 1283-1288.
Frumkin, A., and Levich, V.G., 1947. On surfactants and interfacial motion. Zh. Fiz. Khim. 21,
1183.
Fuerstenau, D.W., and Wayman, C.H., 1958. Effect of chemical reagents on the motion of single
air bubbles in water, Mining Engineering, Transactions of AIME, 694-699.
George, C., 1996. Mt. Keith Operation. In: Grimsey, E.J., and Neuss, I. (Eds.), Nickel ’96,
Conference Series - Australasian Institute of Mining and Metallurgy, 6, 19-23.
Gomez, C.O., and Finch, J.A., 2002. Gas dispersion measurements in flotation machines, CIM
Bulletin 95, 1066, 73-78.
Gomez, C.O., and Finch, J.A., 2007. Gas dispersion measurements in flotation cells.
International Journal of Mineral Processing 84, 1, 51-58.
Gomez, C.O., Maldonado, M., Araya, R., and Finch, J.A., 2010. Frother and viscosity effects on
bubble shape and velocity. In: Proceedings of the 49th
Conference of Metallurgists (COM):
47
Rheology in Mineral Processing, The 8th
UBC-McGill-U of A International Symposium on the
Fundamentals of Mineral Processing, The Metallurgical Society of CIM, 57-74.
Gorain, B.K., Franzidis, J.P., and Manlapig, E.V., 1997. Studies on impeller type, impeller speed
and air flow rate in an industrial flotation cell. Part 4: Effect of bubble surface area flux on
flotation performance. Minerals Engineering 10, 4, 367-379.
Grace, J.R., 1973. Shapes and velocities of bubbles rising in infinite liquids. Transactions of the
Institute of Chemical Engineers 51, 116-120.
Grace, J.R., Wairegi, T., and Nguyen, T.H., 1976. Shapes and velocities of single drops and
bubbles moving freely through immiscible liquids. Transactions of the Institute of Chemical
Engineers 54, 167-173.
Grau, R.A., Laskowski, J.S., and Heiskanen, K., 2005. Effect of frothers on bubble size,
International Journal of Mineral Processing 76, 225-233.
Griffin, W.C., 1949. Classification of surface-active agents by HLB, Journal of the Society of
Cosmetic Chemists 1, 311, 1949.
Griffin, W.C., 1954. Calculation of HLB values of non-ionic surfactants, Journal of the Society
of Cosmetic Chemists 5, 259.
Haig-Smillie, L.D., 1974. Sea water flotation, In: Proceedings of the Canadian Mineral
Processors Conference, 263-281.
Harper, J.F., 1972. The motion of bubbles and drops through liquids. In: Yih, C.-S. (Ed.),
Advances in Applied Mechanics. Vol. 12, Academic Press Inc., New York, 59-124.
Harris, P.J., 1982. Frothing phenomenon and frothers, In: King, R.P. (Ed.), Principles of
Flotation. Monograph Series No. 3. South African Institute of Mining and Metallurgy, 237–250.
Heiskanen, K., Javor, Z., Wierink, G., Omelka, B., and Schreithofer, N., 2012. Effect of frother
mobility on the bubble behaviour in bubble rise velocity measurements at the initial stages of
bubble formation, In: Young, C.A., and Luttrell, G.H. (Eds.), Separation Technologies: For
Minerals, Coal, and Earth Resources, SME, Englewood, USA, 1-5.
Helsby, F.W., and Tuson, K.R., 1955. Behaviour of air bubbles in aqueous solutions, Research 8,
270.
48
Henry, C.L., Parkinson, L., Ralston, J.R., and Craig, V.S.J., 2008. A mobile gas – water interface
in electrolyte solutions, The Journal of Physical Chemistry Letters C 112, 15094-15097.
Herman, J., and Mesler, R. 1987. Bubble entrainment from bursting bubbles. Journal of Colloid
and Interface Science 117, 565-569.
Hernandez-Aguilar, J.R., Gomez, C.O., and Finch, J.A., 2002. A Technique for the direct
measurement of bubble size distributions in industrial flotation cells; In: Nesset, J.E. (Ed.),
Proceedings of the 34th
Annual Meeting of the Canadian Mineral Processors, 389-402.
Hernandez-Aguilar, J.R., Cunningham, R., and Finch, J. A., 2006. A test of the Tate equation to
predict bubble size at an orifice in the presence of frother. International Journal of Mineral
Processing 79, 2, 89-97.
Hesketh, R.P., Etchells, A.W., and Russell, T.W.F., 1991. Bubble breakage in pipeline flow,
Chemical Engineering Science 46, 1.
Hinze, J.O., 1955. Fundamentals of the hydrodynamic mechanism of splitting in dispersion
processes. AIChE Journal, 1, 3, 289-295.
Hofmeier, U., Yaminsky, V.V., and Christensen, H.K., 1995. Observations of solute effects on
bubble formation, Journal of Colloid and Interface Science 174, 199-210.
Hou, R., Hunt, A., and Williams, R.A., 1998, Acoustic monitoring of hydrocyclone performance,
Minerals Engineering 11, 11, 1047-1059.
Hunter, T.N., Pugh, R.J., Franks, G.V., and Jameson, G.J., 2008. The role of particles in
stabilizing foams and emulsions, Advances in Colloid and Interface Science 137, 57–81.
Jameson, G.J., Physics and hydrodynamics of bubbles. In: Ives, K.J. (Ed.), The Scientific Basis
of Flotation. Series E: Applied Sciences – No. 75. Martinus Nijhoff Publishers. Boston. 53-78.
Javor. Z., Scheithofer, N., and Heiskanen, K., 2012. The effect of bubble release techniques on
their behaviour at the initial stages of rise, Minerals Engineering 36-38, 254-261.
Johnson, B.D., and Gershet, R.M., 1991. Bubble formation at a cylindrical frit surface in a shear
field, Chemical Engineering Science 46, 2753-2756.
Karamanev, G.G., 1994. Rise of gas bubbles in quiescent liquids. AIChE 38, 1843-1846.

49
Khristov, K., Malysa, K., and Exerowa, D., 1984. Steady-state foams: Influence of the type of
liquid films, Colloids and Surfaces 11, 39-49.
Klimpel, R.R, and Isherwood, S., 1991. Some industrial implications of changing frother
chemical structure, International Journal of Mineral Processing 33, 369-381.
Kracht, W., and Finch, J.A., 2009a. Bubble break-up and the role of frother and salt,
International Journal of Mineral Processing 92, 153–161.
Kracht, W., and Finch, J.A., 2009b. Using sound to study bubble coalescence, Journal of Colloid
and Interface Science 332, 237–245.
Kracht, W., and Finch, J.A., 2010. Effect of frother on initial bubble shape and velocity,
International Journal of Mineral Processing 94, 115-120.
Krzan, M., and Malysa, K., 2002a. Profiles of local velocities of bubbles in n-butanol, n-hexanol
and n-nonanol solutions. Colloids and Surfaces A: Physicochemical and Engineering Aspects
207, 279-291.
Krzan, M., and Malysa, K., 2002b. Influence of frother concentration on bubble dimensions and
rising velocities. Physicochemical Problems of Mineral Processing 36, 65-76.
Krzan, M., Lunkenheimer, K., and Malysa, K., 2004. On the influence of the surfactant’s polar
group on the local and terminal velocities of bubbles. Colloids and Surfaces A: Physicochemical
Engineering Aspects 250, 431-441.
Krzan, M., Zawala, J., and Malysa, K., 2007. Development of steady state adsorption distribution
over interface of a bubble rising in solutions of n-alkanols (C5, C8) and n-
alkyltrimethylammonium bromides (C8, C12, C16). Colloids and Surfaces A: Physicochemical
Engineering Aspects 298, 42-51.
Kulkarni, A.A., and Joshi, J.B., 2005. Bubble formation and bubble rise velocity in gas-liquid
systems: A review. Industrial and Engineering Chemistry Research 44, 5873-5931.
Kugou, N., Ishida, K., and Yoshida, A., 2003. Experimental study on motion of air bubbles in
seawater (terminal velocity and drag coefficient of air bubble rising in seawater). Transactions on
the Built Environment 68, 145-158.

50
Kupferberg, A. and G.J. Jameson, 1969. Bubble formation at a submerged orifice above a gas
chamber of finite volume, Transactions of the Institute of Chemical Engineers 47, T241-T250.
Kyriakides, N.K., Kasrinakis, E.G., Nychas, S.G., and Goulas, A., 1997. Bubbling from nozzles
submerged in water: Transitions between bubbling regimes, The Canadian Journal of Chemical
Engineering 75, 684-691.
Laskowski, J.S., 2004. Testing flotation frothers, Physicochemical Problems in Mineral
Processing 38, 13-34.
Laskowski, J.S., Cho, Y.S., and Ding, K., 2003a. Effect of frothers on bubble size and foam
stability in potash ore flotation systems, The Canadian Journal of Chemical Engineering 81, 63-
69.
Laskowski, J.S., Tlhone, T., Williams, P., and Ding, K., 2003b. Fundamental properties of the
polyoxypropylene alkyl ether flotation frothers, International Journal of Mineral Processing 72,
289–299.
Lee, C.-H., Herickson, L.E., and Glasgow, L.A., 1987. Bubble break-up and coalescence in
turbulent gas-liquid dispersion, Chemical Engineering Communications 59, 65-84.
Leighton, T. G., 1994. The Acoustic Bubble. Academic Press Inc., London.
Leighton, T.G., Fagan K.J., and Field, J.E., 1991. Acoustic and photographic studies of injected
bubbles, European Journal of Physics 12, 77-85.
Leighton, T.G., and Walton, A.J., 1987. An experimental study of the sound emitted from gas
bubbles in a liquid. European Journal of Physics 8, 2, 98-104.
Lekki, J., and Laskowski, J., 1975. A new concept of frothing in flotation systems and general
classification of flotation frothers, In: Proceedings of the 11th
International Mineral Processing
Congress, Cagliari, 429-448.
Lessard, R.D., and Zieminski, S.A., 1971. Bubble coalescence and gas transfer in aqueous
electrolytic solutions; Industrial and Engineering Chemistry Fundamentals 10, 260-289.
Levich, V. G., 1962. Physicochemical Hydrodynamics, Vol. 689. Englewood Cliffs, NJ,
Prentice-Hall.
51
Lewis, D., and Davidson, J.F., 1982. Bubble splitting in shear flow. Transactions of the
Institution of Chemical Engineers 60, 5, 283-291.
Maldonado, M., Quinn, J.J., Gomez, C.O., and Finch, J.A., 2013. An experimental study
examining the relationship between bubble shape and rise velocity. Chemical Engineering
Science 98, 7-11.
Malysa, K., 1992. Wet foams: Formation, properties and mechanism of stability, Advances in
Colloid and Interface Science 40, 37-83.
Malysa, K., and Pawlikowska-Czubak, J., 1975. Frothability and surface elasticity of aqueous
solutions of some frothers, Bulletin de l’Academie Polonaise des Sciences 5, 423-427.
Manasseh, R., Riboux, G., and Risso, F., 2008. Sound generation on bubble coalescence
following detachment. International Journal of Multiphase Flow, 34, 10, 938-949.
Martinez-Bazan, C., Montanes, J.L., and Lasheras, J.C., 2000. Bubble size distribution resulting
from the break-up of an air cavity injected into a turbulent water jet. Physics of Fluids 12, 145–
148.
Marrucci, G., and Nicodemo, L., 1967. Coalescence of gas bubbles in aqueous solutions of
inorganic electrolytes. Chemical Engineering Science 22, 1257-1265.
Melo, F., and Laskowski, J.S., 2006. Fundamental properties of flotation frothers and their effect
on flotation, Minerals Engineering 19, 766-773.
Mendelson, H.D., 1967. The prediction of bubble terminal velocities from wave theory. AIChE
Journal 13, 2, 250-253.
Minnaert, M., 1933. On musical air-bubbles and the sounds of running water, Philosophical
Magazine 16, 235–248.
Miyahara, T., Iwata, M. and Takahashi, T., 1984. Bubble formation pattern with weeping at a
submerged orifice, Journal of Chemical Engineering of Japan 17, 592-597.
Miyahara, T., Tanimoto, M., and Takahashi, T., 1982. Bubble formation from an orifice at high
gas injection rates, Kagaku Kogaku Ronbunshu 8, 18-24.
52
Miyhara, T., Tsuchiya, K., and Fan, L-S, 1991. Effect of turbulent wakes on bubble–bubble
interaction in a gas–liquid–solids Fluidized bed, Chemical Engineering Science 46, 9, 2368–
2373.
Moyo, P., Gomez, C.O., and J.A. Finch, 2006. Characterization of frothers by water carrying
rate, in Interfacial Phenomena in Fine Particle Technology, 6th UBC-McGill UA International
Symposium on Fundamentals of Mineral Processing (Eds. Z. Xu and Q. Liu), COM 2006,
Montreal, 133-146.
Moyo, P., Gomez, C.O. and J.A. Finch, 2007. Characterization frothers using water carrying rate,
Canadian Metallurgical Quarterly 46, 3, 215-220.
Nesset, J.E., Finch, J.A., and Gomez, C.O., 2007. Operating variables affecting the bubble size in
forced-air mechanical flotation machines, Ninth Mill Operators’ Conference, Fremantle, WA,
55-66.
Nesset, J.E., Hernandez-Aguilar, J.R., Acuna, C., Gomez, C.O., and Finch, J.A., 2006. Some gas
dispersion characteristics of mechanical flotation machines. Minerals Engineering 19, 807-815.
Nguyen, P.T., Hampton, M.A., Nguyen, A.V., and Birkett, G.R., 2012. The influence of gas
velocity, salt type and concentration on transition concentration for bubble coalescence inhibition
and gas holdup, Chemical Engineering Research and Design 90, 1, 33-39.
Nguyen, A.V., and Schulze, H.J. (eds.), 2004. Colloidal Science of Flotation. Surfactant science
series, vol. 118. Marcel Dekker. New York.
Ohnishi, M., Azuma, H., and Straub, J., 1999. Study on secondary bubble creation induced by
bubble coalescence, Advances in Space Research 24, 10, 1331-1336.
Okazaki,S., 1962. The velocity of air bubble ascending in aqueous solution of surface active
substance and inorganic electrolyte. Kolloid-Zeitschrift und Zeitschrit für Polymere, Band
185·Heft 2, 154-157.
Oosterwegel, G.G., and de Groot, H.J., 1980. On the possibility to measure volumes of small gas
bubbles and the bubble producing gas flow rates acoustically, Review of Scientific
Instrumentation 51, 2, 201-205.

53
Peng, Y., and Seaman, D., 2011. The flotation of slime-fine fractions of Mt. Keith pentlandite
ore in de-ionised and saline water, Minerals Engineering 24, 5, 479-481.
Peters, F., and Els, C., 2012. An experimental study on slow and fast bubbles in tap water.
Chemical Engineering Science 82, 194-199.
Pomianowski, A., Malysa, K., and Para, G., 1973. Annual Report for the Institute of Nonferrous
Metals, 6.
Prince, M.J., and Blanch, H.W., 1990. Bubble coalescence and break-up in air-sparged bubble
columns, AIChE Journal 36, 1485-1499.
Pugh, R.J., 1996. Foaming, foam films, antifoaming and defoaming, Advances in Colloid and
Interface Science 64, 67–142.
Pugh, R.J., 2007. The physics and chemistry of frothers, In: Fuerstenau, M.C., Jameson, G., and
Yoon, R.-H. (Eds.), Froth Flotation: A Century of Innovation, SME, Littleton, Colorado, USA.
Pugh, R.J., Weissenborn, P., and Paulson, O. 1997. Flotation in inorganic electrolytes; the
relationship between recovery of hydrophobic particles, surface tension, bubble coalescence and
gas solubility. International Journal of Mineral Processing 51, 125-138.
Quinn, J.J., Kracht, W., Gomez, C.O., Gagnon, C., and Finch, J.A., 2007. Comparing the effects
of salts and frother (MIBC) on gas dispersion and froth properties, Minerals Engineering 20,
1296-1302.
Quinn, J.J., Maldonado, M., Gomez, C.O., and Finch, J.A., 2013. An experimental study on
bubble shape and rise velocity in frother, polymer and inorganic salt solutions, In: Proceedings of
the 52nd
Conference of Metallurgists: Water and Energy in Mineral Processing, The 9th
UBC-
McGill-U of A International Symposium on the Fundamentals of Mineral Processing, The
Metallurgical Society of CIM , 1981-1992.
Quinn, J.J., Sovechles, J.M., Finch, J.A., and Waters, K.E., 2014. Critical coalescence
concentrations of inorganic salt solutions. Minerals Engineering 58, 1-6.
Raymond, F., and Rosant, J.-M., 2000. A numerical and experimental study of the terminal
velocity and shape of bubbles in viscous liquids. Chemical Engineering Science 55, 943-955.
54
Riggs, W.F., 1986. Frothers - An Operator’s Guide. In: Chemical Reagents in the Mineral
Processing Industry, 110-116.
Roberts, J.D., and Caserio, M.C., 1977, Basic Principles of Organic Chemistry, Second Edition,
W.A. Benjamin Inc.
Sam, A., Gomez, C.O., and Finch, J.A., 1996. Axial Velocity Profiles of Single Bubbles in
Water/Frother Solutions, International Journal of Mineral Processing 47, 177-196.
Sato, A., Aoki, M., and Watanabe, M., 2010. Single Rising Bubble Motion in Aqueous Solution
of Electrolyte, Journal of Fluid Science and Technology, 5, 1, 14-25.
Savic, P., 1953. Circulation and distortion of liquid drops falling through viscous medium, Nat.
Res. Council of Canada, Div. of Mech. Eng., Rep. No. NRC-MT-22, 36.
Schäfer, R., Merten, C., and Eigenberger, G., 2002. Bubble size distributions in a column reactor
under industrial conditions, Experimental Thermal and Fluid Science 26, 595-604.
Sevik, M., and Park, S.H., 1973. The splitting of drops and bubbles by turbulent fluid flow.
Journal of Fluids Engineering 95, 53-60.
Smolianski, A., Haario, H., and Luukka, P., 2008, Numerical study of dynamics of single
bubbles and bubble swarms. Applied Mathematical Modelling 32, 641-659.
Stewart, C.W., 1995. Bubble interaction in low-viscosity liquids. International Journal of
Multiphase Flow 21, 1037-1046.
Stokes, G.G., 1851. On the effect of the internal friction of fluid on the motion of pendulums.
Trans. Cambridge Phi. Soc. 9, 8.
Sweet, C., van Hoogstraten, J., Harris, M., and Laskowski, J.S., 1997. The effect of frothers on
bubble size and frothability of aqueous solutions, In: Finch, J.A., Rao, S.R., Holubec, I. (Eds.),
Processing of Complex Ores, 2nd UBC-McGill Symposium on Fundamentals in Mineral
Processing, The Metallurgical Society of CIM, 235–246.

55
Talaia, M.A.R., 2007. Terminal velocity of a bubble rise in a liquid column, World Academy of
Science, Engineering and Technology 28, 264-268.
Tan, S.N., Pugh, R.J., Fornasiero, D., Sedev, R., and Ralston, J., 2005. Foaming of
Polypropylene Glycols and Glycol/MIBC Mixtures, Minerals Engineering 18, 179-188.
Tan, S.N., Pugh, R.J., Fornasiero, D., Sedev, R., and Ralston, J., 2006. The interfacial
conformation of polypropylene glycols and their foam properties, Minerals Engineering 19, 703-
712.
Tan, Y.H., Rafiei, A.A, Elmahdy, A., and Finch, J.A., 2013. Bubble size, gas holdup and bubble
velocity profile of some alcohols and commercial frothers. International Journal of Mineral
Processing 119, 1-5.
Tate, T., 1864. On the magnitude of a drop of liquid formed under different circumstances. The
London, Edinburgh, and Dublin Philosophical Magazine and Journal of Science, 27, 181, 176-
180.
Tomiyama, A., 2002. Single bubbles in stagnant liquids and in linear shear flows (Keynote
Lecture). In: Prasser, H.-M. (Ed.), Proceedings of Measurement Techniques for Steady and
Transient Multiphase Flows, Rossendorf, September 18 – 20.
Tomiyama, A., Celata, G.P., Hosokawa, S., and Yoshida, S., 2002. Terminal velocity of single
bubbles in surface tension force dominant regime. International Journal of Multiphase Flow 28,
1497-1519.
Tomiyama, A., and Hayashi, K., 2011, Interface tracking and multi-fluid simulations of bubble
flows in bubble columns. (Keynote Lecture) 8th International Conference on
Computational Fluid Dynamics in the Oil & Gas, Metallurgical and Process Industries (CFD
2011), Trondheim, Norway.
Tsang, Y.H., Koh, Y.-H., and Koch, D.L., 2004. Bubble-size dependence of the critical
electrolyte concentration for inhibition of coalescence, Journal of Colloid and Interface Science
275, 290-297.
Tse, K.L., Martin, T., McFarlane, C.M., and A.W. Nienow, 2003. Small bubble formation via a
coalescence dependent break-up mechanism, Chemical Engineering Science 58, 275-286.
56
Tucker, J.P., Deglon, D.A., Franzidis, J.P., Harris, M.C., and O’Connor, C.T., 1994. An
Evaluation of Direct Method of Bubble Size Distribution Measurements in a Laboratory Batch
Flotation Cell, Minerals Engineering 7, 667-680.
Tuson, K.R., 1955. Single exposure photography of high speed event, British Journal of Applied
Physics 6, 99-100.
van Wijngaarden, L., and Veldhuis, C., 2008. On hydrodynamical properties of ellipsoidal
bubbles. Acta Mechanica 201, 37-46.
Vanegas, C., and Holtham, P., 2008. On-line froth acoustic emission measurements in industrial
sites, Minerals Engineering 21, 883–888.
Vera, M.A., Mathe, Z.T., Franzidis, J.-P., Harris, M.C., Manlapig, E.V., and O’Connor, C.T.,
2002. The modelling of froth zone recovery in batch and continuously operated laboratory
flotation cells, International Journal of Mineral Processing 64, 135-151.
Wang, B., and Peng, Y., 2013. The behaviour of mineral matter in fine coal flotation using saline
water. Fuel 109 309-315.
Wentzell, P. D., and Wade, A. P., 1989. Chemical acoustic emission analysis in the frequency
domain, Analytical Chemistry 61, 2638-2642.
Wichterle, K., Sutná, K., and Večeř, M., 2009. Shape and rising velocity of bubbles. In: Markoš,
J. (Ed.), Proceedings: 36th
International Conference of Slovak Society of Chemical Engineering,
090-1 - 090-12.
Wilkinson, P.M., Van Schayk, A., and Spronken, J.P., 1993. The influence of gas density and
liquid properties on bubble breakup. Chemical Engineering Science 48, 7, 1213-1226.
Wills, B.A., and Napier-Munn, T., 2006. Wills' Mineral Processing Technology: An Introduction
to the Practical Aspects of Ore Treatment and Mineral Recovery. Butterworth-Heinemann,
Burlington, MA, USA.
Wu, M., and Gharib, M., 2002. Experimental studies on the shape and path of small air bubbles
rising in clean water. Physics of Fluids 14, 7, L49-L52.
57
Yañez, A.B., Morales, P., Coddou, F., Elgueta, H., Ortiz, J.M., Perez, C., Cortes, G., Gomez,
C.O., and Finch, J.A., 2009. Gas dispersion characterization of TANKCELL®-300 at
Chuquicamata concentrator, Conference of Metallurgists, Sudbury, 313-324.
Yoon, R. H., and Sabey, J. B., 1989. Coal flotation in inorganic salt solutions, Surfactant Science
Series: Interfacial Phenomena in Coal Technology 32, 87-114.
Zahradnik, J., Fialová, M., and Linek, V., 1999. The effect of surface additives on bubble
coalescence in aqueous media, Chemical Engineering Science 54, 4757-4766.
Zeng, Y., and Forssberg, E., 1993. Monitoring Grinding parameters by signal measurements for
an industrial ball mill, International Journal of Mineral Processing 40, 1-16.
Zhang, F.H., and Thoroddsen, S.T., 2008. Satellite generation during bubble coalescence,
Physics of Fluids 20, 022104.
Zhang, L., and Shoji, M., 2001. Aperiodic bubble formation from a submerged orifice. Chemical
Engineering Science 56, 5371-5381.
Zhang, W., Nesset, J.E., Rao, R., and Finch, J.A., 2012a. Concentration (CCC)95-hydrophile-
lipophile balance (HLB) relationship. Minerals 2, 3, 208-227.
Zhang, W., Zhou, X., and Finch, J.A., 2012b. Determining independent control of dual-frother
systems – gas holdup, bubble size and water overflow rate. Minerals Engineering 39, 106-116.
Zhang, Y., McLaughlin, J.B., and Finch, J.A., 2001. Bubble velocity profile and model of
surfactant mass transfer to bubble surface. Chemical Engineering Science 56, 6605-6616.
Zieminski, S.A., Hume III, R.M., and Durham, R., 1976. Rates of oxygen transfer from air
bubbles to aqueous NaCl solutions at various temperatures, Marine Chemistry 4, 333-346.
Zieminski, S.A., and Lessard, R.D., 1969. Effects of chemical additives on performance of an
air-water contactor, I & EC Process Design and Development 8, 1, 69-75.
Zieminski, S.A., and Whittemore, R.C., 1971. Behavior of gas bubbles in aqueous electrolyte
solutions; Chemical Engineering Science 26, 509-520.
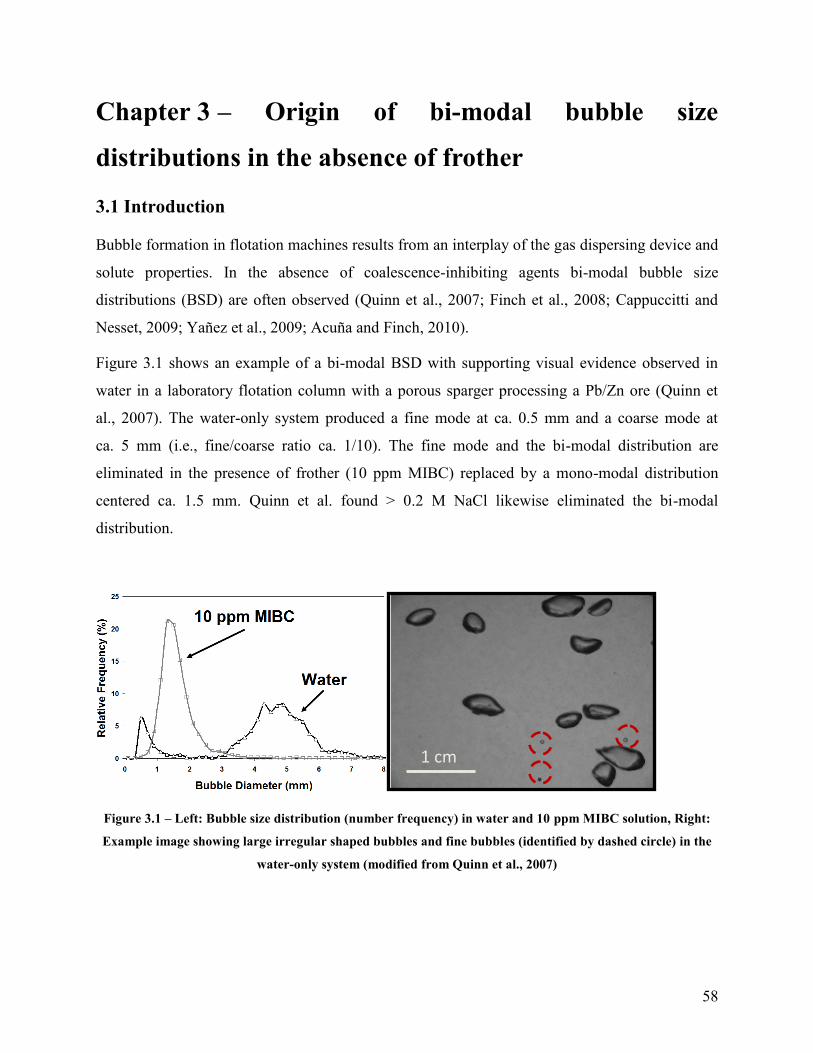
58
Chapter 3 – Origin of bi-modal bubble size
distributions in the absence of frother
3.1 Introduction
Bubble formation in flotation machines results from an interplay of the gas dispersing device and
solute properties. In the absence of coalescence-inhibiting agents bi-modal bubble size
distributions (BSD) are often observed (Quinn et al., 2007; Finch et al., 2008; Cappuccitti and
Nesset, 2009; Yañez et al., 2009; Acuña and Finch, 2010).
Figure 3.1 shows an example of a bi-modal BSD with supporting visual evidence observed in
water in a laboratory flotation column with a porous sparger processing a Pb/Zn ore (Quinn et
al., 2007). The water-only system produced a fine mode at ca. 0.5 mm and a coarse mode at
ca. 5 mm (i.e., fine/coarse ratio ca. 1/10). The fine mode and the bi-modal distribution are
eliminated in the presence of frother (10 ppm MIBC) replaced by a mono-modal distribution
centered ca. 1.5 mm. Quinn et al. found > 0.2 M NaCl likewise eliminated the bi-modal
distribution.
Figure 3.1 – Left: Bubble size distribution (number frequency) in water and 10 ppm MIBC solution, Right:
Example image showing large irregular shaped bubbles and fine bubbles (identified by dashed circle) in the
water-only system (modified from Quinn et al., 2007)
1 cm
59
In another example, Finch et al. (2008) show bi-modal distribution in a mechanical cell in water
only with a fine mode (ca. 0.5 mm) and coarse mode (ca. 5 mm), i.e., ca. 1/10 ratio similar to
Figure 3.1. Sequential addition of frother was illustrated to progressively eliminate the bi-modal
distribution eventually realizing a mono-modal distribution centered in that case at ca. 0.8 mm.
The origin of the bi-modal distribution in water-only and its elimination by adding frother, or
salt, needs an explanation. One possible origin of the bi-modal distribution is the fact that the
large bubbles expected without frother are unstable and prone to break-up (Leighton, 1991).
Another possibility is that the bi-modal distribution originates from bubble-bubble interactions.
Tse et al. (2003), trying to explain the origin of fine bubbles as the swarm rose in a bubble
column, observed coalescing bubbles expelling a fine bubble. They argued that an annular wave
is set up in the newly formed bubble which travels the length of the bubble resulting in extension
and pinching-off of a daughter bubble. The mechanism was observed in experiments contacting
two bubbles at facing capillaries. The process will be called ‘coalescence-induced bubble break-
up’. Ohnishi et al. (1999) described a similar phenomenon.
Zhang and Thoroddsen (2008) studied coalescence-induced break-up. Experimentally, they
launched one bubble into a second bubble held at a capillary and showed that for equal sized
parent bubbles, the daughter bubble is roughly 1/10th
the parent size. Using high-speed video
imaging the authors identified the capillary waves which converged at the bubble apex and
pinched off the daughter bubble.
Exploring the origin of bi-modal distributions in the absence of frother in flotation systems,
Finch et al. (2008) found they could control bubble interactions and generate coalescence-
induced break-up by manipulating gas rate at a capillary. In the example shown, addition of
frother prevented coalescence and the related fine bubble formation. The intention was to pursue
this experimental technique and determine the gas rate at which coalescence-induced break-up
occurred as a function of frother addition, following the previous work that tracked the transition
gas rate between non-coalescence and coalescence (Kracht and Finch, 2009). It became apparent,
however, that the mechanism described by Tse et al. (2003) was only one possibility. The
purpose of this paper is to identify other mechanisms that may promote small bubble formation
and bi-modal distributions using high-speed imaging of bubble interactions at a capillary.
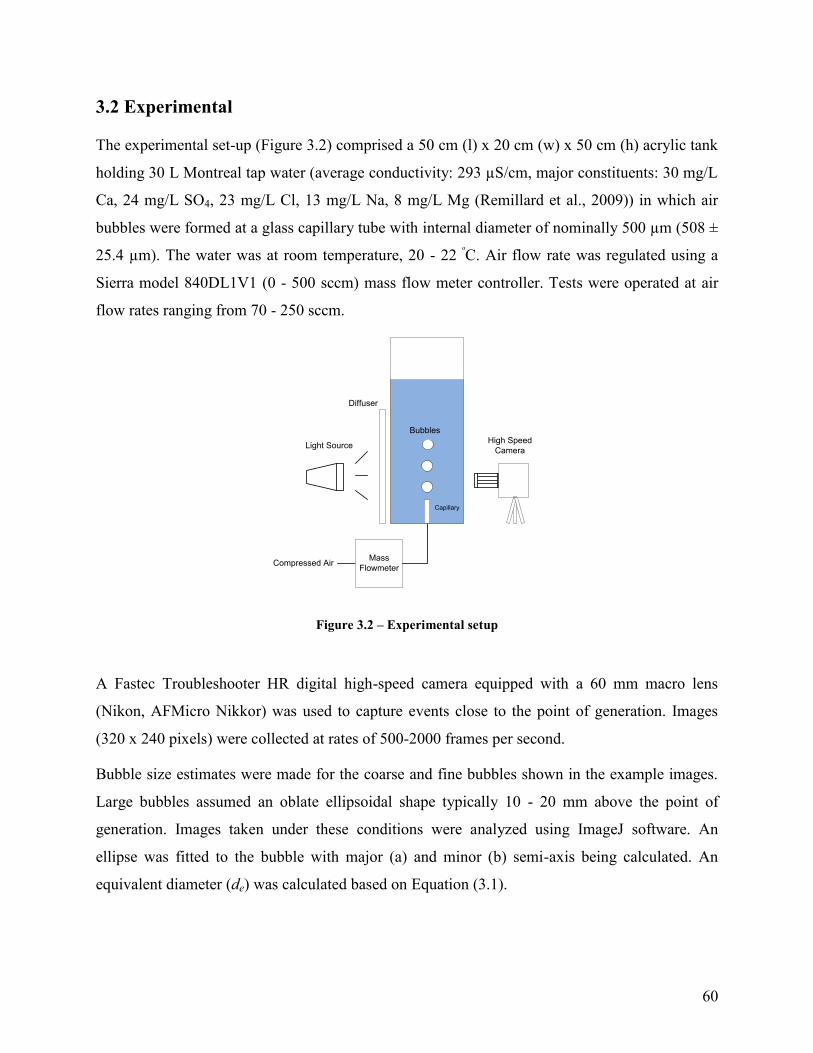
60
3.2 Experimental
The experimental set-up (Figure 3.2) comprised a 50 cm (l) x 20 cm (w) x 50 cm (h) acrylic tank
holding 30 L Montreal tap water (average conductivity: 293 µS/cm, major constituents: 30 mg/L
Ca, 24 mg/L SO4, 23 mg/L Cl, 13 mg/L Na, 8 mg/L Mg (Remillard et al., 2009)) in which air
bubbles were formed at a glass capillary tube with internal diameter of nominally 500 µm (508 ±
25.4 µm). The water was at room temperature, 20 - 22 ᵒC. Air flow rate was regulated using a
Sierra model 840DL1V1 (0 - 500 sccm) mass flow meter controller. Tests were operated at air
flow rates ranging from 70 - 250 sccm.
Compressed AirMass
Flowmeter
Light Source
Diffuser
High Speed
Camera
Bubbles
Capillary
Figure 3.2 – Experimental setup
A Fastec Troubleshooter HR digital high-speed camera equipped with a 60 mm macro lens
(Nikon, AFMicro Nikkor) was used to capture events close to the point of generation. Images
(320 x 240 pixels) were collected at rates of 500-2000 frames per second.
Bubble size estimates were made for the coarse and fine bubbles shown in the example images.
Large bubbles assumed an oblate ellipsoidal shape typically 10 - 20 mm above the point of
generation. Images taken under these conditions were analyzed using ImageJ software. An
ellipse was fitted to the bubble with major (a) and minor (b) semi-axis being calculated. An
equivalent diameter (de) was calculated based on Equation (3.1).
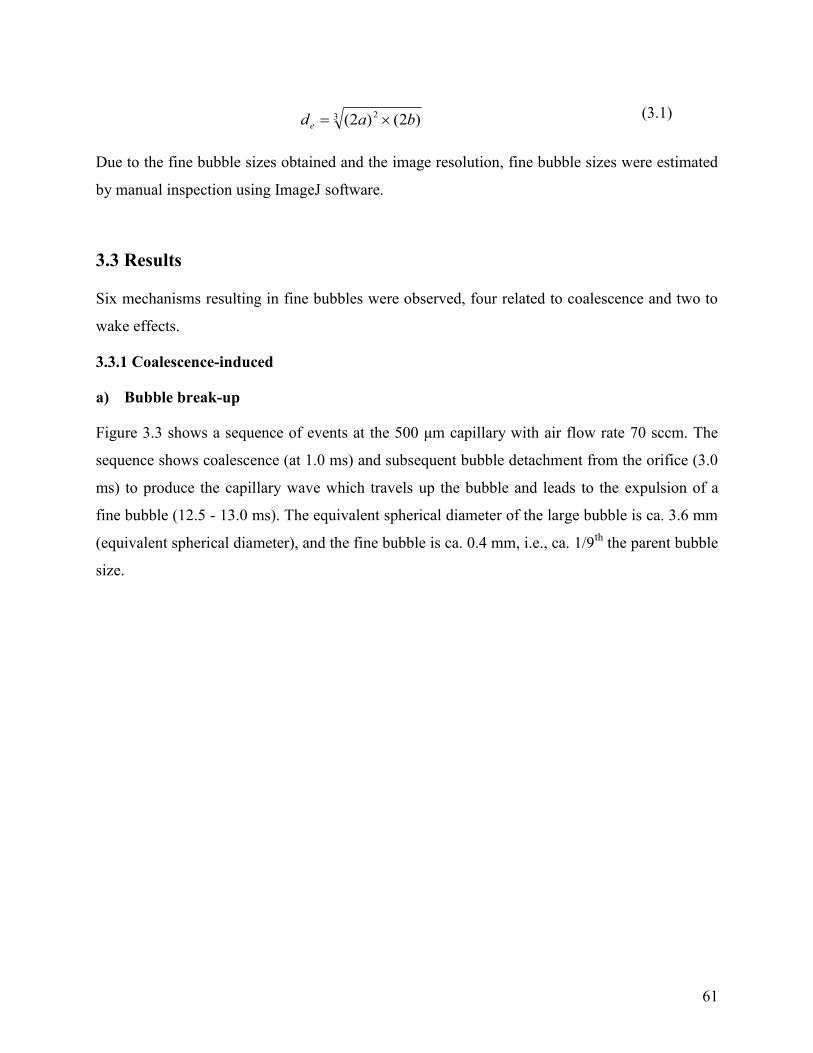
61
3 2 )2()2( bade (3.1)
Due to the fine bubble sizes obtained and the image resolution, fine bubble sizes were estimated
by manual inspection using ImageJ software.
3.3 Results
Six mechanisms resulting in fine bubbles were observed, four related to coalescence and two to
wake effects.
3.3.1 Coalescence-induced
a) Bubble break-up
Figure 3.3 shows a sequence of events at the 500 μm capillary with air flow rate 70 sccm. The
sequence shows coalescence (at 1.0 ms) and subsequent bubble detachment from the orifice (3.0
ms) to produce the capillary wave which travels up the bubble and leads to the expulsion of a
fine bubble (12.5 - 13.0 ms). The equivalent spherical diameter of the large bubble is ca. 3.6 mm
(equivalent spherical diameter), and the fine bubble is ca. 0.4 mm, i.e., ca. 1/9th
the parent bubble
size.
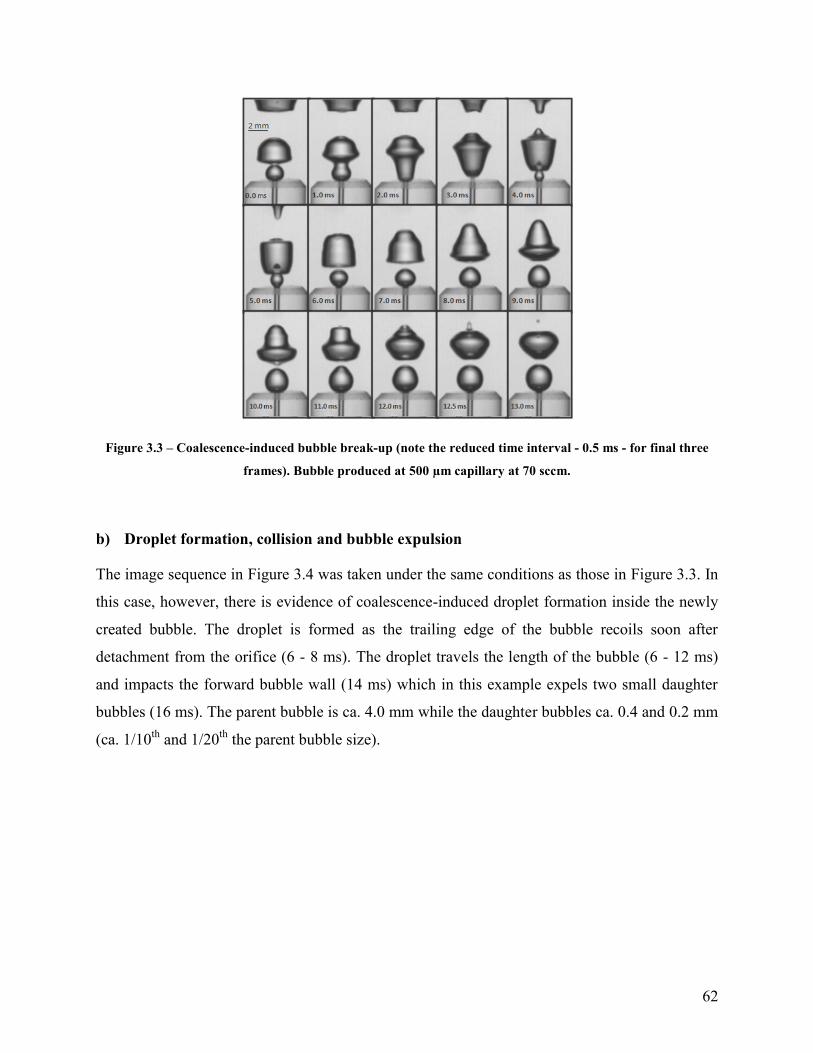
62
Figure 3.3 – Coalescence-induced bubble break-up (note the reduced time interval - 0.5 ms - for final three
frames). Bubble produced at 500 µm capillary at 70 sccm.
b) Droplet formation, collision and bubble expulsion
The image sequence in Figure 3.4 was taken under the same conditions as those in Figure 3.3. In
this case, however, there is evidence of coalescence-induced droplet formation inside the newly
created bubble. The droplet is formed as the trailing edge of the bubble recoils soon after
detachment from the orifice (6 - 8 ms). The droplet travels the length of the bubble (6 - 12 ms)
and impacts the forward bubble wall (14 ms) which in this example expels two small daughter
bubbles (16 ms). The parent bubble is ca. 4.0 mm while the daughter bubbles ca. 0.4 and 0.2 mm
(ca. 1/10th
and 1/20th
the parent bubble size).
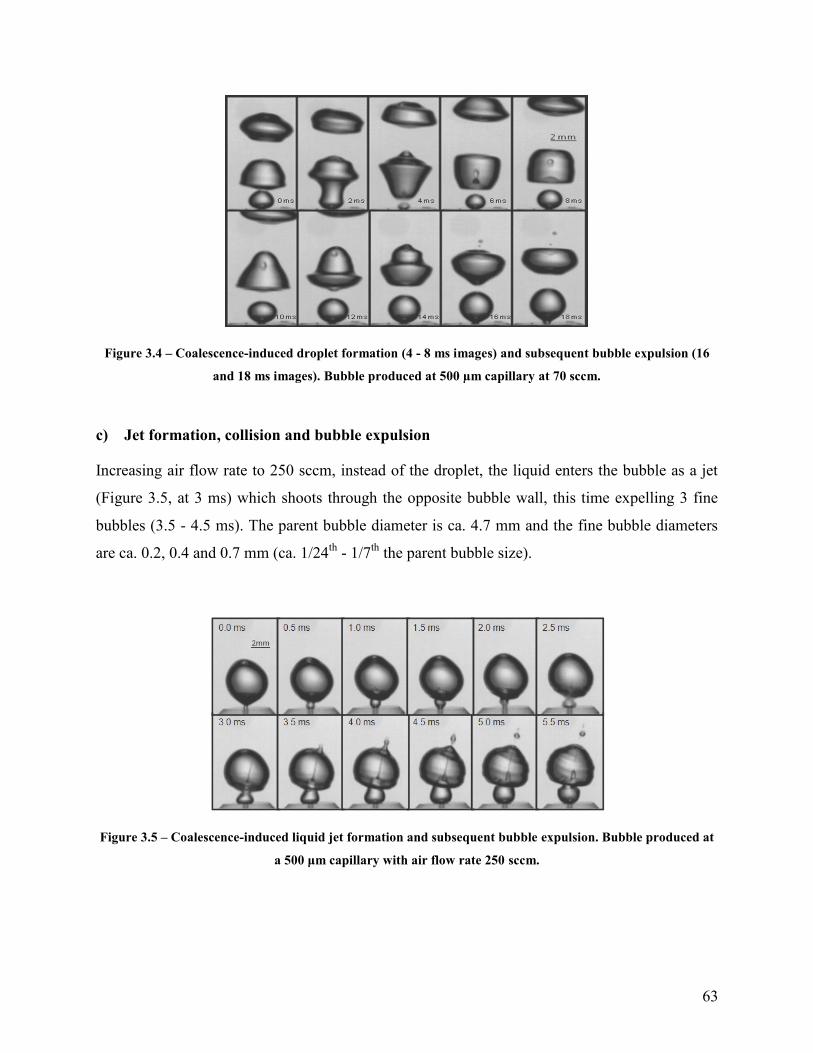
63
Figure 3.4 – Coalescence-induced droplet formation (4 - 8 ms images) and subsequent bubble expulsion (16
and 18 ms images). Bubble produced at 500 µm capillary at 70 sccm.
c) Jet formation, collision and bubble expulsion
Increasing air flow rate to 250 sccm, instead of the droplet, the liquid enters the bubble as a jet
(Figure 3.5, at 3 ms) which shoots through the opposite bubble wall, this time expelling 3 fine
bubbles (3.5 - 4.5 ms). The parent bubble diameter is ca. 4.7 mm and the fine bubble diameters
are ca. 0.2, 0.4 and 0.7 mm (ca. 1/24th
- 1/7th
the parent bubble size).
Figure 3.5 – Coalescence-induced liquid jet formation and subsequent bubble expulsion. Bubble produced at
a 500 μm capillary with air flow rate 250 sccm.
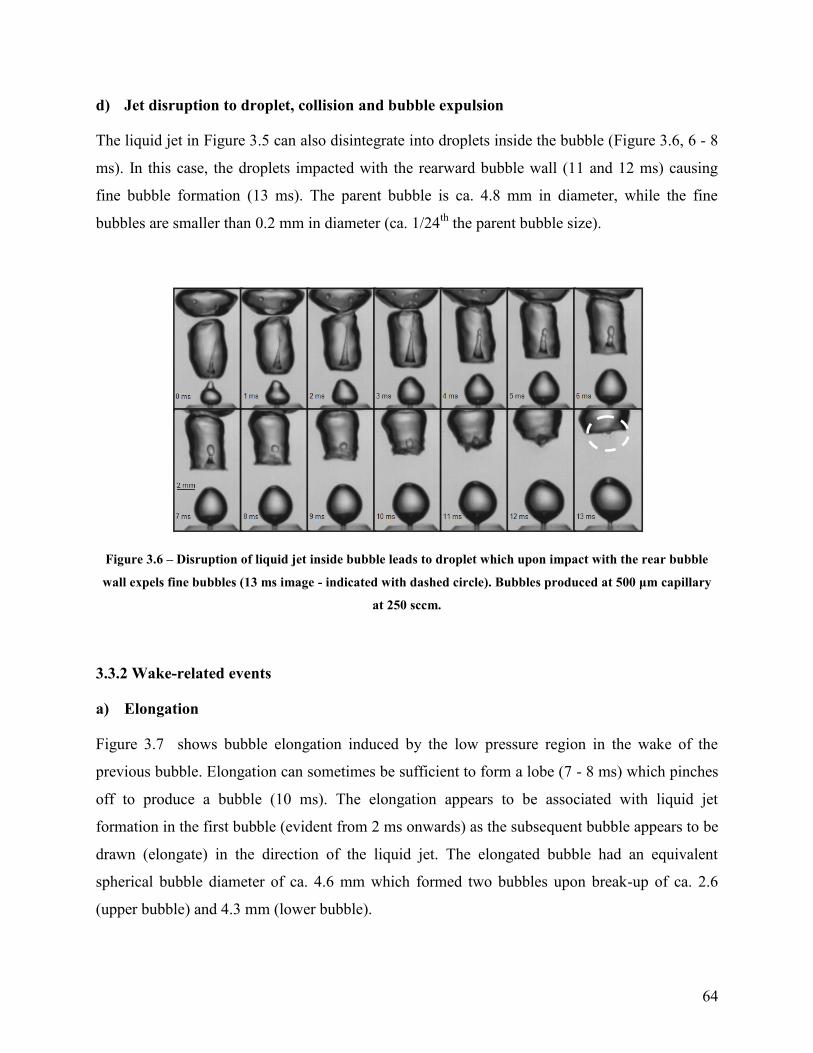
64
d) Jet disruption to droplet, collision and bubble expulsion
The liquid jet in Figure 3.5 can also disintegrate into droplets inside the bubble (Figure 3.6, 6 - 8
ms). In this case, the droplets impacted with the rearward bubble wall (11 and 12 ms) causing
fine bubble formation (13 ms). The parent bubble is ca. 4.8 mm in diameter, while the fine
bubbles are smaller than 0.2 mm in diameter (ca. 1/24th
the parent bubble size).
Figure 3.6 – Disruption of liquid jet inside bubble leads to droplet which upon impact with the rear bubble
wall expels fine bubbles (13 ms image - indicated with dashed circle). Bubbles produced at 500 μm capillary
at 250 sccm.
3.3.2 Wake-related events
a) Elongation
Figure 3.7 shows bubble elongation induced by the low pressure region in the wake of the
previous bubble. Elongation can sometimes be sufficient to form a lobe (7 - 8 ms) which pinches
off to produce a bubble (10 ms). The elongation appears to be associated with liquid jet
formation in the first bubble (evident from 2 ms onwards) as the subsequent bubble appears to be
drawn (elongate) in the direction of the liquid jet. The elongated bubble had an equivalent
spherical bubble diameter of ca. 4.6 mm which formed two bubbles upon break-up of ca. 2.6
(upper bubble) and 4.3 mm (lower bubble).

65
Figure 3.7 – Wake-related force causes subsequent bubble deformation and break-up. Bubble produced at
500 µm capillary at 250 sccm.
b) Premature detachment
Figure 3.8 shows bubbles formed at the 500 μm capillary with air flow rate of 100 sccm.
Coalescence (not shown) and subsequent detachment (0.5 - 1.0 ms) is followed by the bubble
base recoiling which seems to extract a bubble from the capillary before it can grow to normal
release size. The initially released bubble diameter is roughly 4.5 mm while the fine bubble is
about 0.4 mm (ca. 1/11th
the parent bubble size).
Figure 3.8 – Fine bubble formed by premature detachment from the orifice due to the wake of a previous
bubble. Bubble produced at 500 µm capillary at 100 sccm.
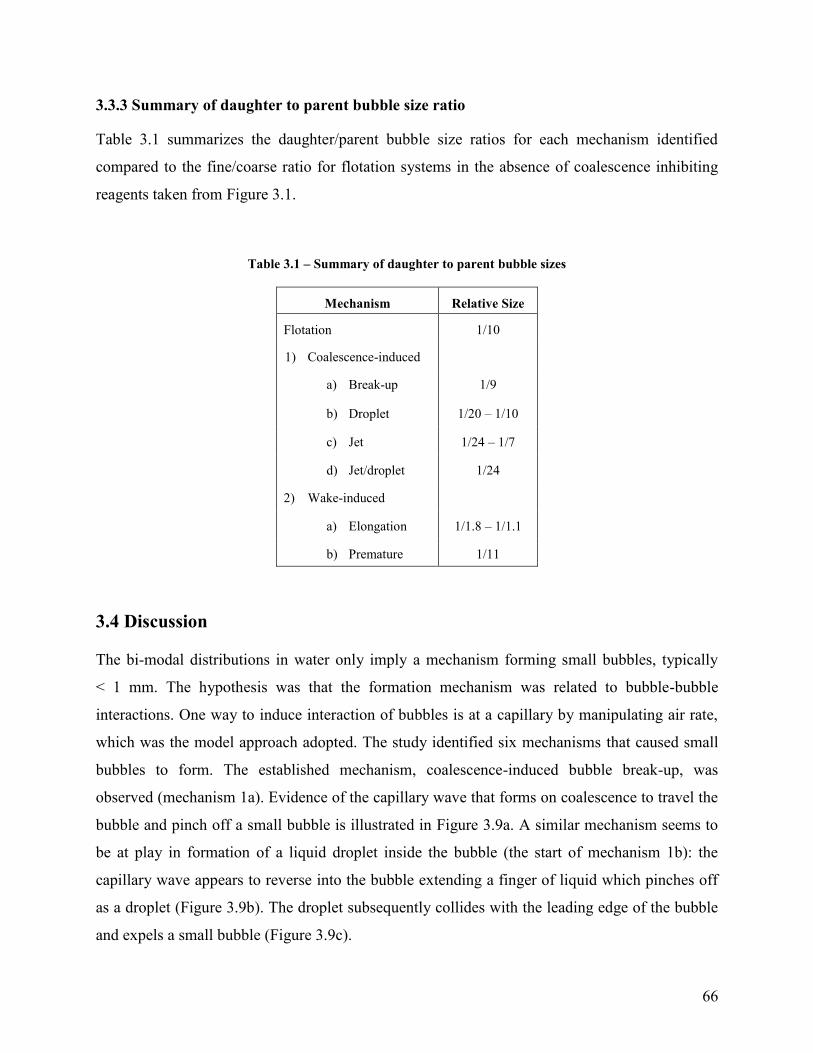
66
3.3.3 Summary of daughter to parent bubble size ratio
Table 3.1 summarizes the daughter/parent bubble size ratios for each mechanism identified
compared to the fine/coarse ratio for flotation systems in the absence of coalescence inhibiting
reagents taken from Figure 3.1.
Table 3.1 – Summary of daughter to parent bubble sizes
Mechanism Relative Size
Flotation 1/10
1) Coalescence-induced
a) Break-up 1/9
b) Droplet 1/20 – 1/10
c) Jet 1/24 – 1/7
d) Jet/droplet 1/24
2) Wake-induced
a) Elongation 1/1.8 – 1/1.1
b) Premature 1/11
3.4 Discussion
The bi-modal distributions in water only imply a mechanism forming small bubbles, typically
< 1 mm. The hypothesis was that the formation mechanism was related to bubble-bubble
interactions. One way to induce interaction of bubbles is at a capillary by manipulating air rate,
which was the model approach adopted. The study identified six mechanisms that caused small
bubbles to form. The established mechanism, coalescence-induced bubble break-up, was
observed (mechanism 1a). Evidence of the capillary wave that forms on coalescence to travel the
bubble and pinch off a small bubble is illustrated in Figure 3.9a. A similar mechanism seems to
be at play in formation of a liquid droplet inside the bubble (the start of mechanism 1b): the
capillary wave appears to reverse into the bubble extending a finger of liquid which pinches off
as a droplet (Figure 3.9b). The droplet subsequently collides with the leading edge of the bubble
and expels a small bubble (Figure 3.9c).

67
Figure 3.9 – Schematics showing: a) coalescence-induced bubble break-up, b) coalescence-induced droplet
formation and, c) coalescence-induced droplet formation and subsequent bubble break-up.
Mechanism 1c sees conditions forming a liquid jet which shoots across the bubble to expel a
small bubble. Liquid jets were noted by Leighton (1994) and Mitrovic (1997) who gave
photographic evidence of an upward axial jet within a newly created bubble; the present work
shows the jet can form on coalescence and give rise to small bubbles. The jet sometimes
disintegrates into droplets which, in this case, impact the rear bubble wall and eject fine bubbles
(mechanism 1d). Jetting and jet disruption phenomena are seen in bubbles bursting at a free
surface (Boulton-Stone and Blake, 1993; Duchemin et al., 2002; Lee et al., 2011); the present
work identifies the phenomena with coalescing bubbles.
In addition to coalescence-related mechanisms the study identified two apparently wake-related
events. The low pressure region in the bubble wake tends to draw in a trailing bubble, extending
it and sometimes causing a lobe to form which pinches off (mechanism 2a). Splitting of the
trailing bubble is due to shear caused by the flow generated by the leading bubble (Tsuchiya et
al., 1989). If present, liquid jet formation also seems to contribute to the wake forces as the
trailing bubble appears to deform in the direction of the liquid jet. The second wake-related
phenomenon (mechanism 2b) is reminiscent of events described by Hofmeier et al. (1995) in
which small bubbles form between larger bubbles in a chain due to inertia from the preceding
large bubble.
68
The purpose of the study was to identify mechanisms giving rise to small bubbles and thus bi-
modal size distributions. One way to identify is to compare the observed ratio of daughter to
parent bubble in the present experiments with the fine/coarse mode ratio for flotation systems in
the absence of frother or salts (Table 3.1). We can apply our understanding that frothers and salts
inhibit coalescence to suggest that only the coalescence-related mechanisms should be retained.
Of those four, the comparison suggests that mechanism 1d is likely not a factor, the fine bubbles
being too small.
We can now offer a possible explanation of Figure 3.1. Recognizing the coalescence suppressing
effect of frothers has led to the hypothesis that flotation machines produce small bubbles and
frothers preserve them (Gomez and Finch, 2002; Cho and Laskowski, 2002). Applying this to
Figure 3.1 means the original bubbles were ca. 1.5 mm (i.e., the size observed in presence of
frother) which in the absence of frother coalesced to form the ca. 5 mm bubbles, an act that also
induced fine bubble production from mechanisms 1a-c resulting in the bi-modal distribution.
There are difficulties with this interpretation, as discussed elsewhere (Finch et al., 2008), for
instance coalescence to form a 5 mm bubble requires 37 1.5 mm bubbles. We will follow up this
qualitative study by determining the transition air rate dividing coalescence without break-up
from coalescence with break-up, i.e., transition to mechanisms 1a-c, and how this air rate
depends on frother and salt concentration.
3.5 Conclusions
Bi-modal bubble size distributions observed in the absence of coalescence inhibiting agents may
result from bubble-bubble interactions. The work utilized high-speed photography to examine
bubble interactions at a capillary. Conditions could be adjusted to observe coalescence-related
and wake-related mechanisms giving fine bubbles and bi-modal distributions. Three
coalescence-related mechanisms are argued to be at play in flotation systems where bi-modal
bubble size distributions are reported.
References
Boulton-Stone, J.M., and Blake, J.R., 1993. Gas bubble bursting at a free surface. Journal of
Fluid Mechanics 254, 437-466.
69
Cappuccitti, F., and Nesset, J.E., 2009. Frother and collector effects on flotation cell
hydrodynamics and their implication on circuit performance. In: Advances in Mineral Processing
Science and Technology – 48th
Conference of Metallurgists, 169-182.
Cho, Y.S., and Laskowski, J.S., 2002. Effect of flotation frothers on bubble size and foam
stability. International Journal of Mineral Processing 64, 69-80.
Duchemin, L., Popinet, S., Josserand, C., and Zaleski, S., 2002. Jet formation in bubbles bursting
at a free surface. Physics of Fluids 14, 9, 3000-3008.
Finch, J.A., Nesset, J.E. and Acuña, C., 2008. Role of frother on bubble production and
behaviour in flotation. Minerals Engineering 21, 949–957.
Gomez, C.O., and Finch, J.A., 2002. Gas dispersion measurements in flotation machines. CIM
Bulletin 95, 1066, 73-78.
Hofmeier, U., Yaminsky, V.V. and Christensen, H.K., 1995. Observations of solute effects on
bubble formation. Journal of Colloid and Interface Science 174, 199-210.
Kracht, W., and Finch, J.A., 2009. Using sound to study bubble coalescence. Journal of Colloid
and Interface Science 332, 237–245.
Lee, J.S., Weon, B.M., Park, S.J., Le, J.H., Fezaa, K., and Lee, W.-K., 2011. Size limits the
formation of liquid jets during bubble bursting. Nature Communications 2, 367, 1-7.
Leighton, T. G., 1994. The Acoustic Bubble. Academic Press Inc., London.
Leighton, T.G., Fagan, K.J., and Field, J.E., 1991. Acoustic and photographic studies of injected
bubbles. European Journal of Physics 12, 77-85.
Mitrovic, J., 1997. Formation of a liquid jet after detachment of a vapour bubble. International
Journal of Heat and Mass Transfer 40, 18, 4309-4317.
Ohnishi, M., Azuma, H. and Straub, J., 1999. Study on secondary bubble creation induced by
bubble coalescence. Advances in Space Research 24, 10, 1331-1336.
Quinn, J.J., Kracht, W., Gomez, C.O., Gagnon, C., and Finch, J.A., 2007. Comparing the effects
of salts and frother (MIBC) on gas dispersion and froth properties. Minerals Engineering 20,
1296-1302.

70
Remillard, M., Joseph, M., and Laroche, L., 2009. Municipal drinking water produced by
Atwater and Charles-J Des Baillets drinking water treatment plant: Annual Summary. Montreal:
Division de l’expertise technique.
Tse, K.L., Martin, T., McFarlane, C.M. and A.W. Nienow, 2003. Small bubble formation via a
coalescence dependent break-up mechanism. Chemical Engineering Science 58, 275-286.
Yañez, A.B., Morales, P., Coddou, F., Elgueta, H., Ortiz, J.M., Perez, C., Cortes, G., Gomez,
C.O., and Finch, J.A., 2009. Gas dispersion characterization of TANKCELL®-300 at
Chuquicamata concentrator. In: Advances in Mineral Processing Science and Technology – 48th
Conference of Metallurgists, 313-324.
Zhang, F.H. and Thoroddsen, S.T., 2008. Satellite generation during bubble coalescence. Physics
of Fluids 20, 022104.

71
Chapter 4 – Effect of frother and inorganic salts on
bubble regimes at a capillary
4.1 Introduction
4.1.1 Gas dispersion: Frothers and inorganic salts
Gas dispersion properties in mineral flotation systems result from an interplay of the gas
dispersing device with frothers and sometimes high concentrations of salts. The initial
mechanism involved in dispersing gas (air) in a flotation cell is the break-up of a continuous gas
phase into discreet bubbles (formation process). Subsequent bubble coalescence or break-up are
secondary events which occur and determine overall gas dispersion properties. There is extensive
literature on the ability of frothers to inhibit bubble coalescence which helps explain decreased
bubble size and increased frothing (Foulk and Miller, 1931; Zhou et al., 1993; Sweet et al., 1997;
Cho and Laskowski, 2002, 2003; Finch et al., 2006; Finch et al., 2008). A combination of Gibbs
elasticity and the Marangoni effect form the basis for understanding how frothers resist
coalescence (Harris, 1982; Pugh, 1996).
Some flotation processes are in saline solutions (Alexander et al., 2012). In certain instances, the
presence of inorganic salts can replace the function of frother (Quinn et al., 2007). Relatively
high concentrations (>0.05 M) of inorganic salts are required for coalescence inhibition (Lessard
and Zieminski, 1971; Craig et al., 1993; Zahradnik et al., 1999) compared to a few parts per
million (<1 mM) of frother (Cho and Laskowski, 2002a,b). For coalescence inhibiting salts,
researchers have shown correlations between solution ionic strength and gas dispersion
properties, i.e., bubble size and gas holdup, with salts containing multi-valent ions showing a
greater effect than mono-valent salts (Lessard and Zieminski, 1969; Zieminski and Whittemore,
1971; Quinn et al., 2007).
Contacting two bubbles to quantify the effect of surfactants or inorganic salts on bubble
coalescence is a common experimental technique (Lessard and Zieminski, 1971; Kim and Lee,
1988; Craig, 1993; Hofmeier et al., 1995; Tse et al., 1998, 2003; Tsang et al., 2004; Christenson
et al., 2008; Wang and Qu, 2012; Bournival et al., 2012). Indirect measurements of coalescence,
such as bubble size and gas holdup, have been used to quantify the effect of solutes in bubble
72
swarms (Marrucci and Nicodemo, 1967; Zieminski and Whittemore, 1971; Cho and Laskowski,
2002a,b; Laskowski et al., 2003, Azgomi et al., 2007; Nesset et al. 2007; Quinn et al., 2007;
Zhang et al., 2012). An action of frother promoting fine bubble production through break-up has
been speculated (Grau and Laskowski, 2006; Finch et al., 2008) but there are few experimental
studies into the role of solutes on bubble break-up (Tse et al., 2003; Kracht and Finch, 2009a;
Chu and Finch, 2013).
One fine bubble generation mechanism is coalescence-induced break-up (Tse et al., 2003). By
adapting the technique of Kracht and Finch (2009b), who manipulated gas rate to study
interactions between bubbles generated at a capillary, both coalescence and coalescence-induced
break-up is reported in this paper.
4.1.2 Effect of gas rate on bubble formation at a capillary
At sufficiently low gas rate bubble size is determined by orifice specifications (e.g., material and
dimension) and solution surface tension, given by the Tate equation (Tate, 1864; Hernandez-
Aguilar et al., 2002). At concentrations of industrial interest frothers and salts typically have
little impact on surface tension and thus little impact on the size of a single bubble produced at a
capillary as shown by several authors (Zhang and Shoji, 2001; Cho and Laskowski, 2002a;
Hofmeier et al., 1995). The effect of frothers or salts is only seen once bubbles begin to interact,
typically close to the point of bubble generation (Marrucci and Nicodemo, 1967). Bubble
interaction at a capillary can be controlled using gas flow rate.
Marrucci and Nicodemo (1967) ascribed increased coalescence at increasing gas flow rate at an
orifice to the increased number of bubbles increasing collision frequency coupled with
convection forces resulting in more effective coalescence-producing impacts. As turbulence is
further increased by increasing gas rate the system becomes chaotic with relatively large bubbles
being formed (through coalescence) and fine bubbles formed due to break-up (Hofmeier et al.,
1995). Prince (1990) noted a maximum in average bubble size as a function of gas rate due to the
competing effects of coalescence and break-up.
Tse et al. (2003), trying to explain the ongoing production of fine bubbles as a bubble swarm
rose in a column, observed coalescing bubbles expelling fine bubbles. Contacting two bubbles at
73
facing capillaries, the authors showed that an annular wave is set up in the newly formed bubble
which travels the length of the bubble resulting in extension and pinching-off of a daughter
bubble. The process was termed ‘coalescence-induced (or -mediated) bubble break-up’ (Ohnishi
et al., 1999; Tse et al., 2003). Expulsion of fines bubbles has been noted with bubbles bursting at
a free surface (Duchemin et al., 2002), and of fine droplets being expelled upon coalescence of
oil droplets (Hansen and Brown, 1967). In the air-water system, Quinn and Finch (2012)
described various mechanisms resulting in breakaway of fine bubbles (bubble break-up) at a
capillary, including, coalescence-induced break-up, liquid jet formation inside the bubble that
ruptures the bubble wall, and wake forces causing premature bubble detachment. Coalescence
events appear to play an important role in bubble break-up. The question posed is does the
presence of frother and salt enhance this break-up mechanism or suppress it?
The literature on the effect of solutes on bubble break-up is ambiguous. Otake et al. (1977)
observing bubble coalescence and break-up in a bubble swarm stated that for liquids with
otherwise comparable physical properties those with lower surface tension resulted in increased
bubble break-up. Hofmeier et al. (1995) compared bubbles produced in water and in 1M NaCl
solutions which increases surface tension and noted it ‘seemed evident that break-up played a
role in fine bubble production’ in the salt solution.
4.1.3 Motivation for the present study
Kracht and Finch (2009b) utilized high-speed photography and an acoustic emission monitoring
technique to determine the transition gas flow rate (in units of standard cubic centimeters per
minute (sccm)) at which the bubble regime changed from non-coalescing to coalescing at a 200
µm capillary. An example ‘coalescence plots’ is shown in Figure 4.1 for 1-pentanol. Comparison
of the plots for different frothers gave a ranking for frother ‘strength’ in terms of coalescence
prevention, the stronger frother requiring a higher gas rate for onset of coalescence.

74
Figure 4.1 – Coalescence plot for 1-pentanol (Reprinted with permission from Elsevier. (Kracht and Finch
(2009b))
Recently, Kracht and Rebolledo (2013) used the acoustic technique to test
1-alcohols, commercial frothers, and inorganic salts. The concept of a local critical coalescence
concentration (l-CCC) curve was developed to compare the coalescence prevention strength of
the solutes. Similar to the work of Kracht and Finch (2009b), the authors found that certain
inorganic salts (NaCl, KCl, and CaCl2) showed a transition range of partial coalescence, i.e., not
all bubble collisions resulted in coalescence.
Finch et al. (2008) found they could control coalescence-induced break-up by manipulating gas
rate at a capillary. This introduces a second transition gas rate between coalescence and
coalescence with break-up. Addition of frother prevented coalescence and the related
coalescence-induced fine bubble formation. The current study extends that work to a variety of
frothers and inorganic salts utilising high-speed photography to determine the transition air flow
rates between bubble regimes at a 300 μm capillary. The first transition gas rate between non-
coalescence (single bubble production) and coalescence, and the second between coalescence
and coalescence with fine bubble production (bubble break-up) were determined.
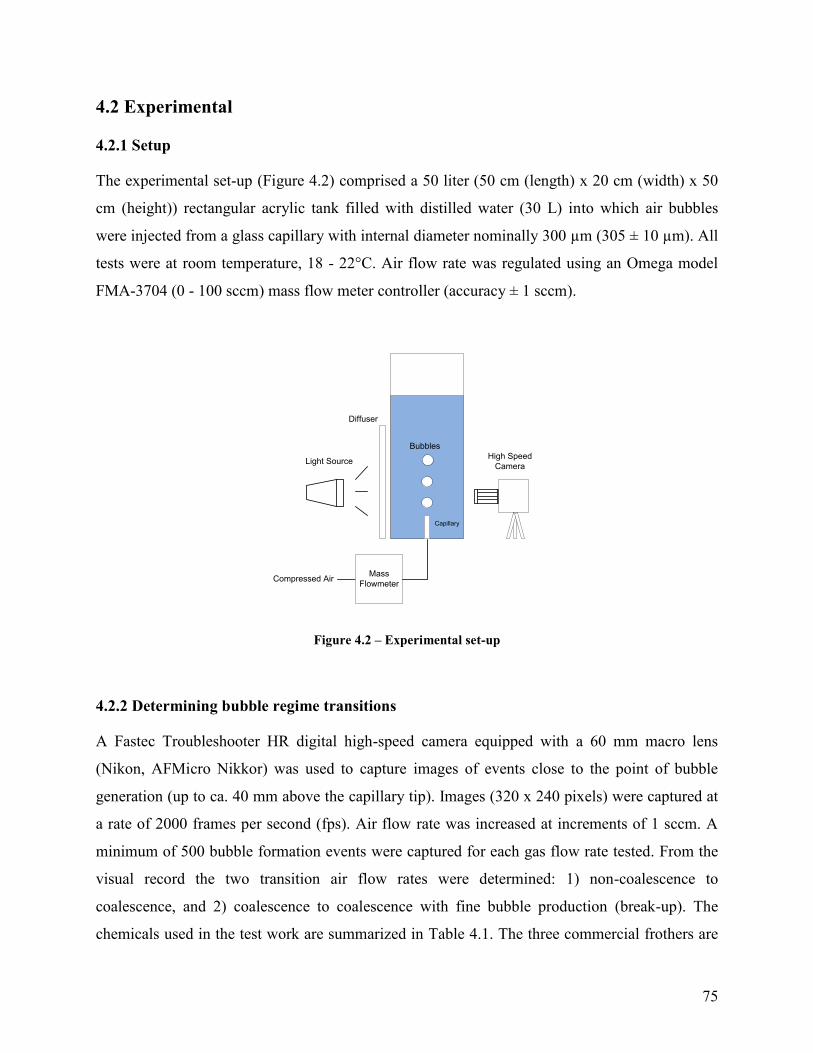
75
4.2 Experimental
4.2.1 Setup
The experimental set-up (Figure 4.2) comprised a 50 liter (50 cm (length) x 20 cm (width) x 50
cm (height)) rectangular acrylic tank filled with distilled water (30 L) into which air bubbles
were injected from a glass capillary with internal diameter nominally 300 µm (305 ± 10 µm). All
tests were at room temperature, 18 - 22°C. Air flow rate was regulated using an Omega model
FMA-3704 (0 - 100 sccm) mass flow meter controller (accuracy ± 1 sccm).
Compressed AirMass
Flowmeter
Light Source
Diffuser
High Speed
Camera
Bubbles
Capillary
Figure 4.2 – Experimental set-up
4.2.2 Determining bubble regime transitions
A Fastec Troubleshooter HR digital high-speed camera equipped with a 60 mm macro lens
(Nikon, AFMicro Nikkor) was used to capture images of events close to the point of bubble
generation (up to ca. 40 mm above the capillary tip). Images (320 x 240 pixels) were captured at
a rate of 2000 frames per second (fps). Air flow rate was increased at increments of 1 sccm. A
minimum of 500 bubble formation events were captured for each gas flow rate tested. From the
visual record the two transition air flow rates were determined: 1) non-coalescence to
coalescence, and 2) coalescence to coalescence with fine bubble production (break-up). The
chemicals used in the test work are summarized in Table 4.1. The three commercial frothers are
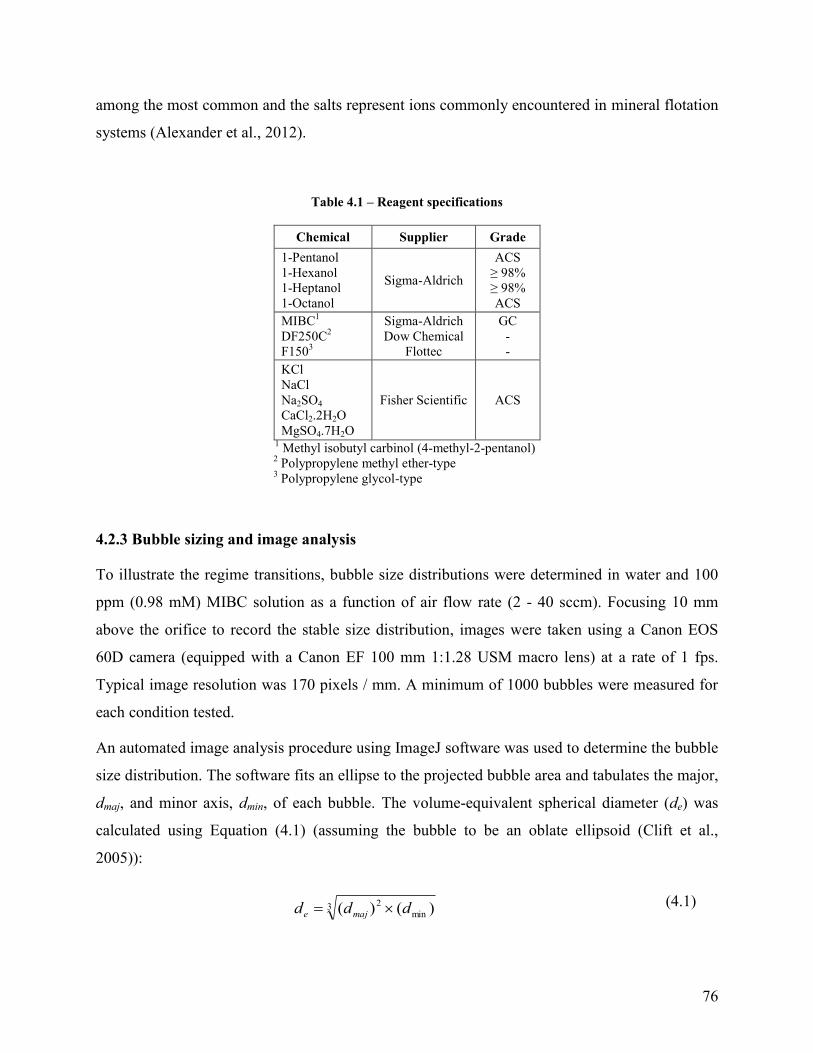
76
among the most common and the salts represent ions commonly encountered in mineral flotation
systems (Alexander et al., 2012).
Table 4.1 – Reagent specifications
Chemical Supplier Grade
1-Pentanol
1-Hexanol
1-Heptanol
1-Octanol
Sigma-Aldrich
ACS
≥ 98%
≥ 98%
ACS
MIBC1
DF250C2
F1503
Sigma-Aldrich
Dow Chemical
Flottec
GC
-
-
KCl
NaCl
Na2SO4
CaCl2.2H2O
MgSO4.7H2O
Fisher Scientific ACS
1 Methyl isobutyl carbinol (4-methyl-2-pentanol)
2 Polypropylene methyl ether-type
3 Polypropylene glycol-type
4.2.3 Bubble sizing and image analysis
To illustrate the regime transitions, bubble size distributions were determined in water and 100
ppm (0.98 mM) MIBC solution as a function of air flow rate (2 - 40 sccm). Focusing 10 mm
above the orifice to record the stable size distribution, images were taken using a Canon EOS
60D camera (equipped with a Canon EF 100 mm 1:1.28 USM macro lens) at a rate of 1 fps.
Typical image resolution was 170 pixels / mm. A minimum of 1000 bubbles were measured for
each condition tested.
An automated image analysis procedure using ImageJ software was used to determine the bubble
size distribution. The software fits an ellipse to the projected bubble area and tabulates the major,
dmaj, and minor axis, dmin, of each bubble. The volume-equivalent spherical diameter (de) was
calculated using Equation (4.1) (assuming the bubble to be an oblate ellipsoid (Clift et al.,
2005)):
3min
2 )()( ddd maje
(4.1)
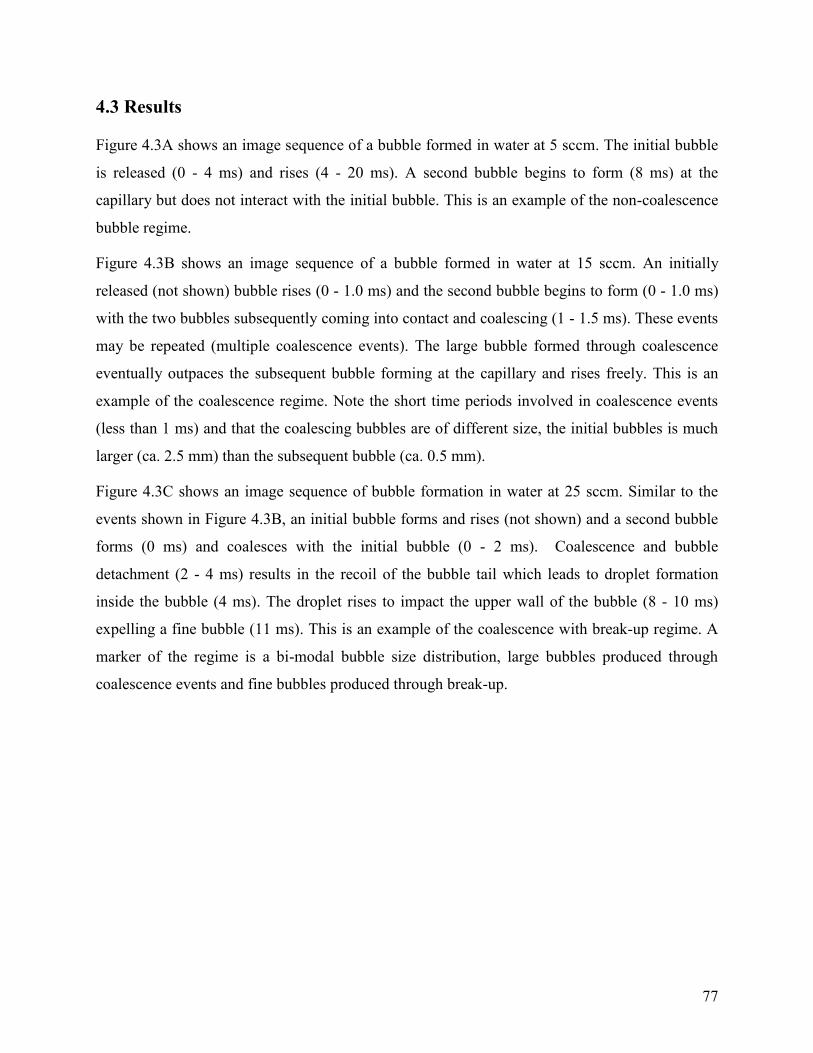
77
4.3 Results
Figure 4.3A shows an image sequence of a bubble formed in water at 5 sccm. The initial bubble
is released (0 - 4 ms) and rises (4 - 20 ms). A second bubble begins to form (8 ms) at the
capillary but does not interact with the initial bubble. This is an example of the non-coalescence
bubble regime.
Figure 4.3B shows an image sequence of a bubble formed in water at 15 sccm. An initially
released (not shown) bubble rises (0 - 1.0 ms) and the second bubble begins to form (0 - 1.0 ms)
with the two bubbles subsequently coming into contact and coalescing (1 - 1.5 ms). These events
may be repeated (multiple coalescence events). The large bubble formed through coalescence
eventually outpaces the subsequent bubble forming at the capillary and rises freely. This is an
example of the coalescence regime. Note the short time periods involved in coalescence events
(less than 1 ms) and that the coalescing bubbles are of different size, the initial bubbles is much
larger (ca. 2.5 mm) than the subsequent bubble (ca. 0.5 mm).
Figure 4.3C shows an image sequence of bubble formation in water at 25 sccm. Similar to the
events shown in Figure 4.3B, an initial bubble forms and rises (not shown) and a second bubble
forms (0 ms) and coalesces with the initial bubble (0 - 2 ms). Coalescence and bubble
detachment (2 - 4 ms) results in the recoil of the bubble tail which leads to droplet formation
inside the bubble (4 ms). The droplet rises to impact the upper wall of the bubble (8 - 10 ms)
expelling a fine bubble (11 ms). This is an example of the coalescence with break-up regime. A
marker of the regime is a bi-modal bubble size distribution, large bubbles produced through
coalescence events and fine bubbles produced through break-up.
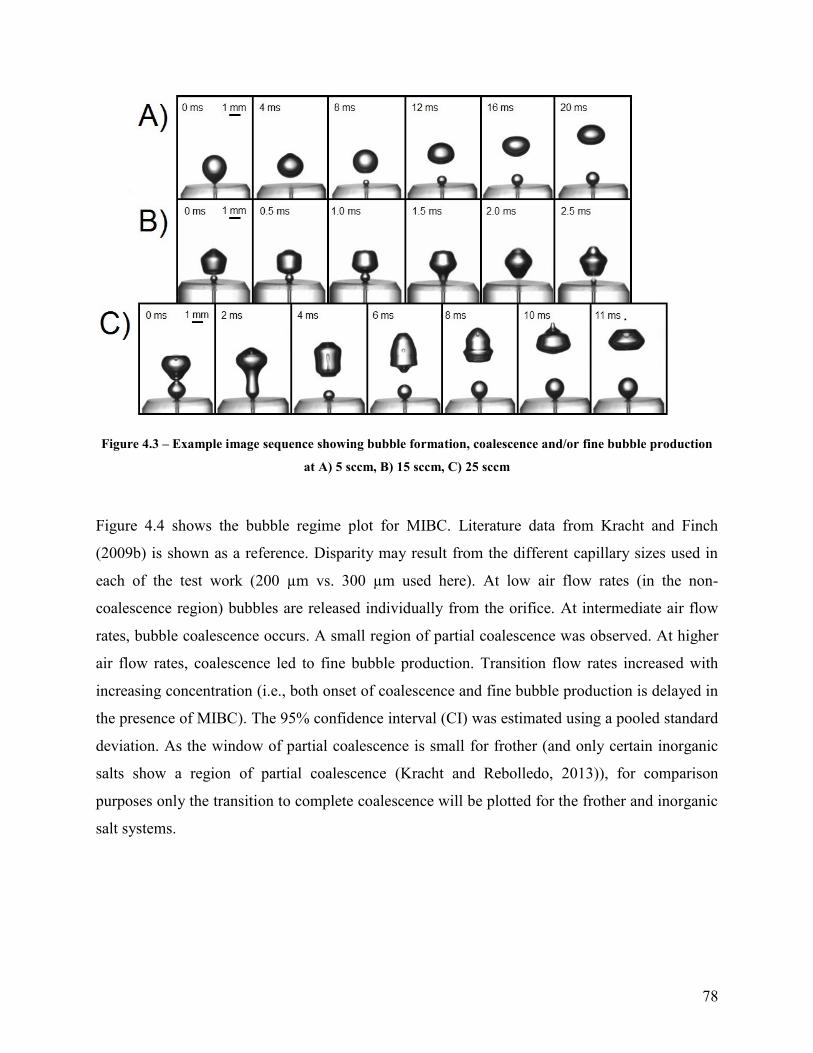
78
Figure 4.3 – Example image sequence showing bubble formation, coalescence and/or fine bubble production
at A) 5 sccm, B) 15 sccm, C) 25 sccm
Figure 4.4 shows the bubble regime plot for MIBC. Literature data from Kracht and Finch
(2009b) is shown as a reference. Disparity may result from the different capillary sizes used in
each of the test work (200 µm vs. 300 µm used here). At low air flow rates (in the non-
coalescence region) bubbles are released individually from the orifice. At intermediate air flow
rates, bubble coalescence occurs. A small region of partial coalescence was observed. At higher
air flow rates, coalescence led to fine bubble production. Transition flow rates increased with
increasing concentration (i.e., both onset of coalescence and fine bubble production is delayed in
the presence of MIBC). The 95% confidence interval (CI) was estimated using a pooled standard
deviation. As the window of partial coalescence is small for frother (and only certain inorganic
salts show a region of partial coalescence (Kracht and Rebolledo, 2013)), for comparison
purposes only the transition to complete coalescence will be plotted for the frother and inorganic
salt systems.
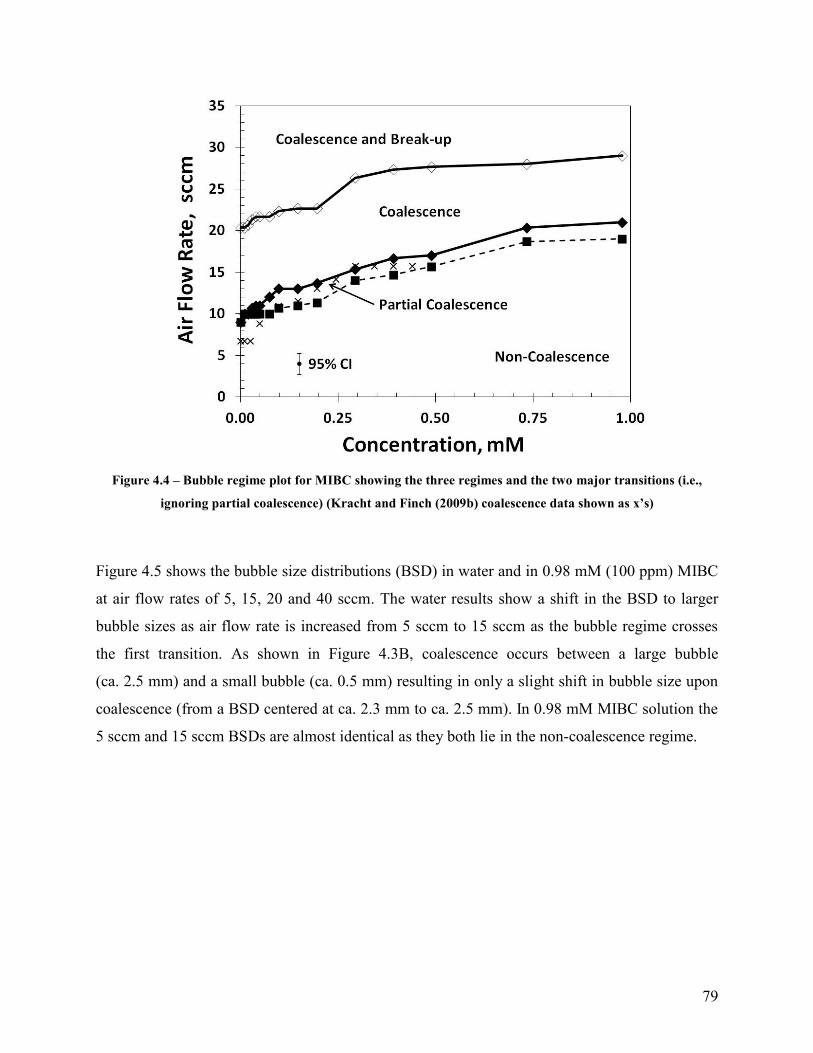
79
Figure 4.4 – Bubble regime plot for MIBC showing the three regimes and the two major transitions (i.e.,
ignoring partial coalescence) (Kracht and Finch (2009b) coalescence data shown as x’s)
Figure 4.5 shows the bubble size distributions (BSD) in water and in 0.98 mM (100 ppm) MIBC
at air flow rates of 5, 15, 20 and 40 sccm. The water results show a shift in the BSD to larger
bubble sizes as air flow rate is increased from 5 sccm to 15 sccm as the bubble regime crosses
the first transition. As shown in Figure 4.3B, coalescence occurs between a large bubble
(ca. 2.5 mm) and a small bubble (ca. 0.5 mm) resulting in only a slight shift in bubble size upon
coalescence (from a BSD centered at ca. 2.3 mm to ca. 2.5 mm). In 0.98 mM MIBC solution the
5 sccm and 15 sccm BSDs are almost identical as they both lie in the non-coalescence regime.

80
Figure 4.5 – Bubble size distributions in water and 0.98 mM MIBC solution at various air flow rates
81
At 20 sccm the BSD in water and 0.98 mM MIBC become bi-modal with slightly larger and
finer bubbles sizes present when compared to bubbles produced in the non-coalescence region
(i.e., 5 sccm in water and at 5 and 15 sccm in 0.98 mM MIBC). As seen in Figure 4.6, in water
the beginning of a fine bubble fraction (< 1 mm) is seen at 20 sccm which corresponds to the
coalescence with break-up regime. In 0.98 mM MIBC the onset of break-up is delayed to
30 sccm.
At low air flow rates (i.e., 2 and 5 sccm) bubble size does not exceed 2.6 mm. With increasing
air flow rate bubbles greater than 2.6 mm are observed that indicates coalescence. Figure 4.6
shows the number frequency of bubbles greater than 2.6 mm in water and 0.98 mM MIBC
solution. The production of bubbles greater than 2.6 mm begins at 10 sccm in water and 20 sccm
with frother and coincides with the transition into the coalescence regime.
It should be noted that although the production of fine bubbles occurred at lower gas flow rates
in water only (compared to frother or salt solutions) re-coalescence of the fine bubbles occurred.
This did not occur with increased frother or salt concentration as all coalescence events are
inhibited.
Figure 4.6 – Number frequency of bubbles below 1 mm and greater than 2.6 mm in water and
0.98 mM MIBC
Figure 4.7 shows the bubble regime plots for the commercial frothers: MIBC, DF250C and
F150. For the non-coalescence to coalescence transition, MIBC is seen to be the weakest frother,
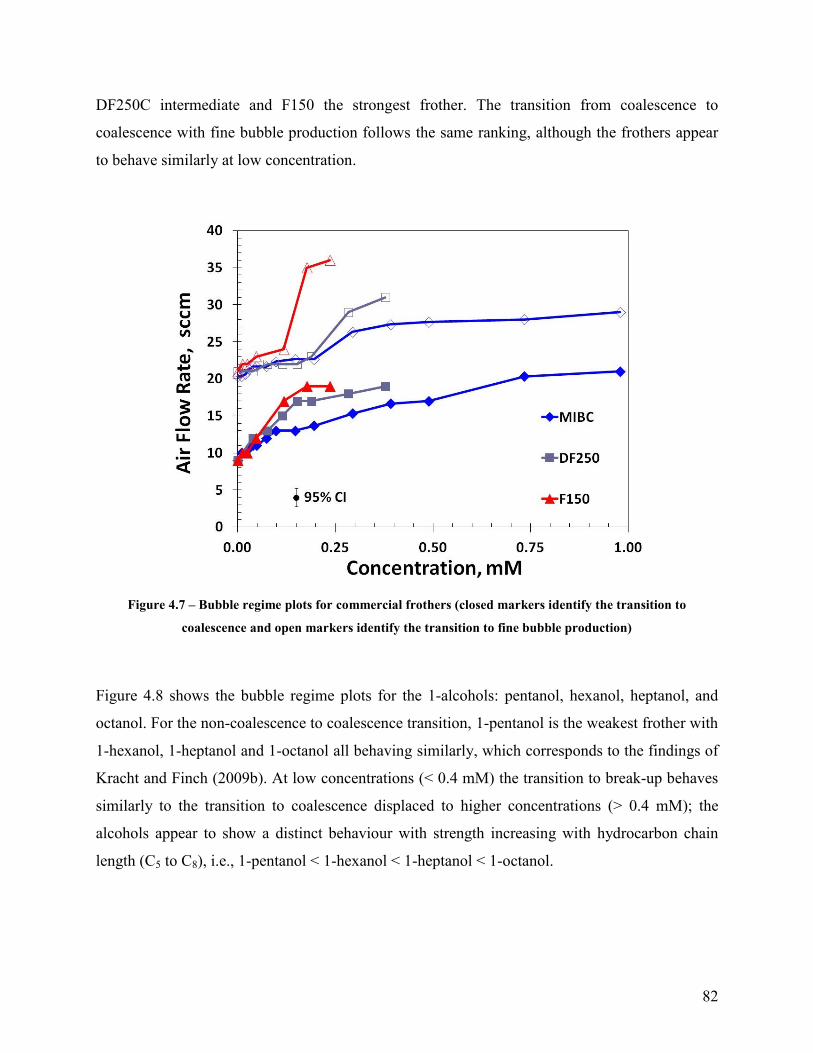
82
DF250C intermediate and F150 the strongest frother. The transition from coalescence to
coalescence with fine bubble production follows the same ranking, although the frothers appear
to behave similarly at low concentration.
Figure 4.7 – Bubble regime plots for commercial frothers (closed markers identify the transition to
coalescence and open markers identify the transition to fine bubble production)
Figure 4.8 shows the bubble regime plots for the 1-alcohols: pentanol, hexanol, heptanol, and
octanol. For the non-coalescence to coalescence transition, 1-pentanol is the weakest frother with
1-hexanol, 1-heptanol and 1-octanol all behaving similarly, which corresponds to the findings of
Kracht and Finch (2009b). At low concentrations (< 0.4 mM) the transition to break-up behaves
similarly to the transition to coalescence displaced to higher concentrations (> 0.4 mM); the
alcohols appear to show a distinct behaviour with strength increasing with hydrocarbon chain
length (C5 to C8), i.e., 1-pentanol < 1-hexanol < 1-heptanol < 1-octanol.

83
Figure 4.8 – Bubble regime plots for 1-alcohols (closed symbols represent lower transition, open symbols
represent upper transition)
Figure 4.9 shows the bubble regime plots for the inorganic electrolytes: KCl, NaCl, Na2SO4,
CaCl2, and MgSO4. Kracht and Rebolledo (2013) showed that certain inorganic salt solutions
(e.g., NaCl, KCl, CaCl2) exhibit a relatively large region of partial coalescence. As such only the
transition to complete coalescence is shown (i.e., the lower transition curve). For the transition to
complete coalescence, KCl and NaCl are seen as weak while Na2SO4, CaCl2 and MgSO4 have a
stronger effect. For the transition from coalescence to coalescence with break-up, salt strength
appears to follow a similar order, although MgSO4 now overlaps with Na2SO4.
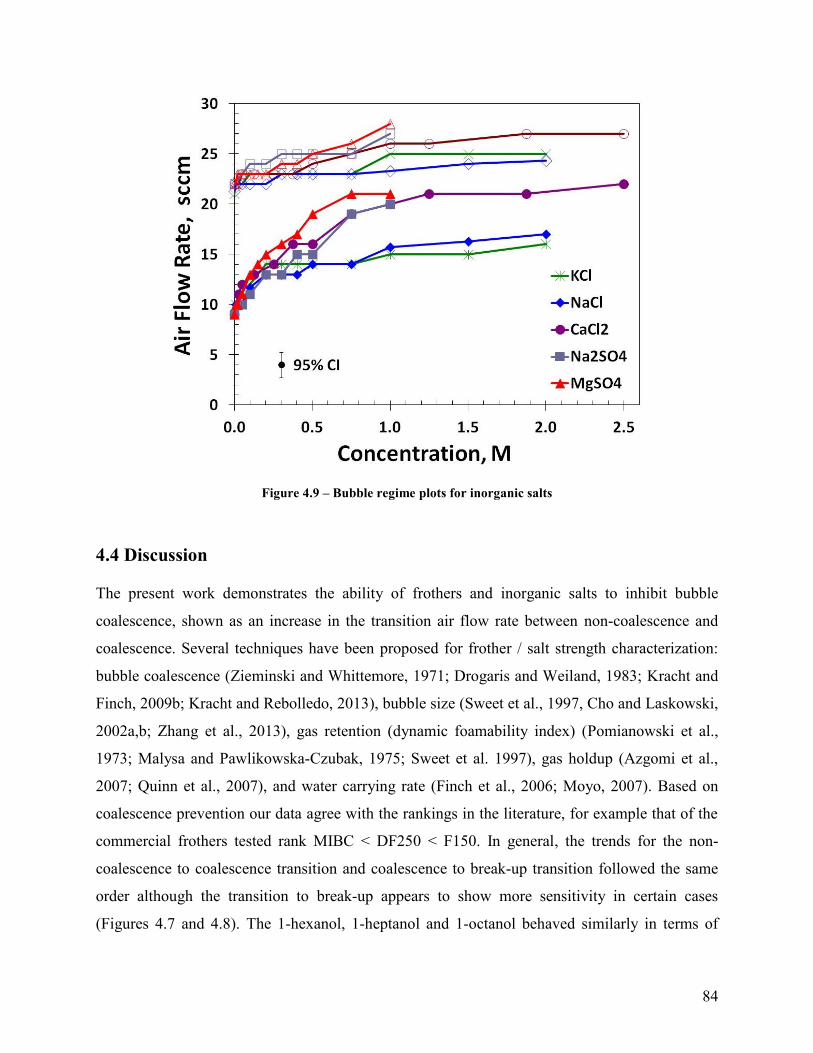
84
Figure 4.9 – Bubble regime plots for inorganic salts
4.4 Discussion
The present work demonstrates the ability of frothers and inorganic salts to inhibit bubble
coalescence, shown as an increase in the transition air flow rate between non-coalescence and
coalescence. Several techniques have been proposed for frother / salt strength characterization:
bubble coalescence (Zieminski and Whittemore, 1971; Drogaris and Weiland, 1983; Kracht and
Finch, 2009b; Kracht and Rebolledo, 2013), bubble size (Sweet et al., 1997, Cho and Laskowski,
2002a,b; Zhang et al., 2013), gas retention (dynamic foamability index) (Pomianowski et al.,
1973; Malysa and Pawlikowska-Czubak, 1975; Sweet et al. 1997), gas holdup (Azgomi et al.,
2007; Quinn et al., 2007), and water carrying rate (Finch et al., 2006; Moyo, 2007). Based on
coalescence prevention our data agree with the rankings in the literature, for example that of the
commercial frothers tested rank MIBC < DF250 < F150. In general, the trends for the non-
coalescence to coalescence transition and coalescence to break-up transition followed the same
order although the transition to break-up appears to show more sensitivity in certain cases
(Figures 4.7 and 4.8). The 1-hexanol, 1-heptanol and 1-octanol behaved similarly in terms of

85
coalescence behaviour, as shown previously by Kracht and Finch (2009b) but showed distinct
strengths in terms of break-up, strength increasing with hydrocarbon chain length. For inorganic
salts, the 1-1 (cation-anion valence) salts were weakest, all salts containing multi-valent ions
inhibited coalescence and break-up at lower molar concentrations. The results follow the
literature; salts containing multi-valent ions have a stronger effect (Marrucci and Nicodemo,
1967; Lessard and Zieminski, 1971; Craig et al., 1993; Quinn et al., 2007). Some authors have
shown a dependence on ionic strength (Lessard and Zieminski, 1971; Quinn et al., 2007). Figure
4.10 shows the bubble regime plot for inorganic salts as a function of ionic strength. There is
spread in the data but the curves do tend to collapse into one.
Figure 4.10 – Bubble regime transitions for inorganic salts as a function of ionic strength
Based on the visual evidence, all fine bubble production mechanisms at a capillary proposed by
Quinn and Finch (2012) seem to be at play both in the absence and presence of frother or
inorganic salt. As gas rate is increased in the fine bubble production region, liquid jet formation
86
and subsequent fine bubble formation seems to be the dominant fine bubble production
mechanism.
Liquid droplet formation was identified by Quinn and Finch (2012) as one mechanism that could
result in fine bubble production. In the present results there was visual evidence of droplet
formation at high frother concentration but these droplets tended to bounce inside the bubble as it
rose and not pierce the wall. This may have been a result of lower droplet velocities compared to
the prior work or interfacial properties which resisted deformation. The ability of frothers or
inorganic salts to delay the onset of break-up may be related to their ability to inhibit bubble
coalescence. As shown by several authors, break-up can be brought on by coalescence events
(Tse et al., 2003; Quinn and Finch, 2012), thus delaying the onset of coalescence may delay the
onset of coalescence-induced break-up. Other explanations may include: convective wake forces
reach a critical value (Marrucci and Nicodemo, 1967) or a critical bubble size (and associated
surface instabilities) is reached which allows for break-up (Hinze, 1955).
The presence of frother or salt has been shown to modify the shape of a rising bubble (Krzan and
Malysa, 2002a,b; Maldonado et al., 2013) and dampen shape oscillations (Tomiyama et al.,
2002). Figure 4.11 shows example images of bubbles in water and 0.98 mM MIBC solution
produced at 5 sccm (both in the non-coalescence regime). The bubble produced in frother
solution is more spherical than the bubble produced in water. The link between shape
deformation and break-up was discussed by Hinze (1955). Tse et al. (2003) noted that increased
flexibility of the interface and significant shape distortion, especially in the water system,
promoted bubble break-up. Coalescence events appear to be a major contributor to shape
instabilities and induce break-up. Bubble shape is related to the bubble interfacial properties
which dictate whether a bubble is susceptible to break-up.
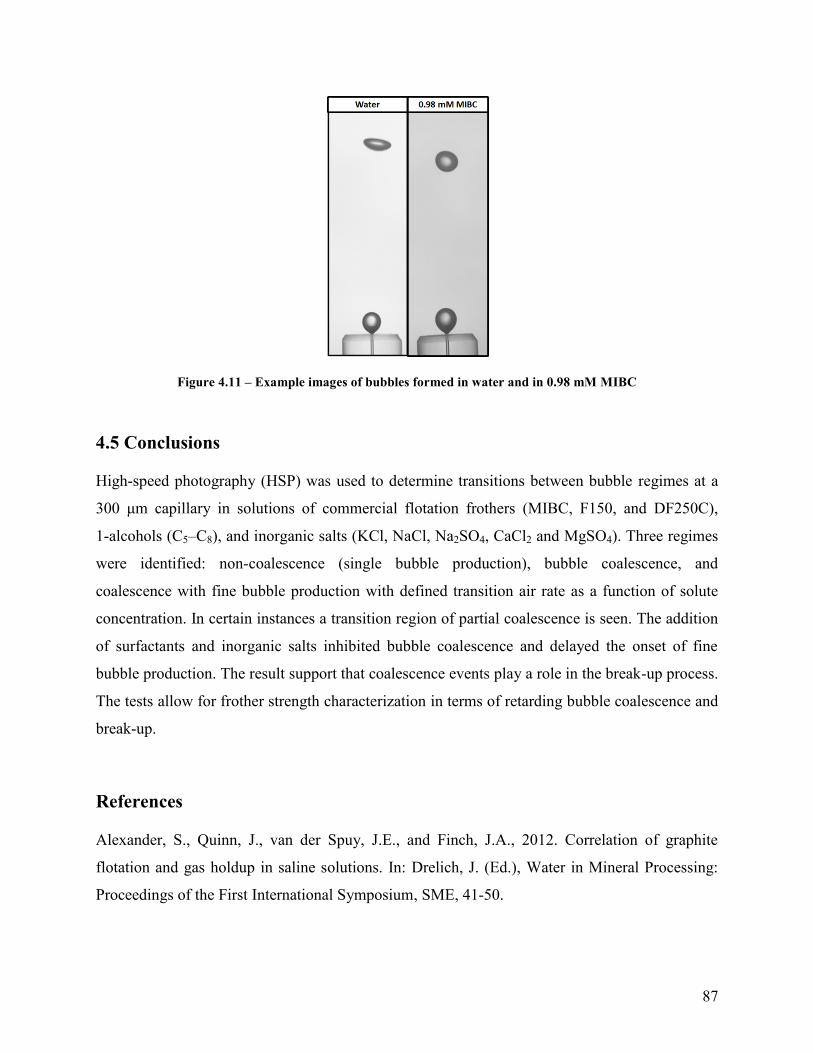
87
Figure 4.11 – Example images of bubbles formed in water and in 0.98 mM MIBC
4.5 Conclusions
High-speed photography (HSP) was used to determine transitions between bubble regimes at a
300 μm capillary in solutions of commercial flotation frothers (MIBC, F150, and DF250C),
1-alcohols (C5–C8), and inorganic salts (KCl, NaCl, Na2SO4, CaCl2 and MgSO4). Three regimes
were identified: non-coalescence (single bubble production), bubble coalescence, and
coalescence with fine bubble production with defined transition air rate as a function of solute
concentration. In certain instances a transition region of partial coalescence is seen. The addition
of surfactants and inorganic salts inhibited bubble coalescence and delayed the onset of fine
bubble production. The result support that coalescence events play a role in the break-up process.
The tests allow for frother strength characterization in terms of retarding bubble coalescence and
break-up.
References
Alexander, S., Quinn, J., van der Spuy, J.E., and Finch, J.A., 2012. Correlation of graphite
flotation and gas holdup in saline solutions. In: Drelich, J. (Ed.), Water in Mineral Processing:
Proceedings of the First International Symposium, SME, 41-50.
88
Azgomi, F., Gomez, C.O., and Finch, J.A., 2007. Characterizing frothers using gas hold-up.
Canadian Metallurgical Quarterly 46, 3, 237-242.
Bournival, G., Pugh, R. J., and Ata, S., 2012. Examination of NaCl and MIBC as bubble
coalescence inhibitor in relation to froth flotation. Minerals Engineering 25, 1, 47-53.
Cain, F.W., and Lee, J.C., 1984. A technique for studying the drainage and rupture of unstable
liquid films formed between two captive bubbles: Measurement on KCl solutions. Journal of
Colloid and Interface Science 106, 1, 70-85.
Cho, Y.S., and Laskowski, J.S., 2002a. Effect of flotation frothers on bubble size and foam
stability. International Journal of Mineral Processing 64, 69-80.
Cho, Y.S., and Laskowski, J.S., 2002b. Bubble coalescence and its effect on bubble size and
foam stability. Canadian Journal of Chemical Engineering 80, 299-305.
Christenson, H.K., Bowen, R.E., Carlton, J.A., Denne, J.R.M., and Lu, Y., 2008. Electrolytes
that show transition to bubble coalescence inhibition at high concentrations. Journal of Physical
Chemistry C 112, 794-796.
Chu, P., and Finch, J.A., 2013. Frother and breakup in small bubble formation. In: Proceedings
of the 52nd
Conference of Metallurgists (hosted by Materials Science & Technology (MS&T)
2013): Water and Energy in Mineral Processing, The 9th
UBC-McGill-U of A International
Symposium on the Fundamentals of Mineral Processing, The Metallurgical Society of CIM,
2034-2043.
Clift, R., Grace, J.R., and Weber, M., 2005. Bubble, Drops, and Particles. Dover Publications
Inc., Mineola, New York. 169-202.
Craig, V.S.J., Ninham, B.W., and Pashley, R.M., 1993. The effect of electrolytes on bubble
coalescence in water. Journal of Physical Chemistry 97, 10192-10197.
Drogaris, G., and Weiland, P., 1983. Coalescence of gas bubbles in aqueous solutions of n-
alcohols and fatty acids. Chemical Engineering Science 38, 9, 1501-1506.
Finch, J.A., Gelinas, S., and Moyo, P., 2006. Frother-related research at McGill University.
Minerals Engineering 19, 726-733.
89
Finch, J.A., Nesset, J.E., and Acuna, C., 2008. Role of frother in bubble production and
behaviour in flotation. Minerals Engineering 21, 949–957.
Foulk, C.W., and Miller, J.N., 1931. Experimental evidence in support of the balanced-layer
theory of liquid film formation. Industrial and Engineering Chemistry 23, 11, 1283-1288.
George, C., 1996. Mt. Keith Operation. In: Grimsey, E.J., and Neuss, I. (Eds.), Nickel ’96,
Conference Series- Australasian Institute of Mining and Metallurgy, 6, 19-23.
Haig-Smillie, L.D., 1974. Sea Water Flotation. Proceedings Canadian Mineral Processors
Conference, 263-281.
Harris, P.J., 1982. Frothing phenomenon and frothers. In: King, R.P. (Ed.), Principles of
Flotation. Monograph Series No. 3. S. African IMM, 237-250.
Hernandez-Aguilar, J.R., Cunningham, R., and Finch, J.A., 2006. A test of the Tate equation to
predict bubble size at an orifice in the presence of frother. International Journal of Mineral
Processing, 79, 2, 89-97.
Hinze, J.O., 1955. Fundamentals of the hydrodynamic mechanism of splitting in dispersion
processes. AIChE Journal, 1, 3, 289-295.
Hofmeier, U., Yaminsky, V.V. and Christensen, H.K., 1995. Observations of solute effects on
bubble formation. Journal of Colloid and Interface Science 174, 199-210.
Kim, J. W., and Lee, W. K., 1988. Coalescence behavior of two bubbles growing side-by-side.
Journal of Colloid and Interface Science 123, 1, 303-305.
Kracht, W., and Finch, J.A., 2009a. Bubble break-up and the role of frother and salt,
International Journal of Mineral Processing 92, 153–161.
Kracht, W., and Finch, J.A. 2009b, Using sound to study bubble coalescence. Journal of Colloid
and Interface Science 332, 237–245.
Kracht, W., and Rebolledo, H., 2013, Study of the local critical coalescence concentration (l-
CCC) of alcohols and salts at bubble formation in two-phase systems. Minerals Engineering 50-
51, 77-82.
90
Krzan, M., and Malysa, K., 2002a. Profiles of local velocities of bubbles in n-butanol, n-hexanol
and n-nonanol solutions. Colloids and Surfaces A: Physicochemical and Engineering Aspects
207, 279-291.
Krzan, M., and Malysa, K., 2002b. Influence of frother concentration on bubble dimensions and
rising velocities. Physicochemical Problems of Mineral Processing 36, 65-76.
Kyriakides, N.K., Kasrinakis, E.G., Nychas, S.G., and Goulas, A., Bubbling from nozzles
submerged in water: Transitions between bubbling regimes. The Canadian Journal of Chemical
Engineering 75, 684-691, 1997.
Laskowski, J.S., Cho, Y.S., and Ding, K., 2003. Effect of frothers on bubble size and foam
stability in potash ore flotation systems. The Canadian Journal of Chemical Engineering 81, 63-
69.
Lessard, R.D., and Zieminski, S.A., 1971. Bubble coalescence and gas transfer in aqueous
electrolytic solutions. Industrial and Engineering Chemistry Fundamentals 10, 260-289.
Maldonado, M., Quinn, J.J., Gomez, C.O., and Finch, J.A., 2013. An experimental study
examining the relationship between bubble shape and rise velocity. Chemical Engineering
Science 98, 7-11.
Malysa, K., and Pawlikowska-Czubak, J., 1975. Frothability and surface elasticity of aqueous
solutions of some frothers, Bulletin de l’Academie Polonaise des Sciences 5, 423-427.
Marrucci, G., and Nicodemo, L., 1967. Coalescence of gas bubbles in aqueous solutions of
inorganic electrolytes. Chemical Engineering Science 22, 1257-1265.
Moyo, P., Gomez, C.O., and Finch, J.A., 2007. Characterization frothers using water carrying
rate. Canadian Metallurgical Quarterly 46, 3, 215-220.
Nesset, J.E., Finch, J.A., and Gomez, C.O., 2007. Operating variables affecting bubble size in
forced-air mechanical flotation machines. In: Proceedings of the 9th
Mill Operators’ Conference,
Fremantle, Australia, 55-65.
Otake, T., Tone, S., Nakao, K., and Mitsuhashi, Y., 1977. Coalescence and breakup of bubbles in
liquids. Chemical Engineering Science 32, 4, 377-383.
91
Pomianowski, A., Malysa, K., and Para, G., 1973, Annual Report for the Institute of Nonferrous
Metals, 6.
Pugh, R.J., 1996. Foaming, foam films, antifoaming and defoaming. Advances in Colloid and
Interface Science 64, 67-142.
Prince, M.J., and Blanch, H.W. 1990. Bubble coalescence and break‐up in air‐sparged bubble
columns. AIChE Journal 36, 10, 1485-1499.
Quinn, J.J., and Finch, J.A., 2012. On the origin of bi-modal bubble size distributions in the
absence of frother. Minerals Engineering 36-38, 237-241.
Quinn, J.J., Kracht, W., Gomez, C.O., Gagnon, C., and Finch, J.A., 2007. Comparing the effects
of salts and frother (MIBC) on gas dispersion and froth properties. Minerals Engineering 20,
1296-1302.
Sweet, C., van Hoogstraten, J., Harris, M., and Laskowski, J.S., 1997. The effect of frothers on
bubble size and frothability of aqueous solutions. In: Finch, J.A., Rao, S.R., Holubec, I. (Eds.),
Processing of Complex Ores, 2nd UBC-McGill Symposium Series on Fundamental in Mineral
Processing, The Metallurgical Society of CIM, 235–246.
Tate, T., 1864. On the magnitude of a drop of liquid formed under different circumstances. The
London, Edinburgh, and Dublin Philosophical Magazine and Journal of Science 27, 181, 176-
180.
Tomiyama, A., Celata, G.P., Hosokawa, S., and Yoshida, S., 2002. Terminal velocity of single
bubbles in surface tension force dominant regime. International Journal of Multiphase Flow 28,
1497-1519.
Tsang, Y.H., Koh, Y-H, and Koch, D.L., 2004. Bubble-size dependence of the critical electrolyte
concentration for inhibition of coalescence. Journal of Colloid and Interface Science 275, 290-
297.
Tse, K., Martin, T., McFarlane, C.M., and Nienow, A.W., 1998. Visualization of bubble
coalescence in a coalescence cell, a stirred tank and a bubble column. Chemical Engineering
Science 53, 23, 4031-4036.
92
Tse, K.L., Martin, T., McFarlane, C.M., and A.W. Nienow, 2003. Small bubble formation via a
coalescence dependent break-up mechanism. Chemical Engineering Science 58, 275-286.
Wang, L., and Qu, X., 2012. Impact of interface approach velocity on bubble coalescence.
Minerals Engineering 26, 50-56.
Zahradnik, J., Fialová, M., and Linek, V., 1999. The effect of surface additives on bubble
coalescence in aqueous media. Chemical Engineering Science 54, 4757-4766.
Zhang, L., and Shoji, M., 2001. Aperiodic bubble formation from a submerged orifice. Chemical
Engineering Science 56, 5371-5381.
Zhang, W., Nesset, J.E., Rao, R., and Finch, J.A., 2012. Characterizing frothers through critical
coalescence concentration (CCC)95-hydrophile-lipophile balance (HLB) relationship. Minerals
2, 208-227.
Zhou, Z.A., Egiebor, N.O., and Plitt, L.R., 1993. Frother effects on bubble size estimation in a
flotation column. Minerals Engineering 6, 1, 55-67.
Zieminski, S.A., and Whittemore, R.C., 1971. Behavior of gas bubbles in aqueous electrolyte
solutions. Chemical Engineering Science 26, 509-520.
93
Chapter 5 – Passive acoustic emission monitoring to
detect bubble coalescence in presence of
solid particles
5.1 Introduction
Optical techniques are typically used to investigate the action of solutes in retarding bubble
coalescence in air/water systems (Hofmeier et al., 1995; Zahradnik et al., 1999; Cho and
Laskowski, 2002a,b; Tse et al., 2003). To be closer to flotation conditions solid particles should
be present. Slurries render systems opaque that means direct visual techniques cannot be used.
This introduces the idea of acoustic monitoring.
Passive acoustic emission monitoring (PAEM) has been used on a variety of unit operations and
processes in the minerals industry: crushing and grinding (Zeng and Forssberg, 2003),
hydrocycloning (Hou et al., 1998), bubble formation (Kracht and Finch, 2009), flotation
machines (Spencer et al., 2012), and frothing (Vanegas and Holtham, 2008). The reliability, non-
intrusive nature, low cost and the capability of real-time continuous measurement make acoustics
an attractive tool for monitoring and control (Boyd and Varley, 2001; Vanegas and Holtham,
2010).
In his classic book ‘The Flotation Process’, T.A. Rickard (1916) noted “the noise made by the
bursting bubble suggests the fact that it is a receptacle of energy.” The first systematic study of
sound production upon bubble formation was undertaken by Minnaert (1933) and was entitled
“On musical air-bubbles and the sounds of running water”. He introduced an energy balance
which related the sound frequency produced (commonly termed the Minnaert frequency), ν, and
equilibrium bubble diameter, db:
L
o
b
p
d
31 (5.1)
where κ is the ratio of specific heats of the gas phase, ρL the liquid density and p° the hydrostatic
pressure. A range of bubble sizes and gas types were fit by the equation.
Strasberg (1956) noted that when bubbles split or coalesce, a decaying sinusoidal pulse of sound
is emitted, just as in bubble formation. Deane and Czerski (2008) demonstrated that sound was
94
excited by the rapid decrease in volume accompanying the collapse of the bubble neck upon
detachment. Manasseh (1998) studied initial bubble deformation upon release from a nozzle
using high-speed photography to understand the physical mechanisms generating sound. After
bubble release (bubble neck breaking) a liquid jet was shown to enter the bubble corresponding
to increased pressure within the bubble.
Leighton et al. (1991) used high-speed photography to observe air bubble behaviour in water at a
0.5 mm internal diameter nozzle. An individual bubble released from the orifice produced a
single decaying sinusoidal acoustic signal. At higher gas rates (0.1 - 5 ml s-1
) coalescence
occurred in proximity to the nozzle resulting in a characteristic acoustic signal: initial bubble
detachment resulted in a decaying sinusoid with subsequent peaks in the acoustic signal relating
to each coalescence event (which created a larger bubble which emitted a lower frequency
signal). The authors noted that bubble shape oscillations could promote coalescence.
Using a stroboscope and digital video camera Hofmeier et al. (1995) observed bubble formation
at a capillary and frit in various solutions (including sodium chloride). Similar to Leighton et al.
(1991), Hofmeier et al. noted bubble regimes which were flow rate dependent: 1) At low gas
flow rates bubbles were released individually and anti-coalescence agents (some surfactants and
inorganic salts) had little effect on bubble generation; and 2) At intermediate gas rate bubbles
interacted close to the orifice with the initial bubble either bouncing off or coalescing with the
subsequently bubble(s). In pure liquids, bubbles were more likely to coalesce and create larger
bubbles. In systems containing certain surfactants or inorganic salts, bubbles were more likely to
bounce.
The presence of frothers or certain inorganic salts have been shown to inhibit bubble coalescence
(Lessard and Zieminski, 1971; Zahradnik et al., 1999; Finch et al., 2008). The mechanism in the
case of surfactants has been attributed to surface tension gradients stabilizing thin liquid surface
films against drainage through the Gibbs elasticity and the Marangoni effects (Dukhin et al.,
1998; Finch et al., 2008). Inorganic salts (at relatively high concentrations) may act in a similar
manner as surface tension gradients can be generated (Quinn et al., 2013).
The effect of solid particles on bubble coalescence has attracted attention but mainly related to
properties of the froth phase (Pugh, 1996; Ata et al., 2004; Pugh, 2005; Ata, 2012). While
potentially of some relevance to bubble formation the role of solids in the froth phase, is likely
95
different to that in the pulp phase (Ata, 2012). Hydrophobic particles have been shown to
stabilize or de-stabilize the froth depending on concentration, size and shape (Dippenaar, 1982;
Garrett, 1993; Pugh, 1996; Ata, 2012). Pugh (2007) noted that increasing contact angle
(increasing hydrophobicity) initially tended to increase froth stability (decrease bubble
coalescence) but highly hydrophobic particles could destabilize the froth by promoting
coalescence probably due to bubble bridging by the hydrophobic particle. With hydrophilic
particles any bridging could have the opposite effect and cause liquid retention in the film thus
delaying coalescence (Ip et al., 1999; Pugh, 2007; Ata, 2008).
Several techniques have been used to quantify the effect of solutes on bubble coalescence with
no solid particles present. The contacting of bubble pairs at adjacent capillaries has been widely
used (Lessard and Zieminski, 1971; Zahradnik et al., 1999; Christenson et al., 2008). Contacting
mineralized bubbles (bubbles covered by hydrophobic particles) showed increased resistance to
coalescence (Ata, 2008; Gallegos-Acevedo et al., 2010). An indirect measure of bubble
coalescence is determination of the critical coalescence concentration (Cho and Laskowski,
2002a,b; Zhang et al., 2012). Again these data are largely derived on air/water systems but the
close comparison with bubble size data from flotation systems suggests little effect of solid
particles (Nesset et al., 2006). The presence of solid particles may adsorb some frothers
(Kulkarni et al., 1977; Kuan and Finch, 2010) and cause bubbles to coalesce but this is an
indirect effect of solids.
Kracht and Finch (2009) utilized high-speed photography and acoustic emission monitoring to
determine the transition gas flow rate at which the bubble regime changed from non-coalescing
to coalescing (termed coalescence plots) at a 200 µm capillary. The characteristic acoustic signal
upon coalescence (as described by Leighton et al. (1991)) was used to determine the onset of
coalescence as air flow rate was increased. Example coalescence plots are given in Figure 5.1 for
MIBC and sodium chloride which show the transition gas flow rate between non-coalescence
and coalescence. For NaCl the presence of a partial coalescence region is seen (i.e., not all
bubble-bubble interactions resulted in coalescence). Comparison of the plots gave a ranking of
frother ‘strength’ in terms of coalescence prevention, the stronger frother requiring a higher
transition gas rate for the onset of coalescence.

96
Figure 5.1 – Coalescence plots for MIBC and sodium chloride (modified from Kracht and Finch, 2009)
Recently, Kracht and Rebolledo (2013) used the acoustic technique to test 1-alcohols,
commercial frothers, and inorganic salts. The concept of a local critical coalescence
concentration (l-CCC) curve was developed to compare the coalescence prevention strength of
the solutes. Similar to the work of Kracht and Finch (2010) (for NaCl), the authors found that
certain inorganic salts (NaCl, KCl, and CaCl2) showed a region of partial coalescence.
The present paper extends the work of Kracht and Finch (2009) to determine the effect of
hydrophobic and hydrophilic solid particles on the transition between bubble regimes at a
capillary using passive acoustic emission monitoring.
5.2 Experimental
The experimental set-up (Figure 3.2) comprised a 50 L (50 cm (L) x 20 cm (W) x 50 cm (H))
acrylic tank filled with distilled water (30 L) into which air bubbles were launched from a glass
capillary with internal diameter 305 ± 10 µm. All tests were at 18 - 22°C. Air flow rate was
controlled using an Omega model FMA-3704 (0 - 100 standard cubic centimeters per minute
(sccm)) mass flow meter controller (accuracy of ± 1% full scale).

97
Figure 5.2 – Experimental set-up
Acoustic emissions were measured using a hydrophone (Lab-40 hydrophone from LAB-core
System) with a frequency range 5 to 85000 Hz. Acoustic emissions were recorded using
Audacity audio editing software.
Tests were in water (Montreal tap) with silica (as a model hydrophilic solid) or talc
(hydrophobic) at 1% and 10% w/w. The effect of MIBC (4-methyl-2-pentanol) frother
(0 - 0.98 mM (0 - 100 ppm (mg/l)) and sodium chloride (0 - 2 M) concentration was tested.
Reagent specifications are given in Table 5.1. Relatively fine particle sizes were used in the test
work (-44 µm silica and -10 µm talc) to minimize the impact of particle settling. An overhead
stirrer (RW20 Digital IKA stirrer) equipped with a 3-bladed radial-flow impeller was used to
disperse/suspend the solids prior to measurement. Each test was performed three times with the
average transition flow rate shown.
Table 5.1 – Reagent specifications
Reagents Supplier Specifications
Silica Unimin -44 µm powder
>99% Silica
Talc Sigma-Aldrich -10 µm powder
>99% Talc
MIBC Sigma-Aldrich GC
NaCl Fisher ACS
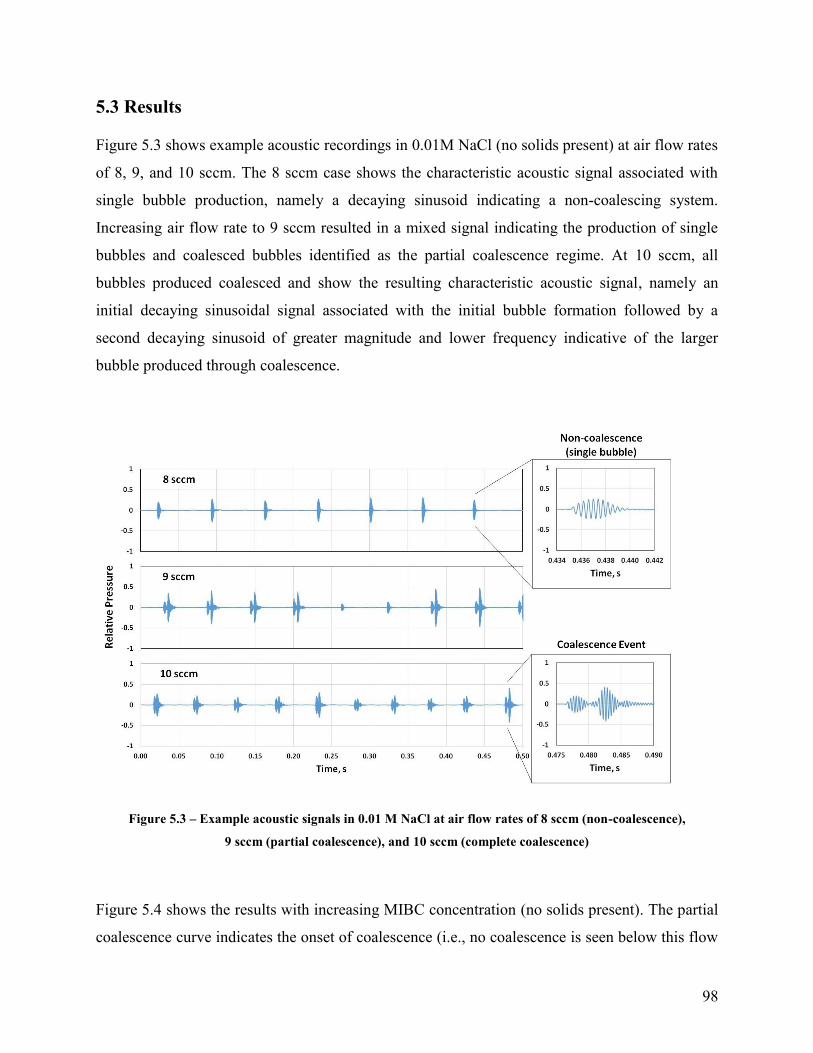
98
5.3 Results
Figure 5.3 shows example acoustic recordings in 0.01M NaCl (no solids present) at air flow rates
of 8, 9, and 10 sccm. The 8 sccm case shows the characteristic acoustic signal associated with
single bubble production, namely a decaying sinusoid indicating a non-coalescing system.
Increasing air flow rate to 9 sccm resulted in a mixed signal indicating the production of single
bubbles and coalesced bubbles identified as the partial coalescence regime. At 10 sccm, all
bubbles produced coalesced and show the resulting characteristic acoustic signal, namely an
initial decaying sinusoidal signal associated with the initial bubble formation followed by a
second decaying sinusoid of greater magnitude and lower frequency indicative of the larger
bubble produced through coalescence.
Figure 5.3 – Example acoustic signals in 0.01 M NaCl at air flow rates of 8 sccm (non-coalescence),
9 sccm (partial coalescence), and 10 sccm (complete coalescence)
Figure 5.4 shows the results with increasing MIBC concentration (no solids present). The partial
coalescence curve indicates the onset of coalescence (i.e., no coalescence is seen below this flow
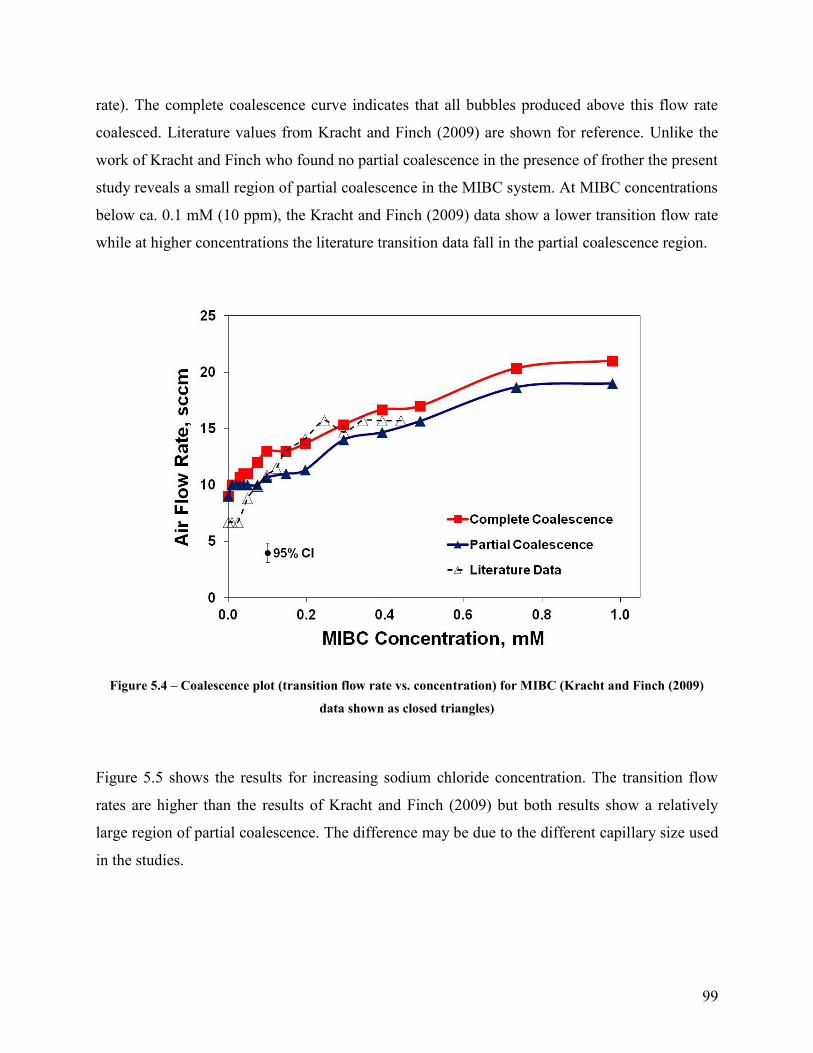
99
rate). The complete coalescence curve indicates that all bubbles produced above this flow rate
coalesced. Literature values from Kracht and Finch (2009) are shown for reference. Unlike the
work of Kracht and Finch who found no partial coalescence in the presence of frother the present
study reveals a small region of partial coalescence in the MIBC system. At MIBC concentrations
below ca. 0.1 mM (10 ppm), the Kracht and Finch (2009) data show a lower transition flow rate
while at higher concentrations the literature transition data fall in the partial coalescence region.
Figure 5.4 – Coalescence plot (transition flow rate vs. concentration) for MIBC (Kracht and Finch (2009)
data shown as closed triangles)
Figure 5.5 shows the results for increasing sodium chloride concentration. The transition flow
rates are higher than the results of Kracht and Finch (2009) but both results show a relatively
large region of partial coalescence. The difference may be due to the different capillary size used
in the studies.
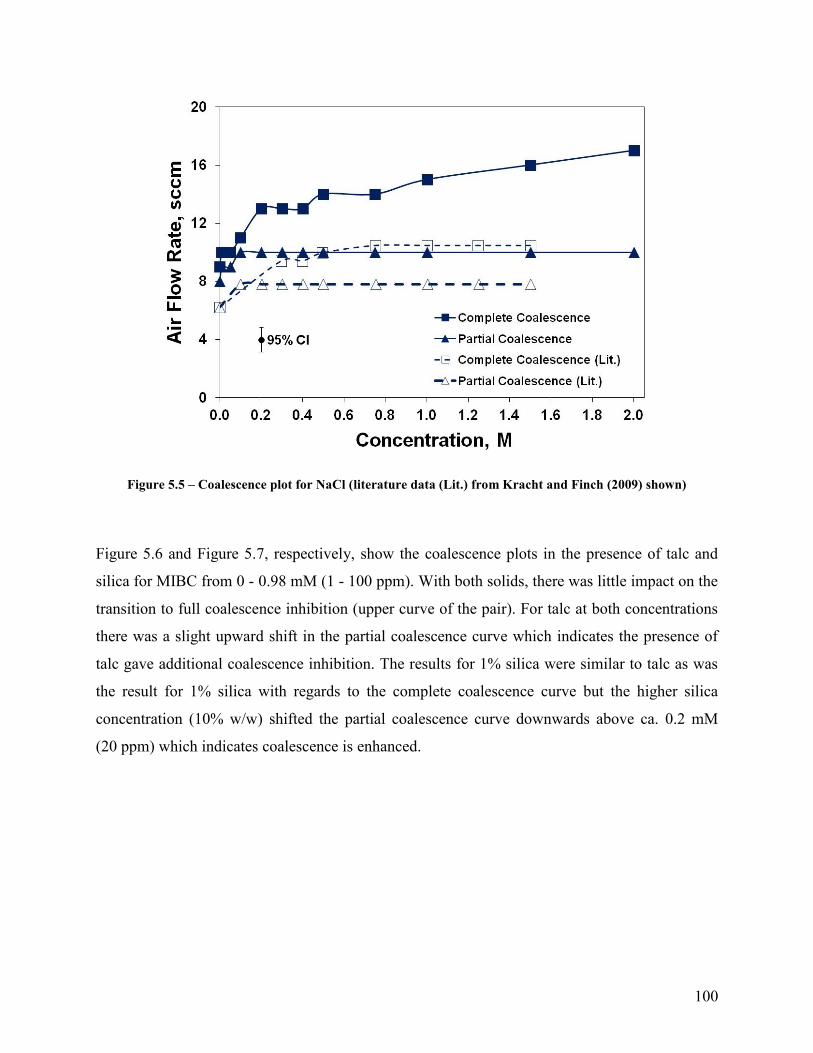
100
Figure 5.5 – Coalescence plot for NaCl (literature data (Lit.) from Kracht and Finch (2009) shown)
Figure 5.6 and Figure 5.7, respectively, show the coalescence plots in the presence of talc and
silica for MIBC from 0 - 0.98 mM (1 - 100 ppm). With both solids, there was little impact on the
transition to full coalescence inhibition (upper curve of the pair). For talc at both concentrations
there was a slight upward shift in the partial coalescence curve which indicates the presence of
talc gave additional coalescence inhibition. The results for 1% silica were similar to talc as was
the result for 1% silica with regards to the complete coalescence curve but the higher silica
concentration (10% w/w) shifted the partial coalescence curve downwards above ca. 0.2 mM
(20 ppm) which indicates coalescence is enhanced.

101
Figure 5.6 – Coalescence plots for 0%, 1% and 10% w/w talc in MIBC solution
Figure 5.7 – Coalescence plots for 0%, 1% and 10% w/w silica in MIBC solution
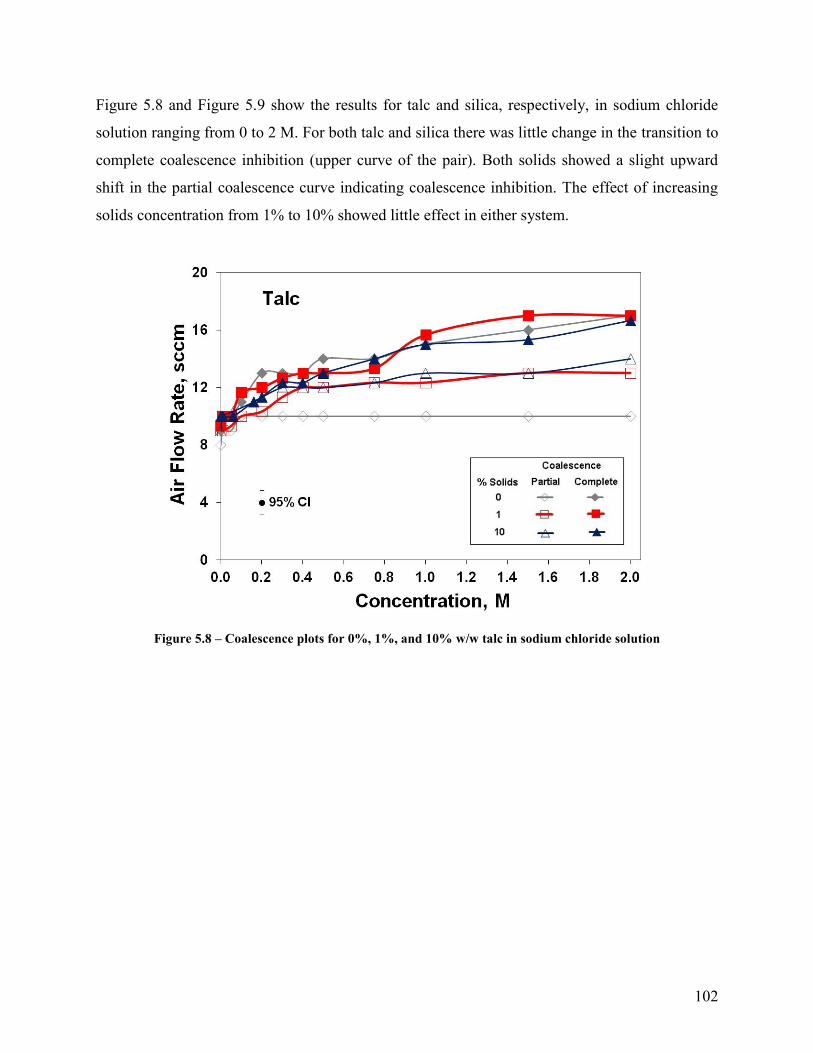
102
Figure 5.8 and Figure 5.9 show the results for talc and silica, respectively, in sodium chloride
solution ranging from 0 to 2 M. For both talc and silica there was little change in the transition to
complete coalescence inhibition (upper curve of the pair). Both solids showed a slight upward
shift in the partial coalescence curve indicating coalescence inhibition. The effect of increasing
solids concentration from 1% to 10% showed little effect in either system.
Figure 5.8 – Coalescence plots for 0%, 1%, and 10% w/w talc in sodium chloride solution

103
Figure 5.9 – Coalescence plots for 0%, 1%, and 10% w/w silica in sodium chloride solution
5.4 Discussion
The use of passive acoustic emission monitoring allowed direct examination of bubble-bubble
interactions at a capillary in the presence of solids which produce opaque systems where the use
of visual techniques is limited. This extends the work of Kracht and co-workers (Kracht and
Finch, 2009; Kracht and Rebolledo, 2013) who used a similar capillary-based acoustic setup to
study coalescence in air-water systems. In the same air-water systems tested by Kracht and co-
workers the present results were similar except we noted a partial coalescence region for MIBC
(Figure 5.5) as well as for NaCl. The partial coalescence region proved important in identifying
an effect of solids.
With both MIBC and NaCl the transition to complete coalescence (the upper curve of the pair)
was hardly influenced by the presence of talc or silica. This suggests no impact on coalescence.
The lower coalescence curve indicating transition to partial coalescence did reveal an effect of
solids. For all cases except 10% silica with greater than ca. 0.2 mM (20 ppm) MIBC the partial
coalescence curve was shifted upward which indicates both hydrophobic talc and hydrophilic
104
silica inhibited coalescence. Based on the theories emerging from froth studies this could mean
inhibition by particle coated bubbles in the case of talc, and water retention in the case of silica.
The 10% silica / MIBC case gave the opposite effect: the partial coalescence curve was shifted
downwards indicating coalescence was enhanced. This is difficult to reconcile with theory as
silica is unlikely to bridge to promote coalescence the way bridging is understood to function. It
is doubtful that theories from studies of froth are applicable to bubble production as noted by Ata
(2012). Researchers have noted increased bubble size in flotation systems at increasing solids
concentration in the presence of frother (O’Connor et al., 1990; Tucker et al., 1994). The effect
may be related to slurry viscosity which could allow bubbles to linger in proximity to the gas
dispersing device which could promote bubble coalescence.
Depending on the significance of partial coalescence, overall the observations do not suggest a
major impact of solid particles on bubble production in flotation machines. The particles selected
represent the range in wettability encountered in flotation systems but arguably other particle
sizes or much higher solids concentration may have more effect. High solids concentrations, for
example, could have an influence through increased slurry viscosity (Grau and Laskowski,
2006). Coupled with the observation that industrial bubble size data fall in the range predicted by
the bubble size model developed in the air-water system (Finch et al., 2008; Nesset, 2011), this
supports that particles have limited impact on the bubble production process. This is perhaps as
well since a significant impact might necessitate bubble size control to offset particle effects
which may vary through a circuit as composition (ratio of hydrophobic to hydrophilic particles)
and size varied, an unwanted additional level of complexity. We are left with bubble size being
dominated by the interplay of the air dispersion mechanism and solution composition.
5.5 Conclusions
Passive acoustic emission monitoring was used to detect air bubble formation and coalescence at
a 300 µm capillary in slurry containing talc or silica particles. The effect of frother (MIBC) or
inorganic salt (NaCl) was to inhibit bubble coalescence, as indicated by increasing transition
flow rates between the non-coalescence, partial coalescence and complete coalescence bubble
regimes. The presence of silica with MIBC created a wider range of partial coalescence when
compared to talc. The effect of both solids was to slightly inhibit bubble coalescence except for
105
the case of 10% silica which appeared to promote coalescence at high frother concentration. Talc
and silica behaved similarly in the presence of sodium chloride with slight additional
coalescence inhibition detected. Overall, neither solid had a large effect supporting that particles
do not have much impact on bubble formation in flotation machines.
References
Ata, S., Ahmed, N., and Jameson, G.J., 2004. The effect of hydrophobicity on the drainage of
gangue minerals in flotation froths. Minerals Engineering 17, 7, 897-901.
Ata, S., 2008. Coalescence of bubbles covered by particles. Langmuir 24, 12, 6085-6091.
Ata, S., 2012. Phenomena in the froth phase of flotation - A review. International Journal of
Mineral Processing 102, 1-12.
Betteridge, D., Joshlin, M.T., and Lilley, T., 1981. Acoustic emissions from chemical reactions.
Analytical Chemistry 53, 1064-1073.
Boyd, J.W.R., and Varley, J., 2001. The use of passive measurement of acoustic emissions from
chemical engineering processes. Chemical Engineering Science 56, 1749-1767.
Cao, Z., Wang, B.-F., Wang, K.-M., Lin, H.-G., and Yu, R.-Q., 1998. Chemical acoustic
emissions from gas evolution processes recorded by a piezoelectric transducer. Sensors and
Actuators B 50, 27-37.
Cho, Y.S., and Laskowski, J.S., 2002a. Effect of flotation frothers on bubble size and foam
stability. International Journal of Mineral Processing 64, 2, 69-80.
Cho, Y.S., and Laskowski, J.S., 2002b. Bubble coalescence and its effect on dynamic foam
stability. The Canadian Journal of Chemical Engineering 80, 2, 299-305.
Christenson, H.K., Bowen, R.E., Carlton, J.A., Denne, J.R.M., and Lu, Y., 2008. Electrolytes
that show a transition to bubble coalescence inhibition at high concentrations. Journal of Physical
Chemistry C 112, 794-796.
Craig, V.S.J., Ninham, B.W., and Pashley, R.M., 1993. The effect of electrolytes on bubble
coalescence in water. Journal of Physical Chemistry 97, 10192-10197.
106
Crowther, T.G., Wade, A.P., Wentzell, P.D., and Gopal, R., 1991. Characterization of acoustic
emission from an electrolysis cell. Analytica Chimica Acta 254, 223-234.
Dippenaar, A., 1982. The destabilization of froth by solids. I. The mechanism of film rupture.
International Journal of Mineral Processing 9, 1, 1-14.
Dukhin, S.S., Miller, R., Loglio, G., 1998. Physico-chemical hydrodynamics of rising bubbles.
In: Möbius, D., Miller, R. (Eds.), Studies in Interfacial Science, Drops and Bubbles in Interfacial
Research, Elsevier Science 6, 367-432.
Finch, J.A., Nesset, J.E., and Acuña, C., 2008. Role of frother on bubble production and
behaviour in flotation. Minerals Engineering 21, 12, 949-957.
Gallegos-Acevedo, P.M., Espinoza-Cuadra, J., Pérez-Garibay, R., and Pecina-Treviño, 2010.
Bubble Coalescence: Hydrophobic particles effect. Journal of Mining Science 46, 3, 333-337.
Garrett, P.R., 1993. Defoaming. Surfactant Science Series, volume 45, Marcel Dekker, New
York.
Hofmeier, U., Yaminsky, V.V., and Christensen, H.K., 1995. Observations of solute effects on
bubble formation. Journal of Colloid and Interface Science 174, 199-210.
Hou, R., Hunt, A., and Williams, R.A., 1998. Acoustic monitoring of hydrocyclone performance.
Minerals Engineering 11, 11, 1047-1059.
Ip, S.W., Wang, Y., and Toguri, J.M., 1999. Aluminum foam stabilization by solid particles.
Canadian Metallurgical Quarterly 38, 1, 81-92.
Kracht, W., and Finch, J.A., 2009. Using sound to study bubble coalescence. Journal of Colloid
and Interface Science 332, 237–245.
Kulkarni, R.D., Goddard, E.D., and Kanner, B., 1977. Mechanism of antifoaming: Role of filler
particle. Industrial & Engineering Chemistry Fundamentals 16, 4, 472-474.
Kuan, S.H., and Finch, J.A., 2010. Impact of talc on pulp and froth properties in F150 and 1-
pentanol frother systems. Minerals Engineering 23, 11, 1003-1009.
Kyriakides, N.K., Kasrinakis, E.G., Nychas, S.G., and Goulas, A., 1997. Bubbling from nozzles
submerged in water: Transitions between bubbling regimes, The Canadian Journal of Chemical
Engineering 75, 684-691.
107
Leighton, T.G., Fagan K.J., and Field, J.E., 1991. Acoustic and photographic studies of injected
bubbles. European Journal of Physics 12, 77-85.
Minnaert, M., 1933. On musical air-bubbles and the sounds of running water. Philosophical
Magazine 16, 235-248.
Nesset, J.E., 2011. Modeling the Sauter mean bubble diameter in mechanical, forced-air flotation
machines. Ph.D. Thesis, McGill University, Department of Mining and Materials Engineering.
Pugh, R.J., 2007. The physics and chemistry of frothers. In: Fuerstenau, M. C., Jameson, G. J.,
and Yoon, R. H. (Eds.). Froth Flotation: A Century of Innovation, SME, Littleton, USA, 259-
281.
Quinn, J.J., and Finch, J.A., 2012. On bi-modal bubble size distributions in the absence of
frother. Minerals Engineering 36-38, 237-241.
Quinn, J.J., Kracht, W., Gomez, C.O., Gagnon, C., and Finch, J.A., 2007. Comparing the effects
of salts and frother (MIBC) on gas dispersion and froth properties. Minerals Engineering 20,
1296-1302.
Quinn, J.J., Maldonado, M., Gomez, C.O., and Finch, J.A., 2013. An experimental study on
bubble shape and rise velocity in frother, polymer and inorganic salt solutions, In: Proceedings of
the 52nd
Conference of Metallurgists (hosted by Materials Science & Technology (MS&T)
2013): Water and Energy in Mineral Processing, The 9th
UBC - McGill - U of A International
Symposium on the Fundamentals of Mineral Processing, 1981-1992.
Spencer, S.J., Bruniges, R., Sharp, V., Catanzano, V., Roberts, G., Bruckard, W.J., and Davey,
K., 2010. Acoustic emission monitoring of froth flotation. In: Proceedings of the XXV
International Mineral Processing Congress. AUSIMM, Melbourne, 3489-3500.
Tse, K.L., Martin, T., McFarlane, C.M., and Nienow, A.W., 2003. Small bubble formation via a
coalescence dependent break-up mechanism. Chemical Engineering Science 58, 2, 275-286.
Vanegas, C., and Holtham, P., 2010. Possibility for flotation acoustics monitoring - a review. In:
Proceedings of the XXV International Mineral Processing Congress. AUSIMM, Melbourne,
2457-2470.

108
Vanegas, C., and Holtham, P., 2008. On-line froth acoustic emission measurements in industrial
sites. Minerals Engineering 21, 883–888.
Wentzell, P.D., and Wade, A.P., 1989. Chemical acoustic emission analysis in the frequency
domain. Analytical Chemistry 61, 2638-2642.
Zahradnik, J., Fialová, M., and Linek, V., 1999. The effect of surface additives on bubble
coalescence in aqueous media. Chemical Engineering Science 54, 4757-4766.
Zeng, Y., and Forssberg, E., 1993. Monitoring grinding parameters by signal measurements for
an industrial ball mill. International Journal of Mineral Processing 40, 1-16.
Zhang, W., Nesset, J.E., Rao, R., and Finch, J.A., 2012. Characterizing frothers through critical
coalescence concentration (CCC) 95-hydrophile-lipophile balance (HLB) relationship. Minerals
2, 3, 208-227.

109
Chapter 6 – Experimental study on the shape -
velocity relationship of an ellipsoidal bubble in
inorganic salt solutions
6.1 Introduction
Froth flotation and gas dispersion in saline solutions has garnered increased attention in recent
years (Craig, 2011; Alexander et al., 2012; Castro, 2012; Wang and Peng, 2013). The scarcity of
fresh water especially in remote mining locales has forced several plants to recycle process water
(which typically concentrates contaminants) or to use saline bore or sea water. The presence of
certain soluble inorganic ions has been shown to decrease bubble size and increase gas holdup in
flotation systems (Laskowski et al., 2003; Nesset et al., 2006). Quinn et al. (2007) showed that
inorganic solutions with ionic strength ca. 0.4 gave similar gas holdup to 8 - 10 ppm MIBC
frother in water. One flotation concentrator, Xstrata’s Raglan operation in northern Quebec,
operates without frother due to the high salt content of the process water which provides
adequate bubble size reduction and frothing characteristics. Several authors have investigated the
effect of saline process water on flotation performance (Yoon and Sabey, 1989; Pugh et al.,
1997; Castro, 2012).
Frother is typically added to flotation circuits with one function being the reduction of bubble
rise velocity (Klimpel and Isherwood, 1991). The ability of surfactants (frothers) to lower single
bubble rise velocity is well documented (Fuerstenau and Wayman, 1958; Sam et al., 1996;
Bozzano and Dente, 2001; Krzan and Malysa, 2002a, 2002b; Finch et al., 2008). The stagnant
cap model describes how surfactant molecules on the bubble surface are swept to the rear of a
rising bubble creating surface tension gradients which increase drag and thus retard bubble rise
(Savic, 1953; Dukhin et al., 1998). A similar mechanism seems to control bubble shape, surface
tension gradients resisting deformation (Dukhin et al., 1998; Finch et al., 2008). In comparison,
the mechanism(s) by which inorganic salts act to modify shape and velocity of rising bubbles is
not clear although surface tension gradients may be at play as most inorganic salts slightly
increase surface tension.
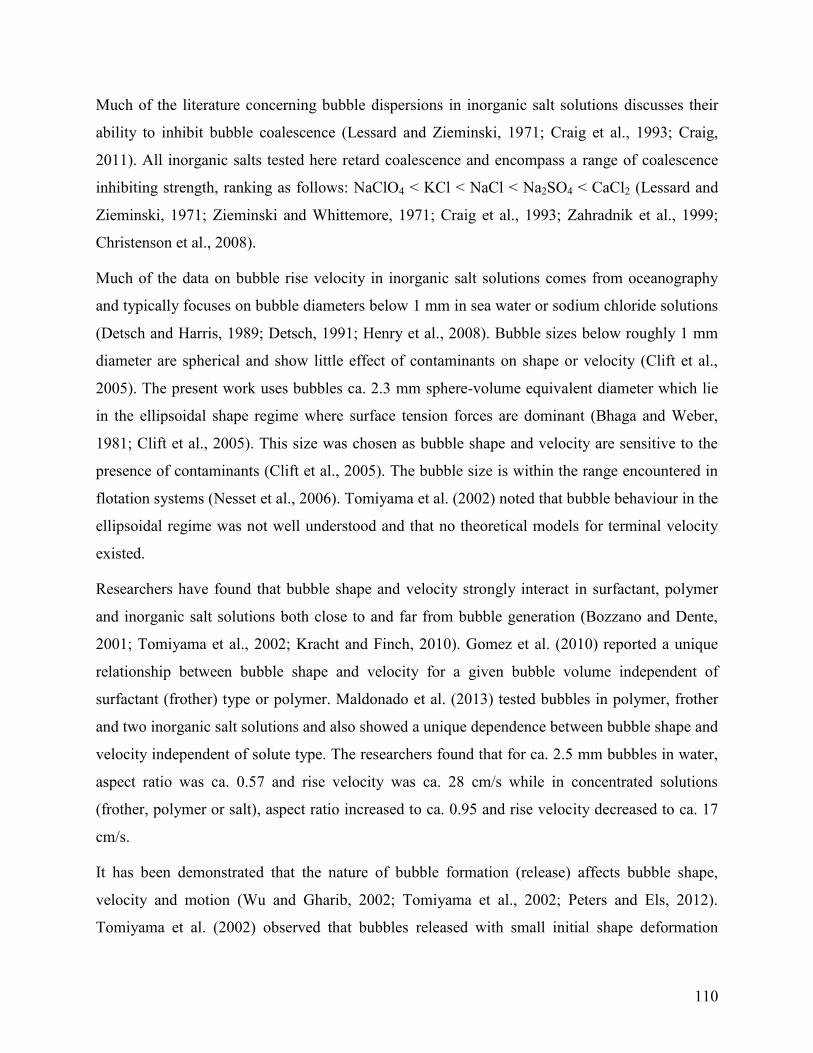
110
Much of the literature concerning bubble dispersions in inorganic salt solutions discusses their
ability to inhibit bubble coalescence (Lessard and Zieminski, 1971; Craig et al., 1993; Craig,
2011). All inorganic salts tested here retard coalescence and encompass a range of coalescence
inhibiting strength, ranking as follows: NaClO4 < KCl < NaCl < Na2SO4 < CaCl2 (Lessard and
Zieminski, 1971; Zieminski and Whittemore, 1971; Craig et al., 1993; Zahradnik et al., 1999;
Christenson et al., 2008).
Much of the data on bubble rise velocity in inorganic salt solutions comes from oceanography
and typically focuses on bubble diameters below 1 mm in sea water or sodium chloride solutions
(Detsch and Harris, 1989; Detsch, 1991; Henry et al., 2008). Bubble sizes below roughly 1 mm
diameter are spherical and show little effect of contaminants on shape or velocity (Clift et al.,
2005). The present work uses bubbles ca. 2.3 mm sphere-volume equivalent diameter which lie
in the ellipsoidal shape regime where surface tension forces are dominant (Bhaga and Weber,
1981; Clift et al., 2005). This size was chosen as bubble shape and velocity are sensitive to the
presence of contaminants (Clift et al., 2005). The bubble size is within the range encountered in
flotation systems (Nesset et al., 2006). Tomiyama et al. (2002) noted that bubble behaviour in the
ellipsoidal regime was not well understood and that no theoretical models for terminal velocity
existed.
Researchers have found that bubble shape and velocity strongly interact in surfactant, polymer
and inorganic salt solutions both close to and far from bubble generation (Bozzano and Dente,
2001; Tomiyama et al., 2002; Kracht and Finch, 2010). Gomez et al. (2010) reported a unique
relationship between bubble shape and velocity for a given bubble volume independent of
surfactant (frother) type or polymer. Maldonado et al. (2013) tested bubbles in polymer, frother
and two inorganic salt solutions and also showed a unique dependence between bubble shape and
velocity independent of solute type. The researchers found that for ca. 2.5 mm bubbles in water,
aspect ratio was ca. 0.57 and rise velocity was ca. 28 cm/s while in concentrated solutions
(frother, polymer or salt), aspect ratio increased to ca. 0.95 and rise velocity decreased to ca. 17
cm/s.
It has been demonstrated that the nature of bubble formation (release) affects bubble shape,
velocity and motion (Wu and Gharib, 2002; Tomiyama et al., 2002; Peters and Els, 2012).
Tomiyama et al. (2002) observed that bubbles released with small initial shape deformation

111
resulted in more spherical bubbles (high aspect ratio) with low terminal velocities compared to
bubbles with large initial shape deformation which resulted in oblate bubbles (low aspect ratio)
with high terminal velocities. Tomiyama et al. (2002) noted the presence of surfactant acted to
damp initial shape deformation.
The present work aims to build upon the work of Gomez et al. (2010) and Maldonado et al.
(2013) and test the bubble shape - rise velocity relationship in a series of inorganic salt solutions
(NaClO4, KCl, NaCl, Na2SO4, CaCl2). The results are compared to MIBC, a typical flotation
frother. The inorganic salts tested were chosen based on ions which are typically present in
flotation concentrator process water (Alexander et al., 2012) and to encompass a range of bubble
coalescence inhibiting behaviour. For the bubble size used (ca. 2.3 mm) the Reynolds numbers
range from ca. 280 - 670 and Eötvös numbers range from ca. 0.65 - 0.85, showing bubbles to be
in the ellipsoidal shape regime (Bhaga and Weber, 1981; Clift et al., 2005).
6.2 Experimental
6.2.1 Setup and image collection
The experimental setup is shown in Figure 6.1. Individual air bubbles were created at a glass
capillary tube (406 ± 25 μm inner diameter) in the various test solutions (Table 6.1). All
inorganic salts were supplied by Fisher Scientific and were ACS grade. The MIBC sample was
supplied by Sigma Aldrich and was GC grade. Bubble generation frequency was controlled at 5
seconds using a high-precision pressure regulator (Fairchild, model M4100A, 0-5 psi). The aim
was to form bubbles under constant release conditions to restrict effects of release on initial
shape. Bubble formation time was 71 ms ± 2 ms (95% confidence interval, CI). The pressure
regulator was connected to the capillary via coiled tubing with inner diameter 200 µm. After
detachment, the bubble rose through a 1 m vertical clear PVC pipe (0.025 m diameter) to a
rectangular viewing chamber (height 0.60 m, width 0.22 m, depth 0.14 m). Liquid level was
maintained at 1.35 m above the capillary. The viewing chamber was back-lit using an
arrangement of light emitting diodes (Phlox, model LLUB-QIR-24V) covering an area of 0.10 x
0.10 m. Images were collected of bubbles rising between a height of ca. 1.15 m to 1.20 m above
the capillary.
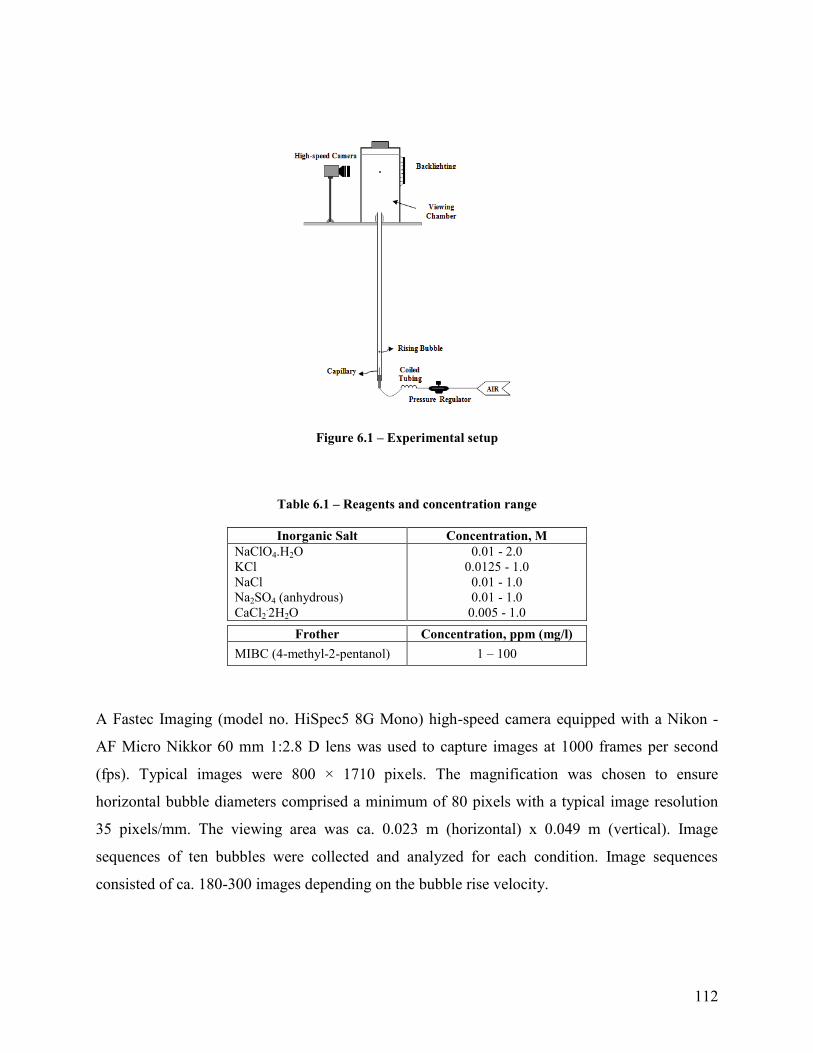
112
Figure 6.1 – Experimental setup
Table 6.1 – Reagents and concentration range
Inorganic Salt Concentration, M
NaClO4.H2O
KCl
NaCl
Na2SO4 (anhydrous)
CaCl2.2H2O
0.01 - 2.0
0.0125 - 1.0
0.01 - 1.0
0.01 - 1.0
0.005 - 1.0
Frother Concentration, ppm (mg/l)
MIBC (4-methyl-2-pentanol) 1 – 100
A Fastec Imaging (model no. HiSpec5 8G Mono) high-speed camera equipped with a Nikon -
AF Micro Nikkor 60 mm 1:2.8 D lens was used to capture images at 1000 frames per second
(fps). Typical images were 800 × 1710 pixels. The magnification was chosen to ensure
horizontal bubble diameters comprised a minimum of 80 pixels with a typical image resolution
35 pixels/mm. The viewing area was ca. 0.023 m (horizontal) x 0.049 m (vertical). Image
sequences of ten bubbles were collected and analyzed for each condition. Image sequences
consisted of ca. 180-300 images depending on the bubble rise velocity.

113
6.2.2 Image analysis
Image sequences were analyzed off-line using ImageJ software and a macro which automatically
calculated and tabulated: 1) bubble size, 2) bubble aspect ratio, and 3) bubble velocity. These
parameters were tracked at intervals of 1 ms.
1) Bubble size
The sphere-volume equivalent diameter (de) was calculated using the major (a) and minor (b)
semi-axes of an ellipse fitted to the projected bubble area (Equation (6.1)), assuming the bubble
to be an oblate spheroid (i.e., symmetric about the minor axis):
3 2 )2()2( bade (6.1)
Figure 6.2 depicts the ellipse fitting procedure and semi-axes determination.
2) Aspect ratio
Aspect ratio (E) was used to characterize bubble shape (Equation (6.2)). Values of E less than
1.0 denote the bubble is an oblate spheroid (Clift et al., 2005).
a
bE
(6.2)
3) Bubble rise velocity
Bubble rise velocity was calculated from the vertical displacement of the center of the fitted
ellipse over two consecutive frames.
Figure 6.2 – Image analysis procedure: a) original bubble image, b) image after applying threshold, c) ellipse
fitting, and d) determination of major (a) and minor (b) semi-axes
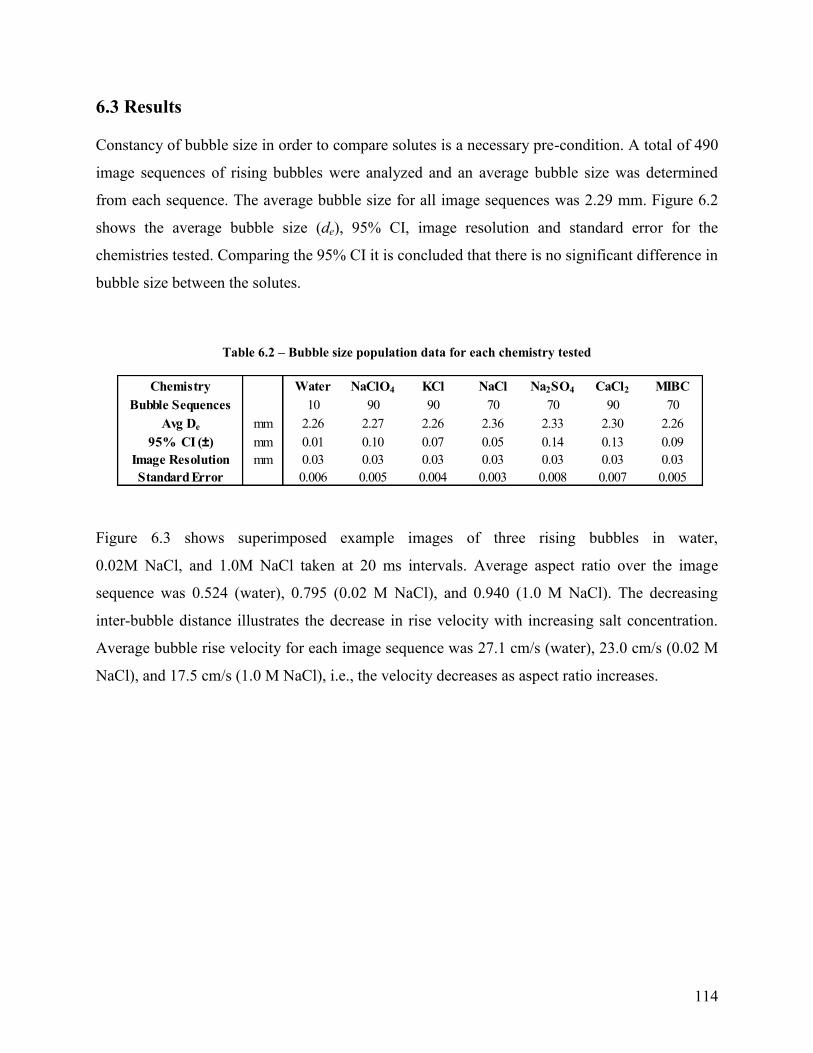
114
6.3 Results
Constancy of bubble size in order to compare solutes is a necessary pre-condition. A total of 490
image sequences of rising bubbles were analyzed and an average bubble size was determined
from each sequence. The average bubble size for all image sequences was 2.29 mm. Figure 6.2
shows the average bubble size (de), 95% CI, image resolution and standard error for the
chemistries tested. Comparing the 95% CI it is concluded that there is no significant difference in
bubble size between the solutes.
Table 6.2 – Bubble size population data for each chemistry tested
Figure 6.3 shows superimposed example images of three rising bubbles in water,
0.02M NaCl, and 1.0M NaCl taken at 20 ms intervals. Average aspect ratio over the image
sequence was 0.524 (water), 0.795 (0.02 M NaCl), and 0.940 (1.0 M NaCl). The decreasing
inter-bubble distance illustrates the decrease in rise velocity with increasing salt concentration.
Average bubble rise velocity for each image sequence was 27.1 cm/s (water), 23.0 cm/s (0.02 M
NaCl), and 17.5 cm/s (1.0 M NaCl), i.e., the velocity decreases as aspect ratio increases.
Chemistry Water NaClO4 KCl NaCl Na2SO4 CaCl2 MIBC
Bubble Sequences 10 90 90 70 70 90 70
Avg De mm 2.26 2.27 2.26 2.36 2.33 2.30 2.26
95% CI (±) mm 0.01 0.10 0.07 0.05 0.14 0.13 0.09
Image Resolution mm 0.03 0.03 0.03 0.03 0.03 0.03 0.03
Standard Error 0.006 0.005 0.004 0.003 0.008 0.007 0.005
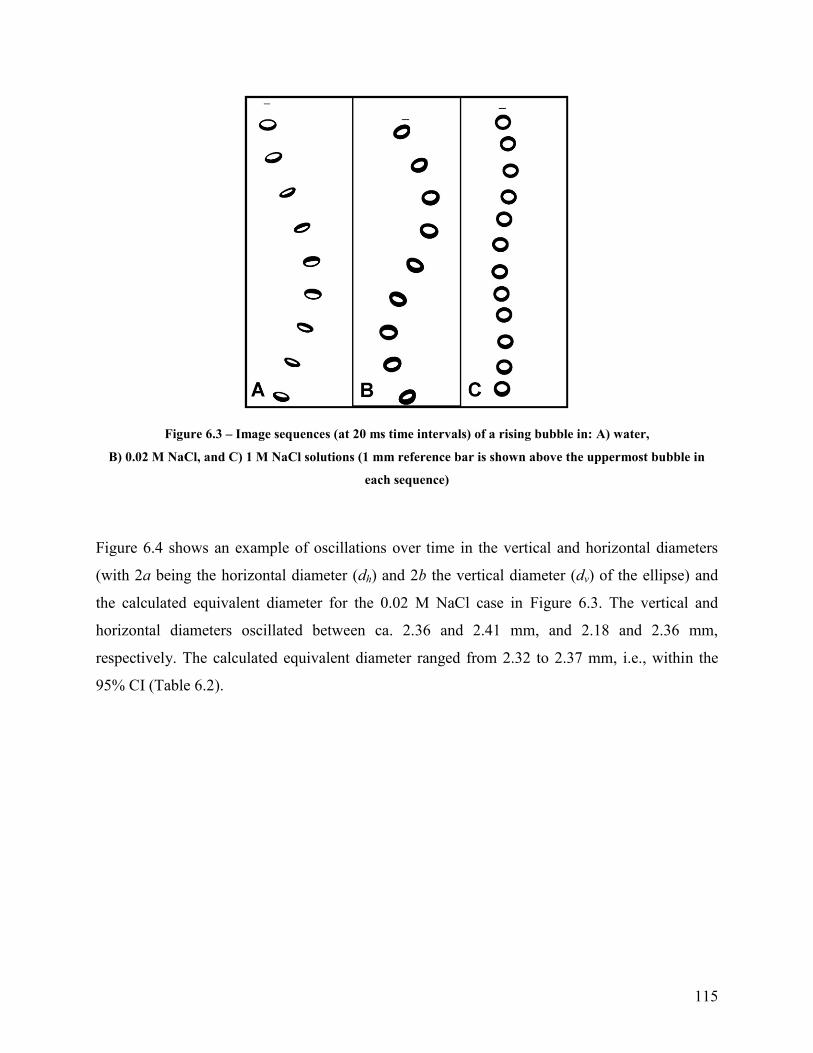
115
Figure 6.3 – Image sequences (at 20 ms time intervals) of a rising bubble in: A) water,
B) 0.02 M NaCl, and C) 1 M NaCl solutions (1 mm reference bar is shown above the uppermost bubble in
each sequence)
Figure 6.4 shows an example of oscillations over time in the vertical and horizontal diameters
(with 2a being the horizontal diameter (dh) and 2b the vertical diameter (dv) of the ellipse) and
the calculated equivalent diameter for the 0.02 M NaCl case in Figure 6.3. The vertical and
horizontal diameters oscillated between ca. 2.36 and 2.41 mm, and 2.18 and 2.36 mm,
respectively. The calculated equivalent diameter ranged from 2.32 to 2.37 mm, i.e., within the
95% CI (Table 6.2).

116
Figure 6.4 – Example of oscillations in the length of the major and minor axis and the calculated volume
equivalent diameter as a function of time in 0.02 M NaCl
Figure 6.5 shows bubble aspect ratio and rise velocity at 1 ms time intervals for the example
image sequences shown in Figure 6.3. It is evident that the variation in aspect ratio follows the
inverse in rise velocity: as aspect ratio increases (bubble becomes more spherical) velocity
decreases and vice versa. The effect of sodium chloride concentration is to change the magnitude
of each but not this inverse relationship. All the salts and the MIBC showed a similar ability to
increase bubble aspect ratio and decrease rise velocity with increasing concentration.
2.0
2.1
2.2
2.3
2.4
2.5
0 50 100 150 200 250
Time, ms
Dia
me
ter,
mm
dh
dv
de
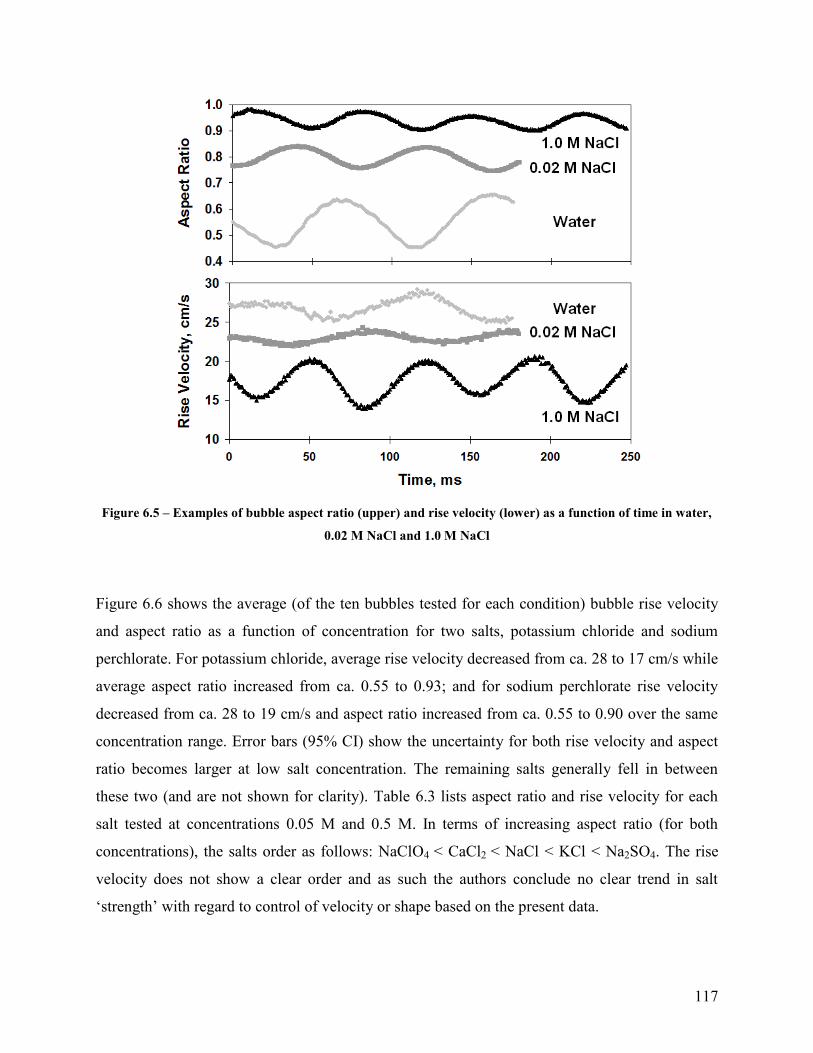
117
Figure 6.5 – Examples of bubble aspect ratio (upper) and rise velocity (lower) as a function of time in water,
0.02 M NaCl and 1.0 M NaCl
Figure 6.6 shows the average (of the ten bubbles tested for each condition) bubble rise velocity
and aspect ratio as a function of concentration for two salts, potassium chloride and sodium
perchlorate. For potassium chloride, average rise velocity decreased from ca. 28 to 17 cm/s while
average aspect ratio increased from ca. 0.55 to 0.93; and for sodium perchlorate rise velocity
decreased from ca. 28 to 19 cm/s and aspect ratio increased from ca. 0.55 to 0.90 over the same
concentration range. Error bars (95% CI) show the uncertainty for both rise velocity and aspect
ratio becomes larger at low salt concentration. The remaining salts generally fell in between
these two (and are not shown for clarity). Table 6.3 lists aspect ratio and rise velocity for each
salt tested at concentrations 0.05 M and 0.5 M. In terms of increasing aspect ratio (for both
concentrations), the salts order as follows: NaClO4 < CaCl2 < NaCl < KCl < Na2SO4. The rise
velocity does not show a clear order and as such the authors conclude no clear trend in salt
‘strength’ with regard to control of velocity or shape based on the present data.
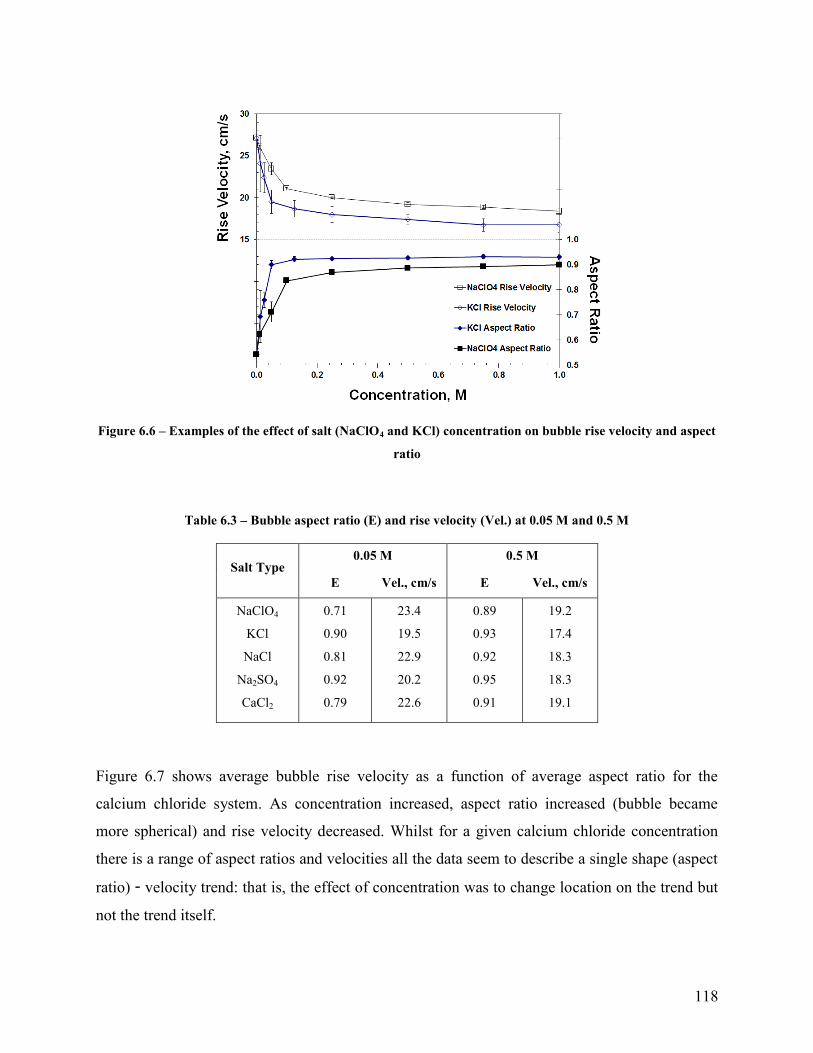
118
Figure 6.6 – Examples of the effect of salt (NaClO4 and KCl) concentration on bubble rise velocity and aspect
ratio
Table 6.3 – Bubble aspect ratio (E) and rise velocity (Vel.) at 0.05 M and 0.5 M
Salt Type 0.05 M 0.5 M
E Vel., cm/s E Vel., cm/s
NaClO4
KCl
NaCl
Na2SO4
CaCl2
0.71
0.90
0.81
0.92
0.79
23.4
19.5
22.9
20.2
22.6
0.89
0.93
0.92
0.95
0.91
19.2
17.4
18.3
18.3
19.1
Figure 6.7 shows average bubble rise velocity as a function of average aspect ratio for the
calcium chloride system. As concentration increased, aspect ratio increased (bubble became
more spherical) and rise velocity decreased. Whilst for a given calcium chloride concentration
there is a range of aspect ratios and velocities all the data seem to describe a single shape (aspect
ratio) - velocity trend: that is, the effect of concentration was to change location on the trend but
not the trend itself.
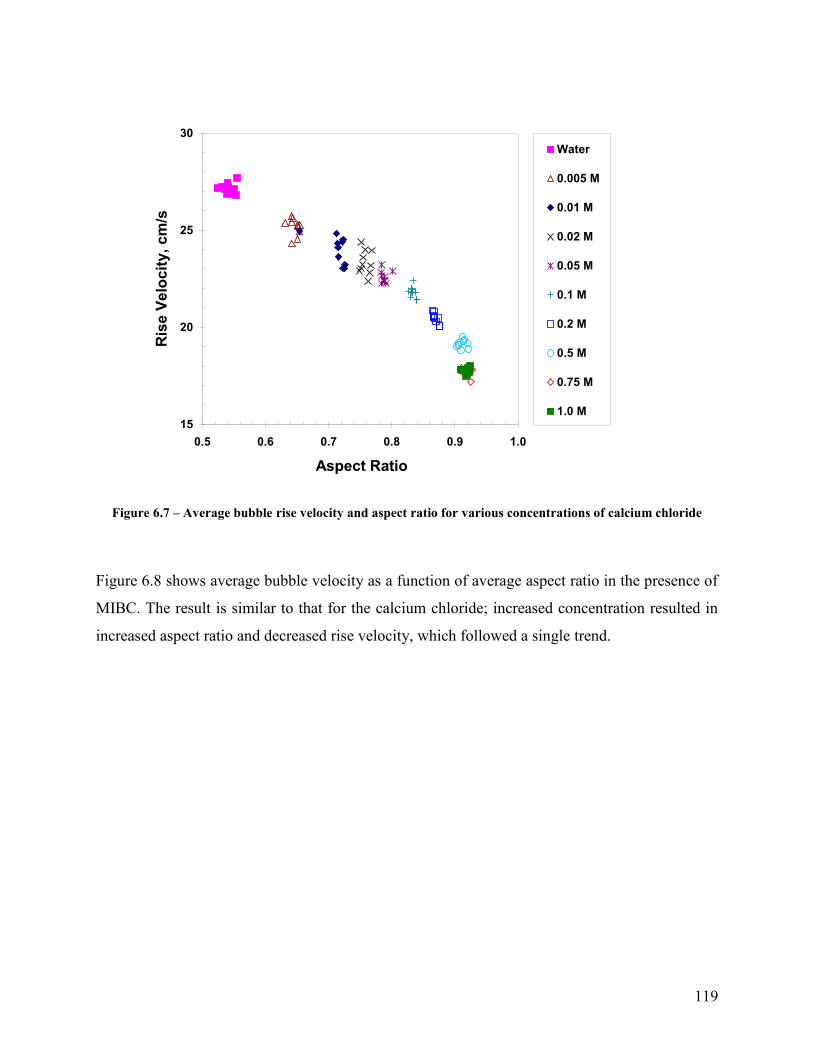
119
Figure 6.7 – Average bubble rise velocity and aspect ratio for various concentrations of calcium chloride
Figure 6.8 shows average bubble velocity as a function of average aspect ratio in the presence of
MIBC. The result is similar to that for the calcium chloride; increased concentration resulted in
increased aspect ratio and decreased rise velocity, which followed a single trend.
15
20
25
30
0.5 0.6 0.7 0.8 0.9 1.0
Aspect Ratio
Ris
e V
elo
cit
y,
cm
/sWater
0.005 M
0.01 M
0.02 M
0.05 M
0.1 M
0.2 M
0.5 M
0.75 M
1.0 M
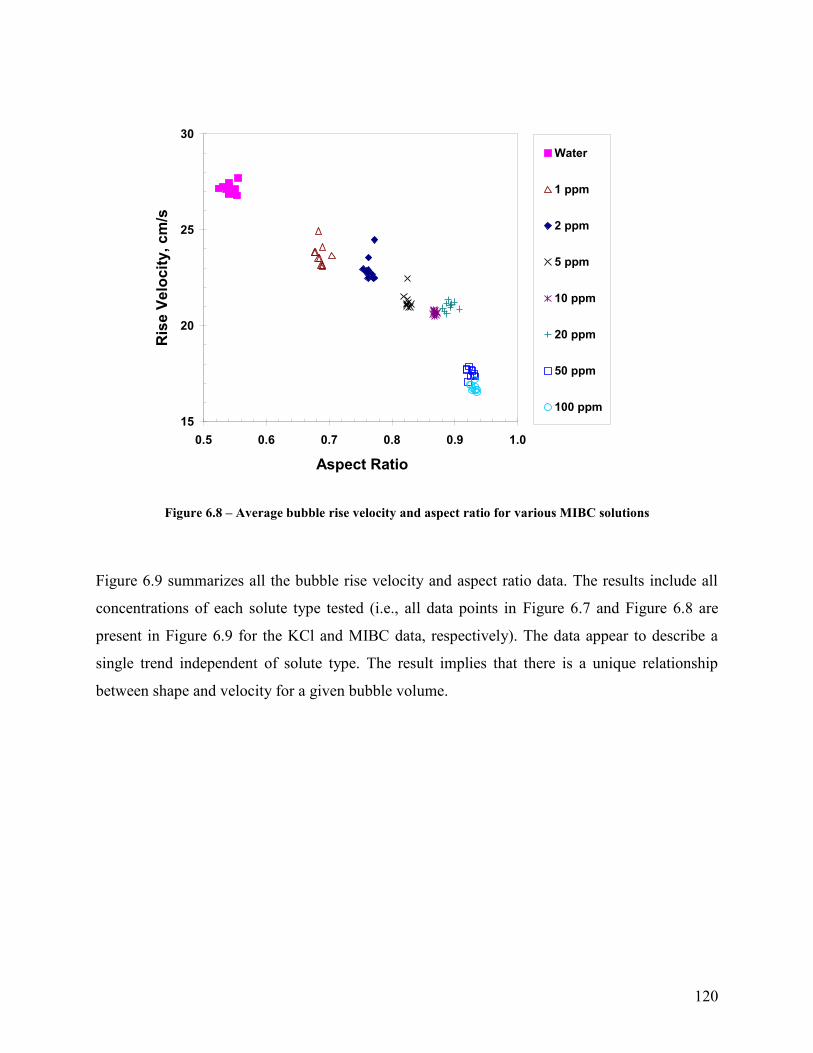
120
Figure 6.8 – Average bubble rise velocity and aspect ratio for various MIBC solutions
Figure 6.9 summarizes all the bubble rise velocity and aspect ratio data. The results include all
concentrations of each solute type tested (i.e., all data points in Figure 6.7 and Figure 6.8 are
present in Figure 6.9 for the KCl and MIBC data, respectively). The data appear to describe a
single trend independent of solute type. The result implies that there is a unique relationship
between shape and velocity for a given bubble volume.
15
20
25
30
0.5 0.6 0.7 0.8 0.9 1.0
Aspect Ratio
Ris
e V
elo
cit
y,
cm
/sWater
1 ppm
2 ppm
5 ppm
10 ppm
20 ppm
50 ppm
100 ppm
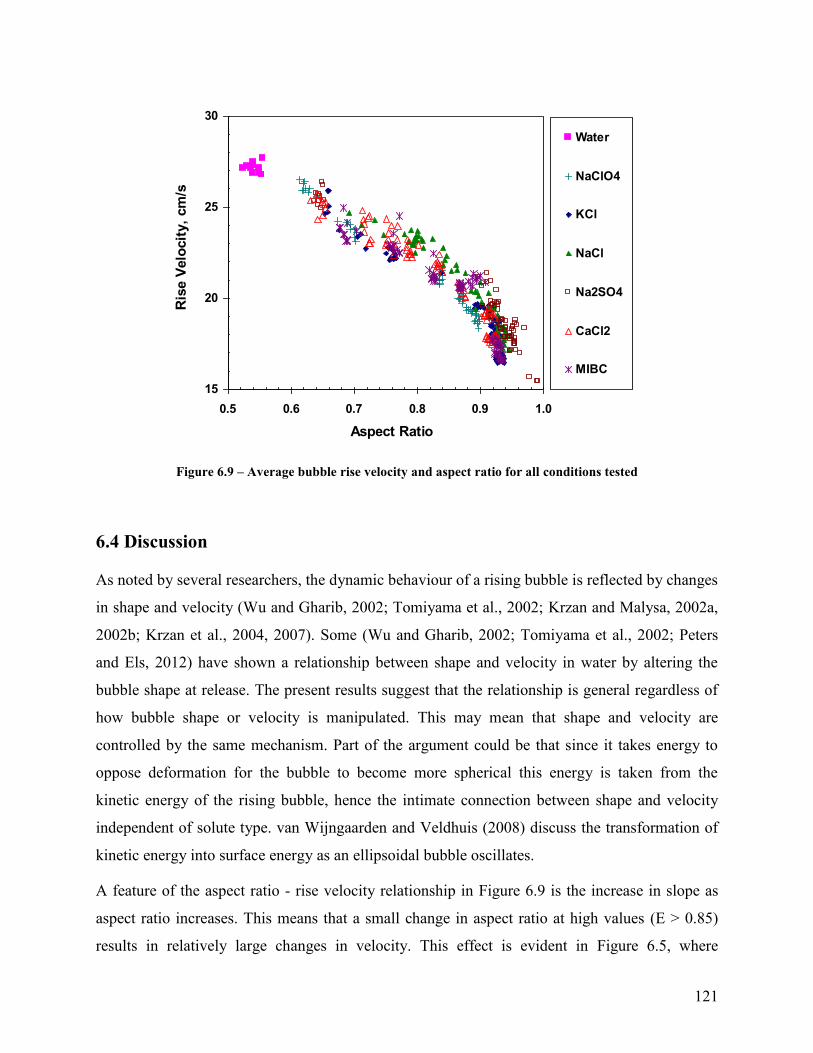
121
Figure 6.9 – Average bubble rise velocity and aspect ratio for all conditions tested
6.4 Discussion
As noted by several researchers, the dynamic behaviour of a rising bubble is reflected by changes
in shape and velocity (Wu and Gharib, 2002; Tomiyama et al., 2002; Krzan and Malysa, 2002a,
2002b; Krzan et al., 2004, 2007). Some (Wu and Gharib, 2002; Tomiyama et al., 2002; Peters
and Els, 2012) have shown a relationship between shape and velocity in water by altering the
bubble shape at release. The present results suggest that the relationship is general regardless of
how bubble shape or velocity is manipulated. This may mean that shape and velocity are
controlled by the same mechanism. Part of the argument could be that since it takes energy to
oppose deformation for the bubble to become more spherical this energy is taken from the
kinetic energy of the rising bubble, hence the intimate connection between shape and velocity
independent of solute type. van Wijngaarden and Veldhuis (2008) discuss the transformation of
kinetic energy into surface energy as an ellipsoidal bubble oscillates.
A feature of the aspect ratio - rise velocity relationship in Figure 6.9 is the increase in slope as
aspect ratio increases. This means that a small change in aspect ratio at high values (E > 0.85)
results in relatively large changes in velocity. This effect is evident in Figure 6.5, where
15
20
25
30
0.5 0.6 0.7 0.8 0.9 1.0
Aspect Ratio
Ris
e V
elo
cit
y,
cm
/s
Water
NaClO4
KCl
NaCl
Na2SO4
CaCl2
MIBC
122
oscillations in aspect ratio between 0.90 and 0.98 for the 1.0 M NaCl case resulted in velocity
oscillations between 14 and 21 cm/s while in water the relatively large oscillations in aspect ratio
(between 0.45 and 0.65) resulted in relatively minor velocity oscillations (between 25 and 29
cm/s). Tomiyama et al. (2002) state that the presence of solute damps shape oscillations while
Smolianski et al. (2008) note that the magnitude of oscillations in rise velocity are larger for
bubbles which are more resistant to deformation: both of these effects are seen here.
Surface tension gradients help explain both bubble coalescence inhibition and reduced single
bubble rise velocity with solute present. Several authors have characterized coalescence-
inhibiting salt strength which correlates well with ionic strength (Zieminski and Whittemore,
1971; Lessard and Zieminski, 1971; Craig et al., 1993). In contrast, from our data there appears
to be no clear trend in strength based on a salt’s ability to modify bubble shape and rise velocity.
Gas dispersion parameters (e.g. bubble size and gas holdup) play a key role in determining
flotation kinetics (Gorain et al., 1997). In the case of inorganic salts, coalescence inhibition helps
explain reduced bubble size (Zieminski and Whittemore, 1971; Craig et al., 1993) and, because
small bubbles rise slower than large bubbles (at least for bubbles < ca. 3 mm (Clift et al., 2005)),
also helps explain increased gas holdup (Quinn et al., 2007). In addition, the present work
indicates that rise velocity for a given bubble size (at least > 1 mm) is reduced in inorganic salt
solutions, which also contributes to increased gas holdup. Alexander et al. (2012) showed that
flotation recovery of graphite in salt solutions correlated with gas holdup independent of salt
type.
The correlation noted between graphite recovery and gas holdup reflects the particle collection
process which depends on bubble surface area and rise velocity. Collection would seem favored
by high surface area which can increase the number of particles transported, and by low rise
velocity, i.e., high bubble retention time, which increases the number of collision events. Given
that surface area increases as a spheroid becomes more oblate (i.e., for a given bubble volume a
sphere is the geometry with the least interfacial surface area), Figure 6.10 explores the
relationship between specific bubble surface area (mm2/mm
3or mm
-1) and bubble rise velocity
derived from the present data. The figure poses an interesting question: which is preferable, an
increased bubble surface area or reduced bubble rise velocity as both cannot be achieved

123
simultaneously? This discrimination could be a good exercise for a fundamental bubble-particle
capture model to examine.
Figure 6.10 – Rise velocity and specific bubble surface area for all conditions tested
6.5 Conclusions
Ellipsoidal bubbles of 2.3 mm equivalent diameter were produced at a capillary in water
containing a series of inorganic salts and MIBC frother. The shape and velocity were measured
over a distance of 1.15 to 1.20 m above the launch point. The shape and velocity oscillated in a
linked fashion with increasing concentration creating more spherical bubbles with reduced rise
velocity. There appears to be a unique bubble shape - rise velocity relationship independent of
solute type.
10
15
20
25
30
2.0 2.5 3.0 3.5 4.0 4.5 5.0
Specific Bubble Surface Area, mm-1
Ris
e V
elo
cit
y, c
m/s
Water NaClO4 KCl NaCl Na2SO4 CaCl2 MIBC
124
References
Alexander, S., Quinn, J., van der Spuy, J.E., and Finch, J.A., 2012. Correlation of graphite
flotation and gas holdup in saline solutions. In: Drelich, J. (Ed.), Water in Mineral Processing:
Proceedings of the First International Symposium, SME, Englewood, 41-50.
Bhaga, D., and Weber, M.E., 1981. Bubbles in viscous liquids: shapes, wakes and velocities.
Journal of Fluid Mechanics 105, 61-85.
Bozzano, G., and Dente, M., 2001. Shape and terminal velocity of single bubble motion: a novel
approach. Computers and Chemical Engineering 25, 571-576.
Castro, S., 2012. Challenges in flotation of Cu-Mo sulphide ores in sea water. In: Drelich, J.
(Ed.), Water in Mineral Processing: Proceedings of the First International Symposium, SME,
Englewood, 29-40.
Christenson, H.K., Bowen, R.E., Carlton, J.A., Denne, J.R.M., and Lu, Y., 2008. Electrolytes
that show transition to bubble coalescence inhibition at high concentrations. The Journal of
Physical Chemistry C 112, 794-796.
Clift, R., Grace, J.R., and Weber, M., 2005. Bubble, Drops, and Particles. Dover Publications
Inc., Mineola, New York. 169-202.
Craig, V.S.J., Ninham, B.W., and Pashley, R.M. 1993. The effect of electrolytes on bubble
coalescence in water. The Journal of Physical Chemistry 97, 10192-10197.
Craig, V.S.J., 2011. Do hydration forces play a role in thin film drainage and rupture observed in
electrolyte solution? Current Opinion in Colloid and Interface Science 16, 597-600.
Detsch, R.M., 1991. Small air bubbles in reagent grade water and seawater: rise velocities of 20-
to 1000-μm diameter bubbles. Journal of Geophysical Research 96, C5, 8901-8906.
Detsch R., and Harris, I., 1989. Dissolution and rise velocity of small air bubbles in water and
salt water. In: Proceedings of OCEANS'89, 1, 286–291.
Dukhin, S.S., Miller, R., and Loglio, G., 1998. Physico-chemical hydrodynamics of rising
bubbles. In: Mobius, D., Miller, R. (Eds.), Studies in interfacial Science, Drops and Bubbles in
Interfacial Research, vol. 6. Elsevier Science, 367-432.
125
Finch, J.A., Nesset, J.E., and Acuna, C., 2008. Role of frother on bubble production and
behaviour in flotation. Minerals Engineering 21, 949-957.
Fuerstenau, D.W., and Wayman, C.H., 1958. Effect of chemical reagents on the motion of single
air bubbles in water. Mining Engineering, Transactions of AIME, 694-699.
Gomez, C.O., Maldonado, M., Araya, R., and Finch, J.A., 2010. Frother and viscosity effects on
bubble shape and velocity. In: Pawlik, M. (Ed.), Proceedings of the 49th
Conference of
Metallurgists: Rheology in Mineral Processing, The 8th
UBC - McGill - U of A International
Symposium on the Fundamentals of Mineral Processing, 57-74.
Gorain, B.K., Franzidis, J.P., and Manlapig, E.V., 1997. Studies on impeller type, impeller speed
and air flow rate in an industrial flotation cell. Part 4: Effect of bubble surface area flux on
flotation performance. Minerals Engineering 10, 4, 367-379.
Henry, C.L., Parkinson, L., Ralston, J.R., and Craig, V.S.J., 2008. A mobile gas – water interface
in electrolyte solutions. The Journal of Physical Chemistry Letters C 112, 15094-15097.
Kracht, W., and Finch, J.A., 2010. Effect of frother on initial bubble shape and velocity.
International Journal of Mineral Processing 94, 115-120.
Krzan, M., and Malysa, K., 2002a. Profiles of local velocities of bubbles in n-butanol, n-hexanol
and n-nonanol solutions. Colloids and Surfaces A: Physicochemical and Engineering Aspects
207, 279-291.
Krzan, M., and Malysa, K., 2002b. Influence of frother concentration on bubble dimensions and
rising velocities. Physicochemical Problems of Mineral Processing 36, 65-76.
Krzan, M., Lunkenheimer, K., and Malysa, K., 2004. On the influence of the surfactant’s polar
group on the local and terminal velocities of bubbles. Colloids and Surfaces A: Physicochemical
Engineering Aspects 250, 431-441.
Krzan, M., Zawala, J., and Malysa, K., 2007. Development of steady state adsorption distribution
over interface of a bubble rising in solutions of n-alkanols (C5, C8) and n-
alkyltrimethylammonium bromides (C8, C12, C16). Colloids and Surfaces A: Physicochemical
Engineering Aspects 298, 42-51.
126
Laskowski, J.S., Cho, Y.S., and Ding, K., 2003. Effect of frothers on bubble size and foam
stability in potash ore flotation systems. The Canadian Journal of Chemical Engineering 81, 63-
69.
Lessard, R.R., and Zieminski, S.A., 1971. Bubble coalescence and gas transfer in aqueous
electrolyte solutions. Industrial and Engineering Chemistry Fundamentals 10, 2, 260-269.
Maldonado, M., Quinn, J.J., Gomez, C.O., and Finch, J.A., 2013. An experimental study
examining the relationship between bubble shape and rise velocity. Chemical Engineering
Science 98, 7-11.
Nesset, J.E., Hernandez-Aguilar, J.R., Acuna, C., Gomez, C.O., and Finch, J.A., 2006. Some gas
dispersion characteristics of mechanical flotation machines, Minerals Engineering 19, 807-815.
Peters, F., and Els, C., 2012. An experimental study on slow and fast bubbles in tap water.
Chemical Engineering Science 82, 194-199.
Pugh, R.J., Weissenborn, P., and Paulson, O., 1997. Flotation in inorganic electrolytes; the
relationship between recovery of hydrophobic particles, surface tension, bubble coalescence and
gas solubility. International Journal of Mineral Processing 51, 125-138.
Quinn, J.J., Kracht, W., Gomez, C.O., Gagnon, C., and Finch, J.A., 2007. Comparing the effects
of salts and frother (MIBC) on gas dispersion and froth properties. Minerals Engineering 20,
1296-1302.
Sam, A., Gomez, C.O., and Finch, J.A., 1996. Axial velocity profiles of single bubbles in
water/frother solutions. International Journal of Mineral Processing 47, 177-196.
Savic, P., 1953. Circulation and distortion of liquid drops falling through viscous medium.
Natural Resources Council of Canada, Div. Mech.l Eng., Rep. No. NRC-MT-22, 36.
Smolianski, A., Haario, H., and Luukka, P., 2008, Numerical study of dynamics of single
bubbles and bubble swarms. Applied Mathematical Modelling 32, 641-659.
Tomiyama, A., Celata, G.P., Hosokawa, S., and Yoshida, S., 2002. Terminal velocity of single
bubbles in surface tension force dominant regime. International Journal of Multiphase Flow 28,
1497-1519.

127
Wang, B., and Peng, Y., 2013. The behaviour of mineral matter in fine coal flotation using saline
water. Fuel 109, 309-315.
van Wijngaarden, L., and Veldhuis, C., 2008. On hydrodynamical properties of ellipsoidal
bubbles. Acta Mechanica 201, 37-46.
Wu, M., and Gharib, M., 2002. Experimental studies on the shape and path of small air bubbles
rising in clean water. Physics of Fluids 14, 7, L49-L52.
Yoon, R.H., and Sabey, J.B. 1989. Coal flotation in inorganic salt solutions. Surfactant Science
Series: Interfacial Phenomena in Coal Technology 32, 87-114.
Zahradnik, J., Fialová, M., and Linek, V., 1999. The effect of surface additives on bubble
coalescence in aqueous media. Chemical Engineering Science 54, 4757-4766.
Zieminski, S.A., and Whittemore, R.C., 1971. Behavior of gas bubbles in aqueous electrolyte
solutions. Chemical Engineering Science 26, 509-520.

128
Chapter 7 – Unifying discussion
The effect of frother in the pulp phase of a flotation cell is to inhibit bubble coalescence and
reduce bubble rise velocity (Klimpel and Isherwood, 1991). Inorganic salts have been shown to
have a similar capability (Detsch, 1991; Craig et al., 1993; Quinn et al., 2007). Much of the
literature focuses on the role of bubble coalescence on the production of fine bubbles (Keitel and
Onken, 1982; Cho and Laskowski, 2002a,b). Researchers have hinted that the presence of frother
may also affect bubble break-up (Otake et al., 1977; Finch et al., 2008; Chu and Finch, 2013).
The topics covered in the thesis include: a review of bubble break-up mechanisms at a capillary,
the effect of frother and inorganic salt on bubble coalescence and break-up, the use of acoustics
to detect bubble coalescence in the presence of solid particles, and the relationship between
ellipsoidal bubble shape and rise velocity.
As a unifying discussion we offer some speculation on the role solute plays in determining
bubble coalescence and break-up, and link to the effect on bubble shape and rise velocity. It
would seem that a common mechanism(s) is determining the behaviour.
Bubble coalescence inhibition in the presence of frother has been explained by the presence of
surface tension gradients at the bubble surface. As bubbles approach one another an intervening
liquid film is formed. We can expect that the air-water interfaces in this region become deficient
in frother being swept away by the liquid being expelled from the film by the forces bringing the
bubbles together. As frother molecules diffuse to the interface region of low concentration liquid
is transported back into the film and counteracts the liquid drainage. Although inorganic salts
typically increase surface tension (unlike frothers) a similar surface tension gradient-driven
mechanism can be argued.
Similarly in the case of an ellipsoidal rising bubble, the commonly considered mechanism for
reduction in rise velocity results from the flow of liquid over the bubble surface that sweeps
adsorbed surfactant from the upstream side to the rear of the bubble. The re-distribution of
surfactant results in a concentration gradient with concentration increasing towards the bubble
rear which is associated with a surface tension gradient in the opposite direction, (i.e., surface
tension increases towards the bubble front). The surface tension gradient induces a force that
increases drag (Duhkin et al., 1998).

129
Single rising bubbles tend to become more spherical upon the addition of surfactant. The change
in bubble shape can also be related to the surface tension gradient, the associated force opposing
deformation due to the dynamic pressure across the rising bubble (Hinze, 1955; Dukhin et al.,
1998; Finch et al., 2008). The combination of opposition to deformation and increased drag
results in the observation that as bubbles become spherical they slow down.
Bubble shape can also be invoked in discussing bubble coalescence and break-up. Leighton et al.
(1991) noted that shape oscillations upon bubble release from an orifice could result in bubble
coalescence. Ohnishi et al. (1999) and Tse et al. (2003) observed a coalescence-induced bubble
break-up mechanism. Coalescence was shown to impart shape oscillations which could lead to
break-up. Solutes have been shown to damp shape oscillations (Tomiyama et al., 2002;
Smolianski et al. 2008). Hinze (1955) noted the possibility of determining a critical bubble size
with associated surface instabilities (shape deformation) which allowed for break-up. Similar
explanations include a critical convective wake force above which bubbles are prone to break-up
(Marrucci and Nicodemo, 1967). Tse et al. (2003) noted that increased flexibility of the interface
and significant shape distortion, especially in the water only, promoted bubble break-up. The
tendency of solutes to make a bubble spherical and reduce shape distortions reflects the action of
solute at the interface which appears to inhibit bubble break-up.
An alternate explanation for the phenomena (coalescence and break-up inhibition, reduced rise
velocity and shape change in surfactant systems) may lie in the hydrogen bonds (H-bonds) that
form between the hydrophilic group(s) of the surfactant (OH- in the case of frothers) and water
molecules. We can envisage that the H-bonding creates a network of water molecules around the
bubble that resists bubble deformation and induces a surface viscosity higher than the bulk value
that slows bubble rise (Nguyen and Schulze, 2002) or inhibits coalescence (by slowing film
drainage).
In the case of inorganic salts the surface tension gradient argument could apply but since salts
tend to increase surface tension rather than decrease it as do surfactants the solute concentration
would have to be in the opposite sense to that for surfactant. For example, for a bubble rising in a
solution of inorganic salt to generate a surface tension gradient towards the front of the bubble
requires that the surface salt concentration increase towards the bubble front. Perhaps the action
of the liquid passing over the bubble is to transport the free water molecules to the rear rather
130
than the large hydrated ions which remain in the bulk solution. The H-bonding argument may
also be tenable in the case of salts as the hydration sheaths which would impose a certain order
(network) on the water molecules around the bubbles.
The role of solids in the thesis was only examined with respect to coalescence and their impact
related to bubble formation appears limited. There may be a situation where hydrophobic
particles of sufficient small size (nano-particles) may start to act as surfactants and retard
coalescence (Ng et al., 2013). Certainly hydrophobic particles can be expected to slow bubble
rise upon attachment. The presence of hydrophilic particles may also slow bubble rise due to the
potential impact on slurry viscosity. Given the demonstrated connection between velocity and
shape, would a bubble slowed by a particle load adjust its shape to conform with the relationship
observed in the absence of particles?
References
Cho, Y.S., and Laskowski, J.S., 2002a. Effect of flotation frothers on bubble size and foam
stability. International Journal of Mineral Processing, 64, 2, 69-80.
Cho, Y.S., and Laskowski, J.S., 2002b. Bubble coalescence and its effect on dynamic foam
stability. The Canadian Journal of Chemical Engineering 80, 2, 299-305.
Chu, P., and Finch, J.A., 2013. Frother and breakup in small bubble formation. In: Proceedings
of the 52nd
Conference of Metallurgists (hosted by Materials Science & Technology (MS&T)
2013): Water and Energy in Mineral Processing, The 9th
UBC-McGill-U of A International
Symposium on the Fundamentals of Mineral Processing, The Metallurgical Society of CIM,
2034-2043.
Craig, V.S., Ninham, B.W., and Pashley, R.M., 1993. The effect of electrolytes on bubble
coalescence in water. The Journal of Physical Chemistry 97, 39, 10192-10197.
Detsch, R.M., 1991. Small air bubbles in reagent grade water and seawater: Rise velocities of 20
to 1000-μm diameter bubbles. Journal of Geophysical Research 96, C5, 8901-8906.
131
Dukhin, S.S., Miller, R., Loglio, G., 1998. Physico-chemical hydrodynamics of rising bubbles.
In: Möbius, D., Miller, R. (Eds.), Studies in Interfacial Science, Drops and Bubbles in Interfacial
Research, Elsevier Science, 6, 367-432.
Finch, J.A., Nesset, J.E., and Acuña, C., 2008. Role of frother on bubble production and
behaviour in flotation. Minerals Engineering 21, 12, 949-957.
Keitel, G., and Onken, U., 1982. Inhibition of bubble coalescence by solutes in air/water
dispersions. Chemical Engineering Science, 37, 11, 1635-1638.
Ng, K.Y., Law, E., Lim, M., and Ata, S., 2013. Influence of particle on the formation of bubbles
from a submerged capillary. In: Proceedings Flotation’13, Cape Town.
Nguyen, A.V., and Schulze, H.J. (Eds.), 2004. Colloidal Science of Flotation. Surfactant science
series, vol. 118. Marcel Dekker. New York.
Otake, T., Tone, S., Nakao, K., and Mitsuhashi, Y., 1977. Coalescence and breakup of bubbles in
liquids. Chemical Engineering Science 32, 4, 377-383.
Quinn, J.J., Kracht, W., Gomez, C.O., Gagnon, C., and Finch, J.A., 2007. Comparing the effect
of salts and frother (MIBC) on gas dispersion and froth properties. Minerals Engineering 20, 14,
1296-1302.
Smolianski, A., Haario, H., and Luukka, P., 2008. Numerical study of dynamics of single
bubbles and bubble swarms. Applied Mathematical Modelling 32, 641-659.
132
Chapter 8 – Conclusions, contributions, and future
work
8.1 Conclusions
The thesis addressed bubble coalescence and break-up in water and frother or inorganic salt
solutions at a capillary, the use of acoustics to detect bubble coalescence in the presence of
hydrophobic and hydrophilic solid particles, and the relationship between ellipsoidal bubble
shape and rise velocity. The following conclusions can be drawn from the individual studies:
Conditions at a capillary could be adjusted to observe coalescence-related and wake-
related mechanisms giving fine bubbles and bi-modal distributions.
Bi-modal bubble size distributions observed in the absence of coalescence inhibiting
agents may result from bubble-bubble interactions.
Three coalescence-related mechanisms are argued to be at play in flotation systems where
bi-modal bubble size distributions are reported.
The addition of surfactant or inorganic salts inhibited bubble coalescence and delayed the
onset of fine bubble production (break-up) at a capillary.
Three bubble regimes were identified: non-coalescence (single bubble production),
bubble coalescence, and coalescence with fine bubble production with defined transition
air rates as a function of solute concentration.
In certain instances, a region of partial coalescence was observed in frother and inorganic
salt solutions.
Frother and inorganic salt strength was characterized in terms of bubble coalescence
inhibiting and bubble break-up inhibiting strength. Commercial frothers ranked: MIBC <
DF250 < F150. Inorganic salts containing multi-valent ions were stronger than mono-
valent salts.
Passive acoustic emission monitoring was used to detect air bubble coalescence at a
capillary in an opaque slurry system containing talc or silica particles.
133
The effect of frother (MIBC) or inorganic salt (NaCl) in the slurry was to inhibit bubble
coalescence.
The presence of silica particles with MIBC created a wider range of partial coalescence
when compared to talc.
The effect of both solids (talc and silica) was to slightly inhibit bubble coalescence except
for the case of 10% w/w silica which appeared to promote coalescence at high frother
concentration.
Neither solid (talc or silica) had a large effect on coalescence supporting that particles do
not have much impact on bubble formation in flotation systems.
For ellipsoidal bubbles of ca. 2.3 mm equivalent diameter in inorganic salt solutions,
bubble shape and velocity were seen to oscillate.
Bubble shape and velocity oscillated in a linked fashion with increasing concentration
creating more spherical bubbles with reduced rise velocity.
There appears to be a unique bubble shape - rise velocity relationship independent of
solute type.
8.2 Contributions to original knowledge
Mechanisms resulting in bubble break-up at a capillary in water were determined.
Experiments quantified the effect of frothers and inorganic salts on bubble coalescence
and break-up at a capillary
Frothers and inorganic salts delayed the onset of bubble coalescence and break-up.
The results appear to indicate that the action of solute in delaying coalescence also results
in delayed coalescence-induced break-up.
Acoustics were used to detect bubble coalescence in a three-phase (opaque) system where
visual techniques cannot be used.
134
The role of hydrophobic talc and hydrophilic silica on coalescence was investigated. The
presence of talc created a fairly narrow range of incomplete coalescence. The presence of
silica created a wider range of incomplete coalescence. Silica appeared to have a slight
ability to promote bubble coalescence at 10% w/w.
The shape and rise velocity of single bubbles was measured in various inorganic salt
solutions.
For a single rising bubble, the presence of inorganic salt and frother resulted in more
spherical bubbles that rose at lower velocities.
There appears to be a unique relationship between ellipsoidal bubble shape and velocity
(for a given bubble volume) independent for solute type or concentration.
8.3 Suggestions for future work
Explore the effect of solute on coalescence and break-up in a swarm (produced in a
flotation column or a mechanical cell)
Explore the use of passive acoustic emission monitoring in a flotation cell to infer
information regarding the bubble size distribution
The use of two high-speed cameras at right angles to further understand the link between
bubble shape, rise velocity and motion (spiral vs. zig-zag). A setup that enables accurate
reconstruction of the bubble shape, volume, motion and velocity as a function of bubble
size, height of rise, solution chemistry and the method of formation could prove useful in
fully understanding the behaviour of a single rising bubble.
The shape-velocity data should be tested against theoretical and empirical models that
link ellipsoidal bubble shape and rise velocity.
Linking the behaviour of a single rising bubble to the behaviour of a swarm could
improve modeling gas dispersion properties in flotation systems.
135
References
Acuña Perez, C.A., 2007. Measurement techniques to characterize bubble motion in swarms.
Ph.D. Thesis, McGill University, Department of Mining and Materials Engineering.
Acuña, C.A., and Finch, J.A., 2010. Tracking velocity of multiple bubbles in a swarm.
International Journal of Mineral Processing 94, 147-158.
Agrawal, S.K., and Wasan, D.T., 1979. The effect of interfacial viscosities on the motion of
drops and bubbles. The Chemical Engineering Journal 18, 215-223.
Alexander, S., Quinn, J., van der Spuy, J.E., and Finch, J.A., 2012. Correlation of graphite
flotation and gas holdup in saline solutions. In: Drelich, J. (Ed.), Water in Mineral Processing:
Proceedings of the First International Symposium, SME, Englewood, 41-50.
Ata, S., Ahmed, N., and Jameson, G.J., 2004. The effect of hydrophobicity on the drainage of
gangue minerals in flotation froths. Minerals Engineering 17, 7, 897-901.
Ata, S., 2008. Coalescence of bubbles covered by particles. Langmuir 24, 12, 6085-6091.
Ata, S., 2012. Phenomena in the froth phase of flotation - A review. International Journal of
Mineral Processing 102, 1-12.
Aybers N.M., and Tapucu, A., 1969a. The motion of gas bubbles rising through stagnant liquid.
Wärme- und Stoffübertragung Bd. 2, S. 118-128.
Aybers N.M., and Tapucu, A., 1969b. Studies on the drag and shape of gas bubbles rising
through a stagnant liquid. Wärme- und Stoffübertragung Bd. 2, S. 171-177.
Azgomi, F., Gomez, C.O., and Finch, J.A., 2007. Characterizing frothers using gas hold-up.
Canadian Metallurgical Quarterly 46, 3, 237-242.
Bachhuber, C., and Sanford, C., 1974. The rise of small bubbles in water. Journal of Applied
Physics 45, 2567-2569.
Bean, J.J., May 1971. Tale of tails. Mining World, 59.
Bergman, T., and Mesler, R., 1981. Bubble nucleation studies. Part I: Formation of bubble nuclei
in superheated water by bursting bubbles. AIChE Journal 27, 851-853.

136
Betteridge, D., Joshlin, M.T., and Lilley, T. 1981. Acoustic emissions from chemical reactions.
Analytical Chemistry 53, 1064-1073.
Bhaga, D., and Weber, M.E., 1981. Bubbles in viscous liquids: shapes, wakes and velocities.
Journal of Fluid Mechanics 105, 61-85.
Bikerman, J. J., 1938. The unit of foaminess. Transactions of the Faraday Society 34, 634.
Blin, P., and Dion-Ortega, A., June/July 2013. High and dry: With water in short supply, some
are looking to the ocean for answers. CIM Magazine, 46-51.
Bonner, O.D., and Jumper, C.F., 1973. Effect of ions on water structure. Infrared Physics 13,
233-242.
Boulton-Stone, J.M., and Blake, J.R., 1993. Gas bubble bursting at a free surface. Journal of
Fluid Mechanics 254, 437-466.
Bournival, G., Pugh, R.J., and Ata, S., 2012. Examination of NaCl and MIBC as bubble
coalescence inhibitor in relation to froth flotation. Minerals Engineering 25, 1, 47-53.
Boyd, J.W.R., and Varley, J., 2001. The use of passive measurement of acoustic emissions from
chemical engineering processes. Chemical Engineering Science 56, 1749-1767.
Bozzano, G., and Dente, M., 2001. Shape and terminal velocity of single bubble motion: a novel
approach. Computers and Chemical Engineering 25, 571-576.
Cain, F.W., and Lee, J.C., 1984. A technique for studying the drainage and rupture of unstable
liquid films formed between two captive bubbles: Measurement on KCl Solutions. Journal of
Colloid and Interface Science 106, 1, 70-85.
Cao, Z., Wang, B.-F., Wang, K.-M., Lin, H.-G., and Yu, R.-Q., 1998. Chemical acoustic
emissions from gas evolution processes recorded by a piezoelectric transducer. Sensors and
Actuators B 50, 27-37.
Cappuccitti, F., and Finch, J.A., 2007. Development of new frothers through hydrodynamic
characterization. In: Folinsbee, J. (Ed.), Proceedings 39th Annual Meeting of the Canadian
Mineral Processors of CIM, 399–412.
137
Cappuccitti, F., and Nesset, J.E., 2009. Frother and collector effects on flotation cell
hydrodynamics and their implication on circuit performance. In: Advances in Mineral Processing
Science and Technology – 48th
Conference of Metallurgists, Sudbury, 169-182.
Castro, S., 2012. Challenges in flotation of Cu-Mo sulfide ores in sea water. In: Drelich, J. (Ed.),
Water in Mineral Processing: Proceedings of the First International Symposium. SME,
Englewood, 29-40.
Chen, F., Gomez, C.O., and Finch, J.A., 2001. Bubble size measurement in flotation machines.
Minerals Engineering 14, 427-432.
Cho, Y.S., and Laskowski, J.S., 2002a. Effect of flotation frothers on bubble size and foam
stability. International Journal Minerals Processing 64, 69-80.
Cho, Y.S., and Laskowski, J.S., 2002b. Bubble coalescence and its effect on bubble size and
foam stability. Canadian Journal of Chemical Engineering 80, 299-305.
Christenson, H.K., Bowen, R.E., Carlton, J.A., Denne, J.R.M., and Lu, Y., 2008. Electrolytes
that show transition to bubble coalescence inhibition at high concentrations. Journal of Physical
Chemistry C 112, 794-796.
Chu, P., and Finch, J.A., 2013. Frother and breakup in small bubble formation. In: Proceedings
of the 52nd
Conference of Metallurgists (hosted by Materials Science & Technology (MS&T)
2013): Water and Energy in Mineral Processing, The 9th
UBC-McGill-U of A International
Symposium on the Fundamentals of Mineral Processing, The Metallurgical Society of CIM,
2034-2043.
Clift, R., Grace, J.R., and Weber, M., 2005. Bubble, Drops, and Particles. Dover Publications,
Inc., Mineola, New York.
Cole, R., 2009. KCGM News and Views, Issue 8, August 2009. 1-4.
Comley, B.A., Harris, P.J., Bradshaw, D.J., and Harris, M.C., 2002. Frother characterization
using dynamic surface tension measurements. International Journal of Mineral Processing, 64, 2,
81-100.
Craig, V.S.J., Ninham, B.W., and Pashley, R.M., 1993. The effect of electrolytes on bubble
coalescence in water. Journal of Physical Chemistry 97, 10192-10197.
138
Craig, V.S.J., 2004. Bubble coalescence and specific-ion effects. Current Opinion in Colloid and
Interface Science 9, 178-184.
Craig, V.S.J., 2011. Do hydration forces play a role in thin film drainage and rupture observed in
electrolyte solution? Current Opinion in Colloid and Interface Science 16, 597-600.
Crowther, T. G., Wade, A. P., Wentzell, P. D., and Gopal, R. 1991. Characterization of acoustic
emission from an electrolysis cell. Analytica Chimica Acta 254, 223-234.
Crozier, R.D., and Klimpel, R.R., 1989. Frothers: plant practice. Mineral Procesing and
Extractive Metallurgy Review, 5, 1-4, 257-279.
Cytec Industries Inc., Mining Chemicals Handbook, Revised Edition, 2002.
Czarnecki, J., Malysa, K., and Pomianowski, A., 1982. Dynamic Frothability Index. Journal of
Colloid and Interface Science 86, 570–572.
Czerski, H., 2011. A candidate mechanism for exciting sound during bubble coalescence. The
Journal of the Acoustical Society of America, 129, 3, EL83-EL88.
Davies, J.T., 1957. A quantitative kinetic theory of emulsion type. In: Physical Chemistry of the
Emulsifying Agent, Gas/Liquid and Liquid/Liquid Interface. Proceedings of the International
Congress of Surface Activity, 426-438.
Davies, R.M., and Taylor, G., 1950. The mechanics of large bubbles rising through extended
liquids and through liquids in tubes. Proceedings of the Royal Society of London, Series A,
Mathematical and Physical Sciences 200, 1060, 375-390.
Deane, G.B., and Czerski, H., 2008. A mechanism stimulating sound production from air
bubbles released from a nozzle. Journal of the Acoustical Society of America 123, 6, EL126-
EL132.
Detsch, R.M., 1991. Small air bubbles in reagent grade water and seawater: Rise velocities of 20
to 1000-μm diameter bubbles. Journal of Geophysical Research 96, C5, 8901-8906.
Detsch R., and Harris, I., 1989. Dissolution and rise velocity of small air bubbles in water and
salt water. In: Proceedings of OCEANS'89, 1, 286–291.
Detwiler, A., and Blanchard, D.C., 1978. Aging and Bursting bubbles in trace-contaminated
water. Chemical Engineering Science 33, 9-13.

139
Dippenaar, A., 1982. The destabilization of froth by solids. I. The mechanism of film rupture.
International Journal of Mineral Processing 9, 1, 1-14.
Drogaris, G., and Weiland, P., 1983. Coalescence of gas bubbles in aqueous solutions of n-
alcohols and fatty acids. Chemical Engineering Science 38, 9, 1501-1506.
Duchemin, L., Popinet, S., Josserand, C., and Zaleski, S., 2002. Jet formation in bubbles bursting
at a free surface. Physics of Fluids 14, 9, 3000-3008.
Duineveld, P.C., 1995. The rise velocity and shape of bubbles in pure water at high Reynolds
number. Journal of Fluid Mechanics 292, 325-332.
Dukhin, S.S., Miller, R., and Loglio, G., 1998. Physico-chemical hydrodynamics of rising
bubbles. In: Möbius, D., Miller, R. (Eds.), Studies in interfacial Science, Drops and Bubbles in
Interfacial Research, Elsevier Science 6, 367-432.
Dunne, R., 2012. Water water everywhere and not a drop to drink, nor do I know its
whereabouts. In: Drelich, J., Water in Mineral Processing: Proceedings of the First International
Symposium, Englewood, USA, 1-16.
Elmore, F.E., 1898. British Patent 21,948.
Fan, L.S., and Tsuchiya, K., 1990. Bubble wake dynamics in liquids and liquid-solid
suspensions, Butterworth and Heinemann, 363.
Finch, J.A., and Dobby, G.S., 1990. Column Flotation, Permagnon Press, Toronto.
Finch, J.A., Gelinas, S., and Moyo, P., 2006. Frother-related research at McGill University.
Minerals Engineering 19, 726-733.
Finch, J.A., Nesset, J.E., and Acuña, C., 2008. Role of frother in bubble production and
behaviour in flotation. Minerals Engineering 21, 949–957.
Foulk, C.W., and Miller, J.N., 1931. Experimental evidence in support of the balanced-layer
theory of liquid film formation. Industrial and Engineering Chemistry 23, 11, 1283-1288.
Frumkin, A., and Levich, V. G., 1947. On surfactants and interfacial motion. Zh. Fiz. Khim. 21,
1183.
140
Fuerstenau, D.W., 1999. The froth flotation century. In: Parekh, B. K., and Miller, J. D.
(Eds.). Advances in Flotation Technology. SME, 3-21.
Fuerstenau, D.W., 2007. A century of developments in the chemistry of flotation processing. In:
Fuerstenau, M.C., Jameson, G.J., and Yoon, R.H. (Eds.), Froth flotation: A Century of
Innovation. SME, 3-64.
Fuerstenau, D.W., and Wayman, C.H., 1958. Effect of chemical reagents on the motion of single
air bubbles in water. Mining Engineering, Transactions of AIME, 694-699.
Gallegos-Acevedo, P.M., Espinoza-Cuadra, J., Pérez-Garibay, R., and Pecina-Treviño, 2010.
Bubble Coalescence: Hydrophobic particles effect. Journal of Mining Science 46, 3, 333-337.
Garrett, P.R., 1993. Defoaming. Surfactant Science Series, volume 45, Marcel Dekker, New
York.
Gaudin, A.M., 1934. Flotation’s future beset with difficult problems. Engineering and Mining
Journal 135, 1, 29.
Gebrueder Bessel, 1877. Verfahren zur Reinigung von Graphit (process for the purification of
graphite). German patent 42, Class 22.
Gelinas, S., and Finch, J.A., 2005. Colorimetric determination of common industrial frothers.
Minerals Engineering 18, 2, 263-266.
Gélinas, S., and Finch, J.A., 2007. Frother analysis: Some plant experience. Minerals
Engineering 20, 14, 1303-1308.
George, C., 1996. Mt. Keith Operation. In: Grimsey, E.J., and Neuss, I. (Eds.), Nickel ’96,
Conference Series - Australasian Institute of Mining and Metallurgy, 6, 19-23.
Gomez, C.O., and Finch, J.A., 2002. Gas dispersion measurements in flotation machines. CIM
Bulletin 95, 1066, 73-78.
Gomez, C.O., and Finch, J.A., 2007. Gas dispersion measurements in flotation cells.
International Journal of Mineral Processing 84, 1-4, 51-58.
Gomez, C.O., Maldonado, M., Araya, R., and Finch, J.A., 2010. Frother and viscosity effects on
bubble shape and velocity. In: Pawlik, M. (Ed.), Proceedings of the 49th
Conference of
141
Metallurgists (COM): Rheology in Mineral Processing, The 8th
UBC - McGill - U of A
International Symposium on the Fundamentals of Mineral Processing, 57-74.
Gorain, B.K., Franzidis, J.P., and Manlapig, E.V., 1997. Studies on impeller type, impeller speed
and air flow rate in an industrial flotation cell. Part 4: Effect of bubble surface area flux on
flotation performance. Minerals Engineering 10, 4, 367-379.
Grace, J.R., 1973. Shapes and velocities of bubbles rising in infinite liquids. Transactions of the
Institute of Chemical Engineers 51, 116-120.
Grace, J.R., Wairegi, T., and Nguyen, T.H., 1976. Shapes and velocities of single drops and
bubbles moving freely through immiscible liquids. Transactions of the Institute of Chemical
Engineers 54, 167-173.
Grau, R.A., Laskowski, J.S., and Heiskanen, K., 2005. Effect of frothers on bubble size.
International Journal of Mineral Processing 76, 225-233.
Griffin, W.C., 1949. Classification of surface-active agents by HLB. Journal of the Society of
Cosmetic Chemists 1, 311, 1949.
Griffin, W.C., 1954. Calculation of HLB values of non-ionic surfactants. Journal of the Society
of Cosmetic Chemists 5, 259.
Haig-Smillie, L. D., 1974. Sea water flotation. In: Proceedings of the Canadian Mineral
Processors Conference, 263-281.
Haynes, W., 1860. British Patent 488.
Harper, J.F., 1972. The motion of bubbles and drops through liquids. In: Yih, C.-S. (Ed.),
Advances in Applied Mechanics. Vol. 12, Academic Press Inc., New York, 59-124.
Harris, P.J., 1982. Frothing phenomenon and frothers. In: King, R.P. (Ed.), Principles of
Flotation. Monograph Series No. 3. South African Institute of Mining and Metallurgy, 237–250.
Heiskanen, K., Javor, Z., Wierink, G., Omelka, B., and Schreithofer, N., 2012. Effect of frother
mobility on the bubble behaviour in bubble rise velocity measurements at the initial stages of
bubble formation. In: Young, C.A., and Luttrell, G.H. (Eds.), Separation Technologies: For
Minerals, Coal, and Earth Resources, SME, Englewood, USA, 1-5.
142
Helsby, F.W., and Tuson, K.R., 1955. Behaviour of air bubbles in aqueous solutions. Research 8,
270.
Henry, C.L., Parkinson, L., Ralston, J.R., and Craig, V.S.J., 2008. A mobile gas – water interface
in electrolyte solutions. The Journal of Physical Chemistry Letters C 112, 15094-15097.
Herman, J., and Mesler, R. 1987. Bubble entrainment from bursting bubbles. Journal of Colloid
and Interface Science 117, 565-569.
Hernandez-Aguilar, J.R., Gomez, C.O., and Finch, J.A., 2002. A technique for the direct
measurement of bubble size distributions in industrial flotation cells. In: Nesset, J.E. (Ed.),
Proceedings of the 34th
Annual Meeting of the Canadian Mineral Processors, 389-402.
Hernandez-Aguilar, J.R., Cunningham, R., and Finch, J.A., 2006. A test of the Tate equation to
predict bubble size at an orifice in the presence of frother. International Journal of Mineral
Processing 79, 2, 89-97.
Hesketh, R. P., Etchells, A.W., and Russell, T.W.F. 1991. Bubble breakage in pipeline flow.
Chemical Engineering Science 46, 1.
Hinze, J. O., 1955. Fundamentals of the hydrodynamic mechanism of splitting in dispersion
processes. AIChE Journal, 1, 3, 289-295.
Hofmeier, U., Yaminsky, V.V., and Christensen, H.K., 1995. Observations of solute effects on
bubble formation. Journal of Colloid and Interface Science 174, 199-210.
Hou, R., Hunt, A., and Williams, R.A., 1998, Acoustic monitoring of hydrocyclone performance.
Minerals Engineering 11, 11, 1047-1059.
Hunter, T.N., Pugh, R.J., Franks, G.V., and Jameson, G.J., 2008. The role of particles in
stabilizing foams and emulsions. Advances in Colloid and Interface Science 137, 57–81.
Ip, S.W., Wang, Y., and Toguri, J.M., 1999. Aluminum foam stabilization by solid particles.
Canadian Metallurgical Quarterly 38, 1, 81-92.
Jameson, G.J., 1984. Physics and hydrodynamics of bubbles. In: Ives, K.J. (Ed.), The Scientific
Basis of Flotation. Series E: Applied Sciences – No. 75. Martinus Nijhoff Publishers. Boston.
53-78.
143
Javor. Z., Scheithofer, N., and Heiskanen, K., 2012. The effect of bubble release techniques on
their behaviour at the initial stages of rise. Minerals Engineering 36-38, 254-261.
Johnson, B.D., and Gershet, R.M., 1991. Bubble formation at a cylindrical frit surface in a shear
field. Chemical Engineering Science 46, 2753-2756.
Karamanev, G.G., 1994. Rise of gas bubbles in quiescent liquids. AIChE 38, 1843-1846.
Khristov, K., Malysa, K., and Exerowa, D., 1984. Steady-state foams: Influence of the type of
liquid films. Colloids and Surfaces 11, 39-49.
Kim, J.W., and Lee, W.K., 1988. Coalescence behavior of two bubbles growing side-by-side.
Journal of Colloid and Interface Science 123, 1, 303-305.
Klimpel, R.R, and Isherwood, S., 1991. Some industrial implications of changing frother
chemical structure. International Journal of Mineral Processing 33, 369-381.
Kracht, W., and Finch, J.A., 2009. Bubble break-up and the role of frother and salt. International
Journal of Mineral Processing 92, 153–161.
Kracht, W., and Finch, J.A., 2009. Using sound to study bubble coalescence. Journal of Colloid
and Interface Science 332, 237–245.
Kracht, W., and Finch, J.A., 2010. Effect of frother on initial bubble shape and velocity.
International Journal of Mineral Processing 94, 115-120.
Kracht, W., and Rebolledo, H., 2013. Study of the local critical coalescence concentration (l-
CCC) of alcohols and salts at bubble formation in two-phase systems. Minerals Engineering 50-
51, 77-82.
Krzan, M., and Malysa, K., 2002a. Profiles of local velocities of bubbles in n-butanol, n-hexanol
and n-nonanol solutions. Colloids and Surfaces A: Physicochemical and Engineering Aspects
207, 279-291.
Krzan, M., and Malysa, K., 2002b. Influence of frother concentration on bubble dimensions and
rising velocities. Physicochemical Problems of Mineral Processing 36, 65-76.
Krzan, M., Lunkenheimer, K., and Malysa, K., 2004. On the influence of the surfactant’s polar
group on the local and terminal velocities of bubbles. Colloids and Surfaces A: Physicochemical
Engineering Aspects 250, 431-441.
144
Krzan, M., Zawala, J., and Malysa, K., 2007. Development of steady state adsorption distribution
over interface of a bubble rising in solutions of n-alkanols (C5, C8) and n-
alkyltrimethylammonium bromides (C8, C12, C16). Colloids and Surfaces A: Physicochemical
Engineering Aspects 298, 42-51.
Kuan, S.H., and Finch, J.A., 2010. Impact of talc on pulp and froth properties in F150 and 1-
pentanol frother systems. Minerals Engineering 23, 11, 1003-1009.
Kulkarni, R.D., Goddard, E.D., and Kanner, B., 1977. Mechanism of antifoaming: Role of filler
particle. Industrial & Engineering Chemistry Fundamentals 16, 4, 472-474.
Kulkarni, A.A., and Joshi, J.B., 2005. Bubble formation and bubble rise velocity in gas-liquid
systems: A review. Industrial and Engineering Chemistry Research 44, 5873-5931.
Kugou, N., Ishida, K., and Yoshida, A., 2003. Experimental study on motion of air bubbles in
seawater (terminal velocity and drag coefficient of air bubble rising in seawater). Transactions on
the Built Environment 68, 145-158.
Kupferberg, A. and G.J. Jameson, 1969. Bubble formation at a submerged orifice above a gas
chamber of finite volume. Transactions of the Institute of Chemical Engineers 47, T241-T250.
Kyriakides, N.K., Kasrinakis, E.G., Nychas, S.G., and Goulas, A., 1997. Bubbling from nozzles
submerged in water: Transitions between bubbling regimes. The Canadian Journal of Chemical
Engineering 75, 684-691.
Laskowski, J.S., 2004. Testing flotation frothers. Physicochemical Problems in Mineral
Processing 38, 13-34.
Laskowski, J.S., Cho, Y.S., and Ding, K., 2003a. Effect of frothers on bubble size and foam
stability in potash ore flotation systems. The Canadian Journal of Chemical Engineering 81, 63-
69.
Laskowski, J.S., Tlhone, T., Williams, P., and Ding, K., 2003b. Fundamental properties of the
polyoxypropylene alkyl ether flotation frothers. International Journal of Mineral Processing 72,
289–299.
Lee, C.-H., Herickson, L. E., and Glasgow, L. A., 1987. Bubble break-up and coalescence in
turbulent gas-liquid dispersion. Chemical Engineering Communications 59, 65-84.

145
Lee, J.S., Weon, B.M., Park, S.J., Le, J.H., Fezaa, K., and Lee, W.-K., 2011. Size limits the
formation of liquid jets during bubble bursting. Nature Communications 2, 367, 1-7.
Leighton, T.G., 1994. The Acoustic Bubble, Academic Press Inc., London.
Leighton, T.G., Fagan K.J., and Field, J.E., 1991. Acoustic and photographic studies of injected
bubbles. European Journal of Physics 12, 77-85.
Leighton, T.G., and Walton, A.J., 1987. An experimental study of the sound emitted from gas
bubbles in a liquid. European Journal of Physics 8, 2, 98-104.
Lekki, J., and Laskowski, J., 1975. A new concept of frothing in flotation systems and general
classification of flotation frothers. In: Proceedings of the 11th
International Mineral Processing
Congress, Cagliari, 429-448.
Lessard, R.D., and Zieminski, S.A., 1971. Bubble coalescence and gas transfer in aqueous
electrolytic solutions. Industrial and Engineering Chemistry Fundamentals 10, 260-289.
Levich, V.G., and Spalding, D.B., 1962. Physicochemical Hydrodynamics, Vol. 689, Englewood
Cliffs, NJ, Prentice-Hall.
Lewis, D., and Davidson, J.F., 1982. Bubble splitting in shear flow. Transactions of the
Institution of Chemical Engineers 60, 5, 283-291.
Lynch, A.J., Watt, J.S., Finch, J.A., and Harbort, G.E., 2007. History of flotation technology. In:
Fuerstenau, M.C., Jameson, G.J., and Yoon, R.H. (Eds.), Froth Flotation: A Century of
Innovation. SME, 65-92.
Maldonado, M., Quinn, J.J., Gomez, C.O., and Finch, J.A., 2013. An experimental study
examining the relationship between bubble shape and rise velocity. Chemical Engineering
Science 98, 7-11.
Malysa, K., 1992. Wet foams: Formation, properties and mechanism of stability. Advances in
Colloid and Interface Science 40, 37-83.
Malysa, K., and Pawlikowska-Czubak, J., 1975. Frothability and surface elasticity of aqueous
solutions of some frothers. Bulletin de l’Academie Polonaise des Sciences 5, 423-427.
Manasseh, R., Riboux, G., and Risso, F., 2008. Sound generation on bubble coalescence
following detachment. International Journal of Multiphase Flow 34, 10, 938-949.
146
Martinez-Bazan, C., Montanes, J.L., and Lasheras, J.C., 2000. Bubble size distribution resulting
from the break-up of an air cavity injected into a turbulent water jet. Physics of Fluids 12, 145–
148.
Marrucci, G., and Nicodemo, L., 1967. Coalescence of gas bubbles in aqueous solutions of
inorganic electrolytes. Chemical Engineering Science 22, 1257-1265.
Melo, F., and Laskowski, J.S., 2006. Fundamental properties of flotation frothers and their effect
on flotation. Minerals Engineering 19, 766-773.
Mendelson, H.D., 1967. The prediction of bubble terminal velocities from wave theory. A.I.Ch.E
Journal 13, 2, 250-253.
Minnaert, M., 1933. On musical air-bubbles and the sounds of running water. Philosophical
Magazine 16, 235–248.
Mitrovic, J., 1997. Formation of a liquid jet after detachment of a vapour bubble. International
Journal of Heat and Mass Transfer 40, 18, 4309-4317.
Miyahara, T., Iwata, M., and Takahashi, T., 1984. Bubble formation pattern with weeping at a
submerged orifice. Journal of Chemical Engineering of Japan 17, 592-597.
Miyahara, T., Tanimoto, M., and Takahashi, T., 1982. Bubble formation from an orifice at high
gas injection rates. Kagaku Kogaku Ronbunshu 8, 18-24.
Miyhara, T., Tsuchiya, K., and Fan, L-S, 1991. Effect of turbulent wakes on bubble–bubble
interaction in a gas–liquid–solids fluidized bed. Chemical Engineering Science 46, 9, 2368–
2373.
Moyo, P., Gomez, C.O., and Finch, J.A., 2006. Characterization of frothers by water carrying
rate. In: Xu, Z., and Liu, Q. (Eds.), Interfacial Phenomena in Fine Particle Technology, 6th UBC-
McGill UA International Symposium on Fundamentals of Mineral Processing, COM 2006,
Montreal, 133-146.
Moyo, P., Gomez, C.O., and Finch, J.A., 2007. Characterization frothers using water carrying
rate. Canadian Metallurgical Quarterly 46, 3, 215-220.
147
Nesset, J.E., 2008. 100 years of blowing bubbles for profit (with an emphasis on the bubbles).
Canadian Institute of Mining, Metallurgy and Petroleum, Distinguished Lecturer Presentation
2008-2009.
Nesset, J.E., 2011. Modeling the Sauter mean bubble diameter in mechanical, forced-air flotation
machines. Ph.D. Thesis, McGill University, Department of Mining and Materials Engineering.
Nesset, J.E., Finch, J.A., and Gomez, C.O., 2007. Operating variables affecting the bubble size in
forced-air mechanical flotation machines. In: Proceedings of the 9th
Mill Operators’ Conference,
Fremantle, WA, 55-66.
Nesset, J.E., Hernandez-Aguilar, J.R., Acuna, C., Gomez, C.O., and Finch, J.A., 2006. Some gas
dispersion characteristics of mechanical flotation machines. Minerals Engineering 19, 807-815.
Ng, K.Y., Law, E., Lim, M., and Ata, S., 2013. Influence of particle on the formation of bubbles
from a submerged capillary. In: Proceedings Flotation’13, Cape Town.
Nguyen, P.T., Hampton, M.A., Nguyen, A.V., and Birkett, G.R., 2012. The influence of gas
velocity, salt type and concentration on transition concentration for bubble coalescence inhibition
and gas holdup. Chemical Engineering Research and Design 90, 1, 33-39.
Nguyen, A.V., and Schulze, H.J. (eds.), 2004. Colloidal Science of Flotation, Surfactant science
series, vol. 118. Marcel Dekker. New York.
Ohnishi, M., Azuma, H., and Straub, J., 1999. Study on secondary bubble creation induced by
bubble coalescence. Advances in Space Research 24, 10, 1331-1336.
Okazaki, S., 1962. The velocity of air bubble ascending in aqueous solution of surface active
substance and inorganic electrolyte. Kolloid-Zeitschrift und Zeitschrit für Polymere, Band
185·Heft 2, 154-157.
Oosterwegel, G.G., and de Groot, H.J., 1980. On the possibility to measure volumes of small gas
bubbles and the bubble producing gas flow rates acoustically. Review of Scientific
Instrumentation 51, 2, 201-205.
Otake, T., Tone, S., Nakao, K., and Mitsuhashi, Y., 1977. Coalescence and breakup of bubbles in
liquids. Chemical Engineering Science 32, 4, 377-383.
148
Peng, Y., and Seaman, D., 2011. The flotation of slime-fine fractions of Mt. Keith pentlandite
ore in de-ionised and saline water. Minerals Engineering 24, 5, 479-481.
Perkins, C.L., and Sayre, R.E., 1921. Flotation of Minerals, United States Patent Office, serial
number 284,981. Publication number US1364308 A.
Peters, F., and Els, C., 2012. An experimental study on slow and fast bubbles in tap water.
Chemical Engineering Science 82, 194-199.
Pomianowski, A., Malysa, K., and Para, G., 1973. Annual Report for the Institute of Nonferrous
Metals, 6.
Prince, M.J., and Blanch, H.W., 1990. Bubble coalescence and break-up in air-sparged bubble
columns. AIChE Journal 36, 1485-1499.
Pugh, R.J., 1996. Foaming, foam films, antifoaming and defoaming. Advances in Colloid and
Interface Science 64, 67–142.
Pugh, R.J., 2007. The physics and chemistry of frothers. In: Fuerstenau, M.C., Jameson, G., and
Yoon, R.-H. (Eds.), Froth Flotation: A Century of Innovation, SME, Littleton, USA, 259-281.
Pugh, R.J., Weissenborn, P., and Paulson, O., 1997. Flotation in inorganic electrolytes; the
relationship between recovery of hydrophobic particles, surface tension, bubble coalescence and
gas solubility. International Journal of Mineral Processing 51, 125-138.
Quinn, J.J., and Finch, J.A., 2012. On the origin of bi-modal bubble size distributions in the
absence of frother. Minerals Engineering 36, 237-241.
Quinn, J.J., Kracht, W., Gomez, C.O., Gagnon, C., and Finch, J.A., 2007. Comparing the effects
of salts and frother (MIBC) on gas dispersion and froth properties. Minerals Engineering 20,
1296-1302.
Quinn, J.J., Maldonado, M., Gomez, C.O., and Finch, J.A., 2013. An experimental study on
bubble shape and rise velocity in frother, polymer and inorganic salt solutions, In: Proceedings of
the 52nd
Conference of Metallurgists (hosted by Materials Science & Technology (MS&T)
2013): Water and Energy in Mineral Processing, The 9th
UBC - McGill - U of A International
Symposium on the Fundamentals of Mineral Processing, The Metallurgical Society of CIM,
1981-1992.
149
Quinn, J.J., Sovechles, J.M., Finch, J.A., and Waters, K.E., 2014. Critical coalescence
concentrations of inorganic salt solutions. Minerals Engineering 58, 1-6.
Raymond, F., and Rosant, J.-M., 2000. A numerical and experimental study of the terminal
velocity and shape of bubbles in viscous liquids. Chemical Engineering Science 55, 943-955.
Remillard, M., Joseph, M., and Laroche, L., 2009. Municipal drinking water produced by
Atwater and Charles-J Des Baillets drinking water treatment plant: Annual Summary. Montreal:
Division de l’expertise technique.
Rickard, T.A. (Ed.), 1916. The Flotation Process, Mining and Scientific Press, Dewey Publishing
Company, San Francisco.
Riggs, W.F., 1986. Frothers - An Operator’s Guide. In: Chemical Reagents in the Mineral
Processing Industry, SME, 110-116.
Roberts, J.D., and Caserio, M.C., 1977, Basic Principles of Organic Chemistry, Second Edition,
W.A. Benjamin Inc.
Sam, A., Gomez, C.O., and Finch, J.A. 1996. Axial velocity profiles of single bubbles in
water/frother solutions. International Journal of Mineral Processing 47, 177-196.
Sato, A., Aoki, M., and Watanabe, M., 2010. Single rising bubble motion in aqueous solution of
electrolyte. Journal of Fluid Science and Technology 5, 1, 14-25.
Savic, P., 1953. Circulation and distortion of liquid drops falling through viscous medium.
Natural Resource Council of Canada, Div. of Mech. Eng., Rep. No. NRC-MT-22, 36.
Sevik, M., and Park, S.H., 1973. The splitting of drops and bubbles by turbulent fluid flow.
Journal of Fluids Engineering 95, 53-60.
Schäfer, R., Merten, C., and Eigenberger, G., 2002. Bubble size distributions in a column reactor
under industrial conditions. Experimental Thermal and Fluid Science 26, 595-604.
Smolianski, A., Haario, H., and Luukka, P., 2008. Numerical study of dynamics of single
bubbles and bubble swarms. Applied Mathematical Modelling 32, 641-659.
Spencer, S.J., Bruniges, R., Roberts, G., Sharp, V., Catanzano, A., Bruckard, W. J., Davey, K.J.,
and Zhang, W., 2012. An acoustic technique for measurement of bubble solids mass loading: (b)
150
Monitoring of Jameson cell flotation performance by passive acoustic emissions. Minerals
Engineering 36, 21-30.
Spencer, S.J., Bruniges, R., Sharp, V., Catanzano, V., Roberts, G., Bruckard, W.J., and Davey,
K., 2010. Acoustic emission monitoring of froth flotation. In: Proceedings of the XXV
International Mineral Processing Congress. AUSIMM, Melbourne, 3489-3500.
Stewart, C.W., 1995. Bubble interaction in low-viscosity liquids. International Journal of
Multiphase Flow 21, 1037-1046.
Stokes, G.G., 1851. On the effect of the internal friction of fluid on the motion of pendulums.
Transactions of the Cambridge Philosophical Society 9, 8.
Sweet, C., van Hoogstraten, J., Harris, M., and Laskowski, J.S., 1997. The effect of frothers on
bubble size and frothability of aqueous solutions. In: Finch, J.A., Rao, S.R., Holubec, I. (Eds.),
Processing of Complex Ores, 2nd UBC-McGill Symposium on Fundamentals in Mineral
Processing, The Metallurgical Society of CIM, 235–246.
Talaia, M.A.R., 2007. Terminal velocity of a bubble rise in a liquid column. World Academy of
Science, Engineering and Technology 28, 264-268.
Tan, S.N., Pugh, R.J., Fornasiero, D., Sedev, R., and Ralston, J., 2005. Foaming of
polypropylene glycols and glycol/MIBC mixtures. Minerals Engineering 18, 179-188.
Tan, S.N., Pugh, R.J., Fornasiero, D., Sedev, R., and Ralston, J., 2006. The interfacial
conformation of polypropylene glycols and their foam properties. Minerals Engineering 19, 703-
712.
Tan, Y.H., Rafiei, A.A, Elmahdy, A., and Finch, J.A., 2013. Bubble size, gas holdup and bubble
velocity profile of some alcohols and commercial frothers. International Journal of Mineral
Processing 119, 1-5.
Tate, T., 1864. On the magnitude of a drop of liquid formed under different circumstances. The
London, Edinburgh, and Dublin Philosophical Magazine and Journal of Science, 27, 181, 176-
180.
151
Tomiyama, A., 2002. Single bubbles in stagnant liquids and in linear shear flows (Keynote
Lecture). In: Prasser, H.-M. (Ed.), Proceedings of Measurement Techniques for Steady and
Transient Multiphase Flows, Rossendorf, September 18 – 20.
Tomiyama, A., Celata, G.P., Hosokawa, S., and Yoshida, S., 2002. Terminal velocity of single
bubbles in surface tension force dominant regime. International Journal of Multiphase Flow 28,
1497-1519.
Tomiyama, A., and Hayashi, K., 2011, Interface tracking and multi-fluid simulations of bubble
flows in bubble columns. The 8th International Conference on Computational Fluid Dynamics in
the Oil & Gas (Keynote Lecture), Metallurgical and Process Industries (CFD 2011), Trondheim,
Norway.
Tsang, Y.H., Koh, Y.-H., and Koch, D.L., 2004. Bubble-size dependence of the critical
electrolyte concentration for inhibition of coalescence. Journal of Colloid and Interface Science
275, 290-297.
Tse, K., Martin, T., McFarlane, C.M., and Nienow, A.W., 1998. Visualization of bubble
coalescence in a coalescence cell, a stirred tank and a bubble column, Chemical Engineering
Science 53, 23, 4031-4036.
Tse, K.L., Martin, T., McFarlane, C.M., and Nienow, A.W., 2003. Small bubble formation via a
coalescence dependent break-up mechanism. Chemical Engineering Science 58, 275-286.
Tucker, J.P., Deglon, D.A., Franzidis, J.P., Harris, M.C., and O’Connor, C.T., 1994. An
evaluation of direct method of bubble size distribution measurements in a laboratory batch
flotation cell. Minerals Engineering 7, 667-680.
Tuson, K.R., 1955. Single exposure photography of high speed event. British Journal of Applied
Physics 6, 99-100.
van Wijngaarden, L., and Veldhuis, C., 2008. On hydrodynamical properties of ellipsoidal
bubbles. Acta Mechanica 201, 37-46.
Vanegas, C., and Holtham, P., 2008. On-line froth acoustic emission measurements in industrial
sites. Minerals Engineering 21, 883–888.
152
Vanegas, C., and Holtham, P., 2010. Possibility for flotation acoustics monitoring - a review. In:
Proceedings of the XXV International Mineral Processing Congress. AUSIMM, Melbourne,
2457-2470.
Vera, M.A., Mathe, Z.T., Franzidis, J.-P., Harris, M.C., Manlapig, E.V., and O’Connor, C.T.,
2002. The modelling of froth zone recovery in batch and continuously operated laboratory
flotation cells. International Journal of Mineral Processing 64, 135-151.
Wang, B., and Peng, Y., 2013. The behaviour of mineral matter in fine coal flotation using saline
water. Fuel 109 309-315.
Wang, L., and Qu, X., 2012. Impact of interface approach velocity on bubble coalescence,
Minerals Engineering 26, 50-56.
Wentzell, P.D., and Wade, A. P., 1989. Chemical acoustic emission analysis in the frequency
domain. Analytical Chemistry 61, 2638-2642.
Wichterle, K., Sutná, K., and Večeř, M., 2009. Shape and rising velocity of bubbles. In: Markoš,
J. (Ed.), Proceedings: 36th
International Conference of Slovak Society of Chemical Engineering,
090-1 - 090-12.
Wilkinson, P.M., Van Schayk, A., and Spronken, J.P., 1993. The influence of gas density and
liquid properties on bubble breakup. Chemical Engineering Science, 48, 7, 1213-1226.
Wills, B.A., and Napier-Munn, T. (Eds.), 2006. Wills' Mineral Processing Technology: An
Introduction to the Practical Aspects of Ore Treatment and Mineral Recovery. Butterworth-
Heinemann, Burlington, USA.
Wu, M., and Gharib, M., 2002. Experimental studies on the shape and path of small air bubbles
rising in clean water. Physics of Fluids 14, 7, L49-L52.
Yañez, A.B., Morales, P., Coddou, F., Elgueta, H., Ortiz, J.M., Perez, C., Cortes, G., Gomez,
C.O., and Finch, J.A., 2009. Gas dispersion characterization of TANKCELL®-300 at
Chuquicamata concentrator. Conference of Metallurgists, Sudbury, 313-324.
Yoon, R.-H., and Sabey, J.B., 1989. Coal flotation in inorganic salt solutions. Surfactant Science
Series: Interfacial Phenomena in Coal Technology 32, 87-114.
153
Zahradnik, J., Fialová, M., and Linek, V., 1999. The effect of surface additives on bubble
coalescence in aqueous media. Chemical Engineering Science 54, 4757-4766.
Zeng, Y., and Forssberg, E., 1993. Monitoring Grinding parameters by signal measurements for
an industrial ball mill. International Journal of Mineral Processing 40, 1-16.
Zhang, F.H., and Thoroddsen, S.T., 2008. Satellite generation during bubble coalescence.
Physics of Fluids 20, 022104.
Zhang, L., and Shoji, M., 2001. Aperiodic bubble formation from a submerged orifice. Chemical
Engineering Science 56, 5371-5381.
Zhang, W., Nesset, J.E., Rao, R., and Finch, J.A., 2012a. Concentration (CCC)95-hydrophile-
lipophile balance (HLB) relationship. Minerals 2, 3, 208-227.
Zhang, W., Zhou, X., and Finch, J.A., 2012b. Determining independent control of dual-frother
systems – gas holdup, bubble size and water overflow rate. Minerals Engineering 39, 106-116.
Zhang, W., Nesset, J. E., Rao, R., and Finch, J. A., 2012. Characterizing frothers through critical
coalescence concentration (CCC) 95-hydrophile-lipophile balance (HLB) relationship. Minerals
2, 3, 208-227.
Zhang, Y., McLaughlin, J.B., and Finch, J.A., 2001. Bubble velocity profile and model of
surfactant mass transfer to bubble surface. Chemical Engineering Science 56, 6605-6616.
Zhou, Z.A., Egiebor, N.O., and Plitt, L.R., 1993. Frother effects on bubble size estimation in a
flotation column, Minerals Engineering 6, 1, 55-67.
Zieminski, S.A., Hume III, R.M., and Durham, R., 1976. Rates of oxygen transfer from air
bubbles to aqueous NaCl solutions at various temperatures. Marine Chemistry 4, 333-346.
Zieminski, S.A., and Lessard, R.D., 1969. Effects of chemical additives on performance of an
air-water contactor. I & EC Process Design and Development 8, 1, 69-75.
Zieminski, S.A., and Whittemore, R.C., 1971. Behavior of gas bubbles in aqueous electrolyte
solutions. Chemical Engineering Science 26, 509-520.

154
Appendices

155
Appendix 1 – Bubble coalescence and break-up data
Table A1.1 – Bubble coalescence and break-up data for MIBC solutions
[MIBC]
Complete Coalescence Transition Break-up Transition
1 2 3 Avg. 95%
CI 1 2 3 Avg.
95%
CI
mM ppm sccm
0.000 0 9 9 9 9.0 0.0 19 21 21 20.3 0.0
0.010 1 10 10 10 10.0 0.0 19 21 21 20.3 0.0
0.020 2 10 10 10 10.0 0.0 20 21 21 20.7 0.0
0.029 3 11 11 10 10.7 1.4 21 21 22 21.3 1.4
0.039 4 11 11 11 11.0 0.0 21 22 22 21.7 0.0
0.049 5 11 11 11 11.0 0.0 21 22 22 21.7 0.0
0.073 7.5 12 12 12 12.0 0.0 21 22 22 21.7 0.0
0.098 10 13 13 13 13.0 0.0 22 22 23 22.3 0.0
0.147 15 13 13 13 13.0 0.0 23 22 23 22.7 0.0
0.196 20 14 14 13 13.7 1.4 23 22 23 22.7 1.4
0.294 30 16 15 15 15.3 1.4 27 25 27 26.3 1.4
0.391 40 18 17 15 16.7 3.8 27 26 29 27.3 3.8
0.489 50 18 17 16 17.0 2.5 28 26 29 27.7 2.5
0.734 75 21 21 19 20.3 2.9 28 27 29 28.0 2.9
0.978 100 22 21 20 21.0 2.5 29 28 30 29.0 2.5
Table A1.2 – Bubble coalescence and break-up data for DF250 solutions
[DF250]
Complete
Coalescence
Transition
Break-up
Transition
mM ppm sccm
0.000 0 9 21
0.038 10 12 21
0.076 20 13 22
0.114 30 15 22
0.152 40 17 22
0.189 50 17 23
0.283 75 18 29
0.378 100 19 31
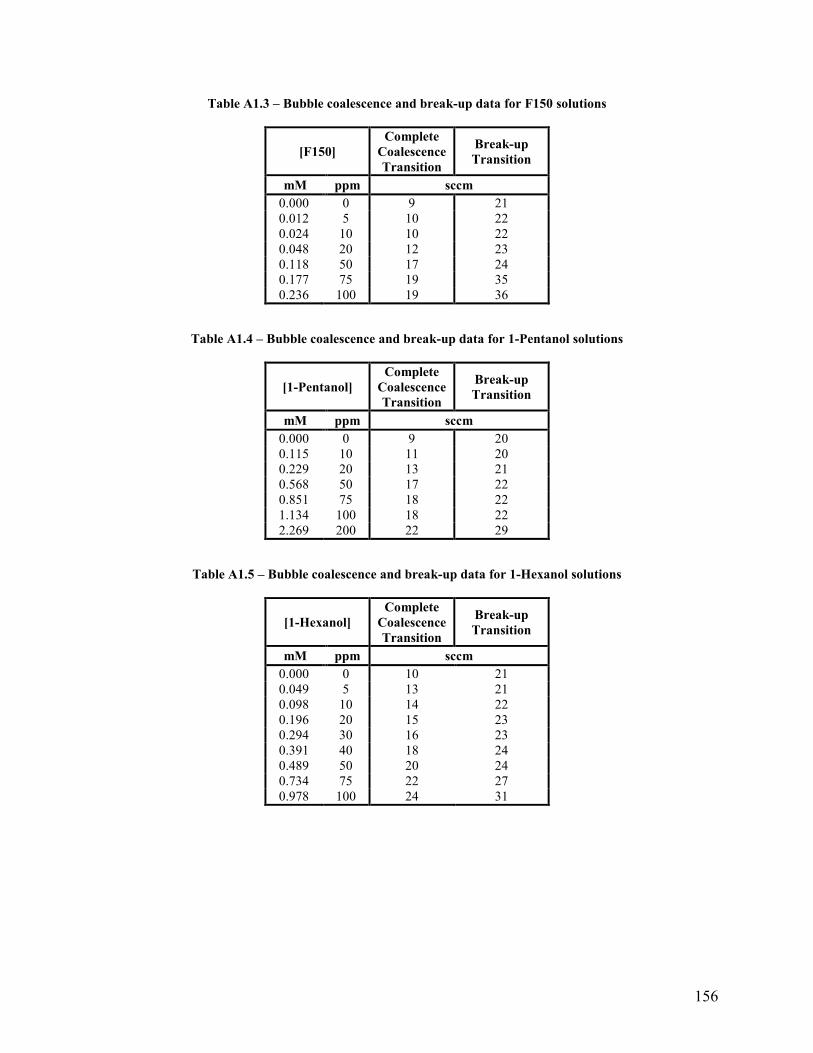
156
Table A1.3 – Bubble coalescence and break-up data for F150 solutions
[F150]
Complete
Coalescence
Transition
Break-up
Transition
mM ppm sccm
0.000 0 9 21
0.012 5 10 22
0.024 10 10 22
0.048 20 12 23
0.118 50 17 24
0.177 75 19 35
0.236 100 19 36
Table A1.4 – Bubble coalescence and break-up data for 1-Pentanol solutions
[1-Pentanol]
Complete
Coalescence
Transition
Break-up
Transition
mM ppm sccm
0.000 0 9 20
0.115 10 11 20
0.229 20 13 21
0.568 50 17 22
0.851 75 18 22
1.134 100 18 22
2.269 200 22 29
Table A1.5 – Bubble coalescence and break-up data for 1-Hexanol solutions
[1-Hexanol]
Complete
Coalescence
Transition
Break-up
Transition
mM ppm sccm
0.000 0 10 21
0.049 5 13 21
0.098 10 14 22
0.196 20 15 23
0.294 30 16 23
0.391 40 18 24
0.489 50 20 24
0.734 75 22 27
0.978 100 24 31
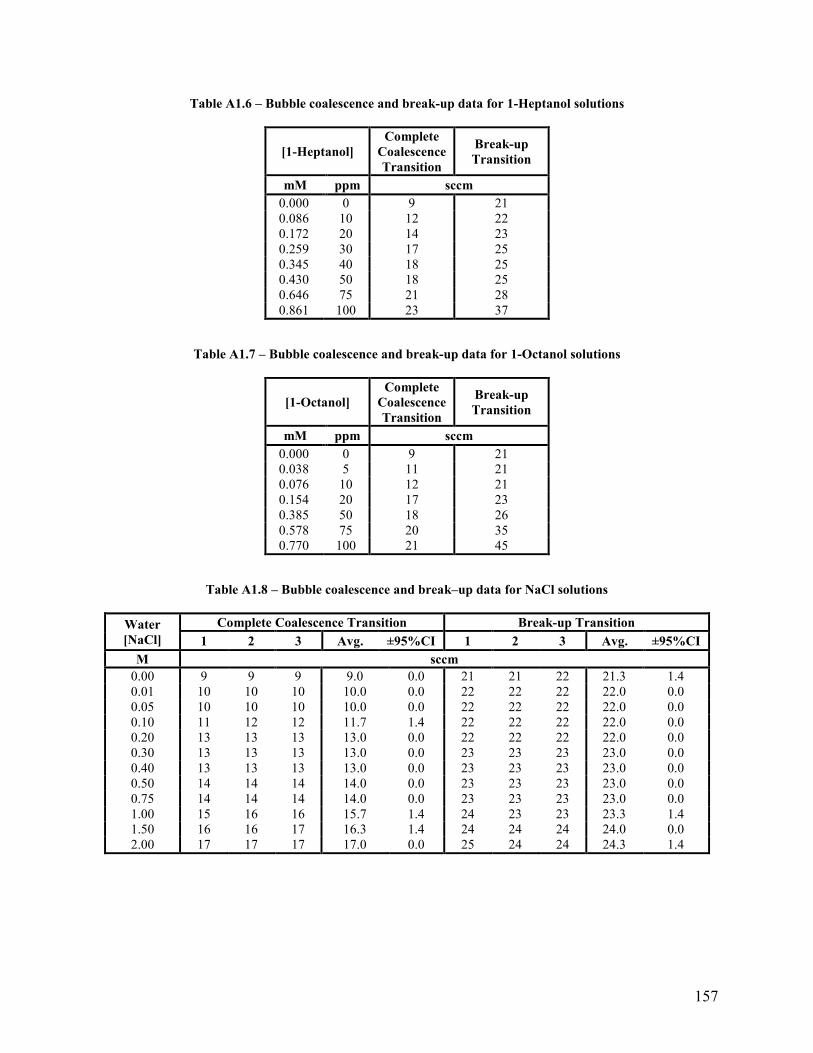
157
Table A1.6 – Bubble coalescence and break-up data for 1-Heptanol solutions
[1-Heptanol]
Complete
Coalescence
Transition
Break-up
Transition
mM ppm sccm
0.000 0 9 21
0.086 10 12 22
0.172 20 14 23
0.259 30 17 25
0.345 40 18 25
0.430 50 18 25
0.646 75 21 28
0.861 100 23 37
Table A1.7 – Bubble coalescence and break-up data for 1-Octanol solutions
[1-Octanol]
Complete
Coalescence
Transition
Break-up
Transition
mM ppm sccm
0.000 0 9 21
0.038 5 11 21
0.076 10 12 21
0.154 20 17 23
0.385 50 18 26
0.578 75 20 35
0.770 100 21 45
Table A1.8 – Bubble coalescence and break–up data for NaCl solutions
Water
[NaCl]
Complete Coalescence Transition Break-up Transition
1 2 3 Avg. ±95%CI 1 2 3 Avg. ±95%CI
M sccm
0.00 9 9 9 9.0 0.0 21 21 22 21.3 1.4
0.01 10 10 10 10.0 0.0 22 22 22 22.0 0.0
0.05 10 10 10 10.0 0.0 22 22 22 22.0 0.0
0.10 11 12 12 11.7 1.4 22 22 22 22.0 0.0
0.20 13 13 13 13.0 0.0 22 22 22 22.0 0.0
0.30 13 13 13 13.0 0.0 23 23 23 23.0 0.0
0.40 13 13 13 13.0 0.0 23 23 23 23.0 0.0
0.50 14 14 14 14.0 0.0 23 23 23 23.0 0.0
0.75 14 14 14 14.0 0.0 23 23 23 23.0 0.0
1.00 15 16 16 15.7 1.4 24 23 23 23.3 1.4
1.50 16 16 17 16.3 1.4 24 24 24 24.0 0.0
2.00 17 17 17 17.0 0.0 25 24 24 24.3 1.4
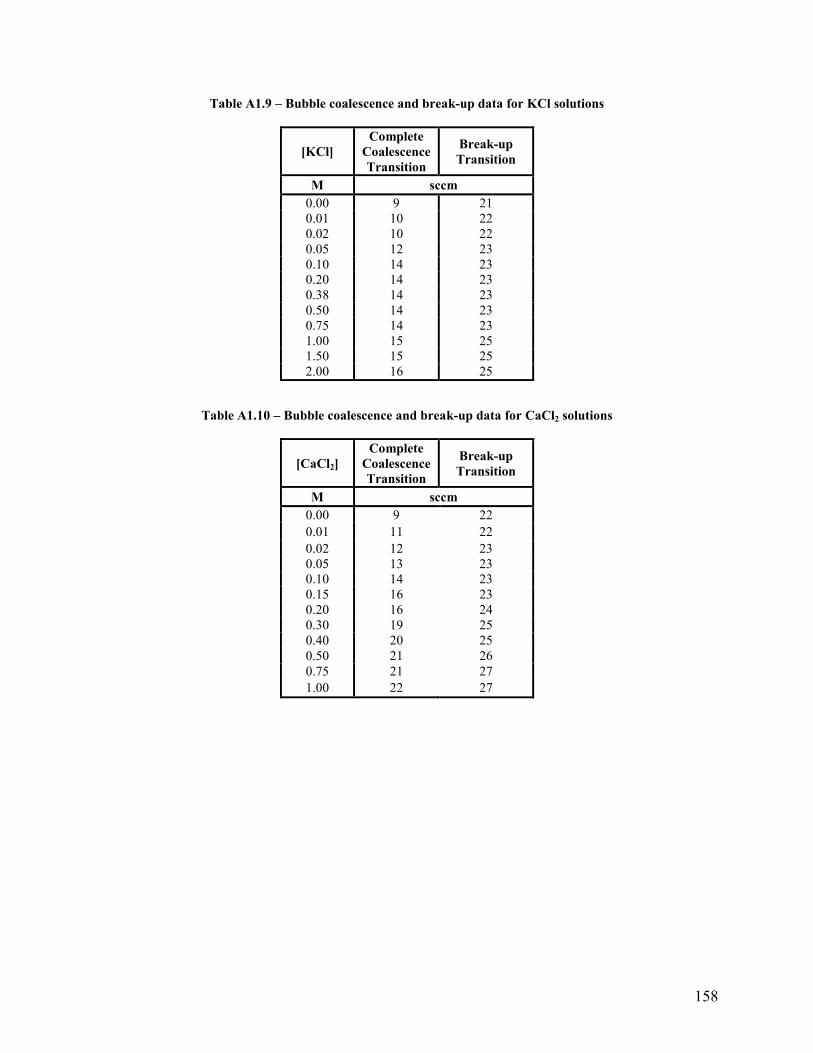
158
Table A1.9 – Bubble coalescence and break-up data for KCl solutions
[KCl]
Complete
Coalescence
Transition
Break-up
Transition
M sccm
0.00 9 21
0.01 10 22
0.02 10 22
0.05 12 23
0.10 14 23
0.20 14 23
0.38 14 23
0.50 14 23
0.75 14 23
1.00 15 25
1.50 15 25
2.00 16 25
Table A1.10 – Bubble coalescence and break-up data for CaCl2 solutions
[CaCl2]
Complete
Coalescence
Transition
Break-up
Transition
M sccm
0.00 9 22
0.01 11 22
0.02 12 23
0.05 13 23
0.10 14 23
0.15 16 23
0.20 16 24
0.30 19 25
0.40 20 25
0.50 21 26
0.75 21 27
1.00 22 27

159
Table A1.11 – Bubble coalescence and break-up data – Na2SO4
[Na2SO4]
Complete
Coalescence
Transition
Break-up
Transition
M sccm
0.00 9 22
0.05 10 23
0.10 11 24
0.20 13 24
0.30 13 25
0.40 15 25
0.50 15 25
0.75 19 25
1.00 20 27
Table A1.12 – Bubble coalescence and break-up data – MgSO4
[MgSO4]
Complete
Coalescence
Transition
Break-up
Transition
M sccm
0.00 9 22
0.01 10 22
0.02 10 23
0.05 11 23
0.10 13 23
0.15 14 23
0.20 15 23
0.30 16 24
0.40 17 24
0.50 19 25
0.75 21 26
1.00 21 28
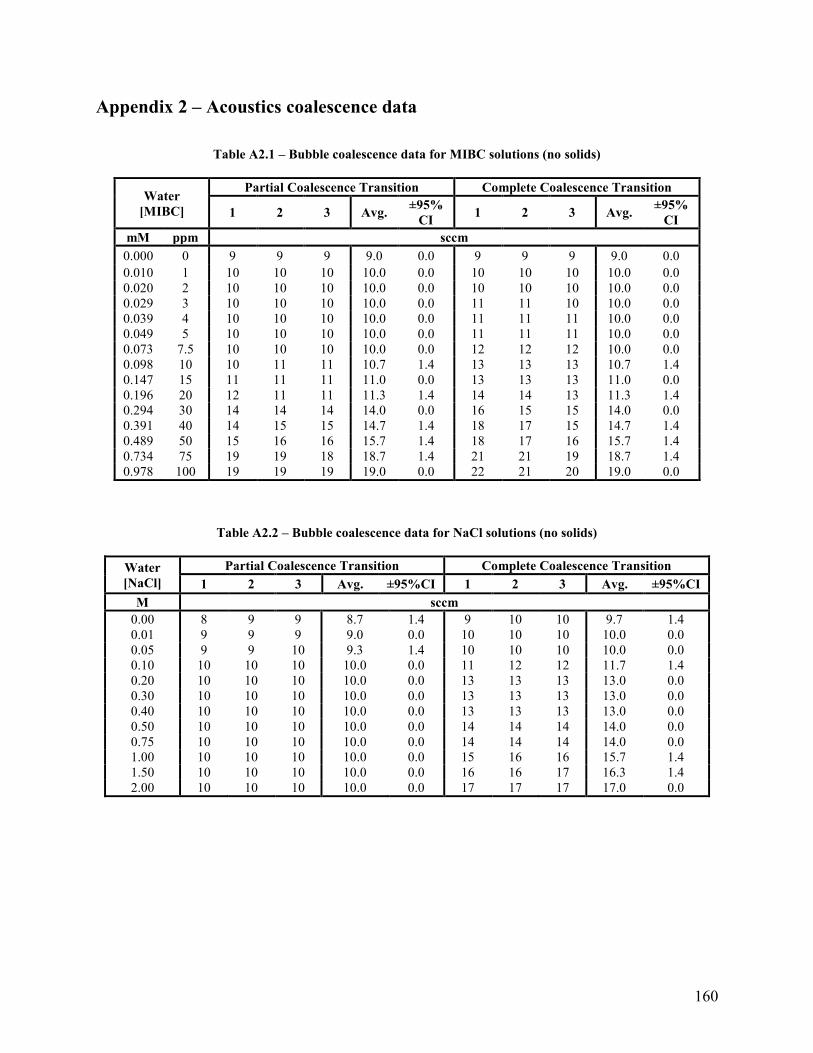
160
Appendix 2 – Acoustics coalescence data
Table A2.1 – Bubble coalescence data for MIBC solutions (no solids)
Water
[MIBC]
Partial Coalescence Transition Complete Coalescence Transition
1 2 3 Avg. ±95%
CI 1 2 3 Avg.
±95%
CI
mM ppm sccm
0.000 0 9 9 9 9.0 0.0 9 9 9 9.0 0.0
0.010 1 10 10 10 10.0 0.0 10 10 10 10.0 0.0
0.020 2 10 10 10 10.0 0.0 10 10 10 10.0 0.0
0.029 3 10 10 10 10.0 0.0 11 11 10 10.0 0.0
0.039 4 10 10 10 10.0 0.0 11 11 11 10.0 0.0
0.049 5 10 10 10 10.0 0.0 11 11 11 10.0 0.0
0.073 7.5 10 10 10 10.0 0.0 12 12 12 10.0 0.0
0.098 10 10 11 11 10.7 1.4 13 13 13 10.7 1.4
0.147 15 11 11 11 11.0 0.0 13 13 13 11.0 0.0
0.196 20 12 11 11 11.3 1.4 14 14 13 11.3 1.4
0.294 30 14 14 14 14.0 0.0 16 15 15 14.0 0.0
0.391 40 14 15 15 14.7 1.4 18 17 15 14.7 1.4
0.489 50 15 16 16 15.7 1.4 18 17 16 15.7 1.4
0.734 75 19 19 18 18.7 1.4 21 21 19 18.7 1.4
0.978 100 19 19 19 19.0 0.0 22 21 20 19.0 0.0
Table A2.2 – Bubble coalescence data for NaCl solutions (no solids)
Water
[NaCl]
Partial Coalescence Transition Complete Coalescence Transition
1 2 3 Avg. ±95%CI 1 2 3 Avg. ±95%CI
M sccm
0.00 8 9 9 8.7 1.4 9 10 10 9.7 1.4
0.01 9 9 9 9.0 0.0 10 10 10 10.0 0.0
0.05 9 9 10 9.3 1.4 10 10 10 10.0 0.0
0.10 10 10 10 10.0 0.0 11 12 12 11.7 1.4
0.20 10 10 10 10.0 0.0 13 13 13 13.0 0.0
0.30 10 10 10 10.0 0.0 13 13 13 13.0 0.0
0.40 10 10 10 10.0 0.0 13 13 13 13.0 0.0
0.50 10 10 10 10.0 0.0 14 14 14 14.0 0.0
0.75 10 10 10 10.0 0.0 14 14 14 14.0 0.0
1.00 10 10 10 10.0 0.0 15 16 16 15.7 1.4
1.50 10 10 10 10.0 0.0 16 16 17 16.3 1.4
2.00 10 10 10 10.0 0.0 17 17 17 17.0 0.0
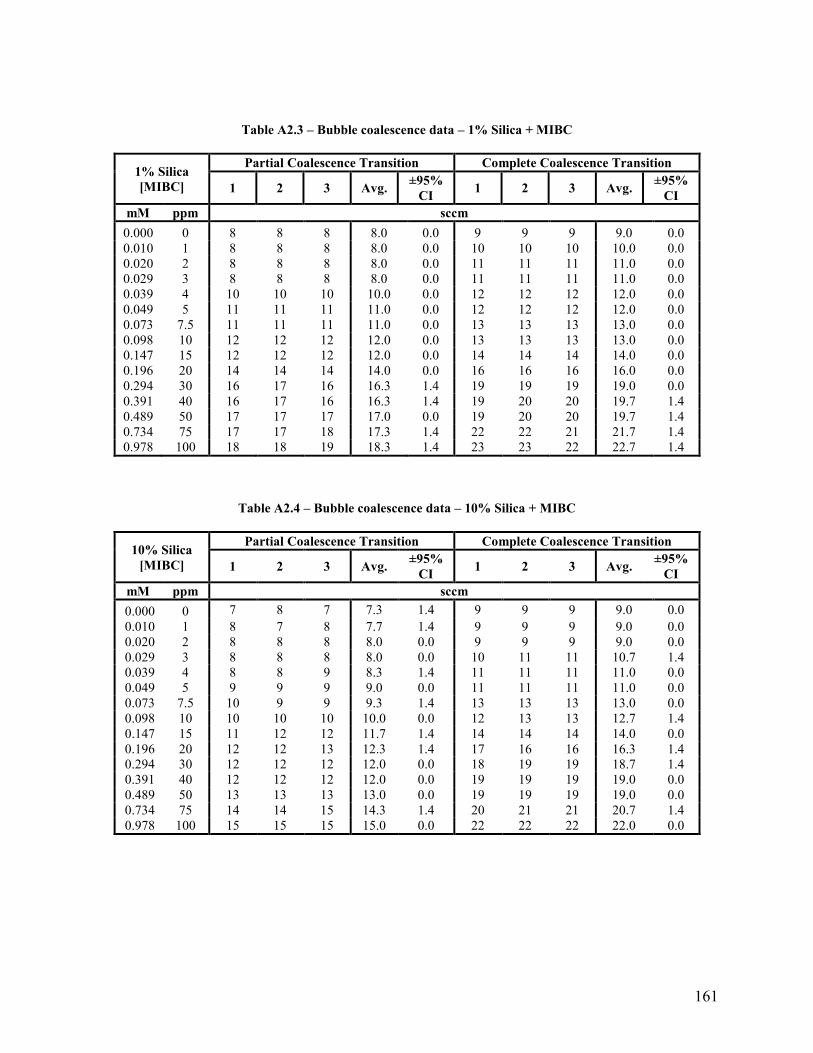
161
Table A2.3 – Bubble coalescence data – 1% Silica + MIBC
1% Silica
[MIBC]
Partial Coalescence Transition Complete Coalescence Transition
1 2 3 Avg. ±95%
CI 1 2 3 Avg.
±95%
CI
mM ppm sccm
0.000 0 8 8 8 8.0 0.0 9 9 9 9.0 0.0
0.010 1 8 8 8 8.0 0.0 10 10 10 10.0 0.0
0.020 2 8 8 8 8.0 0.0 11 11 11 11.0 0.0
0.029 3 8 8 8 8.0 0.0 11 11 11 11.0 0.0
0.039 4 10 10 10 10.0 0.0 12 12 12 12.0 0.0
0.049 5 11 11 11 11.0 0.0 12 12 12 12.0 0.0
0.073 7.5 11 11 11 11.0 0.0 13 13 13 13.0 0.0
0.098 10 12 12 12 12.0 0.0 13 13 13 13.0 0.0
0.147 15 12 12 12 12.0 0.0 14 14 14 14.0 0.0
0.196 20 14 14 14 14.0 0.0 16 16 16 16.0 0.0
0.294 30 16 17 16 16.3 1.4 19 19 19 19.0 0.0
0.391 40 16 17 16 16.3 1.4 19 20 20 19.7 1.4
0.489 50 17 17 17 17.0 0.0 19 20 20 19.7 1.4
0.734 75 17 17 18 17.3 1.4 22 22 21 21.7 1.4
0.978 100 18 18 19 18.3 1.4 23 23 22 22.7 1.4
Table A2.4 – Bubble coalescence data – 10% Silica + MIBC
10% Silica
[MIBC]
Partial Coalescence Transition Complete Coalescence Transition
1 2 3 Avg. ±95%
CI 1 2 3 Avg.
±95%
CI
mM ppm sccm
0.000 0 7 8 7 7.3 1.4 9 9 9 9.0 0.0
0.010 1 8 7 8 7.7 1.4 9 9 9 9.0 0.0
0.020 2 8 8 8 8.0 0.0 9 9 9 9.0 0.0
0.029 3 8 8 8 8.0 0.0 10 11 11 10.7 1.4
0.039 4 8 8 9 8.3 1.4 11 11 11 11.0 0.0
0.049 5 9 9 9 9.0 0.0 11 11 11 11.0 0.0
0.073 7.5 10 9 9 9.3 1.4 13 13 13 13.0 0.0
0.098 10 10 10 10 10.0 0.0 12 13 13 12.7 1.4
0.147 15 11 12 12 11.7 1.4 14 14 14 14.0 0.0
0.196 20 12 12 13 12.3 1.4 17 16 16 16.3 1.4
0.294 30 12 12 12 12.0 0.0 18 19 19 18.7 1.4
0.391 40 12 12 12 12.0 0.0 19 19 19 19.0 0.0
0.489 50 13 13 13 13.0 0.0 19 19 19 19.0 0.0
0.734 75 14 14 15 14.3 1.4 20 21 21 20.7 1.4
0.978 100 15 15 15 15.0 0.0 22 22 22 22.0 0.0
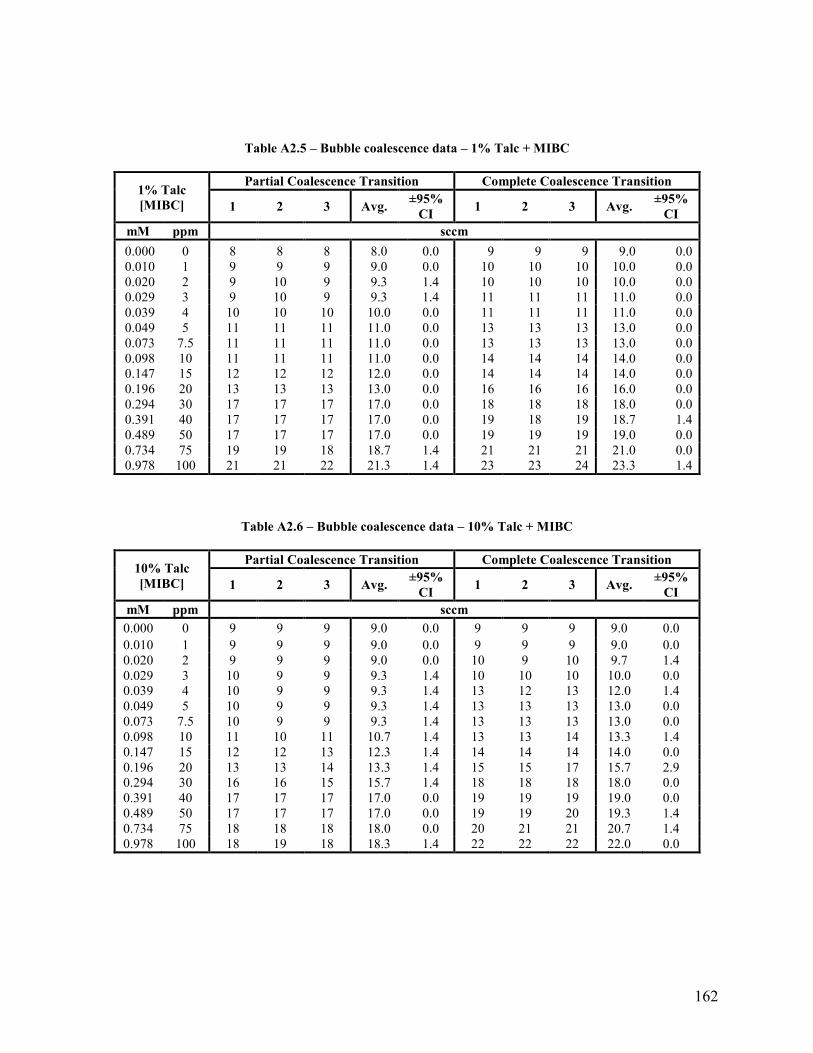
162
Table A2.5 – Bubble coalescence data – 1% Talc + MIBC
1% Talc
[MIBC]
Partial Coalescence Transition Complete Coalescence Transition
1 2 3 Avg. ±95%
CI 1 2 3 Avg.
±95%
CI
mM ppm sccm
0.000 0 8 8 8 8.0 0.0 9 9 9 9.0 0.0
0.010 1 9 9 9 9.0 0.0 10 10 10 10.0 0.0
0.020 2 9 10 9 9.3 1.4 10 10 10 10.0 0.0
0.029 3 9 10 9 9.3 1.4 11 11 11 11.0 0.0
0.039 4 10 10 10 10.0 0.0 11 11 11 11.0 0.0
0.049 5 11 11 11 11.0 0.0 13 13 13 13.0 0.0
0.073 7.5 11 11 11 11.0 0.0 13 13 13 13.0 0.0
0.098 10 11 11 11 11.0 0.0 14 14 14 14.0 0.0
0.147 15 12 12 12 12.0 0.0 14 14 14 14.0 0.0
0.196 20 13 13 13 13.0 0.0 16 16 16 16.0 0.0
0.294 30 17 17 17 17.0 0.0 18 18 18 18.0 0.0
0.391 40 17 17 17 17.0 0.0 19 18 19 18.7 1.4
0.489 50 17 17 17 17.0 0.0 19 19 19 19.0 0.0
0.734 75 19 19 18 18.7 1.4 21 21 21 21.0 0.0
0.978 100 21 21 22 21.3 1.4 23 23 24 23.3 1.4
Table A2.6 – Bubble coalescence data – 10% Talc + MIBC
10% Talc
[MIBC]
Partial Coalescence Transition Complete Coalescence Transition
1 2 3 Avg. ±95%
CI 1 2 3 Avg.
±95%
CI
mM ppm sccm
0.000 0 9 9 9 9.0 0.0 9 9 9 9.0 0.0
0.010 1 9 9 9 9.0 0.0 9 9 9 9.0 0.0
0.020 2 9 9 9 9.0 0.0 10 9 10 9.7 1.4
0.029 3 10 9 9 9.3 1.4 10 10 10 10.0 0.0
0.039 4 10 9 9 9.3 1.4 13 12 13 12.0 1.4
0.049 5 10 9 9 9.3 1.4 13 13 13 13.0 0.0
0.073 7.5 10 9 9 9.3 1.4 13 13 13 13.0 0.0
0.098 10 11 10 11 10.7 1.4 13 13 14 13.3 1.4
0.147 15 12 12 13 12.3 1.4 14 14 14 14.0 0.0
0.196 20 13 13 14 13.3 1.4 15 15 17 15.7 2.9
0.294 30 16 16 15 15.7 1.4 18 18 18 18.0 0.0
0.391 40 17 17 17 17.0 0.0 19 19 19 19.0 0.0
0.489 50 17 17 17 17.0 0.0 19 19 20 19.3 1.4
0.734 75 18 18 18 18.0 0.0 20 21 21 20.7 1.4
0.978 100 18 19 18 18.3 1.4 22 22 22 22.0 0.0
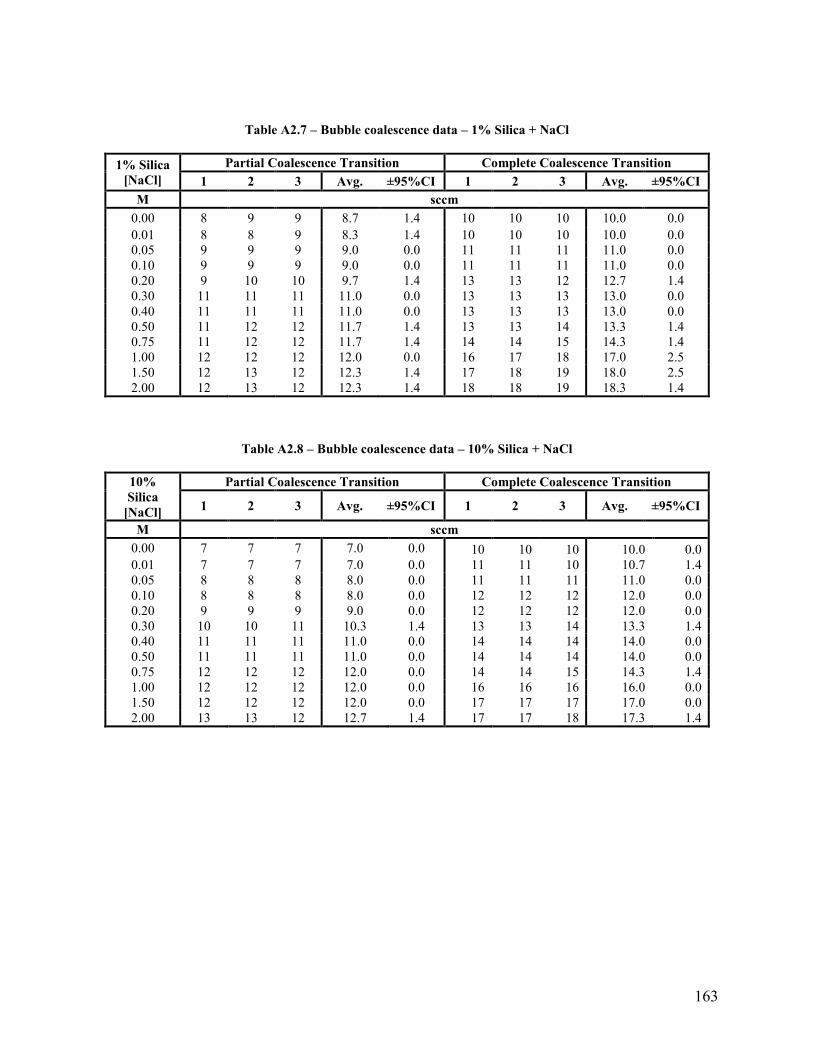
163
Table A2.7 – Bubble coalescence data – 1% Silica + NaCl
1% Silica
[NaCl]
Partial Coalescence Transition Complete Coalescence Transition
1 2 3 Avg. ±95%CI 1 2 3 Avg. ±95%CI
M sccm
0.00 8 9 9 8.7 1.4 10 10 10 10.0 0.0
0.01 8 8 9 8.3 1.4 10 10 10 10.0 0.0
0.05 9 9 9 9.0 0.0 11 11 11 11.0 0.0
0.10 9 9 9 9.0 0.0 11 11 11 11.0 0.0
0.20 9 10 10 9.7 1.4 13 13 12 12.7 1.4
0.30 11 11 11 11.0 0.0 13 13 13 13.0 0.0
0.40 11 11 11 11.0 0.0 13 13 13 13.0 0.0
0.50 11 12 12 11.7 1.4 13 13 14 13.3 1.4
0.75 11 12 12 11.7 1.4 14 14 15 14.3 1.4
1.00 12 12 12 12.0 0.0 16 17 18 17.0 2.5
1.50 12 13 12 12.3 1.4 17 18 19 18.0 2.5
2.00 12 13 12 12.3 1.4 18 18 19 18.3 1.4
Table A2.8 – Bubble coalescence data – 10% Silica + NaCl
10%
Silica
[NaCl]
Partial Coalescence Transition Complete Coalescence Transition
1 2 3 Avg. ±95%CI 1 2 3 Avg. ±95%CI
M sccm
0.00 7 7 7 7.0 0.0 10 10 10 10.0 0.0
0.01 7 7 7 7.0 0.0 11 11 10 10.7 1.4
0.05 8 8 8 8.0 0.0 11 11 11 11.0 0.0
0.10 8 8 8 8.0 0.0 12 12 12 12.0 0.0
0.20 9 9 9 9.0 0.0 12 12 12 12.0 0.0
0.30 10 10 11 10.3 1.4 13 13 14 13.3 1.4
0.40 11 11 11 11.0 0.0 14 14 14 14.0 0.0
0.50 11 11 11 11.0 0.0 14 14 14 14.0 0.0
0.75 12 12 12 12.0 0.0 14 14 15 14.3 1.4
1.00 12 12 12 12.0 0.0 16 16 16 16.0 0.0
1.50 12 12 12 12.0 0.0 17 17 17 17.0 0.0
2.00 13 13 12 12.7 1.4 17 17 18 17.3 1.4
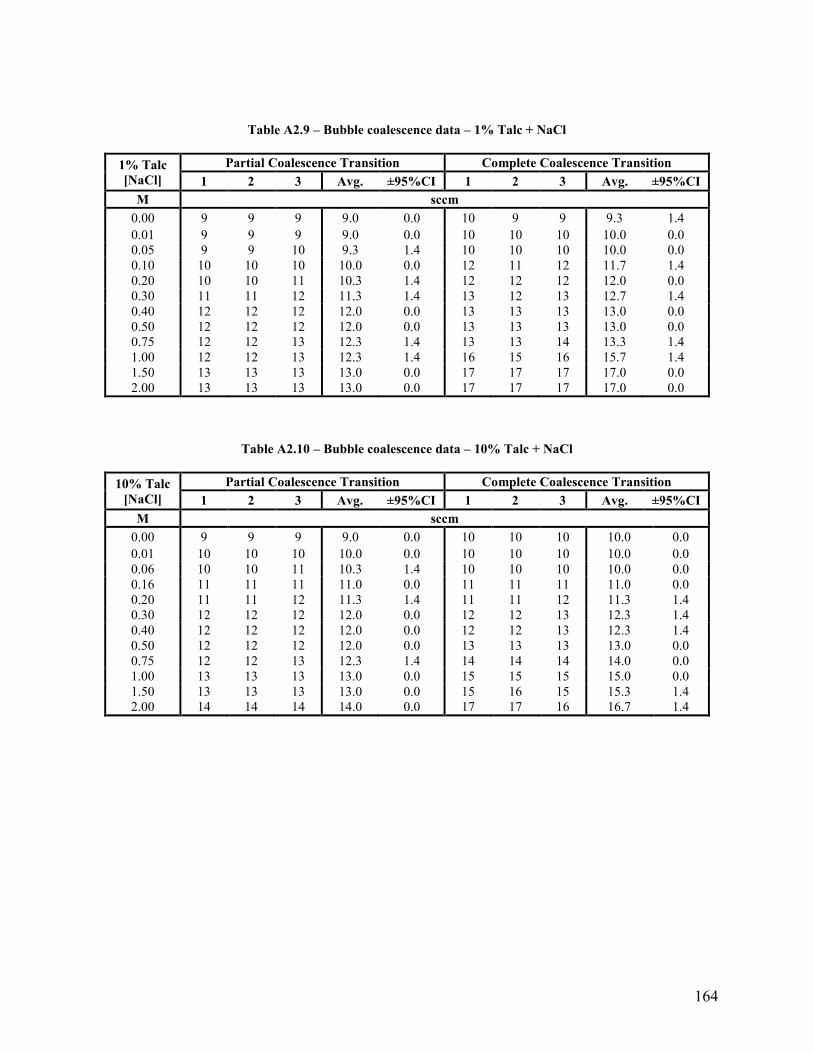
164
Table A2.9 – Bubble coalescence data – 1% Talc + NaCl
1% Talc
[NaCl]
Partial Coalescence Transition Complete Coalescence Transition
1 2 3 Avg. ±95%CI 1 2 3 Avg. ±95%CI
M sccm
0.00 9 9 9 9.0 0.0 10 9 9 9.3 1.4
0.01 9 9 9 9.0 0.0 10 10 10 10.0 0.0
0.05 9 9 10 9.3 1.4 10 10 10 10.0 0.0
0.10 10 10 10 10.0 0.0 12 11 12 11.7 1.4
0.20 10 10 11 10.3 1.4 12 12 12 12.0 0.0
0.30 11 11 12 11.3 1.4 13 12 13 12.7 1.4
0.40 12 12 12 12.0 0.0 13 13 13 13.0 0.0
0.50 12 12 12 12.0 0.0 13 13 13 13.0 0.0
0.75 12 12 13 12.3 1.4 13 13 14 13.3 1.4
1.00 12 12 13 12.3 1.4 16 15 16 15.7 1.4
1.50 13 13 13 13.0 0.0 17 17 17 17.0 0.0
2.00 13 13 13 13.0 0.0 17 17 17 17.0 0.0
Table A2.10 – Bubble coalescence data – 10% Talc + NaCl
10% Talc
[NaCl]
Partial Coalescence Transition Complete Coalescence Transition
1 2 3 Avg. ±95%CI 1 2 3 Avg. ±95%CI
M sccm
0.00 9 9 9 9.0 0.0 10 10 10 10.0 0.0
0.01 10 10 10 10.0 0.0 10 10 10 10.0 0.0
0.06 10 10 11 10.3 1.4 10 10 10 10.0 0.0
0.16 11 11 11 11.0 0.0 11 11 11 11.0 0.0
0.20 11 11 12 11.3 1.4 11 11 12 11.3 1.4
0.30 12 12 12 12.0 0.0 12 12 13 12.3 1.4
0.40 12 12 12 12.0 0.0 12 12 13 12.3 1.4
0.50 12 12 12 12.0 0.0 13 13 13 13.0 0.0
0.75 12 12 13 12.3 1.4 14 14 14 14.0 0.0
1.00 13 13 13 13.0 0.0 15 15 15 15.0 0.0
1.50 13 13 13 13.0 0.0 15 16 15 15.3 1.4
2.00 14 14 14 14.0 0.0 17 17 16 16.7 1.4
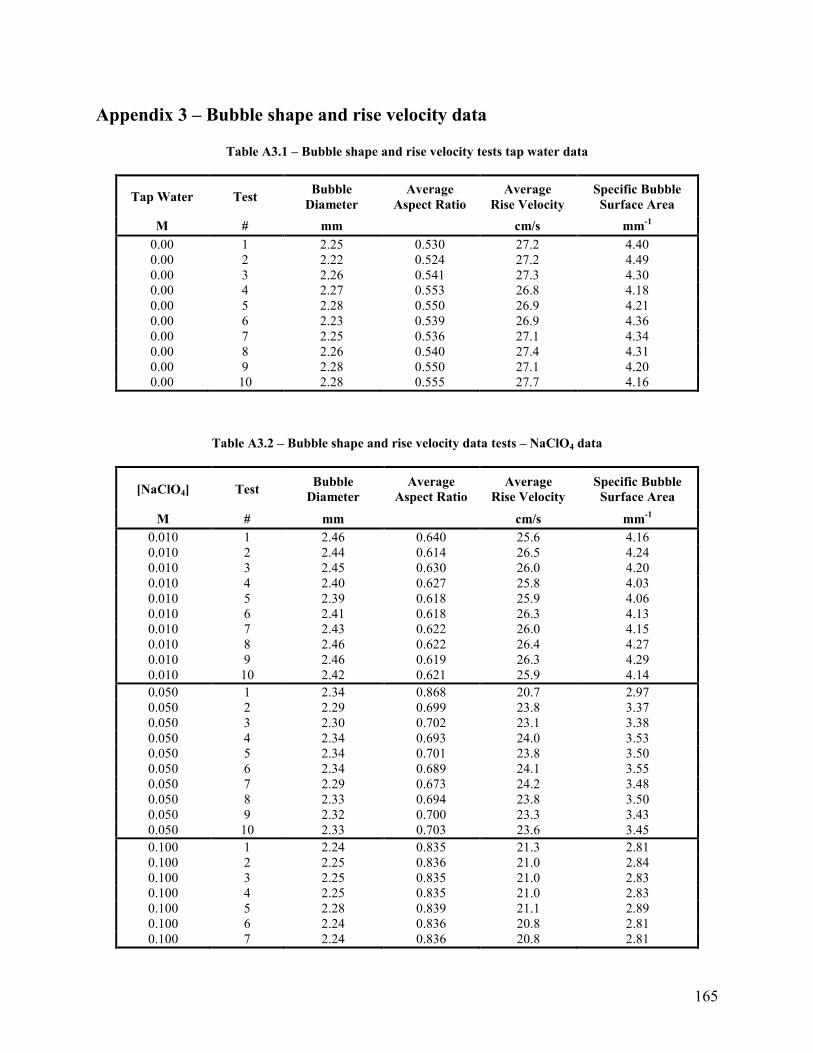
165
Appendix 3 – Bubble shape and rise velocity data
Table A3.1 – Bubble shape and rise velocity tests tap water data
Tap Water Test Bubble
Diameter
Average
Aspect Ratio
Average
Rise Velocity
Specific Bubble
Surface Area
M # mm cm/s mm-1
0.00 1 2.25 0.530 27.2 4.40
0.00 2 2.22 0.524 27.2 4.49
0.00 3 2.26 0.541 27.3 4.30
0.00 4 2.27 0.553 26.8 4.18
0.00 5 2.28 0.550 26.9 4.21
0.00 6 2.23 0.539 26.9 4.36
0.00 7 2.25 0.536 27.1 4.34
0.00 8 2.26 0.540 27.4 4.31
0.00 9 2.28 0.550 27.1 4.20
0.00 10 2.28 0.555 27.7 4.16
Table A3.2 – Bubble shape and rise velocity data tests – NaClO4 data
[NaClO4] Test Bubble
Diameter
Average
Aspect Ratio
Average
Rise Velocity
Specific Bubble
Surface Area
M # mm cm/s mm-1
0.010 1 2.46 0.640 25.6 4.16
0.010 2 2.44 0.614 26.5 4.24
0.010 3 2.45 0.630 26.0 4.20
0.010 4 2.40 0.627 25.8 4.03
0.010 5 2.39 0.618 25.9 4.06
0.010 6 2.41 0.618 26.3 4.13
0.010 7 2.43 0.622 26.0 4.15
0.010 8 2.46 0.622 26.4 4.27
0.010 9 2.46 0.619 26.3 4.29
0.010 10 2.42 0.621 25.9 4.14
0.050 1 2.34 0.868 20.7 2.97
0.050 2 2.29 0.699 23.8 3.37
0.050 3 2.30 0.702 23.1 3.38
0.050 4 2.34 0.693 24.0 3.53
0.050 5 2.34 0.701 23.8 3.50
0.050 6 2.34 0.689 24.1 3.55
0.050 7 2.29 0.673 24.2 3.48
0.050 8 2.33 0.694 23.8 3.50
0.050 9 2.32 0.700 23.3 3.43
0.050 10 2.33 0.703 23.6 3.45
0.100 1 2.24 0.835 21.3 2.81
0.100 2 2.25 0.836 21.0 2.84
0.100 3 2.25 0.835 21.0 2.83
0.100 4 2.25 0.835 21.0 2.83
0.100 5 2.28 0.839 21.1 2.89
0.100 6 2.24 0.836 20.8 2.81
0.100 7 2.24 0.836 20.8 2.81
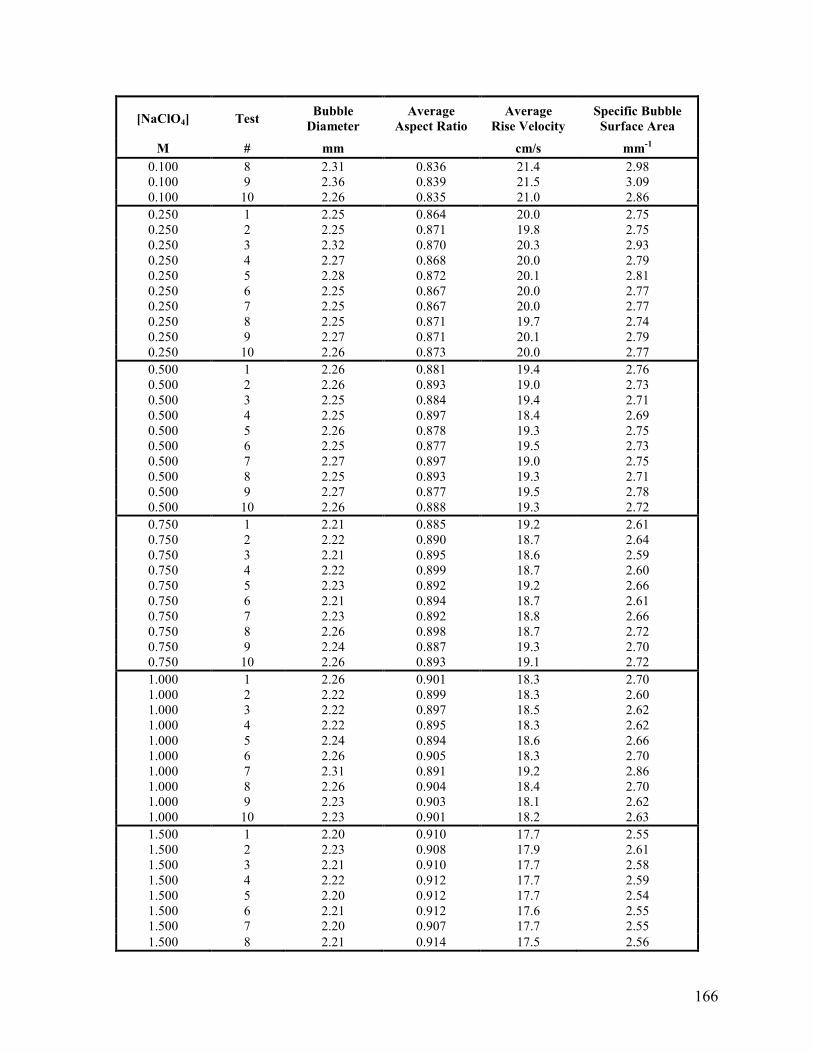
166
[NaClO4] Test Bubble
Diameter
Average
Aspect Ratio
Average
Rise Velocity
Specific Bubble
Surface Area
M # mm cm/s mm-1
0.100
0.100
8
9
2.31
2.36
0.836
0.839
21.4
21.5
2.98
3.09
0.100 10 2.26 0.835 21.0 2.86
0.250 1 2.25 0.864 20.0 2.75
0.250 2 2.25 0.871 19.8 2.75
0.250 3 2.32 0.870 20.3 2.93
0.250 4 2.27 0.868 20.0 2.79
0.250 5 2.28 0.872 20.1 2.81
0.250 6 2.25 0.867 20.0 2.77
0.250 7 2.25 0.867 20.0 2.77
0.250 8 2.25 0.871 19.7 2.74
0.250 9 2.27 0.871 20.1 2.79
0.250 10 2.26 0.873 20.0 2.77
0.500 1 2.26 0.881 19.4 2.76
0.500 2 2.26 0.893 19.0 2.73
0.500 3 2.25 0.884 19.4 2.71
0.500 4 2.25 0.897 18.4 2.69
0.500 5 2.26 0.878 19.3 2.75
0.500 6 2.25 0.877 19.5 2.73
0.500 7 2.27 0.897 19.0 2.75
0.500 8 2.25 0.893 19.3 2.71
0.500 9 2.27 0.877 19.5 2.78
0.500 10 2.26 0.888 19.3 2.72
0.750 1 2.21 0.885 19.2 2.61
0.750 2 2.22 0.890 18.7 2.64
0.750 3 2.21 0.895 18.6 2.59
0.750 4 2.22 0.899 18.7 2.60
0.750 5 2.23 0.892 19.2 2.66
0.750 6 2.21 0.894 18.7 2.61
0.750 7 2.23 0.892 18.8 2.66
0.750 8 2.26 0.898 18.7 2.72
0.750 9 2.24 0.887 19.3 2.70
0.750 10 2.26 0.893 19.1 2.72
1.000 1 2.26 0.901 18.3 2.70
1.000 2 2.22 0.899 18.3 2.60
1.000 3 2.22 0.897 18.5 2.62
1.000 4 2.22 0.895 18.3 2.62
1.000 5 2.24 0.894 18.6 2.66
1.000 6 2.26 0.905 18.3 2.70
1.000 7 2.31 0.891 19.2 2.86
1.000 8 2.26 0.904 18.4 2.70
1.000 9 2.23 0.903 18.1 2.62
1.000 10 2.23 0.901 18.2 2.63
1.500 1 2.20 0.910 17.7 2.55
1.500 2 2.23 0.908 17.9 2.61
1.500 3 2.21 0.910 17.7 2.58
1.500 4 2.22 0.912 17.7 2.59
1.500 5 2.20 0.912 17.7 2.54
1.500 6 2.21 0.912 17.6 2.55
1.500 7 2.20 0.907 17.7 2.55
1.500 8 2.21 0.914 17.5 2.56
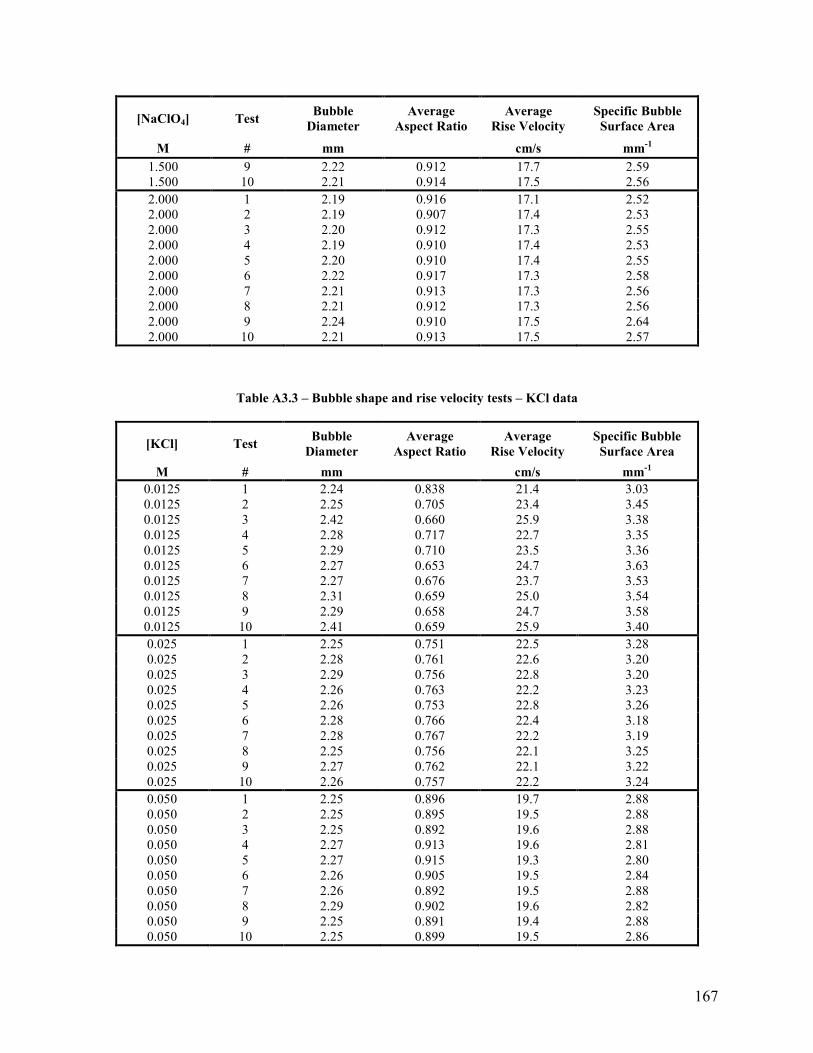
167
[NaClO4] Test Bubble
Diameter
Average
Aspect Ratio
Average
Rise Velocity
Specific Bubble
Surface Area
M # mm cm/s mm-1
1.500
1.500
9
10
2.22
2.21
0.912
0.914
17.7
17.5
2.59
2.56
2.000 1 2.19 0.916 17.1 2.52
2.000 2 2.19 0.907 17.4 2.53
2.000 3 2.20 0.912 17.3 2.55
2.000 4 2.19 0.910 17.4 2.53
2.000 5 2.20 0.910 17.4 2.55
2.000 6 2.22 0.917 17.3 2.58
2.000 7 2.21 0.913 17.3 2.56
2.000 8 2.21 0.912 17.3 2.56
2.000 9 2.24 0.910 17.5 2.64
2.000 10 2.21 0.913 17.5 2.57
Table A3.3 – Bubble shape and rise velocity tests – KCl data
[KCl] Test Bubble
Diameter
Average
Aspect Ratio
Average
Rise Velocity
Specific Bubble
Surface Area
M # mm cm/s mm-1
0.0125 1 2.24 0.838 21.4 3.03
0.0125 2 2.25 0.705 23.4 3.45
0.0125 3 2.42 0.660 25.9 3.38
0.0125 4 2.28 0.717 22.7 3.35
0.0125 5 2.29 0.710 23.5 3.36
0.0125 6 2.27 0.653 24.7 3.63
0.0125 7 2.27 0.676 23.7 3.53
0.0125 8 2.31 0.659 25.0 3.54
0.0125 9 2.29 0.658 24.7 3.58
0.0125 10 2.41 0.659 25.9 3.40
0.025 1 2.25 0.751 22.5 3.28
0.025 2 2.28 0.761 22.6 3.20
0.025 3 2.29 0.756 22.8 3.20
0.025 4 2.26 0.763 22.2 3.23
0.025 5 2.26 0.753 22.8 3.26
0.025 6 2.28 0.766 22.4 3.18
0.025 7 2.28 0.767 22.2 3.19
0.025 8 2.25 0.756 22.1 3.25
0.025 9 2.27 0.762 22.1 3.22
0.025 10 2.26 0.757 22.2 3.24
0.050 1 2.25 0.896 19.7 2.88
0.050 2 2.25 0.895 19.5 2.88
0.050 3 2.25 0.892 19.6 2.88
0.050 4 2.27 0.913 19.6 2.81
0.050 5 2.27 0.915 19.3 2.80
0.050 6 2.26 0.905 19.5 2.84
0.050 7 2.26 0.892 19.5 2.88
0.050 8 2.29 0.902 19.6 2.82
0.050 9 2.25 0.891 19.4 2.88
0.050 10 2.25 0.899 19.5 2.86
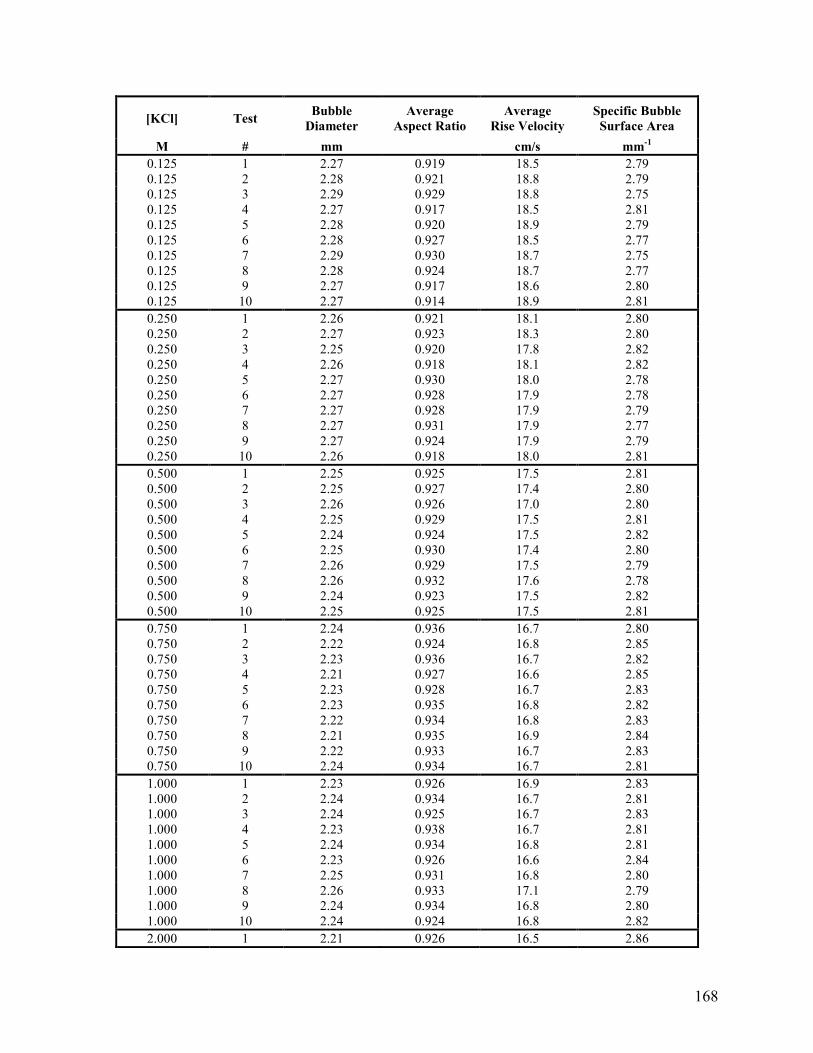
168
[KCl] Test Bubble
Diameter
Average
Aspect Ratio
Average
Rise Velocity
Specific Bubble
Surface Area
M # mm cm/s mm-1
0.125 1 2.27 0.919 18.5 2.79
0.125 2 2.28 0.921 18.8 2.79
0.125 3 2.29 0.929 18.8 2.75
0.125 4 2.27 0.917 18.5 2.81
0.125 5 2.28 0.920 18.9 2.79
0.125 6 2.28 0.927 18.5 2.77
0.125 7 2.29 0.930 18.7 2.75
0.125 8 2.28 0.924 18.7 2.77
0.125 9 2.27 0.917 18.6 2.80
0.125 10 2.27 0.914 18.9 2.81
0.250 1 2.26 0.921 18.1 2.80
0.250 2 2.27 0.923 18.3 2.80
0.250 3 2.25 0.920 17.8 2.82
0.250 4 2.26 0.918 18.1 2.82
0.250 5 2.27 0.930 18.0 2.78
0.250 6 2.27 0.928 17.9 2.78
0.250 7 2.27 0.928 17.9 2.79
0.250 8 2.27 0.931 17.9 2.77
0.250 9 2.27 0.924 17.9 2.79
0.250 10 2.26 0.918 18.0 2.81
0.500 1 2.25 0.925 17.5 2.81
0.500 2 2.25 0.927 17.4 2.80
0.500 3 2.26 0.926 17.0 2.80
0.500 4 2.25 0.929 17.5 2.81
0.500 5 2.24 0.924 17.5 2.82
0.500 6 2.25 0.930 17.4 2.80
0.500 7 2.26 0.929 17.5 2.79
0.500 8 2.26 0.932 17.6 2.78
0.500 9 2.24 0.923 17.5 2.82
0.500 10 2.25 0.925 17.5 2.81
0.750 1 2.24 0.936 16.7 2.80
0.750 2 2.22 0.924 16.8 2.85
0.750 3 2.23 0.936 16.7 2.82
0.750 4 2.21 0.927 16.6 2.85
0.750 5 2.23 0.928 16.7 2.83
0.750 6 2.23 0.935 16.8 2.82
0.750 7 2.22 0.934 16.8 2.83
0.750 8 2.21 0.935 16.9 2.84
0.750 9 2.22 0.933 16.7 2.83
0.750 10 2.24 0.934 16.7 2.81
1.000 1 2.23 0.926 16.9 2.83
1.000 2 2.24 0.934 16.7 2.81
1.000 3 2.24 0.925 16.7 2.83
1.000 4 2.23 0.938 16.7 2.81
1.000 5 2.24 0.934 16.8 2.81
1.000 6 2.23 0.926 16.6 2.84
1.000 7 2.25 0.931 16.8 2.80
1.000 8 2.26 0.933 17.1 2.79
1.000 9 2.24 0.934 16.8 2.80
1.000 10 2.24 0.924 16.8 2.82
2.000 1 2.21 0.926 16.5 2.86

169
[KCl] Test Bubble
Diameter
Average
Aspect Ratio
Average
Rise Velocity
Specific Bubble
Surface Area
M # mm cm/s mm-1
2.000 2 2.21 0.924 16.6 2.87
2.000 3 2.22 0.935 16.5 2.83
2.000 4 2.21 0.924 16.6 2.87
2.000 5 2.22 0.934 16.7 2.83
2.000 6 2.21 0.929 16.6 2.85
2.000 7 2.22 0.937 16.4 2.83
2.000 8 2.21 0.927 16.5 2.85
2.000 9 2.21 0.927 16.5 2.86
2.000 10 2.21 0.932 16.6 2.84
Table A3.4 – Bubble shape and rise velocity tests - NaCl data
[NaCl] Test # Bubble
Diameter
Average
Aspect Ratio
Average
Rise Velocity
Specific Bubble
Surface Area
M mm cm/s mm-1
0.010 1 2.35 0.733 24.3 3.20
0.010 2 2.32 0.912 18.9 2.76
0.010 3 2.33 0.926 19.1 2.71
0.010 4 2.37 0.900 20.9 2.73
0.010 5 2.34 0.920 19.5 2.71
0.010 6 2.28 0.846 22.3 2.96
0.010 7 2.37 0.712 24.1 3.25
0.010 8 2.40 0.691 24.7 3.28
0.010 9 2.38 0.808 23.1 2.93
0.010 10 2.38 0.747 23.4 3.11
0.020 1 2.34 0.945 17.2 2.67
0.020 2 2.40 0.801 23.7 2.92
0.020 3 2.41 0.790 23.7 2.94
0.020 4 2.36 0.785 23.1 3.02
0.020 5 2.36 0.795 23.1 2.99
0.020 6 2.37 0.792 23.0 2.98
0.020 7 2.40 0.798 23.2 2.94
0.020 8 2.38 0.799 23.2 2.95
0.020 9 2.40 0.797 23.4 2.94
0.020 10 2.35 0.797 22.5 3.00
0.050 1 2.34 0.807 23.2 2.99
0.050 2 2.38 0.886 20.4 2.75
0.050 3 2.39 0.824 23.3 2.88
0.050 4 2.39 0.802 23.4 2.93
0.050 5 2.39 0.796 23.3 2.95
0.050 6 2.38 0.793 22.9 2.98
0.050 7 2.28 0.810 22.8 3.05
0.050 8 2.39 0.792 23.0 2.97
0.050 9 2.39 0.786 23.1 2.98
0.050 10 2.38 0.780 23.5 3.01
0.100 1 2.35 0.876 21.4 2.80
0.100 2 2.35 0.862 21.8 2.83
0.100 3 2.36 0.864 21.6 2.82

170
[NaCl] Test # Bubble
Diameter
Average
Aspect Ratio
Average
Rise Velocity
Specific Bubble
Surface Area
M mm cm/s mm-1
0.100 4 2.35 0.843 22.1 2.87
0.100 5 2.35 0.841 21.8 2.88
0.100 6 2.33 0.932 17.4 2.70
0.100 7 2.35 0.854 21.5 2.85
0.100 8 2.35 0.913 19.4 2.72
0.100 9 2.35 0.840 22.8 2.88
0.100 10 2.34 0.935 17.2 2.68
0.200 1 2.32 0.926 18.3 2.72
0.200 2 2.33 0.912 20.3 2.74
0.200 3 2.34 0.921 19.6 2.71
0.200 4 2.33 0.902 19.8 2.77
0.200 5 2.33 0.912 19.1 2.75
0.200 6 2.33 0.920 17.9 2.72
0.200 7 2.34 0.892 20.4 2.78
0.200 8 2.34 0.895 20.3 2.77
0.200 9 2.34 0.897 20.1 2.76
0.200 10 2.34 0.912 19.4 2.73
0.500 1 2.37 0.928 18.6 2.66
0.500 2 2.38 0.928 18.8 2.66
0.500 3 2.38 0.927 18.2 2.65
0.500 4 2.36 0.892 19.4 2.75
0.500 5 2.37 0.933 18.3 2.65
0.500 6 2.37 0.932 18.3 2.66
0.500 7 2.36 0.925 18.0 2.68
0.500 8 2.38 0.928 18.0 2.66
0.500 9 2.36 0.925 18.1 2.68
0.500 10 2.36 0.931 17.6 2.66
1.000 1 2.35 0.940 18.1 2.66
1.000 2 2.36 0.936 18.4 2.67
1.000 3 2.35 0.937 18.4 2.67
1.000 4 2.34 0.934 18.3 2.68
1.000 5 2.35 0.937 17.5 2.66
1.000 6 2.34 0.939 18.1 2.67
1.000 7 2.34 0.937 17.8 2.68
1.000 8 2.35 0.941 17.9 2.66
1.000 9 2.34 0.937 17.7 2.68
1.000 10 2.36 0.936 17.5 2.66
Table A3.5 – Bubble shape and rise velocity tests – Na2SO4 data
[Na2SO4] Test Bubble
Diameter
Average
Aspect Ratio
Average
Rise Velocity
Specific Bubble
Surface Area
M # mm cm/s mm-1
0.010 1 2.40 0.640 25.8 3.96
0.010 2 2.35 0.647 25.6 3.76
0.010 3 2.37 0.637 25.3 3.90
0.010 4 2.37 0.647 25.0 3.82
0.010 5 2.36 0.643 25.1 3.82
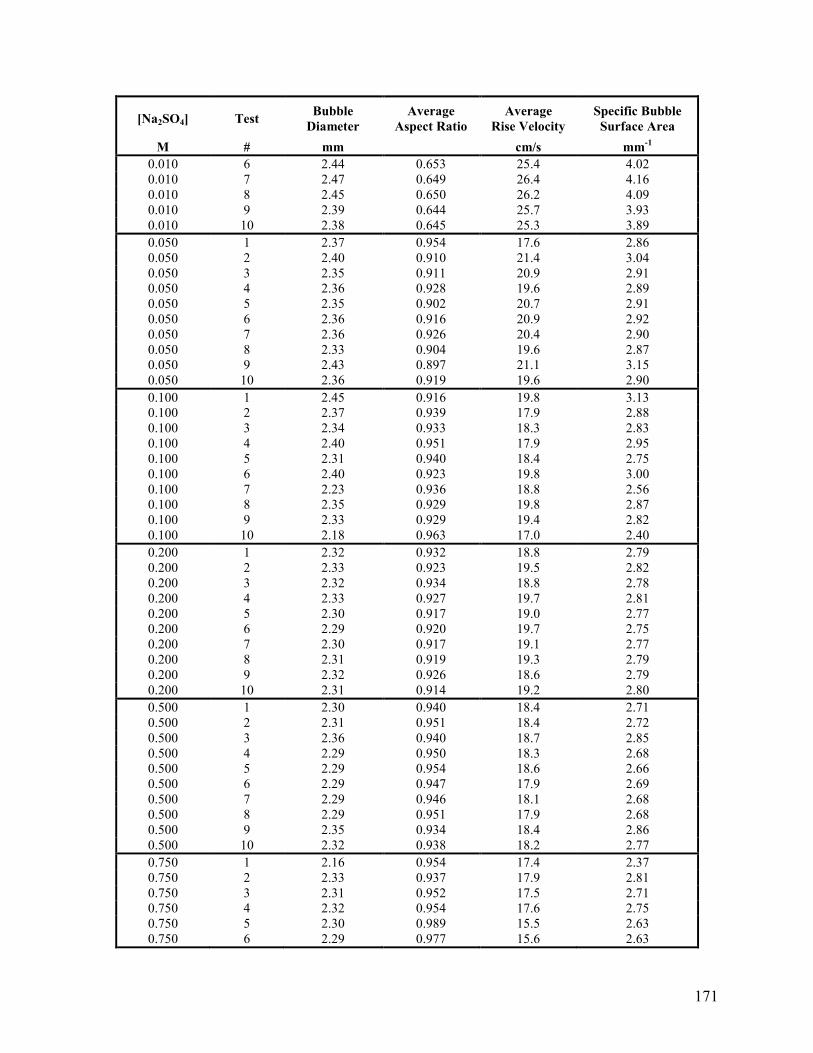
171
[Na2SO4] Test Bubble
Diameter
Average
Aspect Ratio
Average
Rise Velocity
Specific Bubble
Surface Area
M # mm cm/s mm-1
0.010 6 2.44 0.653 25.4 4.02
0.010 7 2.47 0.649 26.4 4.16
0.010 8 2.45 0.650 26.2 4.09
0.010 9 2.39 0.644 25.7 3.93
0.010 10 2.38 0.645 25.3 3.89
0.050 1 2.37 0.954 17.6 2.86
0.050 2 2.40 0.910 21.4 3.04
0.050 3 2.35 0.911 20.9 2.91
0.050 4 2.36 0.928 19.6 2.89
0.050 5 2.35 0.902 20.7 2.91
0.050 6 2.36 0.916 20.9 2.92
0.050 7 2.36 0.926 20.4 2.90
0.050 8 2.33 0.904 19.6 2.87
0.050 9 2.43 0.897 21.1 3.15
0.050 10 2.36 0.919 19.6 2.90
0.100 1 2.45 0.916 19.8 3.13
0.100 2 2.37 0.939 17.9 2.88
0.100 3 2.34 0.933 18.3 2.83
0.100 4 2.40 0.951 17.9 2.95
0.100 5 2.31 0.940 18.4 2.75
0.100 6 2.40 0.923 19.8 3.00
0.100 7 2.23 0.936 18.8 2.56
0.100 8 2.35 0.929 19.8 2.87
0.100 9 2.33 0.929 19.4 2.82
0.100 10 2.18 0.963 17.0 2.40
0.200 1 2.32 0.932 18.8 2.79
0.200 2 2.33 0.923 19.5 2.82
0.200 3 2.32 0.934 18.8 2.78
0.200 4 2.33 0.927 19.7 2.81
0.200 5 2.30 0.917 19.0 2.77
0.200 6 2.29 0.920 19.7 2.75
0.200 7 2.30 0.917 19.1 2.77
0.200 8 2.31 0.919 19.3 2.79
0.200 9 2.32 0.926 18.6 2.79
0.200 10 2.31 0.914 19.2 2.80
0.500 1 2.30 0.940 18.4 2.71
0.500 2 2.31 0.951 18.4 2.72
0.500 3 2.36 0.940 18.7 2.85
0.500 4 2.29 0.950 18.3 2.68
0.500 5 2.29 0.954 18.6 2.66
0.500 6 2.29 0.947 17.9 2.69
0.500 7 2.29 0.946 18.1 2.68
0.500 8 2.29 0.951 17.9 2.68
0.500 9 2.35 0.934 18.4 2.86
0.500 10 2.32 0.938 18.2 2.77
0.750 1 2.16 0.954 17.4 2.37
0.750 2 2.33 0.937 17.9 2.81
0.750 3 2.31 0.952 17.5 2.71
0.750 4 2.32 0.954 17.6 2.75
0.750 5 2.30 0.989 15.5 2.63
0.750 6 2.29 0.977 15.6 2.63

172
[Na2SO4] Test Bubble
Diameter
Average
Aspect Ratio
Average
Rise Velocity
Specific Bubble
Surface Area
M # mm cm/s mm-1
0.750 7 2.31 0.991 15.5 2.65
0.750 8 2.30 0.955 17.8 2.70
0.750 9 2.17 0.947 17.1 2.41
0.750 10 2.17 0.957 17.1 2.38
1.000 1 2.15 0.970 18.4 2.32
1.000 2 2.23 0.956 18.8 2.53
1.000 3 2.42 0.952 18.5 2.98
1.000 4 2.42 0.959 18.5 2.98
1.000 5 2.43 0.953 18.2 3.00
1.000 6 2.39 0.947 17.8 2.92
1.000 7 2.40 0.930 18.5 2.98
1.000 8 2.23 0.954 17.5 2.52
1.000 9 2.24 0.948 17.1 2.56
1.000 10 2.38 0.945 17.9 2.90
Table A3.6 – Bubble shape and rise velocity tests – CaCl2 data
[CaCl2] Test # Bubble
Diameter
Average
Aspect Ratio
Average
Rise Velocity
Specific Bubble
Surface Area
M mm cm/s mm-1
0.005 1 2.34 0.631 25.4 3.83
0.005 2 2.38 0.652 25.2 3.86
0.005 3 2.40 0.654 25.3 3.91
0.005 4 2.36 0.642 25.4 3.82
0.005 5 2.27 0.642 24.3 3.55
0.005 6 2.40 0.641 25.7 3.96
0.005 7 2.39 0.650 25.3 3.89
0.005 8 2.38 0.654 25.0 3.84
0.005 9 2.40 0.643 25.6 3.94
0.005 10 2.33 0.651 24.5 3.70
0.010 1 2.40 0.714 24.3 3.63
0.010 2 2.43 0.722 24.4 3.69
0.010 3 2.31 0.725 23.0 3.33
0.010 4 2.34 0.715 24.1 3.43
0.010 5 2.49 0.723 24.5 3.86
0.010 6 2.32 0.716 23.6 3.38
0.010 7 2.44 0.713 24.8 3.77
0.010 8 2.33 0.723 23.0 3.39
0.010 9 2.38 0.654 25.0 3.84
0.010 10 2.33 0.726 23.2 3.37
0.020 1 2.30 0.749 22.9 3.22
0.020 2 2.38 0.758 24.0 3.42
0.020 3 2.45 0.769 23.9 3.58
0.020 4 2.28 0.763 22.4 3.11
0.020 5 2.45 0.751 24.4 3.64
0.020 6 2.31 0.765 22.8 3.19
0.020 7 2.32 0.754 23.2 3.26
0.020 8 2.36 0.767 23.2 3.31

173
[CaCl2] Test # Bubble
Diameter
Average
Aspect Ratio
Average
Rise Velocity
Specific Bubble
Surface Area
M mm cm/s mm-1
0.020
0.020
9
10
2.34
2.30
0.755
0.752
23.6
23.0
3.30
3.19
0.050 1 2.30 0.789 22.4 3.08
0.050 2 2.31 0.784 22.2 3.12
0.050 3 2.30 0.788 22.4 3.10
0.050 4 2.34 0.789 22.6 3.19
0.050 5 2.33 0.791 22.2 3.15
0.050 6 2.34 0.783 22.8 3.23
0.050 7 2.32 0.784 22.6 3.15
0.050 8 2.38 0.802 22.9 3.26
0.050 9 2.38 0.784 23.2 3.32
0.050 10 2.32 0.788 22.4 3.14
0.100 1 2.28 0.838 21.8 2.91
0.100 2 2.29 0.831 21.8 2.94
0.100 3 2.33 0.832 22.0 3.05
0.100 4 2.38 0.834 22.4 3.16
0.100 5 2.32 0.833 21.9 3.01
0.100 6 2.28 0.827 21.9 2.92
0.100 7 2.28 0.840 21.4 2.90
0.100 8 2.29 0.834 21.8 2.95
0.100 9 2.27 0.830 21.6 2.90
0.100 10 2.26 0.839 21.4 2.85
0.200 1 2.26 0.867 20.8 2.77
0.200 2 2.24 0.868 20.5 2.74
0.200 3 2.28 0.865 20.9 2.83
0.200 4 2.25 0.868 20.5 2.76
0.200 5 2.24 0.867 20.6 2.73
0.200 6 2.24 0.870 20.3 2.72
0.200 7 2.26 0.873 20.5 2.76
0.200 8 2.25 0.875 20.1 2.72
0.200 9 2.25 0.875 20.1 2.72
0.200 10 2.24 0.867 20.5 2.74
0.500 1 2.28 0.906 19.1 2.74
0.500 2 2.29 0.909 18.8 2.75
0.500 3 2.30 0.920 19.2 2.76
0.500 4 2.28 0.903 19.0 2.76
0.500 5 2.31 0.921 18.9 2.78
0.500 6 2.31 0.907 19.2 2.80
0.500 7 2.35 0.913 19.5 2.91
0.500 8 2.30 0.914 19.3 2.79
0.500 9 2.33 0.915 19.4 2.83
0.500 10 2.29 0.906 19.1 2.76
0.750 1 2.21 0.920 17.9 2.55
0.750 2 2.22 0.924 17.8 2.57
0.750 3 2.24 0.921 18.0 2.61
0.750 4 2.21 0.912 17.8 2.56
0.750 5 2.22 0.916 17.6 2.59
0.750 6 2.22 0.925 17.2 2.56
0.750 7 2.21 0.911 17.9 2.57
0.750 8 2.24 0.923 18.0 2.60
0.750 9 2.23 0.928 17.8 2.59
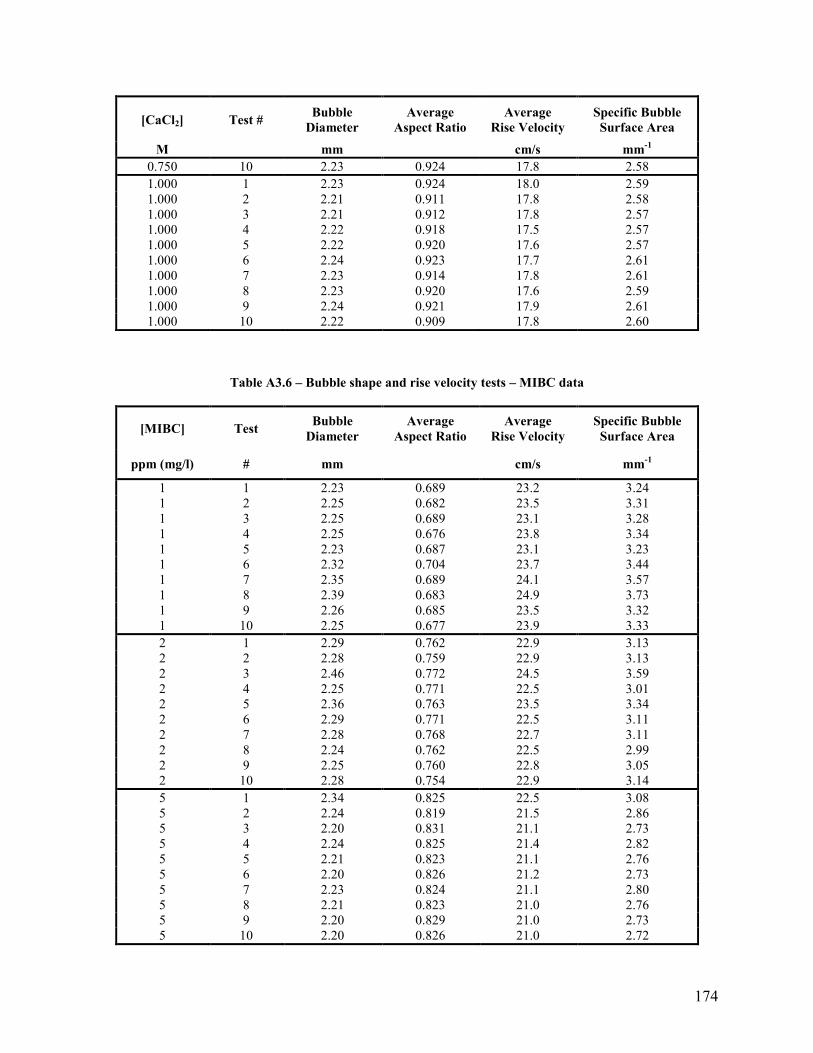
174
[CaCl2] Test # Bubble
Diameter
Average
Aspect Ratio
Average
Rise Velocity
Specific Bubble
Surface Area
M mm cm/s mm-1
0.750 10 2.23 0.924 17.8 2.58
1.000 1 2.23 0.924 18.0 2.59
1.000 2 2.21 0.911 17.8 2.58
1.000 3 2.21 0.912 17.8 2.57
1.000 4 2.22 0.918 17.5 2.57
1.000 5 2.22 0.920 17.6 2.57
1.000 6 2.24 0.923 17.7 2.61
1.000 7 2.23 0.914 17.8 2.61
1.000 8 2.23 0.920 17.6 2.59
1.000 9 2.24 0.921 17.9 2.61
1.000 10 2.22 0.909 17.8 2.60
Table A3.6 – Bubble shape and rise velocity tests – MIBC data
[MIBC] Test Bubble
Diameter
Average
Aspect Ratio
Average
Rise Velocity
Specific Bubble
Surface Area
ppm (mg/l) # mm cm/s mm-1
1 1 2.23 0.689 23.2 3.24
1 2 2.25 0.682 23.5 3.31
1 3 2.25 0.689 23.1 3.28
1 4 2.25 0.676 23.8 3.34
1 5 2.23 0.687 23.1 3.23
1 6 2.32 0.704 23.7 3.44
1 7 2.35 0.689 24.1 3.57
1 8 2.39 0.683 24.9 3.73
1 9 2.26 0.685 23.5 3.32
1 10 2.25 0.677 23.9 3.33
2 1 2.29 0.762 22.9 3.13
2 2 2.28 0.759 22.9 3.13
2 3 2.46 0.772 24.5 3.59
2 4 2.25 0.771 22.5 3.01
2 5 2.36 0.763 23.5 3.34
2 6 2.29 0.771 22.5 3.11
2 7 2.28 0.768 22.7 3.11
2 8 2.24 0.762 22.5 2.99
2 9 2.25 0.760 22.8 3.05
2 10 2.28 0.754 22.9 3.14
5 1 2.34 0.825 22.5 3.08
5 2 2.24 0.819 21.5 2.86
5 3 2.20 0.831 21.1 2.73
5 4 2.24 0.825 21.4 2.82
5 5 2.21 0.823 21.1 2.76
5 6 2.20 0.826 21.2 2.73
5 7 2.23 0.824 21.1 2.80
5 8 2.21 0.823 21.0 2.76
5 9 2.20 0.829 21.0 2.73
5 10 2.20 0.826 21.0 2.72
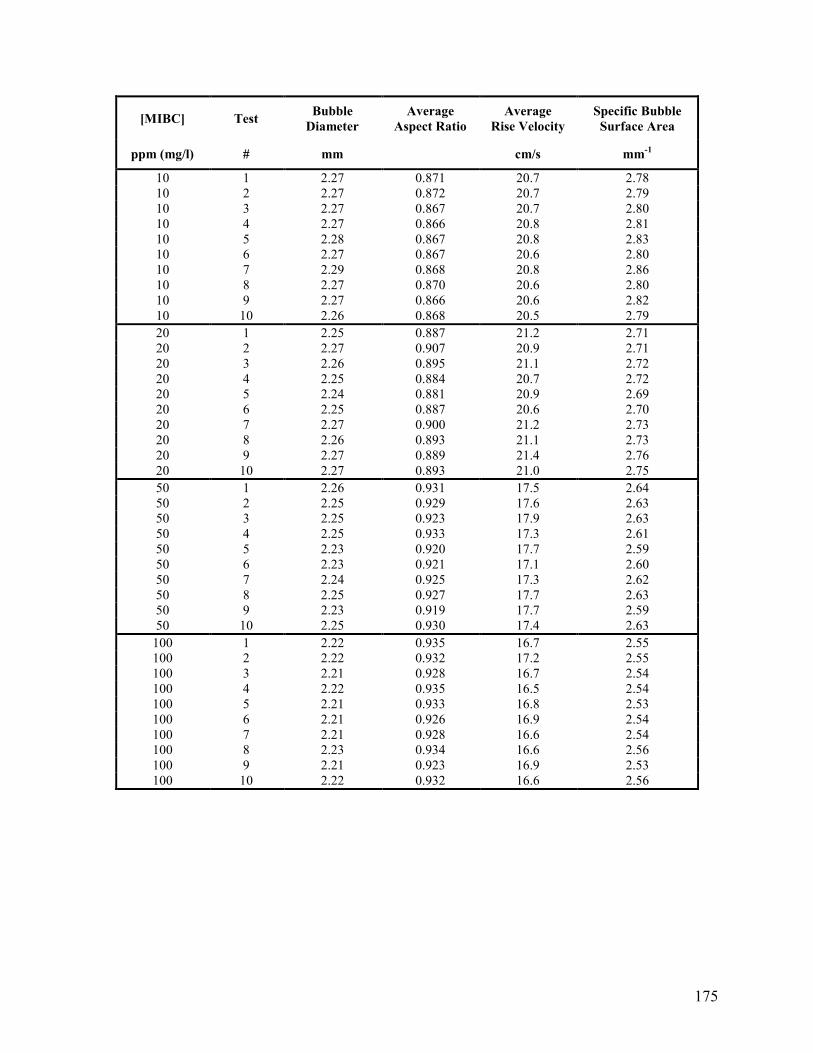
175
[MIBC] Test Bubble
Diameter
Average
Aspect Ratio
Average
Rise Velocity
Specific Bubble
Surface Area
ppm (mg/l) # mm cm/s mm-1
10 1 2.27 0.871 20.7 2.78
10 2 2.27 0.872 20.7 2.79
10 3 2.27 0.867 20.7 2.80
10 4 2.27 0.866 20.8 2.81
10 5 2.28 0.867 20.8 2.83
10 6 2.27 0.867 20.6 2.80
10 7 2.29 0.868 20.8 2.86
10 8 2.27 0.870 20.6 2.80
10 9 2.27 0.866 20.6 2.82
10 10 2.26 0.868 20.5 2.79
20 1 2.25 0.887 21.2 2.71
20 2 2.27 0.907 20.9 2.71
20 3 2.26 0.895 21.1 2.72
20 4 2.25 0.884 20.7 2.72
20 5 2.24 0.881 20.9 2.69
20 6 2.25 0.887 20.6 2.70
20 7 2.27 0.900 21.2 2.73
20 8 2.26 0.893 21.1 2.73
20 9 2.27 0.889 21.4 2.76
20 10 2.27 0.893 21.0 2.75
50 1 2.26 0.931 17.5 2.64
50 2 2.25 0.929 17.6 2.63
50 3 2.25 0.923 17.9 2.63
50 4 2.25 0.933 17.3 2.61
50 5 2.23 0.920 17.7 2.59
50 6 2.23 0.921 17.1 2.60
50 7 2.24 0.925 17.3 2.62
50 8 2.25 0.927 17.7 2.63
50 9 2.23 0.919 17.7 2.59
50 10 2.25 0.930 17.4 2.63
100 1 2.22 0.935 16.7 2.55
100 2 2.22 0.932 17.2 2.55
100 3 2.21 0.928 16.7 2.54
100 4 2.22 0.935 16.5 2.54
100 5 2.21 0.933 16.8 2.53
100 6 2.21 0.926 16.9 2.54
100 7 2.21 0.928 16.6 2.54
100 8 2.23 0.934 16.6 2.56
100 9 2.21 0.923 16.9 2.53
100 10 2.22 0.932 16.6 2.56