Embed Size (px)
Citation preview
8/18/2019 BTO Research Report No.223 - Developing a Mammal Monitoring Programme for the UK
http://slidepdf.com/reader/full/bto-research-report-no223-developing-a-mammal-monitoring-programme-for-the 1/316
BTO Research Report No.223
Developing a mammal
monitoring programme
for the UK
M.P. Toms, G.M. Siriwardena & J.J.D. Greenwood
(Part III.A.1 written by S.N. Freeman & G.M. Siriwardena)
July 1999
A report by the British Trust for Ornithology under contract to
the Joint Nature Conservation Committee (Contract No: F76-01-241).
British Trust for Ornithology,The Nunnery, Thetford, Norfolk, IP24 2PU.Registered Charity No. 216652
8/18/2019 BTO Research Report No.223 - Developing a Mammal Monitoring Programme for the UK
http://slidepdf.com/reader/full/bto-research-report-no223-developing-a-mammal-monitoring-programme-for-the 2/316
BTO Research Report No.223
July 1999
M.P. Toms, G.M. Siriwardena & J.J.D. Greenwood
(Part III.A.1 written by S.N. Freeman & G.M. Siriwardena)
DEVELOPING A MAMMAL
MONITORING PROGRAMME
FOR THE UK
A report by the British Trust for Ornithology under contract to
the Joint Nature Conservation Committee (Contract No: F76-01-241).
Published in July and 1999 by the British Trust for Ornithology
The Nunnery, Thetford, Norfolk IP24 2PU, U.K.
Copyright © British Trust for Ornithology 1999
Report to be cited as: Toms, M.P., Siriwardena, G.M. & Greenwood, J.J.D. (1999) Developing a
mammal monitoring programme for the UK . BTO Research Report No.223. BTO, Thetford.
ISBN 1-902576-19-5
All rights reserved. No part of this publication may be
reproduced, stored in a retrieval system or transmitted,
in any form, or by any means, electronic, mechanical,
photocopying, recording or otherwise, without the prior
permission of the publishers.

8/18/2019 BTO Research Report No.223 - Developing a Mammal Monitoring Programme for the UK
http://slidepdf.com/reader/full/bto-research-report-no223-developing-a-mammal-monitoring-programme-for-the 3/316
BTO Research Report No.223
July 1999 1
CONTENTS
Page No.
List of Tables ............................................................................................................................9
List of Figures.........................................................................................................................11List of Species Covered..........................................................................................................13
Key References.......................................................................................................................15
PART I. AIMS AND OBJECTIVES OF UK MAMMAL MONITORING...........17
1. WHY SUCH MONITORING IS NEEDED ............................................................17
1.1 What is monitoring?.....................................................................................17
1.2 The status of British and Irish mammals...................................................18
1.3 Objectives of mammal monitoring .............................................................19
1.4 Aims of mammal monitoring ......................................................................20
1.4.1 Information.........................................................................................20
1.4.2 Geographical scope ............................................................................21
1.4.3 Habitat information...........................................................................22
1.4.4 Monitoring range ...............................................................................22
1.4.5 Monitoring abundance ......................................................................24
1.4.6 Demographic rates .............................................................................26
2. THE BACKGROUND TO THE CURRENT PROJECT ......................................27
2.1 Current mammal monitoring in the UK ....................................................27
2.2 MMR proposals ............................................................................................27
2.2.1 What species? .....................................................................................282.2.2 What is to be measured? ...................................................................28
2.2.3 Integration across species..................................................................28
2.2.4 The three-tiered structure and the Master Squares .......................28
2.2.5 The seven-year cycle ..........................................................................28
2.2.6 Rich Interest Kilometre Squares ......................................................29
2.2.7 Focus Zones ........................................................................................29
2.2.8 Manpower and costs ..........................................................................29
2.2.9 Utilising existing ancillary schemes..................................................29
2.2.10 Setting up the MaMoNet ...................................................................31
2.2.11 Sampling with partial replacement (SPR) .......................................31
2.3 Aims of the current project .........................................................................31
2.3.1 General aims and species to be considered......................................31
2.3.2 What is to be measured? ...................................................................32
2.3.3 Integration across species..................................................................32
2.3.4 The Master Squares...........................................................................33
2.3.5 The seven-year cycle ..........................................................................33
2.3.6 Rich Interest Kilometre Squares ......................................................34
2.3.7 Focus Zones ........................................................................................34
2.3.8 Manpower and costs ..........................................................................34
2.3.9 Utilising existing and ancillary schemes ..........................................34
2.3.10 Setting up the mammal monitoring programme ............................352.3.11 Sampling with partial replacement ..................................................35
3. HOW THE MONITORING OF MAMMALS IS DIFFERENT FROM

8/18/2019 BTO Research Report No.223 - Developing a Mammal Monitoring Programme for the UK
http://slidepdf.com/reader/full/bto-research-report-no223-developing-a-mammal-monitoring-programme-for-the 4/316
BTO Research Report No.223
July 1999 2
THAT OF BIRDS ......................................................................................................37
3.1 Mammals are less easily detectable than birds..........................................37
3.2 Identification.................................................................................................37
3.3 More species-specific techniques are needed for mammals than
for birds.........................................................................................................37
3.4 Availability of personnel..............................................................................373.5 Diversity of existing inputs is greater for mammal monitoring...............38
3.6 There is no commitment to long-term monitoring of mammals..............38
3.7 Mammals are generally less mobile than birds .........................................38
3.8 Many mammals occur in many different habitats ....................................39
PART II. CONSIDERATIONS OF DESIGN AND STATISTICS...........................41
1. INTRODUCTION......................................................................................................41
1.1 Why revisit these issues?..............................................................................41
1.2 Statistical nicety or practical pragmatism? ...............................................41
2. THE SPATIAL DISTRIBUTION OF SAMPLING...............................................43
2.1 Generalising from samples ..........................................................................43
2.2 Sources of imprecision in sample surveys..................................................43
2.3 What population is of interest?...................................................................44
2.4 Randomisation..............................................................................................46
2.5 Species restricted to special habitats of limited extent .............................47
2.6 Systematic surveys........................................................................................47
2.7 Study sites chosen by the observers............................................................48
2.8 Sampling at more than one level.................................................................49
2.9 Many small samples or fewer larger ones?................................................502.10 Stratification: general ..................................................................................50
2.11 Focus Zones may be strata ..........................................................................52
2.12 Stratification by observer availability ........................................................52
2.13 Statistical power ...........................................................................................53
3. THE TEMPORAL DIMENSION TO SAMPLING...............................................55
3.1 The importance of historical continuity of sample sites ...........................55
3.2 Partially replacing samples .........................................................................56
3.3 Building on previous surveys.......................................................................57
3.4 Within-year variation ..................................................................................58
4. NOTES ON STATISTICAL INTERPRETATION................................................61
4.1 Estimation and hypothesis testing ..............................................................61
4.2 Remarks on appropriate statistical models ...............................................61
4.3 Post-stratification, regression and other modelling as means of
increasing precision and understanding ....................................................62

8/18/2019 BTO Research Report No.223 - Developing a Mammal Monitoring Programme for the UK
http://slidepdf.com/reader/full/bto-research-report-no223-developing-a-mammal-monitoring-programme-for-the 5/316
BTO Research Report No.223
July 1999 3
PART III. MULTI-SPECIES SCHEMES....................................................................63
INTRODUCTION ..............................................................................................................63
A. EVALUATION OF EXISTING SOURCES OF DATA.........................................63
1. MAMMAL MONITORING UNDER THE BREEDING BIRDSURVEY ..............................................................................................................63
1.1 Introduction ..................................................................................................63
1.2 The Background of the Breeding Bird Survey ..........................................64
1.3 The Methods of the BBS ..............................................................................64
1.4 Mammal Recording within the BBS...........................................................65
1.5 The Mammal Species Recorded..................................................................65
1.6 Estimating Population Changes and Population Trends..........................66
1.7 Statistical Power ...........................................................................................70
1.8 Waterways Breeding Bird Survey ..............................................................72
1.9 Discussion......................................................................................................72
2. GAME BAGS .............................................................................................................77
2.1 Introduction and Background.....................................................................77
2.2 The case for Game Bag data as a mammal monitoring tool ....................77
2.3 The case against Game Bags........................................................................78
2.4 Conclusion and future priorities.................................................................81
B. FURTHER POTENTIAL MULTI-SPECIES SCHEMES ....................................83
3. WINTER TRANSECT SURVEY.............................................................................83
3.1 Advantages and disadvantages of this approach.......................................83
3.2 Which species could be monitored under this scheme..............................833.3 Examples of previous surveys using winter visual transects....................84
3.4 What a Winter Transect Survey could offer .............................................84
3.5 Alternative Approaches ...............................................................................84
3.6 The Data Recording Forms .........................................................................85
3.7 Organisation of Winter Transect Survey...................................................85
3.8 Other considerations ....................................................................................85
3.9 Resource Requirements ...............................................................................86
4. SIGN TRANSECT SURVEY....................................................................................87
4.1 Advantages and disadvantages of this approach.......................................87
4.2 What species could be monitored under this scheme................................87
4.3 Previous surveys using field sign transects ................................................88
4.4 What a field sign transect scheme could offer ...........................................88
4.5 The data recording forms............................................................................88
4.6 Organisation of Sign Transects...................................................................88
4.7 Other considerations ....................................................................................89
4.8 Resource Requirements ...............................................................................89
5. MAMMALS ON ROADS..........................................................................................91
5.1 Advantages and disadvantages of this approach.......................................91
5.2 What species could be monitored under this scheme?..............................91
5.3 What a Mammals on Road Survey could offer .........................................92

8/18/2019 BTO Research Report No.223 - Developing a Mammal Monitoring Programme for the UK
http://slidepdf.com/reader/full/bto-research-report-no223-developing-a-mammal-monitoring-programme-for-the 6/316
BTO Research Report No.223
July 1999 4
5.4 The data recording forms............................................................................92
5.5 Organisation of Mammals on Roads ..........................................................92
5.6 Other Considerations...................................................................................92
5.7 Resource Requirements ...............................................................................93
6. MAMMALS ON NATURE RESERVES.................................................................956.1 Advantages and disadvantages of this approach.......................................95
6.2 Which species could be monitored under this scheme?............................95
6.3 Participating organisations..........................................................................96
6.4 Setting the scheme up on each reserve .......................................................97
6.5 The data recording forms............................................................................97
6.6 Organisation of the scheme .........................................................................98
6.7 Data analysis .................................................................................................99
6.8 Resource requirements ................................................................................99
7. GARDEN MAMMAL WATCH.............................................................................101
7.1 Introduction ................................................................................................101
7.2 Previous garden mammal surveys............................................................101
7.3 The BTO/CJ Garden BirdWatch (GBW) ................................................101
7.4 What Garden Mammal Watch could cover.............................................102
7.5 Should other taxa be included...................................................................103
7.6 Organisation of Garden Mammal Watch ................................................103
IV. SCHEMES FOR INDIVIDUAL SPECIES................................................................105
INTRODUCTION................................................................................................................105
1. Hedgehog .................................................................................................................1072. Mole...........................................................................................................................109
3. Lesser White-toothed Shrew...................................................................................111
4. Rabbit........................................................................................................................113
5. Hares .........................................................................................................................117
6. Squirrels....................................................................................................................123
7. Orkney Vole..............................................................................................................129
8. Water Vole................................................................................................................131
9. Yellow-necked Mouse ..............................................................................................137
10. Harvest Mouse..........................................................................................................141
11. House Mouse ............................................................................................................145
12. Brown Rat.................................................................................................................147
13. Ship Rat.....................................................................................................................149
14. Common Dormouse .................................................................................................153
15. Fat Dormouse ...........................................................................................................157
16. Other Small Mammal Species ................................................................................161
17. Red Fox .....................................................................................................................169
18. Pine Marten..............................................................................................................175
19. Stoat and Weasel......................................................................................................181
20. Polecat .......................................................................................................................185
21. Feral Ferret ..............................................................................................................187

8/18/2019 BTO Research Report No.223 - Developing a Mammal Monitoring Programme for the UK
http://slidepdf.com/reader/full/bto-research-report-no223-developing-a-mammal-monitoring-programme-for-the 7/316
BTO Research Report No.223
July 1999 5
22. American Mink ........................................................................................................189
23. Badger .......................................................................................................................193
24. Otter ..........................................................................................................................199
25. Wildcat......................................................................................................................205
26. Wild Swine................................................................................................................209
27. Deer ...........................................................................................................................21128. Feral Goat.................................................................................................................219
29. Feral Sheep ...............................................................................................................221
30. Red-necked Wallaby................................................................................................223
31. Unestablished Aliens................................................................................................225
V. BUILDING THE VOLUNTEER NETWORK .....................................................227
1. INTRODUCTION....................................................................................................227
2. WHY USE VOLUNTEERS FOR WILDLIFE MONITORING.........................227
2.1 Citizen participation...................................................................................227
2.2 Building up a body of committed enthusiasts..........................................227
2.3 Large numbers............................................................................................227
2.4 Knowledge of local areas ...........................................................................228
2.5 Reduced dependence on individuals.........................................................228
2.6 Guaranteed commitment...........................................................................228
2.7 Saving in costs.............................................................................................228
2.8 Establishment of protocols ........................................................................229
3. POTENTIAL PROBLEMS WITH USING VOLUNTEERS..............................229
3.1 Level of expertise........................................................................................2293.2 Numbers ......................................................................................................229
3.3 Cost-effectiveness .......................................................................................229
3.4 Availabillity.................................................................................................230
3.5 Reliability ....................................................................................................230
4. THE NEED FOR A PROFESSIONAL INFRASTRUCTURE ...........................230
5. HOW MANY MAMMAL VOLUNTEERS MIGHT THERE BE? ....................230
6. DEVELOPING THE VOLUNTEER NETWORK THROUGH
TRAINING ............................................................................................................232
6.1 Why train? ..................................................................................................232
6.2 Look Out For Mammals Courses .............................................................232
6.3 Further benefits of the LOFM project .....................................................233
6.4 The future....................................................................................................233
7. DEVELOPING THE VOLUNTEER NETWORK THROUGH
COMMUNICATION AND FEEDBACK..............................................................233
8. THE IMPORTANCE OF A MEMBERSHIP-BASED
ORGANISATION....................................................................................................235

8/18/2019 BTO Research Report No.223 - Developing a Mammal Monitoring Programme for the UK
http://slidepdf.com/reader/full/bto-research-report-no223-developing-a-mammal-monitoring-programme-for-the 8/316
BTO Research Report No.223
July 1999 6
9. ORGANISATION AT THE LOCAL LEVEL......................................................236
10. THE SPECIAL PROBLEMS OF SPARSELY POPULATED
AREAS......................................................................................................................237
11. SHOULD DIRECT FINANCIAL SUPPORT BE PROVIDED FORVOLUNTEERS?......................................................................................................239
PART VI. POTENTIAL RELATIONSHIPS BETWEEN MAMMAL
MONITORING AND THE NATIONAL BIODIVERSITY
NETWORK.................................................................................................241
1. THE CURRENT BIOLOGICAL RECORDING NETWORK...........................241
2. THE PROPOSAL FOR A NATIONAL BIODIVERSITY NETWORK
(NBN) ........................................................................................................................241
3. THE ADVANTAGES OF BUILDING FROM LOCAL TO
NATIONAL..............................................................................................................241
4. THE DISADVANTAGES OF BUILDING FROM LOCAL TO
NATIONAL..............................................................................................................242
5. CONCLUSION: MAMMAL MONITORING SHOULD BE
CENTRALLY ORGANISED .................................................................................243
6. CAN NBN CONTRIBUTE IN ANY WAY TO DATA COLLECTIONFOR NATIONAL MONITORING?......................................................................243
7. USING LRCs AND NBN FOR DISTRIBUTION RECORDS ............................244
8. DISSEMINATION OF INFORMATION THROUGH NBN..............................244
9. ULSTER: A SPECIAL CASE ................................................................................244
10. SUMMARY ..............................................................................................................245
PART VII. PROPOSALS FOR A UK MAMMAL MONITORING
SCHEME.....................................................................................................247
1. SPECIES AND SCHEMES.....................................................................................247
2. COSTS OF PROPOSED SCHEMES.....................................................................247
2.1 Likely Costings - Additional Data Collation Through the Breeding
Bird Survey .................................................................................................248
2.2 Likely Costings - Additional Data Collation Through the National
Game Bag Census.......................................................................................248
2.3 Likely Costings - Combined Scheme with Winter Transects, SignTransects and Mammals on Roads...........................................................249
2.4 Likely Costings - Mammals on Nature Reserves.....................................249

8/18/2019 BTO Research Report No.223 - Developing a Mammal Monitoring Programme for the UK
http://slidepdf.com/reader/full/bto-research-report-no223-developing-a-mammal-monitoring-programme-for-the 9/316
BTO Research Report No.223
July 1999 7
2.5 Likely Costings - Owl Pellet Survey .........................................................250
2.6 Likely Costings - One Year Single Species Survey..................................250
2.7 Likely Costings - National Co-ordination of Mammal Schemes............251
2.8 Likely Costings - Total Costs for All Schemes.........................................251
3. ORGANISATIONAL PRACTICALITIES...........................................................252 3.1 Long-term guarantees................................................................................252
3.2 Security of data...........................................................................................252
3.3 Developing the system................................................................................252
3.4 Comprehensiveness ....................................................................................252
3.5 Design and Statistics...................................................................................252
3.6 Organisation................................................................................................253
3.7 Geographic aspects of organisation..........................................................253
3.8 Professional/volunteer interface................................................................253
PART VIII. DETERMINING THE LIMITS OF CHANGE ......................................255
1. INTRODUCTION....................................................................................................255
2. HOW SHOULD WE DECIDE WHAT ARE THE PRIORITY
SPECIES?.................................................................................................................256
3. WHAT INFORMATION IS REQUIRED?...........................................................259
4. TRIAL AND POWER ANALYSES ......................................................................259
Acknowledgements ..............................................................................................................263 References.............................................................................................................................265
Tables ....................................................................................................................................283
Figures...................................................................................................................................303
Appendices............................................................................................................................313

8/18/2019 BTO Research Report No.223 - Developing a Mammal Monitoring Programme for the UK
http://slidepdf.com/reader/full/bto-research-report-no223-developing-a-mammal-monitoring-programme-for-the 10/316
BTO Research Report No.223
July 1999 8

8/18/2019 BTO Research Report No.223 - Developing a Mammal Monitoring Programme for the UK
http://slidepdf.com/reader/full/bto-research-report-no223-developing-a-mammal-monitoring-programme-for-the 11/316
BTO Research Report No.223
July 1999 9
LIST OF TABLES
Page No.
Table I.1.1 Action Plan objectives and targets for UK mammals .................................283
Table I.1.2 The status and history of British and Irish mammals..................................284
Table I.1.3 Conservation assessment of species considered in this report ....................294
Table III.A.1.1 Summary of the numbers of BBS survey squares in which each of
the principal 17 mammal species was reported to be present in each
year of the trial mammal survey, 1995-1997..............................................296
Table III.A.1.2 Results of likelihood-ratio tests of the significance of inter-
annual differences in the proportion of survey squares in
which species were recorded as present .....................................................297
Table III.A.1.3 Results of a simulation-based study of the power of a simple
GLM to detect a range of gradual, long-term declines in
presence/absence data .................................................................................298
Table III.A.1.4 Mammals recorded on more than 1% of WBBS random
stretches during the 1998 trial survey.........................................................299
Table VII.1.1 Summary of the potential contributions of the proposed monitoring
schemes to the monitoring of each mammal species in the UK .................300

8/18/2019 BTO Research Report No.223 - Developing a Mammal Monitoring Programme for the UK
http://slidepdf.com/reader/full/bto-research-report-no223-developing-a-mammal-monitoring-programme-for-the 12/316
BTO Research Report No.223
July 1999 10

8/18/2019 BTO Research Report No.223 - Developing a Mammal Monitoring Programme for the UK
http://slidepdf.com/reader/full/bto-research-report-no223-developing-a-mammal-monitoring-programme-for-the 13/316
BTO Research Report No.223
July 1999 11
LIST OF FIGURES
Page No.
Figure I.1.1 How monitoring supports management by helping to
answer key questions ..................................................................................303
Figure II.3.2 Various sampling designs............................................................................304
Figure II.3.3 Rotationsampling.........................................................................................305
Figure III.A.1.1 Distribution of records of presence in BBS squares for
Rabbit in 1997.............................................................................................306
Figure III.A.1.2 Distribution of records of presence in BBS squares for
Brown Hare in 1997....................................................................................307
Figure III.A.1.3 Distribution of records of presence in BBS squares for
Reeves’ Muntjac in 1995 ............................................................................308
Figure III.A.1.4 Distribution of records of presence in BBS squares for
Red Squirrel over all years 1995-1997 .......................................................309
Figure III.A.1.5 Sample sizes required for the detection of a 10% decline
from a starting proportion p1 at ! = 0.05...................................................310
Figure III.A.1.6 Samples sizes required for the detection of a 20% declinefrom a starting proportion p1 at ! = 0.05...................................................310
Figure III.A.1.7 Sample sizes required for the detection of a 30% decline
from a starting proportion p1 at ! = 0.05...................................................311

8/18/2019 BTO Research Report No.223 - Developing a Mammal Monitoring Programme for the UK
http://slidepdf.com/reader/full/bto-research-report-no223-developing-a-mammal-monitoring-programme-for-the 14/316
BTO Research Report No.223
July 1999 12

8/18/2019 BTO Research Report No.223 - Developing a Mammal Monitoring Programme for the UK
http://slidepdf.com/reader/full/bto-research-report-no223-developing-a-mammal-monitoring-programme-for-the 15/316
BTO Research Report No.223
July 1999 13
Scientific and vernacular names of all mammals considered in this report.
Asterisks represent species not considered by MMR.
Insectivores
Erinaceus europaeus HedgehogTalpa europaea* Mole
Sorex araneus Common Shrew
Sorex minutus* Pygmy Shrew
Neomys fodiens Water Shrew
Crocidura suaveolens* Lesser White-toothed Shrew
Lagomorphs
Orcyctolagus cuniculus Rabbit
Lepus europaeus Brown Hare
Lepus timidus Mountain Hare
Rodents
Sciurus vulgaris Red Squirrel
Sciurus carolinensis Grey Squirrel
Clethrionomys glareolus* Bank Vole
Microtus agrestis Field Vole
Microtus arvalis* Orkney Vole Arvicola terrestris Water Vole
Apodemus sylvaticus* Wood Mouse
Apodemus flavicollis Yellow-necked Mouse
Micromys minutus Harvest Mouse
Mus domesticus* House Mouse
Rattus norvegicus* Common Rat
Rattus rattus Ship Rat
Muscardinus avellanarius Common Dormouse
Glis glis* Fat Dormouse
Terrestrial carnivores
Vulpes vulpes Red Fox
Martes martes Pine Marten
Mustela erminea Stoat
Mustela nivalis Weasel
Mustela putorius Polecat
Mustela furo* Feral Ferret
Mustela vison American Mink

8/18/2019 BTO Research Report No.223 - Developing a Mammal Monitoring Programme for the UK
http://slidepdf.com/reader/full/bto-research-report-no223-developing-a-mammal-monitoring-programme-for-the 16/316
BTO Research Report No.223
July 1999 14
Meles meles Badger
Lutra lutra Otter
Felis silvestris Wildcat
Felis catus* Feral Cat
Even-toed ungulates
Sus scrofa* Wild Swine
Cervus elaphus Red Deer
Cervus nippon Sika Deer
Dama dama Fallow Deer
Capreolus capreolus Roe Deer
Muntiacus reevesi Reeves’ Muntjac
Hydropotes inermis* Chinese Water Deer
Capra hircus* Feral Goat
Ovis ammon* Feral Sheep
Marsupials
Macropus rufogriseus* Red-necked Wallaby

8/18/2019 BTO Research Report No.223 - Developing a Mammal Monitoring Programme for the UK
http://slidepdf.com/reader/full/bto-research-report-no223-developing-a-mammal-monitoring-programme-for-the 17/316
BTO Research Report No.223
July 1999 15
Key References
For convenience, we refer throughout the text to the following key references by short titles. The
full references are given at the end of the report.
Short title Reference
The Atlas Arnold (1993)
The Handbook Corbet & Harris (1991)
The Populations Review Harris et al . (1995)
The Field Guide Macdonald & Barrett (1993)
MMR Macdonald et al. (1998)
Yalden Yalden (1999)

8/18/2019 BTO Research Report No.223 - Developing a Mammal Monitoring Programme for the UK
http://slidepdf.com/reader/full/bto-research-report-no223-developing-a-mammal-monitoring-programme-for-the 18/316
BTO Research Report No.223
July 1999 16

8/18/2019 BTO Research Report No.223 - Developing a Mammal Monitoring Programme for the UK
http://slidepdf.com/reader/full/bto-research-report-no223-developing-a-mammal-monitoring-programme-for-the 19/316
BTO Research Report No.223
July 1999 17
PART I. AIMS AND OBJECTIVES OF UK MAMMAL MONITORING
The purpose of this part of the report is to set the scene for the rest. It does so in three somewhat
disparate sections. The first begins with a discussion of what we mean by monitoring and of its
role in conservation, which it is crucial to understand if one is to design good monitoringschemes. We go on briefly to review the status of British and Irish mammals, why we need to
monitor them, and the broad aims of such monitoring.
The second section begins with a brief reminder of the current state of UK mammal monitoring.
It summarises the proposals of MMR (see front of this report for main references) and then
presents our responses to each of them, except for those for which more detailed discussion is
presented in later parts of the report. Section 3 briefly considers how the monitoring is different
from that of birds, to ensure that both the authors and the readers of this report do not make
unwarranted assumptions. The authors, with largely ornithological rather than theriological
experience, are particularly likely to do so. Furthermore, the methods of bird monitoring are so
well-known and well-developed that even non-ornithologists may translate them to mammals
unless they carefully consider the differences.
It is perhaps worth remarking here that, in Part I of the report in particular, we have generally
used BTO examples to illustrate points being made rather than examples from other monitoring
work. While we have no doubt that examples could have been found elsewhere, it has been more
efficient for us to stick to the illustrative examples with which we are most familiar.
1. WHY SUCH MONITORING IS NEEDED
1.1 What is monitoring?
Monitoring is more than surveillance (the documentation of changes over time in the distribution
or abundance of species). It has three additional features (Baillie 1990; Hellawell 1991; Furness
et al. 1993; Greenwood et al. 1993; Greenwood 1999):
1. Objectives and targets
2. Contribution to understanding
3. Stimulating and underpinning action
Effective monitoring involves applying the surveillance to management objectives. For example,
the UK Biodiversity Action Plan (Anon. 1995) has as its overall goal:
To conserve and enhance biological diversity within the UK and to contribute to the
conservation of global biodiversity through all appropriate mechanisms.
On the basis of such broad objectives, specific targets need to be defined - such as the UK
Biodiversity Action Plan targets for mammals (Table I.1.1). We do not address such targets in
this report but note the need not only for them to be established but also for that establishment to
be based on wide consultation. This is because, for many species, there is likely to be a wide
range of people with legitimate interests, such as farmers, foresters, naturalists and shooters;
furthermore, both the extent of their interests and the balance that has to be struck between themare value judgements that should not be made in a democracy without open consultation. The
difficulties in reaching decisions are perhaps illustrated by the fact that the Brown Hare Action

8/18/2019 BTO Research Report No.223 - Developing a Mammal Monitoring Programme for the UK
http://slidepdf.com/reader/full/bto-research-report-no223-developing-a-mammal-monitoring-programme-for-the 20/316
BTO Research Report No.223
July 1999 18
Plan envisages that the species’ numbers are doubled by 2010; yet it is an introduced species that
competes with a native species (the Mountain Hare), leading to an apparent conflict with both the
Habitats and Species Directive and the Convention on Biodiversity (see below).
Surveillance provides the information to judge whether such targets are being attained. If they
are not being met, the monitoring process should ideally: contribute to understanding of why not;contribute to the scientific advice underpinning remedial action; and provide alerts to those
responsible for undertaking such action.
Fig I.1.1 identifies how monitoring supports management. It does so by contributing information
and understanding that provide sound answers to the series of questions shown in Fig. I.1.1.
Note that even if the answer is positive to the most basic question of all (which is whether the
monitoring shows the target for the species to have been achieved), that is not the end of the
matter; monitoring must be maintained (and the question constantly readdressed) in case of
unforeseen changes. If the target is not being achieved, we need to ask whether we know why
(question 2). There may be information external to the monitoring process that helps identify the
reasons but if the monitoring programme has been well-designed, the monitoring alone may well
provide the answer to that question. Whatever the answer, it will lead to a branching network of
further questions and actions. Some of these must be informed by information from fields other
than ecology or conservation (such as economics) or incorporate value judgements (such as the
value people place on being able to watch Water Voles on their local brook) but all of them also
require input of monitoring information. Note that the network is a closed one - all routes
eventually lead back to the continuation of monitoring. This is essential, both to measure the
effectiveness of deliberate management actions (such as legal protection) and to detect new
problems (such as the impact of American Mink on Water Voles).
In the planning of a monitoring programme, it is important to remember that it is indeed amonitoring programme and not a research programme. Monitoring should, of course, contribute
to our understanding of why targets are not being attained and of how management practices may
be altered to improve the prospects of the population of interest. If too much ongoing research is
built into the monitoring programme, however, this may divert resources from the more basic
step of determining whether the population is being maintained at the target level and may result
in much of the research not being focussed on the key issues. As with so many issues in respect
of monitoring, striking the right balance is a matter of judgement.
1.2 The status of British and Irish mammals
The status and history of each species is summarised in Table I.1.2.
Further relevant information on ecology, life history, and behaviour is summarised for the 28
target species considered by MMR in their Appendix 1.1 and Table 1.4; for the other species it
can be found in the Handbook and the Field Guide.
The conservation of a significant proportion of the UK’s species of mammals is governed by
domestic or European legislation (MMR, Chapter 1, Section 3). In more general terms, a very

8/18/2019 BTO Research Report No.223 - Developing a Mammal Monitoring Programme for the UK
http://slidepdf.com/reader/full/bto-research-report-no223-developing-a-mammal-monitoring-programme-for-the 21/316
BTO Research Report No.223
July 1999 19
high proportion of species feature on the “long list” of the UK Biodiversity Action Plan (Anon
1995) (Table I.1.3), although, so far, there are species Action Plans for only a few of them (Table
I.1.1).
1.3 Objectives of mammal monitoring
The Biodiversity Action Plan includes summary actions for monitoring the components of
biodiversity, viz:
The Government and its agencies will:
" examine and develop the integration of monitoring studies and seek to establish
baselines for key components of biodiversity.
" develop UK monitoring schemes to take account of threats and impacts on
biodiversity.
" develop thresholds for conservation action in relation to species population and
habitat change.
The UK Plan was a response to the Convention on Biological Diversity, Article 7 of which
requires contracting parties to:
" monitor through sampling and other techniques the components of biological
diversity paying particular attention to those requiring urgent conservation measures
and those offering the greatest potential for sustainable use.
" maintain and organise by any mechanism data derived from such monitoring
activities.
There is thus an administrative and statutory requirement for monitoring key elements of biodiversity. The administrative requirement is, of course, only there to fulfil deeper objectives,
which are hinted at by the Convention’s stating that particular regard should be paid to species
that are of social, cultural or scientific importance, that are threatened, or that are important for
research into biodiversity and its sustainable use. Broadly speaking, there is an objective of
conservation management, to which monitoring has important contributions to make. The
species listed in the Action Plan (see Table I.1.3) must therefore be prime candidates for
monitoring. Indeed the individual species Action Plans (see Table I.1.1) can only be undertaken
sensibly if monitoring is in place for those species.
Conservation management also underlies the requirement under the Habitats and Species
Directive to maintain or restore the favourable conservation status of nominated species
(comprising, for the UK, Mountain Hare, Common Dormouse, Pine Marten, Polecat, Otter and
Wildcat).
A high proportion of the UK mammal fauna is non-native (Table I.1.2). The Convention on
Biological Diversity requires contracting parties to take action against alien species that threaten
native species. Since all communities are invasible, since the success and impacts of invading
species are unpredictable, and since those impacts on other organisms may be great (Williamson
1996), all aliens pose potential threats. Furthermore, the establishment of any alien reduces the
component of biodiversity contributed by biogeographical differences (!-level diversity in
technical terms). Thus the conservation of biodiversity requires that aliens in particular aremanaged and hence (for the management to be soundly-based) that they are monitored, even if

8/18/2019 BTO Research Report No.223 - Developing a Mammal Monitoring Programme for the UK
http://slidepdf.com/reader/full/bto-research-report-no223-developing-a-mammal-monitoring-programme-for-the 22/316
BTO Research Report No.223
July 1999 20
the management comprises doing nothing unless the alien population begins to grow to a
threatening extent.
Mammals need to be managed (and therefore monitored) for reasons other than their own
conservation. Many, at least sometimes, can cause significant economic damage. Some
represent an economic resource to be exploited, such as the Red Deer that attract both touristsand hunters to the Highlands. Even more broadly, mammals are important because they may
have ecological impacts that affect other species of animals and plants. Their impacts may tend
to be greater than those of many other animals because mammals are individually large;
compared with birds, they are, furthermore, numerous for their sizes (Greenwood et al. 1996).
The most developed wildlife monitoring in Britain and Ireland is that of birds (Greenwood et al.
1993; Greenwood 1999). One value of bird monitoring is that birds can be useful indicators of
environmental conditions (Furness & Greenwood 1993). This is not so much because individual
species indicate particular conditions but because whole suites of species can provide
information on problems in particular habitats (such as the now well-known problems in
farmland, Baillie et al. 1997) or about the effects broad-scale environmental changes (such as
climate change, Crick et al. 1997; Crick and Sparks 1999). Mammals are less useful in this
respect since there are fewer species and since it is impossible to apply a single monitoring
system across more than a few of them. Furthermore, many mammal species are subject to direct
control (or are recovering from past control), so their status reflects the direct impact of man
rather than other environmental factors. Even so, some mammalian species may be useful
indicators - Moles perhaps of ground invertebrates, Water Shrews and Otters of water quality,
Dormice and Yellow-necked Mice of habitat fragmentation, and many species as monitors of
climate change.
In contrast, some mammals are key prey for a range of predators (birds and other mammals) andsome have major impacts on vegetation; they are significant components of ecosystems.
Furthermore, many species are economically important as pests or as game.
Thus, the objectives of mammal monitoring are to provide management information in respect of
individual species of conservation or economic significance and to provide a contribution to the
ecological information that is needed for the conservation of biodiversity.
1.4 Aims of mammal monitoring
1.4.1 Information
Monitoring schemes should aim to provide information, not data. The data are simply the means
to the end, which is the information about changes in status in relation to target and about the
likely reasons for those changes. There are two reasons why we need to be clear on this point.
The first is that the monitoring needs to include provision not just for the collection and curation
of data but also for the interpretation of the data and the reporting of the results, i.e. turning the
data into information.
The other reason for making clear the need for information rather than data is that the data can be
used for purposes additional to the provision of monitoring information. They may be used for
other conservation purposes. They may be used for scientific studies. They may be used forwork of a commercial nature that not only provides employment for staff of the organisation
doing the
8/18/2019 BTO Research Report No.223 - Developing a Mammal Monitoring Programme for the UK
http://slidepdf.com/reader/full/bto-research-report-no223-developing-a-mammal-monitoring-programme-for-the 23/316
BTO Research Report No.223
July 1999 21
work but also produces surplus monies that can help support the other work of the organisation.
They may simply be sold (though in BTO’s experience, while some data are commercially
valuable most are not and the overall cost of a data-provision service is greater than the income it
generates). Mammal monitoring in the UK is likely to involve a number of different
organisations (and very many different individuals). For their collaboration to be effective, theywill need to recognise not only that their roles in the monitoring scheme are different but that so
may be their interests in subsidiary uses of the data. Those who need the conservation
information but not the data need not insist on access to the latter.
1.4.2 Geographical scope
Mammal monitoring must aim to provide information at UK level. It is also desirable that
information is available at national level, i.e. separately for England, N. Ireland, Scotland and
Wales, not only because this is the level of government that is mainly relevant but also because
the ecological circumstances of the four countries are generally different. It would not, however,
be cost-effective generally to run separate schemes in the four countries. Not only would the
cost of doing far exceed the cost of running a UK scheme but insights would emerge less readily
from separate analyses at the country level than from integrated analyses of the data that build on
differences that there may be between the countries. (As examples of the latter approach from
BTO studies, we can quote the understanding we are getting of changes in Welsh wintering
wader populations from analyses at the UK level and insights into farmland bird problems that
come from comparisons between east and west Britain). Thus, UK monitoring needs to cover
each of the four countries adequately but through common rather than separate schemes.
The provision of information at the UK level is a broad aim that does not necessarily mean that
the immediate focus of attention should be the UK population rather than local populations.Some mammals have such disjunct populations that it is not biologically meaningful to speak of
a national population; greater insight is gained by focussing on the separate local populations. It
may even be convenient and effective to use different methods for monitoring such separate
populations. Nonetheless, for administrative and practical purposes it is important that the local
information is drawn together at country or UK level. Furthermore, ecological insights may be
gained from comparisons between populations in different regions. It is therefore important,
even for these species, that the local monitoring fits into a broad national framework. It will
generally be helpful if similar methods are used in different regions, though we acknowledge that
there may be reasons for using different methods that override this general guideline.
Monitoring information is needed at a local level in some cases - for the management of deer populations in specific areas, for example. The uses of such information may be specific to each
locality, so the information required may also be specific. For this reason and because the
detailed monitoring required in these places is not required nationwide, it is not appropriate to
conduct nationwide monitoring at the intensity sometimes needed locally. This is not to say that
local intensive monitoring cannot feed into the national programme; it would be wasteful if it did
not.
Mammal monitoring will produce site-based data. These data are valuable for local planning
purposes. For example, although the whole country is not covered by Badger Groups, the
National Federation of Badger Groups reports that records of Badger setts influence well over100 planning cases a year in Britain (Pat Williams, in Sargent & Morris 1997). Although

8/18/2019 BTO Research Report No.223 - Developing a Mammal Monitoring Programme for the UK
http://slidepdf.com/reader/full/bto-research-report-no223-developing-a-mammal-monitoring-programme-for-the 24/316
BTO Research Report No.223
July 1999 22
monitoring schemes should be set up in ways designed to best fulfil the monitoring aims, we
recommend that consideration should be given to how the data may be made available for site-
based work, the value of doing so, and the additional cost involved. This is likely to involve The
National Biodiversity Network (see Part VI).
Northern Ireland is a special case. It is politically important for monitoring there to fit in withthat in Great Britain, so that a UK overview is possible. Equally the management of Northern
Ireland’s animals will most effectively take place in an all-Ireland context. It would therefore be
useful if the monitoring within the two administrations were comparable (just as, in the bird
world, the Irish Common Birds Survey uses identical methods to the UK Breeding Birds Survey
and there is close co-operation between the Irish Wetland Birds Survey (I-WeBS) and the
Wetland Birds Survey (WeBS)). We recommend that contact be made with Irish agencies at an
early stage, in the hope that at least some of the monitoring that will be established (or continue)
in UK may be extended to (or parallelled within) the Republic of Ireland.
Northern Ireland also has its own landscape characteristics and culture that may mean that
monitoring schemes that are effective in Great Britain are less appropriate there. Time has
prevented us paying much attention to this issue but it needs to be addressed when plans for
particular monitoring schemes are being drawn up.
1.4.3 Habitat information
The interpretation of population data may be considerably enhanced if relevant habitat data are
available, especially if they are gathered at the same time as the population data. We recommend
that this be considered for any mammal monitoring scheme, although the advantages of gathering
habitat information need to be weighed against various possible disadvantages. These could
include putting off volunteer data-collectors and the greater costs of gathering, collating, processing and analysing the data.
An important question is whether to use a common habitat classification for all species or to use
different classifications, appropriate to each species. This issue must be explored when decisions
have been taken about what mammal monitoring is to be undertaken. (To aid integration, BTO
now uses a common habitat classification across most of its schemes (Crick 1992); however,
because many bird species can often be covered by a single method, BTO runs relatively few
schemes). Whatever new habitat classifications are used for mammal monitoring, it is important
that they are as compatible as possible with existing classifications, especially those particularly
relevant to the species in question (e.g. The Environment Agency’s River Habitat Survey
scheme, for riparian species). The key aspect of compatibility is the mapping of classificationson each other: one-to-one, one-to-many, and many-to-one mappings are useful; many-to-many
mappings are not.
1.4.4 Monitoring range
The collation of distribution records in the past has been valuable in demonstrating changes in
range, which have focused conservation attention on problem species. However, with important
exceptions (see below) we agree with MMR that biological recording as currently practised
provides only approximate information on range, especially on range change, mainly because
there is little or no control over the amount of effort devoted to it. Even the breeding bird
8/18/2019 BTO Research Report No.223 - Developing a Mammal Monitoring Programme for the UK
http://slidepdf.com/reader/full/bto-research-report-no223-developing-a-mammal-monitoring-programme-for-the 25/316
BTO Research Report No.223
July 1999 23
atlases, which have both managed to obtain almost complete coverage over just a few years, have
to be used with caution as sources of information on change in range (Gibbons et al.1993;
Greenwood et al. 1997; Donald & Fuller 1998). It will be possible to assess such changes better
in future because the second atlas used a more formal protocol that can be used again. The
success of this approach depends, however, on the ease with which birds may be detected and
the great number of observers available to take part in the fieldwork. It seems unlikely that suchcomplete coverage could be achieved for mammals, although useful distributional surveys of
some species (especially the more apparent ones and those of more restricted distribution) could
be achieved. There are some mammals for which it is important to monitor range but, in general,
we do not believe that it would be wise to devote resources to the promotion of biological
recording that could be used to mount focused schemes to monitor abundance.
Fortunately, monitoring of range generally adds little to monitoring of abundance (providing the
latter is achievable). Indeed, the evidence from birds is that overall abundance is more sensitive
to changing conditions than is range (Donald & Fuller 1998). This is a logical consequence of
the tendency for there to be a correlation between mean abundance at the sites that species
occupy and the number of sites occupied (see, e.g. Holt et al. 1997). Since national abundance is
the product of local abundance and range size, range will necessarily be correlated with national
abundance. The latter is thus generally a better, and largely sufficient, measure of status.
These considerations do not preclude all monitoring of ranges. Indeed, for species that are (or
could be) rapidly expanding their range, monitoring the extent of the range may be significantly
more sensitive, and therefore more important, than monitoring total abundance. For some other
species, range may be so much easier to measure than abundance that it is better to monitor
range. For yet others, useful information on range may be obtained at little extra cost during the
monitoring of abundance. Furthermore, biological recording may provide a useful stop-gap if
there are species for which formal monitoring schemes are unlikely be set up in the foreseeablefuture but this can only be assessed after decisions have been taken about what schemes should
be set up.
Recent work by Chamberlain et al. (1999) is relevant to the interpretation of changes in range.
They found that, while changes in the abundance of declining farmland birds had been most
marked in regions of predominantly arable agriculture in England and Wales, local extinctions
(losses of birds from 10x10km squares) had been most common in regions of predominantly
pastoral agriculture. They proposed two explanations for this, both predicated on pastoral areas
having been less suitable for the species in question, not just in recent years but form the start of
the period that their study covered. The simpler explanation is that the abundance of these birds
has declined in all areas but that this has led to local extinction more in the pastoral areas becausethe birds were initially less abundant there. Under this scenario, reductions in range would be a
sensitive indicator of problems which affect entire ranges. (It would, however, be misleading to
associate the range losses closely with the features of the squares from which species were lost:
such features would at most be correlates of low abundance rather than a local extinction). The
second possibility is that at the start of the study period the pastoral areas were already so poor
for these species that their populations there acted as sinks, maintained only by immigration from
the comparatively better arable areas. As conditions worsened in the latter the supply of
immigrants to the pastoral areas dwindles and the species therefore disappeared. Under this
scenario, the losses of range in the pastoral regions depended on conditions elsewhere, making
them poor indicators of problems locally. Thus the interpretation of changes in range undereither scenario is not straightforward, a further reason for generally concentrating on changes in
abundance where possible.
8/18/2019 BTO Research Report No.223 - Developing a Mammal Monitoring Programme for the UK
http://slidepdf.com/reader/full/bto-research-report-no223-developing-a-mammal-monitoring-programme-for-the 26/316
BTO Research Report No.223
July 1999 24
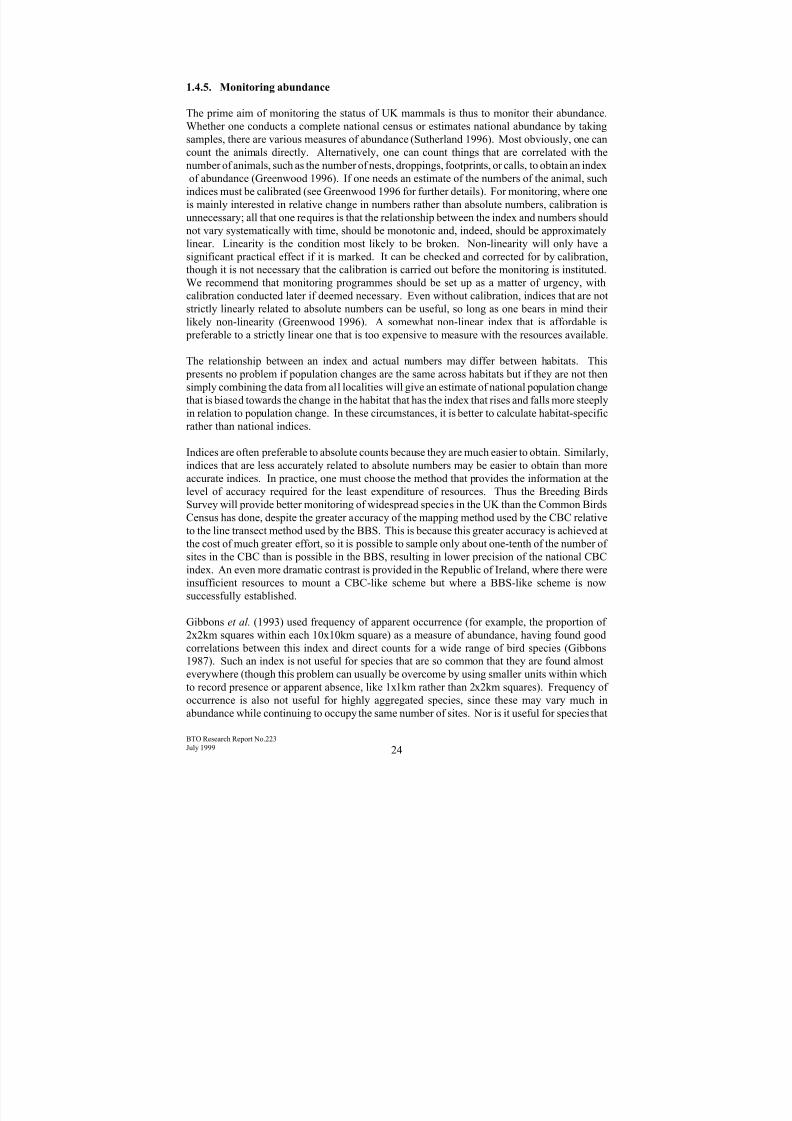
1.4.5. Monitoring abundance
The prime aim of monitoring the status of UK mammals is thus to monitor their abundance.
Whether one conducts a complete national census or estimates national abundance by taking
samples, there are various measures of abundance (Sutherland 1996). Most obviously, one cancount the animals directly. Alternatively, one can count things that are correlated with the
number of animals, such as the number of nests, droppings, footprints, or calls, to obtain an index
of abundance (Greenwood 1996). If one needs an estimate of the numbers of the animal, such
indices must be calibrated (see Greenwood 1996 for further details). For monitoring, where one
is mainly interested in relative change in numbers rather than absolute numbers, calibration is
unnecessary; all that one requires is that the relationship between the index and numbers should
not vary systematically with time, should be monotonic and, indeed, should be approximately
linear. Linearity is the condition most likely to be broken. Non-linearity will only have a
significant practical effect if it is marked. It can be checked and corrected for by calibration,
though it is not necessary that the calibration is carried out before the monitoring is instituted.
We recommend that monitoring programmes should be set up as a matter of urgency, with
calibration conducted later if deemed necessary. Even without calibration, indices that are not
strictly linearly related to absolute numbers can be useful, so long as one bears in mind their
likely non-linearity (Greenwood 1996). A somewhat non-linear index that is affordable is
preferable to a strictly linear one that is too expensive to measure with the resources available.
The relationship between an index and actual numbers may differ between habitats. This
presents no problem if population changes are the same across habitats but if they are not then
simply combining the data from all localities will give an estimate of national population change
that is biased towards the change in the habitat that has the index that rises and falls more steeply
in relation to population change. In these circumstances, it is better to calculate habitat-specificrather than national indices.
Indices are often preferable to absolute counts because they are much easier to obtain. Similarly,
indices that are less accurately related to absolute numbers may be easier to obtain than more
accurate indices. In practice, one must choose the method that provides the information at the
level of accuracy required for the least expenditure of resources. Thus the Breeding Birds
Survey will provide better monitoring of widespread species in the UK than the Common Birds
Census has done, despite the greater accuracy of the mapping method used by the CBC relative
to the line transect method used by the BBS. This is because this greater accuracy is achieved at
the cost of much greater effort, so it is possible to sample only about one-tenth of the number of
sites in the CBC than is possible in the BBS, resulting in lower precision of the national CBCindex. An even more dramatic contrast is provided in the Republic of Ireland, where there were
insufficient resources to mount a CBC-like scheme but where a BBS-like scheme is now
successfully established.
Gibbons et al. (1993) used frequency of apparent occurrence (for example, the proportion of
2x2km squares within each 10x10km square) as a measure of abundance, having found good
correlations between this index and direct counts for a wide range of bird species (Gibbons
1987). Such an index is not useful for species that are so common that they are found almost
everywhere (though this problem can usually be overcome by using smaller units within which
to record presence or apparent absence, like 1x1km rather than 2x2km squares). Frequency ofoccurrence is also not useful for highly aggregated species, since these may vary much in
abundance while continuing to occupy the same number of sites. Nor is it useful for species that
8/18/2019 BTO Research Report No.223 - Developing a Mammal Monitoring Programme for the UK
http://slidepdf.com/reader/full/bto-research-report-no223-developing-a-mammal-monitoring-programme-for-the 27/316
BTO Research Report No.223
July 1999 25
are so difficult to detect in a locality (because they are either scarce or cryptic) that they are
detected in few places; this is because there will be considerable statistical error in measuring
year-on-year change (Box 1). There is no such problem when the species only occurs in
relatively few of the subunits but is readily detectable; in that case, the index of frequency of
occurrence will be low but not subject to great sampling variance.
In using presence/absence records as indices of abundance it is important to bear in mind the
problems of interpreting changes in range (subsection 1.4.4, above). These problems generally
do not affect the interpretation of the proportion of occupied sites in an area as being an index of
average abundance in that area (they may even strengthen it). They do, however, indicate the
need for caution in interpreting losses at individual sites or comparisons of losses between suites
of sites.
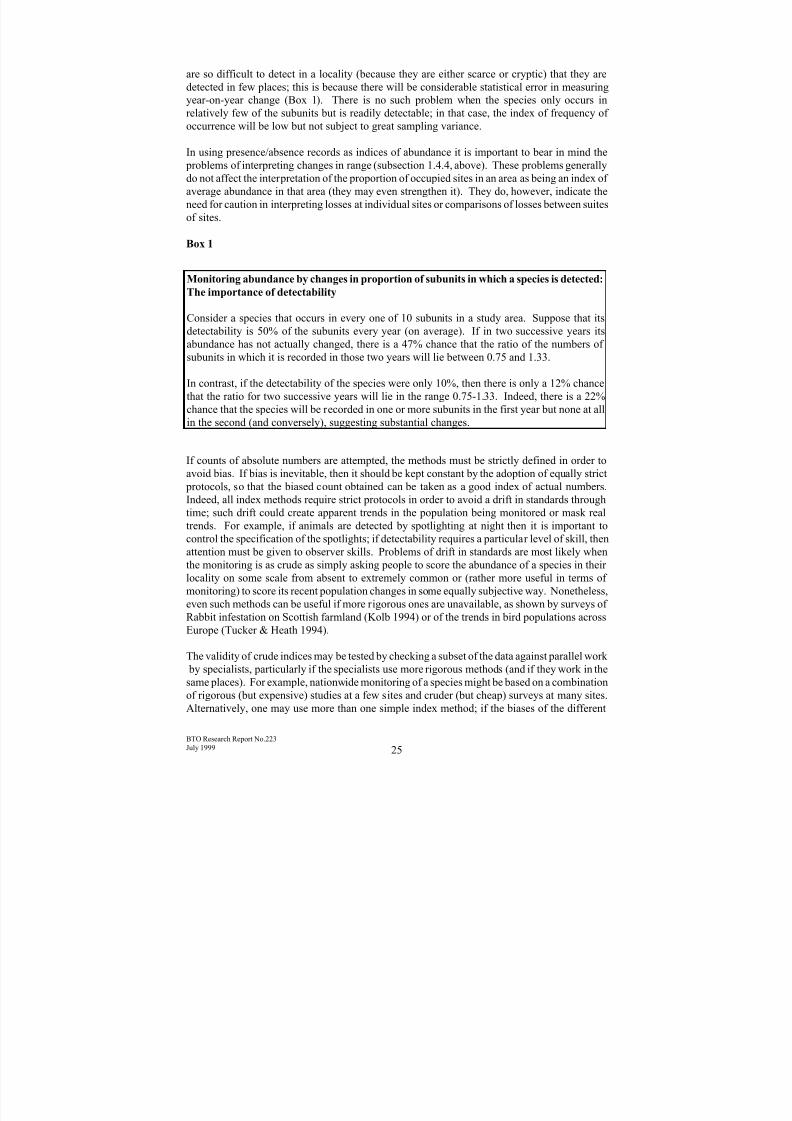
Box 1
If counts of absolute numbers are attempted, the methods must be strictly defined in order to
avoid bias. If bias is inevitable, then it should be kept constant by the adoption of equally strict
protocols, so that the biased count obtained can be taken as a good index of actual numbers.
Indeed, all index methods require strict protocols in order to avoid a drift in standards through
time; such drift could create apparent trends in the population being monitored or mask real
trends. For example, if animals are detected by spotlighting at night then it is important to
control the specification of the spotlights; if detectability requires a particular level of skill, then
attention must be given to observer skills. Problems of drift in standards are most likely whenthe monitoring is as crude as simply asking people to score the abundance of a species in their
locality on some scale from absent to extremely common or (rather more useful in terms of
monitoring) to score its recent population changes in some equally subjective way. Nonetheless,
even such methods can be useful if more rigorous ones are unavailable, as shown by surveys of
Rabbit infestation on Scottish farmland (Kolb 1994) or of the trends in bird populations across
Europe (Tucker & Heath 1994).
The validity of crude indices may be tested by checking a subset of the data against parallel work
by specialists, particularly if the specialists use more rigorous methods (and if they work in the
same places). For example, nationwide monitoring of a species might be based on a combination
of rigorous (but expensive) studies at a few sites and cruder (but cheap) surveys at many sites.Alternatively, one may use more than one simple index method; if the biases of the different
Monitoring abundance by changes in proportion of subunits in which a species is detected:The importance of detectability
Consider a species that occurs in every one of 10 subunits in a study area. Suppose that its
detectability is 50% of the subunits every year (on average). If in two successive years its
abundance has not actually changed, there is a 47% chance that the ratio of the numbers of
subunits in which it is recorded in those two years will lie between 0.75 and 1.33.
In contrast, if the detectability of the species were only 10%, then there is only a 12% chance
that the ratio for two successive years will lie in the range 0.75-1.33. Indeed, there is a 22%
chance that the species will be recorded in one or more subunits in the first year but none at all
in the second (and conversely), suggesting substantial changes.
8/18/2019 BTO Research Report No.223 - Developing a Mammal Monitoring Programme for the UK
http://slidepdf.com/reader/full/bto-research-report-no223-developing-a-mammal-monitoring-programme-for-the 28/316
BTO Research Report No.223
July 1999 26
methods are different and unlikely to drift in the same way, they provide checks on each other.
These two forms of cross-checking are useful if the different types of survey suggest similar
trends. Unfortunately, if they do not then one may have no way of deciding which to believe.
Cost aside, unbiased estimates of absolute abundance are preferable to indices. For this reason,
those contemplating population monitoring may favour the use of Capture-Mark-Recapturemethods. Unfortunately, estimates so obtained are extremely sensitive to the assumptions of the
underlying statistical models and these assumptions are generally unrealistic. This means that,
unless it can be proved that Capture-Mark-Recapture estimates for a particular population are
accurate (by checking against intrinsically more reliable estimates), these estimates themselves
must be treated just as indices. We are not aware of any reason to suppose that they are better
indices than the simple total number of animals captured. Since the latter is more transparent and
requires no calculation beyond counting, we recommend against the use of Capture-Mark-
Recapture unless there are specific and demonstrated reasons for using it in particular cases.
1.4.6 Demographic rates
BTO’s Integrated Population Monitoring programme involves the monitoring of demographic
rates, not just numbers, particularly the productivity of individual nests and the survival rates of
fully-grown birds; as a result, it provides deeper insights into the causes of population changes
(Baillie et al. 1997; Crick et al. 1998; Greenwood et al. 1993). However, this depends on some
of these rates being relatively easy to measure in birds, on a large and experienced network of
nest-finders and bird-ringers, and on 60 or more years of development. We recommend that the
monitoring of demographic rates is not initially taken as a primary aim of the mammal
monitoring programme. Nonetheless, attention should be paid to such information when it arises
from local monitoring work (as it often does in the case of deer, for example) and demographic
data should be obtained where it is easy and cost-effective to do so in the course of monitoring ofnumbers (for example, the reproduction data gathered in the National Dormouse Monitoring
Programme).

8/18/2019 BTO Research Report No.223 - Developing a Mammal Monitoring Programme for the UK
http://slidepdf.com/reader/full/bto-research-report-no223-developing-a-mammal-monitoring-programme-for-the 29/316
BTO Research Report No.223
July 1999 27
2. THE BACKGROUND TO THE CURRENT PROJECT
2.1 Current mammal monitoring in the UK
MMR give a full account of current monitoring. We do not even attempt to summarise it here, as
the picture is so complex. Its chief features are:
1. Many different organisations are involved.
There is very little national co-ordination, sometimes not even between bodies working
on the same species or between projects funded by the same organisations.
2. Not all species are covered
Even for species that are covered, cross-species co-ordination is not common.
3. Some of it is not at the UK, GB or all-Ireland scales
Some projects are restricted to single countries of the UK or to only one administration in
Ireland; others are restricted even more, to just a few much smaller areas.
4. Much is not annual
Some is at longer than annual intervals but fairly regular but much is irregular - including
some schemes that are apparently set up to provide regular monitoring, which may run
for a few years but then close down.
5. Level of refinement varies widely
At one extreme, irregular questionnaire surveys of respondents’ opinions on status
(which provide little hard information); at the other, careful estimates of national
population size (which may provide more than is strictly necessary for monitoring).
6. Reporting is disparate and scattered
Some surveys result in detailed and comprehensive reports; others in no publication at
all. Each project reports separately. The reports appear in a variety of different
publications.
7. The role of volunteers varies widely
Given the diversity of methods appropriate to mammal monitoring, this is inevitable; but
there are some species where volunteers could contribute but do not currently do so.
2.2 MMR proposals
Note that our responses to these proposals are given in Section 2.3, using parallel sub-
subsections for ease of cross-reference.

8/18/2019 BTO Research Report No.223 - Developing a Mammal Monitoring Programme for the UK
http://slidepdf.com/reader/full/bto-research-report-no223-developing-a-mammal-monitoring-programme-for-the 30/316
BTO Research Report No.223
July 1999 28
2.2.1 What species?
MMR were asked to consider only a restricted list of species - those without asterisks in the table
of species at the front of this report.
2.2.2 What is to be measured?
MMR propose particular methods suitable for individual species. Many of them involve the use
of indices of relative change but there is also considerable emphasis on estimating absolute
population sizes where possible.
2.2.3 Integration across species
MMR propose a scheme (the MaMoNet) in which all species are monitored in the same
10x10km and 1x1km squares of the OS grid.
2.2.4 The three-tiered structure and the Master Squares
To maximise effectiveness, MMR propose a three-tiered structure for the MaMoNet: Master
Squares, Rich Interest Kilometre Squares, and Focus Zones.
The Master Squares form the core of the MaMoNet. They are 10x10km OS squares. On the
basis that the sampling intensity used in the Water Vole and similar surveys has proved
satisfactory, MMR propose that 18% of the squares should be sampled. The sample squares
would be chosen at random.
Within each of the Master Squares, five 1x1km squares would be the basic survey units. Withineach, methods appropriate to each species would be used to measure numbers or an index of
abundance. For example, using a standard protocol, a 1x1km square could be completely
searched for Badger setts, whereas one might search only a fixed length of river-bank for Water
Voles. If other than a complete search is conducted, MMR recommend placing the actual survey
location randomly within the square (or within suitable habitat).
To improve effectiveness, MMR recommend that the location of the 1x1km survey units is
stratified. Stratifications suggested are: habitat (e.g. woodland, riparian, rough grassland, other),
historical versus new survey sites and random versus systematic components of the Master
Square sample (see 2.2.10).
2.2.5 The seven-year cycle
MMR recommend that the monitoring takes place on a seven-year cycle. In the first two years,
surveys would be conducted of woodland squares (using methods appropriate to that habitat and
to the species within it); the next two years would be devoted to riparian sites; the next two to
other sites; the seventh to intensive analysis and writing up of major reports. “Mandatory rapid
turn-around of customised feed-back material from the Central Office to the field workers and
collaborating organisations” would take place throughout the cycle.
2.2.6 Rich Interest Kilometre Squares

8/18/2019 BTO Research Report No.223 - Developing a Mammal Monitoring Programme for the UK
http://slidepdf.com/reader/full/bto-research-report-no223-developing-a-mammal-monitoring-programme-for-the 31/316
BTO Research Report No.223
July 1999 29
These would be sites that have been surveyed in the past (particularly those covered in formal
nationwide surveys) but which do not fall within the random sample of Master Squares. MMR
propose that some at least of these should be surveyed as part of MaMoNet, to provide
comparison with the past.
2.2.7 Focus Zones
The third tier of the MaMoNet would comprise sites where intensive investigations should be
carried out. MMR suggest two sorts of Focus Zones:
intensive studies of local populations, providing detailed ecological understanding;
more intensive surveys than provided by the network of Master Squares in regions of
particular significance, such as the region bordering the current main distribution of the
Polecat (into which the species may be expected to spread).
As MMR remark, Rich Interest Kilometre Squares and Focus Zones grade into each other,
especially in respect of the class into which historical study sites should be placed.
2.2.8 Manpower and costs
MMR envisage a professional team of staff, operating in two groups: a central office staff of
three scientists and managers (plus a half-time secretary) and a peripatetic team of five full-time
and five part-time fieldworkers (who would also do much of the data entry).
In addition, MMR envisage volunteer participation in the work of MaMoNet, suggesting twosources in particular: unemployed graduates, vacation students, and gap-year students; Mammal
Society members and others recruited through ‘The Look Out For Mammals’ and similar
projects. However, they conclude that: “for the foreseeable future professional Mammal
Monitors comprise the metaphorical skeleton of the MaMoNet, to which ever more volunteers
add increasing muscle bulk”. They suggest that professionals would mainly cover the Master
Squares, with volunteers being used mainly for RIKS.
Finally, MMR suggest an Advisory Panel to provide input from all the collaborating parties and
from technical experts.
Box 2 shows the cost of the MaMoNet, based on figures provided in MMR.
2.2.9 Utilising existing and ancillary schemes
MMR consider how periodic national surveys (such as the Water Vole survey) could be moulded
into the MaMoNet (see below). They appear to envisage, however, that existing monitoring
effort will contribute only in so far as the personnel might be redeployed to participate in
MaMoNet - e.g. stalkers who currently contribute to the various deer-monitoring programmes
could carry out deer surveys in Master Squares.
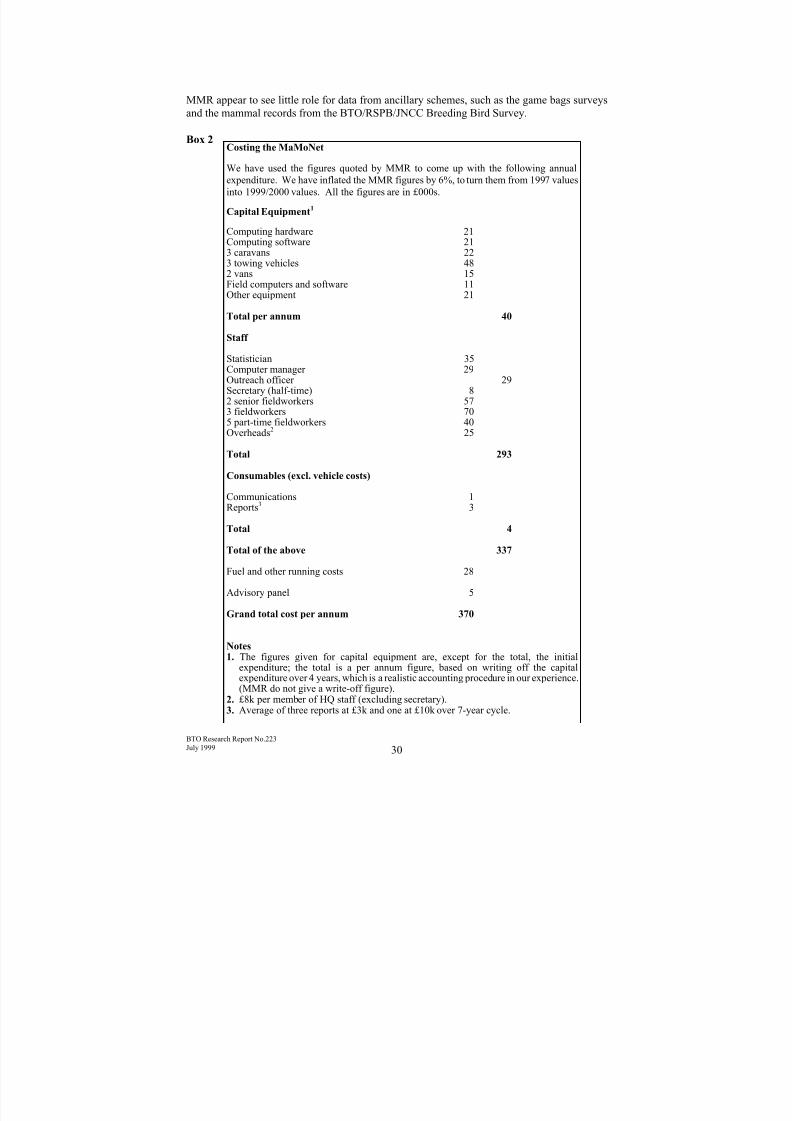
8/18/2019 BTO Research Report No.223 - Developing a Mammal Monitoring Programme for the UK
http://slidepdf.com/reader/full/bto-research-report-no223-developing-a-mammal-monitoring-programme-for-the 32/316
BTO Research Report No.223
July 1999 30
Costing the MaMoNet
We have used the figures quoted by MMR to come up with the following annual
expenditure. We have inflated the MMR figures by 6%, to turn them from 1997 values
into 1999/2000 values. All the figures are in £000s.
Capital Equipment1
Computing hardware 21Computing software 213 caravans 223 towing vehicles 48
2 vans 15Field computers and software 11Other equipment 21
Total per annum 40
Staff
Statistician 35Computer manager 29Outreach officer 29Secretary (half-time) 82 senior fieldworkers 57
3 fieldworkers 705 part-time fieldworkers 40Overheads2 25
Total 293
Consumables (excl. vehicle costs)
Communications 1Reports3 3
Total 4
Total of the above 337
Fuel and other running costs 28
Advisory panel 5
Grand total cost per annum 370
Notes 1. The figures given for capital equipment are, except for the total, the initial
expenditure; the total is a per annum figure, based on writing off the capitalexpenditure over 4 years, which is a realistic accounting procedure in our experience.
(MMR do not give a write-off figure).2. £8k per member of HQ staff (excluding secretary).3. Average of three reports at £3k and one at £10k over 7-year cycle.
MMR appear to see little role for data from ancillary schemes, such as the game bags surveys
and the mammal records from the BTO/RSPB/JNCC Breeding Bird Survey.
Box 2

8/18/2019 BTO Research Report No.223 - Developing a Mammal Monitoring Programme for the UK
http://slidepdf.com/reader/full/bto-research-report-no223-developing-a-mammal-monitoring-programme-for-the 33/316
BTO Research Report No.223
July 1999 31
2.2.10 Setting up the MaMoNet
MMR propose that the first seven-year cycle be regarded as an Exploratory Cycle, in that results
obtained during it should be used to modify the methodology.
They also propose that, to provide continuity with existing surveys, the Master Square sample isnot randomised at the start of the MaMoNet scheme. Rather, the first cycle would use the “QQ
grid” that was used in the Water Vole survey. (The QQ grid is a systematic grid of 10x10km
squares, with randomly located 1x1km squares within it). Subsequently, a proportion (e.g. 20%)
of the QQ squares would be randomly substituted in each cycle by the same number of squares
drawn at random. Once the substitution had reached a certain stage (e.g. 60% of the squares
being random), there would be no further substitution, so that long-term continuity would be
conserved.
2.2.11 Sampling with partial replacement (SPR)
MMR recommend that the random Master Squares should neither all be reselected during each
survey cycle nor all be retained in perpetuity. Rather, they recommend that most are retained
from one cycle to the next but that there is a 20% (for example) turnover in each cycle, with 40%
retained in perpetuity.
In respect of 1x1km survey squares within each Master Square, MMR recommend that the same
ones are used throughout the period for which that Master Square is retained in the MaMoNet
sample.
2.3 Aims of the current project
2.3.1 General aims and species to be considered
The MaMoNet is a carefully thought-out scheme that would deliver high quality information on
Britain and Ireland’s mammals were it to be implemented. It is, however, expensive and it is in
the form of such an integrated package that it is not clear how it could be modified (say by
dropping some components, by relaxing statistical rigour, or by making more use of ancillary
data) to be less expensive but still provide effective monitoring. We have been asked to provide
a series of costed options that would allow the conservation authorities to pick out a set that
would provide them with what they believe to be the most cost-effective mammal monitoring
that would satisfy their needs.
We have also been asked to consider all the mammals living at liberty in the UK, not just the
restricted list that MMR has asked to address.
In the rest of Section 2.3, we briefly review the design issues raised in Section 2.2 (using
corresponding subsection numbers, for ease of cross-reference). More detailed considerations of
the statistically formal design are covered in Part II and of volunteer input in Part V.
2.3.2 What is to be measured?
8/18/2019 BTO Research Report No.223 - Developing a Mammal Monitoring Programme for the UK
http://slidepdf.com/reader/full/bto-research-report-no223-developing-a-mammal-monitoring-programme-for-the 34/316
BTO Research Report No.223
July 1999 32
The bedrock of the monitoring must be the surveillance of status - primarily abundance but range
in certain circumstances (Sections 1.4.4 and 1.4.5. above). Surveillance does not, however,
require absolute measurement of abundance, merely measurement of relative change, which may
be easier (Section 1.4.5). As MMR demonstrate, measuring absolute abundance allows one to
build spatial, habitat-related models of mammal distribution (using the powerful tool of GIS ifappropriate). This is not the chief aim of monitoring but is a useful piece of associated research
that may help illuminate some of the key questions that arise if management targets are not
attained (Fig. I.1.1). If absolute abundance can be measured with little more effort than
measuring relative change it is therefore worth measuring it. Otherwise, it may be better to
concentrate on relative change and to mount special surveys or research projects when the
monitoring reveals problems.
Absolute abundance estimates are also required for Population Viability Analysis, also
considered by MMR. We are unconvinced of the value of PVA for the conservation of the native
mammal fauna of the UK, given that long before a species had declined to such an extent that it
was threatened by the stochastic processes to which PVA is relevant (demographic stochasticity,
loss of genetic variation, environmental catastrophe) we would expect the conservation
authorities not only to have been alerted (by the monitoring) but to have taken the necessary
measures to have reversed the decline. Furthermore, the history of various mammals in Britain,
which have recovered from low numbers or expanded from very small numbers of introduced
individuals, leads to some doubt as to the applicability of the available PVA models. We note
that MMR consider that one of the primary roles of PVA “will be for providing insight into the
relative benefits of alternative population or habitat management strategies”. We believe that
direct studies of the effect of habitat management on the species in question are more likely to
provide useful guidance.
2.3.3 Integration across species
It can be useful to monitor different species in the same sites, as one can then conduct site-by-site
analyses of the influence of species on each other (e.g. the demonstration that Sparrowhawk
Accipiter nisus and Magpie Pica pica predation is not generally the cause of declining songbird
populations in Britain, Thomson et al. 1998). Indeed, developing a series of representative
1x1km squares to provide a general sampling framework for the UK has been a subject of much
discussion. There are potential practical benefits to using the same squares for all species. For
example, permission has only to be sought once; the corresponding disadvantage is that a
landowner who is faced with (or fears being faced with) people coming back time and time again
to monitor one thing after another may be more inclined to refuse access than one who is askedfor permission simply to monitor one species. Another potential advantage is that the
fieldworkers will become familiar with the area, which may be advantageous; conversely, they
may get bored and either do the work less well or not do it at all.
Using the same places for different species has the particular disadvantage for British mammals
that several species have already been subject to national surveys using different sample sites; to
move them all onto a common series of sites would lose the considerable advantages of historical
continuity of sample sites (see Part II). A more generally practical problem is that different
species may require sampling on different scales (e.g. 40x40m trap grids for mice, 10x10km
squares for deer) or in different habitats (e.g. riparian, reedbed and woodland specialists).Further, the optimal pattern of sampling over the UK will differ between species; Badgers, e.g.,
may need to be sampled everywhere, whereas Polecats need to be sampled intensively on the

8/18/2019 BTO Research Report No.223 - Developing a Mammal Monitoring Programme for the UK
http://slidepdf.com/reader/full/bto-research-report-no223-developing-a-mammal-monitoring-programme-for-the 35/316
BTO Research Report No.223
July 1999 33
margins of their range, perhaps less intensively within their core range and scarcely at all in the
rest of the country. Finally, landowners may change management practices if they perceive that
their land is in some way special, thus rendering it no longer an unbiased sample of the
countryside.
For these reasons, we would not generally support using the same sample locations for allmammals, though we acknowledge that there may be value in having common locations for
species that are likely to interact directly.
2.3.4 The Master Squares
We take up issues of sample distribution, intensity of sampling and stratification in Part II.
2.3.5 The seven-year cycle
A seven-year cycle is too long for smaller mammals, which may show considerable short-term
fluctuations. If the number of Weasels is 20% lower in 2010 than it was in 2000, how do we
now that this is a long-term decline rather than a short-term hiccup, perhaps caused by peculiar
weather? We need annual monitoring both to be able simply to distinguish long- from short-term
changes and to be able to estimate the effects of weather and similar variables (Baillie 1990).
It is true that, if a change can be assumed to be constant, then the most effective way of
measuring it is to study large samples of sites at long intervals rather than just a few sites every
year, but the assumption of constancy flies in the face of our knowledge of the natural history of
many British animals. We recommend that monitoring should be annual for species that are
likely to show short-term fluctuations.
There may sometimes be other reasons (such as keeping a team of observers together) that favour
annual surveys. Equally, for some species, practical reasons may make it desirable to undertake
major surveys at infrequent intervals rather than to attempt annual surveys. If so, this has to be
considered alongside the desirability of annual monitoring and a decision reached about the
relative cost-effectiveness of different frequencies of monitoring. This will be a species-specific
(or, at least, scheme-specific) decision. To impose the same frequency of survey on all species
would be inefficient.
Note that the interval between surveys may be adjusted in the light of experience. Where there is
doubt about the appropriate interval, it is perhaps best to err on the side of caution starting with a
relatively short interval at first and extending it if experience shows a longer interval to be permissible.
In working on this project, we have been alert to the possibilities of hybrid approaches, i.e. major
surveys at long intervals combined with smaller-scale annual surveys, the former to give long-
term precision, the latter to provide information on short-term variation.
2.3.6 Rich Interest Kilometre Squares
Our considerations of sampling design (Part II) cover these.
8/18/2019 BTO Research Report No.223 - Developing a Mammal Monitoring Programme for the UK
http://slidepdf.com/reader/full/bto-research-report-no223-developing-a-mammal-monitoring-programme-for-the 36/316
BTO Research Report No.223
July 1999 34
2.3.7 Focus Zones
We recommend that special intensive study sites should be included in the monitoring scheme
only if monitoring is the prime focus of the study. If the prime focus is demographic or other
ecological investigation, the methods may not be appropriate for monitoring. It would notusually be cost-effective to constrain the methods of the intensive study in order to fit it into the
monitoring scheme (or vice versa).
In contrast, we support the suggestion that monitoring may need to focus on particular
geographical regions for some species.
2.3.8 Manpower and costs
We consider that the cost figure derived from MMR (Box 2) is only c.80% of the true cost of
employing the number of staff involved, despite the salaries proposed by MMR for fieldworkers
being higher than we believe is necessary. The reason is that MMR propose overhead rates that
are unrealistically low - only 26% even if everything but the direct costs of running the vehicles
and the Advisory Panel costs are excluded. This is substantially less than is charged by any
organisation we know that has to cover its costs, as well as being substantially less than
government guidelines to universities. In addition, we believe that MMR have underestimated
the true cost of running the vehicles.
Note, furthermore, that we have made no attempt to estimate whether the man-power estimates
listed by MMR are correct but we suspect that they are too low. We note, in particular, that their
seven-year cycle involves two years’ fieldwork on riparian habitats, two on woodlands and two
on other habitats; yet the latter comprise the bulk of the country and may be expected to demandfar more fieldwork.
We consider other ways of monitoring mammals, particularly the use of volunteers, later in this
report. These have significant impacts on costs.
2.3.9 Utilising existing and ancillary schemes
Those conducting existing or ancillary schemes may have their own reasons for continuing to
conduct them in much the same way as they do at present. For example, The Deer Commission
for Scotland has a specific remit, for which it needs to conduct its current surveys of deer; it is
presumably unlikely to abandon its current surveys in order to participate more directly in a UKmonitoring scheme. The information from its work is, however, considerable and it would be
unwise not to use it as part of the overall UK monitoring of deer. It may not be easy to combine
it with information from other schemes, such as these conducted by the Forestry Commission, by
The British Deer Society, by MoD, by BASC etc. (and then with information from any new
scheme designed to cover the gaps); and the combination of such disparate sets of information
may not provide a simple index of the state of the nation’s deer. Nonetheless, bringing all this
information together will be more cost-effective than to base our monitoring on some new
scheme that ignores all these continuing sources of information.
Of course, even greater cost-effectiveness may be achieved if it is possible for existing schemes
to modify their procedures with the aim of improving their contribution to the nationalmonitoring programme.

8/18/2019 BTO Research Report No.223 - Developing a Mammal Monitoring Programme for the UK
http://slidepdf.com/reader/full/bto-research-report-no223-developing-a-mammal-monitoring-programme-for-the 37/316
BTO Research Report No.223
July 1999 35
2.3.10 Setting up the mammal monitoring programme
We agree with MMR that the early stages of any new programme should be regarded as
exploratory. In terms of methodology for individual schemes, we urge that such exploration
occurs as quickly as possible, so that the work can settle into long-term protocols that deliver
reliable monitoring within a very few years. More broadly, we advise that it would beinadvisable to set up the entire suite of desired monitoring schemes all at once. There are three
reasons for this. First, some new schemes (and, indeed, some continuing schemes that require
substantial modifications to existing practices) will probably demand more resources at first than
they need later, especially if volunteer-based (because of the effort needed to recruit
participants). Second, some schemes may need to be preceded by pilot work to ensure that the
best methods and design are chosen. Third, the extent to which volunteers are prepared to
participate is likely to increase with experience. It would thus be wise to begin an overall
programme with fewer schemes than it is intended eventually to run, building in new schemes as
the original ones get established.
2.3.11 Sampling with partial replacement
The issue of Sampling with Partial Replacement is taken up in Part II.

8/18/2019 BTO Research Report No.223 - Developing a Mammal Monitoring Programme for the UK
http://slidepdf.com/reader/full/bto-research-report-no223-developing-a-mammal-monitoring-programme-for-the 38/316
8/18/2019 BTO Research Report No.223 - Developing a Mammal Monitoring Programme for the UK
http://slidepdf.com/reader/full/bto-research-report-no223-developing-a-mammal-monitoring-programme-for-the 39/316
BTO Research Report No.223
July 1999 37
3. HOW THE MONITORING OF MAMMALS IS DIFFERENT FROM
THAT OF BIRDS
3.1 Mammals are less easily detectable than birds
Because mammals are less easily detectable than birds, simple counts may reveal only a small proportion of the population present in an area. Thus, they provide an index that may be less
closely linked to the true population than would be a count of, say, singing Whitethroats Sylvia
communis on a warm morning in early May.
If people go out to record mammals they may see none at all, resulting in a loss of motivation.
To boost the frequency of observations, it may be necessary to trap mammals or to substitute
observation of the animals themselves with observations of their signs. Trapping is generally
more demanding of human and financial resources than is simple observation. The use of signs
may demand special training and raises the problems of standardisation common to almost all
index methods (see Section 1.5.6).
3.2 Identification
Apart from some groups of small mammals and mustelids, mammals are generally at least as
easy to identify as birds. Indeed, a rather higher proportion may be identifiable by the non-
specialist than is the case for birds, raising the possibility of drawing relatively inexperienced
observers into the monitoring of some species.
3.3 More species-specific techniques are needed for mammals than for birds
A high proportion of terrestrial bird species can be covered by the Breeding Bird Survey (BBS),of freshwater and estuarine species by the Wetland Birds Survey (WeBS), and of seabirds by
general counts at colonies. In contrast, most potential monitoring surveys for mammals cover
only single species or a small group of species. In designing such surveys, one must try to find
ways of including as many species as possible in each, without unduly compromising the quality
of the data for individual species.
3.4 Availability of personnel
There are far fewer amateur mammal enthusiasts than there are birdwatchers, so there is a
smaller pool of potential volunteer recruits for survey work. This problem may be rather less
severe than one might imagine at first sight, however, because amateurs who regard themselvesas interested in mammals tend to have a rather more scientific (or, at least, committed) interest
than do many birdwatchers; “twitching” has not distracted mammal-watchers. Furthermore, it is
clear that there is considerable potential for building up volunteer network for mammal
monitoring (Part V). (It is true that Burnett, Copp and Harding (1994) reported that there were
c.100 times more biological records referring to birds in the UK than those referring to
mammals, suggesting a huge imbalance of observer effort. However, a large proportion of the
bird records result form there having been three atlases of bird distribution and from bird-
ringing. The latter alone produces almost a million records each year).
8/18/2019 BTO Research Report No.223 - Developing a Mammal Monitoring Programme for the UK
http://slidepdf.com/reader/full/bto-research-report-no223-developing-a-mammal-monitoring-programme-for-the 40/316
BTO Research Report No.223
July 1999 38
In contrast, a significant proportion of the admittedly small number of academic theriologists still
feel able to engage in survey and monitoring as part of their academic work. Unfortunately,
retirements and the relentless pressure to engage in theoretically more exciting work may quickly
deplete the ranks of this group of scholars.
3.5 Diversity of existing inputs is greater for mammal monitoring
Most bird monitoring is organised by BTO, WWT, RSPB and JNCC, between whom there is
close liaison. Thus bird monitoring is well integrated. As is made clear elsewhere in this report,
recent and current mammal monitoring is conducted by a great variety of organisations: some do
national work on one or a few species, others work only locally; individual bodies may conduct
one-off surveys but not repeat them, or may mount schemes that last just a few years. Some
effort may be needed to pull this diversity of interest together (as is essential if UK mammal
monitoring is to be developed properly) but we do not believe that this will be a major problem.
3.6 There is no commitment to long-term monitoring of mammals
Whereas the ornithological bodies have managed to build up a level of commitment to long-term
monitoring (including some commitment to the funding that makes it possible to keep schemes
going in practice), this has not been the case for most mammal monitoring. Some guarantee of
funding is essential if cost-effective monitoring is to take place. Otherwise, we will continue to
waste resources (both human or financial) on a series of short-term initiatives that do not provide
the long-term monitoring that is needed.
3.7 Mammals are generally less mobile than birds
Birds are sufficiently mobile for it to be useful to think of a “British population” for manyspecies. For mammals it will often be more illuminating simply to draw together the monitoring
information for different regional populations rather than to combine it into some sort of national
index, since the regional populations are affected by regional management and environment and
since they exchange few individuals. There may, of course, be an administrative need to report
at UK (or country) level but for actually managing the animals we need the regional information.
This presents no problems for species that are already well-monitored for management purposes,
such as Red Deer. Indeed, given that such species may be monitored differently in different
places (by different organisations!), it is an advantage, because formally combining the regional
data into a national index may not be easy. For other species, it may be difficult to obtain
enough data to provide reliable indices at scales less than the whole UK; if we have to accept
that, then we must still remain alert to the likelihood of regional differences in population trends.
Lower mobility may mean that mammals treat the environment as more ‘fine-grained’ than do
birds, so that populations may vary more from place to place within a habitat than do those of
birds of corresponding size. This may be particularly important for surveys of small mammals
based on trapping, where a sample area may typically be one hectare or less; larger sample areas
would smooth out the spatial variation in small mammal numbers but may be practically
inconvenient.
3.8 Many mammals occur in many different habitats

8/18/2019 BTO Research Report No.223 - Developing a Mammal Monitoring Programme for the UK
http://slidepdf.com/reader/full/bto-research-report-no223-developing-a-mammal-monitoring-programme-for-the 41/316
BTO Research Report No.223
July 1999 39
This has several consequences. First, it is especially important to ensure that all habitats are
adequately represented in the national sample, since population changes may differ between
habitats. Unfortunately, because mammals are difficult to detect, it may be necessary to use
different field methods in different habitats. For example, deer in open country may be assessed
best by direct observation but in woodland by signs, whereas birds can be directly observed (bysight or sound) in both habitats, using methods such as distance sampling to correct for the
difference in detectability between habitats this may mean that monitoring information for deer
in the different habitats cannot be formally combined.
If there are economic reasons for focusing attention on a species in some habitats (for example,
Grey Squirrels in forestry but not in gardens), this may result in a disparity between habitats in
levels of work and, therefore, in level of information.

8/18/2019 BTO Research Report No.223 - Developing a Mammal Monitoring Programme for the UK
http://slidepdf.com/reader/full/bto-research-report-no223-developing-a-mammal-monitoring-programme-for-the 42/316
BTO Research Report No.223
July 1999 40
8/18/2019 BTO Research Report No.223 - Developing a Mammal Monitoring Programme for the UK
http://slidepdf.com/reader/full/bto-research-report-no223-developing-a-mammal-monitoring-programme-for-the 43/316
BTO Research Report No.223
July 1999 41
PART II. CONSIDERATIONS OF DESIGN AND STATISTICS
1. INTRODUCTION
1.1 Why revisit these issues?
MMR cover many of these issues in some detail. Our purposes in revisiting them are: to remind
readers of key points, to introduce some points not covered by MMR, and to make a closer
connection between some of the matters of statistical nicety and those of practical possibility.
Some of the points we make are elementary; we make no apologies for this, because getting the
design of surveys right is so important.
1.2 Statistical nicety or practical pragmatism?
The purpose of scientific investigations is to draw conclusions about the natural world. The
purposes of survey design and statistical analysis are to maximise the efficiency of that process
and to minimise the possibility of the wrong conclusions being drawn. In simple situations, the
statistical design and analysis may almost completely remove the need for the scientist to make
subjective judgements. For example, if one were to count all the individuals of a highly
conspicuous and easily identifiable species in a truly random sample of 1ha plots in Great
Britain, one could arrive at an unbiased estimate of the total GB population (with reliable
confidence limits) simply by applying standard statistical techniques. In most real cases,
however, the investigator would have to make judgements about the extent to which individuals
may have been missed in the counts (or counted twice), the extent to which such counting
problems differed between plots, the extent to which randomly chosen plots that could not be
counted because of access problems were likely to have more or fewer animals than the average,etc. Such judgements will determine how accurate the investigator judges the population
estimate to be - i.e. how close it is likely to be to the true population size. Accuracy thus defined
is affected by two consequences of the methods used - whether they give biased results (i.e.
whether the estimates are systematically different from the true values in one direction or the
other) and whether they give precise results (i.e. whether repeating the study would produce a
closely similar estimate). In general, it is impossible simultaneously to minimise bias and
maximise precision. We make these elementary points because so much attention is usually paid
to minimising bias, both during the education of ecologists and in the design or interpretation of
ecological fieldwork, that there is a tendency to neglect the simultaneous need to maximise
precision; the overall need is to achieve the most accurate estimates possible (given the resources
available), by striking the optimum balance between minimising bias and maximising precision.
The point can be illustrated by example. Suppose that one is monitoring a species and has
decided that action should be taken to conserve it if its numbers fall by 25% over 25 years.
Suppose that one adopts a monitoring method that estimates the population size after 25 years to
be 90% of its original size and that this estimate is absolutely unbiased; but suppose further that
the lack of bias has been purchased at the cost of low precision, so that the confidence limits of
the estimate are 60% and 150%. This information is of limited practical use. In contrast, if one
had adopted an admittedly biased method that gave confidence limits of 87% and 93% and had
good reason to suppose that the bias was unlikely to be more than a few percent, then one could
conclude that it was unlikely that the 75% alert limit had been exceeded, a useful conclusion. AsYates (1981) wrote: “The investigator must also avoid attaching exaggerated importance to

8/18/2019 BTO Research Report No.223 - Developing a Mammal Monitoring Programme for the UK
http://slidepdf.com/reader/full/bto-research-report-no223-developing-a-mammal-monitoring-programme-for-the 44/316
BTO Research Report No.223
July 1999 42
minor sources of bias which, in fact, can only produce errors which are trivial relative to the
random sampling error”.
Unfortunately, bias is rarely measurable in practice, so the balance between bias and precision is
a difficult one to strike and generally depends on subjective judgements. So long as the
judgements about bias are based on the best information about the natural history of the subjectspecies and are made explicit to those involved in using the results, one is justified in using
methods that are not completely unbiased.
Recommendation:
* Be prepared to abandon absolutely unbiased methods if practical considerations dictate
that overall accuracy is higher for somewhat biased methods - but make explicit the
likely sources and magnitudes of bias. To avoid post hoc controversy, seek wide
agreement about the likely sources and magnitudes of bias before finalising plans for the
monitoring scheme.

8/18/2019 BTO Research Report No.223 - Developing a Mammal Monitoring Programme for the UK
http://slidepdf.com/reader/full/bto-research-report-no223-developing-a-mammal-monitoring-programme-for-the 45/316
BTO Research Report No.223
July 1999 43
2. THE SPATIAL DISTRIBUTION OF SAMPLING
2.1 Generalising from samples
To know the population size of an animal in Britain, we would ideally count every individual
directly - i.e. conduct a census. This is usually impossible in practice, if for no other reason thancost. Instead, we count sample areas and generalise from them to the whole country. The
process of generalisation is straightforward when the samples are taken through a formal,
properly randomised design. If they are not, the reliability and extent of the generalisation are a
matter of judgement. The worst case occurs when, for practical reasons, it is only possible to
study a single site: not only may this site be atypical but one has no direct knowledge of how
atypical it might be, having to rely on knowledge of the species, the habitat and of similar cases
to judge the reliability of conclusions drawn from just the one site. Sometimes the conclusion
may be that knowledge of one site is better than no knowledge at all; sometimes one may reach
exactly the opposite conclusion, in that the cost of being misled by information derived from just
one site is so great that it is better to have no knowledge at all.
The reliability of information derived from a single site depends on how representative it is of
the whole country. This has to be a matter of careful judgement. Unfortunately, naive
judgements about how typical is a site may be seriously awry: a “typical” oak woodland is more
likely to resemble some sort of idealised oak woodland (rarely observed in real life) rather than
an average oak woodland. Assumptions and assertions of typicality thus need particularly
critical examination.
Even if a site is not truly representative, there may be good reasons for studying it. Thus the
sites in the Environmental Change Network (ECN) are mostly not typical of the British
countryside: some were chosen for study because they had special features or were idealexamples of a particular habitat; most are managed differently from the wider countryside,
sometimes because they are long-term ecological study sites! Nonetheless, the view was taken
that, for the purposes for which ECN was set up, the sites were sufficiently representative of the
rest of Britain that the information derived from them would be sufficiently capable of
generalisation. The benefit of establishing a set of truly representative sites for the ECN, rather
than using the existing long-term study sites, was judged not to be sufficient to justify the cost of
doing so. Similar practical considerations must illuminate the establishment of mammal
monitoring.
Multiple sample sites, as in ECN, have the advantage that the differences between them provide
information on how atypical each is likely to be of the whole population and therefore howreliable one’s generalisations are likely to be. Formally, provided the samples are truly random,
one can place confidence intervals on statistical estimates derived from multiple samples. Thus,
where possible, monitoring should be conducted at more than one site.
2.2 Sources of imprecision in sample surveys
Generally speaking, the precision with which population means are estimated will increase with
the square root of the number of samples, but precision of the overall mean also depends on the
precision with which measurements are made at each sample site. There is often a trade-off:
more effort devoted to improving the precision of counts at individual sites means that there isless effort available for covering more sites. Texts on survey design provide methods for
8/18/2019 BTO Research Report No.223 - Developing a Mammal Monitoring Programme for the UK
http://slidepdf.com/reader/full/bto-research-report-no223-developing-a-mammal-monitoring-programme-for-the 46/316
BTO Research Report No.223
July 1999 44
optimising the distribution of effort in such cases (e.g. Greenwood 1996). It has been suggested
that such cost-benefit analysis in survey-design may often not be worth the effort, at least unless
one pays careful attention to the design of the pilot studies that are used to provide information
for the cost-benefit analysis (McArdle & Pawley 1994). However, the extent to which the
recently-developed BTO/JNCC/RSPB Breeding Bird Survey (many sites, relatively
undemanding work at each) provides better bird-monitoring at the national scale than theCommon Birds Census (comparatively few sites, each studied intensively) shows the value of
choosing the right design. For some mammal monitoring, rather little background information is
available on which to base design judgements; it may be necessary to conduct pilot studies to
provide the necessary information or to treat the first few years of a new monitoring scheme as a
trial. (See also Part I, Subsection 2.3.10).
A great imponderable for surveys that use volunteers is the level of participation to be expected.
One has little alternative but, having decided what level of participation is the minimum to make
the planned survey effective, to use the experience of those involved in organising similar
surveys in the past to judge whether that level of participation is likely to be attained.
2.3 What population is of interest?
Design texts lay great stress on the need to define what is the statistical population about which
one is wishing to make inferences. Unless one does this, one’s survey is likely to be both
inefficient and misleading.
It is possible in principle to design surveys that will provide efficient and unbiased estimates of
population change at the national level - i.e. the focus is on the national population.
Paradoxically however, there are several reasons why having the national population as the
immediate focus of the survey design may not be efficient for the monitoring of that population.The first we have covered in Part I, Subsection 1.4.2: where populations in different parts of the
country are rather isolated from each other, greater insight is obtained by treating each as a
separate entity than by aiming to obtain some measure that relates to the “national population”;
the national perspective that is required can be obtained from drawing together the information
about the individual populations.
There may be some geographical regions or habitats that contain so few of the species in
question that the effort involved in surveying these places is not worthwhile as, for example,
Badgers in urban areas (Cresswell, Harris & Jefferies, 1990). If so, it is best to omit those
regions or habitats from the sampling programme. Given the extreme fragmentation of habitats
in much of the UK and the fact that the smaller mammals in particular do not move far,selectivity of sampling may need to be fairly fine-grained. The information one gets from such
selective sampling is, of course, relevant only to that part of the national population that lives in
the parts of the country included in the survey; but if this is clearly most of the national
population, that is enough for practical purposes. There is a proviso, however, in respect of
surveys that are undertaken for monitoring purposes, since monitoring is concerned with change
rather than with absolute numbers and change may, in some circumstances, be more marked in
places where a species is scarce than where it is abundant. It is true that because such places
hold only a small proportion of the national population the changes occurring in them (unless
hugely different from the changes elsewhere) will have little impact on the national population
index. However, knowing that there have been marked changes in such places may well be ofmuch more relevance to conservation than knowing that the national population has changed
rather little. For example, a species may be more sensitive to environmental change in marginal

8/18/2019 BTO Research Report No.223 - Developing a Mammal Monitoring Programme for the UK
http://slidepdf.com/reader/full/bto-research-report-no223-developing-a-mammal-monitoring-programme-for-the 47/316
BTO Research Report No.223
July 1999 45
rather than in core areas, or we may need to assess how well a species, such as the Polecat, is re-
occupying its former range, or we may need to assess how rapidly a species such as the Grey
Squirrel is spreading and thus increasing its impact on other species. Thus whether or not to
leave places with few of the species out of a survey must be a case-by-case decision as to
whether such places are of special interest - Focus Zones, in MMR terms.
It may be necessary to leave out some places because they are difficult to work in or to access.
This is acceptable for monitoring if one knows that the animal is relatively scarce in the excluded
areas or if one can reasonably assume that the changes in those areas are unlikely to be markedly
different from those in the rest of the country; otherwise, one simply has to admit ignorance of
the excluded sector of the population. If the excluded places are left out according to clear
criteria that can be related to habitat, the effect of leaving them out can be explicitly and clearly
addressed. If they are left out on a more ad hoc basis, there is often a tendency to gloss over the
possible effects; this should be avoided. For example, it may be reasonable to assume, in some
circumstances, that places to which observers are refused access are representative of the
countryside as a whole, so the exclusion does not bias the results. The refusal may, however, be
linked to land-management practices that may affect the mammals being monitored (such as
Pheasant-rearing) or, indeed, to the fact that illegal methods of control are being practised; if so,
one has to accept that the population being studied is not that of the countryside as a whole but
only a (rather ill-defined) part of it and that the results may not accurately reflect the population
in the areas excluded from the survey.
Another situation in which one monitors only parts of the national population is when one is
using existing schemes that are designed to provide monitoring of local populations (such as
much deer monitoring) or of particular habitats (such as surveys of rodent infestation of houses).
The extent to which it is appropriate to rely on such schemes depends on how representative are
the populations they cover of the national population and on the expense of mounting surveysthat would be more representative.
Appropriate monitoring techniques may differ between habitats. If so, it is sensible to design
one’s monitoring programme as a set of surveys, one for each of the habitats; each provides
information on the population in that habitat. The way in which that information is brought
together and used for national monitoring will depend both on statistical constraints and on
needs; if the index in habitat A has gone up by X% and that in B by Y%, one can only produce
an index of change in the national population if one knows the relative sizes of the populations in
A and B - but that index is probably less revealing than are the separate indices for the two
habitats.
For some species, useful information may arise from more than one monitoring scheme. For
example, Grey Squirrels might be monitored by presence/absence in volunteers’ gardens,
through presence/absence in Woodland Trust reserves, through numbers seen on Breeding Bird
Survey transects, and by frequency of occurrence of signs in hair tubes in plantations. None of
these provides an index for the national population (or even that of a well-defined geographical
region or habitat). Furthermore, the population to which each relates may be rather ill-defined
(such as: “Grey Squirrels that use gardens at the times of day when volunteers are observing and
that are bold enough to be observed”) and may overlap with the populations covered by other
schemes. Nonetheless, if the suite of schemes is taken as a whole and interpreted carefully, it
will provide useful information for conservationists.

8/18/2019 BTO Research Report No.223 - Developing a Mammal Monitoring Programme for the UK
http://slidepdf.com/reader/full/bto-research-report-no223-developing-a-mammal-monitoring-programme-for-the 48/316
BTO Research Report No.223
July 1999 46
Finally, the interpretation of indices (rather than true counts) in terms of the population being
studied is important. If Red Foxes in forests are monitored by counting scats along the edges of
rides, one is monitoring not the Red Fox population in the forests but that proportion of the
population that defecates along rides; the extent to which such Red Foxes are representative of
the whole population must be explicitly considered not only when the survey is being designed,
but also when the data are interpreted. The consideration must not only involve knowledge ofRed Fox behaviour but also of the external factors that may be relevant, such as the likely impact
of ride management on defecation behaviour. (In addition, as with all indices, one must consider
how the relationship between the index and the population that is being monitored varies. For
example, the number of ride-defecating Red Foxes may stay the same but the index may change
because the defecation rate varies seasonally or because the detectability of scats by observers
varies according to vegetation growth.)
Recommendations:
* Treat isolated populations as separate targets for monitoring.
* Leave areas sparsely populated by the species in question out of the study, unless
changes occurring there are likely to be of special interest.
* Be prepared to leave out areas that are difficult to cover but make as explicit as possible
the criteria for omission and the likely resultant biases.
* Use existing local schemes as part of the national programme if this adds useful
information, even if they use non-standard methods.
* Treat the populations in various habitats as separate targets for monitoring if different
methods have to be used in the different habitats.
* Especially if no one scheme provides unbiased information on the national population,
be prepared to use multiple schemes for monitoring a single species.
* Be particularly aware that indirect indices may refer to only part of the total population.
2.4 Randomisation
It is well-known that the only way to obtain a sample that is truly representative of the
population as a whole is to select which areas to sample by a formal randomisation process.
Informal, haphazard processes are rarely truly random. Selecting “typical” sites is usually
grossly non-random, suffering both from the misapprehensions about what is truly typical and
from the failure to include a representative range of sites.
Unfortunately, many practical constraints make randomisation difficult or at least costly. Many
of these have been considered in the last section - places or habitats where the species is scarce,
difficulties of access, etc. If these practical difficulties interfere with full randomisation, onemust carefully consider what exactly is the population that is being studied and then consider
how typical it is likely to be of the wider population that is the true focus of interest. In other
words, what bias is involved in using the non-random sample to estimate the changes going on in
the wider population?
Recommendation:
* If practical problems rule out proper randomisation, make the likely biases as explicit as
possible.
2.5 Species restricted to special habitats of limited extent
8/18/2019 BTO Research Report No.223 - Developing a Mammal Monitoring Programme for the UK
http://slidepdf.com/reader/full/bto-research-report-no223-developing-a-mammal-monitoring-programme-for-the 49/316
BTO Research Report No.223
July 1999 47
Riparian species present particular difficulties. It is not practically effective to choose study sites
completely at random, since the majority of them will then not contain riparian habitat nor,
therefore, the species in question. For example, the pilot Waterways Breeding Bird Survey
achieved markedly better coverage than the Breeding Bird Survey of many riparian species, e.g.
36% of WBBS sites occupied by Dippers compared with 2% of BBS sites, 31% vs 4% forCommon Sandpipers, and 41% vs 6% for Grey Wagtails (Marchant & Gregory 1999). There
were similar differences for mammals, although the mammal data were collected incidentally to
the bird data and are therefore perhaps less reliable: e.g. Otters on 14% of WBBS sites, Water
Vole on 9% and American Mink on 8%, with almost none of these species being recorded on
BBS sites (Marchant & Gregory 1999 and Part III).
It is easy enough to randomise at a coarse scale - for example, by choosing a sample of 10x10 km
squares within which to survey the species in question. The difficulty lies in defining and
identifying riparian habitat within such areas - when is a ditch too narrow or too dry to be
included? Whatever method is used to pick which stretches of waterway to survey, one must
consider carefully how this will bias the results. Another problem is how large a sample one
should take within each 10x10km square; in principle, one should sample the same proportion of
available habitat in each square, not the same absolute quantity. If one does not sample the same
proportion and if the density of animals per km of habitat varies according to the amount of
habitat available, then one’s sample will provide a biased estimate of population size. Even if
density does not vary according to the amount of habitat available, sampling that is not
proportionate to the amount of habitat available may result in substantial inflation of the error
variance of one’s estimates of mean numbers or changes in numbers (Cochran 1977, section
11.2). In this respect, the methodology of Otter surveys, sampling at 5km intervals along every
waterway in the selected 10x10km squares, has been superior to that of Water Vole surveys, in
which exactly five samples were taken in each selected square.
Similar considerations apply to other special habitats, some of which may be of very limited
extent. Small mammals that occupy field margins, but not the cropped area of farmland, may
pose particular problems.
Recommendations:
* For surveys limited to special habitats, make as explicit as possible both the criteria used
to define the places to be sampled and the potential biases.
* The number of samples of a special habitat to be taken within higher level sampling
units (such as 10x10km squares) should preferably be proportional to the amount of that
habitat present in the higher units.
2.6 Systematic surveys
Systematic surveys comprise those surveys in which the country is covered by a grid and cells of
the grid are included in the sample not at random but in some sort of pattern. MMR consider the

8/18/2019 BTO Research Report No.223 - Developing a Mammal Monitoring Programme for the UK
http://slidepdf.com/reader/full/bto-research-report-no223-developing-a-mammal-monitoring-programme-for-the 50/316
BTO Research Report No.223
July 1999 48
problems resulting from systematic sampling at some length. Our aim is briefly to review and
assess the magnitude of these.
The most obvious problem is that the pattern of the sampling may coincide with a pattern in the
distribution of the organisms being monitored. This could easily happen, for example, if one
studied soil invertebrates on a hillside that had been subject to periglacial sorting of the soil, producing some sort of patterned ground, but we believe that mammals are unlikely to show
regular patterns in distribution or numbers at scales that would coincide with sampling patterns
based on the national grid.
A more subtle problem, to which MMR pay much attention, is that estimates of the error
variance of population means that are based on the assumption of random sampling are likely to
be wrong if sampling is systematic. The direction and extent of the biases in the estimates of
error and ways of obtaining unbiased estimates have been addressed in the technical literature
(e.g. Bellhouse 1988; Murthy & Rao 1988). Unfortunately, they depend very much on the type
of geographical trends and patterns present in the study population and how the pattern of the
sampling relates to these (which determines the spatial correlation between samples), about
which we are likely to know little in practice. However, both theory and simple simulations
suggest that when the total number of potential sample units (e.g. 1x1km squares of the national
grid) is large then the bias in estimating the error variance is likely to be small.
MMR also point out that the fact that the “false origin” of the Ordnance Survey grid was not
randomly located raises difficulties in statistical theory, although these are unlikely to be other
than trivial in practice.
To test out the effects of systematic versus random sampling, MMR used Countryside Survey
data on habitat distribution taking the latter as an example of a spatial distribution comparable tothat of mammals. They found no obvious biases in estimation of either means or standard errors
when comparing systematic with random sampling. We agree with their conclusion that the
theoretical reasons for preferring random sampling are unimportant in practice.
Advantages of systematic sampling pointed out by MMR are that it is easier for the layman to
understand and that the sample units are easier to locate. Perhaps even more important, a regular
grid makes the description and analysis of geographical patterns easier. Such patterns may be
important in understanding population changes in distribution or abundance.
Note that, in refusing to follow statistical purists in condemning systematic sampling, we follow
one of the masters of sampling methodology, who recognised that it would generally provesatisfactory except for material that had periodic features (Yates 1981).
Recommendations:
* Generally choose random sampling but adopt systematic sampling if this is practically
more convenient or if information about geographical patterns is required.
2.7 Study sites chosen by the observers
Study sites chosen by observers are likely to be unrepresentative: they may be “typical” (i.e.
atypical, see Section 2.1 above), chosen for reasons (such as accessibility) with which the

8/18/2019 BTO Research Report No.223 - Developing a Mammal Monitoring Programme for the UK
http://slidepdf.com/reader/full/bto-research-report-no223-developing-a-mammal-monitoring-programme-for-the 51/316
BTO Research Report No.223
July 1999 49
abundance of mammals may be linked, or chosen because they have good populations of the
species in question. In principle, such biases are undesirable. In practice, however, it may be
better to get information from such sites than to get none at all.
Note that schemes in which observers choose where to go within a randomly chosen 10x10km
square (for example) may be less biased than those in which there is absolutely free choice - butthey cannot be bias-free.
Recommendation:
* Be prepared to use study sites chosen by observers (rather than randomly allocated) if
this is the only way to achieve enough sites but explicitly address the biases that may
result.
2.8 Sampling at more than one level
Suppose that traps are difficult to transport long distances but relatively easy to transport short
distances. If one decides to set traps in a 40x40m grid at each sampling location, one could have
such sites scattered across the country; but this would involve long distances between the sites.
Alternatively, one might choose a set of 1x1km squares to which to take traps and then choose a
set of 40x40m squares within each to be the sites at which one does the trapping; the 1x1km
squares would still be at long distances apart but the small squares within each would be within
easy distance of each other. This is an example of two-level sampling, which may be adopted for
various practical reasons. If sampling is random at both levels, statistical interpretation is
straightforward. The principle can be extended to more than two levels. The relative number of
sample units to take at each level in order to maximise efficiency depends on relative costs (see
e.g. Cochran 1977; Greenwood 1996).
If the sampling is non-random at any level, then the total sample is non-random - the
randomisation at other levels does not compensate for the non-randomness at the one level. As
always, judgement about likely bias must be made before one adopts non-random choice.
If non-random choice is at the lowest level, it may be circumvented simply by combining the
data within each of the low-level groups, which are now treated as “clusters” rather than as sets
of independent samples. In the trapping example for instance, moving the traps between five
(say) random 40x40m squares within a 1x1km square may be too burdensome; as an alternative,
one might choose one such 40x40m square as the starting point, then set the traps during the next
four successive weeks in four squares 100m away from the first one, to the north, east, south and
west. To analyse the data, one then lumps the results from each of these clusters of five. Suchcluster-sampling allows more data to be gathered without expending the effort that full
randomisation may require; the benefit is achieved at the cost of having rather broader
confidence limits on one’s results than if the design were fully randomised.
Recommendations:
* If practical considerations suggest that it may be appropriate to sample at more than
one level, pure random sampling or cluster sampling should be adopted if possible.
Beware of bias entering at any level.
2.9 Many small samples or fewer larger ones?
8/18/2019 BTO Research Report No.223 - Developing a Mammal Monitoring Programme for the UK
http://slidepdf.com/reader/full/bto-research-report-no223-developing-a-mammal-monitoring-programme-for-the 52/316
BTO Research Report No.223
July 1999 50
Since the samples in a cluster are lumped, each cluster is effectively one sample. Thus cluster
sampling is an example of taking fewer larger samples than many small ones. Another example
might be sampling 100 2x2km squares rather than 400 1x1km squares. To get the same area
covered, taking fewer, larger samples (and clusters) is generally practically more convenient than
taking many small ones - travel costs are likely to be lower, for example, but there is a cost tothis, in that (because of the spatial autocorrelation between the parts of the larger samples, or the
components of the clusters), the standard errors of the statistics that are estimated from the data
will be higher. Cochran (1977) shows how to optimise cluster-sampling designs for a given cost
(i.e. how many clusters of what size) and similar considerations apply when optimising the
balance between number and size of samples.
For volunteer-based surveys, optimising the distribution of sampling effort will be more difficult
because it will depend on predicting the responses of potential volunteers to various possible
designs. For example, suppose that volunteers can easily walk several 1km transects. For the
same total distance walked by a volunteer, precision will be greatest if his or her transects were
part of a completely random sample; it would be less if they were randomly distributed within a
fixed 10x10km square (itself randomly chosen, one hopes), even less if they were randomly
distributed within a 5x5km square, and least if they were in adjacent 1x1km squares, but
volunteers would rate these four designs in reverse order in terms of ease, so one would be able
to recruit more people to the statistically less effective designs. Given that the likely reactions of
volunteers to different designs are likely to be unknown in advance (unless some sort of opinion
poll is undertaken), this aspect of survey design may depend largely on the judgement of those
with good previous experience of organising such work and on their ability to balance
theoretically probity with practicalities.
Recommendation:* Try to optimise the distribution of survey effort, in terms of number and size of samples,
even though this may be difficult to predict for volunteer-based work.
2.10 Stratification: general
In the most recent national Badger survey, OS grid squares were each assigned to one of seven
land class groups; sampling was random within each group, not over the total set of squares
(Wilson, Harris & McLaren 1997). A similar procedure has been used in surveys of Brown
Hares, Red Foxes and bats. This is an example of stratified sampling: the potential sample units
are divided up into sets (strata) and randomly sampled from within each set rather than from the
entire population. The sets may be defined according to any relevant criteria, such as geography,land class, habitat, or observer availability, depending on the purpose of the stratification.
Because stratified sampling adds to the complexity of organising a survey, it is important not
only to be aware of its potential benefits but also to assess the likely magnitude of those benefits.
One purpose of stratification may be to ensure that all administrative divisions are adequately
covered by the sample. For surveys involving hundreds of sample sites across the UK, adequate
samples of each of the four countries (and of the English government regions) will be obtained
without stratification. For smaller regions (should it ever be necessary to focus on such fine
scales), stratification would be needed to ensure adequate coverage of each.
Stratification may also be needed to ensure adequate coverage of all habitats or land classes,which may be important if one wishes to use between-habitat differences to explain changes in
abundance or distribution. Again, if the size of such strata is not too small, adequate sampling of
8/18/2019 BTO Research Report No.223 - Developing a Mammal Monitoring Programme for the UK
http://slidepdf.com/reader/full/bto-research-report-no223-developing-a-mammal-monitoring-programme-for-the 53/316
BTO Research Report No.223
July 1999 51
each will happen without stratification. Since the most efficient distribution of sampling effort
for exploring differences between strata is similar to that for precise estimates of the national
statistics, the guideline that Cochran (1977) provides for the latter can be used here: if non-
stratified sampling is likely to provide samples of 20 or more in each habitat, stratification is not
needed at the sampling stage; post-stratification (Section 4.3, below) will be sufficient. Thus it is
only likely to be needed if some of the habitats cover less than 10% of the country.
Another reason for stratification arises from the need to replace some of the sample sites over the
years because, for example, land-owners decide to withdraw permission. To keep the
characteristics of the sample as constant as possible, one could replace sites that drop out with
other sites from the same strata, as has been done in Badger surveys (S. Harris, pers. comm.).
This is likely to be important if the turnover of sample sites is large or is concentrated in some
strata.
Stratification also allows sampling to be more efficient as a means of assessing the national
population size or population change. By concentrating sampling effort where variation is
greatest (which for monitoring means spatial variation in changes in abundance over time),
greater precision is obtained per unit effort; the same is achieved by concentrating it where
sampling is easiest (cheapest). The ways of optimising the distribution of sampling between
strata according to differences in variation and in cost are well known: sampling should be
concentrated more on strata that have large between-locality, within-stratum variance in numbers
and that are relatively cheap to sample (e.g. Cochran 1977; Yates 1981; Greenwood 1996).
However, McArdle and Pawley (1994) point out that one needs good information on within-
stratum variation to achieve the optimum design and they suggest that it may often not be worth
the effort. Unless strata differ markedly in the magnitude of the between-locality variance in
population size or change or in the cost of taking samples, optimum stratification produces
relatively little gain compared either with including the same proportion of each stratum in theoverall sample (as has been attempted with several recent mammal surveys) or with pure random
sampling combined with post-stratification (Section 4.3, below).
If stratification is used to improve the efficiency with which the national mean is estimated, it is
probably unnecessary to use more than about six strata (Cochran 1977). We suggest that a
similar number is appropriate if the focus is on using between-stratum differences to understand
a species’ ecology: to use more would run the risk of obscuring major patterns with incoordinate
detail, as well as of having sample sizes for some strata that were too small to provide precise
enough statistics.
Decisions not to sample areas, habitats or land classes that hold few animals or that are particularly difficult of access (see 2.3, above) are an extreme case of stratification - they involve
identifying strata that provide so little information relative to the cost of getting it that there is
little point in sampling them at all.
If habitat-related stratification is to be used in mammal monitoring, it is important to use relevant
strata. If stratification is being used because of major differences between strata in variance or
cost (so that stratification is needed to optimise efficiency), then the distribution of samples
between strata needs to be species-specific. Furthermore, different stratum divisions may be
appropriate for different species. On the other hand, it would be practically convenient to use the
same system for most species; this would also make the analysis of species interactions easier.Several surveys of mammals have already used the ITE Land Classes as the basis of
stratification, generally on the four or seven aggregate landscape groups rather than the 32 basic
8/18/2019 BTO Research Report No.223 - Developing a Mammal Monitoring Programme for the UK
http://slidepdf.com/reader/full/bto-research-report-no223-developing-a-mammal-monitoring-programme-for-the 54/316
BTO Research Report No.223
July 1999 52
Land Classes, the latter rightly being considered to be too finely divided for the purpose. The
ITE system underpins the GB Countryside Surveys, thus allowing monitoring based on these
Land Classes to be linked to the data that they provide. Unless there are particular reasons for
using other stratifications for other species, it would be appropriate to continue to stratify by
aggregated Land Classes, such as the ten of ITE’s Division 3 or the four of Division 4 (Bunce
1992).
Note that, for administrative reasons, these 32 Land Classes have now been modified somewhat
differently in Scotland and in England and Wales, in that Land Classes that are scarce in
Scotland have been combined with similar but commoner Land Classes for Scottish purposes and
similarly for England and Wales (Barr 1998). Furthermore, the Northern Ireland Countryside
Survey used a different landscape classification from that used in Great Britain. Thus
stratification will need in future to be at two levels: first by geography (three - or perhaps four-
strata), then by Land Classes that are somewhat different in the different countries. We
understand that analysis of CS2000 may use three aggregate Land Classes in England and Wales
(two lowland, one upland) and a different three in Scotland (one lowland, two upland). There are
enough data from previous mammal surveys to test whether this level of aggregation is sufficient
or whether it would be better to use more strata for mammal monitoring schemes.
Recommendations:
* Adopt stratification for mammal monitoring if there are good reasons for doing so for
the species in question (This may need some simulation work relevant to individual
species, based on existing data and realistic assumptions). If there are no particular
reasons for stratifying, and it is easier not to do so, then do not bother.
* Unless there are particular reasons for doing otherwise, stratify by aggregate ITE Land
Classes.
2.11 Focus Zones may be strata
A particular form of stratification arises for species where Focus Zones have been identified. To
pursue the example in Part I, Subsection 2.3.3, Polecat sampling could be conducted on the basis
of three strata: one, regions with no Polecats (sampling intensity zero); two, regions on the edges
of the Polecat’s range (Focus Zones - high intensity of sampling); three, core Polecat range
(moderate sampling intensity). However, if it is appropriate to use different methods in different
regions, the latter can no longer be considered to be strata in a single survey; rather, they are
subdivisions of the national population for which different monitoring schemes are being
operated.
2.12 Stratification by observer availability
Concentrating sampling effort where there are relatively more volunteer observers (see above) is
another example of stratification. The costs of sampling in the different parts of the country may
not be explicit in this case, since they are chiefly the indirect costs of drumming up support, but
these certainly differ according to the availability of volunteers (with the complication that
within any one region the costs rise disproportionately with the number of observers required -
the 21st observer is more difficult to recruit than the first). If one were simply to choose
potential sample sites at random across the whole country and then only use those for which it is
possible to recruit observers, bias will creep in at two levels. First, whole areas of the country(e.g. the Scottish Highlands) will be under-represented; second, places within local areas that are
closer to peoples’ homes are likely to be over-represented. These problems have both been
8/18/2019 BTO Research Report No.223 - Developing a Mammal Monitoring Programme for the UK
http://slidepdf.com/reader/full/bto-research-report-no223-developing-a-mammal-monitoring-programme-for-the 55/316
BTO Research Report No.223
July 1999 53
addressed in the BTO/JNCC/RSPB Breeding Bird Survey. First, the country is divided into
regions and the sampling intensity in each adjusted to the availability of observers; by
appropriately weighting the data from each region, an unbiased national index can be obtained.
Second, potential sample sites within regions are randomly ordered and are allocated to
observers in that order, so that a site that is close to potential observers cannot be included until
all sites before it in the list have been included, even if some of these are distant. Difficulties arestill encountered in large, sparsely-populated regions: it may be impossible to persuade anyone to
cover a remote square that is early in the list, even though there are plenty who are prepared to
cover less remote squares. Once again, if the patchy distribution of observers cannot be fully
overcome by using methods such as used by BBS, one has to consider carefully the likely biases
that will result.
It is, of course, important not just to take steps to overcome the problems arising from variation
in availability of observers but to take steps to reduce that variation. Recruitment efforts should
be particularly intense in poorly populated regions. Volunteers may also be supplemented with
professionals in such regions but we regard this as a last resort if the scheme is meant to be
volunteer-based: it adds significantly to costs and sets an undesirable precedent.
Recommendation:
* In schemes that are largely volunteer-based, consider stratifying by observer availability
as an effective means of avoiding bias while achieving large sample sizes in those regions
where it is possible.
2.13 Statistical power
Many of the recommendations above are designed to maximise statistical power (the ability to
detect important changes in numbers). The matter should also be looked at the other way round:For a given cost and sampling design, what is the power of the scheme to detect changes in
numbers of a certain magnitude?
MMR present considerable discussion of the issues of statistical power to detect trends and
validation of survey methods. They generally fail, however, to justify the choice of sampling
design and recommended sampling size for individual species in terms of the power that these
will have to detect trends that are considered important to conservationists. This can only be
done formally by using species-specific data on the scale of geographical variation in the
magnitude of temporal changes and on the extent of short-term fluctuations, since both of these
determine the variance of any estimate of trend. Where the requisite data are not available,
informal estimates based on scraps of relevant data, on related species, and knowledge of thespecies’ natural history can be made. We have not had time to conduct the necessary analyses.
Instead, we have used our experience in avian monitoring, knowledge of species’ natural history
and population ecology, and expert advice to come up with suggestions for suitable sample size
for each species. This will allow decisions to be made as to what schemes it would be useful to
attempt to run. After that, it would be wise to undertake more formal statistical analyses to
confirm the suggestions that we have made for the species that it has been decided to cover.
As a general guideline in discussions on the size of schemes to run, one should note that
precision will generally increase according to the square root of sample size. Thus, to halve the
width of one’s confidence limits, one would need to quadruple the sample size. Moreoptimistically, if one can tolerate confidence limits twice as wide as have been (or may be)

8/18/2019 BTO Research Report No.223 - Developing a Mammal Monitoring Programme for the UK
http://slidepdf.com/reader/full/bto-research-report-no223-developing-a-mammal-monitoring-programme-for-the 56/316
BTO Research Report No.223
July 1999 54
obtained with an existing (or planned) survey, one can reduce the sample size to only 25% of the
current (or planned) number.
8/18/2019 BTO Research Report No.223 - Developing a Mammal Monitoring Programme for the UK
http://slidepdf.com/reader/full/bto-research-report-no223-developing-a-mammal-monitoring-programme-for-the 57/316
BTO Research Report No.223
July 1999 55
3. THE TEMPORAL DIMENSION OF SAMPLING
3.1 The importance of historical continuity of sample sites
Monitoring necessarily entails taking samples repeatedly over time. There are two extreme possibilities, to choose the sample locations independently on each occasion (Fig. II.3.2A) or to
use the same locations on each occasion (Fig. II.3.2B). (We consider intermediate cases in the
next section). Using the same localities has three advantages. The first is concerned with
avoiding bias. Suppose that, however carefully the protocol for choosing sample sites is defined,
there is a subjective element in it. If different sites are chosen on each occasion, there is no
guarantee that the subjective element will remain constant; thus a change in the sample mean
over time may not, not because there has been a change in the population mean but because the
bias is changing. This problem is circumvented if the same sample sites are used on every
occasion. It can probably also be circumvented in most cases by using careful and consistent
protocols for choosing study sites, so it is not a strong reason for sticking to the same sites on
every occasion.
Much more important is the value of historical continuity for increasing the precision of one’s
estimates of change. This is because the error variance of the estimate of change contains two
components if one uses independent samples - that due to differences between sites in average
numbers and that due to differences between sites in the change in numbers. The former, which
is typically large, is removed if one uses the same sites on each occasion, so the change in
numbers is estimated more precisely. An illustrative example of the effect on precision is given
by Greenwood (1996). The number of breeding territories of Chaffinches Fringilla coelebs were
counted in each of two years on 65 English farms; in one simulation exercise, an independent
sample of 20 was drawn from the population of 65 farms in each year (five squares falling in both samples by chance); in another, the same sample of 20 farms was used in the two years; in
both cases, the sample data were used to estimate the change in mean numbers between the two
years. The confidence limits of these estimates were five times wider for the independent
samples than for the constant sample. In a national programme, it is likely that there would be
much less (if any) overlap between independent samples drawn in different years, so the
confidence limits of the estimate of change under that protocol would be even greater. If the
Chaffinch result is typical, it means that historical continuity delivers an improvement in
precision equivalent to more than doubling the sample size. This is a powerful advantage.
The third advantage of historical continuity is that (unless the sampling intervals are greater than
a few years) it requires less time to be spent in seeking access permission. In our experience, thetime taken in getting initial permission is an order of magnitude greater than the time taken in
renewing that permission annually.
There could be a corresponding disadvantage to historical continuity: that land owners may be
less prepared to grant access for a survey that will continue indefinitely into the future than for a
one-off survey. We do not believe that this is generally the case.
Another disadvantage to long-term continuity is that land-owners may change their management
as a result of the regular visits of those conducting the monitoring. They may, on one hand,
manage the land more sympathetically for the wildlife; on the other hand, through having theirattention drawn to a species that they may consider to be a problem, they may take steps to
control its number or even to eliminate it from their land. If these steps are illegal (or likely to

8/18/2019 BTO Research Report No.223 - Developing a Mammal Monitoring Programme for the UK
http://slidepdf.com/reader/full/bto-research-report-no223-developing-a-mammal-monitoring-programme-for-the 58/316
BTO Research Report No.223
July 1999 56
attract public opprobrium), they may then deny access to the land! We do not believe this
problem to be a general one but it needs to be considered for a few species, of which Badger is
perhaps the most obvious.
A final disadvantage of revisiting the same sites, especially for single-species surveys, is that
observers know what to expect. They may be more persistent in looking for the species becausethey know it was seen there on a previous occasion. If there was no corresponding lessening of
effort in sites from which the species had not been previously recorded, this would bias analyses
of change.
Wilson et al. (1997) checked for both of the latter two potential biases by comparing the numbers
of Badger setts in revisited and new squares (and found no evidence of bias). Given that some
turnover of sites is almost inevitable, similar checks could be carried out in most repeat surveys
even when the aim was to revisit the same sites
Drawing new samples on each sampling occasion gives more information on geographical
variation in abundance. This provides better estimates of the mean abundance (or index of
abundance) of animals, averaged over the whole country and over all the years of the study, but
knowledge of actual abundance is of limited value for monitoring, which must focus on changes
in abundance - which are better estimated using an historically continuous sample.
Geographical information is directly useful for modelling distribution in relation to
environmental factors, which may help to understand what determines the distribution and
abundance of the species. However, given the extent to which the distributions of mammals in
Britain are dependent on direct management by man (current or historical), this is likely to be
less illuminating than studying temporal changes. In any case, the increase in precision of the
geographical models that is obtained by taking new samples every year is likely to be less thanthe corresponding decrease in precision of the temporal monitoring.
Geographical information is useful for planning and similar purposes: the presence of Common
Dormice or Badgers in a wood may affect the decision as to whether it should be turned into a
housing estate, but even if new monitoring samples are drawn every year for many years, the
overall proportion of the country covered will be small. Site-based information is much more
effectively delivered from Atlas surveys, local biological recording, and specific surveys of
threatened sites.
Recommendation:
* The general case for using the same sites from year to year is overwhelming, exceptpossibly for species that may be persecuted by landowners.
3.2 Partially replacing samples
It is not always possible to keep sampling the same sites: permission may be withdrawn, or
fieldworkers may not be able to carry on. The available methods for analysing monitoring data
can cope with the inexorable slow turn-over of sites that results (see 4.2, below).

8/18/2019 BTO Research Report No.223 - Developing a Mammal Monitoring Programme for the UK
http://slidepdf.com/reader/full/bto-research-report-no223-developing-a-mammal-monitoring-programme-for-the 59/316
BTO Research Report No.223
July 1999 57
MMR consider in detail more formal designs for Sampling with Partial Replacement (Fig.
II.3.2C); their proposed MaMoNet incorporates these ideas. The rationale of such designs is that
they provide information on both geographical and temporal variation, providing estimates of
both overall means and temporal change. There are situations where this combination may be
more useful than either the mainly temporal information provided by sampling the same
localities on every occasion (Fig. II.3.2B) or the much greater spatial information provided bydrawing independent samples on each occasion (Fig. II.3.2A) (see, e.g., Skalski 1990). We do
not believe that these apply to the monitoring of mammals in the UK. Sampling with as little
replacement as possible remains the method of choice.
There is one exception to this recommendation, which we see applying to cases where there is an
individual or group of observers working in an area that is too large to be covered in one year but
small enough to be covered over a few years. In this case, particularly if the species is one where
trends in numbers are likely to be fairly slow, Rotational Sampling may be appropriate. This
means that observers cover a different part of the area every year until they have covered the
whole, when the same cycle of coverage is begun again (Fig. II.3.3). Such a strict cycle will give
much more useful information for the level of effort expended than will the rather haphazard
variation in coverage that generally happens in such studies. We do not see Rotational Sampling
as being directly relevant at the national level but it may be relevant to local studies that feed into
the national monitoring.
(Note that the protocol we present, in which each part of the population is sampled only once per
cycle (Fig. II.3.3A), is a special case. More generally, Rotational Sampling involves each group
of sample units staying in the sample for a certain number of years, then dropping out for the rest
of the cycle (Fig. II.3.3B). The statistics of the general case have been considered by Rao &
Graham, 1964).
Recommendation:
* There is no advantage in sampling with Partial Replacement for mammal monitoring.
* Rotational Sampling may be useful for local studies (which may form part of the
national programme) but is unlikely to be useful at the national level.
3.3 Building on previous surveys
Setting up long-term mammal monitoring in the UK does not take place on a clean slate: several
species have been the subject of previous surveys. Given the extent of the changes that have
occurred in the countryside in recent decades, it is important to be able to compare the status of
these species now and in the near future with what it has been in the past. Does this mean thatthe methods of previous surveys should be adopted without any changes for future monitoring?
For methods that produce indices, the answer is clearly “Yes”, since the relationship between an
index and absolute abundance depends on the methods used. Where past surveys have
determined absolute abundance, the naive answer is “No”, at least if the future monitoring is also
based on absolute abundance. Suppose, however, that either the past or the future estimates are
biased (whether or not we realise it): unless the bias is identical, the comparison of future
estimates with the past is undermined, so even in this case there is an advantage in continuing to
use the methods used in previous surveys.
The advantage of sticking with the same methods does, however, need to be balanced against anyadvantage to be gained from the greater efficiency or greater accuracy of other possible methods.
This is a different judgement to make, as it entails weighting the short-term advantages of
8/18/2019 BTO Research Report No.223 - Developing a Mammal Monitoring Programme for the UK
http://slidepdf.com/reader/full/bto-research-report-no223-developing-a-mammal-monitoring-programme-for-the 60/316
BTO Research Report No.223
July 1999 58
continuing with the same methods against the long-term advantages of making a change. If such
decisions have to be made, it is worth investing time in getting them right. It is also important to
make them now, since the longer that suboptimal methods are used the more disruptive will be a
shift to better methods. Where changes are to be made, it is important to calibrate old and new
methods against each other if one wishes to retain long-term comparability of the data.
It is somewhat easier to avoid disruption if one wishes to change the sampling design rather than
the field methods. MMR suggest moving from one design to another by gradual modification,
which has the benefit of providing some historical continuity but allowing a better design to be
used in the long-term. Where such changes are contemplated, it would be worth simulating
alternative designs and ways of moving between them, to aid judging what is best.
An easy modification to design is to change the intensity of sampling (through it may need some
ingenuity to do this in the case of systematic sampling unless one envisages changes in
intensity) that are particularly large. If previous surveys indicate that the sample sizes used are
providing estimates that are more precise than needed, then reducing the sample size may be
justified to save resources. It is probably wise to err on the side of caution and to retain a larger
sample size than appears theoretically necessary, making further downward adjustments in future
if the evidence from the data confirms that this is justified. If one reduces the sample too much,
sites can always be drawn back into the sample in future, since modern analytical techniques can
cope with sites being temporarily missing; it is however, better to avoid this if possible. Note
that changes in intensity may be stratified, whether or not previous surveys have been stratified.
For example, regions or land classes judged unimportant may be sampled less intensively.
Recommendations:
* Use the same field methods as have previous surveys of the same species, unless others
are clearly more efficient.* Use the same sampling design as have previous surveys of the same species or change
gradually to better methods.
* Invest enough time in judging whether or not to change methods or design.
* If changes appear desirable, make them now.
3.4 Within-year variation
Mammal numbers at a site typically vary (often markedly) during the year, generally showing
season patterns. There are two ways of dealing with this problem (to avoid within-year variation
being added to the short-term between-year variation that interferes with the detection of long-
term trends). One is to sample repeatedly over a sufficient period (or on a sufficient number ofoccasions) throughout the year that seasonal variation is averaged out. The other is to sample at
a fixed time each year, though this is not so useful if the seasonal pattern itself varies between
years. If one chooses to sample at a fixed time of year, it should be a time when between-year
differences are least influenced by year-to-year changes compared to long-term trends: one
should not choose times when behaviour or numbers are likely to be highly influenced by
weather, for example.
For multi-species schemes, the optimum sampling time may differ between species. An obvious
way to overcome this problem is to sample repeatedly over a sufficient span of time that one
includes the optima for every species. Generally speaking, it will not then be sensible to ignorethe data for each species that come from the suboptimal times, though if these produce very
variable data it might be. The decision is best made by analysing the data, to find whether the

8/18/2019 BTO Research Report No.223 - Developing a Mammal Monitoring Programme for the UK
http://slidepdf.com/reader/full/bto-research-report-no223-developing-a-mammal-monitoring-programme-for-the 61/316
BTO Research Report No.223
July 1999 59
error variance is lower for analyses based on the whole data set or for those based just on data
from the optimal season.

8/18/2019 BTO Research Report No.223 - Developing a Mammal Monitoring Programme for the UK
http://slidepdf.com/reader/full/bto-research-report-no223-developing-a-mammal-monitoring-programme-for-the 62/316
BTO Research Report No.223
July 1999 60
8/18/2019 BTO Research Report No.223 - Developing a Mammal Monitoring Programme for the UK
http://slidepdf.com/reader/full/bto-research-report-no223-developing-a-mammal-monitoring-programme-for-the 63/316
BTO Research Report No.223
July 1999 61
4. NOTES ON STATISTICAL INTERPRETATION
4.1 Estimation and hypothesis testing
Too little attention is generally paid to how monitoring information should be used to triggerconservation attention. In practice, decisions about the conservation status of species based on
trends in their abundance or distribution are often simply based on the best estimate of the
magnitude of the trends, with little discussion of the reliability of the trend data. If there is any
discussion, it is often more concerned with bias rather than precision. This is satisfactory for
better-known species, such as many birds, where confidence limits for long-term trends may lie
only a few percent around the mean. For other species, concerns may justifiably be raised about
the reliability of the estimate: if a species has declined by an estimated 40% but the confidence
limits on that figure range from a decline of 63% to an increase of 7% (confidence limits will
always be asymmetric on a proportional scale), are we justified in turning conservation concern
on to that species?
There are two approaches to judging the significance of monitoring trends. The more traditional
is to test them against the null hypothesis of No Trend. Conservation concern is only raised if
the actual trend indicates a decline significantly stronger than this. (If the interest is only in
declines, a one-tailed test would be applied.) The other approach follows the Precautionary
Principle: assume that there is a problem unless the trend is either an increase or a decline that is
significantly weaker than the value agreed to be critical - say 25% over 25 years. In this case, a
one-tailed test of the null hypothesis that there has been such a decline (or greater) is appropriate.
In practice, for species where the monitoring provides only rather imprecise estimates of trends
(which will often include the rarer species), the traditional view will result in important declines
being missed, the precautionary view in alarms being raised unnecessarily. The best way aroundthis dilemma is to place confidence limits on one’s trend estimates. These immediately indicate
whether each of the two null hypotheses may be rejected. (90% limits are appropriate if one
wishes to apply one-tailed tests at the traditional 5% significance level). If neither test is
rejected, one then has a “most likely” scenario (the trend estimate) a “worst case” scenario (the
lower confidence limit) and a “best case” scenario (the upper confidence limit); considering the
costs and benefits of taking or not taking conservation action under each of these three then
allows the conservation manager to decide on the best course.
Recommendation:
* Rather than testing null hypothesis of No Trend unthinkingly, place confidence limits on
trend estimates.
4.2 Remarks on appropriate statistical models
Considerable attention has been given to methods for modelling animal abundance and
presence/absence data over the last few decades, much of it based around data on birds held by
organisations like the BTO. Clear recommendations can therefore now be made as to the best
modelling approaches with which to analyse monitoring data on mammals.
In general, the methods currently in common use for analysing population trends can be
classified as forms of Generalized Linear Model (GLM) (McCullagh & Nelder 1989). Thesemodels are flexible, allowing choices of error distribution and link function which are most
appropriate for the data being tested. The framework also allows indexing, hypothesis testing and

8/18/2019 BTO Research Report No.223 - Developing a Mammal Monitoring Programme for the UK
http://slidepdf.com/reader/full/bto-research-report-no223-developing-a-mammal-monitoring-programme-for-the 64/316
BTO Research Report No.223
July 1999 62
statistical controls to be implemented through the estimation of categorical or continuous
predictor effects and tests akin to regression and analysis of variance. The approaches applied to
bird count data are reviewed by ter Braak et al . (1994) and Thomas (1996); Fewster et al . (in
press) describe how Generalized Additive Models (GAMs) can be used in similar ways to
estimate smooth but non-linear population trends (GLMs are limited to the estimation of linear
(on the scale used) or categorical effects). The appropriate link function for count (abundance)data is the logarithmic link, used with a Poisson error distribution, whereas a logit link with
binomial errors is appropriate for presence/absence data (McCullagh & Nelder 1989).
4.3 Post-stratification, regression and other modelling as means of increasing precision
and understanding.
Suppose that one estimates the change in national abundance over a period. The standard error
of the estimate will reflect both sampling error and the differences between sites in the extent of
population change. If the samples are divided into categories, such as land-classes or regions,
after sampling has taken place (post-stratification) and if there are differences between the
categories, then the variation ascribable to between-category differences can be removed using
standard analysis-of-variance techniques, thus reducing the standard error of the national
estimate. If the differences between categories are small, the removal of this component of the
variation may be outweighed by the reduction in the number of degrees of freedom associated
with the estimate, so post-stratification should not be undertaken blindly. However, sample sizes
for national monitoring schemes are likely to be so large compared with the number of categories
used that there is unlikely to be much effect on the degrees of freedom.
An alternative approach is to identify relevant continuous variables that can be measured at each
sample site (or are already available in national databases). These may explain part of the
between-sample variation in the population change. If so, this component can be removed usingappropriate regression techniques.
Both stratification and regression have a further benefit: the differences between strata (or the
correlation with the regression variables) may aid understanding of the causes of observed
population changes. For example, if Wood Mouse populations remain stable in woods but
decline in farms, this may suggest that it is changes in farmland management that are driving the
population changes. At the very least, such pointers may guide further research, allowing the
causes of decline to be confirmed more quickly than if the habitat difference had not been
identified. Modelling may go beyond the simple approaches of stratification and regression to
provide even deeper insights into the factors influencing the numbers and distribution of a
species (Buckland & Elston, 1993).
Recommendation:
* Sufficient resources should be available in monitoring programmes to allow refined
statistical analyses to be conducted that extract the maximum information from the
data.
8/18/2019 BTO Research Report No.223 - Developing a Mammal Monitoring Programme for the UK
http://slidepdf.com/reader/full/bto-research-report-no223-developing-a-mammal-monitoring-programme-for-the 65/316
BTO Research Report No.223
July 1999 63
PART III MULTI-SPECIES SCHEMES
INTRODUCTION
In this section we review existing and potential multi-species monitoring schemes for Britishmammals. Schemes which provide data on large numbers of species are unlikely to be ideal for
any single species but can nevertheless contribute useful information, especially if several are
run in parallel. Multi-species schemes are particularly suitable for use by volunteers because they
allow all interesting encounters to be recorded, adding to the personal rewards that volunteers
perceive. An important benefit is that areas peripheral to a species’ range or where its abundance
is low can be monitored without a loss of volunteer motivation when other species are also
included in the target group. Multi-species schemes also provide monitoring data cost-effectively
(given that the data are of sufficient quality) because the costs of central organisation, data
processing, newsletter production, etc., can be shared across budgets allocated to a range of
species. Running several multi-species schemes in parallel would provide effective checks for
each individual scheme and help guard against problems due to the inadequacies of any one
approach for a given species.
Mammal monitoring data are already collected under two national schemes: the Breeding Bird
Survey (run by the BTO under a consortium including the RSPB and JNCC) and the National
Game Bag Census (run by the Game Conservancy Trust). We review the potential these schemes
have as parts of a unified UK mammal monitoring programme in Part III.A. We then outline
proposals (for discussion) for five new national multi-species programmes, each of which can
add important information cost-effectively to the spectrum of current monitoring schemes, by
broadening species and/or habitat coverage. We stress that the schemes we consider should not
be taken as alternatives to one another: they would contribute complementary information (butare, equally, not inter-dependent and any number or combination could be selected for further
development). Our accounts of the multi-species schemes should be read in conjunction with the
individual species accounts (Part IV), in which they are referred to where they can contribute
usefully to monitoring in individual cases. The ways in which we envisage single and multi-
species schemes contributing to the monitoring of each species are summarised in Part VII.
A. EVALUATION OF EXISTING SOURCES OF DATA
1. MAMMAL MONITORING UNDER THE BREEDING BIRD SURVEY
1.1 Introduction
A trial mammal survey was instigated in 1995 as an adjunct to the BTO/RSPB/JNCC Breeding
Bird Survey (BBS) as a result of interest from BBS volunteers in recording the mammals they
saw while counting birds. This trial has continued into the 1999 field season and has produced
encouraging detection rates and/or sample sizes for a range of mammal species, suggesting that
the BBS has the potential to contribute significantly to the monitoring of mammal populations in
the UK. Although it is clearly not designed specifically for the monitoring of mammals and thus
is not organised as would be ideal for that purpose, the BBS has the benefit of being an extant,
national scheme with a large sample size (over 2,200 sites currently surveyed annually). The
scheme draws on a pool of volunteers which is likely to be largely different from that tapped bymammal organisations such as The Mammal Society. In this chapter, we describe the
8/18/2019 BTO Research Report No.223 - Developing a Mammal Monitoring Programme for the UK
http://slidepdf.com/reader/full/bto-research-report-no223-developing-a-mammal-monitoring-programme-for-the 66/316
BTO Research Report No.223
July 1999 64
background of the BBS and its methods, and then assess its potential value for monitoring
mammals.
1.2 The background of the Breeding Bird Survey
The British Trust for Ornithology (BTO) has organised standardised, volunteer-based andnational surveys of British breeding bird abundance since the early 1960s. For more than 30
years, the principal national survey was the Common Birds Census (CBC), which has served
both to highlight a range of important changes in the British avifauna (see, e.g., Marchant et al.
1990; Gregory & Marchant 1996; Siriwardena et al.1998) and to provide a basis for the
development and testing of new and better statistical methods for the identification of population
trends (see, e.g., Mountford 1985; Peach & Baillie 1994; Fewster et al. in press). Although the
CBC provides good data on bird populations breeding in farmland and woodland, and the
farmland plot sample (at least) is representative of the wider habitat in south and east Britain
(Fuller et al . 1985), its methods are labour-intensive (limiting the likely total plot sample size)
and it has large gaps, nationally, in its habitat and regional coverage.
The Breeding Bird Survey (BBS) was introduced in 1994 as a replacement for the CBC
(although the two continue to run in parallel for calibration purposes) which avoids the sampling
biases associated with the latter while incorporating simpler fieldwork methods and maintaining
statistical power. The method used by the BBS is described in detail below, but basically
consists of two counts of a 2km line transect, within each of a random sample of 1km grid
squares, along which all birds seen or heard are recorded. The size of the sample of BBS survey
squares has now exceeded that shown by simulation studies to be sufficient to provide the same
statistical power as is provided by the CBC, and it continues to grow annually (Gregory &
Baillie, in press). Another important feature of BBS is the habitat data that are collected along
the survey transects according to standardised methods and which are computerised routinely.These data allow bird abundance to be related to habitat characteristics so that a range of
environmental hypotheses can potentially be tested.
1.3 The methods of the BBS
BBS survey design and methods are described in full elsewhere (Gregory & Baillie in press;
Gregory et al. in press), so we only summarise them here. The BBS is based on a formal
sampling strategy under which 1km squares to be surveyed are selected as a random sample,
stratified by regions defined by observer density. Observers are distributed with human
population density and are therefore harder to recruit in more remote areas; the stratification
allows for this without introducing bias. Survey squares are allocated to observers showinginterest in the BBS through staff at BTO headquarters and the BTO’s national network of
volunteer regional representatives.
Volunteers visit their survey squares three times in each year: one visit to record habitat and (re-)
establish a transect route and two visits on which birds are recorded. Bird-recording visits are
made in each of an early (April to mid-May) and a late period (mid-May to June), with at least
four weeks between them, and visits begin between 6.00 and 7.00am to coincide with maximum
bird activity while avoiding the daily peak of birdsong. Transect routes ideally comprise two
parallel lines within a square, each 1km long, although terrain and access mean that deviations
from the ideal are common. Each 1km transect is divided into five 200m sections which formthe units for bird and habitat recording. Visits each tend to take around 1½ hours.
8/18/2019 BTO Research Report No.223 - Developing a Mammal Monitoring Programme for the UK
http://slidepdf.com/reader/full/bto-research-report-no223-developing-a-mammal-monitoring-programme-for-the 67/316
BTO Research Report No.223
July 1999 65
All birds seen and heard while walking transects are recorded using three distance band
categories (<25m, 25-100m and >100m on either side of the transect); birds in flight are assigned
to a separate category. Habitat is recorded annually using an hierarchical coding scheme (Crick
1992) which is used (with minor modifications) in all BTO monitoring schemes. Space is
provided on the recording form for both a primary and a secondary habitat to be recorded for
each 200m transect section.
1.4 Mammal recording within the BBS
To date, mammal recording in the BBS has proceeded only on a trial basis: the approach in use is
therefore subject to revision and there is scope for improvements to be incorporated. The BBS
approach attempts to take account of the fact that mammals are generally harder to observe than
birds (in particular, they tend to be more silent, are often more cryptic and are often less tolerant
of the presence of human observers). Currently, counts are solicited for the 17 species which are
most likely to be seen and for which useful data are most likely to be collected (see Table
III.A.1.1). Space is also allowed on the recording form for additional species to be recorded
(which we do not consider further here). Volunteers are asked to provide one of two forms of
data: numbers of individuals seen during the early and late transect surveys and an additional
qualitative assessment of whether a species is “known to be present in the square”. The latter
encompasses any identifications made which are not on the formal transects, for example,
identifiable field signs seen during transect surveys and sightings made during the habitat
recording visit to the square. Zero returns, where no evidence of mammals was found, are
encouraged, because these are essential for unbiased monitoring, but their rates of submission
could still be improved. More than 75% of BBS volunteers have provided information on the
mammals in their survey squares since the inception of the trial survey.
1.5 The Mammal Species Recorded
Three years of BBS mammal data, from 1995-1997, were computerised and available for
analysis as of spring 1999. Restricting ourselves to considering species’ presence or absence for
simplicity, we investigated the sample sizes provided by the survey. A square was assumed to
have been surveyed for mammals if either at least one species of mammal was counted (or
known to be present) or a return reporting no evidence of mammals was received. A species was
treated as present if either a count was provided in either of the two survey visits or the species
was recorded as “known to be present”. A species was recorded as absent if mammal data had
been submitted for a square (including zero returns but not including squares surveyed for birds
from which no mammal forms were received) and the species was not reported. Note that
“absence” here refers to non-detection rather than, necessarily, to true absence from a square (orfrom the habitat through which a transect passes).
The BBS is intended to survey the same squares year-by-year, but there is some inevitable
turnover as volunteers are recruited, drop out or move. A total of 2,231 squares yielded some
information on the presence or absence of mammals during the period 1995-1997, annual
contributions rising from 1,334 in 1995 to 1,874 in 1997. The numbers and proportions of
squares occupied in each of the three years are tabulated, for seventeen species, in Table
III.A.1.1 To quantify the precision of the estimated proportions presented, we computed their
standard errors (s.e.) using the following standard equation (assuming that the number of squares
occupied is a binomial variable with probability p: Cochran 1977):
8/18/2019 BTO Research Report No.223 - Developing a Mammal Monitoring Programme for the UK
http://slidepdf.com/reader/full/bto-research-report-no223-developing-a-mammal-monitoring-programme-for-the 68/316
BTO Research Report No.223
July 1999 66
where n is the total number of squares surveyed.
Rabbit was easily the commonest species, being reported as present in about 70% of squares forwhich information on mammals was given. Other species reported in more than 10% of the
squares were Mole, Brown Hare, Grey Squirrel, Red Fox and Roe Deer. Small insectivores,
rodents and mustelids, although likely to be widespread were reported only from a small
proportion of squares, almost certainly because of their inconspicuous nature. The commonness
with which the various species are detected within the BBS sample has important implications
for the utility of the survey for the detection of changes in their populations: within the range of
values found here, higher proportions of the total number of squares are better. These issues are
explored in detail under “Statistical Power” below.
Geographical patterns in the occurrence of mammal species across Britain are often of interest,especially for species whose ranges are believed to be increasing (e.g. Reeves’ Muntjac: Corbet
& Harris 1991) or contracting (e.g. Red Squirrel: Corbet & Harris 1991). As a random sample of
the landscape in Britain surveyed using standard methods, the BBS presents a powerful tool with
which to examine the national ranges of British mammal species and a significant advance on the
collation of opportunistic records used previously (Arnold 1993). Using DMAP For Windows
mapping software (Morton 1993-1996), we plotted the spatial distribution of mammal records,
contrasting examples of which are contained here. The Rabbit (Figure III.A.1.1) is shown to be
almost ubiquitous, the Scottish highlands being the only large area in which most squares lack
recorded presence. This is no doubt a major contribution to the significant spatial variation
found in the generalized linear model fitted to the data for this species (see below). The scarcer
Brown Hare was also not recorded from much of Northern Ireland, south-east and south-westEngland (Figure III.A.1.2). Reeves’ Muntjac was first introduced to Bedfordshire but has since
spread widely, both naturally and through many additional releases (Figure III.A.1.3). The
distribution of the Red Squirrel records shows clearly that it is more widespread in eastern
Scotland and northern England, but in all three years considered, only isolated locations
elsewhere are found to contain the animal (Figure III.A.1.4).
1.6 Estimating Population Changes and Population Trends
Simple measures of changes in reported presence
Several possible options exist for identifying changes in BBS mammal data, each addressing
subtly different questions with varying statistical sophistication, but all being generally definable
within the framework of generalized linear models (GLMs: McCullagh & Nelder 1989). Using
numerical count data would extract the maximum amount of information on mammal population
changes from the BBS, provided that the number of animals counted is related to true abundance,
but the sample size of squares available is maximized if we consider only the estimation of
presence and absence. For such analyses, count records are thus considered to be simple
“presences” and combined with the “known to be present” data. The proportions of squares
where a species is present can be compared between years (or between regions or habitats) using
a contingency table approach and referring the test statistic to " 2 tables. Alternatively, in a GLM
formulation, we can test whether the variation between years is significant by comparing a modelwith annual proportions and one with a single, time-invariant estimate derived by combining data
1)-(n
p)- p(1 = s.e.
8/18/2019 BTO Research Report No.223 - Developing a Mammal Monitoring Programme for the UK
http://slidepdf.com/reader/full/bto-research-report-no223-developing-a-mammal-monitoring-programme-for-the 69/316
BTO Research Report No.223
July 1999 67
across years, using a likelihood ratio test. Since the data to be modelled are proportions, we
employ GLMs with a binomial error distribution and a logit link function.
Applying the likelihood-ratio test approach to data from 1995, 1996 and 1997, we found that
proportions had varied significantly between years (at the 5% level) for nine of the 17 mammal
species named on the recording form: Hedgehog, Mole, Common Shrew, Grey Squirrel, BrownRat, Red Fox, Stoat, Weasel and Badger (Table III.A.1.2). Many of the smaller animals in
particular were reported noticeably less frequently in 1995. This may be due to increasing effort
by observers to record signs of mammals as the BBS has developed or to subtle changes in the
recording instructions during the trial survey (see Discussion), so we repeated our analyses
restricting our attention to 1996/1997. The analyses omitting the 1995 data gave rise to similar
results for most species, but the inter-annual differences became non-significant for Mole,
Rabbit, Brown Rat, Stoat, Weasel and Badger (Table III.A.1.2), suggesting that the effects
identified previously for these species could have been artefacts of the change in survey methods.
Note, however, that fewer significant results would be expected a priori from comparisons of
two years as opposed to three.
The analyses of proportions described above are crude in the sense that they take no account of
the matching of BBS survey squares between years: they assume that independent random
samples of squares are drawn in each year. However, although there is some turnover in the
BBS sample, the majority of squares are sampled in consecutive years. Analyses of the data can
therefore make use of this to remove the need for the statistical consideration of square-specific
effects (i.e. random biases caused by habitat-specific and geographical variations in density)
which is inherent in the simple comparison of proportions. A method for doing this for pairs of
years is presented by Cox (1970): data from any two years to be compared (not necessarily
consecutive ones) are matched by square and squares where a species has been reported as either
present or absent in both years are omitted. The remaining squares all therefore experienced achange in the reported status of the species, either from present to absent or from absent to
present. The relative numbers of squares of these two types form sufficient statistics for the
estimation of the difference in detection rates between years (Cox 1970, p. 56). A significant
change in the overall proportion of squares reported to be occupied is indicated if significantly
more than half of the squares where status has changed experienced change in one or other
direction. Specifically, this test is based on the following observation: if the probabilities of
detection at site j in the two years under consideration are p j and p j+#, then N pa has a binomial
distribution (m, p) with binomial denominator m= N pa+ N ap and probability p=e#/(1+e#), where
N pa and N ap are, respectively, the numbers of squares changing from present to absent and from
absent to present (Cox 1970).
To evaluate the effects of the difference in approach, we used the matched squares method to
conduct analogous analyses to those described above comparing the data from 1996 and 1997 for
each species. The results are presented in Table III.A.1.2 . The results for most species were
more significant than had been found in the unmatched analyses and inter-annual differences for
seven (as opposed to four) species were significant at or around the 5% level (Mole, Common
Shrew, Brown Hare, Grey Squirrel, Red Fox, Badger and Roe Deer: Table III.A.1.2 ). The
variations between analyses in the species identified as having significant inter-annual
differences in numbers of occupied squares show where a difference or a lack of difference
identified by the unmatched analyses could reflect the influences of spatial biases in the sample
of survey squares.
8/18/2019 BTO Research Report No.223 - Developing a Mammal Monitoring Programme for the UK
http://slidepdf.com/reader/full/bto-research-report-no223-developing-a-mammal-monitoring-programme-for-the 70/316
BTO Research Report No.223
July 1999 68
The number of squares in which changes in status had occurred varied from 30 (Red Squirrel) to
382 (Red Fox) (Table III.A.1.2 ). Clearly, the utility of the square-matching approach depends
on the number of squares which have been surveyed in both of the years compared: survey
square turnover means that this will fall as the years compared are moved further apart in time.
Note, however, that long-term turnover should be less of a problem (notwithstanding any
observer effects) than has been the case for the CBC because new surveyors for particularsquares will be sought to replace any who drop out.
The potential of Generalized Linear Models for presence/absence data
Extending the methods applied within the GLM framework and using likelihood-based testing
would permit the fitting of a range of more flexible models, and therefore the testing of various
hypotheses of interest. A logical extension of the pairwise square-matching approach is the
linking of data from several years via square identity (together with enough flexibility to allow
squares not to have to have been surveyed in all years). This can be done in GLMs incorporating
the estimation of a set of square-specific probabilities of species presence in addition to year-
specific probabilities: the prediction of the model for a given square in a given year is then the
sum of the “location effect” and the “time effect”. Analogous models now routinely form the
basis for analyses of population trends in CBC and Wetland Bird Survey data, as well as in other
bird monitoring schemes worldwide (ter Braak et al. 1994; Thomas 1996). Under such models,
the probability of detection of a species in a survey square varies between locations, but this
proportion fluctuates between years in a parallel fashion in each location.
In the methods currently used to analyse CBC data, location or site effects are usually fitted as a
categorical variable, i.e. survey sites are not assumed to be inter-related (Mountford 1985; Peach
& Baillie 1994; Fewster et al . in press). An alternative is to characterise sites by means of a few
biologically meaningful variables such as latitude, longitude, altitude, area of woods, etc.; i.e. toassume that site-specific variation derives from a combination of these influences, and therefore
to estimate far fewer parameters during model fitting. This approach, using geographical and
habitat covariates in place of categorical site effects, may be obligatory for the application of
GLM-based indices for mammal monitoring under the BBS: with currently available computing
resources, it would be prohibitively time-consuming routinely to conduct long-term analyses
incorporating over 2,000 separate “location” effects. The covariate approach also provides
greater numerical precision. It is also important to note that formal statistical methods such as
likelihood-ratio tests allow the significance of any relationships with covariates in GLMs to be
assessed. This permits both the identification of a parsimonious model to explain any spatial
variation and the testing of covariate-based hypotheses.
As an example of the application of GLMs incorporating both spatial and temporal variation, we
analysed BBS Rabbit data using the county in which a survey square was found (as a categorical
variable) as the spatial component. Each presence/absence record was categorised both by year
and by county: survey squares were located in a total of 74 counties. Both “year” and “county”
were then fitted as categorical predictor variables in a Generalized Linear Model and the
significance of their effects tested by comparing models omitting each in turn with the full model
using likelihood-ratio tests. Spatial variation, expressed at the county level, explained a
significant proportion of the variation in the probability of detection for Rabbits (" 273 = 773.27,
p<0.01). However, temporal variation was not significant at the 5% level (" 22 = 4.84, p=0.09),
although the annual indices of rabbit presence suggest that a decline may have occurred: on a
logit scale, the indices were 0.1807 (1995), 0.0542 (1996) and zero (1997: the point relative to
which the other years are scaled).
8/18/2019 BTO Research Report No.223 - Developing a Mammal Monitoring Programme for the UK
http://slidepdf.com/reader/full/bto-research-report-no223-developing-a-mammal-monitoring-programme-for-the 71/316
BTO Research Report No.223
July 1999 69
The GLM framework allows a range of additional models to be fitted; for example, interactions
between year and geographical category could be added, permitting a test of whether proportions
of squares occupied vary differently between regions, rather than in parallel as assumed above.
As implied earlier, relationships between distribution and climatic or habitat variation could also
be explored using either continuous or categorical variables.
Analysing changes in abundance
The GLM approaches applied to BBS and CBC data have focused on the estimation of changes
and trends in abundance (see, e.g., Field & Gregory 1999). Similar methods can be applied to
mammal data from the BBS, although rather fewer species can be meaningfully approached in
this way than was the case with analyses of presence/absence data. However, where the data will
support models of abundance and counts of mammals from BBS transects are likely to be good
measures of true abundance, these models would provide much more sensitive methods for
revealing population changes than would the presence/absence method. GLMs used for
modelling variations in abundance are generally formulated using a logarithmic link function and
a Poisson error distribution (ter Braak et al. 1994; Pannekoek & van Strien 1996), but otherwise
the principles are consistent with those applied to presence/absence data as described above. We
have investigated models of the abundance data collected by BBS volunteers for Brown Hare:
this is probably the species to which the BBS methods and sample of survey squares are best
suited (see Part IV.5).
We fitted a GLM with log link and Poisson errors to BBS Brown Hare data for 1995-1997,
allowing for categorical year and county effects (as with the model of presence/absence data for
Rabbit, this approach was much less demanding of computer resources, reducing the number of
independent location effects to be estimated from around 2,000 to around 70). Counts weretaken as the total of early and late counts to avoid problems with non-integer mean values.
Likelihood-ratio tests showed that both the year and county effects were highly significant,
revealing both temporal and spatial variation on Brown Hare abundance. Abundance indices
(antilogs of the fitted year effects) for the three years were as follows: 3.78 (95% confidence
interval 3.41-4.18: 1995), 3.31 (2.99-3.67: 1996) and 3.86 (3.49-4.27: 1997); from the relevant
likelihood-ratio test, $22=363.9, P <0.01. These results therefore show no sign of a trend in
Brown Hare numbers, but that abundance underwent a transient fall in 1996. Note, however, that
we have made no attempt here to compensate for any effects of changes in survey methods.
1.7 Statistical Power
8/18/2019 BTO Research Report No.223 - Developing a Mammal Monitoring Programme for the UK
http://slidepdf.com/reader/full/bto-research-report-no223-developing-a-mammal-monitoring-programme-for-the 72/316
BTO Research Report No.223
July 1999 70
A fundamental issue in the design of any monitoring scheme is the power with which it is able to
detect the changes that are of interest: sample sizes of survey data points must be large enough
for change of the magnitude required to be detectable in the appropriate period of time. Equally,
an efficient monitoring scheme would not expend effort collecting more data than is required to
meet its objectives.
Presence/absence data
We have used standard formulae and simulation analyses to investigate the power of the analyses
of BBS presence/absence data outlined above, under scenarios with various postulated
population trends and survey square sample sizes. Sokal & Rohlf (1995, p. 768-769) provide a
formula for the estimation of the sample size required to detect, with a given power, a given
difference (at a predetermined level of significance) between two proportions. The method
applies to random samples of the proportions compared, so is applicable to the “unmatched”
survey squares approach. We applied this formula to simulated changes (declines) of 10, 20 and
30% in the “true” proportion of squares where presence is detected, varying the postulated power
of detection and investigating a range of starting proportions from 0.05 to 1.00. The results,
given a required P -value of 0.05, are shown graphically in Figures III.A.1.5 - III.A.1.7. The
current BBS sample size of around 2,000 squares (more have been surveyed for birds in recent
years but fewer for mammals) would detect 10% declines in reported presence with a power of
between 60% and 90% given starting proportions of (approximately) between 0.3 and 0.5 (Figure
III.A.1.5). (Note that, for a given starting proportion, there is higher power associated with the
detection of “true” increases than declines since power increases as a function of the magnitude
of both proportions being compared, irrespective of their temporal order.) These figures
correspond roughly to or are exceeded by the proportions of squares where Rabbit, Brown Hare,
Grey Squirrel and Red Fox have been reported as present in recent years. A decline of 20% can
be detected given the current BBS sample size and starting proportions (approximately) between0.1 and 0.2 across the range of powers tested (Figure III.A.1.6). A postulated 30% decline can
be detected with still smaller starting proportions (below 0.1 for powers of 90% or less) (Figure
III.A.1.7). The observed BBS sample sizes for different mammal species (Table III.A.1.1)
therefore suggest that the survey could provide useful monitoring data at least for Hedgehog,
Mole, Badger and Roe Deer in addition to the four more frequently reported species. In addition,
any increases in the BBS sample size in the future can only increase the power of the survey to
detect smaller changes.
The above process considers the significance of change between two chosen years. To assess the
power of BBS data (with squares unmatched) to detect a gradual, long-term decline, we used a
simulation approach based on 10% declines over 10 years in the proportions of squares withreported presence from starting values 0.3, 0.1 and 0.03. The proportion 0.3 corresponds
approximately to that in which Brown Hares were found, and the others represent values from
which we would expect the detection of declines to be progressively more difficult a priori. We
then extended the analyses to consider a 25% decline from a starting proportion of 0.03 over
periods of 10 and 25 years, as described below.
We simulated artificial mammal presence/absence records for 2,000 BBS survey squares over
periods of 10 or 25 years, as appropriate. Given a pre-determined linear decline over the one of
these time periods, each square was recorded, at random, as having a species “present” or
“absent” with the probability for each year which would provide the overall decline required. A
GLM containing a linear trend in the probability of detection was then fitted to the simulated
presence/absence data. This process was repeated 100 times, generating 100 data sets from the
8/18/2019 BTO Research Report No.223 - Developing a Mammal Monitoring Programme for the UK
http://slidepdf.com/reader/full/bto-research-report-no223-developing-a-mammal-monitoring-programme-for-the 73/316
BTO Research Report No.223
July 1999 71
same hypothesized model. To investigate the power with which the pre-determined linear
decline could be identified, we tested the significance of the linear time trend term in each
replicate analysis. The proportion of the 100 replicates in which a decline significant at the 5%
level was found provided a measure of the statistical power of this modelling approach. The
results are summarised in Table III.A.1.3.
The results show that the power of the simple GLM approach to detect a 10% decline over 10
years is high, given a starting proportion of 30% (similar to that found in real BBS data for
Brown Hare, Grey Squirrel and Red Fox). However, the power declines rapidly as the starting
proportion is reduced (Table III.A.1.3). Nevertheless, a larger, 25% decline was successfully
detected in the majority of cases even from a very low starting proportion (3%), especially over a
longer time period (25 years: Table III.A.1.3). We have suggested elsewhere that this is a key
level for the detection of trends, and it is one which has been adopted for the generation of lists
of Birds of Conservation Concern (Gibbons et al. 1996): it is extremely encouraging that BBS
data could have the power to detect such changes for almost all of the species listed in Table
III.A.1.1.
However, BBS presence/absence data seem to have limited utility for the detection of shallow
population trends from low probabilities of detection (below 0.2) such as have been found for
many species (Table III.A.1.1). Clearly, however, the key issue is the magnitude of population
change that is of interest, and therefore that which the BBS would be required to detect. In this
context, a 10% decline over 10 years may not be a significant cause for conservation concern for
common or widespread species.
Abundance data
We also carried out a rough assessment of the power of BBS data to detect changes inabundance, rather than presence, using a simulation approach. Our simulations were based on a
log-linear Poisson regression model fitted to 1995-1997 BBS data for Brown Hare. This GLM
included categorical county and year effects: we used the fitted county effects and the year effect
for 1997 as the basis for our simulation. We assumed that the squares visited in 1997 were
visited in each of the ten subsequent consecutive years, and generated randomised data (counts of
hares) for each square in each year. To do this, we assumed that the county effects remained at
their estimated values throughout, but made the year effect decline annually by a constant
amount, such that it had declined by 10% at the end of the tenth year. We ran this simulation
100 times, producing 100 replications of a scenario in which the population varies spatially but
declines at the same rate throughout. The results showed that we could detect the 10% decline at
the 5% level (via a likelihood-ratio test) in all 100 of our replicates, showing that with a data setof the size of the Brown Hare one, the BBS has very high power to detect a population change of
this size. We should note, however, that the scenario we modelled featured a linear decline,
which is highly unlikely to occur in practice: one might be able to fit a linear trend to population
change, but the real changes will not be smooth because of inter-annual variation due to
sampling error and effects which are independent of those driving the long-term trend. This
means that we have estimated power under the best of all conditions. Nevertheless, the 100%
success rate is encouraging, and it suggests that more detailed simulation work would be
worthwhile.
1.8 Waterways Breeding Bird Survey
The line transects used by the BBS, being random in orientation with respect to the landscape,
are not optimal for the monitoring of birds in linear habitats such as rivers and canals. The
8/18/2019 BTO Research Report No.223 - Developing a Mammal Monitoring Programme for the UK
http://slidepdf.com/reader/full/bto-research-report-no223-developing-a-mammal-monitoring-programme-for-the 74/316
BTO Research Report No.223
July 1999 72
recognition of this fact led to the organisation of a pilot Waterways Breeding Bird Survey
(WBBS) in 1998, in which BBS methods were adapted for use on linear waterways (Marchant &
Gregory 1999). The key differences between WBBS and BBS were that WBBS sites were
selected at the tetrad (2x2km square) rather than the 1km square level, that transect sections were
500m rather than 200m in length (to match the Environment Agency’s River Habitats Survey)
and that total transect lengths were allowed to vary up to a maximum of 5km (ten 500msections). Routes within tetrads followed the course of the waterway and habitat recording was
extended to allow recording of the characteristics of the waterway itself as well as the
surrounding terrestrial habitats. Mammal recording was conducted exactly as in the BBS: either
presence/absence or a pair of counts (early/late).
Observers surveyed 103 random WBBS stretches in 1998, returning mammal data on 93 of these
stretches. The mammals recorded on more than 1% of survey stretches are listed in Table
III.A.1.4. The species found most commonly on WBBS stretches were similar to those reported
most commonly under the BBS, but the comparatively small scale of WBBS means that it is
unlikely to be able to contribute significantly to the monitoring of such species (except, perhaps,
populations specific to riparian habitats). Of more interest is the potential for WBBS to monitor
three key riparian species: Otter, American Mink and Water Vole. The proportions of squares
from which these species were reported (Table III.A.1.4) were large enough to suggest that
WBBS could contribute to their monitoring. To check this, we ran further simulation analyses of
the kind summarized in Table III.A.1.2, investigating the power to detect a 25% decline over 25
years from a starting proportion of stretches with a species present of 0.1 (i.e. approximately the
figure found for Otter, American Mink and Water Vole). Taking a significance level of 5% and
putative WBBS sample sizes of 100, 200 and 400, the trend was detected in 8%, 17% and 29%
respectively, of the simulations conducted. Therefore, even with a significantly increased WBBS
sample size, trends of the magnitude which are likely to be of interest are unlikely to be
detectable in a majority of cases.
1.9 Discussion
The suitability of BBS field methods
Our exploratory analyses show that mammal monitoring through the BBS has the potential to
provide a wealth of data which are statistically adequate to contribute significantly to a national
monitoring scheme. The principal asset of the BBS in this context is that a large number of
randomised sites are being surveyed regularly already using standardised methods, allowing
mammal data of a high statistical quality to be collected at minimal cost. However, as described
above, the BBS was designed for bird monitoring and its methods do not represent the ideal forany mammal species. Transect methods, in general, represent efficient and readily standardised
approaches to the sampling of many habitats for many taxa, and we have recommended them for
British mammals elsewhere in this report (see Part III.B.3, III.B.4 and III.B.5). Visual counts of
individuals are not, however, appropriate as a means of surveying many mammal species, so
considering mammals, in general, effectively as supplementary bird species (in terms of field
recording) is unlikely to be feasible. Doubts may also exist as to the reliability of birdwatchers as
identifiers of mammals, although these might be eased by the provision of a simple identification
guide. Nevertheless, more visible species which are commonly detected where they occur by
BBS observers, such as Brown Hare, Grey Squirrel and Reeves’ Muntjac, could yield useful
abundance data from BBS counts. In addition, standardised recording of presence/absencethrough signs or off-transect sightings (see below) can add further information for the less visible
species. The BBS clearly cannot provide count data for these species.
8/18/2019 BTO Research Report No.223 - Developing a Mammal Monitoring Programme for the UK
http://slidepdf.com/reader/full/bto-research-report-no223-developing-a-mammal-monitoring-programme-for-the 75/316
BTO Research Report No.223
July 1999 73
The principal weakness of the BBS for mammal monitoring, even for visual species such as
Brown Hare (for which line transect sighting methods can be recommended as the best
monitoring tool: see Part IV.5), is that the timing of the survey is sub-optimal. Vegetation
growth is substantial by May and (especially) June, making the detection of cryptic and silent
animals more difficult, both on the ground and in trees. A second, potentially more serious problem, is that mammal productivity can vary greatly between years, and distinguishing the
adults and juveniles of species, including Brown Hare and the squirrels, can be difficult by May.
This means that apparent changes in abundance from BBS counts could just represent
fluctuating productivity, masking the true trends in the abundance of adults. For each of these
reasons, winter or early spring transect surveys would be preferable (see Part III.B.3). However,
neither problem makes BBS mammal data invalid. Provided that problems with detection caused
by vegetation growth do not affect the form of the relationship between detection rates and true
abundance, lower rates will have no effect on population indices: any inter-annual biases caused
by weather can be controlled for in GLMs using variables such as temperature or rainfall.
Differences between annual counts or probabilities of detection, which are due to variation in
annual productivity, will essentially only produce noise around any long-term population
changes, thus making these underlying changes in adult numbers harder to detect. This will,
therefore, only be a problem if this noise prevents the detection of “true” trends of the magnitude
and with the power required. The effects of variable productivity will vary from species to
species and will be greatest for the less visible species which cannot be counted effectively.
Winter Transect Surveys (see Part III.B.3) run in parallel with the BBS would help to show for
which species the BBS provides data which are not severely influenced by the effects of annual
productivity and vegetation growth.
Presence/absence monitoring
As we have already stated, surveys of animal abundance provide more powerful monitoring tools
than do those of changes in status (presence/absence), all other factors being equal. However,
direct counts of many species are not feasible and the BBS allows useful direct counts to be
made for only a few species.
The utility of BBS presence/absence data clearly depends on how the data can be interpreted. An
obvious, but important, point is that “absence” reflects non-detection, which is not necessarily
true absence. It is then critical to what extent detection rates reflect abundance within BBS
squares: ideally, detection of presence would occur at a certain, fixed density of a given species.
In reality, visual detection will vary with vegetation and productivity as discussed above, and
will also incorporate a strong stochastic component, especially for rarely seen species such asStoats and Weasels. The extent to which presence/absence data are useful then depends on how
much of the variation in detection rates is due to real changes in adult abundance. Given a
sufficiently large sample size, these real changes should be detectable, but we have no data to
determine whether the current and achievable BBS sample size approaches this goal. Calibration
of the BBS against other survey schemes which can be considered to provide more reliable
information for particular species could be used to indicate whether changes in the BBS data
reflect real population changes. The winter and sign transect approaches we discuss elsewhere
(see Parts B.3 and B.4) could provide the relevant information for many species. Rarely seen
species might need calibration work based on intensive Capture-Mark-Recapture work in a
sample of BBS squares.
8/18/2019 BTO Research Report No.223 - Developing a Mammal Monitoring Programme for the UK
http://slidepdf.com/reader/full/bto-research-report-no223-developing-a-mammal-monitoring-programme-for-the 76/316
BTO Research Report No.223
July 1999 74
Key issues in interpreting records of presence in BBS data are the criteria by which it is assessed
and what it is that these criteria really mean. The wording of the instructions for volunteers
changed after 1995, giving greater emphasis to the potential use of signs to assess presence, and
this may explain the relatively low detection rates for many species in 1995 (Table III.A.1.3).
However, the instructions have remained consistent in general, asking for records of species
which were “present, but not on transect” (revised to “known to be present in square” for 1998and 1999). These records can include animals which were “seen on a reconnaissance visit to the
square” or for which the observer has seen “obvious signs of presence during fieldwork”
(including tracks and signs). The principal problem with these methods is that there is
considerable scope for variation in interpretation. For example, not all observers will be able to
recognise Red Fox scats and others may not consider scats to be “obvious”. More seriously,
“known to be present” could be taken not to require direct evidence within the current calendar
year. The level of interest observers have in mammals will also influence the extent to which
they look out for signs, although this will cause only noise, not bias, unless this interest changes
with time. A further problem is that the methods for reconnaissance visits are not standardised in
the same way as those for bird recording. Opportunities for mammal recording could therefore
vary from a cursory visit to check for changes in habitat to an in-depth assessment of changes in,
say, agricultural field uses, perhaps with special attention being directed towards looking for
mammal signs.
All of these problems could be solved by improvements to the instructions for volunteers and/or
the recording form used. Several non-exclusive courses of action are available. First, the data
solicited could be restricted to sightings and signs which we can be confident volunteers can
recognise (such as fresh molehills). Second, information on the type of evidence used to assess
presence could be requested (sightings, scats, roadkills), ideally also incorporating an indication
from the surveyor as to whether they looked for each type of evidence. Third, estimates of the
time spent on habitat recording visits would assist interpretation. Fourth, tighter controls on thesources of evidence that are admissible, such as sightings during reconnaissance visits but not on
other occasions that surveyors might (for example) drive through the square, would help to
standardise the data. Whatever improvements are incorporated, it is important that they do not
increase the complexity of the BBS unduly: its primary purpose will remain the monitoring of
bird populations and any additions which would affect its efficiency in this role should be
avoided.
Developing trend analysis methods
Substantial amounts of research have been conducted into methods of analysing trends in CBC
and other bird abundance data, generally focusing on methods which are related to the GLMapproaches described above (Mountford 1985; Peach & Baillie 1994; ter Braak et al . 1994,
Thomas 1996; Field & Gregory 1999; Fewster et al . in press). These methods include
sophisticated uses of covariate modelling to test hypotheses and the modelling of non-linear
trends which allow realistic long-term population trajectories to be estimated (James et al. 1996,
Fewster et al. in press). The wealth of options available and the flexibility of GLM-based
approaches mean that the brief explorations of analyses of BBS mammal data presented above
only scratch the surface of what is possible. If it is considered that BBS data can contribute
significantly to UK mammal monitoring, its potential will be greatest if time and resources are
made available for detailed investigations of the usefulness of the various modelling options to
be conducted. Three months of staff time for a biostatistician to explore the possible methods
ought to be sufficient.
8/18/2019 BTO Research Report No.223 - Developing a Mammal Monitoring Programme for the UK
http://slidepdf.com/reader/full/bto-research-report-no223-developing-a-mammal-monitoring-programme-for-the 77/316
BTO Research Report No.223
July 1999 75
Extensions to the BBS
We have already identified that the BBS has failings as a monitoring scheme for most (if not all)
mammal species and that winter and sign transect surveys could be valuable, both in their own
right and for the calibration of biases in the BBS data. These new survey options are discussed
in detail in Parts B.3 and B.4, but it may be worth considering extending the BBS or building onthe framework it provides to contribute to such new schemes. Three potential extensions are:
(1) to add mammal-only survey squares to the BBS sample to improve sample sizes by recruiting
volunteers who are not birdwatchers; (2) to ask volunteers to make an additional recording visit
to their squares in late winter to record mammals; (3) to ask volunteers to make specific mammal
sign-recording visits to their squares. The second and third potential extensions would depend
on the willingness of bird volunteers to increase their efforts; the likelihood of them actually
doing this might best be assessed by a questionnaire survey. Some winter visits to existing BBS
squares are likely to be conducted in the future as a part of separate bird monitoring schemes,
and so could be used to provide a limited amount of control mammal data.
Conclusions
We believe that the BBS has the potential to contribute significantly to the monitoring of many
UK mammal species. It would have particular potential value if it were combined with other
multi-species schemes run by a dedicated mammal monitoring organisation. The results of our
analyses of its statistical power for mammal monitoring are encouraging. It is very likely to
provide useful information for species such as Brown Hare, Grey Squirrel, Roe Deer and
Reeves’ Muntjac and may play a central role in their future monitoring (see individual species
accounts). It should also at least provide ancillary information for many other species since the
large sample size of survey sites and wide geographical coverage argue in its favour against any
methodological failings. There are important issues in terms of the sensitivity of presence/absence monitoring to changes in abundance and in biases which the bird recording
design might induce, and these should be addressed using alternative, more robust survey
methods, but they do not invalidate BBS mammal monitoring in principle. The WBBS may also
contribute data for key riparian species, but as yet it has no guaranteed long-term funding and the
sample size it can generate is unlikely ever to be large, so it would be wise not to plan mammal
monitoring schemes around the WBBS at present.
The additions or improvements to mammal monitoring under the BBS that we discuss above will
need formal development, and the administration of data collection and collation additional to
that already done for the bird data will need to be funded (see Part VII.2.1). Annual data
management work ought to take no more than about 35 days of additional staff time; we wouldsuggest that the development work ought to take no more than 55 days. We suggest that this
work would best be done by the BTO staff who currently run the scheme, but that all
interpretation of the data, which would be done in conjunction with data from other schemes,
should be done by mammal specialists, hopefully within a dedicated mammal research
organisation. The design of the final recording form for BBS mammal surveying and the details
of the methods to be used, species coverage, etc., would also best be designed and organised in
conjunction with the input of mammal specialists.

8/18/2019 BTO Research Report No.223 - Developing a Mammal Monitoring Programme for the UK
http://slidepdf.com/reader/full/bto-research-report-no223-developing-a-mammal-monitoring-programme-for-the 78/316
BTO Research Report No.223
July 1999 76
8/18/2019 BTO Research Report No.223 - Developing a Mammal Monitoring Programme for the UK
http://slidepdf.com/reader/full/bto-research-report-no223-developing-a-mammal-monitoring-programme-for-the 79/316
BTO Research Report No.223
July 1999 77
2. GAME BAGS
2.1 Introduction and background
Over the many years for which British country estates have been managed for shooting andhunting game, many of the gamekeepers and managers responsible have kept records of the
animals killed both as quarry species and in the course of predator control. Game Bag records
therefore are among the earliest long-term ecological time-series data, and as such their potential
importance for monitoring contemporary environmental changes in an historical context has long
been recognised by the game research community (Tapper 1992). In this section, we consider
the contribution that bag return data can make to mammal monitoring in the UK, reviewing the
pros and cons of the data in their current form and suggesting amendments which would increase
the utility of the information collected.
A concise history of bag recording in the UK is given by Tapper (1992). The Game Conservancy
Trust (and its forerunner organisations) masterminded the collation of shooting and gamekeeping
bag data into a National Game Bag Census, which has been in operation since 1961. The census
has been improved over time, with computerisation being introduced in the late 1970s, at which
time the scheme was also expanded to provide better coverage of the uplands, especially in
Scotland. Historical data from before 1961 have also been solicited from estates with long-term
records of their own, and these have been integrated with the more recent data, extending the
time series back to 1900 for many species. Such long runs of well-documented data on many
predatory and game species clearly make Game Bag returns an important potential source of
future mammal monitoring information.
Additional bag record data are collected by The British Association for Shooting andConservation (BASC), primarily through one-off surveys of the organisation’s gamekeeper and
deer-stalker membership. These data do not provide long-term or continuing information, but
could contribute to the meeting of monitoring objectives through repeat, “snapshot” surveys.
BASC’s membership also represents a valuable potential source of volunteers who might
contribute to monitoring both through their bag records and through specific survey work.
2.2 The case for Game Bag data as a mammal monitoring tool
There are two principal reasons why Game Bag records could make a valuable contribution to
mammal monitoring: the long runs of historical data and the fact that the data are already being
collected according to established protocols (in the National Game Bag Census). The formerwill provide continuity and an historical context in which future monitoring information can be
viewed. Such a context could be vital: historical population levels can provide us with targets
for conservation action; they also allow the severity of recent population trends to be assessed in
the light of conditions before the onset of any environmental changes causing contemporary
concern. Integrating an established monitoring programme into future plans would allow data to
feed directly into the consideration of policy and the development of conservation and
management objectives without the need for pilot studies or trial surveys testing proposed
methods. It might also be expected to be continued independently of any additional funding.
Mammal recording via Game Bags has several other key advantages. The National Game BagCensus already covers Great Britain effectively (but not Northern Ireland), including recording
from estates in more remote areas such as the highlands of Scotland. Other forms of survey will

8/18/2019 BTO Research Report No.223 - Developing a Mammal Monitoring Programme for the UK
http://slidepdf.com/reader/full/bto-research-report-no223-developing-a-mammal-monitoring-programme-for-the 80/316
BTO Research Report No.223
July 1999 78
always be more difficult in such areas, either because it is more expensive to survey them
professionally or because volunteer densities are correspondingly low where human populations
are sparse. Problems with access can occur for wildlife surveying if the surveyor does not have
the confidence of the landowner or if the latter perceives that a conflict of interest exists between
the survey and his or her shooting or agricultural interests. The use of records directly connected
to game interests should avoid this problem and therefore maximize the likely cooperation fromlandowners. It is also notable that landowners who exploit game populations commercially have
a vested interest in effective monitoring and so should, in principle, be cooperative.
The National Game Bag Census includes a record of the number of gamekeepers working on
estates and it should be possible to enhance this recording of keepering effort. It is also possible
that some of the concern about variable effort in the “sampling” of game populations (see below)
does not represent a serious problem, at least for quarry species, because the numbers killed will
tend to represent (more-or-less) a constant proportion of the population (40% has been suggested
for Brown Hares: Tapper & Stoate 1992, but see Hutchings & Harris 1996) if a viable population
is to be maintained by management. Game managers will use approximate judgements of game
population sizes to determine the number of days’ shooting that can be supported, improving the
likely correlation between the sizes of Game Bags and abundance. However, improved
recording of zero yields (no shooting) would be required if this approach were applied in
population monitoring. Further expansion of the national census could perhaps be achieved by
targeting individual shooters (for example, members of BASC) as well as gamekeepers and
estates, and by developing coverage in Northern Ireland.
In summary, the following factors recommend the use of Game Bag data for mammal
monitoring:
• long runs of historical data provide an important historical context that is unavailable
elsewhere;• data collection protocols are established and a national scheme is already funded, promising
future continuity at low cost;
• the National Game Bag Census already covers much of Great Britain effectively, including
some general problem areas;
•
game and landowner interests are close to the data recording process, avoiding problems
with cooperation and access which could affect other schemes;
•
improvements to the recording of “sampling” effort and coverage (i.e. in Northern Ireland)
may be possible.
2.3 The case against Game Bags
There are various problems with Game Bag data as they have been (and currently are) collected,
some of which could be remedied easily and some which are more fundamental. The biggest
general problem with the current bag record database is that the effort expended in shooting or
control has not been recorded. In practice, this means that any apparent trend in a time-series of
bag data could reflect changes in “sampling” methods or intensity as well as changes in the
abundance of the species concerned. This is conceded tacitly by Tapper (1992), who wrote of
the inclusion of predator records in the Game Bag Census that they “...could provide a useful
guide not only as to the efficiency of predator control, but also an insight into the changing
abundance of predators”. In fact, these two types of information are confounded in the data.
The significant changes in the methods used by gamekeepers to kill foxes documented by
Reynolds & Tapper (1994) would be expected a priori to produce an upward trend and are
probably sufficiently important to explain the increase in bag returns that these authors
8/18/2019 BTO Research Report No.223 - Developing a Mammal Monitoring Programme for the UK
http://slidepdf.com/reader/full/bto-research-report-no223-developing-a-mammal-monitoring-programme-for-the 81/316
BTO Research Report No.223
July 1999 79
nevertheless ascribe to an increase in abundance. In addition, McDonald & Harris (in press)
have recently shown that long-term declines in the bag returns for Stoat and Weasel can be
explained as well by changes in trapping effort as by changes in abundance. It is highly likely
that some changes in the sampling effort on which the Game Bag time-series are based have
occurred for most species since 1961.
It is important to realise that “sampling effort” as we are referring to it here includes qualitative
as well as quantitative factors. Thus, while a critical influence on shooting bags will be the
number of man-days spent shooting, the efficiency of the guns and other equipment used (e.g.
spotlights) and the skill levels of the shooters will also have important influences. Likewise,
gamekeeper effort includes the nature of the method used for control (traps versus poison versus
shooting), the efficiency of the method (which could vary with, say, type of poison) and the time
expended by the keeper(s). The seasonal timing of control measures (which is likely to vary
more than that of shooting harvests) is another feature of sampling effort which can affect kill
rates via changes in the population sampled. For example, shifts in the timing of the peak effort
in fox control have led to more dispersing animals being killed in addition to residents (Reynolds
& Tapper 1994), a factor which has probably contributed to the rise in bag returns. Although it
is unimportant for monitoring purposes whether sampling effort differs between estates (or
gamekeepers, or whatever the sampling unit is chosen to be), it is critical either that it is constant
over time or that the variation is quantified (see Part II). We would also note that amount or
efficiency of effort may not be closely related to the numbers of individuals killed, because of
interactions with features of species’ social organisation. Once territory holders are removed, a
virtually limitless pool of immigrant individuals may be tapped, such that the local abundance of
breeding animals is not reflected well by the numbers of individuals killed. The extent to which
this occurs is likely to depend on the time of year at which trapping is conducted, but it can
certainly be a problem for foxes (Reynolds & Tapper 1994) and mustelids (McDonald & Harris,
in press).
Even if attempts are made to standardise recording effort, a key problem is likely to stem from
changing fashions in gamekeeping and game rearing. As the aims of game management change,
for example from providing a shootable stock of wild Grey Partridges Perdix perdix to producing
hand-reared Pheasants Phasianus colchicus, the gamekeeping measures thought to be necessary
will change. As a result, the sampling effort underpinning the Game Bag record is likely to
change qualitatively or quantitatively in response to strong commercial influences. It is difficult
to see how gamekeeper effort could remain constant under such circumstances.
Another serious problem with Game Bag data is that they are, inevitably, drawn from shooting
estates which are unlikely to be representative of the wider countryside. Management for gamespecies will produce artificially high densities, especially where predator control is practised, and
animals such as Brown Hares are sometimes moved to restock areas which have been hunted out
or to create densities which are sufficiently high for driven shooting (Hutchings & Harris 1996).
Within estates, shoot locations can also vary from year to year, if abundance is patchy, such that
only areas with high densities are sampled to produce Game Bags, thus masking temporal
variations in overall abundance (S. Harris, pers. comm.). These factors will limit the relevance
of trends in Game Bag data to those of populations in the wider countryside. In addition, the
removal of a large percentage of a species’ population in the course of “sampling” means that the
sampling method has a major impact on the population which, therefore, it cannot measure. For
Brown Hares, as much as 69% of a local population can be removed in a year (Stoate & Tapper1993): such a rate of killing probably represents the major mortality factor in the population, so

8/18/2019 BTO Research Report No.223 - Developing a Mammal Monitoring Programme for the UK
http://slidepdf.com/reader/full/bto-research-report-no223-developing-a-mammal-monitoring-programme-for-the 82/316
BTO Research Report No.223
July 1999 80
an independent (preferably non-destructive) sampling regime would be required to measure its
effects.
Changes in the sample of estates included in the Game Bag data set may also produce biases
leading to the overestimation of abundance. Estates where shooting becomes poor over time are
more likely to drop out of the survey altogether (if shooting ceases) than estates with bettershooting, while new estates joining the scheme will probably be relatively good. In addition,
zero records are not returned in the current National Game Bag Census, i.e. no data are obtained
when no shooting has occurred in a given year because game numbers were too low to permit it.
Each of these effects will bias abundance indices upwards. There is also a potential problem in
that shooting and gamekeeping interests would have close control over the data collection for
any Game Bag-based survey. Such individuals and organisations will have a commercial interest
in having particular population levels of prey and predators perceived by the public at large, by
conservation bodies and by government, especially if the results of the survey were to feed into
policy. It would be preferable if monitoring could be conducted by an independent organisation.
A final problem with Game Bag data is specific to the information collected about predators.
Such data are critically sensitive to changes in legislation: persecution of predators may continue
after protection has been put in place, but gamekeepers and landowners are highly unlikely to
report animals killed in such circumstances, even if anonymity is assured. This problem affects
the data collected for Wildcat, for example: the Game Bag time-series ceases when full
protection under the Wildlife and Countryside Act was granted to the species in 1988 (Tapper
1992). Partial protection for Hedgehog under the same Act has also reduced the number of
estates reporting data on this species (Tapper 1992).
In summary, the following factors argue against the use of Game Bag data for mammal
monitoring:• probable historical changes in sampling effort and methods, both qualitative and
quantitative, tend to devalue historical Game Bag data;
• some recording of effort or some commitment to standardisation is needed to make
monitoring data from Game Bags reliable, but the extent to which the data collection can be
extended is limited;
•
the main influences on gamekeeping and shooting, such as commercial factors and game
rearing fashions, will always be external to a monitoring scheme, so the need for
standardisation under the latter is unlikely to be a guiding influence;
•
shooting estates are unlikely to be representative of the wider countryside;
•
shooting pressure will respond geographically to local variations in density, masking
population variation;• shooting can remove large proportions of local populations, thus becoming a major
mortality factor, the effects of which shooting bags cannot measure;
• zero bag returns are not reported and estates entering into the Game Bag Census will tend to
report larger bags than those leaving the scheme, creating bias;
• political and commercial considerations may influence the accuracy of the reporting of
Game Bag statistics;
• legislation can change over time, leading to unavoidable changes in effort or to a species
dropping out of the scheme altogether.
2.4 Conclusions and future priorities
8/18/2019 BTO Research Report No.223 - Developing a Mammal Monitoring Programme for the UK
http://slidepdf.com/reader/full/bto-research-report-no223-developing-a-mammal-monitoring-programme-for-the 83/316
BTO Research Report No.223
July 1999 81
It is important to remember that, whatever the problems with the historical Game Bag data set
are, many of the historical weaknesses are irrelevant in terms of the potential utility of such data
for future monitoring. Thus, in principle, efforts could be made to include the recording of
shooting and gamekeeping effort and to improve the recording of zero returns in the National
Game Bag Census. However, the principal asset of the Game Bag data is the historical context it
provides, and any large scale changes would remove continuity from the data: the GameConservancy would probably be unwilling to do more than include some ancillary recording
forms in the census as an add-on, preserving the structure of the data (S.C. Tapper, pers. comm.).
It is also the case that, once it is acknowledged that changes need to be made to the collection of
bag data to make them more useful, the historical data have been devalued implicitly. In turn,
this process weakens the case in favour of using bag returns in the first place.
Given the addition of sufficient recording of sampling effort (which will depend, ultimately, on
the amount of information that contributors of Game Bag data are prepared to record) to the
national census, Game Bag trend data could be modelled in the same way as CBC and other bird
abundance data are modelled. This form of analysis would consist of models of bag sizes which
incorporate year effects (estimates of the temporal variation) and categorical estate effects which
change when sampling effort changes, i.e. treating estates where methods (say) change as new
estates (see ter Braak et al. 1994; Thomas 1996). This would not work if changes in effort are
too frequent, so standardisation over time would need to be encouraged: effort for a given
species would have to remain stable over runs of several years (say, 5-10) at each site (estate)
and then not change across all or most estates at the same time. Such developments of the Game
Bag data would need to be funded as specific, contracted research projects.
Even without any improved recording of effort, the utility of bag data will vary between species
because it will be much more reliable for some species than others. The data might be better for
quarry species which are managed sustainably, representing a constant proportion of the population, and they might be particularly poor for generalist predators with only a peripheral
impact on game, such as Brown Rats, Hedgehogs and Grey Squirrels, for which control measures
might vary considerably in space and time. We have discussed the utility of bag data for each
species group in the individual species accounts, but another general consideration is that
sampling effort will be more variable for species for which it is easier for gamekeepers to assess
abundance (S.C. Tapper, pers. comm.). For example, years with higher frequencies of Red Fox
sightings are likely to lead to higher intensities of control, but such clues are not available as to
variations in the abundance of small mustelids, so gamekeepers are more likely simply to expend
the same effort (i.e. to set the same number of traps) every year. The diversity of possible
methods for the control or hunting of a given species will also influence the variation in effective
effort that occurs both spatially and temporally: more choice is likely to lead to moreexperimentation. Nevertheless, it is at least possible for trends in Game Bags apparently to
reflect real changes in abundance: the trends revealed by the data for Grey Partridge match those
shown by the CBC (Tapper 1992; Siriwardena et al. 1998), lending support to both surveys.
(Unfortunately, no such national, potentially corroborative data yet exist for British mammals.)
We conclude that Game Bag data can provide a useful contribution to the monitoring ofmammals in the UK, but that they should not be considered as a central part of future monitoring
policy. The value of the data will depend, to some extent, on the other monitoring options

8/18/2019 BTO Research Report No.223 - Developing a Mammal Monitoring Programme for the UK
http://slidepdf.com/reader/full/bto-research-report-no223-developing-a-mammal-monitoring-programme-for-the 84/316
BTO Research Report No.223
July 1999 82
available for a given species. Where other survey schemes can be established which will provide
alternative sources of population trend information, similarities after 5-10 years between the
changes over time shown by these schemes and the changes shown by the National Game Bag
Census will give a clearer idea of the conclusions that we can draw from historical bag data.
Meanwhile, we recommend that efforts should be made to encourage contributors of bag data to
record as much ancillary information on sampling effort as is feasible. Such efforts would best be focused on the species for which Game Bag data are most likely to be valuable. We suggest
that these species should be Stoat and Weasel: other schemes are unlikely to monitor them well
and there is reason to believe that the bag data for these species are relatively reliable (see
above).
The potential value of the long-term historical data sets that Game Bags provide also means that
it would be worthwhile to investigate further how they might be interpreted. A key issue is the
calibration of changes in sampling effort: monitoring the effects of future changes in effort via
comparisons with independent measurements of abundance would calibrate not only that
particular change but also shed light on the likely implications of past changes. Experiments
mimicking past changes in effort which are regarded as being particularly important would also
be valuable for calibration purposes. A further topic for investigation is the relationship between
bag sizes and true abundance for many species: this is known to be non-linear for some
gamebirds, but has not been investigated for mammals (S.C. Tapper, pers. comm.). Last, some
data which are supplementary to the central Game Bag records are also currently collected and
computerised, and explorations of these data could also clarify some of the biases which are
believed to exist in the data (S.C. Tapper, pers. comm.). We recommend that the funding of
studies such as these should be considered: the potential of Game Bag data to supply a valid
historical context for mammal monitoring should be explored in detail.

8/18/2019 BTO Research Report No.223 - Developing a Mammal Monitoring Programme for the UK
http://slidepdf.com/reader/full/bto-research-report-no223-developing-a-mammal-monitoring-programme-for-the 85/316
BTO Research Report No.223
July 1999 83
B. FURTHER POTENTIAL MULTI-SPECIES SCHEMES
3. WINTER TRANSECT SURVEY
This scheme would use volunteers to carry out visual transects during the late winter period. The
exact protocol to be adopted will require further discussion, although two approaches (the twoextremes) are outlined here. In the more formal approach (based on the BBS protocol) volunteers
would walk two predetermined 1km transects within a 1km square and record the number of
individuals encountered of each selected species. The less-formal approach (used specifically in
upland areas and primarily for Mountain Hares) would ask volunteers to walk a transect (with
location and length selected by the volunteer) once each winter or early spring with the aim of
counting the number of individuals of the selected species seen.
3.1 Advantages and disadvantages of this approach
Advantages
"
It would cover several species for which other monitoring schemes were deemed less
suitable and/or for which the species' is more visible in winter thereby maximising detection
rates (e.g. Rabbit, Brown Hare, Mountain Hare, Red Fox and to a lesser extent Grey and
Red Squirrels and deer).
" It would provide information on some species for which monitoring at other times of year
would contain a significant productivity component masking long-term trends (e.g. Rabbit,
Brown Hare, Mountain Hare). In this way it could act as a control for the BBS data.
" Volunteers might have fewer conflicting demands on their time during late winter.
" Visual transects would be better for volunteer involvement than more demanding techniques
requiring greater identification skills.
Disadvantages
" The possibility of poor weather conditions.
" Difficulties in getting volunteers to participate in some areas (especially the more remote
areas)
" Shorter day length, meaning that most fieldwork would have to be carried out at weekends,
rather than early mornings on weekdays.
This scheme should be used in conjunction with other schemes (notably Sign Transect Survey
and BBS) to determine its effectiveness and to help reveal patterns in long-term trends.
Following examination of the data from concurrent schemes it may be possible to reduce thenumber of schemes being operated.
3.2 Which species could be monitored under this scheme?
All non-marine, non-Chiropteran species could potentially be recorded through this scheme
where visual identification can be determined. This would allow volunteers to record everything
they could see and identify, thus increasing their morale and providing some useful data on
distribution. However, the target species for this scheme should be:
" for monitoring population trends (main spp): Rabbit, Brown Hare, Mountain Hare.
8/18/2019 BTO Research Report No.223 - Developing a Mammal Monitoring Programme for the UK
http://slidepdf.com/reader/full/bto-research-report-no223-developing-a-mammal-monitoring-programme-for-the 86/316
BTO Research Report No.223
July 1999 84
" for monitoring population trends (other spp.): Grey Squirrel, Red Squirrel, Stoat, Weasel, all
deer species.
" for monitoring distribution: Pine Marten, Polecat, Feral Ferret, American Mink, Otter,
Wildcat, Wild Swine, Chinese Water Deer, Reeves' Muntjac.
All the included species should be printed on recording forms. Observers should be asked towrite in any other mammals that they come across, both to allow them the pleasure of doing so
and to provide records of escaped aliens.
3.3 Examples of previous surveys using winter visual transects
National Brown Hare Survey - (see Part IV.5). The national population estimate for this species
of 817,520±137,521 individuals was based on a winter transect survey of 738 1km squares over
three winters. Counts of Brown Hares are best made between October and March, when
detection rates are high and sward height is low. However, heavy persecution through driven
shoots during February and March suggests that survey work should be completed by the end of
January, thereby avoiding the influence of this important annual mortality factor Stephen Harris
(pers. comm.).
Various Rabbit surveys - The five Rabbit surveys documented by Trout et al. ( 1986) were all
carried out during the first third of the year (typically January to March). This is a time of year
when the population is made up of overwinter survivors, thus reducing the influence of annual
productivity on the monitoring estimate. It should be noted that visual transects for Rabbits
carried out during the late winter may not provide as much information of value for monitoring
(e.g. index of abundance) as transects involving the winter recording of field signs (see Part
III.B.4).
Mountain Hare Walks - Several local natural history societies carry out less formalised walks
along standard routes in upland areas, along which the numbers of Mountain Hares are recorded.
(See Part IV.5).
3.4 What a Winter Transect Survey could offer
The use of volunteer recorders would allow the accurate visual recording of a small number of
mammal species, although recorders should be allowed to gather information on all mammal
species seen, even if this were not used in the same way for monitoring (e.g. records of Pine
Martens could provide useful distributional data but would not contribute to any attempt to
monitor population trends for this species). Allowing volunteers to record all speciesencountered should also improve participation rates and maintain motivation. An essential part
of the management of the volunteer effort would be the provision of an annual newsletter, sent
out prior to the fieldwork season and/or the inclusion of other taxa.
3.5 Alternative approaches
There is a continuum of possible methods with: (a) formalised transects based on the BBS
protocol of observers following as closely as possible 'ideal' transect lines at one extreme and (b)
less-formal 'walks' by volunteers along standard routes chosen by themselves at the other. The
former adopts a more rigorous, statistically acceptable protocol while the latter is more likely tofind favour with volunteers. The lack of a rigid protocol need not necessarily reduce the
monitoring potential of winter 'walks'. It is felt that the winter 'walks' would be particularly

8/18/2019 BTO Research Report No.223 - Developing a Mammal Monitoring Programme for the UK
http://slidepdf.com/reader/full/bto-research-report-no223-developing-a-mammal-monitoring-programme-for-the 87/316
BTO Research Report No.223
July 1999 85
suited to the monitoring of population trends in Mountain Hares. Such walks have been
undertaken by local natural history societies in northern England specifically for this purpose,
albeit at the local level. The choice of approach to adopt will depend on the required rigour and
potential volunteer involvement. Consideration should also be given as to whether a particular
approach should be adopted nationally. There could be good reasons for using different
approaches in different regions (related to volunteer availability) or for different species/habitats.
3.6 The data recording forms
Form complexity will depend on the approach adopted and the type of data required.
Formal approach - We suggest that the forms can be read using an optical-mark-reader, allowing
the rapid input of voluminous but fairly simple data. Recorders would simply count the number
of individuals seen for each species, with no attempt to estimate density through distance
sampling, and score through the appropriate box on the recording form. All the species likely to
be encountered would appear on the form, with space for others to be entered by hand. Details
on other species would have to be input by hand if these data are to be used, although they need
not be used. Each transect should have a numeric code, as should each fieldworker. Fieldwork
effort, as denoted by the amount of time spent in the field, should also be recorded. One form
should be used for each of the two visits. A further form could be used to allow the recording of
habitat details using a simple hierarchical approach.
Less formal approach - A single form would be required for this approach, with a reduced set of
species and effort targeted towards recording Mountain Hares. Again the aim would be to use a
form that can be optically-mark-read, containing information on the site, observer and habitat in
addition to the species count data.
3.7 Organisation of the Winter Transect Survey
A single individual should be able to co-ordinate the scheme, producing fieldwork material,
helping with the analysis of data and preparing regular newsletters. Additional inputs would be
required at the graduate scientist, or more likely post-doctoral level, when data analysis takes
place. It is suggested that this individual would also co-ordinate the Sign Transect Survey,
working for the umbrella mammal monitoring body which would also run the other multi-species
schemes and collate data from them and the mammal data generated by the BBS.
3.8 Other considerations
A discussion on the potential for the various forms of winter transect should cover the following
points:
• Integration of components from sign transects may be appropriate for some species covered
by the winter visual transects (e.g. Rabbit and Mole).
•
Late winter may be a difficult time of year in which to recruit volunteers and carry out
fieldwork, although fieldworkers may have fewer alternative commitments. The effects ofshort daylength and poor weather need to be considered.

8/18/2019 BTO Research Report No.223 - Developing a Mammal Monitoring Programme for the UK
http://slidepdf.com/reader/full/bto-research-report-no223-developing-a-mammal-monitoring-programme-for-the 88/316
BTO Research Report No.223
July 1999 86
• Feedback to volunteers would need to be an important component of the scheme, ensuring
that continuation rates are maintained, with an annual newsletter.
•
Consideration should be given to the points raised in Part III.A.2 on the power of BBS data
to detect long-term trends in mammal species.
•
Determination of appropriate transect lengths and survey design need further evaluation,
using a modelling approach and existing datasets on mammal density and distribution
within a range of habitats. 'Winter walks' may be best in upland areas (e.g. for Mountain
Hare with the more rigid protocol used in other habitats.
3.9 Resource Requirements
Set-up costs - see Part VII.2.3
Ongoing costs - Were the scheme to be run centrally (apart from the initial recruitment of
participants) and assuming co-ordination of this scheme with the Sign-Transect Survey and the
Mammals on Roads Scheme, we estimate the annual requirements to be as outlined in Part
VII.2.3.
We anticipate that the establishment and operation of a single scheme (in isolation) would
require approximately half of the sums shown in Part VII.2.3: running all three schemes together
would allow certain economies of scale

8/18/2019 BTO Research Report No.223 - Developing a Mammal Monitoring Programme for the UK
http://slidepdf.com/reader/full/bto-research-report-no223-developing-a-mammal-monitoring-programme-for-the 89/316
BTO Research Report No.223
July 1999 87
4. SIGN TRANSECT SURVEY
This scheme would use volunteers to carry out a search for easily recognisable mammal field
signs along transects of standardised length and location. A protocol for the number of visits and
their timing requires further consideration.
4.1 Advantages and disadvantages of this approach
Advantages
" It would permit the monitoring of a number of species that are difficult to observe directly
in the field, but which have easily identifiable field signs (e.g. Hedgehog, Mole, Red Fox
and Badger). Several of these species may already be covered by species-specific schemes
or other multi-species schemes and data from the proposed scheme could provide an
ancillary role.
" Where there is a known relationship between field sign density and population density it
would be possible to monitor changes in abundance directly. Where the relationship is notclear, then it would still be possible to monitor population change through changes in the
field sign index. Complications caused by any differences between habitats (see Rabbit
species account) could be overcome by maintaining the same field sign transects over time,
coupled with basic habitat recording.
Disadvantages
" Fieldworkers need basic skills in identifying particular field signs (but note the success of
Look Out For Mammals: Part V.6).
" The field signs of some species cannot be readily separated in the field except by very
experienced fieldworkers.
"
Different searching may be required for different species' field signs, resulting especiallyfrom where they are located (e.g. squirrel dreys in trees, Mole hills on the ground).
This scheme could be used in conjunction with other schemes (notably Winter Transect Surveys
and BBS) or in parallel to them (and to other single-species schemes) as a means of providing
ancillary data to support those gathered by the different approaches. If several schemes are
operated in parallel it should be possible to determine which one(s) offer the best power while
being the most cost-effective and to make judgements about future funding and continuation of
individual schemes.
4.2 What species could be monitored under this scheme?
Only a limited number of species should be covered by this scheme, so professional fieldworkers
with experience of the more difficult species and their field signs would not be needed. The
target species for this scheme and their acceptable field signs should be:
Hedgehog (droppings), Mole (mole-hills), Rabbit (warrens, droppings), Red Squirrel (dreys
and cones in areas where the two species do not overlap), Grey Squirrel (dreys and cones in
areas where the two species do not overlap), Red Fox (droppings), Badger (active setts, latrines,
droppings)
8/18/2019 BTO Research Report No.223 - Developing a Mammal Monitoring Programme for the UK
http://slidepdf.com/reader/full/bto-research-report-no223-developing-a-mammal-monitoring-programme-for-the 90/316
BTO Research Report No.223
July 1999 88
4.3 Previous surveys using field sign transects
Field signs have been widely used in a number of monitoring and census schemes. These have
been dealt with under the individual species accounts and so will not be further reported here.
(See Rabbit, Water Vole, Harvest Mouse, Common Dormouse, Otter, Mink, Pine Marten,
Badger, and various deer species.)
The National Fox Survey which is currently in progress (see Part IV.17) is a volunteer-based
scheme involving searches for fieldsigns, so will potentially provide both a useful baseline for
the monitoring of one key Sign Transect Survey species and useful clues as to effective
methodologies. The latter will include successful field methods (transect routes and lengths,
etc.), ideas as to volunteer skill and motivation and data on likely fieldsign encounter rates in
different areas. Preliminary analyses following the Fox Survey’s pilot year show encouraging
levels of participation and of fox scat detection.
4.4 What a field sign transect scheme could offer
The use of volunteer recorders in this manner is likely to offer the best opportunity for
monitoring Mole, Rabbit and Red Fox, as well as providing important ancillary data for a
number of other species. Some additional information would also be generated for other species
where the monitoring of distribution is considered important, although such records would
typically be of individuals seen during fieldwork, rather than their signs. However, volunteers
should be allowed to record field signs of all mammal species where they felt confident enough
to do so. Allowing fieldworkers to record all mammal signs encountered should also improve
participation and retention rates and allow them to 'opt out' of some species. An annual or
seasonal newsletter should also be produced to further increase motivation.
4.5 The data recording forms
We suggest that the forms can be read using an optical-mark-reader (OMR) to allow the rapid
input of voluminous but fairly simple data. Recorders should simply count the number of field
signs encountered for a given species along the transect route, with no attempt to estimate field
sign density from established methods - i.e. no consideration need be given to the accumulation
rates for droppings and the effects of weathering, particularly if the same sites are used in future
years. All the species likely to be encountered should appear on the form with counts scored
through within boxes. Information on additional species would be added by hand within a section
for other records, mainly to prevent observers being frustrated by being unable to submit records
that they found to be interesting. These data would require computerisation by hand rather than by OMR if it was felt advantageous to analyse them. Habitat information should be entered on
the same form along with details about transect location and observer code.
4.6 Organisation of Sign Transects
A single individual should be able to co-ordinate the scheme, producing fieldwork material,
helping with the analysis of data and preparing regular newsletters. Additional inputs would be
required at the graduate scientist, or more likely post-doctoral level, when data analysis takes
place. It is likely that this individual would also co-ordinate the Winter Transect Survey,
working for the umbrella mammal monitoring body which would also run the other multi-speciesschemes and collate data from them and the mammal data generated by the BBS. Transects
should follow linear features (including hedges, roads, rivers, paths, etc) on the basis that higher

8/18/2019 BTO Research Report No.223 - Developing a Mammal Monitoring Programme for the UK
http://slidepdf.com/reader/full/bto-research-report-no223-developing-a-mammal-monitoring-programme-for-the 91/316
BTO Research Report No.223
July 1999 89
encounter rates are likely to be encountered along linear features than random lines (see National
Fox Survey account and Pine Marten account).
4.7 Other considerations
A discussion on the potential for this method should cover the following points:
" Volunteers will vary in their ability to identify different mammal field signs, with the level
of ability likely to improve through training workshops.
" Support to volunteers should allow the provision of training workshops, guidance notes and
verification of any field signs sent in.
" Volunteers should be allowed to record all mammal field signs encountered so long as they
are confident of a correct identification.
" Sightings-based data should also be allowed to be submitted, providing useful
distributional data and some supporting evidence for those field sign records submitted.
"
Integration of Sign Transects with other transect schemes (notably Winter Transect Survey)may be appropriate (e.g. fieldworkers could walk a transect in one direction recording
animals seen and on the return record field signs). This would provide the fieldworker
with something to do on the return route and enable two sets of data to be gathered at the
same time.
" Feedback to volunteers should take the form of a regular newsletter sent out prior to the
commencement of fieldwork.
" Detailed consideration should be given to the points raised in Part III.A.1 on the power of
the BBS transect approach to detect long-term trends in mammal populations.
" Determination of appropriate sampling protocols should be undertaken alongside those for
other potential transect methods, thereby maintaining consistency in methods and allowing
overlap in participation.
" Timing of transects is important and needs to be considered on the basis of temporal
patterns in field sign occurrence for individual species and the timing of other studies. The
number of visits each year, together with transect length and degree of stratification should
be determined through pilot fieldwork and simulation studies.
" Fieldworkers from the National Fox Survey could be recruited into the scheme.
4.8 Resource Requirements
Set-up costs - see Part VII.2.3.
Ongoing costs - Were the scheme to be run centrally and assuming co-ordination of this scheme
with the Winter Transect Survey scheme and the Mammals on Roads Scheme, we estimate the
annual requirements to be as outline in Part VII.2.3.
We anticipate that the establishment and operation of a single scheme (in isolation) would
require approximately half of the sums shown in Part VII.2.3: running all three schemes together
would allow certain economies of scale.

8/18/2019 BTO Research Report No.223 - Developing a Mammal Monitoring Programme for the UK
http://slidepdf.com/reader/full/bto-research-report-no223-developing-a-mammal-monitoring-programme-for-the 92/316
BTO Research Report No.223
July 1999 90

8/18/2019 BTO Research Report No.223 - Developing a Mammal Monitoring Programme for the UK
http://slidepdf.com/reader/full/bto-research-report-no223-developing-a-mammal-monitoring-programme-for-the 93/316
BTO Research Report No.223
July 1999 91
5. MAMMALS ON ROADS
This scheme would monitor a small number of mammal species recorded (alive or dead) along
routes regularly travelled by volunteers. The recording of wildlife road casualties in particular
has been used to calculate national estimates of annual mortality (attributable to road traffic) for
a range of bird and mammal species (Finnis 1960; Hodson 1965; Bourquin 1983; Morris (pers.comm.); Shawyer 1999). This approach can be modified to produce indices of occurrence based
on the presence of individual species along standard routes. Alive or dead individuals would be
recorded separately, to allow the production of either separate or combined indices.
5.1 Advantages and disadvantages of this approach
Advantages
" The scheme would permit the monitoring of a number of species that are difficult to
observe directly in the field, but which are often encountered crossing roads or found dead
on them.
"
A similar method has been successfully applied to a range of bird and mammal species for
monitoring purposes.
Disadvantages
" The species covered would be limited by those that are readily identifiable as they cross the
road or when they have been hit by cars.
" The survey will need to be simple to carry out safely, thus reducing the range of species
that can be covered and the amount of data that can be collected.
" Fieldwork would need to be restricted to the summer months when days are sufficiently
long to allow successful recording.
"
The frequency of carcass removal (particularly of large carcasses) along some roads maycause a problem, since this is likely to vary on an annual basis depending on local
government spending priorities. Some roads are cleared every two days (Colin Shawyer,
pers. comm.).
" Live sightings may not provide many data.
5.2 What species could be monitored under this scheme?
Only a limited number of species could be monitored under this scheme, given the practicalities
of recording mammals while driving a predetermined route. The target species for monitoring
population trends through this scheme should be: Hedgehog, Grey Squirrel, Red Fox, Stoat,Badger, Fallow Deer, Roe Deer and Reeves' Muntjac.
Several other species could perhaps also be included, namely: Rabbit, Brown Hare, Weasel and
Red Deer.
Those species for which this approach could generate useful data on distribution include Polecat,
Pine Marten, Feral Ferret, Otter, Wildcat, Reeves' Muntjac and Chinese Water Deer.

8/18/2019 BTO Research Report No.223 - Developing a Mammal Monitoring Programme for the UK
http://slidepdf.com/reader/full/bto-research-report-no223-developing-a-mammal-monitoring-programme-for-the 94/316
BTO Research Report No.223
July 1999 92
5.3 What a Mammals on Roads Survey could offer
The use of volunteer recorders in this manner is likely to offer a good opportunity for monitoring
a number of mammal species, providing ancillary data to that gathered by other multi- and single
species schemes. Additional information on distribution is also likely to be generated for several
species as a result of this scheme.
5.4 The data recording forms
We suggest that the forms can be read using an optical-mark-reader (OMR) to allow the rapid
input of voluminous but fairly simple data. Recorders should simply count the number of
individuals encountered for a given species along the transect route (with live and dead recorded
separately). All the target species should appear on the form with counts scored through within
boxes. Information on additional species would be added by hand within a section for other
records, mainly to prevent observers being frustrated by being unable to submit records that they
found to be interesting. These data would require computerisation by hand rather than by OMR
if it was felt advantageous to analyse them. The fieldwork instructions should also stress the
value of collecting corpses of certain species: those for which genetic monitoring work is being
undertaken (Polecat, Pine Marten, Feral Ferret), although the safety element should be stressed.
Information on road type, adjacent landscape, route length and traffic density should also be
recorded, with the latter being derived through a simple count of oncoming traffic during a
journey on which mammals were not being counted. This will allow for changes in traffic
density over time to be examined, with the road death data being adjusted accordingly.
5.5 Organisation of Mammals on Roads
A single individual should be able to co-ordinate the scheme, producing fieldwork material,
helping with the analysis of data and preparing regular newsletters. Additional inputs would be
required at the graduate scientist, or more likely post-doctoral level, when data analysis takes
place. This scheme could be co-ordinated alongside the Winter Transect Survey and the Sign
Transect Survey, under an umbrella mammal monitoring body which would also run the other
multi-species schemes and collate data from them and the mammal data generated by the BBS.
5.6 Other considerations
A detailed analysis of the advantages and disadvantages of this approach (when applied to road
deaths) is provided in MMR. There are a number of other considerations:
• The safety of observers is paramount and fieldwork methods, choice of roads, etc. should
all be evaluated against safety aspects. Motorways and dual-carriageways should not be
used.
• Fieldwork should only take place during late spring through to early autumn.
• Details of traffic density, class of road and main habitats along the route all need to be
recorded, though not during the monitoring visits
• Volunteers should be able to select the location and length of their route.

8/18/2019 BTO Research Report No.223 - Developing a Mammal Monitoring Programme for the UK
http://slidepdf.com/reader/full/bto-research-report-no223-developing-a-mammal-monitoring-programme-for-the 95/316
BTO Research Report No.223
July 1999 93
• Timing of recording should be ideally limited to the morning commuter period or some
other consistent time of day.
•
Feedback to volunteers would need to be an important component of the scheme, ensuring
that continuation rates are maintained.
5.7 Resource requirements
Set-up costs - See Part VII.2.3.
Ongoing costs - Were the scheme to be run centrally and assuming co-ordination of this scheme
with the Winter Transect Survey scheme and the Sign Transect Survey, we estimate the annual
requirements to be as outlined in Part VII.2.3.
We anticipate that the establishment and operation of a single scheme (in isolation) would
require approximately half of the same shown in Part VII.2.3: running all three schemes together
would allow certain economies of scale.

8/18/2019 BTO Research Report No.223 - Developing a Mammal Monitoring Programme for the UK
http://slidepdf.com/reader/full/bto-research-report-no223-developing-a-mammal-monitoring-programme-for-the 96/316
BTO Research Report No.223
July 1999 94

8/18/2019 BTO Research Report No.223 - Developing a Mammal Monitoring Programme for the UK
http://slidepdf.com/reader/full/bto-research-report-no223-developing-a-mammal-monitoring-programme-for-the 97/316
BTO Research Report No.223
July 1999 95
6. MAMMALS ON NATURE RESERVES
In this scheme the wardens of nature reserves would send in records of having observed (or not)
mammals on their reserves.
6.1 Advantages and disadvantages of this approach
Advantages
" There are a large number of reserves.
" They have a good geographical spread, especially being better spread than the human
population.
" They cover a good range of semi-natural and natural habitats.
" Those wardening them are committed to nature conservation: some are paid, others have
taken on the role in a voluntary capacity but in a sufficiently formal way for the commitment
to be explicit.
"
Most of those wardening reserves are highly competent field naturalists." Since reserves are mostly permanent, they provide better security for long-term continuity of
observations.
Disadvantages
" Reserves tend not to include agricultural land (which makes up the majority of the UK) or
'human sites'.
" Reserves are usually places of particular nature conservation interest, making them
unrepresentative of the countryside in general.
" Reserves are generally managed to maintain or enhance their nature conservation interest, so
trends observed on them may not be representative of those in the wider countryside.
The last point is particularly important but may be less significant than might at first sight
appear. Reserves are generally small, so that for medium and large mammals at least their
populations are unlikely to be self-sustaining; they are generally so isolated that immigration
from other reserves cannot be relied upon to re-establish mammalian populations that have
become extinct on one reserve (an important difference between mammals and birds - the latter
appear to be able to find almost any patch of suitable habitat). Thus, except for small species,
mammal populations on reserves, while they may be denser, are likely to be correlated with those
in the surrounding countryside.
We believe that the advantages of this approach outweigh the disadvantages and that such ascheme could make a valuable contribution to the monitoring of a number of species.
6.2 Which species could be monitored under this scheme?
All species of non-marine mammals (excluding bats) could be included. All could be the subject
of reports of having been directly observed, alive or dead. These records could be supplemented
by separate records of signs: these should only be signs that are fairly reliably identifiable. The
records of signs should be separated from those of direct observations, to allow both finer
analysis and inspection of the data for evidence that ability to detect signs is changing over time.
To reduce the chances of observers being put off by the scheme appearing unduly difficult, the
list of signs should be modest. We suggest that the following may be appropriate:

8/18/2019 BTO Research Report No.223 - Developing a Mammal Monitoring Programme for the UK
http://slidepdf.com/reader/full/bto-research-report-no223-developing-a-mammal-monitoring-programme-for-the 98/316
BTO Research Report No.223
July 1999 96
" Droppings and latrines: Hedgehog, Water Vole, Red Fox, American Mink, Badger, Otter.
" Nests: Harvest Mouse.
" Active setts: Badger.
" Feeding signs: Common Dormouse? (Should involve suspect nuts being submitted for
confirmation, at least until the observer's reliability has been established).
Note that this scheme could be valuable in documenting the potential spread of several species
whose distributions are currently restricted and for which any data at all may be difficult to get -
i.e. Wild Swine and Chinese Water Deer. It could also be useful in picking up the spread of Wild
Goats into new areas.
We have considered whether certain other species of very restricted distribution should be
excluded from this scheme, as the number of sites providing positive records will be too small to
be useful. The exclusions might be: Lesser White-toothed Shrew, Orkney Vole, Ship Rat, Fat
Dormouse, Feral Sheep, Red-necked Wallaby. We have concluded that excluding them would
frustrate those few observers who recorded them, so that it would be better to include them.
Note that we recommend that Felis catus be included in this scheme. Although there is no way
in which observers can distinguish between Feral Cats and those that are attached to people,
recording the occurrence of cats on reserves could be one of the few practicable ways of
monitoring the occurrence of this widespread species.
All the included species (and signs) should be printed on the recording forms. Observers should
be asked to write in any other mammals that they come across, both to allow them the pleasure of
doing so and to provide records of escaped aliens. (Though, for the benefit of pedants, Dog and
Man should perhaps be mentioned on the form as species not to be bothered with).
6.3 Participating organisations
It would be sensible to start with organisations that each currently manage large numbers of
reserves. This will ease the setting up of the scheme. We suggest that likely candidates are:
" The statutory country conservation agencies
" Plantlife
" RSPB
" The National Trust
" The Wildlife Trusts
"
The Woodland Trust
Between them, these bodies own thousands of reserves (and the number continues to increase).
Not all would be recruited into the scheme. We suggest that the following criteria be used to
prioritise candidate reserves initially:
" Is there a warden who is prepared to participate? Many reserves (perhaps an increasing
proportion) have professional wardens (though a single person may have several reserves
to care for); it may be that all the participating organisations would be prepared to include
any of their reserves that had professional wardens. Other reserves are cared for by
volunteer wardens, whose participation in the scheme would be a matter of persuasion,
rather than instruction (we assume).

8/18/2019 BTO Research Report No.223 - Developing a Mammal Monitoring Programme for the UK
http://slidepdf.com/reader/full/bto-research-report-no223-developing-a-mammal-monitoring-programme-for-the 99/316
BTO Research Report No.223
July 1999 97
" Is the warden (or a colleague) able to identify a fair proportion of the mammals included in
the scheme? So long as the observers were asked to indicate which species (and signs)
they did not feel sufficiently reliable with, it would not matter if they could not deal with
all the species on the list; but there would be no point in including a reserve if the observers
were only capable of identifying a handful of species - unless these were species of
especially high priority." How often is the reserve visited?
" Is the reserve in a region that is comparatively poorly covered for mammal monitoring?
" Does the reserve contain priority habitats?
" Is the reserve in a part of the country that is of special interest (a Focus Zone) for any
species?
Note that the last three criteria do not mean that sites that do not fulfil them should not be
accepted (since we need good geographical and habitat coverage) but that sites fulfilling these
criteria would be particularly acceptable.
6.4 Setting the scheme up on each reserve
When a reserve is taken into the scheme, it should be formally registered and various information
placed in a database. Relevant information would be:
" Name of reserve
" Organisation managing the reserve
" 10km square in which the reserve falls (if in more than one, perhaps the parts in the
different squares should be recorded separately?)
" Area
" Habitat composition - some broad habitats should be used, with simple classes of the areas
of each - such as 0, <5%, 5-33%, 33-67%, 67-95%, >95%
" Name and address of observer responsible for submitting the records for the reserve
Observers should be supplied with a form on which to record (and submit) any changes in the
above details, so that the database can have the new information added to it. Observers should
be reminded from time to time of the need to submit such changes.
When a reserve is registered in the scheme, it should be given a unique number, which can be
used in future to identify it on recording forms. Since the latter should be optically readable
forms (using marked boxes) this number will be the way in which the data on recording forms
are identified to locality, so it is important that observers get it right. We suggest that the numbershould have a part that identifies the organisation managing the reserve and that the whole
number should contain enough simple devices that most wrong numbers can be picked up
automatically when record sheets are being read.
6.5 The data recording forms
We suggest that the forms are optical-mark-read forms. These have proved very useful in
Garden BirdWatch, for the rapid input of voluminous but fairly simple data - though data that are
more complex than what is being contemplated here.

8/18/2019 BTO Research Report No.223 - Developing a Mammal Monitoring Programme for the UK
http://slidepdf.com/reader/full/bto-research-report-no223-developing-a-mammal-monitoring-programme-for-the 100/316
BTO Research Report No.223
July 1999 98
We suggest that each form should cover 13 weeks of the year (it is difficult to fit more onto an
A4 sheet), with a box for each week against each species (and each species-sign), to be marked if
the species (sign) is observed in that week. There should also be a set of boxes to be filled in for
each week, recording the amount of time spent on the reserve that week, in broad classes - say, 0,
1-4, 5-16, 17-64, >64 man-hours. This will provide a means for checking long-term drift in
recording effort and, indeed, of correcting for it.
There will need to be a careful description of what man-hours to include. It should cover all the
hours on the reserve when mammals might be seen, even if the person is doing some task not
directly concerned with recording - e.g. making fences. It should cover everyone who has been
asked specifically to look out for mammals, not just the warden (or nominated observer).
Perhaps there might be value in having a separate row of boxes for each species for casual
records - e.g. reports by members of the public; this would broaden the recorder base for the
species that are more difficult to observe; on the other hand, it would raise serious problems
about the reliability of the data.
It may be useful to ask observers to write in whether there has been any unusual level of effort
put into recording any species that week - for example, a periodic survey to estimate deer
numbers or an occasional trap-survey of small mammals.
6.6 Organisation of the scheme
Forms should be submitted quarterly. The data should be input quickly, routine analyses run,
and a report produced for the observers. The report should be sent out during the subsequent
quarter, together with the survey forms for the quarter after that. This will give the observers
prompt feedback and remind them to continue with the work. This is a routine that works well
with Garden BirdWatch and it fits in with the design of the recording forms (13 weeks).
Routine analyses should cover such things as seasonal patterns, long-term trends, and geographic
patterns, as well as unusual records (the latter are useful for lightening the tone of the reports).
The report should comprise four A4 sides and contain news about the scheme and
announcements, some of the results from the routine analyses, etc.
Most of this work should be undertaken by one organisation, preferably one that can integrate the
results with those of other schemes. Contact with the observers might, however, be better
undertaken by the organisations managing the reserves, to whom the wardens owe their primary
allegiance. So they might be responsible for sending out the newsletters and recording forms to
observers and for collecting up all the data emanating from their reserves. There is always adanger of delay in such a two-tiered approach to contact with the observers but if it helps
participation rates then that is a risk worth taking.
The participating organisations should perhaps receive summary data for their reserves quarterly
and should certainly be provided with an electronic copy of the data from their own reserves
annually.
6.7 Data analysis

8/18/2019 BTO Research Report No.223 - Developing a Mammal Monitoring Programme for the UK
http://slidepdf.com/reader/full/bto-research-report-no223-developing-a-mammal-monitoring-programme-for-the 101/316
BTO Research Report No.223
July 1999 99
The accuracy with which changes in populations would be indexed by this scheme could be
affected both by differences between reserves (such as size and habitat) and changes in recording
effort (number of weeks per year in which the reserve is visited and number of hours per week
spent on the reserve). However, if these are recorded as we suggest, statistical analyses based on
General Linear Models and General Additive Models can allow for them. Furthermore, theeffect of differences between reserves is reduced by retaining the same reserves in the sample
indefinitely.
6.8 Resource requirements
Were the scheme to be run centrally (apart from initial recruitment of participants), we estimate
the annual requirements to be as outlined in Part VII.2.4.
Were the scheme to be run in a more devolved way, with participating organisations taking on
more of the responsibility for communication with the reserve wardens, the central costs would
be diminished but the total costs may be rather higher.
Set-up costs would be 1.5 man-months post-doctoral scientist, for design and programming

8/18/2019 BTO Research Report No.223 - Developing a Mammal Monitoring Programme for the UK
http://slidepdf.com/reader/full/bto-research-report-no223-developing-a-mammal-monitoring-programme-for-the 102/316
BTO Research Report No.223
July 1999 100

8/18/2019 BTO Research Report No.223 - Developing a Mammal Monitoring Programme for the UK
http://slidepdf.com/reader/full/bto-research-report-no223-developing-a-mammal-monitoring-programme-for-the 103/316
BTO Research Report No.223
July 1999 101
7. GARDEN MAMMAL WATCH
7.1 Introduction
A scheme in which volunteers recorded the occurrence (or apparent absence not) of mammals intheir gardens would have the following benefits:
" It would cover significant parts of the populations of some species that would not be
covered so well by other schemes (e.g. Hedgehog, Grey Squirrel, Red Fox - 14% of the
British population of the latter live in urban areas (The Populations Review)).
" It would provide information on species that were difficult to cover by more formal surveys.
" Because large numbers of people might participate, it would provide coverage even in areas
of sparse human populations, which may not be covered by other schemes.
" It would introduce people to monitoring who might go on to more demanding schemes.
" An associated newsletter would be a good medium for seeking casual records (outside
peoples’ gardens) of species for which these would be valuable - e.g. Polecat, Pine Marten.
" It would draw more citizens into direct participation in science-based conservation.
The disadvantage of garden-based recording is that gardens are a peculiar habitat, of marginal
importance for most mammals. Urban and suburban gardens, in particular, are unlikely to reflect
closely the status and trends of mammal populations in the country in general; rural gardens maydo so, though some are so large that for smaller mammals they may form almost self-sufficient
islands of habitat distinct from their surroundings. Thus, except for species with significant
populations in gardens, such a scheme should only be used in conjunction with other schemes, to
provide a suite of information on species that may be difficult to monitor otherwise.
7.2 Previous garden mammal surveys
Look what the cat’s brought in - a one-off, five-month survey run during spring and summer
1997 by The Mammal Society. This produced capture records for 964 cats, comprising a wide
range of mammals (up to the size of Grey Squirrels and Rabbits), birds, amphibians and reptiles.
The Garden Mammal Survey - a one-off survey run during the autumn and winter 1998-99, by
The Mammal Society and The People’s Trust for Endangered Species. The data have not yet
been analysed but we understand that about 2,000 gardens were included and that these provided
records of about 40 different species (bats included). A book on garden mammals was made
available to participants at a modest price.
7.3 The BTO/CJ Garden BirdWatch (GBW)
The scheme we have in mind would be similar to GBW, instructions and recording forms for
which are provided as an Appendix 2. This has run since 1995 and currently has 11,000registered participants, of whom about half supply data. (The number of participants increased

8/18/2019 BTO Research Report No.223 - Developing a Mammal Monitoring Programme for the UK
http://slidepdf.com/reader/full/bto-research-report-no223-developing-a-mammal-monitoring-programme-for-the 104/316
BTO Research Report No.223
July 1999
102
by c.40% during 1998). About 75% of the participants remain in the scheme from one year to
the next.
Participants supply details of their gardens when they register. Thereafter, they record birds
weekly, submitting their records quarterly. These records comprise: semi-quantitative data on
10 species, presence/absence records for 31 species, and records of the provision of water andvarious foods. Species other than the 41 printed on the main survey form may be recorded on a
“Scarcer Species Form”. Records are requested for each of the 13 weeks in the quarter;
observers indicate in which weeks they were actually recording, so that weeks with active
recording but nothing seen (which are theoretically possible) can be distinguished from weeks
with no active recording.
The main survey form and the Site Registration Form are optically-read mark-sense cards, so can
be processed quickly. (The main value of the Scarce Species Form, from which it is more
laborious to extract data, is that is prevents participants being frustrated by being unable to
submit records of these species).
Forms are sent out quarterly, in advance, together with an 8-page A4 newsletter.
Participants pay an annual fee which, with sponsorship from CJ Wildbird Foods Ltd., covers the
cost of running the scheme - printing, postage, staff time and office overheads.
7.4 What Garden Mammal Watch could cover
Participants in Garden Mammal Watch are likely to vary considerably in their ability to identify
mammals: some may be capable of identifying only a few species from direct observations;
others may be able to identify almost all mammals they see and a range of signs. To maximize both participation rates and the value of the data, we suggest that a fairly long list of species is
listed on the recording form, with each participant asked to indicate those that she or he wishes to
cover (thus allowing observers to participate who do not feel able to identify all the species or
their signs).
Species to be included should be decided after the Garden Mammal Watch data have been
analysed. The following points are relevant to that decision.
" All obvious and easily identifiable species should be included, even if we do not really need
the data; otherwise, participants may be frustrated at not being able to record them.
" Animals brought in by cats should be included, even if they may have originated outside the
garden; this will not only avoid participants’ frustration at not being able to record such
animals but will greatly increase sample sizes of some species.
" Observers should be encouraged to record everything - even pests that have been killed or
removed.
" More difficult species may be included, provided observers are reassured that they can opt
out of recording them and provided that identification guidance is given.

8/18/2019 BTO Research Report No.223 - Developing a Mammal Monitoring Programme for the UK
http://slidepdf.com/reader/full/bto-research-report-no223-developing-a-mammal-monitoring-programme-for-the 105/316
BTO Research Report No.223
July 1999
103
" Species of restricted distribution should be included because all records of them outside
their current range will be useful.
" Signs commonly left in gardens and relatively easily identifiable should be included.
"
There should be opportunity to submit records of species additional to those listed.
" Observers should record the presence of non-resident cats and whether or not a cat is in
residence - since these will influence whether some mammals occur in the garden and
whether they are recorded if present. (Perhaps dogs should also be recorded).
" Houses should be included as part of the garden - to encourage records of House Mouse, Fat
Dormouse, etc.
We suggest that observers are asked to record the presence of each species in each week, with a
13-week (i.e. quarterly) cycle of form submission, which has proved successful in GBW. Aquarterly cycle allows the form to be of manageable size, reminds participants about the survey,
and provides important opportunity for feedback through the newsletter.
7.5 Should other taxa be included?
We suggest that, if a Garden Mammal Watch is planned, serious consideration be given to the
inclusion of reptiles and amphibians. Particularly in view of the serious declines of amphibians,
even data not precisely identified to species (e.g. frog, toad) may be valuable. The add-on costs
would be trivial.
7.6 Organisation of Garden Mammal Watch
There are two main options: as a stand-alone project perhaps run by The Mammal Society (or
similar voluntary body) or as a bolt-on to Garden BirdWatch (which is run by BTO, but would
need input from mammal experts if mammals were to be bolted on to it). We are hesitant to
mention the second, as this possibility has not been assessed either by BTO or by the GBW
sponsor; furthermore, it may appear to be a bid for BTO to reserve a high-profile element of
mammal monitoring itself. However, we estimate it to be a much cheaper option. Our current
estimates of approximate costs of (£000s per annum) of a GMW are as follows (they would need
to be refined if this scheme was thought worth discussing further).
Number of participants Stand-alone Part of GBW
1000 85 20
2000 87 21
5000 90 25
10000 95 30
Note that there would be some additional cost for the second option, in the form of a few weeks
per year for the input of time from mammal experts in interpreting the results and helping with
feedback; it would probably be inappropriate for BTO to take on those tasks.

8/18/2019 BTO Research Report No.223 - Developing a Mammal Monitoring Programme for the UK
http://slidepdf.com/reader/full/bto-research-report-no223-developing-a-mammal-monitoring-programme-for-the 106/316
BTO Research Report No.223
July 1999
104
In addition, under either option, 2-4 man-weeks should be allowed for setting up the scheme and
a further 4 man-weeks p.a. for any but the most routine analysis of the data (e.g. long-term
trends, regional analyses, mapping, feeding records through into NBN; routine analysis would be
confined to gross reporting rates in each quarter). These additional weeks would be at post-
doctoral graduate scientist level.
The circulation of identification materials should be considered; the cost of this is not included
above.
We do not believe that such a scheme could be funded through participants’ subscriptions, since
the mammals have fewer devotees than birds and generally provide less entertainment to garden-
watchers than do birds (because there are fewer species - five per garden on average in the
Garden Mammal Survey - and they are less commonly seen). We believe that most GBW
participants would not pay more if asked to do so simply in order to include mammals on this
project.

8/18/2019 BTO Research Report No.223 - Developing a Mammal Monitoring Programme for the UK
http://slidepdf.com/reader/full/bto-research-report-no223-developing-a-mammal-monitoring-programme-for-the 107/316
BTO Research Report No. 223July 1999
105
PART IV SCHEMES FOR INDIVIDUAL SPECIES
INTRODUCTION
In this part of the report, we review the options for monitoring each species of mammal found in
the UK in turn. These accounts should be read in conjunction with the accounts in MMR, because the latter present much important background information (based on wider consultation).
Within the constraints of readability, we have tried to avoid repeating material already presented
in MMR. We have treated species individually, except where common monitoring concerns,
approaches and/or interests make this illogical (for example, squirrels). For each species, we
note current status in the UK (including range, abundance and known population trend) and
review any recent and ongoing monitoring work on that species. We then suggest objectives for
the monitoring of each species, but we would stress that we supply these only as points for
discussion and to put our subsequent remarks in context: decisions on the aims of monitoring
(including the quantitative power required of survey schemes) should be made by consensus
between mammal specialists and government.
We review the techniques potentially available to monitor each species (with particular
consideration as to their suitability for use by volunteers) and then consider how these techniques
can be combined into effective monitoring schemes. Where possible, we suggest more than one
alternative scheme (or combination of schemes) and we review the proposals in MMR critically.
For many species, our suggestions include the use of the multi-species schemes described in
Part III, so the species accounts should be read in conjunction with the outlines of the relevant
schemes provided there. We end each species account with a set of recommendations as to
future priorities and practices for monitoring. Again, these should be taken as points for
discussion which are subject to revision after input from government and mammal specialists.

8/18/2019 BTO Research Report No.223 - Developing a Mammal Monitoring Programme for the UK
http://slidepdf.com/reader/full/bto-research-report-no223-developing-a-mammal-monitoring-programme-for-the 108/316
BTO Research Report No. 223July 1999
106

8/18/2019 BTO Research Report No.223 - Developing a Mammal Monitoring Programme for the UK
http://slidepdf.com/reader/full/bto-research-report-no223-developing-a-mammal-monitoring-programme-for-the 109/316
BTO Research Report No. 223July 1999
107
1. HEDGEHOG Er inaceus europaeus
Native and widespread (probably introduced to Ireland). May have declined in last 50 years.
1.1 RECENT AND ONGOING MONITORING WORK
None.
1.2 MONITORING OBJECTIVES
Hedgehogs, though their numbers are probably influenced by interactions with Badgers and
Foxes, are probably good indicators of the availability of ground invertebrates. They also
resonate with the public, so are a valuable means of drawing wildlife issues to the attention of the
public. For these reasons it is important to monitor them.
The objectives of monitoring should be to be able to detect population changes of 25% over 25
years, at the level of individual countries.
Intensive work may be needed on islands to which Hedgehogs have been (recently) introduced;
our recommendations cover monitoring at the national scale.
1.3 POTENTIAL MONITORING TECHNIQUES
Live-trapping - Live-trapping of Hedgehogs is laborious, as the traps are large and the capture
rate is low.
Game Bags - Game Bag data on Hedgehogs have been collected since 1961 by Game
Conservancy Trust. We do not consider, however, that these provide reliable index data for
Hedgehogs since this is a generalist species, subject to variation in effort of both control
measures and recording, and since the change in its legal status consequent on The Wildlife and
Countryside Act 1981 has led to fewer estates recording Hedgehog kills (Tapper 1992) - see Part
III.A.2.
Direct sightings - Direct observations require many hours to be spent in the field per Hedgehog
observed, though the frequency of observation is greater by night if a spotlight is used. Morris et
al. (unpublished) worked in a high density population on Alderney and in habitats in which
Hedgehogs were easily spotlighted - an airfield and a golf course. Even so, only two or three
animals were detected per km walked. Dr Pat Morris (pers. comm.) estimates that 4-5 hours persite would be required to detect enough Hedgehogs for monitoring purposes.
Field signs - Hedgehog droppings are easily recognised, though are only conspicuous in short
vegetation.
Road-deaths - Dead Hedgehogs are commonly seen on roads and are easily recognisable from a
moving car. There have been various surveys of Hedgehog road-deaths and The Mammal
Society is about to undertake analyses of extensive volunteer-based surveys conducted by Dr Pat
Morris during 1991-1994.

8/18/2019 BTO Research Report No.223 - Developing a Mammal Monitoring Programme for the UK
http://slidepdf.com/reader/full/bto-research-report-no223-developing-a-mammal-monitoring-programme-for-the 110/316
BTO Research Report No. 223July 1999
108
1.4 POTENTIAL MONITORING SCHEMES
Spotlighting transects - MMR propose surveying at least 2000 sites on three consecutive nights
every five years, each site covered by a 1km spotlighting transect. It would not be possible to
recruit volunteers in the required numbers to conduct a survey, given the demanding nature of the
work and the low success rate: given the results of Morris et al . (above), 0.5 animals/km is probably a generous guess of the likely mean sighting rate which suggests that even in three
visits a high proportion of observers would see none at all, making it very unrewarding. To
cover the sites professionally would take 400x3=1200 nights’ work, even if the sites were
sufficiently clumped for five to be done each night, which equates to at least five man-years - or
one man-year/year averaged over the cycle of five years. We do not believe this to be cost-
effective, nor that modifications to this basic design could produce a substantially cheaper option.
Note that MMR suggest applying capture-mark-resighting techniques to the spotlighting data.
The numbers seen per sampling occasion would be too low to give reliable results using this
technique, judging from the results of Morris et al.(unpublished) in ideal conditions on Alderney.
Breeding Bird Survey - Hedgehogs appear to be encountered sufficiently often on BBS squares
for this scheme to contribute usefully to their monitoring (see Part III.A.1).
Sign Transect Survey - These could provide useful information on Hedgehogs (see Part III.B.4).
Mammals on Roads - MMR recommend 2000 transects of 1km length, driven at least three
times at weekly intervals, every five years. We believe Mammals on Roads transects would
provide useful data, though would adopt a different protocol in detail (see Part III.B.5).
Mammals on Nature Reserves - We believe that Hedgehogs and their signs are commonly
enough observed, and readily enough identified, for records on reserves to provide useful
monitoring information (see Part III.B.6).
Garden Mammal Watch - Hedgehogs were the second most commonly recorded species in The
Mammal Society’s Garden Mammal Survey, so Garden Mammal Watch could provide useful
data (see Part III.B.7).
1.5 RECOMMENDATIONS
A combination of two more-or-less existing surveys (BBS and Garden Mammal Watch) and
two others that could be mounted with relatively little further piloting (Mammals on Roadand Mammals on Reserves) should provide sufficient information to detect major changes
in Hedgehog numbers, though further quantitative analyses of the likely power of these
schemes should be undertaken.

8/18/2019 BTO Research Report No.223 - Developing a Mammal Monitoring Programme for the UK
http://slidepdf.com/reader/full/bto-research-report-no223-developing-a-mammal-monitoring-programme-for-the 111/316
BTO Research Report No. 223July 1999
109
2. MOLE Talpa europaea
Native and widespread in Great Britain; absent from Ireland and most islands.
2.1 RECENT AND ONGOING MONITORING WORK
None. Moles are so difficult to count that there seem to have been no serious demographic
studies.
2.2 MONITORING OBJECTIVES
We suggest that the Mole is probably a good indicator of soil invertebrate populations and that it
should therefore be monitored throughout its British range. A decline in abundance (or in an
index of abundance) of 25% over 25 years would be regarded as serious, so the monitoring
programme should aim to detect this.
2.3 POTENTIAL MONITORING TECHNIQUES
Direct sightings - Moles are rarely seen on the surface, so this method is not useful.
Road-deaths - Haeck (1969) found that large numbers of young Moles were killed on roads in
The Netherlands in June and July, as they dispersed from their natal territories. We believe that
this species is too inconspicuous, however, for sightings of dead mammals to be included in the
Mammals on Roads scheme (see Part III.B.5)
Owl pellets - Southern (1954) found that moles comprised 15% of the vertebrates taken by
Tawny Owls Strix aluco in the midsummer dispersal period. However, they were much scarcer
at other times of year. Barn Owls Tyto alba take Moles much less often, so such records are of
little or no value for monitoring.
Trapping - Friesian live-traps have a fair success rate but are laborious to transport and set. In
any case, both they and the various traps that kill Moles (and which are less laborious) need to be
set in tunnels - which themselves provide an indication of the presence of Moles.
Field signs (fresh tunnelling activity) - New Mole hills are seen from midwinter onwards, as
the animals repair damaged tunnels; since damage depends on soil structure and weather, so does
the number of Mole hills. Surface tunnels are often conspicuous but are disproportionately dug
in newly cultivated fields, very light soils and very shallow soils. Tunnelling activity is not
always conspicuous in woodland, which is important Mole habitat. In addition to these habitatdifferences, tunnelling activity varies seasonally, not only in relation to winter weather damage
but particularly in relation to the reproductive cycle: Moles burrow very actively in spring in the
search for receptive females. Thus the observation of tunnelling activity is not a good indicator
of Mole density. However, particularly if observations are made in the same places year after
year and if habitat details are recorded, it can be used as a long-term monitoring index. The
major caveat is its weather dependence. Given that there is no other easy way of monitoring
Moles, we suggest that schemes based on observations of fresh tunnels should be used for
monitoring; there is sufficient variation in weather from year to year for the potential impact of
weather on the index to be examined as data accumulate, which will help in the interpretation of
the index against the background of long-term climate change.

8/18/2019 BTO Research Report No.223 - Developing a Mammal Monitoring Programme for the UK
http://slidepdf.com/reader/full/bto-research-report-no223-developing-a-mammal-monitoring-programme-for-the 112/316
BTO Research Report No. 223July 1999
110
2.4 POTENTIAL MONITORING SCHEMES
Breeding Bird Survey, Winter Transects, Sign Transects, Mammals on Nature Reserves,
Garden Mammal Watch - Observations of fresh Mole tunnels in these schemes are likely to
provide a good long-term index of Mole numbers. For their own satisfaction, observers should
also be allowed to include records of Moles seen dead or alive but these are unlikely to benumerous enough for monitoring purposes.
Mammals on Roads - We recommend against observers being asked to record Moles seen dead
on the road but suggest that observations of fresh tunnelling activity beside the road might be
trialed.
2.5 RECOMMENDATIONS
1) Moles should be monitored through a series of multi-species schemes, incorporating
records not only of Moles directly observed (dead or alive) but also of fresh tunnelling. The
schemes are:
Breeding Bird Survey;
Winter Transects;
Sign Transects;
Mammals on Nature Reserves;
Garden Mammal Watch.
2) Observations of fresh tunnelling within sight of roads could be included in Mammals on
Roads on a trial basis.

8/18/2019 BTO Research Report No.223 - Developing a Mammal Monitoring Programme for the UK
http://slidepdf.com/reader/full/bto-research-report-no223-developing-a-mammal-monitoring-programme-for-the 113/316
BTO Research Report No. 223July 1999
111
3. LESSER WHITE-TOOTHED SHREW Crocidura suaveolens
Introduced. Occurs on the Isles of Scilly and is believed to be widespread within most habitats
offering adequate cover. There are few data available for this species, although it is believed that
the population is currently stable.
3.1 RECENT AND ONGOING MONITORING
None.
3.2 MONITORING OBJECTIVES
Although populations of this species are thought to be stable, there is no empirical data either to
support or to refute this claim. In view of this, periodic monitoring should be instigated initially
with a view to producing baseline data against which future changes can be examined.
3.3 POTENTIAL MONITORING TECHNIQUES
Live-trapping - Lesser White-toothed Shrews can be caught using Longworth live-traps set in
suitable habitat, ensuring that the treadle weight is set accordingly for an animal of its size
(Churchfield 1990). A density of 10/hectare was reported in The Populations Review for
populations in natural vegetation. This figure, coupled with home range sizes of 50-80m2,
suggests that a grid of traps covering 1ha should be used, with a 10m trap spacing. However, the
suitability of this approach needs to be evaluated in the field across the range of habitats
occupied by this species. The use of shoreline habitats further complicates the development of a
standard method for trapping this species.
Field signs (faeces) - This species is the only shrew to occur on the Isles of Scilly, thus making it
possible to use dropping boards or bait stations to collect faeces (see similar approach for Water
Shrew - Abyes & Sargent 1997). This will provide information on the distribution of the species,
together with a basic index of abundance. The suitability of this method would need to be
evaluated during pilot fieldwork.
3.4 POTENTIAL MONITORING SCHEMES
Both the use of live-trapping and faeces counts at bait stations may potentially be used for
monitoring this species. However, both need to be evaluated in the field and the two methods
may be calibrated against each other during the initial stages of monitoring, with one beingdropped if it were found not to be cost-effective. Populations of this species may fluctuate over
the short-term and annual monitoring should be implemented for the first 10 years to examine
short-term trends. If these prove to be absent then monitoring could take place periodically
rather than annually, although this needs to be evaluated further.
The biggest difficulty with either of the two approaches is how to ensure that there is sufficient
coverage of the diverse range of habitats the species uses. A suitable sampling design to cover
all habitats needs to be discussed, possibly after some pilot work examining densities of the
species in different habitats.

8/18/2019 BTO Research Report No.223 - Developing a Mammal Monitoring Programme for the UK
http://slidepdf.com/reader/full/bto-research-report-no223-developing-a-mammal-monitoring-programme-for-the 114/316
BTO Research Report No. 223July 1999
112
3.5 DEVELOPMENT AND VALIDATION STUDIES A research study needs to be undertaken over a couple of field seasons in order to determine the
habitat associations of this species. This information can then be used to establish a suitable
sampling protocol for the use of either live-traps or faecal signs.
3.6 RECOMMENDATIONS
Pilot fieldwork needs to be carried out to establish the best way in which to monitor this
species (live-trapping or faecal signs) and how to sample the diverse range of habitats used.
Once this has been determined, monitoring should take place on an annual basis for the
first 10 years and then periodically if short-term fluctuations prove to be insignificant.

8/18/2019 BTO Research Report No.223 - Developing a Mammal Monitoring Programme for the UK
http://slidepdf.com/reader/full/bto-research-report-no223-developing-a-mammal-monitoring-programme-for-the 115/316
BTO Research Report No. 223July 1999
113
4. RABBIT Oryctolagus cuniculus
Introduced. Widespread and abundant, with numbers highest in the east and south-east of
England. Can cause damage to farming and forestry interests, although Rabbit grazing is
beneficial in maintaining chalk grassland habitats.
4.1 RECENT AND ONGOING MONITORING
A full review of Rabbit surveys up to the early 1980s is provided by Trout et al . (1986).
Forestry Commission Surveys - Four surveys of Rabbits (and other wildlife) on Forestry
Commission land have been carried out by the Wildlife Section of the Forestry Commission
since 1968, at approximately five-year intervals. The data are sent in by foresters in response to
a questionnaire and the accuracy of responses is '..inconsistent since the knowledge and interest
of the respondents may vary.' (Tee et al. 1985). However, since Rabbits and Rabbit damage are
relatively straightforward to identify, the results for Rabbit are likely to be reliable.
Environmental Change Network (ECN) - MMR report that the ECN have selected the Rabbit
as an indicator species to be monitored by winter pellet counts in selected sites, although this
scheme has encountered statistical difficulties and only covers less than 20 sites.
Game Conservancy National Game Bag Census - The National Game Bag Census has
recorded the numbers of Rabbits killed by keepers on many shooting estates since 1961. The
general disadvantages of Game Bags are addressed in Part III.A.2. Additionally, the diverse
ways in which Rabbits are controlled, together with changes over time in the favoured methods
of control, make the Rabbit Game Bag data more difficult to interpret.
British Association for Shooting and Conservation (BASC) - Since 1980, a random sample of
BASC members have recorded the number of Rabbits shot during the year. A basic index of
abundance (number shot/km2) can be derived, although this contains a component of hunting
effort, which would need to be separated before the data could be used to determine Rabbit
abundance itself.
Ministry of Agriculture, Fisheries and Food (MAFF) and Scottish Office Agriculture and
Fisheries Department (SOAFD) Surveys - Since 1969, MAFF has operated three consecutive
types of Rabbit survey on farms. This work has been restricted to England and Wales and the
different survey approaches are not directly comparable. Similar work has been carried out in
Scotland (Kolb 1994) with surveys by SOAFD, formally DAFS, in 1969, 1970, 1973, 1974 and1991. See Trout et al. (1986) [Table 1] for detail of the methods employed. Of the MAFF
surveys, all three provide data of value for monitoring Rabbit distribution, but only the two most
recent surveys allow calculation of Rabbit abundance. With the Scottish survey work, there was
a problem in that there was a subjective element involved in judging the severity of infestation.
4.2 MONITORING OBJECTIVES
Rabbits should be monitored because of their economic importance (as pests of agriculture and
forestry), their influence on vegetation structure and their importance to other bird and mammal
species (Sumption & Flowerdew 1985). The widespread distribution of this species negates the
need for distribution based monitoring, but monitoring of abundance would appear to be an
important objective.
8/18/2019 BTO Research Report No.223 - Developing a Mammal Monitoring Programme for the UK
http://slidepdf.com/reader/full/bto-research-report-no223-developing-a-mammal-monitoring-programme-for-the 116/316
BTO Research Report No. 223July 1999
114
4.3 POTENTIAL MONITORING METHODS
Game Bags - Bags of Rabbits taken from estate records are prone to variation stemming from
differences in the control measures employed. For this reason they are more difficult to interpret
and less useful in a monitoring context. Rabbits may be taken by a number of different means,
sometimes as part of a day's shoot, sometimes through ferreting, others through spotlightshooting or snaring. Some control measures may not be reported as part of the Game Bag
records. However, a long term average trend has been produced from the Game Bag data by
Tapper (1992) suggesting a recovery in the population following the increase in genetic
resistance to myxomatosis. It has been established that the different methods of taking Rabbits
have resulted in samples of different age and sex structure (Smith et al. 1995). These biases may
have had an influence on the monitoring value of Game Bag data, as different methods for taking
Rabbits have changed in popularity.
The British Association for Shooting and Conservation have information gathered between
1980-1983 on the number of Rabbits shot by a sample of its members. There is no information
on whether this type of data will be gathered on a more regular basis using a more structuredapproach.
Twilight counts - Counts taking place at dawn and dusk reveal about 15-20% of the population
during winter and 40-60% of the population during the summer. Trout & Tittensor (1989) note
that at least three counts are required to attain sufficient accuracy.
Spotlighting - Like hares, it is possible to detect Rabbits at night by using a spotlight to produce
eyeshine. Barnes & Tapper (1985) developed a method to count Brown Hares using this
approach and this could be re-evaluated to allow the production of population estimates for
Rabbits. The method was found to be most appropriate (in the case of Brown Hares) when
applied to the assessment of large differences between Brown Hare populations in extensive
studies.
Field signs (warren entrances) - The number of active warren entrances has been demonstrated
by some authors to be related to the number of Rabbits using the warren (Parer & Wood 1986).
However, this relationship '.. is likely to be highly variable, and in high-density populations the
relationship may be non-linear..' (Parer & Wood 1986). In some habitats entrances will be more
difficult to find than others, while in a few instances Rabbits may not use burrows at all.
Collectively this suggests that the use of warren entrance counts may be of little value for
long-term monitoring, even though it has the advantage that it is quick and relatively easy to
record such features.
Field signs (pellet counts) - Counts of faecal pellets may be used to determine the presence of
Rabbits at a site, although there may be some confusion with those produced by Brown or
Mountain Hares. The density of Rabbits may be calculated from counting pellets within a
specified area. This approach has been widely used for deer (Bennett et al. 1940; Bailey &
Putman 1981) and potential problems with the method have been reviewed (see Neff 1968). The
technique has been used for Rabbits (Taylor & Williams 1956; Trout & Tittensor 1982; MAFF
1982; Wood 1988).
8/18/2019 BTO Research Report No.223 - Developing a Mammal Monitoring Programme for the UK
http://slidepdf.com/reader/full/bto-research-report-no223-developing-a-mammal-monitoring-programme-for-the 117/316
BTO Research Report No. 223July 1999
115
While consistent relationships between Rabbit density and pellet density have been found within
some sites (overseas), or across sites with similar characteristics, Angerbjorn (1983) points out
[from work on hares] that separate factors are necessary to convert pellet density to hare density
for habitats which differ substantially. While it may not be possible to compare Rabbit densities
between habitats, it should be possible to monitor trends in abundance within sites, so long as the
same monitoring sites are used year-on-year. Variability in pellet production and pellet decayrates may result from a number of factors. Production rates may be influenced by changes in the
quality of vegetation (Arnold and Reynolds 1943), which in turn may be related to season
(Lockley 1962) or climatic differences between years. Consideration should be given to these
effects if a monitoring protocol based on pellet counts is to be implemented. The successes of
the MAFF scheme and ongoing work by Roger Trout suggest that Rabbit abundance may be
monitored through the use of pellet counts along transects.
4.4 POTENTIAL MONITORING SCHEMES
Garden Mammal Watch - Rabbit may be recorded as part of the proposed Garden Mammal
Watch scheme (see Part III.B.7), although it is not clear how often Rabbits will be recorded ingardens and to what extent those that are recorded are representative of the population in the
wider countryside.
Mammals on Roads - Rabbits are likely to feature quite prominently in those species seen dead
on the roads. However, encounters with dead Rabbits may be too frequent to be of value to the
index approach outlined in Part III.B.5. To overcome the problem of a lack of stability in the
Rabbit population during the summer months, road-transects would need to be covered in the
winter, something that may be impractical.
Breeding Bird Survey - Rabbits were reported from about 70% of those transects for which
BBS mammal data were received, suggesting that the BBS approach may be suitable for this
species. However, the BBS count data need evaluation and the BBS presence/absence data needs
evaluation against other schemes.
Sign Transects - (see Part III.B.4) Rabbits can be recorded through a field sign survey
providing a simple index of abundance without the need to determine a relationship between
pellet density and Rabbit density. This approach should be carried out during the winter months
when the Rabbit population is more stable. It is not thought that Game Bags, BBS transects or
other datasets could be used successfully for the monitoring purposes outlined.
4.5 DEVELOPMENT AND VALIDATION OF STUDIES
Work should be carried out to determine the relationships between Rabbit density and pellet
density for a range of regions and habitats. This can then be used to calibrate data from the sign
transects.

8/18/2019 BTO Research Report No.223 - Developing a Mammal Monitoring Programme for the UK
http://slidepdf.com/reader/full/bto-research-report-no223-developing-a-mammal-monitoring-programme-for-the 118/316
BTO Research Report No. 223July 1999
116
4.6 RECOMMENDATIONS
1) The abundance of Rabbits at a series of fieldsites should be determined annually
through Sign Transects (Part III.B.4).
2) Ancillary data should be gathered through Garden Mammal Watch (Part III.B.7) andMammals on Roads (Part III.B.5) schemes. The value of such data should be evaluated
against that derived from sign transects. Data from BBS can also be fed in to the
monitoring programme.

8/18/2019 BTO Research Report No.223 - Developing a Mammal Monitoring Programme for the UK
http://slidepdf.com/reader/full/bto-research-report-no223-developing-a-mammal-monitoring-programme-for-the 119/316
BTO Research Report No. 223July 1999
117
5. HARES
MOUNTAIN HARE Lepus timidus : native to Britain and Ireland, southern British
populations introduced; in Britain, restricted to Scottish uplands, the Isle of Man and the
Peak District but locally common, widespread in Ireland and found in many habitats;
stable but vulnerable, especially with respect to global warming.
BROWN HARE Lepus europaeus : introduced to Britain in Roman times or earlier,
introduced to Ireland in the 19th century; common and widespread in Britain but
abundance variable, scarce and localised in Ireland; has declined considerably but now
perhaps stable.
5.1 RECENT AND ONGOING MONITORING WORK
National Brown Hare Survey - A winter transect survey, using distance sampling, of 738 1km
squares forming a random sample stratified by ITE Landscape Region, conducted in 1991-1993
(Hutchings & Harris 1996). Consideration of more than one winter minimized the impact ofinter-annual fluctuations in numbers on population estimations. A statistically sound and
unbiased survey giving a baseline national population estimate of 817,520±137,521 Brown
Hares, to which future survey results can be compared. The survey has been repeated in 1997-
1999 and preliminary analysis suggests that Brown Hare numbers have fallen slightly in arable
and pastoral habitats, despite the presence of set-aside land which was expected to benefit the
species (S. Harris, pers. comm.).
National Game Bag Census - Long-term data (1961 onwards) on Brown and Mountain Hare
shooting bags taken from keepered estates in Britain.
Game Conservancy Trust Spring Census - Twilight counts of Brown Hare numbers at 34
different sites in Britain since 1989.
British Field Sports Society - Counts of sightings by beagle packs and harriers since 1983-1984.
The Mammal Society - A national questionnaire survey for Brown Hares aimed at past trends
and current status. Analysis is incomplete as yet, but county-specific trends tend to have shown
increases between the 1960s and 1970s and declines between the 1980s and 1990s.
Sorby Natural History Society - An annual, set winter walk of c. 20km: effectively an annual
transect survey for Mountain Hares in one part of the Peak District (east of the Pennines) (D.W.Yalden, pers. comm.). Typically, 60-100 Mountain Hares are recorded.
Derbyshire Wildlife Trust - Another annual winter walk on which Mountain Hares are counted,
this one in the Western Pennines and c. 10km long. Typically, 30-50 Mountain Hares are
recorded (D.W. Yalden, pers. comm.).
5.2 MONITORING OBJECTIVES
As with other quarry species, it may be important to monitor hares both to determine their
conservation status and to indicate whether current hunting pressures are sustainable. Under the
8/18/2019 BTO Research Report No.223 - Developing a Mammal Monitoring Programme for the UK
http://slidepdf.com/reader/full/bto-research-report-no223-developing-a-mammal-monitoring-programme-for-the 120/316
BTO Research Report No. 223July 1999
118
JNCC Brown Hare Species Action Plan, two points for Future research and monitoring are
relevant to objectives of monitoring for the species:
5.5.1 Promote further research to assess the effects of different agricultural practices (e.g. crops
planted, cutting dates and cutting methods) on Brown Hare populations.
5.5.3 Repeat the National Brown Hare Survey at regular intervals.
The second point clearly represents one complete option for the monitoring of Brown Hares in
the long term (see below). While not necessary for monitoring changes in numbers, detailed
habitat recording during survey work could allow studies to be conducted which contribute to the
first point. Hare numbers are known to be very variable, so annual monitoring is needed for the
two species: surveys at long intervals could give false impressions of long-term trends.
Although Mountain Hares are native and both rarer and more vulnerable than Brown Hares, no
Species Action Plan has been prepared for the species. It would seem logical that the monitoring
of Mountain Hare populations should be given a higher priority than that of Brown Hare populations.
Special consideration needs to be given to Mountain Hares in Northern Ireland, where they occur
in lowland areas and may interact with Brown Hares: data collection and/or interpretation would
therefore have to be different.
By analogy with current monitoring practices for birds, the detection of trends leading to
population changes of 25% over 25 years could be taken as the target for hare monitoring.
5.3 POTENTIAL MONITORING TECHNIQUES
Line transect counts - Transect methods allow populations to be sampled quickly and efficiently
using standardised methods. Recording in distance bands allows density to be estimated.
Habitat recording along transects can also be standardised. For hares, counts would best be made
between October and January when vegetation is low and detection rates are high (although the
animals are still visible at other times) and before most hare shooting (which will increase the
variance of counts) occurs (Harris, in press). Timing is less critical if simple counts are used
instead of distance sampling. Late spring/early summer counts (as in the BBS) are likely to
overestimate numbers of breeding adults because the year’s juveniles can have been born as early
as January and be difficult to distinguish from adults. Such counts could then be heavily affected
by variations in productivity from year to year, obscuring variations in adult abundance.Daylight counting probably underestimates true densities because hares are less active than at
twilight or after dark.
Standard winter walks - Effectively surveyor-designated transect routes, annual or twice-annual
winter walks of (say) 2-10km with standardised mammal and habitat recording methods could be
an efficient way of managing volunteer surveyor input. Data collection would best be simple
counts, rather than distance sampling. Such a method is used by the Sorby Natural History
Society and Derbyshire Wildlife Trust to monitor Mountain Hares and it may be particularly
suitable for this species and upland habitats. A disadvantage is the lack of randomisation of
8/18/2019 BTO Research Report No.223 - Developing a Mammal Monitoring Programme for the UK
http://slidepdf.com/reader/full/bto-research-report-no223-developing-a-mammal-monitoring-programme-for-the 121/316
BTO Research Report No. 223July 1999
119
transect routes with respect to habitat, but this has no necessary serious effect on the method’s
potential for detecting population changes.
Direct counts (total or sample, daylight, twilight or spotlight) - Direct counts aim to account
for all individuals within an area or a sample of an area. Considerations for the timing of counts
are the same as for line transects. While direct counts measure true density if they are accurate,they also require more intensive coverage of an area than do transects, so any gains may be
outweighed by the extra time taken. Spotlight counts are very specialised, difficult to standardise
and best analysed only on a site-specific basis (S. Harris, pers. comm.).
Drive counts and dragline counts - Total populations can also be counted by driving with
beaters or dogs or by using draglines. However, as with direct counting, considerable effort is
required: in these cases, teams of individuals for each survey plot.
Capture-Mark-Recapture - Hares can be caught in nets and tagged, allowing population sizes
to be estimated by CMR. However, netting is difficult, costly and time-consuming.
Hunting and Game Bag records - Long time series of historical game bag and hunting records
exist and these data are likely to continue to be collected. These data can therefore at least
provide a valuable historical context for future survey data. However, hunting and bag record
data are subject to important biases which severely limit their potential as a front line monitoring
method. First, they are derived mostly from estates and areas that are managed for hares,
(supporting (often artificially) high hare densities), and so are unlikely to be representative of the
wider countryside and of any areas where densities are low or falling. Second, they will depend
critically on the hunting effort (which includes method (driven shooting versus culling with
rifles) and gun and shooter efficiency, as well as man-days) and, which is rarely recorded. Third,
numbers of Brown Hares are regularly trapped in high density areas and moved to restock other
areas where high densities are required by coursing interests, thus weakening any relationships
there might have been between game bags and the environment. Fourth, no counts are returned
by estates where shooting does not occur in a given year because of low population levels, so
population indices based on national game bags will always be biased upwards. Tapper &
Parsons (1984) considered that estates will generally manage annual bags to be a fixed
proportion of the Brown Hare population (around 40%), but this has been questioned (Hutchings
& Harris 1996) and is also unlikely to be true for the less managed Mountain Hare. The issues of
representativeness will apply equally to other count schemes run by hunting interests.
Counts by beaglers - Numbers of hares seen by beagling packs are collated by the Game
Conservancy. As well as problems with representativeness as discussed above, beaglers chooseareas for hunting, and therefore sampling, to have an optimum density which is neither too low
nor so high that dogs are confused (S. Harris, pers. comm.).
Field signs - Field signs are difficult to distinguish between species and can also be confused
with those of Rabbits. Such indirect methods will inevitably be less accurate than visual count
methods for open habitat species as visible as hares, so are not preferable.
Questionnaire surveys - Simple questionnaires have the advantage that they can reach much
larger samples of people, but data quality will be variable and subjectivity is a problem. Again,
this is not a priority method for species like hares which can easily be censused in other ways.
8/18/2019 BTO Research Report No.223 - Developing a Mammal Monitoring Programme for the UK
http://slidepdf.com/reader/full/bto-research-report-no223-developing-a-mammal-monitoring-programme-for-the 122/316
BTO Research Report No. 223July 1999
120
5.4 POTENTIAL MONITORING SCHEMES
All of the following schemes would provide information on changes in abundance and in range.
Repeats of the National Brown Hare Survey - This is the approach recommended by the
Species Action Plan for Brown Hare. Repetition need not be at fixed intervals, but could occur asa response to external stimuli whenever it were considered necessary. The methods used are
strong, leading to the collection of high quality density and habitat information. However, the
scale and intensity of the National Brown Hare Survey is such that it is unlikely to be
economically feasible for it to be repeated annually (and it was never designed for such a
purpose, running over several winters).
MMR recommended approach: Hare Survey transect methods applied within the
MaMoNet grid - This approach describes a scheme which is more than three times the size of
the National Brown Hare Survey (2,700 sites). The survey would therefore be more expensive
(at least if conducted in isolation) and still more difficult to repeat annually than the Hare Survey.
Such a sample size is also much larger than would be required to obtain enough count data forthe effective monitoring of Brown Hares, so would not be cost-effective (S. Harris, pers. comm.).
Breeding Bird Survey - The BBS transect approach is described in detail in Part III.A.1. It has
several disadvantages specific to hare monitoring, primarily because of the timing of the survey:
counts in spring and early summer will be subject to potentially large fluctuations as a result of
both variable annual productivity and changes in shooting pressure. Despite these problems, the
BBS may provide useful and reliable information on changes in (especially) Brown Hare
numbers, as a result of its wide geographical coverage and large sample size, and the ease with
which the animals can be seen by BBS surveyors (see Part III.A.1). The extent and seriousness
of any problems with the BBS method would need to be investigated before the survey were
adopted as a central contributor to UK hare monitoring. Calibration against a full or trial Winter
Transect Survey (Part III.B.1) ought to supply the necessary information.
Winter Transect Survey incorporating upland standard walks - Mid- to late winter is likely
to be the best time of year to survey most mammals using visual methods, so a multi-species,
standardised winter transect survey could be a widely applicable and useful method (see
Part III.B.1). Hares would be key “flagship” species for such a survey scheme and would
perhaps be the group for which we would expect the highest quality data to be collected.
Carefully chosen squares offering a partial repeat of the National Brown Hare Survey would
allow the linking of future data to an historical context. The optimal timing for hare monitoring
might be different to that for other species and compromise may be required. Upland areas present special problems because of weather and access, so the option of surveyor-designated
standard walks would be a useful one in such areas. The organisation of such a scheme would
most efficiently be done as an offshoot of the more formal Winter Transect Survey.

8/18/2019 BTO Research Report No.223 - Developing a Mammal Monitoring Programme for the UK
http://slidepdf.com/reader/full/bto-research-report-no223-developing-a-mammal-monitoring-programme-for-the 123/316
BTO Research Report No. 223July 1999
121
5.5 RECOMMENDATIONS
1) We suggest that a combination of BBS summer transect data and Winter Transect
Survey data should form the core national monitoring schemes for Brown Hare. BBS
methods are not ideal for mammals (see Section III.A.1) but the sample size of survey sites
is large (over 2000) and running a Winter Transect Survey in parallel should identify anymajor biases and perhaps supply annual correction factors. At least, pilot winter transect
data from the same squares as sampled by BBS will be required to calibrate BBS data. The
design of a Winter Transect Survey is dealt with in detail elsewhere (Section III.B.1), but
the options include a standard walk approach and more standardised transects.
2) Multi-species transect surveys may be sufficient for the monitoring of Mountain Hare
populations, but their geographical distributions in Britain are likely to mean that sample
sizes will be small as a result of local volunteer densities. The importance of Mountain
Hare as a vulnerable, native species means that effective monitoring could be a priority.
We therefore suggest that the standard winter walk approach be developed to sample areas
representative of the whole of the species’ range, building on the Sorby Natural HistorySociety and Derbyshire Wildlife Trust walks.
3) To provide historical context, attempts should also be made to calibrate Game Bag data
against BBS and Winter Transect Survey data. A key issue is the relationship between data
from shooting estates and from the wider countryside, which should be investigated.
However, it is important that the possibility that Game Bags will provide no useful
information at all is acknowledged prior to any attempts at calibration.

8/18/2019 BTO Research Report No.223 - Developing a Mammal Monitoring Programme for the UK
http://slidepdf.com/reader/full/bto-research-report-no223-developing-a-mammal-monitoring-programme-for-the 124/316
BTO Research Report No. 223July 1999
122

8/18/2019 BTO Research Report No.223 - Developing a Mammal Monitoring Programme for the UK
http://slidepdf.com/reader/full/bto-research-report-no223-developing-a-mammal-monitoring-programme-for-the 125/316
BTO Research Report No. 223July 1999
123
6. SQUIRRELS
RED SQUIRRELSciurus vulgari s : native to Britain but probably introduced to Ireland; locally
common in Scotland, scarce and localised (some populations re-introduced) in England and
Wales but widespread in Ireland; declining.
GREY SQUIRREL S. carol inensis : introduced; common throughout most of England andWales and central Scotland, more restricted than Red in Ireland; increasing and spreading.
6.1 RECENT AND ONGOING MONITORING WORK
NPI Red Alert North West - A developing survey of Red Squirrels in north-west England.
Sightings data have been solicited from the public, volunteers and foresters since 1995 and have
been useful in documenting the spread of Greys. Visual transect methods using volunteers are in
development, working from three repeat surveys in each of spring and autumn. Basic volunteer
training is included to allow the use of distance-sampling methods and to promote consistency.
Hair tube methods are also in development for areas where visual transects are less useful (small
and dense woodlands), but will require more professional input than the transect approach. Atransect-based hair tube survey of squirrel distribution in Cumbria is currently being written up.
Biological Recording in Scotland Campaign (BRISC): Scottish Red and Grey Squirrel
Survey - A current survey of Scottish squirrels which began in 1994. BRISC collect records
opportunistically or from sightings-based questionnaires. Sightings data are collected centrally
and stored in a database administered by SNH. BRISC have also organised specific surveys in
known Red Squirrel areas, visiting different sites on different occasions. Following
recommendations from SNH, the surveys consist of parallel transects (100m apart) walked by
teams of volunteers looking for Red and Grey Squirrels themselves (not field signs) (A-.M.
Smout, pers. comm.). The lack of repeat visits under the current survey design clearly limits this
survey to the generation of “snapshots” at present.
Forestry Commission - Records of presence and absence at the 10km square scale on Forest
Enterprise land, together with data on the extent/severity of tree damage and the amount of Grey
Squirrel control practised, for 1960-1994. This monitoring has since ceased, to be replaced with
a scheme to monitor abundance of both species as well as presence/absence in the context of the
Red Squirrel Species Action Plan (see below). The protocol for the new scheme has yet to be
finalised, but recommended methods will include time-area counts, hair tube surveys and line
transects looking for feeding signs. It is intended that data collection will be volunteer-based and
managed by local squirrel groups and wildlife trusts.
Institute of Terrestrial Ecology - Annual monitoring of Red and Grey Squirrel abundance in a
small number of woods.
Northern Ireland Distribution Survey - Presence/absence and crude abundance data from
sightings, field signs and interviews organised by the Ulster Wildlife Trust and the Forest Service
of the Department of Agriculture for Northern Ireland in 1993.
Isle of Wight Red Squirrel Survey - A standardised presence/absence survey using field signs,
conducted in all woods of more than 1ha.
8/18/2019 BTO Research Report No.223 - Developing a Mammal Monitoring Programme for the UK
http://slidepdf.com/reader/full/bto-research-report-no223-developing-a-mammal-monitoring-programme-for-the 126/316
BTO Research Report No. 223July 1999
124
Encroachment by Greys into Red Squirrel habitat - Studies at the Universities of Oxford and
Newcastle of selected populations where the species are interacting.
6.2 MONITORING OBJECTIVES
In the Future research and monitoring section of the Red Squirrel Biodiversity Action Plan, thefollowing point defines the objectives of monitoring for the species:
5.5.2 Establish a survey method and Squirrel Monitoring Scheme to ascertain population levels,
identify key sites and monitor range and population of Greys.
This appears to specify a need for the monitoring of the range and abundance of both Red and
Grey Squirrels in the UK. However, Greys may not be considered the object of conservation
interest and so could be given a lower priority, i.e. monitoring need not be able to identify such a
small change in distribution or abundance: they are also not protected, so can be culled locally if
it is deemed necessary for control purposes. Damage to timber and woodland biotopes as well as
the prevention of the establishment of new woodlands are issues here (S. Gibson, pers. comm.).Intensive monitoring might best be focused on areas where Red and Grey populations are
interacting.
6.3 POTENTIAL MONITORING TECHNIQUES
Visual transect counts - Transect methods allow populations to be sampled quickly and
efficiently using standardised methods. Recording in distance bands allows density to be
estimated in theory, but in practice problems with detectability and with the estimation of
distances in a three-dimensional habitat invalidate the results (S. Harris, pers. comm.). Habitat
recording along transects can also be standardised. For squirrels, differential detection rates with
respect to habitat pose particular problems, such as in deciduous versus coniferous woods, but
sampling or statistical controls could account for such differences in the indexing of population
change (density estimates would be biased). Counts would be best made in early morning and,
in early spring, would benefit from better visibility in deciduous habitats. Some observer
training may be required to assist species identification because well-known features such as
pelage colour and the presence of ear tufts are not reliable in all seasons. Early spring transects
would maximise detection rates; spring/summer counts such as practised under the Breeding Bird
Survey will suffer from variation due to inter-annual differences in productivity and detection
problems due to vegetation growth (especially in deciduous woods) (see Part III.A.1). In
general, visual transects are likely to be more reliable for Grey than for Red Squirrels: behaviour
and population density mean that a higher proportion of the population will be encountered morefrequently (S. Harris, pers. comm.).
Direct counts (total or sample) - Direct counts aim to account for all individuals within an area
or a sample of an area. Variations in detectability are accordingly more of a problem than with
transect counts. In addition, while direct counts measure true density if they are accurate, they
also require more intensive coverage of an area than do transects, so any gains may be
outweighed by the extra time taken. Standardised time-area observation counts (Gurnell &
Pepper 1994) fall into this category.
8/18/2019 BTO Research Report No.223 - Developing a Mammal Monitoring Programme for the UK
http://slidepdf.com/reader/full/bto-research-report-no223-developing-a-mammal-monitoring-programme-for-the 127/316
BTO Research Report No. 223July 1999
125
Capture-Mark-Recapture (CMR) - Baited cage traps, checked twice daily, can be used to
catch squirrels and individual ear tags or combinations of fur tags to mark them (Gurnell &
Pepper 1994). Standard statistical methods then allow the estimation of population size. The
disadvantages with this method are that it is labour-intensive and requires specialised equipment
and training and (for Red Squirrels) government licences.
Field signs (cone cores) - Field signs such as pine cone cores can be searched for using
standardised methods and then related to density, but species identification is a problem. Pine
cone cores can be counted along standard transects which are raked clean after each transect
count, giving information on squirrel habitat use, activity and perhaps abundance (although this
requires verification) (Gurnell & Pepper 1994). The most important problem with this method is
that cone cores left by Red and Grey Squirrels cannot be distinguished.
Field signs (winter drey counts) - Counts of dreys visible along line transects in February and
March can be used to estimate density, based on published studies (Don 1985; Wauters &
Dhondt 1988; Gurnell & Pepper 1994). Drey counting is most effectively done by teams of
observers walking parallel transects 25m apart and it is important that dreys in current use aredistinguished from derelicts and birds’ nests (Gurnell & Pepper 1994): these factors make this
technique less suitable for use by volunteers. It seems likely that relationships between drey and
squirrel density will vary with habitat, as will drey detectability: this would bias estimates of
squirrel density but would not necessarily affect a population index. Dreys will be difficult to
identify reliably to species level, so would only be useful for monitoring in areas where the two
species do not co-occur.
Hair tubes - Plastic tubes of 75mm diameter with adhesive tape placed just inside the
entrance(s), fixed to branches at least 2m above the ground and baited, can be used to collect
samples of hair which can then be identified to species level in the laboratory where necessary
(i.e. where more than one species occurs in the study area) (Gurnell & Pepper 1994, Garson &
Lurz 1998). Hair identification is best done by negative staining: Red Squirrel hair features a
longitudinal groove in which dye collects (Dagnall et al . 1995). The presentation of hair tubes
according to a standardised protocol (for fixed periods of time at a fixed density along a transect
or in a sample plot) can be used to estimate density or to provide an index of abundance as well
as indicating species presence (the adhesive tape with attached hair samples is removed at regular
intervals). This method provides a useful intermediate between visual surveys and CMR: it is
likely to be less biased than a visual approach, does not require licensing and is less labour-
intensive than CMR. It should be noted that hair tubes measure activity rather than numbers of
animals per se, so detection rates are likely to be related non-linearly to abundance.
Road-deaths - Standardised records of squirrel corpses on roads could be used as a monitoring
tool, but information on abundance (at least) would depend critically on “sampling effort”, i.e.
traffic density and distances travelled in searching for corpses (see Part III.B.3).
Garden Mammal Watch - Squirrels are popular, visible animals in gardens, so reliable, simple
presence/absence or abundance data should be readily obtainable from volunteers. This could be
a low-cost method for the monitoring of Grey Squirrel populations and the species would be a
key one in our proposed Garden Mammal Watch (Part III.B.5). Garden sightings may also
provide information on changes in the ranges of each squirrel species.
8/18/2019 BTO Research Report No.223 - Developing a Mammal Monitoring Programme for the UK
http://slidepdf.com/reader/full/bto-research-report-no223-developing-a-mammal-monitoring-programme-for-the 128/316
BTO Research Report No. 223July 1999
126
Reports of presence/absence - Simple reports of squirrel presence or absence from well-
watched and well-defined areas such as nature reserves or Forestry Commission woodlands
might give the most reliable and earliest warnings of changes in the range boundaries of both
species. Such a scheme would involve a regular collation of opportunistic sightings made by
individuals such as nature reserve wardens during the course of their normal activities and is
discussed in Part III.B.4.
6.4 POTENTIAL MONITORING SCHEMES
MMR Recommended Approach - Within the national MaMoNet QQ grid of 10km squares,
MMR recommend that each selected 1km square be surveyed for dreys in winter, using a
distance-sampling “crenellated transect” approach. Where both species occur (and in a buffer
zone around these areas), the base method would be supplemented with direct counts in which
individual squirrels are identified. Red Squirrel-only areas would be surveyed every three years,
Grey-only areas every six years and areas where the species mix would form annually surveyed
Focus Zones. The weaknesses of this monitoring package are that the principal method, drey
counting, is far from ideal and possibly seriously biased as well as perhaps being labour-intensive(see above). There are also doubts about direct counts, but they may represent the best method
for volunteer or non-expert involvement in squirrel surveys.
Combined, complementary surveys - Squirrels are difficult to survey accurately using simple
methods. Our philosophy here is therefore that a number of complementary, simple and
(individually) non-ideal multi-species surveys can be combined to give an overall picture of
squirrel populations. Specifically, the Breeding Bird Survey (Part III.A.1) can potentially
contribute considerable information on Grey Squirrels (in particular), a Winter Transect Survey
would probably provide higher sighting rates and therefore more information still (see Part
III.B.1), a Garden Mammal Watch would give information on suburban populations (see Part
III.B.5), road-deaths would give information on distribution and perhaps abundance (see Part
III.B.3), Mammals on Nature Reserves would give reliable information on changes in range, and
Sign Transects could also contribute (see Part III.B.2). The relative importance of each of these
schemes will depend on the uptake of each by volunteers and then on the detection rates found in
practice. These schemes would be supplemented by more intensive work using hair tubes in and
around the areas where the two species’ ranges overlap. This work would best be done by
professionals and/or trained amateur enthusiasts. Existing Red Squirrel monitoring schemes such
as Red Alert North-West and the Isle of Wight Survey may already meet the requirements of this
work or be easily adapted to it. In terms of organisation, this approach would require the
establishment of the various new schemes listed above and annual central collation of the
information collected. Separate surveys could be conducted by different organisations but itwould be most efficient if they were run by the same body, which would then also collate
information annually.
Current schemes directed towards Red Squirrel - A subset of our recommended methods for
multi-species monitoring, sufficient to detect large changes in abundance or distribution (perhaps
just the BBS), may be enough to monitor squirrels in conjunction with existing Red Squirrel
monitoring. Threatened populations of Red Squirrels (especially) are often monitored already:
additional work might only have to involve central collation and evaluation of the existing
schemes. This would require guaranteed repeat survey or continuation funds for schemes such as
Red Alert North-West, the Isle of Wight Red Squirrel Survey and the BRISC Red and Grey

8/18/2019 BTO Research Report No.223 - Developing a Mammal Monitoring Programme for the UK
http://slidepdf.com/reader/full/bto-research-report-no223-developing-a-mammal-monitoring-programme-for-the 129/316
BTO Research Report No. 223July 1999
127
Squirrel Survey (perhaps with a standardisation of methods and expanded coverage where
necessary). Funding would be required for the central collation of information from the various
sources of monitoring data: within a dedicated mammal research organisation, this could be
achieved with an annual input of no more than one or two months of staff time.
6.5 RECOMMENDATIONS
1) Consensus on the precise requirements of a monitoring programme for Red and Grey
Squirrels must first be established, i.e. it must be decided whether Grey Squirrel
populations are of intrinsic interest or of interest only in terms of their impacts on Reds.
Detection of a 10% decline over 10 years may be required for Red Squirrels (S. Gibson,
pers. comm.). Decisions about monitoring should be made in consultation with the UK Red
Squirrel group and with respect to the Red Squirrel Biodiversity Action Plan. Patterns of
interaction also differ between Britain and Northern Ireland, so different strategies may
need to be adopted.
2) Our proposed multi-species monitoring schemes would all contribute some informationon Grey Squirrels, so a combination of them (managed centrally by a national
organisation) gives a potentially valuable approach for monitoring this species.
3) If monitoring the species is deemed to be important, the existing monitoring schemes for
Red Squirrels should be promoted and future funding guaranteed, perhaps on the
condition that the methods used are standardised as much as possible. In general, it should
be ensured that all monitoring schemes adhere to controlled protocols and a statistically
sound sampling regime.
4) Given that the areas of expansion of Grey Squirrels and of contractions of Reds are of
paramount importance for monitoring, professional hair tube studies of areas of
interaction between Reds and Greys should be established where they do not already exist.
These would best be done or coordinated by a national mammal monitoring body. Such
work should require no more than one staff-year annually, but might most efficiently be
divided between locally-based fieldworkers (who could be employed on short contracts or
be drawn from the staffs of county Wildlife Trusts or the country agencies), together with a
central collation effort.
5) Careful consideration of the integration of new volunteer-based schemes such as the
incipient Forestry Commission survey with established schemes such as Red Alert North-
West is needed. It would be desirable for different schemes to use the same methods and tobe run in collaboration with one another, at least at a committee level. It is imperative that
different surveys do not compete for volunteers.

8/18/2019 BTO Research Report No.223 - Developing a Mammal Monitoring Programme for the UK
http://slidepdf.com/reader/full/bto-research-report-no223-developing-a-mammal-monitoring-programme-for-the 130/316
BTO Research Report No. 223July 1999
128

8/18/2019 BTO Research Report No.223 - Developing a Mammal Monitoring Programme for the UK
http://slidepdf.com/reader/full/bto-research-report-no223-developing-a-mammal-monitoring-programme-for-the 131/316
BTO Research Report No. 223July 1999
129
7. ORKNEY VOLE Microtus arvali s
Introduced. Within the United Kingdom the species is found on only six of the Orkney islands
(and Guernsey). The population has almost certainly declined as a result of substantial changes
in land use.
7.1 RECENT AND ONGOING MONITORING WORK
Aberdeen University - Work has been carried out by Aberdeen University for a number of years
investigating Orkney Vole populations and interactions with their predators (Gorman &
Reynolds 1993).
7.2 MONITORING OBJECTIVES
The Orkney Vole is the only diurnally active rodent on the Orkneys and it is therefore extremely
important as a potential prey item for Hen Harrier Circus cyaneus, Kestrel Falco tinnunculus and
Short-eared Owl Asio flammeus. Recent changes to the landscape of the Orkneys have almostcertainly reduced the population of Orkney Voles and an assessment of the current population
size is urgently needed. Gorman & Reynolds (1993) provide density estimates for a range of
habitat types and these may contribute to assessment of future monitoring requirements.
Monitoring needs to be carried out on an annual basis to account for short-term cyclic behaviour
in population trends. These should also be taken into account when the baseline population
estimates are calculated by running fieldwork over several seasons.
7.3 POTENTIAL MONITORING METHODS
Live-trapping - Orkney Voles can be readily monitored within favoured habitats, notably along
fence lines (Martyn Gorman, pers. comm.), using Longworth live-traps. The Capture-Mark-
Recapture (CMR) method and its inherent biases have been discussed in depth by MMR and by
Flowerdew (1976).
Field Signs - The value of field signs to the monitoring of Orkney Vole populations needs to be
evaluated. The likely dramatic changes in density with the stage of the vole cycle may mean that
such methods may be readily applied to determine short-term changes of large magnitude, but be
less suitable for determining more subtle longer term trends.
7.4 DEVELOPMENT AND VALIDATION STUDIES
A formal trapping protocol should be established following discussions with Martyn Gorman and
colleagues at the University of Aberdeen.
7.5 POTENTIAL MONITORING SCHEMES
A live-trapping approach is recommended for the monitoring of Orkney Vole populations on an
annual basis. Following an examination of densities within different habitats and discussions
with Martyn Gorman, a series of study sites should be selected reflecting the distribution of the
species across habitats in the Orkneys. Each site should be trapped using a trapline of Longworth
live-traps (see Development and Validation of Studies) twice a year (during trough and peak
months of the annual cycle) to provide measures of density. Each site should be trapped for fivedays and is likely to involve 80-100 traps with a single observer covering four sites at a time.
With a six-week trapping window for each of the two trapping periods this would allow four sites

8/18/2019 BTO Research Report No.223 - Developing a Mammal Monitoring Programme for the UK
http://slidepdf.com/reader/full/bto-research-report-no223-developing-a-mammal-monitoring-programme-for-the 132/316
BTO Research Report No. 223July 1999
130
to be covered each week, or 24 sites in total, representing c.60 working days a year. Gorman &
Reynolds (1993) covered 14 different habitats on the mainland with each habitat trapped for five
days, four times a year. Work could be undertaken by professional fieldworkers from the
University of Aberdeen or by volunteers co-ordinated by a single professional. The Orkney Field
Club may be a suitable organisation to approach regarding volunteer input.
7.6 RECOMMENDATIONS
Orkney Vole populations should be monitored at a core of 20-30 sites within the range of
habitats occupied by the species using a live-trapping approach and CMR methods. The
exact trapping protocol should be determined through discussions with researchers at the
University of Aberdeen. Monitoring must take place on an annual basis to allow for
short-term fluctuations in abundance resulting from the cyclic behaviour of this species.
Volunteer involvement (with a professional co-ordinator) could perhaps be mediated
through the Orkney Field Club.
8/18/2019 BTO Research Report No.223 - Developing a Mammal Monitoring Programme for the UK
http://slidepdf.com/reader/full/bto-research-report-no223-developing-a-mammal-monitoring-programme-for-the 133/316
BTO Research Report No. 223July 1999
131
8. WATER VOLE Arvicola terr estri s
Native. Widespread on mainland, but absent from most of Northern and Highland Scotland and
from most islands. Dramatic and widespread decline, both in terms of numbers and distribution.
8.1 RECENT AND ONGOING MONITORING WORK
Nature Conservancy Council Enquiry - An enquiry into the changing status of the Water Vole
was carried out using data from county mammal reports, supplemented by questionnaire
responses from participants in the BTO's Waterways Bird Survey. The analysis suggested a
long-term decline in the Water Vole population linked to the pollution of rivers by
organochlorines from the 1950s and the spread of introduced American Mink from the 1960s
(Jefferies et al. 1989). Although not 'monitoring' per se, this work does illustrate the possibility
of collecting useful data from observers involved in other survey work within riverine habitats.
Vincent Wildlife Trust Survey 1989/90 - Baseline survey work was carried out by a single
professional recorder using a systematic search of pre-selected sites chosen from within a grid of10-km squares. This was supported by a search of sites for which there was historical evidence
of the species. Of the 2,970 sites covered, 47.7% had signs of Water Voles (Strachan & Jefferies
1993; Morris et al. 1998). Reanalysis of the data by Morris et al. (1998) provided a population
estimate of 7,236,000 individuals, although the confidence intervals for this estimate are very
wide. It should be noted that the national survey fieldwork was carried out throughout the year.
Therefore, the low number of latrines reported in some areas may be a consequence of the timing
of fieldwork rather than a reflection of population size. Latrine use varies seasonally with little
or no above ground latrine formation in the winter. This reduces the spatial quality of this
component of the dataset, introducing bias into conclusions drawn about Water Vole distribution
across catchments.
Vincent Wildlife Trust Survey 1997/98 - A repeat of the 1989/90 survey, again using
professional recorders working at the same sites and using the original methodology. Field sites
were revisited during the same season as for the previous survey, thus removing the bias
associated with sampling date and allowing a comparison to be made between the two datasets.
The data are currently being analysed and a report is due to be published at the end of 1999.
When the results are published it will be possible to be much clearer about the future monitoring
strategy for this species.
WildCRU - An ongoing study using River Corridor Survey methodology to record Water Vole
distribution within seven river catchments (Bure, Isle of Sheppey, Isle of Wight, Itchen, Teifi,Thames, Tyne). See MMR for full description of methods. Also within the MMR is a detailed
assessment of possible sampling regimes based on this approach and their application to a
national monitoring programme for Water Voles.
Aberdeen University - Four projects concentrated within the River Don catchment initiated
from 1995 onwards. The projects examine the behavioural ecology, conservation,
metapopulation dynamics and phylo-geography of Water Vole populations. As with the
WildCRU work, this project can potentially provide detailed information on Water Vole
populations within a specific catchment and could contribute to an examination of suitable
recording methods.
8/18/2019 BTO Research Report No.223 - Developing a Mammal Monitoring Programme for the UK
http://slidepdf.com/reader/full/bto-research-report-no223-developing-a-mammal-monitoring-programme-for-the 134/316
BTO Research Report No. 223July 1999
132
Environment Agency - The Environment Agency's River Habitat Survey documents the
presence of Water Voles in conjunction with the collation of data on habitat and river features.
The detailed nature of the survey, coupled with the large number of sample sites, could provide
useful information of the distribution and (with modification) abundance of Water Voles.
Wildlife Trusts - The Water Vole Watch project was established in 1997 by the Wildlife Trustsin collaboration with the Universities of Oxford and Newcastle. Volunteers were asked to survey
stretches of river (selected by the volunteers themselves) for signs of Water Voles. A simple
recording form allowed volunteers to note the presence of Water Voles and their signs and to
record basic habitat information. No systematic selection of sampling areas was undertaken and
in its current format, the survey provides little information of value to the monitoring of temporal
or spatial trends in Water Vole populations.
National Water Vole Breeding Programme - Although not specifically a monitoring
programme, consideration is being given to the efficacy of reintroduction and translocation as a
conservation tool for Water Voles. Monitoring of released populations is being undertaken by
Sparsholt College Hampshire, together with an examination of suitable release methods. A planned reintroduction at the Arundel Wetlands and Wildfowl Trust reserve is due to take place
later this year (Mike Jordan pers. comm.). This will involve 80 individuals, half of which will be
followed using radio-tracking for six months post-release. This will be followed by routine
trapping carried out every 6-12 weeks. A further release of 100 individuals is planned for the
WWT Barn Elms reserve at a later date.
Other projects - A number of other local projects involving the monitoring or surveying of
specific catchments are being carried out across the United Kingdom. These are listed in The
Mammal Society's Current Projects and include work examining the establishment of 'key sites'
in England and Wales as the basis for long-term monitoring. This work is due to commence late
in 1999 (Paul Bright, pers. comm.).
8.2 MONITORING OBJECTIVES
Within the ' Future Research and Monitoring ' section of the Water Vole Biodiversity Species
Action Plan are two aims that point towards the type of monitoring required for this species
(Anon 1995). These are:
5.5.3 to seek to establish a National Water Vole monitoring scheme based on indices
and regular survey of key sites in all counties.
5.5.4. to carry out a survey to determine the distribution of Water Voles throughout
Britain, identifying key populations in all counties and regions.
This suggests that a two-tier approach should be adopted, with periodic national surveys (ideally
within the grid of sample squares already established), supported by annual monitoring at a
number of sites across the UK. The lack of quality spatial data resulting from methodological
problems with the current national survey suggests that the collation of distributional data should
be a high priority. This does not necessarily require a completely new national survey: there is a
lot to be gained from building upon the two surveys already carried out. Instead, an examination
of potential spatial bias within the VWT data may determine whether a calibration exercise could
8/18/2019 BTO Research Report No.223 - Developing a Mammal Monitoring Programme for the UK
http://slidepdf.com/reader/full/bto-research-report-no223-developing-a-mammal-monitoring-programme-for-the 135/316
BTO Research Report No. 223July 1999
133
be used to improve the spatial quality of the data. High quality data already exist for specific
river catchments and efforts should be made to draw these together, identifying those catchments
for which additional data is urgently required.
The 94% decline reported for this species (Don Jefferies, pers. comm.) highlights the immediate
action that needs to be directed towards its conservation.
8.3 POTENTIAL MONITORING TECHNIQUES
Live-trapping - Capture-Mark-Recapture methods may be used at 'core' sites where the majority
of individuals present appear to be readily caught using wire mesh traps baited with mashed
carrot and/or chopped apples (Stoddart 1970; Airoldi 1976; Woodroffe et al. 1990). Trapping at
'Peripheral' sites was found to be ineffective by Woodroffe et al. (1990) even when high levels of
Water Vole activity were registered. Trapping at both types of site should be carried out between
early spring and late autumn, with traps positioned as near to the water as possible. Traps placed
on purpose built rafts may be equally or more effective as indicated by Water Vole responses to
Coypu traps placed on baited rafts (Baker & Clarke 1988). Stoddart (1970) provides a suitabletrap design. Trapping should involve a prebait period followed by three days of trapping with
traps set at a 20m spacing (Mike Jordan, pers. comm.). This species can be readily caught during
the breeding season, but is very difficult to catch between November and March.
Direct sightings - Direct counts of individuals are likely to be unreliable given the difficulties in
approaching this species and because of colony structure.
Field signs - Various field signs may be used to detect the presence of Water Voles at a site, with
breeding season latrine counts in particular potentially providing a measure of abundance
(Woodroffe et al. 1990; Strachan & Jefferies 1993; Morris et al. 1998, MMR). The value of
latrine counts in determining abundance relies on assumptions regarding the ratio of latrines to
individual voles. Reanalysis of Woodroffe et al.'s (1990) data by Morris et al . (1998) suggests a
roughly 1:1 relationship between the number of latrines and the number of voles and not the 6:1
relationship for the Yorkshire sample as reported in MMR. However, other radio tracking work
undertaken by WildCRU suggested some six latrines per vole. Since latrines appear to serve a
territorial purpose, the number produced per vole could be expected to vary with population
density, season and site. This may reduce the effectiveness of the widespread application of
latrine counts as a means of assessing abundance, unless more information can be gathered on
the relationship between latrine production and vole density. Provision of dropping boards may
improve the ease with which latrines can be found in difficult habitats. It should be noted that
there is no latrine formation above ground in the winter and that the persistence of latrines is verydependent upon water level (Mike Jordan, pers. comm.).
Counts of burrows and runways, although they are readily identified, may be biased by the fact
that these features may continue to exist after a colony has become extinct (Woodroffe et al.
1990). Only the presence of tracks provide an indication of Water Vole activity away from 'core'
sites, although the difficulties in separating Water Vole tracks from those of Brown Rat make
this method unsuitable for widespread or amateur use.
Mammals on Nature Reserves - Records of Water Voles on nature reserves could be collated
according to the suggestions outlined in Part III.B.6.
8/18/2019 BTO Research Report No.223 - Developing a Mammal Monitoring Programme for the UK
http://slidepdf.com/reader/full/bto-research-report-no223-developing-a-mammal-monitoring-programme-for-the 136/316
BTO Research Report No. 223July 1999
134
Waterways Breeding Bird Survey (WBBS) - Water Vole, along with Mink and Otter, is one of
the few species that could be monitored through the WBBS, although it should be stressed that
this survey is currently still in its pilot stages and may not have funding for continuation beyond
the end of the pilot period. Additionally, the survey is designed to survey a range of bird species
associated with riparian habitats and is therefore not ideal for the transect monitoring of Water
Vole field signs.
Other alternatives - Questionnaires or Reporting Cards could be used to gather data on an ad
hoc basis from anglers, Wildlife Trust members, river keepers and boat users. While such an
approach may highlight those areas in which Water Voles occur, it will not provide the type of
data required for monitoring purposes.
8.4 POTENTIAL MONITORING SCHEMES
The established grid of Water Vole survey sites, within which two national surveys have already
been undertaken, provides a monitoring framework that has documented a 94% reduction in
Water Vole occurrence (Don Jefferies, pers. comm.). To replace this scheme with an alternativewould effectively remove what is an important historical dataset. As has been stressed
elsewhere, such replacement should only be the preferred option where a current scheme fails to
deliver suitable monitoring information or is prohibitively expensive. Although there is a degree
of spatial bias in the Water Vole dataset, due to the manner in which the data is gathered, it does
provide quality data on temporal trends in the population (see Recent and Ongoing Monitoring
Work - VWT survey 1989/90). The rapid decline witnessed for this species may suggest that
more regular monitoring work is undertaken and with a 94% decline already witnessed, there is
urgent need for a coherent strategy to be put in place. Priority action may require that resources
are targeted towards preserving the remaining populations, removing causal factors and investing
in future captive breeding and release schemes. The nature of planned action will itself partly
determine the monitoring structure required. It would be prudent to base monitoring decisions on
the data published in the second Water Vole Survey Report (due end 1999) rather than to make
and act on recommendations now.
Potentially there is a great deal to be gained from undertaking more detailed monitoring within
specific catchments, either where measures to safeguard Water Vole populations are being
implemented or where populations are to be reintroduced. Such monitoring work would need to
be linked to the monitoring of those factors implicated in the decline, specifically Mink
populations and habitat degradation. This work could be based on a transect approach, involving
the location of field signs (specifically latrine counts) supported by detailed work in a range of
habitats to determine the relationship between the number of voles and the number of latrines.An understanding of Water Vole abundance at study sites should be considered a priority over
the recording of simple presence/absence data. Data showing a decline in abundance at sites will
provide earlier indications of a decline than data merely showing presence or absence at a site.
This will be especially important if existing sites are to be protected and their Water Vole
populations stabilised. The evaluation of 'key sites' as a basis for monitoring in England and
Wales is due to commence later this year. The success of this approach for the Common
Dormouse suggests that it may be equally applicable for Water Voles.
While both the VWT national method and that proposed by MMR can provide broad-based
monitoring data at the national level, it might be better to target the limited resources more

8/18/2019 BTO Research Report No.223 - Developing a Mammal Monitoring Programme for the UK
http://slidepdf.com/reader/full/bto-research-report-no223-developing-a-mammal-monitoring-programme-for-the 137/316
BTO Research Report No. 223July 1999
135
towards priority catchments, long-term refuges and Water Vole/Mink interfaces. These
catchments could be studied in detail, possibly involving local Wildlife Trusts and Environment
Agency officers, in an attempt to undertake regular and detailed monitoring, additionally
gathering other data on the presence of Mink, river quality and habitat structure. This additional
data collation could be based on the Environment Agency's River Habitat Survey (Raven et al.
1997), a method recently adopted and linked to the recording of waterways breeding birds(Buckton & Ormerod 1997; Marchant & Gregory 1999).
Timing of fieldwork should be evaluated through pilot fieldwork or by drawing upon published
data on the seasonality of latrine production. Similarly, the number of transects required and
their length and placement, should be the subject of fieldwork trials, possibly using the validation
work already undertaken by MMR, or expanding on that planned for the monitoring of 'key sites'.
Data from the two national surveys could be used to model the best sample sizes, their
distribution and periodicity of coverage.
8.5 DEVELOPMENT AND VALIDATION STUDIES
A data-modelling exercise (using data from the two national Water Vole surveys, once they are
available) should be used to establish whether the number of sample sites can be reduced without
reducing the power of the approach for detecting trends of say 25% over 25 years. This exercise
could also be used to examine the ideal interval between surveys based on the power of detection
and the costs of implementing the survey. This could be carried out at the same time as
modelling data for other species (e.g. Badger and Otter). Such analyses are considered in Part
VII.
8.6 RECOMMENDATIONS
1) No firm decision on monitoring should be taken until the second National Water Vole
Survey report is published (end 1999) and the 'key site' approach (5) is evaluated. Once
these data become available a study should be initiated to determine a suitable sampling
protocol based on simulations, examining sampling interval and the number of sites used.
The results of the simulations may demonstrate that a further degree of stratification could
be introduced, that sample size could be reduced and that sampling interval could be
altered.
2) Allowing for the outcome of simulations in (1), it would be sensible to base future
monitoring of this species on the approach adopted for the two VWT surveys (transect
search for field signs) and the existing grid of survey sites. However, the survey could bemade more cost-effective through the use of trained volunteers to survey individual sites,
rather than a single professional observer.
3) In view of the 94% decline due to be reported by the second national survey, work
should be carried out using a shorter inter-survey interval than currently used, at least for
the short-term. There may also be some value in targeting efforts towards priority
catchments (i.e. those with remaining populations or those likely to be colonised by Mink in
the coming years).

8/18/2019 BTO Research Report No.223 - Developing a Mammal Monitoring Programme for the UK
http://slidepdf.com/reader/full/bto-research-report-no223-developing-a-mammal-monitoring-programme-for-the 138/316
BTO Research Report No. 223July 1999
136
4) Ancillary data should be gathered through the recording of this species on nature
reserves and possibly through the Waterways Breeding Bird Survey.
5) Evaluation of a 'key sites' approach is to be undertaken (Paul Bright, pers. comm.) and
findings from this work should contribute to the development of the national monitoring
strategy (1). Local monitoring may be an important component of the national strategy,possibly providing information on an annual basis to support the national data collected
every five years.
6) Some attempt should be made to examine the level of spatial bias in the two VWT
surveys (see Recent and Ongoing Monitoring Work: VWT Survey 1989/90).
8.7 RESOURCE REQUIREMENTS
Co-ordination of monitoring work on this species could be carried out by a single individual
(full-time HSO grade - also acting as co-ordinator for Otter and Mink), supported largely by
volunteer fieldworkers, with some professional input to the teaching of monitoring methods,validation of data gathered during the survey work and coverage of remote areas.

8/18/2019 BTO Research Report No.223 - Developing a Mammal Monitoring Programme for the UK
http://slidepdf.com/reader/full/bto-research-report-no223-developing-a-mammal-monitoring-programme-for-the 139/316
BTO Research Report No. 223July 1999
137
9. YELLOW-NECKED MOUSE Apodemus fl avicoll is
Native. Believed to be declining in range and abundance, although the rate and magnitude of the
decline is unknown. Found predominantly in the south, south-east and west of England and in
central and eastern Wales; absent from the southern Midlands.
9.1 RECENT AND ONGOING MONITORING
National Yellow-necked Mouse Survey - A 'snapshot' survey was undertaken by The Mammal
Society and the University of Bristol during late 1998, using volunteers working with lines of
Longworth live-traps (Chitty & Kempson 1949) on sites across England and Wales (Marsh
1999). Trapping was carried out between the start of September and the end of November within
deciduous woodland sites greater than two hectares in size and selected by volunteers. Forty
traps were operated for two nights to obtain a measure of relative abundance, together with the
collation of data on habitat characteristics. The results showed the species to be widespread in
suitable woodland within its natural range (occurring at 71% of sites). However, small mammal
populations are prone to considerable inter-annual fluctuations (Mallorie & Flowerdew 1994)and this may have influenced some of the results, notably those relating to abundance.
Mammal Society planned work - The National Yellow-necked Mouse Survey report outlines
future work planned by The Mammal Society on this species. This will look at habitat needs,
edge of range densities and precise limits of distribution.
9.2 MONITORING OBJECTIVES
A better understanding of the range limits for this species is required, together with information
on long-term population change and persistence of populations in habitat other than mature
deciduous woodland. This approach is likely to require annual monitoring to overcome the
influence of interannual fluctuations when determining long-term trends and delimiting range.
Additionally, more intensive study work should be aimed at examining habitat use outside 'core'
habitats.
9.3 POTENTIAL MONITORING METHODS
Live-trapping - Longworth live-traps can be used to catch Yellow-necked Mice, using rolled
oats as bait and a trap interval of 15m on a grid or transect line. The exact grid arrangement
needs to be established and to some extent will be dependent upon the ultimate aims of the
monitoring work. A trap-line (or transect) approach will be less suitable for determiningabundance than a trapping grid due to the 'edge' effect encountered when trapping (Pelikan 1968;
Hansson 1969; Twigg 1975). However, if simple presence/absence is all that is required, then a
transect line may be the most appropriate approach because it requires fewer traps.
Hair tubes - In practice it may not be possible to separate the hairs of Apodemus flavicollis from
those of Apodemus sylvaticus and the suitability of this method needs further evaluation before
consideration is given to its use as a monitoring tool.
Nestboxes - Yellow-necked Mice will use nestboxes erected for Dormice or cavity-nesting birds.
Where large numbers of boxes are regularly checked (e.g. Pied Flycatcher Ficedula hypoleuca or
Great Tit Parus major schemes) there is the potential for CMR techniques to be applied. The use
of such boxes by Yellow-necked Mice is currently being investigated by Aidan Marsh with

8/18/2019 BTO Research Report No.223 - Developing a Mammal Monitoring Programme for the UK
http://slidepdf.com/reader/full/bto-research-report-no223-developing-a-mammal-monitoring-programme-for-the 140/316
BTO Research Report No. 223July 1999
138
preliminary findings suggesting that capture levels in boxes may be too low for CMR techniques
to be applied for most sites (pers. comm.).
9.4 POTENTIAL MONITORING SCHEMES
Live-trapping using woodland grids - The apparently rather specific habitat requirements ofthis species make it possible to monitor nationally occurring long term changes in abundance that
would be impossible for most other small mammal species. That component of the
Yellow-necked Mouse population using mature deciduous woodland is likely to represent the
bulk of the population within the UK, although more work should be carried out to confirm this.
Assuming that this is the case, so long as enough sites can be covered each year, it should be
possible to monitor long-term trends and to remove the effects of differences between individual
woodland sites (e.g. seed production, age, species composition). This is still likely to require a
significant number of sites, certainly far more than the number covered annually as part of the
study by Mallorie & Flowerdew (1994). The minimum number required should be investigated
as part of a pilot study, in order to determine whether this approach is economically feasible (see
also Part IV.15 - other small mammal species). The pilot work should also examine the numberof traps required and the structure of the trapping protocol, although this may be based on either
the methods of Marsh (1999) or Mallorie & Flowerdew (1994), although top grids should replace
the use of trap lines.
Ancillary data - Information on distribution may be obtained from examination of the
occurrence of Yellow-necked mice in nestboxes at a network of sites across the UK. This is
likely to require increased co-ordination of ongoing schemes to ensure that bird ringers and nest
recorders, together with those people working on Common Dormouse boxes, pass information on
mice to the appropriate recorders. These people should also be provided with training into how
to recognise Yellow-necked Mice and how to separate them from Wood Mice.
9.5 RECOMMENDATIONS
1) A series of woodland study sites should be trapped on an annual basis (to allow for
short-term fluctuations with the aim of monitoring long-term changes in abundance as
revealed by CMR techniques.
2) Field trials should be carried out to investigate the distribution of Yellow-necked Mice in
other habitat types and to determine whether the trapping protocol used for the National
Yellow-necked Mouse survey is the most cost-effective for repeated surveys to allow
determination of a 25% change in abundance over 25 years.
3) The potential for collation of ancillary data from long-term nestbox schemes should be
investigated further.

8/18/2019 BTO Research Report No.223 - Developing a Mammal Monitoring Programme for the UK
http://slidepdf.com/reader/full/bto-research-report-no223-developing-a-mammal-monitoring-programme-for-the 141/316
BTO Research Report No. 223July 1999
139
9.6 RESOURCE REQUIREMENTS
One person could oversee co-ordination of schemes involving the Yellow-necked Mouse, with
this individual likely to be involved in the co-ordination of other projects as well. During the
pilot phase, additional input is likely to be required as fieldwork trials are carried out. The
National Yellow-necked Mouse Survey involved trapping at 168 woods surveyed over a 12 week period. Assuming one set of 40 traps could be used at a single site in any one week, some 14 sets
of traps (560 traps - £16,800) would be required, involving c.1,700 hours fieldwork.

8/18/2019 BTO Research Report No.223 - Developing a Mammal Monitoring Programme for the UK
http://slidepdf.com/reader/full/bto-research-report-no223-developing-a-mammal-monitoring-programme-for-the 142/316
BTO Research Report No. 223July 1999
140

8/18/2019 BTO Research Report No.223 - Developing a Mammal Monitoring Programme for the UK
http://slidepdf.com/reader/full/bto-research-report-no223-developing-a-mammal-monitoring-programme-for-the 143/316
BTO Research Report No. 223July 1999
141
10. HARVEST MOUSE Micromys minutus
Native. The species shows a restricted distribution with the majority of records coming from
England. Populations are thought to fluctuate between years and there is some evidence of a
recent contraction in range.
10.1 RECENT AND ONGOING MONITORING
National Harvest Mouse Survey (1973-1977) - A national survey instigated by The Mammal
Society in 1973 aimed to establish both the status and distribution of the species within Great
Britain. Targeted media appeals were followed up by the collation of record sheets, noting the
occurrence of Harvest Mice at various sites. Some 1,205 record sheets were returned by
observers allowing a distribution map to be plotted. Records of Harvest Mouse nests accounted
for 66.9% of reports, with 8% referring to trapped individuals and 7.6% to remains from Barn
Owl pellets (Harris 1979). It was noted that '.. on the fringes of its range, populations of Harvest
Mice were extremely localised, and often difficult to find..'.
Look Out For Mammals Survey (1996-1997) - As part of The Mammal Society’s Look Out for
Mammals project some 800 sites from the 1970s survey were resurveyed to determine whether
Harvest Mice still occurred at the sites and to assess the degree of habitat change. The results
from this work are currently being analysed, although early indications are that only 29% of
historical sites still show signs of activity.
10.2 MONITORING OBJECTIVES
The monitoring of population trends, together with the establishment of range limits should be
considered a priority for this species.
10.3 POTENTIAL MONITORING TECHNIQUES
Live-trapping - Live-trapping can be carried out using a grid of Longworth live-traps (Chitty &
Kempson 1949). Although Harvest Mice can be caught on the ground between September and
February, (when the vegetation dies or is cut back), they are more readily caught in the summer
months by setting traps some 0.5 to 1m above the ground using bamboo canes (Perrow, pers.
comm.). MMR note that seed-baited traps should be set in undisturbed grassland or along field
margins using a 7x7 grid with a 15m trap interval, in keeping with home range sizes of
300-400m2 (Trout 1978).
Hair tubes - Hair tubes (28mm diameter, placed 0.5-1.0m above the ground) have been used by
Martin Perrow at the University of East Anglia for much of his work on Harvest Mouse
populations. Attempts to calibrate hair tube data against live-trapping data suggest that the use of
hair tubes is well suited to this species.
Field signs (nests) - The aerial breeding nests made by Harvest Mice are distinctive, typically
placed in monocotyledons and are made from finely split and woven grasses. During the period
when young are in the nest there is no obvious entrance, although the nest becomes more battered
once the female has abandoned the young. The nests are usually spatially separated, so a cluster
of two or three is likely to represent successive litters from one female (Trout 1978).
8/18/2019 BTO Research Report No.223 - Developing a Mammal Monitoring Programme for the UK
http://slidepdf.com/reader/full/bto-research-report-no223-developing-a-mammal-monitoring-programme-for-the 144/316
BTO Research Report No. 223July 1999
142
Artificial baiting nests (Warner & Batt 1976) - Artificial baiting nests have been developed
from tennis balls with the aim of attracting Harvest Mice. A hole is made in the wall of the
tennis ball using a 15mm cork borer, before being waterproofed and mounted on a post at a
height of 30 to 50cm. Once in position and baited with bird seed, the tennis ball can then be left
for five days before being checked to determine if Harvest Mice have taken the bait. This period
is thought to be long enough to reveal the presence of Harvest Mice at low population densities(Warner & Batt 1976). MMR note that this approach only provides presence/absence data and
that recent countrywide trials by The Mammal Society have been largely unsuccessful.
Owl pellets - Harvest Mice occur in Barn Owl pellets (Buckley 1977) although the species is
considered to be only a minor prey species (typically up to 3% of dietary intake by number).
Analysis of Barn Owl pellets as part of a general pellet scheme could provide useful information
on distribution of this species.
10.4 POTENTIAL MONITORING SCHEMES
There are two alternative approaches that could potentially be adopted (a) hair tubes - favoured by workers at the University of East Anglia and (b) nest searches - favoured by The Mammal
Society. Both are discussed below.
a) Hair tubes - Hair tubes should be supplied to a volunteer network of people interested in
helping with ongoing monitoring of this species during the summer months. Guidelines should
be supplied on where and how to place tubes and tape from tubes should be sent back for
analysis at the end of each annual sampling period. Survey work should take place each summer,
the data being analysed during the winter and a report sent to all contributors prior to the
commencement of the follow year's fieldwork. Each observer should get a mail-merged letter
accompanying the material for the following season (new forms, tape, etc.) and the report from
the previous season. This letter should contain information on the individual species recorded or
presence/absence of Micromys by that observer.
It is difficult to predict how many volunteers would be willing to become involved in this project,
but the likely number of sites requiring coverage could be determined through an analysis of data
from the two Mammal Society Harvest Mouse surveys. Data from the most recent survey are
currently being analysed and a sampling protocol should not be finalised until after these data are
published. Participants in the most recent survey, together with nature reserve wardens, FWAG
field officers, LOFM participants, etc. may be the logical groups to approach in the hope that
such people could provide continuous monitoring at sites over time.
Analysis would be undertaken by a single person, not necessarily the person running the scheme,
but possibly involved in other monitoring projects of a related nature. Initial inputs to the
scheme would require development of guidelines and survey packs, targeted media appeals and
general promotion of the scheme. Once established, the preparation of an annual report and
analysis of the results should be considered a priority in order to maintain volunteer enthusiasm
and recruit new fieldworkers. The proportion of tubes containing Micromys hairs could form the
basis of an index and provide information on both distribution and abundance.
b) Nest searches - Searches for nests could also be undertaken at the sites being covered with
hair tubes or as part of an unrelated scheme. Searches are likely to be quick, simple and effective

8/18/2019 BTO Research Report No.223 - Developing a Mammal Monitoring Programme for the UK
http://slidepdf.com/reader/full/bto-research-report-no223-developing-a-mammal-monitoring-programme-for-the 145/316
BTO Research Report No. 223July 1999
143
with counts of breeding nests providing a quick and simple approach that can be included in
transects for field signs in the autumn. This approach could allow more sites to be covered
annually than would be possible with hair tubes. Detailed methods for finding sites should be
based on The Mammal Society’s Look Out For Mammals guidelines.
Ancillary data could come through the recording of presence/absence of Harvest Mice at thosenature reserves involved in any monitoring scheme aimed at recording mammals on nature
reserves (see Part III.B.6.).
10.5 DEVELOPMENT AND VALIDATION OF STUDIES
A series of live-trapping grids should be placed on a subset of the sites, allowing calibration of
the data received from the hair tubes and nest searches. This should only continue for as long as
necessary to allow determination of the effectiveness of the two approaches. Pilot work should
be carried out to establish the number of sites that need to be covered, together with the number
of tubes that should be used per site. It is recommended that either The Mammal Society or the
University of East Anglia are approached regarding the pilot work.
10.6 RECOMMENDATIONS
Two alternative schemes (1) and (2) require further consideration and could be supported
by ancillary data from other schemes.
1) Annual monitoring of this species could be based on the use of hair-tubes at a number of
sites across the known range. Placement of tubes and data collection should be undertaken
by volunteers, with tape from the tubes sent to a central co-ordinator for analysis. Results
should be reported on an annual basis through a scheme newsletter sent out with the
fieldwork material for the following season. The number of sites to be covered and the
number of tubes to be used should be determined following discussion with The Mammal
Society and researchers at the University of East Anglia.
2) Searches for nests could be undertaken at those sites detailed in (1) or as part of an
unrelated scheme. Monitoring of those sites notified during the national Harvest Mouse
surveys should continue, using nest searches as the primary fieldwork method. Data from
The Mammal Society's evaluation of artificial baiting nests should be examined in detail to
determine whether this method can be applied successfully and whether there are any
implications for other monitoring methods.
3) Ancillary data could be gathered through the monitoring of this species on nature
reserves (see Part III.B.6).

8/18/2019 BTO Research Report No.223 - Developing a Mammal Monitoring Programme for the UK
http://slidepdf.com/reader/full/bto-research-report-no223-developing-a-mammal-monitoring-programme-for-the 146/316
BTO Research Report No. 223July 1999
144

8/18/2019 BTO Research Report No.223 - Developing a Mammal Monitoring Programme for the UK
http://slidepdf.com/reader/full/bto-research-report-no223-developing-a-mammal-monitoring-programme-for-the 147/316
BTO Research Report No. 223July 1999
145
11. HOUSE MOUSE Mus domesticus
An ancient introduction. Widespread. Strongly commensal: most (but not all) populations
outside buildings are probably sinks, dependent on continuing input from populations in
buildings. Probably suffered big declines following loss of cereal ricks.
11.1 RECENT AND ONGOING MONITORING WORK
Housing Condition Surveys (DETR) - These have been conducted at five-yearly intervals in
England and Wales although (the 1996 survey omitted Wales). They have covered a random
sample of dwellings in the areas of participating local authorities (participation was complete in
1996 but voluntary before that). The 1996 survey (not yet published) gathered information on
the percentage of dwellings infested by mice but we understand that earlier ones did not.
National Rodent Survey (MAFF) - Conducted annually during 1976-1979 and 1993, covering
business premises as well as houses; the 1993 survey included agricultural premises but the
1976-9 surveys did not (Meyer et al . 1995). Covered England and Wales but not all local
authorities participated. Recorded infestation rates. For many years prior to 1976, a less formalsurvey was used to monitor infestation rates roughly (Rennison & Drummond 1981).
Northern Ireland - Similar surveys to the Housing Condition Survey have been run.
Scotland - Similar surveys to the Housing Condition Survey have been run, but without
gathering information on rodents.
Note on data quality in the above surveys
Questionnaires commonly refer simply to “mice”; it is furthermore, likely that many respondents
would not distinguish between mouse species. Given that Wood Mice are common in houses, at
least in rural and semi-rural locations, the above surveys are probably of limited value for
monitoring House Mice.
11.2 MONITORING OBJECTIVES
House Mice are not good wildlife indicators because they are so commensal with humans and
their numbers depend so much of the efficacy of measures taken to control them. They are
probably of little significance in most natural and semi-natural ecosystems in the UK.
Conservation of the species in its own right requires that we need to be aware of catastrophic
declines in its numbers.
11.3 POTENTIAL MONITORING TECHNIQUES
Questionnaire surveys of local authorities - These are limited use because of the problem of
species identification (see above).
Questionnaire surveys of pest-control companies - Company representatives have suggested to
us that these would be of limited value because of the problem of species identification and
because companies do not routinely collate data in a form that could be useful for monitoring.

8/18/2019 BTO Research Report No.223 - Developing a Mammal Monitoring Programme for the UK
http://slidepdf.com/reader/full/bto-research-report-no223-developing-a-mammal-monitoring-programme-for-the 148/316
BTO Research Report No. 223July 1999
146
Pest-control data from specific sites - At many commercial sites, mice and rats are routinely
controlled in continuous programmes of work. Typically, contractors visit sites 2-8 times per
year to determine whether pest species are present (and to take action to control them if they are).
The proportion of visits yielding positive records could provide an index of House Mouse and
Brown Rat at each site.
Trapping - House Mice are relatively easy to trap, so trapping rates at a site could provide anindex of numbers at that site.
Direct sightings - House Mice are too rarely observed (even in gardens) for most schemes based
on direct observations to provide much useful data.
Owl pellets - House Mice are scarce in owl pellets.
11.4 POTENTIAL MONITORING SCHEMES
Questionnaire survey of local authorities - Despite the identification problems, this may be the
only feasible way of getting some sort of measure of changes in the national House Mouse population. Local authorities might only co-operate if it was part of a broader survey of housing
conditions.
Gathering pest control data from specific sites - There are several hundred pest control
companies, each managing pests at many sites. Some may be prepared to provide data as a way
to promote the industry’s positive image. Client confidentiality could be a problem but there is
not need to exact locations to be revealed. The British Pest Control Association could provide a
link with some of the companies. Guidance on identification would be needed.
Trapping - Given the patchiness and great temporal variation of House Mouse populations, a
scheme based on trapping animals would probably only deliver a useful national index if it
involved some hundreds of sites. This would be very expensive.
Owl Pellets Scheme - House Mice would automatically be included in a scheme but the numbers
of House Mice in the samples would probably be too low to be useful.
Garden Mammal Watch - House Mice should probably be included, to allow observers to
record them, but the number of observations is likely to be too few to be useful (and there may be
identification problems).
11.5 RECOMMENDATIONS
1) House Mice should be included in the Owl Pellets Scheme.
2) House Mice should be included in Garden Mammal Watch.
3) The value and best way of including rats and mice in future surveys like the Housing
Condition Survey should be assessed after the report of the 1996 Survey is published.
4) If monitoring through the Housing Condition Survey is judged unfeasible, consideration
should be given to gathering site-specific data from pest-control companies.

8/18/2019 BTO Research Report No.223 - Developing a Mammal Monitoring Programme for the UK
http://slidepdf.com/reader/full/bto-research-report-no223-developing-a-mammal-monitoring-programme-for-the 149/316
BTO Research Report No. 223July 1999
147
12. BROWN RAT Rattus nor vegicus
Eighteenth century introduction. Widespread. Largely commensal but less so than House
Mouse; as well as in buildings, it is common in refuse tips, in sewers and along urban waterways.
Populations on arable land may move more into agricultural buildings after harvest. Natural
habitats are occupied along the coast. Numbers have probably declined greatly this century,consequent on more efficient harvesting and storage of food and on highly effective poisons.
12.1 RECENT AND ONGOING MONITORING WORK
See House Mouse: all of the surveys listed under that species also covered Brown Rats, as did the
1991 Housing Condition Survey.
Note on data quality in these surveys
Although questionnaires commonly refer simply to “rats” and it is likely some respondents
would not distinguish Brown from Ship Rats, the latter are so scarce that the information
provided by the surveys is genuinely relevant to Brown Rats.
12.2 MONITORING OBJECTIVES
Brown Rats are poor wildlife indicators for the same reasons as House Mice. Populations in
natural and semi-natural ecosystems may be important predators (especially of seabirds on
islands) and they are sometimes significant in the diet of larger predators. Thus we need to be
aware of substantial changes in numbers of Brown Rats.
12.3 POTENTIAL MONITORING TECHNIQUES
Questionnaire surveys of local authorities - Provide an index of how abundant and widespread
Brown Rats are.
Questionnaire surveys of pest-control companies - Of limited use because companies do not
routinely collate data in a form that could be useful for monitoring.
Pest-control data from specific sites - At many commercial sites, mice and rats are routinely
controlled in continuous programmes of work. Data from such sites could provide an index of
population levels at each one.
Game Bag data - The recording of rats in Game Bags is almost certainly too sporadic to beuseful.
Trapping - Rat traps are more cumbersome than mouse traps and Brown Rats often difficult to
trap, but trapping could be used to index their numbers at individual sites.
Direct sightings - Brown Rats are not infrequently observed in gardens and in the countryside,
though they are generally shy and nocturnal.
Owl pellets - Rats occur not uncommonly in owl pellets.

8/18/2019 BTO Research Report No.223 - Developing a Mammal Monitoring Programme for the UK
http://slidepdf.com/reader/full/bto-research-report-no223-developing-a-mammal-monitoring-programme-for-the 150/316
BTO Research Report No. 223July 1999
148
12.4 POTENTIAL MONITORING SCHEMES
Questionnaire survey of local authorities - See House Mouse.
Gathering pest-control data from specific sites - See House Mouse.
Trapping - See House Mouse; because of the larger traps and the neophobia exhibited by rats
(leading to smaller numbers of catches per trap-night), the costs would be even greater for rats.
Owl Pellet Scheme - Brown Rats would automatically be included in such a scheme; they may
be recorded often enough for this to provide a useful index. Though most rats found in owl
pellets are young ones, so their frequency is not a good indication of adult numbers.
Garden Mammal Watch - Brown Rats should be included; they may be recorded often enough
for this to provide a useful index.
Mammals on Nature Reserves - Brown Rats should be included; they may be recorded oftenenough for this to provide a useful index.
12.5 RECOMMENDATIONS
1) Brown Rats should be included in the Owl Pellets Scheme.
2) Brown Rats should be included in Garden Mammal Watch.
3) Brown Rats should be included in the Mammals on Nature Reserves Scheme.
4) The value and best way of including rats and mice in future surveys like the Housing
Conditions Survey should be assessed after the report of the 1996 survey is published.
5) If monitoring through the Housing Condition Survey is judged unfeasible, consideration
should be given to gathering site-specific data from pest-control companies.

8/18/2019 BTO Research Report No.223 - Developing a Mammal Monitoring Programme for the UK
http://slidepdf.com/reader/full/bto-research-report-no223-developing-a-mammal-monitoring-programme-for-the 151/316
BTO Research Report No. 223July 1999
149
13. SHIP RAT Rattus rattus
Introduced. Established populations in Britain and Ireland reduced to a few on islands (Lundy,
Shiants, Forth Islands) and one on the mainland (Tilbury); sporadic occurrences in ports (from
ships) and supermarkets (from lorries).
(Note that there seems to be no published reference to the occurrence of Ship Rats on the Forth
islands but Mr William Penrice of Fife Nature has told us that a specimen from Inchcolm was
supplied by a rodent controller in 1998; there is a local belief that the species has been present on
the island for some years, perhaps alongside Brown Rats as on Lundy; there are also suspicions
that Ship Rats may be established on Inchmickery and Inchkeith)
13.1 RECENT AND ONGOING MONITORING WORK
We understand the Port of London Authority have good records for its area.
Both the Lundy and Shiants populations are the subject of sporadic investigation by universityand similar groups (Smith et al. 1993; Key et al. 1998).
Dr Graham Twigg has surveyed Ship Rat distribution by questionnaire (Twigg 1992) and
continues to collate reports of the species.
Fife Nature intend more fully assessing the species’ status on the Forth islands.
13.2 MONITORING OBJECTIVES
We suggest that the national priority for this introduced species of limited distribution should be
to monitor its range. Should it be considered appropriate either to eliminate the island
populations or to take steps to maintain them, then appropriate local monitoring should be
undertaken.
13.3 POTENTIAL MONITORING TECHNIQUES
Live-trapping - Trapping (with or without mark and recapture studies) is an effective way of
monitoring Ship Rats.
Field signs (fur smears and droppings) - Field signs can be distinguished from those of Brown
Rats with experience.
Questionnaire surveys of pest control companies, local authorities, environmental and public
health authorities and port authorities can provide some evidence of occurrence and infestation
rates but there may be problems of distinguishing the two species of rat. Twigg (1992) was able
to get useful information on the changing fortunes of Ship Rats in the UK from such a survey,
though he attempted to gather records going back over three decades, with the result that the data
for earlier years were sparser because of the passage of time.

8/18/2019 BTO Research Report No.223 - Developing a Mammal Monitoring Programme for the UK
http://slidepdf.com/reader/full/bto-research-report-no223-developing-a-mammal-monitoring-programme-for-the 152/316
BTO Research Report No. 223July 1999
150
13.4 POTENTIAL MONITORING SCHEMES
A. Island populations
Since these are isolated and of little relevance to the country as a whole, these populations
can be treated as independent units.
MMR recommend standardised live-trapping for these populations but the monitoring that
should be undertaken depends on the view that is taken of the way in which they should be
managed and, thus, on the strategic conservation objectives for these populations. Broadly
speaking, the possibilities are:
1. Letting nature take its course
In this case, monitoring is unnecessary. We would recommend, however, that the statutory
agencies collate information on these populations as it becomes available.
Resource requirement: a few hours per year on top of the time input of those providing the
information.
2. Eliminating the populations
This is feasible. Success could be determined on the Shiants by using the standard technique
of bait sticks; on Lundy, where Brown Rats are also present, this would need to be
supplemented by sign surveys or trapping if one wished to know whether Ship Rats had been
eliminated even though Brown Rats had not. Similar methods could be used on the Forth
islands.
Resource requirement: difficult to estimate; the monitoring of success would be an integral
part of the control programmes.
3. Maintaining the populations
On Lundy, the population could be readily indexed by using a systematic programme of live-
trapping, since there is a reserve warden on the island in whose duties such work could be
incorporated. It would probably be useful to trap in late winter (when natural food is scarce,
so that trapping rates will be enhanced, but numbers are likely to be low) and in late autumn
(when numbers will be high but variable, depending on breeding success).
On the Shiants, which are difficult of access, standardised live-trapping (i.e. at the same time
of year and in exactly the same sites) could provide useful data. A less-standardised
programme of trapping would be much less cost-effective. Given the cost of getting peopleonto these islands, it may be preferable to undertake a major trapping programme every few
years rather than to undertake a smaller programme annually, despite the likelihood of
considerable annual fluctuations in numbers.
Rats are routinely trapped on at least some of the Forth islands. It would be possible, in
principle, to collate data on numbers trapped and trapping effort; if Brown Rats prove also to
be present, there might be identification problems.

8/18/2019 BTO Research Report No.223 - Developing a Mammal Monitoring Programme for the UK
http://slidepdf.com/reader/full/bto-research-report-no223-developing-a-mammal-monitoring-programme-for-the 153/316
BTO Research Report No. 223July 1999
151
B. Mainland populations It may be possible to get useful information on Ship Rats at the same time as monitoring
Brown Rats and House Mice. If such monitoring is not undertaken, or if gathering
information on Ship Rats is considered too specialised to be included in the monitoring of
these common species, then we suggest that a quinquennial questionnaire survey should be
conducted of: the area offices of major pest control companies, local authorities,environmental and public health authorities, and port authorities. MMR recommend annual
questionnaire surveys but, given that the majority of Ship Rat reports apply to occasional
individuals or to ephemeral populations we believe that this is unnecessary. Such frequent
surveys, for which the majority of responses were negative could alienate potential
respondents.
13.5 RECOMMENDATIONS
1) Monitoring of island populations should depend on a clear decision being reached as to
the strategy conservation objectives for these populations (see above).
2) Mainland populations should be monitored through quinquennial questionnaire
surveys.

8/18/2019 BTO Research Report No.223 - Developing a Mammal Monitoring Programme for the UK
http://slidepdf.com/reader/full/bto-research-report-no223-developing-a-mammal-monitoring-programme-for-the 154/316
BTO Research Report No. 223July 1999
152

8/18/2019 BTO Research Report No.223 - Developing a Mammal Monitoring Programme for the UK
http://slidepdf.com/reader/full/bto-research-report-no223-developing-a-mammal-monitoring-programme-for-the 155/316
BTO Research Report No. 223July 1999
153
14. COMMON DORMOUSE Muscardinus avell anarius
The Common Dormouse population has undergone a pronounced reduction in range and
abundance this century. Populations are threatened by loss and fragmentation of suitable
habitats, and by the inability to respond quickly to environmental change.
14.1 RECENT AND ONGOING MONITORING WORK
Mammal Society Dormouse Survey (1975-1979) - The Dormouse survey was initiated by The
Mammal Society in January 1975 and ran until April 1979 (Hurrell & McIntosh 1984). Details
of the survey were circulated with record forms to all known natural history societies, county
naturalists' trusts and museums in England, Wales and Scotland. Some of the areas from which
relatively few responses were received were examined in greater detail through field visits.
Four-hundred and seventy-four completed record sheets were received, allowing distribution to
be determined. No information was available on the abundance of the species within its
established range.
Mammal Society Dormouse Survey (1993-1994) - Termed the 'Great Nut Hunt' a national
distribution survey was undertaken as part of an exercise to raise the public awareness of
Dormouse conservation issues. Approximately 11,000 survey packs were distributed to schools,
naturalists and the general public resulting in the return of 1,878 report forms. A total of 13,171
nuts were sent in for confirmation that they had been opened by Dormice, as recorded by the
observers (Bright et al. 1996a). However, only 1,352 (10.3%) of these had been opened by
Dormice, the majority (63%) having been opened by squirrels. This was possibly the result of
the survey packs having been distributed to too wide an audience. Three-hundred and thirty-four
individual Dormice sites were identified from the submission of nuts opened by Dormice. Some
attempt was made to quantify the relative abundance of the species across the country on the
basis of the submissions received, but the resulting measures may be unreliable because there
was no indication of how search effort varied between observers.
General agreement between the two Mammal Society surveys, along with that from work in
Wales (Bright 1995), appears to confirm the contraction in range of this species, although it fails
to provide data allowing changes in abundance to be properly assessed.
National Dormouse Monitoring Scheme - This scheme collates data from 'Key Sites' within the
known range of the species. It aims to gather long-term data on an annual basis, providing
information on annual variation in breeding success and population density across habitats and
regions. Those participating in the scheme do so on a voluntary basis and receive feedback in theform of an annual newsletter. Typically, three or four observers cover each of the 70 or so
monitoring sites, with the observers coming from a general mammal background.
14.2 MONITORING OBJECTIVES
The Common Dormouse was included in the review of scheduled species (Whitten 1990) and the
UK Biodiversity Steering Group Report (Anon 1995), and is the subject of a Species Action Plan
prepared by English Nature. Action Plan objectives laid down by Bright et al. (1996b) contain
recommendations for future monitoring of this species, namely:
8/18/2019 BTO Research Report No.223 - Developing a Mammal Monitoring Programme for the UK
http://slidepdf.com/reader/full/bto-research-report-no223-developing-a-mammal-monitoring-programme-for-the 156/316
BTO Research Report No. 223July 1999
154
(a) 'Collation of data from the National Dormouse Monitoring Scheme, its analysis and
dissemination. The purpose is to study long-term effects of habitat change on population density
and breeding success, and also climatic effects on yearly and geographical variation in
population size and viability. More sites and observers should be recruited into the monitoring
scheme. The target should be to maintain surveillance of Key Sites in at least 25 counties,
recruiting at least three new sites per year until the year 2000 and beyond. '
(b) ' Periodically (every 5-10 years), a survey should be undertaken of sites where dormice have
been recorded in the past (using The Mammal Society Survey site list and the Great Nut Hunt of
1993 as the baseline data). [The next 'Great Nut Hunt' is planned for 2001]. The purpose will be
to establish the rate at which sites are being lost and to ensure that widespread extinctions do
not occur unnoticed.'
Bright & Morris (1996) note that the Dormouse is likely to be ' .. a very sensitive indicator
species for monitoring future changing environments and an excellent model for studying the
effects of habitat fragmentation, climatic shifts and climatic stochasticity'. To achieve these
aims, and those mentioned above, annual monitoring of Key Sites should be a priority, coupledwith an examination of Dormouse abundance within hedgerow habitats and periodic national
surveys of distribution.
14.3 POTENTIAL MONITORING TECHNIQUES
Live-trapping - Dormice can be trapped in purpose-built wire-mesh traps (Morris & Whitbread
1986). These should be baited with apple, contain a nestbox (typically a clean milk carton) filled
with hay and be positioned between 1 and 4m above the ground, set against trunks or in suitable
cover. MMR recommended that a grid of 7x7 traps is positioned with a 15m trap spacing. Traps
should be run over a five-day trapping period and checked twice daily. Capture rates are low and
the method is very labour intensive.
Hair-tubes - Hair-tubes can be used to record the presence of Dormice in an area and provide a
simple measure of activity. Tubes should be 3-4cm in diameter, contain sticky tape on the upper
surface, be baited with jam or peanut butter and fixed at 1-3.5m height to the trees. The best
arrangement of tape within the tube is subject to some debate. Bright et al. (1996b) recommend
tape be placed across two openings cut across the roof of the tube, while Jordan (pers. comm.)
recommends (for general hair-tube use across species) that tape be placed length-ways along the
tube roof. Correct identification of Dormouse hairs requires expert knowledge or formal training
and access to a microscope.
Field signs - The way in which hazelnuts are opened by the Common Dormouse is characteristic
and apparently relatively straightforward to identify, although it should be noted that many of the
respondents to the 'Great Nut Hunt' failed to separate correctly squirrel- and dormouse-opened
nuts (Bright & Morris 1989; Bright et al. 1996b). Five 10x10m quadrats placed within suitable
habitat should be searched for 20 minutes each (Bright et al . 1994). If no positive nuts are found
then it is likely that the species is absent from the site. Searches should be undertaken from
about mid-September to the end of December. This approach cannot be applied to Dormouse
populations utilising hedgerow habitats. However, work is planned to examine the relationship
between Dormouse abundance and hedgerow characteristics at 60 sites in England and Wales
(Paul Bright, pers. comm.).

8/18/2019 BTO Research Report No.223 - Developing a Mammal Monitoring Programme for the UK
http://slidepdf.com/reader/full/bto-research-report-no223-developing-a-mammal-monitoring-programme-for-the 157/316
BTO Research Report No. 223July 1999
155
Summer Dormouse nests are characteristic when freshly constructed, having tightly woven
material (typically strips of Honeysuckle) bound together with leaves (Hurrell & McIntosh
1984). Nests are usually spherical, lacking any obvious entrance hole and are grapefruit-sized
(Bright et al. 1996b). The lack of an obvious entrance hole distinguishes them from the nests of
Wren Troglodytes troglodytes and Harvest Mouse.
Nestboxes - From the work of Paul Bright it is clear that nestboxes can provide an important tool
for monitoring Dormouse numbers and breeding success (Morris et al. 1990). A description of
suitable nestbox designs is provided by Bright et al. (1996b). Inspection of nestboxes under
licence should be carried out at least twice a year (mid-June and mid-October), although more
regular checks will provide greater detail.
Nestboxes erected for other species, notably Pied Flycatchers Ficedula hypoleuca, may
occasionally contain Dormice. The number of boxes occupied each year could provide a basic
index of the species at sites where nestbox schemes are regularly monitored. This is currently
being evaluated by Aidan Marsh primarily with regard to Yellow-necked Mouse use of bird
boxes (Aidan Marsh, pers. comm.).
14.4 POTENTIAL MONITORING SCHEMES
National Dormouse Monitoring Scheme - The present National Dormouse Monitoring Scheme,
with its emphasis on 'Key Sites' and periodic national surveys, already provides data of the type
required for the successful monitoring of this species. The monitoring network has grown
steadily since the mid-1980s and with continuing efforts to expand the number of sites covered
annually (and the range of habitats), no alternative monitoring scheme would appear necessary.
Work should continue to evaluate the success of the translocation programme (Bright & Morris
1993, 1994) and other aspects of Dormouse conservation (Bright et al. 1994): e.g. Morris (1993)
stresses the need to establish what constitutes a minimum viable population for this species.
Additional funding may be required to extend the range of habitats and regions covered further.
14.5 RECOMMENDATIONS
1) The current National Dormouse Monitoring Scheme already provides suitable data for
monitoring this species. The scheme could be expanded through additional funding to
cover sites in a number of other habitats and regions.
2) Ancillary data would be available on distribution from the proposed Mammals on
Nature Reserves scheme (Part III.B.6).

8/18/2019 BTO Research Report No.223 - Developing a Mammal Monitoring Programme for the UK
http://slidepdf.com/reader/full/bto-research-report-no223-developing-a-mammal-monitoring-programme-for-the 158/316
BTO Research Report No. 223July 1999
156

8/18/2019 BTO Research Report No.223 - Developing a Mammal Monitoring Programme for the UK
http://slidepdf.com/reader/full/bto-research-report-no223-developing-a-mammal-monitoring-programme-for-the 159/316
BTO Research Report No. 223July 1999
157
15. FAT DORMOUSE Glis gli s
Introduced into Tring Park, Hertfordshire in 1902. The population has steadily expanded its
range since that time and now occupies a triangle of 260km2 delimited by Beaconsfield,
Aylesbury and Luton where it is locally numerous (Thompson & Platt 1964; Hoodless & Morris
1993; Morris 1997).
15.1 RECENT AND ONGOING MONITORING
In addition to the collation of sightings on an ad hoc basis:
DETR - Licences are required under the Wildlife and Countryside Act for the purposes of
trapping Glis. Pest Control companies operating under such licences are required by law to
submit details of where (and how many) animals are caught when carrying out pest control
operations. This data could be made available for monitoring purposes, although some of the
detail may be withheld (Kevin Rye (DETR), pers. comm.).
Study by Pat Morris and Paul Bright - Ongoing work is being carried out in a wood within the
core range of Glis examining basic ecology and survival rates. One-hundred and thirty
nestboxes, with additional nesting tubes (converted tree guards), have been positioned along lines
in 20 hectares of woodland to allow sampling of different woodland compartments. Monthly
visits are made between May and November and individuals caught are marked with implanted
chips, allowing the application of CMR. To date over 170 individuals have been marked with
tags, with others previously having been marked with ear tattoos. This information is being used
to determine survival rates and additional information is available on productivity and
recruitment.
15.2 MONITORING OBJECTIVES
Any expansion in range would be a cause for concern, especially given the potential damage that
this species can cause to forestry and domestic properties. Although the population has yet to
spread much further afield, this may simply be the result of it not yet having saturated the already
colonised area (Lever 1994) and of difficulties in moving across areas of unsuitable habitat.
Assessment of current distribution and some basic information on densities within the occupied
range should be considered a priority. It is established that some individuals removed from
properties have been released at some distance and this may have contributed to the expansion in
range of this species.
15.3 POTENTIAL MONITORING TECHNIQUES
Line-transects - In early summer Fat Dormice are particularly vocal, emitting raucous chirring
vocalisations soon after emergence at dusk. Transects can be walked at this time and the number
of Glis heard can recorded (Pat Morris, pers. comm.) using a distance sampling approach. This
approach was used by Hoodless & Morris (1993) to estimate population density, with 550m
transects each walked a total of nine times between the hours of 2130 and 0100hrs over four
separate nights. Transects should be walked on still nights to reduce the interference caused by
background noise.
8/18/2019 BTO Research Report No.223 - Developing a Mammal Monitoring Programme for the UK
http://slidepdf.com/reader/full/bto-research-report-no223-developing-a-mammal-monitoring-programme-for-the 160/316

8/18/2019 BTO Research Report No.223 - Developing a Mammal Monitoring Programme for the UK
http://slidepdf.com/reader/full/bto-research-report-no223-developing-a-mammal-monitoring-programme-for-the 161/316
BTO Research Report No. 223July 1999
159
15.5 RECOMMENDATIONS
The current monitoring work being carried out by Pat Morris should be formalised
through the provision of specific funding, allowing extension of the scheme into a small
number of other sites. This would provide sufficient detail to monitor population changes
of 25% over 25 years through CMR techniques. Additionally it would provide importantinformation on productivity and basic ecology, both of importance if the potential future
control of the Glis population is to be effective.

8/18/2019 BTO Research Report No.223 - Developing a Mammal Monitoring Programme for the UK
http://slidepdf.com/reader/full/bto-research-report-no223-developing-a-mammal-monitoring-programme-for-the 162/316
BTO Research Report No. 223July 1999
160

8/18/2019 BTO Research Report No.223 - Developing a Mammal Monitoring Programme for the UK
http://slidepdf.com/reader/full/bto-research-report-no223-developing-a-mammal-monitoring-programme-for-the 163/316
BTO Research Report No. 223July 1999
161
16. OTHER SMALL MAMMAL SPECIES
(Common Shrew Sorex araneus , Pygmy Shrew Sorex minutus , Water Shrew Neomys
fodiens , Bank VoleClethr ionomys glareolus , Field VoleMicrotus agrestis and Wood Mouse
Apodemus sylvati cus .)
The remaining small mammal species have a wider distribution and broader habitat requirementsthan species such as Yellow-necked Mouse and Harvest Mouse. Consequently they present
particular difficulties with regard to monitoring. For this reason they have been grouped together
and the structure of this section has been adapted accordingly to allow examination of the
problems associated with monitoring these species and any potential monitoring strategy. For
the purposes of explaining some of the difficulties in working with this group the Wood Mouse is
used as an example. Specific problems associated with the other species are readily available
within the wide-ranging literature on small mammals.
16.1 MONITORING OBJECTIVES
Small mammals are an important component of our mammal community. Some species are ofeconomic importance (Wood Mouse), others of limited distribution or conservation interest
(Water Shrew, Harvest Mouse) and all are important as prey species for some of our scarcer
carnivores and predatory bird species. There is evidence of a widespread decline for species like
Field Vole, Water Shrew and Harvest Mouse, with Action plans having been drawn up for some
species (Churchfield 1997). Monitoring should be directed towards establishing long-term trends
in abundance across a range of habitats.
16.2 DIFFICULTIES WITH THIS GROUP
Scale - The main difficulty in developing a suitable monitoring strategy for this group is one of
scale. Most of these species will use a range of habitat types and all are widely distributed within
Great Britain, although within habitats they often exhibit very clear microhabitat preferences. In
the case of the Field Vole, the species can be found in unimproved grasslands, roadside verges,
young conifer plantations and (at lower population densities) in woodland. In these habitats it
shows a preference for areas with a lush growth of soft grasses, a high basal density to the sward
and well-developed tussock structure (Ferns 1976, 1979).
The Wood Mouse is more of a habitat generalist, occurring in most habitats: woodland
(Flowerdew 1985; Montgomery 1989), arable land (Rogers & Gorman 1995), sand dunes
(Deshmukh & Cotton 1970), hedgerows and urban areas. The widespread occurrence of this
species, coupled with its abundance, makes monitoring on the basis of simple presence/absencequite impractical. The only alternative is to look at abundance. However, this also presents
problems in that there are various biases associated with the application of
Capture-Mark-Recapture (CMR) methods and difficulties in selecting a sample of sites that
represents the wider habitat use of the various species.
Trapping at a small number of sites (say 30 woodland sites) is unlikely to provide a realistic
picture of what is happening to the Wood Mouse population at the national level. The abundance
of the species at each site will depend on both the habitat type and the microhabitat features
present on the trapping grid. This will lead to a high degree of variation between sites, as sites
differ in age, food availability, the proximity of source/sink populations, etc. The only way to
overcome the effects of this between-site variation (site-effect) is to sample at a large number of
sites, across all utilised habitats. This may greatly increase the number of samples that need to be
8/18/2019 BTO Research Report No.223 - Developing a Mammal Monitoring Programme for the UK
http://slidepdf.com/reader/full/bto-research-report-no223-developing-a-mammal-monitoring-programme-for-the 164/316
BTO Research Report No. 223July 1999
162
taken in order to obtain a suitably precise measure of the underlying trend (year effect). Mallorie
& Flowerdew (1994) examined data from a series of 13 study sites in deciduous woodland
employing standardised trapping in an attempt to determine whether there was synchrony
between populations. Analysis of variance of the effects of trapping sites and year on loge
numbers of Wood Mice and Bank Voles showed both significant year and site effects, suggesting
that it is possible to get at year effects, at least in similar woodland habitats, with this number ofsamples. However, the synchrony found by Mallorie & Flowerdew (1994) appears to be related
to masting events (Flowerdew 1973) and similar synchrony is less-likely to occur in
non-woodland habitats. It should be noted that synchrony has also been demonstrated in other
woodland/forest habitats (Shanker & Sukmar 1999) This is further complicated by the influence
of source/sink dynamics.
Number of samples requi red - To build up an accurate picture of what is happening to Wood
Mouse populations at the national level it is important to sample a representative suite of habitats
within which the species is known to occur. For a large species of mammal or bird the size of the
sample unit (e.g. tetrad, 1km square) is typically large enough to ensure that a representative
sample of available habitats can be covered within a reasonable number of units, enabling anational estimate to be produced - i.e. the sample is representative of the wider countryside
(Toms et al . 1998). With small mammals, the sample unit is much smaller, typically a grid of
less than a hectare in size. A larger number of these units would then need to be covered if they
are to be representative of the wider countryside. In the case of a small mammal showing a
restricted distribution (e.g. Dormouse, Harvest Mouse) this may be possible in that the species
has specific habitat requirements, but for a habitat generalist like the Wood Mouse this is more
difficult to achieve. The number of samples required may be prohibitively expensive in terms of
the man hours required and the capital costs involved (see worked examples).
Biases relati ng to the trapping of small mammals - The biases associated with trapping small
mammals and the CMR method have been well covered by MMR. Typically, such biases result
from the number of traps used per trap point (Andrzejewski et al . 1966; Gurnell 1976), trap
position, length of the trapping period (Andrzejewski & Glogowska 1962), weather (Vickery &
Bider 1981), trap odour (Tew 1987) and density of the population under study (Janion &
Wierzbowska 1970). In addition to those biases applicable across habitats, there will be other
biases specific to individual habitats. Biases associated with small mammal trapping and the use
of traps are reviewed by Flowerdew (1976) and Twigg (1975) respectively. The timing of
sampling is another important factor due to (i) regular annual cycles witnessed in most small
mammal populations (Stenseth et al . 1977; Anglestam et al . 1984; Flowerdew 1985) and (ii)
multi-annual cycles witnessed in some species (Henttonen et al. 1989; Hanski et al. 1993).
Biases relating to habitat - There are two components to habitat-related biases; firstly, those
resulting from differences in the dynamics of the study species in different habitats and,
secondly, those relating to differences in trap efficiency in different habitats, mediated through
the biases outlined in the previous section. Wood Mice populations in different habitats may
behave differently, often as a result of source/sink dynamics and habitat preferences. If such
biases influence the number of small mammals caught by trapping, and hence the estimate of
abundance, then comparisons between habitats become less meaningful. This might suggest that
trapping in different habitats should take place with the data from each habitat used
independently to monitor population change. If there is evidence of synchrony between a population sampled in woodland and a population sampled in grassland then this may be taken as
evidence of a real population change. However, it is more likely that source/sink dynamics may
8/18/2019 BTO Research Report No.223 - Developing a Mammal Monitoring Programme for the UK
http://slidepdf.com/reader/full/bto-research-report-no223-developing-a-mammal-monitoring-programme-for-the 165/316
BTO Research Report No. 223July 1999
163
result in one population remaining stable while the other decreases, making the true pattern of
population change more difficult to detect.
16.3 AVAILABLE METHODS
Snap-trapping - Snap or break-back traps kill the small mammals being sampled and carefulconsideration should be given as to the value and ethics of using them for monitoring purposes.
Such traps should always be set undercover and ideally only operated at night to reduce the risk
to non-target species. They are considerably cheaper than live-capture traps. Snap-traps have
been widely used in the surveillance of small mammal abundance in Scandinavia (Myllymaki et
al. 1977) through the application of the Small Quadrat Method (SQM).
Live-trapping - Live-trapping methods have been reviewed by Twigg (1975), Flowerdew
(1976), Tapper (1976) and Gurnell & Flowerdew (1982). Traps can be arranged in grids or lines,
the latter being of less value to most small mammal work, but allowing relative changes in catch
to be measured and being simpler to operate. A grid approach would ideally involve 49 trap
points with two traps per point and an interval of between 5-15m between trap points dependingon the target species. Recent work on Yellow-necked Mice by The Mammal Society has
employed a reduced grid of two lines of ten trap points with two traps per point. The length of
the trapping period should be long enough to catch an adequate sample, but not so long as to
introduce bias as assumptions about a closed population begin to break down. Field Voles
require a period of 3-4 days prebaiting before the trapping is carried out (Toms, in prep.),
although this is less important for other species. The choice of trap is also important with some
considerably less effective than others (Toms, in prep., but see Lambin & Mackinnon, 1997). It
is important that, for monitoring purposes, a single trap design should be employed, with no
mixing of designs between sites. Similarly, the spacing and arrangement of traps used should
also be held constant.
Hair tubes - Hair tubes have been successfully applied to the study of some small mammal
species (e.g. Water Shrew, Mike Jordan; Harvest Mouse, Martin Perrow), although some species
cannot be separated through this approach. An additional problem is that the perceived
'abundance' of a species derived from the use of hair tubes, will contain an activity component in
addition to the abundance component. Whilst this also occurs when live-trapping, the effect with
hair tubes is likely to be more significant. There is some evidence that, at least for Harvest Mice,
there is a correlation between hair tube indices and those derived from live-trapping.
Field signs - Sign-indices have been derived for the examination of Field Vole populations
(Hansson 1979; Village & Myhill 1990). Hansson (1979) found that grazing intensity and to alesser extent, runways and faeces piles, correlated well with trap catches of Microtus agrestis on
abandoned fields throughout the year. In forest habitats similar correlations were found between
field signs and trap catches of Clethrionomys glareolus. Under some circumstances the faeces of
these two species can be difficult to separate. Village & Myhill (1990) derived an index based
on field signs for Microtus agrestis which enabled large differences in population size to be
determined (but not necessarily smaller changes). Tapper (1976) used the number of active
runways as a measure of abundance, although he also demonstrated this to vary seasonally.
8/18/2019 BTO Research Report No.223 - Developing a Mammal Monitoring Programme for the UK
http://slidepdf.com/reader/full/bto-research-report-no223-developing-a-mammal-monitoring-programme-for-the 166/316
BTO Research Report No. 223July 1999
164
The droppings of Neomys fodiens can be distinguished from other shrews (in most cases) because
they contain aquatic invertebrate remains and it is possible to collect these droppings from baited
feeding tubes or dropping boards at bait stations (Abyes & Sargent 1997). This approach has
been used in a national pilot survey examining the habitat preferences of the species (Greenwood
1998). It should be noted that the diet of those Water Shrew populations established away from
water may not contain the diagnostic remains of aquatic invertebrates (Churchfield 1990),making this component of the national population more difficult to monitor effectively. Stephen
Harris (pers. comm.) feels that this component of the population is likely to be transitory in
nature, reducing the importance for its direct monitoring.
Pellet remains - The identifiable remains of small mammals found in the pellets of owls may
allow changes in small mammal populations over time to be investigated. There are two
potential problems with this approach. First, individual owls are not likely to hunt in a random
fashion, i.e. they do not take small mammal prey in relation to their availability (Yom-Tov &
Wool 1997). This means that the proportions of different prey recovered from pellets are not
representative of the proportions of those same prey in the wider countryside (although see Glue
1970). Individual owls may select prey on the basis of its profitability, either directly or throughsome selection of the habitat over which they choose to hunt. Therefore, this problem relates to
how representative the data are of small mammal populations in the wider countryside.
A second problem is that the prey species selected by an owl may change over time; either as a
result of a changing prey availability (the target of monitoring) or because of changes in the
habitats selected by the owls for hunting. Changes in those habitats selected for hunting may
result from changing prey availability, or as a consequence of changes in the owl population
itself. At high population densities a component of the owl population may be forced to hunt
over sub-optimal habitats, taking a different range of prey species to those occurring in optimal
hunting habitats. At low population densities all hunting may take place over optimal habitat, so
changes in the proportions of individual small mammal species in owl pellets may result from
either (1) real changes in the occurrence of small mammals or (2) changes in the habitats hunted
by owls due to the population size of the owls themselves.
Even if individual owls (or owls depositing pellets at individual sites) do not take prey directly in
relation to their availability, it may be possible to build up a general picture of large scale trends
in small mammal populations by analysing pellet samples from a large number of sites and from
different predator species. For example, regular analysis of pellets from Kestrels Falco
tinnunculus, Little Owls Athene noctua, Long-eared Owls Asio otus and Barn Owls Tyto alba
may all point towards a decline in the proportion of Common Shrews being taken, thus providing
some evidence that something has happened to either the Common Shrew population or populations of the other small mammal species occurring in the diets of these three species. The
potential of this approach has been highlighted by a recent study examining Barn Owl diet in the
UK (Love et al ., in press), a follow up to the previous national study (Glue 1974), which together
show a shift in the proportion of Common and Pygmy Shrews being taken. This may indicate a
genuine change in the populations levels of these two species or a shift in the habitats over which
Barn Owls are hunting. Either way it is indicative of something happening and as such may
provide support to some other monitoring approach to small mammals.

8/18/2019 BTO Research Report No.223 - Developing a Mammal Monitoring Programme for the UK
http://slidepdf.com/reader/full/bto-research-report-no223-developing-a-mammal-monitoring-programme-for-the 167/316
BTO Research Report No. 223July 1999
165
16.4 DEVELOPMENT AND VALIDATION STUDIES
A full protocol should be developed following more detailed discussions and pilot fieldwork,
although there are several points that are worth raising here.
1) A period of three days prebait is required when trapping Field Voles (Toms, in prep .).
2) Shrew captures require that traps are visited at least twice a day, increasing to every six hours
in extreme weather.
3) All small mammal populations show pronounced annual fluctuations usually resulting in a
population peak during late autumn. Trapping should therefore be carried out twice a year (late
spring and late autumn) to produce a measure of abundance of value to monitoring.
4) Many small mammal species show pronounced inter-annual fluctuations, with some cyclicity
recorded for populations in some habitats.
5) Cyclic behaviour, activity, trap response, population density, etc., all vary between habitats
and, with the influence of source-sink dynamics, a large number of sites across a range of
habitats need to be covered.
16.5 RECOMMENDATIONS
1) Monitoring of Common Shrew, Pygmy Shrew, Water Shrew, Bank Vole, Field Vole and
Wood Mouse should be undertaken as a pilot scheme at a small number of sites using
live-trapping and a network of volunteers, co-ordinated by a single professional. The
scheme should be evaluated after five years and, if found to be practical, expanded to a
level where the power for detection is acceptable for monitoring purposes. We cannot say
for certain just how many sites would be required for this purpose, but this is something
that could be examined by running simulations from the data collected by Mallorie &
Flowerdew (1994). The trapping protocol will need to be determined, but could involve
volunteers setting traps for prebait on day 1 (Wednesday), setting for capture on day 3
(Friday evening) and trapping on days 4 and 5 (Saturday and Sunday, taking the grid up
on the Sunday).
2) Ancillary data should be gathered through the analysis of predator pellets (Barn Owl,
Tawny Owl, Little Owl, Long-eared Owl and Kestrel) collected from as many sites as
possible.
3) Pilot studies using hair tubes and field signs should be evaluated in parallel to the
live-trapping work in order to determine whether either of these approaches could have a
monitoring role.
16.6 MONITORING COSTS
The costs of implementing a monitoring programme based on live-trapping at a sufficient
number of sites to provide the required power of detection are outlined below. These are very
rough figures designed to give an impression of what is involved rather than to specify particular

8/18/2019 BTO Research Report No.223 - Developing a Mammal Monitoring Programme for the UK
http://slidepdf.com/reader/full/bto-research-report-no223-developing-a-mammal-monitoring-programme-for-the 168/316
BTO Research Report No. 223July 1999
166
sample sizes. The sample sizes required would need to be evaluated through a review process
and possible modelling of existing datasets, notably that stemming from Mallorie & Flowerdew
(1994).
EXAMPLE ONE - Allowing a period of pre-bait and three days trapping -
PROFESSIONAL FIELDWORKERS
ASSUMING - (i) a grid of 49 trap points with two traps per point, with a period of three
days prebait, three days trapping and one day for change over, would allow one trained
fieldworker per grid.
(ii) two trapping periods a year (one in April and one in September) with each trapping
period lasts six weeks, would allow one set of traps to be used at six sites during each
trapping period.
(iii) one fieldworker can only operate one grid at a time to allow for the likely distance
between sites and the time taken each morning and evening to remove trapped animals,mark and release them.
Based on these assumptions, a single, fully committed fieldworker could cover six different sites
during the six-week sampling period. The six-week sampling window is required to ensure that
different sites are sampled at a similar time to each other thus reducing seasonal bias. This
would mean that:
(i) a sample of 50 sites would take 350 working days per trapping period (700 per year) and
require nine fieldworkers using 882 traps (£26,460 for traps).
(ii) a sample of 100 sites would take 700 working days per trapping period (1,400 per year) and
require 17 fieldworkers using 1,666 traps (£49,980 for traps).
(iii) a sample of 500 sites would take 3,500 working days per trapping period (7,000 per year)
and require 84 fieldworkers using 8,232 traps (£246,960 for traps).
These calculations assume that fieldworkers would be fully committed during the six week
period. This would almost certainly rule out volunteer involvement, although a different
approach could be adopted to involve volunteers.
EXAMPLE TWO - no period of prebait and two days of trapping. VOLUNTEERFIELDWORKERS
ASSUMING - (i) two rows of 10 trap points with two traps per point, with the traps set on a
Friday night and checked twice on the two following days. Allowing one trained
fieldworker per grid.
(ii) two trapping periods a year (one in April and one in September) with each trapping
period lasts six weeks, would allow one set of traps to be used at six sites during each
trapping period.

8/18/2019 BTO Research Report No.223 - Developing a Mammal Monitoring Programme for the UK
http://slidepdf.com/reader/full/bto-research-report-no223-developing-a-mammal-monitoring-programme-for-the 169/316
BTO Research Report No. 223July 1999
167
(iii) one fieldworker can only operate one grid at a time to allow for the likely distance
between sites and the time taken each morning and evening to remove trapped animals,
mark and release them. Traps would be passed to the fieldworker covering the next site
during the intervening days.
Based on these assumptions, six different sites could be covered during the six-week sampling period. The six-week sampling window is required to ensure that different sites are sampled at a
similar time to each other thus reducing seasonal bias. This would mean that:
(i) a sample of 50 sites would take 125 working days per trapping period (250 per year) and
require a maximum of 50 fieldworkers assuming one fieldworker per site, using nine sets of traps
(882 traps) (£26,460 for traps).
(ii) a sample of 100 sites would take 250 working days per trapping period (500 per year) and
require a maximum of 100 fieldworkers assuming one fieldworker per site, using 17 sets of traps
(1,666 traps) (£49,980 for traps).
(iii) a sample of 500 sites would take 1,250 working days per trapping period (2,500 per year)
and require a maximum of 500 fieldworkers assuming one fieldworker per site, using 83 sets of
traps (8,232 traps) (£246,960 for traps).
Other alternatives could be considered, varying the number of traps used, the number of sites to
be covered, the inclusion of a period of prebait as part of the volunteer approach and the length of
the trapping period.
16.7 RECOMMENDATIONS
1) Development of suitable monitoring methods for Common Shrew, Pygmy Shrew, Water
Shrew, Bank Vole, Field Vole and Wood Mouse should form part of a specific study.
Attention should be given to the value of live-trapping, pellet analysis, field signs and the
use of hair tubes. Of these, only live-trapping will allow monitoring of all these species at
the same time: field signs cannot be used for the two Sorex spp. or Apodemus , hair tubes
likewise, and pellet analysis is best suited for determining broad changes in commonly
taken prey species.
2) Volunteer involvement is likely to form the basis for long-term monitoring of these small
mammal species, but only with the support of a number of professional co-ordinators, a
ready supply of traps and good logistical support.

8/18/2019 BTO Research Report No.223 - Developing a Mammal Monitoring Programme for the UK
http://slidepdf.com/reader/full/bto-research-report-no223-developing-a-mammal-monitoring-programme-for-the 170/316
BTO Research Report No. 223July 1999
168
8/18/2019 BTO Research Report No.223 - Developing a Mammal Monitoring Programme for the UK
http://slidepdf.com/reader/full/bto-research-report-no223-developing-a-mammal-monitoring-programme-for-the 171/316
BTO Research Report No. 223July 1999
169
17. RED FOX Vulpes vulpes
Native; common and widespread in Britain and Ireland but absent from most small islands;
population may be increasing, especially in urban areas.
17.1 RECENT AND ONGOING MONITORING
Game Conservancy National Game Bag Census - Game Bag records from a sample of
shooting estates throughout the UK dating back to 1961 (with additional historical records).
These data show a continuing, increasing trend which has been interpreted as showing an
increasing population (Reynolds & Tapper 1994). The data are subject to severe biases, however,
and have not been corroborated: sampling methods have changed over time as has the time of
year at which control is typically practised. The sampling method has direct effects on the effort
effectively expended, i.e. the combination of the time spent and the efficiency of the method, but
the timing of control actions has had potentially even more serious effects by changing the
population sampled from resident to dispersing and from older to younger (Reynolds & Tapper
1994). The apparent population increase could therefore be an artefact of changes in the“sampling regime”. Greatly increased inter-annual variation in bag data from recent years
(Reynolds & Tapper 1994) gives further cause for concern.
Long-term monitoring by gamekeepers (The Game Conservancy Trust) - Over sixty
gamekeepers from around the country conduct twice weekly spotlight counts of foxes with,
critically, a measure of survey effort. This is a recently established survey, but is intended to run
in the long term. Cull data are also collected. To an extent dependent on its geographical and
habitat range, this survey could provide an important contribution to the monitoring of rural Red
Fox populations.
Direct distance sampling surveys by spotlight (The Game Conservancy Trust) - A
professional survey to calibrate spotlighting by gamekeepers in four, geographically separated
study areas over the period 1995-1997. The survey, using standardised methods, revealed
consistent differences between regions which corroborate the gamekeepers’ spotlight counts.
The National Fox Survey (The Mammal Society/University of Bristol) - A survey of scat
density and replacement rates in rural areas in February and March, 1998-2001, based on up to
1,000 randomly selected 1km squares (a sample stratified by ITE Landscape Region). The aim is
to collect scats from along all or at least 5km of the linear features found in the square (scats are
then collected centrally for dietary analyses). “Linear features” are defined as hedgerows and
other fence lines, roadside verges, worn footpaths or tracks, woodland edges and the banks ofditches, rivers, lakes and other water features. Estimates of the national population and of
geographical variations in abundance will be made from the results of the survey.
Forestry Commission Kill Records - These records will be geographically limited and may
suffer from a lack of effective measures of effort.
Fox Hunt Kill Records - Hunt kill records will vary in quality from hunt to hunt, but all will be
derived from areas which support high fox populations and which may be managed for them.
Hunting effort will be variable and difficult to quantify, and may not be recorded in any form.
8/18/2019 BTO Research Report No.223 - Developing a Mammal Monitoring Programme for the UK
http://slidepdf.com/reader/full/bto-research-report-no223-developing-a-mammal-monitoring-programme-for-the 172/316
BTO Research Report No. 223July 1999
170
Urban foxes - Stephen Harris and others at the University of Bristol have conducted detailed
studies of the determinants of Red Fox abundance in British towns and cities which have
generated models capable of predicting fox densities in any British conurbation from habitat and
sociological data (Harris 1981; Harris & Rayner 1986a,b,c; Harris & Smith 1987). The survey
work underlying these models was based on counts of litters and made use of the voluntary
participation of schools (Harris 1981; Harris & Rayner 1986a).
17.2 MONITORING OBJECTIVES
The objective may be to measure trends in rural and urban Red Fox populations. Red Fox
populations have intrinsic conservation interest, but monitoring may also be important with a
view to the effects of hunting and control requirements perhaps, and there may be intra-guild
competition issues with respect to Pine Marten. Population information could also feed into
policy development for rabies control.
17.3 POTENTIAL MONITORING TECHNIQUES
Spotlight counts - The eyeshine of foxes is distinctive enough for it to be distinguished from that
of other similarly-sized animals by experienced observers. Spotlight counts along standardised
transects therefore represent a potentially useful survey technique. Counts should be made during
February and March, between 2100 and 0300 hrs on clear nights, to estimate spring breeding
density. Problems with spotlighting are that it is unsuitable for volunteers (it is labour-intensive,
involves unsociable hours and requires considerable training), that counts are likely to
underestimate fox populations because the animals learn to avoid lights under shooting pressure
(so counts are seriously biased according to the intensity of shooting), that habitat access is
severely biased by the need to use motor vehicles and that animals in woodland cannot be seen.
Avoidance of lights due to shooting pressure further mean that counts are biased towards
recording (young) animals which have yet to be shot at. It is also likely that the lights available
for spotlighting will increase in power over time, affecting sampling efficiency (such issues have
been considered with respect to improvements in bat detector technology).
Hunting and Game Bag records - Long time series of historical Game Bag and hunting records
exist and these data are likely to continue to be collected. These data therefore might provide a
valuable historical context for future survey data. However, hunting and bag record data are
subject to important biases which severely limit their potential as a front line monitoring method.
Game Bag data depend critically on the sampling effort, including the type of method (shooting,
trapping or poisoning) and the efficiency of the method, as well as the man-days spent in control
measures; these are rarely recorded. Assumptions must therefore be made about the constancy ofmethods which cannot be tenable in the long term. Bag or hunt records are also likely to be
biased towards area of high fox density, so being unrepresentative of low density areas. These
problems make bag records a poor monitoring tool for foxes. Game Bag data are discussed in
detail in Part III.A.2.
Drive counts - Total populations can also be counted by driving with beaters or dogs. However,
considerable effort is required: in this case, teams of individuals for each survey plot.
Fox hunt counts - Fox hunts could provide data on the numbers of foxes seen during hunting, as
a crude transect-type method. However, hunts will only go where prior intelligence suggests
8/18/2019 BTO Research Report No.223 - Developing a Mammal Monitoring Programme for the UK
http://slidepdf.com/reader/full/bto-research-report-no223-developing-a-mammal-monitoring-programme-for-the 173/316
BTO Research Report No. 223July 1999
171
foxes will be found, so counts are unlikely to track population abundance, among other problems
(see MMR, p. 177).
Mammals on Roads - Fox carcasses are among the more easily identified road-deaths, so road-
death data could give useful background information on distribution. Given measures of search
effort and estimates of traffic density, as postulated for our proposed Mammals on Roads survey(Part III.B.3), information on abundance could also be obtained.
Live-trapping - Foxes can be trapped and tagged, allowing population sizes to be estimated by
CMR. However, trapping is labour-intensive, costly and time-consuming. It is also especially
difficult in rural areas and some individuals are extremely trap-shy (S. Harris, pers. comm.).
Field signs (faecal counts) - Fox faeces are easily identified, so volunteers could feasibly be
used to collect data, especially after Mammal Society accreditation. The National Fox Survey is
effectively providing a valuable baseline measure of rural Red Fox abundance to which future
faecal count work can be compared. It will also provide valuable information on the effectiveness
of the method and suggest where improvements could be made. Preliminary results indicateencouraging scat detection rates and responses from volunteers (S. Harris, pers. comm.). Fox
scats would be a key target of the proposed Sign Transect Survey (Part III.B.2) and would be
monitored as part of our proposed survey protocol for Pine Marten, particularly because of the
interactions that occur between the two species.
Field signs (track counts) - Tracks can be identified and counted, but serious habitat biases and
weather effects are likely unless specialised methods (sand traps or tracking plates) are used.
Such methods effectively preclude any large-scale volunteer input. A further problem is that the
tracks of foxes and small dogs can be difficult to distinguish in less than ideal conditions (S.
Harris, pers. comm.).
Field signs (breeding den counts) - Several field signs allow the identification of Red Fox
breeding dens in spring, especially if dogs are used. Data on abundance could be obtained from
standardised searches for breeding dens, but encounter rates are likely to be low per unit search
effort and searching could have to be very intensive, using teams of six to eight searchers for a
1km square (see Insley 1977). This may make the method unsuitable for volunteer input.
Bait discovery - This method is under development by MAFF and the Game Conservancy Trust
and could provide robust estimates of density if the effects of learning can be controlled for.
However, it will always be an intensive method for professionals only, requiring repeated visits
to baits and standard bait preparation methods.
Visual transect counts - Sightings of foxes in daylight are probably too infrequent for
monitoring via direct counts from transect surveys such as the Breeding Bird Survey, but
presence/absence data based on controlled off-transect sightings and evidence from field signs
such as scats could contribute usefully to national fox monitoring (see Part III.B.2). Sighting
rates would be higher from winter/early spring transect counts (see Part III.B.1).
Questionnaire surveys/follow-up litter counts - This method has been used successfully to
measure fox densities in urban areas, which are important yet difficult to survey in similar ways
to rural areas. Casual sightings or questionnaire returns from the general public (i.e. not
necessarily paid-up wildlife enthusiasts) backed up by professional input provide an efficientway of surveying urban areas.
8/18/2019 BTO Research Report No.223 - Developing a Mammal Monitoring Programme for the UK
http://slidepdf.com/reader/full/bto-research-report-no223-developing-a-mammal-monitoring-programme-for-the 174/316
BTO Research Report No. 223July 1999
172
Garden sightings - Red Fox is a key species which can easily be monitored by a garden-sighting
based monitoring scheme and whose urban and sub-urban populations are important. Our
proposals for a Garden Mammal Watch are detailed in Part III.B.5.
17.4 POTENTIAL MONITORING SCHEMES
MMR Recommended Approach - Within the QQ grid of 10km squares, MMR suggest that
1km squares should be surveyed for foxes by spotlighting along 1km transects covered by car.
They also suggest supplementing this information with scat data collected in conjunction with
sign surveys for other species, with questionnaire surveys of landowners and householders and
with Game Bag data. We have outlined the major problems with Game Bag data and spotlighting
above (see also Part III.A.2): we believe that these methods are unlikely to monitor foxes
adequately. Surveys for fox scats fall under our proposed Sign Transect scheme (Part III.B.2).
Combined, complementary surveys - We suggest that separate survey approaches are required
for urban and rural Red Foxes. For urban foxes, there are two options: regular questionnaire
surveys (perhaps using school projects) backed up by professional checks for litters, using thework of Stephen Harris (Harris 1981; Harris & Rayner 1986a) as a model, or a less specific
approach using records from a Garden Mammal Watch (see Part III.B.5). Recent changes in the
UK’s educational culture such as the development of the National Curriculum may limit the
extent to which repeats of Harris’ school-based work is practicable (S. Harris, pers. comm.). The
latter might not monitor animals in more urban areas well, but should detect large changes in
sub-urban populations. The regular questionnaire approach could target a random sample of
urban areas and the sample could be rotated according to, say, a five-year cycle to maintain
interest and broaden participation. Such a survey could have an additional benefit of introducing
children in urban areas to wildlife and conservation issues.
For rural foxes, we suggest that a scaled-down version of the National Fox Survey would provide
the best guide to changes in abundance and distribution. Such a survey would be provided by our
suggested Sign Transect Survey (see Part III.B.2), within which Red Fox would be a key species.
Scat numbers vary with diet (S. Harris, pers. comm.), so some periodical checks for changes in
diet (say, using faecal analysis) would be necessary as controls to prevent misinterpretation.
Ancillary information on fox abundance and distribution would also be forthcoming from the
Breeding Bird Survey (see Part III.A.1) and our proposed Winter (visual) Transect Survey (see
Part III.B.1). These surveys will be subject to different biases to those affecting sign transects, so
would provide an independent check on the results. Mammals on Roads (Part III.B.3) could also
contribute and further field sign data would be collected in the course of transect surveys for Pine
Marten in habitats where the species co-occur (see Pine Marten species account).
17.5 RECOMMENDATIONS
1) For urban foxes, it may be considered that a specific monitoring scheme is unnecessary,
in which case we recommend that a Garden Mammal Watch (see Part III.B.5) be set up,
within which Red Fox would be a key species. This should detect large changes in urban
and suburban fox range an abundance.

8/18/2019 BTO Research Report No.223 - Developing a Mammal Monitoring Programme for the UK
http://slidepdf.com/reader/full/bto-research-report-no223-developing-a-mammal-monitoring-programme-for-the 175/316
BTO Research Report No. 223July 1999
173
2) For rural foxes, we recommend that our proposed Sign Transect Survey (see Part
III.B.2) forms the principal monitoring tool for the species. Using the National Fox Survey
results as a baseline, this will provide information on changes in range and abundance. We
suggest that visual counts of foxes from the Breeding Bird Survey (Part III.A.1) and a
Winter Transect Survey (Part III.B.1) will also contribute valuable information, as will
Mammals on Roads.

8/18/2019 BTO Research Report No.223 - Developing a Mammal Monitoring Programme for the UK
http://slidepdf.com/reader/full/bto-research-report-no223-developing-a-mammal-monitoring-programme-for-the 176/316
BTO Research Report No. 223July 1999
174
8/18/2019 BTO Research Report No.223 - Developing a Mammal Monitoring Programme for the UK
http://slidepdf.com/reader/full/bto-research-report-no223-developing-a-mammal-monitoring-programme-for-the 177/316
BTO Research Report No. 223July 1999
175
18. PINE MARTEN Martes martes
Native. Population largely restricted to Scotland and currently recovering from a dramatic
population collapse in the mid-Nineteenth Century. Several satellite populations appear to exist
in England and Wales, although their viability has been questioned (Langley & Alden 1977;
Bright & Harris 1994).
18.1 RECENT AND ONGOING MONITORING WORK
Lockie (1964) - Lockie (1964) examined the distribution of Pine Marten records in Scotland,
based on the submission of sightings and trapping records. Local fluctuations in numbers were
also studied at Beinn Eighe NNR, Wester Ross, providing evidence that there is a seasonal
pattern to the occurrence of scats. This was demonstrated at least partially to be the result of
differences in the rates at which scats disintegrated with season. Scats disintegrated more
quickly in summer than in winter and Lockie was able to apply correction factors to his index of
Pine Marten abundance.
Vincent Wildlife Trust Survey (1981-82) - Fieldwork, undertaken by a single fieldworker over
18 months, was based on transects recording the occurrence of Pine Marten faeces at 277 sites
(Velander 1983). Two hundred and sixty people were interviewed regarding records of Pine
Martens and 65% of reported sightings were followed up by site survey to verify reliability. A
similar approach was adopted in the Republic of Ireland (O'Sullivan 1983). Positive records were
noted from 155 10x10km squares. Fieldwork effort was concentrated towards the main Scottish
population, although the work carried out in England failed to reveal any direct evidence of Pine
Marten populations. Velander (1983) concluded that Pine Martens were still present in at least
some of the satellite areas on the basis of local reports. It has been suggested that the method
employed by Velander did not have a large enough sampling intensity to successfully locate Pine
Martens at the very low population levels at which they are thought to occur in England and
Wales (Don Jefferies, pers. comm.).
NCC Pine Marten survey of England and Wales 1987-1988 - Similar survey methods to those
employed by Velander (1983) were used in a NCC study of Pine Marten populations in England
and Wales. Sightings were gathered from a range of sources, these being used to identify 'core'
areas where fieldwork should be carried out. Additional effort was targeted to those adjacent
sites that contained 'likely' habitat. The fieldwork employed again involved transect sampling for
field signs, although the sampling intensity used was increased over that used by Velander
(1983). Fieldwork was carried out over a 19 month period by a single observer. Because of this,
effort was directed to sites selected for the likely presence of Pine Martens, rather than on the basis of random selection.
Selected sites were resurveyed at a different time of year to (a) investigate those areas where
available information suggested that martens were present but had not been detected, and (b)
check on possible seasonal variation in either the ability to detect martens, their marking
behaviour or in the use of certain areas for food resources (Strachan et al.1996). Because the
2km survey transects were chosen as likely positive sites, the number of survey sites examined
per 10x10km square depended on the extent of apparently suitable habitat within that square.
The survey found a mean density of 6.22 sites per 10x10km square (range 1-22). Three potential
problems arise with the methodology especially when applied to Pine Marten populations
occurring at low density:
8/18/2019 BTO Research Report No.223 - Developing a Mammal Monitoring Programme for the UK
http://slidepdf.com/reader/full/bto-research-report-no223-developing-a-mammal-monitoring-programme-for-the 178/316
BTO Research Report No. 223July 1999
176
(a) Pine Martens may alter their range at different times of year;
(b) Seasonal movement within established ranges may occur;
(c) Seasonal variation in the deposition of scats may occur.
The survey concluded that although all five of the main populations south of Scotland were still
extant in 1988, they all existed at very low densities, with three at least contracting. Scats wereonly found in four of these regions (Northumberland, Cumbria, North Yorkshire and north
Wales). Bright & Harris (1994) note that the partial resurvey of sites by Strachan et al . (1996)
did not yield results consistent with the initial visits, and that only 8% of the 896 survey sites
yielded positive results.
Ulster Wildlife Trust and Forest Service Study - A questionnaire approach was adopted in
1993 by the Department of Agriculture for Northern Ireland (DANI) Forest Service and the
Ulster Wildlife Trust (Hughes 1993). A recording sheet was distributed through forest officers
and other staff responsible for the various forest management units throughout Northern Ireland.
Reports suggested a westerly distribution for this species, although there are likely to be
difficulties in interpreting this type of data, given the habits of (Pine Martens).
English Nature study - Bright & Harris (1994) examined the feasibility of reintroducing the
Pine Marten into parts of its former range. As part of this work, 91 2km transects were walked at
a number of sites from the previous survey with the express purpose of determining whether
marten populations were present. Scats were readily located on transects near Glen Trool,
Galloway, but only two Pine Marten scats were positively identified from transect counts carried
out elsewhere. The authors concluded that ‘..Pine Martens are on the verge of extinction in
England. There is no viable population in Cumbria, nor almost certainly in north Yorkshire.'
Comments from this work also serve to highlight the overlap in scat shape between Pine
Martens, other mustelids and Foxes. This is supported by ongoing DNA analyses of faecal
material, which '..casts doubt on the validity of any survey technique based on scats alone..'
(Angus Davison, pers. comm.). It should be noted that surveys in the Lake District in 1993 and
in North Wales in 1994, suggest that there have been further significant declines in numbers
(Bright et al., unpublished).
Scottish Natural Heritage Report (1994) - The survey work undertaken by Balharry et al.
(1996) again utilised a two-tier approach, questionnaires and 1km transects. Effort was targeted
to determine the expansion of the Pine Marten population from 'core' areas, with fieldwork
restricted to those areas containing adequate woodland cover (see Balharry 1993). The
questionnaire generated 256 returns on the presence or absence of Pine Martens with 620 grid
references, covering 42% of the 10km squares in Scotland.
For the fieldwork component, four separate 1km transects (non-randomly selected) were walked
in each area, with both Red Fox and Pine Marten scats being collected: those not identified were
classified as unknown. The 82 areas searched revealed 404 Pine Marten scats, 754 Red Fox scats
and 653 unknown scats. The results demonstrated that there was no significant difference in the
frequency of scat deposition per kilometre of track walked between February and September.
8/18/2019 BTO Research Report No.223 - Developing a Mammal Monitoring Programme for the UK
http://slidepdf.com/reader/full/bto-research-report-no223-developing-a-mammal-monitoring-programme-for-the 179/316
BTO Research Report No. 223July 1999
177
The results suggest that marten had recolonised parts of northern and western Grampian,
Tayside, Central and Strathclyde regions.
Vincent Wildlife Trust - MMR note that the VWT continue to record details of Pine Marten
sightings from England and Wales. As part of this work, detailed DNA analyses are being
carried out on specimens sent in. During the last couple of years six specimens have beenreceived from England and Wales, 20 from Ireland and over 40 from Scotland (Birks et al. 1997;
Angus Davison, pers. comm.). Continued monitoring of the genetics of specimens can also be
used to establish the presence of American Martens Martes americana and Beech Martens
Martes foina, both of which have escaped from UK fur farms (Baker 1990; Don Jefferies, pers.
comm.).
18.2 MONITORING OBJECTIVES
Despite repeated surveys, there remains uncertainty over the status of Pine Marten populations in
England and Wales. There is some suggestion that Pine Marten populations are able to persist at
very low population densities (Don Jefferies, pers. comm.) possibly indicating that 'relict' populations may remain undetected for long periods. Isolated populations of this species should
be a priority for monitoring, alongside work examining the recovery of the Scottish population
and some monitoring within the 'core' range to detect future changes.
18.3 POTENTIAL MONITORING TECHNIQUES
Live-trapping - Pine Martens can be trapped using mesh traps, baited with raw fish or chicken.
Traps should be set in areas of suitable habitat and checked daily, with trapping taking place
between August and February to avoid trapping heavily pregnant females or those with
dependent young (Bright & Harris 1996). Low rates of capture are to be expected, especially
where population densities are low.
Direct counts - MMR note that sightings may provide information on the presence of Pine
Martens within an area, but these would need careful evaluation. Direct sightings, followed up
by intensive fieldwork have formed the basis of most Pine Marten survey work within the UK
and Ireland.
Camera traps - Baited camera traps are recommended by MMR as a means by which the
presence of Pine Martens in an area can be confirmed following the receipt of sighting records.
Road-kills - Although only small numbers of Pine Martens are killed on the road, road-kills can provide useful data on distribution, physiology and the genetic structure of the population.
Field signs (faecal counts) - Fresh Pine Marten scats typically have a characteristic smell,
although this is lost as the scats age. To some extent, older scats can be identified on the basis of
size and shape, although they are very variable and they overlap in size with Stoat at one end and
Fox at the other. Shape is highly dependent on diet. Additionally, confusion may occur with
Ferret and Mink scats. Scats are deposited along man-made tracks (usually dirt or stone, but not
grass) and transects along these tracks (at least 1-2km in length) have been used for monitoring
purposes. Work by Balharry et al. (1996) showed for areas with resident breeding Pine Martens
that they would be '..unlikely to find no scats if at least 2km of track [were] walked.. ' and that
'..we can be 95% confident of finding four or more scats if we walk at least 3km of suitable trackand seven or more if we walk 4km..'. In areas with low population densities or containing only
transitory individuals, the degree of scatting is likely to be greatly reduced, making it difficult to
8/18/2019 BTO Research Report No.223 - Developing a Mammal Monitoring Programme for the UK
http://slidepdf.com/reader/full/bto-research-report-no223-developing-a-mammal-monitoring-programme-for-the 180/316
BTO Research Report No. 223July 1999
178
apply a transect approach based on field signs. Territorial behaviour in other mustelids has been
shown to break down altogether at low population densities potentially making this method
ineffective in some regions (Lockie 1966).
Field signs (tracking-stations) - Baited tracking stations have been used for a range of mustelid
species (e.g. King & Edgar 1977) and the potential exists to employ their use in a similar mannerto hair tubes and camera traps. All three methods should be evaluated during a pilot study
carried out at various sites within the known Pine Marten range.
Hair tubes - The value of hair tubes is currently being evaluated by the Vincent Wildlife Trust.
These would seem to be more cost-effective than live-trapping for the purposes of determining
the presence of Pine Martens within an area, although their reliability needs to be established.
Mammals on Nature Reserves - Records of Pine Martens on nature reserves could be collated
according to the suggestions outlined in Part III.B.6.
Garden Mammal Watch - Pine Martens may use some gardens within their Scottish range andit would be useful (for both the collation of distribution data and project profile within Scotland)
to include Pine Marten on the list of mammal species to be covered by this scheme (see Part
III.B.7).
18.5 POTENTIAL MONITORING SCHEMES
The 'core' Pine Marten population (with its front of range expansion) and the 'relict' populations
in England and Wales should be treated in different ways. Primarily this relates to the different
monitoring objectives for these areas, although apparent differences in population density would
also require the use of different approaches for the different areas.
'Core' populations and front of range expansion - Sites within these areas should be
monitored on a regular basis every five to seven years. Suitable habitat, as defined by Balharry
(1993) and Balharry et al. (1996) should be surveyed within a grid of survey squares selected
from the existing range in Scotland and those areas bordering the front of range expansion. The
same sites should be revisited during subsequent surveys, thus providing a continuous dataset on
range expansion and colonisation rates, together with the statistical benefits of repeat surveys at
the same sites. Trained volunteer fieldworkers should walk 2-3km along predetermined
transects, located along paths, rides and tracks within suitable habitat. All field signs (Pine
Marten, Red Fox and unknown) should be recorded and collected, allowing the potential for
validation work by experts or DNA analysis at a later stage. Fieldwork should be undertakenduring the period when territories are thought to be most stable (February to September) and
co-ordinated by a number of local organisers under the direction of a single scheme co-ordinator,
presumably based at SNH. This approach would also allow the monitoring of Red Foxes within
Pine Marten habitat, something that is considered important given the perceived interactions
between these two species (Don Jefferies, pers. comm.). Information from other sources (e.g.
road-kills) should be fed into the monitoring programme enabling the addition of new survey
squares on a rolling basis, as the population continues to expand.

8/18/2019 BTO Research Report No.223 - Developing a Mammal Monitoring Programme for the UK
http://slidepdf.com/reader/full/bto-research-report-no223-developing-a-mammal-monitoring-programme-for-the 181/316
BTO Research Report No. 223July 1999
179
'Relict' populations in England and Wales - The status of 'relict' populations should be the
target of focused work, with known sightings and other distribution records being followed up by
intensive fieldwork using either live-trapping, camera traps, hair tubes or tracking boards, rather
than field signs. In areas where Pine Martens are found to occur, there is the possibility of more
detailed work (funded as separate projects) to ascertain population density, habitat use and likely
population change.
Co-ordination of Pine Marten monitoring is likely to require the part-time involvement of single
individuals each based at one of the four country agencies. These individuals would liaise at the
national level ensuring that national work is consistent. It is thought that some professional
fieldworkers would be required on a seasonal basis to undertake fieldwork when required.
18.6 RECOMMENDATIONS
1) The 'core' population and its expansion should be monitored every five to seven years
using a grid of survey squares containing suitable Pine Marten habitat. These should be
surveyed by trained volunteers, supported by professionals, to carry out transect counts offield signs. Transects should follow tracks and paths as detailed by Balharry et al. (1996)
and be of 2-3km in length. Red Fox field signs should also be recorded along with those of
unknown origin. A subset of collected field signs can then be examined by professionals to
validate the survey results. Monitoring of the Red Fox population within areas of Pine
Marten habitat would also be possible, and is desirable given the potential interactions
between these two species.
2) The 'relict' populations in England and Wales should be monitored in greater detail,
with recent sightings and other records being followed up by intensive fieldwork based on
either live-trapping, camera trapping, hair tubes or tracking boards rather than field signs.
3) Work should be undertaken within the known Pine Marten range to evaluate the
effectiveness of hair tubes, live-trapping, camera traps and tracking boards. This should be
a priority, enabling application of these techniques to recommendation (2).

8/18/2019 BTO Research Report No.223 - Developing a Mammal Monitoring Programme for the UK
http://slidepdf.com/reader/full/bto-research-report-no223-developing-a-mammal-monitoring-programme-for-the 182/316
BTO Research Report No. 223July 1999
180

8/18/2019 BTO Research Report No.223 - Developing a Mammal Monitoring Programme for the UK
http://slidepdf.com/reader/full/bto-research-report-no223-developing-a-mammal-monitoring-programme-for-the 183/316
BTO Research Report No. 223July 1999
181
19. STOAT Mustela ermi nea and WEASEL Mustela n ivalis
Stoat - Native. Widespread, major reduction in population size following the outbreak of
myxomatosis in Rabbits. Population has recently undergone a partial recovery and reanalysis of
Game Bag records, with trapping effort taken into account, suggests that the population is
currently stable.
Weasel - Native. Widespread, population boomed after myxomatosis outbreak among Rabbit
population. Game Bags indicate a decline since the early 1960s, but see McDonald & Harris (in
press). Pronounced short-term fluctuations in some areas in response to availability of small
mammal prey (Tapper 1979).
19.1 RECENT AND ONGOING MONITORING WORK
Game Conservancy National Game Bag Census - Potential conflicts between Stoats/Weasels
and gamebird populations have led to their control on the majority of shooting estates (Day 1968;
Moors 1975; Tapper 1976, 1992). Data submitted by gamekeepers on the number of Stoats andWeasels killed annually have, since 1961, been collated through the National Game Bag Census
(Tapper 1992). Most of these will have been caught in tunnel traps, although a significant
portion of the Stoats will have been shot.
Analysis of these data (Tapper 1992) suggests that the Stoat population underwent a period of
recovery (through to 1976) as the Rabbit population recovered from the effects of myxomatosis.
Since this time, the national Game Bag trend suggests a gradual population decline.
Game Bag data demonstrate two periods during the year when the number of Weasels trapped
reaches a peak (March/April and August/September), with short-term annual fluctuations also
evident, as Weasel populations respond to changes in the availability of Field Voles (Tapper
1979). The long-term trend in these data suggest a decline in the number of Weasels killed since
1961.
19.2 MONITORING OBJECTIVES
The monitoring of Stoat and Weasel populations is considered as being of High/Medium priority
by JNCC; a result of our relatively poor understanding of the status and current population trend
of these species (Paul Rose, pers. comm.).
19.3 POTENTIAL MONITORING TECHNIQUES
Live-trapping - Live-trapping would allow the population census (at least of trappable
individuals) and estimation of population size through Capture-Mark-Recapture (CMR)
techniques (Cross et al. 1998). However, individual Stoats and Weasels can show selective
responses to trapping, notably relating to sex (King 1975a; Buskirk & Lindstedt 1989), territory
size, weather, activity and social status.
Stoats are very active and highly susceptible to damp and nervous exhaustion (King & Edgar
1977). Wooden, rather than metal or mesh traps should be used. A design (the Edgar Stoat
8/18/2019 BTO Research Report No.223 - Developing a Mammal Monitoring Programme for the UK
http://slidepdf.com/reader/full/bto-research-report-no223-developing-a-mammal-monitoring-programme-for-the 184/316
BTO Research Report No. 223July 1999
182
Live-trap) is shown in King & Edgar (1977). The effects of trap position have been evaluated by
Dilks et al. (1996).
Traps, set for at least four nights in a linear feature, should be baited with a dead mouse or chick
and the entrance smeared with Rabbit gut. Traps will be most successful if operated during the
mating season. Erlinge (see King & Edgar 1977) noted that, depending on population density,somewhere in the order of 30-40 hectares need to be trapped for each Stoat observed. If a CMR
approach is applied then as much as 200 hectares may need to be covered with sufficient density
of traps. This may require a significant amount of fieldwork effort to ensure that the traps are
checked regularly (King 1975a, b)
Trapping for Weasels is most effective during the months of July and August (Rust 1968), with
the traps themselves positioned along natural runways in hedgerows and ditches or, in the case of
traps set in woodland, along specially-created features. Approximately one trap per 0.7 hectares
is the spacing recommended by King (1973). Weasels can be trapped in a range of trap designs
including wooden treadle traps, but should not be caught using traps made from wire mesh since
Weasels chill readily and may damage their teeth on the mesh (King 1973).
From the published literature it appears that the only safe and humane way to handle live
mustelids in the field is anaesthetisation (King 1973), although a method has been developed to
mark Polecats without doing this (Birks 1997).
Kill-trapping - Kill-trapping, using tunnel traps, will provide an index of numbers caught per
unit effort. However, it suffers from the same selectivity problems as seen for live-trapping.
Additionally, there are other disadvantages, not least that you are killing a component of the
population you are supposed to be monitoring as well as other non-target species (Hewson 1972).
The removal of individuals from a population may stimulate a response in those untrapped
individuals remaining, leading to a disruption of social status and dispersal behaviour. By
removing territory holders a sink is created into which other individuals will move, changing the
sampling of individuals from within a defined area to sampling over an unknown area. This is
not ideal for monitoring purposes. King & Edgar (1977) recommend that to estimate population
change by kill-trapping, a single straight line of traps, spaced at 400m intervals, should run for at
least 16km through homogenous habitat (i.e. 50 traps).
National Game Bag Census - Essentially this approach is a form of kill-trapping, although there
are clear differences in the way traps are employed by different gamekeepers, increasing variance
in sampling protocol. There is currently no measure of trapping effort, making comparisons over
time and between areas somewhat difficult. The value of using trapping records to monitor populations of Stoats and Weasels has been examined by McDonald & Harris (in press) who
show that these records can be misleading if sampling effort is not controlled for. They found
that the national decline in the numbers of Stoats trapped (Tapper 1992) was equally consistent
with a reduction in trapping effort and a true population decline. Such long-term changes in
trapping effort are quite likely to have occurred alongside changes in game rearing practice.
There is also the question of whether Game Bag data are representative of populations in the
wider countryside (see Part III.A.2).
Tracking - Tracking methods have been evaluated by King & Edgar (1977), with methods
typically employing tracking stations (tunnels) containing an arrangement on the floor to record

8/18/2019 BTO Research Report No.223 - Developing a Mammal Monitoring Programme for the UK
http://slidepdf.com/reader/full/bto-research-report-no223-developing-a-mammal-monitoring-programme-for-the 185/316
BTO Research Report No. 223July 1999
183
the tracks of visiting individuals. This approach provides a basic index of population status (i.e.
proportion of tracking stations containing tracks of the study species), but this index is confused
by an activity component. Because of differences in activity, one individual may visit many
stations or many individuals may visit only one station, thus providing a false picture of
population size. MMR recommend that tracking stations should have an entrance diameter of
8cm and should be placed in natural runways along linear features (as for live- and kill-trap placement). This approach is less-suited to habitats lacking linear features, notably upland areas.
Additionally, poor weather can dramatically reduce the efficiency of tracking methods.
Hair tubes - Hair tubes are similar to tracking stations in that they record information on both
population status and activity. This approach will not separate Stoat and Weasel (Stephen Harris,
pers. comm.).
Camera traps - MMR note that these traps could be used to record animals running through
tunnels. As with some of the other methods already mentioned, an index of population status
may be confused by activity patterns, unless individuals can be identified. Individual Weasels
can be identified in the hand (Linn & Day 1966) although this approach is not applicable to thecurrent design of camera traps. It should also be noted that camera traps are expensive.
Field signs - Because of considerable overlap in faeces size and composition with other species,
the use of field signs is not recommended. Additionally, the faeces are difficult to find.
BBS transect approach - (see Part II.A.1. - Mammal Monitoring under the Breeding Bird
Survey). The presence of Weasels is reported from about 3-4% of BBS squares for which
mammal recording forms are submitted annually, while the corresponding figure for Stoats is
about 5% of BBS squares submitted annually. However, although Stoats and Weasels are
thought to be widespread, they are unlikely to be encountered by fieldworkers even when present
in an area. This means that there will be a strong stochastic component to the data submitted by
BBS, making it unlikely that the scheme in its current form could be used for monitoring Stoat
and Weasel populations. There may be the potential for BBS (or a modified mammal transect
scheme) to provide ancillary data, but this requires further evaluation.
Winter Transects - (see Part III.B.3) - Compared to summer transects, the encounter rates may
be increased through specific mammal visual transects operated during late winter (Stephen
Harris, pers. comm.). Again, there may be a significant stochastic component in the data
collected. Transects are likely to be a good monitoring technique (Stephen Harris, pers. comm.)
Sign Transects - Transects for field signs are likely to be impractical for this species, given thedifficulties in separating the scats of small mustelids.
Mammals on Roads - The number of Stoats or Weasels recorded dead or alive on the road along
regular survey routes could provide a basic index of population change (see Part III.B.5).
19.4 POTENTIAL MONITORING SCHEMES
For both species MMR recommend the use of camera traps at a minimum of 2,000 sites,
calibrated by live-trapping at a subset of these sites. This is likely to be an extremely expensive
option, given the equipment involved and the number of professional man-hours required. A far

8/18/2019 BTO Research Report No.223 - Developing a Mammal Monitoring Programme for the UK
http://slidepdf.com/reader/full/bto-research-report-no223-developing-a-mammal-monitoring-programme-for-the 186/316
BTO Research Report No. 223July 1999
184
cheaper approach would be to develop the information gathered by the Game Conservancy's
National Game Bag Census. As noted by McDonald & Harris (in press) this would require some
measure of trapping effort to be recorded alongside the trapping returns. If this becomes
possible, then Game Bag data may be available from the majority of estates contributing to the
National Game Bag Census. There are other problems with Game Bags (see Part III.A.2), the
most important of which (for future monitoring of Stoat or Weasel populations) is that changes inlegislation regarding the control of the species' or game rearing in general may radically alter the
amount of data contributed. The likelihood of such changes occurring must be considered in the
context of the likely benefits of utilising the Stoat/Weasel Game Bag data at least over the
short term.
Ancillary data for Stoats and Weasels may be obtainable from the BBS, road-kills and
road-sighting surveys. These may not provide as detailed picture of population change, but taken
together may satisfy the monitoring needs for this species. The use of hair tubes to monitor
population change/activity could also provide useful monitoring data, although the feasibility of
utilising this approach needs to be evaluated. Co-ordination of the road-based schemes should be
carried out by a single individual, also responsible for co-ordination and development of othernational schemes (see Parts III.B.2 and III.B.3).
19.5 RECOMMENDATIONS
1) Seek modification of the National Game Bag Census to allow recording of trapping
effort, thus enabling trapping returns to be expressed per uni t eff ort . This could form a
readily applied and relatively cheap monitoring option. Monitoring of Weasels should take
place on an annual basis to allow for the short-term fluctuations that result from variations
in Field Vole populations (Tapper 1979).
2) Further evaluate the use of transects for monitoring purposes, notably the data
generated by VWT and initially analysed by Simon Poulton.
3) Ancillary data for both Stoat and Weasel could be gathered through the Mammals on
Roads scheme (Part III.B.5).

8/18/2019 BTO Research Report No.223 - Developing a Mammal Monitoring Programme for the UK
http://slidepdf.com/reader/full/bto-research-report-no223-developing-a-mammal-monitoring-programme-for-the 187/316
BTO Research Report No. 223July 1999
185
20. POLECAT Mustela putori us
Locally common throughout Wales with populations recorded in 12 to 15 counties within
England. Population and range appear to be expanding.
20.1 RECENT AND ONGOING MONITORING
National Game Bag Census - The National Game Bag Census has a small amount of data (from
31 estates) on the numbers of Polecats shot by gamekeepers, although the species was not
specifically added to the National Game Bag Census record until 1997 (Tapper 1992). The
inclusion of the species on Schedule 6 of the Wildlife and Countryside Act means that even
fewer records are now received. There is also potential confusion between Polecats and Feral
Ferrets.
Vincent Wildlife Trust survey - Live-trapping was undertaken in selected 1km squares within a
sample area covering 58 10km squares. The distribution of sample sites was not random, but
selected for convenience of volunteers recruited through the Wildlife Trusts. The criteria usedfor selecting squares were (1) that they lay within the known range, (2) that they were
predominantly rural and (3) that they avoided areas of ground-predator control. Trapping was
carried out during the winter (1993-1996). Baited single-entry cage traps were used with each
1km square containing 16 traps set for seven consecutive nights. Volunteers were trained and
initially accompanied by an expert. Eight thousand, seven hundred and twenty trap nights
resulted in 96 captures of 76 individuals.
Road-deaths - Small numbers of Polecats are killed annually on the roads. These reports
currently provide important distribution information and contribute to the monitoring of
introgression between Feral Ferret and Polecat (see below).
Genetic Monitoring - Ongoing work on carcasses submitted to the Vincent Wildlife Trust is
examining the introgression occurring between Feral Ferret and Polecat.
20.2 MONITORING OBJECTIVES
The restricted distribution of the Polecat together with its gradual colonisation of 'fringe' areas
points to a targeted monitoring programme rather than its inclusion in part of a wider scheme.
The low densities at which this species occurs (Blandford & Watson 1991; The Populations
Review), and the range of habitats it occupies, makes it difficult to monitor without the
commitment of significant resources. Distribution monitoring is a high priority as is the collationof detailed information on habitat preferences and the degree of hybridisation with Feral Ferrets.
20.3 POTENTIAL MONITORING TECHNIQUES
Live-trapping - Polecats can be captured using single-entry cage traps baited with a dead-day-
old chick. Each 1km square to be trapped should be divided into a grid of 16 250x250m cells
with one trap placed within each cell. These should be left for seven consecutive nights with the
bait being replaced on day four. Trapping should be carried out between October and March, a
time of year when the Polecat population is likely to be stable. Although labour-intensive, Birks

8/18/2019 BTO Research Report No.223 - Developing a Mammal Monitoring Programme for the UK
http://slidepdf.com/reader/full/bto-research-report-no223-developing-a-mammal-monitoring-programme-for-the 188/316
BTO Research Report No. 223July 1999
186
(1997) has shown that with training volunteers can operate the trapping grid and weigh, mark and
release trapped Polecats without sedating them. The number of individuals caught per unit effort
is low (0.01 captures per trap night) suggesting potential motivational problems in areas where
Polecats are scarce.
Game Bags - As noted above, this approach is unsatisfactory for monitoring purposes. A recentquestionnaire based study, centered on the main Polecat range, demonstrated that 88% of
gamekeeper respondents had experience of Polecats (Packer & Birks, 1999).
Indirect counts - Identification of scats and tracks is difficult, making them unreliable for
monitoring purposes. Additionally, there may be variation in scatting activity between seasons,
habitats and population density as demonstrated for other mustelid species. Hansen & Jacobsen
(1999) have demonstrated that faeces of Otter, Mink and Polecat can be separated using DNA
analysis, although this approach would probably be prohibitively expensive for monitoring
purposes.
Road-deaths - As MMR note, this technique is useful for monitoring the distribution and spreadof this species. If carcasses are collected then they can be analysed using DNA extraction
techniques to monitor the introgression between Ferrets and Polecats.
Mammals on Nature Reserves - Records of Polecats on nature reserves could be collated
according to the suggestions outlined in Part III.B.6.
20.4 POTENTIAL MONITORING SCHEMES
A targeted monitoring programme concentrating on the boundary of the core range would appear
to be the most cost-effective way in which to monitor the increase in range of this species. Other
work should be undertaken within the core range to monitor any future impacts that may
influence the population. Significant resources need to be committed to the monitoring of this
species, given that intensive live-trapping is the only workable option. The approach outlined
and tested by Birks (1997) should be used as the basis for future work and costs of fieldwork
based on this approach, mixing a single professional organiser with volunteer fieldworkers.
20.5 RECOMMENDATIONS
1) Live-trapping of this species should be undertaken both within the core range and along
the boundary of its current range expansion. This should follow the protocol outlined by
Birks (1997).
2) Material removed from trapped animals, along with that from road-kills, should be
analysed to determine the degree of introgression between Feral Ferrets and Polecats. This
is currently being investigated by the Vincent Wildlife Trust.
3) Ancillary data may be available from the Mammals on Nature Reserves and Mammals
on Roads schemes within the current range, although these alone may not be of sufficient
detail or quantity to provide adequate monitoring for this species.

8/18/2019 BTO Research Report No.223 - Developing a Mammal Monitoring Programme for the UK
http://slidepdf.com/reader/full/bto-research-report-no223-developing-a-mammal-monitoring-programme-for-the 189/316
BTO Research Report No. 223July 1999
187
21. FERAL FERRET Mustela fur o
Escaped individuals can be encountered across the UK making it difficult to detect established
feral populations. Island-based feral populations have occurred on Mull, Lewis, Bute, Arran and
the Isle of Man (Blandford & Walton: in The Handbook), Shetland, Islay, Harris, Mull and The
Uists (The Populations Review).
21.1 RECENT AND ONGOING MONITORING
None.
21.2 POTENTIAL MONITORING TECHNIQUES
National Game Bag Census - Feral Ferrets are likely to be controlled on shooting estates as part
of the general management of mustelid predators (Tapper 1992). Although the National Game
Bag Census does not currently report on the number of Feral Ferrets killed annually by
gamekeepers, the scheme could do so in the future. Confusion with the legally protected Polecatmay reduce the number of individuals reported in some areas.
Vincent Wildlife Trust Polecat survey - Feral Ferrets may be caught during the live-trapping of
Polecats providing some data on the occurrence of this species (see Polecat).
Road-deaths - Small numbers of Feral Ferrets are likely to be killed annually on the roads.
These reports could provide important distribution information and contribute to the monitoring
of introgression between Feral Ferret and Polecat (see below).
Genetic Monitoring - Ongoing work on carcasses submitted to the Vincent Wildlife Trust is
examining the introgression occurring between Feral Ferret and Polecat.
Breeding Bird Survey/Winter Transects/Garden Mammal Watch - Although they are rarely
encountered, validated reports of Feral Ferrets could contribute some ancillary information on
distribution. However, it would not be possible to monitor population trends effectively by these
methods.
21.3 MONITORING OBJECTIVES
The Ferret is an introduced species, fully interfertile with the Polecat and established in some
areas. Information is needed on this species because of its potentially deleterious effects onnative fauna. This is twofold:
• Competition and hybridisation with Polecats on the mainland.
• Predation, on islands from which Polecats are naturally absent.
We suggest that this leads to four monitoring objectives
• To determine trends in the frequency of occurrence of Ferrets at liberty on the mainland.
• To detect the establishment of Feral Ferret populations on the mainland.

8/18/2019 BTO Research Report No.223 - Developing a Mammal Monitoring Programme for the UK
http://slidepdf.com/reader/full/bto-research-report-no223-developing-a-mammal-monitoring-programme-for-the 190/316
BTO Research Report No. 223July 1999
188
• To report on occurrences of Feral Ferrets at liberty on islands which have no established
populations.
• To establish trends in abundance of Feral Ferrets on islands on which they are currently
established.
21.4 POTENTIAL MONITORING SCHEMES
The presence of escaped individuals over such a large area makes it difficult to monitor the
general status of this species in mainland Great Britain. Information on the occurrence of Feral
Ferrets should be gathered using all available schemes (e.g. road-kills, Garden Mammal Watch,
Winter Transects, Polecat studies, etc.). If the National Game Bag Census is to be used in the
monitoring of other mammal species, then it may be worthwhile asking estates to report on the
numbers of Feral Ferrets killed annually.
Populations of Feral Ferrets established on islands could be monitored using a live-trapping
approach similar to that devised for Polecat (see Polecat species account), although the density
and ranging behaviour of ferrets on these islands may differ. Trapping for monitoring purposesshould be considered alongside trapping for removal purposes.
21.5 RECOMMENDATIONS
1) Distribution data on Feral Ferrets should be gathered through other single species or
multi-species schemes wherever possible.
2) The value of trapping island populations for monitoring, rather than for control should
be considered before any decision to monitor such populations is made.
3) The National Game Bag Census should be extended to allow submission of records of
Feral Ferrets.
4) Analysis of carcasses to examine introgression between Feral Ferret and Polecat should
continue through work co-ordinated by the Vincent Wildlife Trust.

8/18/2019 BTO Research Report No.223 - Developing a Mammal Monitoring Programme for the UK
http://slidepdf.com/reader/full/bto-research-report-no223-developing-a-mammal-monitoring-programme-for-the 191/316
BTO Research Report No. 223July 1999
189
22. AMERICAN MINK Mustela vison
The American Mink population has been undergoing a general expansion in range and numbers
across the UK, although recent evidence suggests that many populations are in decline, probably
as a result of competition with a recovering Otter population.
22.1 RECENT AND ONGOING MONITORING WORK
Department of Agriculture and Fisheries for Scotland Enquiry - An enquiry into the
changing status of American Mink in Scotland was carried out using data from mink farmers,
gamekeepers, museums, naturalists, Government Pest Officers and Department of Agriculture
trapping records. This analysis demonstrated the rapid spread of American Mink since the early
1960s and suggested that the existence of suitable habitat and abundant food supplies would
allow further expansion in numbers and distribution (Cuthbert 1973).
Forest & Wildlife Service Enquiry - Data on the status of American Mink throughout Ireland
(including Northern Ireland) were gathered from all available sources as part of an enquiryundertaken by the Forest & Wildlife Service. This information was supplemented by a survey
carried out between 1984 and 1986. Trained fieldworkers visited selected 10km squares and
walked a minimum 3km length of representative rivers, recording field signs of both American
Mink and Otter (Smal 1988). Some 167 of the 312 watercourses surveyed (53.5%) showed the
presence of American Mink. It should be noted that there were variations in the amount of effort
expended in each square, and that this may have introduced some bias to the overall results.
Vincent Wildlife Trust National Otter Surveys - Field signs (scats) of American Mink have
been recorded during each of the three Otter surveys carried out in England. The reports on these
surveys (Lenton et al. 1980; Strachan et al. 1990; Strachan & Jefferies 1996) contain maps
highlighting those 10km squares (within the survey grid) with American Mink present.
Examination of the data suggests a continued expansion of the American Mink population into
the Midlands and south-east England, with evidence of a decline in the south-west most probably
linked to the recovering Otter population (Strachan & Jefferies 1996). During the initial survey,
recording effort along the 600m transects was terminated once signs of Otters were found and
this may have resulted in some stretches containing Mink not being recorded as positive sites,
simply because the Mink field signs had not been reached in the linear transect. Transect length
would have varied between sites depending upon the distance at which Otter spraints were found,
thereby introducing an element of spatial bias into the Mink dataset in terms of sampling effort.
Vincent Wildlife Trust Water Vole Survey 1989/1990 - Evidence of American Mink wasrecorded as a component of the VWT Water Vole survey, enabling the distribution of this
introduced species to be determined nationally. One thousand and twenty-two (34.4%) of the
2,970 sites examined for Water Voles showed evidence of American Mink presence (Strachan &
Jefferies 1993).
Vincent Wildlife Trust Water Vole Survey 1997/1998 - A repeat of the 1989/1990 survey,
again recording the presence of American Mink at sites being surveyed for Water Voles. The
data are currently being analysed and a report is due to be published at the end of 1999.

8/18/2019 BTO Research Report No.223 - Developing a Mammal Monitoring Programme for the UK
http://slidepdf.com/reader/full/bto-research-report-no223-developing-a-mammal-monitoring-programme-for-the 192/316
BTO Research Report No. 223July 1999
190
Environment Agency - The Environment Agency's ' River Habitat Survey' documents the
presence of American Mink in conjunction with the collation of data on habitat and river
features. Additional training may be needed to ensure that RHS recorders can identify field signs
(see Part V).
Wildlife Trusts and other organisations - A number of projects examining the status anddistribution of American Mink are being carried out nation-wide, many as components of
projects on Otters and Water Voles.
22.2 MONITORING OBJECTIVES
The American Mink was first recorded breeding in the wild over 30 years ago, since when it has
become an established part of the UK fauna (Birks 1990). It is only recently that researchers and
policy makers have begun critically to examine the effects of its establishment (Birks 1990;
Woodroffe et al. 1990). Consequently, there is a clear need to undertake detailed monitoring of
the distribution, status and likely impact of the species within the United Kingdom. Specifically,
information should be gathered by:
a) monitoring the distribution and spread of American Mink within individual
catchments, especially where catchments contain populations of Water Voles or Otters;
b) monitoring how the distribution and abundance of American Mink is changing in
relation to recovery in the Otter population and loss of Water Vole populations. If
data can be gathered relatively easily and cheaply (possibly as a component of other
work) then examination of the interactions between American Mink, Otters and Water
Voles may be possible.
c) monitoring the distribution and abundance of American Mink on islands where they
may constitute a threat to seabird colonies or other wildlife.
This would suggest that monitoring should be carried out through the proposed national Otter
and Water Vole surveys.
22.3 POTENTIAL MONITORING TECHNIQUES
Live-trapping - American Mink can be trapped in commercially available baited traps
(Dunstone 1993). These should be positioned close to the water's edge with the entrance facing
downstream and some degree of camouflaging employed. Traps can be positioned at a density ofone every 200m along a linear feature. Trapping success varies seasonally, with the greatest
chances of capture being during the mating season (January to April) or when juveniles are
dispersing (September to November). For monitoring purposes trapping should be restricted to
the mating season to remove the effects of short-term variability in productivity. There are
various sex and age biases in terms of the ease with which individuals can be captured (Dunstone
1993).
Direct counts - The direct sighting and correct identification of American Mink are difficult
within riverine habitats, but may be more readily applied in the few areas where the species
occurs in coastal habitats.

8/18/2019 BTO Research Report No.223 - Developing a Mammal Monitoring Programme for the UK
http://slidepdf.com/reader/full/bto-research-report-no223-developing-a-mammal-monitoring-programme-for-the 193/316
BTO Research Report No. 223July 1999
191
Indirect counts - As with Otters, the presence of American Mink at a site may be determined
from field signs, specifically faeces. With a small amount of training these can usually be
separated from those of Otter, but separation from Polecat can be more difficult in certain
circumstances. The consistency and colour of Mink scats depends on diet and on how fresh the
scat is (Lawrence & Brown 1973). Hansen & Jacobsen (1999) have demonstrated that faeces of
the three species can be readily separated using DNA analysis. Mink scats are usually depositedat conspicuous sites around dens, on prominent rocks, under bridges and on fallen tree trunks.
There is some evidence from the literature that scat deposition varies seasonally with scats
significantly more likely to be found during the summer and autumn (Wise et al. 1981). This is
likely to be a result of changes in Mink activity and scat decay rates with season.
Game Bags - Game Bags are not likely to offer a reliable monitoring option for this species,
since it is difficult to standardise information on recording effort (see Part III. A.2).
Road-deaths - As MMR note, road kills could provide incidental records of distribution,
indicating where Mink had moved into new areas before other monitoring methods showed them
to be present.
Mammals on Nature Reserves - Records of American Mink on nature reserves could be
collated according to the suggestions outlined in Part III.B.6.
Waterways Breeding Bird Survey (WBBS) - American Mink, along with Otter and Water
Vole, is one of the few species that could be monitored through the WBBS, although it should be
stressed that this survey is currently still in its pilot stages and may not have funding for
continuation beyond the end of the pilot period. Additionally, the survey is designed to survey a
range of bird species associated with riparian habitats and is therefore not ideal for the transect
monitoring of Mink field signs.
22.4 POTENTIAL MONITORING SCHEMES
Current monitoring of the Mink population takes place through the existing Otter and Water Vole
surveys. Given the interactions between these three species it makes sense to continue recording
Mink distribution as a component of these two schemes. This approach would provide a greater
level of detail regarding the species interactions than would be possible were Mink to be
surveyed in isolation.
Monitoring of American Mink populations should therefore remain a component of the schemes
developed for Otter and Water Vole, either as a continuation of the existing monitoring methodsor with the incorporation of a greater volunteer component. The Mammal Society has
demonstrated that volunteers can be trained to identify Mink scats and that a sufficient network
of observers can be generated for most of the UK. Professional recorders would be required for
the more remote regions and technical support would be needed to help with data analysis and
the identification of problem scats. Co-ordination of Mink monitoring would depend on
decisions made about the co-ordination of Otter and Water Vole.

8/18/2019 BTO Research Report No.223 - Developing a Mammal Monitoring Programme for the UK
http://slidepdf.com/reader/full/bto-research-report-no223-developing-a-mammal-monitoring-programme-for-the 194/316
8/18/2019 BTO Research Report No.223 - Developing a Mammal Monitoring Programme for the UK
http://slidepdf.com/reader/full/bto-research-report-no223-developing-a-mammal-monitoring-programme-for-the 195/316
BTO Research Report No. 223July 1999
193
23. BADGER Meles meles
A general increase in numbers has been witnessed this century, with particularly noticeable
increases in some local areas during the last two decades.
23.1 RECENT AND ONGOING MONITORING WORK
National Badger Survey (report based) - The National Badger Survey was instituted in 1963,
with the aim of establishing the distribution of Badgers in Britain. County Badger Recorders
were asked to submit details of all setts known to them, together with information on sett size,
position and soil characteristics. Records of over 4,300 setts were received including additional
information from the Forestry Commission and the Biological Records Centre. These data were
then used to establish the total likely number of setts per 10km square, allowing some
interpretation and mapping of regional variations in sett density (Clements et al. 1988).
The data used in the National Badger Survey were accumulated over many years, meaning that
some of the earlier records would have been out of date by the time the analysis was carried out.This may have been a particular problem in this instance because of the upsurge in illegal
persecution by Badger diggers in the 1970s and the TB control measures being carried out by
MAFF in the south-west. A further problem results from the fact that different surveyors may
have been working to different standards, specifically with regard to the types of sett being
recorded and to the level of effort put into gathering records.
National Badger Survey 1985-1988 (fieldwork based) - The first fieldwork based national
survey of Badgers was carried out between the end of 1985 and the beginning of 1988, covering
2,455 1km squares. These squares were selected using a stratified approach with squares
allocated within strata based on the 32 land classes of the ITE's Land Classification Scheme
(Bunce et al . 1996). Within each square, fieldworkers followed standard methods recording
Badger setts and signs of Badger activity. The results suggested that there were 42,891 ( ±3,851
((95% confidence limits) Badger social groups, with densities presented for each of the 32 ITE
Land Classes (Cresswell et al. 1990). Additionally, the data were used to demonstrate regional
variations in distribution (Cresswell et al. 1989).
It is worth noting that the data were reanalysed following changes to the ITE Land Classification,
although this resulted in only a slight change to the estimate of the number of Badger social
groups (Reason et al. 1993). Data from this survey were also used by MMR as part of an
analysis to assess the power of this scheme to determine trends in different regions (MMR,
p63-66).
Badger Survey of Northern Ireland - A similar approach to that used by Cresswell et al. (1990)
was employed in Northern Ireland (Feore, Smal & Montgomery 1993), and in the Republic of
Ireland (Smal 1995).
National Badger Survey 1994-1997 (fieldwork based) - Some 93% of the original 2,455
Badger survey squares covered between 1985 and 1988 were resurveyed as part of the second
National Badger Survey (Wilson et al. 1997) allowing an estimate of change in the Badger
population to be determined. This approach was adopted for two main reasons. Firstly, because
Badger setts are not randomly distributed; '.. resurveying the same 1km squares, rather than
surveying a new random sample of 1km squares, is best suited for detecting change in datawhere there are large 95% confidence limits about the population means.' (Wilson et al. 1997).
Secondly, repeatedly surveying the same squares allows the fate of individual setts to be

8/18/2019 BTO Research Report No.223 - Developing a Mammal Monitoring Programme for the UK
http://slidepdf.com/reader/full/bto-research-report-no223-developing-a-mammal-monitoring-programme-for-the 196/316
BTO Research Report No. 223July 1999
194
monitored and those factors leading to sett loss or gain to be quantified. In addition to the 2,271
squares resurveyed, a further 307 new squares were included, enlarging the sample database for
future resurveys.
Changes to the Land Classification Scheme (Bunce et al . 1996) meant that the data were
analysed according to seven land class groups. The results produced an estimate of 50,241(±4,327 ((95% confidence limits) social groups, an increase of 24% over the previous survey.
Regional variations in both the number of social groups and levels of population change were
also examined, as was the loss of individual setts.
23.2 MONITORING OBJECTIVES
Although the Badger population has been demonstrated to have increased within much of its
existing range, there are substantial areas of seemingly suitable lowland Britain from which the
species is absent. Even if the current degree of legal protection continues, it is likely that
recolonisation of all suitable Badger habitat will take many decades. In view of this, and because
of the susceptibility of Badgers to infection with Bovine TB (Cheeseman et al. 1981, 1989), persecution and habitat perturbations (Harris et al. 1992) it is important to continue regular
monitoring of distribution and population size, the latter being based on the number of social
groups. Such information should be considered as being of primary importance if changes in
legislation are to be addressed in the future. Harris et al. (1992) outline the information required
for Badger monitoring, namely:
(a) an estimate of the number of Badger setts in Britain;
(b) the distribution of setts per social group;
(c) the likely effects of land use change on Badger numbers;
(d) the potential effects of population perturbations on reproductive success;
(e) the effects of population density on group structure;
(f) the current rate of annual mortality.
In actual fact, much of this information has a modelling purpose, which could be considered
additional to baseline monitoring. The baseline monitoring should consider changes in
abundance and the number of social groups.
23.3 POTENTIAL MONITORING TECHNIQUES
Live-trapping - Badgers can be caught using cage traps baited with peanuts, in snares or with
hand-held nets, the latter being used when Badgers are foraging within open areas at night(Cheeseman & Mallinson 1980; Harris 1982). Trapping is labour intensive and would not be
practical at the national level unless used as part of a calibration exercise.
Direct Counts - Direct counts of individual Badgers can be made by watching active Badger
setts (MMR). These should be watched either at dawn or dusk, unless night-vision equipment is
available allowing watching to be undertaken throughout the night. MMR evaluated whether the
accuracy of the number of animals counted improves with (a) the number of consecutive nights
on which counting occurs and (b) with the number of observers (MMR: p112-116). It was found
that accuracy increased with the number of nights counted, but that the use of multiple observers
opened up the risk of double-counting the same individuals. It should also be noted that Badger
activity is influenced by weather conditions (Cresswell & Harris 1988) and that emergence timesmay differ between habitats (Harris 1982).
8/18/2019 BTO Research Report No.223 - Developing a Mammal Monitoring Programme for the UK
http://slidepdf.com/reader/full/bto-research-report-no223-developing-a-mammal-monitoring-programme-for-the 197/316
BTO Research Report No. 223July 1999
195
Direct counts of Badgers could also be employed as a component of a Garden Mammal Watch
approach (see Part III.B.7), with the presence/absence of Badger sightings in gardens (or
maximum counts) being used as a basic index.
Road-deaths - Records of Badgers found dead on the road have been examined by several
researchers (Killingley 1973; Jefferies 1975; Neal 1977; Davies et al. 1987). Although there aresome differences between the conclusions of these studies, there appears to be a bimodal
distribution to the seasonal pattern of Badger road deaths. In a study of 984 carcasses from
southern England, Davies et al . (1987) found a similar seasonal pattern for both males and
females, with peaks in February-April and July-August.
Indirect counts - Various field signs can potentially be used to monitor Badger populations
including setts, latrines and tracks (Harris et al. 1989; Wilson et al. 1997). Badger setts are
perhaps the most conspicuous of the field signs, and have been used as a measure of the number
of social groups (Clements et al. 1988; Wilson et al. 1997). Since a Badger social group can
have more than one sett within its range (active or inactive) it is important that different types of
sett and their function can be distinguished. The following guidelines to classifying sett typehave been established by Wilson et al . (1997):
main setts - '.. these usually have a large number of holes with large spoil heaps, and the
sett generally looks well-used..'
annexe setts - '.. these are often close to a main sett, usually less than 150 metres away,
and are usually connected to the main sett by one or more obvious well-worn paths. They
usually have several holes, but may not be in use all the time even if the main sett is very active..'
subsidiary setts - '..these often have only a few holes .. They are at least 50 metres from a
main sett, and do not have an obvious path connecting with another sett. They are not
continuously active..'
outlying setts - '..these usually only have one or two holes, often with a little spoil outside
the hole, have no obvious path connecting with another sett, and are only used sporadically..'
The number of main setts in an area has been used to indicate the number of social groups.
Attempts by MMR to relate the number of badgers using a sett to sett characteristics (see MMR:
112-116) suggest that it is not possible to use this approach to predict group size. However, other
researchers state that there is a very strong relationship between group size and features of sett
size and pattern of use (S. Harris, pers. comm.). A mean of 5.9 adult Badgers per social groupwas used by Cresswell et al. (1990) to approximate the size of the national Badger population.
However, it was accepted that there is great variation in the number of Badgers making up a
social group. Recent work has enabled the production of more precise estimates of social group
size in different parts of the UK (Stephen Harris, pers. comm.).
8/18/2019 BTO Research Report No.223 - Developing a Mammal Monitoring Programme for the UK
http://slidepdf.com/reader/full/bto-research-report-no223-developing-a-mammal-monitoring-programme-for-the 198/316
BTO Research Report No. 223July 1999
196
Badgers regularly use a number of dung pits grouped at latrine sites. These have a territorial
function (Kruuk 1978) and the number of latrines used by a group has been demonstrated to be
related to group size. Even stronger associations can be detected where the number of individual
dung pits or amount of faeces per kilometre of linear feature have been used (MMR, 115-116).
However, Stephen Harris believes the MMR data to be flawed and that this technique only works
in areas with high Badger densities. At low densities Badgers do not use latrines or dung-pits.
23.4 POTENTIAL MONITORING SCHEMES
Several monitoring options could be successfully applied to the Badger population and each of
these is dealt within in turn.
Periodic National Surveys - The pre-existing grid of Badger survey squares, with the two
national surveys already completed, forms an ideal basis for future monitoring of Badger
populations. The approach detailed by Wilson et al. (1997) employs a suitable sampling
protocol, including an element of stratification, which delivers the ability to monitor population
change with the required degree of power. However, considerable professional effort went intocovering some of the more remote strata (containing fewer Badgers) and it should be possible to
use a more effective stratification to reduce the level of coverage in these areas while maintaining
power. Consideration should be given to running simulations based on existing datasets to
determine to what extent the existing stratification can be modified to achieve better sampling
efficiency. It may prove possible to reduce the overall sample size and distribution of samples
between strata. The other distinct advantage of continuing with the approach adopted in the most
recent survey is that resurvey of the existing sites provides greater statistical power and
continuity of historical information on changes to individual setts.
The volunteer involvement in this work increases the cost-effectiveness of the monitoring,
allowing a large number of squares to be covered. Reducing the number of sites covered is
unlikely to increase cost-effectiveness significantly, although it could reduce the number of
volunteers requiring training and thus some of the associated costs.
Further consideration should be given to refining our understanding of the relationship between
latrine/dungpit counts and social group size. This could increase the predictive power of using
such counts to estimate population size rather than relying on estimates of the number of social
groups. Wilson et al. (1997) note that changes to the Badger population can occur in two ways,
either (a) a change in the number of social groups or (b) a change in the number of Badgers
within social groups. There is '.. a general perception that the number of social groups only
increases slowly, particularly in areas of high population density.' Although such changes might be slow, they are likely to reflect a long-term increase in Badger population size. However, if it
is possible to get an accurate estimate of the number of Badgers directly, through latrine/dungpit
counts, then it could offer the opportunity to monitor shorter-term changes in group structure that
may result from other factors (note the problems outlined above). Although this work may be at
the cost of other monitoring options it does offer the potential to monitor any factors that may
reduce the Badger population without a corresponding change in the number of social groups
(e.g. some form of disease).
Badger road deaths - The Badger is one of the species considered for inclusion in the
monitoring of animals seen crossing roads or found dead on roads, by recorders driving regular

8/18/2019 BTO Research Report No.223 - Developing a Mammal Monitoring Programme for the UK
http://slidepdf.com/reader/full/bto-research-report-no223-developing-a-mammal-monitoring-programme-for-the 199/316
BTO Research Report No. 223July 1999
197
routes (see Part III.B.5). This approach could generate a basic index providing ancillary
information on a more regular basis than that produced by periodic (10-yearly) national surveys.
Garden Mammal Watch - The Badger is one of the species considered for inclusion in the
monitoring of mammals recorded in gardens (see Part III.B.7). An index based on
presence/absence or maximum counts (gathered on a weekly or monthly basis), could beestablished following the approach adopted for the BTO's Garden Bird Watch. This could also
allow the extended monitoring of this component of the national population. There are few
Badgers actually using urban areas, although a few more use gardens on the edges of villages and
small towns. Badger use of gardens varies seasonally, often in relation to rainfall (Stephen
Harris, pers. comm.).
23.5 DEVELOPMENT AND VALIDATION STUDIES
Simulations based on existing datasets should be used to determine to what extent the
stratification used for the most recent Badger survey can be modified to achieve better sampling
efficiency. It may prove possible to reduce the overall sample size and distribution of samples between strata while still maintaining the required power to detect a trend of 25% over 25 years.
23.6 RECOMMENDATIONS
1) The current format of the National Badger Survey should be maintained with the
resurvey of existing sites every 10 years. The survey interval could be adjusted if required,
this being an issue that should be examined by modelling data from the two surveys to
establish how sample size and sampling interval can be adjusted to maximise survey
efficiency and the power to detect the required levels of change.
2) Work examining the relationship between social group size and latrine characteristics
should be continued to establish whether this approach offers increased predictive power.
The flaw with this approach highlighted by Stephen Harris (pers. comm.), i.e. that there is
no latrine production at low population densities, requires further discussion. This
problem may not preclude the collation of valuable data on established populations.
3) Ancillary monitoring data should be gathered through schemes based on the Mammals
on Roads scheme (Part III.B.5) and Garden Mammal Watch (Part III.B.7), and on records
of Badgers within gardens. Harris (Harris 1984; Harris & Cresswell 1987) has
demonstrated the different territoriality of urban badgers and monitoring of Badgers in
gardens may make an important contribution to the overall monitoring of this species.This ancillary data would provide more regular information than that from a 10-yearly
national survey.

8/18/2019 BTO Research Report No.223 - Developing a Mammal Monitoring Programme for the UK
http://slidepdf.com/reader/full/bto-research-report-no223-developing-a-mammal-monitoring-programme-for-the 200/316
BTO Research Report No. 223July 1999
198

8/18/2019 BTO Research Report No.223 - Developing a Mammal Monitoring Programme for the UK
http://slidepdf.com/reader/full/bto-research-report-no223-developing-a-mammal-monitoring-programme-for-the 201/316
BTO Research Report No. 223July 1999
199
24. OTTER Lutra lutra
Widespread, but absent from much of central England and central belt of Scotland. Population
recovering from historical decline, now showing expansion in range and numbers with
consolidation most pronounced in areas with already established populations.
24.1 RECENT AND ONGOING MONITORING WORK
National Otter Surveys - England - Baseline survey work by the Vincent Wildlife Trust was
carried out in England between 1977 and 1979, covering 2,940 full survey sites. These were
distributed at approximately 5km intervals along each waterway, coast or lake/reservoir shore,
within a grid of alternate 50km squares (north-west and south-east diagonals of each 100km
square of the national grid. This gave a mean frequency of six sites per 10km square, with the
sites themselves being 600m in length. Otter signs were found at 170 (5.78%) of these (Lenton
et al. 1980). A second survey was undertaken between 1984 and 1986, rechecking the 2,940
original sites and an additional 248 sites (Strachan et al. 1990), during which Otter signs were
found at 286 sites (8.97%). The most recent survey (1991-1994) examined the same 3,188 sitesas in 1984-86, revealing Otters signs within 706 (22.15%) of them (Strachan & Jefferies 1996).
A comparison of the results for those sites covered in all three surveys suggests a 304% increase
in 14 years.
National Otter Surveys - Scotland - Survey work in Scotland has been carried out by the
Vincent Wildlife Trust largely in parallel to that in England (1977-1979, 1984-1985, 1992-1994).
The baseline survey work covered 4,636 sites (Green & Green 1980) with 57% of these sites
being resurveyed during the second survey (Green & Green 1987). Sites surveyed during the
second survey were those showing evidence of a suboptimal distribution from the baseline
survey.
National Otter Surveys - Wales - Otter survey work in Wales again parallels that in England
(1977-1978, 1984-1985, 1991) with baseline work suggesting that 20% of survey sites were
occupied (Crawford et al., 1979). Repeat survey work was carried out in 1984-1985 (Andrews &
Crawford 1986) and 1991 (Andrews et al., 1993) with the proportion of 'positive' sites rising to
38% and 53% respectively.
National Otter Surveys - Northern Ireland - Northern Ireland was surveyed as part of an
all-Ireland sample survey between 1980-1981 (Chapman & Chapman 1982). Of the 2,177 sites
covered across the whole of Ireland, Otter signs were found at 92%.
All these national surveys employed a similar methodology: 'full survey sites' were examined by
a surveyor who walked one bank of a watercourse for up to 600m searching for Otter spraints.
During the earliest surveys once a spraint was found the search was terminated. During
successive surveys sites were revisited at approximately the same time of year to reduce potential
seasonal bias.
National Water Vole Surveys - The presence of Otter signs was recorded as part of the survey
work carried out during the two national Water Vole surveys (Strachan & Jefferies 1993).
During the most recent Water Vole survey an attempt was made to determine whether Otter

8/18/2019 BTO Research Report No.223 - Developing a Mammal Monitoring Programme for the UK
http://slidepdf.com/reader/full/bto-research-report-no223-developing-a-mammal-monitoring-programme-for-the 202/316
8/18/2019 BTO Research Report No.223 - Developing a Mammal Monitoring Programme for the UK
http://slidepdf.com/reader/full/bto-research-report-no223-developing-a-mammal-monitoring-programme-for-the 203/316
BTO Research Report No. 223July 1999
201
Direct Counts - MMR note that direct sightings may give a more accurate estimate of abundance
than sign surveys on some islands, presumably stemming from the work of Kruuk et al. (1989).
Indirect Counts - The presence of Otters at a site may be determined from various field signs
including sprainting sites, holts, tracks, runways and individual spraints themselves. Of these,
spraints provide the best indication of Otter status within a given area (Jenkins & Burrows 1980;Mason & Macdonald 1987), having a territorial function. Otter spraints are characteristic and
can be readily separated from Mink scats by observers with only a small amount of training
(Gillie Sargent, pers. comm.). Additionally, it has been demonstrated that Otter faeces can be
distinguished from those of Polecat and Mink through the use of DNA analysis (Hansen &
Jacobsen 1999). Bas et al. (1984) found that most spraints were located in places that were
densely wooded or well-wooded, with spraints deposited on boulders, under trees, on tree trunks
and tussocks. However, sprainting behaviour appears to differ between habitat types and the
implications of this for spraint decay rates should be considered (Jenkins & Burrows 1980;
Kruuk et al. 1986; Kruuk & Conroy 1987; Mason & Macdonald 1987). The distribution of
spraints appears to reflect centres of activity and points of contact with other Otters (Green et al.
1984).
Otter spraints appear to offer an ideal means by which the presence of Otters at a site can be
established. The number of spraints (or spraint density) can be used to determine Otter
abundance (or activity), although this approach may be less suitable in coastal habitats. Kruuk et
al. (1986), working on Shetland, could find no correlation between sprainting and the frequency
of use of an area by Otters and concluded that their findings cast '..doubt on the use of spraint
surveys as a method to assess habitat utilisation by Otters' . However, coastal Otters may show
different sprainting behaviour to riverine populations. Mason & Macdonald (1987) note that the
demonstrated seasonal cycle in sprainting activity (Erlinge 1968; Mason & Macdonald 1986)
may '..invalidate any proposed relationship between spraint numbers and Otter populations..'
Importantly, these authors go on to assert that '..the level of variation in sprainting at sites
between catchments can be such that, providing the sample size is sufficient, the technique can be
used broadly to define the status of an Otter population.' Therefore, with large enough sample
sizes, spraint density may provide a broad indication of population status and, as Mason &
Macdonald (1987) note, '..such data may become more valuable when part of a monitoring
programme, rather than a single survey.' These sentiments are echoed by Jefferies (1986) who
later demonstrated correlations between spraint density and percentage occupancy of survey sites
for the most recent Otter survey in England (Strachan & Jefferies 1996).
Kruuk et al. (1989) found that in coastal habitats there is a relationship between the number of
holts and the number of Otters (see MMR for elaboration).
Game Bags - Hunting records from packs of otter hounds have been used to illustrate the
historical decline of the Otter (Chanin & Jefferies 1978). However, the legal protection currently
afforded to the Otter and the cessation of hunting by this method prevent the possibility of using
bag records as a monitoring tool.
Road-deaths - Records of Otters killed on roads can provide some information on distribution
(see objective 5.5.5. in Framework for Otter Conservation on the UK 1995-2000) and on various
aspects of physiology and toxicology (Kruuk et al. 1997). Although this approach is not likely to
provide information of the type required for monitoring purposes, it could be used to pick up
records of Otters as they move into new areas, before the population establishes itself at a levelwhere it could be detected through other monitoring methods.
8/18/2019 BTO Research Report No.223 - Developing a Mammal Monitoring Programme for the UK
http://slidepdf.com/reader/full/bto-research-report-no223-developing-a-mammal-monitoring-programme-for-the 204/316
BTO Research Report No. 223July 1999
202
Mammals on Nature Reserves - Records of Otters on nature reserves could be collated
according to the suggestions outlined in Part III.B.6.
Waterways Breeding Bird Survey (WBBS) - Otter, along with Mink and Water Vole is one of
the few species that could be monitored through the WBBS, although it should be stressed that
this survey is currently still in its pilot stages and may not have funding for continuation beyondthe end of the pilot period. Additionally, the survey is designed to survey a range of bird species
associated with riparian habitats and is therefore not ideal for the transect monitoring of Otter
field signs.
24.4 POTENTIAL MONITORING SCHEMES
Clearly, there are a number of options available which can be used to achieve the monitoring
objectives. Given that a grid of survey sites is well-established and that three national surveys
have been undertaken (with a fourth about to begin - Environment Agency), it would seem
unwise to dismantle what is already an adequate monitoring system without good reason. The
historical data available from the VWT sites provides information on population change as wellas suggesting likely reasons for that change. The detailed information on Otter/Mink interactions
that has come from revisiting the same VWT sites in each survey could not have been achieved
had different sites been selected randomly each time. Continuity is important, not only for this
reason, but also because it allows small changes in the Otter population to be monitored more
effectively by reducing the variation associated with selecting a new sample of squares each time
a survey is carried out (see Part II).
Therefore, a different monitoring scheme should only be used if the current scheme fails to
provide sufficient data for monitoring or if it were not economically feasible to continue funding
such a large multi-annual programme. The current scheme delivers information identifying
trends in the Otter population with acceptable levels of precision, demonstrating the change in
range and highlighting those areas where the population is not consolidating as effectively as
elsewhere. It therefore satisfies the primary objective, although it is expensive to fund.
Consequently, a replacement scheme could be argued for on economic grounds if it were able to
deliver adequate monitoring data at a greatly reduced cost. This would also have to be offset
against the loss of an already existing long-term dataset. It should also be noted that the low
density of the Otter population in some areas would require sampling as intensive as that
employed for the VWT surveys, potentially suggesting that a more economical approach may
compromise data quality.
The replacement suggested by MMR has the potential to provide more detail than the currentscheme, but this additional material is likely to be surplus to the basic requirements of a
monitoring scheme for Otters in that a smaller sample size could be used without reducing the
ability to detect trends of the required magnitude. Additionally, combining the Otter work with
that for Mink and Water Vole (as suggested by MMR) may reduce survey efficiency, as
fieldworkers require different 'search-images' for the different species. A combined survey might
also fail to target fieldwork effort most effectively, notably because the three species often
occupy different riparian habitats. The most recent Water Vole survey highlights this, with the
grid of Water Vole survey sites providing a poor estimate of Otter population size (see above).
This is the result of an inappropriate selection of study sites (for Otters) and sampling intensity
(Don Jefferies, pers. comm.).
A volunteer-based transect method involving the recording of field signs (across the grid of
existing sites) could provide a more cost-effective monitoring programme, while maintaining

8/18/2019 BTO Research Report No.223 - Developing a Mammal Monitoring Programme for the UK
http://slidepdf.com/reader/full/bto-research-report-no223-developing-a-mammal-monitoring-programme-for-the 205/316
BTO Research Report No. 223July 1999
203
continuity of the historical dataset. The Mammal Society has demonstrated that volunteers can
be trained to identify Otter spraints and, with technical support to help identify difficult spraints,
there is no reason to expect any reduction in data quality with volunteer involvement. Use of
multiple fieldworkers, rather than the single fieldworker employed on the VWT, has distinct
advantages (see Part V), although the seasonal component of the existing methodology may need
to be changed. It also appears that a sufficient number of volunteers could be recruited (StephenHarris, pers. comm.). The use of trained volunteers could be tested during a pilot study or as a
component of the forthcoming Otter survey of England. Professional recorders would be needed
in the more remote parts of the country where observer coverage would otherwise be low.
Although trained volunteers fieldworkers could carry out much of the survey work, they would
need to be supported by a professional national co-ordinator (also co-ordinating American Mink
and Water Vole) and possibly local co-ordinators (such as the Environment Agency Otter
Officers). A proportion of collected spraints could be sent in for validation and a proportion of
the survey sites could be visited by professionals, again for validation purposes.
24.5 DEVELOPMENT AND VALIDATION STUDIES
A data-modelling exercise (using data from the national Otter surveys for England) should be
used to establish whether the number of sample sites can be reduced without reducing the power
of the approach for detecting trends of say 25% over 25 years. This exercise could also be used
to examine the ideal interval between surveys based on the power of detection and the costs of
implementing the survey. This could be carried out at the same time as modelling potential
sampling protocols for other species (e.g. Badger: Cresswell et al. 1990; Wilson et al. 1997).
24.6 RECOMMENDATIONS
1) Monitoring work should build on the three previous national Otter surveys and there is
a great deal to be gained by continuing a national Otter survey every seven years using
volunteer input. The recommended interval of seven years is based on the balance between
survey costs and the need to obtain regular monitoring data. The steady change in the
Otter population is not so dramatic that more regular surveys are currently needed,
although the sampling interval could be adjusted in light of the modelling exercise
recommended in (4) or as a result of changes in the rate of Otter population change.
2) More intensive monitoring should be carried out at a reduced number of sites to provide
a better understanding of the processes limiting recovery in certain areas. Such work
should examine the relationship between population recovery and catchmentcharacteristics (notably pollution) thus enabling aim 5.5.4 of the action plan to be
addressed. Liaison with groups carrying out ongoing work at the local level may highlight
appropriate study areas.

8/18/2019 BTO Research Report No.223 - Developing a Mammal Monitoring Programme for the UK
http://slidepdf.com/reader/full/bto-research-report-no223-developing-a-mammal-monitoring-programme-for-the 206/316
BTO Research Report No. 223July 1999
204
3) Work examining the feasibility of monitoring Otter populations using the VWT
methodology and sites but with volunteers, rather than a single professional observer,
should be investigated. The completion of this pilot work, together with that outlined in (4)
should be completed prior to the implementation of recommendation (1).
4) A parallel monitoring approach would need to be developed for coastal populations,which, although seemingly more stable, are at risk from catastrophic events such as oil
spills and the effects of sea-level rise.
5) Data from the previous Otter surveys should be used to establish whether the number of
sample sites can be reduced without reducing the power of the approach for detecting
trends of 25% over 25 years. The value of altering the survey interval should also be
evaluated as part of this modelling process.
6) More effort should be targeted towards understanding and quantifying the relationship
between Otter density and spraint density. As Otter numbers increase and the number of
occupied sites also increases, so data on the occupancy of sites becomes less valuable formonitoring purposes. Abundance data will highlight where changes in numbers occur
without a corresponding change in the number of occupied sites. This could be important.
7) Ancillary data should be gathered through Mammals on Nature Reserves (Part III.B.6)
and Mammals on Roads data (Part III.B.5) both of which would contribute to the gathering
of distribution data, with the former also providing a simple index of occurrence on an
annual basis.

8/18/2019 BTO Research Report No.223 - Developing a Mammal Monitoring Programme for the UK
http://slidepdf.com/reader/full/bto-research-report-no223-developing-a-mammal-monitoring-programme-for-the 207/316
BTO Research Report No. 223July 1999
205
25. WILDCAT Fel is si lvestr is
Native; rare and restricted to upland Scotland (extinct in Ireland, England and Wales); population
probably stable but threatened by hybridisation with Feral Cats F. catus: genetic status in
question.
25.1 RECENT AND ONGOING MONITORING
Game Conservancy Trust National Game Bag Census - Game Bag data were collected
centrally by the GCT from 1960 until 1985, when the Wildcat was given legal protection. The
data will suffer from the problems inherent in all Game Bag records (see Part III.A.2). More
Game Bag data will not become available in the future because Wildcats are hugely unlikely
again to be made legal quarry (although persecution certainly persists).
Wildcat Survey of Scotland - A questionnaire survey (1983-1987) involving interviews with
gamekeepers, forest rangers, volunteers and others which solicited sightings information and was
widely publicised in Scotland (Easterbee et al . 1991). Sampling was based on the 100x100kmnational grid squares, with several 10x10km squares sampled within each 100x100km square.
Wildcats in blocks of 3x3 10x10km squares were then classified as rare/absent, rare, occasionally
seen or established.
SNH survey of wild-living cats in Scotland - As part of a study investigating the definition of
the Wildcat and the phenotypic variation found in the extant population of wild-living cats,
Balharry & Daniels (1998) supervised trapping efforts across Scotland using baited cage traps
(primarily for the purpose of collecting blood samples and morphological data). Formal attempts
to estimate abundance or other population parameters were not made, but a total of 44 cats were
caught over 5,558 trap-nights of effort (giving a mean of c. 130 trap-nights per cat). Comparable
numbers of non-target species were also caught, most of which were Pine Martens.
Investigation of Wildcat genetics - Studies of the genetics of Wildcats, Feral Cats and their
hybrids by SNH and the Wildlife Conservation Research Unit (University of Oxford) are
currently in progress.
25.2 WILDCAT GENETICS
Wildcat morphology has traditionally been defined as being identifiable from that of Domestic
and Feral Cats by means of a number of field characters. The typical coat is a tabby mixture of
black and a grey-brown which varies in darkness. Key diagnostic features are large size, longlegs, no dark stripe on the back at the base of the tail, fewer dark stripes on the body and fewer
rings on the bushy, black-tipped tail (Kitchener 1995). Introgressive hybrids with Feral Cats are
identifiable by various “domestic” features such as smaller size and unusual coat colours such as
patches of white: colour variants in Wildcats are believed to be very rare (Kitchener 1995),
although this could surely reflect a reporting bias against “hybrids”.
Recent morphological analyses have suggested that there is no “genetically pure” population of
Wildcats, derived from the native, ancestral stock, which can be distinguished from Feral Cats
(Balharry & Daniels 1998). This suggests that introgression has proceeded to such an extent that
the feral and wild populations are now effectively integrated, and that the (single) type specimen
from which Wildcat morphology was defined (in 1907) may have come from a population whichalready possessed feral genes. Balharry & Daniels (1998) found that two groups of cats (“group
1” and “group 2”) could be identified by a linear discriminant function incorporating gut length
8/18/2019 BTO Research Report No.223 - Developing a Mammal Monitoring Programme for the UK
http://slidepdf.com/reader/full/bto-research-report-no223-developing-a-mammal-monitoring-programme-for-the 208/316
BTO Research Report No. 223July 1999
206
and skull size. Other features, such as pelage colour and pattern and other morphological
measurements did not allow any other groupings to be defined. Group 1 cats had larger skulls
and shorter guts, as well as a higher ratio of tabby to other coat colours (but coat colours were far
from exclusive). Records of group 1 cats also tended to be separated geographically from those
of group 2 cats and tended to come from colder, drier areas. It is tempting to suggest that group
1 cats represent genuine Wildcats, but there is no evidence to support this conclusion. In particular, the possibility that the morphological differences between group 1 and group 2 cats in
fact reflects the influence of natural selection on the same (wild mixed with feral) gene pool
cannot be discounted.
Balharry & Daniels’ (1998) analyses have been criticised (A.C. Kitchener, pers. comm.), but no
written account of the relevant arguments was available at the time of writing. It is possible, for
example, that Balharry & Daniels’ analyses involved only hybrid individuals and that a true
Wildcat population exists in areas that they were unable to sample. It would seem that the only
way to resolve the discrepancy would be to investigate the genetic differences between the
traditional Wildcat phenotype and those of Feral Cats and putative hybrids. The genetic
investigations currently in progress should hopefully provide the necessary information.
25.3 MONITORING OBJECTIVES
Considerable confusion remains as to how a “Wildcat” should be defined. At present, opinion is
divided on whether a genetically distinct and identifiable Wildcat, as opposed to a gradation from
more wild to more feral genotypes, exists (Kitchener 1995, pers. comm.; Balharry & Daniels
1998). Identification of the characteristics of the population to be monitored is the first priority
and must precede the establishment of any monitoring scheme.
It may not be necessary to identify a genetically and/or morphologically distinct Wildcat
population to design an effective monitoring scheme. We suggest that monitoring should focus
on cats in the niche of the ancestral Wildcat (insofar as it exists in contemporary Britain). If a
distinct Wildcat population does exist, this will form some of the population monitored (along
with hybrids which possess “wild” genes). If Scottish wild-living cats are a fully hybridised
population, it suggests that Feral Cats and Wildcats cannot be regarded as different species in any
biologically meaningful sense. It may be notable that domestication has selected cats primarily
for exotic pelage colours and socialisation. If these form the principal differences between the
wild and domestic genotypes, the distinction is likely to disappear rapidly from feral populations
by natural selection: populations in the “Wildcat niche” should therefore become “wilder” over
time (given that introgression is limited in the future). In addition, if the aim of the conservation
effort is to preserve genes from the ancestral Wildcat population, these may now be found inmany “hybrid” and “feral” individuals: trying to conserve (and monitor) any given phenotype
would then merely be an exercise in aesthetics.
We suggest that the aims of monitoring could be (i) to monitor long-term changes in the genetic
and morphological make-up of the wild-living cat population in Scotland (concentrating on areas
away from human habitation), and (ii) to monitor the range and abundance of wild-living cats in
general. Areas considered as core ones for the Wildcat phenotype (with buffer zones around
them) could be chosen as key areas for the monitoring of population trends and introgression by
feral stock.
8/18/2019 BTO Research Report No.223 - Developing a Mammal Monitoring Programme for the UK
http://slidepdf.com/reader/full/bto-research-report-no223-developing-a-mammal-monitoring-programme-for-the 209/316
BTO Research Report No. 223July 1999
207
25.4 POTENTIAL MONITORING TECHNIQUES
Spotlighting - This method would allow visual transects to be conducted (at night), potentially
giving standardised information. However, the method has important disadvantages (see Red
Fox species account: IV.16). Identification is also likely to be a problem if phenotypic
distinctions are to be made among wild-living cat types.
Road-deaths and other carcasses - Carcasses provide a cheap source of detailed information on
morphology and (potentially) genetics which can be stored for reassessment in the light of future
developments in Wildcat taxonomy or in policy. Specific solicitation of Wildcat carcasses is
likely to be necessary since encounter rates will be very low and the species is unlikely to be
monitored effectively by a generic Mammals on Roads survey (see Part III.B.3). Carcasses will
be obtained more frequently from areas near towns and villages, so such biases would have to be
taken into account.
Live trapping - This method is probably the only one that would allow unbiased sampling of all
habitats and also allow morphological recording and genetic sampling, but it has importantdisadvantages. It requires very specialised training, licensing and considerable field effort.
Landowner permission and free access may also be a problem, especially where cats are most
abundant, because illegal control is most likely to occur on such land.
Questionnaire surveys - Both the general public and experienced professionals such as reserve
wardens, gamekeepers and foresters could be targeted to supply sightings information with as
much ancillary information as possible. Such an approach would provide information on
changes in range and perhaps, crudely, on abundance, but would be highly dependent on the
precise questions asked. A useful approach might be to ask not just for records of Wildcats, but
of Feral Cats too, together with some record of the reason for the decision made (e.g. pelage
colour, behaviour). As with most protected species which are considered a threat to gamekeeping
interests, records (or a lack of records) from shooting estates would have to be treated with
caution.
Field signs - Cat scats are deposited in exposed sites as territory markers, so could be used to
assess presence or abundance. The scarcity and distribution of wild-living cats in Scotland means
that sufficient numbers of cat scats are unlikely to be recorded by a generic Sign Transect Survey
(see Part III.B.2) to monitor the population which is of conservation interest. Given suitable
genetic markers, scats could also be used to monitor the genotypes of wild-living cats. As with
carcasses, a central collection of scats would allow re-assessment of any classification in the
future.
25.5 POTENTIAL MONITORING SCHEMES
Road-deaths and live-trapping - MMR recommend that Wildcats are counted by spotlighting
and faecal counts in surveys also monitoring Red Foxes (which would be conducted every seven
years), combined with the collection of road-deaths which could be stored until genetic
differentiations can be made. They concede that spotlighting for Wildcats has yet to be tested:
given the problems with counts of foxes by spotlight (see Red Fox), it is unlikely that Wildcats (a
still more wary species) will be counted easily, although they are shot by spotlight. Cats and
foxes can also be difficult to distinguish at the edge of spotlight teams (S. Harris, pers. comm.).
MMR also suggest that standardised live-trapping may present the most reliable monitoringtechnique, despite the effort and cost involved. However, live-trapping could well be biased by
problems with access, so may not justify its high cost.

8/18/2019 BTO Research Report No.223 - Developing a Mammal Monitoring Programme for the UK
http://slidepdf.com/reader/full/bto-research-report-no223-developing-a-mammal-monitoring-programme-for-the 210/316
BTO Research Report No. 223July 1999
208
Combined Mammals on Roads, questionnaire and field sign surveys - We suggest that an
ongoing scheme soliciting road-deaths and questionnaire data would be the best core approach,
in accordance with the consensus of expert opinion in MMR (p. 180). Mammals on Nature
Reserves (Part III.B.6) could also contribute. Collation (including report/newsletter production)
could be via SNH or a central mammal monitoring body and would perhaps be annual for
questionnaire data and five-yearly for road-deaths (whereupon the accumulated collection ofcorpses would be measured and DNA samples analysed). The collation ought to require no more
than one month of staff time per year. Occasional scat surveys would then allow estimates of cat
abundance and distribution to be made and these could be calibrated genetically via the road-
deaths data. Such surveys would probably have to be conducted professionally because of the
likely difficulty in volunteer recruitment in remote areas. Access problems could perhaps be
reduced by the broadening of such a survey to include other, less contentious species, making the
survey less sensitive politically, even if the additional data accumulated were of little value for
the extra species.
25.6 RECOMMENDATIONS
1) Consensus on the characteristics of the wild-living cat population to be monitored must
first be reached.
2) We suggest that the population to be monitored should consist of all wild-living cats
found away from centres of human population. Road-deaths and questionnaire data could
be used to monitor this population, with records categorised as wild or feral according to
all available criteria (i.e. appearance, behaviour, measurements, etc.). Where possible,
genetic reference material should be collected, stored and analysed periodically (provided
that suitable genetic markers can be found) to monitor any spread of hybrids or Feral Cats.
Such surveys would give information on changes in range and distribution.
3) Occasional scat surveys should also be considered. They would supply information on
changes in the abundance of wild-living cats which could be calibrated by phenotype (and
perhaps genotype), if desired, by the results of the monitoring suggested under point 2.
Given suitable genetic markers, scat collection could perhaps also contribute to any genetic
calibration.
4) The Mammals on Roads and Mammals on Nature Reserves schemes could contribute
useful data to the monitoring of wild-living cats.
8/18/2019 BTO Research Report No.223 - Developing a Mammal Monitoring Programme for the UK
http://slidepdf.com/reader/full/bto-research-report-no223-developing-a-mammal-monitoring-programme-for-the 211/316
BTO Research Report No. 223July 1999
209
26. WILD SWINE Sus scrofa
Native but hunted to extinction. Current population of 100-200 in c.100km2 of Kent and East
Sussex originated from only two escapes, that of 20 or more in a smaller area of Dorset from just
one escape. Widely kept in captivity and escapes not uncommon.
26.1 RECENT AND ONGOING MONITORING WORK
None but CSL (1998) has assessed the species’ current status in England and CSL is currently
studying the British population.
26.2 MONITORING OBJECTIVES
We note that Howells & Edwards-Jones (1997) concluded, on the basis of a simulation model of
the Minimum Viable Population, that “the goal of establishing a self-sustaining population of
Wild Boar in Scotland is unrealistic in the short-term”. We also note that, in contrast, Feral Pig
and Wild Swine populations have become established in very many parts of the world, often onquite small islands (Lever 1994) and that the two English Wild Swine populations seem to have
established themselves readily. Given this practical experience, the analysis by Howells &
Edwards-Jones should not be taken as an excuse for complacency in respect of Wild Swine.
It should be noted that there are strong views on the presence of Wild Swine in the British
countryside. For example, Jackson (1999) argues that it is already far too late to eradicate the
species and that it should be managed properly as a quarry species, whereas the Game
Conservancy Trust argue that it can and should be eliminated (Dr Stephen Tapper, pers. comm.)
Some welcome its return as a native animal, playing its natural part in British forests and
providing an economic resource through hunting. Others point out that the ecology of Britain is
now quite different from what it was before Wild Swine became extinct (in particular, predators
such as Brown Bear Ursus arctos are no longer present and various other herbivores have been
introduced); they point to potential problems of both economic conservation damage to
woodlands, damage to crops and agriculture, predation on lambs, attacks on people and dogs,
road traffic accidents, and the dangers (in the crowded British countryside) of using appropriately
high-powered fire-arms to hunt Wild Boar. Given the potential economic impact of this species
and the strength of the divergent views of how it should be managed, sound monitoring is
particularly important.
26.3 RECOMMENDATIONS
We recommend that the monitoring of this species be considered promptly when CSL has
reported on its current project. It will then be possible to define more clearly the nature of
the problem (if there is one), the management objectives and the best monitoring methods
for use in Britain.

8/18/2019 BTO Research Report No.223 - Developing a Mammal Monitoring Programme for the UK
http://slidepdf.com/reader/full/bto-research-report-no223-developing-a-mammal-monitoring-programme-for-the 212/316
BTO Research Report No. 223July 1999
210

8/18/2019 BTO Research Report No.223 - Developing a Mammal Monitoring Programme for the UK
http://slidepdf.com/reader/full/bto-research-report-no223-developing-a-mammal-monitoring-programme-for-the 213/316
BTO Research Report No. 223July 1999
211
27. DEER
As recognised by MMR (p. 38), deer are a special case among the groups of mammals found in
the UK. They are of interest to people concerned with conservation, forestry, agriculture, animal
welfare and field sports: these interest groups have each collected data on some aspects of deer
.populations, but in ways both diverse and often less than ideal for monitoring (especially at thenational level). A detailed assessment of current and historical deer monitoring is given by
MMR, so we do not repeat it here. Instead, we focus on how new proposals can be combined
with the high quality data which is already being collected, to allow deer populations to be
monitored nationally. Following MMR, we deal with the monitoring of all UK deer species
together: although they exist in a wide range of habitats and vary in behaviour, discussion of the
pros and cons of monitoring approaches applies to all species. MMR were asked to consider only
four deer species; we have broadened the species range to consider all species living wild in the
UK.
RED DEER Cervus elaphus : native to Britain and Ireland; locally very abundant, but
distribution patchy, rarer in Ireland and absent from the North; numbers stable either naturally orunder control by culling; also subject to translocations and introductions.
SIKA DEER C. nippon : introduced to Britain and Ireland; widespread in Scotland, more
localised in England, Wales and Ireland; not abundant, but increasing in Scotland. Hybridising
with C. elaphus and may effectively be indistinguishable.
FALLOW DEER Dama dama : introduced to Britain and Ireland; widespread, especially in
southern Britain and central Ireland, but patchily distributed elsewhere.
ROE DEER Capreolus capreolus : native with reintroductions in Britain, absent from Ireland;
widespread throughout Britain except Wales and Midlands, abundance patchy; range is
expanding, probably along with abundance.
REEVES’ MUNTJAC Mun tiacus reevesi : introduced; south and east Britain only, patchy
distribution reflects introduction sites; rapidly increasing but may soon saturate some areas.
CHINESE WATER DEER Hydropotes inermi s : introduced; uncommon, localised, primarily
found near introduction sites in south-east England; not increasing significantly.
27.1 RECENT AND ONGOING MONITORING WORK (REVIEWED IN DETAIL BY
MMR)
Historically, deer monitoring has been organised mostly only at a local scale, with a view to the
management of local populations either for sporting interests or to control damage to agriculture
and forestry. The best ongoing schemes monitoring abundance are as follows:
The Deer Commission for Scotland (DCS)/Scottish Deer Management Groups - annual and
five-yearly total counts for Red and Sika Deer populations made when the animals are relatively
concentrated on lower ground in late winter and therefore most easily counted. Complete
censuses of Scottish populations are made. There is some doubt as to the genetic integrity of
many Scottish Red Deer populations after possible hybridisation with introduced Sika Deer, but
this may simply mean that effective monitoring cannot distinguish between the two “species” and
their hybrids.
Services Branch of the British Deer Society - complete annual censuses of all deer found on
Ministry of Defence land (all those listed except Chinese Water Deer) are made using the most
appropriate method for each site: where complete, direct counts are not possible, populationestimates are made using correction factors for unseen individuals.
8/18/2019 BTO Research Report No.223 - Developing a Mammal Monitoring Programme for the UK
http://slidepdf.com/reader/full/bto-research-report-no223-developing-a-mammal-monitoring-programme-for-the 214/316
BTO Research Report No. 223July 1999
212
Forestry Commission - the monitoring of all deer species on all Forestry Commission properties
using locally appropriate methods is now being encouraged, and will be made more rigorous and
standardised in future, with pellet counts and distance sampling by thermal imaging as the core
approaches. Population indices, rather than complete censuses, are likely to be the goal of this
monitoring.
Exmoor Deer Management Society - annual census data for deer on Exmoor.
The precise methods used by these surveys differ, but all aim to provide estimates of population
size within designated areas. In each case, the surveying organisations have a vested (and often
commercial) interest in promoting the accuracy and precision of deer monitoring which should
only enhance the value of these surveys. Potential biases due to political pressures must,
however, always be considered when information on politically sensitive issues is collated.
Other data collected under various schemes primarily comprise cull data, bag returns and pres-
ence/absence surveys (conducted nationally by the British Deer Society). The latter would
clearly give information on changes in distribution, but may not be closely related to changes inabundance, especially in terms of relationships with habitat (Chamberlain et al. 1999).
Relationships will also be weaker for species which live in large social groups, as do Red, Sika
and Fallow Deer. As with all population sampling methods, the utility of cull data, bag returns
and other mortality data, such as those from road accidents for monitoring abundance, depends
on the recording of “sampling effort”. Unless effort has been constant, the effects of changes in
methods must be controlled for in indices of changes in population size. In cull and bag data, the
time spent stalking, the quality of equipment, the ability of personnel, the methods used and the
areas visited must all be recorded, together with information on the effects of variation in these
parameters (see Part III.A.2). Changes in any of these could produce spurious apparent changes
in a population index. Nevertheless, mortality data (if complete) can be used to assess population
size and structure retrospectively and thus to check previous censuses (MMR). Such information
can be vital for the management of local populations, because of the importance of population
structure in the design of culling strategies.
27.2 MONITORING OBJECTIVES
Nationally, it may be desirable to monitor changes in range and abundance for each species to
provide information on conservation status and biodiversity. Local monitoring may also be
extremely important for deer because it is at the local scale that any management which aims to
prevent habitat damage or to estimate the size of sustainable annual harvests must occur.
Monitoring of range change may be important for the species which are believed to be expandingtheir ranges: Sika, Roe and Reeves’ Muntjac. Deer are important economically and can have
large impacts on their environments and on other wildlife: these factors suggest monitoring
priorities in addition to those due to the monitoring of the health of the countryside.
27.3 POTENTIAL MONITORING TECHNIQUES
A comprehensive review of the methods available for the monitoring of deer is presented in
Mayle & Staines (1998) (summarised in MMR), so we consider only the best of the methods
here. The diversity of habitats occupied by deer mean that a single monitoring approach could
not be recommended for all species, or indeed across the complete range of some individual
species. Mayle & Staines recommend a different basic method for each of open hill and woodedhabitats and also consider the use of more technologically sophisticated approaches.
8/18/2019 BTO Research Report No.223 - Developing a Mammal Monitoring Programme for the UK
http://slidepdf.com/reader/full/bto-research-report-no223-developing-a-mammal-monitoring-programme-for-the 215/316
BTO Research Report No. 223July 1999
213
Open hill areas (Red and Sika Deer): direct counts - Direct count methods as currently
applied by the Deer Commission for Scotland are recommended by Mayle & Staines (1998).
Counts might be made more often than is currently the case, but otherwise the approach used by
the DCS could be adhered to. In Scotland, counts are made by teams of stalkers who use radio
contact to avoid double-counting in each of 50 blocks which cover the whole range of red deer,
and which each feature “fairly self-contained” deer populations. Animals are counted on openground and, where necessary, flushed from cover. Some will nevertheless be missed, so the
counts are regarded as minima. The counting system is designed to estimate total population size
but might provide reliable information on population changes more efficiently if a randomised
sample of blocks were covered using repeat visits. The nature and spatial distribution of counter
effort within open hill areas outside Scotland would determine whether a sampling or total count
approach would be most appropriate in each area.
Woodland and partially wooded landscapes: pellet-group counts - Mayle & Staines (1998)
concluded that total and sample (plot or transect) counts are unreliable because deer are cryptic in
these habitats and therefore difficult to detect. Of indirect methods, Mayle & Staines concluded
that faecal pellet counts were the most suitable, made using one of two methods: faecalaccumulation rate (FAR) or faecal standing crop (FSC), both of which are best conducted in
winter when vegetation growth is low and decay times are long. FAR requires multiple visits to
a sample plot or transect strip and involves the recording of the pellet groups present on each
occasion. FSC requires only a single visit but depends critically on decay rates. Defecation rates
and decay times vary with habitat, diet and season and need to be known if absolute abundance is
to be estimated. However, the estimation of population change would require only that these
parameters do not change over time within plots. Mayle & Staines (1998) suggest that FAR is
best used where deer densities are high and FSC where densities are lower, but that FSC may
also be the best option when observer time is limiting since fewer, less time-consuming visits to
each plot are required. Pellet groups suffer from a potential identification problem where species
of a similar size co-exist and/or where sheep and goats are also found. In such cases, data where
species cannot be determined with certainty can be omitted from population indexing analyses:
although this would bias estimates of absolute abundance, it should not affect relative indices
unless identifiability changes with time. The identifiability problem may mean, however, that it
is not feasible to use volunteers for pellet count surveys where more than one similarly-sized deer
species occurs. Some experts consider that identifiability presents insurmountable problems that
invalidate pellet-based methods (in practice) for deer monitoring (S. Harris, pers. comm.).
Other methods - Mayle & Staines (1998) discuss a range of further monitoring approaches. In
terms of providing improvements on estimates produced using the methods described above, the
most important of these are aerial transect counts for deer in open country (using helicopters ormicrolight aircraft) and transect counts with distance sampling done using thermal imaging.
Both of these approaches will probably be too expensive to be practical for repeated, large-scale
monitoring projects, but could perhaps be used for the purposes of calibration, either in a one-off
national survey or in the repeated (annual) censusing of particular populations.
Visual transects - The line transect methods as used by the Breeding Bird Survey (see Part
III.A.1) are not ideally suited to deer monitoring (Mayle & Staines 1998, MMR) but this survey
8/18/2019 BTO Research Report No.223 - Developing a Mammal Monitoring Programme for the UK
http://slidepdf.com/reader/full/bto-research-report-no223-developing-a-mammal-monitoring-programme-for-the 216/316
BTO Research Report No. 223July 1999
214
produces presence/absence information at the 1km square scale together with standardised
habitat data which could be useful. The chief advantage of BBS data in this context is that it is
already being collected and is based on a random sample of the UK landscape. The BBS could
also provide a useful independent check on presence/absence data collected by the British Deer
Society and the Institute of Terrestrial Ecology (see MMR Chapter 2, Section 3). Sightings data
from Winter Transects (see Part III.B.1) may supply better data on deer because the animals will be more visible.
Specific, deer-focused transect counts form a monitoring technique recommended by some
experts (S. Harris, pers. comm.): to be most effective, these counts would be conducted at first
light or at dusk and would follow routes along the edges of woods and along rides. Easily
identified field signs (such as tracks) could also be recorded at the same time.
Presence/counts in gardens - The occurrence of deer in gardens could provide important
information, especially on range changes, for Reeves’ Muntjac and Roe Deer, which commonly
enter gardens where they occur.
Road-deaths - Road-death sightings, especially when combined with measures of sampling
effort as recommended for our proposed Mammals on Roads survey (see Part III.B.3) could
supply useful information, especially on distribution and changes in range. Again, the smaller
species will be monitored best by such data.
Presence/counts from nature reserves - Reserve wardens could contribute valuable data,
especially on presence/absence, which could be used to chart changes in range. Reserves are
unlikely to be representative of wider land-use, so will be of less value as a source of count data
(but see Part III.B.4).
27.4 POTENTIAL MONITORING SCHEMES
MMR recommended approach - As part of the QQ grid-based MaMoNet system, MMR
recommend transect-based pellet-group or direct counts (with supplementary methods including
vantage point counts, woodland edge counts and analyses of cull data as necessary or appropriate
for particular species) for five randomly selected 1km squares within each 10km square to be
surveyed (although the details of the method proposed are sometimes unclear). Transects would
be “crenellated to cover the entire square”. Where the 1km square may be too small a sampling
area to produce repeatable data, i.e. for more mobile (less territorial) and more gregarious species
such as Fallow and Red Deer, 5km squares are also suggested as the sampling unit if populations
in entire 10km squares cannot be censused. Absolute densities would presumably be estimatedfor each survey square. Complete surveys are proposed every seven years, with additional, more
intensive monitoring in the key areas for species’ range expansion. Proposals gleaned from
discussion with deer experts but not used explicitly in the MaMoNet (MMR, p.184) also include
recommendations that at least 2000 1km squares which encompass the known range of each
species plus a 50km buffer zone around the ranges of Roe, Sika and Reeves’ Muntjac should be
covered every five years using 1km transects, and that each square should contain at least one
block of woodland of more than 1ha.
The MMR method has the advantage of being geographically unbiased and is therefore a sound
basic sampling strategy to cover national populations. The statistically robust background to the
design of the MaMoNet is a further advantage. The use of absolute densities as a “common
8/18/2019 BTO Research Report No.223 - Developing a Mammal Monitoring Programme for the UK
http://slidepdf.com/reader/full/bto-research-report-no223-developing-a-mammal-monitoring-programme-for-the 217/316
BTO Research Report No. 223July 1999
215
denominator” also allows the results of disparate monitoring methods to be combined
meaningfully. In practice, this could represent the only way in which an internally consistent
national system for the monitoring of deer could be designed. However, there are several
problems with the approach proposed, most of which are practical. First, the method ignores the
large amounts of high quality data which are already being collected for deer populations in some
habitats or regions (see above), which must at least be inefficient. Second, having methodswhich are not fully standardised but require a professional assessment of the action needed to
measure the densities of all species found in a given 1km or 10km square restricts the survey
work to highly qualified surveyors. Third, where good data are being collected, the available
pool of surveyors (if professionals are not to be used) would be asked either to add to their
existing work or to replace it; this is unlikely to be popular when the new data are likely to be of
less use, locally, than those already being collected. Fourth, considerable concern has been
expressed about the reliability of pellet count methods (S. Harris, pers. comm.). Fifth, the
MaMoNet concept is centred on the idea of national monitoring and, ultimately, single species-
specific figures for population changes. Like those of many other mammal species, deer
populations are probably not mobile enough to mix to such an extent that the whole of Britain or
of the UK can be meaningfully considered to hold a single, homogeneous population. It mighttherefore be more desirable to monitor deer species according to biologically meaningful
divisions and to combine the results of such monitoring schemes if and when it is required
politically. This would allow the needs of local and national monitoring to be combined.
Combining existing and new schemes - Although the MMR method may be the only way to
obtain an internally consistent national survey of deer populations (subject to the methods being
ratified), we suggest that this requirement could be relaxed. We consider that the objectives for
UK deer monitoring can be met by using the existing monitoring schemes which generate high
quality data and by supplementing them with new survey information which fills the
geographical and species gaps in the current monitoring spectrum. Current deer monitoring
probably covers most of the ranges of Red, Sika and Fallow Deer effectively through the
schemes run by the Deer Commission for Scotland, Services Branch of the British Deer Society,
Forestry Commission and Exmoor Deer Management Society. British Deer Society cull data
provide further monitoring information on distributional changes.
Several options exist for the monitoring of the other species and areas. Most accurate would be
dedicated deer surveys, which would have be species-specific and to be conducted in winter. For
open hill species (almost always Red Deer outside Scotland), direct counts of large randomised
survey areas (say, 2!2km tetrads) would be the best method and could be conducted by
volunteers. For woodland species, expert opinion is divided, suggesting that further discussion
and pilot work is necessary to identify methods which are widely acceptable. One option is to usefaecal pellet count methods (either FSC or FAR methods according to the availability of
resources and distribution of sample sites: Mayle & Staines 1998), working on small plots (a
minimum of 10!10m) or transects (say, 1km). Different transect lengths or plot sizes would be
most appropriate for species with different social behaviour (e.g. Roe and Fallow Deer), but
compromise may be needed to allow such species to be monitored by a single scheme (such as an
adjunct to our proposed Sign Transect Survey: Section III.B.2). The considerable difficulties with
pellet identification mean that professional surveyors would probably be required to conduct
these surveys; volunteers could be trained to make the identifications (perhaps with professional
support by post in difficult cases) but deer pellets are not currently covered by The Mammal
Society’s Look Out for Mammals courses. However, even professional surveyors may be unable
to identify a sufficient proportion of the pellets they find for monitoring to be effective,especially in areas with which they are unfamiliar. The alternative approach is to use a dedicated
visual transect method, with routes designed to maximize encounter rates (i.e. concentrated in

8/18/2019 BTO Research Report No.223 - Developing a Mammal Monitoring Programme for the UK
http://slidepdf.com/reader/full/bto-research-report-no223-developing-a-mammal-monitoring-programme-for-the 218/316
BTO Research Report No. 223July 1999
216
late evening/early morning and directed along woodland rides and edges). Such an approach
would need research into the specifics of its design to optimise the monitoring of each species
and the concerns with habitat-specific differences in detectability would have to be addressed.
Less accurate information, but sufficient at least to monitor changes in range, could be obtained
at much lower cost from the general, multi-species schemes suggested elsewhere in this report:the Breeding Bird Survey (Part III.A.1), Mammals on Roads surveys (Part III.B.3), Winter
(visual) Transects (Part III.B.1), Sign Transects (Part III.B.2) and Garden Mammal Watch (Part
III.B.5). In addition, simple sightings data, solicited from key potential range expansion areas for
Roe Deer, Reeves’ Muntjac and Chinese Water Deer, through county Wildlife Trust magazines
(for example), would give information on distributional change. None of these might be ideal
individually, but each would be subject to different biases and sources of error such that patterns
common to a number of survey schemes would be highly suggestive of genuine changes.
Before the implementation of such new schemes, the principal requirement for coordinated
national deer monitoring is a body which can collate the data collected by the specialist deer
organisations and combine them with information from the general mammal or deer-specificschemes. Such a body would also be best-placed to administer the latter. It might be most
efficient for this overall monitoring organisation to form part of whatever body oversees general
mammal schemes such as a Winter Transect Survey, and it could be as small as a single
individual working within such a body. The coordinating work should be co-supervised by a
committee drawn from the various groups interested in deer, or at least by a combination of Deer
Initiative and Deer Commission for Scotland representatives, and significant input from scientists
in the deer research community should be incorporated.
The coordination work would involve combining region and habitat-specific data from the
modular system outlined above. It may not be biologically meaningful to combine data from
disparate schemes monitoring different areas, so it should be acceptable to index populations
from different habitats and/or regions separately. However, if a combined index is required (for
example, for national biodiversity targets), the deer monitoring coordinator(s) could calibrate the
individual surveys using habitat- or region-specific estimates of density and construct some kind
of meta-index.
27.5 RECOMMENDATIONS
1) The amount and quality of information required from monitoring work on each species
must be decided as a first priority. This will then determine the need for new survey
schemes to be established and the extent to which existing schemes meet the objectives ofmonitoring.
2) The second priority is the establishment of a national coordinating body for deer
monitoring, perhaps through collaboration between the Deer Initiative and the Deer
Commission for Scotland. This body, ideally through staff within a national mammal
research organisation, would collate the data collected under existing schemes, set up and
administer any new surveys required and combine the information into indices or
summaries addressing national deer monitoring aims. This work should require no more
than one full-time post within an umbrella mammal monitoring organisation.
8/18/2019 BTO Research Report No.223 - Developing a Mammal Monitoring Programme for the UK
http://slidepdf.com/reader/full/bto-research-report-no223-developing-a-mammal-monitoring-programme-for-the 219/316
BTO Research Report No. 223July 1999
217
3) Significant proportions of the British populations of the larger deer species are already
monitored well. Cost-effective and efficient national monitoring would best be served by
promoting the continuation of these schemes and by making efforts to collate the
information generated centrally. It is important that the needs of national monitoring do
not impinge on extant, more local schemes which have been designed with the needs of local
monitoring in mind.
4) New survey schemes will be necessary if the populations of deer (especially outside
Scotland and of the smaller species) not found on land which is currently the subject of
survey work are to be monitored effectively. These include much of the populations of
Fallow Deer, Roe Deer, Chinese Water Deer and Reeves’ Muntjac. We have outlined two
possible general approaches for the monitoring of these populations. If detailed information
on complete populations is required, then surveys based on direct counts (open habitats)
and on either pellet group counts or deer-specific transects (woodland) should be
established, sampling the countryside on a random basis stratified by habitat (say, using
ITE Land Cover data). Identifying the best method for surveying woodland deer should be
a priority: the conclusions of the most recent methodological review (Mayle & Staines 1998)and the consensus of expert opinion (per S. Harris) are currently at odds, so we cannot
provide firm conclusions here. Any pellet-based surveys would require considerable
professional input, at least in terms of support for the identification of difficult pellet
groups and probably also directly to conduct fieldwork (professional input would not,
however, guarantee successful pellet identification). Volunteer input to any survey would
best be managed by a central mammal research organisation and could be drawn from the
memberships of BASC, The Mammal Society and the British Deer Society. Three to five
staff employed over the survey period (which would best be a period of several months in
winter) ought to be sufficient to cover (with volunteer assistance) several hundred of each
of woodland and open survey plots. A sample size of at least this order would be needed to
provide useful information, but precise requirements can only be assessed through trial
survey work.
5) If less detailed information than that specified under point 4 is required, data compiled
piecemeal from the multi-species schemes we propose elsewhere and from sightings that
solicited from key areas of range expansion could be sufficient. We would envisage that the
BBS (Part III.A.1), Winter (visual) Transect Survey (Part III.B.1), Sign Transect Survey
(provided that pellet identification is not considered too difficult for volunteers) (Part
III.B.2), Garden Mammal Watch (Part III.B.5), Nature Reserve Monitoring (Part III.B.4)
and Mammals on Roads data (Part III.B.3) could all contribute. Such a system would
require significantly less staff time than specific deer schemes: no more than one to twomonths per year over and above the time needed to run the multi-species schemes
themselves. Both this potential approach and that based on deer-specific monitoring would
have to be piloted to assess their suitability and to suggest required sample sizes before
either one were adopted wholesale.

8/18/2019 BTO Research Report No.223 - Developing a Mammal Monitoring Programme for the UK
http://slidepdf.com/reader/full/bto-research-report-no223-developing-a-mammal-monitoring-programme-for-the 220/316
BTO Research Report No. 223July 1999
218

8/18/2019 BTO Research Report No.223 - Developing a Mammal Monitoring Programme for the UK
http://slidepdf.com/reader/full/bto-research-report-no223-developing-a-mammal-monitoring-programme-for-the 221/316
BTO Research Report No.223July 1999
219
28. FERAL GOAT Capra hircus
Introduced. Series of small (mostly a few hundred or less), isolated populations in the uplands of
each of the four countries of the UK and on some sea cliffs. Abundance stable. Bullock (1995)
provides much information on the status and management of this species.
28.1 RECENT AND ONGOING MONITORING
No formal monitoring at national level but managers of almost all land on which goats occur in
UK monitor their animals to varying degrees of precision using various combinations of direct
counts and observations of damage to vegetation. In Wales, CCW lead a formal management
plan with the objective of preventing extinctions of goat populations whilst avoiding damage to
oak woodlands.
28.2 MONITORING OBJECTIVES
Local monitoring has the objectives of signalling when unacceptable damage to vegetation hasoccurred or when numbers are increasing to a degree that is believed to threaten vegetation.
Goats are easy to observe, to herd with dogs, and to cull, so management is also easy.
Goat populations are so limited in distribution and so widely managed that there is no reason to
monitor them as indicators or (generally) as ecosystem components. Their social structure is
such that national monitoring should concentrate on changes in distribution.
28.3 POTENTIAL MONITORING TECHNIQUES
Direct counts - Goat distribution, and even numbers, are easy to monitor by direct observation.
28.4 POTENTIAL MONITORING SCHEMES
Collation of data from local monitoring would provide sufficient monitoring at a national level.
28.5 RECOMMENDATIONS
We recommend that the conservation agencies ensure that the current informal system,
whereby Dr D J Bullock (National Trust) collates information on Feral Goats is maintained
and perhaps somewhat formalised. (The field observations are generally provided by those
responsible for local land management.) Ongoing collation of readily obtained data wouldprobably be five days work per year. More intensive reviews at perhaps decennial
intervals may prove necessary of the annual accumulation of data is insufficient. Regional
staff of the country conservation agencies should be encouraged to be alert to the possible
establishment of Feral Goats in new areas.

8/18/2019 BTO Research Report No.223 - Developing a Mammal Monitoring Programme for the UK
http://slidepdf.com/reader/full/bto-research-report-no223-developing-a-mammal-monitoring-programme-for-the 222/316
BTO Research Report No.223July 1999
220

8/18/2019 BTO Research Report No.223 - Developing a Mammal Monitoring Programme for the UK
http://slidepdf.com/reader/full/bto-research-report-no223-developing-a-mammal-monitoring-programme-for-the 223/316
BTO Research Report No.223July 1999
221
29. FERAL SHEEP Ovis ammon
Introduced. Boreray Sheep restricted to Boreray (St. Kilda), unenclosed Soay Sheep to Soay and
(through recent introduction) to Hirta (St. Kilda), Holy Island (Arran), Cardigan Island, Lundy
Island and Cheddar Gorge.
29.1 RECENT AND ONGOING MONITORING WORK
The Hirta population has been studied in some detail since the 1950s. All other free-ranging
populations of Soays, with the exception of that on Holy Island (about which there is no recent
information) are managed closely on the basis of almost annual counts. Boreray Sheep are
counted opportunistically, mainly by telescope from Hirta (which overlooks the main grazing
slope.)
29.2 MONITORING OBJECTIVES
The demographic studies on Hirta have scientific objectives, based on this being such a detailedlong-term study. More generally, local monitoring has the objectives of managing populations
for the benefit of vegetation and of preventing animal welfare problems that could arise from
overstocking. (Feral Sheep are not readily herded but they are easy to cull by shooting).
Sheep populations are so limited in distribution and so widely managed that there is no reason to
monitor them as indicators or (generally) as ecosystem components. Their social structure is
such that national monitoring should concentrate on changes in distribution.
29.3 POTENTIAL MONITORING TECHNIQUES
Direct counts - Feral Sheep live in open habitats and are easy to observe.
29.4 POTENTIAL MONITORING SCHEMES
Collation of data from local monitoring and scientific studies would provide sufficient
monitoring at national level.
29.5 RECOMMENDATIONS
1) We suggest that individual country conservation agencies should routinely collate the
data obtained about Feral Sheep populations and that appropriate regional staff should beencouraged to be alert to the possible establishment of new populations (given that Soay
Sheep are widely kept in captivity).
2) Resource requirement: two or three man-days work per year for each country
conservation agency to ensure that data are centrally collated and to alert regional staff to
the possible establishment of new populations. (The latter should be combined with
alerting them about the need to gather information on occurrence of various species beyond
their known range.)

8/18/2019 BTO Research Report No.223 - Developing a Mammal Monitoring Programme for the UK
http://slidepdf.com/reader/full/bto-research-report-no223-developing-a-mammal-monitoring-programme-for-the 224/316
BTO Research Report No.223July 1999
222

8/18/2019 BTO Research Report No.223 - Developing a Mammal Monitoring Programme for the UK
http://slidepdf.com/reader/full/bto-research-report-no223-developing-a-mammal-monitoring-programme-for-the 225/316
BTO Research Report No.223July 1999
223
30. RED-NECKED WALLABY Macropus ru fogri seus
Introduced. Frequently released or escapes. Populations have persisted for decades but 20-30
animals on Inchconachan (Loch Lomond) and perhaps 50 on the Isle of Man are the only
currently viable populations. At least one animal has reached the mainland from Inchonachan.
The reproduction rate is low, the animals are vulnerable to road traffic and hard winters, and theymay not compete well with ungulates.
30.1 RECENT AND ONGOING MONITORING WORK
Dr D W Yalden has studied the Peak District population for c.30 years (Yalden 1988) and there
has been one study of the Inchconachan population (Weir et al.1995).
There seems to have been no published work on the Manx population but Chris Sharpe (pers.
comm.) has supplied the following information. The population inhabits an extensive area of
“curragh” willow scrub (grid reference SC3694/95), largely owned by The Manx Museum and
National Trust; it may number 50 animals (10 have been seen in a single group) and occupies anarea of about 1km2; it may be increasing. It originated from escapes from a wildlife park,
probably in the late 1960s. There is no formal monitoring, all the above information being
derived from casual observations.
30.2 MONITORING OBJECTIVES
Assuming that the current aim is neither actively to eliminate nor to maintain wallaby
populations in the UK, we suggest that the monitoring objectives for this alien species should be:
1. to record the establishment of any new populations;
2. to monitor the size and range of such populations, especially to detect any sustained
increase.
30.3 POTENTIAL MONITORING TECHNIQUES
Direct counts - Wallabies are secretive (and small populations are therefore easily overlooked)
but populations in small areas can be counted by sweeping the area with a line of counters - 45
people were used to cover the 45ha of Inchconachan.
Field signs (droppings) - Wallaby droppings are fairly easily identifiable and are thus a useful
means of confirming continued presence in an area; but they are unlikely to be sufficientlynoticeable to provide alerts to the presence of Wallabies in previously unoccupied areas.
Field signs (tracks) - Wallaby spoor is so different from that of any British animal that
naturalists alert to the possibility of the species escaping or being released may notice it. It is a
useful means, particularly after snow, of confirming the species’ continued presence in an area.
30.4 POTENTIAL MONITORING SCHEMES
See below.

8/18/2019 BTO Research Report No.223 - Developing a Mammal Monitoring Programme for the UK
http://slidepdf.com/reader/full/bto-research-report-no223-developing-a-mammal-monitoring-programme-for-the 226/316
BTO Research Report No. 223
July 1999224
30.5 RECOMMENDATIONS
1) Inchconachan - There is no need to devote resources to monitoring this population but
SNH should collate any information that is obtained about it. Resource requirement: a few
hours per year.
2) Loch Lomond - Local SNH staff should be aware of the possibility of animals emigrating
from Inchconachan. They should know what wallaby droppings and spoor look like. They
should collate all reports of sightings and signs. They should follow up such reports, to
establish the number and exact locations of any animals observed.
Resource requirement: virtually none, unless reports need to be followed up, which may
take a few man days.
3) Isle of Man - The Manx Museum and National Trust could perhaps take the lead in
systematically collating sightings of these animals. Local ornithologists maintain a
systematic programme of work on part of the site and could perhaps maintain systematicrecords of wallaby sightings. The extent of the area occupied should be assessed every few
years by a survey using sightings and field signs. It would be useful to have a base-line
assessment of numbers, by organising a large team of drivers to cover the area thoroughly,
as was done on Inchonachan (Weir et al. 1995).
Resource requirement - depends on scale of work but collation of sightings should take no
more than a few hours per year and surveys of the area occupied only a very few man days
each.
4) Other established populations - Assuming, as is likely, that other populations of
wallabies are occasionally established, their size and range should be monitored. We
suggest that, given the slow reproductive rate of the species, surveillance at intervals of, say,
five years would be adequate, consisting of surveys to determine the area occupied (by
means of searching for animals, droppings and tracks), followed by intensive sweeps of the
area by a large team during a single day, to determine numbers.
Resource requirements: perhaps two-man-months of professional time to organise and
report on each survey; some dozens of volunteers would be needed for the sweep of the
occupied area.
5) Alien mammals scheme - This should be used to monitor occurrences of this species.

8/18/2019 BTO Research Report No.223 - Developing a Mammal Monitoring Programme for the UK
http://slidepdf.com/reader/full/bto-research-report-no223-developing-a-mammal-monitoring-programme-for-the 227/316
BTO Research Report No.223July 1999 225
31. UNESTABLISHED ALIENS
Large numbers of alien species (and sub-species) are kept in captivity in Britain, as exotic pets as
exhibits in zoos and wildlife parks, and as farmed animals. Escapes and deliberate releases are
not uncommon (Baker 1990). In addition to the non-native species that are currently established
(and which are individually considered in this report), this has resulted in the establishment of populations of Muskrat (Ondatra zibethicus), Himalayan Porcupine ( Hystrix trachyura) and
Coypu ( Myocastor coypu); all were eliminated, though in two cases at great cost.
In order that the potential establishment of aliens should be properly managed, monitoring should
be conducted of the occurrence of all alien mammals at liberty in the UK. Dr Simon Baker
(FRCA) currently runs a low-key monitoring scheme for MAFF, for all alien mammals except
common small pets such as Golden hamster Mesocricetus auritus; most of his records come
from FRCA colleagues and Mammal Society members. Some occurrences probably go
unrecorded because of the low level of publicity afforded to this scheme.
31.1 RECOMMENDATIONS
The FRCA scheme should be strengthened, through a systematic publicity programme to a
target audience (too wide publicity could result in large numbers of dubious and
unverifiable records of “The Beast of Bodmin” sort). This would include more frequent
publication of results.
Resource requirements: a few man-weeks per year.

8/18/2019 BTO Research Report No.223 - Developing a Mammal Monitoring Programme for the UK
http://slidepdf.com/reader/full/bto-research-report-no223-developing-a-mammal-monitoring-programme-for-the 228/316
BTO Research Report No.223July 1999 226

8/18/2019 BTO Research Report No.223 - Developing a Mammal Monitoring Programme for the UK
http://slidepdf.com/reader/full/bto-research-report-no223-developing-a-mammal-monitoring-programme-for-the 229/316
BTO Research Report No.223July 1999 227
PART V BUILDING THE VOLUNTEER NETWORK
1. INTRODUCTION
The UK has the most highly developed system for conservation-related research and monitoring
of birds in the world. This is largely because of the substantial input of fieldwork by volunteers.Similar work is also undertaken for other taxa, albeit on a smaller scale. In respect of the
monitoring of mammals, the key question is whether the volunteer input can be developed
enough to enable the UK to put into place an effective and affordable programme.
From earlier parts of this report and from MMR, one gains some appreciation of the major
contribution that volunteers have already made to the study of mammals in Britain and Ireland.
Most of the major surveys have involved a considerable input from the volunteers. Another
impressive example comes from surveys of vespertilionid bats (scarcely the easiest group of
mammals to study). Volunteers covered 1,030 1x1km squares stratified by Land Class; and the
result was two major papers in the Journal of Applied Ecology on the foraging habitat
preferences of the bats and on the relationship of their abundance to geographical factors, toLand Class and to habitat (Walsh & Harris 1996 a, b). There is clearly a lot that volunteers can
do.
We begin this part of our report by briefly reviewing why one should use volunteers for wildlife
monitoring and the potential problems with doing so. We consider the support needed from
professionals, given that volunteers cannot do the whole job. We review how many volunteers
there might be for the monitoring of mammals and we discuss how the volunteer network can be
developed through training and through good systems of communication and feedback to
volunteers on the work that they do. The volunteer input has to be organised: we make the case
for this to be done by a membership organisation, to which many of the volunteers would belong
(or, to put it another more important way) which would belong to many of the volunteers. We
address how to organise the volunteers and their work at local level, and the special problems
that there are in sparsely populated areas. Finally, we address the question of payment to
volunteers, sometimes seen as a way of overcoming difficulties of recruitment especially in the
sparsely populated areas.
2. WHY USE VOLUNTEERS FOR WILDLIFE MONITORING?
2.1 Citizen participation
There is great value in a democracy in citizens actively participating on a voluntary basis in workthat is for the benefit of the whole community.
2.2 Building up a body of committed enthusiasts
The involvement of citizens in conservation-related fieldwork gives them an understanding and
commitment to wildlife conservation that is deeper and more soundly based than that they are
likely to get simply from reading or hearing about conservation problems.
2.3 Large numbers
Because volunteers are available in large numbers, it is possible to carry out surveys over a wide
geographical area potentially in a short period of time. Thus, 1,000 volunteers can easily deliver

8/18/2019 BTO Research Report No.223 - Developing a Mammal Monitoring Programme for the UK
http://slidepdf.com/reader/full/bto-research-report-no223-developing-a-mammal-monitoring-programme-for-the 230/316
BTO Research Report No.223July 1999 228
five man-years of work in a single weekend. The concentration of work into a short time frame
may often be necessary in monitoring and can be impossible to deliver with professionals simply
because not enough of them are available.
2.4 Knowledge of local areas
Volunteers can build up an intimate knowledge of their local areas in a way that professionals
covering much larger areas cannot. Furthermore, they can provide long term continuity in those
local areas, which may be important for effective monitoring.
2.5 Reduced dependence on individuals
If a monitoring programme depends on a single professional, it can be seriously interrupted at
short notice should the professional fall ill or move to a different job. Because there are a large
number of volunteers there is an overall continuity of effort, even though individuals might drop
out of a work programme. Furthermore, there is a long-term continuity of expertise in the body
of volunteers even though there may be a gradual turnover of individuals. In contrast, if anindividual professional carries out a survey of a species, that same person is unlikely to be
available in five or ten years time when the repeat survey is conducted, leading to a loss of the
experience that is important in long term monitoring work.
2.6 Guaranteed commitment
“The best assurance that the fieldwork shall be accurate is that the investigators are thoroughly
trained in their work, are capable, conscientious, and keen.” (Yates, 1981)
We deal with training and ability below. Here we point out that volunteers, by their very nature,
are bound to be conscientious and keen. This means that if they do the work at all then they can
be relied upon to do it to the best of their ability. It is true that a proportion of volunteers in a
survey may fail to do the work because unexpected commitments interfere with it or because it
turns out to be more arduous than they anticipated. They are unlikely, however, to pretend to do
the work to the required standard when they have not. In contrast, while the majority of
professionals are at least as conscientious and keen as the volunteers, there is always the
possibility that a small proportion of them are not conscientious and, in order to maintain their
employment, pretend to have done work that they have not actually done (or at least pretend to
have done to standards higher than those that they actually operated). While we have no reason
to suppose that this has ever undermined the integrity of national surveys of wildlife, the risk is
always there.
2.7 Saving in costs
Volunteers do not need to be paid. Most of them live close to where they conduct the fieldwork
and are willing and able to cover their travel costs. In contrast, professionals need to be paid and
may have to travel long distances in order to undertake fieldwork. As a result, surveys in which
the majority of the fieldwork is conducted by volunteers can achieve many times the level of
work for a given expenditure on professional organisation than can surveys which are wholly
dependent on professionals. This is an obvious advantage of using volunteer fieldworkers, but it
is important not to over emphasise it in relation to the other benefits of using volunteers that we
have covered here.

8/18/2019 BTO Research Report No.223 - Developing a Mammal Monitoring Programme for the UK
http://slidepdf.com/reader/full/bto-research-report-no223-developing-a-mammal-monitoring-programme-for-the 231/316
BTO Research Report No.223July 1999 229
2.8 Establishment of protocols
“In order that common standards shall be achieved throughout the survey (which means that over
the course of time of monitoring work) it is important that all the survey forms and explanatory
material that are to be used by fieldworkers are carefully designed and thought out” (Yates,
1981). This is just as true for professional fieldworkers as for volunteers. Our experience withusing volunteers is that one is forced to pay particular attention to these issues because the
volunteers quickly come back with questions if the forms or the instructions are unclear. As a
result, if another takes over the survey in later years, they may be unaware of procedures adopted
by their predecessors because these procedures were in their predecessors heads rather than being
recorded on paper. Thus volunteer based surveys, by forcing one to be more explicit about
instructions, have a long-term advantage in ensuring that common protocols are adhered to.
3. POTENTIAL PROBLEMS WITH USING VOLUNTEERS
3.1 Level of expertise
Some volunteers may have less expertise than professional surveyors. It must not, however, be
forgotten that some volunteers in national wildlife surveys and monitoring are professional
ecologists carrying out these surveys in their spare time. Nor must it be forgotten that many
amateurs have very considerable field experience with skills equalling, or indeed exceeding,
those of many of their professional colleagues. The key issue is field skills and since these are
rarely taught as part of the education of professionals, academic qualifications, however sound,
are no guarantee of requisite field skills.
Training can overcome the problem of insufficient field expertise for amateurs, just as it can for
professionals. Of course, since individual amateurs do less work than those professionally
employed to carry out surveys, the training of amateurs tends to result in fewer man-hours of
subsequent fieldwork per hour of training than does the training of professionals. However, the
Look Out For Mammals project (Section 6) shows that training of amateurs can be carried out at
relatively low cost. Indeed, amateurs are prepared to pay often significant fees in order to obtain
training in the work for which they have so much enthusiasm.
3.2 Numbers
It may not always be possible to recruit enough volunteers, especially in sparsely populated
areas, to undertake the level of survey work that is required. Recruitment can, however, be
considerably enhanced by investing professional time in building up a team of committedvolunteer fieldworkers for the monitoring work. This is one of the reasons why a professional
infrastructure is needed for a monitoring programme where much of the fieldwork is carried out
by volunteers (Section 4).
3.3 Cost-effectiveness
Given the need for training and for the building of teams of volunteers which take professional
time, some survey work is certainly more cost-effective if done largely by professionals rather
than largely by volunteers. The cost-effectiveness of an amateur versus a professional approach
must be assessed on a case-by-case basis.

8/18/2019 BTO Research Report No.223 - Developing a Mammal Monitoring Programme for the UK
http://slidepdf.com/reader/full/bto-research-report-no223-developing-a-mammal-monitoring-programme-for-the 232/316
BTO Research Report No.223July 1999 230
3.4 Availability
Survey organisers sometimes worry that volunteers may not always be available at the times
when they are needed. After all, volunteers are carrying out the work in their spare time on
which there are often many competing demands. BTO experience is that this is a minor problem.
It is certainly outweighed by being able to concentrate many man-hours of volunteer work into ashort period because of the availability of large numbers of volunteers. This is a major problem
with conducting surveys using professional fieldworkers since the best time of year for
conducting a survey may be a relatively short season so that it is simply impossible to recruit
enough professionals to do the work within that short time.
3.5 Reliability
Some people who have volunteered to cover an area in a survey may not do so. In our
experience, this is usually a very small proportion. This disadvantage is compensated for by the
fact that those who do go out to do the work will do it to the best of their ability.
4. THE NEED FOR A PROFESSIONAL INFRASTRUCTURE
The history of the BTO is that the amount of work conducted by the organisation increased
rapidly after the number of professional staff that the organisation employed had built up to a
level that allowed them to provide the requisite support to the volunteers. There are several jobs
that need to be done in running survey and monitoring programmes for which professional input
is important. They are as follows:
• Planning - Professional expertise is needed to carry out the detailed work of planning
surveys and to make sure that the best principles of design are used. The professionals
may also be needed to carry out trials of alternative methods before a survey is launched.
• Training - Training by professional organisers is a good way of ensuring common
standards across fieldworkers.
• Organisation - There is a great deal of routine office work in organising surveys, from
arranging that the necessary coverage is indeed obtained, to producing and distributing
the recording forms. Much of this work is not the sort of thing that volunteers wish to do,
and much of it demands sustained and intensive input at particular times.
• Publicity - Publicity may be needed on a large scale during the launch of a scheme. Thisdemands both time and expertise.
• Answering fieldworker queries - Even in the best planned surveys, fieldworkers are
likely to come up with queries when they begin to apply the methods in the field because
it is difficult to cater for every eventuality in instructions that have been put together
before a survey is actually carried out. The value of a professional organiser is that she,

8/18/2019 BTO Research Report No.223 - Developing a Mammal Monitoring Programme for the UK
http://slidepdf.com/reader/full/bto-research-report-no223-developing-a-mammal-monitoring-programme-for-the 233/316
BTO Research Report No.223July 1999 231
• or he, can be available constantly to answer these questions and can ensure that the
answers to them are the same for all fieldworkers.
• Collating data - The collation of large amounts of survey data (including their input into
appropriate computer databases) is a much more demanding task than might be thought.
For long-term work the data have to be stored such that they can be used withoutambiguity in future. This requires both professional expertise and experience if it is to be
done properly.
• Analysis - The analysis of data arising from monitoring work requires considerable
statistical and computing abilities that almost inevitably require professionals to carry out
the work.
• Feedback to the volunteers - This is an important aspect of building the volunteer
network (see Section 7). It is important that it is done well, and that it is done promptly.
Volunteer survey organisers often do not have enough time available to give the feedback
as quickly as is desirable.
A few volunteers have the expertise, the competence, and the time to carry out the sort of full
time organising work for which one might otherwise employ a professional. The majority of
volunteers, however, either have jobs that prevent them devoting sufficient time to organising
surveys or, if they are retired, they do not wish to undertake such demanding tasks and would
rather concentrate on fieldwork.
Other advantages of professional organisers arise if they work for a body that is responsible for a
suite of mammal monitoring and survey work. Even though there may be turnover of individual
staff in such organisations, there is a build-up of corporate expertise and the development of the
necessary long-term continuity of approach that is needed for successful monitoring. It should
also be noted that, at the corporate level, it is easier to manage professionals than volunteers,
particularly if performance is not up to standard.
5. HOW MANY MAMMAL VOLUNTEERS MIGHT THERE BE?
Sources of volunteer manpower for mammal monitoring are various. The chief ones are
probably the established voluntary bodies: The Mammal Society has a growing membership of
c.2,000 and The Bat Conservation Trust c.3,000. Both of these have been able to mobilise many
hundreds of volunteers for some of the national surveys of mammal species (as have other people
organising such surveys).
In addition, there are special interest groups who may be able to provide substantial input for
certain species - the 80 groups who belong to The National Federation of Badger Groups, The
British Deer Society, The Game Conservancy Trust, and the British Association for Shooting and
Conservation. BASC, in particular, have a large membership (around 125,000), which includes
the majority of the UK’s professional gamekeepers and many others who are active in the
countryside, such as professional and amateur deer-stalkers. BASC members are perhaps
particularly likely to be interested in (and to possess the appropriate skills for) monitoring key
quarry species, but no formal attempt to gauge this interest has yet been made. Overlap in
membership between BASC and other organisations such as The Mammal Society and the
British Deer Society would have to be considered if volunteer input were solicited from several
bodies.

8/18/2019 BTO Research Report No.223 - Developing a Mammal Monitoring Programme for the UK
http://slidepdf.com/reader/full/bto-research-report-no223-developing-a-mammal-monitoring-programme-for-the 234/316
BTO Research Report No.223July 1999 232
Some mammalian species or their signs are identifiable by relatively inexperienced naturalists,
especially if good identification materials and training are provided. It is likely that there are
large numbers of potential mammal surveyors who could be contacted via the Wildlife Trusts,
local naturalists societies, etc. Even if such people have no particular commitment to mammal
monitoring in general, their interest may be enough for them to participate in an individual
survey (perhaps one of the less-demanding). Providing they get the right encouragement,training, and feedback, this may lead on to further surveys and to taking up membership of
relevant bodies such as The Mammal Society.
The fact that some mammals are relatively easy identifiable means that it may be possible to
recruit a wide range of people working in the countryside into mammal monitoring. The easiest
groups are those that work for large agencies, such as The Forestry Commission, The
Environment Agency, and SEPA. Such people may well be prepared to participate in surveys of
species such as deer, Red Fox, Badger, Wildcat and Pine Marten.
In summary, there are enough potential volunteers for a good national programme of mammal
monitoring to be run, provided the professional infrastructure is in place to develop the network.
6. DEVELOPING THE VOLUNTEER NETWORK THROUGH TRAINING
6.1 Why train?
Training improves people’s skills, so improving the quality of their work. Furthermore, it builds
their self-confidence, so making them more prepared to participate in surveys and monitoring.
Follow-up questionnaires to 1997 participants in LOFM training courses (see below) showed that
in the subsequent year, over 60% had submitted records to their County Mammal Recorders
compared with 18% the previous year; over 60% had used new search methods; and 50% had
made records of mammal groups that they had not previously recorded.
6.2 Look Out For Mammals Courses
The Mammal Society has run this training project during 1996-9, mounting 60 weekend courses
over that period in all parts of the UK. To date, c.500 people have attended and it is anticipated
that the final number will be almost 700 - double what was planned for the project.
These weekend events include:
• talks and practical training on finding, identifying signs and making sightings of
mammals, particularly distinguishing difficult groups.
• hands on experience of Longworth trapping
• owl pellet analysis of identification of mammal remains
• demonstration of the new mammal recording software
• training in identifying mammal calls
• access to an extensive collection of skins, feeding remains, droppings and other mammal
signs enabling participants to develop recognition skills.

8/18/2019 BTO Research Report No.223 - Developing a Mammal Monitoring Programme for the UK
http://slidepdf.com/reader/full/bto-research-report-no223-developing-a-mammal-monitoring-programme-for-the 235/316
BTO Research Report No.223July 1999 233
Participants in the courses have the objectives clearly laid out for them and are tested on their
level of achievement at the end of the course. Those who successfully graduate from the course
are awarded a certificate (accredited jointly by The Mammal Society and the Field Studies
Council). This is a good system for producing a cadre of fieldworkers, trained to consistently
high standards.
As part of this programme, a team of trainers has been set up. A standardised programme has
been developed for training such trainers.
The courses are evaluated by participants and 70% of participants in the 1997 courses said that
they would now like to receive more advanced training.
6.3 Further benefits of the LOFM project
• Publication of How to Find & Identify Mammals training manuals. Over 1,000 have been
sold.
• National Mammal Recorder workshops co-ordinated by the Look Out For Mammals
project, have provided a forum for debate on Mammal recording issues.
• New versions of specially developed mammal recording software; the LOFT Recording
Package, have been circulated. Over 70 systems are now in operation.
• Improved the UK coverage of County Mammal Recorders from 60% to 95%.
• A LOFM national survey of Harvest Mice revealed alarming declines over the last twenty
years. This information forms the basis for future targeted surveys and a successful
media campaign has targeted farmers who are in a unique position to manage Harvest
Mouse habitat sympathetically.
• An additional investigation into survey techniques for recording Water Shrews has tested
and established new and effective methods for collecting records of this elusive species.
• Where training courses involve people mostly from one area, they serve a valuable role in
building the local team.
6.4 The future
The Mammal Society is now seeking funding to take LOFM forward and to develop courses in
monitoring as such, going beyond the simple identification and recording covered in the courses
run so far. An Atlas may be produced to focus interest and raise the profile of mammal
surveying by volunteers.
7. DEVELOPING THE VOLUNTEER NETWORK THROUGH
COMMUNICATION AND FEEDBACK
It is important to give volunteers feedback on the results of their work, both in terms of
straightforward descriptions of how many animals have been found and where and in terms of
the use that is being made of that information. The chief value of that feedback is to maintain thelevel of enthusiasm and commitment that is required in order for the volunteers to continue the
work that they do.

8/18/2019 BTO Research Report No.223 - Developing a Mammal Monitoring Programme for the UK
http://slidepdf.com/reader/full/bto-research-report-no223-developing-a-mammal-monitoring-programme-for-the 236/316
BTO Research Report No.223July 1999 234
Feedback is also important in building up the expertise of volunteers. As organisers discover the
problems that volunteers are having and the ways in which their work can be improved, they can
pass on the necessary messages as part of the feedback.
To obtain both of these benefits, it is necessary to give specific feedback on individual surveys,
but more generalised feedback on mammals and their monitoring is also valuable, not only forthese purposes, but also for creating a general climate of interest in the monitoring work, and
thus for recruiting new participants.
Feedback can take a variety of forms. Newsletters that reach the people who have participated in
a survey and potential recruits are perhaps the most important way of reaching a large number of
people for a relatively modest outlay of resources. It is important that all participants get
newsletters about their work. This can be difficult if people work in groups, only one member of
which is known to the national organiser. A web site can also be valuable (particularly for
reaching participants whose names and addresses are unknown to the national organiser). Unlike
a newsletter, however, it does not force itself on the attention of participants or potential recruits.
Nor may it give the same sense of belonging as does a newsletter sent to participants in thesurvey, a sense of belonging that may be very important in maintaining volunteers commitment
to the work (It is true that one can operate a web site with access restricted to the survey
participants, but this tends to defeat the publicity objective which is important in terms of
recruiting new volunteers).
Meetings between the volunteers and survey organisers are especially important in developing
enthusiasm for monitoring work. These may take the form of informal gatherings, with groups
of volunteers in a region or more formal workshops. Presenting lectures to local natural history
societies, local mammal groups, Wildlife Trusts etc. is valuable for recruitment and can also be
used as an effective means of thanking and meeting survey participants as they are likely to be
members of such audiences. Short conferences are another effective way of developing the
commitment of the volunteers.
Face-to-face contact between professional organisers and volunteers is easier if the professional
organisers are not all concentrated in a single office, but are spread across the country. We
would urge that serious consideration is given should a body be set up to promote mammal
monitoring to having offices in the different countries of the UK. Compared with having a single
office this has many disadvantages, such as losing out on economies of scale and on ease of
interaction between the staff. It reduces the extent to which the organisation is seen as a focus of
interest and to which it becomes a centre of expertise, it can interfere with the integration of and
mutual support within the monitoring team. It may also mean, unless the matter is fairlycarefully managed, that volunteers in different parts of the UK may be getting slightly but
significantly different advice on how to conduct their survey work. Such disadvantages need to
be carefully weighed against the advantages of the organisers being seen to have a local
commitment and to them being able to meet a greater cross-section of the volunteers on a much
more routine basis.
8/18/2019 BTO Research Report No.223 - Developing a Mammal Monitoring Programme for the UK
http://slidepdf.com/reader/full/bto-research-report-no223-developing-a-mammal-monitoring-programme-for-the 237/316
BTO Research Report No.223July 1999 235
8. THE IMPORTANCE OF A MEMBERSHIP-BASED ORGANISATION
We believe that membership-based organisations are the most effective way of developing a
volunteer network for wildlife monitoring.
An obvious advantage of conducting much of the monitoring through a membership-basedorganisation is that such bodies, through their membership, have good contacts with volunteers.
In practical terms, it is very important to have an up-to-date database of the names and addresses
of potential volunteers. The law on data protection makes it increasingly difficult to keep lists of
people who have not given consent to their names and addresses being held, especially if
reasonable effort is not made to keep those lists up-to-date. Membership organisations, by
necessity, have to have the arrangements in place both for dealing with data protection issues
relating to names and addresses and for keeping their records up-to-date.
The main advantage that membership-based organisations have in running volunteer surveys is
that the members of an organisation have ownership of the work that the organisation carries out.
This is not only true in a formal sense but also in an informal sense: the members not only havelegal ownership of the organisation but they also feel such a commitment to the organisation that
they feel that the work that is done is truly theirs. Developing and maintaining this level of
commitment requires focused and sustained attention to members concerns. Nonetheless, it is
much easier to do where the organisation running the work is one to which the volunteers have
made a membership commitment rather than if it is merely some body that has simply asked the
volunteers to assist it.
The feeling of ownership is important for three chief reasons. First, it helps to prevent the
organisation being seen as some sort of remote body separate from the volunteers themselves.
Second, it reinforces the motivation that the volunteers have for the work because they have
made a commitment to the organisation through their membership. Third, in a well run
membership organisation, the members should be able to have their views heard. This is always
true in principle, since the members will be responsible for electing the board of governance of
the organisation. If that board works properly, along with its various specialist committees, it
should provide an important channel of communication between the members and the staff. It is
important that members feel that they are able to make their views heard, both in strengthening
their commitment to the work of the organisation and also in broadening the base of expertise
that feeds into the organisations work. It is too easy for professional organisers sitting in offices
to lose contact with the problems of fieldworkers. In a well run, membership-based organisation,
however, the concerns of the fieldworkers can be fed through the proper channels so that they
influence the way in which future work is organised.
If the professional organisers of surveys do not respond to the concerns of fieldworkers, then
fieldworkers are likely to stop participating in survey work. We believe that, in a membership-
based organisation, they will generally make their views clear through the usual channels before
they reach the stage of resigning. Furthermore, if they do resign from membership, it will
quickly become apparent that the organisation is not satisfying the wishes of its members. This
is a powerful form of feedback. In contrast, if a survey is organised by an institution that is not
membership-based, then the support of volunteers can slip away almost unnoticed until it is too
late.

8/18/2019 BTO Research Report No.223 - Developing a Mammal Monitoring Programme for the UK
http://slidepdf.com/reader/full/bto-research-report-no223-developing-a-mammal-monitoring-programme-for-the 238/316
BTO Research Report No.223July 1999 236
We believe that the lessons from the ornithological world, not only in Britain but throughout the
world, are that wildlife monitoring works best if it is carried out by a membership-based
organisation and less well if it is carried out by private research institutes, universities or
governments that try to recruit volunteers without a membership base. Our interactions with
amateur naturalists suggest to us that government bodies are at a particular disadvantage in this
disregard, being perceived as remote, unresponsive to the concerns of amateur naturalists, undulyinfluenced by political interests, and as trying to get their monitoring work done “on the cheap”.
9. ORGANISATION AT THE LOCAL LEVEL
From early in its history, the BTO has benefitted from having a network of Regional
Representatives. These are volunteers who undertake to organise the Trust’s work at local level.
They are usually responsible for a single county, though in sparsely populated areas a Regional
Organiser may take on more than one county, and in heavily populated areas it is sometimes
advantageous to split a county between more than one Regional Representative.
It is not the function of BTO’s Regional Representatives to organise surveys as such. Rather,they implement the survey organisation at local level. The value of their input is as follows:
• They know the local volunteers, not only those who are members of the organisation but
also non-members who are potentially interested in participating in the survey and
monitoring work.
• They know which of the local members are reliable because they know many of them
personally and, indeed, have often been in the field with them.
• They provide contacts with local groups such as local natural history societies, local bird
clubs and county Wildlife Trust branches.
• They know their local areas. This can be important for some surveys, if effort has to be
focussed in particular sorts of places or if particular large land-owners need to be
approached in a certain way in order to allow access to their land for wildlife surveys.
• They can deal with some of the questions and worries of volunteers and so take pressure
off the national organisers of surveys (though it is important to regulate this element of
their work to ensure that the same advice is being given by Regional Representatives
across the country.
• They provide a focus for feedback to the volunteers and for contact between the
volunteers and the organisation as a whole, helping to prevent the organisation as being
seen as a remote. professional driven body.
• In some cases, local organisers can be useful in screening survey returns before they are
submitted to the national centre. They have the local knowledge to pick up errors that
might not be spotted by national organisers and they know more about the ability of
individual fieldworkers so that they can judge whether data are likely to be correct. They
are also often in a better position to discuss with fieldworkers the quality of their records
than would be a national organiser sitting in an office remote from the fieldworkers.

8/18/2019 BTO Research Report No.223 - Developing a Mammal Monitoring Programme for the UK
http://slidepdf.com/reader/full/bto-research-report-no223-developing-a-mammal-monitoring-programme-for-the 239/316
BTO Research Report No.223July 1999 237
We believe that a similar network of local organisers would not only be valuable for mammal
monitoring work, but would also be relatively easy to set up. There is already an almost
complete network of County Mammal Recorders. In addition, there are local mammal groups in
some areas which provide a particular focus for volunteer mammal studies. It is true that some
of the County Mammal Recorders are not particularly active but, given the lack of official
support for their activities, it is remarkable that they are as active as they are. In any case, we believe that these sorts of problems can be overcome if sufficient resources are put in to
supporting the network. Resources are not only needed to ensure that individual local organisers
are effective (by enthusing existing incumbents and by recruiting replacements for ineffective
individuals) but they are also needed to support the work of the local organisers. That support
may range widely from the provision of office back-up and of such things as display materials, to
the training of local organisers in effective ways of carrying out their role.
10. THE SPECIAL PROBLEMS OF SPARSELY POPULATED AREAS
It is almost inevitable that there are likely to be fewer volunteers available in sparsely populated
parts of the country. In practice, the problem seems to be smaller than might be thought. InScotland, for example, where large parts of the country are very sparsely populated, the
membership of The Mammal Society is disproportionately large in relation to the population as a
whole (and levels of participation in almost all BTO schemes are also disproportionately greater).
Similarly, in Northern Ireland where we (and we understand others) have sometimes had
problems in recruiting enough volunteer fieldworkers, The Mammal Society has found a
particularly strong demand for training courses. It may be that, in the more sparsely populated
parts of the UK, people appreciate the need to get involved themselves and not to leave such
volunteer work to others. In addition, in these smaller communities people with common
interests tend to know each other better than they do in heavily populated parts of the country, so
that there is more interaction and mutual encouragement to take up volunteer work of the sort we
are discussing. Nonetheless, there is often a problem in getting enough volunteers in the sparsely
populated parts of the country and any plans to set up a programme of mammal monitoring must
address how this problem can be dealt with.
It is important, in such areas, to demonstrate to people that the work one wishes to carry out is
useful in a local, as well as a UK, context since people often have greater commitment to their
local area or to their own country than they do to the UK as a whole. This needs to be
remembered throughout the process of interacting with volunteers and it is one of the reasons
why it is valuable to have contacts at local level and not just through newsletters and conferences
that cover the whole of the UK.
The key to recruiting volunteers is persistent encouragement to participate. The means are
through meetings with local natural history societies and similar groups, through notices in the
magazines of the Wildlife Trusts, through training courses, and so on. This sort of
encouragement can best be delivered at a local level, underlining the importance of having
regional meetings around the country and events associated with National Mammal Weeks, as
well as a good system of regional organisers and, if possible, professional staff located in offices
in various places around the UK rather than in just one place. Given that this sort of
encouragement to participate is delivered at local level, it is possible to concentrate these
activities in those parts of the UK where volunteers are most needed. Doing so can have an
important impact on the level of recruitment.

8/18/2019 BTO Research Report No.223 - Developing a Mammal Monitoring Programme for the UK
http://slidepdf.com/reader/full/bto-research-report-no223-developing-a-mammal-monitoring-programme-for-the 240/316
BTO Research Report No.223July 1999 238
Concentrating recruitment and publicity efforts in the areas of sparse population is unlikely to
overcome the problem entirely. One way of mitigating its effects is to stratify the sampling
programme for surveys according to the availability of observers. This allows the variation in
intensity of sampling in different regions to be allowed for in the analysis. It does not, however,
solve the problem that the intensity of coverage in sparsely populated regions may be too low to
give satisfactory information on the regional populations of animals.
To attain better coverage in sparsely populated regions than the local volunteers can provide, it is
necessary for people from other areas to help out. One way in which this can be done is by
mounting expeditions of teams of volunteers from elsewhere in the country. “Earthwatch” is a
global example of the way in which volunteers are often prepared not only to participate in
working holidays but to pay the costs of doing so, particularly where there is an element of
training involved. Since sparsely populated areas of the UK tend to be areas that naturalists from
elsewhere find particularly attractive, there are considerable possibilities of covering such areas
with visiting teams of observers. We suggest that such arrangements may work best when the
organisation responsible for monitoring is able to bring together potential visitors and local
volunteers. The latter, with their local knowledge, can undertake tasks such as getting access permission and finding accommodation, so that the visiting volunteers can concentrate on getting
the fieldwork done. Even simply putting individuals from elsewhere into contact with the
regional organisers in sparsely populated areas can be a useful contribution to increasing the
volunteer effort in the sparsely populated regions.
The obvious solution to coverage in sparsely populated areas is to employ professionals to survey
them. We believe that this should be a last resort because the response of volunteers may be that
their time is obviously not needed, since the survey organisers can afford to pay professionals. If
professionals are put into the field, they should have close contact with the local regional
organisers so that they are very much seen as part of the local team and not just as professionals
drafted in from outside.
It is often advantageous for survey organisers to undertake some of the fieldwork involved in
their survey in order that they should understand the practical problems which the fieldworkers
encounter and to provide a quality control against which to evaluate the results submitted by
volunteers. If this is to be the case, then it is clearly best for their efforts to be especially
concentrated in the sparsely populated regions of the country, not only because that helps to fill
the gaps in the coverage, but because if they interact well with local volunteers and potential
volunteers, then they can build up the enthusiasm that is so important for recruiting and retaining
members of the volunteer network.
11. SHOULD DIRECT FINANCIAL SUPPORT BE PROVIDED FOR
VOLUNTEERS?
There is no doubt that providing financial support for volunteers could help recruitment,
although, depending on the sort of financial support offered, they might no longer be volunteers
in the strict sense. Many of the advantages that stem from using volunteers would persist, such
as the number of people that could be involved in a survey over a short period of time, and the
local knowledge that volunteers have of their areas. The major disadvantage of supporting
volunteers financially would be the costs, even if only travel costs and a modest fee were to be
paid, this could increase the overall cost of a monitoring programme many fold, even to the point
where it might be more cost-effective instead to conduct the survey wholly through professionalstaff.

8/18/2019 BTO Research Report No.223 - Developing a Mammal Monitoring Programme for the UK
http://slidepdf.com/reader/full/bto-research-report-no223-developing-a-mammal-monitoring-programme-for-the 241/316
BTO Research Report No.223July 1999 239
Even if it should be judged that the costs involved of providing financial support for volunteers
are justified by the likely improvement in recruitment for a particular survey, it is important that
the issue is very carefully considered before it is decided to go down the route of making
payments. This is because any such system of payment sets something of a precedent with wider
implications for wildlife monitoring generally. Payments made in respect of one monitoring
scheme may be a cost-effective way of running that scheme but they may, through underminingvolunteers’ willingness to participate in survey work without financial support, cause problems
for other wildlife monitoring schemes.
It is also worth pointing out that developments in employment law are such that one has to be
extremely careful in making payments to volunteers. It is very easy to get into a situation where
they are legally to be treated as employees. This may lead to problems in relation to conditions
of employment, health and safety, minimum wage and dismissal on the grounds of unsatisfactory
performance, or indeed of redundancy.
The arguments against providing direct financial support for volunteers are therefore strong. In
general, the equivalent funding spent on providing them with encouragement, support andfeedback is likely to be more cost-effective in building up a team of dedicated volunteer wildlife
surveyors.
There is one exception to this generalisation, which is that coverage of remote areas may be
improved if some funding is available to assist with the travel expenses of volunteers. Even here,
however,
it is important to be seen to be providing such funds as a special case, with the funding available
to support fieldwork requiring special efforts in remote areas. The payments should never be
seen to be matters of routine.

8/18/2019 BTO Research Report No.223 - Developing a Mammal Monitoring Programme for the UK
http://slidepdf.com/reader/full/bto-research-report-no223-developing-a-mammal-monitoring-programme-for-the 242/316
BTO Research Report No. 223
July 1999240

8/18/2019 BTO Research Report No.223 - Developing a Mammal Monitoring Programme for the UK
http://slidepdf.com/reader/full/bto-research-report-no223-developing-a-mammal-monitoring-programme-for-the 243/316
BTO Research Report No. 223July 1999
241
PART VI. POTENTIAL RELATIONSHIPS BETWEEN MAMMAL MONITORING
AND THE NATIONAL BIODIVERSITY NETWORK
1. THE CURRENT BIOLOGICAL RECORDING NETWORK
Some biological recording is organised through national bodies but much of it takes placethrough Local Records Centres (LRCs). The distribution of these is, unfortunately, very patchy;
the number of effective LRCs is perhaps only 20% of what is required; some parts of Britain
have never had an LRC; others have had one in the past but not now. The effective LRCs feed
data into the national Biological Records Centre (run by ITE); others do not.
Another important element of biological recording comprises the County Recorders, usually
volunteers but sometimes employees of bodies such as county museums, squeezing their
recording work into gaps they make between their other duties. Some counties have recorders for
a wide range of taxa (sometimes co-ordinated through a county naturalists’ society); some taxa
(including, now, mammals) have recorders in almost all counties. As with LRCs, the
effectiveness of County Recorders varies widely. Effective County Recorders work closely witheffective LRCs, exchanging records systematically.
Ulster, with a Biological Records Centre that covers the whole province, is in a unique position.
We address this briefly in section 9.
2. THE PROPOSAL FOR A NATIONAL BIODIVERSITY NETWORK (NBN)
The NBN is currently under development, with the objective of improving the provision of
biodiversity information to all those who need it, through better collection, collation, and
dissemination. The vision is of a complete network of LRCs (to gather and disseminate data
locally), linked with national societies, organisations and schemes that gather or use such
information.
Much thought, planning and preparatory work has gone into the proposal but its progress
depends on how quickly three things can be achieved: first, completing the LRC network;
second, building the links between the elements of NBN in such a way that information is as
freely available as possible but with safeguards against its misuse (and with protection of
ownership rights); third, funding for the building and operation of what will be an expensive
system. It is currently not clear what the time-scale is likely to be, though the wish is to begin
expansion from a demonstration phase in 2000 and to complete the national network with
comprehensive local coverage by 2010.
This part of our report addresses the part that NBN might play in mammal monitoring. We
concentrate on one area in particular: the potential role of the LRCs.
3. THE ADVANTAGES OF BUILDING FROM LOCAL TO NATIONAL
Many naturalists have particular commitment to their local areas. Building up national
programmes of recording and monitoring from the local level has the advantage that such local
commitment is harnessed. Many volunteers in national schemes, however, also take a pride in
making their contribution to something of national significance, so it is important that the local
elements are seen to be part of the national programme, not as independent entities.

8/18/2019 BTO Research Report No.223 - Developing a Mammal Monitoring Programme for the UK
http://slidepdf.com/reader/full/bto-research-report-no223-developing-a-mammal-monitoring-programme-for-the 244/316

8/18/2019 BTO Research Report No.223 - Developing a Mammal Monitoring Programme for the UK
http://slidepdf.com/reader/full/bto-research-report-no223-developing-a-mammal-monitoring-programme-for-the 245/316
BTO Research Report No. 223July 1999
243
Unfortunately, resources are limited. A county that concentrates enough effort on riparian
habitats to be able to monitor riverside species precisely at the local level is less likely to be able
to find enough further volunteers to do all of the general mammal monitoring needed nationally.
A third problem with the bottom-up approach is that the data can only be interpreted readily at
national level if they are gathered using uniform protocols and common data standards. Such areunlikely to emerge without an overarching national organisation.
5. CONCLUSION: MAMMAL MONITORING SHOULD BE CENTRALLY
ORGANISED
We believe that a national programme of monitoring can only be delivered effectively if it is
centrally organised; the disadvantages of the alternative bottom-up approach (4, above) strongly
outweigh the advantages (3, above). Ornithological experience across Europe supports this
conclusion. Bird monitoring has been effectively developed in many European countries but not
in those where the organisational structure is divided regionally.
Our conclusion specifically with reference to NBN is that it cannot provide the means for
collecting data for a national monitoring programme. If the organisation of a survey is the
responsibility of a national centre, then the data can be collected satisfactorily without NBN
being involved, whether the fieldworkers are professionals or volunteers, though indirect support
of fieldworkers may usefully be provided by LRCs (see Section 7, below).
6. CAN NBN CONTRIBUTE IN ANY WAY TO DATA COLLECTION FOR
NATIONAL MONITORING?
Our general conclusion does not mean that NBN has no part to play in data collection for
national monitoring. In particular, the national monitoring of some species may require intensive
local work (e.g. local studies of the more southerly populations of Red Squirrels). There may
also be cases where local enthusiasm results in intensive studies that complement the extensive
national work (e.g. the new Water Vole study in Somerset). LRCs may be important in either
circumstance, providing a focus for local organisation, technical expertise and back-up, and a
connection (via NBN) with the national programme.
Should intense local work be planned, it is important (in terms of effectiveness) that it fits in well
with the national programme and that it does not detract from national priorities. It is also
important, as with all monitoring work, that it has some guarantee of continuity, to avoid
resources being wasted. Given the history of so many LRCs, this last point should not beforgotten.
LRC personnel (whether staff or volunteers) can also contribute significantly to national
monitoring by encouraging volunteers to participate and by stressing the value of local efforts
being drawn together at the national level, to provide the monitoring feedback that will ultimately
drive national policy and, thus, eventually, the fate of local wildlife. LRC personnel can also be
in the vanguard of training, perhaps going on special training courses themselves and then
passing on the skills to local volunteers. Demonstration collections of skins and “signs” would
be particularly useful for training potential mammal recorders.

8/18/2019 BTO Research Report No.223 - Developing a Mammal Monitoring Programme for the UK
http://slidepdf.com/reader/full/bto-research-report-no223-developing-a-mammal-monitoring-programme-for-the 246/316
BTO Research Report No. 223July 1999
244
LRCs may also assist national programmes by providing office facilities for volunteers (both
fieldworkers and regional co-ordinators). Computing facilities and local data collation (Section
3, above) are obvious examples but even such simple things as photocopying may be useful to
some people. For monitoring schemes that involve significant quantities of data being generated
by individual observers, it may be cost-effective to ask observers to submit the data
electronically; more generally, regional organisers might usefully submit their regional dataelectronically. In such cases, LRCs may be able to provide the appropriate facilities for the input
and transmission of data.
7. USING LRCs AND NBN FOR DISTRIBUTION RECORDS
Rejecting a bottom-up approach to building a mammal monitoring programme does not mean
rejecting any role for LRCs. They have a part to play, especially through NBN and especially in
terms of distribution records. Such records are useful for identifying locally significant wildlife
sites, which is often important for local planning. LRCs are the most effective means of
collecting and collating such information; NBN will be an effective means of delivering
distributional information collected at the national level to the LRCs.
Even though there are severe problems of interpretation caused by the unsystematic nature of
most biological recording, such records have been used both to model the distributions of
animals and plants (thus helping us to understand what controls them) and to monitor changes in
distributions. LRCs are important for drawing in general distribution records, particularly
because they can harness local enthusiasm in a way that a national centre cannot. Those parts of
mammal monitoring that require distribution to be monitored will therefore benefit greatly from
the involvement of LRCs.
Where the recording of distribution needs to be based on a more systematic approach, as in
recent atlases of birds, central organisations is appropriate, to maintain uniform protocols and
common standards. LRCs have a role to play even here, however, as one means of linking
volunteer observers into the national programme of work.
8. DISSEMINATION OF INFORMATION THROUGH NBN
This is the central objective of NBN. Even if a mammal monitoring programme is organised
centrally, NBN will be a highly effective means of delivering information from the central
system to LRCs. Site-based records would form the bulk of such information (Section 7, above)
but it would be appropriate for LRCs also to be the point of contact between NBN and the public
in respect of monitoring results for local populations. This would be important both for thedevelopment and promotion of the monitoring programme and for the use of its results at local
level.
9. ULSTER: A SPECIAL CASE
The Ulster Biological Records Centre covers the whole province and is well-founded.
Furthermore, the ecological, land-use and cultural differences between Ulster and GB are
sufficiently great that it might be useful to modify national monitoring programmes for local
application there, even at the expense of abandoning the uniformity of approach that is generally
so important in national monitoring schemes. Furthermore, there may be advantages in some of
the work in taking an all-Ireland approach in Ulster, even if this interferes with a UK approach:

8/18/2019 BTO Research Report No.223 - Developing a Mammal Monitoring Programme for the UK
http://slidepdf.com/reader/full/bto-research-report-no223-developing-a-mammal-monitoring-programme-for-the 247/316
BTO Research Report No. 223July 1999
245
in terms of the effective delivery of conservation science, biogeography may be more important
than administrative protocol.
We do not have the expertise to do more than raise these issues and to recommend that they be
seriously addressed as part of the planning of a mammal monitoring programme.
10. SUMMARY
1. NBN would not be appropriate as the chief means of data gathering for the national mammal
monitoring programme but has important roles in drawing intensive local studies into the
national programme and in encouraging and supporting volunteer participants.
2. NBN has an important role in gathering distribution records locally for use centrally.
3. NBN has a major role in disseminating monitoring results.

8/18/2019 BTO Research Report No.223 - Developing a Mammal Monitoring Programme for the UK
http://slidepdf.com/reader/full/bto-research-report-no223-developing-a-mammal-monitoring-programme-for-the 248/316
BTO Research Report No.223July 1999
246

8/18/2019 BTO Research Report No.223 - Developing a Mammal Monitoring Programme for the UK
http://slidepdf.com/reader/full/bto-research-report-no223-developing-a-mammal-monitoring-programme-for-the 249/316
BTO Research Report No.223July 1999
247
PART VII PROPOSALS FOR A UK MAMMAL MONITORING SCHEME
1. SPECIES AND SCHEMES
The proposals set out in MMR are based around a single, three-tiered grid design, to which the
recommended monitoring techniques are applied. We have not attempted to create a single
monitoring scheme for all UK mammals, since we recognise that it is unlikely that a
comprehensive scheme will be an affordable option. It would also lead to a lack of flexibility in
incorporating pre-existing data collection and in adaptation to constraints such as the available
density of volunteers. Instead, we have indicated species-specific monitoring options, combined
into multi-species schemes where possible to maximize cost-effectiveness, as described in Parts
III and IV. Table VII.1.1 summarises the available monitoring options for each species (as we
see them), and the range of species for which each multi-species scheme can contribute useful
information. We then indicate likely approximate costs for the various individual schemes and
discuss briefly practical considerations for the organisation of our proposed composite mammal
monitoring programme.
2. COSTS OF THE PROPOSED SCHEMES
We now present approximate costings for the multi-species schemes proposed in Part III and for
a single example of a species-specific scheme, which should be generally applicable to all such
schemes described in Part IV and referred to in Table VII.1.1. All costings are based on the
experience of the BTO in setting up and operating each type of scheme and of the various
staffing requirements that the schemes will incur. They should be taken as estimates: running
several schemes in parallel under the control of a single organisation would be likely to lead to
economies of scale and some costs are necessarily unpredictable until the details of survey design
and the numbers of volunteers participating are known.
These estimates are costed at 1999/2000 rates and all figures exclude VAT.
The total costs are summarised in Section 2.8.
Note that we have not addressed the costs of running some of the more specialised single-species
schemes.

8/18/2019 BTO Research Report No.223 - Developing a Mammal Monitoring Programme for the UK
http://slidepdf.com/reader/full/bto-research-report-no223-developing-a-mammal-monitoring-programme-for-the 250/316
BTO Research Report No.223July 1999
248
2.1 Likely Costings- Additional Data Collation Through the Breeding Bird Survey
The figures presented below are the projected costings associated with the collation of mammal
data as a formalised component of the Breeding Bird Survey. The recurrent costs represent
approximately a 10% increase on the existing Breeding Bird Survey annual budget.
Detail Days Grade Cost (£)
Setup costs
Development of methods 55 HSO 11,000
Programming 30 HSO 6,000
Total Setup Costs 17,000
Recurrent costs
Inputting/Printing 3,000
Data Validation 15 SO 3,000Data Analysis 20 HSO 4,000
Feedback/scheme promotion 20 SO 3,000
Total Recurrent Costs 13,000
Notes:
1. Programming includes simulations on existing data to evaluate sampling requirements
and the development of programs to check and analyse the data gathered.
2.2 Likely Costings - Additional Data Collation Through the National Game Bag Census
The figures presented below are the projected costings associated with the collation of data on
sampling effort as a new component of the National Game Bag Census. It is assumed that
secretarial support and other associated costs are already met as a component of the existing
National Game Bag Census protocol.
Detail Days Grade Cost (£)
Setup costs
Form design 10 HSO 2,000
Analysis for setup 20 SSO 5,000Promotion of the scheme 40 SO 7,000
Total Setup Costs 14,000
Recurrent costs
Promotion of the scheme 20 SO 3,000
Annual reporting 20 HSO 4,000
Total recurrent costs 7,000

8/18/2019 BTO Research Report No.223 - Developing a Mammal Monitoring Programme for the UK
http://slidepdf.com/reader/full/bto-research-report-no223-developing-a-mammal-monitoring-programme-for-the 251/316
BTO Research Report No.223July 1999
249
2.3 Likely Costings - Combined Scheme with Winter Transects, Sign Transects and
Mammals on Roads
The three schemes (Winter Transects, Sign Transects and Mammals on Roads) could be co-
ordinated most cost-effectively by running them in parallel rather than in isolation. This would
require the establishment and introduction of schemes on a rolling basis, with one new scheme
being established every year until all three were operating in parallel. The costings presented
below assume this approach is adopted and include set-up and running costs. The costings are
for al l schemes together rather than per scheme. We anticipate that the establishment and
operation of a single scheme (in isolation) would require approximately half of the sums shown:
running all three would allow certain economies of scale.
Detail Days Grade Cost (£)
Organiser/Publicity 220 HSO 44,000
Data Manager/Analyst1 220 SO 37,000
Secretarial support 110 SEC 12,000
Scheme workshops c.10,000
Travel c.5,000
Data inputting c. 7,000
Mailing/Printing Costs (report) c. 6,000
Total Annual Cost 121,000
Notes:
1. Some consultancy on analysis techniques and statistical design may be considered
appropriate, in which case this would need to be costed into this budget.
2.4 Likely Costings - Mammals on Nature Reserves
The costings presented below assume that a sample of 3,000 nature reserves are included in
the scheme. The costs presented are recurring annual costs (30-50% on top of this is
envisaged during the initial year).
Detail Days Grade Cost (£)
Promotion of the scheme & feedback 55 SO 9,000
Data analysis and interpretation 20 HSO 4,000
Secretarial support 20 SEC 2,000
Data inputting1 c. 1,000
Mailing/Printing Costs (report) c. 9,000
Total Annual Cost 25,000
Notes:
1. - Assumes that data are input using an Optical Mark Reader.

8/18/2019 BTO Research Report No.223 - Developing a Mammal Monitoring Programme for the UK
http://slidepdf.com/reader/full/bto-research-report-no223-developing-a-mammal-monitoring-programme-for-the 252/316
BTO Research Report No.223July 1999
250
2.5 Likely Costings - Owl Pellet Survey
The figures presented below are the projected costings associated with the processing of mammal
data from a standardised analysis of pellet material. This would involve collection, analysis and
submission of material by volunteers, with co-ordination and some validation carried out
centrally.
Detail Days Grade Cost (£)
Co-ordination 20 SO 3,000
Promotion/Feedback 20 SO 3,000
Data analysis 20 HSO 4,000
Total Annual Cost 10,000
2.6 Likely Costings - One Year Single Species Survey
The costings presented below assume that a single year of fieldwork is required to carry out a
survey for an individual species.
Detail Days Grade Cost (£)
Setup costs
Determination of sampling protocol1 10 SSO 2,000
Determination of sampling protocol1 75 HSO 15,000
Total Setup Costs 17,000
Running costs
Overall running of the project 15 SSO 4,000
50 HSO 10,000
110 SO 19,000
Secretarial Support 30 SEC 3,000
Expenses
(Travel, Inputting Data, Printing Costs) 5,000
Total Running Costs 41,000
Notes:
1. This includes examination of suitable methods, simulation of stratification required
and associated analyses.

8/18/2019 BTO Research Report No.223 - Developing a Mammal Monitoring Programme for the UK
http://slidepdf.com/reader/full/bto-research-report-no223-developing-a-mammal-monitoring-programme-for-the 253/316
BTO Research Report No.223July 1999
251
2.7 Likely Costings - National Co-ordination of Mammal Schemes
The costings presented below represent the likely requirement for linking the various schemes at
the national level, thereby providing a nationally coherent approach to mammal monitoring. The
co-ordinator would also be responsible for the collation of data from existing schemes such as
those currently carried out on deer and squirrels. These figures could potentially be reduced by
50% if the national co-ordination was integrated directly into the co-ordination of the three
schemes (Winter Transects, Sign transects and Mammals on Roads) approach outlined
previously.
Detail Days Grade Cost (£)
Co-ordination of schemes, publicity, etc 220 HSO 44,000
Secretarial Support 50 SEC 5,000
Total Cost 49,000
2.8 Likely Costings - Total Costs for All Schemes
Setup Costs (where calculated)
Cost (£)
Additional Data from the Breeding Bird Survey 17,000
Additional Data from National Game Bag Census 14,000
Mammals on Nature Reserves Not costed
Owl Pellet Survey Not costed
Total (where costed) 31,000
Annual Recurrent Costs
Cost (£)
Additional Data from the Breeding Bird Survey 13,000
Additional Data from National Game Bag Census 7,000
Combined Schemes (Winter Transects, Sign Transects, 121,000
Mammals on Roads, Mammals on Nature Reserves) 25,000Owl Pellet Survey 10,000
Single Species Survey (includes setup costs) 58,000
National Co-ordination 49,000
Total Recurrent Costs 283,000

8/18/2019 BTO Research Report No.223 - Developing a Mammal Monitoring Programme for the UK
http://slidepdf.com/reader/full/bto-research-report-no223-developing-a-mammal-monitoring-programme-for-the 254/316
BTO Research Report No.223July 1999
252
3. ORGANISATIONAL PRACTICALITIES
There are several issues that need to be addressed, or at least borne in mind, during the
development of a mammal monitoring scheme.
3.1 Long-term guarantees
There is no point in setting up any monitoring scheme without some commitment to its long-term
continuity. Schemes that are discontinued after a few years are a waste of time and money.
They also seriously undermine the enthusiasm of participants, especially volunteers. If a
mammal monitoring scheme is set up then those who have undertaken to fund it must be
prepared to give guarantees about its future that are sufficiently firm that it would at least cause
them severe embarrassment were the funding to be withdrawn. For this reason, it would be
better to start with a modest scheme that costs relatively little than a more ambitious and more
expensive scheme. A modest scheme can be expanded as it becomes established and if funding
is available, whereas an expensive scheme is likely to be more subject to the vagaries of the
financial climate.
Another aspect of long-term security is that those responsible for the work should be corporate
bodies rather than individuals, so that there is a better guarantee of continuity.
3.2 Security of data
However the programme is organised, raw data and the supporting documentation should be
copied and stored in more than one place. The most effective way to do this is to computerise
the data, or at least to store its image on CD-ROMs. It is essential to set up the right data
curation systems from the start. Indeed, as a one-off investment, data from previous surveys
should be computerised where this has not already been done.
3.3 Developing the system
It would be unwise to set up all components of the system at once. Rather, there should be a
phased approach, beginning with the most urgent schemes and introducing others after the most
urgent are established.
3.4 Comprehensiveness
Consideration should be given to including bats and marine mammals in the overall mammal
monitoring system.
3.5 Design and Statistics
A critical part of the design of any monitoring programme is the method of statistical analysis
proposed to deliver information with the precision and power required. We have considered
these issues with respect to the BBS in Part III.A.1, but many of our remarks there also apply to
other monitoring schemes. All of the entries in Table VII.1.1 assume that sufficient sample sizes
and effective analysis techniques are in place: these must be dealt with during the initial
organisation of any survey and could have large impacts on the time and effort required (for
example, to recruit volunteer effort from more sparsely populated areas). Where multiple
surveys

8/18/2019 BTO Research Report No.223 - Developing a Mammal Monitoring Programme for the UK
http://slidepdf.com/reader/full/bto-research-report-no223-developing-a-mammal-monitoring-programme-for-the 255/316
BTO Research Report No.223July 1999
253
are to be considered, the quality of information which is likely to accrue from thecombination of
surveys must be assessed. This presents a different statistical problem which is considered briefly
in Part VIII.4.
3.6 Organisation
There may be large numbers of organisations with potential interests in mammal monitoring, as
producers or as users of information; some may be able to provide financial support or staff
manpower; others may be able to muster teams of volunteers. All of them need to be drawn
together, their different interests recognised, and an overall organisation put in place. We advise
against setting up bureaucratic structures; what is need is clear agreement as to what is each
body’s role and how these various roles should work together in making the whole system work.
If the decision is taken to base much of the system on volunteer fieldworkers, one or more
membership-based NGOs needs to be supported to take the lead in organising the volunteer-
based work.
3.7 Geographic aspects of organisation
Thought should be given to whether schemes should be run centrally or from centres in each
country (or even in regions of countries).
3.8 Professional/volunteer interface
We have covered many aspects of this in Part V. A further point is that some organisations may
have such a particular interest in a species that they are prepared to put time from their own staff
into the fieldwork or into its local organisation. If, as a result, these staff are essentially doing
work that might otherwise have been done by volunteers and especially if they are covering onlysome of the work for a survey (with volunteers providing the rest), it is important that they are
seen by volunteers as part of the same team as themselves. How this is done will vary from
scheme to scheme but its importance should not be overlooked.

8/18/2019 BTO Research Report No.223 - Developing a Mammal Monitoring Programme for the UK
http://slidepdf.com/reader/full/bto-research-report-no223-developing-a-mammal-monitoring-programme-for-the 256/316
BTO Research Report No.223July 1999
254
8/18/2019 BTO Research Report No.223 - Developing a Mammal Monitoring Programme for the UK
http://slidepdf.com/reader/full/bto-research-report-no223-developing-a-mammal-monitoring-programme-for-the 257/316
BTO Research Report No.223July 1999
255
PART VIII. DETERMINING THE LIMITS OF CHANGE
1. INTRODUCTION
In Part I of this report we have considered why conservationists should wish to monitor British
and Irish mammals. In Part II, we have considered the design of monitoring programmes. These
broad issues now need to be brought down to the practicalities of putting together a practical
programme for monitoring, based not only on this report and on MMR but on the views of all of
those who have an interest in such work. This is not a task for us but in this final part of the
report we raise issues that need to be addressed during the planning of a mammal monitoring
programme: how one decides what are the priority species, what information is required for each
(in terms of both type and precision), and the sorts of pilot work that should be done before the
programme of work is finalised.
To set the scene, we quote from Buckland (1993) who, although he was addressing narrower and
more local management issues, illustrates clearly how the definition of management
requirements is an integral part of conservation science, determining exactly what science andmonitoring needs to be done:
To determine appropriate methods for counting deer, or for estimating deer density, it
is necessary to define and list management objectives. These objectives should be
specific, and tolerances should be specified that determine maximum acceptable
departures from the desired objectives. Only then can the value to management of
competing methodologies be fully and objectively compared, and experiments carried
out to aid this comparison. A strict definition of management objectives enables
subsidiary requirements to be identified. For example, if an objective is to ensure that
deer population size is maintained below some limit, that limit or “target population”
must be determined. This in turn requires that the term target population is preciselydefined. For example, it might be that population which maintains current diversity of
habitat, or allows habitat diversity to reach a pre-determined level. This then
necessitates modelling habitat diversity as a function of deer numbers, if possible by
detailed modelling of deer requirements in different habitats, otherwise or additionally
by monitoring habitat change and incorporating a feedback mechanism, so that cull
sizes are adjusted to ensure convergence to the desired habitat diversity. The detailed
“process” modelling allows target populations to be estimated, whereas the feedback
approach by default yields an estimate only when habitat stability at the desired
diversity has been reached, and the deer population is therefore at the target level. In
practice, a combination of these approaches, with greater initial dependence on the
process models, and increased use of feedback over time, allows faster achievement ofthe target population with adjustment of that target if feedback suggests that the initial
estimate is poor.
Tight definition of management objectives can lead logically to sophisticated research
requirements, as outlined above. However, by specifying tolerances for these
objectives, it may become clear that approximate rules of thumb can sometimes replace
the process modelling step. For example, data from a number of sites and from various
sources may suggest acceptable deer densities by type of forest with adequate
accuracy. It is then necessary merely to estimate density periodically (with precision,
and hence survey effort, determined from the specified tolerances), and to adjust cull
levels if required.
8/18/2019 BTO Research Report No.223 - Developing a Mammal Monitoring Programme for the UK
http://slidepdf.com/reader/full/bto-research-report-no223-developing-a-mammal-monitoring-programme-for-the 258/316
BTO Research Report No.223July 1999
256
2. HOW SHOULD WE DECIDE WHAT ARE THE PRIORITY SPECIES?
Other things being equal, the species to which most monitoring effort should be devoted are
those most in actual or potential need of active management. Of course, other things are not
equal: some species may be very easy to monitor, so may be worth a little effort even if of low
conservation priority; others may be so difficult to monitor that, even if they are of high
conservation priority, it is better to devote the monitoring resources to other species.
Nonetheless, determining priorities for conservation management is an essential next step in
establishing a mammal monitoring programme. We list here matters that need to be taken into
account when priorities are determined. Our list is not in order of importance.
1. Legal and administrative status
If there is a legal or administrative requirement to manage the population of the species,
monitoring is essential.
2. Can the species be managed effectively?
Suppose it were to be concluded that the population of American Mink on mainland Britain
could not be controlled given the resources available. (We are not arguing that this is, indeed,
so). Then there is a little point in monitoring that population for its own sake. There might, of
course, be reasons for monitoring it in order to understand its interactions with other species or as
an indicator, but those are different matters; it is important to be clear about the issues and not to
confuse them.
In contrast, it might be concluded that American Mink populations on many islands could be
controlled; if there were reasons for implementing such control, monitoring of these populations
would be needed.
3. Taxonomic status
Some conservationists argue that taxonomically more isolated species are more important than
those with many relatives, since their extinction would result in a greater loss of total
biodiversity. At the species level, this may not be an important criterion for British and Irish
mammals. At the intraspecific level it is: many would wish to conserve Soay Sheep and Feral
Goats because they are ancient breeds now scarce and rather distinct from modern domestic
sheep and goats; however, they are not full species and should therefore perhaps be accorded
relatively low priority.
4. Is the species alien?
The introduction of species outside their natural range has had many ecological and economic
impacts; it has often reduced biodiversity by bringing about the extinction of native species.
Even without such impacts, however, introduction of aliens results in loss of biodiversity - that
part of biodiversity (! - diversity in technical terms) comprising the biotic differences between
different parts of the world that depend not on modern ecology but on the accidents of history,
such as the absence (before man interfered) of marsupials from Europe or of Fat Dormice from
Britain and Ireland.
8/18/2019 BTO Research Report No.223 - Developing a Mammal Monitoring Programme for the UK
http://slidepdf.com/reader/full/bto-research-report-no223-developing-a-mammal-monitoring-programme-for-the 259/316
BTO Research Report No.223July 1999
257
Note that whether the species is alien does not always have a simple answer. For example, some
might argue that the introduction of Microtus arvalis to Orkney by Neolithic people should be
considered “natural”; we might wish to be more tolerant of House Mice than of Brown Rats
because they have been here for a few thousand, rather than a few hundred, years; we might be
more tolerant of the Brown Hare than of the American Mink because it has long ago settled into
Britain’s ecology, whereas the mink is still causing disruption.
5. Are the species’ numbers dangerously low?
We doubt whether any species of mammal native in Britain and Ireland is so scarce that it is
likely to become extinct through demographic accidents or inbreeding. The evidence from the
establishment of so many species from small introductions and from the persistence of others on
islands is that our mammals are able to persist at very low numbers.
6. Are numbers expectedly low?
The relationship of animal abundance to body size is one of the most persuasive of ecologicalgeneralisations (Peters 1991). It applies to British mammals (Greenwood et al. 1996). Harris et
al. (in prep.) point out that some species of British mammals (e.g. Pine Marten) are less common
than one would expect on the basis of their body size, while others (e.g. Rabbit) are more
abundant than expected. They suggest that these departures from expectation should be used to
identify species of particular conservation concern, and species interactions that should be
considered, to take prioritisation beyond simple rarity and population change.
7. Current and historical population changes
If a species is currently declining in numbers, or has undergone a marked decline in the past, then
(especially if the decline can be ascribed to human activities) many would argue that the declineshould be reversed. People feel that the species’ numbers should be restored to their “natural”
level. Given the ecological transformations that man has wrought in Europe over the last 10,000
years, defining what that level should be is impossible in both practice and principle; that does
not, however, weaken people’s views that we “ought” to have more Pine Martens, Brown Hares
and Water Voles.
Equally, people become concerned if populations are increasing beyond what they regard as
desirable or natural.
These views are strongly value-laden but they are also often strongly held. Even when they do
not lead to a decision to take action to modify the decline or growth in the population, they mayrequire that the population is monitored, so that the need for management action can be kept
under review.
8. International status
In addition to domestic issues, international status may be a reason for giving a species priority:
Is the species generally rare in Europe? Does Britain hold a high proportion of the European
population? Such considerations are often reflected in legislation but the latter should not be the
only criterion.

8/18/2019 BTO Research Report No.223 - Developing a Mammal Monitoring Programme for the UK
http://slidepdf.com/reader/full/bto-research-report-no223-developing-a-mammal-monitoring-programme-for-the 260/316
BTO Research Report No.223July 1999
258
9. Quarry species
Species that are hunted should usually be monitored (if only at the level of the individual
exploited populations), to ensure that their numbers are not reduced to levels either that threaten
the economic viability of the hunting or that are unacceptable to the public.
10. Health and economic impacts
Some mammals are vectors of human diseases and many others cause economic damage. In
contrast, other species are of economic benefit, not just as quarry species but as tourist
attractions, for example. It is not always necessary to monitor such species directly. For
example, if damage to trees by Feral Goats is monitored and the goats are culled when the
damage reaches unacceptable levels, the situation can be well managed - better managed, indeed,
than if one monitored the goat population itself and managed it to some target that was
considered, perhaps mistakenly, to be appropriate in terms of vegetation damage. In other cases,
direct monitoring would be appropriate.
11. Ecological impacts and species interactions
The American Mink is an important predator of the Water Vole and may have been the key
factor in the massive decline of the latter. If the Water Vole is to be conserved, we need to
understand its ecology and be aware of the changing pressures on it; monitoring mink is thus
important for Water Vole conservation, even if not for any other reason. Equally, the impact of
grazing by Field Voles and Rabbits and their status as prey of many birds and mammals is an
argument for monitoring their numbers.
12. Is the species a useful indicator of the state of the environment?
The way in which the declines of farmland birds have focussed conservation and political
attention on the need to reform agricultural policy shows the potential value of using wildlife as
indicators of environmental problems.
13. Cultural significance
Some species are culturally important: the Red Fox has played a major part in rural life and
economics for many years; the Ship Rat was responsible for the outbreaks of bubonic plague that
had so much impact on our history. Some would argue that these species should be conserved
for that reason, just like the Magna Carta and great buildings.
14. Public resonance
Some species arouse more public sympathy and interest than others. In a democracy it is right
that this should influence conservation action. Furthermore, species that resonate with the public
will act as more effective alarm signals than others, if their decline is an indicator of wider
problems. For these reasons, the resonance of the species with the public is an appropriate
criterion to use when judging the priority of species for conservation monitoring, alongside the
other criteria we have listed.

8/18/2019 BTO Research Report No.223 - Developing a Mammal Monitoring Programme for the UK
http://slidepdf.com/reader/full/bto-research-report-no223-developing-a-mammal-monitoring-programme-for-the 261/316
BTO Research Report No.223July 1999
259
3. WHAT INFORMATION IS REQUIRED?
For some species, we have clearly indicated in Part IV the different monitoring programmes that
would be appropriate for different management objectives. In general, however, there is a
considerable range of possible objectives, so we have not considered alternative monitoring
strategies in detail. It is important that the objectives should be determined for each species
before monitoring programmes are defined; otherwise, inappropriate assumptions may be made.
Broad questions to be asked include:
• Do the management objectives require only an overall national monitoring programme or
should the work be regionally focussed?
• Do the management objectives make the monitoring of distribution (at least in some areas)
more useful (cost-effective) than monitoring numbers?
• How precisely do changes need to be measured?
The last question may perhaps be recast as “What change would be great enough to trigger
concern?” but even in this form it is almost impossible to answer other than arbitrarily, especially
in the absence of historical records showing the extent of past variations. A key level used in the
Biodiversity Action Plan and elsewhere for the purpose of identifying species of conservation
concern is a 25% decline over 25 years. Perhaps this should be regarded as a general guideline
for the present.
Perhaps, however, 25 years is too long. Should we aim to be able to detect a 10% decline over
10 years?
Suppose that, given the resources available, a potential monitoring scheme is unlikely to be able
to deliver the precision required. What should one do? One answer is that there is no point in
wasting money on monitoring that is not precise enough. This is, however, too simple. Suppose
that one mounted the monitoring anyway and discovered a decline of 20% over the next 10
years; one would be very glad not to have turned down the scheme on the grounds that it would
not have reliably picked up a smaller decline. On the other hand, very imprecise monitoring is
unlikely to be useful, since declines that are so large as to be detectable by very imprecise
schemes are unlikely to occur. Thus the judgement as to whether a scheme is worth mounting
depends not only on its precision and its cost but also on the likelihood and likely magnitude of
untoward changes. It also depends on how bad these changes would be in conservation and other
terms - a 50% decline in Field Voles might be considered to be worse than a 50% decline inYellow-necked Mice (or perhaps not so bad!). We raise these issues not because we have
answers but because they should be explicitly addressed by those who set up the monitoring
programme.
4. TRIAL AND POWER ANALYSES
There are two issues which are critical in the design of all monitoring schemes: first, that the
measure or index of presence or abundance is related to true presence or abundance in a known
way and, second, that the survey sample size is sufficiently large for population changes of the
magnitude required to be detected with the required statistical power. (If we are to consider cost-
effectiveness, the latter can be extended to include the avoidance of over-powered designs.)

8/18/2019 BTO Research Report No.223 - Developing a Mammal Monitoring Programme for the UK
http://slidepdf.com/reader/full/bto-research-report-no223-developing-a-mammal-monitoring-programme-for-the 262/316
BTO Research Report No.223July 1999
260
The trial work required to determine relationships between survey methods and population
parameters will vary with method and species. At one extreme, direct counts of large proportions
of a population (e.g. for Feral Sheep) may require no trialing at all; at the other extreme, detailed
investigations of the factors influencing the detection of field signs such as Pine Marten scats
may be necessary. Visual count methods can be heavily influenced by factors such as the activity
of individuals and vegetation density, whereas the detectability of faecal signs can vary in
complex ways with population density (see, e.g., Water Vole species account). In each case, the
necessary extent of any trial survey work (calibrating proposed methods against other
techniques) should be determined by expert opinion and by consultation of any previous work
which has already been done using the method concerned. Educated guesses about the efficiency
of some methods may be possible given the results of other work using related techniques: for
example, the results of the current National Fox Survey will inform the design of our proposed
Sign Transect Survey.
Four parameters need to be known to calculate the sample size of survey sites required for the
detection of a population change with a given statistical power: the size of change/trend to be
detected, the sampling interval to be employed, the variance which exists between sites in(changes in) abundance (or presence) and the extent to which short-term fluctuations occur
around long-term trends. The former two are set (and can be altered at will) by the monitoring
body; the latter two need to be measured or estimated. The best approach to investigating the
implications of these unknowns is to conduct simulation analyses, informed by as much relevant
information as possible.
Information on spatial variation in abundance or detectability will be available from the results of
any one-off or longer-running survey. In this way, we ran simulations of future trends in BBS
data (Part III.A.1) using estimates of current survey-square-specific abundance and presence
effects. Data from past or existing Badger, fox or hare surveys (for example) could be used in the
same way (although they would need, in practice, to be computerised). Information on (annual)fluctuations in abundance under a given long-term trend is harder to come by, and can strictly
only be measured with long-term survey data (or at least repeated surveys) in which an
underlying trend can be determined. In practice, it will be necessary to run simulations on a range
of plausible levels of short-term temporal fluctuation and spatial variation where little useful data
are available. Clearly, any simulations will be of higher quality and more reliable if more real
data are employed: results on the power of future, repeated Badger surveys would be stronger
than any on the power of the Mammals on Roads scheme (for which we do not even know mean
detection rates as yet).
As well as variations in trend magnitude and sampling interval, simulations might also take into
account issues of stratification and the degree of randomisation of survey sites. The former wouldform a key part of the design of many of our proposed surveys to maximize their efficiency (Part
III) and simulation would be a useful approach for the exploration of stratification strategies.
Randomisation may also be worth exploring: power is affected if survey sites are not selected
randomly (as they were assumed to be in our BBS: Part III.A.1). A scheme such as our proposed
Winter Transect Survey, which would probably include an (as yet undetermined) proportion of
surveyor-selected transect routes (Part III.B.1), would benefit from simulations investigating the
effects of this lack of randomness.
A further issue with respect to statistical power arises if multiple schemes as considered for the
monitoring of the same species. Conceptually, it is clear that we would have more confidence in
a population change suggested by one scheme if a consistent change were shown by an
independent, parallel scheme. Statistically, however, consideration of the relative value of each

8/18/2019 BTO Research Report No.223 - Developing a Mammal Monitoring Programme for the UK
http://slidepdf.com/reader/full/bto-research-report-no223-developing-a-mammal-monitoring-programme-for-the 263/316
BTO Research Report No.223July 1999
261
scheme and how to quantify it may be necessary. Such consideration could be informed by the
literature on “meta-analysis”, which refers to the combination of multiple, independent studies in
searches for patterns at a larger scale (Osenberg et al . 1999a & b; Gurevitch & Hedges 1999).
We suggest that each potential scheme for the monitoring of each species should be assessed
with respect to the need for trial field survey work, and particularly important areas are identified
in the scheme and species accounts (Parts III and IV). For analyses of statistical power, many of
the schemes we suggest are based on essentially similar data, so could be addressed by the same
simulations, or at least by minor modifications of a basic simulation framework. We suggest that
a suite of power analyses which would provide comprehensive coverage of potential mammal
monitoring schemes (given that the data required are made available) should be achievable in c. 2
man-months of the time of a statistician.

8/18/2019 BTO Research Report No.223 - Developing a Mammal Monitoring Programme for the UK
http://slidepdf.com/reader/full/bto-research-report-no223-developing-a-mammal-monitoring-programme-for-the 264/316
BTO Research Report No.223July 1999
262

8/18/2019 BTO Research Report No.223 - Developing a Mammal Monitoring Programme for the UK
http://slidepdf.com/reader/full/bto-research-report-no223-developing-a-mammal-monitoring-programme-for-the 265/316
BTO Research Report No.223July 1999 263
ACKNOWLEDGEMENTS
We are especially grateful to Sam Rider for all her help in producing, formatting and checking
this report, and to Jenny Aitken, Dawn Morris, Nicki Read and Jane Wells for their valuable help
in proof-reading various drafts.
Our work has benefitted greatly from the advice we have received from many others. We thank
them for their unfailing assistance and apologise to those whom we have omitted from the list
below.
Dr Nicholas Aebischer (GCT)
Dr Graham Austin (British Trust for Ornithology)
Emma Baker (Environment Agency)
Dr Simon Baker (Farming & Rural Conservation Agency)
Dr Colin Barr (ITE)
Sarah Bentley ( NPI Red Alert North-West)
Cle Boyd (Somerset Otter Group)Dr Paul Bright (Royal Holloway University of London)
Professor S J Buckland (University of St Andrews)
Dr David Bullock (National Trust)
Bill Butcher (Somerset Environmental Records Centre)
Andrew Cannon (British Trust for Ornithology)
Dr Nigel Clark (BTO)
Mark Colvin (Green Hunter Pest Control)
Angus Davison (University of Nottingham)
Mark Elliott (Environment Agency)
Dr R A Elton
Dr L G Firbank (ITE Merlewood).Dr Martyn Gorman (University of Aberdeen)
Wayne Green (Hertfordshire)
Dr J G Greenwood (Stranmillis University College)
Melanie Hall (Tees Valley Wildlife Trust)
Dr Liz Halliwell (The Wildlife Trusts)
Dr John Harradine (BASC)
Professor Stephen Harris (Chairman of Mammal Society/University of Bristol)
Dr Steve Holloway (British Trust for Ornithology)
Dr Steve Hunter (CSL)
Zoe James (Dorset Wildlife Trust)
Dr Don JefferiesMike Jordan (Sparsholt College)
Dr Valerie Keeble (People's Trust for Endangered Species)
Lisa Kerslake (Northumberland Wildlife Trust)
Dr Steve Langton (CSL)
Professor D W Macdonald (Wild CRU, University of Oxford)
Dr Adrian N Mayer (The Acheta Partnership)
John Marchant (British Trust for Ornithology)
Aidan Marsh (Mammal Society/University of Bristol)
Dr Adrian Meehan (Rentokill)
Dr Pat Morris (Royal Holloway University of London)

8/18/2019 BTO Research Report No.223 - Developing a Mammal Monitoring Programme for the UK
http://slidepdf.com/reader/full/bto-research-report-no223-developing-a-mammal-monitoring-programme-for-the 266/316
BTO Research Report No. 223July 1999 264
Mervyn Newman (Surrey Wildlife Trust)
Dr William Penrice (Fife Nature)
Harry Pepper (Forest Research, Forestry Authority)
Gillie Sargent (Mammal Society)
Chris Sharpe (Manx Bird Atlas)
Anne Skinner (Environment Agency)
Richard Smithers (The Woodland Trust)
Anna-Marie Smout (BRISC)
Dr Stephen Tapper (Game Conservancy)
Roger Trout (Rabbit Wise Consultancy)
Dr Graham Twigg
Peter Watson (BASC)
James Williams (Somerset Otter Group)
Dr D W Yalden (University of Manchester)

8/18/2019 BTO Research Report No.223 - Developing a Mammal Monitoring Programme for the UK
http://slidepdf.com/reader/full/bto-research-report-no223-developing-a-mammal-monitoring-programme-for-the 267/316
BTO Research Report No. 223July 1999 265
References
Abyes, C. & Sargent, G. (1997) Investigation into survey techniques for recording Water Shrews
Neomys fodiens. Mammal Society Report to WWF-UK. Mammal Society, London.
Airoldi, J.-P. (1976) Capture and recapture experiments in the Water Vole, Arvicola terrestris
scherman Shaw ( Mammalia, Rodentia). Terre et Vie, 32, 3-45 (In French, English summary).
Andrews, E. & Crawford, A.K. (1986) Otter Survey of Wales 1984-85. The Vincent Wildlife
Trust, London.
Andrews, E., Howell, P. & Johnson, K. (1993) Otter Survey of Wales 1991. The Vincent Wildlife
Trust, London.
Andrzejewski, R. & Glgowska, J. (1962) The influence of the lay-out of traps and length of time
for which they remain set on the distribution of captures of small rodents. Ekologia Polska -
Seria A. 10 (10), 285-293.
Andrzejewski, R., Bujalska, G., Ryszkowski, L. & Ustyniuk, J. (1966) On a relation between the
number of traps in a point of catch and trappability of rodents. Acta Theriologica 11, 343-349
Angerbjorn, A. (1983) Reliability of pellet counts as density estimates of Mountain Hares.
Finnish Game Research, 41, 13-20.
Anglestam, P., Lindstrom, E. & Widen, P. (1984) Role of predation in short-term population
fluctuations of some birds and mammals in Fennoscandia. Oecologia, 62, 199-208.
Anon. (1995) Biodiversity: The UK Action Plan. HMSO, London.
Anon. (1995) Biodiversity: The UK Steering Group Report . Volume 2. HMSO, London.
Arnold, J.F. & Reynolds, H.G. (1943) Droppings of Arizona and Antelope Jack Rabbits and the
'pellet census'. Journal of Wildlife Management , 7, 322-327.
Arnold, H.R. (1993) Atlas of mammals in Britain. ITE Research Publication No.6. HMSO,
London.
Baillie, S.R. (1990) Integrated population monitoring of breeding birds in Britain and Ireland.
Ibis, 132, 151-166.
Baillie, S.R. & Gregory, R.D. (1997) Farmland Bird Declines: Patterns, Processes and Prospects.
1997 BCPC Symposium Proceedings No.69: Biodiversity and Conservation in Agriculture.
Bailey, R.E. & Putman, R.J. (1981) Estimation of Fallow Deer ( Dama dama) populations from
faecal accumulation. Journal of Applied Ecology, 18, 697-702.
Baker, S.J. & Clarke, C.N. (1988) Cage trapping Coypus ( Myocaster coypus) on baited rafts.
Journal of Applied Ecology, 25, 41-48.
Baker, S.J. (1990) Escaped exotic mammals in Britain. Mammal Review, 20 (2/3), 75-96.

8/18/2019 BTO Research Report No.223 - Developing a Mammal Monitoring Programme for the UK
http://slidepdf.com/reader/full/bto-research-report-no223-developing-a-mammal-monitoring-programme-for-the 268/316
BTO Research Report No. 223July 1999 266
Balharry, D. (1993) Factors affecting the distribution and population density of Pine Martens
(Martes martes) in Scotland . PhD Thesis, University of Aberdeen.
Balharry, E.A., McGowan, G.M., Kruuk, H. & Halliwell, E. (1996). Distribution of Pine
Martens in Scotland as revealed by field survey and questionnaire. SNH Research, Survey and
Monitoring Report No. 48., SNH , Edinburgh.
Balharry, D. & Daniels, M.J. (1998) Wild living cats in Scotland . Scottish Natural Heritage
Research, Survey and Monitoring Report No.23.
Barnes, R.F.W. & Tapper, S.C. (1985) A method for counting hares by spotlight. Journal of
Zoology, London, 206, 273-276.
Barr, C.J. (1998) The Sampling Strategy for Countryside Survey 2000. ITE contract report to
DETR. ITE Merlewood.
Bas, N., Jenkins, D. & Rothery, P. (1984) Ecology of Otters in Northern Scotland V. Thedistribution of Otter ( Lutra lutra) faeces in relation to bankside vegetation on the River Dee in
Summer 1981. Journal of Applied Ecol ogy, 21, 507-513.
Bellhouse, D.R. (1988) Systematic Sampling. In Handbook of Statistics, Vol.6 (eds. P.R.
Krishnaiah and C.R. Rao). pp 125-145. Elsevier Science Publishers.
Bennett, L.J., English, P.F. & McCain, R. (1940) A study of deer populations by use of
pellet-group counts. Journal of Wildlife Management , 4, 398-403.
Birks, J. (1990) Feral Mink and nature conservation. British Wildlife, 1, 313-323.
Birks, J. (1993) The return of the Polecat. British Wildlife, 5, 16-25.
Birks, J.D.S. (1997) A volunteer-based system for sampling variations in the abundance of
Polecats ( Mustela putorius). Journal of Zoology, London, 243, 857-863.
Birks, J.D.S., Messenger, J.E. & Davison, A. (1997). A 1994 Pine Marten Martes martes ( L.)
record for Lancashire, including a preliminary genetic analysis. Naturalist , 122, 13-18.
Blandford, P.R.S. & Walton, K.C. (1991) Polecat Mustela putoris. In The handbook of British
mammals (eds, Corbett, G.B. & Harris S.). pp 396-405. Blackwell Scientific Publications,
Oxford.
Bourquin, J.D. (1983) Mortalité des rapaces le long de l’autoroute Genève-Lausanne. Nos
Oiseaux 37, 149-169.
Bright, P.W. (1995) Distribution of the Dormouse ( Muscardinus avellanarius) in Wales, on the
edge of its range. Mammal Review, 25 (3), 101-110.
Bright, P.W. & Morris, P.A. (1989) A practical guide to dormouse conservation. Occasional
Publication of The Mammal Society No. 11. Mammal Society, London.
Bright, P.W. & Morris, P.A. (1993) Conservation of the Dormouse. British Wildlife, 4, 154-162.

8/18/2019 BTO Research Report No.223 - Developing a Mammal Monitoring Programme for the UK
http://slidepdf.com/reader/full/bto-research-report-no223-developing-a-mammal-monitoring-programme-for-the 269/316
BTO Research Report No.223July 1999 267
Bright, P.W. & Morris, P.A. (1994) Animal translocation for conservation: performance of
dormice in relation to release methods, origin and season. Journal of Applied Ecol ogy, 31,
699-708.
Bright, P.W. & Harris, S. (1994) Reintroduction of the Pine Marten: Feasibility Study. English
Nature Research Report No. 84., English Nature, Peterborough.
Bright, P.W., Mitchell, P. & Morris, P.A. (1994) Dormouse distribution: survey techniques,
insular ecology and selection of sites for conservation. Journal of Applied Ecology, 31, 329-339.
Bright, P.W., Morris, P.A. & Mitchell-Jones, A.J. (1996a) A new survey of the Dormouse
Muscardinus avellanarius in Britain, 1993-4. Mammal Review, 26 (4):,189-195.
Bright, P.W., Morris, P.A. & Mitchell-Jones, A.J. (1996b) The Dormouse Conservation
Handbook. Species Recovery Programme Report. English Nature, Peterborough.
Buckton, S.T. & Ormerod, S.J. (1997) Use of a new standardised habitat survey for assessing thehabitat preferences and distribution of upland river birds. Bird Study, 44, 327-337.
Buckland, S.T. (1992) Review of deer count methodology. Scottish Agricultural Statistics
Service, unpublished report.
Buckland, S.T. and Elston, D.A. (1993) Empirical models for the spatial distribution of wildlife.
Journal of Applied Ecology, 30, 478-495.
Buckley, J. (1977) Barn Owl predation on the Harvest Mouse. Mammal Review, 7 (3/4), 117-
121.
Bullock, D. (1995) The Feral Goat - conservation and management. British Wildlife, 6, 152-159.
Bunce, R.G.H., Barr, C.J., Clarke, R.T., Howard, D.C. & Lane, A.M.J. (1996) ITE Merlewood
Land Classification of Great Britain. Journal of Biogeography, 23, 625-634.
Burnett, J., Copp, C. & Harding, P. (1994) Biological recording in the United Kingdom: Present
practice and future development. A report on behalf of the Coordinating Commission for
Biological Recording.
Buskirk, S.W. & Lindstedt, S.L. (1989) Sex biases in trapped samples of Mustelidae. Journal of
Mammalogy, 70 (1), 88-97.
Chamberlain, D.E., Fuller, R.J., Shrubb, M., Bunce, R.G.H., Duckworth, J.C., Garthwaite, D.G.,
Impey, A.J. & Hart, A.D.M. (1999) The Effects of Agricultural Management on Farmland Birds.
BTO Research Report No. 209. BTO, Thetford.
Chanin, P.R.F. & Jefferies, D.J. (1978) The decline of the Otter Lutra lutra L. in Britain: an
analysis of hunting records and discussion of causes. Biological Journal of the Linnean Society,
10, 305-328.
Chapman, P.J. & Chapman, L.L. (1982) Otter Survey of Ireland 1980-81. The Vincent Wildlife
Trust, London.

8/18/2019 BTO Research Report No.223 - Developing a Mammal Monitoring Programme for the UK
http://slidepdf.com/reader/full/bto-research-report-no223-developing-a-mammal-monitoring-programme-for-the 270/316
BTO Research Report No.223July 1999 268
Cheeseman, C.L. & Mallinson, P.J. (1980) Radio tracking in the study of bovine tuberculosis in
Badgers. In A handbook on Biotelemetry and Radio Tracking . (eds, C.J.Amlaner & D.W.
Macdonald), pp 649-656. Pergamon Press, Oxford.
Cheeseman, C.L., Jones, G.W., Gallagher, J. & Mallinson, P.J. (1981) The population structure,
density and prevalence of tuberculosis ( Mycobacterium bovis) in Badgers ( Meles meles) from
four areas in south-west England. Journal of Applied Ecology, 18, 795-804.
Cheeseman, C.L., Wilesmith, W.J. & Stuart, F.A. (1989) Tuberculosis, the disease and its
epidemiology in the Badger, a review. Epidemiology & Infection, 103, 113-125.
Chitty, D. & Kempson, D.A. (1949) Prebaiting small mammals and a new design of live trap.
Ecology, 30 (4), 536-542.
Churchfield, S. (1990) The Natural History of Shrews. Christopher Helm, London.
Churchfield, S. (1997) Species Action Plan for England and Wales for the water Shrew - Neomys fodiens. The Environment Agency.
Clements, E.D., Neal, E.G. & Yalden, D.W. (1988) The National Badger Sett Survey. Mammal
Review, 18 (1), 1-9.
Cochran, W.G. (1977) Sampling Techniques, 3rd Edition. Wiley, New York.
Corbet, G.B. & Harris, S. (eds.) (1991) The Handbook of British Mammals. Third Edition.
Blackwell Science, Oxford.
Cox, D.R. (1970) Analysis of Binary Data. Chapman and Hall, London.
Crawford, A., Evans, D., Jones, A.. & McNulty, J. (1979) Otter Survey of Wales 1977-78.
Society for the Promotion of Nature Conservation, Nettleham, Lincoln.
Cresswell P., & Harris, S. (1988) The effects of weather conditions on the movements and
activity of Badgers ( Meles meles) in a suburban environment. Journal of Zoology, London, 216,
187-194.
Cresswell, P., Harris, S., Bunce, R.G.H. & Jefferies, D.J. (1989) The Badger ( Meles meles) in
Britain: present status and future population changes. Biological Journal of the Linnean Society,
38, 91-101.
Cresswell, P., Harris, S., & Jefferies, D.J. (1990) The history, distribution, status and habitat
requirements of the Badger in Britain. Nature Conservancy Council, Peterborough.
Crick, H.Q.P. (1992) A bird-habitat coding system for use in Britain and Ireland incorporating
aspects of land-management and human activity. Bird Study, 39, 1-12.
Crick, H.Q.P., Dudley, C., Glue, D.E. & Thomson, D.L. (1997) UK birds are laying eggs earlier.
Nature, 388, 526.

8/18/2019 BTO Research Report No.223 - Developing a Mammal Monitoring Programme for the UK
http://slidepdf.com/reader/full/bto-research-report-no223-developing-a-mammal-monitoring-programme-for-the 271/316
BTO Research Report No.223July 1999 269
Crick, H.Q.P., Baillie, S.R., Balmer, D.E., Bashford, R.I., Beaven, L.P., Dudley, C., Glue, D.E.,
Gregory, R.D., Marchant, J.H., Peach, W.J. and Wilson, A.M. (1998) Breeding Birds of the
Wider Countryside: their conservation status (1972-1996). BTO Research Report No. 198.
BTO, Thetford.
Crick, H.Q.P. & Sparks, T.H. (1999) Climate change explains bird egg-laying trends. Nature,
399, 423-424.
Cross, M., Smale, A., Bettany, S., Numata, M., Nelson, D., Keedwell, R. & Ragg, J. (1998) Trap
catch as a relative index of Ferret ( Mustela furo) abundance in a New Zealand pastoral habitat.
New Zealand Journal of Zoology, 25 (1):
Cuthbert, J.H. (1973) The origin and distribution of feral mink in Scotland. Mammal Review, 3
(3): 97-103.
Dagnall, J.L. Duckett, J.G. & Gurnell, J. (1995) A simple negative staining technique for the
identification of mammal hairs. Journal of Zoology, London 237, 670-674.
Daniels, M.J., Balharry, D., Hirst, D., Kitchener, A.C. & Aspinall, R.J. (1998) Morphological
and pelage characteristics of wild living cats in Scotland: implications for defining the ‘wildcat’.
Journal of Zoology, London 244, 231-247.
Davies, J.M., Roper, T.J. & Shepherdson, D.J. (1987) Seasonal distribution of road kills in the
European Badger (Meles meles). Journal of Zoology, London, 211, 525-529.
Day, M.G. (1968) Food habits of British Stoats ( Mustela erminea) and Weasels ( Mustela
nivalis). Journal of Zoology, London, 155, 485-497.
Deshmukh, I.K. & Cotton, M.J. (1970) The small mammals of a sand dune system. Journal of
Zoology, London, 162, 525-527.
Dilks, P.J., O'Donnell, C.F.J., Elliott, G.P. & Phillipson,S.M. (1996) The effect of bait type,
tunnel design, and trap position on Stoat control operations for conservation management. New
Zealand Journal of Zoology, 23, 295-306.
Don, B.A.C. (1985) The use of drey counts to estimate grey squirrel populations. Journal of
Zoology, London, 206, 282-286.
Donald, P.F. & Fuller, R.J. (1998) Ornithological atlas data: a review of uses and limitations. Bird Study 45, 129-145.
Dunstone, N. (1993) The Mink . T. & A.D. Poyser, London.
Durbin, L.S. (1998) Habitat selection by five Otters Lutra lutra in rivers of northern Scotland.
Journal of Zoology, London, 245 (1), 85-92.
Easterbee, N., Hepburn, L.V. & Jefferies, D.J. (1991) Survey of the status and distribution of the
wildcat in Scotland, 1983-1987. Nature Conservancy Council for Scotland, Edinburgh.
Erlinge, S. (1968) Territoriality of the Otter Lutra lutra L. Oikos, 19, 81-98.

8/18/2019 BTO Research Report No.223 - Developing a Mammal Monitoring Programme for the UK
http://slidepdf.com/reader/full/bto-research-report-no223-developing-a-mammal-monitoring-programme-for-the 272/316
BTO Research Report No.223July 1999 270
Feore, S., Smal, C.M. & Montgomery, W.I. (1993) Survey of Badger setts in Northern Ireland:
progress report. pp 23-25 In The Badger . (ed. T.J. Hayden). Royal Irish Academy, Dublin.
Ferns, P.N. (1976) Diet of a Microtus agrestis population in the south-west Britain. Oikos, 28,
506-511.
Ferns, P.N. (1979) Successional changes in the small mammal community of a young Larch
plantation in south-west Britain. Mammalia, 43, 439-452.
Fewster, R.M., Buckland, S.T., Siriwardena, G.M., Baillie, S.R. & Wilson, J.D. (in press)
Analysis of population trends for farmland birds using generalized additive models. Ecology.
Field, R.H. & Gregory, R.D. (1999) Measuring population changes from the Breeding Bird
Survey. BTO Research Report No. 217. British Trust for Ornithology, Thetford.
Finnis, R.G. (1960) Road casualties among birds. Bird Study 7, 21-32.
Flowerdew, J.R. (1973) The effect of natural and artificial changes in food supply on breeding in
woodland mice and voles. Journal of Reproductive Fertility, supplement 19, 259-269.
Flowerdew, J.R. (1976) Ecological Methods. Mammal Review, 6, 123-149.
Flowerdew, J.R. (1985) The population dynamics of wood mice and yellow-necked mice.
Symposium of the Zoological Society of London, 55, 315-338.
Fuller, R.J., Marchant J.H. & Morgan, R.A. (1985) How representative of agricultural practice in
Britain are Common Birds Census plots? Bird Study, 32, 56-70.
Furness, R.W., Greenwood, J.J.D. & Jarvis, P.J. (1993) Can birds be used to monitor the
environment? In Birds as Monitors of Environmental Change (eds, R.W. Furness & J.J.D.
Greenwood), pp. 1-41. Chapman & Hall, London.
Furness, R.W. & Greenwood, J.J.D. (eds.) (1993) Birds as Monitors of Environmental Change.
Chapman & Hall, London.
Garson, P.J. & Lurz, P.W.W. (1998) Red squirrel monitoring: the potential of hair tubes for
estimating squirrel abundance in conifer plantations dominated by sitka spruce. Unpublished MS.
Gibbons, D.W. (1987) The ‘New Atlas’ Pilot Fieldwork. BTO Research Report No.30. BTO,Thetford.
Gibbons, D.W., Reid, J.B. & Chapman, R.A. (1993) The New Atlas of Breeding Birds in Britain
and Ireland: 1988-1991. T. & A.D. Poyser, London.
Gibbons, D.W., Avery, M.I., Baillie, S.R., Gregory, R.D., Kirby, J.S., Porter, R., Tucker, G.M. &
Williams, G. (1996) Bird species of conservation concern in the United Kingdom, Channel
Islands and Isle of Man: revising the Red Data List. RSPB Conservation Review, 10, 7-18.
Glue, D.E. (1970) Avian predator pellet analysis and the mammalogist. Mammal Review, 1,
53-62.
Glue, D.E. (1974) Food of the Barn Owl in Britain and Ireland. Bird Study, 21, 200-210.

8/18/2019 BTO Research Report No.223 - Developing a Mammal Monitoring Programme for the UK
http://slidepdf.com/reader/full/bto-research-report-no223-developing-a-mammal-monitoring-programme-for-the 273/316
BTO Research Report No.223July 1999 271
Goldspink, C.R., King, S. & Putnam, R.J. (eds.) (1998) Population Ecology, Management and
Welfare of Deer . Manchester Metropolitan University, Manchester.
Gorman, M.L. & Stone, R.D. (1990) The Natural History of Moles.
Gorman, M.L. & Reynolds, P. (1993) The impact of land-use change on voles and raptors.
Mammal Review, 23 (3/4), 121-126.
Green, J. & Green, R. (1980) Otter Survey of Scotland 1977-79. The Vincent Wildlife Trust,
London.
Green, J., Green, R. & Jefferies, D.J. (1984). A radio-tracking survey of Otters Lutra lutra on a
Perthshire river system. Lutra, 27, 85-145.
Green, J. & Green, R. (1987) Otter Survey of Scotland 1984-85. The Vincent Wildlife Trust,
London.
Greenwood, J.J.D., Baillie, S.R., Crick, H.Q.P., Marchant, J.H. & Peach, W.J. (1993) Integrated
population monitoring: detecting the effects of diverse changes. In Birds as Monitors of
Environmental Change (eds, R.W. Furness & J.J.D. Greenwood), pp. 267-342. Chapman &
Hall, London.
Greenwood, J.J.D. (1996) Basic Techniques. In Ecological Census Techniques: A Handbook
(ed. W.J. Sutherland). pp 11-110. Cambridge University Press, Cambridge.
Greenwood, J.J.D., Gregory, R.D., Harris, S., Morris, P.A. & Yalden, D.W. (1996) Relations
between abundance, body size and species number in British birds and mammals. Phil. Trans. R.Soc. Lond. B, 351, 265-278.
Greenwood, J.J.D., Fuller, R.J. & Gibbons, D.W. (1997) Assessing changes in distribution from
atlas data: reply to Bircham and Jordan. Ibis 139 (1), 186-189.
Greenwood, A. (1998) National Survey Pilot Study: The habitat preference of the Water Shrew.
M.Sc. Dissertation in Conservation, University College London.
Gregory, R.D. & Marchant, J.H. (1996) Population trends of jays, magpies and carrion crows in
the United Kingdom. Bird Study, 43, 28-37.
Gregory, R.D. & Baillie, S.R. (in press) Survey design and sampling strategies for breeding bird
monitoring. Proceedings of the 13th International Conference of European Bird Census
Councils, Estonia 1995.
Gregory, R.D., Baillie, S.R. & Bashford, R.I. (in press) Monitoring breeding birds in the United
Kingdom. Proceedings of the 13th International Conference of European Bird Census Councils,
Estonia 1995.
Gresswell, P., Harris, S. & Jefferies, D.J. (1990) The history, distribution, status and habitat
requirements of the badger in Britain. JNCC, Peterborough. (now out of print).
Gurevitch, J & Hedges, L.V. (1999) Statistical issues in ecological meta-analyses. Ecology 80,
(4), 1142-1149.

8/18/2019 BTO Research Report No.223 - Developing a Mammal Monitoring Programme for the UK
http://slidepdf.com/reader/full/bto-research-report-no223-developing-a-mammal-monitoring-programme-for-the 274/316
BTO Research Report No.223July 1999 272
Gurnell, J. (1976) Studies on the effects of bait and sampling intensity on trapping and estimating
Wood Mice, Apodemus sylvaticus. Journal of Zoology, London, 178, 91-105.
Gurnell, R. & Flowerdew, J.R. (1982) Live trapping small mammals: a practical guide.
Occasional Publication of The Mammal Society No. 3. Mammal Society, London.
Gurnell, J. & Pepper, H.W. (1994) Red squirrel conservation: field study methods. Research
Information Note 255, Forestry Commission, Edinburgh.
Haeck, J. (1969) Colonisation of the mole (T. europaea, L) in the Ijsselmeerpolders. Neth. J.
Zool. 19 (2), 145-248.
Hansen, M.M. & Jacobsen, L. (1999) Identification of mustelid species: Otter ( Lutra lutra),
American Mink ( Mustela vison) and Polecat ( Mustela putorius) by analysis of DNA from faecal
samples. Journal of Zoology, London, 247, 177-181.
Hanski, I., Turchin, P., Korpimaki, E. & Henttonen, H. (1993) Population oscillations of borealrodents: regulation by mustelid predators leads to chaos. Nature, 364, 232-235.
Hansson, L. (1969) Home range, population structure and density estimates at removal catches
with edge effect. Acta Theriologica, 14, 153-160.
Hansson, L. (1979) Fieldsigns as indicators of vole abundance. Journal of Applied Ecology, 16,
339-347.
Harris, S. (1979) History, distribution, status and habitat requirements of the Harvest Mouse
( Micromys minutus) in Britain. Mammal Review, 9 (4), 159-171.
Harris, S. (1981) An estimation of the number of foxes (Vulpes vulpes) in the city of Bristol, and
some possible factors affecting their distribution. Journal of Applied Ecology, 18, 455-465.
Harris, S. (1982) Activity patterns and habitat utilisation of Badgers ( Meles meles) in suburban
Bristol: a radiotracking study. Symposium of the Zoological Society of London, 49, 301-323.
Harris, S. (1984) Ecology of urban Badgers ( Meles meles): distribution in Britain and habitat
selection, persecution, food and damage in the city of Bristol. Biological Conservation, 28,
349-375.
Harris, S. & Rayner, J.M.V. (1986a) Urban fox (Vulpes vulpes) population estimates and habitatrequirements in several British cities. Journal of Animal Ecology, 55, 575-591.
Harris, S. & Rayner, J.M.V. (1986b) Models for predicting urban fox (Vulpes vulpes) numbers in
British cities and their application for rabies control. Journal of Animal Ecology, 55, 593-603.
Harris, S. & Rayner, J.M.V. (1986c) A discriminant analysis of the current distribution of urban
foxes (Vulpes vulpes) in Britain. Journal of Animal Ecology, 55, 605-611.
Harris, S. & Smith, G.C. (1987) The use of sociological data to explain the distribution and
numbers of urban foxes (Vulpes vulpes) in England and Wales. Symposia of the Zoological
Society of London, 58, 313-328.

8/18/2019 BTO Research Report No.223 - Developing a Mammal Monitoring Programme for the UK
http://slidepdf.com/reader/full/bto-research-report-no223-developing-a-mammal-monitoring-programme-for-the 275/316
BTO Research Report No.223July 1999 273
Harris, S. & Cresswell, P. (1987) Dynamics of a suburban Badger ( Meles meles) population.
Symposium of the Zoological Society of London, 58, 295-311.
Harris, S., Cresswell, P. & Jefferies, D. (1989) Surveying Badgers. Mammal Society, London.
Harris, S. & Cresswell, P. (1992) An Integrated approach to monitoring badger (Meles meles)
population changes in Britain. In Wildlife 2001: populations (eds. D.R. McCullough & R.H.
Barrett) pp. 945-953. Elsevier Applied Science, London.
Harris, S, Morris, P., Wray, S. & Yalden, D. (1995) A review of British mammals: population
estimates and conservation status of British mammals other than cetaceans. JNCC,
Peterborough.
Harris, S. (in press) Monitoring techniques for hares. Mammal Review.
Hellawell, J.M. (1991) Development of a rationale for monitoring. In Monitoring for
Conservation and Ecology (ed. F.B. Goldsmith), pp. 1-14. Chapman & Hall, London.
Henttonen, H., Haukisalmi, V., Kaikusalo, A., Korpimaki, E., Norrdahl, K. & Skaren, U.A.P.
(1989) Long-term population dynamics of the common shrew Sorex araneus in Finland.
Annales Zoologica Fennici, 26, 349-355.
Hewson, R. (1972) Changes in the number of Stoats, Rats and Little Owls in Yorkshire as shown
by tunnel trapping. Journal of Zoology, London, 168, 427-429.
Hodson, N.L. & Snow, D.W. (1965) The Road Deaths Enquiry, 1960-61. Bird Study 12, 90-99.
Holt, R.D., Lawton, J.H., Gaston, K.J. and Blackburn, T.M. (1997) On the relationship betweenrange size and local abundance: back to basics. Oikos, 78, 183-190.
Hoodless, A & Morris, P.A. (1993) An estimate of population density of the Fat Dormouse (Glis
glis). Journal of Zoology, London, 230, 337-340.
Howells, O. & Edwards-Jones, G. (1997) A feasibility study of reintroducing Wild Boar Sus
scrofa to Scotland: Are existing woodlands large enough to support minimum viable populations.
Biological Conservation, 81, 77-89.
Hughes, D. (1993) Mammal survey of five species: Red Squirrel, Grey Squirrel, Pine Marten,
Irish Hare and English Hare. Ulster Wildlife Trust and Forest Service DANI, Crossgar.
Hurrell, E. & McIntosh, G. (1984) Mammal Society Dormouse survey, January 1975-April 1979.
Mammal Review, 14, 1-18.
Hutchings, M.R. & Harris, S. (1996) The current status of the Brown Hare ( Lepus europaeus) in
Britain. Nature Conservancy Council, Peterborough.
Insley, H. (1977) An estimate of the population density of the red fox (Vulpes vulpes) in the New
Forest. Journal of Zoology (London), 183, 549-553.
James, F.C., McCulloch, C.E. & Wiedenfeld, D.A. (1996). New approaches to the analysis of
population trends in land birds. Ecology, 77, 13-27.
Janion, M. & Wierzbowska, T. (1970) Trappability of rodents depending on population density.
Acta Theriologica, 15, 199-207.

8/18/2019 BTO Research Report No.223 - Developing a Mammal Monitoring Programme for the UK
http://slidepdf.com/reader/full/bto-research-report-no223-developing-a-mammal-monitoring-programme-for-the 276/316
BTO Research Report No.223July 1999 274
Jefferies, D.J. (1975) Different activity patterns of male and female Badgers ( Meles meles) as
shown by road mortality. Journal of Zoology, London, 177, 504-506.
Jefferies, D.J. (1986) The value of Otter Lutra lutra surveying using spraints: an analysis of its
successes and problems in Britain. Otters, Journal of the Otter Trust , 1 (9), 25-32.
Jefferies, D.J., Morris, P.A. & Mulleneux, J.E. (1989) An enquiry into the changing status of the
Water Vole ( Arvicola terrestris). Mammal Review, 19 (3), 111-131.
Jenkins, D.J. & Burrows, G.O. (1980) Ecology of Otters in northern Scotland. III The uses of
faeces as indicators of Otter ( Lutra lutra) density and distribution. Journal of Animal Ecology,
49, 755-774.
Key, G., Fielding, A.H., Goulding, M.J., Holm, R.S. & Stevens-Woods, B. (1998) Ship rats
Rattus rattus on the Shiant Isles, Outer Hebrides. Journal of Zoology, London, 245, 228-233.
Killingley,A. (1973) The beleaguered Badger. Countryside, 22, 156-160.
King, C.M. (1973) A system for trapping and handling live weasels in the field. Journal of
Zoology, London, 171, 458-464.
King, C.M. (1975a) The sex-ratio of trapped Weasels ( Mustela nivalis). Mammal Review, 5 (1),
1-8.
King, C.M. (1975b) The home range of the Weasel ( Mustela nivalis) in an English woodland.
Journal of Zoology, London, 44, 639-668.
King, C.M. & Edgar, R.L. (1977) Techniques for trapping and tracking Stoats ( Mustela
erminea): a review and a new system. New Zealand Journal of Zoology, 4, 193-212.
Kitchener, A.C. (1995) The Wildcat . The Mammal Society, London.
Kolb, H. H. (1994) Rabbit Oryctolagus cuniculus populations in Scotland since the introduction
of myxomatosis. Mammal Review 24, 41-48.
Kruuk, H. (1978) Spatial organization and territorial behaviour of the European Badger Meles
meles. Journal of Zoology, London. 184, 1-19.
Kruuk, H. (1995) Wild Otters: Predation and Populations. Oxford University Press, New York.

8/18/2019 BTO Research Report No.223 - Developing a Mammal Monitoring Programme for the UK
http://slidepdf.com/reader/full/bto-research-report-no223-developing-a-mammal-monitoring-programme-for-the 277/316
BTO Research Report No.223July 1999 275
Kruuk, H. & Conroy, J.W.H. (1987) Surveying Otter Lutra lutra populations: A discussion of
problems with spraints. Biological Conservation, 41 (3), 179-184.
Kruuk, H., Conroy, J.W.H., Glimmerveen, U. & Ouwerkerk, E.J. (1986) The use of spraints to
survey populations of Otters Lutra lutra. Biological Conservation, 35 (2), 187-194.
Kruuk, H., Moorhouse, A., Conroy, J.W.H., Durbin, L. & Frears, S. (1989) A estimate of
numbers and habitat preferences of Otters Lutra lutra in Shetland, UK. Biological Conservation,
49, 241-254.
Kruuk, H., Jones, C., McLaren, G.W., Gorman, M.L. & Conroy, J.W.H. (1997) Changes in age
composition in populations of the Eurasian Otter Lutra lutra in Scotland. Journal of Zoology,
London, 243, 853-857.
Lambin, X, & MacKinnon, J.L. (1997) The relative efficiency of two commercial live-traps for
small mammals. Journal of Zoology, 242, 400-404.
Langley, P.J.W. & Yalden, D.W. (1977) The decline of the rarer carnivores in Britain during the
nineteenth century. Mammal Review, 7, 95-116.
Lawrence, M.J. & Brown, R.W. (1973) Mammals of Britain. Their tracks, trails and signs.
Blandford Press, Poole, Dorset.
Lenton, E.J., Chanin, P.R.F. & Jefferies, D.J. (1980) Otter Survey of England 1977-1979. Nature
Conservancy Council, Peterborough.
Lever, C. (1994) Naturalised Animals: The ecology of successfully introduced species. T & AD
Poyser, London.
Linn, I. & Day, M.G. (1966) Identification of individual Weasels Mustela nivalis using the
ventral pelage pattern. Journal of Zoology, London, 148, 583-585.
Lockie, J.D. (1964) Distribution and fluctuations of the Pine Marten, Martes martes ( L.), in
Scotland. Journal of Animal Ecology, 33, 349-356.
Lockie, J.D. (1966) Territory in small carnivores. Symposium of the Zoological Society of
London, 18, 143-165.
Lockley, R.M. (1962) Production of faecal pellets in the wild Rabbit. Nature (London), 194,988-989.
Love, R.A., Webbon, C.C., Glue, D.E. & Harris, S. (in press) Changes in the food of British Barn
Owls (Tyto alba) between 1974 and 1977 .
Macdonald, D.W. & Barrett, P. (1994) Collins Field Guide Mammals of Britain and Europe.
Harper Collins.
Macdonald, D.W., Mace, G. & Rushton, S. (1998) Proposals for future monitoring of British
mammals. Department of the Environment, Transport and Regions, London with Joint Nature
Conservation Committee, Peterborough.

8/18/2019 BTO Research Report No.223 - Developing a Mammal Monitoring Programme for the UK
http://slidepdf.com/reader/full/bto-research-report-no223-developing-a-mammal-monitoring-programme-for-the 278/316
BTO Research Report No.223July 1999 276
MAFF (1982) Rabbit distribution and abundance. Mammal and Bird Pest Research and
Development Report, 1980: pp 17-18. HMSO, London.
Mallorie, H.C. & Flowerdew, J.R. (1994) Woodland small mammal population ecology in
Britain: a preliminary review of The Mammal Society survey of Wood Mice Apodemus
sylvaticus and Bank Voles Clethrionomys glareolus, 1982-87. Mammal Review, 24, 1-15.
Mammals 2000 - A scheme for monitoring British mammals. Proposed by a consortium of The
Mammal Society and The Bat Conservation Trust.
Marchant, J.H., Hudson, R., Carter, S.P. & Whittington, P. (1990) Population trends in British
breeding birds. British Trust for Ornithology, Tring, Hertfordshire.
Marchant, J.H. & Gregory, R.D. (1999) Waterways Breeding Bird Survey pilot study 1998:
adaptation of BBS census methods to rivers and canals. BTO Research Report No. 218. BTO,
Thetford.
Marsh, A. (1999) The National Yellow-necked Mouse Survey. Mammal Society Report.
Mason, C.F. & Macdonald, S.M. (1986) Otters: ecology and conservation. Cambridge
University Press, Cambridge.
Mason, C.F. & Macdonald, S.M. (1987) The use of spraints for surveying Otter Lutra lutra
populations: An evaluation. Biological Conservation 41 (3), 167-177.
Mason, C.F. & MacDonald, S.M. (1992) Pollution and Otter conservation in a European
context. In Proceedings of the National Otter Conference, Cambridge, September 1992 (ed. P.A.
Morris) pp. 17-20. Mammal Society, Bristol.
Mayle, B.A. & Staines, B.W. (1998) An overview of methods used for estimating the size of deer
populations in Great Britain. In: Population Ecology, Management and Welfare of Deer , (ed.
E.A.R. Putnam). UFAW.
McArdle, B.H. & Pawley, M.D.M. (1994) Cost benefit analysis in the design of biological
monitoring programs: Is it worth the effort? In Statistics in Ecology and Environmental
Monitoring: Otago Conference Series No.2 (eds. David J. Fletcher & Bryan F.J. Manly) pp239-
253. University of Otago Press, Dunedin.
McCullagh, P. & Nelder, J.A. (1989) Generalized Linear Models, 2nd Edition. Chapman & Hall,London.
McDonald, R.A. & Harris, S. (in press) The use of trapping records to monitor populations of
stoats Mustela erminea and weasels M. nivalis: the importance of trapping effort. Journal of
Applied Ecology.
Meyer, A.N., Shankster, A., Langton, S.D. & Jukes, G. (1995) National commensal rodent
survey 1993. Environmental Health 103 (6), 127-135.
Montgomery, W.I. (1978) Studies on the distribution of Apodemus sylvaticus (L.) and Apodemus
flavicollis (Melchior) in Britain. Mammal Review, 8 (4), 177-184.

8/18/2019 BTO Research Report No.223 - Developing a Mammal Monitoring Programme for the UK
http://slidepdf.com/reader/full/bto-research-report-no223-developing-a-mammal-monitoring-programme-for-the 279/316
BTO Research Report No.223July 1999 277
Montgomery, W.I. (1989) Population regulation in the Wood Mouse Apodemus sylvaticus. II.
Density dependence in spatial distribution and reproduction. Journal of Animal Ecology, 58,
477-494.
Moors, P.J. (1975) The food of Weasels ( Mustela nivalis) on farmland in north-east Scotland.
Journal of Zoology, London, 177, 455-461.
Morris, P.A. & Whitbread, S. (1986) A method for trapping the Dormouse Muscardinus
avellanarius. Journal of Zoology, London, 210, 642-644.
Morris, P.A., Bright, P.W. & Woods, D. (1990) Use of nestboxes by the Dormouse
( Muscardinus avellanarius). Biological Conservation, 51, 1-13.
Morris, P.A. (1993) British mammals - their status, research needs and likely future. Mammal
Review, 23 (3/4), 167-176.
Morris, P.A. (1997) A Review of the Fat Dormouse (Glis glis) in Britain. Natura Croatica, 6 (2), 163-176.
Morris, P.A., Morris, M.J., MacPherson, D., Jefferies, D.J., Strachan, R. & Woodroffe, G.L.
(1998). Estimating numbers of the Water Vole Arvicola terrestris: a correction to the published
method. Journal of Zoology, London, 246, 61-62.
Morris, P.A. & Temple, R.K. (1998) ‘Nest Tubes’: a potential new method for controlling
numbers of the edible Dormouse (Glis glis) in plantations. Quarterly Journal of Forestry, 92 (3),
The Royal Forestry Society of England, Wales and Northern Ireland.
Morton, A. (1993-1996) DMAP for Windows.
Mountford, M.D. (1985) An index of population change with application to the Common Birds
Census. Statistics in Ornithology (eds B.J.T. Morgan & P.M. North), pp 121-132. Springer-
Verlag, Berlin.
Murthy, M.N. & Rao, T.J. (1988) Systematic Sampling with Illustrative Examples. In Handbook
of Statistics, Vol.6 (eds. P.R. Krishnaiah and C.R. Rao). pp 147-185. Elsevier Science
Publishers, Amsterdam.
Myllymaki, A., Christiansen, E. & Hansson, L. (1977) Five-year surveillance of small mammal
abundance in Scandinavia. EPPO Bulletin, 7 (2), 385-396.
Neal, E.G. (1977) Badgers. Blandford Press, Poole.
Neff, D.J. (1968) The pellet-group count technique for big game trend, census, and distribution: a
review. Journal of Wildlife Management , 32, 597-614.
Osenberg, C.W., Sarnelle, O. & Goldberg, D.E. (1999a) Meta-analysis in ecology: concepts,
statistics, and applications. Ecology 80 (4), 1103-1104.
Osenberg, C.W., Sarnelle, O., Cooper, S.C. & Holt, R.D. (1999b) Resolving ecological
questions through meta-analysis: goals, metrics, and models. Ecology 80 (4), 1105-1117.

8/18/2019 BTO Research Report No.223 - Developing a Mammal Monitoring Programme for the UK
http://slidepdf.com/reader/full/bto-research-report-no223-developing-a-mammal-monitoring-programme-for-the 280/316
BTO Research Report No.223July 1999 278
O'Sullivan (1983) The distribution of the Pine Marten (Martes martes) in the Republic of Ireland.
Mammal Review, 13, (1):, 39-44.
Packer, J.J. & Birkds, J.D.S. (1999) An assemssment of British farmers’ and gamekeeper’
experiences, attitudes and practices in relation to the European Polecat Muntela putorius.
Mammal Review 29 (2), 75-92.
Pannekoek J. & van Strien, A. (1996) TRIM (TRends & Indices for Monitoring data). Statistics
Netherlands, Voorburg, Netherlands.
Parer, I. & Wood, D.H. (1986) Further observations of the use of warren entrances as an index of
the number of Rabbits, Oryctolagus cuniculus. Australian Wildlife Research, 13, 331-332.
Peach, W.J. & Baillie, S.R. (1994) Implementation of the Mountford indexing method for the
Common Birds Census. Bird Numbers 1992: Distribution, Monitoring and Ecological Aspects;
Proceedings 12th International Conference of IBCC & EOAC (eds W. Hagemeijer & T.
Verstrael), pp 653-662. SOVON, Beek-Ubbergen, Netherlands.
Pelikan, J. (1968) The edge effect of the trapping area in estimates of small mammal numbers.
Zoologiscke Listy, 17, 97-108.
Peters, R.H. (1991) A critique for ecology. Cambridge University Press.
Rao, J.N.K. & Graham, J.E. (1964) Rotation Designs for Sampling on Related Occasions. In
Journal of the American Statistical Association, 59, 492-509.
Raven, P.J., Fox, P., Everard, M., Holmes, N.T.H. & Dawson, F.H. (1997) River Habitat Survey:
a new system for classifying rivers according to their habitat quality. In: Freshwater Quality: Defining the Indefinable? (eds, Boon, P.J. & Howell, D.L.) pp 215-234. The Stationary Office,
Edinburgh.
Reason, P, Harris, S. & Cresswell, P. (1993) Estimating the impact of past persecution and
habitat changes on the numbers of Badgers Meles meles in Britain. Mammal Review, 23, 1-15.
Rennison, B.D. & Drummond, D.C. (1981) Monitoring and improving rodent control progress
in non-agricultural premises in England and Wales. Environmental Health 92 (11), 287-297.
Reynolds, J.C. & Tapper, S. C. (1994) Are foxes on the increase? Game Conservancy Review of
1993, 25, 94-96.Rogers, L.M. & Gorman, M.L. (1995) The population dynamics of small mammals living in
set-aside and surrounding semi-natural and crop land. Journal of Zoology, London, 236,
451-464.
Rust, C.C. (1968) Procedure for live-trapping Weasels. Journal of Mammalogy, 49, 318-319.
Sargent, G. & Morris, P. (1999) How to find and identify mammals. The Mammal Society.
Shanker, K. & Sukumar, R. (1999) Synchrony in small mammal populations of montane forest
patches in southern India. Journal of Animal Ecology, 68, 50-99.

8/18/2019 BTO Research Report No.223 - Developing a Mammal Monitoring Programme for the UK
http://slidepdf.com/reader/full/bto-research-report-no223-developing-a-mammal-monitoring-programme-for-the 281/316
BTO Research Report No.223July 1999 279
Shawyer, C.R. & Dixon, N. (1999) Impact of roads on Barn Owl populations. Report to the
Highways Agencies.
Siriwardena, G.M., Baillie, S.R., Buckland, S.T., Fewster, R.M., Marchant, J.H. & Wilson, J.D.
(1998) Trends in the abundance of farmland birds: a quantitative comparison of smoothed
Common Birds Census indices. Journal of Applied Ecology, 35, 24-43.
Skalski, J.R. (1990) A Design for Long-Term Status and Trends Monitoring. Journal of
Environmental Management 30, 139-144.
Smal, C.M. (1988) The American Mink Mustela vison in Ireland. Mammal Review, 18 (4),
201-208.
Smal, C.M. (1995) The Badger and habitat survey of Ireland. The Stationary Office, Dublin.
Smith, P.A., Smith, J.A., Tattersall, F.H., Lancaster, V., Natynczuk, S.E. & Seymour, R.S.
(1993) The ship rat ( Rattus rattus) on Lundy, 1991. Journal of Zoology, London, 231, 689-695.
Smith, G.C., Pugh, B. & Trout, R.C. (1995) Age and sex bias in samples of wild Rabbits,
Oryctolagus cuniculus, from wild populations in southern England. New Zealand Journal of
Zoology, 22, 115-121.
Sokal, R.R. & Rohlf, F.J. (1995) Biometry, 3rd Edition. Freeman, New York.
Stenseth, N.C., Hansson, L., Myllymaki, A., Andersson, M. & Katila, J. (1977) General models
for the population dynamics of the field vole Microtus agrestis in Central Scandinavia. Oikos, 29,
616-642.
Stoate, C. & Tapper, S. (1993) The impact of three hunting methods on brown hare ( Lepus
europaeus) populations in Britain. Gibier Faune Sauvage, 10, 229-240.
Stoddart, D.M. (1970) Individual range, dispersion and dispersal in a population of Water Voles
( Arvicola terrestris). Journal of Animal Ecology, 39, 403-425.
Strachan, R., Birks, J.D.S., Chanin, P.R.F. & Jefferies, O.J. (1990) Otter survey of England
1984-1986. Nature Conservancy Council, Peterborough.
Strachan, R. & Jefferies, D.J. (1993) The Water Vole Arvicola terrestris in Britain 1989-1990: its
distribution and changing status. The Vincent Wildlife Trust, London.Strachan, R. & Jefferies, D.J. (1996) Otter Survey of England 1991-1994: A report on the decline
and recovery of the Otter in England and on its distribution, status and conservation in
1991-1994. Vincent Wildlife Trust, London.
Strachan, R., Jefferies, D.J. & Chanin, P.R.F. (1996). Pine Marten survey of England and Wales
1987-1988. JNCC, Peterborough.
Strachan, R. & Jefferies, D.J. (1996) Otter Survey of England 1991-1994. The Vincent Wildlife
Trust, London.
Southern, H.N. (1954) Tawny Owls and their prey. Ibis 96, 384-410.

8/18/2019 BTO Research Report No.223 - Developing a Mammal Monitoring Programme for the UK
http://slidepdf.com/reader/full/bto-research-report-no223-developing-a-mammal-monitoring-programme-for-the 282/316
BTO Research Report No.223July 1999 280
Sumption, K.J. & Flowerdew, J.R. (1985) The ecological effects of the decline in Rabbits
(Oryctolagus cunniculus L.) due to myxomatosis. Mammal Review, 15 (4), 151-186.
Sutherland, W.J. (ed.) (1996) Ecological Census Techniques: A Handbook . Cambridge
University Press, Cambridge.
Tapper, S. (1976) The diet of Weasels, Mustela nivalis, and Stoats, Mustela erminea during early
summer, in relation to predation on gamebirds. Journal of Zoology, London, 179, 219-224.
Tapper, S. (1976) Population fluctuations of Field Voles ( Microtus): a background to the
problems involved in predicting vole plagues. Mammal Review, 6 (3), 93-117.
Tapper, S. (1979) The effect of fluctuating vole numbers ( Microtus agrestis) on a population of
Weasels ( Mustela nivalis) on farmland. Journal of Animal Ecology, 48, 603-617.
Tapper, S. (1992) Game Heritage: An ecological review from shooting and gamekeeping
records. Game Conservancy Trust, Fordingbridge .
Tapper, S. & Parsons, N. (1984) Surveys galore - but how many hares? Game Conservancy
Review for 1978, 67-75.
Tapper, S. & Stoate, C. (1992) Surveys galore - but how many hares? Game Conservancy
Review, 23, 63-64.
Taylor, R.H. & Williams, R.M. (1956) The use of pellet counts for estimating the density of
populations of the wild Rabbit. New Zealand Journal of Science and Technology, 38, 236-256.
Tee, L.A., Rowe, J.J. & Pepper, H.W. (1985) 1983 Mammal/Bird/Damage Questionnaire Survey.Report of the Wildlife Section, Forestry Commission, Alice Holt.
ter Braak, C.J.F., van Strien, A.J., Meijer, R. & Verstrael, T.J. (1994) Analysis of monitoring
data with many missing values: which method? Bird Numbers 1992: Distribution, Monitoring
and Ecological Aspects; Proceedings 12th International Conference of IBCC & EOAC (eds W.
Hagemeijer & T. Verstrael), pp 663-673. SOVON, Beek-Ubbergen, Netherlands.
Tew, T. (1987) A comparison of small mammal responses to clean and dirty traps. Journal of
Zoology, London, 212, 361-364.
Thomas, L. (1996) Monitoring long-term population change: why are there so many analysismethods? Ecology, 77, 49-58.
Thomson, D.L., Green, R.E., Gregory, R.D. & Baillie, S.R. (1998) The widespread declines of
songbirds in rural Britain do not correlate with the spread of their avian predators. Proc. R. Soc.
Lond. B. 265, 2057-2062.
Thompson, H.V. & Platt, F.B. (1964) The present status of Glis in England. Bulletin of The
Mammal Society, 21, 5-6.
Toms, M.P., Crick, H.Q.P. & Shawyer, C.R. (1998) Project Barn Owl Final Report . Draft BTO
Research Report No.197.

8/18/2019 BTO Research Report No.223 - Developing a Mammal Monitoring Programme for the UK
http://slidepdf.com/reader/full/bto-research-report-no223-developing-a-mammal-monitoring-programme-for-the 283/316
BTO Research Report No.223July 1999 281
Trout, R.C. (1978) A review of studies on populations of wild Harvest Mice ( Micromys minutus
( Pallas)). Mammal Review, 8 (4), 143-158.
Trout, R.C. & Tittensor, A.M. (1982) Rabbit distribution and abundance in England and Wales.
Third International Theriological Congress, Helsinki, abstracts 246.
Trout, R.C, Tapper, S.C. & Harradine, J. (1986) Recent trends in the Rabbit population in
Britain. Mammal Review, 16 (3/4), 117-123.
Trout, R.C. & Tittensor, A.M. (1989) Can predators regulate wild rabbit populations in England
and Wales. Mammal Review 19, 153-173.
Tucker, G.M. & Heath, M.F. (1994) Birds in Europe: their conservation status. BirdLife
International (BirdLife Conservation Series no.3), Cambridge.
Twigg, G.I. (1975) Catching mammals. Mammal Review, 5, 83-100.
Trigg, G.I. (1992) The Black Rat Rattus rattus in the United Kingdom in 1989. Mammal Review
22 (1), 33-42.
Velander, K.A. (1983) Pine Marten survey of Scotland, England & Wales 1980-1982. Vincent
Wildlife Trust, London.
Vickery, W.L. & Bider, J.R. (1981) The influence of weather on rodent activity. Journal of
Mammalogy, 62, 140-145.
Village, A. & Myhill, D. (1990) Estimating small mammal abundance for predator studies:
snap-trapping versus sign indices. Journal of Zoology, London, 222, 681-689.
Walsh, A.L. & Harris, S. (1996a) Foraging habitat preferences of vespertilionid bats in Britain.
Journal of Applied Ecology, 33, 508-518.
Walsh, A.L. & Harris, S. (1996b) Factors determining the abundance of vespertilionid bats in
Britain: geographical, land class and local habitat relationships. Journal of Applied Ecology, 33,
519-529.
Warner, L.J. & Batt, G.T. (1976) Some simple methods for recording wild harvest ( Micomys
minutus) distribution and activity. Journal of Zoology, London 179, 226-229.
Wauters, L. & Dhondt, A.A. (1986) The use of red squirrel Sciuris vulgaris dreys to estimate
population density. Journal of Zoology, London, 214, 179-187.
Weir, A., Mcleod, J & Adams, C.E. (1995) The winter diet and parasitic fauna of a population of
Red-necked Wallabies Macropus rufogriseus recently introduced to Scotland. Mammal Review
25 (3), 111-116.
Whitten, A.J. (1990) Recovery: a proposed programme for Britain's protected species. Nature
Conservancy Council, Peterborough.
Williamson, M. (1996) Biological Invasions. Chapman & Hall, London.

8/18/2019 BTO Research Report No.223 - Developing a Mammal Monitoring Programme for the UK
http://slidepdf.com/reader/full/bto-research-report-no223-developing-a-mammal-monitoring-programme-for-the 284/316
BTO Research Report No.223July 1999 282
Wilson, G., Harris, S. & McLaren, G. (1997) Changes in the British badger population, 1988 to
1997 . Peoples' Trust for Endangered Species, London.
Wise, M.H., Linn, I.J. & Kennedy, C.R. (1981) A comparison of the feeding biology of Mink
Mustela vison and Otter Lutra lutra. Journal of Zoology, London, 195, 181-213.
Wood, D.H. (1988) Estimating Rabbit density by counting dung pellets. Australian Wildlife
Research, 15, 665-671.
Woodroffe, G.L., Lawton, J.H. & Davidson, W.L. (1990) Patterns in the production of latrines by
Water Voles ( Arvicola terrestris) and their use as indices of abundance in population surveys.
Journal of Zoology, London, 220, 439-445.
Woodroffe, G.L., Lawton, J.H. & Davidson, W.L. (1990) The impact of feral Mink Mustela
vison on Water Voles Arvicola terrestris in the North Yorkshire Moors National Park.
Biological Conservation, 51, 49-62.
Yalden, D.W. (1988) Feral wallabies in the Peak District, 1971-1985. Journal of Zoology,
London, 215, 369-374.
Yalden, D. (1999) The History of British Mammals. T. & A.D. Poyser, London.
Yates, F. (1981) Sampling methods for censuses and surveys. Charles Griffin & Co. Ltd.,
London.
Yom-Tov, Y. & Wool, D. (1997) Do the contents of Barn Owl pellets accurately represent the
proportion of prey species in the field? Condor , 19, 972-976.
Zubaid, A. & Gorman, M.L. (1991) The diet of Wood Mice Apodemus sylvaticus living in a sand
dune habitat in north-east Scotland. Journal of Zoology, London, 225, 227-232.

8/18/2019 BTO Research Report No.223 - Developing a Mammal Monitoring Programme for the UK
http://slidepdf.com/reader/full/bto-research-report-no223-developing-a-mammal-monitoring-programme-for-the 285/316
BTO Research Report No.223July 1999 283
Table I.1.1 Action Plan objectives and targets for UK mammals (Anon. 1994).
Species Objectives and Targets
Water Vole (Ar vicola terr estri s) Maintain the current distribution and abundance of
the species in the UK.
Ensure that water voles are present throughout their
1970s range by the year 2010, considering habitat
management and possible translocation of
populations to areas from where they have been
lost.
Brown Hare (Lepus europaeus) Maintain and expand existing populations, doubling
spring numbers in Britain by 2010.
Otter (Lutra lutra) Maintain and expand existing otter populations.
By 2010, restore breeding otters to all catchmentsand coastal areas where they have been recorded
since 1960.
Dormouse (Muscardinus avell anarius) Maintain and enhance dormouse populations in all
the counties where they still occur.
Re-establish self-sustaining populations in at least 5
counties where they have been lost.
Red Squirrel (Sciurus vulgari s) Maintain and enhance current populations of red
squirrel, where appropriate, through good
management.
Re-establish red squirrel populations, where
appropriate.

8/18/2019 BTO Research Report No.223 - Developing a Mammal Monitoring Programme for the UK
http://slidepdf.com/reader/full/bto-research-report-no223-developing-a-mammal-monitoring-programme-for-the 286/316

8/18/2019 BTO Research Report No.223 - Developing a Mammal Monitoring Programme for the UK
http://slidepdf.com/reader/full/bto-research-report-no223-developing-a-mammal-monitoring-programme-for-the 287/316

8/18/2019 BTO Research Report No.223 - Developing a Mammal Monitoring Programme for the UK
http://slidepdf.com/reader/full/bto-research-report-no223-developing-a-mammal-monitoring-programme-for-the 288/316

8/18/2019 BTO Research Report No.223 - Developing a Mammal Monitoring Programme for the UK
http://slidepdf.com/reader/full/bto-research-report-no223-developing-a-mammal-monitoring-programme-for-the 289/316

8/18/2019 BTO Research Report No.223 - Developing a Mammal Monitoring Programme for the UK
http://slidepdf.com/reader/full/bto-research-report-no223-developing-a-mammal-monitoring-programme-for-the 290/316
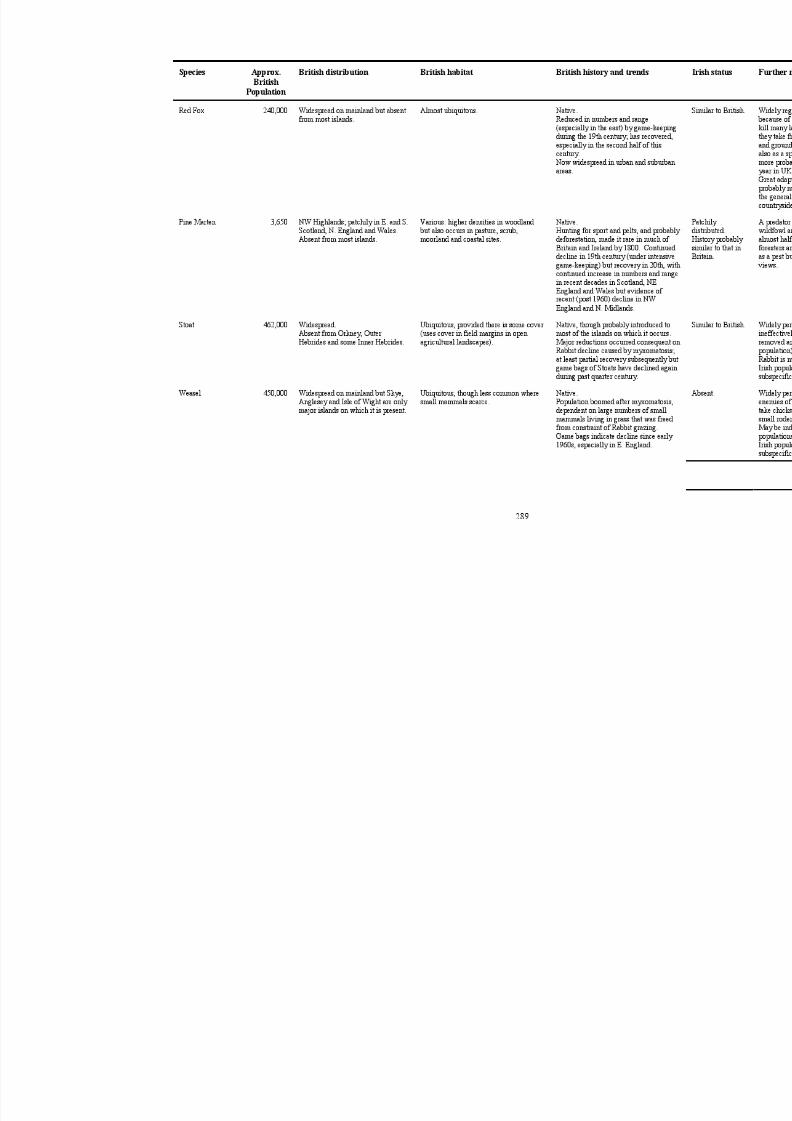
8/18/2019 BTO Research Report No.223 - Developing a Mammal Monitoring Programme for the UK
http://slidepdf.com/reader/full/bto-research-report-no223-developing-a-mammal-monitoring-programme-for-the 291/316
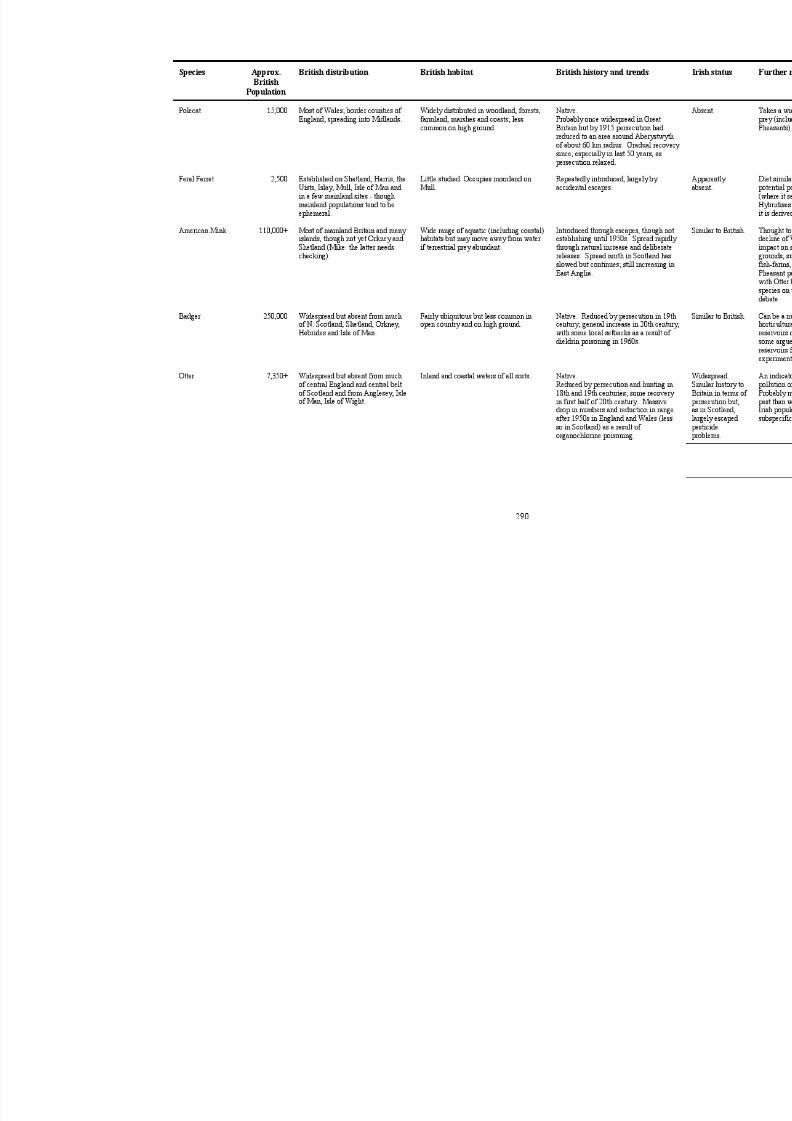
8/18/2019 BTO Research Report No.223 - Developing a Mammal Monitoring Programme for the UK
http://slidepdf.com/reader/full/bto-research-report-no223-developing-a-mammal-monitoring-programme-for-the 292/316

8/18/2019 BTO Research Report No.223 - Developing a Mammal Monitoring Programme for the UK
http://slidepdf.com/reader/full/bto-research-report-no223-developing-a-mammal-monitoring-programme-for-the 293/316

8/18/2019 BTO Research Report No.223 - Developing a Mammal Monitoring Programme for the UK
http://slidepdf.com/reader/full/bto-research-report-no223-developing-a-mammal-monitoring-programme-for-the 294/316

8/18/2019 BTO Research Report No.223 - Developing a Mammal Monitoring Programme for the UK
http://slidepdf.com/reader/full/bto-research-report-no223-developing-a-mammal-monitoring-programme-for-the 295/316
293
Species Approx.
British
Population
British distribution British habitat British history and trends
Feral Sheep 2,100 Soay sheep, from island of that
name (St Kilda), now introduced to
other offshore islands. Boreraysheep confined to island of that
name (St Kilda).
Grassland. Sheep introduced about 5,500 years ago
Soay is considered a primitive domesti
breed, perhaps descended from the sortof sheep introduced by Neolithic people
(though possibly introduced by theVikings). Boreray sheep are a relatively
modern breed. Both St Kilda
populations fluctuate, with no long-termtrends.
Red-necked
Wallaby
50? Inchconachan (Loch Lomond) and
Isle of Man.
Scrub. Introduced.
Escapes and releases have established
populations. One in the Weald survived1940-1972. One in the Peak District,
established 1940, is now reduced to two
females (D.W. Yalden, pers com.). Loch
Lomond population now c.30)
deliberately established 1975. Escapeson Isle of Man (probably late 1960s) led
to current population of c.50 (Chris
Sharpe, pers. comm.). No others surviv
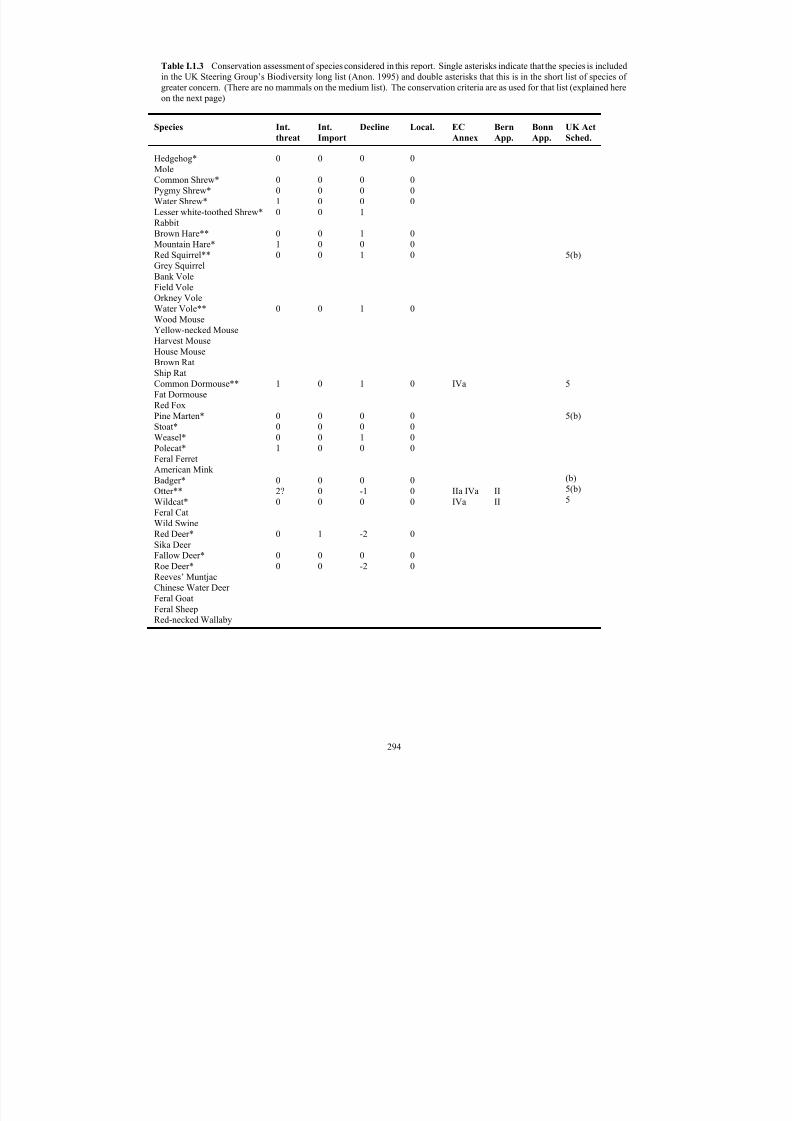
8/18/2019 BTO Research Report No.223 - Developing a Mammal Monitoring Programme for the UK
http://slidepdf.com/reader/full/bto-research-report-no223-developing-a-mammal-monitoring-programme-for-the 296/316
294
Table I.1.3 Conservation assessment of species considered in this report. Single asterisks indicate that the species is included
in the UK Steering Group’s Biodiversity long list (Anon. 1995) and double asterisks that this is in the short list of species of
greater concern. (There are no mammals on the medium list). The conservation criteria are as used for that list (explained here
on the next page)
Species Int.
threat
Int.
Import
Decline Local. EC
Annex
Bern
App.
Bonn
App.
UK Act
Sched.
Hedgehog*
Mole
Common Shrew*
Pygmy Shrew*
Water Shrew*
Lesser white-toothed Shrew*
Rabbit
Brown Hare**
Mountain Hare*
Red Squirrel**
Grey Squirrel
Bank VoleField Vole
Orkney Vole
Water Vole**
Wood Mouse
Yellow-necked Mouse
Harvest Mouse
House Mouse
Brown Rat
Ship Rat
Common Dormouse**
Fat Dormouse
Red Fox
Pine Marten*Stoat*
Weasel*
Polecat*
Feral Ferret
American Mink
Badger*
Otter**
Wildcat*
Feral Cat
Wild Swine
Red Deer*
Sika Deer
Fallow Deer*Roe Deer*
Reeves’ Muntjac
Chinese Water Deer
Feral Goat
Feral SheepRed-necked Wallaby
0
0
0
1
0
0
1
0
0
1
0 0
0
1
0
2?
0
0
00
0
0
0
0
0
0
0
0
0
0
0 0
0
0
0
0
0
1
00
0
0
0
0
1
1
0
1
1
1
00
1
0
0
-1
0
-2
0-2
0
0
0
0
0
0
0
0
0
0 0
0
0
0
0
0
0
00
IVa
IIa IVa
IVa
II
II
5(b)
5
5(b)
(b)
5(b)
5

8/18/2019 BTO Research Report No.223 - Developing a Mammal Monitoring Programme for the UK
http://slidepdf.com/reader/full/bto-research-report-no223-developing-a-mammal-monitoring-programme-for-the 297/316
295
The following provides a key to interpret abbreviations used in Table I.1.3
International Threat:
2 Species of global conservation concern
2? Status uncertain - possibly 2
1 Unfavourable conservation status in Europe
0 Favourable conservation status in Europe
International importance:
3 75+% of the world population in the UK
3* Believed endemic
3*? Possible endemic
2 50-74% of the world population in the UK
1 25-49% of the world population in the UK
0 0-24% of the world population in the UK
Decline:
2 50-100% decline in numbers/range in GB in last 25 years
1 25-49% decline in numbers/range in GB in last 25 years
0 0-24% decline in numbers/range in GB in last 25 years
0 0-24% increase in numbers/range in GB in last 25 years
-1 25-49% increase in numbers/range in GB in last 25 years
-2 50+% increase in numbers/range in GB in last 25 years
Localisation:
2 Currently occurs in 1-5 10km squares in GB
1 Currently occurs in 6-15 10km squares in GB
+ Currently occurs in 16-100 10km squares in GB
0 Currently occurs in 101+ 10km squares in GB
EC Directives Birds Directive Annex 1 (native species only)
EC Habitats Directive Annex II and/or IV (native species only)
Bern Convention Appendices I and II (native species only)
Bonn Convention Appendices I and II (native species only)
UK Act Scheds. 1 Schedule 1} (a) Schedule 1}
5 Schedule 5} Wildlife & Countryside (b) Schedule 5} Wildlife (Northern
8 Schedule 8} Act 1981 (c) Schedule 8} Ireland) Order 1985
5* Schedule 5 but protection against sale only

8/18/2019 BTO Research Report No.223 - Developing a Mammal Monitoring Programme for the UK
http://slidepdf.com/reader/full/bto-research-report-no223-developing-a-mammal-monitoring-programme-for-the 298/316
296
Table III.A.1.1 Summary of the numbers of BBS survey squares in which each of the principal 17 mammal species was
reported to be present in each year of the trial mammal survey, 1995-1997.
Species Number of Squares
“Present” in Each Year
Percentages of Squares “Present” in Each Year (s.e.)
1995 1996 1997 1995 1996 1997
Hedgehog 26 138 162 1.95 (0.38) 8.54 (0.7) 8.64 (0.65)
Mole 95 284 292 7.12 (0.7) 17.59 (0.95) 15.58 (0.84)
Common Shrew 26 100 90 1.95 (0.38) 6.19 (0.6) 4.80 (0.49)
Rabbit 966 1117 1297 72.41 (1.22) 69.16 (1.15) 69.21 (1.07)
Brown Hare 496 594 648 37.18 (1.32) 36.78 (1.2) 34.58 (1.1)
Mountain Hare 39 53 68 2.92 (0.46) 3.28 (0.44) 3.63 (0.43)
Red Squirrel 15 30 33 1.12 (0.29) 1.86 (0.34) 1.76 (0.3)
Grey Squirrel 399 570 602 29.91 (1.25) 35.29 (1.19) 32.12 (1.08)
Brown Rat 23 78 64 1.72 (0.36) 4.83 (0.53) 3.42 (0.42)
Red Fox 423 527 477 31.71 (1.27) 32.63 (1.17) 25.45 (1.01)
Stoat 37 86 86 2.77 (0.45) 5.33 (0.56) 4.59 (0.48)
Weasel 19 69 71 1.42 (0.32) 4.27 (0.5) 3.79 (0.44)
Badger 82 152 156 6.15 (0.66) 9.41 (0.73) 8.32 (0.64)
Red Deer 85 100 102 6.37 (0.67) 6.19 (0.6) 5.44 (0.5)
Fallow Deer 47 57 57 3.52 (0.5) 3.53 (0.46) 3.04 (0.4)
Roe Deer 249 294 298 18.67 (1.07) 18.20 (0.96) 15.90 (0.84)
Reeves’ Muntjac 61 67 76 4.57 (0.57) 4.15 (0.5) 4.06 (0.46)
Total Squares 1334 1615 1874 - - -

8/18/2019 BTO Research Report No.223 - Developing a Mammal Monitoring Programme for the UK
http://slidepdf.com/reader/full/bto-research-report-no223-developing-a-mammal-monitoring-programme-for-the 299/316
BTO Research Report No. 223
July 1999 297
Table III.A.1.2 Results of likelihood-ratio tests of the significance of inter-annual differences in the proportion of survey
squares in which species were recorded as present. The sample size N for the matched squares tests refers to the numbers of
matched squares where changes in status occurred (see text for details).
Species Likelihood-ratio tests: "2, P (N)
1995, 1996 & 1997Unmatched
1996 & 1997Unmatched
1996 & 1997Matched
Hedgehog 84.78, <0.01 0.01, 0.92 0.07, 0.79 (129)
Mole 82.14, <0.01 2.52, 0.11 9.63, <0.01 (207)
Common Shrew 35.49, <0.01 3.24, 0.07 4.11, 0.04 (96)
Rabbit 4.83, <0.1 0.00, 0.98 1.16, 0.28 (220)
Brown Hare 2.88, <0.3 1.83, 0.18 5.79, 0.02 (222)
Mountain Hare 1.25, <0.6 0.31, 0.58 0.61, 0.44 (41)
Red Squirrel 3.07, <0.3 0.05, 0.86 0.00, 1.00 (30)
Grey Squirrel 9.92, <0.01 3.91, 0.05 14.2, <0.01 (248)
Brown Rat 22.78, <0.01 4.43, 0.4 2.76, 0.10 (70)
Red Fox 25.72, <0.01 21.8, <0.05 23.6, <0.01 (382)
Stoat 12.80, <0.01 1.00, 0.32 1.24, 0.26 (80)
Weasel 24.33, <0.01 0.53, 0.47 0.62, 0.43 (58)
Badger 11.09, <0.01 1.27, 0.26 3.08, 0.08 (104)
Red Deer 1.47, <0.6 0.89, 0.35 0.53, 0.47 (47)
Fallow Deer 0.845, <0.7 0.65, 0.42 0.31, 0.65 (43)
Roe Deer 5.17, <0.1 3.26, 0.07 3.47, 0.06 (179)
Reeves’ Muntjac 0.546, <0.8 0.02, 0.89 0.06, 0.81 (68)

8/18/2019 BTO Research Report No.223 - Developing a Mammal Monitoring Programme for the UK
http://slidepdf.com/reader/full/bto-research-report-no223-developing-a-mammal-monitoring-programme-for-the 300/316
BTO Research Report No. 223
July 1999 298
Table III.A.1.3 Results of a simulation-based study of the power of a simple GLM to detect a range of gradual, long-term
declines in presence/absence data. Each set of simulations consisted of 100 replicates, each based, as shown, on a sample size of
2000 BBS survey squares with declines in the “true” probability of detection of the model animal over a given period of years.
The line of the table referring to a 25% decline over 25 years is shown in bold: this magnitude and rate of population change has
been used as a key level for bird monitoring, and we suggest elsewhere that it could be extended to mammals.
Number
of Years
Average proportion of squares
where presence is detected
Overall
Decline
Percentage of replicates where a decline significant
at a=0.05 was detected (likelihood-ratio test)
Start of Decline End of Decline
10 0.3 0.27 10% 90%
10 0.1 0.09 10% 38%
10 0.03 0.027 10% 13%
10 0.03 0.025 25% 65%
25 0.03 0.025 25% 87%
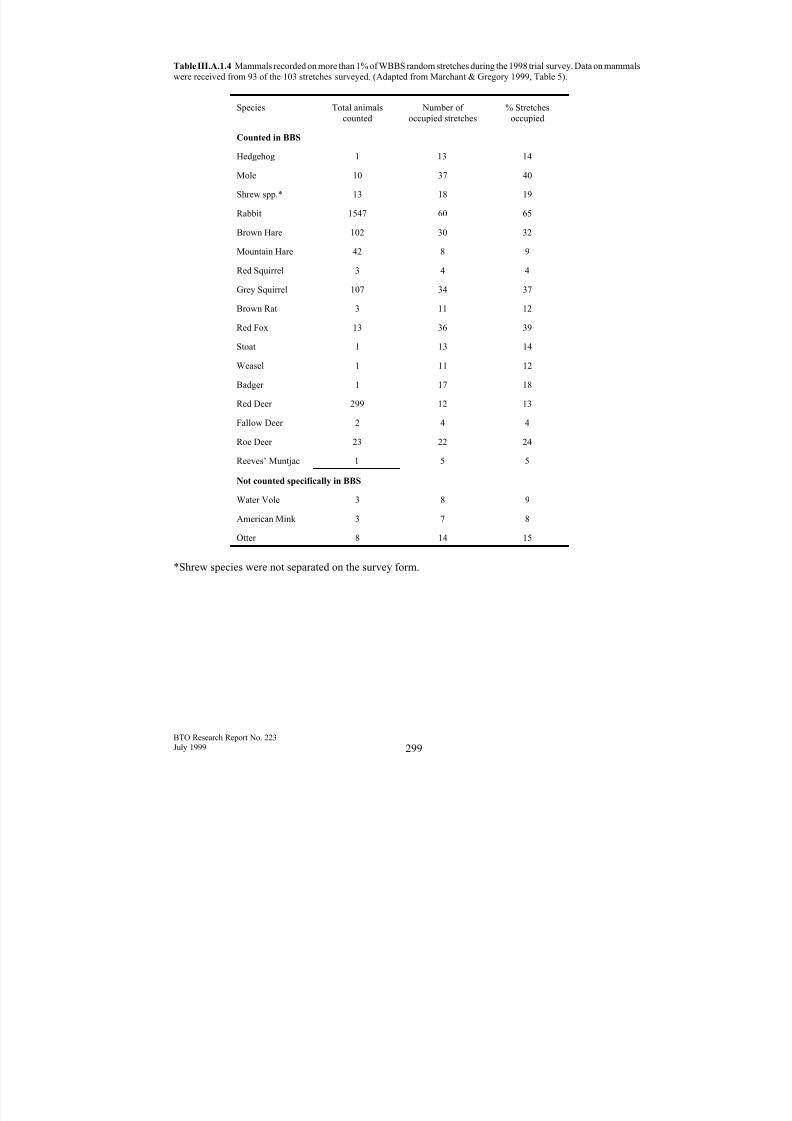
8/18/2019 BTO Research Report No.223 - Developing a Mammal Monitoring Programme for the UK
http://slidepdf.com/reader/full/bto-research-report-no223-developing-a-mammal-monitoring-programme-for-the 301/316

8/18/2019 BTO Research Report No.223 - Developing a Mammal Monitoring Programme for the UK
http://slidepdf.com/reader/full/bto-research-report-no223-developing-a-mammal-monitoring-programme-for-the 302/316
BTO Research Report No. 223July 1999 300
Table VII.1.1 Summary of the potential contributions of the proposed monitoring schemes to the monitoring of each mammal species in
species scheme is considered potentially to provide data central to the future monitoring of the species in question; “C” (for Combination
provide complementary and equally important information without any scheme necessarily being dominant; “A” (for Ancillary) indicate
information. Question marks indicate that a particular scheme may not be useful for the species shown, depending on species-specific fac
(see species accounts). Multi-species schemes are referred to as follows: Breeding Bird Survey (BBS); National Game Bag Census (NG
Sign Transect Survey (STS); Mammals on Roads (MOR); Mammals on Nature Reserves (MONR); Garden Mammal Watch (GMW);
Species Multi-species schemes Single species scheme
BBS NGB
C
WTS STS MOR MONR GMW OP Role Suggested Approach
Hedgehog C C? C C C
Mole C C C A C C
Lesser White-toothed Shrew M Monitoring techniques
faecal signs.
Common Shrew A M Live-trapping/capture-
mammals, but needs de
Pygmy Shrew A M Live-trapping/capture-
mammals, but needs de
Water Shrew A M Live-trapping/capture-mammals, but needs de
counts a possibility.
Rabbit A A M A A
Brown Hare A/M A M A
Mountain Hare A A M A
Red Squirrel A A A A A A M Existing intensive mon
with central data collat
Grey Squirrel C C C C C C
Bank Vole A M Live-trapping/capture-
mammals, but needs de
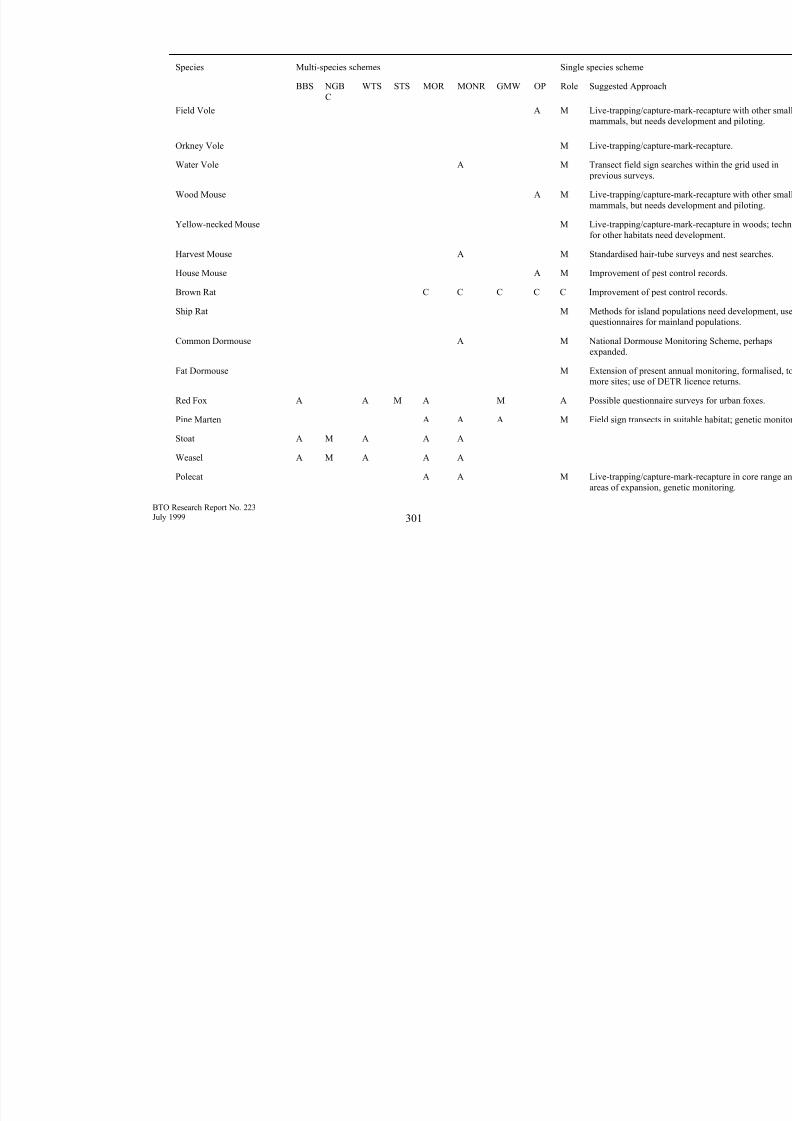
8/18/2019 BTO Research Report No.223 - Developing a Mammal Monitoring Programme for the UK
http://slidepdf.com/reader/full/bto-research-report-no223-developing-a-mammal-monitoring-programme-for-the 303/316
BTO Research Report No. 223July 1999 301
Species Multi-species schemes Single species scheme
BBS NGB
C
WTS STS MOR MONR GMW OP Role Suggested Approach
Field Vole A M Live-trapping/capture-
mammals, but needs de
Orkney Vole M Live-trapping/capture-
Water Vole A M Transect field sign sear
previous surveys.
Wood Mouse A M Live-trapping/capture-
mammals, but needs de
Yellow-necked Mouse M Live-trapping/capture-
for other habitats need
Harvest Mouse A M Standardised hair-tube
House Mouse A M Improvement of pest c
Brown Rat C C C C C Improvement of pest c
Ship Rat M Methods for island pop
questionnaires for main
Common Dormouse A M National Dormouse Mo
expanded.
Fat Dormouse M Extension of present anmore sites; use of DET
Red Fox A A M A M A Possible questionnaire
Pine Marten A A A M Field sign transects in s
Stoat A M A A A
Weasel A M A A A
Polecat A A M Live-trapping/capture-
areas of expansion, gen
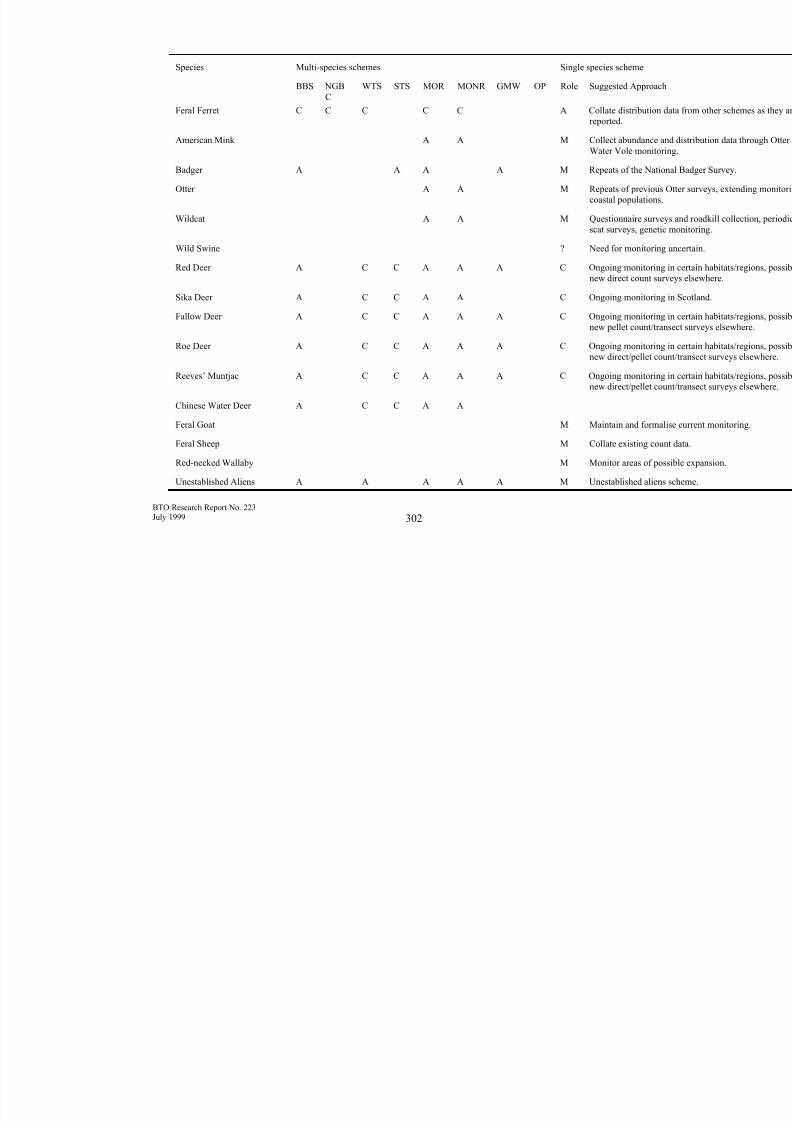
8/18/2019 BTO Research Report No.223 - Developing a Mammal Monitoring Programme for the UK
http://slidepdf.com/reader/full/bto-research-report-no223-developing-a-mammal-monitoring-programme-for-the 304/316
BTO Research Report No. 223July 1999 302
Species Multi-species schemes Single species scheme
BBS NGB
C
WTS STS MOR MONR GMW OP Role Suggested Approach
Feral Ferret C C C C C A Collate distribution dat
reported.
American Mink A A M Collect abundance andWater Vole monitoring
Badger A A A A M Repeats of the Nationa
Otter A A M Repeats of previous Ot
coastal populations.
Wildcat A A M Questionnaire surveys
scat surveys, genetic m
Wild Swine ? Need for monitoring un
Red Deer A C C A A A C Ongoing monitoring in
new direct count surve
Sika Deer A C C A A C Ongoing monitoring in
Fallow Deer A C C A A A C Ongoing monitoring in
new pellet count/transe
Roe Deer A C C A A A C Ongoing monitoring in
new direct/pellet count
Reeves’ Muntjac A C C A A A C Ongoing monitoring in
new direct/pellet count
Chinese Water Deer A C C A A
Feral Goat M Maintain and formalise
Feral Sheep M Collate existing count
Red-necked Wallaby M Monitor areas of possib
Unestablished Aliens A A A A A M Unestablished aliens sc

8/18/2019 BTO Research Report No.223 - Developing a Mammal Monitoring Programme for the UK
http://slidepdf.com/reader/full/bto-research-report-no223-developing-a-mammal-monitoring-programme-for-the 305/316
BTO Research Report No.223July 1999
303
Figure I.1.1 How monitoring supports management by helping to answer key questions
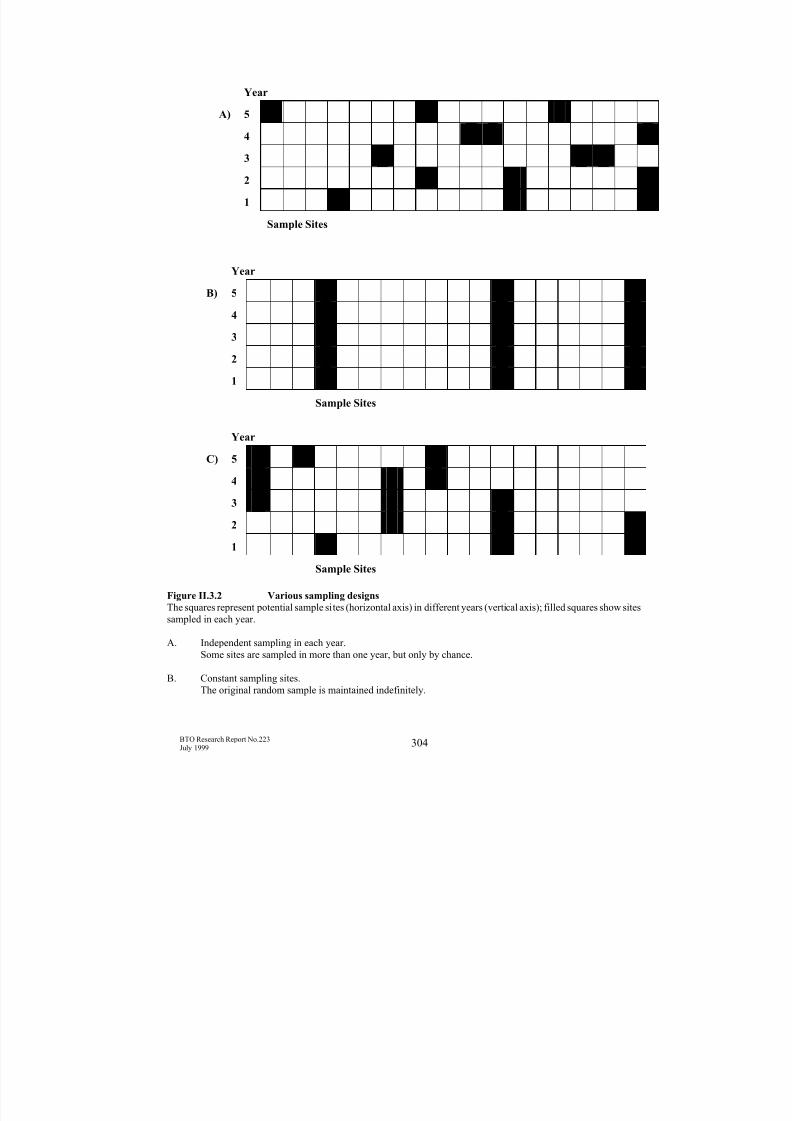
8/18/2019 BTO Research Report No.223 - Developing a Mammal Monitoring Programme for the UK
http://slidepdf.com/reader/full/bto-research-report-no223-developing-a-mammal-monitoring-programme-for-the 306/316
BTO Research Report No.223July 1999
304
Year
A) 5
4
3
2
1
Sample Sites
YearB) 5
4
3
2
1
Sample Sites
Year
C) 5
4
3
2
1
Sample Sites
Figure II.3.2 Various sampling designs
The squares represent potential sample sites (horizontal axis) in different years (vertical axis); filled squares show sites
sampled in each year.
A. Independent sampling in each year.
Some sites are sampled in more than one year, but only by chance.
B. Constant sampling sites.
The original random sample is maintained indefinitely.

8/18/2019 BTO Research Report No.223 - Developing a Mammal Monitoring Programme for the UK
http://slidepdf.com/reader/full/bto-research-report-no223-developing-a-mammal-monitoring-programme-for-the 307/316
BTO Research Report No.223July 1999
305
C. Sampling with partial replacement.
In this particular case, one of the three sites drops out each year, being replaced with another site at random;
each site stays in the sample for three years; it may re-enter the sample but only by chance.
Year
A) 6
5
4
3
2
1
Sample Sites
Year
B) 9
8
7
6
5
4
3
2
1
Sample Sites
Figure II.3.3 Rotation Sampling
The squares represent potential sample sites (horizontal axis) in different years (vertical axis); filled squares show sitessampled in each year.
A. Simple rotation.
Each site remains in the sample for a single occasion. In this particular case, because one in three of the sites
is sampled on each occasion, each site re-enters the sample after a gap of two occasions; each sampling cycle
(during which every site is sampled once) is thus three occasions long.
B. More complex rotation.
East site remains in the sample for more than a single occasion. In this particular case, sites remain in the
sample for three occasions but then drop out for six; each sampling cycle is nine occasions long.
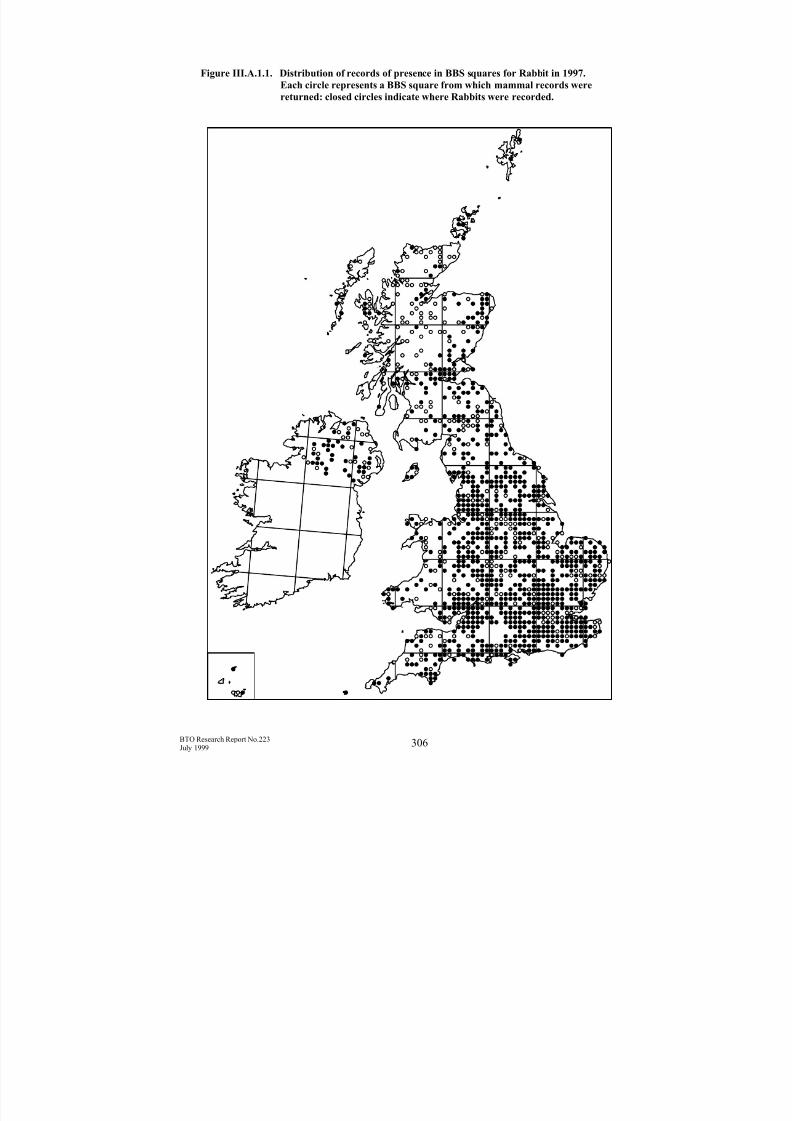
8/18/2019 BTO Research Report No.223 - Developing a Mammal Monitoring Programme for the UK
http://slidepdf.com/reader/full/bto-research-report-no223-developing-a-mammal-monitoring-programme-for-the 308/316
BTO Research Report No.223July 1999
306
Figure III.A.1.1. Distribution of records of presence in BBS squares for Rabbit in 1997.
Each circle represents a BBS square from which mammal records were
returned: closed circles indicate where Rabbits were recorded.

8/18/2019 BTO Research Report No.223 - Developing a Mammal Monitoring Programme for the UK
http://slidepdf.com/reader/full/bto-research-report-no223-developing-a-mammal-monitoring-programme-for-the 309/316
BTO Research Report No.223July 1999
307
Figure III.A.1.2 Distribution of records of presence in BBS squares for Brown Hare in 1997.
Each circle represents a BBS square from which mammal records were
returned: closed circles indicate where Brown Hares were recorded.
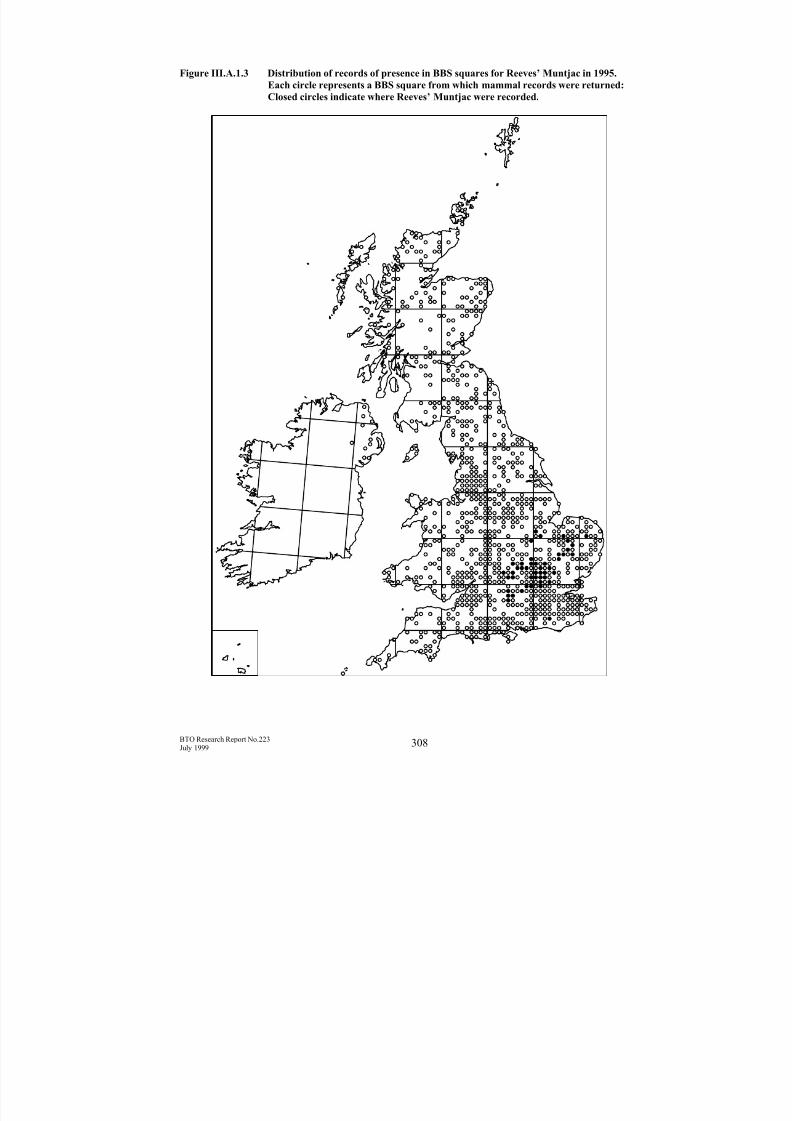
8/18/2019 BTO Research Report No.223 - Developing a Mammal Monitoring Programme for the UK
http://slidepdf.com/reader/full/bto-research-report-no223-developing-a-mammal-monitoring-programme-for-the 310/316
BTO Research Report No.223July 1999
308
Figure III.A.1.3 Distribution of records of presence in BBS squares for Reeves’ Muntjac in 1995.
Each circle represents a BBS square from which mammal records were returned:
Closed circles indicate where Reeves’ Muntjac were recorded.
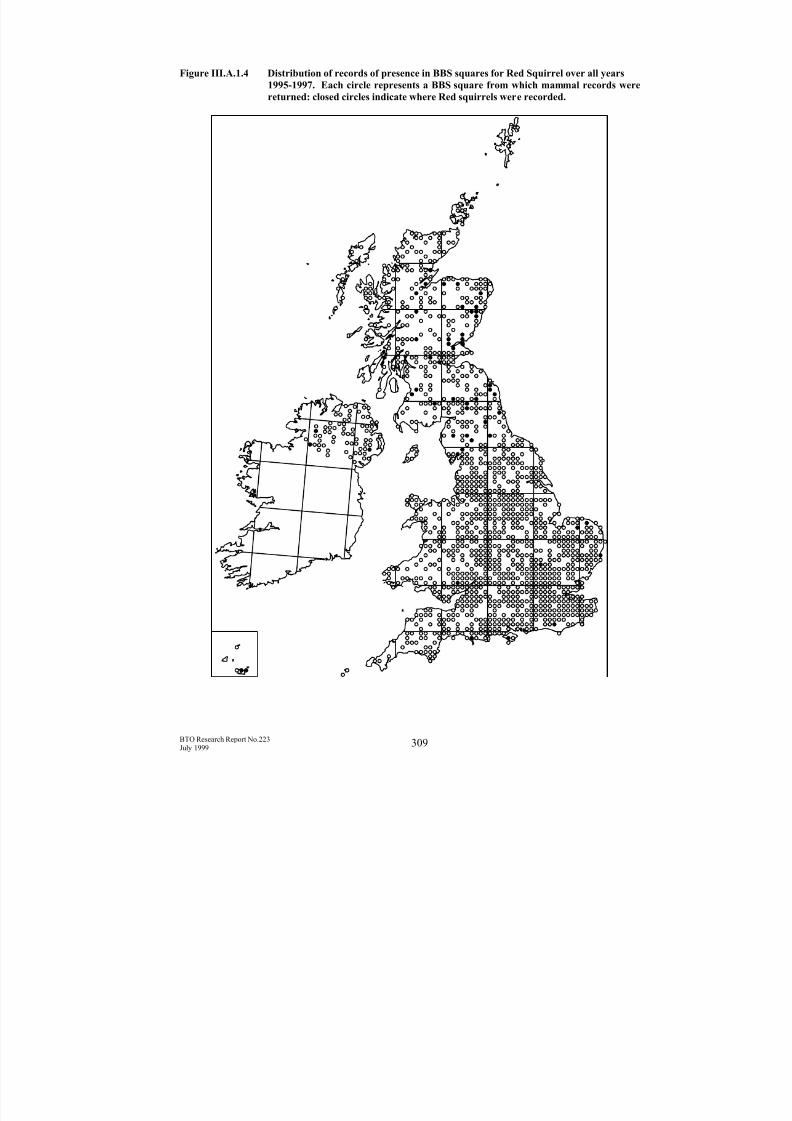
8/18/2019 BTO Research Report No.223 - Developing a Mammal Monitoring Programme for the UK
http://slidepdf.com/reader/full/bto-research-report-no223-developing-a-mammal-monitoring-programme-for-the 311/316
BTO Research Report No.223July 1999
309
Figure III.A.1.4 Distribution of records of presence in BBS squares for Red Squirrel over all years
1995-1997. Each circle represents a BBS square from which mammal records were
returned: closed circles indicate where Red squirrels were recorded.
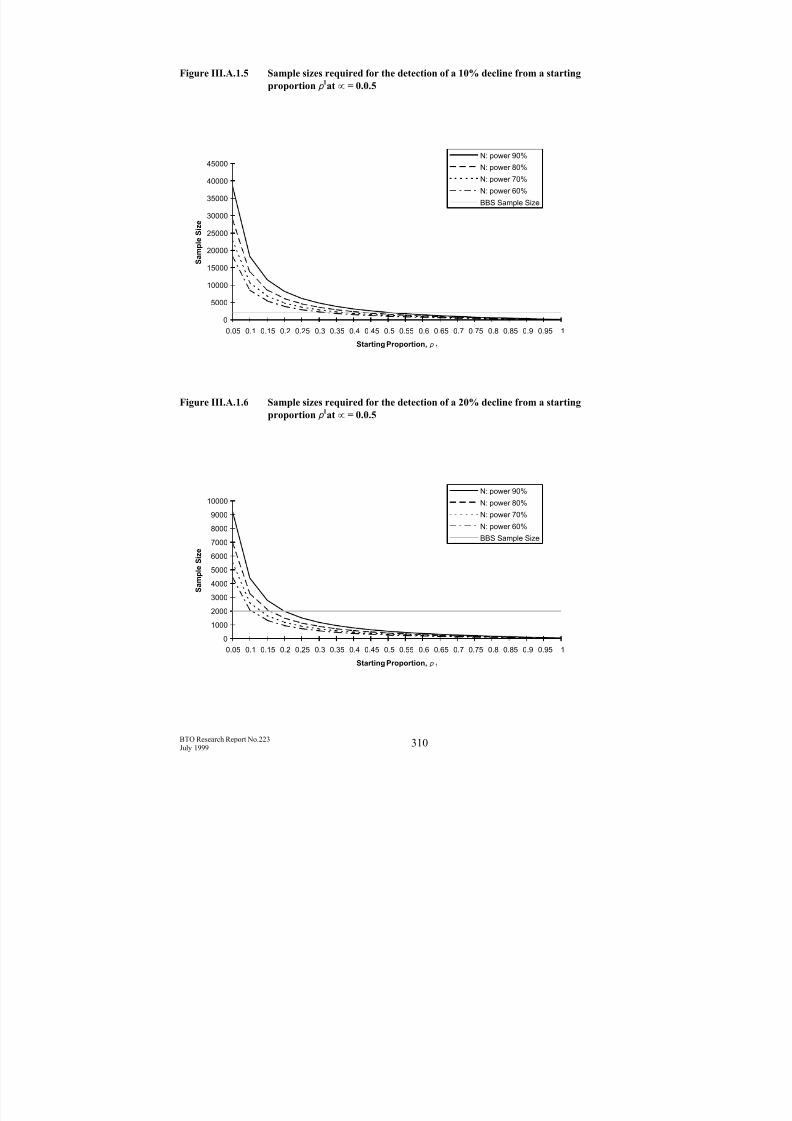
8/18/2019 BTO Research Report No.223 - Developing a Mammal Monitoring Programme for the UK
http://slidepdf.com/reader/full/bto-research-report-no223-developing-a-mammal-monitoring-programme-for-the 312/316

8/18/2019 BTO Research Report No.223 - Developing a Mammal Monitoring Programme for the UK
http://slidepdf.com/reader/full/bto-research-report-no223-developing-a-mammal-monitoring-programme-for-the 313/316
BTO Research Report No.223July 1999
311
Figure III.A.1.7 Sample sizes required for the detection of a 30% decline from a starting
proportion p 1at # = 0.0.5
0
500
1000
1500
2000
2500
3000
3500
4000
4500
0.05 0.1 0.15 0.2 0.25 0.3 0.35 0.4 0.45 0.5 0.55 0.6 0.65 0.7 0.75 0.8 0.85 0.9 0.95 1
Starting Proportion, p 1
S a m p l e S i z e
N: pow er 90%
N: pow er 80%
N: pow er 70%
N: pow er 60%
BBS Sample Size

8/18/2019 BTO Research Report No.223 - Developing a Mammal Monitoring Programme for the UK
http://slidepdf.com/reader/full/bto-research-report-no223-developing-a-mammal-monitoring-programme-for-the 314/316
BTO Research Report No.223July 1999
312

8/18/2019 BTO Research Report No.223 - Developing a Mammal Monitoring Programme for the UK
http://slidepdf.com/reader/full/bto-research-report-no223-developing-a-mammal-monitoring-programme-for-the 315/316
BTO Research Report No.223July 1999
313

8/18/2019 BTO Research Report No.223 - Developing a Mammal Monitoring Programme for the UK
http://slidepdf.com/reader/full/bto-research-report-no223-developing-a-mammal-monitoring-programme-for-the 316/316