Embed Size (px)
Citation preview


7
BTC Project Environmental and Social Annual
Report (Operations Phase) 2007


BTC Pipeline Project
i
TABLE OF CONTENTS 1 EXECUTIVE SUMMARY...........................................................................................1 2 INTRODUCTION .......................................................................................................1 3 ESIAs / EIA AND PERMITTING................................................................................2
3.1 SUMMARY OF ANY MATERIAL MODIFICATIONS TO THE ESIAs............................2 3.1.1 AZERBAIJAN................................................................................................................ 2
3.1.1.1 Construction and Operation of a Camp at PSA2 ...........................................2 3.1.1.2 Interim Routine Right of Way Access Strategy ..............................................2 3.1.1.3 BTC Expansions.............................................................................................2
3.1.2 GEORGIA.................................................................................................................... 2 3.1.3 TURKEY...................................................................................................................... 2 3.1.4 CROSS-COUNTRY PERMITTING ACTIVITY RELATED TO THE EXPANSION OF BTC............. 2
3.2 SUMMARY OF MATERIAL PERMITS ISSUED IN 2007 ..............................................3 3.3 UPDATE ON STATUS OF PROJECT SPECIFIC REQUIREMENTS FOR FURTHER WORK UNDER THE ESIAs OR PERMITS .............................................................................4
3.3.1 AZERBAIJAN................................................................................................................ 4 3.3.2 GEORGIA.................................................................................................................... 5 3.3.3 TURKEY...................................................................................................................... 6
3.4 OTHER STUDIES..........................................................................................................8 3.4.1 GEORGIA.................................................................................................................... 8 3.4.2 TURKEY...................................................................................................................... 9
4 CHANGES...............................................................................................................13 4.1 AZERBAIJAN...............................................................................................................13 4.2 GEORGIA ....................................................................................................................14 4.3 TURKEY ......................................................................................................................16 4.4 CROSS-COUNTRY CHANGES ..................................................................................19 4.5 DESCRIPTION OF ANY MATERIAL AMENDMENT, SUPPLEMENT, REPLACEMENT OR MATERIAL MODIFICATION TO AN ESIA, ESAP, THE RAP, THE ESMS, OR ANY OSRP..........................................................................................................22
4.5.1 AZERBAIJAN..............................................................................................................22 4.5.2 GEORGIA..................................................................................................................23 4.5.3 TURKEY....................................................................................................................23
5 COMPLIANCE WITH ENVIRONMENTAL STANDARDS AND APPLICABLE ENVIRONMENTAL LAW.............................................................................................23
5.1 SUMMARY OF ANY NOTICES OF NON-COMPLIANCE, REMEDIAL ACTION, ANY FINES OR PENALTIES PAID AND FINAL DISPOSITION OF ANY REGULATORY PROCEEDINGS.....................................................................................................................23 5.2 MONITORING RESULTS............................................................................................23
5.2.1 AZERBAIJAN..............................................................................................................23 5.2.1.1 Ambient Air Quality.......................................................................................23 5.2.1.2 Stack Emissions ...........................................................................................23 5.2.1.3 Noise ............................................................................................................24 5.2.1.4 Effluent .........................................................................................................24 5.2.1.5 Ground and Surface Waters.........................................................................24 5.2.1.6 Waste Management .....................................................................................24
5.2.2 GEORGIA..................................................................................................................24 5.2.2.1 Ambient Air Quality.......................................................................................24 5.2.2.2 Stack Emissions ...........................................................................................25 5.2.2.3 Noise ............................................................................................................25 5.2.2.4 Effluent .........................................................................................................25

Environmental and Social Annual Report 2007
ii
5.2.2.5 Ground and Surface Waters.........................................................................25 5.2.2.6 Waste ...........................................................................................................25
5.2.3 TURKEY....................................................................................................................26 5.2.3.1 Ambient Air Quality.......................................................................................26 5.2.3.2 Stack Emissions ...........................................................................................27 5.2.3.3 Noise ............................................................................................................27 5.2.3.4 Aqueous Discharges ....................................................................................27 5.2.3.5 Groundwater.................................................................................................27 5.2.3.6 Waste Management .....................................................................................27
5.3 STATEMENT OF COMPLIANCE ................................................................................28 5.4 CHANGES IN APPLICABLE ENVIRONMENTAL LAW ..............................................28
5.4.1 EU LEGISLATION.......................................................................................................28 5.4.2 AZERBAIJANI LAW .....................................................................................................29 5.4.3 GEORGIAN LAW ........................................................................................................30 5.4.4 TURKISH LAW ...........................................................................................................30
6 OIL SPILL RESPONSE...........................................................................................31 6.1 SUMMARY OF OSRPs COMPLETED, UPDATED OR AMENDED DURING YEAR.31 6.2 SPILL AND REMEDIATION SUMMARIES .................................................................31
6.2.1 AZERBAIJAN..............................................................................................................31 6.2.2 GEORGIA..................................................................................................................32
6.2.2.1 Contained .....................................................................................................32 6.2.2.2 Uncontained (Released to the environment)................................................32 6.2.2.3 Clean up .......................................................................................................32
6.2.3 TURKEY....................................................................................................................32 6.2.3.1 Contained .....................................................................................................32 6.2.3.2 Uncontained (released to the environment) .................................................33 6.2.3.3 Illegal Taps ...................................................................................................34 6.2.3.4 Remediation .................................................................................................34
6.3 SUMMARY OF MATERIAL MODIFICATIONS TO THE OSRPs ................................35 7 CIP AND EIP PROGRAMMING ..............................................................................35
7.1 SUMMARY OF EIP......................................................................................................36 7.1.1 AZERBAIJAN..............................................................................................................36 7.1.2 EIP IN GEORGIA........................................................................................................36 7.1.3 EIP IN TURKEY .........................................................................................................37
7.1.3.1 EIP External Evaluation................................................................................37 7.1.3.2 Project Status as at End 2007......................................................................39
7.1.4 EIP EXPENDITURES, 2007 ........................................................................................40 7.1.5 EIP BUDGET, 2008...................................................................................................41
7.2 SUMMARY OF CIP PROGRAMMING ........................................................................41 7.2.1 AZERBAIJAN..............................................................................................................43 7.2.2 GEORGIA..................................................................................................................43
7.2.2.1 Operations Phase CIP (CIPII) – Year 1 .......................................................43 7.2.2.2 Operations Phase CIP (CIP II) – Years 2-3 .................................................43
7.2.3 TURKEY....................................................................................................................44 7.2.4 CIP II EXPENDITURES 2007 ......................................................................................44 7.2.5 CIP BUDGET, 2008...................................................................................................45
8 PROJECT COMMUNICATION................................................................................45 8.1 CONSULTATION APPROACH ...................................................................................45 8.2 AZERBAIJAN...............................................................................................................46
8.2.1 PROJECT AFFECTED COMMUNITIES ...........................................................................46 8.2.2 NGOS AND TECHNICAL ORGANISATIONS....................................................................47 8.2.3 GOVERNMENT...........................................................................................................47

BTC Pipeline Project
iii
8.3 GEORGIA ....................................................................................................................47 8.3.1 PROJECT AFFECTED COMMUNITIES ...........................................................................47
8.3.1.1 Complaints....................................................................................................47 8.3.2 NATIONAL NGOS AND TECHNICAL ORGANISATIONS....................................................48 8.3.3 GOVERNMENT MINISTRIES AND DEPARTMENTS ..........................................................48 8.3.4 MEDIA ......................................................................................................................48 8.3.5 DONOR ORGANISATIONS ...........................................................................................49
8.4 TURKEY ......................................................................................................................49 8.4.1 COMPLAINTS.............................................................................................................49 8.4.2 CONSULTATION.........................................................................................................50
8.4.2.1 BIL ................................................................................................................50 8.4.2.2 BTC ..............................................................................................................51
9 LAND ACQUISITION AND COMPENSATION .......................................................52 9.1 AZERBAIJAN...............................................................................................................52
9.1.1 ACQUISITION AND COMPENSATION.............................................................................52 9.1.2 LAND HAND-BACK .....................................................................................................53
9.2 GEORGIA ....................................................................................................................53 9.2.1 ACQUISITION AND COMPENSATION.............................................................................53 9.2.2 LAND REGISTRATION AND OWNERSHIP.......................................................................53 9.2.3 RAP FUND ...............................................................................................................53 9.2.4 LAND HAND-BACK .....................................................................................................54
9.3 TURKEY ......................................................................................................................54 9.3.1 ACQUISITION AND COMPENSATION.............................................................................54 9.3.2 LAND MANAGEMENT DURING OPERATIONS .................................................................54 9.3.3 LAND EXIT ................................................................................................................54 9.3.4 TRANSFER OF LAND RIGHTS......................................................................................55 9.3.5 MISIDENTIFICATION OF CUSTOMARY OWNERS ............................................................55 9.3.6 RAP MONITORING ....................................................................................................56 9.3.7 INTERNAL MONITORING .............................................ERROR! BOOKMARK NOT DEFINED.
10 SUMMARY OF KEY HEALTH AND SAFETY STATISTICS ..................................58 10.1 H&S OUTPUTS (CONSTRUCTION)...........................................................................58 10.2 H&S INPUTS (CONSTRUCTION)...............................................................................59 10.3 H&S STATISTICS........................................................................................................59
11 E&S MONITORING PROGRAMME........................................................................60 11.1 INTERNAL MONITORING...........................................................................................60
11.1.1 AZERBAIJAN..............................................................................................................60 11.1.2 GEORGIA..................................................................................................................61 11.1.3 TURKEY....................................................................................................................62 11.1.4 CROSS COUNTRY INTERNAL MONITORING AND REVIEWS ............................................64
11.2 EXTERNAL MONITORING .........................................................................................64 11.2.1 INDEPENDENT ENVIRONMENTAL CONSULTANTS..........................................................64 11.2.2 SOCIAL AND RESETTLEMENT ACTION PLAN (SRAP) PANEL ........................................64 11.2.3 POLARIS ...................................................................................................................65 11.2.4 TURKEY....................................................................................................................65 11.2.5 HOST GOVERNMENT MONITORING .............................................................................65
11.2.5.1 Azerbaijan.....................................................................................................65 11.2.5.2 Georgia.........................................................................................................66 11.2.5.3 Turkey...........................................................................................................66
11.2.6 NGO MONITORING ...............................................................................................66 11.2.6.1 Azerbaijan.....................................................................................................66 11.2.6.2 Georgia.........................................................................................................66 11.2.6.3 Turkey...........................................................................................................66
Environmental and Social Annual Report 2007
iv
11.3 TRAINING....................................................................................................................66 11.3.1 AZERBAIJAN AND GEORGIA........................................................................................66 11.3.2 TURKEY....................................................................................................................67
APPENDIX 1 ................................................................................................................68 APPENDIX 2: ENVIRONMENTAL MONITORING RESULTS ...................................70
APPENDIX 2.1: AZERBAIJAN..............................................................................................70 2.1A – AMBIENT AIR QUALITY ..............................................................................................70 2.1B – STACK EMISSIONS MONITORING................................................................................70 PSA 2 70 2.1C – ENVIRONMENTAL NOISE............................................................................................70 2.1D – EFFLUENT DISCHARGE MONITORING PROGRAMME.....................................................71 2.1E – GROUNDWATER & SURFACE WATER MONITORING PROGRAMME.................................72 2.1F – WASTE.....................................................................................................................73
APPENDIX 2.2: GEORGIA ...................................................................................................73 2.2A – AMBIENT AIR QUALITY ..............................................................................................73 2.2B – STACK EMISSIONS ....................................................................................................75 2.2C – NOISE......................................................................................................................75 2.2D – EFFLUENT ................................................................................................................78 2. 2E – GROUND AND SURFACE WATERS .............................................................................80 2.2F – WASTE...................................................................................................................101
APPENDIX 2.3: TURKEY ...................................................................................................101 2.3A – AMBIENT AIR QUALITY ............................................................................................101 2.3B – STACK EMISSIONS ..................................................................................................102 2.3C – AQUEOUS DISCHARGES ..........................................................................................105 2.3D – WASTE ..................................................................................................................114
APPENDIX 3: CLOSE OUT STATUS OF ACTIONS RELATED TO NON-COMPLIANCES RAISED THROUGH IEC MONITORING.......................................115
APPENDIX 3A – AZERBAIJAN ACTION STATUS AGAINST AUDIT NON-COMPLIANCES AND RECOMMENDATIONS ...............................................................................................116 APPENDIX 3B – GEORGIA ACTION STATUS AGAINST AUDIT NON-COMPLIANCES AND RECOMMENDATIONS ...............................................................................................116 APPENDIX 3C – TURKEY ACTION STATUS AGAINST AUDIT NON-COMPLIANCES AND RECOMMENDATIONS........................................................................................................117
APPENDIX 4: STATUS OF RECOMMENDATIONS RAISED THROUGH SRAP MONITORING ............................................................................................................120 APPENDIX 5: CLOSE OUT STATUS OF ACTIONS RELATED TO ACTIONS AND RECOMMENDATIONS RAISED THROUGH POLARIS MONITORING...................126 CASE STUDIES
CASE STUDY 1: SUPPORTING CULTURAL HERITAGE AWARENESS AND CONSERVATION, AZERBAIJAN
CASE STUDY 2 MONITORING BIORESTORATION AND EROSION RISK, AZERBAIJAN, GEORGIA & TURKEY
CASE STUDY 3 GIVING GAS AND HOT WATER TO ELVAZLILAR COMMUNITY, AZERBAIJAN
CASE STUDY 4 HELPING TO BUILD A BETTER FUTURE: INFRASTRUCTURE REDEVELOPMENT, GEORGIA
CASE STUDY 5 SECURING INCOME FROM AGRICULTURAL PRODUCTION, GEORGIA
BTC Pipeline Project
v
ABBREVIATIONS ACG - Azeri, Chirag, Gunashli (offshore oil fields) AGI - Above Ground Installation
APLR - Association for the Protection of Landowners Rights AzSPU - Azerbaijan Strategic Performance Unit BWRA - Ballast Water Risk Assessment
bbl - Barrel BIL - Botaş International Ltd
BNB - See RUDF BOD - Biochemical Oxygen Demand BTC - Baku-Tbilisi-Ceyhan Pipeline
BTEX - Benzene, Toluene, Ethyl Benzene and Xylene BVT - Block Valves
BWRA - Ballast Water Risk Assessment CARE - CARE International NGO
CAS - Centre for Archaeological Studies, Georgia CBG - Caucasian Black Grouse CBO - Community Base Organization
CCIC - Consolidated Contractors International Company CHPD - Cultural Heritage Protect Department (of the Ministry of Culture,
Monuments Protection and Sport of Georgia) CIP - Community Investment Programme
CLO - Community Liaison Officer CMT - Ceyhan Marine Terminal CO2 - Carbon dioxide
COD - Chemical Oxygen Demand CWAA - Central Waste Accumulation Area
DAFWC(F) - Days Away From Work Cases (Frequency) dB - Decibel
DSA - Designated State Authority (Turkey) E&S - Environmental and Social
EBRD - European Bank of Reconstruction and Development EDDF - Emergency Drain Down Facility EEMP - Environmental Emissions Management Plan EPPD - Export Pipelines Protection Department (Azerbaijan)
EIA - Environmental Impact Assessment EIP - Environmental Investment Programme
EMS - Environmental Management System ESMS - Environmental and Social Management System
ERA - Environmental Risk Assessment ERM - Environmental Resource Management Ltd ESA - Ecologically Sensitive Area
ESAP - Environmental and Social Action Plan

Environmental and Social Annual Report 2007
vi
ESER - Environmental and Social Evaluation Report ESIA - Environmental and Social Impact Assessment
EU - European Union GEF - Global Environmental Facility GIS - Geographical Information System
GTZ - Deutsche Gesellschaft fur Technische Zusammerarbeit (NGO) H&S - Health and Safety
H1 - First half of year (January – June) H2 - Second half of year (July – December)
HGA - Host Government Agreement HiPo(f) - High Potential Incident (frequency)
HSE - Health, Safety and Environment HSSE - Health, Safety, Social and Environment
IEC - Lenders’ Independent Environmental Consultant IFC - International Finance Corporation IFI - International Finance Institution
IPLOCA - International Pipeline and Offshore Contractors Association IPT - Intermediate Pigging Station (Turkey) ISO - International Standards Organisation
IUCN - International Union for Conservation of Nature and Natural Resources
KP - Kilometre Point KPI - Key Performance Indicator
LSTKA - Lump Sum Turn Key Agreement MENR - Ministry of Ecology and Natural Resources (of Azerbaijan) MoEF - Ministry of Environment and Forestry, Turkey
MoENR Ministry of Energy and Natural Resources, Turkey mmbd - Millions of Barrels per Day MOC - Management of Change MoE - Ministry of Environment (Georgia) MOL - Main Oil Line
NACRES - Noah’s Ark Centre for Recovery of Endangered Species (NGO) NDVI - Normalised Difference Vegetation Index NGO - Non-Governmental Organisation NOx - Nitrogen Oxides
OMP - Offset Management Programme OSR - Oil Spill Response
OSRP - Oil Spill Response Plan PCR - Public and Community Relations PEIP - Project Environmental Investment Plan
PM - Particulate Matter PSA - Pump Station, Azerbaijan PSG - Pump Station, Georgia
PT - Pump Station, Turkey

BTC Pipeline Project
vii
PTW - Permit to Work Q1/Q2/Q3/Q4 - Quarter 1 / Quarter 2 / Quarter 3 / Quarter 4
RAP - Resettlement Action Plan RDI - Regional Development Initiative
RINJ - Recordable Injuries ROW - Right of Way
RUDF - Rural and Urban Development Foundation (now called BNB) SARMS - Special Area Reinstatement Method Statement
SCP - South Caucasus Pipeline SESMeke - Joint Venture between SES and Meke Marine,
SIF - Small Investments Fund SLAP - Supplementary Land Acquisition Programme SLIP - Supplementary Lenders Information Pack
SLCC - State Land and Cartography Committee SME - Small and Medium Enterprises SO2 - Sulphur Dioxide
SOC - Safety Observations and Conversation SPJV - (Amec) Spie Petrofac Joint Venture SRAP - Social and Resettlement Action Plan
STP - Sewage Treatment Plant TOC - Total Organic Compound TPH - Total Petroleum Hydrocarbons
TVA(R) - Traffic Vehicle Accident (Rate) UN - United Nations
UNDP - United Nations Development Programme VOC - Volatile Organic Compound VPI - Vulnerable People Initiative
WHO - World Health Organisation WWTP - Waste Water Treatment Plant


BTC Pipeline Project
1
1 EXECUTIVE SUMMARY BTC Co. (hereinafter BTC) and its agents have complied in the development, construction and operation of the BTC Project with the Environmental and Social Action Plan (ESAP), applicable Environmental Laws and applicable Lender Environmental Policies and Guidelines in all material respects during the period covered by this report. There were no fines or penalties incurred for environmental or social non-compliances, and no material environmental claims against BTC during 2007.
All non-compliances that were identified during Independent Environmental Consultant (IEC) and Social and Resettlement Action Plan (SRAP) audits in 2007 are detailed in the Appendices of this report. Information is also given on the actions developed and implemented to address these non-compliances.
Two ESIA addendum documents were prepared during 2007. In September 2007 the ESIA Addendum for a new accommodation camp at PSA2 was approved by MENR. The camp is due to become operational in 2008-2Q. Also in September an ESIA Addendum to the BTC Azerbaijan ESIA was submitted to MENR for the Interim Routine Right of Way Access Strategy. This document describes how BTC intends to deliver its commitment of no routine driving on the Right of Way (ROW).
Eight Class III changes were submitted to lenders for approval; five in Azerbaijan and three in Georgia. All changes were related to the management of wastes.
In November Azerbaijan and Georgia were the subject of an ISO14001 pre-certification audit, with full certification planned for 2008.
Emissions monitoring for the operations phase continued in Azerbaijan and Georgia and results were generally in compliance. Monitoring of gas turbine exhaust gases was carried out for the first time in November and December. This showed emissions above project limits for NOx and CO, due to the gas turbines operating below their design load. Simultaneous ambient air monitoring confirmed that there was no breach of ambient air quality standards from these emissions.
Ten minor uncontained hydrocarbon (crude, diesel and lube oil) releases were reported in 2007, of which two were in excess of one barrel in volume. These were both as a result of third party actions.
BTC continued to benefit communities in all three countries through their Community Investment Programmes and Environmental Investment Programmes. In 2007 over $10 million was invested in these programmes.
2 INTRODUCTION The staged linefill of BTC with oil commenced from Sangachal Terminal near Baku on 18th May 2005, and crossed the Georgian Turkish border on 18th November 2005. Oil reached Ceyhan Marine Terminal (CMT) on 28th May 2006. A total of 10 million barrels of oil, from the Azeri-Chirag-Gunashli (ACG) fields in the Azerbaijani sector of the Caspian Sea, was required to fill the pipeline. The first shipment of oil sailed from the Mediterranean coast in the British Hawthorn tanker on 4th June 2006.
During 2006 the transition from the construction ‘Project’ team to the Operations team commenced.
Transition to Operations is now effectively complete, although some project legacy issues remain.
Environmental and Social Annual Report 2007
2
This BTC Annual Environmental and Social (E&S) Report has been prepared and structured in accordance with the requirements of Annex J of the ESAP governing construction of BTC and Annex H of the ESAP governing the operations phase of BTC. These requirements are reproduced in Appendix 1.
It is the fourth Annual E&S Report post-financing and covers the calendar year 20071.
3 ESIAs / EIA AND PERMITTING
3.1 SUMMARY OF ANY MATERIAL MODIFICATIONS TO THE ESIAs2
3.1.1 Azerbaijan 3.1.1.1 Construction and Operation of a Camp at PSA2
An addendum to the BTC Azerbaijan ESIA was prepared for a new accommodation camp at PSA2. This camp will serve 40 people and occupies 1 ha of land immediately to the south of the PSA2 site. The site is owned by BTC. The ESIA Addendum was approved by MENR in September 2007. The camp is due to become operational in 2008-2Q.
3.1.1.2 Interim Routine Right of Way Access Strategy An addendum to the BTC Azerbaijan ESIA was prepared for the Interim Routine ROW Access Strategy. This document describes how BTC intends to deliver its commitment of no routine driving on the ROW. It considers driving by both BP Operations and also Azerbaijan Government Export Pipelines Protection Department (EPPD). The ESIA Addendum was submitted to MENR in September 2007.
3.1.1.3 BTC Expansions BTC owners have agreed to evaluate the expansion of the existing BTC system, for the purpose of transporting additional volumes of crude oil. An update of developments relating to the proposed expansion is discussed in Section 3.1.4.
3.1.2 Georgia No formal Addenda to the BTC Georgia ESIA were submitted in 2007. For details of activities relating to the proposed expansion of the BTC system, see Section 3.1.4.
3.1.3 Turkey No formal Addenda to the BTC Turkey EIA were submitted in 2007. For details of activities relating to the proposed expansion of the BTC system, see Section 3.1.4.
3.1.4 Cross-Country Permitting Activity related to the Expansion of BTC The BTC Host Government Agreements (HGA) in each country already envisage an expansion of the existing BTC System. As such the BTC shareholders have agreed to investigate expanding the existing system for the purpose of transporting additional volumes of crude oil originating principally in Azerbaijan and the North Caspian. The first phase of expansion is to 1.2 million barrels per day (mmbd) by means of injecting a Drag Reduction Agent (DRA). At the end of 2007 this project was in Define Stage3 and dialogue with the regulatory authorities has taken place as follows:
• In Azerbaijan and Georgia no extension beyond existing site boundaries is needed to enable an increase in throughput to 1.2 mmbd and it was therefore agreed with the regulator that no ESIA Addenda were required. However, a project description
1 While construction started in 2003-Q2, the financing for the project was finalised in early 2004-Q1. 2 Environmental and Social Impact Assessment. Note that in Turkey the formal terminology is EIA (Environmental Impact Assessment). 3 BP projects are divided into five main stages: Appraise, Select, Define, Execute and Operate. The first three stages correspond to the initiation, planning and design of a project and execute corresponds to the implementation of the Project.

BTC Pipeline Project
3
together with updated Environmental Risk Assessments (ERA), were submitted to both governments in the third and fourth quarters of 2007. Workshops were also held to support and explain the documentation.
• In Turkey, the proposed expansion to 1.2 mmbd will require minor expansion outside the existing site boundary at two block valves (BVT 48 and BVT 50) and will increase shipping traffic and loading of crude at Ceyhan Marine Terminal. For these reasons it was agreed with the regulators that a Preliminary EIA report would be prepared (also supported by the ERA and Oil Spill Response Capability documents)4. This document package was submitted in the fourth quarter of 2007. A response is expected in January 2008.
A document package consistent with that submitted to the regulatory authorities, together with a Management of Change (MOC) Note will be submitted to the Lenders and their environmental consultants in 2008.
3.2 SUMMARY OF MATERIAL PERMITS ISSUED IN 2007 BTC Operations related permits acquired in 2007 are as follows:
• Akhaltsikhe Camp Mineral Extraction License Water abstraction from the Akhaltsikhe Camp bore well • PSG 1 Camp Water Discharge Permit Discharge permit and limits of waste water from PSG 1 Camp Sewage Treatment
Plant • PSG 1 – PSG 1 Camp – PSG 2 Camp – Mineral Extraction License Water abstraction from PSG 1, PSG 1 Camp and PSG 2 Camp bore wells • PSG 2 Camp Water Discharge Permit Discharge permit and limits of waste water from PSG 2 Camp Sewage Treatment
Plant Other support permits were as follows:
• Environmental Impact Permit Sanitary Permit issued to Contractor Sanitary by MoE allowing Disposal of solid domestic,
toxic and hazardous waste at Iagluja landfill and PSG1 • Ghudushauri Hospital Environmental Impact Permit Permit issued to subcontractor Ghudushauri Hospital by MoE for medical Waste
Burning (Neutralization) in Incinerator • Kodiana Security Base Water Discharge Permit Discharge permit and Limits for sewage discharge into Surface Water from Security
base Sewage Treatment Plant • Water Abstraction Permit Triquest Tabatskuri Water abstraction by contractor Triquest from lake Tabatskuri for construction of
AGI access roads • In 2006 application was made for Building Use Permits for Residency Elements of
Pump Stations, by BIL on behalf of Botaş. The permits have been issued for CMT (including the jetty) and PT4. The CMT permit was obtained in 2006 and transferred to BIL in 2007. The PT4 permit was obtained in November 2007. The remainder of the permits have not yet been issued due to an unresolved matter between Botaş and the related Ministry. Meetings are on-going between the three parties (BIL, Botaş and the Ministry) to resolve the issue as soon as possible. BTC is monitoring the issue.
• Preliminary and Highway Connection permit for Access Roads for Block Valve Stations 48, 49 and 50 were obtained in March 2007. The application was made in June 2006 as per the other Block Valve Stations; however there was a delay in the administration of the permit.
4 It was subsequently confirmed by the Turkish Ministry of Environment and Forestry on 29th January 2008 that the preliminary EIA report was sufficient and that a full EIA Addendum was not required.

Environmental and Social Annual Report 2007
4
• Discharge permits for the Operations Waste Water Treatment Plants for PT1, PT2, PT3, PT4 and CMT were obtained in March, January, April, February and April 2007, respectively.
• Opening and Operation Permit (Non-Hygienic Establishments) applications for permanent permits were made for each major AGI and the pipeline in 2007. Permanent permits have been obtained for the pipeline and major AGIs in Osmaniye, Kayseri, Gumushane and Kars Provinces. Other permanent permits are being progressed however Turkish authorities have advised that while the application process is in progress Operations are legal under the temporary Operations permits that were obtained in 2006/07.
• A water abstraction permit was obtained for the ground-water well near the CMT facility (Yanikdegirmen well) in February 2007.
• Preliminary Emissions Permits for Fuel Burning Plants: Applications for all facilities completed in 2007. Provincial Environmental Directorates reviewing applications and undertaking on-site reviews as part of approval process. Process is on-going.
3.3 UPDATE ON STATUS OF PROJECT SPECIFIC REQUIREMENTS FOR FURTHER WORK UNDER THE ESIAs OR PERMITS A summary of country-specific activities relating to ongoing studies or surveys as required under the ESIAs or permits is given below. Studies or surveys noted as completed in the 2006 Annual report are not shown.
3.3.1 Azerbaijan The only ‘Additional ESIA Study and Survey’ as specified in the Operations ESAP relates to groundwater monitoring programme.
Study/Survey: Groundwater Monitoring Programme
Expected Timing: Monitor water level and quality: Ongoing
Ref: 2004-Q1 (p5-3); 2004-Q2 (p3-3); 2004-Q3 (p3-2); 2004-Q4 (p3-2); 2005-Q1 (p3-2); 2005-Q2 (p3-2); 2005-Q3 (p3-2); 2005-Q4 (p3-1), 2006-H1 (p3-1) 2007: Groundwater monitoring was carried out in May 2007 and November 2007. A summary of results is given in Section 5.2.2.5 and the data sheets are given in Appendix 2.1e Completion Status: ONGOING
In the Construction ESAP there was a requirement to translocate Iris acutiloba off the ROW prior to construction. This requirement was fulfilled, and monitoring of the success of the relocation was ongoing in 2007. Similarly, Cultural Heritage programme Phase V (Analysis and Reporting) was ongoing during 2007. A summary of the results of both these surveys are given below:
Study/Survey: Iris acutiloba Monitoring Programme
Expected Timing: Monitoring: Ongoing
Ref: 2004-Q1 (p5-2); 2004-Q2 (p3-2); 2004-Q3 (p3-1); 2004-Q4 (p3-2); 2005-Q1 (p3-1); 2005-Q2 (p3-2); 2005-Q3 (p3-1); 2005-Q4 (p3-1), 2006-H1 (p3-1) Field surveys were carried out to assess Iris acutiloba survival rates in May 2007 and in September 2007. During both of these surveys very little above ground evidence of the plants was visible. However, excavations of a selection of bulbs during the September survey revealed that approximately 40% of bulbs remained viable. It is not uncommon for transplanted bulbs to remain dormant for 2 or 3 years after transplantation. Another survey shall be conducted in Q1 2008 to determine numbers of bulbs which have sprouted. Completion Status: ONGOING

BTC Pipeline Project
5
Study/Survey: Cultural Heritage – Archaeology Phase V (Analysis and Reporting)
Expected Timing: Phase V: Ongoing
Ref: 2004-Q3 (p3-2); 2004-Q4 (p3-2); 2005-Q1 (p3-2), 2005-Q2 (p3-2); 2005-Q3 (p3-2); 2005-Q4 (p3-1); 2006-H1 (p3-1)
Work continues in association with the Institute of Archaeology and Ethnology. Refer to Case Study 1. Completion Status: ONGOING
3.3.2 Georgia Some of the commitments of the construction ESAP and requests from the Government of Georgia entailed the construction of additional pipeline facilities like the Emergency Drain Down Facility (EDDF), the Security Base and the Secondary Containment facilities in the Kodiana region. Environmental and social evaluation reports were completed for these facilities. These and other project deliverables are categorized as BTC / SCP Legacy Projects. Implementation of the Legacy Projects commenced in 2006 and continued passed 2007-Q4.
The only ‘Additional ESIA Study and Survey’ specified in the Operations ESAP relates to the groundwater monitoring programme.
Study/Survey: Aquifer Monitoring Wells
Expected Timing: Monitoring: Operations
Ref: 2004-Q1 (p5-7); 2004-Q2 (p3-5); 2004-Q3 (p3-4); 2004-Q4 (p3-4); 2005-Q1 (p3-4); 2005-Q2 (p3-4); 2005-Q3 (p3-3); 2005-Q4 (p3-3); 2006-H1 (p3-2); 2006 – Operations Phase (p5) Drilling and installation of wells for groundwater testing began in 2005-Q2 and sampling was carried out in 2005-Q3, 2006-Q2, 2006-Q3, and again in 2007-Q2 and 2007-Q3. Discussions held with Government of Georgia at the end of 2007 led to a reduction of monitored parameters, which will come into effect in 2008. More details on results of 2007 monitoring rounds are given in Section 5.2.2.5 and Appendix 2.2e of this report. Completion Status: ONGOING
Study/Survey: Monitoring of Translocated Red Data Book Species
Expected Timing: Monitoring: Operations
Ref: 2004-Q1 (p5-5); 2004-Q2 (p3-4); 2004-Q3 (p3-3); 2004-Q4 (p3-3); 2005-Q1 (p3-3); 2005-Q2 (p3-3); 2005-Q3 (p3-3); 2005-Q4 (p3-2); 2006-H1 (p3-2) BTC committed to undertake the necessary steps to protect, conserve and encourage the growth of fourteen identified endangered plant populations through ex-situ conservation and subsequent reintroduction into the wild during reinstatement. Activities in 2007 included routine maintenance and plant cultivation. Results continue to indicate a high survival rate for translocated plants. Reintroduction into the wild is planned for 2008-Q2. Monitoring for survivability is due to begin during 2009-Q2. Completion Status: ONGOING
Study/Survey: Cultural Heritage Phase IV: Archaeological Late Finds Phase V: Analysis and Reporting
Expected Timing: Monitoring: Operations
Ref: 2004-Q2 (p3-5); 2004-Q3 (p3-4); 2004-Q4 (p3-3); 2005-Q1 (p3-4); 2005-Q2 (p3-4); 2005-Q3 (p3-3); 2005-Q4 (p3-2); 2006-H1 (p3-2) The “Archaeology Claims Agreement” was signed by BTC/SCP and Georgia National Museum in August 2007. The agreement states that damaged sites along the ROW are to be effectively preserved in situ and that direct compensatory funding for damages should be directed towards additional archaeological investigations, improving laboratory/storage facilities for cultural materials from archaeological sites recorded in association with AGT Project, and publication of major and important research.

Environmental and Social Annual Report 2007
6
Additionally there are two off-ROW sites, damaged during the construction phase. These excavations will be funded because of their location; they are under a high risk of additional damage due to their exposure. The Architectural sites agreement with Cultural Heritage Protect Department of the Ministry of Culture, Monuments Protection and Sport of Georgia (CHPD) was signed in May 2007. Following joint visits to the architectural sites by CHPD and BP Georgia Cultural Heritage team, a report was received from CHPD stating their conclusion that no damages to these monuments occurred during the construction phase of AGT project. Archaeological Technical Reporting was completed in December 2007. All 11 Comprehensive Technical Reports were received from the Centre of Archaeology of Georgia National Museum. The reports were translated into English and revised and edited by an external expert Prof. Michael Vickers (Oxford, UK). Construction activities are still ongoing, including the Kodiana Special Projects (Emergency Drain Down Facility, Secondary Containment construction etc.) and the Roads program. An additional heritage field officer was hired to monitor construction activities during the Summer. Completion Status: COMPLETED/ONGOING
Study/Survey: Kodiana Special Projects and Other Legacy Projects
Expected Timing: Monitoring: Projects / Operations
Ref: 2006-H1 (p3-2) In order to fulfil the commitments made under the Construction ESAP, construction of the Kodiana Emergency Drain Down Facility (EDDF) and Security Base continued throughout 2007. 69% and 74% of the works were completed at EDDF and Security Base respectively by the end of 2007 and both facilities are expected to be completed by 2008-Q3. Construction of the secondary Containment facilities is expected to commence during 2008-Q1. Marneuli Camp was reinstated (70%) while Tsalka camp was decommissioned and handed back to the local community (school section) and land users. Completion Status: ONGOING
Study/Survey: BTC / SCP Biorestoration
Expected Timing: Monitoring: Operations
Ref: 2006-H1 Under the Construction ESAP, BTC committed to undertake the necessary steps to reinstate areas disturbed during construction to pre-existing conditions. Part of this commitment involved planting and seeding. The first phase of the planting and seeding campaign was completed in 2007-Q4. Monitoring for survivability shall begin during 2008-Q2. Completion Status: COMPLETED
3.3.3 Turkey Five ‘Additional Studies and Surveys’ as required in the Construction ESAP continued in 2007. Two of these (Marine Turtle Survey and Marine Ecological Survey) are also required in accordance with the Operations ESAP.
Study/Survey: Special Area Reinstatement Method Statement and associated surveys
Expected Timing: Construction
Ref: 2004-Q1 (p5-9); 2004-Q2 (p3-6/7); 2004-Q3 (p3-5); 2004-Q4 (p3-5); 2005-Q1 (p3-4); 2005-Q2 (p3-4); 2005-Q3 (p3-4); 2005-Q4 (p3-4); 2006 Annual (p6) Following all reviews and rehabilitation works completed in Ecologically Sensitive Areas (ESAs), the ESA Vegetation Cover Recovery Trend (15 ESAs), Vegetation Cover (40 ESAs) and potential erosion performance (for each ESA) was assessed as part of the ROW Vegetation Monitoring described in Section 3.4. Results of analyses will be communicated to BIL for necessary action as part of the 2008 ROW monitoring programme. Completion Status: ONGOING (but will be reported in 2008 as part of general ROW vegetation monitoring)

BTC Pipeline Project
7
Study/Survey: Landscape Plans and Monitoring for Facilities
Expected Timing: Landscape monitoring ongoing until planting is established.
Ref: 2005-Q1 (p3-4); 2005-Q2 (p3-4); 2005-Q3 (p3-4); 2005-Q4 (p3-4) ; 2006 Annual (p6)
Landscape enhancements are on-going at facilities in accordance with findings of BTC 2006 review. Monitoring of landscape status will be undertaken again in 2008. Completion Status: ONGOING
Study/Survey: Water Supply Sustainability Studies For Groundwater and Surface Water Supplies for Temporary and Permanent Facilities
Expected Timing: Studies completed for temporary and permanent facilities. Monitoring ongoing (additional studies may be required depending upon actual water draw demand and results of monitoring).
Ref: 2005-Q1 (p3-4); 2005-Q2 (p3-4); 2005-Q3 (p3-4); 2005-Q4 (p3-4); 2006-H1 (p3-3), 2006 Annual (p7)
BTC developed a Groundwater Monitoring Strategy on behalf of BIL and is assisting BIL to implement the strategy. Completion Status: ONGOING
Study/Survey: Marine Turtle Survey
Expected Timing: Operations
Ref: 2004-Q1 (p5-10); 2004-Q2 (p3-8); 2004-Q3 (p3-6); 2004-Q4 (p3-5); 2005-Q1 (p3-5); 2005-Q2 (p3-6); 2005-Q3 (p3-6); 2005-Q4 (p3-5); 2006-H1 (p3-4), 2006 Annual (p7-8).
The annual marine turtle survey was conducted by DOKAY between June and September 2007. As in previous years the survey was carried out on four small beaches near CMT. In 2007 a total of 57 Chelonia mydas (Green Turtle) and one Caretta caretta (Loggerhead Turtle) nests were found in the study area. In addition 112 observations of non-nesting green turtles and four observations of non-nesting loggerhead turtles were recorded. A summary of the number of nests observed in 2007 compared with previous years is as follows: 2002 2003 2004 2005 2006 2007 Green Turtle 42 44 118 29 198 57 Loggerhead Turtle 18 3 3 7 0 1 The number of nests observed in 2007 was a third of the number observed in 2006. This is in keeping with previously surveyed fluctuations in nesting patterns and is thought to relate to a natural biological nesting cycle of the Green turtle. This year’s hatchling success was quite high despite the lower nest numbers (overall hatchling success was 82.3%). The predators’ profile was same as that of last year. As reported previously no backward hatchling disorientation due to the presence of lights on the Botaş and CMT jetties was observed when the hatchlings were making their way from the nest to the sea Completion Status: ONGOING
Study/Survey: Marine Ecology Survey
Expected Timing: Operations
Ref: 2006 Annual (p8).
The objective of the survey was to repeat the marine ecology surveys completed in 2001 and 2005 at CMT and compare the results to determine any changed conditions in Iskenderun Bay. The survey was carried out by DOKAY in July 2007 in the vicinity of the BTC Jetty and the coastal zones on both sides of the jetty. The study comprised benthic and water column community assessments, plankton assessments and a fish survey. In summary, the results of the 2007 survey are similar to findings of the 2005 survey and there was no evidence of significant changes in the marine ecology since 2005. There are differences observed between the 2001 and 2005/2007 surveys but this has been attributed to differences in applied method and season in which the surveys were undertaken. Completion Status: ONGOING
Environmental and Social Annual Report 2007
8
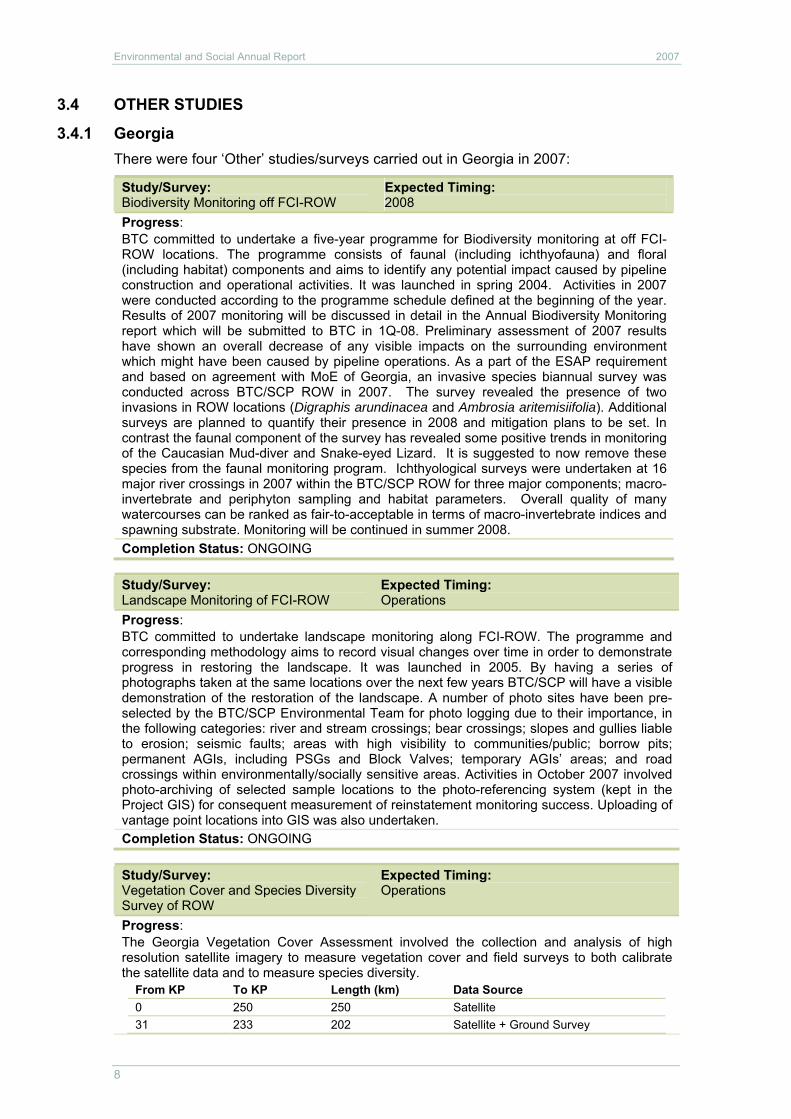
3.4 OTHER STUDIES
3.4.1 Georgia There were four ‘Other’ studies/surveys carried out in Georgia in 2007:
Study/Survey: Biodiversity Monitoring off FCI-ROW
Expected Timing: 2008
Progress: BTC committed to undertake a five-year programme for Biodiversity monitoring at off FCI-ROW locations. The programme consists of faunal (including ichthyofauna) and floral (including habitat) components and aims to identify any potential impact caused by pipeline construction and operational activities. It was launched in spring 2004. Activities in 2007 were conducted according to the programme schedule defined at the beginning of the year. Results of 2007 monitoring will be discussed in detail in the Annual Biodiversity Monitoring report which will be submitted to BTC in 1Q-08. Preliminary assessment of 2007 results have shown an overall decrease of any visible impacts on the surrounding environment which might have been caused by pipeline operations. As a part of the ESAP requirement and based on agreement with MoE of Georgia, an invasive species biannual survey was conducted across BTC/SCP ROW in 2007. The survey revealed the presence of two invasions in ROW locations (Digraphis arundinacea and Ambrosia aritemisiifolia). Additional surveys are planned to quantify their presence in 2008 and mitigation plans to be set. In contrast the faunal component of the survey has revealed some positive trends in monitoring of the Caucasian Mud-diver and Snake-eyed Lizard. It is suggested to now remove these species from the faunal monitoring program. Ichthyological surveys were undertaken at 16 major river crossings in 2007 within the BTC/SCP ROW for three major components; macro-invertebrate and periphyton sampling and habitat parameters. Overall quality of many watercourses can be ranked as fair-to-acceptable in terms of macro-invertebrate indices and spawning substrate. Monitoring will be continued in summer 2008. Completion Status: ONGOING
Study/Survey: Landscape Monitoring of FCI-ROW
Expected Timing: Operations
Progress: BTC committed to undertake landscape monitoring along FCI-ROW. The programme and corresponding methodology aims to record visual changes over time in order to demonstrate progress in restoring the landscape. It was launched in 2005. By having a series of photographs taken at the same locations over the next few years BTC/SCP will have a visible demonstration of the restoration of the landscape. A number of photo sites have been pre-selected by the BTC/SCP Environmental Team for photo logging due to their importance, in the following categories: river and stream crossings; bear crossings; slopes and gullies liable to erosion; seismic faults; areas with high visibility to communities/public; borrow pits; permanent AGIs, including PSGs and Block Valves; temporary AGIs’ areas; and road crossings within environmentally/socially sensitive areas. Activities in October 2007 involved photo-archiving of selected sample locations to the photo-referencing system (kept in the Project GIS) for consequent measurement of reinstatement monitoring success. Uploading of vantage point locations into GIS was also undertaken. Completion Status: ONGOING
Study/Survey: Vegetation Cover and Species Diversity Survey of ROW
Expected Timing: Operations
Progress: The Georgia Vegetation Cover Assessment involved the collection and analysis of high resolution satellite imagery to measure vegetation cover and field surveys to both calibrate the satellite data and to measure species diversity.
From KP To KP Length (km) Data Source 0 250 250 Satellite 31 233 202 Satellite + Ground Survey

BTC Pipeline Project
9
Vegetation Cover Assessment QuickBird satellite data were acquired over the ROW and timed to coincide as far as possible with peak growing season. This data set was processed to generate a Normalised Difference Vegetation Index (NDVI) at a resolution of 2.4m. The NDVI analysis is a common remote sensing technique used to map vegetation cover and is not an intrinsic physical quantity, but a measure of reflectance over a scale of -1 to +1. It is therefore necessary to calibrate NDVI values using data collected in the field. To collect this field data, a stratified random sampling approach was used to locate 40 transects across the areas of interest. Percentage vegetation cover was then measured along these transects using a set of quadrats, at approximately the same time as the satellite data was acquired. Data from the quadrats and corresponding NDVI values were then used to develop a regression model which in turn was used to develop vegetation cover estimates in all non-agricultural areas (including those not sampled in the field) where construction activities caused a disturbance to natural vegetation. The results will be used in future years as a benchmark to assess trends in vegetation re-growth. The result was a set of vegetation cover maps for the 19 different types of habitats of interest, generated from the calibrated NDVI data together with ground survey data.
For more details see Case Study 2 and Section 4.4.
Species Diversity Assessment The primary method for determining species diversity was through field sampling. Sampling locations were initially determined randomly, although a proportional representation approach was adopted to ensure appropriate inclusion of all habitats and sensitive areas. The assessment involved the collection of data from 50 transects along the entire pipeline length in Georgia. The number of sampling sites is being reviewed based on an assessment of the habitat representativeness, specifically in terms of species variability as this is the key factor when relating sample size and statistical significance. Wetlands sample plot sites were excluded from the random selection process due to the absence of those similar to adjacent off ROW areas. Completion Status: ONGOING
Study/Survey: Botanical Survey of South Georgian Wetlands
Expected Timing: 2007-2009
Progress: To mitigate pipeline construction related impacts of wetland plots within the BTC/SCP ROW an agreement was reached between BTC and the Ministry of Environment of Georgia. Based on this an alternative compensatory measure was developed - implementation of botanical surveys of wetlands in southern Georgia aimed at identification of a high conservation value site to be proposed to the Ministry for Protection of Environment and Natural Resources of Georgia as a potential protected area. Consequently it was decided to undertake detailed botanical surveys of wetlands in the volcanic plateau of southern Georgia in order to identify a wetland ecosystem of high conservation value within this geomorphological zone. Completion Status: ONGOING
3.4.2 Turkey Eight ‘Other’ studies were carried out in 2007. A summary of these is as follows:
Study/Survey: Fauna Survey (Caucasian Black Grouse) at ESA1
Expected Timing: Until mid-2008
Ref: 2005-Q3 (p3-8), 2005-Q4 (p3-6), 2006-H1 (p3-5), 2006 Annual (p8)
Six monitoring field visits were carried out in 2007. The original purpose of the monitoring5 was to better understand breeding dynamics during the project identified seasonal constraint period, however the scope of the study has been expanded to cover general behaviour
5 The first phase of the Fauna Survey (Caucasian Black Grouse) at ESA1 was completed in 2005.

Environmental and Social Annual Report 2007
10
dynamics of the local Black Grouse population. Radio telemetry equipment was used in all of the surveys. This technology has improved the quality of the monitoring programme. Currently it is too early to report on any definitive findings. The surveys will continue until mid-2008. The results will be presented in the 2008 Annual Report. Completion Status: ONGOING
Study/Survey: Vegetation Cover, Vegetation Cover Recovery Trend and Potential Erosion Performance Assessments by satellite imagery and field assessment
Expected Timing: Operations
QuickBird, Ikonos and Spot satellite data were acquired for almost the entire pipeline in 2007 and timed to coincide as far as possible with the peak growing season. Vegetation Cover Assessment, Vegetation Cover Recovery Trend and Potential Erosion Performance Assessments were carried out. Analyses were conducted in non- developed areas (as distinct from agricultural areas). The study involved two main activities; (1) field measurements in order to calibrate and verify the satellite imagery and (2) image analysis; analysis of high resolution satellite imagery to define vegetation cover. For further details on the method and results, see Case Study 2. See also Section 4.4. Completion Status: ONGOING
Study/Survey: Soil Fertility Assessment
Expected Timing: Operations
Soil fertility assessments were carried out primarily in ESAs in order to address the concerns raised by the IEC. The survey concluded that the nutrient levels of soils have been reduced at certain locations along the pipeline and some sections would benefit from nutrient supplements. The analysis prioritized the nutrients and locations and concluded that nitrogen is the most essential nutrient in the initial establishment of vegetation cover. As a result about 70-80 kg/hectare of nitrogen fertilizer will be applied to a total length of about 40 kilometres, primarily in ESAs at about 10 locations. Completion Status: COMPLETED
Study/Survey: Tree and Shrub Survival Monitoring
Expected Timing: Operations
The survey covered the entire pipeline, on a randomly selected sampling basis. All of the offset planting areas and 15 on-ROW sample points (2 locations in Lot A, 4 in Lot B, and 9 in Lot C) in 2006 and 31 (9, 6, 16 in Lot A, B and C, respectively) were monitored in 2007. The sample sites were distributed across different tree and scrub habitats according to the habitat’s relative variability, sensitivity and length. The following information was assessed: • The number and type (species) of planted a) trees and b) shrubs; • The number (and hence percentage) of a) trees and b) shrubs that show clear signs of life
(e.g., buds, leaves, evidence of a green vascular cambium); • Likely reason(s) for plant deaths/success; • Recommendations for intervention/ plant replacement. The overall on-ROW tree and shrub survival rate, which was determined on a sampling basis, was about 30%. The major factor negatively influencing the success of planted tree and shrub survival was observed to be stemming from anthropogenic sources or related activities (i.e. grazing, agriculture). Grazing was the major reason for low survival rates in Lot A. Lot C was influenced by grazing, agricultural and other (e.g. access roads) human activities almost equally. In Lot B poor species selection and planting technique (e.g. planting the saplings with their plastic tubes, planting under snow) dominated over other anthropogenic activities in terms of factors contributing to poor survival rates. Relatively harsh climatic conditions in Lot B were determined to be another important factor having a negative affect on survival rates.

BTC Pipeline Project
11
The overall off-ROW offset area tree and shrub survival rate was assessed as 70%. These areas are remote from the ROW. The areas which demonstrated the highest success rate are the areas that are protected and maintained by the Ministry of Environment and Forestry. Mitigation measures for on and off-ROW tree and shrub establishment are being considered. Completion Status: ONGOING
Study/Survey: Sediment Quality Survey
Expected Timing: Operations
The annual sediment quality survey at Ceyhan was conducted by DOKAY in July 2007. As per the previous surveys 12 sediment samples were taken and analysed for Total Petroleum Hydrocarbons (TPH), trace metals, benthic populations and other chemical and physical properties. Key results are as follows: • Concentrations for Hg (mercury), Cd (cadmium), Pb (lead), Cu (copper), Al (aluminium),
Cr (chromium) and Zn (zinc) in all of the sediment samples were below the established international and national guideline values and other literature values. Al, Cd, Cr, Pb concentrations were slightly lower than 2006 levels. Hg, Cu, Sn concentrations increased while Fe and Zn concentrations were measured at much the same levels at all stations as in 2006. According to the results, the measured trace metal concentrations in 2007 are close to 2005 measurements.
• Sn (tin), Fe (iron) concentrations of sediment samples were measured above the international guideline values. The main pollution sources of Sn in the marine environment are antifouling materials. The BTC Project does not use anti-fouling paints on the jetty. However ships accessing the port use anti-fouling paints on their hulls. Other sources of Sn pollution may be the agricultural activities in the Cukurova plain and Iskenderun area. The 2004 Sn value is higher than 2005, 2006 and 2007 and Sn concentrations show a decrease since 2004. Higher Fe concentrations were measured at relatively outer parts of the Gulf towards Iskenderun metropolitan. Anthropogenic sources of Fe include industrial effluents (burning of coke and coal). Existing industrial facilities may cause high level of Fe concentrations. These will continue to be monitored.
• Despite the higher measured concentrations for Sn and Fe there is an overall decrease in Trace Metal values.
• When Gasoline Range Organics (GRO) Total Petroleum Hydrocarbon (TPH) measurements for 2007 are compared with the 2005 and 2006 studies there are no significant changes. At all stations TPH GRO was measured at less than 1mg/kg, suggesting little or no GRO TPH pollution.
• The Diesel Range Organics (DRO) TPH limits were measured at less than 10mg/kg at all stations except at two where the limit was at around 16mg/kg. DRO TPH limits were significantly lower than 2005 and 2006 limits at six of the sample stations but this was attributed to the change of sediments at these stations from fine mud clays to calcareous course sediments. At the stations where no sediment changes were observed DRO TPH limits were approximately the same as 2006.
• Physical properties of water samples were within normal ranges for this area of the Mediterranean Sea when compared to reference values and guidelines.
Completion Status: ONGOING
Study/Survey: Waste Water Feasibility Survey
Expected Timing: Operations
A waste water feasibility study was undertaken by BTC on behalf of BIL by a BP waste water consultant in May 2007. The purpose of the survey was to determine how the Project could improve the operability of the waste water treatment plants to provide more consistent discharge results in accordance with Project standards. This involved a complete review of all waste water treatment plants at each facility location. Three phases of system modifications were recommended after the review to fit within the context of the on-going Project enhancements. Immediate, mid-term and long-term recommendations were made. Immediate improvements included recommendations to improve control of the existing equipment, mid-term improvements considers installation of tertiary treatment systems) and the long-term plan considers the eventual phase out and replacement of existing Waste Water Treatment

Environmental and Social Annual Report 2007
12
Plants. The study report will be finalized in 2008 pending a third-party review. Immediate term actions will be considered under the enhancement programme of 2008 and 2009. Completion Status: COMPLETED
Study/Survey: Ballast Water Management Study
Expected Timing: Operations
TUBITAK MAM was commissioned by the Project to undertake a Ballast Water Risk Assessment (BWRA) for BTC shipping activities at CMT. The EIA committed that the Project would comply with the principles of the IMO Ballast Water Convention, although it is not yet ratified. The Convention requires that ballast water be controlled either through treatment to specified standards or ballast water exchange. Ballast water treatment technology, while established is not yet widely used or available by ships and it is therefore understood that ship ballast water exchange is currently the most effective and cost-efficient means for controlling ballast water. The BWRA assessed the level of risk for all source ports of ships that used CMT between the dates 4th June 2006 and 28th May 2007 (the former date representing start of Operations and the last the commencement date of the BWRA study). The BWRA was undertaken in accordance with the IMO – GloBallast BWRA Methodology. The study used the GloBallast BWRA database developed by IMO that calculates the relative overall risk of a potentially harmful alien species introduction. To complete the BWRA the initial stage was to determine the source ports of the ships berthing and discharging ballast water at the CMT. At the time of the study 171 ships originating from 54 ports around the world had visited CMT in the previous 12 months .The study established the level of risk from the introduction of alien species from current known source ports of ships using CMT. Risk was determined on a five point scale of highest, high, medium, low and lowest. Of the 54 ports, 22 were identified as being of a medium to highest level of risk to İskenderun Bay with respect to alien species invasion. The highest risk ports were Ashkelon and Haifa in Isreal, Sidi Kerir in Egypt, Tartous in Syria, Fos sur Mer in France and Augusto-Priolo in Italy. All of the highest risk ports are located in the Mediterranean Sea as the key criteria to risk is environmental similarity of ports. Upon completion of the risk assessment the Project assessed options for ballast water management from the medium to highest risk ports. Feasible management options at this stage only include ballast water exchange as discussed above. Upon assessment however ballast water exchange did not prove to be a viable option either as the journey time and distance from shore of the ships travelling from all of the medium to highest risk ports is not sufficient to complete a full 95% volumetric ballast water exchange without deviating or delaying a ship’s voyage. The Convention clearly states that no ships will be required to deviate its course or delay its voyage to meet the requirements of the Convention. The Project is therefore complying with the Convention as per the ESIA requirements. However BTC intends to undertake further studies to determine if there is value in undertaking partial ballast water exchange and/or exchanging ballast water closer than Convention recommended distances from the shore. In addition the Project will continue to update the risk assessment to take account of new source ports of tankers using the CMT facility. If in any case a ship is travelling from a medium to high risk port that meets the criteria for allowing ballast water exchange, this will be enforced by the Project as per the Convention. Completion Status: ONGOING
Study/Survey: Coastal Processes Survey
Expected Timing: Operations
The coastal processes surveys commenced in December 2006 at CMT by DOKAY and continued with two additional surveys in 2007 which were carried out in June and December. The scope of the work was to look for evidence of beach scour and potential changes to the beach profiles in the vicinity of the BTC Jetty since the 2001 EIA baseline study. A summary of results below include a comparison June 2007 survey results with the December 2006 and EIA baseline report: • The height of the mobile dunes increased from 2 to 23 cm along the entire coast except
the sheltered sides of rocky promontories since the December 2006 survey. • Similarly, benthic sedimentation increased along the entire coast except the sheltered

BTC Pipeline Project
13
side of rock promontories. Sedimentation rates reached a maximum 7.5 cm/month at the west of the BTC Jetty and 10cm/month at the Holland and Botaş beaches over the study period.
• The average accretion rate (3 m/year) calculated for December 2006 - June 2007 period at the beach immediately west of Botaş Jetty is in agreement with the average rate for the period 1973-1992 (2.9 m/year).
• 0.6 m/year accretion rate measured at the eastern part of Holland Beach appeared to be slightly lower than the average rate (0.73 m/year) for the period 1973-1992.
• Accretion rates at Botaş Beach couldn’t be calculated due to the poor definition of the coastal line as shown on the ortho photograph taken at the time of the EIA baseline study. This was due to the rough sea conditions at the time. An alternative assessment involving a comparison of 1995 and 2002 topographical maps will be undertaken in early 2008.
• Sediments are recharged to the Bay from sandstone and clay soils which are washed to the sea during heavy rainfall periods. The frequency and strength of the winds in the area generate a distinct longshore east south-east current. Sediments are subsequently transported towards the Botaş beach, which explains the accretion of sediments at this location.
• To date there is no apparent impact of the BTC jetty and temporary harbour on coastal processes in the area.
Completion Status: ONGOING
4 CHANGES The BTC Project uses a management system process called “Management of Change” (MOC). Proposed changes with potential associated environmental or social impacts are graded by three Classes – I, II or III, as defined in the ESAP. Class III changes are the most significant. Changes are subject to a process of review and approval by BTC, including review and approval by the Lenders for Class III changes. Class I and II changes do not require direct approval by the Lenders, but are assessed as part of the in-country monitoring process by the Lenders’ IEC. The following sections summarise BTC approved changes as recorded during 2007.
4.1 AZERBAIJAN
There were eight changes in Azerbaijan in 2007.
Asset Class Approved Internally
Description of Change
BTC / SCP Az
III Sept 2007 General Waste This MOC covers the disposal of non-hazardous waste generated by BTC Operations Facilities in a BP dedicated area at the ADES Sumgayit Municipal landfill. (The ADES site is not compliant with EU standards). The operation of the BP area is subject to separate management procedures and controls.
BTC / SCP Az
III Sept 2007 Medical Waste The Medical Waste MOC covers the use of the Baku Central Clinical Hospital incinerator for the disposal of medical waste until April 2007.
BTC / SCP Az
III Sept 2007 Oily Waste The Oily Waste MOC covers the interim measure of storage of oily waste at Serenja Waste Management Facility.

Environmental and Social Annual Report 2007
14
Asset Class Approved Internally
Description of Change
BTC Az
III Sept 2007 Disposal of Waste Pigging Wax This MOC covers the temporary storage of pigging wax generated since 2006. This deviation is required until 4Q 2007. After that date, a new service provider will be appointed following a tender process. Before the service provider is appointed, BTC will submit a further MoC.
BTC / SCP Az
III Sept 2007 Sewage Disposal This MOC outlines the justification for the temporary use of the Mingechevir Waste Water Treatment Facility for treatment and disposal of sewage wastes until on-site treatment facilities are operating to required capacity for liquid phase of sewage effluent. It also covers sewage sludge disposal at the Mingechevir Waste Water Treatment Facility until BP AzSPU Facility for Sewage Sludge disposal is operational and compliant with EU requirements.
BTC / SCP Az
II Sept 2007 Reinstatement of SPJV Camp at PSA2 An MOC was prepared to cover the above-ground and underground communications of the Yevlakh SPJV PSA-2 site being left in place at the landowners’ demand. The sites are intended to be used in the future for construction of a cattle farm to support Azerbaijan economic development in the area.
BTC / SCP Az
II Sept 2007 Reinstatement of CCIC Camp and PDY at Yevlakh This MOC covers the above-ground and underground communications of the Yevlakh CCIC Construction Camp and Pipe Dump Yard sites being left in place at the landowners’ demand. The sites are intended to be used in the future for construction of other camps to support Azerbaijan economic development in the area.
BTC Az
III Sept 2007 Interim Routine ROW Access Strategy This MOC details the change in access to the ROW, and is supported by a full BTC ESIA Addendum.
4.2 GEORGIA
There were eight changes in Georgia in 2007.
Asset Class Approved Internally
Accepted by
Lenders
Description of Change
BTC / SCP Geo
III April 2007 Sept 2007 Disposal of sewage sludge at the Gardabani Municipal Treatment Plant - Document Number: AGT002-2003-OP-DCN-00007 Sewage sludge from STPs trucked to the Gardabani Sewage Treatment facility for sludge solids stabilization and permanent storage in sludge beds.
BTC / SCP Geo
III April 2007 Sept 2007 Continued use of the Central Waste Accumulation Area (CWAA) adjacent to PSG-1 - Document Number: AGT002-2004-PM-DCN-00067 (Document New Number - AGT002-2000-OP-DCN-00012) Continued use of the CWAA for temporary storage of BTC Project and Operational hazardous waste and recyclables prior to disposal by way of export to EU compliant facilities and/or approved local contractors.

BTC Pipeline Project
15
Asset Class Approved Internally
Accepted by
Lenders
Description of Change
BTC / SCP Geo
III April 2007 Sept 2007 Export of BTC legacy waste - Document Number: AGT002-2000-OP-DCN-00010 BTC committed to the EU compliant disposal of waste arising. It is proposed that hazardous, non hazardous (excluding domestic type waste) and recyclable materials that cannot be disposed of within Georgia be exported and disposed in an EU compliant facility outside of Georgia.
BTC / SCP Geo
II April 2007 Sept 2007 Continued operation of the Rustavi Pipeyard - Document Number: AGT002-2004-PM-DCN-000XX Document New Number - AGT002-2000-OP-DCN-00008) The Rustavi Pipe yard will be retained to store spare BTC and SCP pipe. It is strategically located next to a rail spur line. It was used as a general pipe lay down area and BTC’s Oil Spill Contractor has also been temporarily utilizing this yard. The continued use and eventual dismantling of this facility will comply with ESAP and associated Management Plans.
BTC / SCP Geo
II April 2007 Sept 2007 Purchase and dismantling of the Marneuli, Tsalka and Akhaltsikhe Camps - Document Number: AGT002-2004-PM-DCN-00073 Purchase and dismantling of the Marneuli, Tsalka and Alkalsike camps for sale to the Egypt BU, at which time it will be demobilised and reinstated in accordance with requirements. Reinstatement of the camps will be performed by the Project using local contractors following reinstatement requirements under supervision of the environmental department
BTC / SCP Geo
II April 2007 Sept 2007 Purchase and continued operation of the Akhaltsikhe construction camp - Document Number: AGT002-2004-PM-DCN-00072
Purchase and continued operation of the Akhaltsikhe construction camp. It is anticipated the camp will remain open until end 2008, at which time it will be demobilised and reinstated in accordance with requirements.

Environmental and Social Annual Report 2007
16
Asset Class Approved Internally
Accepted by
Lenders
Description of Change
BTC Geo
II April 2007 Sept 2007 Upgrading and continued use of a Kodiana access road and construction of bypass - Document Number: AGT002-2004-PM-DCN-00067 Upgrade the existing construction access track to GB 17 from the public road on the east side of Andeziti up to the point where it crossings the SCP and BTC Pipelines ROW at KP 181+450. From this point the existing ROW running track will be upgraded up to GB 18. A by-pass road will be constructed around GB 18 and the ROW running track will be upgraded to KP 184+460 where the ROW crosses an existing village stoned track.
BTC Geo
II April 2007 Sept 2007 Continued operation of the Andezit pipeyard (also known as Bakuriani pipeyard) - Document Number: AGT002-2004-PM-DCN-000XX (Document New Number - AGT002-2004-PM-DCN-00076)
This change addresses continued operation of the Andezit Pipeyard as a temporary project facility to support construction of the remaining Projects. Andezit pipeyard (also known as Bakuriani pipeyard) was initially constructed by SPJV as a pipe storage, laydown and a mechanic yard area. The site was scheduled for reinstatement at the end of the pipeline construction, however it’s continued use is required for the remaining projects in the Bakuriani area. It is currently used as a batch plant and a laydown area and is expected to be in use until the remaining projects are completed. The continued use and eventual dismantling of this facility will comply with ESAP and associated Management Plans.
4.3 TURKEY
A summary of Class I and II changes during 2006 are summarised below. There were no Class III changes in Turkey during 2007.
Asset Class Approved Internally
Description of Change
BTC I April 2007 Operational Cultural Heritage Management Plan and Waste Management Change Relatively minor changes to the two operational management plans to reflect operational feasibility and changes in BIL departmental and management structure.

BTC Pipeline Project
17
Asset Class Approved Internally
Description of Change
BTC II June 2007 Continued use of Kars and Hanak Camps The EIA and supporting Camp Assessment Reports assumed that the camps would operate for the duration of the construction period. Botaş Corporation had stated that they intended to retain the Camps for alternative use. The camps at Kars and Hanak, are both owned by Botaş Corporation. BTC has no legal standing to enforce Botaş to decommission and reinstate the camps sites with immediate effect. Prior to temporary facility handover, the environmental and social aspects of the camps had been managed throughout the construction and transition period to ensure the camps are operating in accordance with Project standards. BTC has requested due diligence reports from Botaş to register the condition of the site at handover. These reports are currently outstanding. Botaş has however undertaken to decommission and reinstate the camps after completion of activities.
BTC II June 2007 ISO14001 certification The Turkey EIA states that ISO certification should be achieved “within 9 months following commencement of operations”. Full ‘commencement of operations’ is considered to be achieved when outstanding works have been completed on BTC construction. Thus, the following dates were targeted - ISO pre-certification audit November 2007 and certification in May 2008.
BTC II June 2007 Ceyhan temporary harbour The original design of CMT did not include the small craft harbour; therefore the EIA did not take account of this facility in the assessment scope. The small craft harbour is not located within the boundary fence of the BTC Terminal Facilities. Botaş has stated that they intend to keep the facilities. BIL concur with this idea, as they are currently using the area as a staging point and storage location for their marine OSR capability. The purpose of the MOC was to ensure that leaving the facilities in place would not bring about additional impacts above those envisaged in the Turkey EIA.. An alternatives analysis study was carried out that assessed two options: • Keeping the small craft harbour; • Demolishing the small craft harbour. After consideration of the operational alternatives analysis it was determined that keeping the small craft harbour would not bring about additional impacts.

Environmental and Social Annual Report 2007
18
Asset Class Approved Internally
Description of Change
BTC II June 2007 MARPOL ship’s slops handling facility There is a requirement under the international MARPOL convention (73/78) and Turkish Regulation on Waste Removal from Ships and Control of Wastes 26.12.2004 to provide facilities for tankers to discharge oily water and slops water at receiving jetties. The facilities were not specified in the Lump Sum Turkey Agreement (LSTKA) (2000). BTC decided in early 2006 that the facilities to treat oily water and slops from tankers (as required by the MARPOL Convention) at CMT would not be provided by Botas under LSTKA. BTC Co will design and construct the facility instead. Design is currently on-going and construction is planned for 2009. The new facilities will be operated by BIL under the same arrangement and standard as they operate the Turkey section of the BTC Pipeline.
BTC II June 2007 Manning of IPT1 and IPT2 This change addresses the environmental and social impacts of the Operational change to locate staff at Pressure Reduction Station (IPT1) and intermediate pigging station (IPT2). BIL, the Designated Operator, determined a requirement to staff the facilities to undertake Operations in accordance with the Operating Agreement between BIL and BTC The ESIA did not assess the impacts of these facilities assuming that they were manned. The MOC assessed the E&S impacts of manning the facilities and determined that impacts could be managed satisfactorily in accordance with existing mitigation measures in the EIA as per other manned facilities. In addition a Waste Water Treatment system will be installed at IPT1 and a well will be installed at IPT2, subject to a sustainability study.
BTC II June 2007 Temporary camp facilities at Above Ground Installations The EIA and supporting Camp Assessment Reports assumed that the camps would operate for the duration of the construction period. There is an Operational requirement to continue to use the temporary AGI camp facilities (PT1, PT2, PT3, PT4, IPT1 and CMT) to accommodate staff to support the Operation of the BTC Facilities. BIL has determined that it is not possible to house the number of staff required to operate the facilities at the accommodation provided for in the permanent facilities. As a result they have continued to use the camp facilities to provide accommodation to BIL and contractor staff. Office space is also being utilized at the camp facilities. The MOC process assessed additional E&S impacts from the continued use of the camps and mitigation measures have been identified. The camp aspects and impacts have been included in the BIL ISO Environmental Management System and control measures are being implemented by BIL to manage impacts. BTC Co includes the camps in the scope of their bi-annual E&S assurance audits.

BTC Pipeline Project
19
Asset Class Approved Internally
Description of Change
BTC II September 2007
Operations Environmental Emissions Management Plan (EEMP) The Operational EEMP was written prior to start of Operations. Changes were required to the Plan to update it in terms of legal updates, feasibility of implementation and current operations. A summary of significant changes are as follows: • BIL will not monitor stack/exhaust emissions back-up or
emergency engines which have a run-time of less than 500 hours per year, as per Turkish legal standards.
• Reference to 110% containment capacity of diesel tank volume has been amended. Due to space constraints it was not always possible to provide 110% containment, but tanks are filled less to ensure 110% is effectively achieved.
• Deleted reference to ballast water biological sampling and analysis as it was determined that it would not prove feasible to undertake effective and efficient analysis. Ballast water to be managed in accordance with Ballast Water Convention.
• Deleted requirement for ships to discharge their ballast outside of the Designated Operation Zone as this is not feasible due ship handling requirements.
• Removed requirement to undertake environmental ambient noise monitoring as it is not considered necessary. The World Bank night-time noise limits were predicted to be met within 50 m of AGI perimeter fence and nearest residential receptor is 1.5 km away.
• Originally EIA had determined that IPT1 and IPT2 would not require to be lit permanently. For security reasons this requirement has been revised.
• Removed requirement to undertake underwater noise monitoring as it was assessed that impact to marine fauna from underwater noise would be negligible.
• Removed requirement to determine one hour average SO2 ambient air limit at CMT, as the nature of activities are such that they do not have SO2 peaks.
• Removed requirement to monitor PM10 in ambient air around Ceyhan Marine Terminal as there are only very minimal and periodic PM10 sources on site.
• Removed requirement to monitor for nitrogen and phosphorous in waste water discharge from site as water is not discharging to sensitive water course.
• Removed requirement to monitor for fluoride and cyanide from waste water discharge from site as there are no operational sources of fluoride and cyanide.
4.4 CROSS-COUNTRY CHANGES
Cross country changes were as follows:

Environmental and Social Annual Report 2007
20
Asset Class Approved Internally
Accepted by
Lenders
Description of Change
BTC / SCP
III April 2007 May 2007 Change of date of ISO14001 Certification This MOC covers the timing of certification of BTC and SCP to ISO14001. In Azerbaijan and Georgia the Operations ESAP states that BTC will be certified to ISO 14001 “within 9 months of full handover of the right of way to Operations” whilst in Turkey certification would be “within 9 months following commencement of operations.” The practicality of this objective was reviewed in 2007 taking into consideration a number of factors including operational complexity, project legacy issues. As a consequence it was decided to delay ISO14001 certification until May 2008, a date that brings it in line with the AzSPU external auditing schedule.
Asset Class Approved
Internally Description of Change
BTC II May 2007 Changes to the Project Environmental Investment Plan In order to demonstrate the commitment to good stewardship of the environment one of the commitments in the ESAP was the implementation of an Environmental Investment Programme (EIP) that applies to the onshore pipeline projects in Azerbaijan, Georgia and Turkey, including the marine terminal at Ceyhan. A project specific process was developed to define and implement the EIP. The process, key priority themes for intervention and budgets were laid out in the Project Environmental Investment Plan (PEIP) that formed an Annex to the ESAP (Annex D). The change related to items in the PEIP. Cross country and country-specific changes to the PEIPs are summarised as follows: Cross-country: • Re-allocation of the funds for a cross-country project to
national projects; Azerbaijan: • Extension of the implementation timetable. • Not implementing Phase I projects identified through the
RFP process under key priority themes identified in the ESAP.
• Implementation of Phase II community level environmental projects with an extension to the timetable committed for the Phase I.
• Allocation of unspent funds from Phase I and II to be utilised as part of Phase III (currently under development).
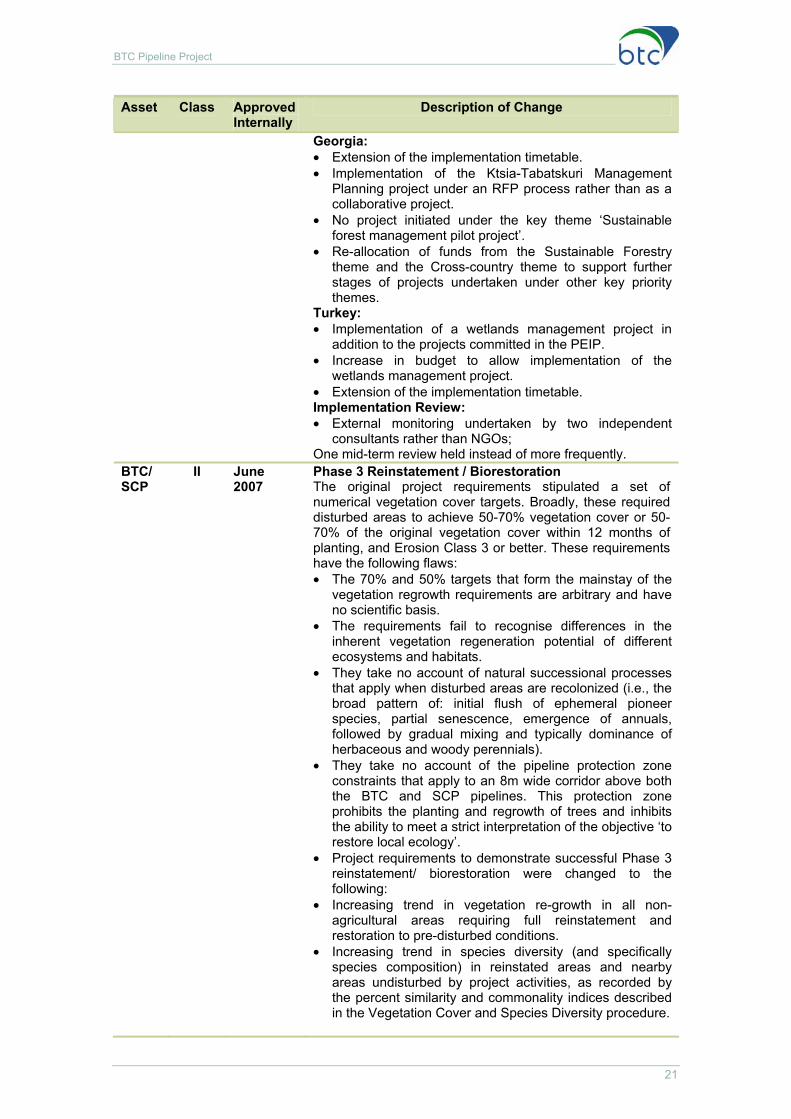
BTC Pipeline Project
21
Asset Class Approved Internally
Description of Change
Georgia: • Extension of the implementation timetable. • Implementation of the Ktsia-Tabatskuri Management
Planning project under an RFP process rather than as a collaborative project.
• No project initiated under the key theme ‘Sustainable forest management pilot project’.
• Re-allocation of funds from the Sustainable Forestry theme and the Cross-country theme to support further stages of projects undertaken under other key priority themes.
Turkey: • Implementation of a wetlands management project in
addition to the projects committed in the PEIP. • Increase in budget to allow implementation of the
wetlands management project. • Extension of the implementation timetable. Implementation Review: • External monitoring undertaken by two independent
consultants rather than NGOs; One mid-term review held instead of more frequently.
BTC/ SCP
II June 2007
Phase 3 Reinstatement / Biorestoration The original project requirements stipulated a set of numerical vegetation cover targets. Broadly, these required disturbed areas to achieve 50-70% vegetation cover or 50-70% of the original vegetation cover within 12 months of planting, and Erosion Class 3 or better. These requirements have the following flaws: • The 70% and 50% targets that form the mainstay of the
vegetation regrowth requirements are arbitrary and have no scientific basis.
• The requirements fail to recognise differences in the inherent vegetation regeneration potential of different ecosystems and habitats.
• They take no account of natural successional processes that apply when disturbed areas are recolonized (i.e., the broad pattern of: initial flush of ephemeral pioneer species, partial senescence, emergence of annuals, followed by gradual mixing and typically dominance of herbaceous and woody perennials).
• They take no account of the pipeline protection zone constraints that apply to an 8m wide corridor above both the BTC and SCP pipelines. This protection zone prohibits the planting and regrowth of trees and inhibits the ability to meet a strict interpretation of the objective ‘to restore local ecology’.
• Project requirements to demonstrate successful Phase 3 reinstatement/ biorestoration were changed to the following:
• Increasing trend in vegetation re-growth in all non-agricultural areas requiring full reinstatement and restoration to pre-disturbed conditions.
• Increasing trend in species diversity (and specifically species composition) in reinstated areas and nearby areas undisturbed by project activities, as recorded by the percent similarity and commonality indices described in the Vegetation Cover and Species Diversity procedure.
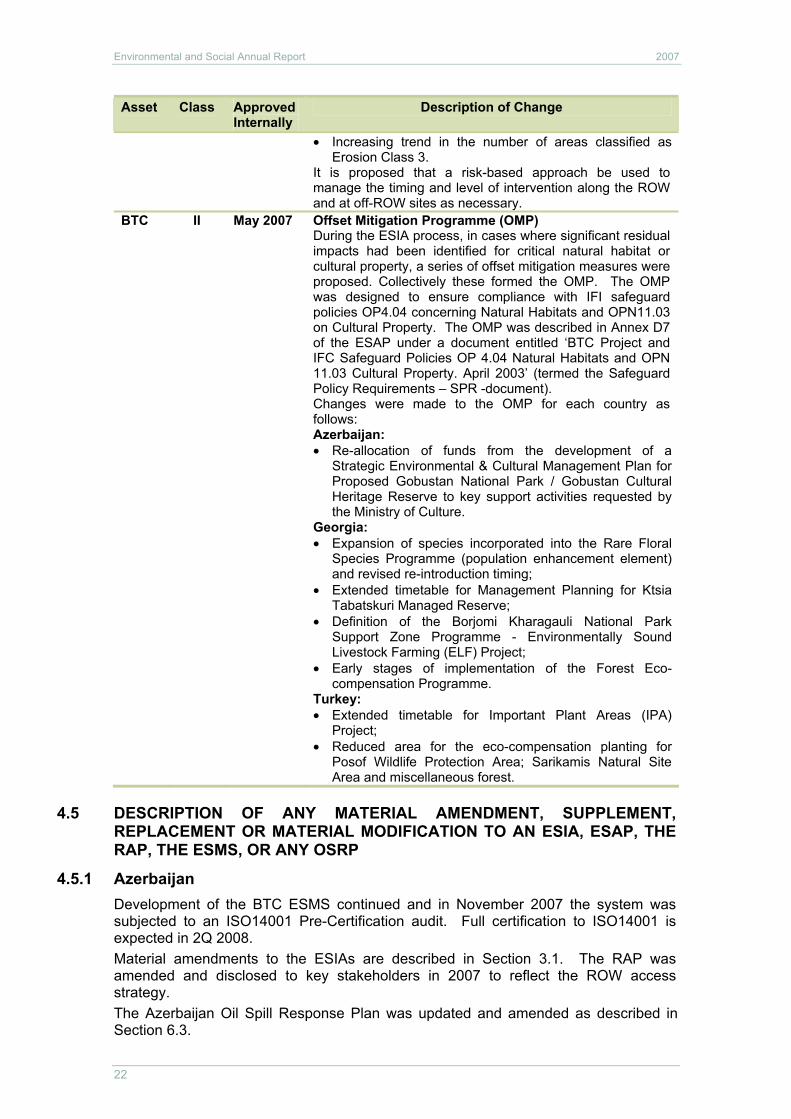
Environmental and Social Annual Report 2007
22
Asset Class Approved Internally
Description of Change
• Increasing trend in the number of areas classified as Erosion Class 3.
It is proposed that a risk-based approach be used to manage the timing and level of intervention along the ROW and at off-ROW sites as necessary.
BTC II May 2007 Offset Mitigation Programme (OMP) During the ESIA process, in cases where significant residual impacts had been identified for critical natural habitat or cultural property, a series of offset mitigation measures were proposed. Collectively these formed the OMP. The OMP was designed to ensure compliance with IFI safeguard policies OP4.04 concerning Natural Habitats and OPN11.03 on Cultural Property. The OMP was described in Annex D7 of the ESAP under a document entitled ‘BTC Project and IFC Safeguard Policies OP 4.04 Natural Habitats and OPN 11.03 Cultural Property. April 2003’ (termed the Safeguard Policy Requirements – SPR -document). Changes were made to the OMP for each country as follows: Azerbaijan: • Re-allocation of funds from the development of a
Strategic Environmental & Cultural Management Plan for Proposed Gobustan National Park / Gobustan Cultural Heritage Reserve to key support activities requested by the Ministry of Culture.
Georgia: • Expansion of species incorporated into the Rare Floral
Species Programme (population enhancement element) and revised re-introduction timing;
• Extended timetable for Management Planning for Ktsia Tabatskuri Managed Reserve;
• Definition of the Borjomi Kharagauli National Park Support Zone Programme - Environmentally Sound Livestock Farming (ELF) Project;
• Early stages of implementation of the Forest Eco-compensation Programme.
Turkey: • Extended timetable for Important Plant Areas (IPA)
Project; • Reduced area for the eco-compensation planting for
Posof Wildlife Protection Area; Sarikamis Natural Site Area and miscellaneous forest.
4.5 DESCRIPTION OF ANY MATERIAL AMENDMENT, SUPPLEMENT, REPLACEMENT OR MATERIAL MODIFICATION TO AN ESIA, ESAP, THE RAP, THE ESMS, OR ANY OSRP
4.5.1 Azerbaijan Development of the BTC ESMS continued and in November 2007 the system was subjected to an ISO14001 Pre-Certification audit. Full certification to ISO14001 is expected in 2Q 2008. Material amendments to the ESIAs are described in Section 3.1. The RAP was amended and disclosed to key stakeholders in 2007 to reflect the ROW access strategy. The Azerbaijan Oil Spill Response Plan was updated and amended as described in Section 6.3.

BTC Pipeline Project
23
4.5.2 Georgia The Georgia Oil Spill Response Plan was updated and amended as described in Section 6.3.
4.5.3 Turkey There were no material changes to the Source Documents in Turkey other than those described in Section 4.
5 COMPLIANCE WITH ENVIRONMENTAL STANDARDS AND APPLICABLE ENVIRONMENTAL LAW
5.1 SUMMARY OF ANY NOTICES OF NON-COMPLIANCE, REMEDIAL ACTION, ANY FINES OR PENALTIES PAID AND FINAL DISPOSITION OF ANY REGULATORY PROCEEDINGS All notices of non-compliance served by the IEC in 2007 are detailed in Appendix 3 of this report.
There were no governmental fines or penalties incurred for environmental or social non-compliances, and no material environmental claims were made against BTC during 2007.
5.2 MONITORING RESULTS During 2007 environmental monitoring of the operation of the BTC Pipeline continued in accordance with the BTC Emissions Management Plans to ensure compliance with project standards as well as to monitor, minimise and where necessary mitigate the environmental impact of pipeline operations.
5.2.1 Azerbaijan 5.2.1.1 Ambient Air Quality
Ambient air quality monitoring was carried out twice in 2007. Sampling devices were deployed for 30 day periods during October – November 2007 and also during December 2007 – January 2008 at four locations around PSA2 and at two locations around IPA1. Analyses were carried out for NOx, SO2, and for benzene at all locations on both occasions.
All results indicate compliance with the ESIA specified limits, except for concentrations of SO2 recorded at one sampling point: at the PSA2 Security Post slightly elevated concentrations of SO2 were detected (24 µg/m3 in Oct-Nov and 33 µg/m3 in Dec-Jan), compared with a project standard of 20 µg/m3). BTC is investigating the significance of this result, along with possible causes. At all other sampling points SO2 readings were well within the standards.
A summary of monitoring results is provided in Appendix 2.1a
5.2.1.2 Stack Emissions Stack emissions monitoring were carried out for the first time in November 2007 at PSA2. Emissions from the MOL Turbines were analysed for NOx, CO, and O2. The results showed elevated levels of both NOx and CO. It is believed that this was due to the fact that at the time of sampling the turbines were operating at below their design load. Although the turbines are fitted with low emission technology, and hence emissions were well below those of conventional turbines, the full benefit of this technology is not achieved unless they are operated at high load. Further data will be gathered at the next monitoring event, scheduled for May 2008, which will further our understanding of this issue. It should be noted that ambient air quality data were

Environmental and Social Annual Report 2007
24
collected at PSA2 at the same time as the stack emissions monitoring, and ambient concentrations of NOx were found to be well within the required standards described in the ESIA. A summary of monitoring results is provided in Appendix 2.1b.
5.2.1.3 Noise In 2007 environmental noise monitoring took place at pre-identified receptors around PSA2 and at five block valve stations, at both day time and at night time. All the results indicate compliance with the project standards reported in the ESIA except for one monitoring event, at Block Valve AB4 in September. The elevated noise level was contributed to by a neighbour’s dog barking. A summary of monitoring results is provided in Appendix 2.1c.
5.2.1.4 Effluent Throughout 2007, no treated sewage was discharged from BTC Azerbaijan facilities to the environment. All sewage effluent was trucked off-site to a third party sewage treatment works, while the onsite sewage treatment plants underwent upgrades (due for completion 2Q 2008). Discharges of rainwater runoff and water from retention ponds did occur throughout 2007, and were regularly monitored. All the monitoring results indicate that the discharges were generally in full compliance with project standards. One notable exception is Total Coliforms. According to current procedures, the retention ponds are sampled prior to all planned discharges to the environment. Should concentrations exceed the applicable standards, as has been the case, that water is not discharged. Instead, it is trucked to a third party sewage treatment works. A summary of monitoring results is provided in Appendix 2.1d.
5.2.1.5 Ground and Surface Waters In 2007 surface and groundwater monitoring was carried out in May and in November. Groundwater samples were taken from nine monitoring wells at the Karayazi aquifer and two at PSA2. Surface water samples from five locations around IPA1 and PSA2 in November. All the results indicate no significant deterioration from pre-project baseline conditions. A summary of monitoring results is provided in Appendix 2.1e.
5.2.1.6 Waste Management During 2007 waste management practices on site were maintained and improvements undertaken to increase awareness of site personnel on waste minimisation and segregation issues. A new fully engineered waste storage and handling area was opened at PSA2 in 2Q 2007. All wastes were handled and disposed of in accordance with BP AzSPU waste management requirements. A summary of waste generated is provided in Appendix 2.1f.
5.2.2 Georgia 5.2.2.1 Ambient Air Quality
Measurements were taken at five locations around PSG1 and PSG2. There were four rounds of monitoring (January, March, June and October). However, due to technical difficulties, the results of only three rounds were provided by the vendor company. Also, the results for March and June were incomplete (SOx results were missing) and only SOx results were provided for October. As a consequence of this poor service the vendor has been changed for 2008. A review of the monitoring data demonstrate compliance with project standards with the exception of two locations where the levels of SOx are slightly higher. A summary of monitoring results for Ambient Air Quality is provided in Appendix 2.2a.

BTC Pipeline Project
25
5.2.2.2 Stack Emissions All turbine and water bath heater sample ports at both BTC Pump Stations were modified to make them suitable for stack emissions monitoring. A full round of monitoring was conducted in November – December 2007. The results show that none of the turbines meet the project standard for NOx. The reasons for this are the same as noted in Section 5.2.1.2. The water bath heater complied with project standards for NOx and SO2.
The original generator sample ports were incorrectly located and therefore new ports were to be drilled to allow monitoring. However, this was found to be not possible, due to the composition of the material of the generator stacks. It was therefore decided to modify the existing ports to make them suitable for collecting samples.
A full set of results are given in the Appendix 2.2b.
5.2.2.3 Noise Noise monitoring was carried out at eight locations around PSG1 and at seven locations around PSG2 in January, February, March and July. Noise monitoring was also conducted in July around PSG 1 and 2 camps and Akhaltsikhe camp, each of which are used extensively by BTC staff and related personnel.
The monitoring demonstrated compliance with project standards.
A summary of monitoring results for noise is provided in Appendix 2.2c.
5.2.2.4 Effluent Samples of treated waste water were taken from the reed beds at PSG1 and PSG2 prior to discharge to the drainage channels and assessed. Retention ponds at PSG1 and PSG2 were also monitored prior to discharge into the drainage channels. Total Suspended Solids slightly exceeded project standards at PSG1 on three occasions and more significantly on two others, while Total Coliforms were high on two sampling occasions at PSG2 (August and September). A programme to upgrade the on-site wastewater treatment process commenced in 2006 and continues.
A summary of monitoring results for effluent discharges at facilities is provided in Appendix 2.2d. It should be noted that data for 1 month is absent (April) as samples were no longer valid for analysis due to delays in custom clearance at the Georgia-Azerbaijan border. Samples at PSG1 for January and November and at PSG2 for January, February, November and December were not taken due to frost at both Pump Stations.
5.2.2.5 Ground and Surface Waters Two rounds of groundwater and surface water monitoring were conducted in 2007.The results show compliance with the baseline monitoring results.
A summary of monitoring results for Ground and Surface Waters is provided in Appendix 2.2e.
5.2.2.6 Waste A summary of waste generated in 2007 is given in Appendix 2.2f.
The main waste generation areas are at PSG1 and PSG2. The Central Waste Accumulation Area (CWAA) continues to be utilised by Operations for the management of materials that cannot be recycled or disposed of to appropriate standards. BTC’s contractor for waste export, UK company Veolia has completed hazardous waste repackaging for the export and has obtained the necessary export permits to transfer the wastes to Germany and the Netherlands. Export is planned to commence in January 2008.
Various waste plans were accepted by Lenders in 2007: Waste Management Plan, Waste Management Implementation Plan, Waste Offset Plan and Waste Projects Plan.

Environmental and Social Annual Report 2007
26
These plans outline particular actions to improve waste management, to develop a new non-hazardous landfill, to close the Level III non-compliance related to BTC’s use of Iagluja waste disposal site, and to set offset mechanisms for compensation of non-compliant waste disposal.
Following completion of these plans, considerable progress was made on the development of a non-hazardous waste landfill. Specifically, a land parcel for a landfill was acquired and the UK consulting company Golder Associates was commissioned to prepare a landfill design and related ESIA. It is anticipated that the BP landfill will begin operation by the end of 2008.
The Waste Projects Plan includes a waste diversion program with the aim of diverting waste from Iagluja prior to the completion of the new landfill. The program considers: 1) food waste maceration and disposal via Gardabani sewage treatment plant, 2) General waste compaction and temporary storage (with final disposal at the new landfill once it is operational). It is anticipated that waste will be diverted from Iagluja disposal site by no later than June 2008.
5.2.3 Turkey In Turkey, BIL has contracted DOKAY to conduct all environmental monitoring activities at the pipeline facilities. These activities will be conducted in accordance with the project monitoring programme which in turn is based on commitments detailed in the ESAP.
5.2.3.1 Ambient Air Quality Ambient air quality monitoring is undertaken at CMT. The results are presented in Appendix 2.3a. No ambient air monitoring is required at the Pump Stations as the major sources of emissions (pump drivers and water heaters) run on natural gas and there is little impact on ambient air quality.
In 2007, five surveys were undertaken by DOKAY between January and December. The January 2007 survey commenced in December 2006 and wasn’t reported in last year’s Annual Report. The results therefore are included in this year’s summary. Similarly the results of the last survey in 2007 will be reported in 2008. A summary of the average results from the four rounds of monitoring in 2007 is as follows:
• The average SO2 and NO2 values measured in all sampling locations were within the Project limits with the exception of one SO2 result which was measured at sampling location CMT 3 (located off-site on the far side of the Botaş facility tank farm) in the Fall 2007 monitoring period. The result was slightly higher than the related average baseline concentration value due to a spot increase in the second 15-day sampling period. The spot increase was understood to have arisen from a source off-site as it could not be linked to BTC CMT Operations. Generally, SO2 concentration values measured in 2007 were higher than the corresponding values measured in 2006. It is understood that the SO2 concentration value of the region has increased slightly since last year. Conversely, NO2 concentration values measured during 2007 were lower on average than the concentration values of 2006.
• The average BTEX values measured in all sampling locations were within the project limits and benchmarks (refer to 2006 Annual Report).
• Benzene, toluene and xylene (o-xylene and m/p xylene) values of 2007 were lower than the concentration values of 2006.
• Overall there is no significant difference between ambient air quality in 2006 and 2007.

BTC Pipeline Project
27
5.2.3.2 Stack Emissions The flue gases originating from engine stacks (e.g. gas fired reciprocating engines, water heaters, diesel fired generators, LPG fired heaters) is monitored by DOKAY as per the legal and other requirements set out in the ESAP. Stack emissions monitoring results for 2007 are provided in Appendix 2.3b. The results are generally in compliance. The non-compliant results are being addressed through maintenance. When maintenance is undertaken, BIL advises DOKAY in order that the exhausts can be re-monitored for compliance.
5.2.3.3 Noise Project standards specify a maximum of 45 dBA for night time ambient noise levels at sensitive receptors. Modelling undertaken as part of the EIA process (Volume II, Section 7.9.4) predicted that noise levels 50m from the perimeter fence at each pump station would be within this limit. Given that the closest residential receptor to any of the facilities is 1.5 km monitoring at off-site residential receptors was therefore not considered necessary unless in response to concerns raised by residents. To date there have been no community complaints, nor has there been any other indication to suggest that on-site noise is rising.
5.2.3.4 Aqueous Discharges The aqueous discharges that originate from the facilities (PTs and CMT) and the upstream and downstream water of the receiving surface water bodies are being monitored on a monthly basis. The results for 2007 are shown in Appendix 2.3c. A waste water feasibility study was undertaken by BTC on behalf of BIL by a BP waste water consultant in May 2007. The purpose of the survey was to determine how the Project could improve the operability of the waste water treatment plants to provide more consistent discharge results in accordance with Project standards. This involved a complete review of all waste water treatment plants at each facility location. Recommended improvements included operational and design modifications. The details of the study can be found in Section 3.4.
5.2.3.5 Groundwater BTC developed a Groundwater Monitoring Strategy on behalf of BIL in 2007 and is implementing it in conjunction with BIL.
5.2.3.6 Waste Management The main waste generation areas of the BTC Turkey section are the PTs and CMT. Waste is collected and segregated at the on-site CWAAs. Waste is reused and recycled where possible. Glass, metal, vegetable oil, paper, battery and other recyclable wastes are sent to Project-approved, third party recycling facilities. Fifteen of these facilities were audited in 2007. All but one was found to be non-compliant with project standards. The non-compliant facility will no longer be used by the project. In 2007 a total of 1,368 tonnes of solid waste was disposed off-site. Eighty six percent was non-hazardous waste that was re-used or re-cycled. The remainder, comprising 2% hazardous waste and 12% domestic waste, was sent to the Izaydas facility located in Izmit6. Appendix 2.3d provides details of the waste volumes generated. A Best Practicable Option Study for waste management will be conducted by BIL and BTC in 2008.
6 This is the only facility of its kind that meets the Project requirements for hazardous waste in Turkey.

Environmental and Social Annual Report 2007
28
5.3 STATEMENT OF COMPLIANCE
BTC and its agents have complied with the development, construction and operation of the BTC Project with the ESAP, applicable Environmental Laws and Applicable Lender Environmental and Social Policies and Guidelines in all material respects during the period covered by this report.
All non-compliances with emissions that have been identified in 2007 are summarized in Chapter 5 and shown in Appendix 2. Non-compliances relating the other audits are given in Chapter 11 (and detailed in Appendices 3 and 4). For all non-compliances identified, corrective actions have been developed and implemented.
5.4 CHANGES IN APPLICABLE ENVIRONMENTAL LAW
5.4.1 EU Legislation Changes in EU legislation/regulations in 2006 and 2007 have been reviewed and their potential applicability to BTC Operations will be considered during the ongoing process of implementing the Health, Safety, Social & Environment (HSSE) Compliance Enhancement Programme.
• DIRECTIVE 2005/90/EC, 18/01/2006. Amends the list of carcinogens in Council Directive 76/769/EEC relating to restrictions on the marketing and use of certain dangerous substances and preparations.
• DIRECTIVE 2006/12/EC, 04/05/2006. Makes a number of amendments and clarifications to EU waste management legislation (references Council Directive 75/442/EEC and amendments).
• DIRECTIVE 2006/11/EC, 15/02/2006. Makes a number of amendments and clarifications to EU legislation on dangerous substances discharged to the environment (references Council Directive 75/464/EEC and amendments).
• DIRECTIVE PE-CONS 3658/06, 22/11/2006. On the protection of groundwater against pollution and deterioration.
• DIRECTIVE 2006/44/EC, 09/06/2006. On the quality of fresh waters needing protection or improvement in order to support fish life.
• DECISION 2006/61/EC, 12/02/2006. Approval of the UN-ECE Protocol on Pollutant Release and Transfer Registers. Requires member states to maintain a publicly available national pollutant release and transfer register that is facility specific.
• DECISION 2006/516/EC, 14/10/2004. (Published in OJ 01/08/2006) Approval of the Stockholm convention on Persistent Organic Pollutants. The provisions of the Stockholm convention (if not already applicable to Exports) are now indirectly applicable as the EU has now joined.
• REGULATION EC No. 29/2006, 01/10/2006. Minor amendment to the classification code of Regulation EC 20037/2000 on substances that deplete the Ozone Layer. Replaces Annex IV to the Regulation EC 20037/2000.
• REGULATION EC No. 842/2006, 17/05/2006. Relates to the control of fluorinated greenhouse gases.
• REGULATION EC No. 1013/2006, 14/06/2006. Relates to waste shipments. Amendments to improve compliance with Basel Convention. Includes a number of specific requirements for the control of waste movements including templates for documentation to accompany shipments.

BTC Pipeline Project
29
• REGULATION EC No. 1367/2006, 09/06/2006. Relates to the application of provisions of the Aarhus convention. May not be directly applicable to the private sector, but could be construed as being indirectly applicable as private sector may be required to cooperate and support the state in fulfilling its requirements.
• Regulation (EC) No 899/2007, 27/07/2007. Amending Regulation (EC) No 2037/2000 of the European Parliament and of the Council as regards the adjustment of CN codes for certain ozone depleting substances and mixtures containing ozone depleting substances to take account of amendments to the Combined Nomenclature laid down in Council Regulation (EEC) No 2658/87.
• REGULATION (EC) No 1379/2007, 26/11/2007. Amending Annexes IA, IB, VII and VIII of Regulation (EC) No 1013/2006 of the European Parliament and of the Council on shipments of waste, for the purposes of taking account of technical progress and changes agreed under the Basel Convention. Includes documentation requirements for the shipment of waste.
• DIRECTIVE 2006/118/EC, 12/12/2006. On the protection of groundwater against pollution and deterioration (Note that Directive 2000/60/EC sets out general provisions for the protection and conservation of groundwater). Includes a number of requirements regarding ground water quality and its monitoring that could potentially be applicable to the private sector.
• DECISION 18/07/2007. Establishes guidelines for the monitoring and reporting of greenhouse gas emissions pursuant to Directive 2003/87/EC of the European Parliament and of the Council. Provides guidance for the reporting of greenhouse gas emissions some of which are likely to be applicable to AzSPU operations.
5.4.2 Azerbaijani Law The changes in 2007 in Azerbaijani National legislation which have relevance to BTC were:
• "On construction of the new Baku International Sea Trade Port" – 18 October 2007. According to this Presidential Order, it is planned to build new Sea Port at the Alat Village in Garadagh District of the Baku City. The necessity of this construction proceeds from low turnover capacity of existing Baku Sea Port on the threshold of Baku-Tbilisi-Qars railroad opening and consequent rapid growth of the international transaction and transportation agreements through the Baku Sea Port.
• "On Regulation of Movables List, its arrangement and implementation". – this Presidential Decree brings together all rules requiring Registration of different types of Movable Property (e.g. Vehicles, artworks) in relevant State Bodies in one. 11 April 2007
• Decree of Cabinet of Ministers N63 from 11 April 2007 "About some additions and changes to the Decrees of Cabinet of Ministers". In accordance with this Decree new paragraph has been added to the "Rules for providing of State control on using and protection of water bodies".
• Law "About making changes and additions to "Law of Azerbaijan republic on industrial and utility wastes" N341-IIIQD, dated 22 May 2007. Changes are in: 1) Requirements in relation to design, construction, re-construction, conservation and abatement of enterprises, facilities and other installations, 2) Conditions applicable to wastes processing 3) Requirements on location of wastes 4). Requirements on hazardous wastes management 5) Medical wastes management 6) Oil, gas and power industry waste management 7) Transboundary and transit transportation of waste.

Environmental and Social Annual Report 2007
30
5.4.3 Georgian Law Significant changes to environmental legislation were adopted by the Parliament of Georgia in December 2007, which may have relevance to BTC. In particular, the Law on Environmental Impact Permits was adopted on December 14, 2007, which formally invalidated the 1996 Law on Environmental Permits, as well as Government Resolution No. 154 (dated September 1, 2005) on Terms and Conditions of Issuance of Environmental Impact Permits. On the same date, the Law on Ecological Expertise was adopted, revoking the 1996 Law on State Ecological Expertise. The Law on Environmental Impact Permits and the Law on Ecological Expertise define activities which are subject to mandatory ecological expertise and thus, to environmental impact permit. There are number of changes in the list of such activities established by the new laws, as compared to the previously effective legislation. In addition, the Law on Environmental Impact Permits only regulates certain ‘activities’, while the Resolution No. 154 also included several ‘facilities’. The Law on Environmental Impact Permits also determines rules with regard to carrying out environmental impact assessments.
Other notable changes of the environmental legislation include:
• Law on Environmental Protection Service adopted on December 28, 2007, invalidating the 2005 Law on State Control of Environmental Protection. According to the new law, a new agency – Environmental Protection Service – is established under the auspices of the Ministry of Environmental Protection and Natural Resources. The new agency is to be formed by reorganizing/merging three existing agencies within the system of the Ministry. The Environmental Protection Service shall be authorized to conduct investigations and generally carry out police functions in the environmental field to protect the environment.
• Noteworthy amendments were introduced to the Law on Protection of Atmospheric Air on December 14, 2007. One of the significant novelties of the new amendments is the inclusion of the reference to specific EC Regulations and Directives as guideline instruments for respective Georgian environmental legislation.
• Law on Creation and Management of Borjomi-Kharagauli Protected Territory, dated July 11, 2007.
• Law on Status of Protected Territories, dated November 22, 2007.
5.4.4 Turkish Law In Turkey environmental regulations are governed by an overarching piece of legislation referred to as the Environment Law. This Law describes the environmental legal regime in Turkey and its administration. Minor changes were made to the Environment Law this year. Clause 20 of the Law which defines the penalties was revised to prescribe heavier penalties. Three new pieces of environmental regulations were passed in 2007 which were relevant to BTC Co Operations as follows: • Regulation on Control of Packaging Waste (July 2007). The new regulation
requires all packaging waste to be segregated at source for re-cycling purposes. This is already a project requirement as stated in the Turkey Waste Management Plan (WMP) and is being implemented and monitored at all facilities.
• Regulation on Transporting Hazardous Materials by Highway (March 2007). The regulation defines the requirements for hazardous materials transportation, loading and unloading operations. BIL have incorporated the legal requirements into their Environmental Management System.
BTC Pipeline Project
31
• Regulation on Determining Breaches in Administrative Penalties Imposed upon Environmental Law and Imposing and Collecting Penalty (April 2007). The regulation defines how a breach in environmental law is determined, the responsibilities and authorization of Ministry bodies in relation to defining and managing these breaches and the law on imposing and collecting the penalty incurred for breaking the environmental law.
In addition two changes were made to existing Turkish environmental regulations in 2007 as follows: • Regulation on Accepting Waste from Ships and Control of Waste was revised in
December 2007. The changes did not directly impact BTC Operations or the CMT MARPOL slops handling facility design.
• Regulation on Control of Air Pollution Resulting from Heating was revised in May 2007. This revision did not directly impact BTC Operations.
6 OIL SPILL RESPONSE
6.1 SUMMARY OF OSRPs COMPLETED, UPDATED OR AMENDED DURING YEAR The OSRPs for Georgia and Azerbaijan were updated and amended in May 2007, as summarised in Section 6.3.
In addition, an internal audit was undertaken against the Oil Spill Response Plan in Turkey in January 2007. An external audit was then undertaken as part of the Lender audits in June 2007. The findings of both audits are summarised in Chapter 11. The Containment site databases and manuals were updated throughout 2007 and will be finalised in 2008.
Similarly, in Georgia, an audit was carried out in June 2007 to verify compliance against the Oil Spill Response Plans. Audit findings were considered during the update of the OSRPs. A new version of the Oil Spill Response Plan was issued for BTC Georgia Operations (AZSPU-HSSE-DOC-00220-5).
6.2 SPILL AND REMEDIATION SUMMARIES
BTC reports any material release that reaches the environment (i.e. is uncontained) or that is greater than 1 barrel, even though it maybe contained. Gas releases are always classified as uncontained. A summary of these releases is given in Table 6.1.
Table 6.1: BTC Material Releases in 2007
Liquid < 1 bbl > 1 bbl
Asset
Uncontained Contained Uncontained
Gas
BTC Azerbaijan 1 0 0 1 BTC Georgia 0 1 0 0 BTC Turkey 8 5 2 0
Further details on the material release shown in Table 6.1 are given in the following sections:
6.2.1 Azerbaijan There were two reportable releases recorded for BTC Azerbaijan during 2007: • Hydraulic Oil Release (PSA2 – October 2007)

Environmental and Social Annual Report 2007
32
Approximately 0.2 litres of hydraulic oil was released from a HIAB boom. All of the spilled material was mopped up with absorbent pads and no oil escaped off the spill site.
• CO2 gas release (PSA2 - November 2007) Approximately 8 m3 of CO2 was released to atmosphere when a fire suppression system tripped due to a false alarm.
6.2.2 Georgia There was a single oil spill over 1bbl however this was contained within the secondary structure. Details of the clean up are given below. Several minor spills were also recorded during the year. All of them were contained and therefore not discussed further in this report. None impacted the environment.
6.2.2.1 Contained The following spill was greater than 1bbl. The spill was fully contained: • Diesel spill in secondary containment (Tbilisi office – April 2007) A leak occurred from the generators’ diesel tank located in the Tbilisi office yard. The cause of the leak was a damaged 2” drain main valve situated on the bottom of the tank. In total 290 litres of diesel was spilled into the concrete secondary containment bund. A diesel sheen was observed on the surface of rainwater pools located within the primary containment around the tank. This was due to the poor structure of the bunded area. To prevent small spills out of the containment vessel absorbent padding was placed around the reservoir. The Oil Spill Response contractor was mobilized and clean up work was completed on the same day of the incident.
6.2.2.2 Uncontained (Released to the environment) No uncontained spills were recorded during the year.
6.2.2.3 Clean up Contaminated liquid and solid waste generated from the post incident clean up activities were placed in appropriate hazardous waste containers and transferred to CWAA for the storage prior to final disposal.
6.2.3 Turkey A summary of releases that occurred in Turkey is given in Table 6.2.
Table 6.2: BTC Turkey Material Releases in 2007
2007 Material Releases Less than 1 bbl Greater than 1 bbl
Liquid Liquid Asset Contained Uncontained Contained Uncontained
Gas
BTC Tu 13 8 5 2 0
6.2.3.1 Contained The following spills were greater than 1bbl, but were fully contained: • Estimated 1.9 bbls crude oil (PT3 – January 2007) A crude oil spill due to an Emergency Shutdown valve problem. The oil spilled onto a hard standing and contained area.
• Estimated 4.4 bbls engine lube oil (PT1 – May 2007) Engine lube oil spilled inside the pump house. The spill was contained inside the building.

BTC Pipeline Project
33
• Estimated 113.2 bbls crude oil (PT1 – June 2007) Crude oil spilled during pig launching. The spill was contained in the pig launcher pit..
• Estimated 6.3 bbls crude oil (PT1 – December 2007) Crude oil spilled inside the pump house. The spill was contained inside the building and cleaned up.
• Estimated 12.6 bbls crude oil (PT3 – December 2007) Crude oil spilled inside the pump house. The spill was contained inside the building and cleaned up.
In all cases all of the oil was recovered and re-injected back into the pipeline.
6.2.3.2 Uncontained (released to the environment) All uncontained material releases in 2007 are reported below: • Estimated 0.5 bbls crude oil (ROW – March 2007) Crude oil spilled to the ground due to an illegal tap. 0.6 tonnes of contaminated soil was removed and shipped to CMT CWAA for storage. After BIL established the contaminated soil temporary storage area at CMT in May 2007 the soil was moved to this area. Ultimately the soil will be bio-remediated at a facility to be established at CMT.
• Estimated 62.9 bbls crude oil (ROW – March 2007) Crude oil spilled to the ground due to an illegal tap. 220 tonnes of contaminated soil was removed and shipped to CMT as above.
• Estimated 22 bbls crude oil (ROW – April 2007) Crude oil spilled to the ground due to an illegal tap. 9.4 bbls of oil was recovered and15 tonnes of contaminated soil was removed and shipped to PT4 CWAA. The soil was then shipped to CMT contaminated soil temporary storage area as above.
• Estimated 0.6 bbls crude oil (BVT33 – April 2007) Crude oil spilled to the ground at BVT33 due to operator error during maintenance activities. The spill was cleaned up and 1.5 tonnes of contaminated soil and gravel mixture was removed and shipped to PT4 CWAA. The soil was then shipped to CMT contaminated soil temporary storage area as above.
• Estimated 0.1 bbls crude oil (ROW – June 2007) Crude oil spilled to the ground due to an illegal tap. 35 kg of contaminated soil was removed and shipped to CMT contaminated soil temporary storage area.
• Estimated 0.1 bbls crude oil (CMT On-shore – June 2007) Crude oil from the road tanker spilled to the ground. 30 kg of contaminated soil was removed and shipped to the contaminated soil temporary storage area inside the facility.
• Estimated 0.6 bbls crude oil (ROW – July 2007) Crude oil spilled to the ground due to an illegal tap. 750 kg of contaminated soil was removed and shipped to CMT contaminated soil temporary storage area.
• Estimated 0.5 bbls crude oil (BVT13 – September 2007) Crude oil spilled during pressure equalization activities. Area was cleaned and contaminated gravel was removed and shipped to PT2 CWAA. The soil was then shipped to CMT contaminated soil temporary storage area.

Environmental and Social Annual Report 2007
34
• Estimated 0.4 bbls crude oil (ROW – September 2007) Crude oil spilled to the ground due to an illegal tap which was detected during the intelligent pig run. 300 kg of contaminated soil was removed and shipped to CMT contaminated soil temporary storage area.
• Estimated 0.1 bbls lubricating oil (CMT Marine – October 2007) Lubricating oil spilled to the sea from stern tube of a tug boat. The majority of the spill was contained by using booms.
Details on remediation are given in Section 6.2.3.4
6.2.3.3 Illegal Taps In 2007 there was a 43% decrease in the number of illegal taps discovered in Turkey. Only 1 tap was leaking to the environment at the time it was discovered, however in some cases spills had occurred while the tap was being made (refer to Section 6.2.3.2).
BIL has appointed an internationally recognised sub-contractor to undertake the repairs of the illegal taps. All taps had been repaired with the exception of BTC-HT-T5 which has been secured. This tap was discovered in July 2006. There have been several attempts to position and remove the plug for the illegal tap however they have not been realised due to potential risks. An action plan has been developed and the repair activity is scheduled for Q2 2008.
The Turkish government enacted changes to the Petroleum Market Law to deter acts of crude oil theft. Article 142 of the Turkish Criminal Code now includes crude petroleum theft within the scope of "aggravated theft". This re-categorisation of the crime means that penalties are now stricter than before. For individuals the terms of imprisonment can be for up to 5 years and in the case of an organised syndicate, the term of imprisonment can be in excess of 15 years each for the syndicate members. There are additional avenues for prosecution for illegal taps in accordance with the Prohibition of Smuggling Act, also establish in 2007. This law recognises crude-oil theft as a potential act of smuggling with a penalty of up to two years imprisonment. Court cases related to some of the illegal taps in Turkey are on-going.
Upon discovery of an illegal tap the BIL Environmental and Social department prepares E&S risk assessment reports which are provided to the On-site Commander, the repair contractor and SESMeke teams prior to the repair activities commencing. These assessments provide essential E&S information and clearly identifies mitigation measures to be implemented both as part of the repair, and in case of a spill, during actual repair activities.
6.2.3.4 Remediation A contaminated soil temporary storage area was constructed at CMT in May 2007. Approximately 220 tonnes of contaminated soil was removed to the location which was generated from uncontained spills (see Section 6.2.3.2). A permanent bioremediation area is being planned at the CMT.
An Oil Spill Clean-up and Remediation Plan has been developed by BTC (for implementation by BIL). The Plan provides clean-up and remediation guidance for the Project and describes the actions to be followed to ensure due process is followed in the event of ground/water contamination from a spill. In particular the document addresses the following:
1. Oil spill clean-up techniques for a specific site early in the response operations;
2. Endpoints for clean-up so that oil spill response personnel are clear when their task has been completed;

BTC Pipeline Project
35
3. Demobilization of oil spill response personnel and equipment in a controlled and organized manner;
4. Whether remediation procedures are required on the basis of site-specific risk assessment procedures;
5. The most suitable remediation procedures for particular situations; and
6. Generic procedures to be followed during remediation of oil-contaminated soils or groundwater.
BIL is in the process of developing their own Plans that meets the requirements in the document developed by BTC and addresses the development of the CMT bioremediation area. To date, BIL has held meetings with relevant stakeholders as part of this process. The Plans will be finalised in 2008.
6.3 SUMMARY OF MATERIAL MODIFICATIONS TO THE OSRPs The OSRPs for Georgia and Azerbaijan were updated and amended in May 2007. The main changes to the existing Plans involved re-structuring into three distinct sections; namely Strategy, Action and Data. This was undertaken to make the Plan more user-friendly, to conform to Industry standard and to make it easier to find relevant information during a response. Information contained within the plans was edited to remove duplication of text and to allow the information to flow in a more logical manner. A new section (Action) was added to the plans and is one of the most important sections for a responder. This section now includes Action Cards or checklists of the roles, responsibilities and action for each key role identified within the Incident Management System manual. In the Data section, some forms have also been included. These are the forms needed most frequently or quickly (during an incident) including external notification forms and Tier 3 mobilization forms.
Some of the Appendices were modified or re-placed as a direct request of the Lenders’ Auditors. This includes: the updating of the Wildlife Response Plans; the updating of the Special Response Plan for Tsalka, to include specific reference to the Ktsia – Tabatskuri area; updating the Special Response Plan for Kodiana, to reflect the change in design of the secondary containment basins; the updating and reformatting of the Containment Site Manuals and; the rewriting of Waste Management. A new Appendix, titled, ‘Clean-up and Remediation Procedures’ replaced ‘Remediation after a Spill’.
In addition, an updated version of the Georgian Oil Spill Response Containment Manual was issued in 2007, in English and Georgian languages, for BP Georgia operations.
7 CIP AND EIP PROGRAMMING Implementation of the BTC Additionality programmes is carried out through a series of regional and community-based projects, designed to conserve biodiversity, to deliver local and long term benefits, and to empower local communities to resolve issues for themselves. The Additionality Programmes were formalised into an Environmental Investment Programme (EIP) and a Community Investment Programme (CIP). CIP and EIP are jointly and equally funded by BTC and SCP in Azerbaijan and Georgia. In Turkey these programmes are 100% funded by BTC.

Environmental and Social Annual Report 2007
36
7.1 SUMMARY OF EIP
7.1.1 Azerbaijan A significant milestone was achieved in 2007 with the successful completion of the Green Pack project. This project, which represents the culmination of almost 3 years of intensive work with local and international partners, is a multimedia, interactive educational tool that aims at enhancing environmental knowledge of school teachers and 1-11 grade pupils. The pack contains a teacher’s handbook, a textbook for children, DVD film collection, CD-ROM and dilemma game.
The development of the Green Pack was a joint effort requiring cooperation with and assistance from a large group of leading national environmental non-governmental organisations, academic institutions and regulatory bodies. The content of the pack was approved by Azerbaijan’s Ministry of Education and Ministry of Ecology and Natural Resources and officially included in the national school curriculum.
The project also provided extensive training for teachers and specialists from regional education departments on the ways to present the Green Pack material effectively to school students.
The project, which was funded by BP and its co-venturers in BTC and SCP together with OSCE’s Baku office, was implemented by the Regional Environment Centre for Central and Eastern Europe (Hungary) in collaboration with the Azerbaijani national non-governmental organization For Sustainable Development Society. The total cost of the project is slightly over $400,000 USD, out of which $300,000 was contributed by BP and its co-venturers in BTC/SCP. The remaining $100,000 USD was provided by OSCE Office in Baku.
Another EIP project - Support to Environmental and Energy Initiatives – was also completed in 2007. This project delivered about 13 pilot micro-projects on energy, safety and environment. The project was designed to support improved resource/energy management, promote the use of locally developed alternative energy solutions and reduce environmental degradation in communities primarily along the BTC/SCP Pipelines route. As a result of the programme solar collectors, solar water heaters, biogas units and photovoltaic devices were installed in and handed over to the BTC/SCP communities (see Case Study 3).
The BP flagship Tugay Forest Rehabilitation Project continued in 2007. Major works which included planting of trees, construction of a guardian house, setting up irrigation pump and canals on a 12 ha land plot were successfully completed. The main focus of future works will be on nursing of trees, irrigation, and backfilling as well as protection and control measures.
7.1.2 EIP in Georgia There were three construction phase EIP projects that continued during 2007. One was completed in 2007 while another was initiated. All three projects are due to be completed in 2008. Highlights are as follows:
• Caucasian Black Grouse Conservation in Georgia (Phase 2) implemented by Georgian Centre for the Conservation of Wildlife. The project goal is to initiate and promote implementation of the Caucasian Grouse National Action Plan developed during Phase 1 of the project to ensure that the bird population is stable in Georgia and does not decline.
• Conflict Prevention through Environmental Awareness for Youth implemented by CARE, and co-funded with BTC, SCP, the Austrian Development Agency and CARE Austria. The object of the project was to empower youth to contribute to the social and environmental development of their communities by increasing their peace building capacities and environmental awareness. A new Nature Club was

BTC Pipeline Project
37
established in Tsalka and training was given to 28 teachers and 49 students. Five grants were awarded to small-scale environmental conservation projects. The one year project was completed in May 2007.
• Management of the Small Grants Programme for NGO Capacity Building (Phase 2) along the SCP and BTC ROW implemented by Save the Children in partnership with NACRES. First round grants were disbursed to a total of 14 national NGOs from Kvemo Kartli and Samtskhe-Javakheti regions.
The project will be completed in December 2008.
• Development of a Management Plan for Ktsia-Tabatskuri Managed Reserve implemented by The World Conservation Union (IUCN). The project is jointly funded by both EIP funds and separate offset funds, and has two main goals:
1) Developing a management plan for Ktsia-Tabatskuri Managed Reserve that is endorsed by all stakeholders; and
2) Enhancing capacity at site and national levels to implement this management plan.
The project will be completed in July 2008.
Further programmes are being developed for 2008 and will be funded by the construction phase EIP budget. This budget is forecast to run until the end of 2008, although this is somewhat dependent on the rate of disbursed by the Project.
Starting from January 2008 the Operation’s phase (Phase 3) EIP will commence. This phase will be managed by BP’s Community & External Affairs department. The budget allocation is $300K per year, over three years. . Project activity is expected to commence 2008-Q3.
7.1.3 EIP in Turkey The construction phase EIP projects were completed by the end of 2007, with the exception of several forestation and follow-up activities. These are scheduled to be completed by mid-2008.
In addition to these project activities, the EIP underwent an external evaluation in order to identify the progress against the programme’s original objectives. This evaluation fulfilled a commitment contained within the Supplementary Lenders Information Package (SLIP). The findings of the evaluation are summarised in the next section.
7.1.3.1 EIP External Evaluation The evaluation aimed to provide feed-back to the programme and the individual projects to assist in an effective close-out of the construction phase projects. The external evaluation also provided inputs for the on-going Operations phase projects and for the existing and future strategies of the programme. The section of the external evaluation report regarding the performance against the original Project Environmental Investment Plan objectives is summarised below using direct quotes from the report.
PEIP Objective One: To provide additional benefits (‘additionality’) that go further than mitigation of impacts (Rating: High)
The EIP goes well beyond “mitigating” impacts caused by pipeline construction and operation. EIP has invested in building national and regional capacity to conceive and implement innovative conservation initiatives. Virtually all EIP-I Projects provided strong “additionality”.
The only “weakness” to date under Objective One is the ability of EIP to show support for decision-makers to institutionalize best practices (policies and regulations). This will likely come on line during the next few years as capacity building and “baseline” initiatives bear fruit and EIP funds more “on-the-ground” activities.
Environmental and Social Annual Report 2007
38
PEIP Objective Two: To respond to ongoing initiatives, issues and suggestions raised by stakeholders during the consultation process undertaken as part of the pipeline projects to ensure that they are complimentary and avoid duplication. (Rating: Very High)
Nearly every EIP project funded to date has been complementary and responsive to stakeholder consultations. EIP Staff have endeavoured to work very closely with the entire conservation community, including Government, NGO’s, private sector and communities. They have designed both their program approach and funding strategy to make certain EIP complements on-going and priority conservation initiatives. Almost all stakeholders, including Government officials, stated that EIP has helped them do what they have wanted to do, to do it better, and to do it much sooner than would have otherwise been possible.
Maintaining complementarity under next phases of EIP will present new challenges for the EIP team because there are many more conservation programs and projects underway in Turkey in early 2007 then in 2003.
PEIP Objective Three: To achieve maximum benefit from the level of financial input.(rating: Very High)
The finding is that the EIP was very efficient and cost effective with respect to adding value for BTC. For a relatively small amount of funding, EIP has generated tremendous additional value for BTC in several ways.
We have experience with dozens of donor programs similar in size to EIP. This program has achieved a great deal by all comparisons. This success is made all the more impressive because EIP did it building in-country capacity. BTC has made the initial, and most painful, investment in starting the EIP “business,” now they need to see greater and greater returns on that investment.
The EIP now represents a very sound “start up venture” for BTC. With relatively little capital, EIP has gone from being a concept to being a full-fledged, operational program with strategic momentum. It is a program poised to provide excellent returns for many years. The longer the program runs, the more “profit” will be made from the original capital invested.
PEIP Objective Four: To maximize opportunities for wider national and international application of outcomes (Rating: High)
Even though EIP investments are “limited” to pipeline provinces, EIP is already having national level impacts. EIP’s innovative projects are designed as models that will be picked up by national level organizations and replicated in other areas.
PEIP Objective Five: To include international stakeholders in the development of the EIP and reporting on the outcomes of the actions.(Rating: Medium)
EIP cooperates very closely with both the UNDP and EU. This includes co-funding and co-implementing projects. Due to their association with EIP grants, The Royal Society for the Protection of Birds, Bird Life International and Tour du Valat are broadly aware of BTC’s conservation support. Informal meetings are held periodically between WWF-Turkey and EIP staff.
Although EIP Turkey has likely surpassed the original expectations of international stakeholders, EIP’s reporting to international stakeholders appears to be rather opportunistic and could be improved.
PEIP Principal Objective: Whether the Principal Objective of EIP, composed of the above Specific Objectives, which is the “Delivery of Actions that are of benefit in the promotion and conservation of biodiversity” has been satisfied.(Rating: Very High).
Every action taken to date by EIP has benefited the promotion and/or conservation of biodiversity.

BTC Pipeline Project
39
7.1.3.2 Project Status as at End 2007 Two new grant agreements were signed in 2007 as follows: • Conservation of the Endangered Plants along the BTC Pipeline Region
(Phase 1): The aim of the Project is to contribute to the sustainable use and conservation of biodiversity by conserving certain endangered plant species in Ardahan and Kahramanmaraş. The project is implemented by Turkish Wildlife Conservation Association.
• Eastern Mediterranean Marine Wildlife Rehabilitation Centre: The aim is to establish a rehabilitation centre in order to reduce the death rates of marine animals in Iskenderun Bay which may have become injured or sick due to shipping and industrial activity in the Bay (e.g., boat collision and oil spill).
A summary of key EIP developments in 2007 are as follows:
• Small Investments Fund: Eight small grants projects were initiated:
1. Development of Ecotourism in Kuyucuk Lake, in Akyaka-Kars: 2. Production of Biogas and Biomass from Systematically Collected Cattle
Manure, in Hemite-Osmaniye: 3. Decreasing the Threats on the Fish Populations in the Rivers of Amanos
Mountains, in Dörtyol-Hatay 4. Development of Ecotourism in Yoğunoluk Village, in Samandağ-Hatay: 5. Sustainable and Effective Usage of Resources in the Production of Local
Zerun, Kırik and Şigon Organic Wheat, in Pasinler-Erzurum: 6. Using Wind Energy for Drinking Water of Kırmıtlı Municipality, in Kırmıtlı-
Osmaniye: 7. Technical feasibility of use of Modern Fish Barriers in the Yelkoma Lagoons, in
Yumurtalık-Adana: 8. Boğatepe Village Sustainability and Life with Plants, in Boğatepe-Kars. 9. Promoting the Yumurtalık Lagoons for Conservation, in Yumurtalık-Adana: To
develop alternative income-generating activities and to establish necessary infrastructure for visitor management.
The SIF project Natural Wastewater Treatment in Karaurgan Village, Kars Province, was extended.
• Ecological planning and management of Ardahan-Yalnızçam Forests: The draft forest management plan was approved by both local and national stakeholders including the MoEF. Various training courses were provided to local forestry personnel and other local stakeholders to provide a better understanding of conservation forestry practices and how to implement these practices in a systematic way within the context of the Project. Awareness-raising materials were developed and distributed. Three community development projects which received matching funds from the EU and GEF-SGP were successfully completed.
• Ekşisu Marshes; for Nature and People: A Local Steering Committee was established. The second phase of consultations with local stakeholders were initiated to revise the problems and risk analyses and to define the quick impact project opportunities. A visitor strategy was prepared. A cooperation protocol was established with the MoEF. A local endemic species S. Erzincanicus was successfully reproduced through its seeds. Hunting was officially made illegal in the area.
• Conservation Investment Priority Analysis for the Central and Southern BTC Region: A cooperation protocol between the Implementing Partner and the MoEF was signed to integrate the conservation prioritisation initiatives of the project with those of the Ministry. Extensive ecological and community based field work generated a data set to aid the conservation prioritisation.

Environmental and Social Annual Report 2007
40
• Developing Yumurtalık Lagoons Wetland Management Plan and Identifying Erzurum Marshes Conservation Zones: Focus groups were established as part of the Project to address fishery, dunes, animal husbandry and Halep pinewood and meetings were held with these groups. A draft management plan was developed as the outcome of an intensive participatory process. The plan was approved by the Local Wetlands Commission which demonstrates the local ownership of the plan. Government funds were secured for the implementation phase. BTC also committed funds for the implementation phase. The conservation zones were developed for Erzurum Marshes and approved by the government body responsible for management of wetlands.
• Conservation of the Endangered Plants along the BTC Pipeline: A greenhouse and garden were established in Ardahan in which the seeds of previously specified endemic plants were established.
• Kaçkar Mountains Forest Conservation and Sustainable Rural Development Project: The project is a continuation of the Lesser Caucasus Forest Gap Analysis and aims to demonstrate ecologically-sound community development. The project received a matching fund of $1,800,000 from EU in late 2006. In 2007 the project was restructured and field surveys were undertaken.
• Biogas/Fertiliser Generation in Geben-K.Maraş: Two pilot plants were constructed in a CIP village late 2007. The biogas and fertiliser production will be tested in Q2 2008.
7.1.4 EIP Expenditures, 2007 Table 7.1 shows the amount budgeted for the EIP and the cumulative amount spent since the inception. Table 7.2 and 7.3 shows the breakdown of expenditures for 2007.
The cost effectiveness of projects supported in 2007 greatly exceeded expectations, with a consequence that expenditure over the year was significantly less than planned.
Table 7.1: Construction Phase EIP Budget and Expenditures ($), 2003-2007
Azerbaijan Georgia Turkey TOTAL EIP Budget 2,600,000 3,000,000 3,450,000 9,050,000 Total Spent to date (at end 2007) 975,536 2,009,559 3,390,000 6,375,095
Table 7.2: Summary of EIP (Construction Phase) Expenditures ($), 2007
Azerbaijan Georgia Turkey TOTAL
Planned – 745,497 991,000 1,736,497
Actual – 219,559 986,000 1,205,559
Table 7.3: Summary of EIP (Operations Phase) Expenditures ($), 2007
Azerbaijan Georgia Turkey TOTAL
Planned 1,100,000 0 1,200,000 2,300,000
Actual 188,149 0 1,250,000 1,438,149

BTC Pipeline Project
41
7.1.5 EIP Budget, 2008 The full construction phase EIP budget was transferred to the Operations organisation through the Management of Change Process in 2007 and was fully utilised. The EIP will be funded from Operations budget in 2008 and beyond. Budgets for 2008 are currently under review.
7.2 SUMMARY OF CIP PROGRAMMING
The following table summarise the projects being performed across all three countries under the CIP (Table 7.4). This is followed by an outline of project activity in each country.

Environmental and Social Annual Report 2007
42
Table 7.4: BTC/SCP CIP and Other Investments7 - Visualising the Benefits (up to end 2007)
Investment Type AZERBAIJAN GEORGIA TURKEY Number of communities benefiting 130 79 331 Amount of money invested (US$) $10,08 million8 $3.86 million $13,6 million Implementing Partners (IP)/ Number of local/national NGOs
6 IPs and 1 NGO assisting (a further 4 IPs and 22 NGOs have completed
their CIP)
1 IP and 5 NGOs assisting 4 IPs (all national) and many local NGOs/cooperatives assisting
% Women in Community Action Groups — 22% Varies from 5% to100% according to region. (All CIPs have programmes targeting women)
Number of medical facilities improved 42 2 11 Number of education facilities improved 52 (in addition 14 schools have
received computers) 5 95 (in addition 622 students applied to open school programme most of
whom are girls) Number of water supply systems improved
75 (potable and irrigation) 8 potable, 4 irrigation 120 potable water 13 irrigation
Km of road upgraded 220,97 km 4km Road improvements were not incl. in CIP Turkey (except one village road in Ardahan). Construction Contractors upgraded the roads.
% Infrastructure project achieving >25% community contribution
— 100% 95%
Number of medical staff trained 497 0 399 Number of people receiving direct medical support
183,970 0 Over 34,000 (also over 13,000 people received Reproductive Health training from an EU funded project implemented by a CIP IP)
Number of micro loans issued 12,901 2,640 423 % Repayment rate for micro-loans 99% 100% It is 100% in some villages; however limited in other places. The
average in 63%. The new IP in Kahramanmaraş is implementing a strategy to collect repayments.
Average value of micro-loan (US$) 8519 1,680 750 % Women receiving micro-loans 49.5% 43,7% 8.75% Number of demonstration farms / agricultural trainers
48 agricultural trainers, 49 demonstration fields and 13 farms
102 demonstration farms / 11 trainers
885 demonstration farms
Number of farmers trained 4,330 636 Over 37,000 (also 791 beekeepers) Number of livestock vaccinated — 828 Over 500,000 Weight of high quality seed provided 17,3 tonnes 18,6 tonnes 1,053 tonnes Number of co-operatives established 1 Development Resource Centre in
Yevlakh 4 Agricultural Service Centres
6 Water Purification LLC’s
16 co-operatives ( 9 service and 7 producer groups)
82 (24 cooperatives, Village Development Associations and informal CBOs existing cooperatives also included in capacity building
programme). These organisations are the backbone of the CIP exit strategy in Turkey.
7 Total of US$25 million allocated for BTC and SCP Construction Phase CIP and other community investments for the period 2003 to 2006 8 Amount invested: till 31st 2006-accruals plus amount disbursed, from 1st January 2007 – only amount disbursed. 9 Average value of micro-loan for year 2007 is $1,338.

BTC Pipeline Project
43
7.2.1 Azerbaijan The following activities of note took place in 2007:
• Umid NGO has established Water Purification Programme Phase ll, which started in the beginning of year 2007, and was targeted on communities along the BTC/SCP route affected by lack of potable water
• Save the Children Foundation (SC) has proceeded to Consolidation Phase of Future Communities Programme
• Junior Achievement Azerbaijan has commenced School Economic and Business Education Programme to provide necessary skills and knowledge through economic and business trainings for secondary school students and other interested community members who appreciate free market and business values
• Madad continued School Connectivity and Global Citizenship Programme Phase II for communities along the BTC/SCP route and started similar programme in 2007 for Baku corridor
• Umid started Youth Employment and Economic Opportunities Expansion Initiative to involve youth, living in areas along the Baku corridor to apprenticeship courses and to provide them grants for establishing their own business
• International Medical Corps has continued Rural Inclusive Education Programme, targeted on improving of the skills of the district medical and educational staff to assess early childhood development and evaluate the progress
• SC began Phase lll of Community Investment Programme to enhance positive relations between BP and co-venturers and communities along the pipeline by investing in targeted communities that demonstrate a commitment to becoming models for sustainable community development
• FINCA AZERBAIJAN commenced Community Investment Program Baku Corridor Microfinance Initiative to give increased economic opportunity and provide sustainable, equitable economic growth in BP and Partners affected target areas
7.2.2 Georgia 7.2.2.1 Operations Phase CIP (CIPII) – Year 1
The Operations Phase of the CIP (CIP II) has the goal of enhancing positive relations between BP and communities along the BTC/SCP pipeline route through sustainable socio-economic development. Initially, a one year contract was signed with CARE on carrying out following project themes:
• Community mobilisation • Infrastructure rehabilitation (Case Study 4) • Economic development, including agricultural development, support for business
start up and provision of micro credit (Case Study 5) • Education and youth empowerment. In June 2007 CARE, working with a consortium of 4 national NGOs, successfully completed implementation of the 1st year activities for BTC/SCP Operations phase.
7.2.2.2 Operations Phase CIP (CIP II) – Years 2-3 In July 2007 a new two year agreement was signed with CARE in relation to the implementation of the 2nd and 3rd year activities of CIP II. These activities aim to increase the impact of CIP II through:
Environmental and Social Annual Report 2007
44
• Economic development, including support to the agricultural sector through provision of necessary extension services, strengthening associations and service entities, business development, access to micro financing, with the increased focus on the young women.
• Strengthening of Civil Society, including continuation of leveraged grants to CBOs, infrastructure and training support to the schools, ecological education, empowering youth.
In September 2007 CARE proposed set of activities aimed at assisting small farmers in getting their goods to markets. - the “farmers to Markets” proposal with the budget of $500K over three years 2008 – 2010. This project is due to start in early 2008.
7.2.3 Turkey 2007 was a transition year for CIP in Turkey whereby the programme shifted away from a focus on improvement of basic livelihood activities to broader income- generation projects. At the strategic level, the emphasis was on:
• Enhancing production of high economic-value crops; • Increasing the scale of production to increase profit; and • Provision of assistance on sales and marketing. Additionally, as a cross cutting concern in each project, effort was directed towards developing local capacity to ensure the sustainability of the projects after the completion of the CIP. This has entailed less intervention on the part of the Implementing Partners and transference of responsibilities.
Key achievements in 2007 in this regard were as follows:
• In Erzurum the Cattle Breeders Union completed all vaccinations whereas in the previous year they were completed by the Project;
• The Damal Co-operative completed their first milk collection activity resulting in a profit for its members as well as attracting a $US 30,000 support grant from the sub-governorship for 2008;
• The Erkadın Cooperative, a women’s textile co-operative in Erzincan, completed business development and marketing activities without project intervention;
• A development association in Hemite established a fodder grinding and mixing facility. The Association also won a grant from a joint BTC-UNDP fund to establish a bio-gas facility.
• Farmers in Sivas started organic wheat production and farmers in Erzurum are selling conola to a bio-diesel refinery company in Samsun.
Similarly, each Implementing Partner developed a CIP programme exit strategy. These strategies were based upon the recommendations presented in the Construction Phase CIP Final Evaluation and the outcomes of internal evaluations undertaken by each Implementing Partner. The strategies concentrated on two main areas, income generation and capacity building of local organisations.
7.2.4 CIP II Expenditures 2007 Construction phase CIP finished in June 2006 (with carry over of funds until July 2006) and total expenditure was reported in the 2006 Annual Report to the Lenders.
A further programme, CIP II, which commenced in June 2006, was drawn up to cover the period 2006 - 2008. US$8.25 million was allocated to Azerbaijan, US$4.9 million to Georgia and US$6.2 million to Turkey. An increase to the Turkey budget, mentioned in the 2006 Annual Report was realised and the funding was scaled up from $4,200,000 to $7,295,000. The increase was provided due to the recognised benefits of extending the timeframe of the development programmes to ensure successful exit and closure. This realisation was supported by positive feedback from external reviewers.

BTC Pipeline Project
45
CIP expenditures for the total Operations phase and for the year 2007 are summarised in Tables 7.5 and 7.6.
In Georgia CIP II expenditures for 2007 included expenditures associated with the CIP II 1st year contract, which was completed in June 2007 and expenditures for the CIP II two-year contract effective from July 2007.
CIP II 1st year contract value was $1,470,000
CIP II 2nd and 3rd year contract value is $2, 390,000.
Table 7.5: Operations Phase CIP II Budget and Expenditures ($) 2006-2008 (BTC/SCP only)
Azerbaijan Georgia Turkey TOTAL CIP II Budget 5,623,000 3,900,000 6,200,000 15,723,000 Total Spend up to the end 2007 4,362,000 3,351,000 5,100,000 12,813,000
Table 7.6: Summary of Operations Phase CIP II Expenditures ($), 2006 – 2007 (BTC/SCP only)
Azerbaijan Georgia Turkey TOTAL Planned 3,919,000 2,865,000 5,000,000 11,784,000 Actual 4,353,000 3,351,000 5,100,000 12,813,000
Table 7.7 shows the amount from the CIP II budget spent in 2007. Note this includes expenditures for two agreements – Year 1 and Year 2-3 agreements.
Table 7.7: Summary of BTC/SCP CIP II Expenditures ($), 2007 only
Azerbaijan Georgia Turkey TOTAL Actual 2007 2,920,000 1,945,000 3,500,000 8,365,000
7.2.5 CIP Budget, 2008 The BTC CIP II budget for 2008 is presently under review.
8 PROJECT COMMUNICATION
8.1 CONSULTATION APPROACH Consultation and communication with various Project stakeholders, from communities to Government organisations, was ongoing during 2007.
A key objective of Project consultation is to avoid situations that could lead to complaints. Where complaints do arise, as is inevitable for a project of this size and complexity, effort is made to ensure they are resolved promptly. Information on complaints raised by project affected communities is detailed below.
Across the Project, significant efforts are also made to engage other Project stakeholders, such as national NGOs, government ministries and the local and national media. Information on meetings held with key stakeholders in 2006 is provided below.

Environmental and Social Annual Report 2007
46
8.2 AZERBAIJAN
8.2.1 Project Affected Communities There were a number of community relations initiatives launched by Operations’ Social Team in response to various requests from Project Affected Communities.
There were 5 complaints/requests relating to ROW crossings. Operations social staff worked closely with technical and land teams and, as a result of joint efforts, including the construction of seven additional crossings, all related complaints/requests were resolved to the satisfaction of the community members.
Operations social staff have since taken a proactive approach and have developed an action plan to identify all crossings available, and those that need to be built, on all three pipelines (BTC/SCP/WREP). The crossings data will be communicated through Community Liaison Officers (CLOs) to community members, landowners, operations patrolling and Export Pipelines Protection Department (EPPD) staff. Relevant training will be also delivered to EPPD officers in the regions.
The other initiative developed by the social and security teams involves the formation of the Regulatory and Emergency Response Committees. The goals of these Committees are to facilitate effective community liaison, effective interaction with local regulatory authorities in regards to complaints resolution, and awareness in relation to company activities as well as communication in the case of emergency. A letter from Onshore PU Leader was sent to the Ministry of Energy and Industry with a request to support this initiative at a district level. The Minister of Energy and Industry has sent a letter to each district authority requesting their support in arranging such committees. The committees have now been formed in each district affected by the pipelines.
The handover date of complaints management from the Construction Social Team to the Operations Social Team was 1st September 2006. Considerable work was carried out during 2007 to resolve outstanding complaints remaining from the Construction phase. By the end of the year only two remained. Both related to bridge damage in Kurdamir and Samukh. BTC is ready to overtake the maintenance works on both bridges and is currently finalizing an agreement with an assigned contractor.
Table 8.1 summarises the type and status of complaints received during 2007. Two infrastructure related complaints remaining from year 2006 are not included into the second column.
Table 8.1: Summary of Complaints received by BTC/SCP, 2007 (Azerbaijan)
Complaint Category Complaints received Complaints open at end of 2007
Orphan land cases 2 0 Irrigation 10 0 Damage to infrastructure 3 0 Compensation for land/crop 8 5 Reinstatement 3 0 Land use 4 0 Damage to property 9 1 Access Roads 1 0
TOTAL 40 6

BTC Pipeline Project
47
8.2.2 NGOs and Technical Organisations During 2007, regular dialogue with NGOs continued through quarterly “NGO Dialogue Sessions”. During these sessions BP representatives shared information about business developments in Azerbaijan.
Regular meetings were also held with a broad range of national (Madad, GABA, Umid) and international NGOs (Junior Achievement Azerbaijan, Save the Children, FINCA) to discuss ongoing and future community projects.
8.2.3 Government
Dialogue continued with government ministries, including the MENR and the Ministry of Emergency Situations. Topics included facility inspections, the Right of Way Access Strategy and BTC expansion.
Winners of the 6th Biodiversity competition were announced a ceremony in December. The competition was held in two categories – the best biodiversity project and the best environmental awareness project. A total of 80 entries were received coming from 44 different organisations.
8.3 GEORGIA
8.3.1 Project Affected Communities The BTC Community Liaison team continues to work and communicate with local communities on a regular basis. A summary of the main achievements in 2007 is as follows:
• Development of a Community Communications Plan for 2007. This plan included details for meeting village communities on a regular basis.
• Preparation and distribution of a 2007 calendar to all villages along the ROW. The calendar included information about land use restrictions in the vicinity of the pipeline and how to contact Company in the event of queries. A writing competition was conducted amongst school students living in project affected communities based on the theme “BP – Neighbour of Choice”. A committee of Company employees selected the top 12 entries, with the winners and their schools receiving prizes. The winning entries will feature in a 2008 Calendar that will be widely distributed along the ROW.
8.3.1.1 Complaints The Community Liaison Team, along with the Land Team, implements the Third Party Complaints procedure and addresses disputes from communities. All complaints are received and registered in the Company grievance log. Complaints are either resolved by the Social team, or diverted to other departments for further actions.
In 2007, 110 complaints were considered, including 26 carried over from the Construction phase (Table 8.2).
Table 8.2 Operations Phase Complaints Log Statistics (as of December 2007)
Complaint category Total number received to
date
Number of complaints
resolved
Total % of complaints
resolved
Number of complaints
pending
Additional Land 21 21 100% 0 Irrigation 12 10 83% 2 Land Handback 15 12 80% 3 Orphan Land 7 7 100% 0 Other Land Issues 17 16 94% 1

Environmental and Social Annual Report 2007
48
Complaint category Total number received to
date
Number of complaints
resolved
Total % of complaints
resolved
Number of complaints
pending
Parcel Ownership or Size 3 3 100% 0 CBO Compensation 1 1 100% 0 Community Infrastructure 12 8 67% 4 Cracked house 3 3 100% 0 Employment 6 6 100% 0 Household Infrastructure 9 9 100% 0 Nuisance 2 2 100% 0 Miscellaneous 2 1 50% 1 TOTAL 110 99 90% 11
8.3.2 National NGOs and Technical Organisations Throughout 2007, BP continued to engage with the Georgian civil sector through regularly organizing meetings, delivering presentations, responding to queries, providing updates and launching structured programs and projects.
In 2007, a new initiative targeted at strengthening Georgian civil society was launched. From among many concept papers solicited from national NGOs, a concept proposed by Transparency International Georgia (TI) was selected as the best and a full proposal was subsequently developed. The implementation of the one-year project Promoting Understanding of the Energy Sector in Georgia started in September. The aim of the project is to increase public awareness of the energy sector in Georgia and to disseminate information throughout the country about related reforms.
BP in Georgia continued engagement with NGOs involved with the Pipeline Monitoring and Dialogue Initiative specifically to review the company’s response to the recommendations provided by the NGOs in their audit reports.
8.3.3 Government Ministries and Departments There is a close, constant interaction with Georgian Oil and Gas Corporation and the Government MEP representative, on number of key issues. Regular meetings are also held with the Ministry of Energy in relation to approval of Construction Rights Agreement for State Lands, and issues linked with additional gas supply from Azerbaijan.
BTC Co concluded $10 million grant agreement with the Ministry of Finance on rehabilitation of certain state roads damaged during the construction.
BTC has also maintained dialogue with the Ministry of the Environment and Rustavi Municipality in relation to plans to development of modern non-hazardous waste landfill. As a result land for the landfill has been secured. Design of the landfill and a related ESIA are now being prepared for submission and approval by Government.
Efforts to improve relationships with the Customs Department with respect to improving the efficiency of clearing imported goods and developing a simplified emergency border crossing protocol, have continued.
8.3.4 Media During 2007, various media activities took place in Georgia including:
• A media round table arranged for local media, covering general BP business activities and social projects

BTC Pipeline Project
49
• Press releases and interviews associated with the opening of the BP auditorium at the Georgian National Museum
• Interviews recorded with BP Georgia’s country manager, after the signing ceremony held in the ministry of Finance for the rehabilitation of certain state roads
• The 5th BP Biodiversity Competition award ceremony involving BP management, Government, scientists, local NGOs and media;
• Print and television interviews given as part of a SME Policy Development Project (RDI/IFC financed) and another SME support project in Borjomi (in partnership with GTZ, a development agency owned by the German government)19;
8.3.5 Donor Organisations BTC continued to meet with various development organizations in Georgia including: UNDP, USAID, World Bank, IFC, Millennium Challenge Commission Georgia and several national and international NGOs.
BTC, in collaboration with number of international organizations continues to implement a number of projects in Georgia, including: solid waste management programme as part of the Greater Borjomi Initiative10 (in association with GTZ); Georgia Enabling Business Environment Project (IFC); Corporate Governance Project (IFC), Business Development project in Borjomi (GTZ), Technical Assistance and Landing Support to Constanta Foundation (EBRD), Technical Assistance to Georgian Oil and Gas Corporation (EBRD and MCC), Engineering Design for Water and Sewage System in Borjomi and Bakuriani (EBRD).
Regular talks with donor organizations continue with the aim of defining potential areas for future engagement.
8.4 TURKEY
8.4.1 Complaints During 2007 BIL received 89 complaints. A breakdown of the complaints by category is shown in Table 8.3.
Table 8.3: Total Number and Category of Operation Complaints received, 2007
Subject Number 2006 Number 2007 Residual Open 2007
Employment 24 2 0 Reinstatement 12 37 14 Access to land and other resources 2 0 0
Damage to property, crops and land 2 16 11
Damage to infrastructure and community assets 3 10 2
Dust 1 1 1 Payment to service provider 5 7 1
Local Procurement 3 1 1 Outstanding expropriation payment 0 13 2
10 The Greater Borjomi Initiative (GBI) was set up by BP under the Regional Development Initiative in 2004, and allocated a budget of approximately US$4 million. The GBI aims to contribute towards the socio-economic development of the Borjomi region.

Environmental and Social Annual Report 2007
50
Subject Number 2006 Number 2007 Residual Open 2007
Misconduct of BIL employees 0 1 0
CIP – perceived inequity in distribution of support 0 1 0
TOTAL 52 89 32
During 2006 BIL received 52 complaints from the time Operations commenced (end July 2006) to the end of the year or, on average, about 10 complaints per month. The average number of complaints per month during 2007 has dropped to about seven. All residual Botaş complaints (5 from 2006) were transferred to the BIL system for management and have since been closed.
During their visit in June 2007 the SRAP panel concluded that community complaints were likely under-represented as the BIL Public and Community Relations (PCR) department had not, at the time of the audit, achieved good coverage of all the project affected villages due to lack of vehicles and human resources. In addition, it was understood by the SRAP panel that complaints recorded by other organizations were not being passed to BIL in a systematic way for closure and therefore, were potentially being lost. BIL, in conjunction with BTC has revised their complaints procedure and developed a strategy for maximizing visits to un-visited or under visited communities prior to winter11.
The majority of complaints received during the 2007 period related to reinstatement following construction. Many of these can only be closed once reinstatement teams are mobilized to site in the Spring.
Other complaints related to crop and land damage. These represent a combination of residual issues from construction as well as new issues relating to illegal tap repairs. Land repair and compensation for damages resulting from illegal taps have largely been completed by BIL. Some issues cannot be resolved until the Spring.
The third highest category of complaints related to payment for land. At the pump stations the camps continue to be occupied (refer to Section 4) requiring additional agreements and payments for temporary land occupancy. However due to the transition from Construction to Operations, and therefore Botaş to BIL, there wasn’t a mechanism in place to make the payments. This process was accelerated as far as possible and these payments have now been made. Open residual complaints relating to this issue, shown above in Table 8.3, relate to a disagreement regarding whether payment is required from the construction period and a delay in payment related to banking administration.
8.4.2 Consultation 8.4.2.1 BIL
A breakdown of meetings held by BIL in 2007 is shown in Table 8.4.
BIL has allocated BIL PCR experts to sections of the pipeline. There are currently four covering the pipeline and an additional one located in Ceyhan to cover the CMT and IPT1. During the first half of 2007 BIL PCR experts did not have exclusive access to their own vehicles in the field, due to the slow release of vehicles from the Construction phase. After the SRAP audit in June 2007 (see above), BIL PCR experts gained access to their own vehicles and a strategy was put in place to ensure wide coverage of visits to previously un-visited project affected villages. 11 Despite these changes the number of complaints received over the two time periods, pre-SRAP visit and post SRAP visit, was not greatly different, 40 and 49 respectively. Regardless as BIL continue to improve their coverage in the villages it is recognised that community complaints may continue to rise for a short period before tailing off in subsequent years.

BTC Pipeline Project
51
To assist in the consultation process an Operations Community Pamphlet was prepared (as a follow-up to the 2005 pamphlet). This phamplet provided updated information on BIL (as the Operator of the pipeline,) third-party crossing restrictions, community safety; pipeline security, oil spill response and planning and Project contact information. It was widely distributed to villages and stakeholders.
Table 8.4: BIL Community Meetings, 2007
BIL Community Meetings No. of Village Meetings
Stakeholder Meetings
Introductory meetings 137 39 Regular Meetings (follow-up to introductory meetings)
95 43
ER/Oil Spill Drill Notifications 10 2 Land-use Restriction Notification meetings* 164 14 Women’s Meetings 9 - Third-party crossings* 4 7 SRAP Audit 19 - Illegal tap consultation meetings/ROW Security 13 2 Other (holiday courtesy visits; response to particular issues etc)
11 34
TOTAL 457 141
*The scope of introductory and regular follow-up meetings includes land-use restrictions and third-party crossings. These subject specific meetings were held in some cases to re-emphasise these issues where considered necessary.
BIL stakeholder communications included consultation meetings with local Gendarme, Provincial governors, District sub-governors, Mayors, Government utility providers, Government Departments etc. The purpose of these meetings was similar to village level meetings, i.e. to introduce BIL and discuss restrictions regarding land-use and third-party crossings. Throughout the year the PCR Department of BIL also hosted official visitors to CMT including country representatives, government officials and NGO representatives.
8.4.2.2 BTC In addition to meetings held by BIL, BTC also undertook various stakeholder meetings. The majority of the meetings related to Investment Programmes (EIP, CIP and RDI). Investment stakeholders with whom meetings were held included local, regional and national government representatives, development/doner organisations such as UNDP, NGOs, and to a lesser extent embassies, universities and private businesses. The purpose of the investment stakeholder meetings was to raise awareness and support for the investment activities, understand government and NGO future priorities and strategies, seek additional funds, etc.
BTC also held meetings and other formal communications with the Ministry of Environment and Forestry (MoEF) and Ministry of Energy and Natural Resources (MoENR) with respect to Operations, BTC Expansion, Enhancement Projects, as well as clarifications on environmental legal requirements such as discharge standards and the national EIA process.
A summary of the number of meetings or other formal communications held by BTC is shown in Table 8.5. Note that the number of meetings held does not include meetings held by EIP/CIP Implementing Partners. The Implementing Partners held many district level meetings in addition to those shown in Table 8.5.

Environmental and Social Annual Report 2007
52
Table 8.5: BTC Stakeholder Meetings, 2007
Type of Meeting No. of Consultations* Donor 17 Government 14 NGO 6 Private companies 2 Vendor 1 University 1 Embassies 2 International Conference 1 TOTAL 44
* In many cases, consultation can represent a series of meetings on the same subject.
9 LAND ACQUISITION AND COMPENSATION The land acquisition and compensation process, land hand-back and livelihood restoration activities are described in the Resettlement Action Plan (RAP). This section of the report gives a summary of relevant activities conducted in 2007.
9.1 AZERBAIJAN
9.1.1 Acquisition and Compensation The primary land acquisition and compensation process for the pipeline ROW in Azerbaijan is substantially completed (Table 9.1).
Table 9.1: Land Acquisition Statistics and Data (cumulative up to 31st December, 2007)
Event/Activity Status % of Total Primary Land Acquisition: Payments made to owners / users (% of total number of owners / users)
Bank accounts have been established for all people, in all districts, except for 9 unavailable landowners (compensation for these owners has been retained until such time as they are located).
99.9%
Supplementary Land Acquisition Programs: • Notification Letters Sent • Land Use Agreements
Extended • Compensation Paid
SLAP1: 4,763 parcels (from a total of 4,838) SLAP2: 1,365 parcels (from a total of 1,370)
98.6% 99.2%
Number of lots reinstated and handed back to owners/users Land Hand-back to landowners, as
documented by Exit Agreements, almost completed. 6,646 land plots were handed back to the land owners/users.
99.1 %
During the reporting period there have been no significant issues relating to the primary acquisition and compensation process. Some post agreement cases attributed to technical errors (refer Annual Report 2006) are ongoing.

BTC Pipeline Project
53
9.1.2 Land Hand-back In accordance with Land Lease Agreement, Article 2.04 (b) “As soon as practicable after construction of the Pipelines is completed, the State shall ensure that re-cultivation works are carried out and that the Construction Corridor is returned to its original condition”.
• By the end of March 2007, 6,646 land parcels had been handed back to the land owners/users and corresponding Land Exit Agreements signed. Although the signing of the Land Exit Agreements has covered 98.1 % of land parcels, there are a number of cases when the Contractor is not responsible for the signing of the Land Exit agreements.
In addition to the cases mentioned above there are still 31 cases of refusals to sign the land exit agreements. Such cases have been included in the action plan noted above.
Further to SRAP audit (October 2006) recommendation that “the Project is to specifically monitor in the coming months any refusals to sign the land exit protocols”; it is worth underlining that the Project, together with the Contractor, have organised a systematic review of outstanding refusals as well as other pending construction-related grievances. Instances where the Contractor could not manage to obtain a sign off of Land Exit Agreements, the Construction and Operations land team have now done so.
9.2 GEORGIA
9.2.1 Acquisition and Compensation All construction activities on BTC and SCP pipelines are 100% complete. Reinstatement of the ROW is also complete. Land use agreements for some off ROW facilities have been extended (camps, yards, helipads etc).
A summary of land parcels for which compensation has been paid is shown in Table 9.2.
Table 9.2: Number of Land Parcels for which compensation has been paid (to end December 2007)
Private land Parcels High Mountain Village Land Parcels
State Leased land Parcels
District Required Actual Required Actual Required Actual
Total 3,750 3,703 208 208 239 224
% Complete 99% 100% 95%
9.2.2 Land Registration and Ownership The major issue subject to court consideration continues to be a case of privatisation of Dispute over 78 land parcels which were State owned and were allocated to the Project by the State Authorities remains unresolved. In the village Tabatskuri compensation has been paid for the original acquisition of the ROW but not for securing servitudes and restrictions. This affects 98 pasture and arable land plots. The situation prevents BTC from completing registration of its ownership over these plots.
Seven title holders cannot be located (mostly because he/she now resides abroad). BTC has applied to Court to obtain “Necessary Right-of-Way” while attempts to locate the absentee landowners continue.
9.2.3 RAP Fund RAP Fund activities in Georgia are totally complete.

Environmental and Social Annual Report 2007
54
9.2.4 Land Hand-back The agreed strategy for the hand back of land use to the original owners and for acquisition of use restrictions within the protection zone is being implemented. The process has continued in Gardabani, Borjomi Ahaltsihe and Adigeni Districts, with the appropriate information packages and offers distributed to a total of 2585 landowners (approximately 75% of total for entire route). Follow up meetings have taken place, with 1,586 (96%) owners agreeing to the offers. A total of 1,720 (65% of distributed agreements and 50% overall) owners have completed the necessary formal documentation and received payment. The process will continue during 2008.
9.3 TURKEY
9.3.1 Acquisition and Compensation The initial land acquisition and payment process continued throughout 2007. Outstanding issues to finalise the initial land acquisition process related to Article 10 cases and misidentification of customary land owners (see 2006 and previous reports). Table 9.3 provides the status as of the end of 2007.
Table 9.3: Land Acquisition and Compensation Progress (December 2007)
Information Provided by Botaş DSA (DSA MONTHLY REPORT:
DECEMBER 2007)
Indicators
Total (by parcel) Percent Complete
Title Deed Registration (Note. Change in statistics is due to Those subject to transfer, owing to different configurations).
11,735 96.65%
Resolution of Article 10 Cases 4,657 91.58%
Overall Land Acquisition (Excluding item iv and v) 16,798 96.28%
Transfer or Rights to Land Status (Note. Those subject to transfer, owing to different configurations, are c. 18,000)
17,877 90.45%
As part of the re-identification of customary ownership, cadastral surveys were completed in 2006, results disclosed and an evaluation was completed to determine the approach to compensation. BNB (formerly RUDF), on behalf of BTC, has been involved in the independent monitoring of the compensation process during 2007. Compensation was completed in 2007.
Throughout 2007 Botaş/DSA acquired additional land in response to as-built survey results and the pipeline ROW as-built alignment. By the end of 2007, 96.65% of land had been acquired. BTC will continue to monitor this process closely.
9.3.2 Land Management during Operations BIL and Botaş/DSA have developed a Land Management Plan which outlines future roles and responsibilities between DSA and BIL.
9.3.3 Land Exit Land exit was deemed complete by Botaş, with the exception of those Land Exit Agreements that were outstanding due to the misidentification of customary owners. During the customary owner compensation work, further land exits were obtained once the compensation had been made.

BTC Pipeline Project
55
9.3.4 Transfer of Land Rights Transfer of Rights activity has been conducted on a District basis using two Official Acts: 1) private/customary owned land; and 2) state/forest owned land. Due diligence reviews, were conducted by BTC representatives prior to the Transfer of Rights process being completed. By the end of 2007, 90% of parcels had been transferred to BTC
9.3.5 Misidentification of Customary Owners Compensation to misidentified customary owners is being performed in a two stage process: 1. First Tranche: Compensation of individual vs state (including forest) cases. During
this compensation exercise, consultation will be carried out to test the mitigation measures considered for individual to individual cases. The consultation exercise will be used to evaluate and determine the lowest risk approach between the two options ‘direct compensation’ or ‘loan’ assistance.
2. Second Tranche: Compensation of individual vs individual cases will be made according to the findings of the consultation undertaken with landowners.
First tranche payments involved owners of land in 15 villages in LOT A identified as treasury or forest lands during customary ownership identification (priority cadastre works). These owners were compensated by the RAP fund between 26 – 31 March.
Second tranche payments involved owners of lands in 20 villages in LOT A identified as individual to individual cases (primarily) during customary ownership identification (priority cadastre works). This group was compensated by the RAP fund between 14-19 April.
The compensation exercise was executed by a compensation team comprising BTC Co, and third party observers from DSA and BNB.
A summary of the third party observation of both first and second tranche work is provided below.
• The affected persons were satisfied with the compensation payments. Those who received compensation were satisfied with the amounts paid.
• In LOT A, after the payment of the compensation, land exit protocols were signed.
• Customary ownership identification errors which remained on the agenda during the Project’s land acquisition process within the range of Tranche 1 and Tranche 2 were resolved with these payments.
• Legal explanations were provided to those people who had requested compensation but were not eligible, providing the reasons for their ineligibility.
• A number of those not yet compensated had either ongoing or awaited priority cadastre works court cases. Following the closure of these court cases the persons were duly compensated. However, because the court process took considerable time, Botaş/DSA continued to stay in contact with the landowners and followed the process to ensure that the compensation payments were provided.
• All landowners have been compensated. This achievement owes much to BTC’s commitment to the prescribed criteria in every stage of the Project in compensating the landowners.
A full third party report was made available during the SRAP visit in June 2007. The current status is reported in Table 9.4 below.

Environmental and Social Annual Report 2007
56
Table 9.4 Customary Ownership Compensation Status Based On Priority Cadastre Work Results
District Village TOTAL Individual to individual (TRANCHE 2)
State to individual (TRANCHE 1)
Parcels Total Achieved Total Achieved
Sarikamiş Akören 17 4 4 13 13 Sarikamiş Karaurgan 19 6 6 13 13 Sarikamiş Kurbançayiri 8 4 2 4 4 Sarikamiş Süngütaşi 8 1 1 7 7 Posof Kayinli 10 3 3 7 7 Posof Türkgözü 2 2 2 0 0 Posof Söğütlükaya 1 1 1 0 0 Susuz Büyükçatak 76 21 21 55 55 Selim Başköy 12 4 4 8 8 Selim Hasbey 1 1 1 0 0 Selim Darboğaz 24 0 0 24 24 Selim Tuygun 7 0 0 7 7 Selim Bozkuş 13 0 0 13 13 Selim Karakale 3 3 3 0 0 Selim Beyköy 2 0 0 2 2 Selim Gürbüzler 14 14 0 0 0 Şenkaya Kaynak 63 22 19 41 34 Şenkaya Şenpinar 5 1 1 4 2 TOTAL 327 117 96 210 200
Source: DSA February 2008
The remaining cases are being dealt with on a case-by-case basis by the DSA regional offices. These include:
• For 38 parcels, DSA has compensated the parcels through bank accounts as the owners were absent.
• For 16 parcels compensation payments could not be made as the parcels are disputed.
• For 15 parcels, compensation payments could not be made as there is ongoing court case against Botaş.
9.3.6 RAP Monitoring 9.3.6.1 Land Acquisition
BNB has continued to monitor both the land acquisition process and construction impacts on communities during this reporting period.
To date, BNB have conducted about 1170 meetings with communities located adjacent to ROW and AGIs. Please refer to Section 9.3.5 for a summary account of BNBs findings during the customary ownership compensation activity.
9.3.6.2 Household income surveys by Ankara University Full details of the Household Income Surveys report carried out by Ankara University are given in 2006-H1. This is the first annual replicate household income survey on almost a third of all affected villages.

BTC Pipeline Project
57
9.3.6.3 Fishermen Monitoring Two monitoring surveys were undertaken by a third-party consultancy, ISTEM in 2007.
• The fifth monitoring survey was undertaken between the 27th April and the 7th May 2007 and;
• The sixth monitoring survey was undertaken between the 26th November and the 12th December 2007.
The aims of the surveys were to:
• identify whether there is any change in fishing activities (daily catch amounts, types of fish etc) and income levels of the active fishermen and thereby determine the effectiveness of the livelihood restoration plan;
• analyse the changes in the number of active fishermen and boats, and propose the possible reasons for this;
• identify the impact of BTC Operations on fishing activities (whether tanker traffic has an impact on current fishing activities, the impact of implementation of the restrictions around the jetty etc).
ISTEM conducted questionnaires and held face to face meetings with the fishermen in Golovasi to collect data on daily catch stocks, types of fish etc. They also held consultations with tradesmen, fisheries Cooperative management and other relevant local stakeholders (harbour authority, Coast Guard, district agricultural directorate, fisheries department at Cukurova University etc). Due to the on-going court cases (see below), ISTEM noted that during the study data collected from fishermen and other stakeholders could not always be relied upon as objective. ISTEM therefore cross checked this data with other data collected from tradesmen and fish restaurant owners as well as their own direct observations at site.
The main findings of the surveys are summarised below:
a. There is no significant change in the average catch statistics compared to the baseline information (2003) and therefore no significant impact of BTC Operations on daily /yearly catchs
b. Yearly average catch amounts in 2007 are higher than the baseline (May 2003) conditions including for species with significant commercial value (e.g. shrimps).
c. Seven new boats were purchased since the fishermen received compensation in 2004. Five of the boats were purchased by previous fishermen and two of them were purchased by two new fishermen.
d. During 2007 only 20 fishermen out of the original 48 were observed to be actively involved in fishing activities (18 full-time and two part-time). The remainder of the fishermen now reside outside of the village or have found full-time positions in private companies (including BIL sub-contractors). This data was confirmed by tradesmen records.
e. Average income of the fishermen households increased by approximately 22% in USD compared to the baseline (2003).
f. There is no discernable impact of the tanker traffic on fishing activities due to the different time schedules of tanker and fishing activities.
g. In the last 6 months 5 fishermen had to pay fines due to lack of certification and necessary on-board equipment. Fishermen claim that the reason for the increase in the fines levied by the Coast Guard is due to BTC Operations. After inquiries and investigation these claims have not been substantiated.
Environmental and Social Annual Report 2007
58
During 2007 there were a number of developments relating to the Yumurtalık and Golovasi Fishermen Lawsuits. A summary of the lawsuits filed by the fishermen of Yumurtalık is as follows:
• The Yumurtalık Cooperative filed a lawsuit against BTC and Botaş claiming compensation for loss of income from BTC Project impacts on fish stocks (refer to the 2006 Annual Report for full summary).
• The Civil Court has dismissed the lawsuit due to a lack of standing.
• The Plaintiff Cooperative applied to the Court of Appeals.
• The Court of Appeals upheld the verdict of The Civil Court. The Plaintiff applied for a further appeal, however the Court of Appeals rejected the Plaintiff’s request for a further appeal. The court decision for the Yumurtalik Co-operative case is final and closed.
• After this decision the 80 fishermen who went to court under the Yumurtalik Cooperative filed a lawsuit against BTC Co and Botaş as a collection of individuals.
• At the last hearing, the expert evaluations could not be undertaken due to the bad weather conditions. The Court determined to re-schedule the expert evaluation to the 12th March 2008. It will be held at CMT.
The lawsuit filed by the Golovasi Cooperative was dismissed by the Court due to lack of standing in line with the Court’s previous decision regarding the Yumurtalık Cooperative case. The Plaintiff has not appealed the decision.
10 SUMMARY OF KEY HEALTH AND SAFETY STATISTICS BTC reported two sets of health and safety (H&S) statistics in 2007: Construction and Operations as both sets of activities were evident across the three countries, although work carried out by the construction team was limited.
Whether construction or operations related, H&S performance is reviewed on an ongoing basis and monthly reports are produced for both management and partners
Table 10.1 presents an overview of performance.
Table 10.1: Comparison of BTC and International Industry Safety Performance
BTC Statistics for 2005
BTC Statistics for 2006
BTC Statistics for 2007
IPLOCA Statistics for 2004
Contractors submitting data 9 5 6 56 Total man-hours 23,477,749 3,407,082 2,073,578 650,123,559 Project Reportable Fatality 1 1 0 34 DAFWC 13 1 0 2,247 DAFWCf rate 0.11 0.06 0.00 0.69 Notes: IPLOCA – International Pipeline and Offshore Constructors Association 200,000 man hours is used to calculate DAFWC frequency DAFWC: Days Away from Work Cases (frequency)
10.1 H&S OUTPUTS (CONSTRUCTION)
A summary of the H&S performance for construction during 2007 is shown in Table 10.2.

BTC Pipeline Project
59
Table 10.2: Project Performance Outputs, 2007
Project Performance Outputs Year to Date Project to Date
Man-hours 2,073,578 112,463,480 Kilometres Driven 564,729 212,341,352 Vehicle Accidents 1 415 Fatalities 0 10 DAFWC 0 56 Medical Treatment and Restricted Work 1 278 Recordable Illnesses 0 287 Total Recordables 1 631 First Aid Cases 1 1,264 Near Misses 10 825
10.2 H&S INPUTS (CONSTRUCTION) Inputs such as STOP observation cards and Safety Observations and Conversation12 (SOC) far exceeded the target, whilst safety training hours were below target, although given the stage of the project and recruitment activity it was always anticipated that it would be difficult to sustain this target since the vast majority of workers had received their H&S training in earlier year/s (Table 10.3).
Table 10.3: BTC H&S Performance Against 2007 Targets (Construction Phase)
Performance Indicator 2007 Target 2007 Actual
Inputs Safety Observations and Conversation (SOC) 600 945 STOP Observation 3,000 3,838 Safety Training Hours 4,000 4,030
10.3 H&S STATISTICS A summary of H&S performance during 2007 for Operations is presented in Table 10.4.
Table 10.4: BTC H&S Performance Against 2007 Targets (Operations Phase)
2006 Performance 2007 Performance Performance Indicator
2006 Target BP BIL
2007 Target BP BIL
Man-hours n/a 1,244,352 1,958,959 n/a 1,260,057 2,635,456 Km Driven n/a 6,029,156 3,568,746 n/a 6,471,426 6,064,092 Outputs Fatality 0 0 0 0 0 0 DAFWC frequency
0.02 0 0 0.02 0 0
RINJ frequency 0.35 0 0 0.28 0,32 0,30 High Potential Incident (HiPo) frequency
0.01 0 0.10 0.02 0 0.08
12 SOC replaced ASA effective 1 October 2007. Data provided for SOC includes ASA as well, since these programmes are similar.

Environmental and Social Annual Report 2007
60
2006 Performance 2007 Performance Performance Indicator
2006 Target BP BIL
2007 Target BP BIL
Traffic Vehicle Accident Rate (TVAR)
0.50 0.995 0.56 0.50 1.24 1.48
TVA n/a 6 2 n/a 8 9 Red figures = above target; Green figures = below target BP = BP operated section of BTC (Azerbaijan & Georgia) and the BTC Assurance Team in Turkey
11 E&S MONITORING PROGRAMME
11.1 INTERNAL MONITORING
Internal monitoring takes place as necessary on a daily basis or through theme audits and reviews. In some cases the review might result in actions and recommendations for implementation.
Non-compliances are only raised by BTC or BIL in certain circumstances i.e. for persistent issues that need management attention. If the matter can be rectified in a timely manner through local site intervention, non-compliance is not generally raised. The status of all internal non-compliances raised is given in the relevant country sections in this Chapter.
BTC has also developed a set of tools to assist in the management of E&S issues including detailed monthly reports and quarterly performance reviews.
11.1.1 Azerbaijan Internal environmental inspections, reviews and audits continued to be carried out at both AGIs and on the ROW. A full summary of internal reviews and audits is given in Table 11.113.
Table 11.1: Summary of Internal Reviews / Audits, Azerbaijan, 2007
Audit / Review
Auditor Auditee Scope Findings and/or Recommendations
Reinstate-ment & Biorest-oration
BTC & Consultant AETC
BTC / SCP ROW
Status of reinstatement & biorestoration
A high standard of reinstatement has been achieved over the majority of the pipeline, resulting in high levels of natural re-vegetation. In places it is difficult to distinguish the pipeline route from the surrounding area. A number of high priority areas remaining including Gobustan, Badlands, and various river crossings. Additional biorestoration works including re-seeding are being carried out in these areas. In May 2007 a survey of the Iris acutiloba population detected no growing plants, therefore a number of bulbs were excavated and found to be viable (alive) but dormant. This is normal after transplantation and it is expected that they will grow in Spring 2008.
13 Note: these are treated separately from environmental monitoring, which is detailed elsewhere in this report.

BTC Pipeline Project
61
Audit / Review
Auditor Auditee Scope Findings and/or Recommendations
ISO14001 Health Check Audit
Lead by ERM / With auditors from other (non Az Pipelines) AzSPU assets
BTC / SCP
Status of BTC / SCP readiness for pre-certification
Many commendable environmental management practices were identified, and significant progress since the previous EMS audit was recognised. No major gaps were identified either with respect to the EMS documentation or implementation of the EMS on site. The audit team concluded that BTC / SCP was well positioned for the ISO14001 pre-certification audit in November 2007
Temporary Facility Post-Exit HSE Review
BTC BTC / SCP
HSE Assurance Inspections of Temporary Facilities
The temporary facilities (construction camps, pipe yards, etc) were subjected to HSE inspections after exit to provide assurance that there were no outstanding HSE issues after handover. No unacceptable HSE risks were identified.
Regular Environ-mental Inspections
BTC BTC / SCP
Regular Environmental Inspections of IPA1, PSA2, Block Valves
Weekly and monthly environmental inspections were carried out at all AGIs throughout 2007. No major issued were identified, and all minor issues are closed out as soon as practicable on an ongoing basis.
There was one internal non-compliance raised by BTC during 2007, relating to a maintenance exercise (simulated emergency replacement of a pipe section) which involved driving on the ROW. Corrective actions were implemented.
11.1.2 Georgia Informal environmental inspections continued to be carried out at both permanent and temporary sites along the ROW. A full summary of significant internal reviews and audits is given in Table 11.2.
Table 11.2: Summary of Internal Reviews/Audits, Georgia, 2007
Audit / Review
Auditor Auditee Scope Findings and/or Recommendations
Project Biorestoration Review
BTC BTC Thorough closure of Project Biorestoration phase and handover of aftercare and future biorestoration to the operations.
The bio-restoration of the ROW is not yet complete. More vegetation restoration works and monitoring of outcomes are proposed for 2008 and depending on survival success evaluation results, in following years.
Review of Complaints Procedure
BTC BTC Complaint Procedure
Update of procedure for transition to Operations phase.
OSR Internal review close-out
BTC BTC / Seacor Compliance with OSRP
Close-out of 1200 items raised by internal review in 2006 of BTC’s OSR capabilities, during 2007.
ISO14001 Internal “Health Check” audit
ERM BTC/SCP Assess level of compliance / readiness for ISO 14001 certification.
The Operations EMS is well developed and in good shape for the upcoming ISO14001 Certification audit.

Environmental and Social Annual Report 2007
62
Audit / Review
Auditor Auditee Scope Findings and/or Recommendations
Waste Audit AzSPU CWAA Compliance with Waste Management Plan
Improved management options have been identified by BTC. These need to be followed up and implemented.
Waste Audit AzSPU PSG1 Compliance with Waste Management Plan
Good overall performance / waste management. Recommend implementing site waste log.
As part of day to day field environmental inspection and monitoring one internal Level II non-compliance was raised concerning the use of a crusher by a third party contractor at an unapproved site. BTC instructed the contractor to cease any project related use of the site and remove all equipment from the site. Work continues to close out the non-compliance.
There were a total of eight environmental-related incidents in 2007. There was one hydrocarbon spill of over one barrel. A spill in April 2007 resulted in the release of 290 litres of diesel into secondary containment in an office yard. Clean up activities were completed on the day the leak was discovered. The environmental impacts from the remaining seven incidents were negligible or minor.
In November 2007 Moody International conducted a 1st stage (pre-certification) audit of Georgia BTC Operations environmental management system. The objective of the audit was to review the environmental management system to assess whether the system has been fully implemented and determine the readiness of the system for certification. A total of 28 development points were raised during the audit. The recommendation from the auditor was that once the development points raised by the audit team have been effectively addressed then BTC Georgia can go forward for the 2nd stage (certification) audit. The 2nd stage audit is schedule for May 2008.
11.1.3 Turkey In 2007 audits and monitoring were carried out by BTC and BIL to cover Operations, EIP and CIP. The Operations audits were carried out to assess compliance with E&S commitments in the ESIA and Operations ESAP as well as to assess progress towards the development of the BIL ISO14001 certified ESMS. In addition various third-party facility compliance audits were undertaken to determine if the facilities met project standards and could be used by the Project. CIP and EIP monitoring was undertaken to assess Implementing Partner performance and subsequently identify areas of support. A list of environmental and social audits and reviews is given in Tables 11.3 and 11.4 below.
Table 11.3: Audits/Reviews Conducted by BTC
Audit / Review
Scope Findings and/or Recommendations
Pre-Lender Audit – All facilities and the ROW June 2007
• To follow up on any previously identified BTC and IEC findings.
• Verify closure of these items where appropriate.
• Determine the current situation with regards E&S performance on site.
BTC had 23 non-compliant observations with corresponding corrective actions. Observations and corresponding subject areas are as follows: ROW Patrolling (1); Social Management (2); Emissions Management (19); Waste Management (1). With respect to closure of previous BTC observations (non-compliances and recommendations) 74% of environmental items were closed out and 38% of social items were closed.

BTC Pipeline Project
63
Audit / Review
Scope Findings and/or Recommendations
Oil Spill Response Plan Audit January 2007
• To review Project compliance with OSRP in Turkey.
• Follow up on January 2005 OSRP audit.
• Implementation status of BIL Oil Spill Response Contract.
• Review BIL and BTC Co Incident Management Systems in relation to BP requirements.
The audit findings were classified based on priority into HMedium, Low and Observation. Of the 13 findings, 4 werclassified as “High”, 2 classified as “Medium”, 4 classified“Low” and 3 were classified as “Observation”. The fourfindings related to: • Inclusion of containment sites, access roads and
equipment storage locations in GIS system. • Completion of off-shore oil spill modeling. • Implementation of mobile data collection and
mapping.
• Transboundary protocols for rapid movement of equipment with relevant Government Authorities.
CIP and RDI Internal Evaluation – on-going throughout the year
• Regular planned visits to each project area and IP.
• To review IP performance in relation to gant charts and logical framework.
• Financial reviews
IPs are making good progress and are generally aligned with gant charts and logical framework. It was determined however that IPs are weaker in terms of local capacity building and marketing strategies. BTC Co will develop a support programme in 2008 to address these issues.
EIP Internal Evaluation – on-going throughout the year
• EIP performance and areas for improvement
Reviews recognised need for improving management, skills and implementation in relation to stakeholder engagement, conflict management and social impact mitigation. Identified need to shift focus from species level to ecosystem level. Projects require skills in local capacity building and business development in relation to conservation aims. Programme would benefit from improved integration and lesson sharing from CIP team.
Table 11.4: Audits Conducted by BIL
Audit / Review
Auditee Scope Findings and/or Recommendations
EU compliance waste facility audits
Izaydas hazardous waste facility at Izmit
Compliance with EU Landfill Directive, EU Hazardous Waste Directive and Waste Incineration Directive
The Izaydas facility was compliant and will therefore continue to be used for the disposal of all Operational wastes.
Waste recycling Companies compliance audit
Multiple glass, metal, paper and vegetable oil recycling companies along pipeline
Project environmental standards
The facilities were compliant with Project HSE standards.
Municipality waste water treatment plants compliance audit
Kayseri, Erzincan and Osmaniye municipality WWTPs
Project environmental standards
Kayseri and Erzincan Municipality WWTPs were compliant with Project environmental standards. Residual chlorine levels were slightly above Project limits at Osmaniye Municipal WWTP. Independent verification monitoring will be undertaken again to determine if it can be used by the Project for waste water disposal.
Hazardous waste transporter audits
Nergiz Tahmil in Adana and Sim in Izmit.
Project health, safety and environmental standards prior to contractual award.
Both companies were compliant with Project HSE standards. Contract was awarded to Nergiz Tahmil.

Environmental and Social Annual Report 2007
64
In addition to the uncontained oil spill incidents described in Section 6.2.3 there were two further environmental incidents in 2007. These both related to a release of glycol from the hot water heating systems at PT3 and PT4. In both cases glycol was not released to the environment as the water was captured in the storm water ponds where the water levels were not high enough to discharge to the environment. Upon the discovery of the leaks the discharge points from the ponds were blocked. Both leaks were about 100 litres. After seeking technical advice regarding the appropriate treatment for the contaminated water it was removed by vacuum truck to the Kayseri WWTP for treatment. As a result of the incident the drains leading from the water heater buildings to the main drains were closed at each of the pump stations. This is expected to prevent re-occurrence of a similar incident.
11.1.4 Cross Country Internal Monitoring and Reviews Various internal E&S Reviews were carried out during 2007 relating to the expansion of BTC pipeline (see section 3.1.4). A summary is presented in Table 11.5:
Table 11.5: Cross-country Monitoring
Audit / Review
Auditor Auditee Scope Findings and/or Recommendations
Peer Review (October)
BP Group
BTC Expansion Team
BTC 1.2 E&S Assessments / Preliminary EIA Report; and BTC 1.2 E&S Compliance report.
Generally satisfactory. More work needed on cumulative impacts sections of the E&S Assessments.
11.2 EXTERNAL MONITORING
11.2.1 Independent Environmental Consultants The IEC audit was conducted in June 2007. The IEC visit reports document non-compliances against the ESAP and assigns them a level of importance (Level I, II or III, with III being the most significant). The IEC also verifies closure of BTC’s responses to non-compliances as part of subsequent monitoring visits.
A total of 13 non-compliances were raised during the June audit. One Level 1 non-compliance was raised in Azerbaijan, three (2 Level I and 1 Level III) were raised in Georgia, and six in Turkey (4 Level I and 2 Level II). Appendix 3 contains details of these non-compliances along with a summary of actions taken to resolve the issue. Full reports are given on www.bp.com/caspian.
11.2.2 Social and Resettlement Action Plan (SRAP) Panel SRAP monitoring aims to provide practical guidance and advice to the Projects’ management team on the land acquisition and resettlement process and the management of other social issues, as well as monitoring compliance.
A visit was carried out in May/June 2007. The report from this visit is available on www.bp.com/caspian. The results of the SRAP monitoring are given in Appendix 4. A summary of findings are below in Table 11.6.
Table 11.6 Summary of SRAP Findings, 2007
Areas of Good / Improved Performance Areas for Continued Focus • Community Investment Programme (CIP) • Reinstatement • Awareness of land-use restrictions
• Land acquisition closure • Operations grievance management • Operations community relations resources

BTC Pipeline Project
65
11.2.3 Polaris Polaris audited the Project to assess compliance with requirements of Oil Spill Response Plans on behalf of the Lenders. The audit identified two levels of findings, issues which ‘require attention’ in order to ensure the ESAP and/or HGA requirements are met and issues which should be implemented to ensure that international best practice is maintained or sustained. The audit took place in June 2007.
Ten issues were identified in Azerbaijan and nine in Turkey. An additional 6 items were identified as being necessary in order to maintain international best practice. More details are given in Appendix 5.
11.2.4 Turkey In addition to Lender audits summarised above, BTC Co and BIL were subject to other external reviews as described in Table 11.7, below.
Table 11.7: External Audits in Turkey
Auditor Auditee Scope Findings and/or Recommendations Independent Consultant
BIL BIL Operations Environmental and Social Management System ISO14001 pre Certification
Seven non-conformances with the ISO14001:2004 system. Non-conformances related to awareness of responsibilities; documentation of aspects/impacts, responsibilities and operational control procedures and systems; and calibration of equipment.
BP Director of Environmental Operations
BTC Co and BIL
Operations Environmental Management CMT, IPT1 and PT4
• Lessons learned and information exchange from other BP environmental operations;
• Advice on improvements and enhancement to operations;
• 7 site specific findings requiring corrective actions related to chemical management, procedures for valve closure from contained areas and discharge control from site.
EIP External Evaluation
BTC Co and IPs
EIP Programme to verify if the EIP Plan criteria was being achieved
EIP adds and protects value of BP/BTC and provides excellent returns in terms of reputation and non-mitigation. It was determined that the longer the programme runs the greater will be the returns. EIP however has complex challenges to address conservation problems. It requires careful focus on integration of ecological, regulatory, social and economic factors. IPs also require support and must build capacity to ensure that existing and future integrated conservation programmes deliver positive results and serve as models for national replication. EIP could benefit from a more strategic marketing strategy that reaches target audiences.
11.2.5 Host Government Monitoring 11.2.5.1 Azerbaijan
MENR Inspectors conducted a brief visit at PSA2 in October 2007 to view the camp construction site and the reed bed. No issues were raised.
MENR also visited the BTC ROW in the area of Haji Kabul in November 2007, after receiving complaints regarding poor pipeline construction practices in that area. During the site visit it was observed that the damage had been caused by a third party during installation of a new pipeline, and that the reinstatement of the BTC ROW remained at a high standard.

Environmental and Social Annual Report 2007
66
11.2.5.2 Georgia BTC held regular monthly meetings with Government MEP representative- Georgian Oil and Gas Corporation and other Ministries and top officials to discuss the results of Government monitoring as well as raise issues for the Government in a timely to allow them to fulfil their obligations under the HGA. The main topics were closing construction stages for Kodiana projects as per issued permits, BTC 1.2 mmbd expansion permit and related activities and Government actions for state land registration. BTC and MoE discipline heads (emissions, waste, etc) communicate on an as-needed bases and have frequent consultations. MoE conducts physical checks of BTC facilities and in 2007conducted 26 monitoring trips, mainly along the ROW.
11.2.5.3 Turkey Turkish regulatory authorities visited all the facility sites in Turkey in 2007. The purpose of the visits was generally to verify water and air emission permit application information provided by BIL and therefore, to enable permits to be issued.
11.2.6 NGO MONITORING BTC is facilitating national NGO involvement in the Project in all three countries, although the method of involvement differs.
The background and objectives were described fully in the 2004-Q2 and 2004-Q3 reports. The current status of the NGO programmes in each country is given below or in related links. All reports are published on www.bp.com/caspian.
11.2.6.1 Azerbaijan The NGO Monitoring and Audit Programme was successfully completed in November 2006. All NGO recommendations and BP's response can be found: http://www.bp.com/genericarticle.do?categoryId=9006625&contentId=7013552
11.2.6.2 Georgia BP in Georgia continued to engage with NGOs involved with the Pipeline Monitoring and Dialogue Initiative. This initiative was a NGO monitoring program that ran for over two years and concluded in 2006. (See Section 8.3.2)
11.2.6.3 Turkey In Turkey a facilitating/capacity building organisation is not being used as in Azerbaijan and Georgia since many national NGOs are already involved in the Project, their experience is generally greater, and there was a lack of demand for a facilitated scheme. Notwithstanding, BTC and BIL continued to engage both national and regional stakeholders to discuss specific issues on an as needed basis, refer to Section 8.4.
11.3 TRAINING
11.3.1 Azerbaijan and Georgia In both Azerbaijan and Georgia, training for BTC Operations focused around ESMS and ISO14001 awareness to Operations staff. Training was also given on key issues such as waste management, emissions management and cultural heritage. Environmental awareness continued to be a component of the induction process for all new staff.
Training in both countries was delivered though a variety of medium ranging from formal classroom training to toolbox talks. Computer based training modules have also been developed for certain subjects, such as ISO14001 awareness. External trainers were contracted for longer courses which included a waste management course and lead auditor training for environmental staff. In Georgia, computer based training modules were distributed to site personnel covering chemical management issues - control of substances hazardous to health management.

BTC Pipeline Project
67
11.3.2 Turkey In Turkey, BIL continued to provide environmental and social training to operations and maintenance teams. Training topics were wide in scope and have been tailored to the departmental teams according to their roles. Some topics included Tier 1 spill response, environmental plans and procedures, ROW patrolling, laboratory environmental management, mitigation of operational impacts on the marine environment, and waste minimisation and segregation.
All BIL environmental and social team members participated in ISO14001 lead auditor training. Some BTC environmental staff who had not previously been trained in ISO14001 also participated while a ESMS training course was conducted at the manned AGI sites.
Other training topics for the BIL E&S team members in 2007 included site specific aspects/impacts identification and management, incident investigation and reporting, Traction, Media Relations, IMO Level I and III Oil Spill Response Training, NEBOSH, Medical Waste Management and OHAS18001.
The BTC E&S team participated in BP Environmental Requirements for New Projects training in November 2007. The training provided an overview of the ERNP rationale, process and implementation as well as providing points of contacts for future queries. Other E&S training undertaken by BTC Co E&S team members in 2007 included remote sensing (use of image processing software) and corporate social responsibility.
One-day training was provided to CIP Implementing Partners to raise awareness on EU agricultural policies and Ministry of Agriculture support mechanisms for agricultural initiatives.

Environmental and Social Annual Report 2007
68
APPENDIX 1 Annex J of the Construction ESAP – Outline of Project Environmental and Social Monitoring Annual Report14 Each annual report will address each of the topics listed below for BTC Co. activities conducted in Azerbaijan, Georgia and Turkey.
1 EXECUTIVE SUMMARY 2 ESIAs / EIA AND PERMITTING 2.1 SUMMARY OF ANY MATERIAL MODIFICATIONS TO THE AZERBAIJANI, GEORGIAN AND TURKISH ESIAs
DURING THE YEAR. 2.2 SUMMARY OF MATERIAL PERMITS ISSUED DURING THE YEAR AND ANY APPLICABLE CONDITIONS. 2.3 UPDATE ON STATUS OF PROJECT STATE SPECIFIC REQUIREMENTS FOR FURTHER WORK UNDER THE
ESIAS OR PERMITS. 3 CHANGES 3.1 DESCRIPTION OF ANY CHANGES TO AN ESIA DURING THE PERIOD TO REFLECT A CLASS I, II OR III CHANGE. 3.2 SUMMARY OF THE TYPE OF CLASS I CHANGES IMPLEMENTED DURING THE PERIOD, OR A CONFIRMATION
OF NO SUCH CHANGE. 3.3 LIST OF ALL CLASS II CHANGES NOTIFIED DURING THE PERIOD, OR CONFIRMATION OF NO SUCH
CHANGES. 3.4 SUMMARY OF ALL CLASS III CHANGES DURING THE PERIOD, OR CONFIRMATION OF NO SUCH CHANGES. 3.5 UPDATE ON CONSTRUCTION STATUS IN A CHANGE AREA INCLUDING DESCRIPTION OF ANY IMPACTS OR
MITIGATION MEASURES. 3.6 DESCRIPTION OF ANY MATERIAL AMENDMENT, SUPPLEMENT, REPLACEMENT OR MATERIAL MODIFICATION
TO AN ESIA, THIS ESAP, THE RAP, THE ESMS, OR ANY OSRP. 4 COMPLIANCE WITH ENVIRONMENTAL STANDARDS AND APPLICABLE ENVIRONMENTAL LAW 4.1 SUMMARY OF ANY NOTICES OF NON-COMPLIANCE, REMEDIAL ACTION, ANY FINES OR PENALTIES PAID
AND FINAL DISPOSITION OF ANY REGULATORY PROCEEDINGS. 4.2 SUMMARY OF AIR EMISSIONS. 4.3 SUMMARY OF ENVIRONMENTAL DISCHARGES. 4.4 STATEMENT INDICATING WHETHER BTC CO. AND ITS AGENTS HAVE COMPLIED IN THE DEVELOPMENT,
CONSTRUCTION AND OPERATION OF THE BTC PROJECT WITH THIS ESAP, APPLICABLE ENVIRONMENTAL LAWS AND APPLICABLE LENDER ENVIRONMENTAL AND SOCIAL POLICIES AND GUIDELINES IN ALL MATERIAL RESPECTS AND SUMMARY OF ANY (I) MATERIAL NON-COMPLIANCE AND THE STEPS BEING TAKEN TO REMEDY IT AND (II) MATERIAL MODIFICATIONS OF ESIAS, PLANS OR PROGRAMMES MATERIALLY IN CONTRAVENTION OF THE OPERATIONAL POLICIES AND DIRECTIVES LISTED IN THIS ESAP.
4.5 UPDATE ON SIGNIFICANT CHANGES IN APPLICABLE LAW, IF ANY. 5 OIL SPILL RESPONSE 5.1 SUMMARY OF OSRPS COMPLETED, UPDATED OR AMENDED DURING YEAR (AS DESCRIBED IN THIS ESAP). 5.2 SPILL SUMMARIES (AZERBAIJAN, GEORGIA AND TURKEY). 5.3 SPILL RESPONSE AND REMEDIATION SUMMARIES. 5.4 SUMMARY OF MATERIAL MODIFICATIONS TO THE OSRPS DESCRIBED IN THIS ESAP. 6 CIP AND EIP PROGRAMMING 6.1 SUMMARY OF PROGRAMMING FOR THE PAST YEAR. 6.1 COMPARISON OF ACTUAL TOTAL EXPENDITURES AND BUDGETED TOTAL EXPENDITURES. 6.3 DESCRIPTION OF EXPECTED BUDGET AND PROGRAMMING FOR THE COMING YEAR. 7 ENVIRONMENTAL AND SOCIAL MONITORING PROGRAMME 7.1 SUMMARY OF ESMS MONITORING COMMITMENTS COMPLETED DURING THE YEAR, INCLUDING SUMMARY
OF RESULTS, COMPARISON OF ENVIRONMENTAL PERFORMANCE TO APPLICABLE ENVIRONMENTAL STANDARDS AND SUMMARY OF PERFORMANCE AGAINST KPIS.
7.2 SUMMARY OF ENVIRONMENTAL AND SOCIAL TRAINING. 8 PROJECT COMMUNICATION 8.1 UPDATE OF ONGOING COMMUNICATION WITH EXTERNAL STAKEHOLDERS. 8.2 UPDATE OF COMMUNITY LIAISON ACTIVITIES. 9 SUMMARY OF RESULTS OF RAP MONITORING 10 SUMMARY OF KEY HEALTH AND SAFETY STATISTICS 10.1 DAYS AWAY FROM WORK CASES. 10.2 INJURIES. 10.3 FATALITIES. 11 AUDITS 11.1 SUMMARY OF THE RESULTS OF BTC CO. AND BOTAŞ’S INTERNAL ENVIRONMENTAL AND SOCIAL AUDIT
PROGRAMMES. 14 Following completion of construction, the annual report will not cover items that are relevant only to construction. In addition, if matters are covered in the Operations ESAP that are not reflected in the contents for the annual report, this Annex will be amended as appropriate to cover these matters.

BTC Pipeline Project
69
Annex H of the Operations ESAP – Outline of Project Environmental and Social Monitoring Annual Report Each annual report will address each of the topics listed below for BTC activities conducted in Azerbaijan, Georgia and Turkey.
1 EXECUTIVE SUMMARY 2 ESIAS / EIA AND PERMITTING 2.1 SUMMARY OF ANY MATERIAL MODIFICATIONS TO THE AZERBAIJANI, GEORGIAN AND TURKISH ESIAS
DURING THE YEAR. 2.2 SUMMARY OF MATERIAL PERMITS ISSUED DURING THE YEAR AND ANY APPLICABLE CONDITIONS. 2.3 UPDATE ON STATUS OF PROJECT STATE SPECIFIC REQUIREMENTS FOR FURTHER WORK UNDER THE
ESIAS OR PERMITS. 3 CHANGES 3.1 DESCRIPTION OF ANY CHANGES TO AN ESIA DURING THE PERIOD TO REFLECT A CLASS I, II OR III CHANGE. 3.2 SUMMARY OF THE TYPE OF CLASS I CHANGES IMPLEMENTED DURING THE PERIOD, OR A CONFIRMATION
OF NO SUCH CHANGE. 3.3 LIST OF ALL CLASS II CHANGES NOTIFIED DURING THE PERIOD, OR CONFIRMATION OF NO SUCH
CHANGES. 3.4 SUMMARY OF ALL CLASS III CHANGES DURING THE PERIOD, OR CONFIRMATION OF NO SUCH CHANGES. 3.5 DESCRIPTION OF ANY MATERIAL AMENDMENT, SUPPLEMENT, REPLACEMENT OR MATERIAL MODIFICATION
TO AN ESIA, THIS ESAP, THE RAP, THE ESMS, OR ANY OSRP. 4 COMPLIANCE WITH ENVIRONMENTAL STANDARDS AND APPLICABLE ENVIRONMENTAL LAW 4.1 SUMMARY OF ANY NOTICES OF NON-COMPLIANCE, REMEDIAL ACTION, ANY FINES OR PENALTIES PAID
AND FINAL DISPOSITION OF ANY REGULATORY PROCEEDINGS. 4.2 SUMMARY OF AIR EMISSIONS. 4.3 SUMMARY OF ENVIRONMENTAL DISCHARGES. 4.4 STATEMENT INDICATING WHETHER BTC CO. AND ITS AGENTS HAVE COMPLIED IN THE DEVELOPMENT,
CONSTRUCTION AND OPERATION OF THE BTC PROJECT WITH THIS ESAP, APPLICABLE ENVIRONMENTAL LAWS AND APPLICABLE LENDER ENVIRONMENTAL AND SOCIAL POLICIES AND GUIDELINES IN ALL MATERIAL RESPECTS AND SUMMARY OF ANY (I) MATERIAL NON-COMPLIANCE AND THE STEPS BEING TAKEN TO REMEDY IT AND (II) MATERIAL MODIFICATIONS OF ESIAS, PLANS OR PROGRAMMES MATERIALLY IN CONTRAVENTION OF THE OPERATIONAL POLICIES AND DIRECTIVES LISTED IN THIS ESAP.
4.5 UPDATE ON SIGNIFICANT CHANGES IN APPLICABLE LAW, IF ANY. 5 OIL SPILL RESPONSE 5.1 SUMMARY OF OSRPS COMPLETED, UPDATED OR AMENDED DURING YEAR (AS DESCRIBED IN THIS ESAP). 5.2 SPILL SUMMARIES (AZERBAIJAN, GEORGIA AND TURKEY). 5.3 SPILL RESPONSE AND REMEDIATION SUMMARIES. 5.4 SUMMARY OF MATERIAL MODIFICATIONS TO THE OSRPs DESCRIBED IN THIS ESAP. 6 ADDITIONALITY PROGRAMMING 6.1 SUMMARY OF PROGRAMMING FOR THE PAST YEAR. 6.2 COMPARISON OF ACTUAL TOTAL EXPENDITURES AND BUDGETED TOTAL EXPENDITURES. 6.3 DESCRIPTION OF EXPECTED BUDGET AND PROGRAMMING FOR THE COMING YEAR. 7 ENVIRONMENTAL AND SOCIAL MONITORING PROGRAMME 7.1 SUMMARY OF ESMS MONITORING COMMITMENTS COMPLETED DURING THE YEAR, INCLUDING SUMMARY
OF RESULTS, COMPARISON OF ENVIRONMENTAL PERFORMANCE TO APPLICABLE ENVIRONMENTAL STANDARDS AND SUMMARY OF PERFORMANCE AGAINST KPIS.
7.2 SUMMARY OF ENVIRONMENTAL AND SOCIAL TRAINING. 8 PROJECT COMMUNICATION 8.1 UPDATE OF ONGOING COMMUNICATION WITH EXTERNAL STAKEHOLDERS. 8.2 UPDATE OF COMMUNITY LIAISON ACTIVITIES. 9 SUMMARY OF RESULTS OF RAP MONITORING (AS APPLICABLE) 10 SUMMARY OF KEY HEALTH AND SAFETY STATISTICS 10.1 DAYS AWAY FROM WORK CASES. 10.2 INJURIES. 10.3 FATALITIES. 11 AUDITS 11.1 SUMMARY OF THE RESULTS OF BTC CO. AND BIL’S INTERNAL ENVIRONMENTAL AND SOCIAL AUDIT
PROGRAMMES.

Environmental and Social Annual Report 2007
70
APPENDIX 2: ENVIRONMENTAL MONITORING RESULTS
APPENDIX 2.1: AZERBAIJAN Please read this section in conjunction with the commentary in Section 5.2.1.
2.1a – Ambient Air Quality
Pollutant Standard Units Averaging Period
NO2 40 (Annual average will reduce by 2 µg/m3 every year, to reach 40 µg/m3 by 1 January 2010)
µg/m3 Annual mean
SO2 20 µg/m3 Annual mean
Benzene 5 (Annual average will reduce by 1 µg/m3 every year from 2006, to reach 5 µg/m3 by 1 January 2010)
µg/m3 Annual mean
PM10 20 (30 on 1 January 2005, reducing every 12 months thereafter by equal annual percentages to reach 20 by 1 January 2010)
µg/m3 Annual mean
PSA2: Round 1
ID NO2 SO2 Benzene Units Date Duration PSA 2 AQ 1p 7.7 5.5 0.81 µg/m3 Oct/Nov2007 1 month PSA 2 AQ 2p 8.5 5.4 0.90 µg/m3 Oct/Nov2007 1 month PSA 2 AQ 3p 16 24 0.93 µg/m3 Oct/Nov2007 1 month PSA 2 AQ 4p 10 1.3 0.91 µg/m3 Oct/Nov2007 1 month
PSA2: Round 2 ID NO2 SO2 Benzene Units Date Duration
PSA 2 AQ 1p 8.2 1.1 1.7 µg/m3 Dec2007/Jan2008 1 month PSA 2 AQ 2p 7.3 <0.79 1.7 µg/m3 Dec2007/Jan2008 1 month PSA 2 AQ 3p 8.8 33 1.7 µg/m3 Dec2007/Jan2008 1 month PSA 2 AQ 4p 16 12 1.7 µg/m3 Dec2007/Jan2008 1 month
IPA1 ID NO2 SO2 Benzene Units Date Duration
IPA 1 AQ 1p 13 3.8 0.67 µg/m3 Oct/Nov2007 1 month IPA 1 AQ 2p 11 18 0.59 µg/m3 Oct/Nov2007 1 month
NOTES: Baseline for PSA2 shown in Appendix 2.1a of 2005 Annual Report
Red figures show non-compliance with project standards
2.1b – Stack Emissions Monitoring PSA 2
Concentration at ref conditions
Standards Mass emissions Equipment Date tested
Load Fuel
NOx mg/m3
CO mg/m3
Nox mg/m3
CO mg/m3
Nox g/h
CO g/h
MOL Turbine No 1 10/10/2007 – gas 96.11 2311.08 75 600 2827.36 39758.82
MOL Turbine No 2 10/10/2007 – gas 98.76 2477.89 75 600 1189.91 17589.34
MOL Turbine No 3 10/10/2007 – gas 65.93 2311.08 75 600 737.67 67989.94
2.1c – Environmental Noise
Standard Units Period
55 dB (A) Daytime PSA2 & IPA1
45 dB (A) Night-time

BTC Pipeline Project
71
PSA2 ID Readings Units Date Time Duration Comments PSA 2 NM 1p 26.6 dB (A) Aug-2007 13:30 5 min daytime PSA 2 NM 2p 32.4 dB (A) Aug-2007 14:00 5 min daytime
Block Valves ID Readings Units Date Time Duration Comments AB 3 NM 1p 34,7 dB (A) Aug-2007 13:40 5 min daytime AB 3 NM 1p 30,8 dB(A) Sep-2007 21:15 5 min night-time AB 4 NM 2p 39,2 dB (A) Aug-2007 13:40 5 min daytime AB 4 NM 1p 50,5 dB(A) Sep-2007 21.30 5min night-time AB 15 NM 1p 27,1 dB(A) Aug-2007 13.40 5min daytime IPA 1 NM 3p 43,8 dB (A) Aug-2007 13:40 5 min daytime NOTE: Baseline for PSA2 shown in Appendix 2.1b of 2005 Annual Report
2.1d – Effluent Discharge Monitoring Programme
Parameter Standard Units Parameter Standard Units
Total coliform bacteria (per 100ml) <400 MPN/100ml Ag 0.5 mg/l pH 6-9 As 0.1 mg/l Total residual chlorine 0.2 mg/l Cd 0.1 mg/l BOD 25 mg/l Cr (total) 0.5 mg/l COD 125 mg/l Cu 0.5 mg/l Total suspended solids 35 mg/l Fe 3.5 mg/l Ammonia NH4 10 mg/l Pb 0.1 mg/l Total Nitrogen 15 mg/l Hg 0.01 mg/l Phenols 0.5 mg/l Ni 0.5 mg/l Total Phosphorus 2.0 mg/l Se 0.1 mg/l Sulphides 1.0 mg/l Zn 2.0 mg/l Oil and grease 10 mg/l
IPA1 (Sample Location – IPA1 Retention Pond) Sample ID
Parameter 02-Nov-07 29-Nov-07 17-Jan-07
Total coliform bacteria (per 100ml) 6.9x10³ 1600 9.3 pH 8.79 8.32 7.97 Total residual chlorine <0.02 <0.02 0.07 COD 61 30 3 Total suspended solids 64 90 2 Ammonia NH4 0.04 0.05 0.02 Total Nitrogen* 4.4 3.8 4.4 Total Phosphorus** 0.07 Sulphides 40 µg/L 62 µg/L 7 µg/L Oil and grease <5 <5 Cd <0.02 <0.02 <0.02 Cr (total) <0.03 <0.03 <0.01 Fe 0.07 0.12 0.11 Pb <0.2 <0.2 0.095 Ni <0.007 <0.007 <0.007 Zn <0.01 <0.01 0.02
NOTE: Red figures show non-compliance with project standards
PSA2 (Sample Location – PSA2 Retention Pond) Sample ID
Parameter 2-Jul-07 26-Jul-07 18-Oct-07 20-Nov-07
Total coliform bacteria (per 100ml) 220 <1600 400 <1600 pH 9 7.84 7.92 7.7 Total residual chlorine 0.1 0.21 0.2 COD 105 1660 56 80.5
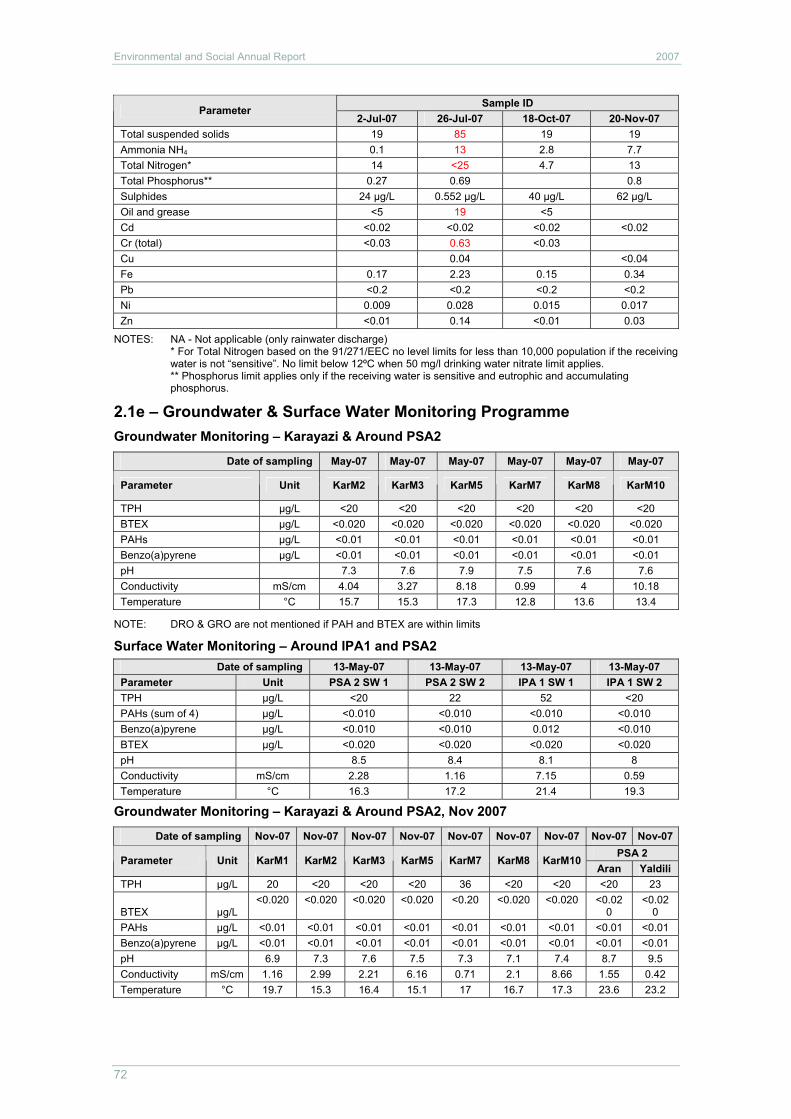
Environmental and Social Annual Report 2007
72
Sample ID Parameter
2-Jul-07 26-Jul-07 18-Oct-07 20-Nov-07 Total suspended solids 19 85 19 19 Ammonia NH4 0.1 13 2.8 7.7 Total Nitrogen* 14 <25 4.7 13 Total Phosphorus** 0.27 0.69 0.8 Sulphides 24 µg/L 0.552 µg/L 40 µg/L 62 µg/L Oil and grease <5 19 <5 Cd <0.02 <0.02 <0.02 <0.02 Cr (total) <0.03 0.63 <0.03 Cu 0.04 <0.04 Fe 0.17 2.23 0.15 0.34 Pb <0.2 <0.2 <0.2 <0.2 Ni 0.009 0.028 0.015 0.017 Zn <0.01 0.14 <0.01 0.03
NOTES: NA - Not applicable (only rainwater discharge) * For Total Nitrogen based on the 91/271/EEC no level limits for less than 10,000 population if the receiving water is not “sensitive”. No limit below 12ºC when 50 mg/l drinking water nitrate limit applies. ** Phosphorus limit applies only if the receiving water is sensitive and eutrophic and accumulating phosphorus.
2.1e – Groundwater & Surface Water Monitoring Programme Groundwater Monitoring – Karayazi & Around PSA2
Date of sampling May-07 May-07 May-07 May-07 May-07 May-07
Parameter Unit KarM2 KarM3 KarM5 KarM7 KarM8 KarM10
TPH µg/L <20 <20 <20 <20 <20 <20 BTEX µg/L <0.020 <0.020 <0.020 <0.020 <0.020 <0.020 PAHs µg/L <0.01 <0.01 <0.01 <0.01 <0.01 <0.01 Benzo(a)pyrene µg/L <0.01 <0.01 <0.01 <0.01 <0.01 <0.01 pH 7.3 7.6 7.9 7.5 7.6 7.6 Conductivity mS/cm 4.04 3.27 8.18 0.99 4 10.18 Temperature °C 15.7 15.3 17.3 12.8 13.6 13.4
NOTE: DRO & GRO are not mentioned if PAH and BTEX are within limits
Surface Water Monitoring – Around IPA1 and PSA2 Date of sampling 13-May-07 13-May-07 13-May-07 13-May-07
Parameter Unit PSA 2 SW 1 PSA 2 SW 2 IPA 1 SW 1 IPA 1 SW 2 TPH µg/L <20 22 52 <20 PAHs (sum of 4) µg/L <0.010 <0.010 <0.010 <0.010 Benzo(a)pyrene µg/L <0.010 <0.010 0.012 <0.010 BTEX µg/L <0.020 <0.020 <0.020 <0.020 pH 8.5 8.4 8.1 8 Conductivity mS/cm 2.28 1.16 7.15 0.59 Temperature °C 16.3 17.2 21.4 19.3
Groundwater Monitoring – Karayazi & Around PSA2, Nov 2007
Date of sampling Nov-07 Nov-07 Nov-07 Nov-07 Nov-07 Nov-07 Nov-07 Nov-07 Nov-07PSA 2
Parameter Unit KarM1 KarM2 KarM3 KarM5 KarM7 KarM8 KarM10 Aran Yaldili
TPH µg/L 20 <20 <20 <20 36 <20 <20 <20 23
BTEX µg/L <0.020 <0.020 <0.020 <0.020 <0.20 <0.020 <0.020 <0.02
0 <0.02
0 PAHs µg/L <0.01 <0.01 <0.01 <0.01 <0.01 <0.01 <0.01 <0.01 <0.01 Benzo(a)pyrene µg/L <0.01 <0.01 <0.01 <0.01 <0.01 <0.01 <0.01 <0.01 <0.01 pH 6.9 7.3 7.6 7.5 7.3 7.1 7.4 8.7 9.5 Conductivity mS/cm 1.16 2.99 2.21 6.16 0.71 2.1 8.66 1.55 0.42 Temperature °C 19.7 15.3 16.4 15.1 17 16.7 17.3 23.6 23.2

BTC Pipeline Project
73
Surface Water Monitoring – Around IPA1 and PSA2, Nov 2007 Date of sampling 09-Nov-07 09-Nov-07 09-Nov-07 09-Nov-07 09-Nov-07 09-Nov-07
Parameter Unit PSA 2 SW P1
PSA 2 SW P1
PSA 2 SW 3
PSA 2 SW P2
IPA 1 SW P1
IPA 1 SW P2
TPH µg/L <20 -- <20 <20 <20 <20 PAHs (sum of 4) µg/L <0.010 <0.010 <0.010 <0.010 <0.010 <0.010 Benzo(a)pyrene µg/L <0.010 <0.010 <0.010 <0.010 <0.010 <0.010 BTEX µg/L <0.020 -- <0.020 <0.020 <0.020 <0.020 pH 7.9 -- 7.8 7.3 7.7 7.5 Conductivity mS/cm 0.97 -- 1.11 1.64 0.42 0.44 Temperature °C 11.1 -- 11.8 15.0 13.7 14.0
2.1f – Waste BTC Waste Volumes: Summary – 2007
Unit Value Hazardous Wastes
Oily rags m3 14 Oily water m3 672 Oil and diesel (used) m3 98 Sewage wastes (raw) m3 7315 Sewage sludge m3 15.3 Contaminated drums m3 110 Antifreeze m3 3 Chemicals 2 Wax m3 5
Non-hazardous wastes Empty drums and cans m3 66 Toner cartridges / Fluorescent tubes m3 1 Insulation material / Construction waste / Pig discs m3 1 Aerosol cans m3 1 Non-recyclable domestic wastes m3 135 Paper m3 38 Wood m3 12 Metal m3 11
APPENDIX 2.2: GEORGIA Please read this section in conjunction with the commentary in Section 5.2.2.
2.2a – Ambient Air Quality
Pollutant Standard Units Averaging Period
NO2 40 (Annual average will reduce by 2 µg/m3 every year, to reach 40 µg/m3 by 1 January 2010)
µg/m3 Annual mean
SO2 20* µg/m3 Annual mean
Benzene 5 (Annual average will reduce by 1 µg/m3 every year from 2006, to reach 5 µg/m3 by 1 January 2010)
µg/m3 Annual mean
PM10 20 (30 on 1 January 2005, reducing every 12 months thereafter by equal annual percentages to reach 20 by 1 January 2010)**
µg/m3 Annual mean
* For the protection of vegetation and ecosystems ** No PM 10 was measured in 2007 due to the system running on natural gas
PSG1 and PSG2 (January 2007) Concentration (µg/m3) Pump Station
Location Ref Start date / End date (NO2, SO2, Benzene) NO2 SO2 Benzene
Approx sampling duration (hrs)
PSG1-1 04/01/07-06/02/07 7 4.06 N/A* 792 PSG1-2 04/01/07-06/02/07 11 5.44 3.68 792 PSG1-3 04/01/07-06/02/07 14 8.3 0.39 792 PSG1-4 04/01/07-06/02/07 7 3.49 1.3 792

Environmental and Social Annual Report 2007
74
Concentration (µg/m3) Pump Station Location Ref
Start date / End date (NO2, SO2, Benzene) NO2 SO2 Benzene
Approx sampling duration (hrs)
PSG1-5 04/01/07-06/02/07 11 2.51 3.69 792 PSG2-1 05/01/07-07/02/07 3 2.58 4.36 792 PSG2-2 05/01/07-07/02/07 4 3.13 0.45 792 PSG2-3 05/01/07-07/02/07 <1 2.53 2.81 792 PSG2-4 05/01/07-07/02/07 2 6.48 4.17 792 PSG2-5 05/01/07-07/02/07 5 15.31 3.55 792
NOTE: *Tubes displaced
PSG1 and PSG2 (March 2007) Concentration (µg/m3) Pump Station
Location Ref Start date / End date (NO2, SO2, Benzene) NO2 SO2 Benzene
Approx sampling duration (hrs)
PSG1-1 01/03/07-31/03/07 10 N/A** 0.6 744 PSG1-2 01/03/07-31/03/07 7 N/A** 0.6 744 PSG1-3 01/03/07-31/03/07 19 N/A** 0.4 744 PSG1-4 01/03/07-31/03/07 9 N/A** 0.5 744 PSG1-5 01/03/07-31/03/07 9 N/A** 0.5 744 PSG2-1 01/03/07-31/03/07 1 N/A** 0.9 744 PSG2-2 01/03/07-31/03/07 6 N/A** 0.5 744 PSG2-3 01/03/07-31/03/07 7 N/A** 0.5 744 PSG2-4 01/03/07-31/03/07 7 N/A** 0.6 744 PSG2-5 01/03/07-31/03/07 N/A* N/A** 0.4 744
NOTE: * Tubes displaced
**Report not received from contractor laboratory
PSG1 and PSG2 (June 2007) Concentration (µg/m3) Pump Station
Location Ref Start date / End date (NO2, SO2, Benzene) NO2 SO2 Benzene
Approx sampling duration (hrs)
PSG1-1 01/06/07- 03/07/07 6 N/A* 0.1 792 PSG1-2 01/06/07- 03/07/07 12 N/A* 0.2 792 PSG1-3 01/06/07- 03/07/07 7 N/A* <0.1 792 PSG1-4 01/06/07- 03/07/07 5 N/A* <0.1 792 PSG1-5 01/06/07- 03/07/07 4 N/A* <0.1 792 PSG2-1 01/06/07- 03/07/07 3 N/A* <0.1 792 PSG2-2 01/06/07- 03/07/07 1 N/A* <0.1 792 PSG2-3 01/06/07- 03/07/07 3 N/A* <0.1 792 PSG2-4 01/06/07- 03/07/07 1 N/A* <0.1 792 PSG2-5 01/06/07- 03/07/07 6 N/A* <0.1 792
NOTE: * Report not received from contractor laboratory
PSG 1 and PSG 2 (October 2007) Concentration (µg/m3) Pump Station
Location Ref Start date / End date (NO2, SO2, Benzene) NO2 SO2 Benzene
Approx sampling duration (hrs)
PSG1-1 05/09/07 – 04/10/07 N/A** N/A* N/A** 768 PSG1-2 05/09/07 – 04/10/07 N/A** 29.9 N/A** 768 PSG1-3 05/09/07 – 04/10/07 N/A** 40.76 N/A** 768 PSG1-4 05/09/07 – 04/10/07 N/A** 3.57 N/A** 768 PSG1-5 05/09/07 – 04/10/07 N/A** N/A* N/A** 768 PSG2-1 06/09/07 – 05/10/07 N/A** 0.49 N/A** 768 PSG2-2 06/09/07 – 05/10/07 N/A** N/A* N/A** 768 PSG2-3 06/09/07 – 05/10/07 N/A** 2.29 N/A** 768 PSG2-4 06/09/07 – 05/10/07 N/A** 0.71 N/A** 768 PSG2-5 06/09/07 – 05/10/07 N/A** 3.05 N/A** 768
NOTE: * Tubes displaced
**Report not received from contractor laboratory
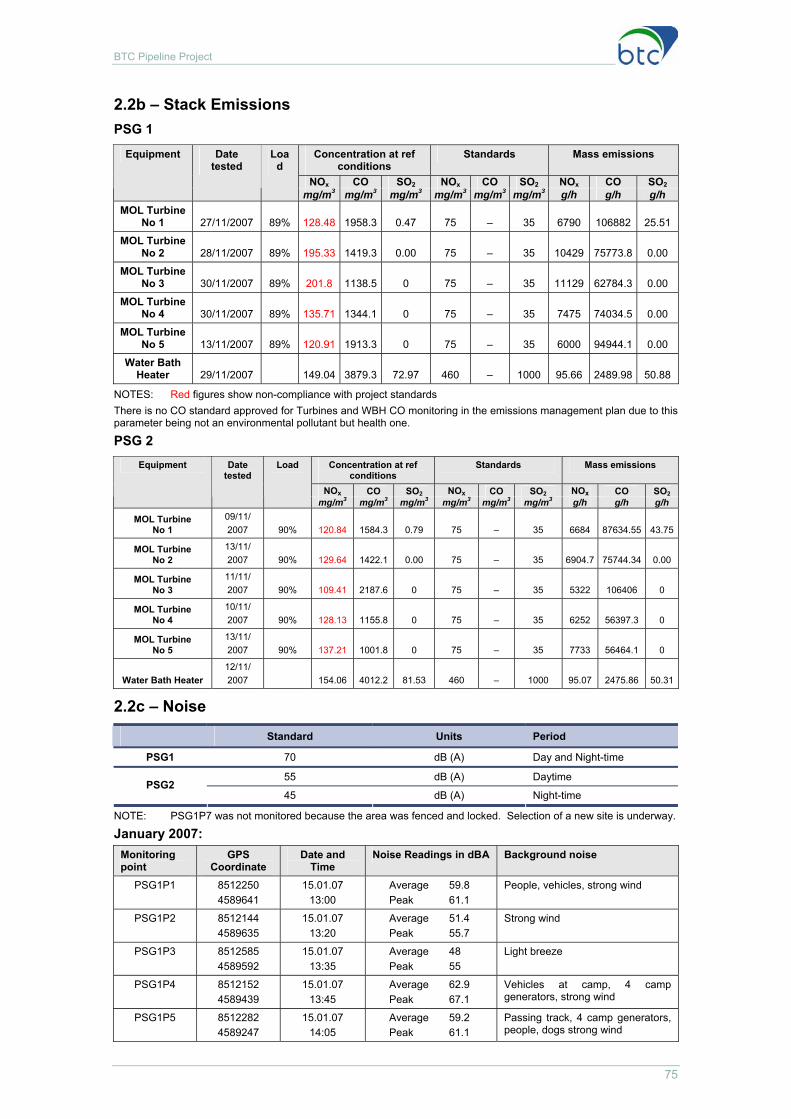
BTC Pipeline Project
75
2.2b – Stack Emissions PSG 1
Concentration at ref conditions
Standards Mass emissions
NOx CO SO2 NOx CO SO2 NOx CO SO2
Equipment Date tested
Load
mg/m3 mg/m3 mg/m3 mg/m3 mg/m3 mg/m3 g/h g/h g/h MOL Turbine
No 1 27/11/2007 89% 128.48 1958.3 0.47 75 – 35 6790 106882 25.51
MOL Turbine No 2 28/11/2007 89% 195.33 1419.3 0.00 75 – 35 10429 75773.8 0.00
MOL Turbine No 3 30/11/2007 89% 201.8 1138.5 0 75 – 35 11129 62784.3 0.00
MOL Turbine No 4 30/11/2007 89% 135.71 1344.1 0 75 – 35 7475 74034.5 0.00
MOL Turbine No 5 13/11/2007 89% 120.91 1913.3 0 75 – 35 6000 94944.1 0.00
Water Bath Heater 29/11/2007 149.04 3879.3 72.97 460 – 1000 95.66 2489.98 50.88
NOTES: Red figures show non-compliance with project standards There is no CO standard approved for Turbines and WBH CO monitoring in the emissions management plan due to this parameter being not an environmental pollutant but health one.
PSG 2 Concentration at ref
conditions Standards Mass emissions
NOx CO SO2 NOx CO SO2 NOx CO SO2
Equipment Date tested
Load
mg/m3 mg/m3 mg/m3 mg/m3 mg/m3 mg/m3 g/h g/h g/h
MOL Turbine No 1
09/11/ 2007 90% 120.84 1584.3 0.79 75 – 35 6684 87634.55 43.75
MOL Turbine No 2
13/11/ 2007 90% 129.64 1422.1 0.00 75 – 35 6904.7 75744.34 0.00
MOL Turbine No 3
11/11/ 2007 90% 109.41 2187.6 0 75 – 35 5322 106406 0
MOL Turbine No 4
10/11/ 2007 90% 128.13 1155.8 0 75 – 35 6252 56397.3 0
MOL Turbine No 5
13/11/ 2007 90% 137.21 1001.8 0 75 – 35 7733 56464.1 0
Water Bath Heater 12/11/ 2007 154.06 4012.2 81.53 460 – 1000 95.07 2475.86 50.31
2.2c – Noise
Standard Units Period
PSG1 70 dB (A) Day and Night-time
55 dB (A) Daytime PSG2
45 dB (A) Night-time
NOTE: PSG1P7 was not monitored because the area was fenced and locked. Selection of a new site is underway.
January 2007: Monitoring point
GPS Coordinate
Date and Time
Noise Readings in dBA Background noise
PSG1P1 8512250 4589641
15.01.07 13:00
Average 59.8 Peak 61.1
People, vehicles, strong wind
PSG1P2 8512144 4589635
15.01.07 13:20
Average 51.4 Peak 55.7
Strong wind
PSG1P3 8512585 4589592
15.01.07 13:35
Average 48 Peak 55
Light breeze
PSG1P4 8512152 4589439
15.01.07 13:45
Average 62.9 Peak 67.1
Vehicles at camp, 4 camp generators, strong wind
PSG1P5 8512282 4589247
15.01.07 14:05
Average 59.2 Peak 61.1
Passing track, 4 camp generators, people, dogs strong wind

Environmental and Social Annual Report 2007
76
Monitoring point
GPS Coordinate
Date and Time
Noise Readings in dBA Background noise
PSG1P6 8512360 4589286
15.01.07 14:25
Average 54.2 Peak 54.7
Strong wind close to reeds
PSG1P8 8512232 4589652
15.01.07 14:50
Average 56.4 Peak 57.5
Passing track at main road to PSG1, strong wind
PSG1NV 15.01.07 15:40
Average 55.3 Peak 56.8
Birds, breeze, noise from village
PSG2P1 8450014 4602752
16.01.07 15:30
Average 49.9 Peak 52
People, wind
PSG2P2 8450182 4602742
16.01.07 14:25
Average 52 Peak 53.2
Wind
PSG2P3 8450386 4602697
16.01.07 14:50
Average 50.9 Peak 53.1
Wind, traffic
PSG2P4 8450410 4602631
16.01.07 14:35
Average 55.1 Peak 56.5
Wind
PSG2P5 8450330 4602557
16.01.07 13:30
Average 55.9 Peak 57.1
Wind, plane
PSG2P6 8450010 4602603
16.01.07 12:50
Average 45.3 Peak 46.9
Wind
PSG2P7 8450164 4602509
16.01.07 13:15
Average 53.2 Peak 68.9
Wind
February 2007: Monitoring point
GPS Coordinate
Date and Time
Noise Readings in dBA Background noise
PSG1P1 8512250 4589641
01.02.07 11:05
Average 58.2 Peak 58.4
People, vehicles (PSG1 car parking area)
PSG1P2 8512144 4589635
01.02.07 11:25
Average 48.3 Peak 49.7
Track (50m), light breeze, birds
PSG1P3 8512585 4589592
01.02.07 11:50
Average 42.6 Peak 43.1
Light breeze
PSG1P4 8512152 4589439
01.02.07 13:00
Average 45.9 Peak 46.7
People
PSG1P5 8512282 4589247
01.02.07 13:25
Average 54.5 Peak 54.7
4 camp generators
PSG1P6 8512360 4589286
01.02.07 14:05
Average 40.7 Peak 42.3
Light breeze, CWAA noise.
PSG1P8 8512232 4589652
01.02.07 14:50
Average 53.5 Peak 54.1
Breeze, birds
PSG1NV 01.02.07 15:40
Average 39.2 Peak 40.7
Birds, small stream
PSG2P1 8450014 4602752
02.02.07 11:15
Average 49.4 Peak 49.5
N/A
PSG2P2 8450182 4602742
02.02.07 11:40
Average 53.1 Peak 54.2
Birds
PSG2P3 8450386 4602697
02.02.07 12:05
Average 44.4 Peak 44.7
N/A
PSG2P4 8450410 4602631
02.02.07 13:25
Average 42.6 Peak 42.7
Birds
PSG2P5 8450330 4602557
02.02.07 13:40
Average 44.6 Peak 44.7
N/A
PSG2P6 8450010 4602603
02.02.07 14.40
Average 52 Peak 52.2
Breeze, birds
PSG2P7 8450164 4602509
02.02.07 15.15
Average 51.5 Peak 51.8
Breeze

BTC Pipeline Project
77
March 2007: Monitoring point
GPS Coordinate
Date and Time
Noise Readings in dBA Background noise
PSG1P1 8512250 4589641
01.03.07 11:05
Average 58.4 Peak 58.7
People, vehicles (PSG1 car parking area)
PSG1P2 8512144 4589635
01.03.07 11:25
Average 47.2 Peak 47.6
light breeze
PSG1P3 8512585 4589592
01.03.07 11:50
Average 43.5 Peak 43.8
Light breeze
PSG1P4 8512152 4589439
01.03.07 13:00
Average 45.7 Peak 46.5
People, light breeze
PSG1P5 8512282 4589247
01.03.07 13:25
Average 53.9 Peak 54.3
4 camp generators. people
PSG1P6 8512360 4589286
01.03.07 14:05
Average 41.3 Peak 41.9
Light breeze
PSG1P8 8512232 4589652
01.03.07 14:50
Average 54.7 Peak 55.2
Light breeze
PSG1NV 01.03.07 15:40
Average 39.4 Peak 39.9
Light breeze, small stream
PSG2P1 8450014 4602752
02.03.07 11:15
Average 51.7 Peak 52.3
Light breeze
PSG2P2 8450182 4602742
02.03.07 11:40
Average 55.2 Peak 55.8
Birds, Light breeze
PSG2P3 8450386 4602697
02.03.07 12:05
Average 45.3 Peak 45.5
N/A
PSG2P4 8450410 4602631
02.03.07 13:25
Average 43.5 Peak 43.8
Birds
PSG2P5 8450330 4602557
02.03.07 13:40
Average 45.3 Peak 45.8
N/A
PSG2P6 8450010 4602603
02.03.07 14.40
Average 51.6 Peak 52.2
Breeze, birds
PSG2P7 8450164 4602509
02.03.07 15.15
Average 51.3 Peak 51.7
Breeze
June 2007: Monitoring point
GPS Coordinate
Date and Time
Noise Readings in dBA Background noise
PSG1P1 8512250 4589641
09.07.07 13:15
Average 53.5 Peak 54
People, breeze
PSG1P2 8512144 4589635
09.07.07 13:40
Average 52.1 Peak 52.5
People, breeze, traffic
PSG1P3 8512585 4589592
09.07.07 14:05
Average 52 Peak 68.2
Traffic, breeze. Passing vehicle
PSG1P4 8512152 4589439
09.07.07 14:25
Average 52.7 Peak 53.1
Breeze, birds, camp generators
PSG1P5 8512282 4589247
09.07.07 14:40
Average 45.7 Peak 49.2
Strong wind, breeze, traffic
PSG1P6 8512360 4589286
09.07.07 15.10
Average 37.9 Peak 38.8
Light breeze
PSG1P7 8512232 4589652
09.07.07 15.25
Average 54.8 Peak 56.2
People, breeze
PSG1PNV 09.07.07 15.40
Average 37.5 Peak 39.7
Light breeze
PSG1CA MP1 09.07.07 16:00
Average 48.5 Peak 48.9
Wind, frogs
PSG1CA MP2 09.07.07 16:20
Average 45.3 Peak 46
Wind, frogs

Environmental and Social Annual Report 2007
78
Monitoring point
GPS Coordinate
Date and Time
Noise Readings in dBA Background noise
PSG1CA MP3 09.07.07 16:35
Average 47.2 Peak 47.7
Camp STP, birds, wind
PSG2P1 8450014 4602752
14.07.07 13:15
Average 52.1 Peak 53.3
Light breeze
PSG2P2 8450182 4602742
14.07.07 13:40
Average 52.2 Peak 54.1
Birds
PSG2P3 8450386 4602697
14.07.07 14:05
Average 44.2 Peak 46.3
Birds
PSG2P4 8450410 4602631
14.07.07 14:25
Average 47.4 Peak 49.3
Birds
PSG2P5 8450330 4602557
14.07.07 14:40
Average 44.4 Peak 45.1
Birds
PSG2P6 8450010 4602603
14.07.07 15.10
Average 51.3 Peak 52.0
Birds
PSG2P7 8450164 4602509
14.07.07 15.25
Average 51.7 Peak 52.2
Birds
PSG2C1 8452736 4600534
13.07.07 14:25
Average 40.4 Peak 43.1
Light breeze, birds
PSG2C2 8452688 4600483
13.07.07 14:35
Average 39.5 Peak 40.2
Birds
PSG2C3 8452716 4600378
13.07.07 14:40
Average 53.4 Peak 55.1
Birds. Camp generators within 40m.
PSG2C4 8452758 4600258
13.07.07 15:05
Average 41.5 Peak 52.2
Light vehicle
PSG2C5 8452878 4600279
13.07.07 15:25
Average 42.7 Peak 58.3
Light vehicle
PSG2CNV 8452846 4600390
13.07.07 16:25
Average 39.4 Peak 40.1
People
AKP1 8319207 4609945
12.07.07 10:05
Average 47.4 Peak 57.1
People, light vehicle
AKP2 8334618 4614017
12.07.07 10:15
Average 38.7 Peak 41.2
Birds
AKP3 8334635 4613763
12.07.07 10:30
Average 53.2 Peak 55.1
Traffic
AKP4 8334778 4613668
12.07.07 10:45
Average 42.4 Peak 45.1
Birds, light breeze
AKP5 8334756 4613992
12.07.07 10:55
Average 52.9 Peak 54.3
STP noise within 30m
2.2d – Effluent PSG 1 Parameters Standards Feb Mar May Jun Jul Aug Sep Oct Dec Monthly pH 6-9 6.83 6.59 7.26 7.61 7.38 7.63 7.36 7.12 7.02 COD 125 72 60 87 55 63 87 43 56 36 Oil and grease 10 <5 <5 <5 <5 <5 <5 <5 <5 <5
TSS 35 130 44 100 25 18 37 6.4 38 9.3 NH4 1 0.43 4.3 5.6 3.4 2.2 2.4 1.9 0.19 <0.01 Sulphide <400 <0.02 <0.02 <0.02 <0.02 <0.02 <0.02 <0.02 <0.02 0.04 Coliform bacteria <2 <2 4 <2 <2 5 180 2 2
Quarterly BOD 25 8.8 8.4 8 8.9 Heavy metals 10 As 0.1 <0.005 <0.005 <0.005 <0.01 Cd 0.1 <0.001 <0.001 <0.001 <0.001 Cr (6) 0.1 <0.01 <0.01 <0.01 <0.005

BTC Pipeline Project
79
Cr total 0.5 <0.01 <0.01 <0.01 <0.005 Cu 0.5 0.01 0.019 0.004 0.011 Fe 3.5 0.23 0.031 0.026 <0.05 Pb 0.1 <0.01 <0.01 <0.01 <0.01 Hg 0.01 <0.00001 <0.00001 <0.00001 0.00015 Ni 0.5 <0.01 <0.01 <0.01 <0.05 Se 0.1 0.03 <0.005 0.02 0.01 Ag 0.5 0.003 <0.001 0.002 0.0019 Zn 1 0.095 0.024 0.4 0.063 Phenols 0.5 0.03 <0.03 <0.03 0.01 Chlorine 0.2 0.1 <0.01 <0.01 <0.01 NOTE: January and November Retention Ponds were frozen - no monitoring was conducted
In April due to custom clearance expansion samples’ holding time exceeded and no monitoring was conducted
PSG2 Parameters Standards Mar May Jul Aug Sep Oct Monthly pH 6-9 7.85 8.42 7.06 7 6.85 6.4 COD 125 20 26 59 60 69 49 Oil and grease 10 <5 <5 <5 <5 <5 <5
TSS 35 <2 3.6 6.9 12 11 6.8 NH4 10 2.9 1.8 2.2 1.4 1.9 0.05 Sulphide 1 <0.02 <0.02 <0.02 <0.02 <0.02 <0.02 Coliform bacteria <400 <2 2 4 16000 3500 350
Quarterly BOD 25 6.9 19 14 Heavy metals 10 <0.1 <0.1 <0.1 As 0.1 <0.005 <0.005 <0.01 Cd 0.1 <0.001 <0.001 <0.001 Cr (6) 0.1 <0.01 <0.01 <0.005 Cr total 0.5 <0.01 <0.01 <0.005 Cu 0.5 0.012 <0.01 0.009 Fe 3.5 0.029 0.09 0.33 Pb 0.1 <0.01 <0.005 <0.01 Hg 0.01 <0.00001 <0.00001 0.00025 Ni 0.5 <0.01 <0.01 <0.05 Se 0.1 <0.005 <0.005 <0.01 Ag 0.5 <0.001 <0.001 0.0092 Zn 1 0.023 0.01 0.017 Phenols 0.5 <0.03 <0.03 0.04 Chlorine 0.2 <0.01 0.02 0.24 NOTE: In January, February, November and December Retention Ponds were frozen or dry – no monitoring was
conducted In April due to custom clearance expansion samples’ holding time exceeded – no monitoring was conducted
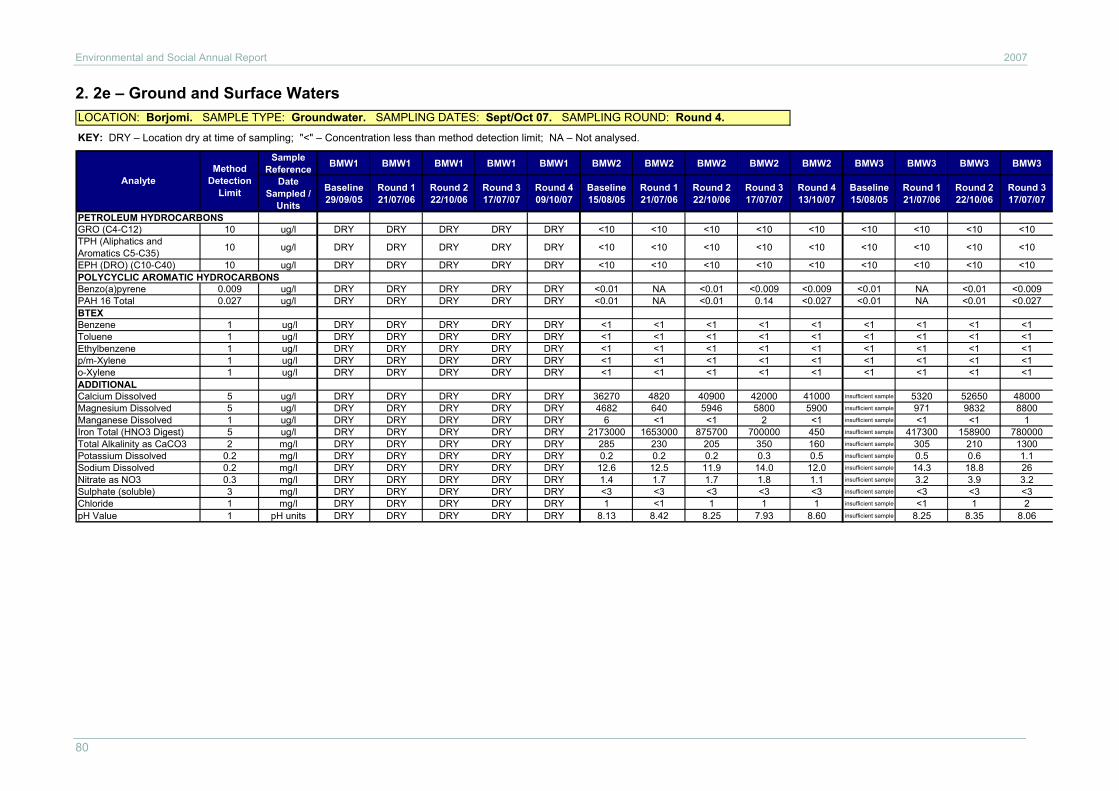
Environmental and Social Annual Report 2007
80
2. 2e – Ground and Surface Waters LOCATION: Borjomi. SAMPLE TYPE: Groundwater. SAMPLING DATES: Sept/Oct 07. SAMPLING ROUND: Round 4.
KEY: DRY – Location dry at time of sampling; "<" – Concentration less than method detection limit; NA – Not analysed.
Sample Reference BMW1 BMW1 BMW1 BMW1 BMW1 BMW2 BMW2 BMW2 BMW2 BMW2 BMW3 BMW3 BMW3 BMW3
Date Sampled /
Units
Baseline 29/09/05
Round 1 21/07/06
Round 2 22/10/06
Round 317/07/07
Round 409/10/07
Baseline 15/08/05
Round 1 21/07/06
Round 222/10/06
Round 317/07/07
Round 413/10/07
Baseline 15/08/05
Round 1 21/07/06
Round 222/10/06
Round 317/07/07
PETROLEUM HYDROCARBONSGRO (C4-C12) 10 ug/l DRY DRY DRY DRY DRY <10 <10 <10 <10 <10 <10 <10 <10 <10TPH (Aliphatics and Aromatics C5-C35) 10 ug/l DRY DRY DRY DRY DRY <10 <10 <10 <10 <10 <10 <10 <10 <10
EPH (DRO) (C10-C40) 10 ug/l DRY DRY DRY DRY DRY <10 <10 <10 <10 <10 <10 <10 <10 <10POLYCYCLIC AROMATIC HYDROCARBONSBenzo(a)pyrene 0.009 ug/l DRY DRY DRY DRY DRY <0.01 NA <0.01 <0.009 <0.009 <0.01 NA <0.01 <0.009PAH 16 Total 0.027 ug/l DRY DRY DRY DRY DRY <0.01 NA <0.01 0.14 <0.027 <0.01 NA <0.01 <0.027BTEXBenzene 1 ug/l DRY DRY DRY DRY DRY <1 <1 <1 <1 <1 <1 <1 <1 <1Toluene 1 ug/l DRY DRY DRY DRY DRY <1 <1 <1 <1 <1 <1 <1 <1 <1Ethylbenzene 1 ug/l DRY DRY DRY DRY DRY <1 <1 <1 <1 <1 <1 <1 <1 <1p/m-Xylene 1 ug/l DRY DRY DRY DRY DRY <1 <1 <1 <1 <1 <1 <1 <1 <1o-Xylene 1 ug/l DRY DRY DRY DRY DRY <1 <1 <1 <1 <1 <1 <1 <1 <1ADDITIONALCalcium Dissolved 5 ug/l DRY DRY DRY DRY DRY 36270 4820 40900 42000 41000 insufficient sample 5320 52650 48000Magnesium Dissolved 5 ug/l DRY DRY DRY DRY DRY 4682 640 5946 5800 5900 insufficient sample 971 9832 8800Manganese Dissolved 1 ug/l DRY DRY DRY DRY DRY 6 <1 <1 2 <1 insufficient sample <1 <1 1Iron Total (HNO3 Digest) 5 ug/l DRY DRY DRY DRY DRY 2173000 1653000 875700 700000 450 insufficient sample 417300 158900 780000Total Alkalinity as CaCO3 2 mg/l DRY DRY DRY DRY DRY 285 230 205 350 160 insufficient sample 305 210 1300Potassium Dissolved 0.2 mg/l DRY DRY DRY DRY DRY 0.2 0.2 0.2 0.3 0.5 insufficient sample 0.5 0.6 1.1Sodium Dissolved 0.2 mg/l DRY DRY DRY DRY DRY 12.6 12.5 11.9 14.0 12.0 insufficient sample 14.3 18.8 26Nitrate as NO3 0.3 mg/l DRY DRY DRY DRY DRY 1.4 1.7 1.7 1.8 1.1 insufficient sample 3.2 3.9 3.2Sulphate (soluble) 3 mg/l DRY DRY DRY DRY DRY <3 <3 <3 <3 <3 insufficient sample <3 <3 <3Chloride 1 mg/l DRY DRY DRY DRY DRY 1 <1 1 1 1 insufficient sample <1 1 2pH Value 1 pH units DRY DRY DRY DRY DRY 8.13 8.42 8.25 7.93 8.60 insufficient sample 8.25 8.35 8.06
AnalyteMethod
Detection Limit
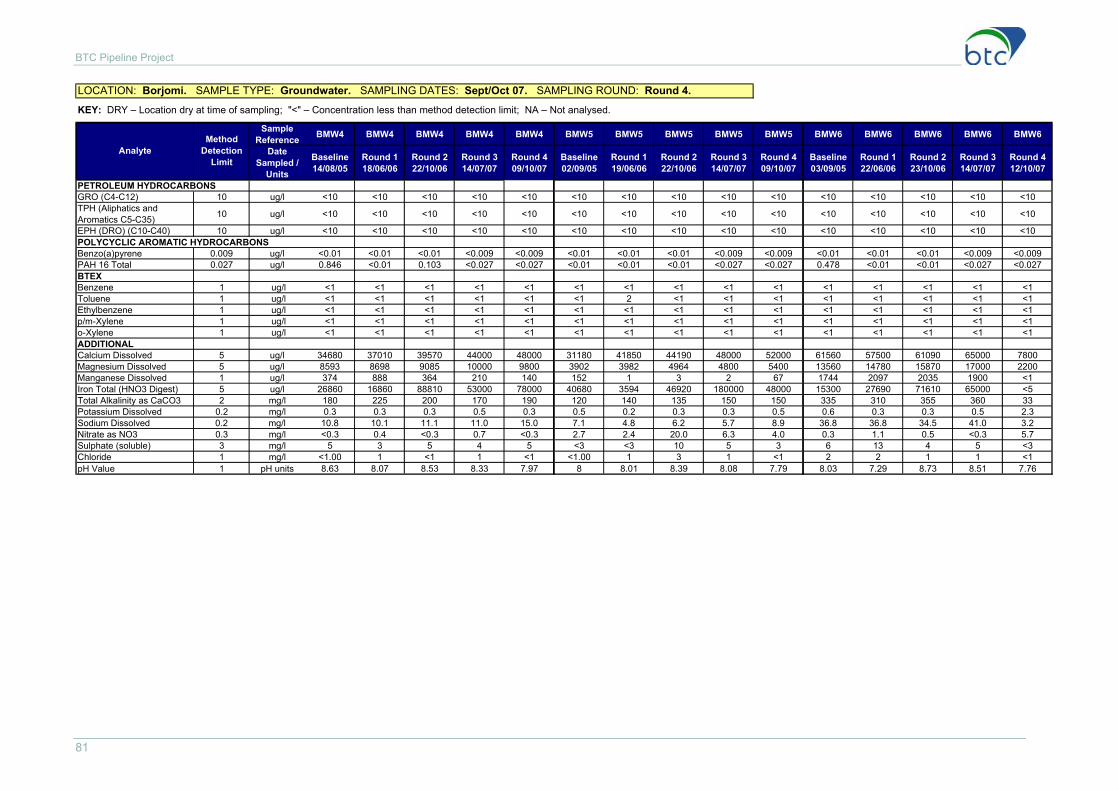
BTC Pipeline Project
81
LOCATION: Borjomi. SAMPLE TYPE: Groundwater. SAMPLING DATES: Sept/Oct 07. SAMPLING ROUND: Round 4.
KEY: DRY – Location dry at time of sampling; "<" – Concentration less than method detection limit; NA – Not analysed.
Sample Reference BMW4 BMW4 BMW4 BMW4 BMW4 BMW5 BMW5 BMW5 BMW5 BMW5 BMW6 BMW6 BMW6 BMW6 BMW6
Date Sampled /
Units
Baseline 14/08/05
Round 1 18/06/06
Round 222/10/06
Round 314/07/07
Round 409/10/07
Baseline 02/09/05
Round 1 19/06/06
Round 222/10/06
Round 314/07/07
Round 409/10/07
Baseline 03/09/05
Round 1 22/06/06
Round 223/10/06
Round 314/07/07
Round 412/10/07
PETROLEUM HYDROCARBONSGRO (C4-C12) 10 ug/l <10 <10 <10 <10 <10 <10 <10 <10 <10 <10 <10 <10 <10 <10 <10TPH (Aliphatics and Aromatics C5-C35) 10 ug/l <10 <10 <10 <10 <10 <10 <10 <10 <10 <10 <10 <10 <10 <10 <10
EPH (DRO) (C10-C40) 10 ug/l <10 <10 <10 <10 <10 <10 <10 <10 <10 <10 <10 <10 <10 <10 <10POLYCYCLIC AROMATIC HYDROCARBONSBenzo(a)pyrene 0.009 ug/l <0.01 <0.01 <0.01 <0.009 <0.009 <0.01 <0.01 <0.01 <0.009 <0.009 <0.01 <0.01 <0.01 <0.009 <0.009PAH 16 Total 0.027 ug/l 0.846 <0.01 0.103 <0.027 <0.027 <0.01 <0.01 <0.01 <0.027 <0.027 0.478 <0.01 <0.01 <0.027 <0.027BTEXBenzene 1 ug/l <1 <1 <1 <1 <1 <1 <1 <1 <1 <1 <1 <1 <1 <1 <1Toluene 1 ug/l <1 <1 <1 <1 <1 <1 2 <1 <1 <1 <1 <1 <1 <1 <1Ethylbenzene 1 ug/l <1 <1 <1 <1 <1 <1 <1 <1 <1 <1 <1 <1 <1 <1 <1p/m-Xylene 1 ug/l <1 <1 <1 <1 <1 <1 <1 <1 <1 <1 <1 <1 <1 <1 <1o-Xylene 1 ug/l <1 <1 <1 <1 <1 <1 <1 <1 <1 <1 <1 <1 <1 <1 <1ADDITIONALCalcium Dissolved 5 ug/l 34680 37010 39570 44000 48000 31180 41850 44190 48000 52000 61560 57500 61090 65000 7800Magnesium Dissolved 5 ug/l 8593 8698 9085 10000 9800 3902 3982 4964 4800 5400 13560 14780 15870 17000 2200Manganese Dissolved 1 ug/l 374 888 364 210 140 152 1 3 2 67 1744 2097 2035 1900 <1Iron Total (HNO3 Digest) 5 ug/l 26860 16860 88810 53000 78000 40680 3594 46920 180000 48000 15300 27690 71610 65000 <5Total Alkalinity as CaCO3 2 mg/l 180 225 200 170 190 120 140 135 150 150 335 310 355 360 33Potassium Dissolved 0.2 mg/l 0.3 0.3 0.3 0.5 0.3 0.5 0.2 0.3 0.3 0.5 0.6 0.3 0.3 0.5 2.3Sodium Dissolved 0.2 mg/l 10.8 10.1 11.1 11.0 15.0 7.1 4.8 6.2 5.7 8.9 36.8 36.8 34.5 41.0 3.2Nitrate as NO3 0.3 mg/l <0.3 0.4 <0.3 0.7 <0.3 2.7 2.4 20.0 6.3 4.0 0.3 1.1 0.5 <0.3 5.7Sulphate (soluble) 3 mg/l 5 3 5 4 5 <3 <3 10 5 3 6 13 4 5 <3Chloride 1 mg/l <1.00 1 <1 1 <1 <1.00 1 3 1 <1 2 2 1 1 <1pH Value 1 pH units 8.63 8.07 8.53 8.33 7.97 8 8.01 8.39 8.08 7.79 8.03 7.29 8.73 8.51 7.76
AnalyteMethod
Detection Limit

Environmental and Social Annual Report 2007
82
LOCATION: Borjomi. SAMPLE TYPE: Groundwater. SAMPLING DATES: Sept/Oct 07. SAMPLING ROUND: Round 4.
KEY: DRY – Location dry at time of sampling; "<" – Concentration less than method detection limit; NA – Not analysed.
Sample Reference BMW7 BMW7 BMW7 BMW7 BMW7 BMW8 BMW8 BMW8 BMW8 BMW8 BMW9 BMW9 BMW9 BMW9 BMW9
Date Sampled /
Units
Baseline 02/09/05
Round 1 25/06/06
Round 2 24/10/06
Round 313/07/07
Round 4 13/10/07
Baseline 02/09/05
Round 1 19/06/06
Round 224/10/06
Round 313/07/07
Round 401/10/07
Baseline 08/09/05
Round 1 21/06/06
Round 225/10/06
Round 308/08/07
Round 402/10/07
PETROLEUM HYDROCARBONSGRO (C4-C12) 10 ug/l <10 <10 No Access <10 <10 <10 <10 <10 <10 <10 <10 <10 <10 <10 <10TPH (Aliphatics and Aromatics C5-C35) 10 ug/l <10 <10 No Access <10 <10 <10 <10 <10 <10 <10 <10 <10 <10 <10 <10
EPH (DRO) (C10-C40) 10 ug/l <10 <10 No Access <10 <10 <10 <10 <10 <10 <10 <10 <10 <10 <10 <10POLYCYCLIC AROMATIC HYDROCARBONSBenzo(a)pyrene 0.009 ug/l <0.01 <0.01 No Access <0.009 <0.009 <0.01 <0.01 <0.01 <0.009 <0.009 0.203 <0.01 <0.01 <0.009 <0.009PAH 16 Total 0.027 ug/l <0.01 <0.01 No Access <0.027 <0.027 <0.01 <0.01 <0.01 0.028 0.032 2.553 <0.01 <0.01 <0.027 <0.027BTEXBenzene 1 ug/l <1 <1 No Access <1 <1 <1 <1 <1 <1 <1 <1 <1 <1 <1 <1Toluene 1 ug/l <1 <1 No Access <1 <1 <1 <1 <1 <1 <1 <1 <1 <1 <1 <1Ethylbenzene 1 ug/l <1 <1 No Access <1 <1 <1 <1 <1 <1 <1 <1 <1 <1 <1 <1p/m-Xylene 1 ug/l <1 <1 No Access <1 <1 <1 <1 <1 <1 <1 <1 <1 <1 <1 <1o-Xylene 1 ug/l <1 <1 No Access <1 <1 <1 <1 <1 <1 <1 <1 <1 <1 <1 <1ADDITIONALCalcium Dissolved 5 ug/l 45870 55840 No Access 56000 55000 38330 43260 30410 35000 28000 112500 96160 90010 91000 92000Magnesium Dissolved 5 ug/l 6783 9380 No Access 10000 10000 8208 10400 7883 9100 7100 22360 20490 20320 20000 19000Manganese Dissolved 1 ug/l 248 947 No Access 940 970 130 27 78 20 <1 598 487 426 440 450Iron Total (HNO3 Digest) 5 ug/l 13870 335400 No Access 300000 430000 14120 8239 268800 240000 19000 2241 15000 2101 30000 19000Total Alkalinity as CaCO3 2 mg/l 205 305 No Access 320 350 275 950 410 770 360 410 400 370 320 390Potassium Dissolved 0.2 mg/l 1.1 0.6 No Access 1.2 0.9 2.3 1.7 3.0 2.1 1.8 0.8 1.4 1.4 1.4 1.5Sodium Dissolved 0.2 mg/l 30.8 30.0 No Access 41 40 72.0 84.0 108.8 110.0 130.0 35.8 37.5 35.3 45.0 47.0Nitrate as NO3 0.3 mg/l <0.3 0.6 No Access <0.3 <0.3 <0.3 1.8 <0.3 0.3 2.5 <0.3 0.5 <0.3 <0.3 <0.3Sulphate (soluble) 3 mg/l 20 7 No Access 4 5 19 26 37 32 42 17 15 16 16 15Chloride 1 mg/l 7 17 No Access 17 19 3 2 2 2 2 1 2 1 1 1pH Value 1 pH units 8.48 7.99 No Access 8.39 8.48 8.07 8.27 8.54 8.40 8.32 7.86 7.34 8.12 8.19 7.91
AnalyteMethod
Detection Limit

BTC Pipeline Project
83
LOCATION: Borjomi. SAMPLE TYPE: Groundwater. SAMPLING DATES: Sept/Oct 07. SAMPLING ROUND: Round 4.
KEY: DRY – Location dry at time of sampling; "<" – Concentration less than method detection limit; NA – Not analysed.
Sample Reference BMW10 BMW10 BMW10 BMW10 BMW10 BMW11 BMW11 BMW11 BMW11 BMW11
Date Sampled /
Units
Baseline 06/09/05
Round 1 21/07/06
Round 225/10/06
Round 308/08/07
Round 402/10/07
Baseline 06/09/05
Round 1 21/06/06
Round 2 25/10/06
Round 308/08/07
Round 402/10/07
PETROLEUM HYDROCARBONSGRO (C4-C12) 10 ug/l <10 <10 <10 <10 <10 <10 <10 <10 <10 <10TPH (Aliphatics and Aromatics C5-C35) 10 ug/l 18 <10 <10 520 <10 <10 <10 <10 <10 <10
EPH (DRO) (C10-C40) 10 ug/l <10 <10 <10 1500 <10 <10 <10 <10 <10 <10POLYCYCLIC AROMATIC HYDROCARBONSBenzo(a)pyrene 0.009 ug/l <0.01 <0.01 <0.01 0.014 <0.009 <0.01 <0.01 <0.01 <0.009 <0.009PAH 16 Total 0.027 ug/l 0.279 <0.01 <0.01 0.8 0.060 <0.01 <0.01 <0.01 <0.027 <0.027BTEXBenzene 1 ug/l <1 <1 <1 <1 <1 <1 <1 <1 <1 <1Toluene 1 ug/l <1 <1 <1 <1 <1 <1 <1 <1 <1 <1Ethylbenzene 1 ug/l <1 <1 <1 <1 <1 <1 <1 <1 <1 <1p/m-Xylene 1 ug/l <1 <1 <1 <1 <1 <1 <1 <1 <1 <1o-Xylene 1 ug/l <1 <1 <1 <1 <1 <1 <1 <1 <1 <1ADDITIONALCalcium Dissolved 5 ug/l 27860 30680 43990 60000 48000 5204 4291 6249 7200 9500Magnesium Dissolved 5 ug/l 24 5956 12630 16000 15000 1175 977 1137 2000 2400Manganese Dissolved 1 ug/l <1 11 76 200 57 9 6 8 2 19Iron Total (HNO3 Digest) 5 ug/l 810 110100 486200 11470000 58000 336600 140700 265600 7900 540Total Alkalinity as CaCO3 2 mg/l 230 270 805 27000.0 420 515 325 295 140 120Potassium Dissolved 0.2 mg/l 2.1 3.3 8.3 3.5 2.7 48.0 33.8 2.9 2.1 1.8Sodium Dissolved 0.2 mg/l 81.0 45.0 46.5 41.0 56.0 75.0 73.5 78 42 43.0Nitrate as NO3 0.3 mg/l <0.3 0.3 <0.3 <0.3 1.7 <0.3 0.5 <0.3 2 2.1Sulphate (soluble) 3 mg/l 12 15 16 12 17 17 15 12 8 8Chloride 1 mg/l 1 <1 <1 2.00 <1 1 <1.00 <1 2 <1pH Value 1 pH units 11.47 8.50 8.33 8.21 8.27 8.94 9.08 9.09 8.47 8.35
AnalyteMethod
Detection Limit

Environmental and Social Annual Report 2007
84
LOCATION: Borjomi. SAMPLE TYPE: Surfacewater. SAMPLING DATES: Sept/Oct 07. SAMPLING ROUND: Round 4.
KEY: DRY – Location dry at time of sampling; "<" – Concentration less than method detection limit; NA – Not analysed.
Sample Reference BSW1 BSW1 BSW1 BSW1 BSW1 BSW2 BSW2 BSW2 BSW2 BSW2 BSW3 BSW3 BSW3 BSW3 BSW3
Date Sampled /
Units
Baseline 06/09/05
Round 1 17/06/06
Round 226/10/06
Round 317/07/07
Round 429/09/07
Baseline 08/09/05
Round 1 17/06/06
Round 222/10/06
Round 316/07/07
Round 429/09/07
Baseline 01/09/05
Round 1 17/06/06
Round 221/10/06
Round 313/07/07
Round 429/09/07
PETROLEUM HYDROCARBONSGRO (C4-C12) 10 ug/l <10 <10 <10 <10 <10 <10 <10 <10 <10 <10 <10 <10 <10 <10 <10TPH 10 ug/l <10 <10 <10 <10 <10 <10 <10 <10 <10 <10 <10 <10 <10 <10 <10EPH (DRO) (C10-C40) 10 ug/l <10 <10 <10 <10 <10 <10 <10 <10 <10 <10 <10 <10 <10 <10 <10POLYCYCLIC AROMATIC HYDROCARBONSBenzo(a)pyrene 0.009 ug/l <0.01 <0.01 <0.01 <0.009 <0.009 <0.01 <0.01 <0.01 <0.009 <0.009 <0.01 <0.01 <0.01 <0.009 <0.009PAH 16 Total 0.027 ug/l <0.01 <0.01 <0.01 <0.027 <0.027 <0.01 <0.01 <0.01 <0.027 <0.027 <0.01 <0.01 <0.01 <0.027 <0.027BTEXBenzene 1 ug/l <1 <1 <1 <1 <1 <1 <1 <1 <1 <1 <1 <1 <1 <1 <1Toluene 1 ug/l <1 <1 <1 <1 <1 <1 <1 <1 <1 <1 <1 <1 <1 <1 <1Ethylbenzene 1 ug/l <1 <1 <1 <1 <1 <1 <1 <1 <1 <1 <1 <1 <1 <1 <1p/m-Xylene 1 ug/l <1 <1 <1 <1 <1 <1 <1 <1 <1 <1 <1 <1 <1 <1 <1o-Xylene 1 ug/l <1 <1 <1 <1 <1 <1 <1 <1 <1 <1 <1 <1 <1 <1 <1
AnalyteMethod
Detection Limit
LOCATION: Borjomi. SAMPLE TYPE: Surfacewater. SAMPLING DATES: Sept/Oct 07. SAMPLING ROUND: Round 4.
KEY: DRY – Location dry at time of sampling; "<" – Concentration less than method detection limit; NA – Not analysed.
Sample Reference BSW4 BSW4 BSW4 BSW4 BSW4 BSW5 BSW5 BSW5 BSW5 BSW5 BSW6 BSW6 BSW6 BSW6 BSW6
Date Sampled /
Units
Baseline 15/08/05
Round 1 17/06/06
Round 2 21/10/06
Round 313/07/07
Round 429/09/07
Baseline 05/09/05
Round 1 17/06/06
Round 221/10/06
Round 313/07/07
Round 429/09/07
Baseline 15/08/05
Round 1 17/06/06
Round 226/10/06
Round 313/07/07
Round 429/09/07
PETROLEUM HYDROCARBONSGRO (C4-C12) 10 ug/l <10 <10 <10 <10 <10 <10 <10 <10 <10 <10 <10 <10 <10 <10 <10TPH 10 ug/l <10 <10 <10 <10 <10 <10 <10 <10 <10 <10 <10 <10 68 <10 <10EPH (DRO) (C10-C40) 10 ug/l <10 <10 <10 <10 <10 <10 <10 <10 <10 <10 <10 <10 <10 <10 <10POLYCYCLIC AROMATIC HYDROCARBONSBenzo(a)pyrene 0.009 ug/l <0.01 <0.01 <0.01 <0.009 <0.009 <0.01 <0.01 <0.01 <0.009 <0.009 <0.01 <0.01 <0.01 <0.009 <0.009PAH 16 Total 0.027 ug/l 1.119 <0.01 <0.01 <0.027 <0.027 <0.01 <0.01 <0.01 <0.027 <0.027 <0.01 <0.01 <0.01 <0.027 <0.027BTEXBenzene 1 ug/l <1 <1 <1 <1 <1 <1 <1 <1 <1 <1 <1 <1 <1 <1 <1Toluene 1 ug/l <1 <1 <1 <1 <1 <1 <1 <1 <1 <1 <1 <1 <1 <1 <1Ethylbenzene 1 ug/l <1 <1 <1 <1 <1 <1 <1 <1 <1 <1 <1 <1 <1 <1 <1p/m-Xylene 1 ug/l <1 <1 <1 <1 <1 <1 <1 <1 <1 <1 <1 <1 <1 <1 <1o-Xylene 1 ug/l <1 <1 <1 <1 <1 <1 <1 <1 <1 <1 <1 <1 <1 <1 <1
AnalyteMethod
Detection Limit

BTC Pipeline Project
85
LOCATION: Borjomi. SAMPLE TYPE: Surfacewater. SAMPLING DATES: Sept/Oct 07. SAMPLING ROUND: Round 4.
KEY: DRY – Location dry at time of sampling; "<" – Concentration less than method detection limit; NA – Not analysed.
Sample Reference BSW7 BSW7 BSW7 BSW7 BSW7 BSW8 BSW8 BSW8 BSW8 BSW8 BSW9 BSW9 BSW9 BSW9 BSW9
Date Sampled /
Units
Baseline 11/09/05
Round 1 17/06/06
Round 2 26/10/06
Round 3 13/07/07
Round 4 29/09/07
Baseline 11/09/05
Round 1 17/06/06
Round 2 26/10/06
Round 3 13/07/07
Round 4 29/09/07
Baseline 05/09/05
Round 1 17/06/06
Round 2 21/10/06
Round 313/07/07
Round 428/09/07
PETROLEUM HYDROCARBONSGRO (C4-C12) 10 ug/l <10 No Access No Access No Access No Access <10 No Access No Access No Access No Access <10 <10 <10 <10 <10TPH 10 ug/l <10 No Access No Access No Access No Access <10 No Access No Access No Access No Access <10 <10 <10 <10 <10EPH (DRO) (C10-C40) 10 ug/l <10 No Access No Access No Access No Access <10 No Access No Access No Access No Access <10 <10 <10 <10 <10POLYCYCLIC AROMATIC HYDROCARBONSBenzo(a)pyrene 0.009 ug/l <0.01 No Access No Access No Access No Access <0.01 No Access No Access No Access No Access <0.01 <0.01 <0.01 <0.009 <0.009PAH 16 Total 0.027 ug/l <0.01 No Access No Access No Access No Access 1.106 No Access No Access No Access No Access <0.01 <0.01 <0.01 <0.027 <0.027BTEXBenzene 1 ug/l <1 No Access No Access No Access No Access <1 No Access No Access No Access No Access <1 <1 <1 <1 <1Toluene 1 ug/l <1 No Access No Access No Access No Access <1 No Access No Access No Access No Access <1 <1 <1 <1 <1Ethylbenzene 1 ug/l <1 No Access No Access No Access No Access <1 No Access No Access No Access No Access <1 <1 <1 <1 <1p/m-Xylene 1 ug/l <1 No Access No Access No Access No Access <1 No Access No Access No Access No Access <1 <1 <1 <1 <1o-Xylene 1 ug/l <1 No Access No Access No Access No Access <1 No Access No Access No Access No Access <1 <1 <1 <1 <1
AnalyteMethod
Detection Limit
LOCATION: Ktsia / Tabatskuri. SAMPLE TYPE: Groundwater. SAMPLING DATES: Sept/Oct 07. SAMPLING ROUND: Round 4.
KEY: DRY – Location dry at time of sampling; "<" – Concentration less than method detection limit; NA – Not analysed; NDP – No determination possible.
Sample Reference KTMW1 KTMW1 KTMW1 KTMW1 KTMW1 KTMW2 KTMW2 KTMW2 KTMW2 KTMW2 KTMW3 KTMW3 KTMW3 KTMW3 KTMW3
Date Sampled /
Units
Baseline 21/09/05
Round 1 27/06/06
Round 2 31/10/06
Round 3 19/07/07
Round 4 03/10/07
Baseline 09/09/05
Round 1 27/06/06
Round 231/10/06
Round 3 19/07/07
Round 4 03/10/07
Baseline 22/09/05
Round 1 20/07/06
Round 231/10/06
Round 3 19/07/07
Round 4 03/10/07
PETROLEUM HYDROCARBONSGRO (C4-C12) 10 ug/l <10 <10 Dry <10 <10 <10 No Access <10 <10 <10 <10 <10 <10 <10 <10TPH 10 ug/l <10 <10 Dry <10 <10 <10 No Access <10 <10 <10 <10 <10 <10 <10 <10EPH (DRO) (C10-C40) 10 ug/l <10 233 Dry <10 <10 <10 No Access <10 200 <10 <10 <10 <10 <10 <10POLYCYCLIC AROMATIC HYDROCARBONSBenzo(a)pyrene 0.009 ug/l <0.01 <0.01 Dry <0.009 <0.009 <0.01 No Access NDP <0.009 <0.009 <0.01 <0.01 <0.01 <0.009 <0.009PAH 16 Total 0.027 ug/l 2.248 <0.01 Dry <0.027 <0.027 <0.01 No Access NDP <0.027 <0.027 <0.01 <0.01 <0.01 <0.027 <0.027BTEXBenzene 1 ug/l <1 <1 Dry <1 <1 <1 No Access <1 <1 <1 <1 <1 <1 <1 <1Toluene 1 ug/l <1 <1 Dry <1 <1 <1 No Access <1 <1 <1 <1 <1 <1 <1 <1Ethylbenzene 1 ug/l <1 <1 Dry <1 <1 <1 No Access <1 <1 <1 <1 <1 <1 <1 <1p/m-Xylene 1 ug/l <1 <1 Dry <1 <1 <1 No Access <1 <1 <1 <1 <1 <1 <1 <1o-Xylene 1 ug/l <1 <1 Dry <1 <1 <1 No Access <1 <1 <1 <1 <1 <1 <1 <1ADDITIONALCalcium Dissolved 5 ug/l 38860 37590 Dry 47000 60000 61710 No Access 61110 45000 52000 43670 4247 51580 47000 54000Magnesium Dissolved 5 ug/l 11010 10660 Dry 5500 8200 14370 No Access 10450 11000 13000 8195 829 8578 8200 8200Manganese Dissolved 1 ug/l 462 2714 Dry 5 2600 282 No Access 402 310 1400 - 53 498 560 400Iron Total (HNO3 Digest) 5 ug/l 109500 6652 Dry 8200 260000 34900 No Access 84130 290000 180000 - 179500 108600 150000 420000Total Alkalinity as CaCO3 2 mg/l 4000 165 Dry 160 190 305 No Access 225 260 210 125 145 110 140 130Potassium Dissolved 0.2 mg/l 0.2 1.7 Dry 0.5 0.6 4.5 No Access 1.5 3.6 3.3 1.5 1.5 1.7 2.0 1.8Sodium Dissolved 0.2 mg/l 6.6 7.1 Dry 4.7 6.0 11.4 No Access 9.3 8.4 9.9 15.8 17.3 19.5 21.0 26.0Nitrate as NO3 0.3 mg/l <0.3 0.3 Dry <0.3 0.5 <0.3 No Access 0.6 1.9 1.6 <0.3 <0.3 0.4 <0.3 <0.3Sulphate (soluble) 3 mg/l 3 <3 Dry <3 <3 7 No Access 5 3 4 20 23 21 21 22Chloride 1 mg/l 1 <1 Dry 2 <1 1 No Access <1 2 5 78 70 71 70 74pH Value 1 pH units 7.77 8.06 Dry 8.27 7.93 8.43 No Access 8.44 7.89 8.12 8.16 8.26 8.29 8.25 8.33
AnalyteMethod
Detection Limit
Environmental and Social Annual Report 2007
86
LOCATION: Ktsia / Tabatskuri. SAMPLE TYPE: Groundwater. SAMPLING DATES: Sept/Oct 07. SAMPLING ROUND: Round 4.
KEY: DRY – Location dry at time of sampling; "<" – Concentration less than method detection limit; NA – Not analysed; NDP – No determination possible.
Sample Reference KTMW4 KTMW4 KTMW4 KTMW4 KTMW4 KTMW5 KTMW5 KTMW5 KTMW5 KTMW5 KTMW6 KTMW6 KTMW6 KTMW6 KTMW6
Date Sampled /
Units
Baseline 25/09/05
Round 1 27/06/06
Round 2 31/10/06
Round 309/08/07
Round 4 03/10/07
Baseline 25/09/05
Round 1 28/06/06
Round 231/10/06
Round 309/08/07
Round 4 03/10/07
Baseline 25/09/05
Round 1 28/06/06
Round 2 01/11/06
Round 309/08/07
Round 4 03/10/07
PETROLEUM HYDROCARBONSGRO (C4-C12) 10 ug/l <10 <10 No Access Decommissioned Decommissioned <10 <10 <10 <10 <10 <10 <10 No Access Decommissioned DecommissionedTPH 10 ug/l <10 <10 No Access Decommissioned Decommissioned <10 <10 <10 <10 <10 <10 <10 No Access Decommissioned DecommissionedEPH (DRO) (C10-C40) 10 ug/l <10 <10 No Access Decommissioned Decommissioned <10 <10 <10 <10 <10 <10 <10 No Access Decommissioned DecommissionedPOLYCYCLIC AROMATIC HYDROCARBONSBenzo(a)pyrene 0.009 ug/l <0.01 <0.01 No Access Decommissioned Decommissioned <0.01 <0.01 <0.01 <0.009 <0.009 <0.01 <0.01 No Access Decommissioned DecommissionedPAH 16 Total 0.027 ug/l <0.01 <0.01 No Access Decommissioned Decommissioned <0.01 <0.01 <0.01 <0.027 <0.027 <0.01 <0.01 No Access Decommissioned DecommissionedBTEXBenzene 1 ug/l 2 <1 No Access Decommissioned Decommissioned <1 <1 <1 <1 <1 <1 <1 No Access Decommissioned DecommissionedToluene 1 ug/l <1 <1 No Access Decommissioned Decommissioned <1 <1 <1 <1 <1 <1 <1 No Access Decommissioned DecommissionedEthylbenzene 1 ug/l <1 <1 No Access Decommissioned Decommissioned <1 <1 <1 <1 <1 <1 <1 No Access Decommissioned Decommissionedp/m-Xylene 1 ug/l <1 <1 No Access Decommissioned Decommissioned <1 <1 <1 <1 <1 <1 <1 No Access Decommissioned Decommissionedo-Xylene 1 ug/l <1 <1 No Access Decommissioned Decommissioned <1 <1 <1 <1 <1 <1 <1 No Access Decommissioned DecommissionedADDITIONALCalcium Dissolved 5 ug/l 58250 45140 No Access Decommissioned Decommissioned 34810 33080 26730 18000 25000 13870 14280 No Access Decommissioned DecommissionedMagnesium Dissolved 5 ug/l 16860 17130 No Access Decommissioned Decommissioned 5349 6147 4017 3300 3700 4003 3269 No Access Decommissioned DecommissionedManganese Dissolved 1 ug/l 1049 1613 No Access Decommissioned Decommissioned 74 311 126 2 3 158 331 No Access Decommissioned DecommissionedIron Total (HNO3 Digest) 5 ug/l 29820 55540 No Access Decommissioned Decommissioned 34160 43510 6155 22000 100000 40400 774900 No Access Decommissioned DecommissionedTotal Alkalinity as CaCO3 2 mg/l 230 145 No Access Decommissioned Decommissioned 115 175 100 110 100 120 335 No Access Decommissioned DecommissionedPotassium Dissolved 0.2 mg/l 2.3 1.5 No Access Decommissioned Decommissioned 1.8 1.7 2.3 2.6 2.6 3.2 4.1 No Access Decommissioned DecommissionedSodium Dissolved 0.2 mg/l 18.0 10.7 No Access Decommissioned Decommissioned 6.0 5.1 5.1 5.7 3.9 4.5 5.3 No Access Decommissioned DecommissionedNitrate as NO3 0.3 mg/l <0.3 <0.3 No Access Decommissioned Decommissioned 3.2 2.3 3.0 3.3 2.3 8.0 6.8 No Access Decommissioned DecommissionedSulphate (soluble) 3 mg/l 39 <3 No Access Decommissioned Decommissioned 5 4 3 4 3 4 4 No Access Decommissioned DecommissionedChloride 1 mg/l 16 <1 No Access Decommissioned Decommissioned 4 3 3 4 3 2 1 No Access Decommissioned DecommissionedpH Value 1 pH units 8.59 8.63 No Access Decommissioned Decommissioned 8.35 8.00 8.29 8.32 7.95 7.62 8.05 No Access Decommissioned Decommissioned
AnalyteMethod
Detection Limit
LOCATION: Ktsia / Tabatskuri. SAMPLE TYPE: Groundwater. SAMPLING DATES: Sept/Oct 07. SAMPLING ROUND: Round 4.
KEY: DRY – Location dry at time of sampling; "<" – Concentration less than method detection limit; NA – Not analysed; NDP – No determination possible.
Sample Reference KTMW7 KTMW7 KTMW7 KTMW7 KTMW7 KTMW8 KTMW8 KTMW8 KTMW8 KTMW8 KTMW9 KTMW9 KTMW9 KTMW9 KTMW9
Date Sampled /
Units
Baseline 25/09/05
Round 1 28/06/06
Round 2 01/11/06
Round 3 11/08/07
Round 4 03/10/07
Baseline 25/09/05
Round 1 28/06/06
Round 2 01/11/06
Round 309/08/07
Round 4 03/10/07
Baseline 28/09/05
Round 1 28/06/06
Round 2 01/11/06
Round 309/08/07
Round 4 03/10/07
PETROLEUM HYDROCARBONSGRO (C4-C12) 10 ug/l <10 <10 No Access <10 <10 <10 No Access No Access Decommissioned Decommissioned <10 DRY No Access DRY DRYTPH 10 ug/l <10 <10 No Access <10 <10 <10 No Access No Access Decommissioned Decommissioned <10 DRY No Access DRY DRYEPH (DRO) (C10-C40) 10 ug/l <10 <10 No Access <10 <10 <10 No Access No Access Decommissioned Decommissioned <10 DRY No Access DRY DRYPOLYCYCLIC AROMATIC HYDROCARBONSBenzo(a)pyrene 0.009 ug/l <0.01 <0.01 No Access <0.009 <0.009 <0.01 No Access No Access Decommissioned Decommissioned <0.01 DRY No Access DRY DRYPAH 16 Total 0.027 ug/l <0.01 <0.01 No Access <0.027 <0.027 <0.01 No Access No Access Decommissioned Decommissioned <0.01 DRY No Access DRY DRYBTEXBenzene 1 ug/l <1 <1 No Access <1 <1 <1 No Access No Access Decommissioned Decommissioned <1 DRY No Access DRY DRYToluene 1 ug/l <1 <1 No Access <1 <1 <1 No Access No Access Decommissioned Decommissioned <1 DRY No Access DRY DRYEthylbenzene 1 ug/l <1 <1 No Access <1 <1 <1 No Access No Access Decommissioned Decommissioned <1 DRY No Access DRY DRYp/m-Xylene 1 ug/l <1 <1 No Access <1 <1 <1 No Access No Access Decommissioned Decommissioned <1 DRY No Access DRY DRYo-Xylene 1 ug/l <1 <1 No Access <1 <1 <1 No Access No Access Decommissioned Decommissioned <1 DRY No Access DRY DRYADDITIONALCalcium Dissolved 5 ug/l 84750 47670 No Access 48000 36000 56870 No Access No Access Decommissioned Decommissioned 55220 DRY No Access DRY DRYMagnesium Dissolved 5 ug/l 16900 11790 No Access 12000 7800 12060 No Access No Access Decommissioned Decommissioned 8636 DRY No Access DRY DRYManganese Dissolved 1 ug/l 255 16 No Access 1 1 811 No Access No Access Decommissioned Decommissioned 736 DRY No Access DRY DRYIron Total (HNO3 Digest) 5 ug/l 19750 261800 No Access 33000 450000 446 No Access No Access Decommissioned Decommissioned 23270 DRY No Access DRY DRYTotal Alkalinity as CaCO3 2 mg/l 300 110 No Access 160 140 225 No Access No Access Decommissioned Decommissioned 220 DRY No Access DRY DRYPotassium Dissolved 0.2 mg/l 1.8 1.5 No Access 1.5 1.5 3.0 No Access No Access Decommissioned Decommissioned 3.2 DRY No Access DRY DRYSodium Dissolved 0.2 mg/l 30.0 13.4 No Access 9.6 8.3 18.0 No Access No Access Decommissioned Decommissioned 42.8 DRY No Access DRY DRYNitrate as NO3 0.3 mg/l 1.1 1.1 No Access 1.6 2.3 0.4 No Access No Access Decommissioned Decommissioned 6.7 DRY No Access DRY DRYSulphate (soluble) 3 mg/l 191 5 No Access <3 <3 6 No Access No Access Decommissioned Decommissioned 104 DRY No Access DRY DRYChloride 1 mg/l 2 <1 No Access <1 <1 7 No Access No Access Decommissioned Decommissioned 10 DRY No Access DRY DRYpH Value 1 pH units 8.41 8.38 No Access 8.42 8.14 8.64 No Access No Access Decommissioned Decommissioned 7.76 DRY No Access DRY DRY
AnalyteMethod
Detection Limit

BTC Pipeline Project
87
LOCATION: Ktsia / Tabatskuri. SAMPLE TYPE: Groundwater. SAMPLING DATES: Sept/Oct 07. SAMPLING ROUND: Round 4.
KEY: DRY – Location dry at time of sampling; "<" – Concentration less than method detection limit; NA – Not analysed; NDP – No determination possible.
Sample Reference KTMW10 KTMW10 KTMW10a KTMW10 KTMW10 KTMW10 KTMW11 KTMW11 KTMW11 KTMW11 KTMW11 KTMW12 KTMW12 KTMW12 KTMW12 KTMW12
Date Sampled /
Units
Baseline 28/09/05
Round 1 16/07/06
Round 1 24/07/06
Round 201/11/06
Round 330/07/07
Round 4 12/10/07
Baseline 21/09/05
Round 1 20/07/06
Round 2 01/11/06
Round 309/08/07
Round 4 12/10/07
Baseline 21/09/05
Round 1 20/07/06
Round 201/11/06
Round 309/08/07
Round 412/10/07
PETROLEUM HYDROCARBONSGRO (C4-C12) 10 ug/l <10 <10 <10 <10 <10 <10 <10 <10 <10 <10 <10 <10 No Access <10 <10 <10TPH 10 ug/l <10 <10 <10 27 <10 <10 <10 <10 15 <10 <10 <10 No Access <10 <10 <10EPH (DRO) (C10-C40) 10 ug/l <10 <10 <10 <10 <10 <10 <10 <10 NDP <10 <10 <10 No Access <10 <10 <10POLYCYCLIC AROMATIC HYDROCARBONSBenzo(a)pyrene 0.009 ug/l <0.02 <0.01 <0.01 <0.01 <0.009 <0.009 <0.01 <0.01 NDP <0.009 <0.009 <0.01 No Access <0.01 <0.009 <0.009PAH 16 Total 0.027 ug/l <0.06 1.033 2.84 <0.01 <0.027 <0.027 <0.01 <0.01 NDP <0.027 <0.027 <0.01 No Access <0.01 <0.027 <0.027BTEXBenzene 1 ug/l <1 <1 <1 <1 <1 <1 <1 <1 <1 <1 <1 <1 No Access <1 <1 <1Toluene 1 ug/l <1 <1 <1 <1 <1 <1 <1 <1 <1 <1 <1 <1 No Access <1 <1 <1Ethylbenzene 1 ug/l <1 <1 <1 <1 <1 <1 <1 <1 <1 <1 <1 <1 No Access <1 <1 <1p/m-Xylene 1 ug/l <1 <1 <1 <1 <1 <1 <1 <1 <1 <1 <1 <1 No Access <1 <1 <1o-Xylene 1 ug/l <1 <1 <1 <1 <1 <1 <1 <1 <1 <1 <1 <1 No Access <1 <1 <1ADDITIONALCalcium Dissolved 5 ug/l 43680 50020 44430 38110 37000 33000 24330 2135 23530 17000 19000 37570 No Access 27490 23000 26000Magnesium Dissolved 5 ug/l 7672 7604 7444 5531 5400 4800 3181 262 2804 2300 2600 7022 No Access 5379 5000 5700Manganese Dissolved 1 ug/l 877 229 155 117 <1 2 49 <1 <1 <1 <1 497 No Access 373 640 640Iron Total (HNO3 Digest) 5 ug/l 22880 8938 52860 12550 33000 36000 - 9965 326500 1500 4400 - No Access 25220 390000 330000Total Alkalinity as CaCO3 2 mg/l 190 175 225 160 140 160 105 85 105 85 75 130 No Access 125 210 180Potassium Dissolved 0.2 mg/l 0.9 0.9 0.6 0.6 0.6 0.8 0.5 0.5 1.5 0.6 0.5 1.5 No Access 1.5 1.4 1.2Sodium Dissolved 0.2 mg/l 13.8 11.1 13.1 11.0 13.0 12.0 5.6 7.7 7.4 7.2 7.5 30.0 No Access 9.8 13 9.8Nitrate as NO3 0.3 mg/l 1.2 1.0 0.7 2.0 1.5 1.1 5.2 5.0 5.7 6.2 5.3 <0.3 No Access 1.5 <0.3 1.0Sulphate (soluble) 3 mg/l 10 <3 <3 <3 <3 <3 4 <3 <3 <3 17 91 No Access - 4 <3Chloride 1 mg/l 1 1 <1 <1 <1 <1 1 <1 <1 1 <1 1 No Access <1 1 <1pH Value 1 pH units 7.38 8.45 8.19 8.16 7.31 8.34 8.01 7.91 7.87 8.28 8.22 8.25 No Access 8.27 8.07 7.99
AnalyteMethod
Detection Limit
LOCATION: Ktsia / Tabatskuri. SAMPLE TYPE: Groundwater. SAMPLING DATES: Sept/Oct 07. SAMPLING ROUND: Round 4.
KEY: DRY – Location dry at time of sampling; "<" – Concentration less than method detection limit; NA – Not analysed; NDP – No determination possible.
Sample Reference KTMW13 KTMW13 KTMW13 KTMW13 KTMW13 KTMW14 KTMW14 KTMW14 KTMW14 KTMW14 KTMW15 KTMW15 KTMW15 KTMW15 KTMW15
Date Sampled /
Units
Baseline 25/09/05
Round 1 16/07/06
Round 201/11/06
Round 330/07/07
Round 4 09/10/07
Baseline 22/09/05
Round 1 16/07/06
Round 201/11/06
Round 330/07/07
Round 405/10/07
Baseline 22/09/05
Round 1 29/06/06
Round 201/11/06
Round 330/07/07
Round 405/10/07
PETROLEUM HYDROCARBONSGRO (C4-C12) 10 ug/l <10 <10 <10 <10 <10 <10 <10 <10 <10 <10 <10 <10 <10 <10 <10TPH 10 ug/l <10 <10 12 <10 <10 <10 <10 33 <10 <10 <10 <10 12 <10 <10EPH (DRO) (C10-C40) 10 ug/l <10 <10 <10 <10 <10 <10 <10 NDP <10 <10 <10 <10 <10 <10 <10POLYCYCLIC AROMATIC HYDROCARBONSBenzo(a)pyrene 0.009 ug/l <0.01 <0.01 <0.01 <0.009 <0.009 <0.01 <0.01 NDP <0.009 0.010 0.154 <0.01 <0.01 <0.009 <0.009PAH 16 Total 0.027 ug/l <0.01 <0.01 <0.01 0.068 <0.027 <0.01 <0.01 NDP <0.027 <0.027 2.686 <0.01 0.24 <0.027 <0.027BTEXBenzene 1 ug/l <1 <1 <1 <1 <1 <1 <1 <1 <1 <1 <1 <1 <1 <1 <1Toluene 1 ug/l <1 <1 <1 <1 <1 <1 <1 <1 <1 <1 <1 <1 <1 <1 <1Ethylbenzene 1 ug/l <1 <1 <1 <1 <1 <1 <1 <1 <1 <1 <1 <1 <1 <1 <1p/m-Xylene 1 ug/l <1 <1 <1 <1 <1 <1 <1 <1 <1 <1 <1 <1 <1 <1 <1o-Xylene 1 ug/l <1 <1 <1 <1 <1 <1 <1 <1 <1 <1 <1 <1 <1 <1 <1ADDITIONALCalcium Dissolved 5 ug/l 62460 17400 28670 37000 41000 69570 65260 29260 63000 58000 9608 8964 4521 52000 51000Magnesium Dissolved 5 ug/l 3612 1033 1169 1500 1500 10130 9066 7961 8400 8500 2318 2028 870 7500 7700Manganese Dissolved 1 ug/l 246 <1 4 <1 <1 133 <1 <1 6 <1 75 14 13 84 2Iron Total (HNO3 Digest) 5 ug/l 17740 22670 43390 8800 51000 - 31170 646900 36000 110000 - 138200 165000 22000 120000Total Alkalinity as CaCO3 2 mg/l 175 60 100 120 130 170 235 145 180 340 1100 205 495 240 470Potassium Dissolved 0.2 mg/l 1.1 1.2 0.6 0.6 2.7 0.9 0.5 1.1 1.5 1.5 1.5 1.4 5.6 3.6 2.9Sodium Dissolved 0.2 mg/l 5.4 3.5 3.9 4.2 7.1 33.0 15.0 5.7 22.0 21.0 97.5 88.5 247.5 78.0 74.0Nitrate as NO3 0.3 mg/l 0.3 0.3 1.1 0.8 0.8 7.0 1.9 2.0 2.2 1.9 5.1 5.9 4.2 17.0 9.5Sulphate (soluble) 3 mg/l 7 <3 <3 <3 <3 127 <3 <3 <3 <3 3 14 83 12 15Chloride 1 mg/l <1.00 <1 <1 <1 <1 2 1 <1 4 1 1 1 3 6 5pH Value 1 pH units 8.54 7.72 7.78 7.65 7.88 8.34 8.27 8.28 7.85 8.27 8.53 8.58 8.83 7.84 8.27
AnalyteMethod
Detection Limit

Environmental and Social Annual Report 2007
88
LOCATION: Ktsia / Tabatskuri. SAMPLE TYPE: Groundwater. SAMPLING DATES: Sept/Oct 07. SAMPLING ROUND: Round 4.
KEY: DRY – Location dry at time of sampling; "<" – Concentration less than method detection limit; NA – Not analysed; NDP – No determination possible.
Sample Reference KTMW16a KTMW16a KTMW16a KTMW16a KTMW16a KTMW17 KTMW17 KTMW17 KTMW17 KTMW17
Date Sampled /
Units
Baseline 27/09/05
Round 1 17/07/06
Round 2 02/11/06
Round 330/07/07
Round 406/10/07
Baseline 27/09/05
Round 1 17/07/06
Round 2 02/11/06
Round 3 11/08/07
Round 4 10/10/07
PETROLEUM HYDROCARBONSGRO (C4-C12) 10 ug/l <10 <10 <10 <10 <10 <10 No Access No Access <10 <10TPH 10 ug/l <10 <10 11 <10 <10 <10 No Access No Access <10 <10EPH (DRO) (C10-C40) 10 ug/l <10 <10 <10 <10 <10 <10 No Access No Access <10 <10POLYCYCLIC AROMATIC HYDROCARBONSBenzo(a)pyrene 0.009 ug/l <0.01 <0.01 <0.01 <0.009 <0.009 <0.01 No Access No Access <0.009 0.009PAH 16 Total 0.027 ug/l <0.01 <0.01 <0.01 <0.027 <0.027 <0.01 No Access No Access <0.027 <0.027BTEXBenzene 1 ug/l <1 <1 <1 <1 <1 <1 No Access No Access <1 <1Toluene 1 ug/l <1 <1 <1 <1 <1 <1 No Access No Access <1 <1Ethylbenzene 1 ug/l <1 <1 <1 <1 <1 <1 No Access No Access <1 <1p/m-Xylene 1 ug/l <1 <1 <1 <1 <1 <1 No Access No Access <1 <1o-Xylene 1 ug/l <1 <1 <1 <1 <1 <1 No Access No Access <1 <1ADDITIONALCalcium Dissolved 5 ug/l 44490 32580 30820 31000 28000 32470 No Access No Access 3900 41000Magnesium Dissolved 5 ug/l 16560 8281 7921 7900 7600 9018 No Access No Access 1500 16000Manganese Dissolved 1 ug/l 85 <1 2 5 <1 189 No Access No Access <1 12Iron Total (HNO3 Digest) 5 ug/l 5102 15150 41430 17000 4300 2300 No Access No Access 36000 49000Total Alkalinity as CaCO3 2 mg/l 180 140 140 130 120 195 No Access No Access 200 200Potassium Dissolved 0.2 mg/l 1.1 0.9 1.1 1.2 1.1 0.2 No Access No Access 0.3 0.3Sodium Dissolved 0.2 mg/l 7.2 4.5 5.4 5.9 6.0 11.4 No Access No Access 11 15Nitrate as NO3 0.3 mg/l 1.2 5.4 2.1 2.0 2.2 <0.3 No Access No Access 0.4 0.3Sulphate (soluble) 3 mg/l <3 <3 <3 <3 <3 <3 No Access No Access <3 7Chloride 1 mg/l 1 1 <1 <1 <1 <1 No Access No Access <1 <1pH Value 1 pH units 7.84 8.41 8.40 7.96 8.19 7.76 No Access No Access 8.58 8.45
AnalyteMethod
Detection Limit
LOCATION: Ktsia / Tabatskuri. SAMPLE TYPE: Surfacewater. SAMPLING DATES: Sept/Oct 07. SAMPLING ROUND: Round 4.
KEY: DRY – Location dry at time of sampling; "<" – Concentration less than method detection limit; NA – Not analysed.
Sample Reference KTSW1 KTSW1 KTSW1 KTSW1 KTSW1 KTSW2 KTSW2 KTSW2 KTSW2 KTSW2 KTSW3 KTSW3 KTSW3 KTSW3 KTSW3
Date Sampled /
Units
Baseline 21/09/05
Round 1 27/06/06
Round 229/10/06
Round 319/07/07
Round 4 03/10/07
Baseline 21/09/05
Round 1 19/07/06
Round 229/10/06
Round 319/07/07
Round 403/10/07
Baseline 28/09/05
Round 1 19/07/06
Round 2 29/10/06
Round 309/08/07
Round 48/10/07
PETROLEUM HYDROCARBONSGRO (C4-C12) 10 ug/l <10 <10 <10 <10 <10 <10 <10 <10 <10 <10 DRY DRY DRY <10 DRYTPH 10 ug/l <10 <10 <10 <10 <10 <10 <10 <10 <10 <10 DRY DRY DRY <10 DRYEPH (DRO) (C10-C40) 10 ug/l <10 <10 <10 240 <10 <10 <10 <10 <10 <10 DRY DRY DRY <10 DRYPOLYCYCLIC AROMATIC HYDROCARBONSBenzo(a)pyrene 0.009 ug/l <0.01 <0.01 <0.01 <0.009 <0.009 <0.01 <0.01 <0.01 <0.009 <0.009 DRY DRY DRY <0.009 DRYPAH 16 Total 0.027 ug/l <0.01 <0.01 0.217 <0.027 <0.027 <0.01 <0.01 <0.01 <0.027 <0.027 DRY DRY DRY <0.027 DRYBTEXBenzene 1 ug/l <1 <1 <1 <1 <1 <1 <1 <1 <1 <1 DRY DRY DRY <1 DRYToluene 1 ug/l <1 <1 <1 <1 <1 <1 <1 <1 <1 <1 DRY DRY DRY <1 DRYEthylbenzene 1 ug/l <1 <1 <1 <1 <1 <1 <1 <1 <1 <1 DRY DRY DRY <1 DRYp/m-Xylene 1 ug/l <1 <1 <1 <1 <1 <1 <1 <1 <1 <1 DRY DRY DRY <1 DRYo-Xylene 1 ug/l <1 <1 <1 <1 <1 <1 <1 <1 <1 <1 DRY DRY DRY <1 DRY
AnalyteMethod
Detection Limit

BTC Pipeline Project
89
LOCATION: Ktsia / Tabatskuri. SAMPLE TYPE: Surfacewater. SAMPLING DATES: Sept/Oct 07. SAMPLING ROUND: Round 4.
KEY: DRY – Location dry at time of sampling; "<" – Concentration less than method detection limit; NA – Not analysed.
Sample Reference KTSW4 KTSW4 KTSW4 KTSW4 KTSW4 KTSW5 KTSW5 KTSW5 KTSW5 KTSW5 KTSW6 KTSW6 KTSW6 KTSW6
Date Sampled /
Units
Baseline 10/09/05
Round 1 26/06/06
Round 229/10/06
Round 309/08/07
Round 408/10/07
Baseline 10/09/05
Round 1 26/06/06
Round 229/10/06
Round 309/08/07
Round 412/10/07
Baseline 10/09/05
Round 1 26/06/06
Round 2 29/10/06
Round 309/08/07
PETROLEUM HYDROCARBONSGRO (C4-C12) 10 ug/l insufficient sample <10 <10 DRY DRY <10 <10 <10 <10 <10 DRY <10 DRY <10TPH 10 ug/l insufficient sample insufficient sample <10 DRY DRY <10 <10 <10 <10 <10 DRY 11 DRY <10EPH (DRO) (C10-C40) 10 ug/l insufficient sample insufficient sample <10 DRY DRY <10 <10 <10 <10 <10 DRY <10 DRY <10POLYCYCLIC AROMATIC HYDROCARBONSBenzo(a)pyrene 0.009 ug/l insufficient sample insufficient sample <0.01 DRY DRY <0.01 <0.01 <0.01 <0.009 <0.009 DRY <0.01 DRY <0.009PAH 16 Total 0.027 ug/l insufficient sample insufficient sample <0.01 DRY DRY <0.01 <0.01 <0.01 <0.027 <0.027 DRY <0.01 DRY <0.027BTEXBenzene 1 ug/l <1 <1 <1 DRY DRY <1 <1 <1 <1 <1 DRY <1 DRY <1Toluene 1 ug/l <1 <1 <1 DRY DRY <1 <1 <1 <1 <1 DRY <1 DRY <1Ethylbenzene 1 ug/l <1 <1 <1 DRY DRY <1 <1 <1 <1 <1 DRY <1 DRY <1p/m-Xylene 1 ug/l <1 <1 <1 DRY DRY <1 <1 <1 <1 <1 DRY <1 DRY <1o-Xylene 1 ug/l <1 <1 <1 DRY DRY <1 <1 <1 <1 <1 DRY <1 DRY <1
AnalyteMethod
Detection Limit
LOCATION: Ktsia / Tabatskuri. SAMPLE TYPE: Surfacewater. SAMPLING DATES: Sept/Oct 07. SAMPLING ROUND: Round 4.
KEY: DRY – Location dry at time of sampling; "<" – Concentration less than method detection limit; NA – Not analysed.
Sample Reference KTSW7 KTSW7 KTSW7 KTSW7 KTSW7 KTSW8 KTSW8 KTSW8 KTSW8 KTSW8 KTSW9 KTSW9 KTSW9 KTSW9 KTSW9
Date Sampled /
Units
Baseline 28/09/05
Round 1 26/06/06
Round 229/10/06
Round 309/08/07
Round 408/10/07
Baseline 25/09/05
Round 1 26/06/06
Round 2 29/10/06
Round 309/08/07
Round 409/10/07
Baseline 22/09/05
Round 1 15/07/06
Round 229/10/06
Round 309/08/07
Round 409/10/07
PETROLEUM HYDROCARBONSGRO (C4-C12) 10 ug/l DRY <10 <10 <10 DRY <10 <10 <10 <10 <10 <10 <10 <10 <10 <10TPH 10 ug/l DRY 10 <10 <10 DRY <10 <10 <10 <10 <10 <10 <10 <10 <10 <10EPH (DRO) (C10-C40) 10 ug/l DRY <10 <10 <10 DRY <10 161 <10 <10 <10 <10 <10 <10 <10 <10POLYCYCLIC AROMATIC HYDROCARBONSBenzo(a)pyrene 0.009 ug/l DRY <0.01 <0.01 <0.009 DRY <0.01 <0.01 <0.01 <0.009 <0.009 <0.01 <0.01 <0.01 <0.009 <0.009PAH 16 Total 0.027 ug/l DRY <0.01 <0.01 <0.027 DRY <0.01 0.237 <0.01 <0.027 <0.027 <0.01 <0.01 <0.01 <0.027 <0.027BTEXBenzene 1 ug/l DRY <1 <1 <1 DRY <1 <1 <1 <1 <1 <1 <1 <1 <1 <1Toluene 1 ug/l DRY <1 <1 <1 DRY <1 <1 <1 <1 <1 <1 <1 <1 <1 <1Ethylbenzene 1 ug/l DRY <1 <1 <1 DRY <1 <1 <1 <1 <1 <1 <1 <1 <1 <1p/m-Xylene 1 ug/l DRY <1 <1 <1 DRY <1 <1 <1 <1 <1 <1 <1 <1 <1 <1o-Xylene 1 ug/l DRY <1 <1 <1 DRY <1 <1 <1 <1 <1 <1 <1 <1 <1 <1
AnalyteMethod
Detection Limit

Environmental and Social Annual Report 2007
90
LOCATION: Ktsia / Tabatskuri. SAMPLE TYPE: Surfacewater. SAMPLING DATES: Sept/Oct 07. SAMPLING ROUND: Round 4.
KEY: DRY – Location dry at time of sampling; "<" – Concentration less than method detection limit; NA – Not analysed.
Sample Reference KTSW10 KTSW10 KTSW10 KTSW10 KTSW10 KTSW11 KTSW11 KTSW11 KTSW11 KTSW11 KTSW12 KTSW12 KTSW12 KTSW12 KTSW12
Date Sampled /
Units
Baseline 27/09/05
Round 1 15/07/06
Round 228/10/06
Round 330/07/07
Round 408/10/07
Baseline 27/09/05
Round 1 15/07/06
Round 228/10/06
Round 324/08/07
Round 408/10/07
Baseline 29/09/05
Round 1 17/07/06
Round 229/10/06
Round 330/07/07
Round 406/10/07
PETROLEUM HYDROCARBONSGRO (C4-C12) 10 ug/l DRY <10 <10 <10 DRY <10 <10 <10 DRY DRY <10 <10 <10 <10 DRYTPH 10 ug/l DRY <10 <10 <10 DRY <10 <10 <10 DRY DRY <10 <10 <10 <10 DRYEPH (DRO) (C10-C40) 10 ug/l DRY <10 <10 <10 DRY <10 <10 <10 DRY DRY <10 <10 <10 <10 DRYPOLYCYCLIC AROMATIC HYDROCARBONSBenzo(a)pyrene 0.009 ug/l DRY <0.01 <0.01 <0.009 DRY <0.01 <0.01 <0.01 DRY DRY <0.01 <0.01 <0.01 <0.009 DRYPAH 16 Total 0.027 ug/l DRY <0.01 <0.01 <0.027 DRY <0.01 <0.01 <0.01 DRY DRY <0.01 <0.01 <0.01 <0.027 DRYBTEXBenzene 1 ug/l DRY <1 <1 <1 DRY <1 <1 <1 DRY DRY <1 <1 <1 <1 DRYToluene 1 ug/l DRY <1 <1 <1 DRY <1 <1 <1 DRY DRY <1 <1 <1 <1 DRYEthylbenzene 1 ug/l DRY <1 <1 <1 DRY <1 <1 <1 DRY DRY <1 <1 <1 <1 DRYp/m-Xylene 1 ug/l DRY <1 <1 <1 DRY <1 <1 <1 DRY DRY <1 <1 <1 <1 DRYo-Xylene 1 ug/l DRY <1 <1 <1 DRY <1 <1 <1 DRY DRY <1 <1 <1 <1 DRY
AnalyteMethod
Detection Limit
LOCATION: Ktsia / Tabatskuri. SAMPLE TYPE: Surfacewater. SAMPLING DATES: Sept/Oct 07. SAMPLING ROUND: Round 4.
KEY: DRY – Location dry at time of sampling; "<" – Concentration less than method detection limit; NA – Not analysed.
Sample Reference KTSW13 KTSW13 KTSW13 KTSW13 KTSW13 KTSW14 KTSW14 KTSW14 KTSW14 KTSW14 KTSW15 KTSW15 KTSW15 KTSW15 KTSW15
Date Sampled /
Units
Baseline 28/09/05
Round 1 17/07/06
Round 228/10/06
Round 325/07/08
Round 406/10/07
Baseline 27/09/05
Round 1 17/07/06
Round 228/10/06
Round 330/07/07
Round 406/10/07
Baseline 09/09/05
Round 1 17/07/06
Round 228/10/06
Round 330/07/07
Round 406/10/07
PETROLEUM HYDROCARBONSGRO (C4-C12) 10 ug/l DRY DRY <10 DRY DRY Sample Broken <10 <10 <10 <10 <10 insufficient sample <10 <10 <10TPH 10 ug/l DRY DRY <10 DRY DRY Sample Broken <10 <10 <10 <10 <10 insufficient sample <10 <10 <10EPH (DRO) (C10-C40) 10 ug/l DRY DRY <10 DRY DRY Sample Broken <10 <10 <10 <10 <10 insufficient sample <10 <10 <10POLYCYCLIC AROMATIC HYDROCARBONSBenzo(a)pyrene 0.009 ug/l DRY DRY <0.01 DRY DRY Sample Broken <0.01 <0.01 <0.009 0.009 <0.01 insufficient sample <0.01 <0.009 <0.009PAH 16 Total 0.027 ug/l DRY DRY <0.01 DRY DRY Sample Broken <0.01 <0.01 <0.027 <0.027 <0.01 insufficient sample <0.01 <0.027 <0.027BTEXBenzene 1 ug/l DRY DRY <1 DRY DRY Sample Broken <1 <1 <1 <1 <1 <1 <1 <1 <1Toluene 1 ug/l DRY DRY <1 DRY DRY Sample Broken <1 <1 <1 <1 <1 <1 <1 <1 <1Ethylbenzene 1 ug/l DRY DRY <1 DRY DRY Sample Broken <1 <1 <1 <1 <1 <1 <1 <1 <1p/m-Xylene 1 ug/l DRY DRY <1 DRY DRY Sample Broken <1 <1 <1 <1 <1 <1 <1 <1 <1o-Xylene 1 ug/l DRY DRY <1 DRY DRY Sample Broken <1 <1 <1 <1 <1 <1 <1 <1 <1
AnalyteMethod
Detection Limit
BTC Pipeline Project
91
LOCATION: Ktsia / Tabatskuri. SAMPLE TYPE: Surfacewater. SAMPLING DATES: Sept/Oct 07. SAMPLING ROUND: Round 4.
KEY: DRY – Location dry at time of sampling; "<" – Concentration less than method detection limit; NA – Not analysed.
Sample Reference KTSW16 KTSW16 KTSW16 KTSW16 KTSW16 KTSW17 KTSW17 KTSW18 KTSW18 KTSW19 KTSW19
Date Sampled /
Units
Baseline 10/09/05
Round 1 17/07/06
Round 228/10/06
Round 330/07/07
Round 406/10/07
Round 309/08/07
Round 403/10/07
Round 309/08/07
Round 412/10/07
Round 309/08/07
Round 412/10/07
PETROLEUM HYDROCARBONSGRO (C4-C12) 10 ug/l <10 <10 <10 <10 <10 <10 <10 <10 <10 DRY DRYTPH 10 ug/l <10 <10 <10 <10 <10 <10 <10 <10 <10 DRY DRYEPH (DRO) (C10-C40) 10 ug/l <10 <10 <10 <10 <10 <10 <10 <10 <10 DRY DRYPOLYCYCLIC AROMATIC HYDROCARBONSBenzo(a)pyrene 0.009 ug/l <0.01 <0.01 <0.01 <0.009 <0.009 <0.009 <0.009 <0.009 <0.009 DRY DRYPAH 16 Total 0.027 ug/l <0.01 <0.01 <0.01 <0.027 <0.027 <0.027 <0.027 <0.027 <0.027 DRY DRYBTEXBenzene 1 ug/l <1 <1 <1 <1 <1 <1 <1 <1 <1 DRY DRYToluene 1 ug/l <1 <1 <1 <1 <1 <1 <1 <1 <1 DRY DRYEthylbenzene 1 ug/l <1 <1 <1 <1 <1 <1 <1 <1 <1 DRY DRYp/m-Xylene 1 ug/l <1 <1 <1 <1 <1 <1 <1 <1 <1 DRY DRYo-Xylene 1 ug/l <1 <1 <1 <1 <1 <1 <1 <1 <1 DRY DRY
AnalyteMethod
Detection Limit
LOCATION: Tsalka. SAMPLE TYPE: Groundwater. SAMPLING DATES: Sept/Oct 07. SAMPLING ROUND: Round 4.KEY: DRY – Location dry at time of sampling; "<" – Concentration less than method detection limit; ** – Error with analytical schedule andsample held beyond holding time. Refer to Duplicate 13 results; NA – Not analysed.
Sample Reference TMW1 TMW1 TMW1 TMW1 TMW1 TMW2 TMW2 TMW2 TMW2 TMW2 TMW3 TMW3 TMW3 TMW3 TMW3
Date Sampled /
Units
Baseline 17/08/05
Round 1 08/07/06
Round 210/11/06
Round 331/07/07
Round 4 18/10/07
Baseline 31/08/05
Round 1 08/07/06
Round 211/11/06
Round 3 06/08/07
Round 4 19/10/07
Baseline 16/08/05
Round 1 08/07/06
Round 2 09/11/06
Round 3 06/08/07
Round 4 18/10/07
PETROLEUM HYDROCARBONSGRO (C4-C12) 10 ug/l <10 <10 <10 <10 <10 DRY DRY DRY DRY DRY <10 <10 DRY DRY DRYTPH 10 ug/l <10 <10 <10 <10 <10 DRY DRY DRY DRY DRY <10 <10 DRY DRY DRYEPH (DRO) (C10-C40) 10 ug/l <10 <10 <10 <10 <10 DRY DRY DRY DRY DRY <10 <10 DRY DRY DRYPOLYCYCLIC AROMATIC HYDROCARBONSBenzo(a)pyrene 0.009 ug/l <0.01 <0.01 <0.01 <0.009 <0.009 DRY DRY DRY DRY DRY <0.01 <0.01 DRY DRY DRYPAH 16 Total 0.027 ug/l <0.01 <0.01 <0.01 <0.027 <0.027 DRY DRY DRY DRY DRY 0.091 <0.01 DRY DRY DRYBTEXBenzene 1 ug/l <1 <1 <1 <1 <1 DRY DRY DRY DRY DRY <1 <1 DRY DRY DRYToluene 1 ug/l <1 <1 <1 <1 <1 DRY DRY DRY DRY DRY <1 5 DRY DRY DRYEthylbenzene 1 ug/l <1 <1 <1 <1 <1 DRY DRY DRY DRY DRY <1 3 DRY DRY DRYp/m-Xylene 1 ug/l <1 <1 <1 <1 <1 DRY DRY DRY DRY DRY <1 6 DRY DRY DRYo-Xylene 1 ug/l <1 <1 <1 <1 <1 DRY DRY DRY DRY DRY <1 3 DRY DRY DRYADDITIONALCalcium Dissolved 5 ug/l 111300 128700 151200 140000 140000 DRY DRY DRY DRY DRY 90630 75560 DRY DRY DRYMagnesium Dissolved 5 ug/l 17310 19910 22720 22000 22000 DRY DRY DRY DRY DRY 35940 19480 DRY DRY DRYManganese Dissolved 1 ug/l 348 <1 1 <1 <1 DRY DRY DRY DRY DRY 799 1 DRY DRY DRYIron Total (HNO3 Digest) 5 ug/l 346500 34450 303800 62000 82000 DRY DRY DRY DRY DRY 458 24770 DRY DRY DRYTotal Alkalinity as CaCO3 2 mg/l 275 390 335 210 270 DRY DRY DRY DRY DRY 375 500 DRY DRY DRYPotassium Dissolved 0.2 mg/l 0.6 0.8 0.6 0.6 0.5 DRY DRY DRY DRY DRY 87.0 2.0 DRY DRY DRYSodium Dissolved 0.2 mg/l 12.5 12.8 13.1 20.0 14.0 DRY DRY DRY DRY DRY 46.5 17.3 DRY DRY DRYNitrate as NO3 0.3 mg/l 152.8 161.7 178.9 170.0 170.0 DRY DRY DRY DRY DRY 21.9 1.9 DRY DRY DRYSulphate (soluble) 3 mg/l 24 30 32 33 37 DRY DRY DRY DRY DRY 91 8 DRY DRY DRYChloride 1 mg/l 42 40 43 45 52 DRY DRY DRY DRY DRY 88 5 DRY DRY DRYpH Value 1 pH units 7.89 7.87 7.92 7.74 8.10 DRY DRY DRY DRY DRY 8.80 8.00 DRY DRY DRY
AnalyteMethod
Detection Limit

Environmental and Social Annual Report 2007
92
LOCATION: Tsalka. SAMPLE TYPE: Groundwater. SAMPLING DATES: Sept/Oct 07. SAMPLING ROUND: Round 4.KEY: DRY – Location dry at time of sampling; "<" – Concentration less than method detection limit; ** – Error with analytical schedule andsample held beyond holding time. Refer to Duplicate 13 results; NA – Not analysed.
Sample Reference TMW4 TMW4 TMW4 TMW4 TMW4 TMW5 TMW5 TMW5 TMW5 TMW5 TMW6 TMW6 TMW6 TMW6 TMW6
Date Sampled /
Units
Baseline 21/08/05
Round 1 08/07/06
Round 206/11/06
Round 3 01/08/07
Round 4 17/10/07
Baseline 19/08/05
Round 1 08/07/06
Round 205/11/06
Round 3 01/08/07
Round 4 17/10/07
Baseline 21/08/05
Round 1 05/07/06
Round 205/11/06
Round 3 01/08/07
Round 4 17/10/07
PETROLEUM HYDROCARBONSGRO (C4-C12) 10 ug/l <10 <10 <10 <10 <10 <10 <10 <10 <10 <10 <10 <10 <10 <10 <10TPH 10 ug/l <10 <10 <10 <10 <10 <10 <10 26 <10 <10 <10 <10 51 <10 <10EPH (DRO) (C10-C40) 10 ug/l <10 <10 <10 <10 <10 <10 <10 <10 <10 <10 <10 <10 405 <10 <10POLYCYCLIC AROMATIC HYDROCARBONSBenzo(a)pyrene 0.009 ug/l <0.01 <0.01 <0.01 <0.009 <0.009 <0.01 <0.01 <0.01 <0.009 <0.009 <0.01 <0.01 <0.01 <0.009 <0.009PAH 16 Total 0.027 ug/l 0.099 <0.01 <0.01 <0.027 <0.027 0.492 <0.01 <0.01 0.017 0.140 0.109 <0.01 <0.01 <0.027 <0.027BTEXBenzene 1 ug/l <1 <1 <1 <1 <1 <1 <1 <1 <1 <1 <1 <1 <1 <1 <1Toluene 1 ug/l <1 <1 <1 <1 <1 <1 <1 <1 <1 <1 <1 <1 <1 <1 <1Ethylbenzene 1 ug/l <1 <1 <1 <1 <1 <1 <1 <1 <1 <1 <1 <1 <1 <1 <1p/m-Xylene 1 ug/l <1 <1 <1 <1 <1 <1 <1 <1 <1 <1 <1 <1 <1 <1 <1o-Xylene 1 ug/l <1 <1 <1 <1 <1 <1 <1 <1 <1 <1 <1 <1 <1 <1 <1ADDITIONALCalcium Dissolved 5 ug/l 89500 91970 87320 90000 91000 42530 36710 49200 50000 53000 64300 136200 75630 66000 70000Magnesium Dissolved 5 ug/l 23080 24300 22580 24000 25000 11710 9574 12560 13000 13000 11110 15340 10150 11000 10000Manganese Dissolved 1 ug/l 12 <1 5 2 9 259 94 15 47 99 129 14 1 8 1Iron Total (HNO3 Digest) 5 ug/l 272000 24590 960600 150000 58000 249400 29000 45580 71000 18000 6445 8314 37600 17000 45000Total Alkalinity as CaCO3 2 mg/l 275 355 425 260 200 195 245 225 250 200 235 210 280 220 240Potassium Dissolved 0.2 mg/l 0.8 0.6 0.9 0.6 0.6 1.7 2.4 0.9 1.5 1.4 1.4 0.3 0.6 1.1 0.9Sodium Dissolved 0.2 mg/l 10.2 9.2 10.2 16.0 11.0 24.8 17.3 13.5 20.0 14.0 9.2 5.3 5.6 11.0 6.9Nitrate as NO3 0.3 mg/l 10.9 10.1 8.5 8.5 7.6 6.4 4.9 9.8 11.0 8.8 16.2 15.0 15.3 13.0 13.0Sulphate (soluble) 3 mg/l 36 12 - 11 13 30 7 7 7 7 10 10 10 7 10Chloride 1 mg/l 6 5 4 4 4 2 1 1 2 1 1 <1.00 <1 <1 1pH Value 1 pH units 8.33 7.86 8.09 7.79 7.85 8.44 8.30 8.50 8.01 8.08 8.26 8.31 8.21 8.41 7.83
AnalyteMethod
Detection Limit
LOCATION: Tsalka. SAMPLE TYPE: Groundwater. SAMPLING DATES: Sept/Oct 07. SAMPLING ROUND: Round 4.KEY: DRY – Location dry at time of sampling; "<" – Concentration less than method detection limit; ** – Error with analytical schedule andsample held beyond holding time. Refer to Duplicate 13 results; NA – Not analysed.
Sample Reference TMW7 TMW7 TMW7 TMW7 TMW7 TMW8 TMW8 TMW8 TMW8 TMW8 TMW9a TMW9a TMW9a TMW9a TMW9a
Date Sampled /
Units
Baseline 24/08/05
Round 1 05/07/06
Round 205/11/06
Round 302/08/07
Round 417/10/07
Baseline 24/08/05
Round 1 24/07/06
Round 210/11/06
Round 303/08/07
Round 416/10/07
Baseline 07/09/05
Round 1 05/07/06
Round 2 09/11/06
Round 3 03/08/07
Round 4 16/10/07
PETROLEUM HYDROCARBONSGRO (C4-C12) 10 ug/l <10 <10 <10 <10 DRY <10 13 <10 28 DRY DRY <10 No Access Decommissioned DecommissionedTPH 10 ug/l <10 20 53 <10 DRY <10 13 <10 28 DRY DRY <10 No Access Decommissioned DecommissionedEPH (DRO) (C10-C40) 10 ug/l 1652 <10 <10 <10 DRY <10 <10 <10 <10 DRY DRY <10 No Access Decommissioned DecommissionedPOLYCYCLIC AROMATIC HYDROCARBONSBenzo(a)pyrene 0.009 ug/l <0.01 <0.01 <0.01 <0.009 DRY <0.01 <0.01 Insufficient sample <0.009 DRY DRY <0.01 No Access Decommissioned DecommissionedPAH 16 Total 0.027 ug/l 0.176 <0.01 <0.01 <0.027 DRY <0.01 <0.01 Insufficient sample <0.027 DRY DRY <0.01 No Access Decommissioned DecommissionedBTEXBenzene 1 ug/l <1 <1 <1 <1 DRY <1 <1 <1 <1 DRY DRY <1 No Access Decommissioned DecommissionedToluene 1 ug/l <1 <1 <1 <1 DRY <1 12 <1 24 DRY DRY <1 No Access Decommissioned DecommissionedEthylbenzene 1 ug/l <1 <1 <1 <1 DRY <1 <1 <1 <1 DRY DRY <1 No Access Decommissioned Decommissionedp/m-Xylene 1 ug/l <1 <1 <1 <1 DRY <1 <1 <1 <1 DRY DRY <1 No Access Decommissioned Decommissionedo-Xylene 1 ug/l <1 <1 <1 <1 DRY <1 <1 <1 <1 DRY DRY <1 No Access Decommissioned DecommissionedADDITIONALCalcium Dissolved 5 ug/l 76090 176600 88870 85000 DRY 17060 32430 Insufficient sample 38000 DRY DRY 144200 No Access Decommissioned DecommissionedMagnesium Dissolved 5 ug/l 14210 34550 16500 16000 DRY 2045 4665 Insufficient sample 5800 DRY DRY 18460 No Access Decommissioned DecommissionedManganese Dissolved 1 ug/l 103 131 1 49 DRY 137 3165 Insufficient sample 4200 DRY DRY 22 No Access Decommissioned DecommissionedIron Total (HNO3 Digest) 5 ug/l 5070 1694 4724 36000 DRY 1121 2081000 Insufficient sample 260000 DRY DRY 357600 No Access Decommissioned DecommissionedTotal Alkalinity as CaCO3 2 mg/l 250 205 255 310 DRY 125 290 Insufficient sample 140 DRY DRY 260 No Access Decommissioned DecommissionedPotassium Dissolved 0.2 mg/l 2.6 1.4 1.7 2.3 DRY 5.6 4.7 Insufficient sample 2.4 DRY DRY 4.2 No Access Decommissioned DecommissionedSodium Dissolved 0.2 mg/l 12.5 7.2 7.7 7.7 DRY 23.3 34.5 Insufficient sample 4.4 DRY DRY 13.4 No Access Decommissioned DecommissionedNitrate as NO3 0.3 mg/l 51.7 55.6 44.6 40.0 DRY 6.3 <0.3 Insufficient sample <0.3 DRY DRY 32.0 No Access Decommissioned DecommissionedSulphate (soluble) 3 mg/l 17 32 19 20 DRY 8 <3 Insufficient sample <3 DRY DRY <3 No Access Decommissioned DecommissionedChloride 1 mg/l 7 14 12 12 DRY 3 1 Insufficient sample 3 DRY DRY 4 No Access Decommissioned DecommissionedpH Value 1 pH units 8.03 8.24 8.37 8.17 DRY 8.22 7.44 Insufficient sample 7.45 DRY DRY 8.50 No Access Decommissioned Decommissioned
AnalyteMethod
Detection Limit

BTC Pipeline Project
93
LOCATION: Tsalka. SAMPLE TYPE: Groundwater. SAMPLING DATES: Sept/Oct 07. SAMPLING ROUND: Round 4.KEY: DRY – Location dry at time of sampling; "<" – Concentration less than method detection limit; ** – Error with analytical schedule andsample held beyond holding time. Refer to Duplicate 13 results; NA – Not analysed.
Sample Reference TMW10 TMW10 TMW10 TMW10 TMW10 TMW11 TMW11 TMW11 TMW11 TMW11 TMW12 TMW12 TMW12 TMW12 TMW12 TMW13 TMW13 TMW13 TMW13 TMW13
Date Sampled /
Units
Baseline 24/08/05
Round 1 05/07/06
Round 205/11/06
Round 303/08/07
Round 4 16/10/07
Baseline 18/08/05
Round 1 13/07/06
Round 210/11/06
Round 303/08/07
Round 4 16/10/07
Baseline 31/08/05
Round 1 13/07/06
Round 2 11/11/06
Round 3 3/08/07
Round 4 16/10/07
Baseline 25/08/05
Round 1 22/07/06
Round 2 11/11/06
Round 3 04/08/07
Round 4 04/10/07
PETROLEUM HYDROCARBONSGRO (C4-C12) 10 ug/l <10 <10 <10 <10 <10 <10 <10 <10 <10 <10 DRY DRY No Access DRY DRY <10 <10 No Access <10 <10TPH 10 ug/l <10 <10 48 <10 <10 <10 <10 <10 <10 <10 DRY DRY No Access DRY DRY <10 <10 No Access <10 780EPH (DRO) (C10-C40) 10 ug/l <10 <10 <10 <10 <10 <10 <10 <10 <10 <10 DRY DRY No Access DRY DRY 2109 <10 No Access <10 1300POLYCYCLIC AROMATIC HYDROCARBONSBenzo(a)pyrene 0.009 ug/l <0.01 <0.01 <0.01 <0.009 <0.009 <0.01 <0.01 <0.01 <0.009 <0.009 DRY DRY No Access DRY DRY <0.01 <0.01 No Access <0.009 <0.009PAH 16 Total 0.027 ug/l <0.01 <0.01 <0.01 <0.027 <0.027 0.384 <0.01 <0.01 <0.027 <0.027 DRY DRY No Access DRY DRY 0.627 0.437 No Access <0.027 <0.027BTEXBenzene 1 ug/l <1 <1 <1 <1 <1 <1 <1 <1 <1 <1 DRY DRY No Access DRY DRY 2 <1 No Access <1 <1Toluene 1 ug/l <1 <1 <1 <1 <1 <1 <1 <1 <1 <1 DRY DRY No Access DRY DRY 2 <1 No Access <1 <1Ethylbenzene 1 ug/l <1 <1 <1 <1 <1 <1 <1 <1 <1 <1 DRY DRY No Access DRY DRY <1 <1 No Access <1 <1p/m-Xylene 1 ug/l <1 <1 <1 <1 <1 <1 <1 <1 <1 <1 DRY DRY No Access DRY DRY <1 <1 No Access <1 <1o-Xylene 1 ug/l <1 <1 <1 <1 <1 <1 <1 <1 <1 <1 DRY DRY No Access DRY DRY <1 <1 No Access <1 <1ADDITIONALCalcium Dissolved 5 ug/l 68840 163800 68720 87000 80000 27810 24060 24490 21000 26000 DRY DRY No Access DRY DRY 17960 59000 No Access 92000 84000Magnesium Dissolved 5 ug/l 14840 39320 13670 19000 18000 4439 3971 3859 3700 3600 DRY DRY No Access DRY DRY 3785 10640 No Access 16000 16000Manganese Dissolved 1 ug/l 41 4 <1 5 <1 30 10 4 1 160 DRY DRY No Access DRY DRY 61 481 No Access 750 1400Iron Total (HNO3 Digest) 5 ug/l 1065 16410 37330 100000 4200 206500 13000 142600 32000 27000 DRY DRY No Access DRY DRY 228100 23880 No Access 13000 30000Total Alkalinity as CaCO3 2 mg/l 280 290 240 270 290 85 70 160 70 75 DRY DRY No Access DRY DRY 10750 245 No Access 440 300Potassium Dissolved 0.2 mg/l 0.2 <0.2 <0.2 0.3 0.2 0.8 0.6 0.8 0.9 0.8 DRY DRY No Access DRY DRY 6.8 1.7 No Access 3 3.3Sodium Dissolved 0.2 mg/l 12.6 15.0 10.8 15.0 14.0 7.5 6.2 6.8 6.8 8.0 DRY DRY No Access DRY DRY 85.5 12.3 No Access 22 27Nitrate as NO3 0.3 mg/l 1.0 0.4 0.9 0.9 <0.3 26.1 20.7 15.0 15.0 11.0 DRY DRY No Access DRY DRY <0.3 2.2 No Access <0.3 0.6Sulphate (soluble) 3 mg/l 28 24 31 27 16 11 15 12 10 9 DRY DRY No Access DRY DRY 32 <3 No Access 10 <3Chloride 1 mg/l 6 4 8 10 7 4 4 3 3 3 DRY DRY No Access DRY DRY 13 <1 No Access 1 1pH Value 1 pH units 8.21 8.34 8.52 8.01 7.56 7.98 8.04 7.83 7.93 7.83 DRY DRY No Access DRY DRY 8.34 8.15 No Access 8.13 8.17
AnalyteMethod
Detection Limit
LOCATION: Tsalka. SAMPLE TYPE: Groundwater. SAMPLING DATES: Sept/Oct 07. SAMPLING ROUND: Round 4.KEY: DRY – Location dry at time of sampling; "<" – Concentration less than method detection limit; ** – Error with analytical schedule andsample held beyond holding time. Refer to Duplicate 13 results; NA – Not analysed.
Sample Reference TMW14 TMW14 TMW14 TMW14 TMW14 TMW15 TMW15 TMW15 TMW15 TMW15 TMW16 TMW16 TMW16 TMW16 TMW16 TMW17 TMW17 TMW17 TMW17 TMW17
Date Sampled /
Units
Baseline 27/08/05
Round 1 09/07/06
Round 2 11/11/06
Round 3 04/08/07
Round 4 04/10/07
Baseline 21/08/05
Round 1 05/07/06
Round 205/11/06
Round 3 01/08/07
Round 4 17/10/07
Baseline 22/08/05
Round 1 05/07/06
Round 205/11/06
Round 3 01/08/07
Round 4 17/10/07
Baseline 19/08/05
Round 1 05/07/06
Round 206/11/06
Round 302/08/07
Round 4 18/10/07
PETROLEUM HYDROCARBONSGRO (C4-C12) 10 ug/l <10 <10 No Access <10 DRY <10 <10 <10 <10 DRY <10 <10 <10 <10 <10 <10 No Access <10 <10 <10TPH 10 ug/l 12 <10 No Access <10 DRY <10 29 82 <10 DRY <10 <10 26 <10 <10 <10 No Access <10 <10 <10EPH (DRO) (C10-C40) 10 ug/l <10 <10 No Access 51 DRY <10 <10 <10 540 DRY <10 <10 <10 <10 <10 <10 No Access <10 <10 <10POLYCYCLIC AROMATIC HYDROCARBONSBenzo(a)pyrene 0.009 ug/l <0.01 <0.01 No Access <0.009 DRY <0.01 <0.01 <0.01 <0.009 DRY <0.01 <0.01 <0.01 <0.009 <0.009 <0.01 No Access <0.01 <0.009 <0.009PAH 16 Total 0.027 ug/l <0.01 <0.01 No Access <0.027 DRY 0.473 <0.01 <0.01 0.037 DRY <0.01 <0.01 <0.01 <0.027 <0.027 0.126 No Access <0.01 <0.027 <0.027BTEXBenzene 1 ug/l <1 <1 No Access <1 DRY <1 <1 <1 <1 DRY <1 <1 <1 <1 <1 <1 No Access <1 <1 <1Toluene 1 ug/l <1 <1 No Access <1 DRY <1 <1 <1 <1 DRY <1 <1 <1 <1 <1 <1 No Access <1 <1 <1Ethylbenzene 1 ug/l <1 <1 No Access <1 DRY <1 <1 <1 <1 DRY <1 <1 <1 <1 <1 <1 No Access <1 <1 <1p/m-Xylene 1 ug/l <1 <1 No Access <1 DRY <1 <1 <1 <1 DRY <1 <1 <1 <1 <1 <1 No Access <1 <1 <1o-Xylene 1 ug/l <1 <1 No Access <1 DRY <1 <1 <1 <1 DRY <1 <1 <1 <1 <1 <1 No Access <1 <1 <1ADDITIONALCalcium Dissolved 5 ug/l 16780 11000 No Access 30000 DRY 46800 87710 48440 55000 DRY 35800 41780 36800 43000 43000 81260 No Access 76560 89000 87000Magnesium Dissolved 5 ug/l 5275 3169 No Access 4100 DRY 11160 24240 14410 15000 DRY 9071 7161 7308 9100 9100 10560 No Access 10580 12000 11000Manganese Dissolved 1 ug/l 29 7 No Access 220 DRY 115 3 <1 330 DRY 114 <1 <1 790 3 284 No Access 403 370 38Iron Total (HNO3 Digest) 5 ug/l 15480 22730 No Access 100000 DRY 71920 4165 6449 17000 DRY 82500 260500 4831 63000 25000 51970 No Access 455300 460000 330000Total Alkalinity as CaCO3 2 mg/l 85 65 No Access 840 DRY 190 185 195 250 DRY 160 225 145 270 170 1775 No Access 265 220 450Potassium Dissolved 0.2 mg/l 2.6 2.1 No Access 3.6 DRY 0.9 0.8 0.9 1.7 DRY 1.1 0.5 0.3 1.2 0.8 1.1 No Access 1.1 1.2 1.4Sodium Dissolved 0.2 mg/l 8.0 5.0 No Access 6.2 DRY 6.3 6.2 6.2 18.0 DRY 10.7 7.5 7.1 17.0 8.3 17.3 No Access 15.8 16 20Nitrate as NO3 0.3 mg/l 6.4 6.2 No Access <0.3 DRY 6.1 8.9 13.1 6.3 DRY 4.2 5.2 5.8 4.6 4.2 0.3 No Access 0.4 1.1 20Sulphate (soluble) 3 mg/l 3 6 No Access 4 DRY 6 13 13 10 DRY 6 7 5 5 4 10 No Access 4 5 7Chloride 1 mg/l 1 <1.00 No Access 3 DRY 2 2 2 2 DRY 1 <1.00 <1 1 1 <1 No Access <1 <1 <1pH Value 1 pH units 7.43 7.63 No Access 7.82 DRY 8.44 8.60 8.64 8.52 DRY 8.52 8.53 8.50 8.34 8.02 8.37 No Access 8.06 7.87 7.96
AnalyteMethod
Detection Limit

Environmental and Social Annual Report 2007
94
LOCATION: Tsalka. SAMPLE TYPE: Groundwater. SAMPLING DATES: Sept/Oct 07. SAMPLING ROUND: Round 4.KEY: DRY – Location dry at time of sampling; "<" – Concentration less than method detection limit; ** – Error with analytical schedule andsample held beyond holding time. Refer to Duplicate 13 results; NA – Not analysed.
Sample Reference TMW18** TMW18 TMW18 TMW18 TMW18 TMW19 TMW19 TMW19 TMW19 TMW19 TMW20 TMW20 TMW20 TMW20 TMW20
Date Sampled /
Units
Baseline 19/08/05
Round 1 09/07/06
Round 2 06/11/06
Round 3 01/08/07
Round 4 18/10/07
Baseline 31/08/05
Round 1 09/07/06
Round 2 11/11/06
Round 3 03/08/07
Round 4 18/10/07
Baseline 26/08/05
Round 1 09/07/06
Round 2 09/11/06
Round 3 03/08/07
Round 4 16/10/07
PETROLEUM HYDROCARBONSGRO (C4-C12) 10 ug/l No Access <10 No Access <10 <10 DRY DRY DRY DRY DRY <10 No Access No Access DRY DRYTPH 10 ug/l No Access <10 No Access <10 <10 DRY DRY DRY DRY DRY <10 No Access No Access DRY DRYEPH (DRO) (C10-C40) 10 ug/l No Access <10 No Access <10 <10 DRY DRY DRY DRY DRY <10 No Access No Access DRY DRYPOLYCYCLIC AROMATIC HYDROCARBONSBenzo(a)pyrene 0.009 ug/l No Access <0.01 No Access 0.019 <0.009 DRY DRY DRY DRY DRY <0.01 No Access No Access DRY DRYPAH 16 Total 0.027 ug/l No Access <0.01 No Access 0.036 <0.027 DRY DRY DRY DRY DRY 0.661 No Access No Access DRY DRYBTEXBenzene 1 ug/l No Access <1 No Access <1 <1 DRY DRY DRY DRY DRY <1 No Access No Access DRY DRYToluene 1 ug/l No Access <1 No Access <1 <1 DRY DRY DRY DRY DRY <1 No Access No Access DRY DRYEthylbenzene 1 ug/l No Access <1 No Access <1 <1 DRY DRY DRY DRY DRY <1 No Access No Access DRY DRYp/m-Xylene 1 ug/l No Access <1 No Access <1 <1 DRY DRY DRY DRY DRY <1 No Access No Access DRY DRYo-Xylene 1 ug/l No Access <1 No Access <1 <1 DRY DRY DRY DRY DRY <1 No Access No Access DRY DRYADDITIONALCalcium Dissolved 5 ug/l No Access 59170 No Access 61000 63000 DRY DRY DRY DRY DRY 42480 No Access No Access DRY DRYMagnesium Dissolved 5 ug/l No Access 14250 No Access 15000 15000 DRY DRY DRY DRY DRY 10600 No Access No Access DRY DRYManganese Dissolved 1 ug/l No Access <1 No Access 2 <1 DRY DRY DRY DRY DRY 101 No Access No Access DRY DRYIron Total (HNO3 Digest) 5 ug/l No Access 7638 No Access 2600 25000 DRY DRY DRY DRY DRY 494 No Access No Access DRY DRYTotal Alkalinity as CaCO3 2 mg/l No Access 365 No Access 140 250 DRY DRY DRY DRY DRY 330 No Access No Access DRY DRYPotassium Dissolved 0.2 mg/l No Access 0.2 No Access 0.5 0.3 DRY DRY DRY DRY DRY 2.0 No Access No Access DRY DRYSodium Dissolved 0.2 mg/l No Access 8.4 No Access 15 11 DRY DRY DRY DRY DRY 11.0 No Access No Access DRY DRYNitrate as NO3 0.3 mg/l No Access 23.3 No Access 20 <0.3 DRY DRY DRY DRY DRY 1.5 No Access No Access DRY DRYSulphate (soluble) 3 mg/l No Access 6 No Access <3 <3 DRY DRY DRY DRY DRY 12 No Access No Access DRY DRYChloride 1 mg/l No Access 3 No Access 3 3 DRY DRY DRY DRY DRY 2 No Access No Access DRY DRYpH Value 1 pH units No Access 8.33 No Access 8.53 8.17 DRY DRY DRY DRY DRY 8.31 No Access No Access DRY DRY
AnalyteMethod
Detection Limit
LOCATION: Tsalka. SAMPLE TYPE: Surface water. SAMPLING DATES: Sept/Oct 07. SAMPLING ROUND: Round 4.
KEY: DRY – Location dry at time of sampling; "<" – Concentration less than method detection limit; no access – Sampling location inaccessible; NA – Not analysed.
Sample Reference TSW1 TSW1 TSW1 TSW1 TSW1 TSW2 TSW2 TSW2 TSW2 TSW2 TSW3 TSW3 TSW3 TSW3 TSW3
Date Sampled /
Units
Baseline 16/08/2005
Round 1 08/07/06
Round 209/11/06
Round 331/07/07
Round 4 18/10/07
Baseline 19/08/05
Round 1 12/07/06
Round 206/11/06
Round 301/08/07
Round 417/10/07
Baseline 17/08/05
Round 1 10/0706
Round 206/11/06
Round 331/07/07
Round 418/10/07
PETROLEUM HYDROCARBONSGRO (C4-C12) 10 ug/l DRY <10 <10 <10 <10 <10 <10 <10 <10 <10 No Access <10 <10 <10 <10TPH 10 ug/l DRY <10 52 <10 <10 <10 <10 <10 <10 <10 No Access <10 <10 <10 <10EPH (DRO) (C10-C40) 10 ug/l DRY <10 <10 <10 <10 <10 <10 <10 <10 <10 No Access <10 <10 <10 390POLYCYCLIC AROMATIC HYDROCARBONSBenzo(a)pyrene 0.009 ug/l DRY <0.01 <0.01 0.063 <0.009 <0.01 <0.01 <0.01 <0.009 <0.009 No Access <0.01 <0.01 <0.009 <0.009PAH 16 Total 0.027 ug/l DRY <0.01 <0.01 0.47 <0.027 0.101 <0.01 <0.01 <0.027 <0.027 No Access <0.01 <0.01 0.074 <0.027BTEXBenzene 1 ug/l DRY <1 <1 <1 <1 <1 <1 <1 <1 <1 No Access <1 <1 <1 <1Toluene 1 ug/l DRY <1 <1 <1 <1 <1 <1 <1 <1 <1 No Access <1 <1 <1 <1Ethylbenzene 1 ug/l DRY <1 <1 <1 <1 <1 <1 <1 <1 <1 No Access <1 <1 <1 <1p/m-Xylene 1 ug/l DRY <1 <1 <1 <1 <1 <1 <1 <1 <1 No Access <1 <1 <1 <1o-Xylene 1 ug/l DRY <1 <1 <1 <1 <1 <1 <1 <1 <1 No Access <1 <1 <1 <1
AnalyteMethod
Detection Limit

BTC Pipeline Project
95
LOCATION: Tsalka. SAMPLE TYPE: Surface water. SAMPLING DATES: Sept/Oct 07. SAMPLING ROUND: Round 4.
KEY: DRY – Location dry at time of sampling; "<" – Concentration less than method detection limit; no access – Sampling location inaccessible; NA – Not analysed.
Sample Reference TSW4 TSW4 TSW4 TSW4 TSW4 TSW5 TSW5 TSW5 TSW5 TSW6 TSW6 TSW6 TSW6 TSW6
Date Sampled /
Units
Baseline 17/08/05
Round 1 10/0706
Round 206/11/06
Round 331/07/07
Round 4 18/10/07
Baseline 17/08/05
Round 1 14/07/06
Round 205/11/06
Round 301/08/07
Baseline 24/08/05
Round 1 10/0706
Round 2 05/11/06
Round 3 03/08/07
Round 4 16/10/07
PETROLEUM HYDROCARBONSGRO (C4-C12) 10 ug/l <10 <10 <10 <10 <10 <10 <10 <10 DRY <10 <10 <10 <10 <10TPH 10 ug/l <10 <10 <10 <10 <10 <10 <10 38 DRY 10 <10 Insufficient Sample <10 <10EPH (DRO) (C10-C40) 10 ug/l <10 <10 <10 <10 <10 <10 <10 <10 DRY <10 <10 <10 <10 <10POLYCYCLIC AROMATIC HYDROCARBONSBenzo(a)pyrene 0.009 ug/l <0.01 <0.01 <0.01 <0.009 <0.009 <0.01 <0.01 <0.01 DRY <0.01 <0.01 <0.01 <0.009 <0.009PAH 16 Total 0.027 ug/l 0.129 <0.01 <0.01 <0.027 <0.027 <0.01 <0.01 <0.01 DRY 0.299 <0.01 0.031 <0.027 <0.027BTEXBenzene 1 ug/l <1 <1 <1 <1 <1 <1 <1 <1 DRY <1 <1 <1 <1 <1Toluene 1 ug/l <1 <1 <1 <1 <1 <1 <1 <1 DRY <1 <1 <1 <1 <1Ethylbenzene 1 ug/l <1 <1 <1 <1 <1 <1 <1 <1 DRY <1 <1 <1 <1 <1p/m-Xylene 1 ug/l <1 <1 <1 <1 <1 <1 <1 <1 DRY <1 <1 <1 <1 <1o-Xylene 1 ug/l <1 <1 <1 <1 <1 <1 <1 <1 DRY <1 <1 <1 <1 <1
AnalyteMethod
Detection Limit
LOCATION: Tsalka. SAMPLE TYPE: Surface water. SAMPLING DATES: Sept/Oct 07. SAMPLING ROUND: Round 4.
KEY: DRY – Location dry at time of sampling; "<" – Concentration less than method detection limit; no access – Sampling location inaccessible; NA – Not analysed.
Sample Reference TSW7 TSW7 TSW7 TSW7 TSW7 TSW9 TSW9 TSW9 TSW9 TSW9 TSW10 TSW10 TSW10 TSW10 TSW10
Date Sampled /
Units
Baseline 18/08/05
Round 1 10/0706
Round 209/11/06
Round 3 03/08/07
Round 4 16/10/07
Baseline 25/08/05
Round 1 07/07/06
Round 2 11/11/06
Round 3 03/08/07
Round 4 04/10/07
Baseline 25/08/05
Round 1 07/07/06
Round 2 11/11/06
Round 3 03/08/07
Round 4 04/10/07
PETROLEUM HYDROCARBONSGRO (C4-C12) 10 ug/l <10 <10 <10 <10 <10 DRY <10 No Access DRY DRY <10 <10 No Access DRY DRYTPH 10 ug/l <10 <10 51 <10 <10 DRY <10 No Access DRY DRY <10 <10 No Access DRY DRYEPH (DRO) (C10-C40) 10 ug/l <10 <10 <10 <10 <10 DRY 362 No Access DRY DRY <10 <10 No Access DRY DRYPOLYCYCLIC AROMATIC HYDROCARBONSBenzo(a)pyrene 0.009 ug/l <0.01 <0.01 <0.01 <0.009 <0.009 DRY <0.01 No Access DRY DRY <0.01 <0.01 No Access DRY DRYPAH 16 Total 0.027 ug/l 0.106 <0.01 <0.01 <0.027 <0.027 DRY <0.01 No Access DRY DRY <0.01 <0.01 No Access DRY DRYBTEXBenzene 1 ug/l <1 <1 <1 <1 <1 DRY <1 No Access DRY DRY <1 <1 No Access DRY DRYToluene 1 ug/l <1 <1 <1 <1 <1 DRY <1 No Access DRY DRY <1 <1 No Access DRY DRYEthylbenzene 1 ug/l <1 <1 <1 <1 <1 DRY <1 No Access DRY DRY <1 <1 No Access DRY DRYp/m-Xylene 1 ug/l <1 <1 <1 <1 <1 DRY <1 No Access DRY DRY <1 <1 No Access DRY DRYo-Xylene 1 ug/l <1 <1 <1 <1 <1 DRY <1 No Access DRY DRY <1 <1 No Access DRY DRY
AnalyteMethod
Detection Limit

Environmental and Social Annual Report 2007
96
LOCATION: Tsalka. SAMPLE TYPE: Surfacewater. SAMPLING DATES: Sept/Oct 07. SAMPLING ROUND: Round 4.
KEY: DRY – Location dry at time of sampling; "<" – Concentration less than method detection limit; no access – Sampling location inaccessible; NA – Not analysed.
Sample Reference TSW11 TSW11 TSW11 TSW11 TSW11 TSW12 TSW12 TSW12 TSW12 TSW12 TSW13 TSW13 TSW13 TSW13 TSW13
Date Sampled /
Units
Baseline 25/08/05
Round 1 07/07/06
Round 2 11/11/06
Round 3 03/08/07
Round 4 04/10/07
Baseline 31/08/05
Round 1 14/07/06
Round 2 11/11/06
Round 3 04/08/07
Round 4 04/10/07
Baseline 01/09/05
Round 1 14/07/06
Round 2 11/1106
Round 3 04/08/07
Round 4 04/10/07
PETROLEUM HYDROCARBONSGRO (C4-C12) 10 ug/l DRY <10 No Access DRY DRY <10 <10 No Access <10 <10 <10 <10 No Access <10 <10TPH 10 ug/l DRY <10 No Access DRY DRY <10 <10 No Access <10 <10 <10 <10 No Access <10 <10EPH (DRO) (C10-C40) 10 ug/l DRY <10 No Access DRY DRY <10 <10 No Access <10 <10 <10 <10 No Access <10 <10POLYCYCLIC AROMATIC HYDROCARBONSBenzo(a)pyrene 0.009 ug/l DRY <0.01 No Access DRY DRY <0.01 <0.01 No Access <0.009 <0.009 <0.01 <0.01 No Access <0.009 <0.009PAH 16 Total 0.027 ug/l DRY <0.01 No Access DRY DRY <0.01 <0.01 No Access <0.027 <0.027 <0.01 <0.01 No Access <0.027 <0.027BTEXBenzene 1 ug/l DRY <1 No Access DRY DRY <1 <1 No Access <1 <1 <1 <1 No Access <1 <1Toluene 1 ug/l DRY <1 No Access DRY DRY <1 <1 No Access <1 <1 <1 <1 No Access <1 <1Ethylbenzene 1 ug/l DRY <1 No Access DRY DRY <1 <1 No Access <1 <1 <1 <1 No Access <1 <1p/m-Xylene 1 ug/l DRY <1 No Access DRY DRY <1 <1 No Access <1 <1 <1 <1 No Access <1 <1o-Xylene 1 ug/l DRY <1 No Access DRY DRY <1 <1 No Access <1 <1 <1 <1 No Access <1 <1
AnalyteMethod
Detection Limit
LOCATION: Tsalka. SAMPLE TYPE: Surface water. SAMPLING DATES: Sept/Oct 07. SAMPLING ROUND: Round 4.
KEY: DRY – Location dry at time of sampling; "<" – Concentration less than method detection limit; no access – Sampling location inaccessible; NA – Not analysed.
Sample Reference TSW14 TSW14 TSW14 TSW14 TSW14 TSW16 TSW16 TSW16 TSW16 TSW16 TSW17 TSW17 TSW17 TSW17 TSW17
Date Sampled /
Units
Baseline 01/09/05
Round 1 14/07/06
Round 2 11/11/06
Round 3 04/08/07
Round 4 04/10/07
Baseline 27/08/05
Round 1 07/07/06
Round 2 11/11/06
Round 3 04/08/07
Round 4 04/10/07
Baseline 25/08/05
Round 1 12/07/06
Round 206/11/06
Round 302/08/07
Round 419/10/07
PETROLEUM HYDROCARBONSGRO (C4-C12) 10 ug/l DRY DRY No Access DRY DRY <10 <10 No Access <10 <10 <10 <10 <10 DRY DRYTPH 10 ug/l DRY DRY No Access DRY DRY <10 <10 No Access <10 <10 <10 <10 <10 DRY DRYEPH (DRO) (C10-C40) 10 ug/l DRY DRY No Access DRY DRY <10 <10 No Access <10 <10 <10 <10 <10 DRY DRYPOLYCYCLIC AROMATIC HYDROCARBONSBenzo(a)pyrene 0.009 ug/l DRY DRY No Access DRY DRY <0.01 <0.01 No Access <0.009 <0.009 <0.01 <0.01 <0.01 DRY DRYPAH 16 Total 0.027 ug/l DRY DRY No Access DRY DRY <0.01 <0.01 No Access <0.027 <0.027 <0.01 <0.01 <0.01 DRY DRYBTEXBenzene 1 ug/l DRY DRY No Access DRY DRY <1 <1 No Access <1 <1 <1 <1 <1 DRY DRYToluene 1 ug/l DRY DRY No Access DRY DRY <1 <1 No Access <1 <1 <1 <1 <1 DRY DRYEthylbenzene 1 ug/l DRY DRY No Access DRY DRY <1 <1 No Access <1 <1 <1 <1 <1 DRY DRYp/m-Xylene 1 ug/l DRY DRY No Access DRY DRY <1 <1 No Access <1 <1 <1 <1 <1 DRY DRYo-Xylene 1 ug/l DRY DRY No Access DRY DRY <1 <1 No Access <1 <1 <1 <1 <1 DRY DRY
AnalyteMethod
Detection Limit

BTC Pipeline Project
97
LOCATION: Tsalka. SAMPLE TYPE: Surface water. SAMPLING DATES: Sept/Oct 07. SAMPLING ROUND: Round 4.
KEY: DRY – Location dry at time of sampling; "<" – Concentration less than method detection limit; no access – Sampling location inaccessible; NA – Not analysed.
Sample Reference TSW18 TSW18 TSW18 TSW18 TSW18 TSW19 TSW19 TSW19 TSW19 TSW19 TSW20 TSW20 TSW20 TSW20 TSW20
Date Sampled /
Units
Baseline 17/08/2005
Round 1 08/07/06
Round 206/11/06
Round 331/08/07
Round 4 18/10/07
Baseline 24/08/05
Round 1 09/07/06
Round 209/11/06
Round 319/08/07
Round 416/10/07
Baseline 24/08/05
Round 1 12/07/06
Round 209/11/06
Round 319/08/07
Round 416/10/07
PETROLEUM HYDROCARBONSGRO (C4-C12) 10 ug/l <10 <10 <10 <10 <10 <10 <10 <10 <10 <10 <10 <10 <10 <10 <10TPH 10 ug/l <10 <10 <10 <10 <10 <10 <10 15 <10 <10 <10 <10 13 <10 <10EPH (DRO) (C10-C40) 10 ug/l <10 <10 <10 <10 210 <10 202 <10 <10 <10 1137 <10 <10 <10 <10POLYCYCLIC AROMATIC HYDROCARBONSBenzo(a)pyrene 0.009 ug/l <0.01 <0.01 <0.01 <0.009 <0.009 <0.01 <0.01 <0.01 <0.009 <0.009 <0.01 <0.01 <0.01 <0.009 <0.009PAH 16 Total 0.027 ug/l 0.4 <0.01 <0.01 <0.027 <0.027 <0.01 <0.01 <0.01 <0.027 <0.027 <0.01 <0.01 <0.01 <0.027 0.170BTEXBenzene 1 ug/l <1 <1 <1 <1 <1 <1 <1 <1 <1 <1 <1 <1 <1 <1 <1Toluene 1 ug/l <1 <1 <1 <1 <1 <1 <1 <1 <1 <1 9 <1 <1 <1 <1Ethylbenzene 1 ug/l <1 <1 <1 <1 <1 <1 <1 <1 <1 <1 <1 <1 <1 <1 <1p/m-Xylene 1 ug/l <1 <1 <1 <1 <1 <1 <1 <1 <1 <1 <1 <1 <1 <1 <1o-Xylene 1 ug/l <1 <1 <1 <1 <1 <1 <1 <1 <1 <1 <1 <1 <1 <1 <1
AnalyteMethod
Detection Limit
LOCATION: Tsalka. SAMPLE TYPE: Surfacewater. SAMPLING DATES: Sept/Oct 07. SAMPLING ROUND: Round 4.
KEY: DRY – Location dry at time of sampling; "<" – Concentration less than method detection limit; no access – Sampling location inaccessible; NA – Not analysed.
Sample Reference TSW21 TSW21 TSW21 TSW21 TSW21 TSW22 TSW22 TSW22 TSW22 TSW22
Date Sampled /
Units
Baseline 25/08/05
Round 1 13/07/06
Round 2 11/11/06
Round 319/08/07
Round 404/10/07
Baseline 30/08/2005
Round 1 13/07/06
Round 2 11/11/06
Round 319/08/07
Round 404/10/07
PETROLEUM HYDROCARBONSGRO (C4-C12) 10 ug/l <10 <10 No Access <10 <10 <10 <10 No Access <10 <10TPH 10 ug/l <10 <10 No Access <10 <10 <10 <10 No Access <10 <10EPH (DRO) (C10-C40) 10 ug/l <10 <10 No Access <10 <10 <10 <10 No Access <10 <10POLYCYCLIC AROMATIC HYDROCARBONSBenzo(a)pyrene 0.009 ug/l <0.01 <0.01 No Access <0.009 <0.009 <0.01 NA No Access <0.009 <0.009PAH 16 Total 0.027 ug/l <0.01 <0.01 No Access <0.027 <0.027 <0.01 NA No Access <0.027 <0.027BTEXBenzene 1 ug/l <1 <1 No Access <1 <1 <1 <1 No Access <1 <1Toluene 1 ug/l <1 <1 No Access <1 <1 <1 <1 No Access <1 <1Ethylbenzene 1 ug/l <1 <1 No Access <1 <1 <1 <1 No Access <1 <1p/m-Xylene 1 ug/l <1 <1 No Access <1 <1 <1 <1 No Access <1 <1o-Xylene 1 ug/l <1 <1 No Access <1 <1 <1 <1 No Access <1 <1
AnalyteMethod
Detection Limit
Environmental and Social Annual Report 2007
98
LOCATION: PSG1. SAMPLE TYPE: Groundwater & Surface Water. SAMPLING DATES: Sept/Oct 07. SAMPLING ROUND: Round 4.
KEY: "<" – Concentration less than method detection limit; NA – Not analysed.
Sample Reference PSG1MW1 PSG1MW1 PSG1MW1 PSG1MW1 PSG1MW1 PSG1MW2 PSG1MW2 PSG1MW2 PSG1MW2 PSG1MW2 PSG1MW3 PSG1MW3 PSG1MW3 PSG1MW3 PSG1MW3
Date Sampled / Units
Baseline 09/07/05
Round 1 13/06/06
Round 2 17/11/06
Round 309/7/07
Round 422/10/07
Baseline 09/07/05
Round 1 13/06/06
Round 2 17/11/06
Round 3 07/07/07
Round 422/10/07
Baseline 09/07/05
Round 1 13/06/06
Round 217/11/06
Round 309/07/07
Round 4 22/10/07
METALSArsenic Dissolved 1 ug/l <1 3 1 3 <1 2 3 3 <1 <1 2 7 2 2 <1Barium Dissolved 1 ug/l 3 32 19 36 34 13 21 19 21 26 13 18 15 16 18Boron Dissolved 10 ug/l 145 851 903 900 750 656 1309 1115 1300 1100 939 1517 1476 1500 1300Cadmium Dissolved 0.4 ug/l <0.4 <0.4 <0.4 <0.4 <0.4 <0.4 <0.4 <0.4 <0.4 <0.4 <0.4 <0.4 1.5 <0.4 <0.4Calcium Dissolved 5 ug/l 29,020 228600 220100 210000 210000 201,600 290,000 208,100 230,000 200,000 295,900 349,800 314,900 260,000 270,000Chromium Dissolved 1 ug/l <1 2 <1 3 3 <1 <1 <1 7 2 <1 4 3 4 2Copper Dissolved 1 ug/l <1 6 <1 4 <1 3 4 <1 5 2 4 4 2 6 1Iron Dissolved 5 ug/l 35 NA NA NA NA 14 NA NA NA NA 24 NA NA NA NAIron Total (HNO3 Digest) 5 ug/l NA <835 8279 9500 14000 NA 12250 119500 9500 2500 NA 10880 2181 4200 19000Lead Dissolved 1 ug/l <1 <1 <1 <1 <1 <1 <1 <1 <1 <1 <1 <1 <1 1 <1Magnesium Dissolved 5 ug/l 5,146 40740 41910 40000 32000 36,330 50160 38980 42,000 30,000 56,320 60880 60120 51,000 41,000Manganese Dissolved 1 ug/l 162 5 5 2 3 1010 144 222 24 300 468 18 42 3 380Nickel Dissolved 1 ug/l 2 4 8 4 7 6 4 7 22 560 10 5 69 21 580Selenium Dissolved 1 ug/l 5 18 12 17 12 18 29 25 22 14 26 40 32 27 22Mercury Dissolved 0.05 ug/l <0.05 <0.05 <0.05 <0.05 <0.05 <0.05 <0.05 <0.05 <0.05 <0.05 <0.05 <0.05 <0.05 <0.05 <0.05Total Alkalinity as CaCO3 2 mg/l 485 1110 300 620 350 210 355 535 450 260 175 170 220 210 350Potassium Dissolved 0.2 mg/l 6 4.5 4.5 5.4 4.8 8.1 6.2 7.8 6.6 6.2 9.3 7.2 7.2 6.6 7.1Sodium Dissolved 0.2 mg/l 285 258.0 258.8 310.0 330.0 607.5 510 465 530 520 750 615 585 680 610Sodium Total 0.2 mg/l 360 NA NA NA NA 442.5 NA NA NA NA 67.5 NA 89.7 NA NANitrate as NO3 0.3 mg/l <0.3 29.4 34.0 36.0 33.0 1.7 34.4 51.7 53 48 1.1 28 89.7 76 74Sulphate (soluble) 3 mg/l 864 800 755 710 700 1793 1405 1198 1200 1000 2260 1743 1594 1500 1400Chloride 1 mg/l 173 155 197 170 170 302 243 213 220 200 354 279 300 240 270Total Cyanide 0.05 mg/l <0.05 <0.05 <0.05 <0.05 <0.05 <0.05 <0.05 <0.05 <0.05 <0.05 <0.05 <0.05 <0.05 <0.05 <0.05Free Cyanide 0.05 mg/l <0.05 NA NA NA NA <0.05 NA NA NA NA <0.05 NA NA NA NApH Value 1 pH Units 7.87 7.93 7.83 7.88 7.75 8.07 8.01 8.08 7.97 7.85 8.15 8.00 8.11 8.16 7.73PETROLEUM HYDROCARBONSGRO (C4-C12) 10 ug/l <10 <10 <10 <10 <10 <10 <10 <10 <10 <10 <10 <10 <10 <10 <10Benzene 10 ug/l <10 <10 <10 <10 <10 <10 <10 <10 <10 <10 <10 <10 <10 <10 <10Toluene 10 ug/l <10 <10 <10 <10 <10 <10 <10 <10 <10 <10 <10 <10 <10 <10 <10Ethyl benzene 10 ug/l <10 <10 <10 <10 <10 <10 <10 <10 <10 <10 <10 <10 <10 <10 <10m & p Xylene 10 ug/l <10 <10 <10 <10 <10 <10 <10 <10 <10 <10 <10 <10 <10 <10 <10o Xylene 10 ug/l <10 <10 <10 <10 <10 <10 <10 <10 <10 <10 <10 <10 <10 <10 <10TPH (Total C5-C35) 10 ug/l <10 54 <10 <10 <10 <10 <10 <10 <10 <10 <10 <10 95 <10 <10EPH (DRO) (C10-C40) 10 ug/l <10 NA <10 <10 <10 <10 <10 <10 <10 <10 <10 <10 <10 <10 <10POLYCYCLIC AROMATIC HYDROCARBONSBenzo(a)pyrene 0.009 ug/l <0.01 <0.01 <0.01 <0.009 <0.009 <0.01 <0.01 <10 <0.009 <0.009 <0.01 <0.01 <0.01 <0.009 <0.009PAH 16 Total 0.027 ug/l <0.01 <0.01 <0.01 <0.027 <0.027 0.769 0.615 <10 <0.027 <0.027 <0.01 <0.01 <0.01 <0.027 <0.027SEMI-VOLATILE ORGANIC COMPOUNDSPhenols:
ALL PARAMETERS 1 ug/l <1 <1 <1 <1 <1 <1 <1 <1 <1 <1 <1 <1 <1 <1 <1PhthalatesBis(2-ethylhexyl) phthalate 1 ug/l <1 <1 <1 <2 <2 <1 <1 <1 <2 <2 <1 <1 <1 <2 <2Butylbenzyl phthalate 1 ug/l <1 <1 <1 <1 <1 <1 <1 <1 <1 <1 <1 <1 <1 <1 <1Di-n-butyl phthalate 1 ug/l <1 <1 <1 <1 <1 <1 <1 <1 <1 <1 <1 <1 <1 <1 <1Di-n-Octyl phthalate 1 ug/l <1 <1 <1 <5 <5 <1 <1 <1 <5 <5 <1 <1 <1 <5 <5Diethyl phthalate 1 ug/l <1 <1 <1 <1 <1 <1 <1 <1 <1 <1 <1 <1 <1 <1 <1Dimethyl phthalate 1 ug/l <1 <1 <1 <1 <1 <1 <1 <1 <1 <1 <1 <1 <1 <1 <1Other Semi-volatiles
ALL PARAMETERS 1 ug/l <1 <1 <1 <1 <1 <1 <1 <1 <1 <1 <1 <1 <1 <1 <1VOLATILE ORGANIC COMPOUNDS
ALL PARAMETERS 1 ug/l <1 <1 <1 <1 <1 <1 <1 <1 <1 <1 <1 <1 <1 <1 <1
1,2-Dichlorobenzene; 1,2,4-Trichlorobenzene; 1,3-Dichlorobenzene; 1,4-Dichlorobenzene; 2-Nitroaniline; 2,4-Dinitrotoluene; 2,6-Dinitrotoluene; 3-Nitroaniline; 4-Bromophenylphenylether; 4-Chloroaniline; 4-Chlorophenylphenylether; 4-Nitroaniline; Azobenzene; Bis(2-chloroethoxy)methane; Bis(2-chloroethyl)ether; Carbazole; Dibenzofuran; Hexachlorobenzene; Hexachlorobutadiene; Hexachlorocyclopentadiene; Hexachloroethane; Isophorone; N-nitrosodi-n-propylamine; Nitrobenzene
2-Chlorophenol; 2-Methylphenol; 2-Nitrophenol; 2,4-Dichlorophenol; 2,4-Dimethylphenol; 2,4,5-Trichlorophenol; 2,4,6-Trichlorophenol; 4-Chloro-3-methylphenol; 4-Methylphenol; 4-Nitrophenol; Pentachlorophenol; Phenol
Dichlorodifluoromethane; Chloromethane; Vinyl Chloride; Bromomethane; Chloroethane; Trichlorofluoromethane; trans-1-2-Dichloroethene; Dichloromethane; Carbon Disulphide; 1.1-Dichloroethene; 1.1-Dichloroethane; Methyl Tertiary Butyl Ether; cis-1-2-Dichloroethene; Bromochloromethane; Chloroform; 2.2-Dichloropropane; 1.2-Dichloroethane; 1.1.1-Trichloroethane; 1.1-Dichloropropene; Benzene; Carbontetrachloride; Dibromomethane; 1.2-Dichloropropane; Bromodichloromethane; Trichloroethene; cis-1-3-Dichloropropene; trans-1-3-Dichloropropene; 1.1.2-Trichloroethane; Toluene; 1.3-Dichloropropane; Dibromochloromethane; 1.2-Dibromoethane; Tetrachloroethene; 1.1.1.2-Tetrachloroethane; Chlorobenzene; Ethylbenzene; p/m-Xylene; Bromoform; Styrene; 1.1.2.2-Tetrachloroethane; o-Xylene; 1.2.3-Trichloropropane; Isopropylbenzene; Bromobenzene; 2-Chlorotoluene; Propylbenzene; 4-Chlorotoluene; 1.2.4-Trimethylbenzene; 4-Isopropyltoluene; 1.3.5-Trimethylbenzene; 1.2-Dichlorobenzene; 1.4-Dichlorobenzene; sec-Butylbenzene; tert-Butylbenzene; 1.3-Dichlorobenzene; n-Butylbenzene; 1.2-Dibromo-3-chloropropane; 1.2.4-Trichlorobenzene; Naphthalene; 1.2.3-Trichlorobenzene; Hexachlorobutadiene
AnalyteMethod
Detection Limit
BTC Pipeline Project
99
LOCATION: PSG1. SAMPLE TYPE: Groundwater & Surface Water. SAMPLING DATES: Sept/Oct 07. SAMPLING ROUND: Round 4.
KEY: "<" – Concentration less than method detection limit; NA – Not analysed.
Sample Reference PSG1MW4 PSG1MW4 PSG1MW4 PSG1MW4 PSG1MW4 PSG1MW5 PSG1MW5 PSG1MW5 PSG1MW5 PSG1MW5 PSG1BH1 PSG1BH1 PSG1SW1 PSG1SW1 PSG1SW1 PSG1SW1 PSG1SW1 PSG1SS1 PSG1SS1
Date Sampled / Units
Baseline 09/07/05
Round 1 12/06/06
Round 2 07/12/06
Round 3 07/07/07
Round 4 22/10/07
Baseline 09/07/05
Round 1 12/06/06
Round 217/11/06
Round 3 09/07/07
Round 4 22/10/07
Round 3 16/08/07
Round 4 22/10/07
Baseline 09/07/05
Round 1 12/06/06
Round 2 17/11/06
Round 3 09/07/07
Round 4 22/10/7
Round 3 16/08/07
Round 4 22/10/07
METALSArsenic Dissolved 1 ug/l <1 3 <1 3 1 2 5 2 2 <1 <1 <1 <1 NA NA NA No Access NA NABarium Dissolved 1 ug/l 1 44 34 34 39 20 42 34 37 37 15 26 1 NA NA NA No Access NA NABoron Dissolved 10 ug/l 108 750 666 650 640 267 718 632 610 670 690 660 <10 NA NA NA No Access NA NACadmium Dissolved 0.4 ug/l <0.4 <0.4 <0.4 <0.4 <0.4 <0.4 <0.4 <0.4 <0.4 <0.4 <0.4 <0.4 <0.4 NA NA NA No Access NA NACalcium Dissolved 5 ug/l 13,130 606,800 533,800 520,000 480,000 340,900 615,400 571,000 540,000 550,000 NA 96000 9,363 NA NA NA No Access NA NAChromium Dissolved 1 ug/l <1 3 <1 2 <1 2 3 <1 4 2 3 <1 <1 NA NA NA No Access NA NACopper Dissolved 1 ug/l 2 2 <1 3 <1 2 1 4 3 2 1 <1 <1 NA NA NA No Access NA NAIron Dissolved 5 ug/l 152 NA NA NA NA 47 NA NA NA NA NA NA 48 NA NA NA No Access NA NAIron Total (HNO3 Digest) 5 ug/l NA <10 164 79 <5 NA <10 111 97 <5 NA 66000 NA NA NA NA No Access NA NALead Dissolved 1 ug/l <1 2 <1 <1 <1 <1 2 <1 6 <1 <1 <1 <1 NA NA NA No Access NA NAMagnesium Dissolved 5 ug/l 2,229 97790 90,700 87,000 76,000 61,950 104300 96360 98,000 82,000 NA 37000 1,321 NA NA NA No Access NA NAManganese Dissolved 1 ug/l 4 2 <1 3 1 <1 3 1 2 1 NA 1100 <1 NA NA NA No Access NA NANickel Dissolved 1 ug/l <1 7 3 8 2 5 5 7 5 1 7 7 <1 NA NA NA No Access NA NASelenium Dissolved 1 ug/l 3 39 34 38 29 22 47 36 41 31 NA <1 <1 NA NA NA No Access NA NAMercury Dissolved 0.05 ug/l <0.05 <0.05 <0.05 <0.05 <0.05 <0.05 <0.05 <0.05 <0.05 <0.05 <0.05 <0.05 <0.05 NA NA NA No Access NA NATotal Alkalinity as CaCO3 2 mg/l 70 185 145 150 200 160 165 160 150 150 NA 85 170 NA NA NA No Access NA NAPotassium Dissolved 0.2 mg/l 4.5 7.2 7.4 7.2 7.1 7.4 7.7 7.1 7.4 7.5 NA 5.6 2.3 NA NA NA No Access NA NASodium Dissolved 0.2 mg/l 127.5 367.5 341.3 420 400 382.5 382.5 333.8 410 410 NA 360 48.0 NA NA NA No Access NA NASodium Total 0.2 mg/l 240 NA NA NA NA 25.5 NA NA NA NA NA NA 25.5 NA NA NA No Access NA NANitrate as NO3 0.3 mg/l 21 7.6 3.5 26 21 0.4 6.1 21.6 22 19 NA 0.4 7.0 NA NA NA No Access NA NASulphate (soluble) 3 mg/l 285 1899 1808 1800 1700 2031 2056 1838 1900 1800 NA 720 259 NA NA NA No Access NA NAChloride 1 mg/l 87 322 280 280 280 331 334 294 300 280 NA 170 42 NA NA NA No Access NA NATotal Cyanide 0.05 mg/l <0.05 <0.05 <0.05 <0.05 <0.05 <0.05 <0.05 <0.05 <0.05 <0.05 <0.05 <0.05 <0.05 NA NA NA No Access NA NAFree Cyanide 0.05 mg/l <0.05 NA NA NA NA <0.05 NA NA NA NA NA NA <0.05 NA NA NA No Access NA NApH Value 1 pH Units 7.9 8.29 8.24 8.11 7.99 8.3 8.31 8.32 8.17 8.03 NA 7.47 8.54 NA NA NA No Access NA NAPETROLEUM HYDROCARBONSGRO (C4-C12) 10 ug/l <10 <10 <10 <10 <10 <10 <10 <10 <10 <10 <10 <10 <10 <10 <10 <10 No Access <10 <10Benzene 10 ug/l <10 <10 <10 <10 <10 <10 <10 <10 <10 <10 <10 <10 <10 <10 <10 <10 No Access <10 <10Toluene 10 ug/l <10 <10 <10 <10 <10 <10 <10 <10 <10 <10 <10 <10 <10 <10 <10 <10 No Access <10 <10Ethyl benzene 10 ug/l <10 <10 <10 <10 <10 <10 <10 <10 <10 <10 <10 <10 <10 <10 <10 <10 No Access <10 <10m & p Xylene 10 ug/l <10 <10 <10 <10 <10 <10 <10 <10 <10 <10 <10 <10 <10 <10 <10 <10 No Access <10 <10o Xylene 10 ug/l <10 <10 <10 <10 <10 <10 <10 <10 <10 <10 <10 <10 <10 <10 <10 <10 No Access <10 <10TPH (Total C5-C35) 10 ug/l <10 12 Insufficient sample <10 <10 <10 <10 <10 <10 <10 <10 <10 <10 <10 <10 <10 No Access <10 <10EPH (DRO) (C10-C40) 10 ug/l <10 <10 <10 <10 <10 <10 <10 <10 <10 <10 <10 <10 <10 <10 <10 <10 No Access <10 <10POLYCYCLIC AROMATIC HYDROCARBONS -Benzo(a)pyrene 0.009 ug/l <0.01 <0.01 <0.01 <0.009 <0.009 <0.01 <0.01 <0.01 <0.009 <0.009 <0.009 <0.009 <0.01 <0.01 <0.01 <0.009 No Access <0.009 <0.009PAH 16 Total 0.027 ug/l <0.01 <0.01 <0.01 <0.027 <0.027 <0.01 <0.01 <0.01 <0.027 <0.027 <0.027 <0.027 <0.01 <0.01 <0.01 <0.027 No Access <0.027 <0.027SEMI-VOLATILE ORGANIC COMPOUNDSPhenols:
ALL PARAMETERS 1 ug/l <1 <1 <1 <1 <1 <1 <1 <1 <1 <1 <1 <1 <1 <1 <1 <1 No Access <1 <1PhthalatesBis(2-ethylhexyl) phthalate 1 ug/l <1 <1 <1 <2 <2 <1 <1 <1 <2 <2 <2 <2 <1 <1 <1 <2 No Access <2 <2Butylbenzyl phthalate 1 ug/l <1 <1 <1 <1 <1 <1 <1 <1 <1 <1 <1 <1 <1 <1 <1 <1 No Access <1 <1Di-n-butyl phthalate 1 ug/l <1 <1 <1 <1 <1 <1 <1 <1 <1 <1 <1 <1 <1 <1 <1 <1 No Access <1 <1Di-n-Octyl phthalate 1 ug/l <1 <1 <1 <5 <5 <1 <1 <1 <5 <5 <5 <5 <1 <1 <1 <5 No Access <5 <5Diethyl phthalate 1 ug/l <1 <1 <1 <1 <1 <1 <1 <1 <1 <1 <1 <1 <1 <1 <1 <1 No Access <1 <1Dimethyl phthalate 1 ug/l <1 <1 <1 <1 <1 <1 <1 <1 <1 <1 <1 <1 <1 <1 <1 <1 No Access <1 <1Other Semi-volatiles
ALL PARAMETERS 1 ug/l <1 <1 <1 <1 <1 <1 <1 <1 <1 <1 <1 <1 <1 <1 <1 <1 No Access <1 <1VOLATILE ORGANIC COMPOUNDS
ALL PARAMETERS 1 ug/l <1 <1 <1 <1 <1 <1 <1 <1 <1 <1 <1 <1 <1 <1 <1 <1 No Access <1 <1
Dichlorodifluoromethane; Chloromethane; Vinyl Chloride; Bromomethane; Chloroethane; Trichlorofluoromethane; trans-1-2-Dichloroethene; Dichloromethane; Carbon Disulphide; 1.1-Dichloroethene; 1.1-Dichloroethane; Methyl Tertiary Butyl Ether; cis-1-2-Dichloroethene; Bromochloromethane; Chloroform; 2.2-Dichloropropane; 1.2-Dichloroethane; 1.1.1-Trichloroethane; 1.1-Dichloropropene; Benzene; Carbontetrachloride; Dibromomethane; 1.2-Dichloropropane; Bromodichloromethane; Trichloroethene; cis-1-3-Dichloropropene; trans-1-3-Dichloropropene; 1.1.2-Trichloroethane; Toluene; 1.3-Dichloropropane; Dibromochloromethane; 1.2-Dibromoethane; Tetrachloroethene; 1.1.1.2-Tetrachloroethane; Chlorobenzene; Ethylbenzene; p/m-Xylene; Bromoform; Styrene; 1.1.2.2-Tetrachloroethane; o-Xylene; 1.2.3-Trichloropropane; Isopropylbenzene; Bromobenzene; 2-Chlorotoluene; Propylbenzene; 4-Chlorotoluene; 1.2.4-Trimethylbenzene; 4-Isopropyltoluene; 1.3.5-Trimethylbenzene; 1.2-Dichlorobenzene; 1.4-Dichlorobenzene; sec-Butylbenzene; tert-Butylbenzene; 1.3-Dichlorobenzene; n-Butylbenzene; 1.2-Dibromo-3-chloropropane; 1.2.4-Trichlorobenzene; Naphthalene; 1.2.3-Trichlorobenzene; Hexachlorobutadiene
AnalyteMethod
Detection Limit
2-Chlorophenol; 2-Methylphenol; 2-Nitrophenol; 2,4-Dichlorophenol; 2,4-Dimethylphenol; 2,4,5-Trichlorophenol; 2,4,6-Trichlorophenol; 4-Chloro-3-methylphenol; 4-Methylphenol; 4-Nitrophenol; Pentachlorophenol; Phenol
1,2-Dichlorobenzene; 1,2,4-Trichlorobenzene; 1,3-Dichlorobenzene; 1,4-Dichlorobenzene; 2-Nitroaniline; 2,4-Dinitrotoluene; 2,6-Dinitrotoluene; 3-Nitroaniline; 4-Bromophenylphenylether; 4-Chloroaniline; 4-Chlorophenylphenylether; 4-Nitroaniline; Azobenzene; Bis(2-chloroethoxy)methane; Bis(2-chloroethyl)ether; Carbazole; Dibenzofuran; Hexachlorobenzene; Hexachlorobutadiene; Hexachlorocyclopentadiene; Hexachloroethane; Isophorone; N-nitrosodi-n-propylamine; Nitrobenzene

Environmental and Social Annual Report 2007
100
LOCATION: PSG2. SAMPLE TYPE: Groundwater & Surface Water. SAMPLING DATES: Sept/Oct 07. SAMPLING ROUND: Round 4.
KEY: "<" – Concentration less than method detection limit; NA – Not analysed.
Sample Reference PSG2MW1 PSG2MW1 PSG2MW1 PSG2MW1 PSG2MW1 PSG2SW1 PSG2SW1 PSG2SW1 PSG2SW1 PSG2SW1 PSG2SW2 PSG2SW2 PSG2SW2a PSG2SW2 PSG2SW2 PSG2SW3 PSG2SW3 PSG2SW3 PSG2SW3 PSG2SW3
Date Sampled /
Units
Baseline 10/07/05
Round 1 14/06/06
Round 216/11/06
Round 316/07/07
Round 419/10/07
Baseline 10/07/05
Round 1 14/06/06
Round 216/11/06
Round 316/07/07
Round 419/10/07
Baseline 10/07/05
Round 1 14/06/06
Round 2 16/11/06
Round 316/07/07
Round 419/10/07
Baseline 10/07/05
Round 1 14/06/06
Round 2 16/11/06
Round 316/07/07
Round 419/10/07
METALSArsenic Dissolved 1 ug/l <1 <1 <1 <1 <1 <1 NA NA NA NA DRY NA NA NA NA No Access NA NA NA NABarium Dissolved 1 ug/l 2 15 9 16 10 3 NA NA NA NA DRY NA NA NA NA No Access NA NA NA NABoron Dissolved 10 ug/l <10 93 61 27 <10 <10 NA NA NA NA DRY NA NA NA NA No Access NA NA NA NACadmium Dissolved 0.4 ug/l <0.4 <0.4 <0.4 <0.4 <0.4 <0.4 NA NA NA NA DRY NA NA NA NA No Access NA NA NA NACalcium Dissolved 5 ug/l 19170 125100 101700 97000 99000 8903 NA NA NA NA DRY NA NA NA NA No Access NA NA NA NAChromium Dissolved 1 ug/l 2 <1 <1 2 7 <1 NA NA NA NA DRY NA NA NA NA No Access NA NA NA NACopper Dissolved 1 ug/l <1 <1 <1 6 <1 1 NA NA NA NA DRY NA NA NA NA No Access NA NA NA NAIron Dissolved 5 ug/l 12 NA NA NA NA 16 NA NA NA NA DRY NA NA NA NA No Access NA NA NA NAIron Total (HNO3 Digest) 5 ug/l NA <1 116 78 <5 NA NA NA NA NA DRY NA NA NA NA No Access NA NA NA NALead Dissolved 1 ug/l <1 <1 <1 1 <1 <1 NA NA NA NA DRY NA NA NA NA No Access NA NA NA NAMagnesium Dissolved 5 ug/l 5250 32910 30890 32000 30000 1209 NA NA NA NA DRY NA NA NA NA No Access NA NA NA NAManganese Dissolved 1 ug/l <1 3 1 1 <1 <1 NA NA NA NA DRY NA NA NA NA No Access NA NA NA NANickel Dissolved 1 ug/l <1 1 3 2 1 <1 NA NA NA NA DRY NA NA NA NA No Access NA NA NA NASelenium Dissolved 1 ug/l <1 158 <1 <1 3 <1 NA NA NA NA DRY NA NA NA NA No Access NA NA NA NAMercury Dissolved 0.05 ug/l <0.05 <0.05 <0.05 <0.05 <0.05 <0.05 NA NA NA NA DRY NA NA NA NA No Access NA NA NA NATotal Alkalinity as CaCO3 2 mg/l 325 415 385 200 400 160 NA NA NA NA DRY NA NA NA NA No Access NA NA NA NAPotassium Dissolved 0.2 mg/l 0.2 1.1 0.8 0.8 1.2 1.4 NA NA NA NA DRY NA NA NA NA No Access NA NA NA NASodium Dissolved 0.2 mg/l 20.3 NA 18 21 36 9.9 NA NA NA NA DRY NA NA NA NA No Access NA NA NA NASodium Total 0.2 mg/l 8.9 15.8 NA NA NA 5.1 NA NA NA NA DRY NA NA NA NA No Access NA NA NA NANitrate as NO3 0.3 mg/l 2.8 19.2 21.9 22.0 22.0 3.3 NA NA NA NA DRY NA NA NA NA No Access NA NA NA NASulphate (soluble) 3 mg/l 10 14 16 14 14 7 NA NA NA NA DRY NA NA NA NA No Access NA NA NA NAChloride 1 mg/l 14 13 10 11 10 2 NA NA NA NA DRY NA NA NA NA No Access NA NA NA NATotal Cyanide 0.05 mg/l <0.05 <0.05 <0.05 <0.05 <0.05 <0.05 NA NA NA NA DRY NA NA NA NA No Access NA NA NA NAFree Cyanide 0.05 mg/l <0.05 NA NA NA NA <0.05 NA NA NA NA DRY NA NA NA NA No Access NA NA NA NApH Value 1 pH Units <1 8.31 8.30 8.52 8.44 8.65 NA NA NA NA DRY NA NA NA NA No Access NA NA NA NAPETROLEUM HYDROCARBONSGRO (C4-C12) 10 ug/l <10 <10 <10 <10 <10 <10 <10 <10 <10 <10 DRY DRY <10 DRY DRY No Access <10 <10 <10 <10Benzene 10 ug/l <10 <10 <10 <10 <10 <10 <10 <10 <10 <10 DRY DRY <10 DRY DRY No Access <10 <10 <10 <10Toluene 10 ug/l <10 <10 <10 <10 <10 <10 <10 <10 <10 <10 DRY DRY <10 DRY DRY No Access <10 <10 <10 <10Ethyl benzene 10 ug/l <10 <10 <10 <10 <10 <10 <10 <10 <10 <10 DRY DRY <10 DRY DRY No Access <10 <10 <10 <10m & p Xylene 10 ug/l <10 <10 <10 <10 <10 <10 <10 <10 <10 <10 DRY DRY <10 DRY DRY No Access <10 <10 <10 <10o Xylene 10 ug/l <10 <10 <10 <10 <10 <10 <10 <10 <10 <10 DRY DRY <10 DRY DRY No Access <10 <10 <10 <10TPH (Aliphatics and Aromatics C5-C35) 10 ug/l <10 125 <10 <10 <10 <10 <10 <10 <10 <10 DRY DRY <10 DRY DRY No Access <10 <10 <10 <10
EPH (DRO) (C10-C40) 10 ug/l <10 <10 <10 <10 <10 <10 <10 <10 <10 <10 DRY DRY <10 DRY DRY No Access <10 <10 <10 <10POLYCYCLIC AROMATIC HYDROCARBONSBenzo(a)pyrene 0.009 ug/l <0.01 <0.01 <1 <0.009 <0.009 <0.01 <0.01 <1 <0.009 <0.009 DRY DRY <1 DRY DRY No Access <0.01 <1 <0.009 <0.009PAH 16 Total 0.027 ug/l 0.096 <0.01 <1 <0.027 <0.027 <0.01 <0.01 <1 <0.027 <0.027 DRY DRY <1 DRY DRY No Access <0.01 <1 <0.027 <0.027
<0 01 ug/lSEMI-VOLATILE ORGANIC COMPOUNDSPhenols:
ALL PARAMETERS 1 ug/l <1 <1 <1 <1 <1 <1 <1 <1 <1 <1 DRY DRY <1 DRY DRY No Access <1 <1 <1 <1PhthalatesBis(2-ethylhexyl) phthalate 1 ug/l <1 <1 <1 <2 <2 <1 <1 <1 <2 <2 DRY DRY <1 DRY DRY No Access <1 <1 <2 <2Di-n-Octyl phthalate 1 ug/l <1 <1 <1 <5 <5 <1 <1 <1 <5 <5 DRY DRY <1 DRY DRY No Access <1 <1 <5 <5Butylbenzyl phthalate; Di-n-butyl phthalate; Di-n-Octyl phthalate; Diethyl phthalate; Dimethyl phthalateALL PARAMETERS 1 ug/l <1 <1 <1 <1 <1 <1 <1 <1 <1 <1 DRY DRY <1 DRY DRY No Access <1 <1 <1 <1Other Semi-volatiles
ALL PARAMETERS 1 ug/l <1 <1 <1 <1 <1 <1 <1 <1 <1 <1 DRY DRY <1 DRY DRY No Access <1 <1 <1 <1VOLATILE ORGANIC COMPOUNDS
ALL PARAMETERS 1 ug/l <1 <1 <1 <1 <1 <1 <1 <1 <1 <1 DRY DRY <1 DRY DRY No Access <1 <1 <1 <1
2-Chlorophenol; 2-Methylphenol; 2-Nitrophenol; 2,4-Dichlorophenol; 2,4-Dimethylphenol; 2,4,5-Trichlorophenol; 2,4,6-Trichlorophenol; 4-Chloro-3-methylphenol; 4-Methylphenol; 4-Nitrophenol; Pentachlorophenol; Phenol
1,2-Dichlorobenzene; 1,2,4-Trichlorobenzene; 1,3-Dichlorobenzene; 1,4-Dichlorobenzene; 2-Nitroaniline; 2,4-Dinitrotoluene; 2,6-Dinitrotoluene; 3-Nitroaniline; 4-Bromophenylphenylether; 4-Chloroaniline; 4-Chlorophenylphenylether; 4-Nitroaniline; Azobenzene; Bis(2-chloroethoxy)methane; Bis(2-chloroethyl)ether; Carbazole; Dibenzofuran; Hexachlorobenzene; Hexachlorobutadiene; Hexachlorocyclopentadiene; Hexachloroethane; Isophorone; N-nitrosodi-n-propylamine; Nitrobenzene
Dichlorodifluoromethane; Chloromethane; Vinyl Chloride; Bromomethane; Chloroethane; Trichlorofluoromethane; trans-1-2-Dichloroethene; Dichloromethane; Carbon Disulphide; 1.1-Dichloroethene; 1.1-Dichloroethane; Methyl Tertiary Butyl Ether; cis-1-2-Dichloroethene; Bromochloromethane; Chloroform; 2.2-Dichloropropane; 1.2-Dichloroethane; 1.1.1-Trichloroethane; 1.1-Dichloropropene; Benzene; Carbontetrachloride; Dibromomethane; 1.2-Dichloropropane; Bromodichloromethane; Trichloroethene; cis-1-3-Dichloropropene; trans-1-3-Dichloropropene; 1.1.2-Trichloroethane; Toluene; 1.3-Dichloropropane; Dibromochloromethane; 1.2-Dibromoethane; Tetrachloroethene; 1.1.1.2-Tetrachloroethane; Chlorobenzene; Ethylbenzene; p/m-Xylene; Bromoform; Styrene; 1.1.2.2-Tetrachloroethane; o-Xylene; 1.2.3-Trichloropropane; Isopropylbenzene; Bromobenzene; 2-Chlorotoluene; Propylbenzene; 4-Chlorotoluene; 1.2.4-Trimethylbenzene; 4-Isopropyltoluene; 1.3.5-Trimethylbenzene; 1.2-Dichlorobenzene; 1.4-Dichlorobenzene; sec-Butylbenzene; tert-Butylbenzene; 1.3-Dichlorobenzene; n-Butylbenzene; 1.2-Dibromo-3-chloropropane; 1.2.4-Trichlorobenzene; Naphthalene; 1.2.3-Trichlorobenzene; Hexachlorobutadiene
AnalyteMethod
Detection Limit

BTC Pipeline Project
101
2.2f – Waste Total Figures, 2007
TYPE OF WASTE (m3) PSG1 (site and
camp)
PSG2 (site and
camp)
SES Tsalka
SES Borjomi
BVs SES Rustavi and Tbilisi
Office
Hazardous waste disposed offsite
Oily solids 22.0 14.2 2.0 3.0 0.6 1.3
Oily liquids 13.4 25.2 0 0 1.4 0
Sewage sludge 436 199 0 0 5.0 0
Wax 0 0 0 0 0 0
Other 19.7 28.9 0.9 1,6 1.2 1.2
Non-hazardous waste disposed offsite
Glass 0 0 0 0 0 0
Plastic 0 0 0 0 0 0
Paper 0 0 0 0 0 0
Metal /(Concrete) 0 0 0 0 0 0
Organic Wastes (food wastes) 28.7 63.2 0 0 0 0
General 523.2 287.5 13.8 4.9 6.3 70.9
Non-hazardous waste re-cycled/recovered offsite
Glass 2.5 5.0 0 0 0 0
Plastic (stored) 58.5 19.9 7.7 13.6 0 8.7
Paper 107.4 12.4 8.3 8.8 0 8.7
Metal (stored) 5.2 3.5 0 0 0 0
Timber (stored) 5.0 8.3 0 0 0 0
APPENDIX 2.3: TURKEY 2.3a – Ambient Air Quality Air Quality Standards for Ground Level Concentrations (µg/m3)
Parameter Project Standards (Turkey)
Averaging Period
VOCs Benzene: 5 Annual average by 2010 (Note: A limit value of 10 µg/m3 (100%) must be met on 13 December 2000, reducing on 1 January 2006 and every 12 months thereafter by 1 µg/m3 to reach 0% (5 µg/m3) by 1 January 2010).
Oxides of Nitrogen (NOx)
40 Annual average by 2010
Sulphur Dioxide (SO2) 20* Annual mean
Environmental and Social Annual Report 2007
102
Ceyhan Marine Terminal - Averages of 2007 Measurements
Average Ambient Concentrations (µg/m3) No. Monitoring
Date SO2 NOx Benzene Toluene Ethyl Benzene o-xylene mp-
xylene
CMT 1 6,93 14,59 1,19 0,8 0,31 0,21 0,36
CMT 2 6,18 13,72 0,95 0,85 0,32 0,18 0,44
CMT 3 15,49 11,8 0,84 2,69 0,54 0,42 1,23
CMT 4 4,45 8,9 1,03 0,86 0,29 0,28 0,62
CMT 5 6,82 15,43 0,95 0,97 0,25 0,18 0,41
CMT 6 8,38 12,65 1,03 6,65 0,3 0,38 0,71
CMT 7 6,38 9,16 0,89 0,76 0,29 0,16 0,37
CMT 8 6,48 11,8 0,58 0,71 0,16 0,15 0,22
CMT 9 7,31 11 0,85 1,5 0,44 0,5 1,11
CMT 10
Jan-
Apr
-Jul
y-S
ep 2
007
7,09 9,11 1,01 0,73 0,26 0,15 0,31
2.3b – Stack Emissions Stack Emission Standards
Emission stream sources Parameters Project Specified Standard
5 MW Reciprocating engines (gas fired) (PTs 1, 2, 3 and 4)
NOx SO2 CO PM
500 mg/Nm3 (5% Volumetric O2) 60 mg/Nm3 (5% Volumetric O2)
650 mg/Nm3 (5% Volumetric O2) 130 mg/Nm3 (5% Volumetric O2)
Water Heaters (diesel fired) (Wax Handling Boilers at CMT, IPT1 and IPT2)
NOx SO2 CO
Soot
460 mg/Nm3 (3% Volumetric O2) 1.000 mg/Nm3 (3% Volumetric O2) 150 mg/Nm3 (3% Volumetric O2)
2
Water Heaters (gas and LPG fired) (CMT, PTs 1, 2, 3 and 4)
NOx SO2 CO PM
320 mg/Nm3 (3% Volumetric O2) 100 mg/Nm3 (3% Volumetric O2) 100 mg/Nm3 (3% Volumetric O2) 10 mg/Nm3 (3% Volumetric O2)
NOTE: Figures in red show non-compliance with project standards

BTC Pipeline Project
103
Stack Emission Monitoring Results for Pump Stations and Intermediate Pigging Stations 1 & 2
Emission Source Facility Parameter Driver Engine 1 Driver Engine 2 Driver Engine 3 Driver Engine 4 Driver Engine 5 Water Heater 1 Water Heater 2 Water Heater 3
PT1 Date of monitoring n/a since wasn't in the programme Apr ‘07
NOx 137 127 134 SO2 0 0 0 PM 0,26 1,09 26,58 Monitoring result
CO
n/a
0 0 134 Date of monitoring Oct '07
NOx 270 160 207 103 223 91 74 94 SO2 8 0 0 0 0 0 0 0 PM 4,13 5,03 3,28 3,05 3,34 0,23 0,17 0,29 Monitoring result
CO 62 90 60 31 69 0 150 0 PT2 Date of monitoring n/a since wasn't in the programme Apr ‘07
NOx 69 152 92 SO2 3 0 0 PM 0,48 0,35 0,22 Monitoring result
CO
n/a
3 0 0 Date of monitoring Oct '07 Oct '07
NOx 274 748 279 267 92 93 97 SO2 0 0 0 0 0 0 0 PM 2,45 1,41 1,48 3,78 0,49 0,49 0,35 Monitoring result
CO 34 35 38 28
not e
xist
ing
27 0 0 PT3
Date of monitoring n/a since wasn't in the programme Apr ‘07 n/a since wasn't operating
NOx 107 105 SO2 12 2 PM 2,34 0,37 Monitoring result
CO
n/a
0 0
n/a
Date of monitoring Oct '07 NOx 226 233 225 236 255 88 77 98 SO2 0 0 0 0 10 0 0 0 PM 1,91 2,17 7,31 2,21 2,31 0,4 0,58 0,4 Monitoring result
CO 46 59 93 96 86 0 0 0 PT4 Date of monitoring n/a since wasn't in the programme Apr ‘07
NOx 56 148 148 SO2 30 0 0 PM 14,44 2,3 0,67 Monitoring result
CO
n/a
228 3 0 Date of monitoring Oct '07 Oct '07
NOx 1.992 355 159 248 38 83 75 SO2 0 0 0 0 0 0 0 PM 13,47 2,39 0,63 1,57 1,51 0,24 4,11 Monitoring result
CO 105 44 17 64 no
t exi
stin
g 315 0 0

Environmental and Social Annual Report 2007
104
Stack Emission Monitoring Results for Intermediate Pigging and Pressure Reduction Station
Emission Source Facility Parameter Water Heater Diesel Generator
IPT1 Date of monitoring Apr ‘07 n/a since runs < 500 hrs/year
NOx 112 SO2 4 soot not monitored Monitoring result
CO 0
n/a
Date of monitoring Oct '07 n/a since runs > 500 hrs/year NOx 122 SO2 0 soot not monitored Monitoring result
CO 0
n/a
IPT2 Date of monitoring Apr ‘07 n/a since wasn’t in the programme
NOx 164 SO2 0 soot not monitored Monitoring result
CO 0
n/a
Date of monitoring n/a since wasn’t operating Oct '07
NOx n/a 662 SO2 n/a 156 soot n/a not monitored Monitoring result
CO n/a 593
Stack Emission Monitoring Results for Ceyhan Marine Terminal
Emission Source Emission Source Facility Parameter Process Area Wax
Handling Boiler (diesel)Metering Wax Handling
Boiler (diesel)
ParameterGeneral Facilities
Water Heater 1 (LPG) General Facilities
Water Heater 2 (LPG)Housing Compound Water Heater (LPG)
Process Area Water Heater (LPG)
CMT Date of monitoring Jan ‘07 Jan ‘07 n/a since wasn’t in the programme
NOx 122 162 NOx 139 SO2 365 186 SO2 3 soot not monitored not monitored PM 0 Monitoring result
CO 146 1 CO 2
n/a
Date of monitoring Apr ‘07 Apr ‘07 NOx 103 129 NOx 144 152 161 134 SO2 13 166 SO2 0 2 12 1 soot not monitored not monitored PM 0 0 0 0 Monitoring result
PM 40 92 CO 0 0 35 0 Date of monitoring Oct ‘07 Oct ‘07
NOx 105 108 NOx 145 40 131 130 SO2 13 71 SO2 0 0 0 0 soot not monitored not monitored PM 2,51 2,99 0,45 0,84 Monitoring result
PM 37 137 CO 0 451 0 0

BTC Pipeline Project
105
2.3c – Aqueous Discharges Aqueous Discharge Standards
Waste stream sources Parameters Project Specified Standard
All limits 95th percentiles of annual operational hours. pH 6 – 9 for fresh water and 5-9 for marine
water Oil and grease 10 mg/l Total suspended solids 35 mg/l Metals
Heavy metals, total 10 mg/l Cd 0.05 mg/l Cr total 0.5 mg/l Cu 0.5 mg/l Pb 0.5 mg/l Hg 0.01 mg/l Ni 0.5 mg/l Zn 2 mg/l
NH4 10 mg/l Phenols 0.5 mg/l
Aqueous discharges to surface and marine waters from oily water separators
Sulphur 1 mg/l pH 6-9 BOD 25 mg/l COD 125 mg/l Oil and grease 10 mg/l Total suspended solids 35 mg/l Chlorine, total residual 0.2 mg/l
Aqueous discharges to surface waters from sewage treatment plants
Coliform bacteria <400MPN/100ml
NOTE: Figures in red show non-compliance with project standards

Environmental and Social Annual Report 2007
106
Table Notes:
1. When it is stated that there is ‘no discharge’ it means that the water was sampled but not discharged since the final effluent was not compliant with the project standards. In this case non-compliant waste water was re-cycled or when the capacity of the plant was exceeded it was disposed of at a project approved Municipal WWTP. At sites where there is a construction phase WWTP still in place, the waste water was transferred to this plant for treatment if it was operating in compliance with Project Standards.
2. When it is stated that there is ‘no flow’ it means that the water could not be sampled since there was no flow at the time of monitoring.
PT1 Aqueous Discharges Monitoring Results Jan 07 Feb 07 March 07 April 07 May 07 June 07 July 07 Aug 07 Sep 07 Oct 07 Nov 07 Dec 07 Ops WWTP pH 7,58 7,45 6,43 8,01 7,77 BOD (mg/l) 8 6 12,4 20 11 COD (mg/l) 15,2 20,3 20,3 54,5 51,8 Oil and grease (mg/l) 8 7 3,4 4,4 2,2 TSS (mg/l) 14 18 16,8 2 33,2 Total residual chlorine (mg/l) 0,02 0,09 0,17 0,12 0,03 Coliform bacteria
No discharge
0 0
No discharge
0
No discharge
0
No discharge
0 Storm Water Pond (SWP) pH 7,33 BOD (mg/l) 12 COD (mg/l) 44,6 Oil and grease (mg/l) 4,8 TSS (mg/l) 6,4 Total residual chlorine (mg/l) 0,05 Coliform bacteria
No discharge
<240
No Discharge
OWS pH 6,08 8,1 7,4 7,44 8,87 9,91 9,94 8,74 Oil and grease (mg/l) 3,2 15,6 16,3 3,2 2 <1,5 3,6 3 TSS (mg/l)
No flow 2,4 7 4,5 7,2 <1 21 26 6
Heavy metals, total (mg/l) <0,027 Cd (mg/l) <0,0005 Cr total (mg/l) 0,005 Cu (mg/l) <0,005 Pb (mg/l) <0,001 Hg (mg/l) <0,0002 Ni (mg/l) <0,005 Zn (mg/l) 0,01 NH4 (mg/l) 0,25 Phenols (mg/l) <0,0016 Sulphur (mg/l)
n/a since wasn’t in the programme
0,5
n/a since wasn’t in the programme

BTC Pipeline Project
107
PT2 Aqueous Discharges Monitoring Results Jan 07 Feb 07 March 07 April 07 May 07 June 07 July 07 Aug 07 Sep 07 Oct 07 Nov 07 Dec 07 Ops WWTP pH 7,57 7,51 8,17 8,16 BOD (mg/l) 20 4 4 4 COD (mg/l) 33,9 7 4 5 Oil and grease (mg/l) 3 6,2 1,8 2,6 TSS (mg/l) 1,2 1,2 1,6 1,4 Total residual chlorine (mg/l) 0,18 0,01 0,09 0,11 Coliform bacteria 0 0 0 0
No discharge
Construction WWTP pH 7,42 BOD (mg/l) 4 COD (mg/l) 6 Oil and grease (mg/l) 3 TSS (mg/l) 2,2 Total residual chlorine (mg/l) 0,01 Coliform bacteria
No discharge
<240
No discharge Not operational
Storm Water Pond (SWP) pH 8,35 8,42 8,85 BOD (mg/l) 4 4 4 COD (mg/l) 6 13,6 11,9 Oil and grease (mg/l) 5,8 0,2 3,4 TSS (mg/l) 1,8 13,6 1,6 Total residual chlorine (mg/l) 0 0,01 0,03 Coliform bacteria
No discharge
0 0 0
No discharge
SWP upstream pH 8,57 7,86 8,4 8,54 8,3 8,46 BOD (mg/l) 4 5,12 75 <4 <4 <4 COD (mg/l) 4 7,06 <5,2 <20 41 <20 Oil and grease (mg/l) 3,2 4,2 36 3,6 3,4 5,6 TSS (mg/l) 7,6 565 1 2 15 <1 Total residual chlorine (mg/l) 0,03 0,08 <0,06 0,01 0 0,01 Coliform bacteria
No flow
75
No flow
4.800 4.800
No flow
4.800 >1.100 2.400 SWP downstream pH 8,63 7,91 8,4 8,16 8,27 8,36 BOD (mg/l) 4 4 60 <4 <4 <4 COD (mg/l) 4 5 14,1 22,1 24,8 22 Oil and grease (mg/l) 2,6 4,2 <2 5 3,2 <1,5 TSS (mg/l) 2,2 10,15 6 3 2 <1 Total residual chlorine (mg/l) 0,01 4,2 <0,06 0 0,09 0,04 Coliform bacteria
No flow
>1.100
No flow
4.800 4.800
No flow
>4.800 >1.100 >4.800

Environmental and Social Annual Report 2007
108
Jan 07 Feb 07 March 07 April 07 May 07 June 07 July 07 Aug 07 Sep 07 Oct 07 Nov 07 Dec 07 OWS pH 8 8,87 8,83 8,33 7,41 Oil and grease (mg/l) <2 5,6 6,8 3,4 5,2 TSS (mg/l)
No flow 4
No flow 21,6 9 9 8
Heavy metals, total (mg/l) <0,047 Cd (mg/l) <0,0005 Cr total (mg/l) <0,005 Cu (mg/l) <0,005 Pb (mg/l) <0,001 Hg (mg/l) <0,0002 Ni (mg/l) <0,005 Zn (mg/l) 0,03 NH4 (mg/l) 0,5 Phenols (mg/l) 0,0236 Sulphur (mg/l)
n/a since wasn’t in the programme
1 n/a since wasn’t in the
programme
PT3 Aqueous Discharges Monitoring Results Jan 07 Feb 07 March 07 April 07 May 07 June 07 July 07 Aug 07 Sep 07 Oct 07 Nov 07 Dec 07 Ops WWTP pH 7,6 8,07 8,05 8 BOD (mg/l) 10 6 >4 16,6 COD (mg/l) 15 25,2 >5 30 Oil and grease (mg/l) 3,4 6 3,4 <2 TSS (mg/l) 3,2 1,4 1,33 6 Total residual chlorine (mg/l) 0 0,1 0,15 <0,06 Coliform bacteria 93 0
No discharge
0
No discharge
37
No discharge
Storm Water Pond (SWP) pH 8,11 8,15 8,55 BOD (mg/l) 10 8,1 6,75 COD (mg/l) 59,8 19,6 21,5 Oil and grease (mg/l) 4,8 2 7 TSS (mg/l) 10 2,2 11,6 Total residual chlorine (mg/l) 0 0,15 0,05 Coliform bacteria
No discharge
0 0 0
No discharge
OWS pH 6,69 8,03 7,93 8,61 8,05 7,10 7 7,59 8,32 7,57 8,49 7,74 Oil and grease (mg/l) 10,6 5,4 2,4 4,2 3 <2 <2 8,4 4 5,4 <1,5 2 TSS (mg/l) 25,6 21,6 3,2 6,67 2,2 13 13,15 36 15,8 10 7 <1 Heavy metals, total (mg/l) <0,037 Cd (mg/l) <0,0005 Cr total (mg/l) 0,013 Cu (mg/l) <0,005 Pb (mg/l) <0,001 Hg (mg/l) <0,0002 Ni (mg/l) 0,007 Zn (mg/l) 0,01 NH4 (mg/l) <0,15 Phenols (mg/l) 0,2097 Sulphur (mg/l)
n/a since wasn’t in the programme
0,2
n/a since wasn’t in the programme

BTC Pipeline Project
109
PT4 Aqueous Discharges Monitoring Results Jan 07 Feb 07 March 07 April 07 May 07 June 07 July 07 Aug 07 Sep 07 Oct 07 Nov 07 Dec 07 Ops WWTP pH 7,47 7,98 7,8 8,21 BOD (mg/l) 0 8 17.56 >4 COD (mg/l) 21,6 12,2 39.5 32,9 Oil and grease (mg/l) 7,8 7,2 <2 2 TSS (mg/l) 3,8 15,2 9 1 Total residual chlorine (mg/l) 0,06 0,12 5 0,1 Coliform bacteria
No discharge
>1,8
No discharge
<1,8
No discharge
<1.8
No discharge
24
No discharge
Storm Water Pond (SWP) pH 7,47 7,92 BOD (mg/l) 11 23,56 COD (mg/l) 32,8 27,7 Oil and grease (mg/l) 6,2 9,2 TSS (mg/l) 13,6 28,4 Total residual chlorine (mg/l) 0,01 0,17 Coliform bacteria
No discharge
>1,8
No discharge
<1,8
No discharge
OWS pH 7,34 7,73 7,3 7,85 8,04 7,93 8,26 Oil and grease (mg/l) 3,2 4,8 <2 2,2 12,8 1,8 <1,5 TSS (mg/l)
No flow 38,8 8,4
No flow 20
No flow 20,4 5 11 28,8
Heavy metals, total (mg/l) <0,03 Cd (mg/l) <0,0005 Cr total (mg/l) <0,005 Cu (mg/l) <0,005 Pb (mg/l) <0,001 Hg (mg/l) <0,0002 Ni (mg/l) 0,009 Zn (mg/l) 0,01 NH4 (mg/l) <0,15 Phenols (mg/l) 0,1603 Sulphur (mg/l)
n/a since wasn’t in the programme
<0,2
n/a since wasn’t in the programme

Environmental and Social Annual Report 2007
110
IPT1 Aqueous Discharges Monitoring Results Jan 07 Feb 07 March 07 April 07 May 07 June 07 July 07 Aug 07 Sep 07 Oct 07 Nov 07 Dec 07
OWS pH 7,53 7,06 8 8 8,08 7,6 7,15 7,33 Oil and grease (mg/l) 3 1,2 47 35,9 11,6 10 2,2 4,2 TSS (mg/l)
No flow 9
No flow 2,4 1,5 0,5 2,80
No flow 19 4 10,4
Heavy metals, total (mg/l) <0,058 Cd (mg/l) <0,0005 Cr total (mg/l) <0,005 Cu (mg/l) <0,005 Pb (mg/l) 0,002 Hg (mg/l) <0,0002 Ni (mg/l) <0,005 Zn (mg/l) 0,04 NH4 (mg/l) <0,15 Phenols (mg/l) 0,0342 Sulphur (mg/l) n/a since wasn’t in the programme <0,2
n/a since wasn’t in the programme
IPT2 Aqueous Discharges Monitoring Results Jan 07 Feb 07 March 07 April 07 May 07 June 07 July 07 Aug 07 Sep 07 Oct 07 Nov 07 Dec 07
OWS pH 6,25 6,86 7,38 7,63 8,63 8,33 7,84 Oil and grease (mg/l) 5,6 4,6 0,8 2 1,5 2,4 4,2 TSS (mg/l) 9,6
No flow 14
No flow 2,2 3,6 3 1 2,4
Heavy metals, total (mg/l) <0,106
Cd (mg/l) <0,0005 Cr total (mg/l) <0,005 Cu (mg/l) <0,005 Pb (mg/l) 0,01 Hg (mg/l) <0,0002 Ni (mg/l) <0,005 Zn (mg/l) 0,09 NH4 (mg/l) 0,19 Phenols (mg/l) <0,0016 Sulphur (mg/l)
n/a since wasn’t in the programme
0,5
n/a since wasn’t in the programme
CMT Aqueous Discharges Monitoring Results Jan 07 Feb 07 March 07 April 07 May 07 June 07 July 07 Aug 07 Sep 07 Oct 07 Nov 07 Dec 07 Ops WWTP pH 7 7,01 7,95 7,8 BOD (mg/l) 5 10 4 4 COD (mg/l) 40,6 86 37,1 75,1 Oil and grease (mg/l) 5 1,8 4,2 4,4 TSS (mg/l) 21,6 11,4 11,6 25,2 Total residual chlorine (mg/l) 0,18 0,18 0,2 0,17 Coliform bacteria <400 <400 <400 <400
No discharge

BTC Pipeline Project
111
Jan 07 Feb 07 March 07 April 07 May 07 June 07 July 07 Aug 07 Sep 07 Oct 07 Nov 07 Dec 07 Construction WWTP pH 7,18 6,78 7,83 7,74 7,8 7,80 BOD (mg/l) 15 10 1 5 4 15 COD (mg/l) 37,6 53 55,4 20,9 21,4 27,7 Oil and grease (mg/l) 5,8 2,8 5,6 1,8 2 6,2 TSS (mg/l) 8 17,2 22,8 1,6 28,7 1 Total residual chlorine (mg/l) 0,09 0,2 0,19 0,09 0,12 0,05 Coliform bacteria <400 <400 <400 <400 15 21
No discharge
Storm Water Pond (SWP) pH 7,61 7,74 6,9 8,4 8,25 9 8,97 BOD (mg/l) 10 8 10 12 21 14 20 COD (mg/l) 49,9 46 26,6 97,6 88,1 12,5 89,6 Oil and grease (mg/l) 4,8 1 5,6 2,6 3,8 4,8 9,2 TSS (mg/l) 6,4 8 5,6 15 2,4 21 0,21 Total residual chlorine (mg/l) 0,19 0,2 0,07 0,07 0,04 0,05 0,2 Coliform bacteria <400 <400 <400 <400 <400 0
No discharge
53
No discharge
SWP upstream pH 6,83 7,68 7,53 7,62 BOD (mg/l) 2 5 4 <4 COD (mg/l) 25 16,3 32,9 24,8 Oil and grease (mg/l) 2,6 5 <1,5 6,4 TSS (mg/l) 7 3,6 0,08 3,2 Total residual chlorine (mg/l) 0,02 0,1 0,04 0.01 Coliform bacteria
No flow
2.900 <400
No flow
29.000 <400 SWP downstream pH 7,13 8,14 7,43 BOD (mg/l) 4 5,5 6,7 COD (mg/l) 21 20 57,2 Oil and grease (mg/l) 3,6 4,8 7,4 TSS (mg/l) 14 21 68 Total residual chlorine (mg/l) 0,04 0,02 0,02 Coliform bacteria
No flow
1.500
No flow
110.000 <400 OWS 1&2 (office and housing compounds) pH 7,73 6,75 7,98 7,85 8,54 Oil and grease (mg/l) 5 2,6 2,8 5,2 6 TSS (mg/l) 4,6 11,2 3,4 18,5
No flow 3
No flow
Heavy metals, total (mg/l) <0,027 Cd (mg/l) <0,0005 Cr total (mg/l) <0,005 Cu (mg/l) <0,005 Pb (mg/l) 0,001 Hg (mg/l) <0,0002 Ni (mg/l) <0,005 Zn (mg/l) <0,01 NH4 (mg/l) 0,2 Phenols (mg/l) <0,0016 Sulphur (mg/l)
n/a since wasn’t in the programme
<0,2
n/a since wasn’t in the programme
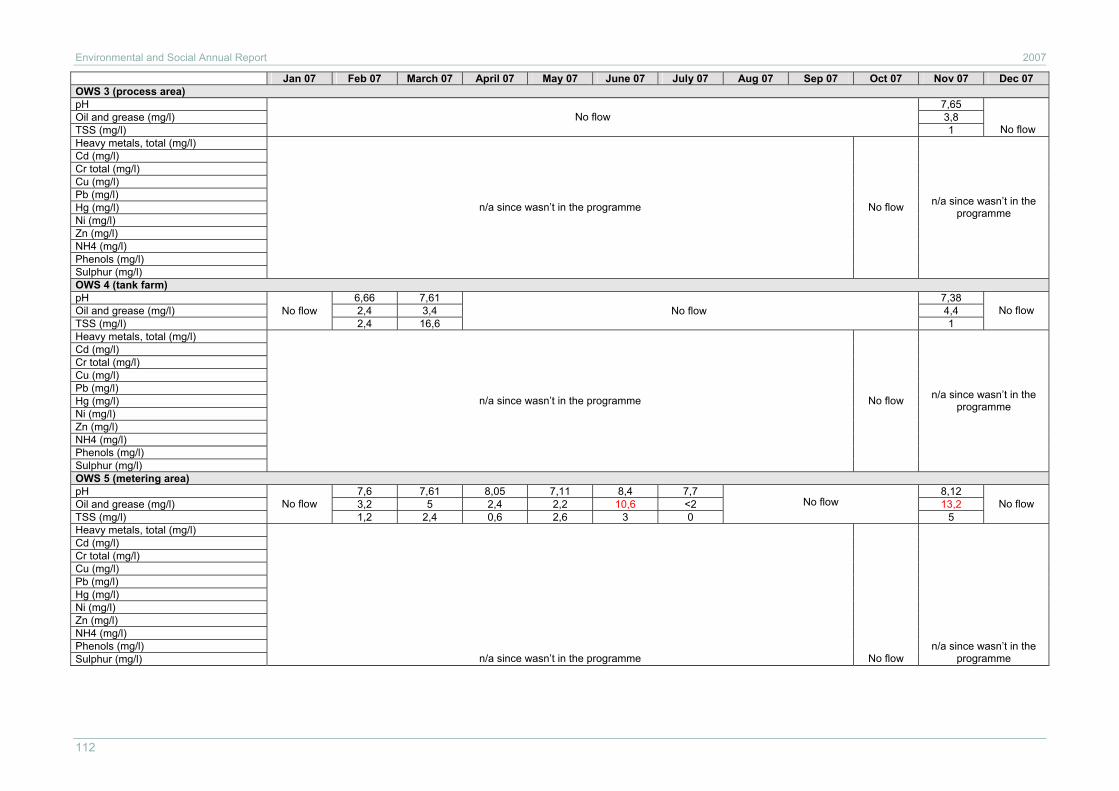
Environmental and Social Annual Report 2007
112
Jan 07 Feb 07 March 07 April 07 May 07 June 07 July 07 Aug 07 Sep 07 Oct 07 Nov 07 Dec 07 OWS 3 (process area) pH 7,65 Oil and grease (mg/l) 3,8 TSS (mg/l)
No flow 1 No flow
Heavy metals, total (mg/l) Cd (mg/l) Cr total (mg/l) Cu (mg/l) Pb (mg/l) Hg (mg/l) Ni (mg/l) Zn (mg/l) NH4 (mg/l) Phenols (mg/l) Sulphur (mg/l)
n/a since wasn’t in the programme No flow n/a since wasn’t in the programme
OWS 4 (tank farm) pH 6,66 7,61 7,38 Oil and grease (mg/l) 2,4 3,4 4,4 TSS (mg/l)
No flow 2,4 16,6
No flow 1
No flow
Heavy metals, total (mg/l) Cd (mg/l) Cr total (mg/l) Cu (mg/l) Pb (mg/l) Hg (mg/l) Ni (mg/l) Zn (mg/l) NH4 (mg/l) Phenols (mg/l) Sulphur (mg/l)
n/a since wasn’t in the programme No flow n/a since wasn’t in the programme
OWS 5 (metering area) pH 7,6 7,61 8,05 7,11 8,4 7,7 8,12 Oil and grease (mg/l) 3,2 5 2,4 2,2 10,6 <2 13,2 TSS (mg/l)
No flow 1,2 2,4 0,6 2,6 3 0
No flow 5
No flow
Heavy metals, total (mg/l) Cd (mg/l) Cr total (mg/l) Cu (mg/l) Pb (mg/l) Hg (mg/l) Ni (mg/l) Zn (mg/l) NH4 (mg/l) Phenols (mg/l) Sulphur (mg/l) n/a since wasn’t in the programme No flow
n/a since wasn’t in the programme

BTC Pipeline Project
113
Jan 07 Feb 07 March 07 April 07 May 07 June 07 July 07 Aug 07 Sep 07 Oct 07 Nov 07 Dec 07 OWS 6 (jetty 1) pH 7,2 7,5 7,2 7,3 Oil and grease (mg/l) 3,2 60 42,7 3,8 TSS (mg/l)
No flow 7
No flow 7 88
No flow 5
No flow
Heavy metals, total (mg/l) Cd (mg/l) Cr total (mg/l) Cu (mg/l) Pb (mg/l) Hg (mg/l) Ni (mg/l) Zn (mg/l) NH4 (mg/l) Phenols (mg/l) Sulphur (mg/l)
n/a since wasn’t in the programme No flow n/a since wasn’t in the programme
OWS 6 (jetty 2) pH 7,37 7,5 7,7 7,28 Oil and grease (mg/l) 3,4 79,8 40,3 5,8 TSS (mg/l)
No flow 23,33
No flow 2 18
No flow 4
No flow
Heavy metals, total (mg/l) Cd (mg/l) Cr total (mg/l) Cu (mg/l) Pb (mg/l) Hg (mg/l) Ni (mg/l) Zn (mg/l) NH4 (mg/l) Phenols (mg/l) Sulphur (mg/l)
n/a since wasn’t in the programme No flow n/a since wasn’t in the programme

Environmental and Social Annual Report 2007
114
2.3d – Waste Total Waste Volumes, 2007 All figures are in tonnes Jan 07 Feb 07 March 07 April 07 May 07 June 07 July 07 Aug 07 Sep 07 Oct 07 Nov 07 Dec 07 TOTAL PT1&IPT2 Hazardous waste disposed offsite 0 0 0 1,8 4 0 0 0 0 0 0 3,3 9,2 Non-hazardous solid waste disposed offsite 1,6 1 2,7 2,8 4,6 2,3 2,6 3,5 1,8 3 2,4 1,7 30 Waste water disposed in 3rd party WWTP 20 20 15 20 25 10 15 10 20 10 15 5 185 Non-hazardous waste re-used & re-cycled 0,5 1 1,5 2 2,9 1,6 1,5 2,2 1,3 1,5 1,1 0,4 17,4 PT2 Hazardous waste disposed offsite 0 0 0 0 6,4 0 0 0 0 0 0 5,2 11,6 Non-hazardous solid waste disposed offsite 4,1 6,2 3,8 7,6 2,4 2,7 3,2 3,1 5 2,9 4,6 4,8 50,4 Waste water disposed in 3rd party WWTP 15 40 15 40 20 97 18 33 10 45 65 60 458 Non-hazardous waste re-used & re-cycled 0,8 4,1 3,3 4,6 1,6 1,3 2,4 2 3,6 1,4 3,6 1,8 30,4 PT3 Hazardous waste disposed offsite 0 0 0 0 3,2 0 0 0 0 0 0 1,9 5,2 Non-hazardous solid waste disposed offsite 6,9 3,4 3 4,6 7,2 3,7 3,1 4,4 1,9 4 2 2,4 46,5 Waste water disposed in 3rd party WWTP 40 15 15 15 10 10 10 10 10 10 5 5 155 Non-hazardous waste re-used & re-cycled 2,8 2 2,8 2,5 6,5 3,2 1,6 2,9 1,2 2,3 0,8 1,5 30 PT4 Hazardous waste disposed offsite 0 0 0 0 2,4 0 0 0 0 0 0 0,8 3,2 Non-hazardous solid waste disposed offsite 3,4 4,2 7,2 2,3 4 3,3 2,6 3,1 4,3 2 2,6 1,7 40,8 Waste water disposed in 3rd party WWTP 0 15 0 120 0 30 15 45 30 30 15 15 315 Non-hazardous waste re-used & re-cycled 0,9 2,5 6,8 1,5 1,7 2,6 0,9 1 3,5 0,6 2 0,8 24,8 IPT1 Hazardous waste disposed offsite 0 0 0 0 0,6 0 0 0 0 0 0,6 Non-hazardous solid waste disposed offsite 2,3 2,6 2 1,7 4,7 1,8 1,6 0,8 2,2 0,2 19,8 Waste water disposed in 3rd party WWTP 675 575 950 750 700 580 540 400 700 98 5.968 Non-hazardous waste re-used & re-cycled 1,6 1,7 1 1 4,2 1,8 1 0,8 2 0,2
Not counted
15,1 CMT Hazardous waste disposed offsite 0 0 0 0 0 0 0 0 0 0 0 3,6 3,6 Non-hazardous solid waste disposed offsite 42,2 42,5 41,7 42 34,8 45,3 33,4 26,8 13,5 27,3 19,3 776,8 1.145,5 Waste water disposed in 3rd party WWTP 0 0 0 0 0 0 0 0 25 10 10 0 45 Non-hazardous waste re-used & re-cycled 35,7 30,7 41,7 33,5 27,8 36,3 22,9 13 13,5 17,4 11,4 769,2 1.053,2
TOTAL 2007 (in tonnes) Hazardous waste disposed offsite 34 Non-hazardous solid waste disposed offsite 1.335 Waste water disposed in 3rd party WWTP 7.156 Non-hazardous waste re-used & re-cycled 1.172

BTC Pipeline Project
115
APPENDIX 3: CLOSE OUT STATUS OF ACTIONS RELATED TO NON-COMPLIANCES RAISED THROUGH IEC MONITORING Appendix 3 contains BTC’s response and progress towards implementing and effectively closing out the non-compliances raised by IEC. Items that remain open are reported in the BTC E&S Reports until they have been closed. Items that have been closed do not appear in subsequent reports. In adopting this approach, the Project aims to provide the transparency and assurance that measures are being taken to ensure follow-up and close out of all actions to address the non-compliances.

Environmental and Social Annual Report 2007
116
APPENDIX 3A – AZERBAIJAN ACTION STATUS AGAINST AUDIT NON-COMPLIANCES AND RECOMMENDATIONS
Ref. No.
Date of finding
Category Description of Finding Level of Non-Compliance
Recommendation for Improvement Action Taken Closure Status
2.3.1 June 2007
Infra-structure
and Services
Potable water quality Overall, the test results over the past year indicate that the H&S staff has actively worked to resolve water quality problems.
I Continue to monitor and maintain the procedures and the systems are in place such that Project staff can have a high level of confidence that the potable water they use for drinking, shower, etc. is pure and safe.
Consumption of drinking water was switched from dispensers to bottled water only; Water quality improvement plan was developed ; As a part of the plan, new effective granulated chlorine-containing disinfectant is used for regular disinfection of potable water substituted for previously used liquid short shelf life disinfectant highly sensitive to parameters of environment; accuracy of chlorination is checked and confirmed in situ by potable test kit; Continuous monitoring of bacterial and chemical quality of potable water is carried out as per water quality assurance schedule.
CLOSED
APPENDIX 3B – GEORGIA ACTION STATUS AGAINST AUDIT NON-COMPLIANCES AND RECOMMENDATIONS
Ref. No.
Date of finding
Category Description of Finding Level of Non-Compliance
Recommendation for Improvement Action Taken Closure Status
3.4.1 June 2007
Waste Manage-
ment
Final disposal of non-hazardous, non recycled/re-usable domestic waste.
III This Level III will remain in effect as long as the Project continues to use the Iagludja facility.
A site for a new non-hazardous waste landfill has been acquired. Temporary disposal options are being investigated, to divert non-hazardous waste from Iagluja prior to the new landfill being constructed.
OPEN
3.5.1 June 2007
Camps Portions of the old PSG-1 camp that are not being used require some cleanup. As an example, the OWS that was associated with the vehicle maintenance area next to the WWTPs were not cleaned up and some small areas with soil contamination from spills were observed. This non-compliance is essentially a residual condition related to construction; therefore reference is made to the construction-phase Pollution Prevention Plan.
I Contaminated areas at the PSG1 camp have been cleaned up. The old OWS (currently disused) has been completely cleaned up and sludge removed to CWAA for further disposal.
CLOSED

BTC Pipeline Project
117
Ref. No.
Date of finding
Category Description of Finding Level of Non-Compliance
Recommendation for Improvement Action Taken Closure Status
3.5.1 June 2007
Emissi-ons
Manage-ment
Stack emission monitoring I The non-compliance will remain in effect until PSGs generators existing sample ports are modified to make them suitable for monitoring.
Existing ports on turbines and water bath heaters have been modified to make them suitable for stack emissions monitoring. A full round of monitoring has been conducted at both PSGs turbines and water bath heaters.
OPEN
APPENDIX 3C – TURKEY ACTION STATUS AGAINST AUDIT NON-COMPLIANCES AND RECOMMENDATIONS
Ref. No.
Date of finding
Category Description of Finding Level of Non-Compliance
Recommendation for Improvement Action Taken Closure Status
4.7.1 June 2007
ROW Maintenance
Lack of maintenance was observed at several locations visited throughout the entire length of the pipeline in Turkey.
II Develop a clear and auditable ROW Maintenance Strategy.
BTC document “Project Right of Way Maintenance Plan” was sent to IEC. Tender process is underway by BIL.
OPEN
4.7.3 June 2007
Reinstatement Lack of clarity with regard to final reinstatement of project access roads in compliance with ESAP commitments.
II
Develop and implement an Access Road Closure and Maintenance Strategy involving a final inventory of project access roads (with special focus on Lot B) including their status, location, length, rationale for being kept open.
BTC documents “Combined Access Road Register”, “Created Access Roads, Stockyards, Borrow Pits and Quarries” and “Residual List” were sent to IEC; awaiting for response.
OPEN
4.7.2 June 2007
Reinstatement Reinstatement of NGPL (Natural Gas Pipeline).
Rec. BTC should ensure adequate NGPL reinstatement, as per Project commitments and undertake the following: a) develop compliance and sign-off procedures for the agreed SoW prior to completion b) provide assurance that the contractor is fully aware and compliant with Construction ESAP commitments (e.g., have an E&S team reporting to Botaş and BTC) and c) that Botaş monitors these commitments and provides BTC with monthly progress reports, including NCRs, MoCs, complaint register and KPIs.
NGPL Reinstatement Works Completed and Close-Out Report sent to IEC.
CLOSED

Environmental and Social Annual Report 2007
118
Ref. No.
Date of finding
Category Description of Finding Level of Non-Compliance
Recommendation for Improvement Action Taken Closure Status
4.5.1 June 2007
Waste Management
Inconsistent emission and waste monitoring registers.
I Improve the format and structure of the two registers and ensure that they report consistent data/information.
Emissions monitoring register and waste log were developed by BTC; shared with BIL to be replaced by the old ones used at facilities. IEC to verify during the next visit.
OPEN
4.5.4 June 2007
Environmental Emissions
Management Plan
Analyses are incomplete for the oil water separator (OWS) discharges (as per the list of parameter indicated in Table 5.3 of the BIL EEMP), and not all OWS have been tested yet.
I Undertake a complete analysis of OWS performance, including testing of parameters not yet tested and implementation of technically adequate techniques to measure all OWS discharge points.
All OWSs at facilities were monitored by Dokay, monitoring contactor of BIL, when there is flow. In addition one round of heavy metal analysis was also conducted in Oct 2007 except for 5 OWSs at CMT as there was no flow during the time of monitoring. Dokay scheduled the next monitoring of these 5 OWSs for Jan 2008. IEC to verify during the next visit.
OPEN
4.6.1 June 2007
Environmental Emissions
Management Plan
An air emissions register is maintained and stack emission ports have been installed at the CMT and Pump Stations, however data reporting is inconsistent.
I Ensure that consistent and complete stack emission monitoring is undertaken at all emission sources on a regularly scheduled based, compliant with the Operations ESAP EEMP. BTC should provide evidence that non-compliant stack emissions have been brought into compliance.
Emissions monitoring register was developed by BTC; shared with BIL to be replaced by the old one used at facilities. Monitoring of stacks is being done in accordance with the ESAP EEMP. The results are generally in compliance. The non-compliant results are being addressed through maintenance. Dokay scheduled the next monitoring of the non-compliant engines for April 2008. IEC to verify during the next visit.
OPEN
4.7.1 June 2007
Reinstatement No measurable work has been initiated for temporary erosion control at the construction camp locations, especially at locations where a visual impact is apparent
I Review the implementation of temporary erosion control measures for those construction camps that will continue to be used during Operations, or transferred to other contractors.
Management of all reinstatement work at the camps will form part of normal operations activity.
CLOSED

BTC Pipeline Project
119
Ref. No.
Date of finding
Category Description of Finding Level of Non-Compliance
Recommendation for Improvement Action Taken Closure Status
4.7.1 June 2007
Reinstatement IEC remains concerned that many punch list items are still not closed and this situation is further complicated due to pending conclusion of the warranty period
Rec. BTC should develop a management strategy and action plan to close out remaining punch list items within a specified time period. As IEC will no longer be conducting quarterly audits of the ROW, BTC should also provide a complete photo coverage of the areas in the punch list (especially the karst areas of Lot B) after repairs are complete and final closure has been signed off. IEC observes that the procedure for closure of warranty items is not fully understood by all Project staff and that final dates for closure of all warranty items post Provisional Acceptance are not fully defined. BTC should develop a list of outstanding warranty items, including dates for final closure and handover to BIL.
BTC has provided a document entitled 'Residual Actions List' dated December 2007. This document details all remaining assurance and physical works planned for 2008.
OPEN
1.8.2 June 2007
Reinstatement Given that BIL and STA/PLL/Botaş are also conducting their own ground based biorestoration monitoring programs, there is a need to improve the coordination of monitoring efforts.
Rec. BTC should develop a coordinated biorestoration monitoring plan involving BIL and assist in the development of a centralized ROW monitoring database.
Biorestoration monitoring procedures and results have been provided in report and presentation form to IEC.
CLOSED
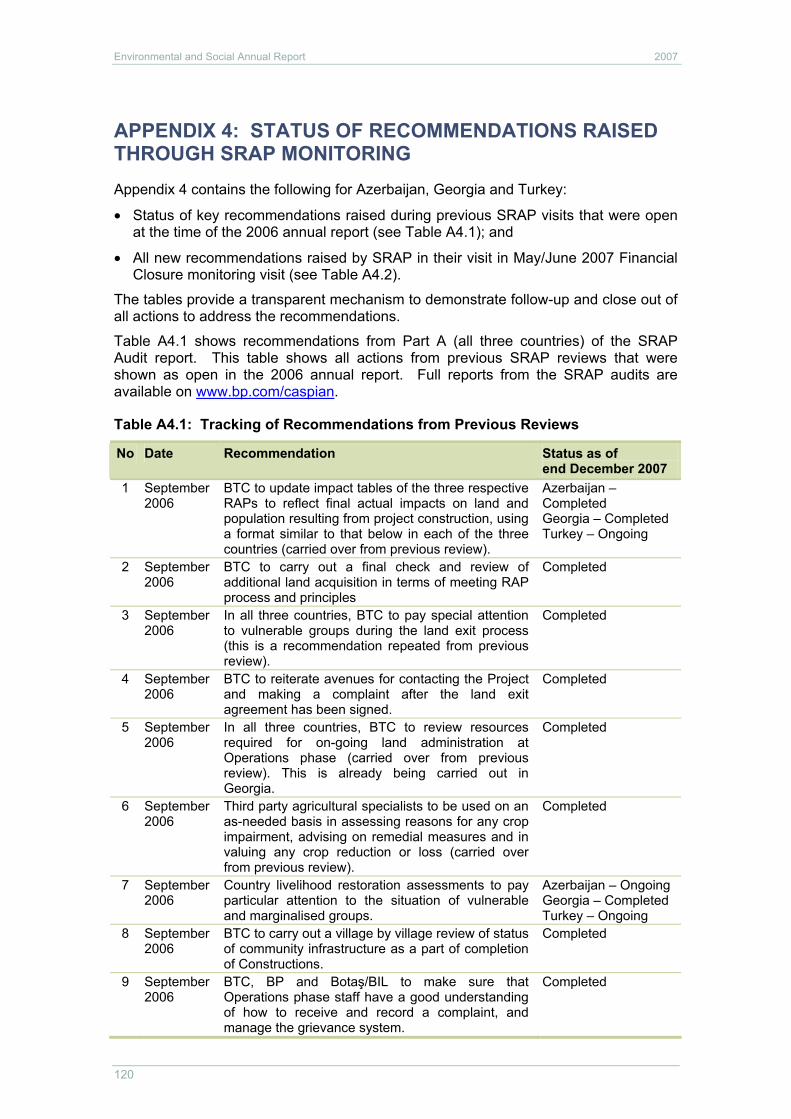
Environmental and Social Annual Report 2007
120
APPENDIX 4: STATUS OF RECOMMENDATIONS RAISED THROUGH SRAP MONITORING Appendix 4 contains the following for Azerbaijan, Georgia and Turkey:
• Status of key recommendations raised during previous SRAP visits that were open at the time of the 2006 annual report (see Table A4.1); and
• All new recommendations raised by SRAP in their visit in May/June 2007 Financial Closure monitoring visit (see Table A4.2).
The tables provide a transparent mechanism to demonstrate follow-up and close out of all actions to address the recommendations.
Table A4.1 shows recommendations from Part A (all three countries) of the SRAP Audit report. This table shows all actions from previous SRAP reviews that were shown as open in the 2006 annual report. Full reports from the SRAP audits are available on www.bp.com/caspian.
Table A4.1: Tracking of Recommendations from Previous Reviews
No Date Recommendation Status as of end December 2007
1 September 2006
BTC to update impact tables of the three respective RAPs to reflect final actual impacts on land and population resulting from project construction, using a format similar to that below in each of the three countries (carried over from previous review).
Azerbaijan – Completed Georgia – Completed Turkey – Ongoing
2 September 2006
BTC to carry out a final check and review of additional land acquisition in terms of meeting RAP process and principles
Completed
3 September 2006
In all three countries, BTC to pay special attention to vulnerable groups during the land exit process (this is a recommendation repeated from previous review).
Completed
4 September 2006
BTC to reiterate avenues for contacting the Project and making a complaint after the land exit agreement has been signed.
Completed
5 September 2006
In all three countries, BTC to review resources required for on-going land administration at Operations phase (carried over from previous review). This is already being carried out in Georgia.
Completed
6 September 2006
Third party agricultural specialists to be used on an as-needed basis in assessing reasons for any crop impairment, advising on remedial measures and in valuing any crop reduction or loss (carried over from previous review).
Completed
7 September 2006
Country livelihood restoration assessments to pay particular attention to the situation of vulnerable and marginalised groups.
Azerbaijan – Ongoing Georgia – Completed Turkey – Ongoing
8 September 2006
BTC to carry out a village by village review of status of community infrastructure as a part of completion of Constructions.
Completed
9 September 2006
BTC, BP and Botaş/BIL to make sure that Operations phase staff have a good understanding of how to receive and record a complaint, and manage the grievance system.
Completed

BTC Pipeline Project
121
No Date Recommendation Status as of end December 2007
10 September 2006
BTC to make stakeholders aware of avenues available to lodge complaints during Operations (carried over from previous review).
Azerbaijan – Ongoing Georgia – Completed Turkey – Ongoing
11 September 2006
BTC, BP to explore avenues for more widely disseminating experience of the CIP.
Azerbaijan – Ongoing Georgia – Completed Turkey – Ongoing
12 September 2006
BTC to identify areas where continued support is needed (health insurance scheme in Azerbaijan for example), and to make provisions in the Operations CIP for such support. (carried over from previous review).
Azerbaijan – Completed Georgia – Completed Turkey – Ongoing
13 September 2006
BTC to undertake a pragmatic social risk assessment for the Operations phase, and to design within the Operations CIP, proactive measures to address identified risks, particularly – but not only – in communities located near permanent installations such as pumping stations and terminals (carried over from previous review).
Completed
14 BTC to develop Operations consultation plans for Georgia and Azerbaijan.
Completed
15 September 2006
BP to provide refresher training to be given to security forces in Georgia and Azerbaijan on conduct along the pipeline as well as general human rights issues.
Completed
16 September 2006
BTC, BP and Botaş/BIL to review over the next few months, adequacy of resources to complete RAP compliance requirements and to address ongoing social program demands.
Completed
17 September 2006
BTC and Botaş to consider mechanisms to retain institutional knowledge developed during Construction Phase so that it is available for Operations Phase.
Turkey – Completed
18 September 2006
BP and BIL to ensure that Operations Phase staff has the right training and skills to carry out village level interactions.
Turkey – Ongoing
19 March 2006 BTC to hold in Azerbaijan and Georgia a formal review of outstanding cases with CLEE and APLR respectively on a six-monthly basis, to monitor the total number of outstanding land compensation cases on a six-monthly basis and get this number approved by CLEE and APLR respectively.
Completed
20 March 2006 In Georgia, BTC to identify landowners in the vicinity of Above-Ground Installations that may have been affected by more significant and permanent land impacts, and to monitor all of them for livelihood restoration.
Georgia – Ongoing
21 March 2006 BTC Project to develop clear and documented procedures to: • Survey & delimit extent of project damaged
roads • Agree reinstatement strategy, roles and
responsibilities (contractor versus government authorities)
Conduct final inspection and community/ authority acceptance.
Azerbaijan- Completed as part of the Land Exit Georgia – Completed Turkey – Completed as part of Land Exit

Environmental and Social Annual Report 2007
122
No Date Recommendation Status as of end December 2007
22 March 2006 BTC Project to take all reasonable measures to ensure that commitments to reinstate project affected roads are delivered in a timely manner, either directly through construction contractors or, through agreements with responsible government authorities.
Completed.
23 March 2006 BTC (all countries) to establish grievance task forces with Contractors to resolve as many grievances as possible before Contractors pull out, to consolidate and reconcile grievance logs (Georgia), to identify and deal with the backlog of grievances left pending by the Contractor, and to plan the roll-over of these into Operations.
Completed.
24 March 2006 BTC to undertake independent final evaluations of the CIP in all three countries.
Completed
25 March 2006 For future CIP extension, BTC to look at procurement approaches that ensure continuity of implementing partners, where appropriate.
Azerbaijan – Completed Georgia – Completed
26 September 2005
Where land exit will not occur by 31 December 2005, project affected people need to be informed as early as possible before the end of the year.
Completed
27 September 2005
The three countries to adopt a common approach on acceptable reinstatement and condition at hand-back of contractor-acquired lands such as pipe dumps, construction camps, borrow areas, access roads and the like.
ROW reinstatement signed off as part of completion audit.
28 September 2005
BTC to ensure that it receives from its contractor’s inventories of all additional land utilized for the project, with clear documentation and record keeping covering lease agreements, condition at time of hand-back and hand-back acceptance by owner/leaseholder.
Completed.
29 September 2005
Annual replicate income-expenditure surveys to be superseded by a one-off income-expenditure survey to be designed and overseen by the SRAP Panel, and conducted as part of the resettlement completion audit.
Ongoing (Action on SRAP)
30 September 2005
All countries to pay particular attention to monitoring livelihood status of households affected by permanent loss of land. Annual income-expenditure surveys recommended.
Azerbaijan – Ongoing Georgia – Ongoing Turkey – Completed
31 September 2005
Construction teams to roll-over grievance logs (including records of grievances yet to be resolved) to the Operations teams, with associated budget provision.
Completed
32 September 2005
To avoid ad hoc or piecemeal development assistance, BP Business Unit to look at designing the CIP strategy within a broader framework such as national poverty strategies (to the extent that these provide clear direction), or within a context of district or sub-district development plans.
Turkey – Ongoing
33 September 2005
BTC to give consideration to adopting a labour standard based on an internationally recognized code or standard, to be applicable to all supply chain contracts with regular monitoring of compliance.
Ongoing
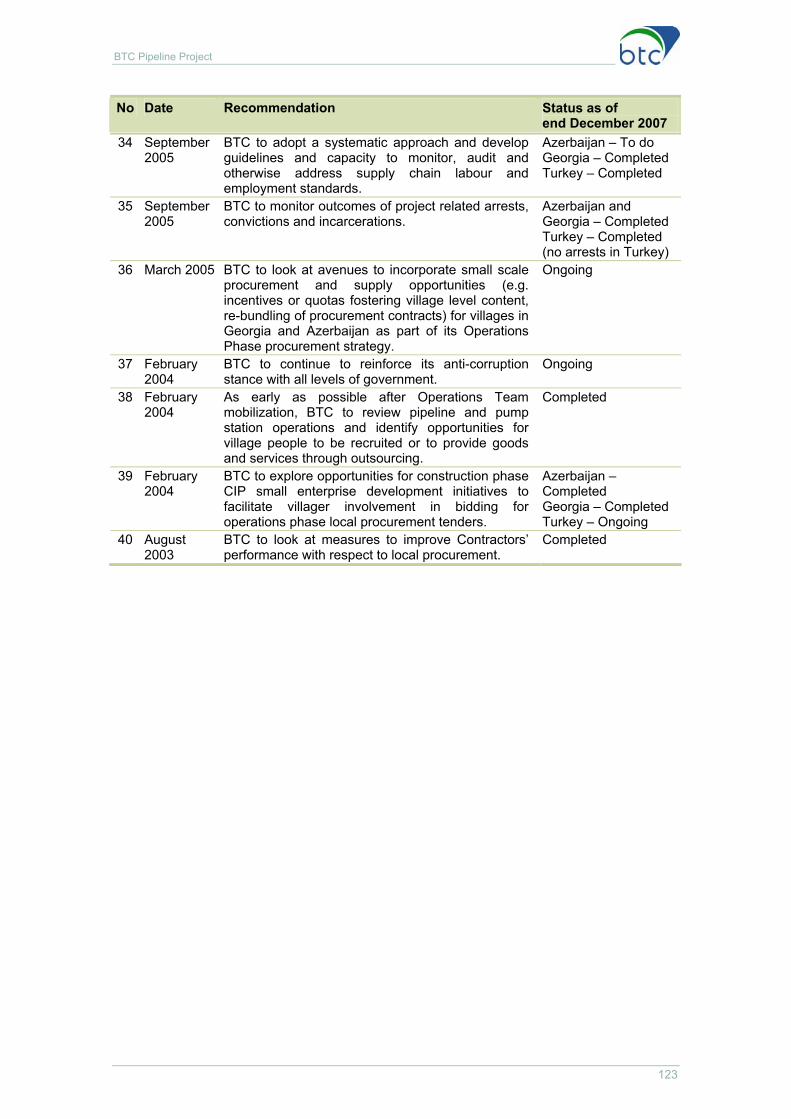
BTC Pipeline Project
123
No Date Recommendation Status as of end December 2007
34 September 2005
BTC to adopt a systematic approach and develop guidelines and capacity to monitor, audit and otherwise address supply chain labour and employment standards.
Azerbaijan – To do Georgia – Completed Turkey – Completed
35 September 2005
BTC to monitor outcomes of project related arrests, convictions and incarcerations.
Azerbaijan and Georgia – Completed Turkey – Completed (no arrests in Turkey)
36 March 2005 BTC to look at avenues to incorporate small scale procurement and supply opportunities (e.g. incentives or quotas fostering village level content, re-bundling of procurement contracts) for villages in Georgia and Azerbaijan as part of its Operations Phase procurement strategy.
Ongoing
37 February 2004
BTC to continue to reinforce its anti-corruption stance with all levels of government.
Ongoing
38 February 2004
As early as possible after Operations Team mobilization, BTC to review pipeline and pump station operations and identify opportunities for village people to be recruited or to provide goods and services through outsourcing.
Completed
39 February 2004
BTC to explore opportunities for construction phase CIP small enterprise development initiatives to facilitate villager involvement in bidding for operations phase local procurement tenders.
Azerbaijan – Completed Georgia – Completed Turkey – Ongoing
40 August 2003
BTC to look at measures to improve Contractors’ performance with respect to local procurement.
Completed

Environmental and Social Annual Report 2007
124
Table A4.2: Recommendations of the May/June 2007 Review Key recommendations arising from the May/June 2007 SRAP review of the BTC project are tabulated below. Recommendations are prioritised as follows:
High Actions that are critical to ensure compliance with commitments contained in the RAP, ESAP or World Bank OD 4.30
Medium Actions desirable to comply with social or resettlement good practice or to address actual or potential areas of social risk
Low Important actions that are less time critical Issue Project Principles Performance Recommendation By Priority LAND ACQUISITION
a. BTC to update impact tables of the three respective RAPs to reflect final actual impacts on land and population resulting from project construction, using a format similar to that below in each of the three countries (carried over from previous review).- Ongoing
BTC
b. BTC to update tabulations of project affected landowners and users experiencing permanent loss of land and for each affected owner/user, to define the extent of those losses relative to his or her total landholding. - Ongoing
BTC
c. SRAP Panel to provide a cross country framework for livelihood restoration surveys to assure a level of consistency in approach.
SRAP Panel
d. BTC to undertake a survey of households affected by permanent loss of land in 2008 to verify whether or not each household has been able to restore its income. In the case of Georgia, a strategy should at least be in place by 2008 for doing this. - Ongoing
BTC/ BP
e. BTC to consider additional livelihood restoration measures for permanent land losers if the survey above establishes that livelihoods are not adequately restored. - Ongoing
BTC/ BP
Land hand back and restrictions of use
Land to be reinstated to original condition. Land use restrictions to be applied to the pipeline corridor to ensure integrity of pipeline and for public safety
All three countries have fully developed information material. Special care needs to be taken to ensure that all groups are fully informed.
f. In all three countries, BTC to develop action plans to address/manage situations in which the landowner refuses to sign the land hand-back agreements. – Completed
BTC
Medium

BTC Pipeline Project
125
Issue Project Principles Performance Recommendation By Priority g. In all three countries, BTC to develop a management plan
that will ensure that land acquisition in Operations phase is also carried out following World Bank Group OD 4.30 principles. Ongoing
BTC
LIVELIHOOD RESTORATION The need to restore lively-hoods of project affected people.
To restore livelihoods of project affected households to at least pre-project levels.
Quality of reinstatement can only be fully assessed after the first harvest post-reinstatement.
a. Country livelihood restoration assessments to pay particular attention to the situation of vulnerable and marginalized groups. – Ongoing
BTC/ BP High
COMMUNITY INVESTMENT PROGRAMME a. BTC to identify areas where continued support is needed
(health insurance scheme in Azerbaijan for example), and to make provisions in the Operations CIP for such support. (Carried over from previous review). - Completed
b. Regular checks to be made on CIP I infrastructure to ensure that they are being properly managed and maintained. - Ongoing
CIP transfer to Operations Phase
Provide benefit sharing opportunities for project affected communities
The CIP needs to be maintained beyond construction for benefits to communities to become sustainable.
c. BTC to undertake a pragmatic social risk assessment for the Operations phase, and to design within the Operations CIP, proactive measures to address identified risks, particularly – but not only – in communities located near permanent installations such as pumping stations and terminals (carried over from previous review) - Ongoing
BTC Low
SECURITY OF PIPELINE Security Reputation risk
management Complaints received in Azerbaijan and Georgia regarding interaction between community and security forces.
a. BTC /BP to provide training to security force patrol staff in Georgia and Azerbaijan on conduct along the pipeline as well as general human rights issues. - Completed
BTC, BP, Botaş, BIL
Medium

Environmental and Social Annual Report 2007
126
APPENDIX 5: CLOSE OUT STATUS OF ACTIONS RELATED TO ACTIONS AND RECOMMENDATIONS RAISED THROUGH POLARIS MONITORING Appendix 5 contains a summary of Polaris audit findings in relation to Oil Spill Readiness. Polaris Applied Sciences Inc undertook the audit on behalf of the Lenders in June 2007. Table 5.1 below lists the findings in Azerbaijan and Georgia (audited together), and in Turkey and provides a status against the findings as at end 2007.
The Polaris audit identified two levels of findings, issues which ‘require attention’ (RQ) in order to ensure the ESAP and/or HGA requirements are met and issues which should be implemented to ensure that international best practice (BP) is maintained or sustained.
Table A5.1: Recommendations of the May/June 2007 Review for Azerbaijan/Georgia
Ref Number Recommendation for Improvement Status end Dec 2007
RQ – A Development and implementation of an annual completion schedule for review and updates of Oil Spill Response Plans.
COMPLETED
RQ – B Review and completion of Containment Manual revisions.
OPEN
RQ – C Documentation of notifications for spills and exercises.
OPEN
RQ – D Development and implementation of approved strategy to replace MAN trucks.
OPEN
RQ – E Finalization of the cleanup standards report. COMPLETED RQ – F Approved completion of OSR Base for Zone 3
(PSG-1). OPEN
RQ – G Plan and schedule for transboundary exercises.
COMPLETED
RQ – H Implementation of the Wildlife Response Plan and rehabilitation resources and capabilities.
COMPLETED in Azerbaijan On-going in Georgia.
RQ – I Assurances that steps and procedures are in place to ensure continued OSR readiness for personnel and equipment.
OPEN
RQ - J Completion of revised plans and construction at Kodiana.
Plans COMPLETED Construction in progress
BP – A Additional and continued IMT training for BTC managers, including greater participation of IMT support in field, with particular emphasis on Community Liaison Officers (CLOs) and Environmental Unit staff and IMT on-site participation with OSR contractors.
OPEN
BP – B Instructors for training courses must have appropriate level of expertise and approved curriculum and field participation with OSR contractors
COMPLETED
BP – C Approved response strategy plan with implementation schedule for Azerbaijan following OSR workshop in Baku
COMPLETED

BTC Pipeline Project
127
Ref Number Recommendation for Improvement Status end Dec 2007
BP – D Continued field training from GIS with OSR contractors (Briggs and SESI) and coordination with GIS for development of OSR maps.
OPEN
BP – E Inclusion of deployment photos in Containment Manual and high-flow tactics for Georgia.
In progress
BP – F Implement approved schedule and plan for adoption of Georgian OSR strategies workshop for winter operations.
In progress
BP – G Development of in-country waste disposal plan and implementation schedule.
COMPLETED for Georgia In progress for Azerbaijan
Table A4.2: Recommendations of the May/June 2007 Review for Turkey
Ref Number Recommendation for Improvement Status end Dec 2007
RQ - 1 Development and implementation of an annual completion schedule for review and updates of Oil Spill Response Plans.
OPEN: An annual completion schedule has been developed. The Plan will be updated in 2008.
RQ - 2 Development and implementation of update for revision and update of Containment Manuals.
OPEN: Programme for updates completed. Containment manual will be updated in 2008.
RQ - 3 Require Wildlife Response Procedure, training and rehabilitation resource schedule.
OPEN: Training scheduled for 2008. EIP programme established to develop a Wildlife Rehabilitation Centre in the vicinity of CMT. The centre is scheduled to be operative by September 2008. Wildlife Response Procedure will be developed post training.
RQ - 4 Develop schedule for GIS data layers and software to be fully operational.
COMPLETED.
RQ - 5 Determine a programme including a schedule for transfer of all relevant documents to BIL.
COMPLETED.
RQ - 6 Require a programme for the completion and finalisation of the Oil Spill Clean-up standards Report.
COMPLETED.
RQ - 7 Develop a plan and schedule for field exercises to demonstrate the feasibility and adequacy of transboundary response operations and equipment transfers. Require a tabletop exercise to demonstrate proficient management interactions.
COMPLETED.
RQ - 8 Define the process by which the Project will monitor and maintain IMT and Oil Spill Response Contractor readiness.
COMPLETED.

Environmental and Social Annual Report 2007
128
Ref Number Recommendation for Improvement Status end Dec 2007
RQ - 9 Plan and schedule to comply with new Turkish regulation relating to Risk Assessment of Onshore Facilities.
OPEN: Awaiting clarifications re: requirements of updated law.
BP1 Develop an IMT training and refresher training programme.
COMPLETED.
BP2 Develop a vehicle replacement plan for MAN trucks or that leased vehicles can be ready within timeframe required by OSRP.
OPEN: Consideration of replacement of trucks on-going.
BP3 Training in and update of Oil Spill Trajectory Model.
OPEN: Training to be undertaken in 2008.
BP4 Completion of Communications Study with a timeline for implementation of recommended actions.
OPEN: To be completed in 2008.
BP5 Completion of an annual remote area and winter logistic exercise involving external logistics, support services and/or contractors.
COMPLETED.
BP6 Development and implementation of appropriate strategy to encourage mandatory boom deployment during loading.
COMPLETED

Post-excavation activities relating to sorting, analysing reporting and conserving artefacts continued during 2007.
The Azerbaijan Institute of Archaeology and Ethnography (IoAE) together with the international archaeologists have been working on reporting, logging and laboratory work related to artefacts unearthed along the BTC/SCP route in Azerbaijan. As part of the conservation programme a conservation laboratory was set up for use by IoAE. About 21 archaeological objects excavated during the BTC/SCP construction underwent special conservation treatment. An American conservator provided a monthly, on-job training for the IoAE staff. Topics included basic archaeological conservation techniques, procedures and ethics.
In a related initiative discussions are underway with the World renown Smithsonian Institution concerning a BTC/SCP Cultural Heritage public outreach and capacity building programme for the Gobustan National State Reserve and Azerbaijan Institute of Archaeology and Ethnography. Expected benefits outcomes are:
Technical reports and analyses of BTC/SCP archaeological findings.
Publication of a book and development of a website describing the archaeological sites and artefacts discovered in the three countries along BTC/SCP pipelines route.
Organisation of an International conference to give the archaeologists involved in the BTC/SCP project, experts from the three Host countries, the USA, and possibly elsewhere, the opportunity to review and discuss the BTC/SCP findings in a manner consistent with international practice.
Training of personnel from the Gobustan National State Reserve, Azerbaijan Institute of Archaeology and Georgia National Museum through internships provided by Smithsonian Institution. Training topics are expected to include: museum management; artefacts management and rock arts damage assessment; documentation and registration of monuments; storage and protection of materials; application of computer technologies; management of collections of scientific, literary and historical value; exhibitions management; and sustainable tourism development.
Flora and fauna survey of Gobustan National State Reserve, in cooperation with Azerbaijan local institutions. A flora and fauna register will be developed.
CASE STUDY 1
SUPPORTING CULTURAL HERITAGE AWARENESS AND CONSERVATION, AZERBAIJAN
Samples of the BTC/SCP archaeological findings
after conservation treatment


The most important mitigation of environmental impacts on a pipeline project is arguably successful reinstatement and biorestoration of the project footprint. Biorestoration is important for restoration of habitat, landscape, drainage patterns and for the prevention of soil erosion. Done well, land is restored to its pre-construction state and the project footprint is barely noticeable. Done badly, it remains a landscape scar with a lasting impact on communities, the environment and company reputation, as well as posing a potential threat to pipeline integrity.
The BTC pipeline project team recognised the importance of biorestoration and established ambitious targets for revegetation (and biodiversity) during the environmental and social impact process. The target of 70% revegetation cover after one year played a large role in motivating the construction teams to safeguard topsoil through good management practises. The post-construction challenge was balance pragmatism and science to monitor the revegetation performance of the 1780 km of reinstated pipeline corridor.
Satellite imagery is now being used to monitor vegetation re-growth along the Right of Way (Figure 1). The results are then been used in combination with a Geographical Information System to identify areas of high risk of erosion and importantly, where on-the-ground intervention is necessary (Figures 2, 3 & 4).
This combination of satellite and information technology, along with ground back-up is proving to be an accurate and cost effective method of meeting a fundamental project commitment of restoring the environment, as well as enhancing the long term integrity of the pipeline.
Figure 1: Vegetation Re-growth Trend: The change in vegetation cover in Lot B from 2006 to 2007. The graph shows that, for example, for about a fifth (18%) of the area covered by the Lot B the amount of
vegetation cover has increased from between 20 and 30% over the period 2006/7. Conversely, vegetation cover over 6% of the Lot B ROW has decreased from between 0 and 10%.
0 0 0 1 1
56
15
2018
10 11
6
3 20 0
2
0
5
10
15
20
25
30
%
0 0 0
(-100
) –(-9
0)
(-90)
–(-8
0)
(-80)
–(-7
0)
(-70)
–(-6
0)
(-60)
–(-5
0)
(-50)
–(-4
0)
(-40)
–(-3
0)
(-30)
–(-2
0)
(-20)
–(-1
0)
(-10)
-0
0 –
10
10 –
20
20 -
30
30 -
40
50 -
60
60 -
70
70 -
80
80 -
90
90 -
100
> 10
0
40 -
50
CASE STUDY 2
MONITORING BIORESTORATION AND EROSION RISK, AZERBAIJAN, GEORGIA & TURKEY

Figure 2: Erosion Performance, 2007. (Class 1: very slight; Class 2: slight; Class 3: moderate;
Class 4: high; Class 5: severe; Class 6: very severe; Class 7: catastrophic)
0
10
20
30
40
50
60
70
80
90
100
Class 1 Class 2 Class 3 Class 4 Class 5 Class 6 Class 7
% A
rea
1511
18
3 2 0
51
Figure 3: Intervention Matrix. The matrix shows how erosion risk and vegetation regrowth trends are used
to determine the most appropriate level of intervention, where L=Class 1-3, M=Class 4-5, H=6-7; C= receding vegetation cover, B = static vegetation cover, A= increasing vegetation cover).
Vegetation Cover Performance
Eros
ion
Ris
k
PromptIntervention(same year)
C B A
H
M
L
Field assessment,active monitoring and intervene if necessary
Field assessment,active monitoring and intervene if necessary
Intervene if trend does not improve in
next monitoring round
No interventionIntervene if trend
does not improve in next monitoring round
No intervention
No intervention
Intervene if trend does not improve in
next monitoring round
CASE STUDY 2 (continued)
MONITORING BIORESTORATION AND EROSION RISK BY SATELLITE

Figure 4: Re-growth Trend, Erosion Performance and Intervention, Lot A. The first caption of the figure shows the change in vegetation growth from the previous year (as per Figure 1).
The second caption shows erosion class for 2007 (as per Figure 2). The third caption shows different levels of intervention based on Figure 3.
CASE STUDY 2 (continued)
MONITORING BIORESTORATION AND EROSION RISK BY SATELLITE


It is a well-known fact that some of the remote communities in Azerbaijan still experience difficulties with gas and hot water supplies. For people living in those areas they remain an eternal and almost unrealizable dream.
As part of the alternative energy, safety and environment programme which consists of 13 pilot micro-projects, BP has conducted a project that helped to realize dreams of people from one of such communities in Goranboy region. A total of 12 solar water heaters and a biogas unit with a solar panel were installed in Eyvazlilar community farm. This farm was considered to be ideal for the project as it accommodates about 50 people and supports about 100 cattle.
With the help of the project the Eyvazlilar farmers have access to hot water and can cook on an environmentally friendly BIOgas. “In the farm, we have always been in need of hot water and gas for our daily activities. These problems were really
disturbing for a long time. To get hot water, we used electricity and firewood, which resulted in huge energy expenses. We were dreaming of such an energy source which could be obtained in an environmentally friendly way and at the same time utilizing the locally available resources. Yes, that was our long-standing dream. Now we can say that the project was a success both for our health and comfort” – says Yahya Mamedov, member of Eyvazlilar community.
CASE STUDY 3
GIVING GAS AND HOT WATER TO EYVAZLILAR COMMUNITY, AZERBAIJAN
Solar batteries for the water heater in Eyvazlar farm
Water tank for hot water Biogaz unit with solar panel


In 2006, CARE International in the Caucasus was awarded a grant from BP and its partners to continue a CIP project for a three-year period in 77 rural communities along BTC/SCP pipeline.
An important component of the CIP is working with youth and education and in support of this endeavour, the programme aims to help school Boards of Trustees (BoT) improve their managerial / administrative skills and assist them in upgrading school infrastructure.
Marneuli School #6, located in the Kvemo-Kartli region of Georgia, was identified as one that met the programme’s eligibility criteria. Just under a thousand children attend this school, most of them ethnic Azeri. The CIP has stepped into the school by providing training to BoTs and offering them a school rehabilitation grant.
The major priority for the school BoT was to rehabilitate the assembly hall. The grant amount was around $12,000. In addition to this amount, the school contributed 27%, including both labour and cash. As a result of the project, the assembly hall was rehabilitated and equipped (furniture, TV, music centre, etc.).
During the interviews with the members of the school BoT, teacher Lia Chikhashvili noted that Georgian and Azeri students were working side by side during the project: “students were helping each other and doing the job with great enthusiasm; this finally brought about a successful project”. The project has attracted additional funding from the Sakrebulo district, in the form of a 5000 GEL. This has enabled corridor/entrance to the assembly hall to be rehabilitated. “The grant received from CIP, influenced the decision of the local municipality to co-fund the project”, noted Sonia Kupatadze, teacher of physics and mathematics.
In June, Azeri and Georgian students were celebrating their 2007 graduation ceremony at the new assembly hall: “We did our best to put in all efforts and finish the project before the graduation day, which was the first event at the new place. It looked very impressive”, said Sonia Kupatadze.
Lia Chikhashvili expressed her opinion on the benefits of the
school project: “Now I can work on theatre performances. I discussed this opportunity with my students, and they got very excited and started discussing themes for the upcoming play”.
As part of the benefit package delivered to each target school in Kvemo-Kartli, members of the BoT were introduced to conflict sensitivity training by Partners-Georgia. “After the training I have learned very important and practical tools on how on to communicate with my students and colleagues to prevent conflict and build good relations with them”. Among the series of trainings provided to members of BoTs, were project writing/proposal development, procurement and financial handling of grants, etc.
Izolda Kupatadze, Dean of the school: “Our teachers gained project writing skills and are more motivated to seek additional funding as well as implement various types of school projects. Being involved in school rehabilitation was a significant experience for our teachers. I think there is still much to be done at our school. With CIP, we have gained trust among students, their parents and now it will become easier for us to work on new opportunities and attract funds for such purposes.”
CASE STUDY 4
HELPING TO BUILD A BETTER FUTURE: INFRASTRUCTURE REDEVELOPMENT, GEORGIA


One feature of the CIP is its work on providing new opportunities to farmers along BTC and SCP pipelines, for example in Samtskhe-Javakheti and Kvemo-Kartli regions of Georgia. CARE International, on of the CIP Implementing Partners, believes that one of the most effective methods to spread new agricultural technologies among farmers is through on-farm demonstrations. Accordingly the CIP has supported the development of around 100 demo-farms, involving up to 500 farmers throughout the target area.
One such farm is run by Almaz Abasov’s and his family in the Gardabani district. Almaz lives together with his wife, son, daughter in law and grandchildren in Nazarlo village, a village that is famous for vegetable growing and cattle breeding. The only source of income for the family is their farm, as is the case for most ethnic Azeri households in Nazarlo.
Almaz owns a 0.15ha greenhouse, where he grows tomatoes and cucumbers. Before the project, Almaz was not using sufficient agricultural inputs and the land was suffering from various agricultural diseases. Due to lack of inputs, vegetables were hardly surviving and the only source of income for the family was disappearing in front of their eyes.
“The project stepped into our family at the right moment. Agricultural specialists studied the problem and provided us with all necessary inputs and recommendations to survive the upcoming harvest”, noted Almaz.
Almaz has already started selling some tomatoes and cucumbers at the market. The major markets for households in Nazarlo village are Gardabani and Tbilisi. The family sold around 75 kg tomatoes for 80 Tetri per kg and around 200 kg of cucumbers for 70 Tetri per kg. As Almaz says, this year they will receive around 1.2 tons of tomatoes and around 1 ton of cucumbers.
“CIP has also provided us with 12.5 kg of hybrid corn, which we have planted on 0.2 hectares of land. During the harvest we should receive around 1.5 tons of maize. Market price for hybrid maize varies between 45 – 60 Tetri per kg. Nearly half of our harvest will be used for feeding our cows and the other half we will sell on the market”, says Almaz.
One of the requests the project has of demo-farmers is to spread the knowledge and skills they have gained from the project among their neighbours, friends and relatives. During the theoretical and practical training provided by CIP agricultural specialists, Almaz called on his neighbours to participate and get familiar with the new methods and technologies.
After seeing the result of new technologies on Almaz’s farm, neighbours are often asking him for advice and try to replicate the models that will bring benefit to their farms. “For many years I was saving money by not buying different types of inputs for my farm as they are quite expensive. However, this year I could have lost everything if I had not used them. Now I believe that by saving money on your farm you are putting at risk all your efforts and you may lose the whole harvest”, says Almaz.
The project believes that people like Almaz can help replace traditional agricultural practices with modern/widely used technologies to enable economic development of their communities.
CASE STUDY 5
SECURING INCOME FROM AGRICULTURAL PRODUCTION, GEORGIA


![BTC FORMBTC FORM –––– 1111 - Finance Departmentfinance.bih.nic.in/Documents/BTC-2011-Forms.pdfBihar Treasury Code – 2011 1 BTC FORMBTC FORM –––– 1111 [See Rule 10]](https://img.pdfslide.us/doc/110x75/5aabc1ef7f8b9aa06a8c49b2/btc-formbtc-form-1111-finance-treasury-code-2011-1-btc-formbtc.jpg)