Embed Size (px)
Citation preview
BT Group plc
Acquisition of EE 5 February 2015

© British Telecommunications plc
Forward-looking statements caution This presentation contains (or may contain) statements that are, or may be deemed to be, “forward-looking statements”, including within the meaning of Section 27A of the Securities Act and Section 21E of the U.S. Securities Exchange Act of 1934, as amended. Forward-looking statements are based on current expectations and projections about future events and other matters that are not historical fact. These forward-looking statements are sometimes identified by the use of a date in the future or forward-looking terminology, including, but not limited to, the words “aim”, “anticipate”, “believe”, “intend”, “plan” “estimate”, “expect”, “may”, “target”, “project”, “will”, “could” or “should” or, in each case, their negative or other variations or words of similar meaning. These forward-looking statements include matters that are not historical facts and include statements that reflect the directors’ intentions, beliefs and current expectations. By their nature, forward-looking statements involve risks and uncertainties because they relate to events and depend on circumstances that may or may not occur in the future or are beyond BT's control. They are not guarantees of future performance and are based on one or more assumptions.
Forward-looking statements appear in a number of places throughout this presentation and include statements regarding the intentions, beliefs or current expectations of BT concerning, without limitation: current and future years’ outlook; revenue and revenue trends; EBITDA; free cash flow and operating free cash flow; capital expenditure; shareholder returns including progressive dividends; net debt; credit ratings; investment in and rollout of BT's fibre network, and its reach, innovations, increased speeds and speed availability; BT's broadband-based service and strategy; BT's investment in TV; growth opportunities in networked IT services; the pay-TV services market, broadband, and mobility and future voice; enhancing BT's TV service; growth of, and opportunities available in, the communications industry and BT's positioning to take advantage of those opportunities; expectations regarding competition, market shares, prices and growth; expectations regarding the convergence of technologies; plans for the launch of new products and services; network performance and quality; the impact of regulatory initiatives, decisions and outcomes on operations; BT’s possible or assumed future results of operations and/or those of its associates and joint ventures; investment plans; adequacy of capital; financing plans and refinancing requirements; demand for and access to broadband and the promotion of broadband by third-party service providers; anticipated financial and other benefits and synergies resulting from the proposed acquisition of EE (the "Acquisition”), including revenue, operating cost and capital expenditure synergies; and BT’s plans and objectives following the Acquisition.
Statements contained in this presentation regarding past trends or activities should not be taken as a representation that such trends or activities will continue in the future. Any forward-looking statements in this presentation reflect BT's view with respect to future events as at the date of this presentation and are subject to risks relating to future events and other risks, uncertainties and assumptions relating to the conditions to the Acquisition being satisfied, including regulatory approval of the Acquisition, increased leverage as a result of the Acquisition, BT’s ability to integrate the businesses and retention of key personnel, the successful realisation of the anticipated synergies and strategic benefits and an adequate return on its investment from the Acquisition, consumer behaviour, the increased regulatory burden facing the Enlarged Group, maintenance of EE's performance and momentum in its business during the period prior to Acquisition and throughout integration and BT’s operations, result of operations, financial condition, growth, strategy, liquidity and the industry in which BT operates, and the other risk factors highlighted in BT’s 2014 Annual Report and risks associated with mobile network operations, as detailed in EE's EMTN prospectus dated 28 March 2014. No assurances can be given that the forward-looking statements in this presentation will be realised. BT’s actual performance, results of operations, internal rate of return, financial condition, distributions to shareholders, the development of its financing strategies and the results or eventual success of the Acquisition may differ materially from the impression created by the forward-looking statements contained in this presentation. In addition, even if BT’s actual performance, results of operations, financial condition, distributions to shareholders and results of the Acquisition are consistent with the forward-looking statements contained in this presentation, those results or developments may not be indicative of results or developments in subsequent periods.
2

© British Telecommunications plc
BT Group plc
Gavin Patterson, Chief Executive

© British Telecommunications plc
Our purpose, goal, strategy and culture
Broaden and deepen our customer relationships
Fibre TV and content
Mobility and
future voice
UK business markets
Leading global
companies
Our strategy
A growing BT: to deliver sustainable profitable revenue growth
Invest for growth
Our goal
A healthy organisation
Deliver superior customer service
Transform our costs
Our purpose To use the power of communications to make a better world
Our culture
4

© British Telecommunications plc
5
Acquisition of a highly attractive business
1 Amount payable to Deutsche Telekom (DT) and Orange will be net of EE Net Debt at deal completion
Creation of the UK’s leading communications provider 100% of EE to be acquired for an Enterprise Value of £12.5bn1
Meeting customer demand for compelling Fixed- Mobile Converged products
Greater scale from combining fixed and mobile market leaders
The UK mobile market leader – No.1 for revenue, with 31m customers, of which 24.5m are direct mobile customers
The UK’s most advanced 4G network, with market-leading network performance
Highly complementary assets
Little overlap, so significant cross-sell opportunity
Combining leading 4G network with UK’s largest superfast fixed network
European markets show strong penetration of FMC offerings
BT will be better equipped to offer FMC services
1
2
3
Transaction overview

© British Telecommunications plc
Transaction overview
6
Creating value and unlocking significant synergies
Accretive to FCF per share in the first full year post completion
Significant cost savings with potential for material revenue synergies
– c.£3.0bn opex & capex synergy NPV and c.£1.6bn revenue synergy NPV
Attractive valuation of 6.0x EBITDA and 9.6x opFCF2
5
Creation of the UK’s leading communications provider 100% of EE to be acquired for an Enterprise Value of £12.5bn1
1 Amount payable to Deutsche Telekom (DT) and Orange will be net of EE Net Debt at deal completion 2 Calculated using EV of £12.5bn less £3.0bn NPV of cost synergies post integration costs. Based on EE’s financial data for the 12 months to 31 December 2014.
EBITDA is EE’s Adjusted EBITDA; opFCF is Adjusted EBITDA less capex
4 Accelerating BT’s mobile strategy and gaining owner economics in mobile
Owner economics provide greater control over product and investment roadmap and more upside from volume growth
Transaction allows BT to meet customer demand quickly

© British Telecommunications plc
Transaction financing
Equity placing constituting c.3% of BT’s share capital
– to be launched in due course Financing1 c.£1.0bn
c.£6.8bn
7
c.£2.4bn
New BT shares issued at closing – 12% of enlarged group to DT, 4% to Orange
– cap and collar price protection in place at closing – cash component to be adjusted to offset maximum +/-4%
movement versus agreed BT share price (411.5p)
– no further cash adjustment for movement above/below 4%
Existing cash and net new debt financing
EE Net Debt2 c.£2.3bn
Total Enterprise Value £12.5bn
1 Illustrative, calculated using BT’s closing share price on 4 February 2015 2 EE net debt as at 31 December 2014, adjusted for other debt-like items

© British Telecommunications plc
Transaction detail
As a Class 1 transaction, shareholder approval will be required at an EGM
Shareholders will also need to approve BT’s right of first offer
Shareholder approval
Standstill period – for a 3 year period, DT unable to increase its stake above 15%1; Orange unable to go
above 4%
Lock-up period – DT and Orange unable to sell down for 18 months and 12 months, respectively – Orange is permitted to sell its BT shares to DT at any time, subject to DT’s 15%
standstill restriction
– off-market sales will be permitted in certain circumstances but BT will have a right of first offer
Share conditions
8
DT representative to join BT board as non-executive director on completion
– appropriate compliance procedures to manage potential conflicts of interest
Relationship agreement
1 During the standstill DT can increase its holding from 12% to 15% only by buying some of Orange’s shares in BT

© British Telecommunications plc
EE – the UK mobile market leader
No.1 for UK mobile revenue1
36%
29%
26%
9%
EE O2 Vodafone 3
9
m
>30m UK mobile customers3
£6.3bn total revenue2
£5.6bn mobile service revenue2
24.5m direct mobile customers
c.15m customers on postpay plans, up 4% YoY – 6x higher ARPU than prepaid
Postpay churn4 at 1.2%
0
10
20
30
Postpay mobile Prepay mobile
Machine-to-Machine MVNO
1
1 Source: Analysys Mason, total service revenue for calendar H1 2014 2 Year to 31 December 2014
3 Source: EE company reporting, at 31 December 2014 4 Excluding Machine-to-Machine, MVNO, at 31 December 2014

© British Telecommunications plc
EE – encouraging trends1
10
Strong growth in postpaid base
m k
Stable ARPU Growing EBITDA2
£/m
on
th
£m
2014 2013 2012 2011
2014 2013 2012 2011
2014 2013 2012 2011
2014 2013 2012 2011
1
1 Source: Company reporting, calendar years 2 Rolling 12-month adjusted EBITDA
A growing fixed broadband base
0
5
10
15
Q1 Q2 Q3 Q4 Q1 Q2 Q3 Q4 Q1 Q2 Q3 Q4 Q1 Q2 Q3 Q4
10
12
14
16
18
20
Q1 Q2 Q3 Q4 Q1 Q2 Q3 Q4 Q1 Q2 Q3 Q4 Q1 Q2 Q3 Q4
600
650
700
750
800
850
Q1 Q2 Q3 Q4 Q1 Q2 Q3 Q4 Q1 Q2 Q3 Q4 Q1 Q2 Q3 Q4
1000110012001300140015001600
H1 H2 H1 H2 H1 H2 H1 H2

© British Telecommunications plc
No.1 for network performance
EE – strong network coverage and performance
No.1 for 4G coverage1
RootMetrics overall performance winner in H1 20142
49% 48% 48%
0%
10%
20%
30%
40%
50%
60%
70%
80%
90%
EE O2 Vodafone 3
>80%
88
84
79 78
70
75
80
85
90
EE 3 O2 Vodafone
11
>48 million people covered by EE 4G network
– 510 major towns and cities
– almost 4,000 villages
7.7 million 4G subscribers
Named No.1 for UK-wide call performance by Ofcom
Strong spectrum position with 105MHz paired spectrum
Ove
rall
per
form
ance
sco
re
1
1 Latest figures, as reported by companies. EE as at Jan 2015; O2 as at Sep 2014; Vodafone as at Sep 2014; 3 as at Dec 2014. Note: EE 4G coverage at Sep 2014 was >75%
2 RootMetrics® award ranking based on RootMetrics 1H 2014 UK RootScore Report for mobile performance as tested on best available plans and devices on 4 mobile networks across all available network types (January – June 2014). The RootMetrics award is not an endorsement of EE. Your results may vary. See rootmetrics.co.uk for details.
© British Telecommunications plc
Position
Mobile market share1
Broadband market share1
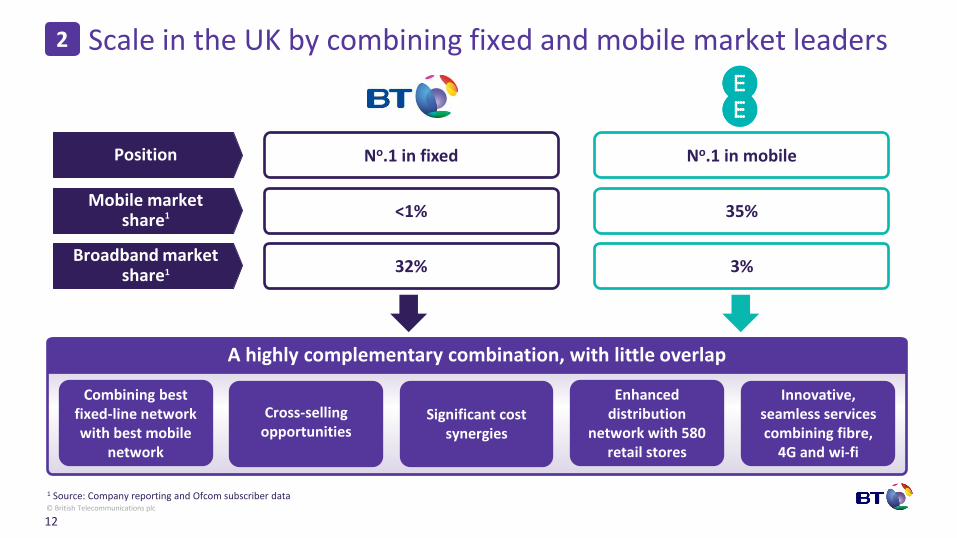
Scale in the UK by combining fixed and mobile market leaders
No.1 in mobile
35%
3%
No.1 in fixed
<1%
32%
12
Innovative,
seamless services combining fibre,
4G and wi-fi
Cross-selling opportunities
Significant cost synergies
A highly complementary combination, with little overlap
Combining best fixed-line network with best mobile
network
1 Source: Company reporting and Ofcom subscriber data
2
Enhanced distribution
network with 580 retail stores

© British Telecommunications plc
Meeting customer demand for FMC products
13
FMC customers as % of broadband customers/households1
European examples show strong penetration of FMC offerings
Move from voice to data has blurred lines between fixed and mobile propositions
– tablets/phablets/smartphones used for both home broadband and on the move
– >200m iPads sold worldwide since launch in 2010
Some European telcos have signed up more than half of their broadband customers to mobile offers
Currently consumer FMC propositions are only offered by Virgin Media and TalkTalk in the UK
BT will be better equipped to provide FMC services in the UK, with its own networks
3
0%
10%
20%
30%
40%
50%
60%
70%
KPN Telenet OrangeFrance
Belgacom TelefonicaSpain
1 All figures per latest company report. KPN: Penetration rate calculated as 4P customers as % of "Residential Broadband Customers“; Telenet: percentage of unique customer relationships taking mobile services; Orange France: Orange Open customers excluding Open multi-ligne (multi-sim 4P) as proportion of total broadband customers; Belgacom: percentage of households with a fixed and mobile component; Telefonica: Fusion customers as % of total broadband customers

© British Telecommunications plc
Seamless connectivity to the best fixed and mobile networks
Customers migrate to “All-IP” services
– driven by compelling bundles of voice, broadband, TV and mobility
– by 2025, all customers will be using IP voice
One common access platform
Connected through copper, fibre and mobile
A single, IP core network
– replacing legacy networks and platforms
14
The convenience of mobile with the power of fixed
A clear vision to deliver seamless FMC services 3
Services
Network

© British Telecommunications plc
Accelerating BT’s mobile strategy and gaining owner economics in mobile
15
Transaction allows BT to quickly meet changing customer demands while working towards a consumer launch this financial year
BT gains ‘owner economics’ in mobile:
– more control over future investment and product innovation
– long-term certainty
– higher margins
– reduced exposure to variable data costs
Remain focused on delivering our ‘inside-out’ network over next 18 months
– we still intend to deploy femtocells for best connectivity wherever our customers are
Full ‘inside-out’ network Consumer: working
towards offering services this FY
Business: converged offering launched
Launched with MVNO proposition
Forecast worldwide mobile data traffic growth rates 2011-20181
0
50
100
150
200
2011 2012 2013 2014 2015 2016 2017 2018
Exab
ytes
(1
m t
era
byt
es)
1 Chart created by BT based on Gartner research. Source: Gartner, Inc., Forecast: Mobile Data Traffic, Worldwide, 2011-2018, Jessica Ekholm, January 12 2015
Combined with leading macro network
4

© British Telecommunications plc
BT Group plc
Tony Chanmugam, Group Finance Director

© British Telecommunications plc
Note: BT financial information has been derived from quarterly results releases previously published by BT for the 12 months ended 31 December 2014. BT figures are before specific items. EE financial information has been extracted without adjustment from the result announcement made by EE for the year ended 31 December 2014. The financial information was prepared under IFRS and in accordance with EE’s accounting policies. EE adjusted EBITDA is before management and brand fees payable to its shareholders, one-off items and restructuring costs. 1 Excluding consolidation adjustments and eliminations
Pro-forma financials December 2014 LTM, £bn
17
BT EE Pro-forma BT
Revenue EBITDA
18.0
6.3 24.3
BT EE Pro-forma BT
6.2 1.6 7.7
Capex Operating FCF (EBITDA – capex)
BT EE Pro-forma BT
2.2 0.6 2.8
BT EE Pro-forma BT
4.0
1.0 5.0
+35% +26%
+28% +25%
1 1
1

© British Telecommunications plc
18
Creating value and unlocking significant synergies 5
Creating value
EV/EBITDA 6.0x EBITDA1
FCF per share accretion
1st full year post completion
EPS accretion 2nd full year post
completion2
ROIC>WACC Comfortably in 3rd
full year post completion
Synergies worth NPV of £4.6bn
Commercial IT Network Operational NPV ofoperatingsynergies(opex &capex)
Integrationcosts
Operatingsynergies
postintegration
Revenuesynergies
NPV ofrevenue and
operatingsynergies
c.£0.7bn
c.£0.9bn
c.£0.8bn
c.£1.1bn c.£3.5bn c.£0.5bn
c.£3.0bn
c.£1.6bn c.£4.6bn
EV/opFCF 9.6x opFCF1
1 EV of £12.5bn is adjusted for £3.0bn NPV of cost synergies post integration costs. Based on EE financials for the 12 months to 31 December 2014 2 Based on aggregate financial forecasts for BT and EE including synergies; does not take into account the impacts of any purchase price allocation

© British Telecommunications plc
BT and EE have proven track records in delivering cost transformation – BT’s tried and tested approach has taken c.£5bn costs out of business over last 5 years
– EE delivered post-transaction synergies ahead of initial expectations following Orange/T-Mobile merger
We’ll work closely with EE to – remove duplication
– rationalise and renegotiate 3rd party spend
– consolidate platforms and re-engineer processes
Capex Labour costs incl. contractors Consultancy Supplier renegotiation
Overhead Value Analysis Process re-engineering Right First Time BT-centric
Insourcing Output-based pricing Continuous Improvement
Quick wins Forensic Pan – BT
19
Last 5 years
Creating value and unlocking significant synergies 5

© British Telecommunications plc
Commercial
IT
c.£70m
c.£90m
Opex and capex combined synergies – areas of focus Run rate achieved in fourth full year post completion
Network
Operational
c.£80m
c.£120m
c.£360m total opex and capex synergy run rate achieved in fourth full year post completion c.£3.0bn total NPV of opex and capex synergies
Duplication External spend Platforms & processes
Sales & marketing activities
IT operations & development
Network operations
Head office functions
Insourcing activities from third parties
Procurement efficiencies from economies of scale
Insourcing network elements
Simplifying network estate
Property estate
Digital platforms and brand portfolio
20
Customer support systems
Realising scale economics in customer service
operations
Creating value and unlocking significant synergies 5
© British Telecommunications plc
21
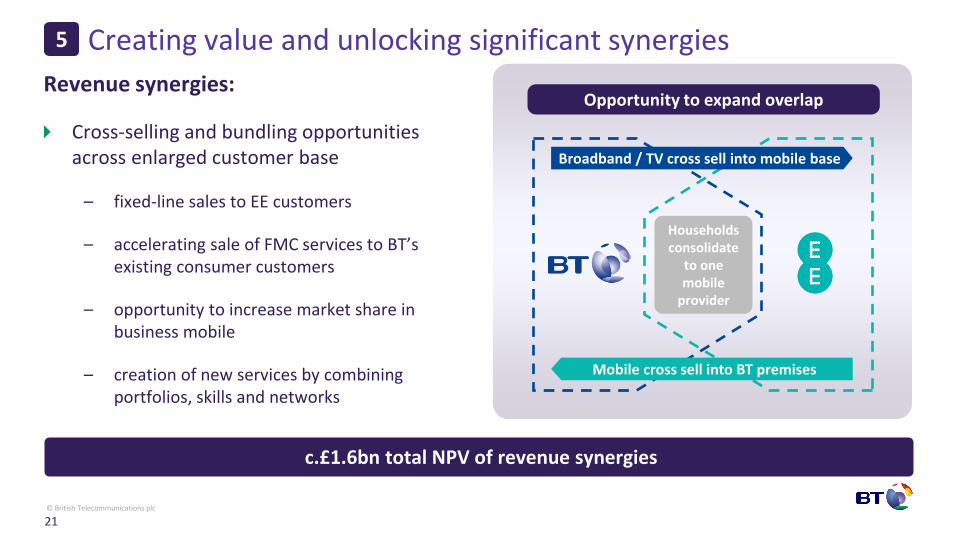
Opportunity to expand overlap
Cross-selling and bundling opportunities across enlarged customer base
– fixed-line sales to EE customers
– accelerating sale of FMC services to BT’s existing consumer customers
– opportunity to increase market share in business mobile
– creation of new services by combining portfolios, skills and networks
Broadband / TV cross sell into mobile base
Mobile cross sell into BT premises
Households consolidate
to one mobile
provider
Revenue synergies:
c.£1.6bn total NPV of revenue synergies
Creating value and unlocking significant synergies 5

© British Telecommunications plc
22
Day 1 organisation (post approvals)
BTC BTB GS W
TSO
EE OR
Focus on smooth operational transition
More in-depth assessment of transformation opportunities
EE to have senior representation on BT Operating Committee
Short term Medium term
Fully integrated operating model taking the best of both organisations
– organised around the customer
– sales and service functions combined
– alignment of marketing teams
Migration of customers onto common systems
Integration project management office to manage overall process
BT board sub-committee will track progress
Begin transition to future operating model
– alignment of corporate functions
– technology function brought together with BT TSO
– joint business sales organisation
Integration:
Total integration costs of c.£0.6bn, NPV of c.£0.5bn
Creating value and unlocking significant synergies 5

© British Telecommunications plc
Net debt at 31Dec 2014
Net new debtfinancing
EE net debt Pro forma posttransaction
net debt
Financial strategy
23
BT net debt at 31 December 2014 of £6.2bn
– c.1.0x EBITDA
– Pro forma net debt c.1.4x EBITDA1
Financing in line with conservative financial policy
Credit rating expected to be at least maintained
– continue to target BBB+/Baa1 credit rating over medium term
c.£10.9bn
Pro forma net debt
£6.2bn
c.£2.4bn
c.£2.3bn
1 Calculated using BT net debt at 31 December 2014, and EE financials for the 12 months to 31 December 2014. EE net debt at 31 December 2014 is adjusted for other debt-like items.
c.1.0x EBITDA
c.1.4x EBITDA

© British Telecommunications plc
Indicative timeline of deal completion
24
5 Feb 2015
Late Mar 2015
Definitive agreement announced
UKLA Class 1 circular published
BT EGM CMA Phase 1 review
Deal completion if approved at
Phase 1
End of 2015/16
Apr 2015
Notice of BT EGM sent
out
CMA Phase 2 review
Deal completion if approved at
Phase 2
Phase 1 approval
More detailed review
End of H1 2015/16

© British Telecommunications plc
BT Group plc
Gavin Patterson, Chief Executive

© British Telecommunications plc
Proposition
Customers
Core asset
Economics
In summary
Always best connected
A relationship with UK individuals, households and businesses
A ‘best of both’ network designed from the bottom up
for data
Owner economics in fixed and mobile
Best of fixed
A relationship with UK households and businesses
A fixed network increasingly talking to personal ‘mobile’ devices
Owner economics in fixed
BT in the UK today BT in the UK tomorrow
26
Deal provides attractive opportunity to generate considerable shareholder value

© British Telecommunications plc
BT Group plc
Q&A

© British Telecommunications plc
BT Group plc
Appendix

© British Telecommunications plc
BT is working with the government to help take fibre to 95% of UK
EE aims to increase 4G coverage to 98% by the end of 2015
BT – c.75% UK fibre coverage EE – leading 4G and 3G coverage
3G coverage
4G coverage
Fibre coverage
29
EE O2
Vodafone
Fibre and 4G coverage
Source: Company data, shows position as at Jan 2015 Source: Ofcom: data as at June 2014, published November 2014. Three not shown as Ofcom omitted data on Three’s 4G coverage from its report

© British Telecommunications plc
Public
Transaction detail1
30
BT
Orange DT
EE
Pre-Transaction structure
100% 50% 50%
Public Orange DT
Transaction structure
Public
Enlarged BT
Orange DT Final ownership structure
4% 12% 84%
Enlarged BT
1. c.£1.0bn equity placing
2. c.£2.4bn net new debt financing
3. New BT shares equivalent to 4% of enlarged company (c.£1.7bn), plus c.£3.4bn cash
3. New BT shares equivalent to 12% of enlarged company (c.£5.1bn)
EE owned equally by Orange and DT
BT 100% owned by public
EE acquired for Enterprise Value of £12.5bn
– c.£10.2bn to be paid to Orange and DT, with EE Net Debt of c.£2.3bn2 taken on by enlarged group
Bridge financing in place at deal announcement
New shares issued to Orange and DT at closing
1 Illustrative, calculated using BT’s closing share price on 4 February 2015 2 EE net debt as at 31 December 2014, adjusted for other debt-like items

© British Telecommunications plc
Next steps
BT Board of Directors will seek shareholders' approval
– subject to UKLA filings, EGM is expected to be held in April
We anticipate that the Transaction would need to be cleared by the Competition and Markets Authority (CMA)
– we do not expect to require clearance from the EC
– we do not require clearance from other UK authorities - Ofcom will advise the CMA
– potentially two stages of CMA review
– Phase 1, which takes c.8 weeks from notification, with a subsequent remedies review if required
– if Transaction not approved at Phase 1, a Phase 2 inquiry would take a further c.24 weeks to complete
Required approvals
31
BT has agreed to pay DT and Orange a break fee of £250m (in aggregate) if the directors: i) fail to seek shareholder approval, ii) fail to recommend the Transaction, or iii) recommend an alternative Transaction
Break fee