Embed Size (px)
Citation preview

www.biosciencetrends.com
BSTBioScience Trends


www.biosciencetrends.com
BioScience Trends is one of a series of peer-reviewed journals of the International Research and Cooperation Association for Bio & Socio-Sciences Advancement (IRCA-BSSA) Group and is published bimonthly by the International Advancement Center for Medicine & Health Research Co., Ltd. (IACMHR Co., Ltd.) and supported by the IRCA-BSSA and Shandong University China-Japan Cooperation Center for Drug Discovery & Screening (SDU-DDSC).
BioScience Trends devotes to publishing the latest and most exciting advances in scientific research. Articles cover fields of life science such as biochemistry, molecular biology, clinical research, public health, medical care system, and social science in order to encourage cooperation and exchange among scientists and clinical researchers.
BioScience Trends publishes Original Articles, Brief Reports, Reviews, Policy Forum articles, Case Reports, News, and Letters on all aspects of the field of life science. All contributions should seek to promote international collaboration.
ISSN: 1881-7815 Online ISSN: 1881-7823
CODEN: BTIRCZIssues/Year: 6
Language: EnglishPublisher: IACMHR Co., Ltd.
Editor-in-Chief:Masatoshi MAKUUCHI Japanese Red Cross Medical Center, Tokyo, Japan
Co-Editors-in-Chief:Xue-Tao CAO Chinese Academy of Medical Sciences, Beijing, ChinaRajendra PRASAD UP Rural Institute of Medical Sciences & Research, Uttar Pradesh, IndiaArthur D. RIGGS Beckman Research Institute of the City of Hope, Duarte, CA, USA
Chief Director & Executive Editor:Wei TANG The University of Tokyo, Tokyo, Japan
Managing Editor:Munehiro NAKATA Tokai University, Hiratsuka, Japan
Senior Editors:Xunjia CHENG Fudan University, Shanghai, ChinaYoko FUJITA-YAMAGUCHI Tokai University, Hiratsuka, JapanNa HEFudan University, Shanghai, ChinaKiyoshi KITAMURA The University of Tokyo, Tokyo, Japan
Misao MATSUSHITA Tokai University, Hiratsuka, JapanTakashi SEKINE The University of Tokyo, Tokyo, JapanYasuhiko SUGAWARA The University of Tokyo, Tokyo, Japan
Web Editor:Yu CHEN The University of Tokyo, Tokyo, Japan
Proofreaders:Curtis BENTLEY Roswell, GA, USAChristopher HOLMES The University of Tokyo, Tokyo, JapanThomas R. LEBON Los Angeles Trade Technical College, Los Angeles, CA, USA
Editorial OfficePearl City Koishikawa 603, 2-4-5 Kasuga, Bunkyo-ku, Tokyo 112-0003, JapanTel: +81-3-5840-8764Fax: +81-3-5840-8765E-mail: [email protected]
Editorial Board
i

www.biosciencetrends.com
Editorial Board Members
Girdhar G. AGARWAL (Lucknow, India)Hirotsugu AIGA(Geneva, Switzerland)Hidechika AKASHI(Tokyo, Japan)Moazzam ALI(Geneva, Switzerland)Ping AO(Shanghai, China)Michael E. BARISH(Duarte, CA, USA)Boon-Huat BAY(Singapore, Singapore)Yasumasa BESSHO(Nara, Japan)Generoso BEVILACQUA(Pisa, Italy)Shiuan CHEN(Duarte, CA, USA)Yuan CHEN(Duarte, CA, USA)Naoshi DOHMAE(Wako, Japan)Zhen FAN (Houston, TX, USA)Ding-Zhi FANG(Chengdu, China)Yoshiharu FUKUDA(Ube, Japan)Rajiv GARG (Lucknow, India)Ravindra K. GARG(Lucknow, India)Makoto GOTO(Tokyo, Japan) Demin HAN(Beijing, China)David M. HELFMAN(Daejeon, Korea)
Takahiro HIGASHI (Tokyo, Japan)De-Xing HOU(Kagoshima, Japan)Sheng-Tao HOU(Ottawa, Canada)Yong HUANG(Ji'ning, China)Hirofumi INAGAKI(Tokyo, Japan)Masamine JIMBA(Tokyo, Japan)Kimitaka KAGA(Tokyo, Japan)Ichiro KAI(Tokyo, Japan)Kazuhiro KAKIMOTO(Osaka, Japan)Kiyoko KAMIBEPPU(Tokyo, Japan)Haidong KAN(Shanghai, China)Bok-Luel LEE(Busan, Korea)Mingjie LI(St. Louis, MO, USA)Ren-Jang LIN(Duarte, CA, USA)Daru LU(Shanghai, China)Duan MA(Shanghai, China)Yutaka MATSUYAMA(Tokyo, Japan)Qingyue MENG(Beijing, China)Mark MEUTH(Sheffi eld, UK)Satoko NAGATA(Tokyo, Japan)
Miho OBA(Odawara, Japan)Xianjun QU(Ji'nan, China)John J. ROSSI(Duarte, CA, USA)Carlos SAINZ-FERNANDEZ(Santander, Spain)Yoshihiro SAKAMOTO(Tokyo, Japan)Erin SATO(Shizuoka, Japan)Takehito SATO(Isehara, Japan)Akihito SHIMAZU(Tokyo, Japan)Zhifeng SHAO(Shanghai, China)Ri SHO(Yamagata, Japan)Judith SINGER-SAM (Duarte, CA, USA)Raj K. SINGH(Dehradun, India)Junko SUGAMA(Kanazawa, Japan)Hiroshi TACHIBANA(Isehara, Japan)Tomoko TAKAMURA (Tokyo, Japan)Tadatoshi TAKAYAMA(Tokyo, Japan)Shin'ichi TAKEDA(Tokyo, Japan)Sumihito TAMURA(Tokyo, Japan)Puay Hoon TAN(Singapore, Singapore)Koji TANAKA(Tsu, Japan)
John TERMINI(Duarte, CA, USA)Usa C. THISYAKORN(Bangkok, Thailand)Toshifumi TSUKAHARA(Nomi, Japan)Kohjiro UEKI(Tokyo, Japan)Masahiro UMEZAKI(Tokyo, Japan)Junming WANG(Jackson, MS, USA)Ling WANG(Shanghai, China)Hisashi WATANABE(Tokyo, Japan)Lingzhong XU(Ji'nan, China)Masatake YAMAUCHI(Chiba, Japan)George W-C. YIP(Singapore, Singapore)Benny C-Y ZEE(Hong Kong, China)Xiaomei ZHU(Seattle, WA, USA)
(as of April 2013)
BioScience TrendsEditorial and Head OfficePearl City Koishikawa 603, 2-4-5 Kasuga, Bunkyo-ku, Tokyo 112-0003, Japan
Tel: +81-3-5840-8764, Fax: +81-3-5840-8765E-mail: [email protected]: www.biosciencetrends.com
ii
www.biosciencetrends.com
Changes in and shortcomings of control strategies, drug stockpiles, and vaccine development during outbreaks of avian influenza A H5N1, H1N1, and H7N9 among humans.Lin Mei, Peipei Song, Qi Tang, Ke Shan, Ruoyan Gai Tobe, Lesego Selotlegeng,Asghar Hammad Ali, Yangyang Cheng, Lingzhong Xu
Primary pathogenicity analysis of a Chinese Entamoeba histolytica isolate. Muxia Luo, Meng Feng, Xiangyang Min, Xueping Li, Junlong Cai, Hiroshi Tachibana, Xunjia Cheng
Detection of group 2 Dermatophagoides pteronyssinus allergen for environmental monitoring of dust mite infestation.En-Chih Liao, Yi-Hsueh Lin, Jaw-Ji Tsai
Association of mineralization-related genes TNAP and ANKH polymorphisms with ankylosing spondylitis in the Chinese Han population.Zeying Liu, Yazhou Cui, Xiaoyan Zhou, Xiumei Zhang, Jinxiang Han
Expression, characterization, and preliminary X-ray crystallographic analysis of recombinant murine Follistatin-like 1 expressed in Drosophila S2 cells.Lian Li, Xinxin Li, Xue Liu, Yingying Dong, Yan Geng, Xinqi Liu, Wen Ning
Pulse pressure variation and stroke volume variation predict fl uid responsiveness in mechanically ventilated patients experiencing intra-abdominal hypertension.Xiaomei Liu, Qiang Fu, Weidong Mi, Henian Liu, Hong Zhang, Peiji Wang
Analysis of the clinical characteristics and treatment of two patients with avian infl uenza virus (H7N9).Shuihua Lu, Xiuhong Xi, Yufang Zheng, Ye Cao, Xinian Liu, Hongzhou Lu
Review
64 - 76
Brief Report
77 - 81
Original Articles
82 - 88
89 - 92
93 - 100
101 - 108
Case Report
109 - 112
CONTENTS Volume 7, Number 2, 2013
iii

www.biosciencetrends.com
Guide for Authors
Copyright
CONTENTS (Continued )
(This journal was partially supported by a Grant-in-Aid for Scientific Research from Japan Society for the Promotion of Science.)
iv
www.biosciencetrends.com
BioScience Trends. 2013; 7(2):64-76. 64
Changes in and shortcomings of control strategies, drug stockpiles, and vaccine development during outbreaks of avian influenza A H5N1, H1N1, and H7N9 among humans
Lin Mei1, Peipei Song2, Qi Tang1, Ke Shan1, Ruoyan Gai Tobe1, Lesego Selotlegeng1,Asghar Hammad Ali1, Yangyang Cheng1, Lingzhong Xu1,*
1 Department of Health Care Management and Maternal and Child Health, Shandong University, Ji′nan, Shandong, China;2 Department of Surgery, Graduate School of Medicine, The University of Tokyo, Tokyo, Japan.
*Address correspondence to:Dr. Lingzhong Xu, Department of Health Care Management and Maternal and Child Health, Mailbox No. 110, Shandong University, 44 Wenhuaxi Road, 250012 Ji'nan, China.E-mail: [email protected]
1. Introduction
The experience of the 2003 SARS outbreak in Asia emphasized the need to enhance the capacity to fight emerging infectious diseases include disease surveillance, transparency in reporting, and regional collaboration and cooperation. Increasing available information, enhancing awareness, and introducing policies have dramatically increased the capacity to prevent and control emerging infectious diseases. However, defects in existing prevention and control systems are consistently noted during the fight against a new disease, and such systems must never stop improving. This paper seeks to provide a reference for the future prevention and control of emerging infectious
diseases by summarizing the control strategies, the status of drugs and vaccines, and shortcomings during two major outbreaks of pandemic influenza (H5N1 in 2003, H1N1 in 2009) and human infection with influenza A (H7N9) virus in China recently.
2. Pandemic influenza A (H5N1) in 2003
2.1. The epidemiology of pandemic influenza A (H5N1) in humans
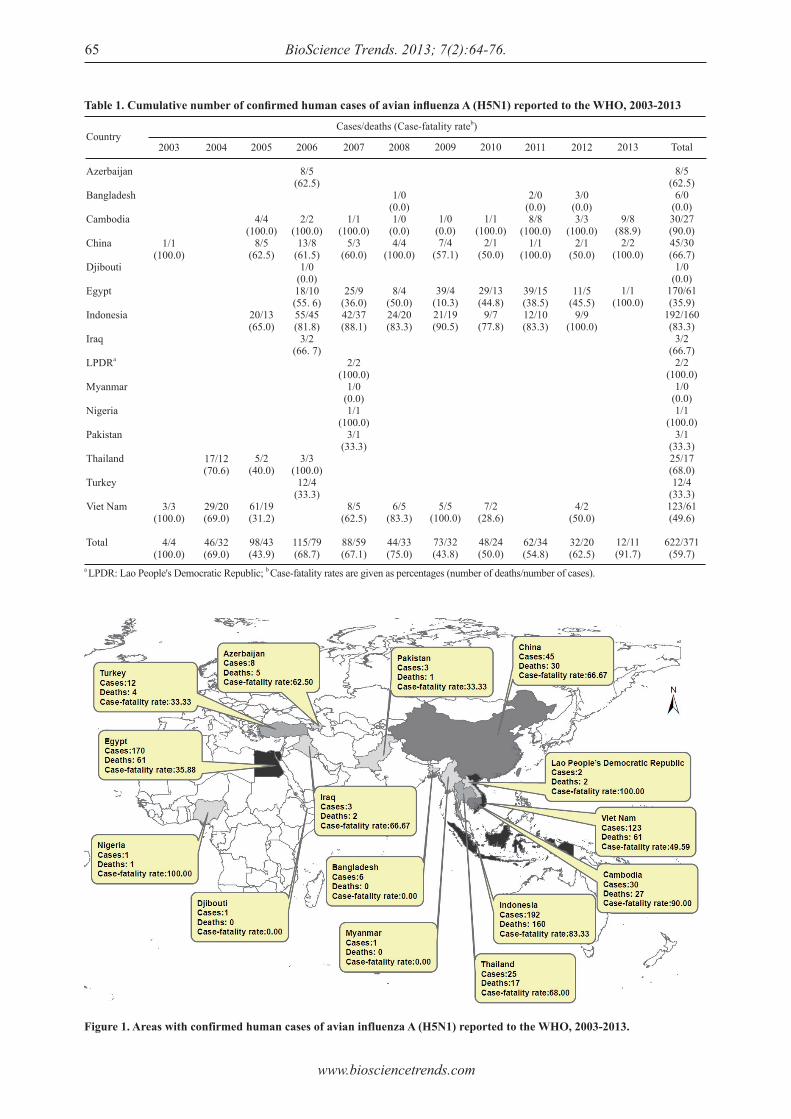
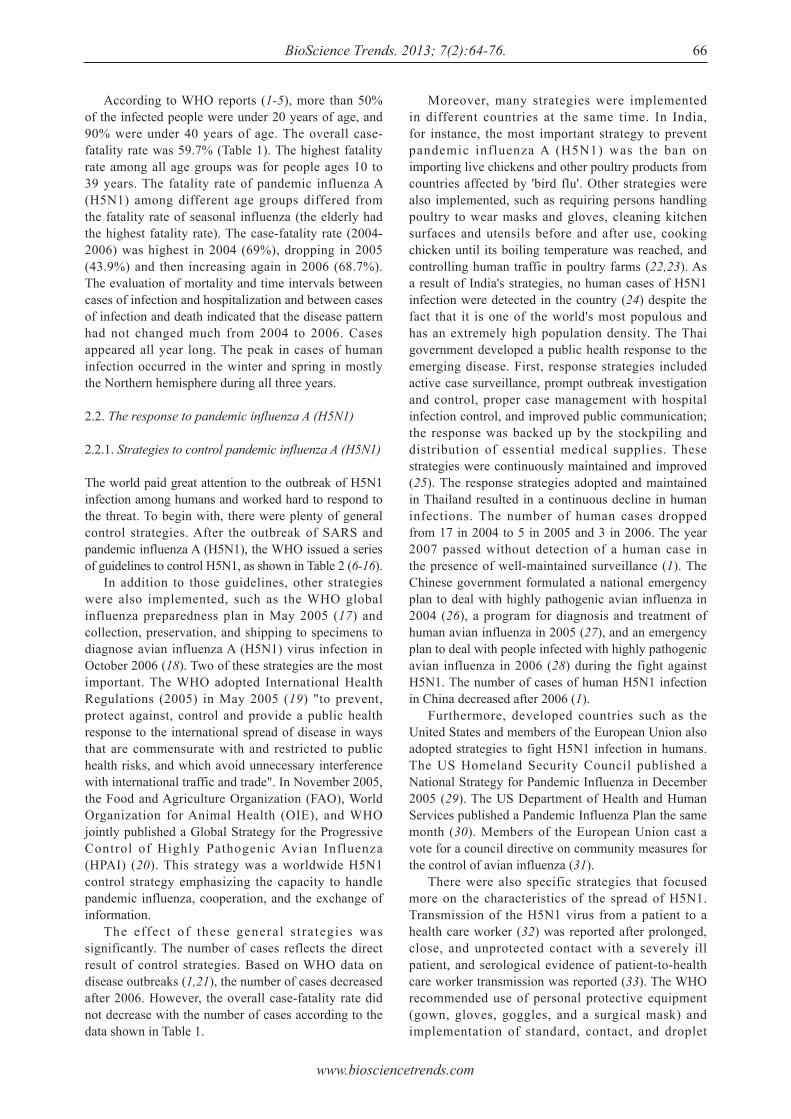
According to the latest data from the World Health Organization (WHO) (1), 15 countries reported a total of 622 laboratory-confirmed human cases and 371 deaths of H5N1 avian influenza, with a total case-fatality rate of 0.597, from February 1, 2003 to March 12, 2013 (Table 1, Figure 1). As Table 1 shows, the two countries with the most cases and deaths were Indonesia and Egypt. However, the highest case-fatality rate was in Cambodia (the Lao People's Democratic Republic and Nigeria are excluded since cases were so rare).
Review
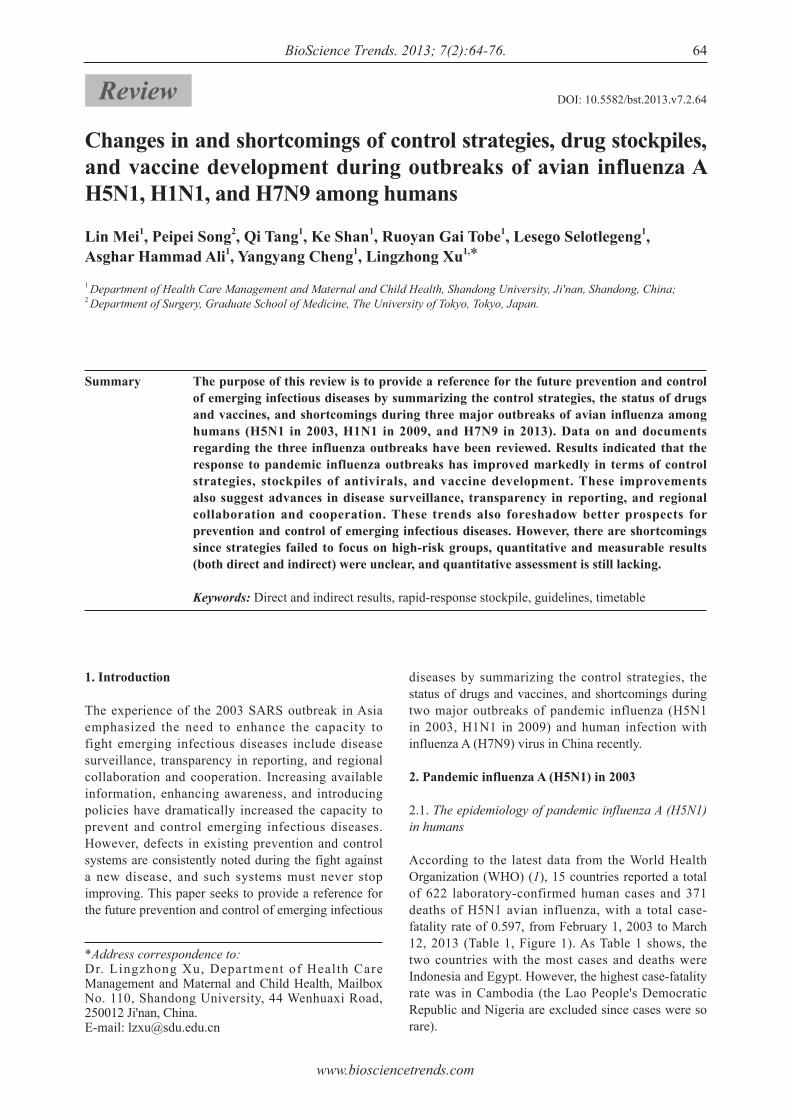
Summary The purpose of this review is to provide a reference for the future prevention and control of emerging infectious diseases by summarizing the control strategies, the status of drugs and vaccines, and shortcomings during three major outbreaks of avian influenza among humans (H5N1 in 2003, H1N1 in 2009, and H7N9 in 2013). Data on and documents regarding the three influenza outbreaks have been reviewed. Results indicated that the response to pandemic influenza outbreaks has improved markedly in terms of control strategies, stockpiles of antivirals, and vaccine development. These improvements also suggest advances in disease surveillance, transparency in reporting, and regional collaboration and cooperation. These trends also foreshadow better prospects for prevention and control of emerging infectious diseases. However, there are shortcomings since strategies failed to focus on high-risk groups, quantitative and measurable results (both direct and indirect) were unclear, and quantitative assessment is still lacking.
Keywords: Direct and indirect results, rapid-response stockpile, guidelines, timetable
DOI: 10.5582/bst.2013.v7.2.64
www.biosciencetrends.com
BioScience Trends. 2013; 7(2):64-76.65
Figure 1. Areas with confirmed human cases of avian influenza A (H5N1) reported to the WHO, 2003-2013.
Table 1. Cumulative number of confi rmed human cases of avian infl uenza A (H5N1) reported to the WHO, 2003-2013
Country
Azerbaijan
Bangladesh
Cambodia
China
Djibouti
Egypt
Indonesia
Iraq
LPDRa
Myanmar
Nigeria
Pakistan
Thailand
Turkey
Viet Nam
Total
2003
1/1(100.0)
3/3(100.0)
4/4(100.0)
a LPDR: Lao People's Democratic Republic; b Case-fatality rates are given as percentages (number of deaths/number of cases).
2004
17/12(70.6)
29/20(69.0)
46/32(69.0)
Cases/deaths (Case-fatality rateb)
2005
4/4(100.0)
8/5(62.5)
20/13(65.0)
5/2(40.0)
61/19(31.2)
98/43(43.9)
2006
8/5(62.5)
2/2(100.0)
13/8(61.5)
1/0(0.0)18/10(55. 6)55/45(81.8)
3/2(66. 7)
3/3(100.0)
12/4(33.3)
115/79(68.7)
2007
1/1(100.0)
5/3(60.0)
25/9(36.0)42/37(88.1)
2/2(100.0)
1/0(0.0)1/1
(100.0)3/1
(33.3)
8/5(62.5)
88/59(67.1)
2008
1/0(0.0)1/0
(0.0)4/4
(100.0)
8/4(50.0)24/20(83.3)
6/5(83.3)
44/33(75.0)
2009
1/0(0.0)7/4
(57.1)
39/4(10.3)21/19(90.5)
5/5(100.0)
73/32(43.8)
2010
1/1(100.0)
2/1(50.0)
29/13(44.8)
9/7(77.8)
7/2(28.6)
48/24(50.0)
2011
2/0(0.0)8/8
(100.0)1/1
(100.0)
39/15(38.5)12/10(83.3)
62/34(54.8)
2012
3/0(0.0)3/3
(100.0)2/1
(50.0)
11/5(45.5)
9/9(100.0)
4/2(50.0)
32/20(62.5)
2013
9/8(88.9)
2/2(100.0)
1/1(100.0)
12/11(91.7)
Total
8/5(62.5)
6/0(0.0)30/27(90.0)45/30(66.7)
1/0(0.0)
170/61(35.9)
192/160(83.3)
3/2(66.7)
2/2(100.0)
1/0(0.0)1/1
(100.0)3/1
(33.3)25/17(68.0)12/4
(33.3)123/61(49.6)
622/371(59.7)
www.biosciencetrends.com
BioScience Trends. 2013; 7(2):64-76. 66
Moreover, many strategies were implemented in different countries at the same time. In India, for instance, the most important strategy to prevent pandemic influenza A (H5N1) was the ban on importing live chickens and other poultry products from countries affected by 'bird flu'. Other strategies were also implemented, such as requiring persons handling poultry to wear masks and gloves, cleaning kitchen surfaces and utensils before and after use, cooking chicken until its boiling temperature was reached, and controlling human traffic in poultry farms (22,23). As a result of India's strategies, no human cases of H5N1 infection were detected in the country (24) despite the fact that it is one of the world's most populous and has an extremely high population density. The Thai government developed a public health response to the emerging disease. First, response strategies included active case surveillance, prompt outbreak investigation and control, proper case management with hospital infection control, and improved public communication; the response was backed up by the stockpiling and distribution of essential medical supplies. These strategies were continuously maintained and improved (25). The response strategies adopted and maintained in Thailand resulted in a continuous decline in human infections. The number of human cases dropped from 17 in 2004 to 5 in 2005 and 3 in 2006. The year 2007 passed without detection of a human case in the presence of well-maintained surveillance (1). The Chinese government formulated a national emergency plan to deal with highly pathogenic avian influenza in 2004 (26), a program for diagnosis and treatment of human avian influenza in 2005 (27), and an emergency plan to deal with people infected with highly pathogenic avian influenza in 2006 (28) during the fight against H5N1. The number of cases of human H5N1 infection in China decreased after 2006 (1). Furthermore, developed countries such as the United States and members of the European Union also adopted strategies to fight H5N1 infection in humans. The US Homeland Security Council published a National Strategy for Pandemic Influenza in December 2005 (29). The US Department of Health and Human Services published a Pandemic Influenza Plan the same month (30). Members of the European Union cast a vote for a council directive on community measures for the control of avian influenza (31). There were also specific strategies that focused more on the characteristics of the spread of H5N1. Transmission of the H5N1 virus from a patient to a health care worker (32) was reported after prolonged, close, and unprotected contact with a severely ill patient, and serological evidence of patient-to-health care worker transmission was reported (33). The WHO recommended use of personal protective equipment (gown, gloves, goggles, and a surgical mask) and implementation of standard, contact, and droplet
According to WHO reports (1-5), more than 50% of the infected people were under 20 years of age, and 90% were under 40 years of age. The overall case-fatality rate was 59.7% (Table 1). The highest fatality rate among all age groups was for people ages 10 to 39 years. The fatality rate of pandemic influenza A (H5N1) among different age groups differed from the fatality rate of seasonal influenza (the elderly had the highest fatality rate). The case-fatality rate (2004-2006) was highest in 2004 (69%), dropping in 2005 (43.9%) and then increasing again in 2006 (68.7%). The evaluation of mortality and time intervals between cases of infection and hospitalization and between cases of infection and death indicated that the disease pattern had not changed much from 2004 to 2006. Cases appeared all year long. The peak in cases of human infection occurred in the winter and spring in mostly the Northern hemisphere during all three years.
2.2. The response to pandemic influenza A (H5N1)
2.2.1. Strategies to control pandemic influenza A (H5N1)
The world paid great attention to the outbreak of H5N1 infection among humans and worked hard to respond to the threat. To begin with, there were plenty of general control strategies. After the outbreak of SARS and pandemic influenza A (H5N1), the WHO issued a series of guidelines to control H5N1, as shown in Table 2 (6-16). In addition to those guidelines, other strategies were also implemented, such as the WHO global influenza preparedness plan in May 2005 (17) and collection, preservation, and shipping to specimens to diagnose avian influenza A (H5N1) virus infection in October 2006 (18). Two of these strategies are the most important. The WHO adopted International Health Regulations (2005) in May 2005 (19) "to prevent, protect against, control and provide a public health response to the international spread of disease in ways that are commensurate with and restricted to public health risks, and which avoid unnecessary interference with international traffic and trade". In November 2005, the Food and Agriculture Organization (FAO), World Organization for Animal Health (OIE), and WHO jointly published a Global Strategy for the Progressive Control of Highly Pathogenic Avian Influenza (HPAI) (20). This strategy was a worldwide H5N1 control strategy emphasizing the capacity to handle pandemic influenza, cooperation, and the exchange of information. The effect of these general s t rategies was significantly. The number of cases reflects the direct result of control strategies. Based on WHO data on disease outbreaks (1,21), the number of cases decreased after 2006. However, the overall case-fatality rate did not decrease with the number of cases according to the data shown in Table 1.
www.biosciencetrends.com
BioScience Trends. 2013; 7(2):64-76.67
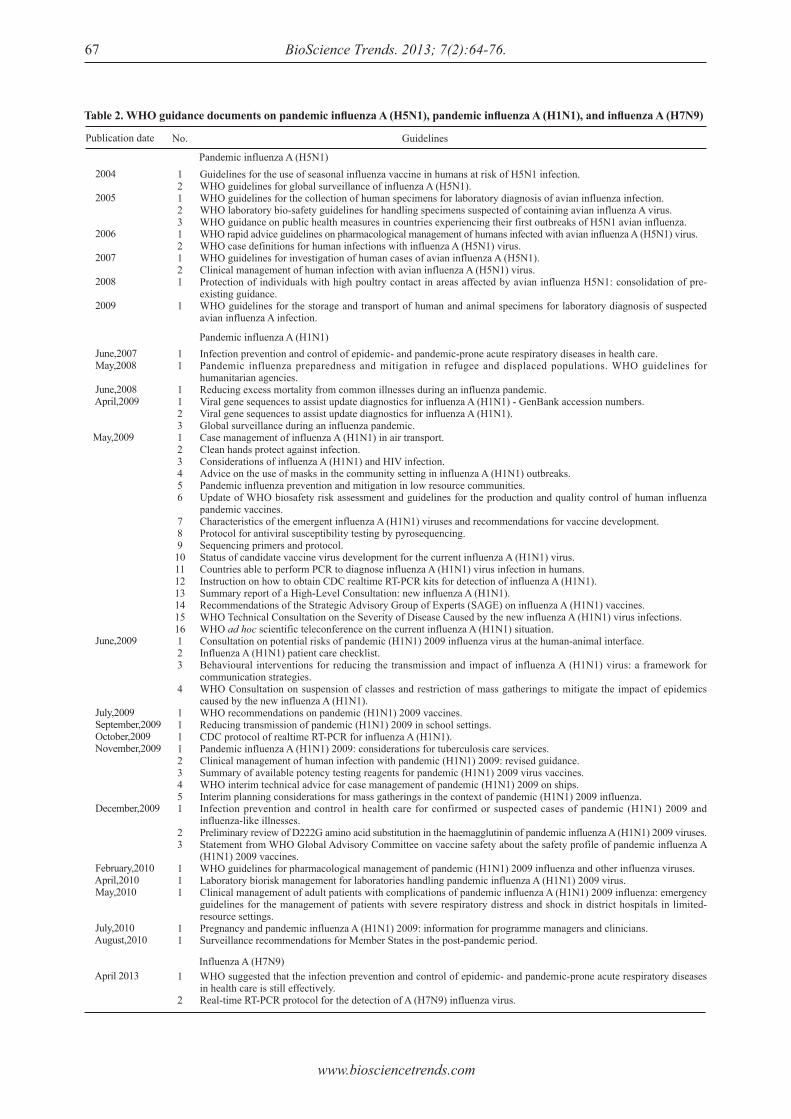
Table 2. WHO guidance documents on pandemic infl uenza A (H5N1), pandemic infl uenza A (H1N1), and infl uenza A (H7N9)
Publication date
2004
2005
2006
2007
2008
2009
June,2007 May,2008
June,2008 April,2009
May,2009
June,2009
July,2009 September,2009 October,2009 November,2009
December,2009
February,2010 April,2010 May,2010
July,2010 August,2010
April 2013
Pandemic influenza A (H5N1)
No.
1212312121
1
11
1123123456
78910111213141516123
4
111123451
23
111
11
1
2
Guidelines
Guidelines for the use of seasonal influenza vaccine in humans at risk of H5N1 infection.WHO guidelines for global surveillance of influenza A (H5N1).WHO guidelines for the collection of human specimens for laboratory diagnosis of avian influenza infection.WHO laboratory bio-safety guidelines for handling specimens suspected of containing avian influenza A virus.WHO guidance on public health measures in countries experiencing their first outbreaks of H5N1 avian influenza.WHO rapid advice guidelines on pharmacological management of humans infected with avian influenza A (H5N1) virus.WHO case definitions for human infections with influenza A (H5N1) virus.WHO guidelines for investigation of human cases of avian influenza A (H5N1).Clinical management of human infection with avian influenza A (H5N1) virus.Protection of individuals with high poultry contact in areas affected by avian influenza H5N1: consolidation of pre-existing guidance.WHO guidelines for the storage and transport of human and animal specimens for laboratory diagnosis of suspected avian influenza A infection.
Infection prevention and control of epidemic- and pandemic-prone acute respiratory diseases in health care.Pandemic influenza preparedness and mitigation in refugee and displaced populations. WHO guidelines for humanitarian agencies.Reducing excess mortality from common illnesses during an influenza pandemic.Viral gene sequences to assist update diagnostics for influenza A (H1N1) - GenBank accession numbers.Viral gene sequences to assist update diagnostics for influenza A (H1N1).Global surveillance during an influenza pandemic.Case management of influenza A (H1N1) in air transport.Clean hands protect against infection.Considerations of influenza A (H1N1) and HIV infection.Advice on the use of masks in the community setting in influenza A (H1N1) outbreaks.Pandemic influenza prevention and mitigation in low resource communities.Update of WHO biosafety risk assessment and guidelines for the production and quality control of human influenza pandemic vaccines.Characteristics of the emergent influenza A (H1N1) viruses and recommendations for vaccine development.Protocol for antiviral susceptibility testing by pyrosequencing.Sequencing primers and protocol.Status of candidate vaccine virus development for the current influenza A (H1N1) virus.Countries able to perform PCR to diagnose influenza A (H1N1) virus infection in humans.Instruction on how to obtain CDC realtime RT-PCR kits for detection of influenza A (H1N1).Summary report of a High-Level Consultation: new influenza A (H1N1).Recommendations of the Strategic Advisory Group of Experts (SAGE) on influenza A (H1N1) vaccines.WHO Technical Consultation on the Severity of Disease Caused by the new influenza A (H1N1) virus infections.WHO ad hoc scientific teleconference on the current influenza A (H1N1) situation.Consultation on potential risks of pandemic (H1N1) 2009 influenza virus at the human-animal interface.Influenza A (H1N1) patient care checklist.Behavioural interventions for reducing the transmission and impact of influenza A (H1N1) virus: a framework for communication strategies.WHO Consultation on suspension of classes and restriction of mass gatherings to mitigate the impact of epidemics caused by the new influenza A (H1N1).WHO recommendations on pandemic (H1N1) 2009 vaccines.Reducing transmission of pandemic (H1N1) 2009 in school settings.CDC protocol of realtime RT-PCR for influenza A (H1N1).Pandemic influenza A (H1N1) 2009: considerations for tuberculosis care services.Clinical management of human infection with pandemic (H1N1) 2009: revised guidance.Summary of available potency testing reagents for pandemic (H1N1) 2009 virus vaccines.WHO interim technical advice for case management of pandemic (H1N1) 2009 on ships.Interim planning considerations for mass gatherings in the context of pandemic (H1N1) 2009 influenza.Infection prevention and control in health care for confirmed or suspected cases of pandemic (H1N1) 2009 and influenza-like illnesses.Preliminary review of D222G amino acid substitution in the haemagglutinin of pandemic influenza A (H1N1) 2009 viruses.Statement from WHO Global Advisory Committee on vaccine safety about the safety profile of pandemic influenza A (H1N1) 2009 vaccines.WHO guidelines for pharmacological management of pandemic (H1N1) 2009 influenza and other influenza viruses.Laboratory biorisk management for laboratories handling pandemic influenza A (H1N1) 2009 virus.Clinical management of adult patients with complications of pandemic influenza A (H1N1) 2009 influenza: emergency guidelines for the management of patients with severe respiratory distress and shock in district hospitals in limited-resource settings.Pregnancy and pandemic influenza A (H1N1) 2009: information for programme managers and clinicians.Surveillance recommendations for Member States in the post-pandemic period.
WHO suggested that the infection prevention and control of epidemic- and pandemic-prone acute respiratory diseases in health care is still effectively.Real-time RT-PCR protocol for the detection of A (H7N9) influenza virus.
Pandemic influenza A (H1N1)
Influenza A (H7N9)
www.biosciencetrends.com
BioScience Trends. 2013; 7(2):64-76. 68
precautions for routine care of patients with H5N1 virus infection (34,35). Public knowledge of avian influenza is an important component of a control strategy. However, this knowledge was insufficient. Studies (36-39) indicated a relatively low level of public knowledge of avian influenza, suggesting that control strategies needed to improve health education.
2.2.2. Drugs and vaccines to treat pandemic influenza A (H5N1)
Table 3 shows the timetable of drug stockpiling and development of vaccines against H5N1. After the outbreak of pandemic influenza A (H5N1) in February 2003, the WHO tried to stockpile enough treatment courses of oseltamivir as an effective drug against H5N1 infection among humans in the beginning of 2006. In January 2006, Roche (a major manufacturer of oseltamivir) announced that it would donate 2 million treatment courses of oseltamivir to the WHO (40). In April 2006, Roche announced that another 3 million treatment courses were ready to be shipped to sites of pandemic influenza outbreaks (41). As this information shows, amassing effective drug stockpiles took three years. In April 2004, the WHO obtained the wild-type H5N1 virus and provided it to the National Institute of Allergy and Infectious Diseases (NIAID) for research and development of a vaccine (42). In August 2005, NIAID declared that the vaccine had proven effective during the first phase of adult experiments (43,44). Although there were several H5N1 vaccines for several of the avian H5N1 varieties, the continual mutation of H5N1 rendered them of limited use to date: while vaccines can sometimes provide cross-protection against related flu strains, the best protection would be from a vaccine specifically produced for any future pandemic flu virus strain (45). However, "pre-pandemic
vaccines" had been created, were being refined and tested, and did have some promise both in furthering research and preparedness for the next pandemic (46,47). Therefore, candidate vaccines to prevent H5N1 infection had been developed, but they were not ready for widespread use because of the continual mutation of H5N1 (48).
2.3. Shortcomings during the outbreak of pandemic influenza A (H5N1)
The outbreak of pandemic influenza A (H5N1) in 2003 was the first serious pandemic influenza outbreak the world faced after SARS. Much work had done during the fight against the outbreak of H5N1, and huge successes had been achieved. However, the response had shortcomings that should be discussed. First of all, the strategies did not focus on the younger population as a high-risk group. According to data from the WHO, the younger population had the highest proportion of cases and the highest case fatality rate. However, there is no evidence of a specific strategy focusing on the younger population. Therefore, prevention strategies should put more emphasis on high-risk groups to better control the spread of H5N1. Second, an evaluation process was missing. Although avian influenza H5N1 is not currently a substantial threat (phase 3 pandemic alert for avian influenza H5N1 according to the WHO) (49), an evaluation of pandemic influenza A (H5N1) still needs to be performed. Third, the stockpiling of effective drugs and vaccine development was relatively slow. As mentioned above, amassing an effective drug stockpile took more than three years, and no effective vaccine had been developed. Therefore, more attention should be paid to drug stockpiles and the development of vaccines. Lastly, the results of strategies were unclear, especially with regard to indirect results. Further research should be conducted.
Table 3. The timetable of drug stockpile and vaccine development of H5N1 and H1N1
Time
February 2003
April 2004(14 months after first outbreak)
August 2005(30 months after first outbreak)
April 2006(38 months after first outbreak)
April 2009
April 2009(same month of first outbreak)
May 2009(1 month after first outbreak)
July 2009(3 months after first outbreak)
Event
First outbreak of H5N1 in Hong Kong, China.
Isolation of wild type viruses of H5N1.
Valid result during the first stage of vaccine's adults experiment.
Rapid response stockpile of oseltamivir gets ready.
First outbreak of H1N1 in Mexico.
Deploying rapid-response stockpile of drug.
Isolation of wild type viruses of H1N1.
Vaccination against pandemic H1N1 influenza first implemented in China.
www.biosciencetrends.com
BioScience Trends. 2013; 7(2):64-76.69
3. Pandemic influenza A (H1N1) in 2009
3.1. The epidemiology of human pandemic influenza A (H1N1) 2009
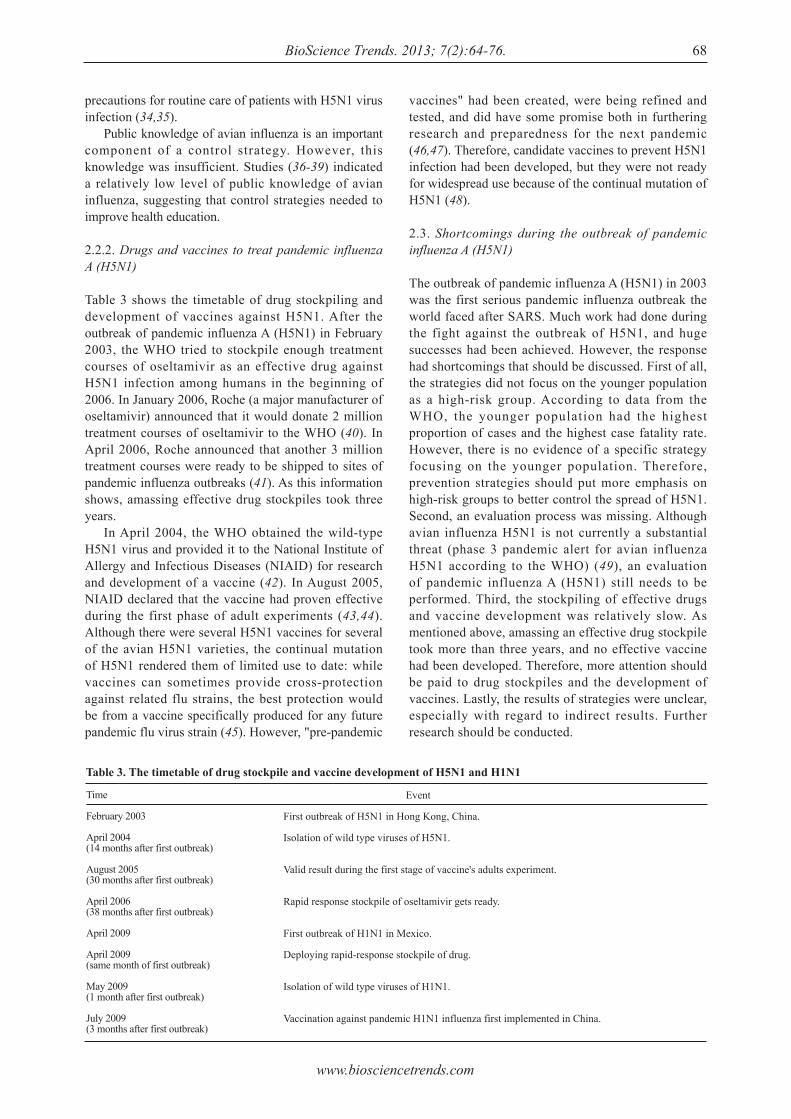
The emergence of a new H1N1 virus in early 2009 was the cause of the first influenza pandemic of the 21st century (50,51). In early April 2009, a new influenza A (H1N1) 2009 virus emerged among humans in California and Mexico, quickly spreading worldwide through human-to-human transmission. By August 2010, when the transition from a pandemic to post-pandemic period was announced, 18,449 laboratory-confirmed deaths from pandemic influenza A (H1N1) 2009 had been recorded (52) (Figure 2). However, the actual number of influenza A (H1N1) cases worldwide remains unknown, as most cases were diagnosed clinically and were not confirmed in the laboratory. In most countries, the capacity for laboratory diagnosis was so stressed that diagnosis was limited to hospitalized patients (53). However, the total number of cases of pandemic H1N1 influenza worldwide was probably on the order of several tens of millions (54,55). Modeling estimates of the global burden of pandemic influenza A (H1N1) 2009 ranged from several tens of millions to 2 billion (56). The official number of deaths from laboratory-confirmed pandemic influenza A (H1N1) 2009 infection worldwide reported to the WHO as of May 7, 2010 was at least 18,449 (52). This number appears to be much lower than the estimated annual global mortality associated with seasonal influenza. However, the actual fatality of the A (H1N1) 2009 pandemic cannot be accurately ascertained at this time. Given the relatively high mortality rates for at-risk groups and hospitalized patients (57,58), the annual mortality due to A (H1N1) 2009 is presumed to be higher.
Geographically, pandemic influenza A (H1N1) transmission remains most active in parts of South Asia and in limited areas of tropical South and Central America. After the first two cases emerged in California, 208 countries, overseas territories, and communities had reported laboratory-confirmed A (H1N1) 2009 cases in humans on December 30, 2009 and more than 214 reported such cases on April 18, 2010. Most countries in the Southern hemisphere reported more cases of pandemic H1N1 in 2009 than any of the seasonal subtypes. One characteristic feature of the H1N1 2009 pandemic is that it disproportionately affected young children. Studies and data show that the virus was spreading rapidly around the world and appeared to primarily affect children and young adults (59,60), and the same was true of the outbreak of H5N1 in 2003.
3.2. The response to pandemic influenza A (H1N1) 2009
3.2.1. Strategies to control pandemic influenza A (H1N1) 2009
With experience fighting the outbreak of SARS and H5N1 in 2003, the world responded rapidly after the H1N1 outbreak. After the outbreak of H1N1 in February and early March 2009 in Mexico, the WHO issued a series of guidelines for control of H1N1, as shown in Table 2 (61-66). As usual, those guidelines were accompanied by control strategies, such as WHO recommendations for the post-pandemic period (67) in August 2010. During the fight against the outbreak of H1N1, school closure was a policy option considered in some countries, such as Argentina and Japan. Argentina and Japan had closed all schools early in their epidemic by extension of or
Figure 2. Areas with confirmed human deaths due to avian influenza A (H1N1) reported to the WHO, April 2009 - August 2010.
www.biosciencetrends.com
BioScience Trends. 2013; 7(2):64-76. 70
overlap with school holidays, while other countries closed only certain schools (68). Studies (69,70) and data showed that these general strategies had significant results. Based on the disease outbreak data from the WHO (71-73), the number of cases decreased after November 2009. However, according to outbreak data (71,72) the overall case-fatality rate remained steady. Each country also had different control strategies. Since the breakout of H1N1, vigorous responses to influenza A H1N1 were implemented by the Chinese government, which included aggressive case identification, vaccine development, and mass vaccination at a speed and scale unparalleled elsewhere (73). One study used a counterfactual to evaluate the results of these responses (74) and found that China would have had 139,693 cases of infection and 2,266 deaths. In fact, there were only 5,542 cases of infection and 6 deaths, suggesting that these responses were effective. The Italian government also implemented several control strategies, including containment measures, surveillance, communication of data, and mitigation measures. After these strategies were implemented, the incidence of influenza-like illness in Italy decreased from a peak of almost 20% to almost 6% (75). However, some strategies were also ineffective. Egypt, which had no cases of H1N1, implemented a policy in March 2009 to prohibit raising pigs and by ordering the "killing of all pigs in the country and compensating the farmers for the loss." In fact, the virus is not transmitted by pigs, so the pig slaughter did nothing to stop the spread of H1N1 (76). Because of the experience with H5N1, health care workers tended to use personal protective equipment and vaccination (77,78), limited their infection. Because of this trend, few cases of patient-to-health care worker transmission were reported during the outbreak of pandemic influenza A (H1N1) 2009. The level of public knowledge of H1N1 increased in comparison to the outbreak of H5N1. Studies (79,80) showed an average level of public knowledge of H1N1 (had knowledge about general influenza and preventive measures but lacked an adequate understanding of H1N1), suggesting that control strategies had improved in comparison to the outbreak of H5N1 but that health education still needed to be improved.
3.2.2. Drugs and vaccines to treat pandemic influenza A (H1N1) 2009
Table 3 presents the major timeline for drug stockpiling and vaccine development during the outbreak of pandemic influenza A (H1N1) 2009. After the outbreak of H5N1, the WHO began to store emergency stocks of oseltamivir. Like the H5N1 virus, the H1N1 virus was susceptible to the drugs oseltamivir and zanamivir, so the WHO started deploying 3 million doses of the drug to Mexico and to 71 pre-identified low-income
countries immediately after the declaration of pandemic alert Phase 5 on April 29, 2009 (81,82). Within a month, this rapid-response stockpile had been delivered and the WHO was to provide additional shipments as required during the course of the pandemic. Some higher-income countries subsequently donated antivirals to the global response. In May 2009, the WHO sent the wild-type H1N1 virus to vaccine manufacturers that requested it (83). At the same time, WHO Collaborating Centers for Influenza (WHO CCs), Essential Regulatory Laboratories (ERLs), and other institutions were developing candidate vaccines with coordination by the WHO. In July 2009, vaccination against pandemic H1N1 influenza was first implemented in China (84), followed by a large number of other countries. The safety of the A (H1N1) 2009 vaccines had been thoroughly monitored during various clinical trials. Current data show that the pandemic influenza vaccines are well-tolerated and behave like corresponding seasonal vaccines in terms of safety and absence of severe adverse events. Compared to the development of vaccines against H5N1, there was a significant improvement in both timeliness and results.
3.3. Shortcomings during the outbreak of pandemic influenza A (H1N1) 2009
Compared to the fight against pandemic influenza A (H5N1) in 2003, the fight in 2009 was a marked improvement. Both direct results and indirect results of control strategies improved. A rapid-response stockpile of antivirals had been prepared in advance, and the stockpile was quickly delivered. Vaccines were also developed faster. The WHO also evaluated pandemic influenza (H1N1) 2009 after the pandemic. Therefore, the response to pandemic influenza improved significantly. However, there were shortcomings during response to the outbreak of pandemic influenza (H1N1) 2009. First of all, just like the strategies against pandemic influenza A (H5N1) in 2003, strategies against H1N1 also failed to pay enough attention to the younger population as a high-risk group. There is no evidence of a specific strategy focusing on the younger population beside the school closure mentioned above. Second, the evaluation needed to go further. The evaluation of H1N1 was a qualitative evaluation, lacking convincing quantitative evidence.
4. The outbreak of influenza A (H7N9)
4.1. The epidemiology of human cases of influenza A (H7N9)
On March 31, 2013, the National Health and Family Planning Commission (NHFPC) of China (formerly the Ministry of Health) announced three confirmed
www.biosciencetrends.com
BioScience Trends. 2013; 7(2):64-76.71
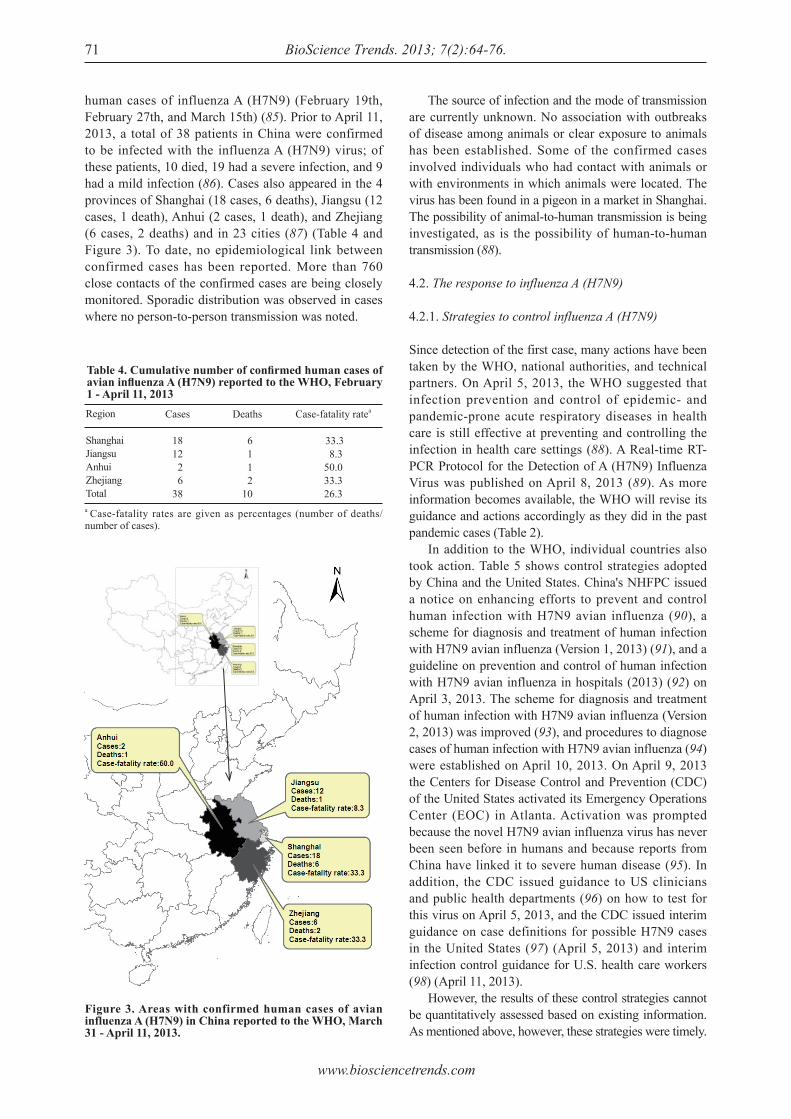
human cases of influenza A (H7N9) (February 19th, February 27th, and March 15th) (85). Prior to April 11, 2013, a total of 38 patients in China were confirmed to be infected with the influenza A (H7N9) virus; of these patients, 10 died, 19 had a severe infection, and 9 had a mild infection (86). Cases also appeared in the 4 provinces of Shanghai (18 cases, 6 deaths), Jiangsu (12 cases, 1 death), Anhui (2 cases, 1 death), and Zhejiang (6 cases, 2 deaths) and in 23 cities (87) (Table 4 and Figure 3). To date, no epidemiological link between confirmed cases has been reported. More than 760 close contacts of the confirmed cases are being closely monitored. Sporadic distribution was observed in cases where no person-to-person transmission was noted.
The source of infection and the mode of transmission are currently unknown. No association with outbreaks of disease among animals or clear exposure to animals has been established. Some of the confirmed cases involved individuals who had contact with animals or with environments in which animals were located. The virus has been found in a pigeon in a market in Shanghai. The possibility of animal-to-human transmission is being investigated, as is the possibility of human-to-human transmission (88).
4.2. The response to influenza A (H7N9)
4.2.1. Strategies to control influenza A (H7N9)
Since detection of the first case, many actions have been taken by the WHO, national authorities, and technical partners. On April 5, 2013, the WHO suggested that infection prevention and control of epidemic- and pandemic-prone acute respiratory diseases in health care is still effective at preventing and controlling the infection in health care settings (88). A Real-time RT-PCR Protocol for the Detection of A (H7N9) Influenza Virus was published on April 8, 2013 (89). As more information becomes available, the WHO will revise its guidance and actions accordingly as they did in the past pandemic cases (Table 2). In addition to the WHO, individual countries also took action. Table 5 shows control strategies adopted by China and the United States. China's NHFPC issued a notice on enhancing efforts to prevent and control human infection with H7N9 avian influenza (90), a scheme for diagnosis and treatment of human infection with H7N9 avian influenza (Version 1, 2013) (91), and a guideline on prevention and control of human infection with H7N9 avian influenza in hospitals (2013) (92) on April 3, 2013. The scheme for diagnosis and treatment of human infection with H7N9 avian influenza (Version 2, 2013) was improved (93), and procedures to diagnose cases of human infection with H7N9 avian influenza (94) were established on April 10, 2013. On April 9, 2013 the Centers for Disease Control and Prevention (CDC) of the United States activated its Emergency Operations Center (EOC) in Atlanta. Activation was prompted because the novel H7N9 avian influenza virus has never been seen before in humans and because reports from China have linked it to severe human disease (95). In addition, the CDC issued guidance to US clinicians and public health departments (96) on how to test for this virus on April 5, 2013, and the CDC issued interim guidance on case definitions for possible H7N9 cases in the United States (97) (April 5, 2013) and interim infection control guidance for U.S. health care workers (98) (April 11, 2013). However, the results of these control strategies cannot be quantitatively assessed based on existing information. As mentioned above, however, these strategies were timely.
Case-fatality ratea
33.3 8.350.033.326.3
Table 4. Cumulative number of confi rmed human cases of avian infl uenza A (H7N9) reported to the WHO, February 1 - April 11, 2013Region
ShanghaiJiangsuAnhuiZhejiangTotal
Cases
1812 2 638
Deaths
6 1 1 210
a Case-fatality rates are given as percentages (number of deaths/number of cases).
Figure 3. Areas with confirmed human cases of avian influenza A (H7N9) in China reported to the WHO, March 31 - April 11, 2013.
www.biosciencetrends.com
BioScience Trends. 2013; 7(2):64-76. 72
4.2.2. Drugs and vaccines to treat influenza A (H7N9)
Laboratory testing conducted in China has shown that the influenza A (H7N9) viruses are sensitive to the anti-influenza drugs known as neuraminidase inhibitors (oseltamivir and zanamivir). Because of the small number of cases and the rapid-response stockpile of drug stockpiled after outbreak of H5N1, there are no reports of drug shortages. These drugs have yet to be used to treat H7N9 infection. On April 5, 2013, about one month after the outbreak of H7N9, China's Food and Drug Administration (CFDA) approved the production of a new anti-influenza drug (a peramivir sodium chloride injection) that has proven effective in fighting influenza H7N9 according to existing clinical trials (99). No vaccine for the prevention of influenza A (H7N9) infections is currently available. However, viruses have already been isolated and characterized from the initial cases. The NHFPC of China indicated that vaccine development is underway. Generally, 6 to 8 months are needed to develop an effective vaccine, yet more time may be needed to develop the effective vaccine against a new virus like H7N9. The Ministry of Science and Technology of the People's Republic of China launched research on the H7N9 avian influenza virus (100) on April 10, 2013, and the development of vaccine should be completed within seven months. Because of the experience with H5N1 and H1N1, the response to influenza A (H7N9) was timely in terms of both drug stores and vaccine development.
4.3. Suggestions regarding the fight against influenza A (H7N9) based on previous experience
As mentioned above, there have been marked strides in preventing pandemic influenza. Control strategies are faster and more effective, a rapid-response stockpile of antivirals is ready, and vaccines are developed more efficiently. These improvements also suggest advances in disease surveillance, transparency in reporting, and regional collaboration and cooperation. A faster response comes only with good disease surveillance, the spread of influenza can be controlled only with transparency in reporting, and international strategies will be effective only
with constructive regional collaboration and cooperation. As these trends continue, they offer prospects of a faster response, better disease surveillance, more open reporting, and closer international cooperation. However, there are still some concerns. To begin with, more attention should be given to high-risk groups. Experience shows that control strategies consistently focused on the general level and placed less emphasis on high-risk groups. Groups that are at risk for influenza A (H7N9) infection have not been identified, and control strategies should be targeted more toward possible high-risk groups. Moreover, quantitative and measurable results (both direct and indirect) should be evident. Although reducing the number of cases is important, indirect results, such as improvement of health professionals (capacity, awareness, etc.) and improvement of vaccine manufacturers, should be evident. Finally, quantitative assessment should be performed. Overwhelming evidence is vitally needed to better identify shortcomings and forecast future influenza outbreaks. Therefore, quantitative assessment should be performed during an outbreak.
5. Conclusion
The response to influenza outbreaks has improved markedly. The response was faster and more effective in terms of control strategies, stockpiling of antivirals, and vaccine development. These improvements also suggest advances in disease surveillance, transparency in reporting, and regional collaboration and cooperation. These trends also foreshadow better prospects for prevention and control of emerging infectious diseases. However, there are shortcomings since strategies failed to focus on high-risk groups, quantitative and measurable results (both direct and indirect) were unclear, and quantitative assessment is still lacking.
Acknowledgments
This paper was supported by a grant from Department of Science & Technology of Shandong province as a Science and Technology Development Project (project ID: 2012GSF11843).
Table 5. Strategies to control infl uenza A (H7N9) adopted in China and the United States
Date issued
April 3, 2013
April 5, 2013
April 10, 2013
April 11, 2013
Control strategy
Notice on enhancing efforts to prevent and control human infection with H7N9 avian influenza.Scheme for diagnosis and treatment of human infection with H7N9 avian influenza (Version 1, 2013).Guideline on prevention and control of human infection with H7N9 avian influenza in hospitals (2013).
Human Infections with Novel Influenza A (H7N9) Viruses.Interim Guidance on Case Definitions to be Used for Novel Influenza A (H7N9) Case Investigations in the United States.
Scheme for diagnosis and treatment of human infection with H7N9 avian influenza (Version 2, 2013).Procedures to diagnose cases of human infection with H7N9 avian influenza.
Interim Guidance for Infection Control Within Healthcare Settings When Caring for Patients with Confirmed, Probable, or Cases Under Investigation of Avian Influenza A (H7N9) Virus Infection.
Issued by
NHFPC ofChina
US CDC
NHFPC ofChina
US CDC
www.biosciencetrends.com
BioScience Trends. 2013; 7(2):64-76.73
References
1. WHO. Cumulative number of confirmed human cases for avian influenza A (H5N1) reported to WHO, 2003-2013. http://www.who.int/influenza/human_animal_interface/EN_GIP_20130312CumulativeNumberH5N1cases.pdf (accessed April 9, 2013).
2. WHO. Epidemiology of WHO-confirmed human cases of avian influenza A (H5N1) infection. Wkly Epidemiol Rec. 2006; 81:249-260.
3. United Nations Statistics Division. The world's women reports. http://unstats.un.org/unsd/demographic/products/indwm/ww2005/tab1b.htm (accessed April 7, 2013).
4. WHO. Avian influenza: Assessing the pandemic threat. http://whqlibdoc.who.int/hq/2005/WHO_CDS_2005.29.pdf (accessed April 7, 2013).
5. Simonsen L, Clarke MJ, Schonberger LB, Arden NH, Cox NJ, Fukuda K. Pandemic versus epidemic influenza mortality: A pattern of changing age distribution. J Infect Dis. 1998; 178:53-60.
6. WHO. Guidelines for the use of seasonal influenza vaccine in humans at risk of H5N1 infection. http://www.who.int/influenza/human_animal_interface/virology_laboratories_and_vaccines/vaccine_use_h5N1_riskgroups/en/ (accessed April 9, 2013).
7. WHO. WHO guidelines for global surveillance of influenza A (H5N1). http://www.who.int/entity/influenza/resources/documents/globalsurveillance.pdf (accessed April 9, 2013).
8. WHO. WHO guidelines for the collection of human specimens for laboratory diagnosis of avian influenza infection. http://www.who.int/influenza/human_animal_interface/virology_laboratories_and_vaccines/guidelines_collection_h5n1_humans/en/index.html (accessed April 9, 2013).
9. WHO. WHO laboratory biosafety guidelines for handling specimens suspected of containing avian influenza A virus. http://www.who.int/influenza/resources/documents/guidelines_handling_specimens/en/index.html (accessed April 9, 2013).
10. WHO. WHO guidance on public health measures in countries experiencing their first outbreaks of H5N1 avian influenza. http://www.who.int/influenza/resources/documents/guidance_publichealthmeasures_h5n1_10_2005/en/index.html (accessed April 9, 2013).
11. WHO. WHO rapid advice guidelines on pharmacological management of humans infected with avian influenza A (H5N1). http://www.who.int/medicines/publications/WHO_PSM_PAR_2006.6.pdf (assessed April 9, 2013).
12. WHO. WHO case definitions for human infections with influenza A (H5N1) virus. http://www.who.int/influenza/resources/documents/case_definition2006_08_29/en/index.html (assessed April 9, 2013).
13. WHO. WHO guidelines for investigation of human cases of avian influenza A (H5N1). http://www.who.int/entity/influenza/resources/documents/WHO_CDS_EPR_GIP_2006_4r1.pdf (assessed April 9, 2013).
14. WHO. Clinical management of human infection with avian influenza A (H5N1) virus. http://www.who.int/entity/influenza/resources/documents/ClinicalManagement07.pdf (assessed April 9, 2013).
15. WHO. Protection of individuals with high poultry contact in areas affected by avian influenza H5N1: Consolidation of pre-existing guidance. http://www.who.int/influenza/resources/documents/guidance_protection_
h5n1_02_2008/en/index.html (assessed April 9, 2013).16. WHO. WHO guidelines for the storage and transport of
human and animal specimens for laboratory diagnosis of suspected avian influenza A infection. http://www.who.int/influenza/resources/documents/transport_storage_specimens/en/index.html (assessed April 9, 2013).
17. WHO. WHO global influenza preparedness plan: the role of WHO and recommendations for national measures before and during pandemics. http://www.who.int/csr/resources/publications/influenza/WHO_CDS_CSR_GIP_2005_5.pdf (assessed April 9, 2013).
18. WHO. Collecting, preserving and shipping specimens for the diagnosis of avian influenza A (H5N1) virus infection. http://www.who.int/entity/csr/resources/publications/surveillance/CDS_EPR_ARO_2006_1.pdf (assessed April 9, 2013).
19. WHO. International health regulations (2005). http://whqlibdoc.who.int/publications/2008/9789241580410_eng.pdf (assessed April 9, 2013).
20. FAO/OIE.WHO. A global strategy for the progressive control of highly pathogenic avian influenza. http://www.oie.int/doc/ged/d2891.pdf (assessed April 7, 2013).
21. WHO. Disease outbreaks by year. http://www.who.int/csr/don/archive/year/en/index.html (assessed April 7 2013).
22. Padhi S, Panigrahi PK, Mahapatra A, Mahapatra S. Avian influenza A (H5N1): A preliminary review. Indian J Med Microbiol. 2004; 22:143-146.
23. WHO. Avian influenza A (H5N1) - update 18: FAO/OIE/WHO technical consultation on the control of avian influenza, situation (human) in Thailand and Viet Nam. http://www.who.int/csr/don/2004_02_05/en/index.html (assessed April 7, 2013).
24. WHO. Disease outbreaks situation in India. http://www.who.int/csr/don/archive/country/ind/en/ (assessed April 8, 2013).
25. Chunsuttiwat S. Response to avian influenza and preparedness for pandemic influenza: Thailand's experience. Respirology. 2008; 13:36-40.
26. The Sate Council of the People's Republic of China. The highly pathogenic avian influenza emergency plan. http://www.gov.cn/xxgk/pub/govpublic/mrlm/200803/t20080328_32348.html (assessed April 9, 2013) (in Chinese).
27. NHFPC of China. Treatment programs of human avian influenza (2005). http://www.moh.gov.cn/mohbgt/pw10509/200804/27436.shtml (assessed April 9, 2013) (in Chinese).
28. NHFPC of China. The emergency plan of people infected with highly pathogenic avian influenza. http://www.moh.gov.cn/mohbgt/pw10609/200804/27711.shtml (assessed April 9, 2013) (in Chinese).
29. Homeland Security Council. National strategy for pandemic influenza. http://www.pandemicflu.gov/plan/pdf/CIKRpandemicInfluenzaGuide.pdf (assessed April 7, 2013).
30. U.S. Department of Health and Human Services. Pandemic influenza plan. http://www.flu.gov/planning-preparedness/federal/hhspandemicinfluenzaplan.pdf (assessed April 7, 2013).
31. European Union council. Council directive 2005/94/EC of 20 December 2005 on community measures for the control of avian influenza and repealing directive 92/40/EEC. http://europa.eu/legislation_summaries/other/l12020_en.htm (assessed April 7, 2013).
32. The Writing Committee of the WHO Consultation on
www.biosciencetrends.com
BioScience Trends. 2013; 7(2):64-76. 74
Human Influenza A/H5. Avian influenza A (H5N1) infection in humans. N Engl J Med 2005; 353:1374-1385.
33. Buxton Bridges C, Katz JM, Seto WH, et al. Risk of influenza A (H5N1) infection among health care Workers exposed to patients with influenza A (H5N1), Hong Kong. J Infect Dis. 2000; 181:344-348.
34. WHO. Clinical management of human infection with avian influenza A (H5N1) virus. http://www.who.int/entity/influenza/resources/documents/SummaryForm07.pdf (assessed April 7, 2013).
35. WHO. Infection control recommendations for avian influenza in health-care facilities. http://apps.who.int/entity/csr/disease/avian_influenza/guidelines/EPR_AM1_E5.pdf (assessed April 7, 2013).
36. Gaglia MA Jr, Cook RL, Kraemer KL, Rothberg MB. Patient knowledge and attitudes about avian influenza in an internal medicine clinic. Public Health. 2008; 122:462-470.
37. Di Giuseppe G, Abbate R, Albano L, Marinelli P, Angelillo IF. A survey of knowledge, attitudes and practices towards avian influenza in an adult population of Italy. BMC Infect Dis. 2008; 8:36.
38. Leslie T, Billaud J, Mofleh J, Mustafa L, Yingst S. Knowledge, attitudes, and practices regarding avian influenza (H5N1), Afghanistan. Emerg Infect Dis. 2008; 14:1459-1461.
39. Ghabili K, Shoja MM, Kamran P. Avian influenza knowledge among medical students, Iran. Emerg Infect Dis. 2008; 14:672-673.
40. Roche. Roche donates a further 2 million treatment courses of antiviral Tamiflu to the WHO for regional stockpiling. http://www.roche.com/media/media_releases/med-cor-2006-01-17.htm (assessed April 9, 2013).
41. Roche. Rapid response stockpile of Tamiflu now ready and available to the World Health Organisation (WHO). http://www.roche.com/media/media_releases/med-cor-2006-04-19.htm (assessed April 9, 2013).
42. NIAID. NIAID announces contracts to develop vaccine against H5N1 avian influenza. http://www.niaid.nih.gov/news/newsreleases/2004/pages/flucontracts.aspx (assessed April 7, 2013).
43. Fauci AS. Pandemic influenza threat and preparedness. Emerg Infect Dis. 2006; 12:73-77.
44. Luke CJ. Subbarao K. Vaccines for pandemic influenza. Emerg Infect Dis. 2006; 12:66-72.
45. Schultz, J. Bird flu vaccine won't precede pandemic. http://www.upi.com/Health_News/2005/11/28/Bird-flu-vaccine-wont-precede-pandemic/UPI-94121133218286/ (assessed April 7, 2013).
46. Enserink M. Avian influenza. 'Pandemic vaccine' appears to protect only at high doses. Science. 2005; 309:996.
47. Gao W, Soloff AC, Lu X, Montecalvo A, Nguyen DC, Matsuoka Y, Robbins PD, Swayne DE, Donis RO, Katz JM, Barratt-Boyes SM, Gambotto A. Protection of mice and poultry from lethal H5N1 avian influenza virus through adenovirus-based immunization. J Virol. 2006; 80:1959-1964.
48. WHO. Antigenic and genetic characteristics of A (H5N1), A (H7N3), A (H9N2) and variant influenza viruses and candidate vaccine viruses developed for potential use in human vaccines. http://www.who.int/entity/influenza/vaccines/virus/201302_h5h7h9_vaccinevirusupdate.pdf (assessed April 9, 2013).
49. WHO. Current WHO phase of pandemic alert (avian influenza H5N1). http://www.who.int/influenza/
preparedness/pandemic/h5n1phase/en/index.html (assessed April 9, 2013).
50. US CDC. Update: Novel Influenza A (H1N1) Virus Infections - Worldwide, May 6, 2009. http://www.cdc.gov/mmwr/preview/mmwrhtml/mm5817a1.htm (assessed April 10, 2013).
51. Scalera NM, Mossad SB. The first pandemic of the 21st century: A review of the 2009 pandemic variant influenza A (H1N1) virus. Postgrad Med. 2009; 121:43-47.
52. WHO. Disease Outbreak News: Pandemic (H1N1) 2009 – update 112. 6 Aug 2010. http://www.who.int/csr/don/2010_08_06/en/index.html (assessed April 10, 2013).
53. WHO. S t ra teg ic advisory group of exper t s on immunization-report of the extraordinary meeting on the influenza A (H1N1) 2009 pandemic, 7 July 2009. Wkly Epidemiol Rec. 2009; 84:301-304.
54. Presanis AM, De Angelis D; New York City Swine Flu Investigation Team, Hagy A, Reed C, Riley S, Cooper BS, Finelli L, Biedrzycki P, Lipsitch M. The severity of pandemic H1N1 influenza in the United States, from April to July 2009: A bayesian analysis. PLoS Med. 2009; 6:e1000207.
55. Hollmann M, Garin O, Galante M, Ferrer M, Dominguez A, Alonso J. Impact of influenza on health-related quality of life among confirmed (H1N1)2009 patients. PLoS One. 2013; 8:e60477.
56. Girard MP, Tam JS, Assossou OM, Kieny MP. The 2009 A (H1N1) influenza virus pandemic: A review. Vaccine. 2010; 28:4895-4902.
57. Bishop JF, Murnane MP, Owen R. Australia's winter with the 2009 pandemic influenza A (H1N1) virus. N Engl J Med. 2009; 361:2591-2594.
58. Libster R, Bugna J, Coviello S, et al . Pediatric hospitalizations associated with 2009 pandemic influenza A (H1N1) in Argentina. N Engl J Med. 2010; 362:45-55.
59. Peiris JS, Poon LL, Guan Y. Emergence of a novel swine-origin influenza A virus (S-OIV) H1N1 virus in humans. J Clin Virol. 2009; 45:169-173.
60. WHO. Epidemiological summary of pandemic influenza A (H1N1) 2009 virus - Ontario, Canada, June 2009. Wkly Epidemiol Rec. 2009; 84:485-492.
61. WHO. Guidance documents on pandemic (H1N1) 2009: Animal-human interface. http://www.who.int/csr/disease/swineflu/guidance/animal/en/index.html (assessed April 10, 2013).
62. WHO. Guidance documents on pandemic (H1N1) 2009: Clinical care. http://www.who.int/csr/disease/swineflu/guidance/clincal/en/index.html (assessed April 10, 2013).
63. WHO. Guidance documents on pandemic (H1N1) 2009: Healthcare management and facilities. http://www.who.int/csr/disease/swineflu/guidance/healthcare_management/en/index.html (assessed April 10, 2013).
64. WHO. Guidance documents on pandemic (H1N1) 2009: Laboratory and virology. http://www.who.int/csr/disease/swineflu/guidance/laboratory/en/index.html (assessed April 10, 2013).
65. WHO. Guidance documents on pandemic (H1N1) 2009: Pandemic preparedness and response. http://www.who.int/csr/disease/swineflu/guidance/pandemic_preparedness/en/index.html (assessed April 10, 2013).
66. WHO. Guidance documents on pandemic (H1N1) 2009: Surveillance and epidemiology. http://www.who.int/csr/disease/swineflu/guidance/surveillance/en/index.html (assessed April 10, 2013).
67. WHO. WHO recommendations for the post-pandemic
www.biosciencetrends.com
BioScience Trends. 2013; 7(2):64-76.75
period. http://www.who.int/csr/disease/swineflu/notes/briefing_20100810/en/index.html (assessed April 10, 2013).
68. Van Kerkhove MD, Ferguson NM. Epidemic and intervention modelling ‒ A scientific rationale for policy decisions? Lessons from the 2009 influenza pandemic. Bull World Health Organ. 2012; 90:306-310.
69. Araz OM, Damien P, Paltiel DA, Burke S, van de Geijn B, Galvani A, Meyers LA. Simulating school closure policies for cost effective pandemic decision making. BMC Public Health. 2012; 12:449.
70. Jackson C, Vynnycky E, Hawker J, Olowokure B, Mangtani P. School closures and influenza: Systematic review of epidemiological studies. BMJ Open. 2013; 3(2): e002149.
71. WHO. Situation updates ‒ pandemic (H1N1) 2009. http://www.who.int/csr/disease/swineflu/updates/en/index.html (assessed April 11, 2013).
72. WHO. Weekly virological update on 05 August 2010. http://www.who.int/csr/disease/swineflu/laboratory06_08_2010/en/index.html (assessed April 11, 2013).
73. Editorial. China's health reforms revisited. Lancet. 2010; 375:1053.
74. Wang B, Xie J, Fang P. Is a mass prevention and control program for pandemic (H1N1) 2009 good value for money? Evidence from the chinese experience. Iran J Public Health. 2012; 41:34-43.
75. Rizzo C, Rota MC, Bella A, Giannitelli S, De Santis S, Nacca G, Pompa MG, Vellucci L, Salmaso S, Declich S. Response to the 2009 influenza A (H1N1) pandemic in Italy. Euro Surveill. 2010; 15:pii:19744.
76. Seef S, Jeppsson A. Is it a policy crisis or it is a health crisis? The egyptian context-analysis of the egyptian health policy for the H1N1 flu pandemic control. Pan Afr Med J. 2013; doi:10.11604/pamj.2013.14.59.1631.
77. Mitchell R, Ogunremi T, Astrakianakis G, Bryce E, Gervais R, Gravel D, Johnston L, Leduc S, Roth V, Taylor G, Vearncombe M, Weir C. Impact of the 2009 influenza A (H1N1) pandemic on canadian health care workers: A survey on vaccination, illness, absenteeism, and personal protective equipment. Am J Infect Control. 2012; 40:611-616.
78. Corace K, Prematunge C, McCarthy A, Nair RC, Roth V, Hayes T, Suh KN, Balfour L, Garber G. Predicting influenza vaccination uptake among health care workers: What are the key motivators? Am J Infect Control. 2013; doi:10.1016/j.ajic.2013.01.014.
79. Sharma R, Kaur S, Sodhi A. Knowledge, behaviour change, and anticipated compliance regarding non-pharmaceutical interventions during pandemic of influenza A H1N1 in Delhi. Lung India. 2012; 29:341-346.
80. Tooher R, Collins JE, Street JM, Braunack-Mayer A, Marshall H. Community knowledge, behaviours and attitudes about the 2009 H1N1 Influenza pandemic: A systematic review. Influenza Other Respi Viruses. 2013; doi:10.1111/irv.12103.
81. WHO. Influenza A (H1N1). http://www.who.int/mediacentre/news/statements/2009/h1n1_20090429/en/index.html (assessed April 11, 2013).
82. WHO. World is better prepared for influenza pandemic. http://www.who.int/dg/speeches/2009/asean_influenza_ah1n1_20090508/en/index.html (assessed April 11, 2013).
83. WHO. Status of candidate vaccine virus development for the current Influenza A(H1N1) virus. http://www.who.
int/csr/resources/publications/swineflu/vaccine_virus_development/en/index.html (assessed April 11, 2013).
84. Stone R. Swine flu outbreak. China first to vaccinate against novel H1N1 virus. Science. 2009; 325:1482-1483.
85. NHFPC of China. 3 confirmed cases of human infection of H7N9 avian influenza. http://www.moh.gov.cn/mohwsyjbgs/s3578/201303/44f25bd6bed14cf082512d8b6258fb3d.shtml (assessed April 12, 2013) (in Chinese).
86. WHO. Human infection with influenza A (H7N9) virus in China ‒ update. http://www.who.int/csr/don/2013_04_11/en/index.html (assessed April 12, 2013).
87. NHFPC of China. The information of human infection of H7N9 avian influenza at 11 April. http://www.moh.gov.cn/mohwsyjbgs/s3578/201304/b122d5a6856e4bb89545ad33615a8800.shtml (assessed April 12, 2013) (in Chinese).
88. WHO. Background and summary of human infection with influenza A (H7N9) virus– As of 5 April 2013. http://www.who.int/influenza/human_animal_interface/update_20130405/en/index.html (assessed April 12, 2013).
89. WHO. Real-time RT-PCR protocol for the detection of A (H7N9) influenza virus. http://www.who.int/influenza/gisrs_laboratory/cnic_realtime_rt_pcr_protocol_a_h7n9.pdf (assessed April 12, 2013).
90. NHFPC of China. The notice on strengthening the prevention and control work of human infection H7N9 avian influenza. http://www.moh.gov.cn/mohwsyjbgs/s3582/201304/392e2a1055c84436945f255f13021717.shtml (assessed April 12, 2013) (in Chinese).
91. NHFPC of China. The diagnosis and treatment scheme of human infection with H7N9 avian influenza (Version 1, 2013). http://www.moh.gov.cn/ewebeditor/uploadfile/2013/04/20130403184130605.doc (assessed April 12, 2013) (in Chinese).
92. NHFPC of China. The guideline of prevention and control of human infection with H7N9 avian influenza in hospital (2013). http://www.moh.gov.cn/ewebeditor/uploadfile/2013/04/20130403184606651.doc (assessed April 12, 2013) (in Chinese).
93. NHFPC of China. The diagnosis and treatment scheme of human infection with H7N9 avian influenza (Version 2, 2013). http://www.moh.gov.cn/ewebeditor/uploadfile/2013/04/20130410212136993.doc (assessed April 12, 2013) (in Chinese).
94. NHFPC o f Ch ina . The d i agnos t i c p rocedure s of human infect ion with H7N9 avian influenza cases. http://www.moh.gov.cn/ewebeditor/uploadfile/2013/04/20130410211001283.docx (assessed April 12, 2013) (in Chinese).
95. CDC of United States. Avian influenza A (H7N9) virus. http://www.cdc.gov/flu/avianflu/h7n9-virus.htm (assessed April 12, 2013).
96. CDC of United States. Human infections with novel influenza A (H7N9) viruses. http://emergency.cdc.gov/HAN/han00344.asp (assessed April 12, 2013).
97. CDC of United States. Interim guidance on case definitions to be used for novel influenza A (H7N9) case investigations in the United States. http://www.cdc.gov/flu/avianflu/h7n9-case-definitions.htm (assessed April 12, 2013).
98. CDC of United States. Interim guidance for infection control within healthcare settings when caring for patients with confirmed, probable, or cases under investigation of avian influenza A (H7N9) virus infection. http://www.cdc.gov/flu/avianflu/h7n9-infection-control.htm (assessed April 12, 2013).

www.biosciencetrends.com
BioScience Trends. 2013; 7(2):64-76. 76
99. CFDA. Anti-influenza drug peramivir sodium chloride injection approved. http://www.sfda.gov.cn/WS01/CL0051/79543.html (assessed April 13, 2013) (in Chinese).
100. NHFPC of China. Ministry of science and technology of the People's Republic of China launch a science and technology research for H7N9 avian influenza virus.
http://www.moh.gov.cn/mohbgt/wzbd/201304/6489ef372b8a445690d69a5c023cd8a4.shtml (assessed April 12, 2013) (in Chinese).
(Received April 2, 2013; Revised April 13, 2013; Accepted April 15, 2013)
www.biosciencetrends.com
BioScience Trends. 2013; 7(2):77-81.77
Primary pathogenicity analysis of a Chinese Entamoeba histolytica isolate
Muxia Luo1, Meng Feng1,2, Xiangyang Min1, Xueping Li1, Junlong Cai1, Hiroshi Tachibana2, Xunjia Cheng1,2,*
1 Department of Medical Microbiology and Parasitology, Shanghai Medical College of Fudan University, Shanghai, China;2 Department of Infectious Diseases, Tokai University School of Medicine, Isehara, Kanagawa, Japan.
Luo MX and Feng M contributed equally to this work.*Address correspondence to:Dr. Xunjia Cheng, Department of Medical Microbiology and Parasitology, Shanghai Medical College of Fudan University, Shanghai 200032, China.E-mail: [email protected]
1. Introduction
The enteric protozoan parasite Entamoeba histolytica causes an estimated 50 million cases of amebic colitis and extraintestinal abscess, which result in 100,000 deaths annually (1). Entamoeba dispar is morphologically indistinguishable from E. histolytica, but it is nonpathogenic (2,3). E. histolytica infections have different clinical outcomes. Most infections remain asymptomatic, whereas some infected patients develop diarrhea and dysentery. Only a few infections develop extra-intestinal complications, such as liver abscess. Several E. histolytica infections in China are reported every year. The average infection rate of amebiasis in China was 0.949% in the 1990s. A 2006
Summary This study is the first to isolate an Entamoeba histolytica strain from Chinese amoebic patients and to conduct a detailed examination of its virulence. A fecal sample that contains cysts of E. histolytica was obtained from Guangxi province. The sample was cultured axenically and then cloned by limiting dilution, and named as XLAC. In vitro and in vivo tests were conducted to evaluate the virulence of the Entamoeba isolate. The E. histolytica strain XLAC was successfully cloned and cultured axenically. DNA regions that contain hexokinase, glucose-6-phosphate isomerase, phosphoglucomutase, and heavy subunit of lectin genes were amplified by PCR. The PCR products were then sequenced. Virulence analysis suggested that the XLAC strain was similar to the HM1:IMSS strain at the genetic level. In vitro and in vivo tests also implicated these strains to be similar. These findings may be attributed to the low expression levels of pathogenic genes obtained through real-time PCR. The XLAC strain restored its virulence after it was injected into hamster liver. This study may be a good model for studying virulence changes in E. histolytica.
Keywords: Entamoeba histolytica, lectin, apoptosis, virulence
DOI: 10.5582/bst.2013.v7.2.77Brief Report
survey of HIV-positive patients in China showed a serum-positive rate of 7.9% for E. histolytica (4). A recent study in seven provinces in China has shown a serum-positive rate of 0.53% to 9.04% for E. histolytica (5). However, insufficient pathogenic information on Chinese E. histolytica strains is currently available. The E. histolytica strain utilized in the current paper was obtained from Guangxi Province. In vitro and in vivo tests were conducted to evaluate the virulence of the Entamoeba isolate.
2. Materials and Methods
2.1. Sample collection
Stool and blood samples were obtained from 120 villagers in August, 2011 in Xilin County, Guangxi Province, China.
2.2. Indirect fluorescence antibody assay (IFA)
The IFA test was performed as previously described using formalin-fixed trophozoites smeared on glass
www.biosciencetrends.com
BioScience Trends. 2013; 7(2):77-81.
slides. Fluorescein isothiocyanate-conjugated goat immunoglobulin G (IgG) to whole human IgG (MP Biomedicals-Cappel, Solon, OH, USA) was used as the second antibody.
2.3. Culture conditions
A fecal sample that contains Entamoeba cysts was suspended in water for 24 h to remove Blastocystis spp. The sample was then cultured in modified Tanabe-Chiba medium (6) at 37°C. The trophozoites were treated with a cocktail of antibiotics and then cultured monoxenically with live Crithidia fasciculata in TYI-S-33 medium supplemented with 15% adult bovine serum (Gibco, Life Technologies, Carlsbad, CA, USA) at 37°C. The trophozoites of the strain were cultured axenically in TYI-S-33 medium and then cloned through limited dilution.
2.4. PCR analysis and sequence
Genomic DNA was extracted from the axenic cultures using a QIAamp DNeasy kit (Qiagen, Valencia, CA, USA) (7). The genomic DNA was subjected to PCR for the amplification of hexokinase (HXK), glucose-6-phosphate isomerase (GPI), phosphoglucomutase (PGM), and heavy subunit of lectin genes (LecHgl). The primers and PCR conditions for E. histolytica were based on previously described procedures (8,9). PCR was performed briefly in a 50 μL reaction mixture using TaKaRa Ex-taq® DNA Polymerase (Takara, Dalian, China). The PCR products were subjected to direct sequencing after purification using a QIAquick PCR purification kit (Qiagen) using a BigDye Terminator v3.1 Cycle sequencing kit (Applied Biosystems, Carlsbad, CA, USA). The reactions were run on an ABI Prism 3100 Genetic Analyzer (Applied Biosystems). Sequence data were analyzed using ClustalX Ver. 1.83 (Conway Institute UCD Dublin, Dublin, Ireland).
2.5. Erythrophagocytosis assay
Type O human erythrocytes from healthy donors were washed and suspended in TYI-S-33 medium. Erythrocytes (2 × 10⁷) were incubated with 2 × 10⁵ trophozoites in 0.4 mL TYI-S-33 medium at 37°C for 10 min. After being lysed with free and adherent erythrocytes through the addition of distilled water, the trophozoites were fixed and stained with a 3,3-diaminobenzidine (Sigma-Aldrich, St. Louis, MO, USA) solution containing hydrogen peroxide (Sinopharm Group Co. Ltd., Shanghai, China). The number of ingested erythrocytes was determined by examining 300 trophozoites. The experiments were repeated three times. Statistical analysis was performed using Student's t-test.
2.6. Erythrocyte adherence assay
The trophozoites (2 × 10⁵) were incubated with 2 × 10⁷ type O human erythrocytes for 5 min at 4°C. The erythrocyte-trophozoite suspension was then fixed in 2.5% glutaraldehyde (Sigma-Aldrich). Afterwards, the erythrocytes were washed with PBS and stained with a 3,3-diaminobenzidine (Sigma-Aldrich) solution containing 0.2% H2O2 (Sinopharm Group Co. Ltd.). The number of amoeba with at least three erythrocytes was scored by examining 300 trophozoites. The experiments were repeated three times. Statistical analysis was performed using Student's t-test.
2.7. Apoptosis in Jurkat cells
Entamoeba trophozoites were washed with and suspended in RPMI 1640 medium (Gibco, Life Technologies). The trophozoites (2 × 10⁴) were incubated with 105 Jurkat cells (The Cell Bank of Chinese Academy of Science, Shanghai, China) for 20 min at 37°C. The cells were then washed twice and stained with FITC-conjugated annexin V (Sigma-Aldrich). The numbers of apoptosis and total cells were determined under a microscope. The experiments were repeated three times. Statistical analysis was performed using Student's t-test.
2.8. Expression of the heavy subunit of lectin genes
Total RNAs of E. histolytica trophozoites were isolated using an RNeasy mini kit (Qiagen) and used for cDNA synthesis using a GeneAmp RNA PCR kit (Applied Biosystems). A reaction mixture that contains SYBR Premix Ex Taq (Takara), specific primers, and the cDNAs was used for quantitative real-time PCR analysis. The primer pairs used were previously described (10). Forty cycles of amplification were performed using the ABI PRISM 7500 Sequence Detection System (Applied Biosystems). The fluorescence intensity in each cycle was also recorded using the ABI PRISM 7500 Sequence Detection System (Applied Biosystems). The relative quantification of the data obtained from the ABI PRISM 7500 Sequence Detection System software version 2.0.1 (Applied Biosystems) was performed by the comparative CT method using actin genes as internal standards. The experiments, including the culture of trophozoites and the isolation of RNA, were repeated three times.
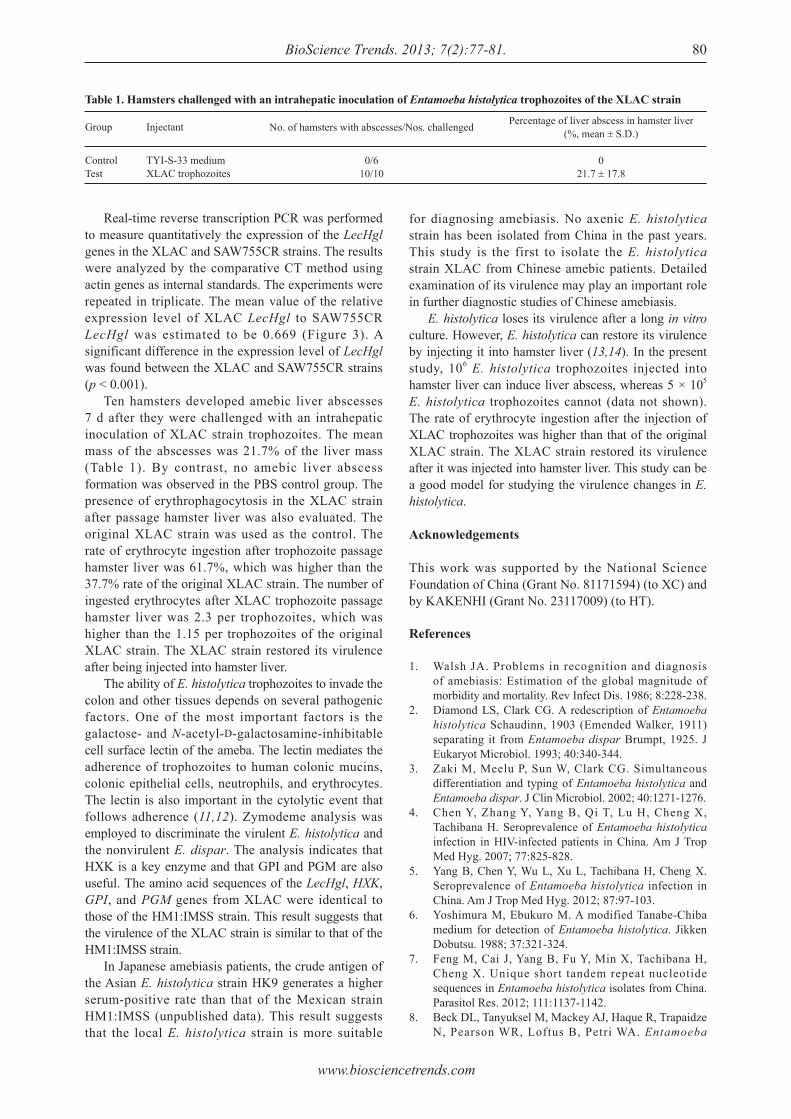
2.9. Hepatic challenge with E. histolytica
Sixteen 6-week-old male hamsters (Shanghai Songlian Experimental Animal Farm, Shanghai, China) were used. The hamsters were challenged with intrahepatic inoculation of 106 E. histolytica trophozoites into the left lobe of the liver. The hamsters were sacrificed 7 d after the challenge. The percentage of the abscessed
78
www.biosciencetrends.com
BioScience Trends. 2013; 7(2):77-81.79
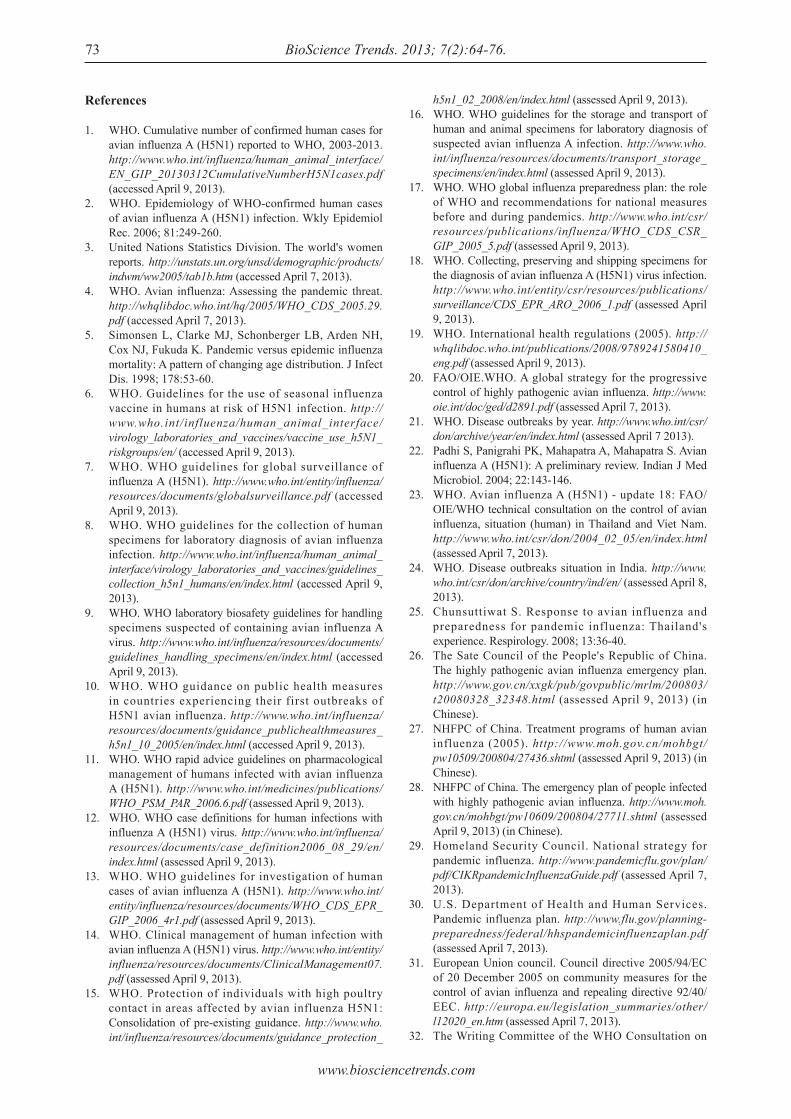
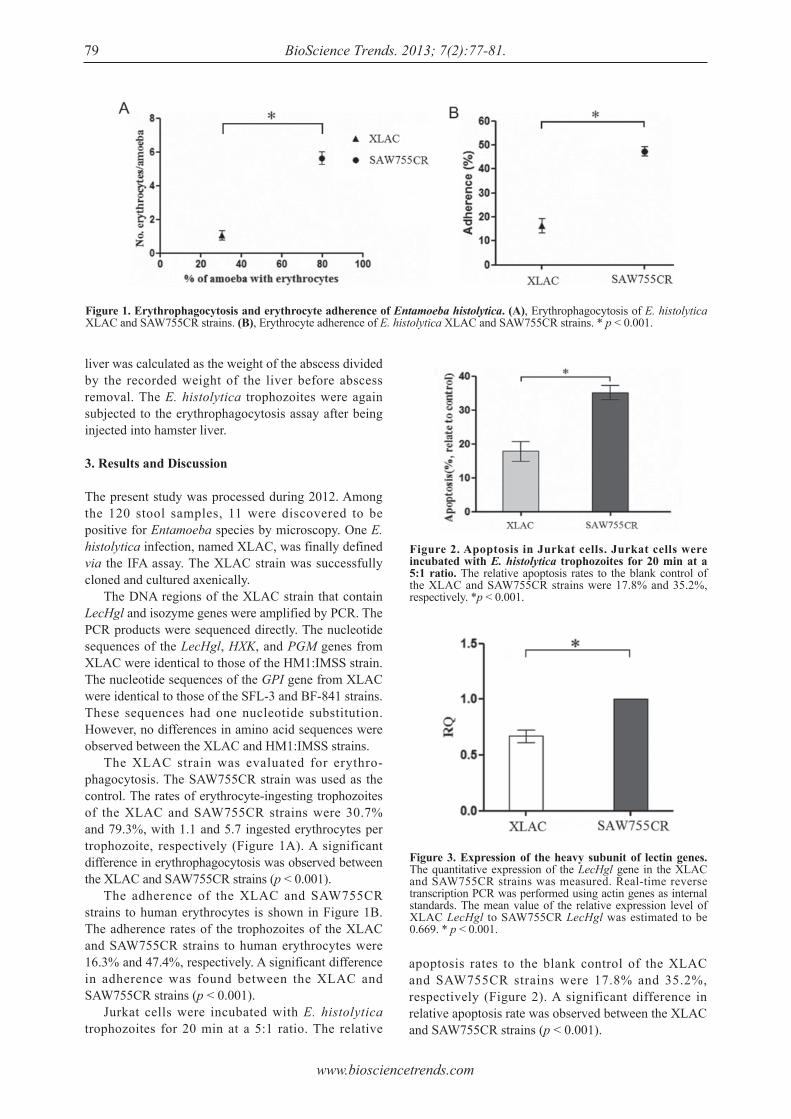
apoptosis rates to the blank control of the XLAC and SAW755CR strains were 17.8% and 35.2%, respectively (Figure 2). A significant difference in relative apoptosis rate was observed between the XLAC and SAW755CR strains (p < 0.001).
liver was calculated as the weight of the abscess divided by the recorded weight of the liver before abscess removal. The E. histolytica trophozoites were again subjected to the erythrophagocytosis assay after being injected into hamster liver.
3. Results and Discussion
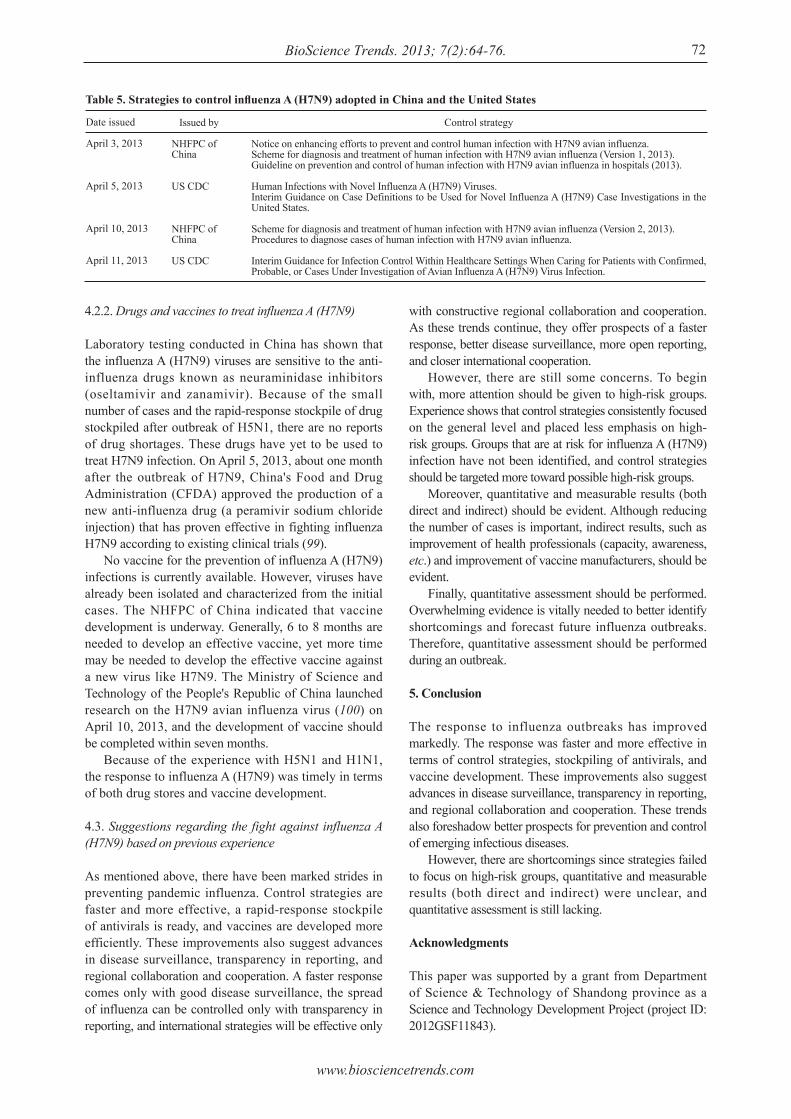
The present study was processed during 2012. Among the 120 stool samples, 11 were discovered to be positive for Entamoeba species by microscopy. One E. histolytica infection, named XLAC, was finally defined via the IFA assay. The XLAC strain was successfully cloned and cultured axenically. The DNA regions of the XLAC strain that contain LecHgl and isozyme genes were amplified by PCR. The PCR products were sequenced directly. The nucleotide sequences of the LecHgl, HXK, and PGM genes from XLAC were identical to those of the HM1:IMSS strain. The nucleotide sequences of the GPI gene from XLAC were identical to those of the SFL-3 and BF-841 strains. These sequences had one nucleotide substitution. However, no differences in amino acid sequences were observed between the XLAC and HM1:IMSS strains. The XLAC strain was evaluated for erythro-phagocytosis. The SAW755CR strain was used as the control. The rates of erythrocyte-ingesting trophozoites of the XLAC and SAW755CR strains were 30.7% and 79.3%, with 1.1 and 5.7 ingested erythrocytes per trophozoite, respectively (Figure 1A). A significant difference in erythrophagocytosis was observed between the XLAC and SAW755CR strains (p < 0.001). The adherence of the XLAC and SAW755CR strains to human erythrocytes is shown in Figure 1B. The adherence rates of the trophozoites of the XLAC and SAW755CR strains to human erythrocytes were 16.3% and 47.4%, respectively. A significant difference in adherence was found between the XLAC and SAW755CR strains (p < 0.001). Jurkat cells were incubated with E. histolytica trophozoites for 20 min at a 5:1 ratio. The relative
Figure 1. Erythrophagocytosis and erythrocyte adherence of Entamoeba histolytica. (A), Erythrophagocytosis of E. histolytica XLAC and SAW755CR strains. (B), Erythrocyte adherence of E. histolytica XLAC and SAW755CR strains. * p < 0.001.
Figure 2. Apoptosis in Jurkat cells. Jurkat cells were incubated with E. histolytica trophozoites for 20 min at a 5:1 ratio. The relative apoptosis rates to the blank control of the XLAC and SAW755CR strains were 17.8% and 35.2%, respectively. *p < 0.001.
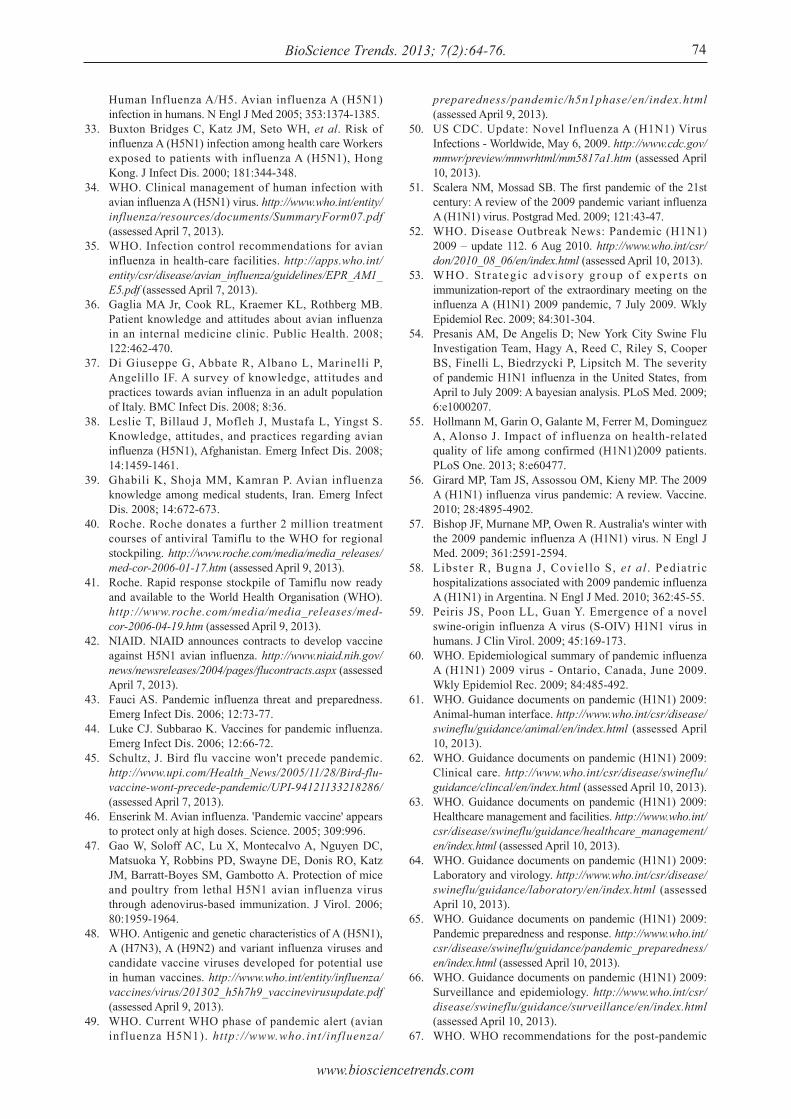
Figure 3. Expression of the heavy subunit of lectin genes. The quantitative expression of the LecHgl gene in the XLAC and SAW755CR strains was measured. Real-time reverse transcription PCR was performed using actin genes as internal standards. The mean value of the relative expression level of XLAC LecHgl to SAW755CR LecHgl was estimated to be 0.669. * p < 0.001.
www.biosciencetrends.com
BioScience Trends. 2013; 7(2):77-81. 80
Real-time reverse transcription PCR was performed to measure quantitatively the expression of the LecHgl genes in the XLAC and SAW755CR strains. The results were analyzed by the comparative CT method using actin genes as internal standards. The experiments were repeated in triplicate. The mean value of the relative expression level of XLAC LecHgl to SAW755CR LecHgl was estimated to be 0.669 (Figure 3). A significant difference in the expression level of LecHgl was found between the XLAC and SAW755CR strains (p < 0.001). Ten hamsters developed amebic liver abscesses 7 d after they were challenged with an intrahepatic inoculation of XLAC strain trophozoites. The mean mass of the abscesses was 21.7% of the liver mass (Table 1). By contrast, no amebic liver abscess formation was observed in the PBS control group. The presence of erythrophagocytosis in the XLAC strain after passage hamster liver was also evaluated. The original XLAC strain was used as the control. The rate of erythrocyte ingestion after trophozoite passage hamster liver was 61.7%, which was higher than the 37.7% rate of the original XLAC strain. The number of ingested erythrocytes after XLAC trophozoite passage hamster liver was 2.3 per trophozoites, which was higher than the 1.15 per trophozoites of the original XLAC strain. The XLAC strain restored its virulence after being injected into hamster liver. The ability of E. histolytica trophozoites to invade the colon and other tissues depends on several pathogenic factors. One of the most important factors is the galactose- and N-acetyl-D-galactosamine-inhibitable cell surface lectin of the ameba. The lectin mediates the adherence of trophozoites to human colonic mucins, colonic epithelial cells, neutrophils, and erythrocytes. The lectin is also important in the cytolytic event that follows adherence (11,12). Zymodeme analysis was employed to discriminate the virulent E. histolytica and the nonvirulent E. dispar. The analysis indicates that HXK is a key enzyme and that GPI and PGM are also useful. The amino acid sequences of the LecHgl, HXK, GPI, and PGM genes from XLAC were identical to those of the HM1:IMSS strain. This result suggests that the virulence of the XLAC strain is similar to that of the HM1:IMSS strain. In Japanese amebiasis patients, the crude antigen of the Asian E. histolytica strain HK9 generates a higher serum-positive rate than that of the Mexican strain HM1:IMSS (unpublished data). This result suggests that the local E. histolytica strain is more suitable
for diagnosing amebiasis. No axenic E. histolytica strain has been isolated from China in the past years. This study is the first to isolate the E. histolytica strain XLAC from Chinese amebic patients. Detailed examination of its virulence may play an important role in further diagnostic studies of Chinese amebiasis. E. histolytica loses its virulence after a long in vitro culture. However, E. histolytica can restore its virulence by injecting it into hamster liver (13,14). In the present study, 106 E. histolytica trophozoites injected into hamster liver can induce liver abscess, whereas 5 × 10⁵ E. histolytica trophozoites cannot (data not shown). The rate of erythrocyte ingestion after the injection of XLAC trophozoites was higher than that of the original XLAC strain. The XLAC strain restored its virulence after it was injected into hamster liver. This study can be a good model for studying the virulence changes in E. histolytica.
Acknowledgements
This work was supported by the National Science Foundation of China (Grant No. 81171594) (to XC) and by KAKENHI (Grant No. 23117009) (to HT).
References
1. Walsh JA. Problems in recognition and diagnosis of amebiasis: Estimation of the global magnitude of morbidity and mortality. Rev Infect Dis. 1986; 8:228-238.
2. Diamond LS, Clark CG. A redescription of Entamoeba histolytica Schaudinn, 1903 (Emended Walker, 1911) separating it from Entamoeba dispar Brumpt, 1925. J Eukaryot Microbiol. 1993; 40:340-344.
3. Zaki M, Meelu P, Sun W, Clark CG. Simultaneous differentiation and typing of Entamoeba histolytica and Entamoeba dispar. J Clin Microbiol. 2002; 40:1271-1276.
4. Chen Y, Zhang Y, Yang B, Qi T, Lu H, Cheng X, Tachibana H. Seroprevalence of Entamoeba histolytica infection in HIV-infected patients in China. Am J Trop Med Hyg. 2007; 77:825-828.
5. Yang B, Chen Y, Wu L, Xu L, Tachibana H, Cheng X. Seroprevalence of Entamoeba histolytica infection in China. Am J Trop Med Hyg. 2012; 87:97-103.
6. Yoshimura M, Ebukuro M. A modified Tanabe-Chiba medium for detection of Entamoeba histolytica. Jikken Dobutsu. 1988; 37:321-324.
7. Feng M, Cai J, Yang B, Fu Y, Min X, Tachibana H, Cheng X. Unique short tandem repeat nucleotide sequences in Entamoeba histolytica isolates from China. Parasitol Res. 2012; 111:1137-1142.
8. Beck DL, Tanyuksel M, Mackey AJ, Haque R, Trapaidze N, Pearson WR, Loftus B, Petri WA. Entamoeba
Table 1. Hamsters challenged with an intrahepatic inoculation of Entamoeba histolytica trophozoites of the XLAC strain
Group
ControlTest
Injectant
TYI-S-33 mediumXLAC trophozoites
No. of hamsters with abscesses/Nos. challenged
0/610/10
Percentage of liver abscess in hamster liver (%, mean ± S.D.)
021.7 ± 17.8
www.biosciencetrends.com
BioScience Trends. 2013; 7(2):77-81.81
histolytica: Sequence conservation of the Gal/GalNAc lectin from clinical isolates. Exp Parasitol. 2002; 101:157-163.
9. Tachibana H, Yanagi T, Pandey K, Cheng XJ, Kobayashi S, Sherchand JB, Kanbara H. An Entamoeba sp. Strain isolated from rhesus monkey is virulent but genetically different from Entamoeba histolytica. Mol Biochem Parasitol. 2007; 153:107-114.
10. Beck DL, Boettner DR, Dragulev B, Haque R, Trapaidze N, Pearson WR, Loftus B, Petri WA. Identification and gene expression analysis of a large family of transmembrane kinases related to the Gal/GalNAc lectin in Entamoeba histolytica. Eukaryot Cell. 2005; 4:722-732.
11. Petri WA, Haque R, Mann BJ. The Bittersweet interface of parasite and host: Lectin-Carbohydrate interactions during Human Invasion by the parasite Entamoeba
histolytica. Annu Rev Microbiol. 2002; 56:39-64.12. Stanley SL Jr. Amoebiasis. Lancet. 2003; 22:1025-1034.13. González-Garza MT, Castro-Garza J, Cruz-Vega DE,
Vargas-Villarreal J, Carranza-Rosales P, Mata-Cárdenas BD, Siller-Campos L, Said-Fernández S. Entamoeba histolytica : Diminution of erythrophagocytosis, phospholipase A2, and hemolytic activities is related to virulence impairment in long-term axenic cultures. Exp Parasitol. 2000; 96:116-119.
14. Olivos A, Ramos E, Nequiz M, Barba C, Tello E, Castañón G, González A, Martínez RD, Montfort I, Pérez-Tamayo R. Entamoeba histolytica: Mechanism of decrease virulence of axenic cultures maintained for prolonged periods. Exp Parasitol. 2005; 110:309-312.
(Received March 20, 2013; Revised April 7, 2013; Accepted April 12, 2013)
www.biosciencetrends.com
BioScience Trends. 2013; 7(2):82-88. 82
Detection of group 2 Dermatophagoides pteronyssinus allergen for environmental monitoring of dust mite infestation
En-Chih Liao1, Yi-Hsueh Lin2, Jaw-Ji Tsai1,2,3,*
1 Department of Medical Research, Taichung Veterans General Hospital, Taichung, Taiwan;2 Institute of Clinical Medicine, National Yang Ming University, Taipei, Taiwan;3 College of Life Sciences, National Chung Hsing University, Taichung, Taiwan.
*Address correspondence to:Dr. Jaw-Ji Tsai, Department of Medical Research, Taichung Veterans General Hospital, #160, Section 3, Chung-Kang Road, Taichung, Taiwan 40705.E-mail: [email protected]
1. Introduction
The prevalence of asthma in Taiwan has increased from 1.3% in 1974, to 13.1% in 2004 with a one percent increase annually over the past decade (1). The predominant dust mites in Taiwan that have been implicated in allergy are Dermatophagoides pteronyssinus and Dermatophagoides farinae (2). The climate is warm (average temperature: 22°C) and humid
(average relative humidity: 76%), more than 90% of children with asthma have positive skin test responses to house dust mite (HDM), and D. pteronyssinus was found to be the primary species accounting for 78% of house dust mite (HDM) in Taipei (3). At least 22 allergenic components in house dust mites have been cloned and identified (4). Among them, more than 80% of the HDM-allergic children with asthma have positive skin test reactions to group 1 and group 2 (Der p 1 and Der p 2) (5). Both in vitro IgE binding studies and in vivo skin tests revealed that more than 90% of the allergic children with asthma and mite allergy in Taiwan reacted to both Der p 1 and Der p 2 (6). The occurrence and severity of asthma symptoms are related to environmental allergens (7). Aeroallergen
Summary Aeroallergen avoidance has been promoted in order to prevent sensitization and the correlation between the level of allergen exposure and sensitization has been reported. The aims of this study were to monitor environmental mite infestation and to design an effective Der p 2 detection kit to estimate the number of mites in house dust samples. House dust samples were collected from 6 carpets and 2 mattresses monthly from April 2010 to March 2011. The total number of mites was counted under microscopes and Der p 2 concentrations were measured using Der p 2 ELISA kits. The detection kit was constituted using Der p 2 specific mouse monoclonal antibody as capture antibody, and rabbit polyclonal antibody as detection antibody. Both Der p crude extract and rDer p 2 were used as internal standards. The number of mites in the dust samples was significantly higher in the mattresses as compared with that in the carpets and the total number of dust mites was higher in the summer than any other seasons. The concentration of Der p 2 components in Der p crude extract was analyzed and the results showed that each gram of Der p crude extract contained 53.4 mg of Der p 2. When the number of mites and Der p 2 concentration were measured for the correlation analysis, the results showed that there was a good correlation between Der p 2 and number of mites with R2 = 0.9667. Dust mites were significantly increased in the dust samples collected from mattresses especially in the summer. The good correlation between Der p 2 concentration and mite numbers indicated that the measurement of Der p 2 can be used to replace direct mite counting. Using the Der p 2 detection method to monitor environmental mite infestation may be beneficial for allergic subjects to prevent disease activation.
Keywords: Dermatophagoides pteronyssinus, Der p 2, house dust mites, environmental allergen
DOI: 10.5582/bst.2013.v7.2.82Original Article
www.biosciencetrends.com
BioScience Trends. 2013; 7(2):82-88.
avoidance has been promoted in order to avoid sensitization, and a correlation between the level of allergen exposure and sensitization has been shown previously (8). It is important to monitor the environmental allergen Der p in house dust. Our previous findings showed that dust mites increased in July and August and decreased in the winter, as determined by direct mite count in the dust sample collected from households of asthmatic patients (2). It has been reported that a seasonal variation of Der p 1 was found as determined by ELISA based immunoassay. However, there were no seasonal variations in Der p 5 level (5,6). This discrepancy may be due to the different characteristics of Der p 1 and Der p 5. The protein concentration of each allergenic component might be different due to their enzymatic activity in the dust. Since it has been reported that Der p 2 was present in the mite body and can be used as an indicator of number of mites in the dust samples, it is feasible to use Der p 2 concentration to reflect mite count in the dust (9). A variety of techniques have been developed to measure levels of specific allergens in the environment using ELISA-based immunoassays for major allergens, such as Der p and Der f 1 and 2, Fel d 1, Bla g 1 and 2, Can f 1, Mus m 1, and Rat n 1 (10). There were high sequences of homology regarding mite group 2 allergens (Der p 2 and Der f 2) according to structure analysis. The crude extracts of D. pteronyssinus and D. farinae could be recognized by MoAb-C1 (generated by Der p 2) with a molecular weight of 16 kDa in our previous study, and therefore it is feasible to use these antibodies which are prepared from group 2 allergen to detect group 2 allergen in house dust (11). In this study both monoclonal antibody and polyclonal antibodies were generated for the development of the Der p 2 ELISA kit. The aim of this study was to develop an effective detection kit to measure Der p 2 concentrations in the dust samples and to correlate these concentrations with mite numbers counted using an inverted phase microscope.
2. Materials and Methods
2.1. Preparation of mite extracts
D. pteronyssinus was obtained from Allergen Pharmacia (Uppsala, Sweden). Mites were extracted by homogenizing after resuspending in phosphate-buffered saline (PBS) containing aprotinin (0.1 IU/mL; Sigma Chemicals, St. Louis, MO, USA) and phenylmethylsulfonyl fluoride (1 mmol/L; Sigma). After centrifugation at 10,000 g for 30 min, the supernatant was dialyzed against 0.05 mol/L of ammonium carbonate, pH 8.0. It was then freeze-dried in aliquots and stored at 4°C until use. The protein content was determined by Lowry's method, using bovine serum albumin as is standard.
2.2. Recombinant Der p 2 preparation
The cDNA of group 2 D. pteronyssinus allergen (Der p 2) was cloned into the commercial expression vector pIC9 (Invitrogen, USA) for the extracellular expression in the yeast Pichia pastoris according to the instruction manual. Expression of rDer p 2 by fermentation cultures was generated. In brief, fermentation was performed in a 1,000 mL flask with 200 mL buffered glycerol-complex (BMGY) medium (Invitrogen, USA). The temperature was maintained at 30°C and the concentration of dissolved oxygen (DO) was maintained at 35% by DO-agitation. The pH was adjusted to 7.0 by 15% NH3H2O. Fermentation was started by adding 200 μL of seed culture to the 200 mL of BMGY. After complete consumption of glycerol in the medium, a glycerol fed-batch phase was initiated by addition of 50% glycerol. Expression of recombinant Der p 2 was induced by the addition of methanol after glycerol was exhausted again. Purified recombinant protein Der p 2 was prepared as previous described (12). The cell-free supernatant was collected and the protein components were fractionated through ammonium sulfate (50%) precipitation and centrifugation. The pellet was dissolved in PBS buffer and dialysis against PBS buffer. The proteins will be then concentrated by Amicon Ultra centrifugal filter devices with an exclusion size of 10 kDa (Millipore, Bedford, MA). The addition rate was adjusted according to pH and DO. One milliliter of the culture was withdrawn to determine rDer p 2 expression using SDS-PAGE analysis.
2.3. Monoclonal and polyclonal antibody production
Monoclonal antibodies (MoAbs named as C1) against Der p 2 were prepared as previously described (13) and its immunoglobulin isotype belonged to IgG1 kappa. Briefly, spleen cells obtained from BALB/c mice immunized with the rDer p 2 were fused with murine plasmacytoma NS-1 cells in the presence of polyethylene glycol (molecular weight 1, 500 daltons; Merck, Hohenbrunn, Germany). Antibody-producing hybrid cells were screened using the enzyme-linked immunosorbent assay (ELISA) and recombinant GST-Der p 2 and GST alone. Briefly, hybridomas producing MoAbs were expanded and the Der p 2 specificity of the MoAbs was determined by ELISA with rDer p 2. Polyclonal antibody anti-rDer p 2 was obtained from a New Zealand rabbit, which was injected once subcutaneously with rDer p 2 emulsified with primary complete Freund's adjuvant (10 mL, Sigma, St. Louis, MO, USA) and boosted incomplete Freund's adjuvant (10 mL, Sigma, St. Louis, MO, USA) once in every two weeks for a total of 3 times. Rabbit serum was obtained and store in −80°C before use, after the last immunization.
83
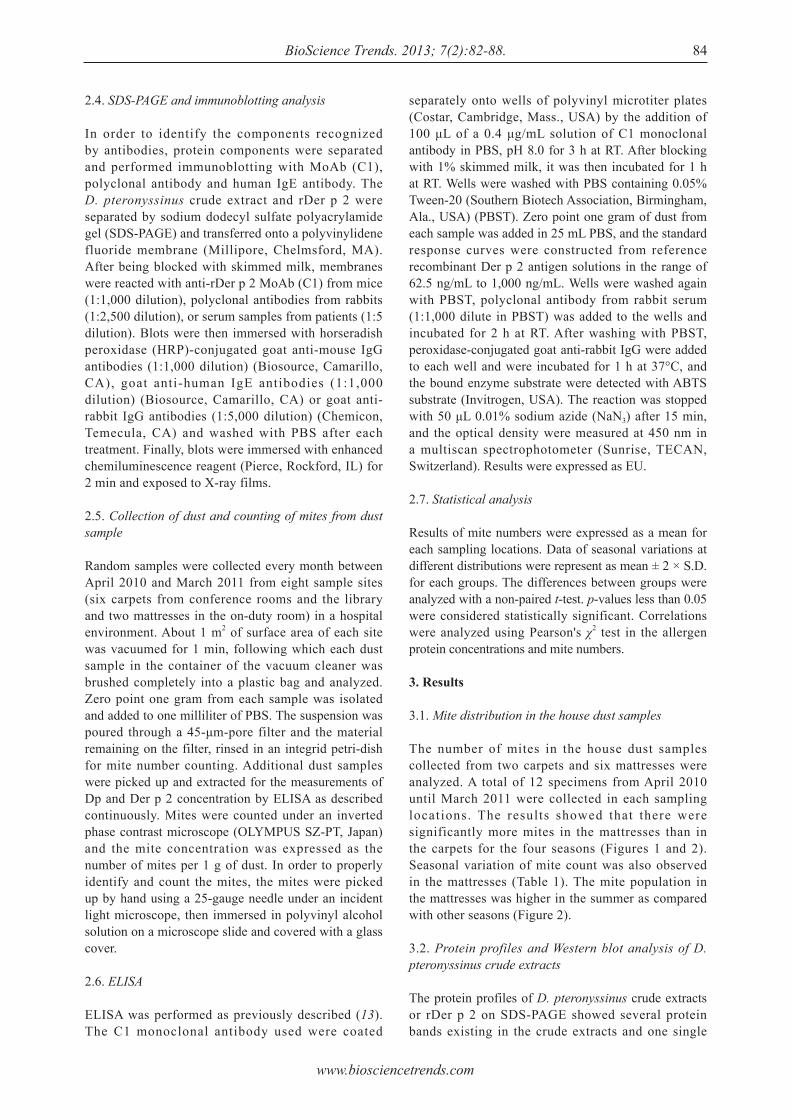
www.biosciencetrends.com
BioScience Trends. 2013; 7(2):82-88. 84
separately onto wells of polyvinyl microtiter plates (Costar, Cambridge, Mass., USA) by the addition of 100 μL of a 0.4 μg/mL solution of C1 monoclonal antibody in PBS, pH 8.0 for 3 h at RT. After blocking with 1% skimmed milk, it was then incubated for 1 h at RT. Wells were washed with PBS containing 0.05% Tween-20 (Southern Biotech Association, Birmingham, Ala., USA) (PBST). Zero point one gram of dust from each sample was added in 25 mL PBS, and the standard response curves were constructed from reference recombinant Der p 2 antigen solutions in the range of 62.5 ng/mL to 1,000 ng/mL. Wells were washed again with PBST, polyclonal antibody from rabbit serum (1:1,000 dilute in PBST) was added to the wells and incubated for 2 h at RT. After washing with PBST, peroxidase-conjugated goat anti-rabbit IgG were added to each well and were incubated for 1 h at 37°C, and the bound enzyme substrate were detected with ABTS substrate (Invitrogen, USA). The reaction was stopped with 50 μL 0.01% sodium azide (NaN3) after 15 min, and the optical density were measured at 450 nm in a multiscan spectrophotometer (Sunrise, TECAN, Switzerland). Results were expressed as EU.
2.7. Statistical analysis
Results of mite numbers were expressed as a mean for each sampling locations. Data of seasonal variations at different distributions were represent as mean ± 2 × S.D. for each groups. The differences between groups were analyzed with a non-paired t-test. p-values less than 0.05 were considered statistically significant. Correlations were analyzed using Pearson's χ2 test in the allergen protein concentrations and mite numbers.
3. Results
3.1. Mite distribution in the house dust samples
The number of mites in the house dust samples collected from two carpets and six mattresses were analyzed. A total of 12 specimens from April 2010 until March 2011 were collected in each sampling locations. The results showed that there were significantly more mites in the mattresses than in the carpets for the four seasons (Figures 1 and 2). Seasonal variation of mite count was also observed in the mattresses (Table 1). The mite population in the mattresses was higher in the summer as compared with other seasons (Figure 2).
3.2. Protein profiles and Western blot analysis of D. pteronyssinus crude extracts
The protein profiles of D. pteronyssinus crude extracts or rDer p 2 on SDS-PAGE showed several protein bands existing in the crude extracts and one single
2.4. SDS-PAGE and immunoblotting analysis
In order to identify the components recognized by antibodies, protein components were separated and performed immunoblotting with MoAb (C1), polyclonal antibody and human IgE antibody. The D. pteronyssinus crude extract and rDer p 2 were separated by sodium dodecyl sulfate polyacrylamide gel (SDS-PAGE) and transferred onto a polyvinylidene fluoride membrane (Millipore, Chelmsford, MA). After being blocked with skimmed milk, membranes were reacted with anti-rDer p 2 MoAb (C1) from mice (1:1,000 dilution), polyclonal antibodies from rabbits (1:2,500 dilution), or serum samples from patients (1:5 dilution). Blots were then immersed with horseradish peroxidase (HRP)-conjugated goat anti-mouse IgG antibodies (1:1,000 dilution) (Biosource, Camarillo, CA), goat anti-human IgE antibodies (1:1,000 dilution) (Biosource, Camarillo, CA) or goat anti-rabbit IgG antibodies (1:5,000 dilution) (Chemicon, Temecula, CA) and washed with PBS after each treatment. Finally, blots were immersed with enhanced chemiluminescence reagent (Pierce, Rockford, IL) for 2 min and exposed to X-ray films.
2.5. Collection of dust and counting of mites from dust sample
Random samples were collected every month between April 2010 and March 2011 from eight sample sites (six carpets from conference rooms and the library and two mattresses in the on-duty room) in a hospital environment. About 1 m2 of surface area of each site was vacuumed for 1 min, following which each dust sample in the container of the vacuum cleaner was brushed completely into a plastic bag and analyzed. Zero point one gram from each sample was isolated and added to one milliliter of PBS. The suspension was poured through a 45-μm-pore filter and the material remaining on the filter, rinsed in an integrid petri-dish for mite number counting. Additional dust samples were picked up and extracted for the measurements of Dp and Der p 2 concentration by ELISA as described continuously. Mites were counted under an inverted phase contrast microscope (OLYMPUS SZ-PT, Japan) and the mite concentration was expressed as the number of mites per 1 g of dust. In order to properly identify and count the mites, the mites were picked up by hand using a 25-gauge needle under an incident light microscope, then immersed in polyvinyl alcohol solution on a microscope slide and covered with a glass cover.
2.6. ELISA
ELISA was performed as previously described (13). The C1 monoclonal antibody used were coated
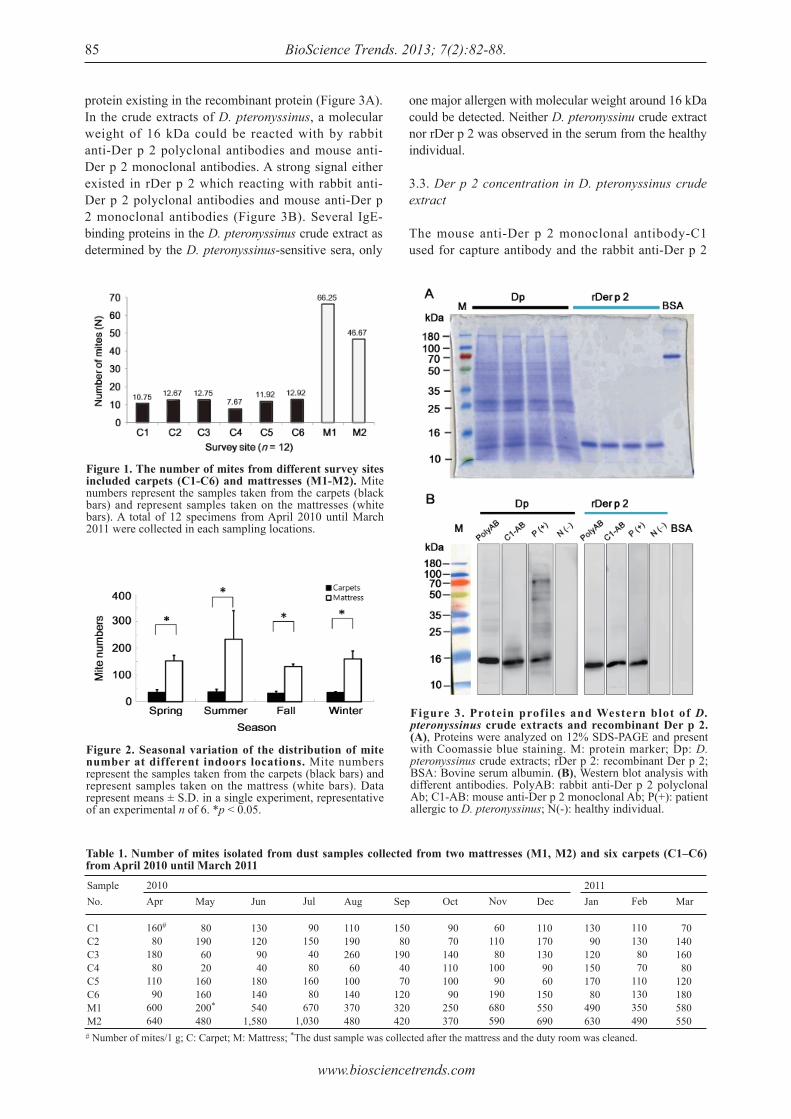
www.biosciencetrends.com
BioScience Trends. 2013; 7(2):82-88.85
protein existing in the recombinant protein (Figure 3A). In the crude extracts of D. pteronyssinus, a molecular weight of 16 kDa could be reacted with by rabbit anti-Der p 2 polyclonal antibodies and mouse anti-Der p 2 monoclonal antibodies. A strong signal either existed in rDer p 2 which reacting with rabbit anti-Der p 2 polyclonal antibodies and mouse anti-Der p 2 monoclonal antibodies (Figure 3B). Several IgE-binding proteins in the D. pteronyssinus crude extract as determined by the D. pteronyssinus-sensitive sera, only
one major allergen with molecular weight around 16 kDa could be detected. Neither D. pteronyssinu crude extract nor rDer p 2 was observed in the serum from the healthy individual.
3.3. Der p 2 concentration in D. pteronyssinus crude extract
The mouse anti-Der p 2 monoclonal antibody-C1 used for capture antibody and the rabbit anti-Der p 2
Table 1. Number of mites isolated from dust samples collected from two mattresses (M1, M2) and six carpets (C1‒C6) from April 2010 until March 2011Sample No.
C1C2C3C4C5C6M1M2# Number of mites/1 g; C: Carpet; M: Mattress; *The dust sample was collected after the mattress and the duty room was cleaned.
2010Apr
160#
80180 80110 90600640
May
80190 60 20160160200*
480
Jun
130 120 90 40 180 140 5401,580
Jul
90 150 40 80 160 80 6701,030
Aug
110190260 60100140370480
Sep
150 80190 40 70120320420
Oct
90 70140110100 90250370
Nov
60110 80100 90190680590
Dec
110170130 90 60150550690
2011Jan
130 90120150170 80490630
Feb
110130 80 70110130350490
Mar
70140160 80120180580550
Figure 1. The number of mites from different survey sites included carpets (C1-C6) and mattresses (M1-M2). Mite numbers represent the samples taken from the carpets (black bars) and represent samples taken on the mattresses (white bars). A total of 12 specimens from April 2010 until March 2011 were collected in each sampling locations.
Figure 2. Seasonal variation of the distribution of mite number at different indoors locations. Mite numbers represent the samples taken from the carpets (black bars) and represent samples taken on the mattress (white bars). Data represent means ± S.D. in a single experiment, representative of an experimental n of 6. *p < 0.05.
Figure 3. Protein profiles and Western blot of D. pteronyssinus crude extracts and recombinant Der p 2. (A), Proteins were analyzed on 12% SDS-PAGE and present with Coomassie blue staining. M: protein marker; Dp: D. pteronyssinus crude extracts; rDer p 2: recombinant Der p 2; BSA: Bovine serum albumin. (B), Western blot analysis with different antibodies. PolyAB: rabbit anti-Der p 2 polyclonal Ab; C1-AB: mouse anti-Der p 2 monoclonal Ab; P(+): patient allergic to D. pteronyssinus; N(-): healthy individual.
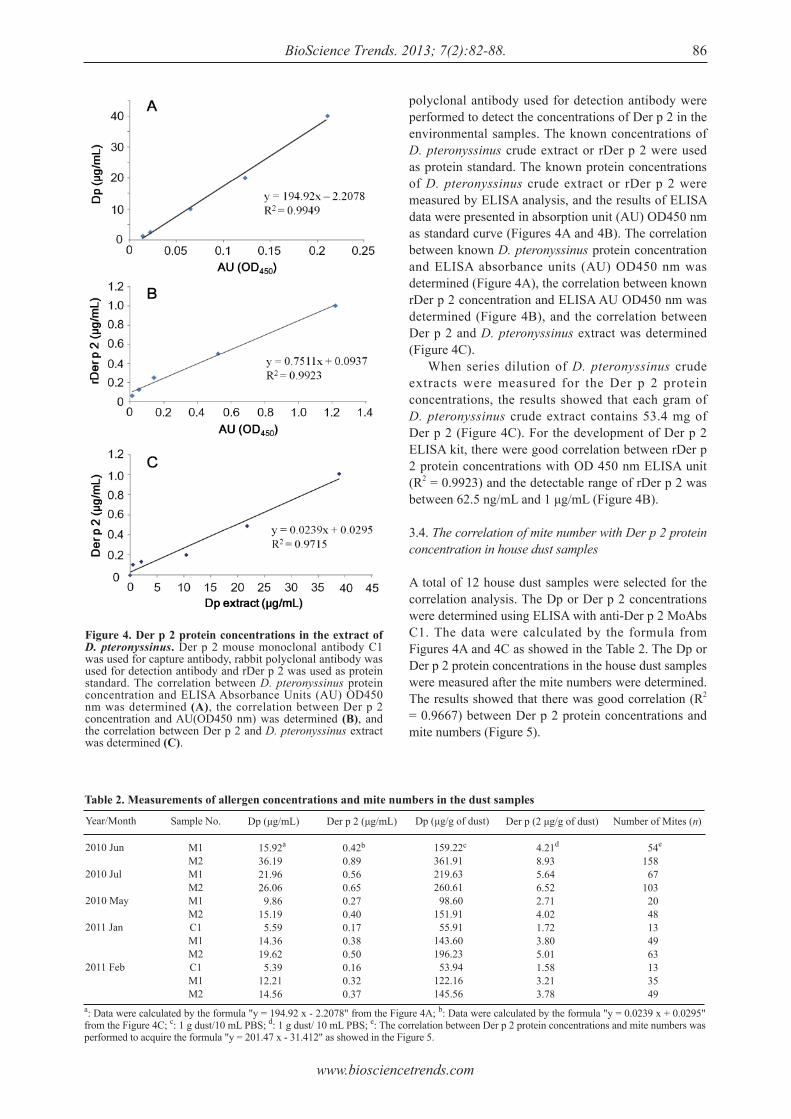
www.biosciencetrends.com
BioScience Trends. 2013; 7(2):82-88. 86
polyclonal antibody used for detection antibody were performed to detect the concentrations of Der p 2 in the environmental samples. The known concentrations of D. pteronyssinus crude extract or rDer p 2 were used as protein standard. The known protein concentrations of D. pteronyssinus crude extract or rDer p 2 were measured by ELISA analysis, and the results of ELISA data were presented in absorption unit (AU) OD450 nm as standard curve (Figures 4A and 4B). The correlation between known D. pteronyssinus protein concentration and ELISA absorbance units (AU) OD450 nm was determined (Figure 4A), the correlation between known rDer p 2 concentration and ELISA AU OD450 nm was determined (Figure 4B), and the correlation between Der p 2 and D. pteronyssinus extract was determined (Figure 4C). When series dilution of D. pteronyssinus crude extracts were measured for the Der p 2 protein concentrations, the results showed that each gram of D. pteronyssinus crude extract contains 53.4 mg of Der p 2 (Figure 4C). For the development of Der p 2 ELISA kit, there were good correlation between rDer p 2 protein concentrations with OD 450 nm ELISA unit (R2 = 0.9923) and the detectable range of rDer p 2 was between 62.5 ng/mL and 1 μg/mL (Figure 4B).
3.4. The correlation of mite number with Der p 2 protein concentration in house dust samples
A total of 12 house dust samples were selected for the correlation analysis. The Dp or Der p 2 concentrations were determined using ELISA with anti-Der p 2 MoAbs C1. The data were calculated by the formula from Figures 4A and 4C as showed in the Table 2. The Dp or Der p 2 protein concentrations in the house dust samples were measured after the mite numbers were determined. The results showed that there was good correlation (R2 = 0.9667) between Der p 2 protein concentrations and mite numbers (Figure 5).
Table 2. Measurements of allergen concentrations and mite numbers in the dust samples
Year/Month
2010 Jun
2010 Jul
2010 May
2011 Jan
2011 Feb
a: Data were calculated by the formula "y = 194.92 x - 2.2078" from the Figure 4A; b: Data were calculated by the formula "y = 0.0239 x + 0.0295" from the Figure 4C; c: 1 g dust/10 mL PBS; d: 1 g dust/ 10 mL PBS; e: The correlation between Der p 2 protein concentrations and mite numbers was performed to acquire the formula "y = 201.47 x - 31.412" as showed in the Figure 5.
Sample No.
M1M2M1M2M1M2C1M1M2C1M1M2
Dp (μg/mL)
15.92a
36.1921.9626.06 9.8615.19 5.5914.3619.62 5.3912.2114.56
Der p 2 (μg/mL)
0.42b
0.890.560.650.270.400.170.380.500.160.320.37
Dp (μg/g of dust)
159.22c
361.91219.63260.61 98.60151.91 55.91143.60196.23 53.94122.16145.56
Der p (2 μg/g of dust)
4.21d
8.935.646.522.714.021.723.805.011.583.213.78
Number of Mites (n)
54e
158 67103 20 48 13 49 63 13 35 49
Figure 4. Der p 2 protein concentrations in the extract of D. pteronyssinus. Der p 2 mouse monoclonal antibody C1 was used for capture antibody, rabbit polyclonal antibody was used for detection antibody and rDer p 2 was used as protein standard. The correlation between D. pteronyssinus protein concentration and ELISA Absorbance Units (AU) OD450 nm was determined (A), the correlation between Der p 2 concentration and AU(OD450 nm) was determined (B), and the correlation between Der p 2 and D. pteronyssinus extract was determined (C).
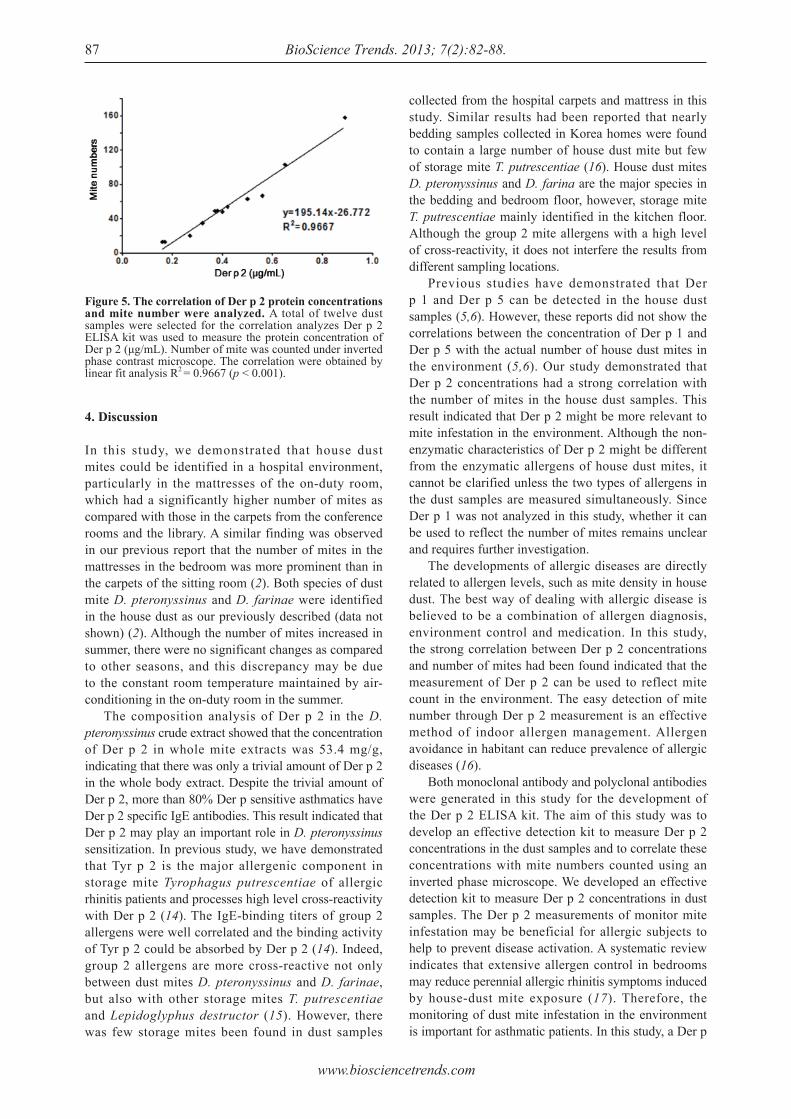
www.biosciencetrends.com
BioScience Trends. 2013; 7(2):82-88.87
4. Discussion
In this study, we demonstrated that house dust mites could be identified in a hospital environment, particularly in the mattresses of the on-duty room, which had a significantly higher number of mites as compared with those in the carpets from the conference rooms and the library. A similar finding was observed in our previous report that the number of mites in the mattresses in the bedroom was more prominent than in the carpets of the sitting room (2). Both species of dust mite D. pteronyssinus and D. farinae were identified in the house dust as our previously described (data not shown) (2). Although the number of mites increased in summer, there were no significant changes as compared to other seasons, and this discrepancy may be due to the constant room temperature maintained by air-conditioning in the on-duty room in the summer. The composition analysis of Der p 2 in the D. pteronyssinus crude extract showed that the concentration of Der p 2 in whole mite extracts was 53.4 mg/g, indicating that there was only a trivial amount of Der p 2 in the whole body extract. Despite the trivial amount of Der p 2, more than 80% Der p sensitive asthmatics have Der p 2 specific IgE antibodies. This result indicated that Der p 2 may play an important role in D. pteronyssinus sensitization. In previous study, we have demonstrated that Tyr p 2 is the major allergenic component in storage mite Tyrophagus putrescentiae of allergic rhinitis patients and processes high level cross-reactivity with Der p 2 (14). The IgE-binding titers of group 2 allergens were well correlated and the binding activity of Tyr p 2 could be absorbed by Der p 2 (14). Indeed, group 2 allergens are more cross-reactive not only between dust mites D. pteronyssinus and D. farinae, but also with other storage mites T. putrescentiae and Lepidoglyphus destructor (15). However, there was few storage mites been found in dust samples
Figure 5. The correlation of Der p 2 protein concentrations and mite number were analyzed. A total of twelve dust samples were selected for the correlation analyzes Der p 2 ELISA kit was used to measure the protein concentration of Der p 2 (μg/mL). Number of mite was counted under inverted phase contrast microscope. The correlation were obtained by linear fit analysis R2 = 0.9667 (p < 0.001).
collected from the hospital carpets and mattress in this study. Similar results had been reported that nearly bedding samples collected in Korea homes were found to contain a large number of house dust mite but few of storage mite T. putrescentiae (16). House dust mites D. pteronyssinus and D. farina are the major species in the bedding and bedroom floor, however, storage mite T. putrescentiae mainly identified in the kitchen floor. Although the group 2 mite allergens with a high level of cross-reactivity, it does not interfere the results from different sampling locations. Previous studies have demonstrated that Der p 1 and Der p 5 can be detected in the house dust samples (5,6). However, these reports did not show the correlations between the concentration of Der p 1 and Der p 5 with the actual number of house dust mites in the environment (5,6). Our study demonstrated that Der p 2 concentrations had a strong correlation with the number of mites in the house dust samples. This result indicated that Der p 2 might be more relevant to mite infestation in the environment. Although the non-enzymatic characteristics of Der p 2 might be different from the enzymatic allergens of house dust mites, it cannot be clarified unless the two types of allergens in the dust samples are measured simultaneously. Since Der p 1 was not analyzed in this study, whether it can be used to reflect the number of mites remains unclear and requires further investigation. The developments of allergic diseases are directly related to allergen levels, such as mite density in house dust. The best way of dealing with allergic disease is believed to be a combination of allergen diagnosis, environment control and medication. In this study, the strong correlation between Der p 2 concentrations and number of mites had been found indicated that the measurement of Der p 2 can be used to reflect mite count in the environment. The easy detection of mite number through Der p 2 measurement is an effective method of indoor allergen management. Allergen avoidance in habitant can reduce prevalence of allergic diseases (16). Both monoclonal antibody and polyclonal antibodies were generated in this study for the development of the Der p 2 ELISA kit. The aim of this study was to develop an effective detection kit to measure Der p 2 concentrations in the dust samples and to correlate these concentrations with mite numbers counted using an inverted phase microscope. We developed an effective detection kit to measure Der p 2 concentrations in dust samples. The Der p 2 measurements of monitor mite infestation may be beneficial for allergic subjects to help to prevent disease activation. A systematic review indicates that extensive allergen control in bedrooms may reduce perennial allergic rhinitis symptoms induced by house-dust mite exposure (17). Therefore, the monitoring of dust mite infestation in the environment is important for asthmatic patients. In this study, a Der p
www.biosciencetrends.com
BioScience Trends. 2013; 7(2):82-88. 88
2 ELISA kit was developed and could accurately reflect the environment infestation of Der p, indicating that this Der p 2 ELISA kit could be used in a clinical setting.
Acknowledgements
The authors sincerely appreciate the assistance of the Biostatistics Task Force of Taichung Veterans General Hospital with regards to statistical assistance. This study was supported by grants (TCVGH-T997807) from the Taichung Veterans General Hospital and (VGHUST-99-G6-4) from the Veterans General Hospitals University System of Taiwan Joint Research Program.
References
1. Pearce N, Ait-Khaled N, Beasley R, Mallol J, Keil U, Mitchell E. Worldwide trends in the prevalence of asthma symptoms: Phase III of the International Study of Asthma and Allergies in Childhood (ISAAC). Thorax. 2007; 62:758-766.
2. Tsa i JJ , Wu HH, Shen HD, Hsu EL, Wang SR. Sensitization to Blomia tropicalis among asthmatic patients in Taiwan. Int Arch Allergy Immunol. 1998; 115:144-149.
3. Chang YC, Hsieh KH. The study of house dust mites in Taiwan. Ann Allergy. 1989; 62:101-106.
4. Lorenz AR, Luttkopf D, May S, Scheurer S, Vieths S. The principle of homologous groups in regulatory affairs of allergen products--a proposal. Int Arch Allergy Immunol. 2009; 148:1-17.
5. Li CS, Wan GH, Hsieh KH, Chua KY, Lin RH. Seasonal variation of house dust mite allergen (Der pI) in a subtropical climate. J Allergy Clin Immunol. 1994; 94:131-134.
6. Li CS, Hsu CW, Chua KY, Hsieh KH, Lin RH. Environmental distribution of house dust mite allergen (Der p 5). J Allergy Clin Immunol. 1996; 97:857-859.
7. Custovic A, Simpson A, Woodcock A. Importance of
indoor allergens in the induction of allergy and elicitation of allergic disease. Allergy. 1998; 53(48 Suppl):115-120.
8. Sporik R, Holgate ST, Platts-Mills TA, Cogswell JJ. Exposure to house-dust mite allergen (Der p I) and the development of asthma in childhood. A prospective study. N Engl J Med. 1990; 323:502-507.
9. Park GM, Lee SM, Lee IY, Ree HI, Kim KS, Hong CS. Localization of a major allergen, Der p 2, in the gut and faecal pellets of Dermatophagoides pteronyssinus. Clin Exp Allergy. 2000; 30:1293-1297.
10. Hamilton RG. Assessment of indoor allergen exposure. Curr Allergy Asthma Rep. 2005; 5:394-401.
11. Tsai JJ, Shen HD, Chua KY. Purification of group 2 Dermatophagoides pteronyssinus Allergen and Prevalence of its specific IgE in Asthmatics. Int Arch Allergy Immunol. 2000; 121:205-210.
12. Feng MQ, Cai QS, Song DX, Dong JB, Zhou P. High yield and secretion of recombinant human apolipoprotein AI in Pichia pastoris. Protein Expr Purif. 2006; 46:337-342.
13. Shen HD, Chua KY, Lin WL, Chen HL, Hsieh KH, Thomas WR. IgE and monoclonal antibody binding by the mite allergen Der p 7. Clin Exp Allergy. 1996; 26:308-315.
14. Liao EC, Ho CM, Lin MY, Tsai JJ. Dermatophagoides pteronyssinus and Tyrophagus putrescentiae allergy in allergic rhinitis caused by cross-reactivity not dual-sensitization. J Clin Immunol. 2010; 30:830-839.
15. Johansson E, Johansson SG, Van Hage-Hamsten M. Allergenic characterization of Acarus siro and Tyrophagus putrescentiae and their cross-reactivity with Lepidoglyphus destructor and Dermatophagoides pteronyssinus. Clin Exp Allergy. 1994; 24:743-751.
16. Jeong KY, Lee IY, Lee J, Ree HI, Hong CS, Yong TS. Effectiveness of education for control house dust mites and cockroaches in Seoul, Korea. Korean J Parasitol. 2006; 44:73-79.
17. Sheikh A, Hurwitz B, Shehata Y. House dust mite avoidance measures for perennial allergic rhinitis. Cochrane Database Syst Rev. 2007; 7:CD001563.
(Received July 10, 2012; Revised March 4, 2013; Accepted April 7, 2013)
www.biosciencetrends.com
BioScience Trends. 2013; 7(2):89-92.89
Association of mineralization-related genes TNAP and ANKH polymorphisms with ankylosing spondylitis in the Chinese Han population
Zeying Liu1,2, Yazhou Cui1, Xiaoyan Zhou1, Xiumei Zhang1, Jinxiang Han1,*
1 Shandong Academy of Medical Sciences, Shandong Medical Biotechnological Center, Key Laboratory for Biotech Drugs of the Ministry of Health, Ji'nan, Shandong, China;
2 School of Medicine and Life Sciences, University of Jinan-Shandong Academy of Medical Science, Ji’nan, Shandong, China.
Liu ZY and Cui YZ contributed equally to this work.*Address correspondence to:Dr. Jinxiang Han, Shandong Academy of Medical Sciences, Shandong Medical Biotechnological Center, Key Laboratory for Rare Disease Research of Shandong Province, and Key Laboratory for Biotech Drugs of the Ministry of Health, Shandong, China.E-mail: [email protected]
1. Introduction
Ankylosing spondylitis (AS) is a progressive chronic disease characterized by inflammatory response and pathological mineralization. The prevalence of AS is 0.24% in the Chinese population, which is similar to the incidence in Caucasians (1). Twin and family studies have shown that genetic factors play an important role in the pathogenesis of AS. Most previously identified genetic risk variants for AS are related to the immune response. Until recently, in a GWAS study in the Chinese
Han population, Gu et al. (2) discovered two new susceptibility loci rs4552569 and rs17095830 near genes (between HAPLN1-EDIL3 at 5q14.3 and within ANO6 at 12q12) related to cartilage development and bone formation. Our previous study also identified a novel single nucleotide polymorphism (SNP) site (c.4488+74 G > A) in low-density lipoprotein receptor-related protein 5 (LRP5) gene was associated with AS in the Chinese Han population (3). These data support the hypothesis that specific polymorphisms in the bone formation genes, in particular pathological mineralization-related genes might predispose to AS. Multiple lines of evidence indicated the potential importance of extracellular pyrophosphatase metabolism regulators tissue-nonspecific alkaline phosphatase (TNAP) and the human orthologue of mouse progressive ankylosis (ANKH) in the pathological mineralization of AS (4). Furthermore, several human and mouse diseases manifested by hydroxyapatite (HA) crystal deposition in the soft tissues of tendons and/or ligaments resembling
Summary The aim of this study was to investigate two mineralization-related genes TNAP and ANKH polymorphisms associated with ankylosing spondylitis (AS) in the North Chinese Han population. We carried out a case-control study in Chinese AS cohorts involving 278 AS patients and 286 unrelated healthy controls. Five TNAP SNPs (rs3200254, rs1256348, rs1472563, rs1780329, rs3767155) and four ANKH SNPs (rs25957, rs26307, rs27356, rs28006) were genotyped by the Multiplex Snapshot method. There were significant differences in genotype (permutated p = 0.00481) and allele (permutated p = 0.0126) frequencies of the rs26307 ANKH SNP between AS patients and controls. Logistic regression analysis suggested an association of AS with the polymorphism in an additive model (OR = 0.640, 95%CI = 0.480-0.853, p = 0.0023, permutation 10,000 corrected p = 0.0158) and a dominant model (OR = 0.599, 95%CI = 0.423-0.846, p = 0.0037, permutation 10,000 corrected p = 0.022). Haplotype analysis identified the ANKH haplotype rs26307(C)/rs27356 (T) as a predisposing factor for AS (OR = 1.53, 95%CI = 1.165-2.071, p = 0.0026, permutation 10,000 corrected p = 0.0103). This study provides evidence that variation in the ANKH gene influences susceptibility to AS in the Northern Han Chinese population.
Keywords: Ankylosing spondylitis, polymorphisms, TNAP, ANKH
DOI: 10.5582/bst.2013.v7.2.89Original Article
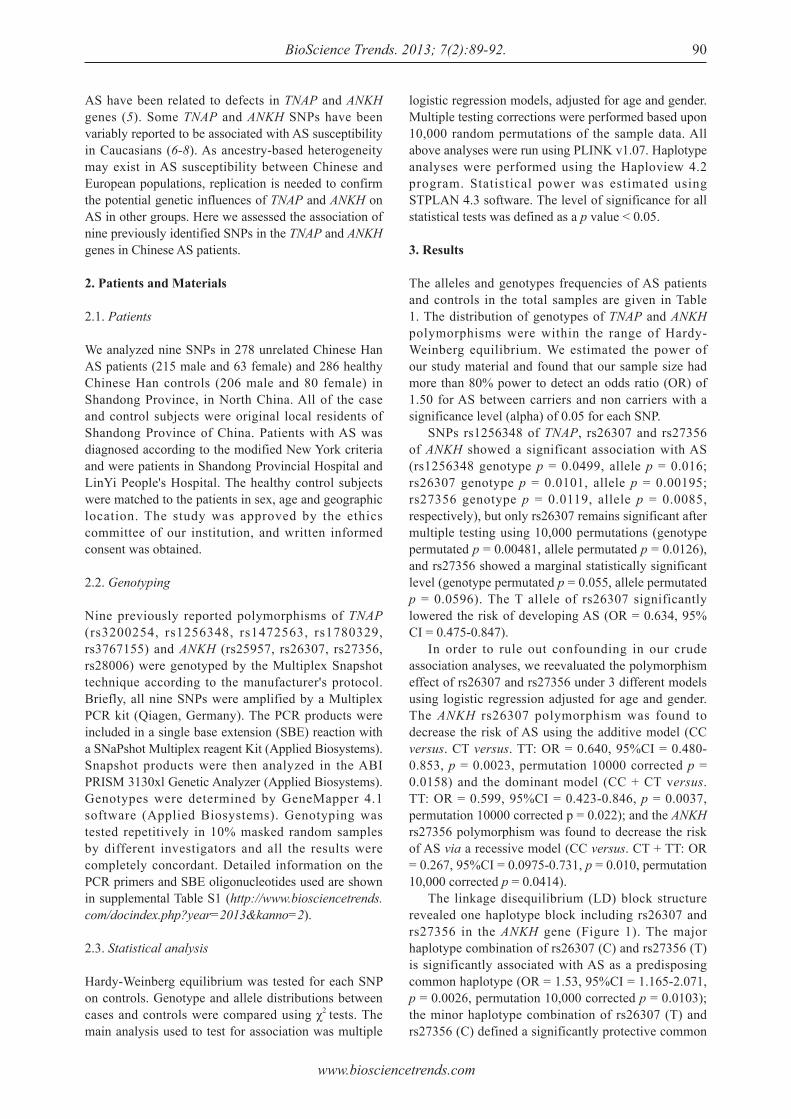
www.biosciencetrends.com
BioScience Trends. 2013; 7(2):89-92.
AS have been related to defects in TNAP and ANKH genes (5). Some TNAP and ANKH SNPs have been variably reported to be associated with AS susceptibility in Caucasians (6-8). As ancestry-based heterogeneity may exist in AS susceptibility between Chinese and European populations, replication is needed to confirm the potential genetic influences of TNAP and ANKH on AS in other groups. Here we assessed the association of nine previously identified SNPs in the TNAP and ANKH genes in Chinese AS patients.
2. Patients and Materials
2.1. Patients
We analyzed nine SNPs in 278 unrelated Chinese Han AS patients (215 male and 63 female) and 286 healthy Chinese Han controls (206 male and 80 female) in Shandong Province, in North China. All of the case and control subjects were original local residents of Shandong Province of China. Patients with AS was diagnosed according to the modified New York criteria and were patients in Shandong Provincial Hospital and LinYi People's Hospital. The healthy control subjects were matched to the patients in sex, age and geographic location. The study was approved by the ethics committee of our institution, and written informed consent was obtained.
2.2. Genotyping
Nine previously reported polymorphisms of TNAP (rs3200254, rs1256348, rs1472563, rs1780329, rs3767155) and ANKH (rs25957, rs26307, rs27356, rs28006) were genotyped by the Multiplex Snapshot technique according to the manufacturer's protocol. Briefly, all nine SNPs were amplified by a Multiplex PCR kit (Qiagen, Germany). The PCR products were included in a single base extension (SBE) reaction with a SNaPshot Multiplex reagent Kit (Applied Biosystems). Snapshot products were then analyzed in the ABI PRISM 3130xl Genetic Analyzer (Applied Biosystems). Genotypes were determined by GeneMapper 4.1 software (Applied Biosystems). Genotyping was tested repetitively in 10% masked random samples by different investigators and all the results were completely concordant. Detailed information on the PCR primers and SBE oligonucleotides used are shown in supplemental Table S1 (http://www.biosciencetrends.com/docindex.php?year=2013&kanno=2).
2.3. Statistical analysis
Hardy-Weinberg equilibrium was tested for each SNP on controls. Genotype and allele distributions between cases and controls were compared using χ2 tests. The main analysis used to test for association was multiple
logistic regression models, adjusted for age and gender. Multiple testing corrections were performed based upon 10,000 random permutations of the sample data. All above analyses were run using PLINK v1.07. Haplotype analyses were performed using the Haploview 4.2 program. Statistical power was estimated using STPLAN 4.3 software. The level of significance for all statistical tests was defined as a p value < 0.05.
3. Results
The alleles and genotypes frequencies of AS patients and controls in the total samples are given in Table 1. The distribution of genotypes of TNAP and ANKH polymorphisms were within the range of Hardy-Weinberg equilibrium. We estimated the power of our study material and found that our sample size had more than 80% power to detect an odds ratio (OR) of 1.50 for AS between carriers and non carriers with a significance level (alpha) of 0.05 for each SNP. SNPs rs1256348 of TNAP, rs26307 and rs27356 of ANKH showed a significant association with AS (rs1256348 genotype p = 0.0499, allele p = 0.016; rs26307 genotype p = 0.0101, allele p = 0.00195; rs27356 genotype p = 0.0119, allele p = 0.0085, respectively), but only rs26307 remains significant after multiple testing using 10,000 permutations (genotype permutated p = 0.00481, allele permutated p = 0.0126), and rs27356 showed a marginal statistically significant level (genotype permutated p = 0.055, allele permutated p = 0.0596). The T allele of rs26307 significantly lowered the risk of developing AS (OR = 0.634, 95% CI = 0.475-0.847). In order to rule out confounding in our crude association analyses, we reevaluated the polymorphism effect of rs26307 and rs27356 under 3 different models using logistic regression adjusted for age and gender. The ANKH rs26307 polymorphism was found to decrease the risk of AS using the additive model (CC versus. CT versus. TT: OR = 0.640, 95%CI = 0.480-0.853, p = 0.0023, permutation 10000 corrected p = 0.0158) and the dominant model (CC + CT versus. TT: OR = 0.599, 95%CI = 0.423-0.846, p = 0.0037, permutation 10000 corrected p = 0.022); and the ANKH rs27356 polymorphism was found to decrease the risk of AS via a recessive model (CC versus. CT + TT: OR = 0.267, 95%CI = 0.0975-0.731, p = 0.010, permutation 10,000 corrected p = 0.0414). The linkage disequilibrium (LD) block structure revealed one haplotype block including rs26307 and rs27356 in the ANKH gene (Figure 1). The major haplotype combination of rs26307 (C) and rs27356 (T) is significantly associated with AS as a predisposing common haplotype (OR = 1.53, 95%CI = 1.165-2.071, p = 0.0026, permutation 10,000 corrected p = 0.0103); the minor haplotype combination of rs26307 (T) and rs27356 (C) defined a significantly protective common
90
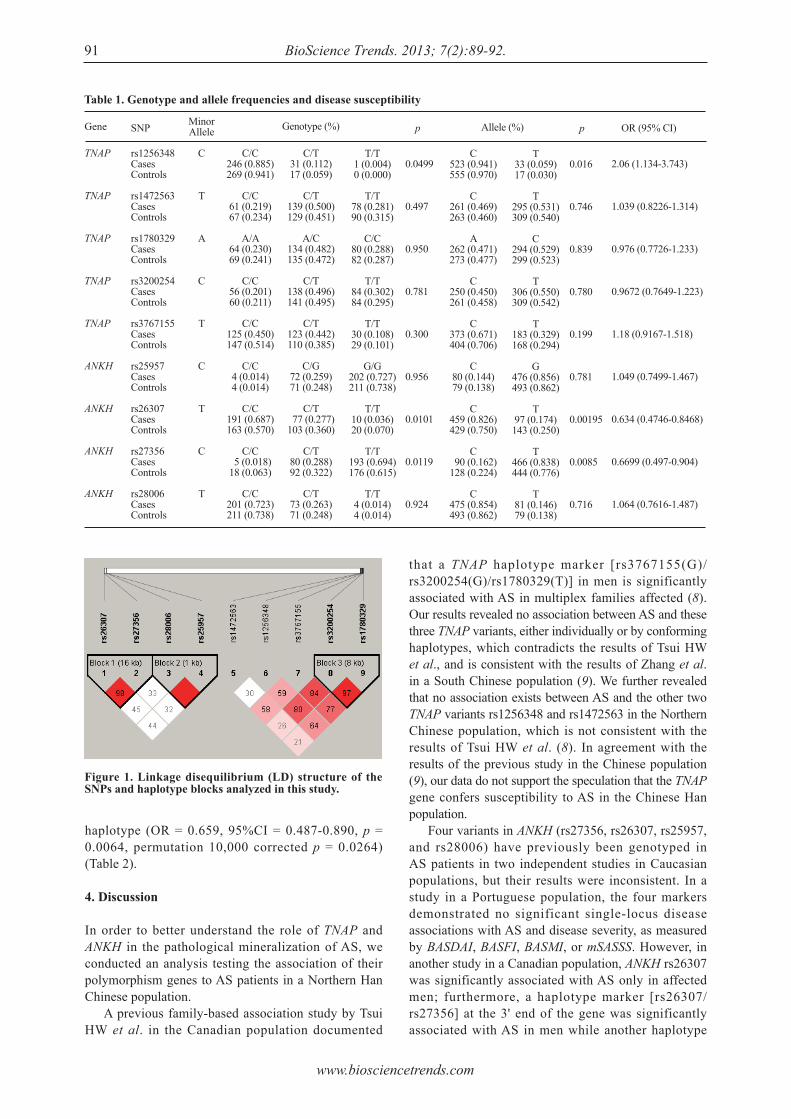
www.biosciencetrends.com
BioScience Trends. 2013; 7(2):89-92.91
that a TNAP haplotype marker [rs3767155(G)/rs3200254(G)/rs1780329(T)] in men is significantly associated with AS in multiplex families affected (8). Our results revealed no association between AS and these three TNAP variants, either individually or by conforming haplotypes, which contradicts the results of Tsui HW et al., and is consistent with the results of Zhang et al. in a South Chinese population (9). We further revealed that no association exists between AS and the other two TNAP variants rs1256348 and rs1472563 in the Northern Chinese population, which is not consistent with the results of Tsui HW et al. (8). In agreement with the results of the previous study in the Chinese population (9), our data do not support the speculation that the TNAP gene confers susceptibility to AS in the Chinese Han population. Four variants in ANKH (rs27356, rs26307, rs25957, and rs28006) have previously been genotyped in AS patients in two independent studies in Caucasian populations, but their results were inconsistent. In a study in a Portuguese population, the four markers demonstrated no significant single-locus disease associations with AS and disease severity, as measured by BASDAI, BASFI, BASMI, or mSASSS. However, in another study in a Canadian population, ANKH rs26307 was significantly associated with AS only in affected men; furthermore, a haplotype marker [rs26307/rs27356] at the 3' end of the gene was significantly associated with AS in men while another haplotype
haplotype (OR = 0.659, 95%CI = 0.487-0.890, p = 0.0064, permutation 10,000 corrected p = 0.0264) (Table 2).
4. Discussion
In order to better understand the role of TNAP and ANKH in the pathological mineralization of AS, we conducted an analysis testing the association of their polymorphism genes to AS patients in a Northern Han Chinese population. A previous family-based association study by Tsui HW et al. in the Canadian population documented
Figure 1. Linkage disequilibrium (LD) structure of the SNPs and haplotype blocks analyzed in this study.
Table 1. Genotype and allele frequencies and disease susceptibility
Gene
TNAP
TNAP
TNAP
TNAP
TNAP
ANKH
ANKH
ANKH
ANKH
SNP
rs1256348CasesControls
rs1472563CasesControls
rs1780329CasesControls
rs3200254CasesControls
rs3767155CasesControls
rs25957CasesControls
rs26307CasesControls
rs27356CasesControls
rs28006CasesControls
MinorAllele
C
T
A
C
T
C
T
C
T
p
0.0499
0.497
0.950
0.781
0.300
0.956
0.0101
0.0119
0.924
C/C246 (0.885)269 (0.941)
C/C61 (0.219)67 (0.234)
A/A64 (0.230)69 (0.241)
C/C56 (0.201)60 (0.211)
C/C125 (0.450)147 (0.514)
C/C4 (0.014)4 (0.014)
C/C191 (0.687)163 (0.570)
C/C 5 (0.018)18 (0.063)
C/C201 (0.723)211 (0.738)
C/T31 (0.112)17 (0.059)
C/T139 (0.500)129 (0.451)
A/C134 (0.482)135 (0.472)
C/T138 (0.496)141 (0.495)
C/T123 (0.442)110 (0.385)
C/G72 (0.259)71 (0.248)
C/T 77 (0.277)103 (0.360)
C/T80 (0.288)92 (0.322)
C/T73 (0.263)71 (0.248)
OR (95% CI)
2.06 (1.134-3.743)
1.039 (0.8226-1.314)
0.976 (0.7726-1.233)
0.9672 (0.7649-1.223)
1.18 (0.9167-1.518)
1.049 (0.7499-1.467)
0.634 (0.4746-0.8468)
0.6699 (0.497-0.904)
1.064 (0.7616-1.487)
T/T1 (0.004)0 (0.000)
T/T78 (0.281)90 (0.315)
C/C80 (0.288)82 (0.287)
T/T84 (0.302)84 (0.295)
T/T30 (0.108)29 (0.101)
G/G202 (0.727)211 (0.738)
T/T10 (0.036)20 (0.070)
T/T193 (0.694)176 (0.615)
T/T4 (0.014)4 (0.014)
p
0.016
0.746
0.839
0.780
0.199
0.781
0.00195
0.0085
0.716
C523 (0.941)555 (0.970)
C261 (0.469)263 (0.460)
A262 (0.471)273 (0.477)
C250 (0.450)261 (0.458)
C373 (0.671)404 (0.706)
C80 (0.144)79 (0.138)
C459 (0.826)429 (0.750)
C 90 (0.162)128 (0.224)
C475 (0.854)493 (0.862)
T33 (0.059)17 (0.030)
T295 (0.531)309 (0.540)
C294 (0.529)299 (0.523)
T306 (0.550)309 (0.542)
T183 (0.329)168 (0.294)
G476 (0.856)493 (0.862)
T97 (0.174)143 (0.250)
T466 (0.838)444 (0.776)
T81 (0.146)79 (0.138)
Genotype (%) Allele (%)
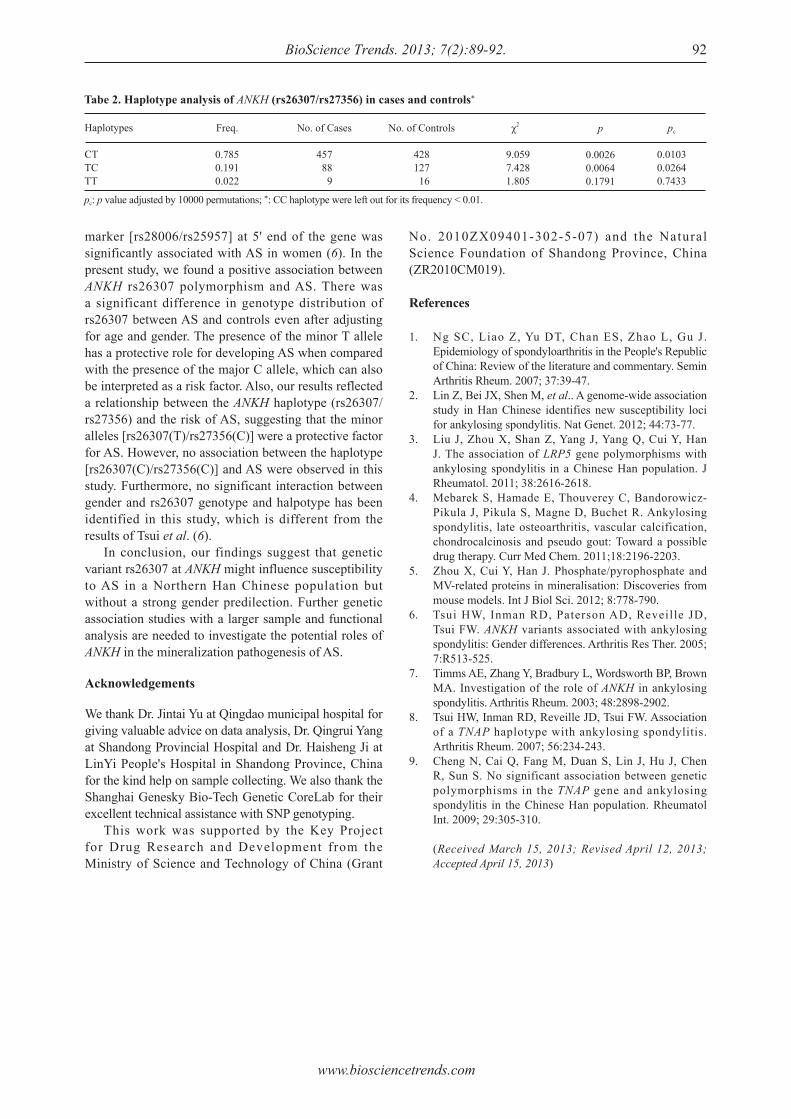
www.biosciencetrends.com
BioScience Trends. 2013; 7(2):89-92. 92
marker [rs28006/rs25957] at 5' end of the gene was significantly associated with AS in women (6). In the present study, we found a positive association between ANKH rs26307 polymorphism and AS. There was a significant difference in genotype distribution of rs26307 between AS and controls even after adjusting for age and gender. The presence of the minor T allele has a protective role for developing AS when compared with the presence of the major C allele, which can also be interpreted as a risk factor. Also, our results reflected a relationship between the ANKH haplotype (rs26307/rs27356) and the risk of AS, suggesting that the minor alleles [rs26307(T)/rs27356(C)] were a protective factor for AS. However, no association between the haplotype [rs26307(C)/rs27356(C)] and AS were observed in this study. Furthermore, no significant interaction between gender and rs26307 genotype and halpotype has been identified in this study, which is different from the results of Tsui et al. (6). In conclusion, our findings suggest that genetic variant rs26307 at ANKH might influence susceptibility to AS in a Northern Han Chinese population but without a strong gender predilection. Further genetic association studies with a larger sample and functional analysis are needed to investigate the potential roles of ANKH in the mineralization pathogenesis of AS.
Acknowledgements
We thank Dr. Jintai Yu at Qingdao municipal hospital for giving valuable advice on data analysis, Dr. Qingrui Yang at Shandong Provincial Hospital and Dr. Haisheng Ji at LinYi People's Hospital in Shandong Province, China for the kind help on sample collecting. We also thank the Shanghai Genesky Bio-Tech Genetic CoreLab for their excellent technical assistance with SNP genotyping. This work was supported by the Key Project for Drug Research and Development from the Ministry of Science and Technology of China (Grant
No. 2010ZX09401-302-5-07) and the Natural Science Foundation of Shandong Province, China (ZR2010CM019).
References
1. Ng SC, Liao Z, Yu DT, Chan ES, Zhao L, Gu J. Epidemiology of spondyloarthritis in the People's Republic of China: Review of the literature and commentary. Semin Arthritis Rheum. 2007; 37:39-47.
2. Lin Z, Bei JX, Shen M, et al.. A genome-wide association study in Han Chinese identifies new susceptibility loci for ankylosing spondylitis. Nat Genet. 2012; 44:73-77.
3. Liu J, Zhou X, Shan Z, Yang J, Yang Q, Cui Y, Han J. The association of LRP5 gene polymorphisms with ankylosing spondylitis in a Chinese Han population. J Rheumatol. 2011; 38:2616-2618.
4. Mebarek S, Hamade E, Thouverey C, Bandorowicz-Pikula J, Pikula S, Magne D, Buchet R. Ankylosing spondylitis, late osteoarthritis, vascular calcification, chondrocalcinosis and pseudo gout: Toward a possible drug therapy. Curr Med Chem. 2011;18:2196-2203.
5. Zhou X, Cui Y, Han J. Phosphate/pyrophosphate and MV-related proteins in mineralisation: Discoveries from mouse models. Int J Biol Sci. 2012; 8:778-790.
6. Tsui HW, Inman RD, Paterson AD, Reveille JD, Tsui FW. ANKH variants associated with ankylosing spondylitis: Gender differences. Arthritis Res Ther. 2005; 7:R513-525.
7. Timms AE, Zhang Y, Bradbury L, Wordsworth BP, Brown MA. Investigation of the role of ANKH in ankylosing spondylitis. Arthritis Rheum. 2003; 48:2898-2902.
8. Tsui HW, Inman RD, Reveille JD, Tsui FW. Association of a TNAP haplotype with ankylosing spondylitis. Arthritis Rheum. 2007; 56:234-243.
9. Cheng N, Cai Q, Fang M, Duan S, Lin J, Hu J, Chen R, Sun S. No significant association between genetic polymorphisms in the TNAP gene and ankylosing spondylitis in the Chinese Han population. Rheumatol Int. 2009; 29:305-310.
(Received March 15, 2013; Revised April 12, 2013; Accepted April 15, 2013)
Tabe 2. Haplotype analysis of ANKH (rs26307/rs27356) in cases and controls*
Haplotypes
CTTCTT
Freq.
0.7850.1910.022
pc: p value adjusted by 10000 permutations; *: CC haplotype were left out for its frequency < 0.01.
No. of Cases
457 88 9
No. of Controls
428127 16
χ2
9.0597.4281.805
pc
0.01030.02640.7433
p
0.00260.00640.1791
www.biosciencetrends.com
BioScience Trends. 2013; 7(2):93-100.93
Expression, characterization, and preliminary X-ray crystallographic analysis of recombinant murine Follistatin-like 1 expressed in Drosophila S2 cells
Lian Li1, Xinxin Li1, Xue Liu1, Yingying Dong1, Yan Geng2, Xinqi Liu1,*, Wen Ning1,*
1 The College of Life Sciences, Nankai University, Tianjin, China;2 School of Pharmaceutical Science, Jiangnan University, Wuxi, China.
*Address correspondence to:Dr. Xinqi Liu, The College of Life Sciences, Nankai University, Weijin Road No. 94, Tianjin300071, China.E-mail: [email protected]
Dr. Wen Ning, The College of Life Sciences, Nankai University, Weijin Road No. 94, Tianjin300071, China.E-mail: [email protected]
1. Introduction
Members of the transforming growth factor-β (TGF-β) superfamily regulate diverse biological cellular functions, such as cellular growth, differentiation and development. The activities and cellular signaling of the TGF-β superfamily members are regulated through multiple mechanisms. For example, multiple extracellular binding partners for the TGF-β family, such as decorin (1), follistatin (2,3), chordin and noggin (4), have been characterized as regulators of TGF-β
signaling. Follistatin-like 1 (FSTL1) is also a TGF-β superfamily binding protein; it has recently been identified as a bone morphogenetic protein 4 (BMP4) antagonist controlling embryonic development in mouse (5-8) and zebrafish models (9,10). In vivo, FSTL1 is expressed temporally and spatially and is generally associated with tissues undergoing remodeling, either during normal developmental processes or in response to injury. Evidence has implicated FSTL1 in a number of pathologic conditions, including inflammation (11), rheumatoid arthritis (12-16), tumorigenesis (17-19), and heart disease (20,21). Functions of FSTL1 in the extracellular milieu are diverse and remain elusive. FSTL1 is a small, secreted glycoprotein belonging to a group of matricellular proteins that mediate cell-matrix interactions but whose primary function is not structural (22,23). Its protein sequence, which is highly conserved throughout vertebrate evolution (> 92% sequence identity) (24), consists of an N-terminal region homologous to follistatin (FS domain), and a
Summary The matricellular protein Follistatin-like 1 (FSTL1) has been shown to negatively regulate bone morphogenetic protein (BMP)/Smad1/5/8 signaling by functioning as an antagonist and has been implicated in physiological and pathological events including organogenesis, immunity and cardiovascular disease. It is therefore an attractive target for potential therapeutic intervention studies. In this study, we established a high-level expression system in Drosophila S2 cells which could produce about 12.5 mg of recombinant murine Follistatin-like 1 protein (rFSTL1) per liter of culture medium. The recombinant protein was then purified to greater than 95% purity using Ni-NTA agarose affinity chromatography followed by HiLoad 16/60 Superdex 200 gel filtration. The biological activity of rFSTL1 was evaluated by its ability to negatively regulate BMP/Smad1/5/8 signaling in cultured mink lung epithelial cells. Furthermore, we crystallized a truncated form of rFSTL1 containing the follistatin-like domain using the sitting drop vapor diffusion method. In conclusion, we have generated and purified biologically active recombinant FSTL1 protein, which will be important for further protein structure and drug discovery studies.
Keywords: Follistatin-like 1 (FSTL1), Drosophila S2 cells, affinity chromatography, biological activity, crystallization
DOI: 10.5582/bst.2013.v7.2.93Original Article
www.biosciencetrends.com
BioScience Trends. 2013; 7(2):93-100.
domain containing two EF-hand calcium-binding sites (EC domain) followed by a C-terminal domain with homology to the von Willebrand factor type C-like (VWC) domain (23,25). The domain structure of murine FSTL1 is shown in Figure 1A. The structure analysis shows that FSTL1 is a member of the Fst-SPARC protein family, members of which possess an FS domain and a pair of EF-hands. Other members of this group of proteins include follistatin and BM-40/SPARC/osteonectin. However, unlike follistatin, the FS domain of FSTL1 does not bind to activin (26), nor does its EC domain functionally bind to collagen as is the case for SPARC (23). The lack of conservation of important functional features common to several other members of the Fst-SPARC family indicates that FSTL1, despite its sequence homology to others, has evolved to acquire distinct properties. The structural characterization of FSTL1 has not been elucidated. Involvement of FSTL1 in cardiovascular tissue regulation has been suggested (20,27-29). Its expression in adult heart is induced in response to injurious conditions that promote myocardial hypertrophy and heart failure (21,30,31). The systemic administration of an adenoviral vector expressing FSTL1 or overexpression of FSTL1 in mice protects the heart from ischemia/reperfusion injury or pressure overload-induced hypertrophy (20,21). Previous studies have shown that FSTL1 functions as an autocrine/paracrine regulatory factor and that the level of circulating FSTL1 is increased in patients with acute coronary syndrome, heart failure, and rheumatoid arthritis (16,31,32). Therefore, FSTL1 appears to be a clinically relevant secreted protein that has broad cardiovascular-protective activities. Targeting FSTL1 protein may provide a novel therapeutic approach for the treatment of patients suffering from the diseases mentioned above. The objective of the current study is to generate and purify recombinant murine FSTL1 protein (rFSTL1) in an amount that is sufficient for biological studies, structural characterization and future antibody production. We report here the expression, purification, and characterization of full-length rFSTL1 expressed in Drosophila Schneider 2 (S2) cells. Moreover, we have obtained crystals of a truncated form of rFSTL1 that only contains the FS domain, which is critical for future structure study.
2. Materials and Methods
2.1. Materials
The PMT/BiP-HisA vector, pCoBlast vector, cellfectin, blasticidin, Drosophila S2 cells, and SFX-Insect medium were obtained from Invitrogen (Carlsbad, CA, USA). DNA polymerase was obtained from Roche Diagnostics (Basel, Switzerland). T4 DNA ligase, the pMD18-T vector, and NcoI and XhoI restriction
enzymes were purchased from Takara Biotechnology (Dalian, China). The Amicon Ultra centrifugal filters (10 kDa) used for buffer exchange and filtration of cell culture medium were from Millipore Corporation (Bedford, MA, USA). Ni-NTA-agarose beads were obtained from Qiagen GmbH (Hilden, Germany). BMP4 protein was purchased from PeproTech (Rocky Hill, NJ, USA). The BCA protein assay kit and ECL reagents were purchased from Pierce Biotechnology (Rockford, IL, USA). Anti-FSTL1, donkey anti-goat and goat anti-rabbit IgG were purchased from Santa Cruz Biotechnology (Santa Cruz, CA, USA). Phospho-Smad1/5/8 and total-Smad5 antibodies were purchased from Cell Signaling Technology (Danvers, MA, USA). Screening kits were purchased from Hampton Research (Oklahoma city, OK, USA). All primers were synthesized by Invitrogen (Beijing, China).
2.2. Construction of murine Fstl1 (mFstl1) expression plasmids
The mFstl1 fragment, which was from 55 bp to 918 bp excluding the signal peptide sequence, was obtained by PCR amplifying using the pcDNA 3.1/myc-His (-) A-mFstl1 plasmid (preserved by our laboratory and included a full-length mFstl1 fragment) (6) as a template. An NcoI restriction site was added to the forward primer (5′–GAGGAGGAACCTAGAAGCAA–3′), and an XhoI restriction site was added to the reverse primer (5′–GATCTCTTTGGTGTTCACCT–3′). The PCR reaction was carried out using the following reaction cycles: initial denaturation at 95°C for 5 min followed by 30 consecutive cycles of denaturation at 95°C for 30 s, annealing at 55°C for 30 s, extension at 72°C for 30 s and a final extension at 72°C for 7 min. The amplified mFstl1 gene was gel-purified using the High Pure PCR Product Purification Kit (Takara). After digestion of mFstl1 with NcoI and XhoI, the purified product was inserted into the pMD18-T cloning vector. Positive clones were confirmed by restriction enzyme digestion and sequencing. pMD18-T-mFstl1 plasmid was extracted from an overnight liquid culture derived from one positive clone. The plasmid was digested with NcoI and XhoI and cloned into the pMT/BiP-HisA vector (Figure 1A). This vector contains a metallothionein promoter, which allows for strong, expression of heterologous proteins in Drosophila S2 cells upon inducing with CuSO4. Finally, pMT/BiP-HisA–mFstl1 plasmid was transformed into Escherichia coli (E. coli) DH5α strain for amplification of the recombinant plasmid, and positive colonies were selected. The pMT/BiP-HisA–mFstl1 plasmid was purified and subjected to DNA sequence analysis.
2.3. Expression of rFSTL1 protein
Drosophila S2 cells were stably transfected with
94
www.biosciencetrends.com
BioScience Trends. 2013; 7(2):93-100.95
starved in serum-free medium for 24 h, and then treated with 20 ng/mL BMP4 together with 100 ng/mL rFSTL1 protein for an additional 30 min.
2.6. SDS-PAGE and Western blotting
Protein samples were denatured under reducing conditions with β-mercaptoethanol at 100°C for 5 min and separated on a 12% SDS-PAGE gel followed by Coomassie blue staining. Western blotting was performed as described previously (33). Equal amounts of conditioned medium from stably transfected Drosophila S2 cells was precipitated with 100% Trichloroacetic acid (TCA), washed with acetone twice, and then denatured under reducing conditions. The cells were rapidly washed with PBS and lysed using RIPA lysis buffer containing 1% NaF. Protein concentrations were determined using the BCA protein assay. Equal amounts of total protein were denatured under reducing conditions. Samples were separated on a 12% SDS-PAGE gel. The gels were electroblotted onto a PVDF membrane (Millipore). The membranes were blocked with 5% skim milk for 1 h at RT, before incubation with different primary antibodies at 4°C overnight. The antibodies were used to recognize the following proteins: FSTL1 (1:200), phospho-Smad1/5/8 (1:1000), and Smad5 (1:1000). Horseradish peroxidase-conjugated antibodies (goat anti-rabbit for phospho-Smad1/5/8 and Smad5, 1:5000; donkey anti-goat for FSTL1, 1:1500) were used as the secondary detection reagents and incubated with the immunoblots for 2 h at RT. Bands were visualized using ECL reagents.
2.7. Crystallization and X-ray diffraction of rFSTL1
The rFSTL1 fusion protein expressed in Drosophila S2 cells contains a C-terminal 6xHis tag cleavable by TEV protease. After purification using Ni-NTA agarose affinity chromatography, the rFSTL1 fusion protein was digested with TEV protease to remove the 6xHis tag, and then separated with HiLoad 16/60 Superdex 200 gel filtration chromatography. The rFSTL1 protein without the C-terminal tag was used for crystallization trials. Crystallization conditions were initially obtained by screening with a variety of screening kits using the sitting drop vapor diffusion technique at 290 K. Crystals were optimized from the initial conditions using the hanging drop vapor diffusion technique. Diffraction-quality crystals were obtained from a protein stock solution (2 mg/mL protein in a buffer containing 50 mM Tris (pH 8.0) and 0.2 M NaCl) that had been mixed with an equal volume of a reservoir solution (consisting of 0.1 M Tris, pH 8.5 and 1.2 M sodium citrate tribasic dehydrate). Additional cryoprotectants were not used prior to data collection. High-quality diffraction data were collected in an in-house X-ray facility at 100 K at a wavelength of 1.5418 Å using a Rigaku MM-007HF
the pMT/BiP-HisA-mFstl1 plasmid using cellfectin according to the manufacturer's instructions. The S2 cells stably transfected with pMT/BiP-HisA vector were used as a control. To permit the selection of positive cell lines, the S2 cells were co-transfected with the pCoBlast selection vector with a ratio of 1:9, which confers blasticidin resistance. Stably transfected positive lines were established after 3 weeks of selection with blasticidin at 25 mg/L. For large-scale production of rFSTL1, cell lines were seeded at a density of approximately 3-5 × 10⁶ cells/mL, and expression was induced with CuSO4 at a final concentration of 0.5 mmol/L. The conditioned medium was harvested after 3 days.
2.4. Purification of rFSTL1 protein
The conditioned medium (1 L) from stably transfected Drosophila S2 cells was centrifuged for 10 min at 3,000 g to pellet cells. The supernatant was filtered with a 0.22 μm membrane and concentrated with Amicon Ultra spin centrifugal filters (Amicon Stirred Cell Model 8003). Subsequently, buffer containing 50 mmol/L Tris and 500 mmol/L NaCl (pH 8.0) was added to the supernatant. The supernatant containing rFSTL1 protein was subjected to Ni-NTA agarose affinity chromatography. The column was washed with at least 10 column volumes of buffer containing 50 mmol/L Tris, 500 mmol/L NaCl and 10 mmol/L imidazole and then eluted with buffer containing 50 mmol/L Tris, 500 mmol/L NaCl and 500 mmol/L imidazole. Elutions were analyzed using 12% SDS-PAGE. The rFSTL1 protein purified using Ni-NTA agarose affinity chromatography was then applied to a HiLoad 16/60 Superdex 200 gel filtration column (GE Healthcare, Uppsala, Sweden) at a flow rate of 1 mL/min after the column had been equilibrated with buffer containing 50 mM Tris-HCl (pH 8.0) and 500 mM NaCl. Ten fractions of 1.0 mL each were collected in the peak region and were then subjected to SDS-PAGE and Western blot analysis.
2.5. Cell culture
Mink lung epithelial (Mv1Lu) cells were obtained from State Key Laboratory of Biomembrane and Membrane Biotechnology at Tsinghua University (Beijing, China) with the original source from American Type Culture Collection (ATCC) (Manassas, VA, USA). Cells were maintained in DMEM (Gibco, Carlsbad, CA, USA) supplemented with 10% FBS (Hyclone, Logan, UT) and antibiotics in 5% CO2 at 37°C in a humidified atmosphere. The cells were divided into the following two treatment groups: (1) after transfection with the pc-Fstl1 plasmid (1 μg) or pcDNA3.1 (1 μg) for 24 h, the cells were starved in serum-free medium for another 24 h, and then treated with 20 ng/mL of BMP4 for an additional 30 min; (2) 100% confluent cells were
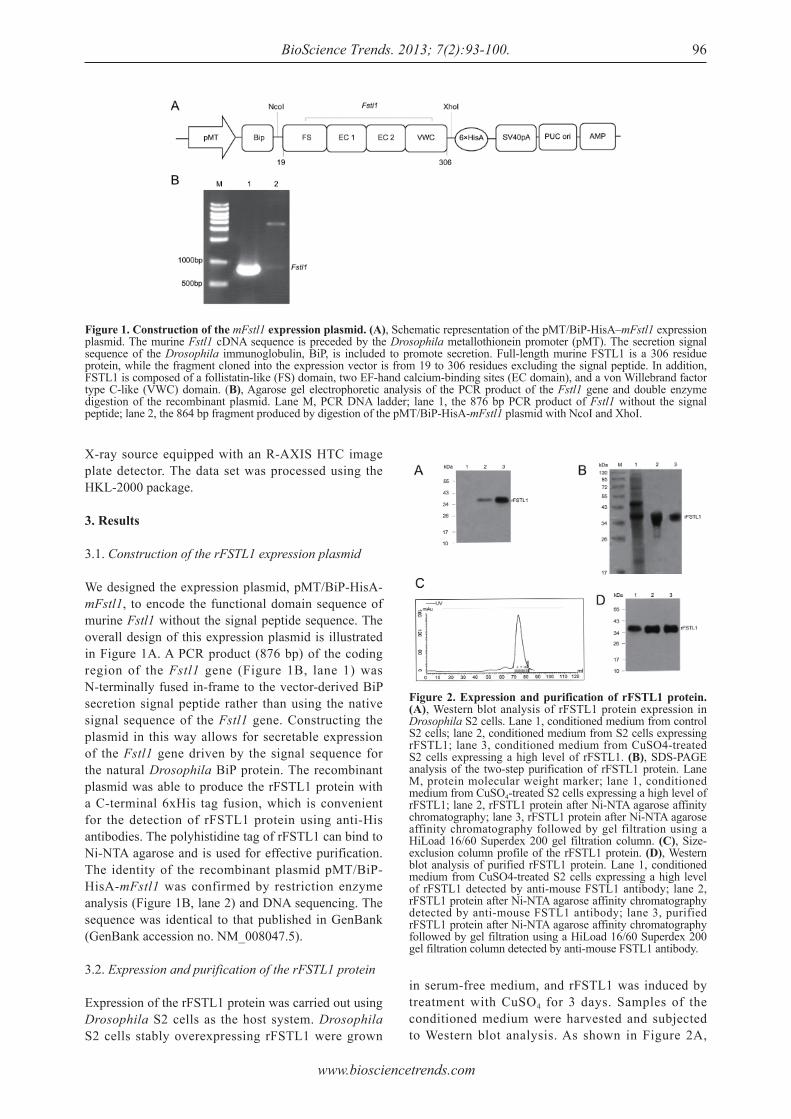
www.biosciencetrends.com
BioScience Trends. 2013; 7(2):93-100. 96
X-ray source equipped with an R-AXIS HTC image plate detector. The data set was processed using the HKL-2000 package.
3. Results
3.1. Construction of the rFSTL1 expression plasmid
We designed the expression plasmid, pMT/BiP-HisA-mFstl1, to encode the functional domain sequence of murine Fstl1 without the signal peptide sequence. The overall design of this expression plasmid is illustrated in Figure 1A. A PCR product (876 bp) of the coding region of the Fstl1 gene (Figure 1B, lane 1) was N-terminally fused in-frame to the vector-derived BiP secretion signal peptide rather than using the native signal sequence of the Fstl1 gene. Constructing the plasmid in this way allows for secretable expression of the Fstl1 gene driven by the signal sequence for the natural Drosophila BiP protein. The recombinant plasmid was able to produce the rFSTL1 protein with a C-terminal 6xHis tag fusion, which is convenient for the detection of rFSTL1 protein using anti-His antibodies. The polyhistidine tag of rFSTL1 can bind to Ni-NTA agarose and is used for effective purification. The identity of the recombinant plasmid pMT/BiP-HisA-mFstl1 was confirmed by restriction enzyme analysis (Figure 1B, lane 2) and DNA sequencing. The sequence was identical to that published in GenBank (GenBank accession no. NM_008047.5).
3.2. Expression and purification of the rFSTL1 protein
Expression of the rFSTL1 protein was carried out using Drosophila S2 cells as the host system. Drosophila S2 cells stably overexpressing rFSTL1 were grown
in serum-free medium, and rFSTL1 was induced by treatment with CuSO4 for 3 days. Samples of the conditioned medium were harvested and subjected to Western blot analysis. As shown in Figure 2A,
Figure 1. Construction of the mFstl1 expression plasmid. (A), Schematic representation of the pMT/BiP-HisA–mFstl1 expression plasmid. The murine Fstl1 cDNA sequence is preceded by the Drosophila metallothionein promoter (pMT). The secretion signal sequence of the Drosophila immunoglobulin, BiP, is included to promote secretion. Full-length murine FSTL1 is a 306 residue protein, while the fragment cloned into the expression vector is from 19 to 306 residues excluding the signal peptide. In addition, FSTL1 is composed of a follistatin-like (FS) domain, two EF-hand calcium-binding sites (EC domain), and a von Willebrand factor type C-like (VWC) domain. (B), Agarose gel electrophoretic analysis of the PCR product of the Fstl1 gene and double enzyme digestion of the recombinant plasmid. Lane M, PCR DNA ladder; lane 1, the 876 bp PCR product of Fstl1 without the signal peptide; lane 2, the 864 bp fragment produced by digestion of the pMT/BiP-HisA-mFstl1 plasmid with NcoI and XhoI.
Figure 2. Expression and purification of rFSTL1 protein. (A), Western blot analysis of rFSTL1 protein expression in Drosophila S2 cells. Lane 1, conditioned medium from control S2 cells; lane 2, conditioned medium from S2 cells expressing rFSTL1; lane 3, conditioned medium from CuSO4-treated S2 cells expressing a high level of rFSTL1. (B), SDS-PAGE analysis of the two-step purification of rFSTL1 protein. Lane M, protein molecular weight marker; lane 1, conditioned medium from CuSO4-treated S2 cells expressing a high level of rFSTL1; lane 2, rFSTL1 protein after Ni-NTA agarose affinity chromatography; lane 3, rFSTL1 protein after Ni-NTA agarose affinity chromatography followed by gel filtration using a HiLoad 16/60 Superdex 200 gel filtration column. (C), Size-exclusion column profile of the rFSTL1 protein. (D), Western blot analysis of purified rFSTL1 protein. Lane 1, conditioned medium from CuSO4-treated S2 cells expressing a high level of rFSTL1 detected by anti-mouse FSTL1 antibody; lane 2, rFSTL1 protein after Ni-NTA agarose affinity chromatography detected by anti-mouse FSTL1 antibody; lane 3, purified rFSTL1 protein after Ni-NTA agarose affinity chromatography followed by gel filtration using a HiLoad 16/60 Superdex 200 gel filtration column detected by anti-mouse FSTL1 antibody.
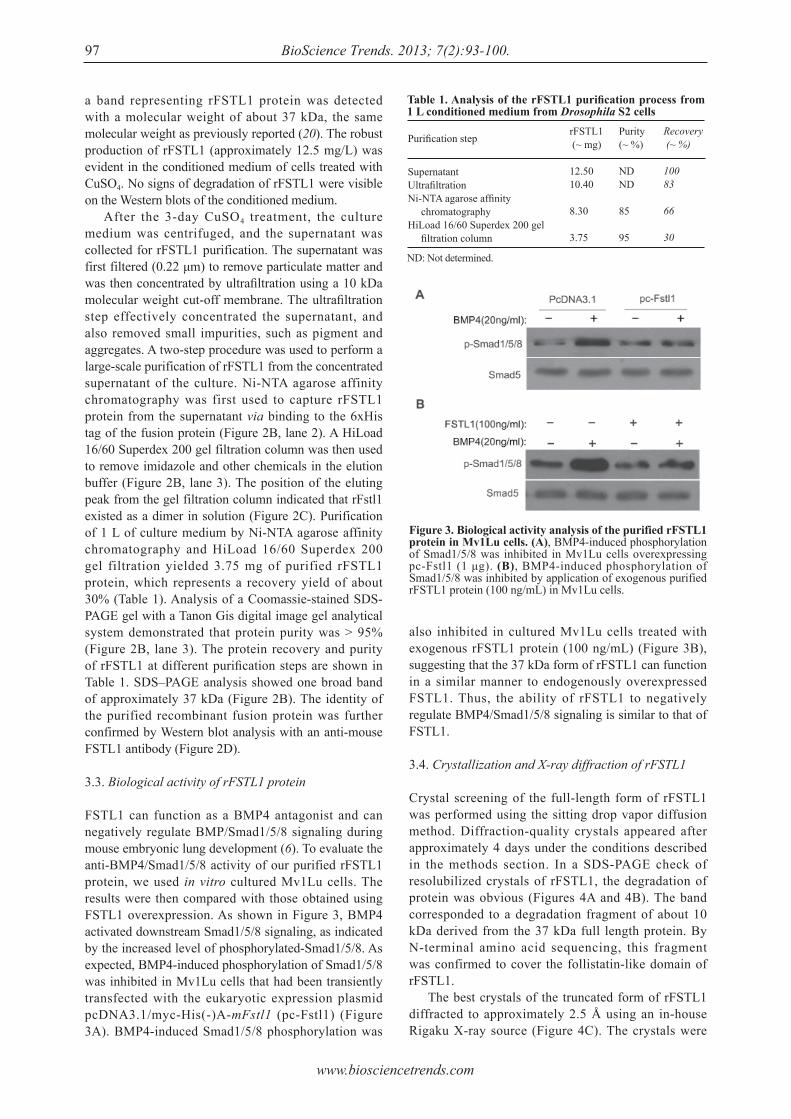
www.biosciencetrends.com
BioScience Trends. 2013; 7(2):93-100.97
a band representing rFSTL1 protein was detected with a molecular weight of about 37 kDa, the same molecular weight as previously reported (20). The robust production of rFSTL1 (approximately 12.5 mg/L) was evident in the conditioned medium of cells treated with CuSO4. No signs of degradation of rFSTL1 were visible on the Western blots of the conditioned medium. After the 3-day CuSO4 treatment, the culture medium was centrifuged, and the supernatant was collected for rFSTL1 purification. The supernatant was first filtered (0.22 μm) to remove particulate matter and was then concentrated by ultrafiltration using a 10 kDa molecular weight cut-off membrane. The ultrafiltration step effectively concentrated the supernatant, and also removed small impurities, such as pigment and aggregates. A two-step procedure was used to perform a large-scale purification of rFSTL1 from the concentrated supernatant of the culture. Ni-NTA agarose affinity chromatography was first used to capture rFSTL1 protein from the supernatant via binding to the 6xHis tag of the fusion protein (Figure 2B, lane 2). A HiLoad 16/60 Superdex 200 gel filtration column was then used to remove imidazole and other chemicals in the elution buffer (Figure 2B, lane 3). The position of the eluting peak from the gel filtration column indicated that rFstl1 existed as a dimer in solution (Figure 2C). Purification of 1 L of culture medium by Ni-NTA agarose affinity chromatography and HiLoad 16/60 Superdex 200 gel filtration yielded 3.75 mg of purified rFSTL1 protein, which represents a recovery yield of about 30% (Table 1). Analysis of a Coomassie-stained SDS-PAGE gel with a Tanon Gis digital image gel analytical system demonstrated that protein purity was > 95% (Figure 2B, lane 3). The protein recovery and purity of rFSTL1 at different purification steps are shown in Table 1. SDS–PAGE analysis showed one broad band of approximately 37 kDa (Figure 2B). The identity of the purified recombinant fusion protein was further confirmed by Western blot analysis with an anti-mouse FSTL1 antibody (Figure 2D).
3.3. Biological activity of rFSTL1 protein
FSTL1 can function as a BMP4 antagonist and can negatively regulate BMP/Smad1/5/8 signaling during mouse embryonic lung development (6). To evaluate the anti-BMP4/Smad1/5/8 activity of our purified rFSTL1 protein, we used in vitro cultured Mv1Lu cells. The results were then compared with those obtained using FSTL1 overexpression. As shown in Figure 3, BMP4 activated downstream Smad1/5/8 signaling, as indicated by the increased level of phosphorylated-Smad1/5/8. As expected, BMP4-induced phosphorylation of Smad1/5/8 was inhibited in Mv1Lu cells that had been transiently transfected with the eukaryotic expression plasmid pcDNA3.1/myc-His(-)A-mFstl1 (pc-Fstl1) (Figure 3A). BMP4-induced Smad1/5/8 phosphorylation was
also inhibited in cultured Mv1Lu cells treated with exogenous rFSTL1 protein (100 ng/mL) (Figure 3B), suggesting that the 37 kDa form of rFSTL1 can function in a similar manner to endogenously overexpressed FSTL1. Thus, the ability of rFSTL1 to negatively regulate BMP4/Smad1/5/8 signaling is similar to that of FSTL1.
3.4. Crystallization and X-ray diffraction of rFSTL1
Crystal screening of the full-length form of rFSTL1 was performed using the sitting drop vapor diffusion method. Diffraction-quality crystals appeared after approximately 4 days under the conditions described in the methods section. In a SDS-PAGE check of resolubilized crystals of rFSTL1, the degradation of protein was obvious (Figures 4A and 4B). The band corresponded to a degradation fragment of about 10 kDa derived from the 37 kDa full length protein. By N-terminal amino acid sequencing, this fragment was confirmed to cover the follistatin-like domain of rFSTL1. The best crystals of the truncated form of rFSTL1 diffracted to approximately 2.5 Å using an in-house Rigaku X-ray source (Figure 4C). The crystals were
Table 1. Analysis of the rFSTL1 purification process from 1 L conditioned medium from Drosophila S2 cells
Purification step
SupernatantUltrafiltrationNi-NTA agarose affi nity chromatographyHiLoad 16/60 Superdex 200 gel fi ltration column
Purity (~ %)
NDND
85
95
rFSTL1 (~ mg)
12.5010.40
8.30
3.75
Recovery (~ %)
10083
66
30
ND: Not determined.
Figure 3. Biological activity analysis of the purified rFSTL1 protein in Mv1Lu cells. (A), BMP4-induced phosphorylation of Smad1/5/8 was inhibited in Mv1Lu cells overexpressing pc-Fstl1 (1 μg). (B), BMP4-induced phosphorylation of Smad1/5/8 was inhibited by application of exogenous purified rFSTL1 protein (100 ng/mL) in Mv1Lu cells.
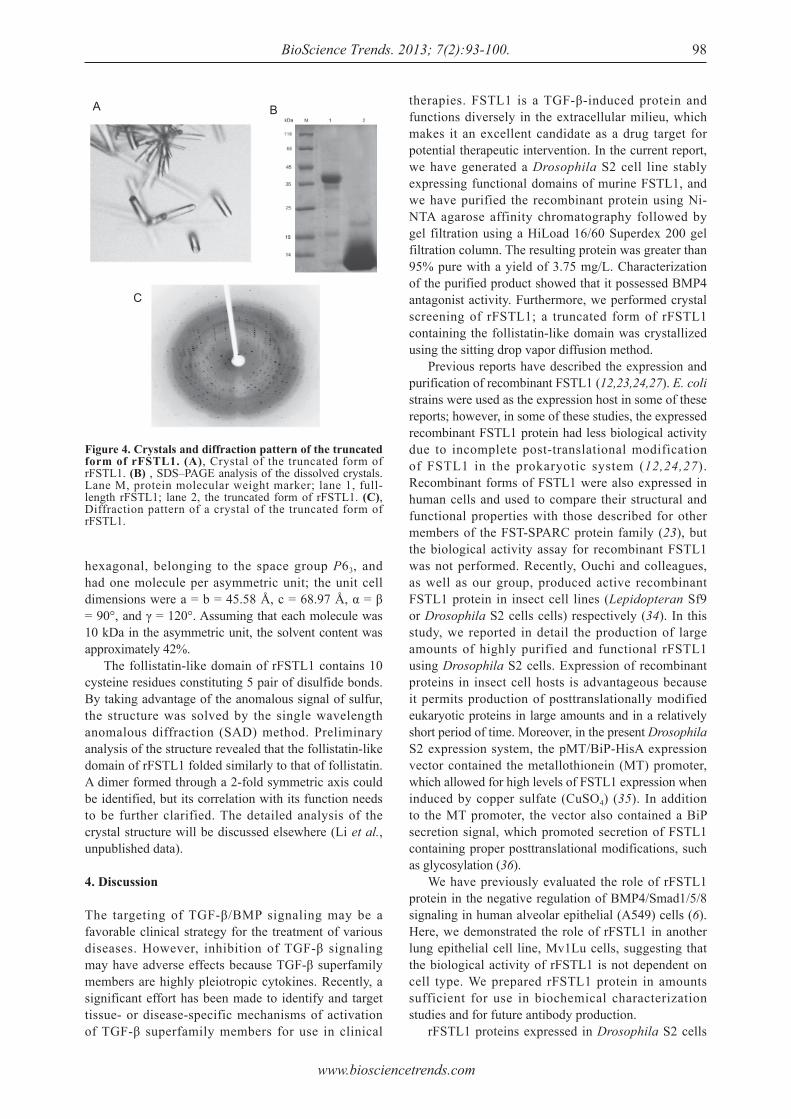
www.biosciencetrends.com
BioScience Trends. 2013; 7(2):93-100. 98
hexagonal, belonging to the space group P63, and had one molecule per asymmetric unit; the unit cell dimensions were a = b = 45.58 Å, c = 68.97 Å, α = β = 90°, and γ = 120°. Assuming that each molecule was 10 kDa in the asymmetric unit, the solvent content was approximately 42%. The follistatin-like domain of rFSTL1 contains 10 cysteine residues constituting 5 pair of disulfide bonds. By taking advantage of the anomalous signal of sulfur, the structure was solved by the single wavelength anomalous diffraction (SAD) method. Preliminary analysis of the structure revealed that the follistatin-like domain of rFSTL1 folded similarly to that of follistatin. A dimer formed through a 2-fold symmetric axis could be identified, but its correlation with its function needs to be further clarified. The detailed analysis of the crystal structure will be discussed elsewhere (Li et al., unpublished data).
4. Discussion
The targeting of TGF-β/BMP signaling may be a favorable clinical strategy for the treatment of various diseases. However, inhibition of TGF-β signaling may have adverse effects because TGF-β superfamily members are highly pleiotropic cytokines. Recently, a significant effort has been made to identify and target tissue- or disease-specific mechanisms of activation of TGF-β superfamily members for use in clinical
therapies. FSTL1 is a TGF-β-induced protein and functions diversely in the extracellular milieu, which makes it an excellent candidate as a drug target for potential therapeutic intervention. In the current report, we have generated a Drosophila S2 cell line stably expressing functional domains of murine FSTL1, and we have purified the recombinant protein using Ni-NTA agarose affinity chromatography followed by gel filtration using a HiLoad 16/60 Superdex 200 gel filtration column. The resulting protein was greater than 95% pure with a yield of 3.75 mg/L. Characterization of the purified product showed that it possessed BMP4 antagonist activity. Furthermore, we performed crystal screening of rFSTL1; a truncated form of rFSTL1 containing the follistatin-like domain was crystallized using the sitting drop vapor diffusion method. Previous reports have described the expression and purification of recombinant FSTL1 (12,23,24,27). E. coli strains were used as the expression host in some of these reports; however, in some of these studies, the expressed recombinant FSTL1 protein had less biological activity due to incomplete post-translational modification of FSTL1 in the prokaryotic system (12,24,27). Recombinant forms of FSTL1 were also expressed in human cells and used to compare their structural and functional properties with those described for other members of the FST-SPARC protein family (23), but the biological activity assay for recombinant FSTL1 was not performed. Recently, Ouchi and colleagues, as well as our group, produced active recombinant FSTL1 protein in insect cell lines (Lepidopteran Sf9 or Drosophila S2 cells cells) respectively (34). In this study, we reported in detail the production of large amounts of highly purified and functional rFSTL1 using Drosophila S2 cells. Expression of recombinant proteins in insect cell hosts is advantageous because it permits production of posttranslationally modified eukaryotic proteins in large amounts and in a relatively short period of time. Moreover, in the present Drosophila S2 expression system, the pMT/BiP-HisA expression vector contained the metallothionein (MT) promoter, which allowed for high levels of FSTL1 expression when induced by copper sulfate (CuSO4) (35). In addition to the MT promoter, the vector also contained a BiP secretion signal, which promoted secretion of FSTL1 containing proper posttranslational modifications, such as glycosylation (36). We have previously evaluated the role of rFSTL1 protein in the negative regulation of BMP4/Smad1/5/8 signaling in human alveolar epithelial (A549) cells (6). Here, we demonstrated the role of rFSTL1 in another lung epithelial cell line, Mv1Lu cells, suggesting that the biological activity of rFSTL1 is not dependent on cell type. We prepared rFSTL1 protein in amounts sufficient for use in biochemical characterization studies and for future antibody production. rFSTL1 proteins expressed in Drosophila S2 cells
Figure 4. Crystals and diffraction pattern of the truncated form of rFSTL1. (A), Crystal of the truncated form of rFSTL1. (B) , SDS–PAGE analysis of the dissolved crystals. Lane M, protein molecular weight marker; lane 1, full-length rFSTL1; lane 2, the truncated form of rFSTL1. (C), Diffraction pattern of a crystal of the truncated form of rFSTL1.
A B
C
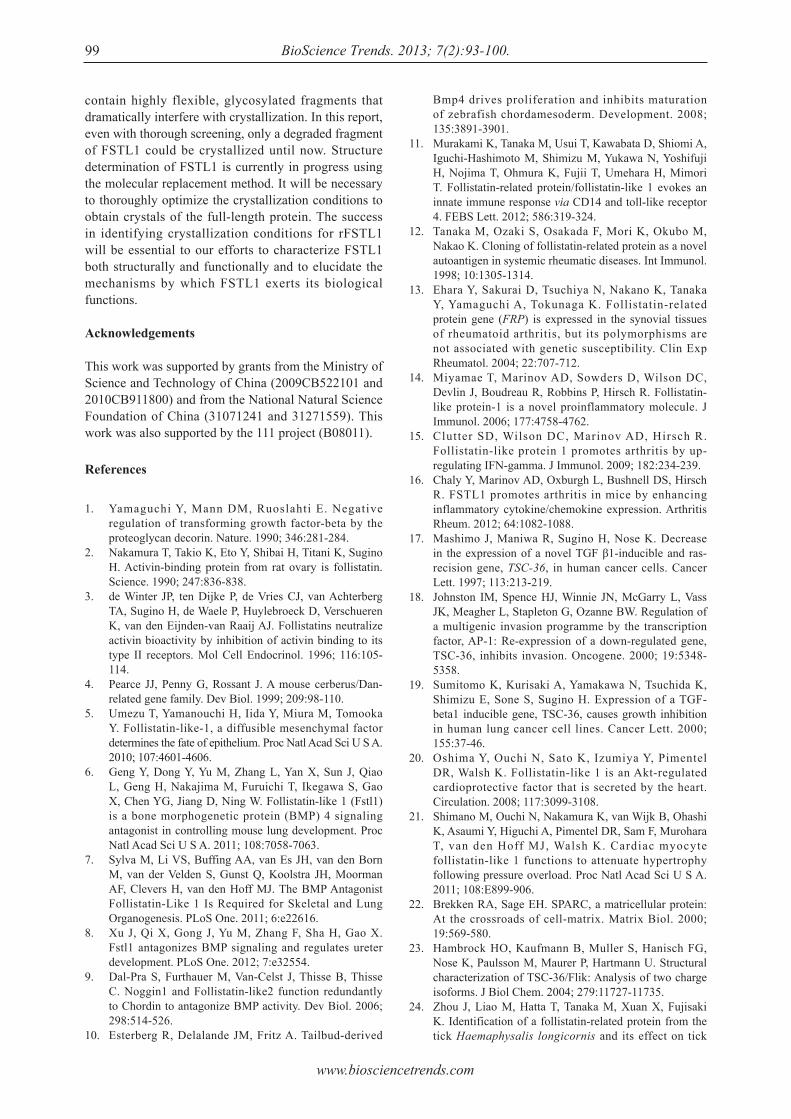
www.biosciencetrends.com
BioScience Trends. 2013; 7(2):93-100.99
contain highly flexible, glycosylated fragments that dramatically interfere with crystallization. In this report, even with thorough screening, only a degraded fragment of FSTL1 could be crystallized until now. Structure determination of FSTL1 is currently in progress using the molecular replacement method. It will be necessary to thoroughly optimize the crystallization conditions to obtain crystals of the full-length protein. The success in identifying crystallization conditions for rFSTL1 will be essential to our efforts to characterize FSTL1 both structurally and functionally and to elucidate the mechanisms by which FSTL1 exerts its biological functions.
Acknowledgements
This work was supported by grants from the Ministry of Science and Technology of China (2009CB522101 and 2010CB911800) and from the National Natural Science Foundation of China (31071241 and 31271559). This work was also supported by the 111 project (B08011).
References
1. Yamaguchi Y, Mann DM, Ruoslahti E. Negative regulation of transforming growth factor-beta by the proteoglycan decorin. Nature. 1990; 346:281-284.
2. Nakamura T, Takio K, Eto Y, Shibai H, Titani K, Sugino H. Activin-binding protein from rat ovary is follistatin. Science. 1990; 247:836-838.
3. de Winter JP, ten Dijke P, de Vries CJ, van Achterberg TA, Sugino H, de Waele P, Huylebroeck D, Verschueren K, van den Eijnden-van Raaij AJ. Follistatins neutralize activin bioactivity by inhibition of activin binding to its type II receptors. Mol Cell Endocrinol. 1996; 116:105-114.
4. Pearce JJ, Penny G, Rossant J. A mouse cerberus/Dan-related gene family. Dev Biol. 1999; 209:98-110.
5. Umezu T, Yamanouchi H, Iida Y, Miura M, Tomooka Y. Follistatin-like-1, a diffusible mesenchymal factor determines the fate of epithelium. Proc Natl Acad Sci U S A. 2010; 107:4601-4606.
6. Geng Y, Dong Y, Yu M, Zhang L, Yan X, Sun J, Qiao L, Geng H, Nakajima M, Furuichi T, Ikegawa S, Gao X, Chen YG, Jiang D, Ning W. Follistatin-like 1 (Fstl1) is a bone morphogenetic protein (BMP) 4 signaling antagonist in controlling mouse lung development. Proc Natl Acad Sci U S A. 2011; 108:7058-7063.
7. Sylva M, Li VS, Buffing AA, van Es JH, van den Born M, van der Velden S, Gunst Q, Koolstra JH, Moorman AF, Clevers H, van den Hoff MJ. The BMP Antagonist Follistatin-Like 1 Is Required for Skeletal and Lung Organogenesis. PLoS One. 2011; 6:e22616.
8. Xu J, Qi X, Gong J, Yu M, Zhang F, Sha H, Gao X. Fstl1 antagonizes BMP signaling and regulates ureter development. PLoS One. 2012; 7:e32554.
9. Dal-Pra S, Furthauer M, Van-Celst J, Thisse B, Thisse C. Noggin1 and Follistatin-like2 function redundantly to Chordin to antagonize BMP activity. Dev Biol. 2006; 298:514-526.
10. Esterberg R, Delalande JM, Fritz A. Tailbud-derived
Bmp4 drives proliferation and inhibits maturation of zebrafish chordamesoderm. Development. 2008; 135:3891-3901.
11. Murakami K, Tanaka M, Usui T, Kawabata D, Shiomi A, Iguchi-Hashimoto M, Shimizu M, Yukawa N, Yoshifuji H, Nojima T, Ohmura K, Fujii T, Umehara H, Mimori T. Follistatin-related protein/follistatin-like 1 evokes an innate immune response via CD14 and toll-like receptor 4. FEBS Lett. 2012; 586:319-324.
12. Tanaka M, Ozaki S, Osakada F, Mori K, Okubo M, Nakao K. Cloning of follistatin-related protein as a novel autoantigen in systemic rheumatic diseases. Int Immunol. 1998; 10:1305-1314.
13. Ehara Y, Sakurai D, Tsuchiya N, Nakano K, Tanaka Y, Yamaguchi A, Tokunaga K. Follistatin-related protein gene (FRP) is expressed in the synovial tissues of rheumatoid arthritis, but its polymorphisms are not associated with genetic susceptibility. Clin Exp Rheumatol. 2004; 22:707-712.
14. Miyamae T, Marinov AD, Sowders D, Wilson DC, Devlin J, Boudreau R, Robbins P, Hirsch R. Follistatin-like protein-1 is a novel proinflammatory molecule. J Immunol. 2006; 177:4758-4762.
15. Clutter SD, Wilson DC, Marinov AD, Hirsch R. Follistatin-like protein 1 promotes arthritis by up-regulating IFN-gamma. J Immunol. 2009; 182:234-239.
16. Chaly Y, Marinov AD, Oxburgh L, Bushnell DS, Hirsch R. FSTL1 promotes arthritis in mice by enhancing inflammatory cytokine/chemokine expression. Arthritis Rheum. 2012; 64:1082-1088.
17. Mashimo J, Maniwa R, Sugino H, Nose K. Decrease in the expression of a novel TGF β1-inducible and ras-recision gene, TSC-36, in human cancer cells. Cancer Lett. 1997; 113:213-219.
18. Johnston IM, Spence HJ, Winnie JN, McGarry L, Vass JK, Meagher L, Stapleton G, Ozanne BW. Regulation of a multigenic invasion programme by the transcription factor, AP-1: Re-expression of a down-regulated gene, TSC-36, inhibits invasion. Oncogene. 2000; 19:5348-5358.
19. Sumitomo K, Kurisaki A, Yamakawa N, Tsuchida K, Shimizu E, Sone S, Sugino H. Expression of a TGF-beta1 inducible gene, TSC-36, causes growth inhibition in human lung cancer cell lines. Cancer Lett. 2000; 155:37-46.
20. Oshima Y, Ouchi N, Sato K, Izumiya Y, Pimentel DR, Walsh K. Follistatin-like 1 is an Akt-regulated cardioprotective factor that is secreted by the heart. Circulation. 2008; 117:3099-3108.
21. Shimano M, Ouchi N, Nakamura K, van Wijk B, Ohashi K, Asaumi Y, Higuchi A, Pimentel DR, Sam F, Murohara T, van den Hoff MJ, Walsh K. Cardiac myocyte follistatin-like 1 functions to attenuate hypertrophy following pressure overload. Proc Natl Acad Sci U S A. 2011; 108:E899-906.
22. Brekken RA, Sage EH. SPARC, a matricellular protein: At the crossroads of cell-matrix. Matrix Biol. 2000; 19:569-580.
23. Hambrock HO, Kaufmann B, Muller S, Hanisch FG, Nose K, Paulsson M, Maurer P, Hartmann U. Structural characterization of TSC-36/Flik: Analysis of two charge isoforms. J Biol Chem. 2004; 279:11727-11735.
24. Zhou J, Liao M, Hatta T, Tanaka M, Xuan X, Fujisaki K. Identification of a follistatin-related protein from the tick Haemaphysalis longicornis and its effect on tick
www.biosciencetrends.com
BioScience Trends. 2013; 7(2):93-100. 100
oviposition. Gene. 2006; 372:191-198.25. Grabarek Z. Structural basis for diversity of the EF-hand
calcium-binding proteins. J Mol Biol. 2006; 359:509-525.
26. Kawabata D, Tanaka M, Fujii T, Umehara H, Fujita Y, Yoshifuji H, Mimori T, Ozaki S. Ameliorative effects of follistatin-related protein/TSC-36/FSTL1 on joint inflammation in a mouse model of arthritis. Arthritis Rheum. 2004; 50:660-668.
27. Liu S, Wang L, Wang W, Lin J, Han J, Sun H, Guo H, Sun R, Wu Q. TSC-36/FRP inhibits vascular smooth muscle cell proliferation and migration. Exp Mol Pathol. 2006; 80:132-140.
28. van den Berg G, Somi S, Buffing AA, Moorman AF, van den Hoff MJ. Patterns of expression of the Follistatin and Follistatin-like1 genes during chicken heart development: A potential role in valvulogenesis and late heart muscle cell formation. Anat Rec (Hoboken). 2007; 290:783-787.
29. Javerzat S, Franco M, Herbert J, Platonova N, Peille AL, Pantesco V, De Vos J, Assou S, Bicknell R, Bikfalvi A, Hagedorn M. Correlating global gene regulation to angiogenesis in the developing chick extra-embryonic vascular system. PLoS One. 2009; 4:e7856.
30. Lara-Pezzi E, Felkin LE, Birks EJ, Sarathchandra P, Panse KD, George R, Hall JL, Yacoub MH, Rosenthal N, Barton PJ. Expression of follistatin-related genes is altered in heart failure. Endocrinology. 2008; 149:5822-5827.
31. El-Armouche A, Ouchi N, Tanaka K, Doros G, Wittkopper K, Schulze T, Eschenhagen T, Walsh K, Sam
F. Follistatin-like 1 in chronic systolic heart failure: A marker of left ventricular remodeling. Circ Heart Fail. 2011; 4:621-627.
32. Widera C, Giannitsis E, Kempf T, Korf-Klingebiel M, Fiedler B, Sharma S, Katus HA, Asaumi Y, Shimano M, Walsh K, Wollert KC. Identification of follistatin-like 1 by expression cloning as an activator of the growth differentiation factor 15 gene and a prognostic biomarker in acute coronary syndrome. Clin Chem. 2012; 58:1233-1241.
33. Ning W, Li CJ, Kaminski N, et al. Comprehensive gene expression profiles reveal pathways related to the pathogenesis of chronic obstructive pulmonary disease. Proc Natl Acad Sci U S A. 2004; 101:14895-14900.
34. Ouchi N, Asaumi Y, Ohashi K, Higuchi A, Sono-Romanelli S, Oshima Y, Walsh K. DIP2A functions as a FSTL1 receptor. J Biol Chem. 2010; 285:7127-7134.
35. Johansen H, van der Straten A, Sweet R, Otto E, Maroni G, Rosenberg M. Regulated expression at high copy number allows production of a growth-inhibitory oncogene product in Drosophila Schneider cells. Genes Dev. 1989; 3:882-889.
36. Kirkpatrick RB, Ganguly S, Angelichio M, Griego S, Shatzman A, Silverman C, Rosenberg M. Heavy chain dimers as well as complete antibodies are efficiently formed and secreted from Drosophila via a BiP-mediated pathway. J Biol Chem. 1995; 270:19800-19805.
(Received February 28, 2013; Revised April 13, 2013; Accepted April 16, 2013)
www.biosciencetrends.com
BioScience Trends. 2013; 7(2):101-108.101
Pulse pressure variation and stroke volume variation predict fluid responsiveness in mechanically ventilated patients experiencing intra-abdominal hypertension
Xiaomei Liu, Qiang Fu, Weidong Mi*, Henian Liu, Hong Zhang, Peiji Wang
Department of Anesthesiology, General Hospital of People's Liberation Army, Beijing, China.
Liu XM and Fu Q contributed equally to this work.*Address correspondence to:Dr. Weidong Mi, Department of Anesthesiology, General Hospital of People's Liberation Army, 28 Fuxing Road, Haidian District, Beijing 100853, China.E-mail: [email protected]
1. Introduction
Intraoperative optimization of fluid administration reduces the number of critical care admissions, the length of hospital stays, and incidences of mortality after major surgery in various clinical settings (1-4). Frequently used static preload variables such as central venous pressure (CVP) or pulmonary capillary wedge pressure often fail to provide reliable information on cardiac preload and are not capable of predicting a cardiac response to fluid therapy (5,6). As an alternative to these static variables, stroke volume variation (SVV) and pulse pressure variation (PPV) have been shown
to be sensitive predictors of fluid responsiveness in mechanically ventilated patients undergoing cardiac surgery, neurosurgical procedures, and live transplantation (7-9). Left ventricle preload is highly susceptible to changes in the intrathoracic pressure induced by mechanical ventilation. Thus, mechanical ventilation results in cyclic changes of stroke volume (SV) predominantly in preload-dependent patients, but to a lesser degree in preload-independent patients. Alterations of SV can be assessed by the cyclic changes in arterial pulse pressure. Both PPV and SVV are increased with hypovolemia, and variations decrease if intravascular blood volume is restored. Intra-abdominal pressure (IAP) is frequently increased in critically ill patients. A multiple prospective epidemiological study involving 97 patients revealed that the prevalence of intra-abdominal hypertension (IAH) (defined as a maximal IAP of 12 mmHg or more) was 50.5%, and of abdominal compartment syndrome (defined as a maximal IAP of 20 mmHg or more) was
Summary The purpose of the present study was to evaluate whether pulse pressure variation (PPV) and stroke volume variation (SVV) can predict fluid responsiveness in patients with intra-abdominal hypertension (IAH) in either a supine or Trendelenburg position. Forty mechanically ventilated patients that exhibited IAH resulting from carbon dioxide insufflation (up to 12 mmHg) underwent fluid therapy in either a supine or Trendelenburg position. Hemodynamic measurements, including PPV and SVV, were obtained before and after fluid therapy. Prediction of fluid responsiveness (> 10% increase in stroke volume) was performed by linear regression analyses. Baseline PPV and SVV values correlated closely with changes in stroke volume induced by fluid therapy, and were significantly higher in patients that subsequently responded to fluid therapy. Fluid responsiveness in patients in a supine position was predicted by a PPV threshold of > 10.5% and an SVV threshold of > 10.5%. Fluid responsiveness in patients in a Trendelenburg position was predicted by a PPV threshold of > 7.5% and an SVV threshold of > 7.0%. PPV and SVV were demonstrated to be sensitive and specific predictors of fluid responsiveness in patients with IAH in both the supine and Trendelenburg positions.
Keywords: Stroke volume variation, pulse pressure variation, fluid responsiveness, intra-abdominal hypertension, Trendelenburg position
DOI: 10.5582/bst.2013.v7.2.101Original Article
www.biosciencetrends.com
BioScience Trends. 2013; 7(2):101-108.
8%, in critically ill patients (10). However, another prospective cohort study involving 83 patients found that the prevalence of IAH and abdominal compartment syndrome in critically ill patients were 64% and 12%, respectively (11). IAH was significantly associated with more severe organ failure, particularly renal and respiratory, and a prolonged intensive care unit stay (11-13). IAH was demonstrated to be an independent predictor for in-hospital mortality (14). Appropriate fluid therapy is of the utmost importance for optimizing cardiac performance and organ perfusion during IAH (15). It has been shown that cardiac filling pressures, such as CVP and pulmonary artery occlusion pressure, in the presence of elevated IAP may be falsely increased, hence misleading adequate fluid therapy (16). Recently, it has been demonstrated that elevated IAP increases the static variables of preload such as PPV and systolic pressure variation (SPV), especially in cases of hypovolemia (17,18). However, it is currently unknown whether PPV and SVV can serve as predictors of fluid responsiveness when IAH is present. The majority of studies have only reported on procedures performed on patients in a supine position. However, a position common in abdominal and gynecological surgeries is the Trendelenburg position. In this position, the patient is laid flat on the back with the feet higher than the head by 15-30 degrees in order to improve surgical exposure of the pelvic organs, as gravity pulls the intestines away from the pelvis. As a result, this position may increase the cardiac preload from the major vessels in the lower extremities, and decrease the compliance of the respiratory system, reducing functional residual capacity as the diaphragm is forced towards the heart, hence affecting heart-lung interactions. Currently, it is unclear whether the Trendelenburg position influences the ability of SVV and PPV to predict fluid responsiveness, especially in patients with IAH.
2. Materials and Methods
2.1. Patients and anesthesia
With local ethics committee approval and patient written informed consent, forty mechanically ventilated patients undergoing laparoscopy-assisted gastrointestinal surgery were enrolled in this study. Twenty patients were placed in the supine position and surgical procedures were performed to remove stomach cancer. The remaining twenty patients were placed in the Trendelenburg position for the surgical removal of colon cancer. Patients with preoperative arrhythmias, left ventricle ejection fractions < 50%, valvular heart disease, intracardiac shunts, pulmonary artery hypertension, or severe peripheral vascular obstructive disease were excluded. The patients were pre-medicated with 0.5 mg
atropine (i.m.) 30-40 min before their arrival to the operating room. After placement of the routine hemodynamic monitoring equipment and the insertion of arterial and peripheral IV lines, anesthesia was induced with an IV infusion of midazolam (0.05 mg/kg), propofol (1-2 mg/kg), and fentanyl (3 μg/kg), and maintained by using target controlled infusion of propofol (2-4 μg/mL) and a continuous infusion of remifentanil (0.3-0.8 μg/kg/min) to keep the bispectral index between 40 and 50. Neuromuscular blockade was achieved with rocuronium (0.8 mg/kg; IV). Following endotracheal intubation, mechanical ventilation was performed in a volume-controlled mode with an inspired oxygen concentration of 40%, a tidal volume of 8-10 mL/kg, an end-expiratory rate of 0 cm H2O, and an inspiratory/expiratory ratio of 0.5. Respiratory rate was adjusted to maintain an arterial carbon dioxide pressure between 35 and 40 mmHg.
2.2. Hemodynamic monitoring
After induction of anesthesia, a standard 7 Fr Two-Lumen central venous catheterization set (Arrow International Inc. Salt Lake City, UT, USA) was introduced via right internal jugular vein access. CVP was measured using standard transducers and displayed on a monitor. Pressure transducers were zeroed at midaxillary level to ambient pressures. A 3 F tipped arterial catheter (Laboratoires Pharmaceutiques, Vygon, Ecouen, France) was inserted percutaneously into the left radial artery. A transducer (FloTrac, Edwards Life-science, LLC, Irvine, CA, USA) was connected to the radial arterial line on one side and to the Vigileo system (software version 01.01; Edwards Life-science LLC, Irvine, CA, USA). This system enables the continuous monitoring of arterial pressure, cardiac output (CO), SV, and SVV by pulse contour analysis. This system needs no calibration and provides continuous CO measurements from the arterial pressure wave. The Vigileo system analyzes the pressure waveform 100 times/sec over 20 sec, captures 2,000 data points for analysis, and performs its calculations on the most recent 20 sec data. The device calculates SV as k × pulsatility, where pulsatility is the standard deviation of arterial pressure over a 20 sec interval, and k is a factor quantifying arterial compliance and vascular resistance. The CO was calculated as follows: CO = heart rate (HR) × SV. Except for cardiac pre- and after-load, alteration of HR significantly impacts the measure of CO. However, SV has a close relationship with cardiac pre-load; thus, it was selected as a measure for showing improvement after fluid therapy. SVV, as a percentage change of SV during the ventilatory cycle, was evaluated according to the following equation: SVV (%) = (maximum SV – minimum SV)/mean SV, where maximum and minimum SV are mean values of the four extreme values of SV during a period of
102
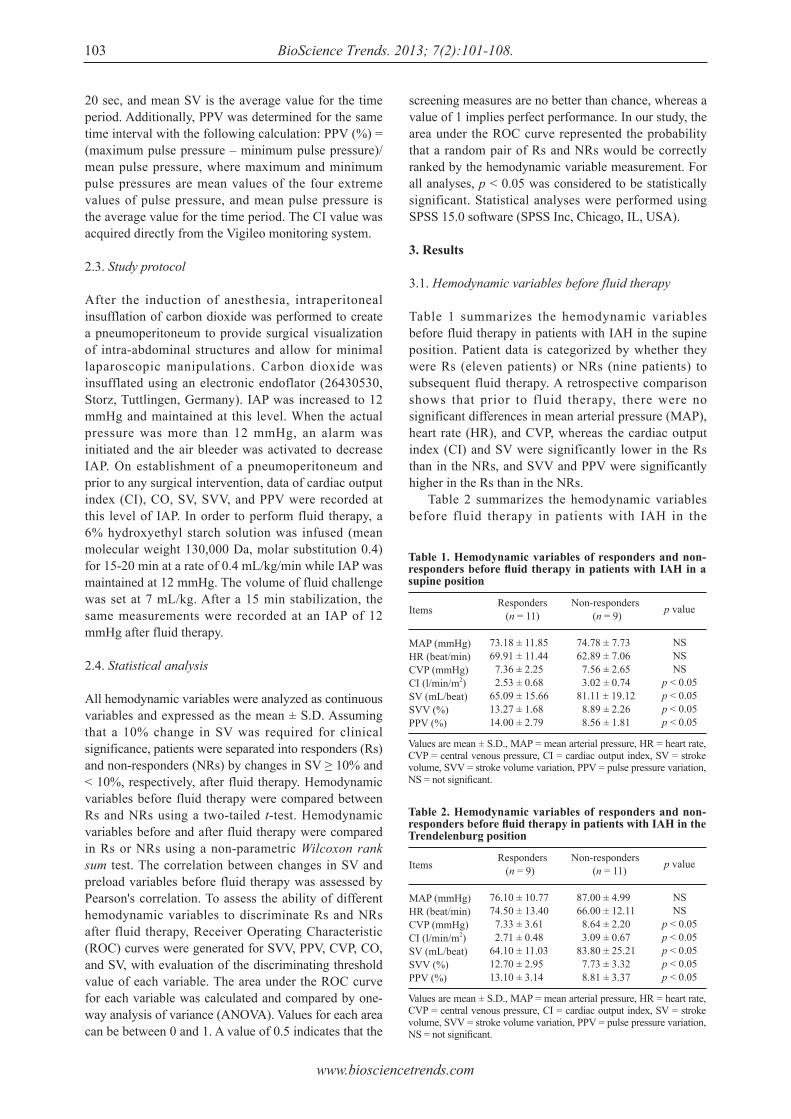
www.biosciencetrends.com
BioScience Trends. 2013; 7(2):101-108.103
screening measures are no better than chance, whereas a value of 1 implies perfect performance. In our study, the area under the ROC curve represented the probability that a random pair of Rs and NRs would be correctly ranked by the hemodynamic variable measurement. For all analyses, p < 0.05 was considered to be statistically significant. Statistical analyses were performed using SPSS 15.0 software (SPSS Inc, Chicago, IL, USA).
3. Results
3.1. Hemodynamic variables before fluid therapy
Table 1 summarizes the hemodynamic variables before fluid therapy in patients with IAH in the supine position. Patient data is categorized by whether they were Rs (eleven patients) or NRs (nine patients) to subsequent fluid therapy. A retrospective comparison shows that prior to fluid therapy, there were no significant differences in mean arterial pressure (MAP), heart rate (HR), and CVP, whereas the cardiac output index (CI) and SV were significantly lower in the Rs than in the NRs, and SVV and PPV were significantly higher in the Rs than in the NRs. Table 2 summarizes the hemodynamic variables before fluid therapy in patients with IAH in the
20 sec, and mean SV is the average value for the time period. Additionally, PPV was determined for the same time interval with the following calculation: PPV (%) = (maximum pulse pressure – minimum pulse pressure)/mean pulse pressure, where maximum and minimum pulse pressures are mean values of the four extreme values of pulse pressure, and mean pulse pressure is the average value for the time period. The CI value was acquired directly from the Vigileo monitoring system.
2.3. Study protocol
After the induction of anesthesia, intraperitoneal insufflation of carbon dioxide was performed to create a pneumoperitoneum to provide surgical visualization of intra-abdominal structures and allow for minimal laparoscopic manipulations. Carbon dioxide was insufflated using an electronic endoflator (26430530, Storz, Tuttlingen, Germany). IAP was increased to 12 mmHg and maintained at this level. When the actual pressure was more than 12 mmHg, an alarm was initiated and the air bleeder was activated to decrease IAP. On establishment of a pneumoperitoneum and prior to any surgical intervention, data of cardiac output index (CI), CO, SV, SVV, and PPV were recorded at this level of IAP. In order to perform fluid therapy, a 6% hydroxyethyl starch solution was infused (mean molecular weight 130,000 Da, molar substitution 0.4) for 15-20 min at a rate of 0.4 mL/kg/min while IAP was maintained at 12 mmHg. The volume of fluid challenge was set at 7 mL/kg. After a 15 min stabilization, the same measurements were recorded at an IAP of 12 mmHg after fluid therapy.
2.4. Statistical analysis
All hemodynamic variables were analyzed as continuous variables and expressed as the mean ± S.D. Assuming that a 10% change in SV was required for clinical significance, patients were separated into responders (Rs) and non-responders (NRs) by changes in SV ≥ 10% and < 10%, respectively, after fluid therapy. Hemodynamic variables before fluid therapy were compared between Rs and NRs using a two-tailed t-test. Hemodynamic variables before and after fluid therapy were compared in Rs or NRs using a non-parametric Wilcoxon rank sum test. The correlation between changes in SV and preload variables before fluid therapy was assessed by Pearson's correlation. To assess the ability of different hemodynamic variables to discriminate Rs and NRs after fluid therapy, Receiver Operating Characteristic (ROC) curves were generated for SVV, PPV, CVP, CO, and SV, with evaluation of the discriminating threshold value of each variable. The area under the ROC curve for each variable was calculated and compared by one-way analysis of variance (ANOVA). Values for each area can be between 0 and 1. A value of 0.5 indicates that the
Table 1. Hemodynamic variables of responders and non-responders before fl uid therapy in patients with IAH in a supine position
Items
MAP (mmHg)HR (beat/min)CVP (mmHg)CI (l/min/m2)SV (mL/beat)SVV (%)PPV (%)
Non-responders (n = 9)
74.78 ± 7.7362.89 ± 7.06 7.56 ± 2.65 3.02 ± 0.7481.11 ± 19.12 8.89 ± 2.26 8.56 ± 1.81
Responders (n = 11)
73.18 ± 11.8569.91 ± 11.44 7.36 ± 2.25 2.53 ± 0.6865.09 ± 15.6613.27 ± 1.6814.00 ± 2.79
p value
NSNSNS
p < 0.05p < 0.05p < 0.05p < 0.05
Values are mean ± S.D., MAP = mean arterial pressure, HR = heart rate, CVP = central venous pressure, CI = cardiac output index, SV = stroke volume, SVV = stroke volume variation, PPV = pulse pressure variation, NS = not signifi cant.
Table 2. Hemodynamic variables of responders and non-responders before fl uid therapy in patients with IAH in the Trendelenburg position
Items
MAP (mmHg)HR (beat/min)CVP (mmHg)CI (l/min/m2)SV (mL/beat)SVV (%)PPV (%)
Non-responders (n = 11)
87.00 ± 4.9966.00 ± 12.11 8.64 ± 2.20 3.09 ± 0.6783.80 ± 25.21 7.73 ± 3.32 8.81 ± 3.37
Responders (n = 9)
76.10 ± 10.7774.50 ± 13.40 7.33 ± 3.61 2.71 ± 0.4864.10 ± 11.0312.70 ± 2.9513.10 ± 3.14
p value
NSNS
p < 0.05p < 0.05p < 0.05p < 0.05p < 0.05
Values are mean ± S.D., MAP = mean arterial pressure, HR = heart rate, CVP = central venous pressure, CI = cardiac output index, SV = stroke volume, SVV = stroke volume variation, PPV = pulse pressure variation, NS = not signifi cant.
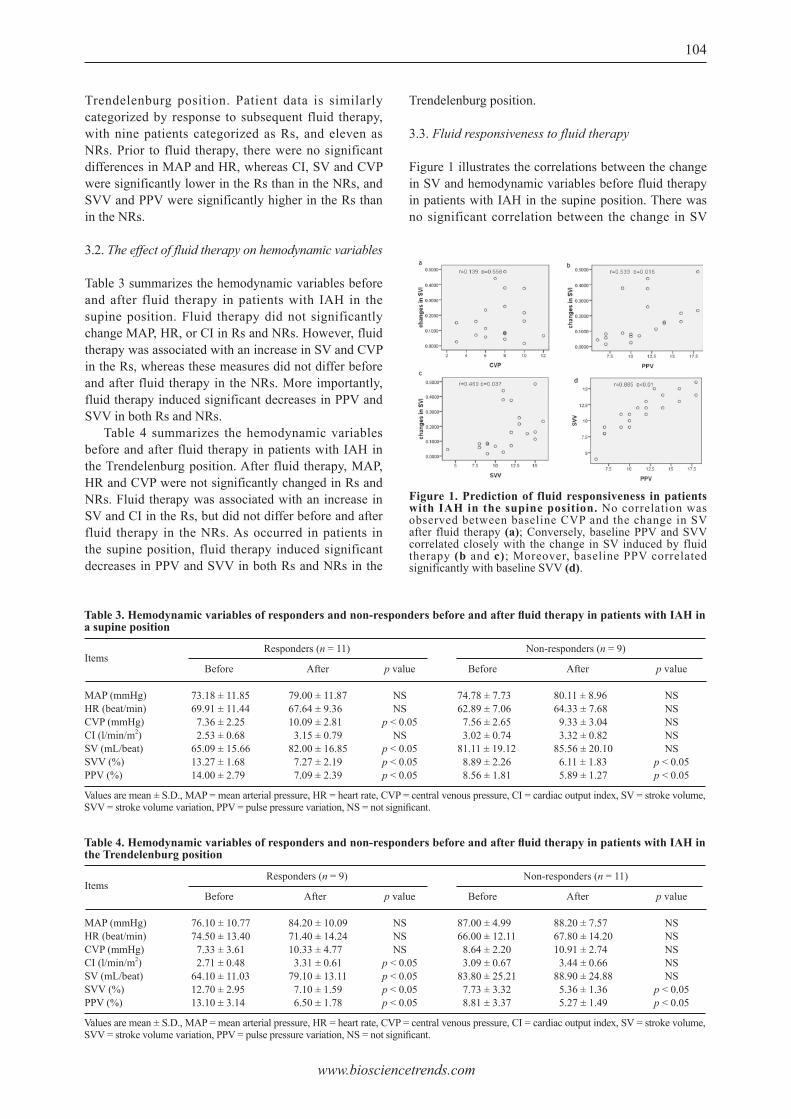
www.biosciencetrends.com
BioScience Trends. 2013; 7(2):101-108. 104
Trendelenburg position. Patient data is similarly categorized by response to subsequent fluid therapy, with nine patients categorized as Rs, and eleven as NRs. Prior to fluid therapy, there were no significant differences in MAP and HR, whereas CI, SV and CVP were significantly lower in the Rs than in the NRs, and SVV and PPV were significantly higher in the Rs than in the NRs.
3.2. The effect of fluid therapy on hemodynamic variables
Table 3 summarizes the hemodynamic variables before and after fluid therapy in patients with IAH in the supine position. Fluid therapy did not significantly change MAP, HR, or CI in Rs and NRs. However, fluid therapy was associated with an increase in SV and CVP in the Rs, whereas these measures did not differ before and after fluid therapy in the NRs. More importantly, fluid therapy induced significant decreases in PPV and SVV in both Rs and NRs. Table 4 summarizes the hemodynamic variables before and after fluid therapy in patients with IAH in the Trendelenburg position. After fluid therapy, MAP, HR and CVP were not significantly changed in Rs and NRs. Fluid therapy was associated with an increase in SV and CI in the Rs, but did not differ before and after fluid therapy in the NRs. As occurred in patients in the supine position, fluid therapy induced significant decreases in PPV and SVV in both Rs and NRs in the
Trendelenburg position.
3.3. Fluid responsiveness to fluid therapy
Figure 1 illustrates the correlations between the change in SV and hemodynamic variables before fluid therapy in patients with IAH in the supine position. There was no significant correlation between the change in SV
Figure 1. Prediction of fluid responsiveness in patients with IAH in the supine position. No correlation was observed between baseline CVP and the change in SV after fluid therapy (a); Conversely, baseline PPV and SVV correlated closely with the change in SV induced by fluid therapy (b and c); Moreover, baseline PPV correlated significantly with baseline SVV (d).
Table 3. Hemodynamic variables of responders and non-responders before and after fl uid therapy in patients with IAH in a supine position
Items
MAP (mmHg)HR (beat/min)CVP (mmHg)CI (l/min/m2)SV (mL/beat)SVV (%)PPV (%)
Before
73.18 ± 11.8569.91 ± 11.44 7.36 ± 2.25 2.53 ± 0.6865.09 ± 15.6613.27 ± 1.6814.00 ± 2.79
Values are mean ± S.D., MAP = mean arterial pressure, HR = heart rate, CVP = central venous pressure, CI = cardiac output index, SV = stroke volume, SVV = stroke volume variation, PPV = pulse pressure variation, NS = not signifi cant.
After
79.00 ± 11.8767.64 ± 9.3610.09 ± 2.81 3.15 ± 0.7982.00 ± 16.85 7.27 ± 2.19 7.09 ± 2.39
p value
NSNS
p < 0.05NS
p < 0.05p < 0.05p < 0.05
Before
74.78 ± 7.7362.89 ± 7.06 7.56 ± 2.65 3.02 ± 0.7481.11 ± 19.12 8.89 ± 2.26 8.56 ± 1.81
After
80.11 ± 8.9664.33 ± 7.68 9.33 ± 3.04 3.32 ± 0.8285.56 ± 20.10 6.11 ± 1.83 5.89 ± 1.27
p value
NSNSNSNSNS
p < 0.05p < 0.05
Non-responders (n = 9)Responders (n = 11)
Table 4. Hemodynamic variables of responders and non-responders before and after fl uid therapy in patients with IAH in the Trendelenburg position
Items
MAP (mmHg)HR (beat/min)CVP (mmHg)CI (l/min/m2)SV (mL/beat)SVV (%)PPV (%)
Before
76.10 ± 10.7774.50 ± 13.40 7.33 ± 3.61 2.71 ± 0.4864.10 ± 11.0312.70 ± 2.9513.10 ± 3.14
Values are mean ± S.D., MAP = mean arterial pressure, HR = heart rate, CVP = central venous pressure, CI = cardiac output index, SV = stroke volume, SVV = stroke volume variation, PPV = pulse pressure variation, NS = not signifi cant.
After
84.20 ± 10.0971.40 ± 14.2410.33 ± 4.77 3.31 ± 0.6179.10 ± 13.11 7.10 ± 1.59 6.50 ± 1.78
p value
NSNSNS
p < 0.05p < 0.05p < 0.05p < 0.05
Before
87.00 ± 4.9966.00 ± 12.11 8.64 ± 2.20 3.09 ± 0.6783.80 ± 25.21 7.73 ± 3.32 8.81 ± 3.37
After
88.20 ± 7.5767.80 ± 14.2010.91 ± 2.74 3.44 ± 0.6688.90 ± 24.88 5.36 ± 1.36 5.27 ± 1.49
p value
NSNSNSNSNS
p < 0.05p < 0.05
Non-responders (n = 11)Responders (n = 9)
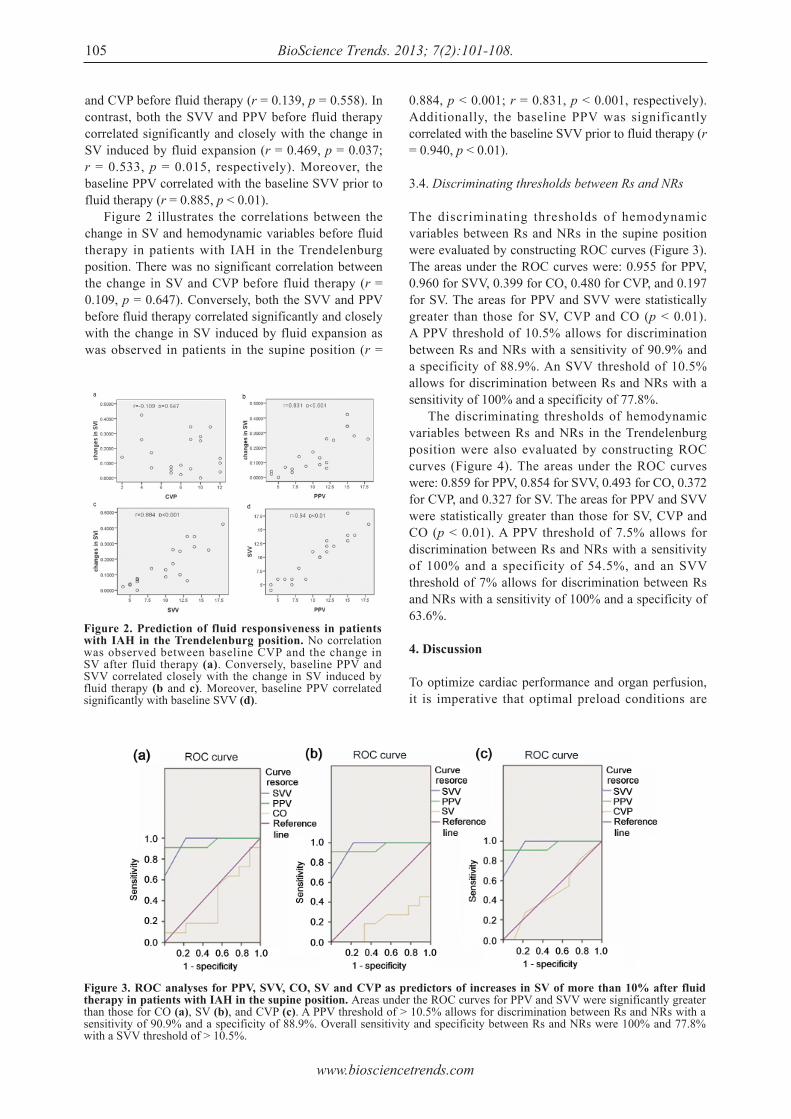
www.biosciencetrends.com
BioScience Trends. 2013; 7(2):101-108.105
and CVP before fluid therapy (r = 0.139, p = 0.558). In contrast, both the SVV and PPV before fluid therapy correlated significantly and closely with the change in SV induced by fluid expansion (r = 0.469, p = 0.037; r = 0.533, p = 0.015, respectively). Moreover, the baseline PPV correlated with the baseline SVV prior to fluid therapy (r = 0.885, p < 0.01). Figure 2 illustrates the correlations between the change in SV and hemodynamic variables before fluid therapy in patients with IAH in the Trendelenburg position. There was no significant correlation between the change in SV and CVP before fluid therapy (r = 0.109, p = 0.647). Conversely, both the SVV and PPV before fluid therapy correlated significantly and closely with the change in SV induced by fluid expansion as was observed in patients in the supine position (r =
0.884, p < 0.001; r = 0.831, p < 0.001, respectively). Additionally, the baseline PPV was significantly correlated with the baseline SVV prior to fluid therapy (r = 0.940, p < 0.01).
3.4. Discriminating thresholds between Rs and NRs
The discriminating thresholds of hemodynamic variables between Rs and NRs in the supine position were evaluated by constructing ROC curves (Figure 3). The areas under the ROC curves were: 0.955 for PPV, 0.960 for SVV, 0.399 for CO, 0.480 for CVP, and 0.197 for SV. The areas for PPV and SVV were statistically greater than those for SV, CVP and CO (p < 0.01). A PPV threshold of 10.5% allows for discrimination between Rs and NRs with a sensitivity of 90.9% and a specificity of 88.9%. An SVV threshold of 10.5% allows for discrimination between Rs and NRs with a sensitivity of 100% and a specificity of 77.8%. The discriminating thresholds of hemodynamic variables between Rs and NRs in the Trendelenburg position were also evaluated by constructing ROC curves (Figure 4). The areas under the ROC curves were: 0.859 for PPV, 0.854 for SVV, 0.493 for CO, 0.372 for CVP, and 0.327 for SV. The areas for PPV and SVV were statistically greater than those for SV, CVP and CO (p < 0.01). A PPV threshold of 7.5% allows for discrimination between Rs and NRs with a sensitivity of 100% and a specificity of 54.5%, and an SVV threshold of 7% allows for discrimination between Rs and NRs with a sensitivity of 100% and a specificity of 63.6%.
4. Discussion
To optimize cardiac performance and organ perfusion, it is imperative that optimal preload conditions are
Figure 2. Prediction of fluid responsiveness in patients with IAH in the Trendelenburg position. No correlation was observed between baseline CVP and the change in SV after fluid therapy (a). Conversely, baseline PPV and SVV correlated closely with the change in SV induced by fluid therapy (b and c). Moreover, baseline PPV correlated significantly with baseline SVV (d).
Figure 3. ROC analyses for PPV, SVV, CO, SV and CVP as predictors of increases in SV of more than 10% after fluid therapy in patients with IAH in the supine position. Areas under the ROC curves for PPV and SVV were significantly greater than those for CO (a), SV (b), and CVP (c). A PPV threshold of > 10.5% allows for discrimination between Rs and NRs with a sensitivity of 90.9% and a specificity of 88.9%. Overall sensitivity and specificity between Rs and NRs were 100% and 77.8% with a SVV threshold of > 10.5%.
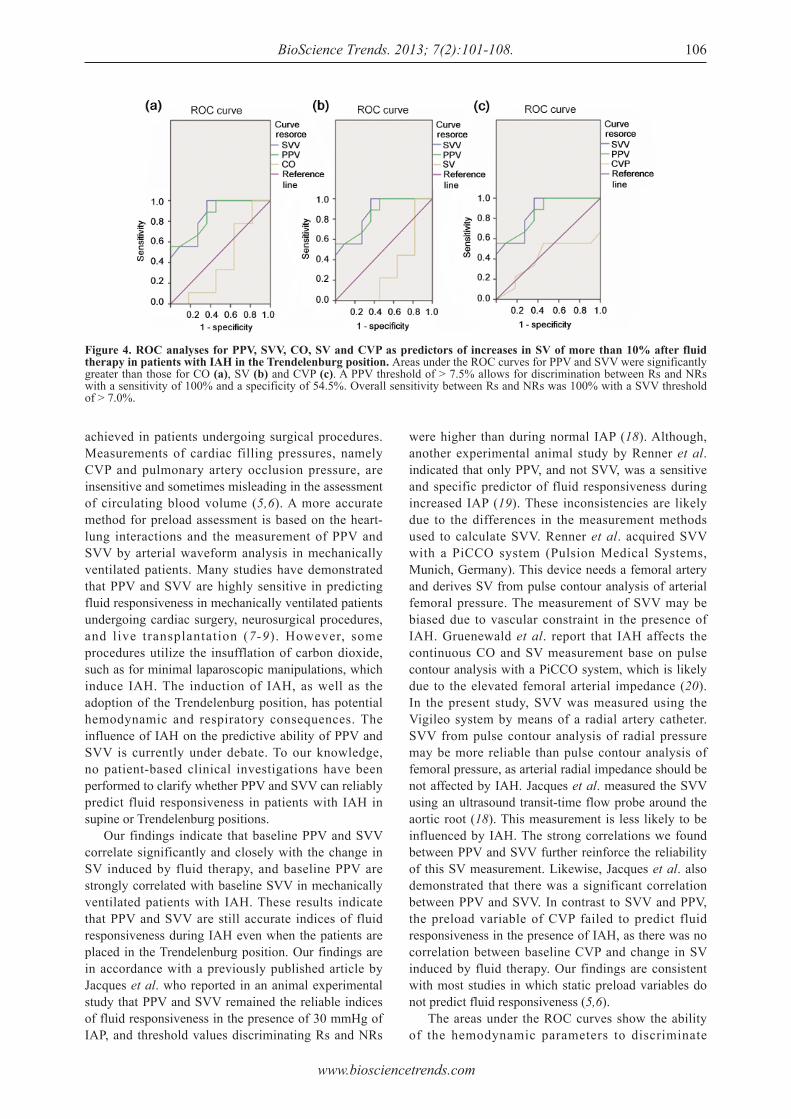
www.biosciencetrends.com
BioScience Trends. 2013; 7(2):101-108. 106
achieved in patients undergoing surgical procedures. Measurements of cardiac filling pressures, namely CVP and pulmonary artery occlusion pressure, are insensitive and sometimes misleading in the assessment of circulating blood volume (5,6). A more accurate method for preload assessment is based on the heart-lung interactions and the measurement of PPV and SVV by arterial waveform analysis in mechanically ventilated patients. Many studies have demonstrated that PPV and SVV are highly sensitive in predicting fluid responsiveness in mechanically ventilated patients undergoing cardiac surgery, neurosurgical procedures, and live transplantation (7-9). However, some procedures utilize the insufflation of carbon dioxide, such as for minimal laparoscopic manipulations, which induce IAH. The induction of IAH, as well as the adoption of the Trendelenburg position, has potential hemodynamic and respiratory consequences. The influence of IAH on the predictive ability of PPV and SVV is currently under debate. To our knowledge, no patient-based clinical investigations have been performed to clarify whether PPV and SVV can reliably predict fluid responsiveness in patients with IAH in supine or Trendelenburg positions. Our findings indicate that baseline PPV and SVV correlate significantly and closely with the change in SV induced by fluid therapy, and baseline PPV are strongly correlated with baseline SVV in mechanically ventilated patients with IAH. These results indicate that PPV and SVV are still accurate indices of fluid responsiveness during IAH even when the patients are placed in the Trendelenburg position. Our findings are in accordance with a previously published article by Jacques et al. who reported in an animal experimental study that PPV and SVV remained the reliable indices of fluid responsiveness in the presence of 30 mmHg of IAP, and threshold values discriminating Rs and NRs
were higher than during normal IAP (18). Although, another experimental animal study by Renner et al. indicated that only PPV, and not SVV, was a sensitive and specific predictor of fluid responsiveness during increased IAP (19). These inconsistencies are likely due to the differences in the measurement methods used to calculate SVV. Renner et al. acquired SVV with a PiCCO system (Pulsion Medical Systems, Munich, Germany). This device needs a femoral artery and derives SV from pulse contour analysis of arterial femoral pressure. The measurement of SVV may be biased due to vascular constraint in the presence of IAH. Gruenewald et al. report that IAH affects the continuous CO and SV measurement base on pulse contour analysis with a PiCCO system, which is likely due to the elevated femoral arterial impedance (20). In the present study, SVV was measured using the Vigileo system by means of a radial artery catheter. SVV from pulse contour analysis of radial pressure may be more reliable than pulse contour analysis of femoral pressure, as arterial radial impedance should be not affected by IAH. Jacques et al. measured the SVV using an ultrasound transit-time flow probe around the aortic root (18). This measurement is less likely to be influenced by IAH. The strong correlations we found between PPV and SVV further reinforce the reliability of this SV measurement. Likewise, Jacques et al. also demonstrated that there was a significant correlation between PPV and SVV. In contrast to SVV and PPV, the preload variable of CVP failed to predict fluid responsiveness in the presence of IAH, as there was no correlation between baseline CVP and change in SV induced by fluid therapy. Our findings are consistent with most studies in which static preload variables do not predict fluid responsiveness (5,6). The areas under the ROC curves show the ability of the hemodynamic parameters to discriminate
Figure 4. ROC analyses for PPV, SVV, CO, SV and CVP as predictors of increases in SV of more than 10% after fluid therapy in patients with IAH in the Trendelenburg position. Areas under the ROC curves for PPV and SVV were significantly greater than those for CO (a), SV (b) and CVP (c). A PPV threshold of > 7.5% allows for discrimination between Rs and NRs with a sensitivity of 100% and a specificity of 54.5%. Overall sensitivity between Rs and NRs was 100% with a SVV threshold of > 7.0%.
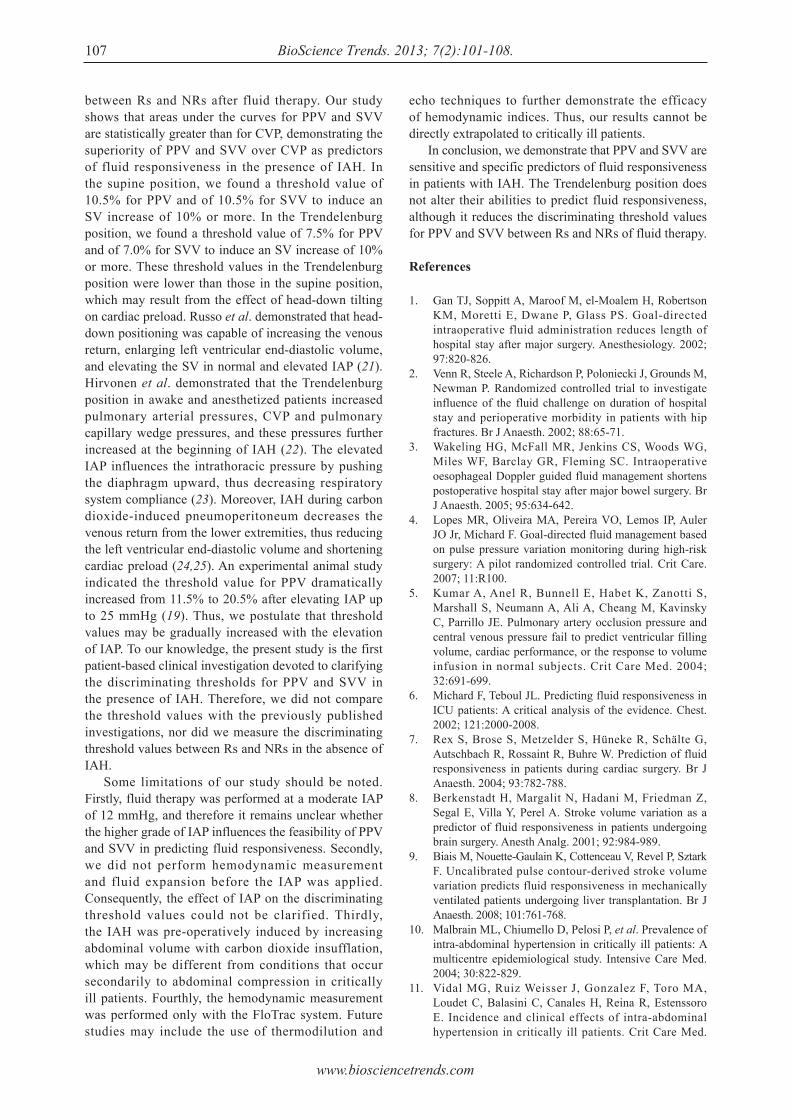
www.biosciencetrends.com
BioScience Trends. 2013; 7(2):101-108.107
between Rs and NRs after fluid therapy. Our study shows that areas under the curves for PPV and SVV are statistically greater than for CVP, demonstrating the superiority of PPV and SVV over CVP as predictors of fluid responsiveness in the presence of IAH. In the supine position, we found a threshold value of 10.5% for PPV and of 10.5% for SVV to induce an SV increase of 10% or more. In the Trendelenburg position, we found a threshold value of 7.5% for PPV and of 7.0% for SVV to induce an SV increase of 10% or more. These threshold values in the Trendelenburg position were lower than those in the supine position, which may result from the effect of head-down tilting on cardiac preload. Russo et al. demonstrated that head-down positioning was capable of increasing the venous return, enlarging left ventricular end-diastolic volume, and elevating the SV in normal and elevated IAP (21). Hirvonen et al. demonstrated that the Trendelenburg position in awake and anesthetized patients increased pulmonary arterial pressures, CVP and pulmonary capillary wedge pressures, and these pressures further increased at the beginning of IAH (22). The elevated IAP influences the intrathoracic pressure by pushing the diaphragm upward, thus decreasing respiratory system compliance (23). Moreover, IAH during carbon dioxide-induced pneumoperitoneum decreases the venous return from the lower extremities, thus reducing the left ventricular end-diastolic volume and shortening cardiac preload (24,25). An experimental animal study indicated the threshold value for PPV dramatically increased from 11.5% to 20.5% after elevating IAP up to 25 mmHg (19). Thus, we postulate that threshold values may be gradually increased with the elevation of IAP. To our knowledge, the present study is the first patient-based clinical investigation devoted to clarifying the discriminating thresholds for PPV and SVV in the presence of IAH. Therefore, we did not compare the threshold values with the previously published investigations, nor did we measure the discriminating threshold values between Rs and NRs in the absence of IAH. Some limitations of our study should be noted. Firstly, fluid therapy was performed at a moderate IAP of 12 mmHg, and therefore it remains unclear whether the higher grade of IAP influences the feasibility of PPV and SVV in predicting fluid responsiveness. Secondly, we did not perform hemodynamic measurement and fluid expansion before the IAP was applied. Consequently, the effect of IAP on the discriminating threshold values could not be clarified. Thirdly, the IAH was pre-operatively induced by increasing abdominal volume with carbon dioxide insufflation, which may be different from conditions that occur secondarily to abdominal compression in critically ill patients. Fourthly, the hemodynamic measurement was performed only with the FloTrac system. Future studies may include the use of thermodilution and
echo techniques to further demonstrate the efficacy of hemodynamic indices. Thus, our results cannot be directly extrapolated to critically ill patients. In conclusion, we demonstrate that PPV and SVV are sensitive and specific predictors of fluid responsiveness in patients with IAH. The Trendelenburg position does not alter their abilities to predict fluid responsiveness, although it reduces the discriminating threshold values for PPV and SVV between Rs and NRs of fluid therapy.
References
1. Gan TJ, Soppitt A, Maroof M, el-Moalem H, Robertson KM, Moretti E, Dwane P, Glass PS. Goal-directed intraoperative fluid administration reduces length of hospital stay after major surgery. Anesthesiology. 2002; 97:820-826.
2. Venn R, Steele A, Richardson P, Poloniecki J, Grounds M, Newman P. Randomized controlled trial to investigate influence of the fluid challenge on duration of hospital stay and perioperative morbidity in patients with hip fractures. Br J Anaesth. 2002; 88:65-71.
3. Wakeling HG, McFall MR, Jenkins CS, Woods WG, Miles WF, Barclay GR, Fleming SC. Intraoperative oesophageal Doppler guided fluid management shortens postoperative hospital stay after major bowel surgery. Br J Anaesth. 2005; 95:634-642.
4. Lopes MR, Oliveira MA, Pereira VO, Lemos IP, Auler JO Jr, Michard F. Goal-directed fluid management based on pulse pressure variation monitoring during high-risk surgery: A pilot randomized controlled trial. Crit Care. 2007; 11:R100.
5. Kumar A, Anel R, Bunnell E, Habet K, Zanotti S, Marshall S, Neumann A, Ali A, Cheang M, Kavinsky C, Parrillo JE. Pulmonary artery occlusion pressure and central venous pressure fail to predict ventricular filling volume, cardiac performance, or the response to volume infusion in normal subjects. Crit Care Med. 2004; 32:691-699.
6. Michard F, Teboul JL. Predicting fluid responsiveness in ICU patients: A critical analysis of the evidence. Chest. 2002; 121:2000-2008.
7. Rex S, Brose S, Metzelder S, Hüneke R, Schälte G, Autschbach R, Rossaint R, Buhre W. Prediction of fluid responsiveness in patients during cardiac surgery. Br J Anaesth. 2004; 93:782-788.
8. Berkenstadt H, Margalit N, Hadani M, Friedman Z, Segal E, Villa Y, Perel A. Stroke volume variation as a predictor of fluid responsiveness in patients undergoing brain surgery. Anesth Analg. 2001; 92:984-989.
9. Biais M, Nouette-Gaulain K, Cottenceau V, Revel P, Sztark F. Uncalibrated pulse contour-derived stroke volume variation predicts fluid responsiveness in mechanically ventilated patients undergoing liver transplantation. Br J Anaesth. 2008; 101:761-768.
10. Malbrain ML, Chiumello D, Pelosi P, et al. Prevalence of intra-abdominal hypertension in critically ill patients: A multicentre epidemiological study. Intensive Care Med. 2004; 30:822-829.
11. Vidal MG, Ruiz Weisser J, Gonzalez F, Toro MA, Loudet C, Balasini C, Canales H, Reina R, Estenssoro E. Incidence and clinical effects of intra-abdominal hypertension in critically ill patients. Crit Care Med.
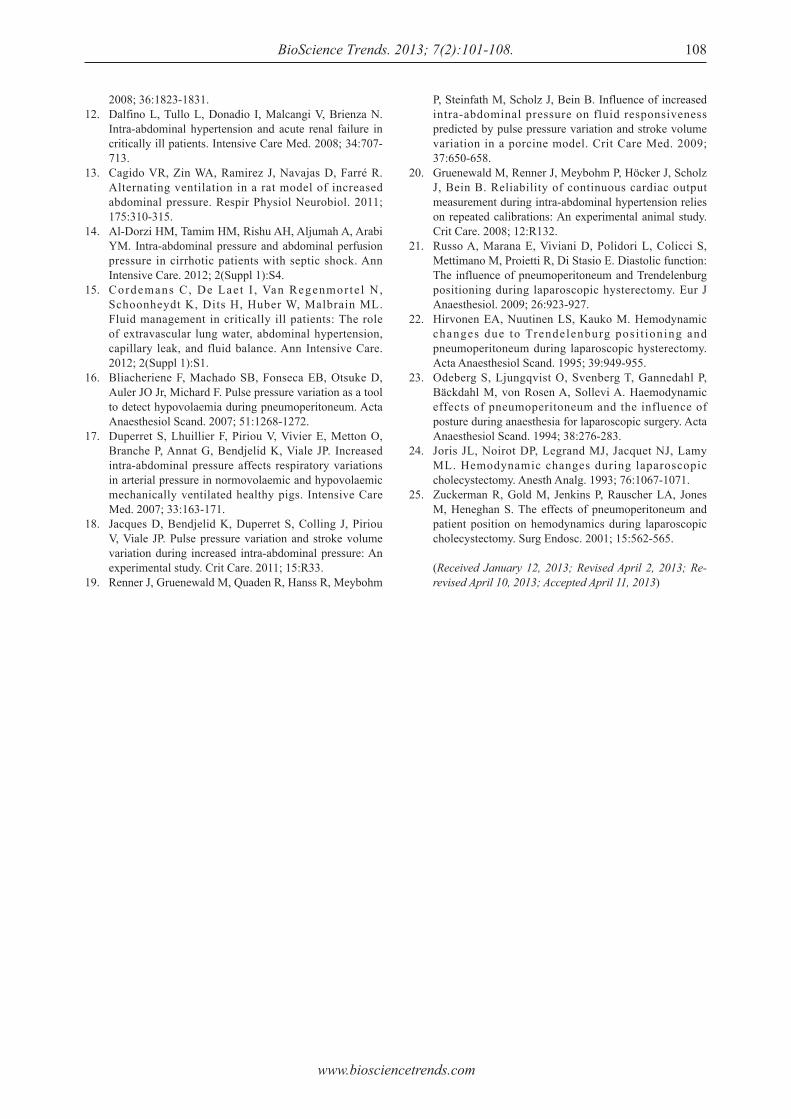
www.biosciencetrends.com
BioScience Trends. 2013; 7(2):101-108. 108
2008; 36:1823-1831.12. Dalfino L, Tullo L, Donadio I, Malcangi V, Brienza N.
Intra-abdominal hypertension and acute renal failure in critically ill patients. Intensive Care Med. 2008; 34:707-713.
13. Cagido VR, Zin WA, Ramirez J, Navajas D, Farré R. Alternating ventilation in a rat model of increased abdominal pressure. Respir Physiol Neurobiol. 2011; 175:310-315.
14. Al-Dorzi HM, Tamim HM, Rishu AH, Aljumah A, Arabi YM. Intra-abdominal pressure and abdominal perfusion pressure in cirrhotic patients with septic shock. Ann Intensive Care. 2012; 2(Suppl 1):S4.
15. Cordemans C, De Laet I , Van Regenmorte l N, Schoonheydt K, Dits H, Huber W, Malbrain ML. Fluid management in critically ill patients: The role of extravascular lung water, abdominal hypertension, capillary leak, and fluid balance. Ann Intensive Care. 2012; 2(Suppl 1):S1.
16. Bliacheriene F, Machado SB, Fonseca EB, Otsuke D, Auler JO Jr, Michard F. Pulse pressure variation as a tool to detect hypovolaemia during pneumoperitoneum. Acta Anaesthesiol Scand. 2007; 51:1268-1272.
17. Duperret S, Lhuillier F, Piriou V, Vivier E, Metton O, Branche P, Annat G, Bendjelid K, Viale JP. Increased intra-abdominal pressure affects respiratory variations in arterial pressure in normovolaemic and hypovolaemic mechanically ventilated healthy pigs. Intensive Care Med. 2007; 33:163-171.
18. Jacques D, Bendjelid K, Duperret S, Colling J, Piriou V, Viale JP. Pulse pressure variation and stroke volume variation during increased intra-abdominal pressure: An experimental study. Crit Care. 2011; 15:R33.
19. Renner J, Gruenewald M, Quaden R, Hanss R, Meybohm
P, Steinfath M, Scholz J, Bein B. Influence of increased intra-abdominal pressure on fluid responsiveness predicted by pulse pressure variation and stroke volume variation in a porcine model. Crit Care Med. 2009; 37:650-658.
20. Gruenewald M, Renner J, Meybohm P, Höcker J, Scholz J, Bein B. Reliability of continuous cardiac output measurement during intra-abdominal hypertension relies on repeated calibrations: An experimental animal study. Crit Care. 2008; 12:R132.
21. Russo A, Marana E, Viviani D, Polidori L, Colicci S, Mettimano M, Proietti R, Di Stasio E. Diastolic function: The influence of pneumoperitoneum and Trendelenburg positioning during laparoscopic hysterectomy. Eur J Anaesthesiol. 2009; 26:923-927.
22. Hirvonen EA, Nuutinen LS, Kauko M. Hemodynamic changes due to Trendelenburg posi t ioning and pneumoperitoneum during laparoscopic hysterectomy. Acta Anaesthesiol Scand. 1995; 39:949-955.
23. Odeberg S, Ljungqvist O, Svenberg T, Gannedahl P, Bäckdahl M, von Rosen A, Sollevi A. Haemodynamic effects of pneumoperitoneum and the influence of posture during anaesthesia for laparoscopic surgery. Acta Anaesthesiol Scand. 1994; 38:276-283.
24. Joris JL, Noirot DP, Legrand MJ, Jacquet NJ, Lamy ML. Hemodynamic changes during laparoscopic cholecystectomy. Anesth Analg. 1993; 76:1067-1071.
25. Zuckerman R, Gold M, Jenkins P, Rauscher LA, Jones M, Heneghan S. The effects of pneumoperitoneum and patient position on hemodynamics during laparoscopic cholecystectomy. Surg Endosc. 2001; 15:562-565.
(Received January 12, 2013; Revised April 2, 2013; Re-revised April 10, 2013; Accepted April 11, 2013)
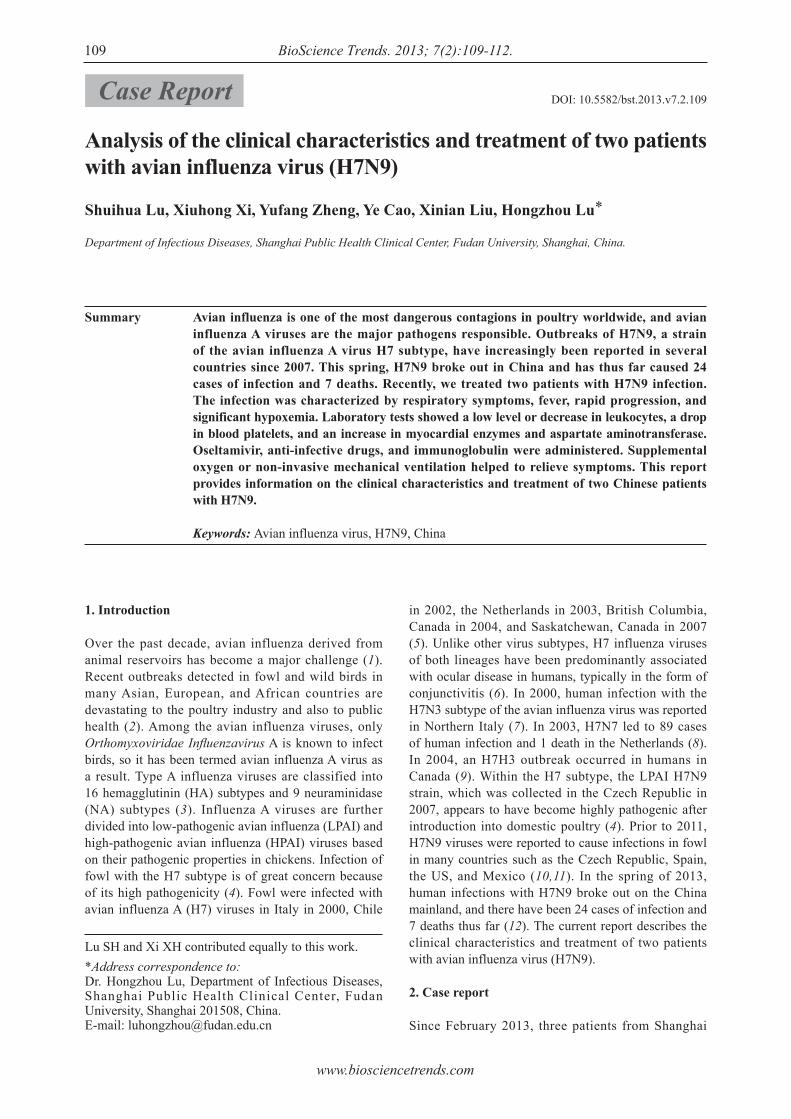
www.biosciencetrends.com
BioScience Trends. 2013; 7(2):109-112.109
Analysis of the clinical characteristics and treatment of two patients with avian influenza virus (H7N9)
Shuihua Lu, Xiuhong Xi, Yufang Zheng, Ye Cao, Xinian Liu, Hongzhou Lu*
Department of Infectious Diseases, Shanghai Public Health Clinical Center, Fudan University, Shanghai, China.
Lu SH and Xi XH contributed equally to this work.*Address correspondence to:Dr. Hongzhou Lu, Department of Infectious Diseases, Shanghai Public Health Clinical Center, Fudan University, Shanghai 201508, China.E-mail: [email protected]
1. Introduction
Over the past decade, avian influenza derived from animal reservoirs has become a major challenge (1). Recent outbreaks detected in fowl and wild birds in many Asian, European, and African countries are devastating to the poultry industry and also to public health (2). Among the avian influenza viruses, only Orthomyxoviridae Influenzavirus A is known to infect birds, so it has been termed avian influenza A virus as a result. Type A influenza viruses are classified into 16 hemagglutinin (HA) subtypes and 9 neuraminidase (NA) subtypes (3). Influenza A viruses are further divided into low-pathogenic avian influenza (LPAI) and high-pathogenic avian influenza (HPAI) viruses based on their pathogenic properties in chickens. Infection of fowl with the H7 subtype is of great concern because of its high pathogenicity (4). Fowl were infected with avian influenza A (H7) viruses in Italy in 2000, Chile
in 2002, the Netherlands in 2003, British Columbia, Canada in 2004, and Saskatchewan, Canada in 2007 (5). Unlike other virus subtypes, H7 influenza viruses of both lineages have been predominantly associated with ocular disease in humans, typically in the form of conjunctivitis (6). In 2000, human infection with the H7N3 subtype of the avian influenza virus was reported in Northern Italy (7). In 2003, H7N7 led to 89 cases of human infection and 1 death in the Netherlands (8). In 2004, an H7H3 outbreak occurred in humans in Canada (9). Within the H7 subtype, the LPAI H7N9 strain, which was collected in the Czech Republic in 2007, appears to have become highly pathogenic after introduction into domestic poultry (4). Prior to 2011, H7N9 viruses were reported to cause infections in fowl in many countries such as the Czech Republic, Spain, the US, and Mexico (10,11). In the spring of 2013, human infections with H7N9 broke out on the China mainland, and there have been 24 cases of infection and 7 deaths thus far (12). The current report describes the clinical characteristics and treatment of two patients with avian influenza virus (H7N9).
2. Case report
Since February 2013, three patients from Shanghai
Summary Avian influenza is one of the most dangerous contagions in poultry worldwide, and avian influenza A viruses are the major pathogens responsible. Outbreaks of H7N9, a strain of the avian influenza A virus H7 subtype, have increasingly been reported in several countries since 2007. This spring, H7N9 broke out in China and has thus far caused 24 cases of infection and 7 deaths. Recently, we treated two patients with H7N9 infection. The infection was characterized by respiratory symptoms, fever, rapid progression, and significant hypoxemia. Laboratory tests showed a low level or decrease in leukocytes, a drop in blood platelets, and an increase in myocardial enzymes and aspartate aminotransferase. Oseltamivir, anti-infective drugs, and immunoglobulin were administered. Supplemental oxygen or non-invasive mechanical ventilation helped to relieve symptoms. This report provides information on the clinical characteristics and treatment of two Chinese patients with H7N9.
Keywords: Avian influenza virus, H7N9, China
DOI: 10.5582/bst.2013.v7.2.109Case Report
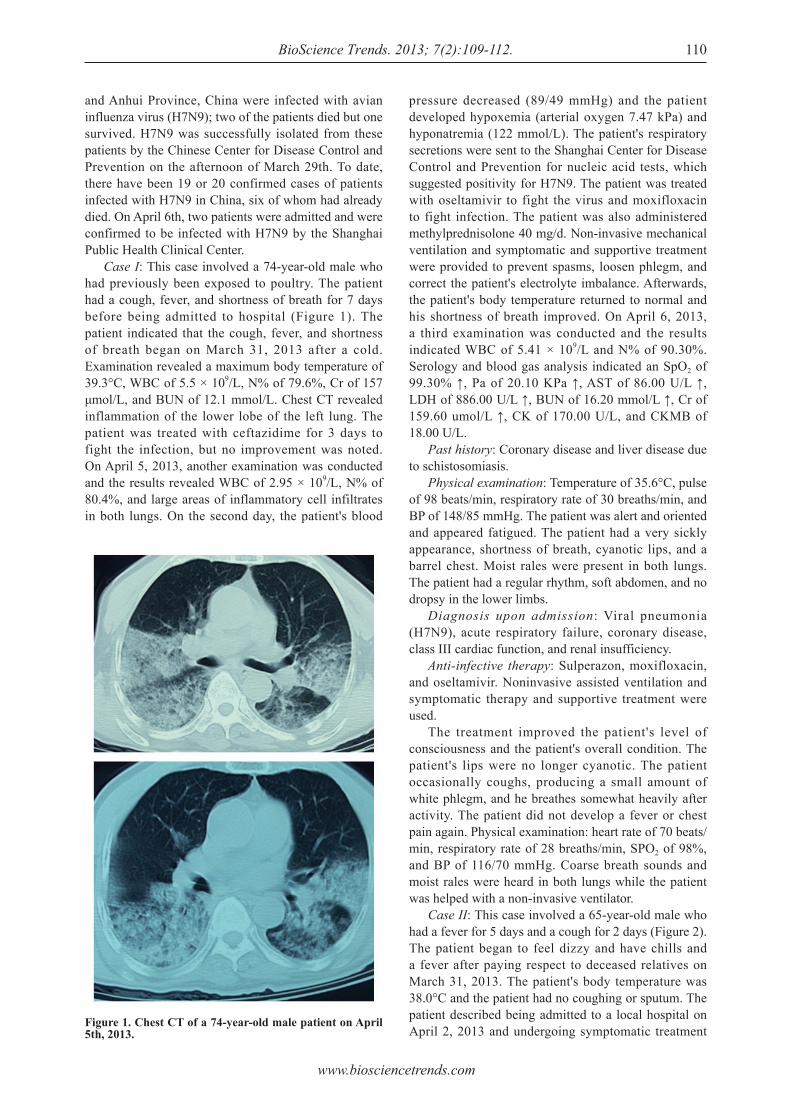
www.biosciencetrends.com
BioScience Trends. 2013; 7(2):109-112.
and Anhui Province, China were infected with avian influenza virus (H7N9); two of the patients died but one survived. H7N9 was successfully isolated from these patients by the Chinese Center for Disease Control and Prevention on the afternoon of March 29th. To date, there have been 19 or 20 confirmed cases of patients infected with H7N9 in China, six of whom had already died. On April 6th, two patients were admitted and were confirmed to be infected with H7N9 by the Shanghai Public Health Clinical Center. Case I: This case involved a 74-year-old male who had previously been exposed to poultry. The patient had a cough, fever, and shortness of breath for 7 days before being admitted to hospital (Figure 1). The patient indicated that the cough, fever, and shortness of breath began on March 31, 2013 after a cold. Examination revealed a maximum body temperature of 39.3°C, WBC of 5.5 × 10⁹/L, N% of 79.6%, Cr of 157 μmol/L, and BUN of 12.1 mmol/L. Chest CT revealed inflammation of the lower lobe of the left lung. The patient was treated with ceftazidime for 3 days to fight the infection, but no improvement was noted. On April 5, 2013, another examination was conducted and the results revealed WBC of 2.95 × 10⁹/L, N% of 80.4%, and large areas of inflammatory cell infiltrates in both lungs. On the second day, the patient's blood
pressure decreased (89/49 mmHg) and the patient developed hypoxemia (arterial oxygen 7.47 kPa) and hyponatremia (122 mmol/L). The patient's respiratory secretions were sent to the Shanghai Center for Disease Control and Prevention for nucleic acid tests, which suggested positivity for H7N9. The patient was treated with oseltamivir to fight the virus and moxifloxacin to fight infection. The patient was also administered methylprednisolone 40 mg/d. Non-invasive mechanical ventilation and symptomatic and supportive treatment were provided to prevent spasms, loosen phlegm, and correct the patient's electrolyte imbalance. Afterwards, the patient's body temperature returned to normal and his shortness of breath improved. On April 6, 2013, a third examination was conducted and the results indicated WBC of 5.41 × 10⁹/L and N% of 90.30%. Serology and blood gas analysis indicated an SpO2 of 99.30% ↑, Pa of 20.10 KPa ↑, AST of 86.00 U/L ↑, LDH of 886.00 U/L ↑, BUN of 16.20 mmol/L ↑, Cr of 159.60 umol/L ↑, CK of 170.00 U/L, and CKMB of 18.00 U/L. Past history: Coronary disease and liver disease due to schistosomiasis. Physical examination: Temperature of 35.6°C, pulse of 98 beats/min, respiratory rate of 30 breaths/min, and BP of 148/85 mmHg. The patient was alert and oriented and appeared fatigued. The patient had a very sickly appearance, shortness of breath, cyanotic lips, and a barrel chest. Moist rales were present in both lungs. The patient had a regular rhythm, soft abdomen, and no dropsy in the lower limbs. Diagnosis upon admission: Viral pneumonia (H7N9), acute respiratory failure, coronary disease, class III cardiac function, and renal insufficiency. Anti-infective therapy: Sulperazon, moxifloxacin, and oseltamivir. Noninvasive assisted ventilation and symptomatic therapy and supportive treatment were used. The treatment improved the patient's level of consciousness and the patient's overall condition. The patient's lips were no longer cyanotic. The patient occasionally coughs, producing a small amount of white phlegm, and he breathes somewhat heavily after activity. The patient did not develop a fever or chest pain again. Physical examination: heart rate of 70 beats/min, respiratory rate of 28 breaths/min, SPO2 of 98%, and BP of 116/70 mmHg. Coarse breath sounds and moist rales were heard in both lungs while the patient was helped with a non-invasive ventilator. Case II: This case involved a 65-year-old male who had a fever for 5 days and a cough for 2 days (Figure 2).The patient began to feel dizzy and have chills and a fever after paying respect to deceased relatives on March 31, 2013. The patient's body temperature was 38.0°C and the patient had no coughing or sputum. The patient described being admitted to a local hospital on April 2, 2013 and undergoing symptomatic treatment
110
Figure 1. Chest CT of a 74-year-old male patient on April 5th, 2013.
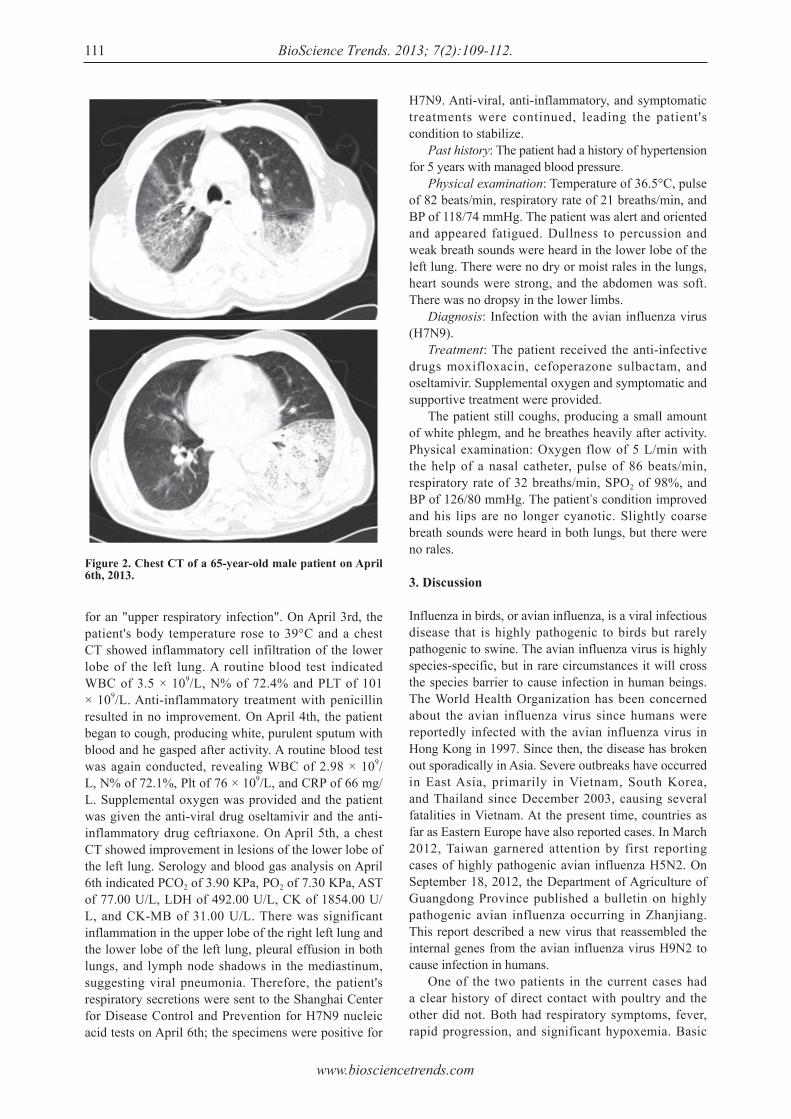
www.biosciencetrends.com
BioScience Trends. 2013; 7(2):109-112.111
H7N9. Anti-viral, anti-inflammatory, and symptomatic treatments were continued, leading the patient's condition to stabilize. Past history: The patient had a history of hypertension for 5 years with managed blood pressure. Physical examination: Temperature of 36.5°C, pulse of 82 beats/min, respiratory rate of 21 breaths/min, and BP of 118/74 mmHg. The patient was alert and oriented and appeared fatigued. Dullness to percussion and weak breath sounds were heard in the lower lobe of the left lung. There were no dry or moist rales in the lungs, heart sounds were strong, and the abdomen was soft. There was no dropsy in the lower limbs. Diagnosis: Infection with the avian influenza virus (H7N9). Treatment: The patient received the anti-infective drugs moxifloxacin, cefoperazone sulbactam, and oseltamivir. Supplemental oxygen and symptomatic and supportive treatment were provided. The patient still coughs, producing a small amount of white phlegm, and he breathes heavily after activity. Physical examination: Oxygen flow of 5 L/min with the help of a nasal catheter, pulse of 86 beats/min, respiratory rate of 32 breaths/min, SPO2 of 98%, and BP of 126/80 mmHg. The patient's condition improved and his lips are no longer cyanotic. Slightly coarse breath sounds were heard in both lungs, but there were no rales.
3. Discussion
Influenza in birds, or avian influenza, is a viral infectious disease that is highly pathogenic to birds but rarely pathogenic to swine. The avian influenza virus is highly species-specific, but in rare circumstances it will cross the species barrier to cause infection in human beings. The World Health Organization has been concerned about the avian influenza virus since humans were reportedly infected with the avian influenza virus in Hong Kong in 1997. Since then, the disease has broken out sporadically in Asia. Severe outbreaks have occurred in East Asia, primarily in Vietnam, South Korea, and Thailand since December 2003, causing several fatalities in Vietnam. At the present time, countries as far as Eastern Europe have also reported cases. In March 2012, Taiwan garnered attention by first reporting cases of highly pathogenic avian influenza H5N2. On September 18, 2012, the Department of Agriculture of Guangdong Province published a bulletin on highly pathogenic avian influenza occurring in Zhanjiang. This report described a new virus that reassembled the internal genes from the avian influenza virus H9N2 to cause infection in humans. One of the two patients in the current cases had a clear history of direct contact with poultry and the other did not. Both had respiratory symptoms, fever, rapid progression, and significant hypoxemia. Basic
for an "upper respiratory infection". On April 3rd, the patient's body temperature rose to 39°C and a chest CT showed inflammatory cell infiltration of the lower lobe of the left lung. A routine blood test indicated WBC of 3.5 × 10⁹/L, N% of 72.4% and PLT of 101 × 109/L. Anti-inflammatory treatment with penicillin resulted in no improvement. On April 4th, the patient began to cough, producing white, purulent sputum with blood and he gasped after activity. A routine blood test was again conducted, revealing WBC of 2.98 × 10⁹/L, N% of 72.1%, Plt of 76 × 109/L, and CRP of 66 mg/L. Supplemental oxygen was provided and the patient was given the anti-viral drug oseltamivir and the anti-inflammatory drug ceftriaxone. On April 5th, a chest CT showed improvement in lesions of the lower lobe of the left lung. Serology and blood gas analysis on April 6th indicated PCO2 of 3.90 KPa, PO2 of 7.30 KPa, AST of 77.00 U/L, LDH of 492.00 U/L, CK of 1854.00 U/L, and CK-MB of 31.00 U/L. There was significant inflammation in the upper lobe of the right left lung and the lower lobe of the left lung, pleural effusion in both lungs, and lymph node shadows in the mediastinum, suggesting viral pneumonia. Therefore, the patient's respiratory secretions were sent to the Shanghai Center for Disease Control and Prevention for H7N9 nucleic acid tests on April 6th; the specimens were positive for
Figure 2. Chest CT of a 65-year-old male patient on April 6th, 2013.
www.biosciencetrends.com
BioScience Trends. 2013; 7(2):109-112. 112
laboratory tests revealed a low level or decrease in leukocytes, a drop in blood platelets, and an increase in myocardial enzymes and aspartate aminotransferase. The patients were confirmed to have H7N9 infection, and oseltamivir, anti-infective drugs, and immunoglobulin were administered for symptomatic and supportive treatment. Supplemental oxygen or non-invasive mechanical ventilation helps to relieve symptoms (13). Thus far, there are no grounds for the use of hormone treatment.
References
1. Capua I, Alexander DJ. Avian influenza: Recent developments. Avian Pathol. 2004; 33:393-404.
2. Cattoli G, Fusaro A, Monne I, Capua I. H5N1 virus evolution in Europe ‒ An updated overview. Viruses. 2009; 1:1351-1363.
3. Fouchier RA, Munster V, Wallensten A, Bestebroer TM, Herfst S, Smith D, Rimmelzwaan GF, Olsen B, Osterhaus AD. Characterization of a novel influenza A virus hemagglutinin subtype (H16) obtained from black-headed gulls. J Virol. 2005; 79:2814-2822.
4. Spackman E. A brief introduction to the avian influenza virus. Methods Mol Biol. 2008; 436:1-6.
5. Belser JA, Davis CT, Balish A, Edwards LE, Zeng H, Maines TR, Gustin KM, Martínez IL, Fasce R, Cox NJ, Katz JM, Tumpey TM. Pathogenesis, transmissibility, and ocular tropism of a highly pathogenic avian influenza A (H7N3) virus associated with human conjunctivitis. J Virol. 2013. DOI: 10.1128/ JVI.00154-13.
6. Belser JA, Bridges CB, Katz JM, Tumpey TM. Past, present, and possible future human infection with influenza virus A subtype H7. Emerg Infect Dis. 2009; 15:859-865.
7. Nicholson KG, Wood JM, Zambon M. Influenza. Lancet. 2003; 362:1733-1745.
8. Koopmans M, Wilbrink B, Conyn M, Natrop G, van der Nat H, Vennema H, Meijer A, van Steenbergen J, Fouchier R, Osterhaus A, Bosman A. Transmission of H7N7 avian influenza A virus to human beings during a large outbreak in commercial poultry farms in the Netherlands. Lancet. 2004; 363:587-593.
9. Krauss S, Pryor SP, Raven G, Danner A, Kayali G, Webby RJ, Webster RG. Respiratory tract versus cloacal sampling of migratory ducks for influenza A viruses: Are both ends relevant. Influenza Other Respi Viruses. 2013; 7:93-96.
10. Nagy A, Cerníková L, Křivda V, Horníčková J. Digital genotyping of avian influenza viruses of H7 subtype detected in central Europe in 2007-2011. Virus Res. 2012; 165:126-133.
11. Pasick J, Pedersen J, Hernandez MS. Avian influenza in North America, 2009-2011. Avian Dis. 2012; 56:845-848.
12. Chinese Center for Disease Control and Prevention. http://www.chinacdc.cn/jkzt/crb/rgrgzbxqlg_5295/rgrqlgyp/201304/t20130408_79589.htm (accessed April 10, 2013).
13. Taubenberger JK, Kash JC. Influenza virus evolution, host adaptation,and pandemic formation. Cell Host Microbe. 2010; 7:440-451.
(Received April 8, 2013; Revised April 11, 2013; Accepted April 12, 2013)
Guide for Authors1. Scope of Articles
BioScience Trends is an international peer-reviewed journal. BioScience Trends devotes to publishing the latest and most exciting advances in scientific research. Articles cover fields of life science such as biochemistry, molecular biology, clinical research, public health, medical care system, and social science in order to encourage cooperation and exchange among scientists and clinical researchers.
2. Submission Types
O r i g i n a l A r t i c l e s s h o u l d b e w e l l -documented, novel, and significant to the field as a whole. An Original Article should be arranged into the following sections: Title page, Abstract, Introduction, Materials and Methods, Results, Discussion, Acknowledgments, and References. Original articles should not exceed 5,000 words in length (excluding references) and should be limited to a maximum of 50 references. Articles may contain a maximum of 10 figures and/or tables.
Brief Reports definitively documenting either experimental results or informative clinical observations will be considered for publication in this category. Brief Reports are not intended for publication of incomplete or preliminary findings. Brief Reports should not exceed 3,000 words in length (excluding references) and should be limited to a maximum of 4 figures and/or tables and 30 references. A Brief Report contains the same sections as an Original Article, but the Results and Discussion sections should be combined.
Reviews should present a full and up-to-date account of recent developments within an area of research. Normally, reviews should not exceed 8,000 words in length (excluding references) and should be limited to a maximum of 100 references. Mini reviews are also accepted.
Policy Forum articles discuss research and policy issues in areas related to life science such as public health, the medical care system, and social science and may address governmental issues at district, national, and international levels of discourse. Policy Forum articles should not exceed 2,000 words in length (excluding references).
Case Reports should be detailed reports of the symptoms, signs, diagnosis, treatment, and follow-up of an individual patient. Case reports may contain a demographic profile of the patient but usually describe an unusual or novel occurrence. Unreported or unusual
side effects or adverse interactions involving medications will also be considered. Case Reports should not exceed 3,000 words in length (excluding references).
News articles should report the latest events in health sciences and medical research from around the world. News should not exceed 500 words in length.
Letters should present considered opinions in response to ar t ic les publ ished in BioScience Trends in the last 6 months or issues of general interest. Letters should not exceed 800 words in length and may contain a maximum of 10 references.
3. Editorial Policies
Ethics: BioScience Trends requires that authors of reports of investigations in humans or animals indicate that those studies were formally approved by a relevant ethics committee or review board.
Conflict of Interest: All authors are required to disclose any actual or potential conflict of interest including financial interests or relationships with other people or organizations that might raise questions of bias in the work reported. If no conflict of interest exists for each author, please state "There is no conflict of interest to disclose".
S u b m i s s i o n D e c l a r a t i o n : W h e n a manuscript is considered for submission to BioScience Trends, the authors should confirm that 1) no part of this manuscript is currently under consideration for publication elsewhere; 2) this manuscript does not contain the same information in whole or in part as manuscripts that have been published, accepted, or are under review elsewhere, except in the form of an abstract, a letter to the editor, or part of a published lecture or academic thesis; 3) authorization for publication has been obtained from the authors’ employer or institution; and 4) all contributing authors have agreed to submit this manuscript.
Cover Letter: The manuscript must be accompanied by a cover letter signed by the corresponding author on behalf of all authors. The letter should indicate the basic findings of the work and their significance. The letter should also include a statement affirming that all authors concur with the submission and that the material submitted for publication has not been published previously or is not under consideration for publication elsewhere. The cover letter should be submitted in PDF format. For example of Cover Letter, please visit http://www.biosciencetrends.com/downcentre.php (Download Centre).
C o p y r i g h t : A s i g n e d J O U R N A L PUBLISHING AGREEMENT ( JPA) form must be provided by post, fax, or as a scanned file before acceptance of the article. Only forms with a hand-written signature are accepted. This copyright will ensure the widest possible dissemination of information. A form facilitating transfer of copyright can be downloaded by clicking the
appropriate link and can be returned to the e-mail address or fax number noted on the form (Please visit Download Centre). Please note that your manuscript will not proceed to the next step in publication until the JPA Form is received. In addition, if excerpts from other copyrighted works are included, the author(s) must obtain written permission from the copyright owners and credit the source(s) in the article.
Suggested Reviewers: A list of up to 3 reviewers who are qualified to assess the scientific merit of the study is welcomed. Reviewer information including names, affiliations, addresses, and e-mail should be provided at the same time the manuscript is submitted online. Please do not suggest reviewers with known conflicts of interest, including participants or anyone with a stake in the proposed research; anyone from the same institution; former students, advisors, or research collaborators (within the last three years); or close personal contacts. Please note that the Editor-in-Chief may accept one or more of the proposed reviewers or may request a review by other qualified persons.
Language Editing: Manuscripts prepared by authors whose native language is not English should have their work proofread by a native English speaker before submission. If not, this might delay the publication of your manuscript in BioScience Trends. The Editing Support Organization can provide English proofreading, Japanese-English translation, and Chinese-English translation services to authors who want to publish in BioScience Trends and need assistance before submitting a manuscript. Authors can visit this organization directly at http://www.iacmhr.com/iac-eso/support.php?lang=en. IAC-ESO was established to facilitate manuscript preparation by researchers whose native language is not English and to help edit works intended for international academic journals.
4. Manuscript Preparation
Manuscripts should be written in clear, grammatically correct English and submitted as a Microsoft Word file in a single-column format. Manuscripts must be paginated and typed in 12-point Times New Roman font with 24-point line spacing. Please do not embed figures in the text. Abbreviations should be used as little as possible and should be explained at first mention unless the term is a well-known abbreviation (e.g. DNA). Single words should not be abbreviated.
Title Page: The title page must include 1) the title of the paper (Please note the title should be short, informative, and contain the major key words); 2) full name(s) and affiliation(s) of the author(s), 3) abbreviated names of the author(s), 4) full name, mailing address, telephone/fax numbers, and e-mail address of the corresponding author; and 5) conflicts of interest (if you have an actual or potential conflict of interest to disclose, it must be included as a footnote on the title page of the manuscript; if no conflict of

interest exists for each author, please state "There is no conflict of interest to disclose"). Please visit Download Centre and refer to the title page of the manuscript sample.
Abstract: The abstract should briefly state the purpose of the study, methods, main findings, and conclusions. For article types including Original Article, Brief Report, Review, Policy Forum, and Case Report, a one-paragraph abstract consisting of no more than 250 words must be included in the manuscript. For News and Letters, a brief summary of main content in 150 words or fewer should be included in the manuscript. Abbreviations must be kept to a minimum and non-standard abbreviations explained in brackets at first mention. References should be avoided in the abstract. Key words or phrases that do not occur in the title should be included in the Abstract page.
Introduction: The introduction should be a concise statement of the basis for the study and its scientific context.
Materials and Methods: The description should be brief but with sufficient detail to enable others to reproduce the experiments. Procedures that have been published previously should not be described in detail but appropriate references should simply be cited. Only new and significant modifications of previously published procedures require complete description. Names of products and manufacturers with their locations (city and state/country) should be given and sources of animals and cell lines should always be indicated. All clinical investigations must have been conducted in accordance with Declaration of Helsinki principles. All human and animal studies must have been approved by the appropriate institutional review board(s) and a specific declaration of approval must be made within this section.
Results: The description of the experimental results should be succinct but in sufficient detail to allow the experiments to be analyzed and interpreted by an independent reader. If necessary, subheadings may be used for an orderly presentation. All figures and tables must be referred to in the text.
Discussion: The data should be interpreted concisely without repeating material already presented in the Results section. Speculation is permissible, but it must be well-founded, and discussion of the wider implications of the findings is encouraged. Conclusions derived from the study should be included in this section.
Acknowledgments: All funding sources should be credited in the Acknowledgments section. In addition, people who contributed to the work but who do not meet the criteria for authors should be listed along with their contributions.
References: References should be numbered in the order in which they appear in the text. Citing of unpublished results, personal communications, conference abstracts, and theses in the reference list is not recommended but these sources may be mentioned in the text. In the reference list,
cite the names of all authors when there are fifteen or fewer authors; if there are sixteen or more authors, list the first three followed by et al. Names of journals should be abbreviated in the style used in PubMed. Authors are responsible for the accuracy of the references. Examples are given below:
Example 1 (Sample journal reference): Inagaki Y, Tang W, Zhang L, Du GH, Xu WF, Kokudo N. Novel aminopeptidase N (APN/CD13) inhibitor 24F can suppress invasion of hepatocellular carcinoma cells as well as angiogenesis. Biosci Trends. 2010; 4:56-60.
Example 2 (Sample journal reference with more than 15 authors): Darby S, Hill D, Auvinen A, et al. Radon in homes and risk of lung cancer: Collaborative analysis of individual data from 13 European case-control studies. BMJ. 2005; 330:223.
Example 3 (Sample book reference): Shalev AY. Post-traumatic stress disorder: diagnosis, history and life course. In: Post-traumatic Stress Disorder, Diagnosis, Management and Treatment (Nutt DJ, Davidson JR, Zohar J, eds.). Martin Dunitz, London, UK, 2000; pp. 1-15.
Example 4 (Sample web page reference): Ministry of Health, Labour and Welfare of Japan . Die ta ry re fe rence in takes for Japanese. http://www.mhlw.go.jp/houdou/2004/11/h1122-2a.html (accessed June 14, 2010).
Tables: All tables should be prepared in Microsoft Word or Excel and should be arranged at the end of the manuscript after the References section. Please note that tables should not in image format. All tables should have a concise title and should be numbered consecutively with Arabic numerals. If necessary, additional information should be given below the table.
Figure Legend: The figure legend should be typed on a separate page of the main manuscript and should include a short title and explanation. The legend should be concise but comprehensive and should be understood without referring to the text. Symbols used in figures must be explained.
Figure Preparation: All figures should be clear and cited in numerical order in the text. Figures must fit a one- or two-column format on the journal page: 8.3 cm (3.3 in.) wide for a single column, 17.3 cm (6.8 in.) wide for a double column; maximum height: 24.0 cm (9.5 in.). Please make sure that the symbols and numbers appeared in the figures should be clear. Please make sure that artwork files are in an acceptable format (TIFF or JPEG) at minimum resolution (600 dpi for illustrations, graphs, and annotated artwork, and 300 dpi for micrographs and photographs). Please provide all figures as separate files. Please note that low-resolution images are one of the leading causes of article resubmission and schedule delays. All color figures will be reproduced in full color in the online edition of the journal at no cost to authors.
Units and Symbols: Units and symbols
conforming to the International System o f U n i t s ( S I ) s h o u l d b e u s e d f o r physicochemical quantities. Solidus notation (e.g. mg/kg, mg/mL, mol/mm2/min) should be used. Please refer to the SI Guide www.bipm.org/en/si/ for standard units.
Supplemental data: Supplemental data might be useful for supporting and enhancing your scientific research and BioScience Trends accepts the submission of these materials which will be only published online alongside the electronic version of your article. Supplemental files (figures, tables, and other text materials) should be prepared according to the above guidelines, numbered in Arabic numerals (e.g., Figure S1, Figure S2, and Table S1, Table S2) and referred to in the text. All figures and tables should have titles and legends. All figure legends, tables and supplemental text materials should be placed at the end of the paper. Please note all of these supplemental data should be provided at the time of initial submission and note that the editors reserve the right to limit the size and length of Supplemental Data.
5. Submission Checklist
The Submission Checklist will be useful during the final checking of a manuscript prior to sending it to BioScience Trends for review. Please visit Download Centre and download the Submission Checklist fi le.
6. Online Submission
Manuscr ipts should be submit ted to BioScience Trends online at http://www.biosciencetrends.com. The manuscript file should be smaller than 5 MB in size. If for any reason you are unable to submit a file online, please contact the Editorial Offi ce by e-mail at offi [email protected].
7. Accepted Manuscripts
Proofs: Galley proofs in PDF format will be sent to the corresponding author via e-mail. Corrections must be returned to the editor ([email protected]) within 3 working days.
Offprints: Authors will be provided with electronic offprints of their article. Paper offprints can be ordered at prices quoted on the order form that accompanies the proofs.
Page Charge: Page charges will be levied on all manuscripts accepted for publication in BioScience Trends ($140 per page for black white pages; $340 per page for color pages). Under exceptional circumstances, the author(s) may apply to the editorial office for a waiver of the publication charges at the time of submission. (Revised February 2013)
Editorial and Head Offi ce: Pearl City Koishikawa 6032-4-5 Kasuga, Bunkyo-kuTokyo 112-0003 JapanTel: +81-3-5840-8764Fax: +81-3-5840-8765E-mail: offi [email protected]
JOURNAL PUBLISHING AGREEMENT (JPA)-----------------------------------------------------------------------------------------------------------------------------------------Manuscript No.:
Title:
Corresponding Author:----------------------------------------------------------------------------------------------------------------------------------------The International Advancement Center for Medicine & Health Research Co., Ltd. (IACMHR Co., Ltd.) is pleased to accept the above article for publication in BioScience Trends. The International Research and Cooperation Association for Bio & Socio-Sciences Advancement (IRCA-BSSA) reserves all rights to the published article. Your written acceptance of this JOURNAL PUBLISHING AGREEMENT is required before the article can be published. Please read this form carefully and sign it if you agree to its terms. The signed JOURNAL PUBLISHING AGREEMENT should be sent to the BioScience Trends office (Pearl City Koishikawa 603, 2-4-5 Kasuga, Bunkyo-ku, Tokyo 112-0003, Japan; E-mail: [email protected]; Tel: +81-3-5840-8764; Fax: +81-3-5840-8765).
1. Authorship CriteriaAs the corresponding author, I certify on behalf of all of the authors that:1) The article is an original work and does not involve fraud, fabrication, or plagiarism.2) The article has not been published previously and is not currently under consideration for publication elsewhere. If accepted by BioScience Trends, the article will not be submitted for publication to any other journal.3) The article contains no libelous or other unlawful statements and does not contain any materials that infringes upon individual privacy or proprietary rights or any statutory copyright.4) I have obtained written permission from copyright owners for any excerpts from copyrighted works that are included and have credited the sources in my article.5) All authors have made significant contributions to the study including the conception and design of this work, the analysis of the data, and the writing of the manuscript.6) All authors have reviewed this manuscript and take responsibility for its content and approve its publication. 7) I have informed all of the authors of the terms of this publishing agreement and I am signing on their behalf as their agent.
2. Copyright Transfer AgreementI hereby assign and transfer to IACMHR Co., Ltd. all exclusive rights of copyright ownership to the above work in the journal BioScience Trends, including but not limited to the right 1) to publish, republish, derivate, distribute, transmit, sell, and otherwise use the work and other related material worldwide, in whole or in part, in all languages, in electronic, printed, or any other forms of media now known or hereafter developed and the right 2) to authorize or license third parties to do any of the above. I understand that these exclusive rights will become the property of IACMHR Co., Ltd., from the date the article is accepted for publication in the journal BioScience Trends. I also understand that IACMHR Co., Ltd. as a copyright owner has sole authority to license and permit reproductions of the article. I understand that except for copyright, other proprietary rights related to the Work (e.g. patent or other rights to any process or procedure) shall be retained by the authors. To reproduce any text, figures, tables, or illustrations from this Work in future works of their own, the authors must obtain written permission from IACMHR Co., Ltd.; such permission cannot be unreasonably withheld by IACMHR Co., Ltd.
3. Conflict of Interest DisclosureI confirm that all funding sources supporting the work and all institutions or people who contributed to the work but who do not meet the criteria for authors are acknowledged. I also confirm that all commercial affiliations, stock ownership, equity interests, or patent-licensing arrangements that could be considered to pose a financial conflict of interest in connection with the article have been disclosed.---------------------------------------------------------------------------------------------------------------------------------------------------------
Corresponding Author's Name (Signature):
Date:
BioScience Trends (www.biosciencetrends.com)Pearl City Koishikawa 603, 2-4-5 Kasuga, Bunkyo-ku, Tokyo 112-0003, Japan; E-mail: offi ce@biosciencetrends; Tel: +81-3-5840-8764; Fax: +81-3-5840-8765