Embed Size (px)
Citation preview

BSM Design Models:PN vs Stellenbosch ME function
Reconciliation?
Fenella JohnsRubicon Solutions

Introduction
History of BSM structural design
Pavement Number• 2009 & 2019
Mechanistic-Empirical • New Stellenbosch function
Design Equivalent Material Classification• DEMAC

History of BSM Structural DesignSABITA Manuals (~1990s)• GEMS• ETBs
TG2 2002 (Asphalt Academy)• Foam Bitumen• ME Design Functions• Conservative, developed on limited data

History of BSM Structural DesignTG2 (2009)• Both foam bitumen and bitumen
emulsion• Introduction of BSM term• Still not enough data for ME
design model• Wanted to use field performance• Pavement Number and DEMAC
born• PN used routinely now
TG2 (2019)

Pavement Number• Based on the Structural Number Concept
(Old AASHTO method)• Improved by incorporating established
design principles• Local experience• Calibrated for long term field performance

PN 2009 - Data
Data Sets
• 20 field sites
• 7 HVS Sites (22 test sections)
• Construction, maintenance & performance information
• TRH4 Catalogues
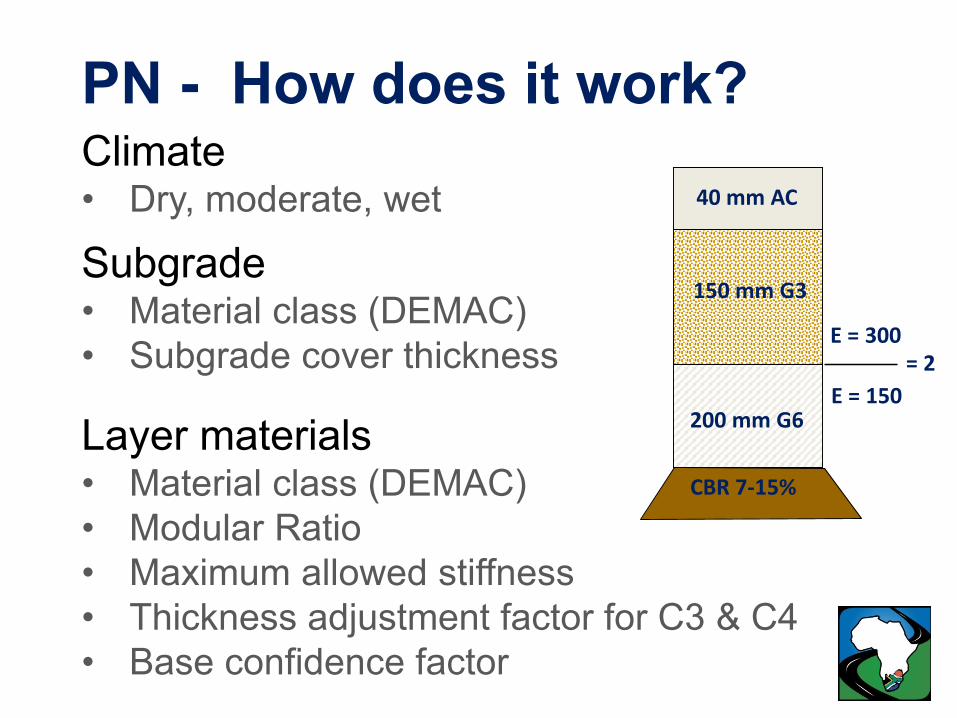
PN - How does it work?Climate• Dry, moderate, wet
Subgrade• Material class (DEMAC)• Subgrade cover thickness
Layer materials• Material class (DEMAC)• Modular Ratio• Maximum allowed stiffness• Thickness adjustment factor for C3 & C4• Base confidence factor
CBR 7-15%
150 mm G3
200 mm G6
40 mm AC
E = 300
E = 150= 2

119 MPa
6. Calculate Layer ELTS Values
119 MPa
4. Adjust for cover
Example, Moderate Region1. Material Classes
2. Determine subgrade stiffness
3. Adjust for climate
CBR 7-15%
180 mm G6
200 mm C4
150 mm BSM2
G7
5. Assign modular ratio’s and max stiffness
MR = 1.8, EMax = 180
MR = 3, EMax = 400
MR = 2, EMax = 450
MR = 2, EMax = 800
7. Layer PN = thickness * ELTS * BCF * TA
8. PN = Σ layer PN
6. ELTS = min (Esupport * MR , Emax)
ELTS = min(214,180)ELTS = 180
ELTS = 400Thickness Adj = 0.4
ELTS = 450BCF = 0.7
ELTS = 800
180 mm G6
200 mm C4
150 mm BSM2
Seal

PN 2009 – Design Frontier• Considers climate
0
5
10
15
20
25
30
35
0 10 20 30 40 50Pavement Number
Min
imum
Str
uctu
ral C
apac
ity
(MES
A)
Category ACategory B
Not a transfer function
Rather, design frontier

PN 2009 - IssuesOver contribution of asphalt
Under contribution of cemented materials
Asphalt layers• Limited to < 50 mm
No asphalt bases
Increase in PN, no increase in life
Limited to 30 MESA

PN 2019 – Data 69 LTPP Sections
TRH 4 Catalogues
SATCC Catalogues

PN 2009 - IssuesOver contribution of asphalt
Under contribution of cemented materials
Asphalt layers• Limited to < 50 mm
No asphalt bases
Increase in PN, no increase in life
Limited to 30 MESA
40
20 – 200 mm
20 – 100 mm
2019
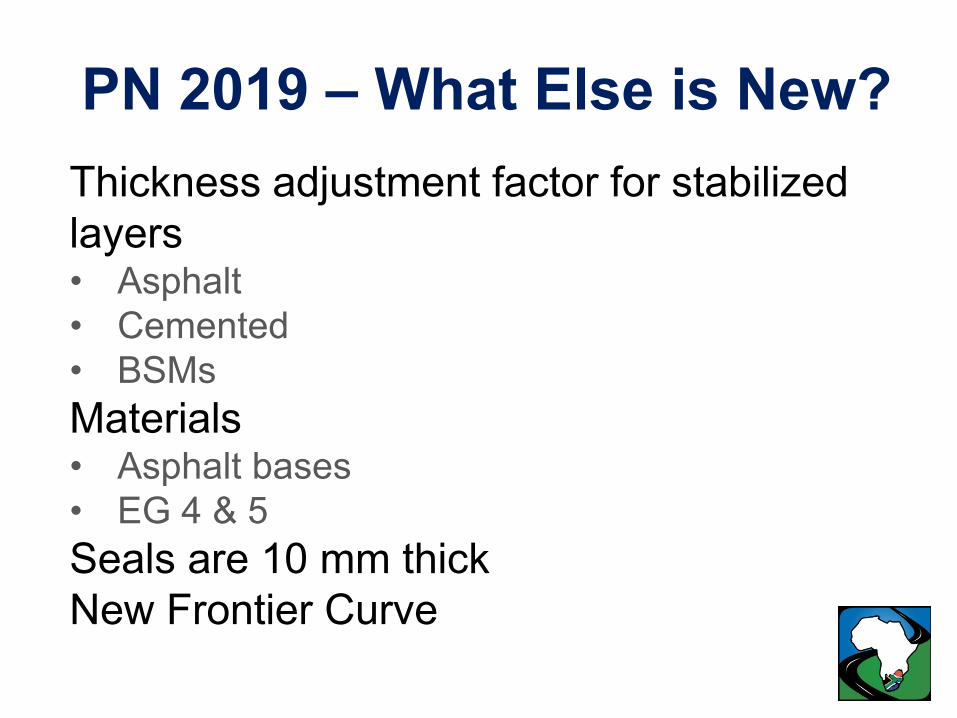
PN 2019 – What Else is New?Thickness adjustment factor for stabilized layers• Asphalt• Cemented• BSMsMaterials• Asphalt bases• EG 4 & 5Seals are 10 mm thickNew Frontier Curve

PN 2019 – Frontier CurveNew Frontier Curve
0
10
20
30
40
50
0 10 20 30 40 50
Min
imum
Allo
wed
Tra
ffic
Cap
acity
(MES
A)
Pavement Number
Category A
Category B
• Increase in PN, increase in life• Maximum 40 MESA

PN 2019 – Calibration
0
10
20
30
40
50
0 10 20 30 40 50
Pave
men
t Cap
acity
(Exp
ecte
d Va
lues
), M
ESA
Pavement Number

MECHANISTIC EMPIRICAL DESIGN
𝑙𝑙𝑙𝑙𝑙𝑙𝑁𝑁 = 𝐴𝐴 − 𝐵𝐵.𝐷𝐷𝐷𝐷𝐷𝐷3 + 𝐶𝐶.𝑃𝑃𝑃𝑃𝑙𝑙𝑃𝑃.𝐷𝐷𝑅𝑅𝑅𝑅𝐶𝐶 + 0.86753
Pmod = % Mod.AASHTO Plastic Strain % (a/b)
Retained CohesionDeviator Stress Ratio
a b
Biermann, Stellenbosch University
Built-in
Reliability A Rut Limit (mm) 95% 0.8436 10 90% 0.9312 15 80% 1.0198 20 50% 1.1369 25
Mechanistic-Empirical Design Function

MECHANISTIC EMPIRICAL DESIGN - BSM2 DEFAULTS
A A B A A BB B B+ B B+
Class Percent of Reclaimed
Asphalt
ITS (kPa) Triaxial
ITSDRY ITSWET Cohesion (kPa) Friction Angle (°)
Retained Cohesion (%)
BSM 1 < 50% 225 125 250 – 300 (250) 40 – 50 (40) 70-85 (75) 50 – 100% 225 125 265 – 350 (265) 38 – 45 (38) 75-90 (75)
BSM 2 < 50% 175 100 200 – 250 (225) 38 – 40 (39) 65-75 (70) 50 – 100% 175 100 225 – 250 (238) 35 – 40 (37) 70-85 (75)
ME – Recommended Inputs

MECHANISTIC EMPIRICAL DESIGN - PAVEMENT 5
0
5
10
15
20
25
Desig
n Li
fe (M
ESAs
)
Moderate Climate & Category (on bar)
PN (old) PN (new) PN (new) Stell (single) Stell (sub) Stell (sub)
A A B A A B
35mm HMA
250mm BSM1
250mm G5
180mm G7
Infinite G8
3500 MPa
720 MPa
240 MPa
120 MPa
90 MPa Note: Single layer & Sub-layer Analysis at ¼ depth
Comparison of Results

MECHANISTIC EMPIRICAL DESIGN - PAVEMENT 8
Note: 1. Single layer & Sub-layer Analysis at ¼ depth2. B+ uses default stiffness for BSM2 (not min)
Using only Min for C, φ and Ret.C is over-conservative
A A B A A B
20mm HMA
280mm BSM2
250mm G6
150mm G8
Infinite G8
2500 MPa
500 MPa
200 MPa
100 MPa
90 MPa
0
0.5
1
1.5
2
2.5
3
3.5
4
4.5
1
Desig
n Li
fe (M
ESAs
)
Moderate Climate & Category (on bar)
PN (old) PN (new) PN (new) Stell (single) Stell (single) Stell (sub)
B B B+ B B B+
Comparison of Results

DEMAC SYSTEM
Cert
aint
y pe
r Cla
ss
Cert
aint
y Fa
ctor
s (CF
)
Adju
st fo
r sam
ple
size
DCP
Visuals
Test Pits
FWD
Materials/ Pavement Tests
Cumulative Certainty
10th% Median 90th%
G7 with Certainty of 0.7
DEMACDesign Equivalent Material Classification System

FOCUS OF SYSTEM REVISION
• Update with latest performance studies and with industry standards
• Validation of Certainty Factors
DEMAC System Update

FOCUS OF SYSTEM REVISION
• Updated and new Material Classification Rules
Cemented materials – Broader spectrum of parameters– Refined DE-EG Class
• Recommended design application
Crushed stone (COTO DS, 2019) – Refined gradings– Additional indicators
DEMAC System Update
Final Certainty Recommended Application
< 0.3 Inadequate
0.3 to 0.5 Category D Roads
0.5 to 0.6 Category C Roads
0.6 to 0.7 Category B Roads
> 0.7 Category A Roads
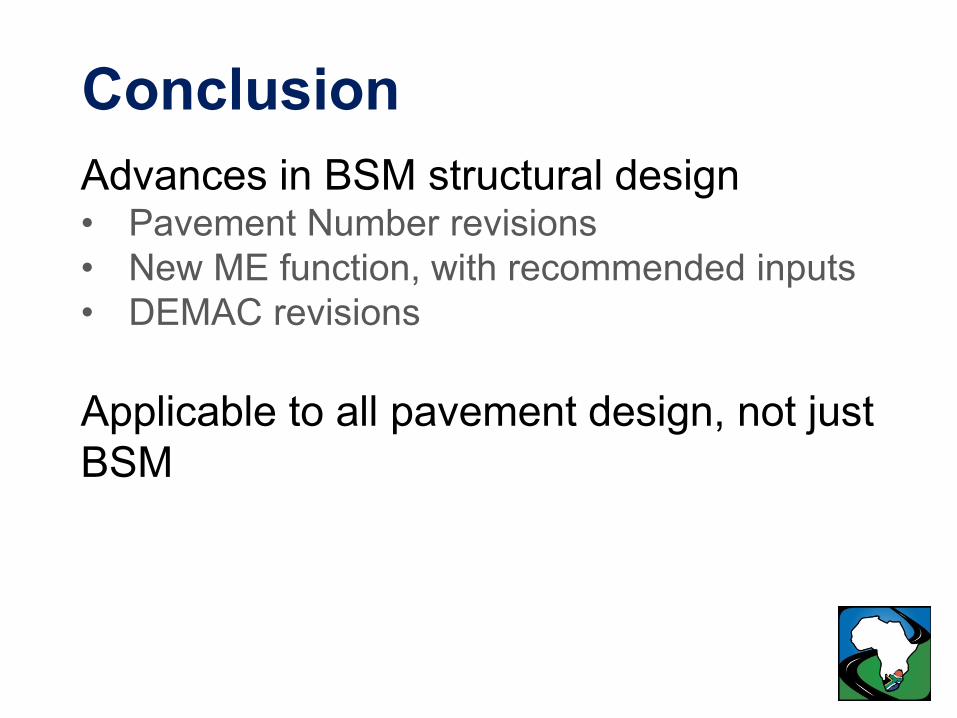
ConclusionAdvances in BSM structural design• Pavement Number revisions• New ME function, with recommended inputs• DEMAC revisions
Applicable to all pavement design, not just BSM