Embed Size (px)
Citation preview
U.O.No. 3990/2016/Admn Dated, Calicut University.P.O, 05.04.2016
Anuja Balakrishnan
Deputy Registrar
Forwarded / By Order
Section Officer
File Ref.No.24326/GA - IV - J2/2013/CU
UNIVERSITY OF CALICUT
Abstract
BSc Programme in Statistics -CUCBCSS UG 2014-Scheme and Syllabus-Implemented w.e.f 2014
Admissions-Corrigendum issued.
G & A - IV - J
Read:-U.O.No. 6916/2014/Admn Dated, Calicut University.P.O, 17.07.2014
ORDER
The following Corrigenda are issued to the University Order read above.
CORRIGENDUM
(a) The Pattern of distribution of Marks/ Credits restructured.
(b) The Model Questionpapers for semester III and semester IV for both core and complementary
courses in Statistics added to the syllabus.
The U.O. read above stands modified to this extent.
(The corrected syllabus is attached to this U.O)
To
1. All Affiliated Colleges/SDE/Dept.s/Institutions under University of Calicut.
2. The Controller of Examinations, University of Calicut.
3. The Director SDE, University of Calicut

APPROVED SYLLABUS
SYLLABUS FOR B.Sc. STATISTICSSEMESTER SYSTEM (APPROVED)CCSS 2014 (2014 ONWARDS)
1. CORE COURSES2. ELECTIVE COURSES3. OPEN COURSES4. COMPLEMENTARY COURSES
Credit Distribution for Core and Complementary StatisticsSemester Core
CourseComplementary Course Open
CourseProject Elective Total
Mathematics OptionalI 4 3 3 10II 4 3 3 10III 4 3 3 10IV 4 3 3 10V 18 2 20VI 18 2 2 22
52 12 12 2 2 2 82
Credit Distribution for languagesSemester
Common CourseEnglish Additio
nal Language
I 4+3 4II 4+3 4III 4 4IV 4 4V VI 22 16
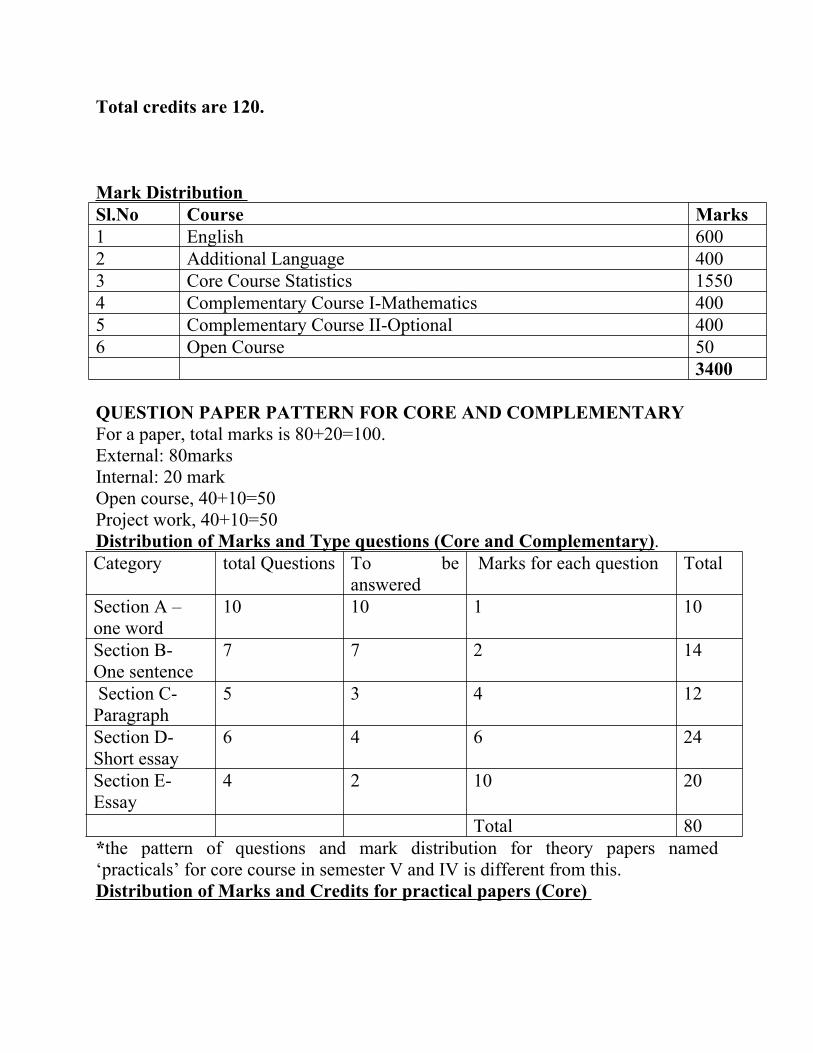
Total credits are 120.
Mark Distribution Sl.No Course Marks1 English 6002 Additional Language 4003 Core Course Statistics 15504 Complementary Course IMathematics 4005 Complementary Course IIOptional 4006 Open Course 50
3400
QUESTION PAPER PATTERN FOR CORE AND COMPLEMENTARYFor a paper, total marks is 80+20=100.External: 80marks Internal: 20 markOpen course, 40+10=50Project work, 40+10=50 Distribution of Marks and Type questions (Core and Complementary). Category total Questions To be
answered Marks for each question Total
Section A –one word
10 10 1 10
Section B One sentence
7 7 2 14
Section C Paragraph
5 3 4 12
Section DShort essay
6 4 6 24
Section EEssay
4 2 10 20
Total 80*the pattern of questions and mark distribution for theory papers named ‘practicals’ for core course in semester V and IV is different from this.Distribution of Marks and Credits for practical papers (Core)
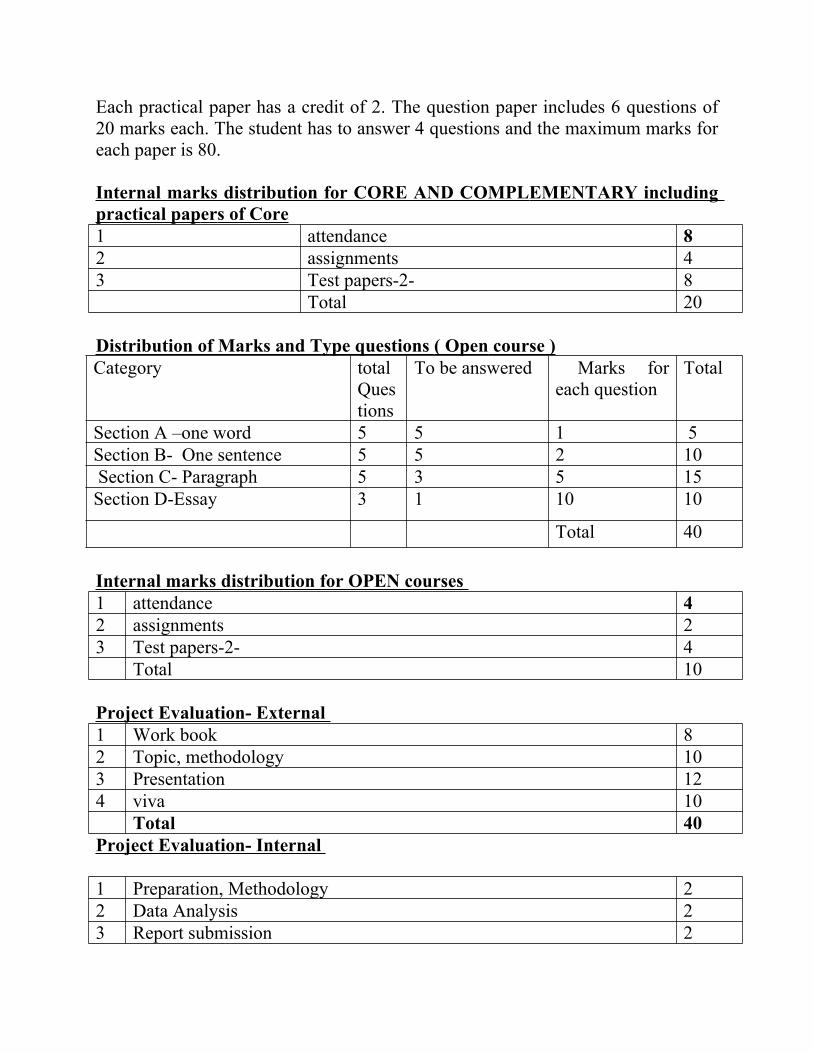
Each practical paper has a credit of 2. The question paper includes 6 questions of 20 marks each. The student has to answer 4 questions and the maximum marks for each paper is 80.
Internal marks distribution for CORE AND COMPLEMENTARY including practical papers of Core1 attendance 82 assignments 43 Test papers2 8
Total 20
Distribution of Marks and Type questions ( Open course )Category total
Questions
To be answered Marks for each question
Total
Section A –one word 5 5 1 5Section B One sentence 5 5 2 10 Section C Paragraph 5 3 5 15Section DEssay 3 1 10 10
Total 40
Internal marks distribution for OPEN courses 1 attendance 42 assignments 23 Test papers2 4
Total 10
Project Evaluation External 1 Work book 82 Topic, methodology 103 Presentation 124 viva 10
Total 40Project Evaluation Internal
1 Preparation, Methodology 22 Data Analysis 23 Report submission 2
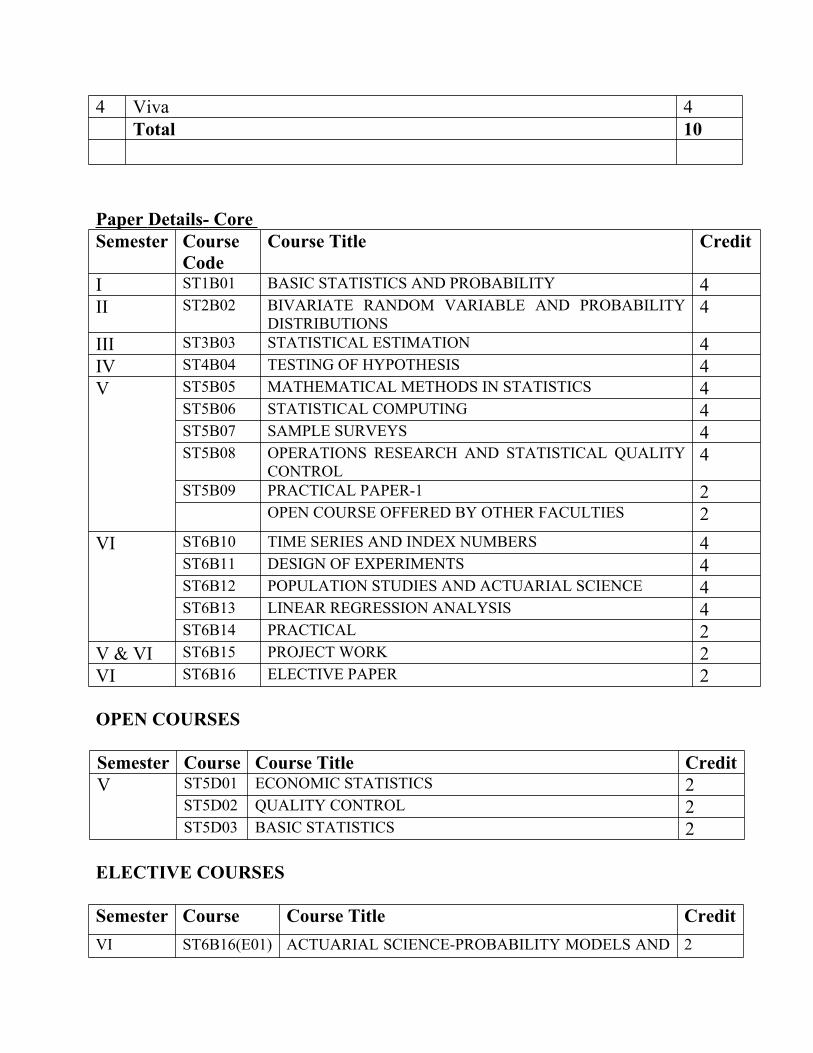
4 Viva 4Total 10
Paper Details Core Semester Course
CodeCourse Title Credit
I ST1B01 BASIC STATISTICS AND PROBABILITY 4II ST2B02 BIVARIATE RANDOM VARIABLE AND PROBABILITY
DISTRIBUTIONS4
III ST3B03 STATISTICAL ESTIMATION 4IV ST4B04 TESTING OF HYPOTHESIS 4V ST5B05 MATHEMATICAL METHODS IN STATISTICS 4
ST5B06 STATISTICAL COMPUTING 4ST5B07 SAMPLE SURVEYS 4ST5B08 OPERATIONS RESEARCH AND STATISTICAL QUALITY
CONTROL4
ST5B09 PRACTICAL PAPER1 2OPEN COURSE OFFERED BY OTHER FACULTIES 2
VI ST6B10 TIME SERIES AND INDEX NUMBERS 4ST6B11 DESIGN OF EXPERIMENTS 4ST6B12 POPULATION STUDIES AND ACTUARIAL SCIENCE 4ST6B13 LINEAR REGRESSION ANALYSIS 4ST6B14 PRACTICAL 2
V & VI ST6B15 PROJECT WORK 2VI ST6B16 ELECTIVE PAPER 2
OPEN COURSES
Semester Course Course Title CreditV ST5D01 ECONOMIC STATISTICS 2
ST5D02 QUALITY CONTROL 2ST5D03 BASIC STATISTICS 2
ELECTIVE COURSES
Semester Course Course Title CreditVI ST6B16(E01) ACTUARIAL SCIENCEPROBABILITY MODELS AND 2
RISK THEORYST6B16(E02) STOCHASTIC MODELLING 2
ST6B16(E03) RELIABILITY THEORY 2
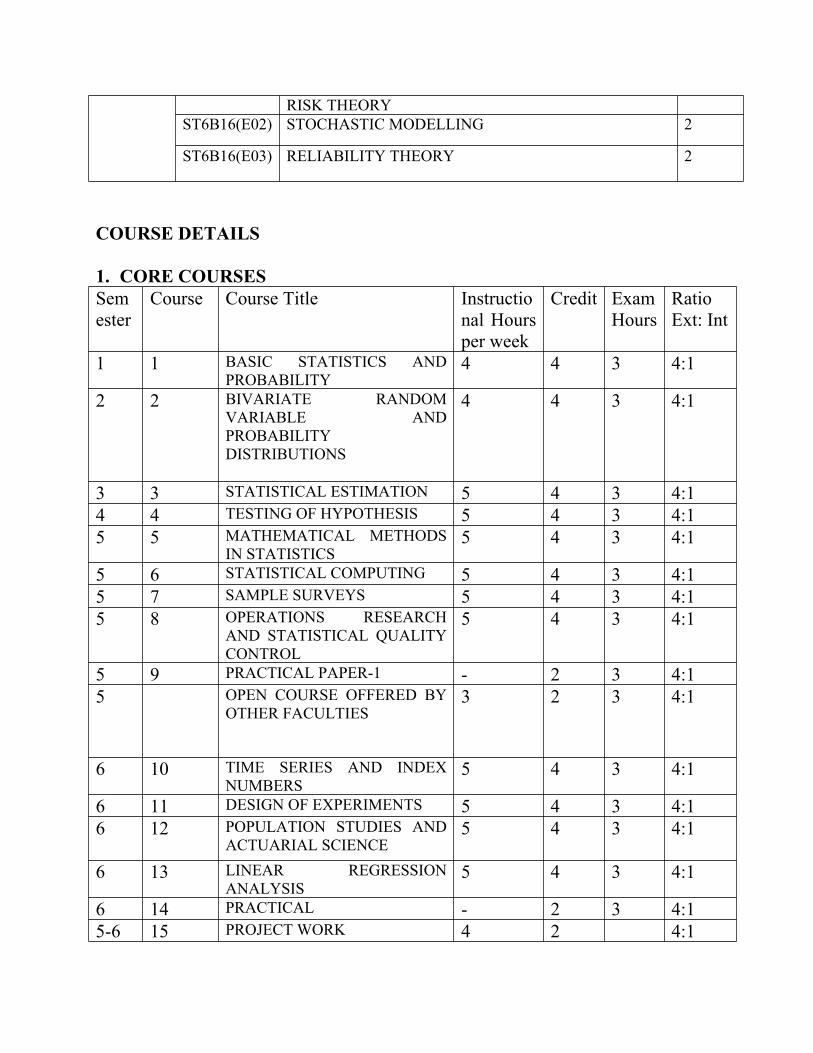
COURSE DETAILS
1. CORE COURSESSemester
Course Course Title Instructional Hours per week
Credit Exam Hours
RatioExt: Int
1 1 BASIC STATISTICS AND PROBABILITY
4 4 3 4:1
2 2 BIVARIATE RANDOM VARIABLE AND PROBABILITY DISTRIBUTIONS
4 4 3 4:1
3 3 STATISTICAL ESTIMATION 5 4 3 4:14 4 TESTING OF HYPOTHESIS 5 4 3 4:15 5 MATHEMATICAL METHODS
IN STATISTICS5 4 3 4:1
5 6 STATISTICAL COMPUTING 5 4 3 4:15 7 SAMPLE SURVEYS 5 4 3 4:15 8 OPERATIONS RESEARCH
AND STATISTICAL QUALITY CONTROL
5 4 3 4:1
5 9 PRACTICAL PAPER1 2 3 4:15 OPEN COURSE OFFERED BY
OTHER FACULTIES3 2 3 4:1
6 10 TIME SERIES AND INDEX NUMBERS
5 4 3 4:1
6 11 DESIGN OF EXPERIMENTS 5 4 3 4:16 12 POPULATION STUDIES AND
ACTUARIAL SCIENCE5 4 3 4:1
6 13 LINEAR REGRESSION ANALYSIS
5 4 3 4:1
6 14 PRACTICAL 2 3 4:156 15 PROJECT WORK 4 2 4:1
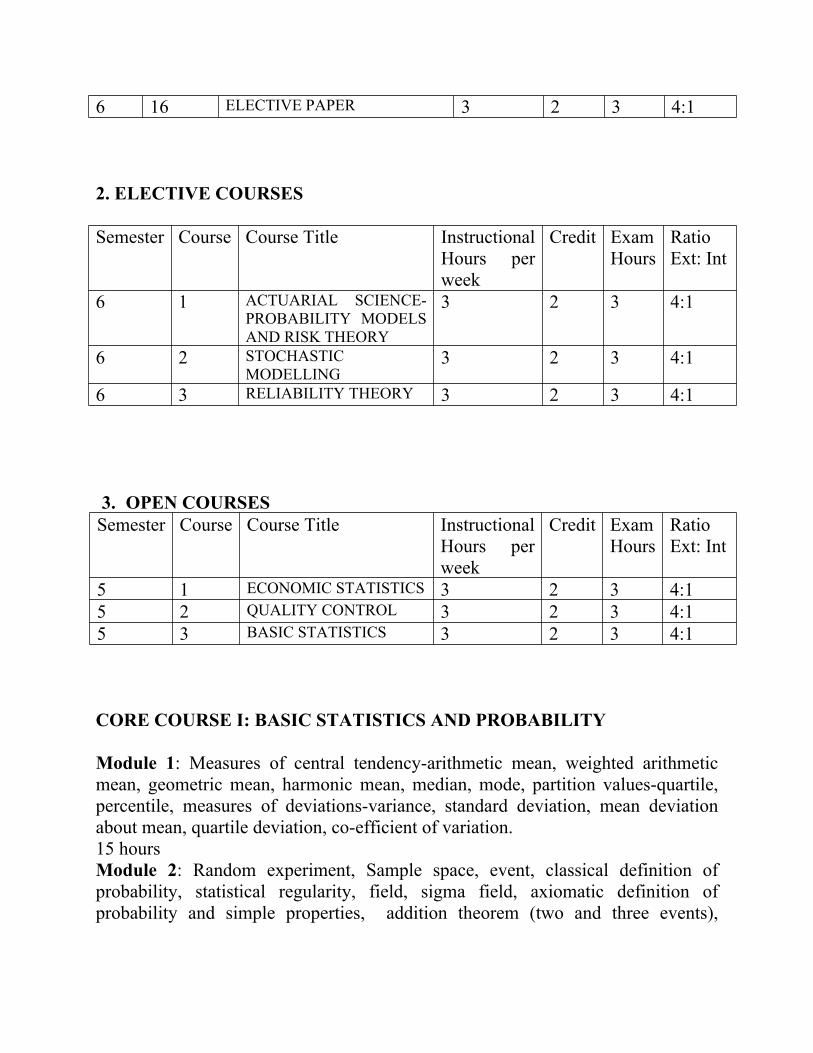
6 16 ELECTIVE PAPER 3 2 3 4:1
2. ELECTIVE COURSES
Semester Course Course Title Instructional
Hours per week
Credit Exam Hours
RatioExt: Int
6 1 ACTUARIAL SCIENCEPROBABILITY MODELS AND RISK THEORY
3 2 3 4:1
6 2 STOCHASTIC MODELLING
3 2 3 4:1
6 3 RELIABILITY THEORY 3 2 3 4:1
3. OPEN COURSESSemester Course Course Title Instructional
Hours per week
Credit Exam Hours
RatioExt: Int
5 1 ECONOMIC STATISTICS 3 2 3 4:15 2 QUALITY CONTROL 3 2 3 4:15 3 BASIC STATISTICS 3 2 3 4:1
CORE COURSE I: BASIC STATISTICS AND PROBABILITY
Module 1: Measures of central tendencyarithmetic mean, weighted arithmetic mean, geometric mean, harmonic mean, median, mode, partition valuesquartile, percentile, measures of deviationsvariance, standard deviation, mean deviation about mean, quartile deviation, coefficient of variation.15 hoursModule 2: Random experiment, Sample space, event, classical definition of probability, statistical regularity, field, sigma field, axiomatic definition of probability and simple properties, addition theorem (two and three events),

conditional probability of two events, multiplication theorem, independence of eventspair wise and mutual, Bayes theorem.25 hoursModule 3: Random variablediscrete and continuous, probability mass function (pmf) and probability density function (pdf)properties and examples, cumulative Distribution function and its properties, change of variable (univariate case).15 hoursModule 4: Fitting of straight line, parabola, exponential, polynomial, (least square method), correlationKarl Pearson’s Correlation coefficient, Rank CorrelationSpearman’s rank correlation coefficient, Partial Correlation, Multiple Correlation, regression, two regression lines, regression coefficients. 17 hours
References1. V. K. Rohatgi, An Introduction to Probability Theory and Mathematical
Statistics, Wiley Eastern.2. S.C.Gupta and V. K. Kapoor, Fundamentals of Mathematical Statistics,
Sultan Chand and Sons3. A.M. Mood, F.A. Graybill and D C Bose, Introduction to Theory of
Statistics, McGraw Hill4. John E Freund, Mathematical Statistics (6th edn), Pearson Edn, NewDelhi
CORE COURSE 2. BIVARIATE RANDOM VARIABLE AND PROBABILITY DISTRIBUTIONS
Module 1: Bivariate random variable, joint pmf and joint pdf, marginal and conditional probability, independence of random variables, 15 hoursModule 2: Mathematical expectationsdefinition, raw and central moments (definition and relationships), moment generating function and properties, characteristic function (definition and use only), covariance and correlation.20 hoursModule 3: Skewness and kurtosis using moments, Bivariate caseconditional mean and variance, covariance, Karl Pearson Correlation coefficient, independence of random variables based on expectation.12 hoursModule 4: Standard distributionsDiscrete typeBernoulli, Binomial, Poisson, Geometric, negative binomial (definition, properties and applications), Uniform (mean, variance and mgf), Continuous typeUniform, exponential, gamma, Beta,
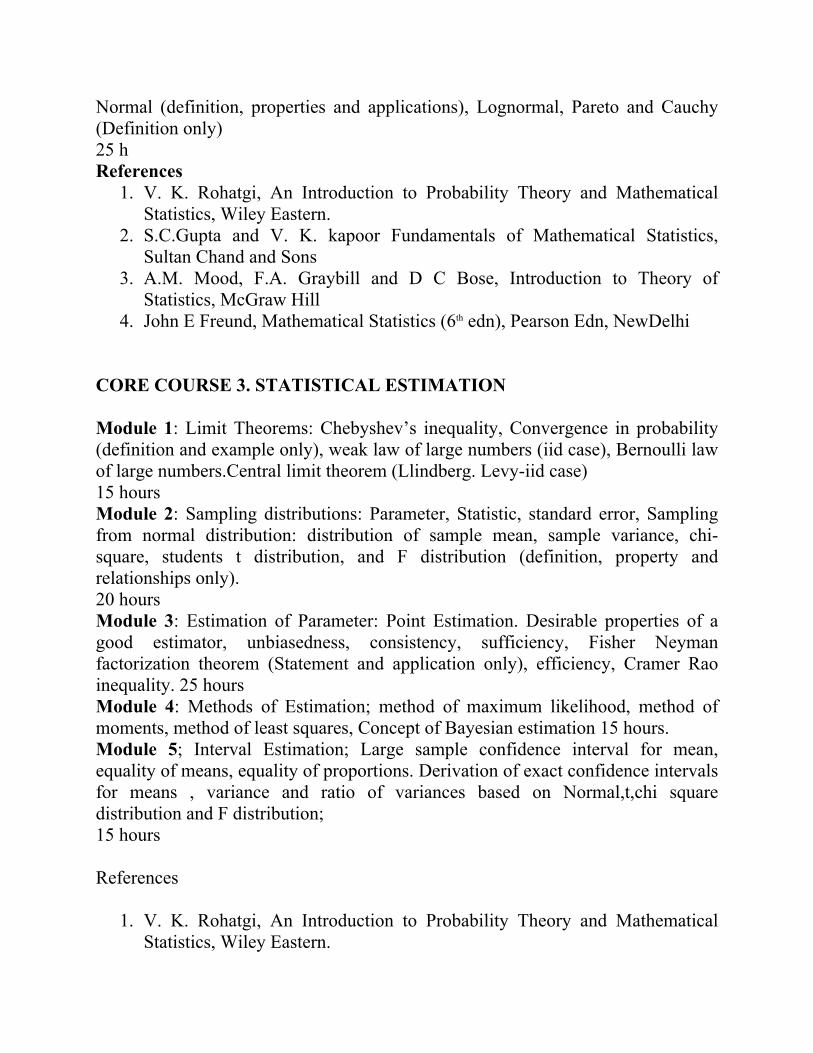
Normal (definition, properties and applications), Lognormal, Pareto and Cauchy (Definition only) 25 hReferences
1. V. K. Rohatgi, An Introduction to Probability Theory and Mathematical Statistics, Wiley Eastern.
2. S.C.Gupta and V. K. kapoor Fundamentals of Mathematical Statistics, Sultan Chand and Sons
3. A.M. Mood, F.A. Graybill and D C Bose, Introduction to Theory of Statistics, McGraw Hill
4. John E Freund, Mathematical Statistics (6th edn), Pearson Edn, NewDelhi
CORE COURSE 3. STATISTICAL ESTIMATION
Module 1: Limit Theorems: Chebyshev’s inequality, Convergence in probability (definition and example only), weak law of large numbers (iid case), Bernoulli law of large numbers.Central limit theorem (Llindberg. Levyiid case)15 hoursModule 2: Sampling distributions: Parameter, Statistic, standard error, Sampling from normal distribution: distribution of sample mean, sample variance, chisquare, students t distribution, and F distribution (definition, property and relationships only).20 hoursModule 3: Estimation of Parameter: Point Estimation. Desirable properties of a good estimator, unbiasedness, consistency, sufficiency, Fisher Neyman factorization theorem (Statement and application only), efficiency, Cramer Rao inequality. 25 hoursModule 4: Methods of Estimation; method of maximum likelihood, method of moments, method of least squares, Concept of Bayesian estimation 15 hours.Module 5; Interval Estimation; Large sample confidence interval for mean, equality of means, equality of proportions. Derivation of exact confidence intervals for means , variance and ratio of variances based on Normal,t,chi square distribution and F distribution; 15 hours
References
1. V. K. Rohatgi, An Introduction to Probability Theory and Mathematical Statistics, Wiley Eastern.
2. S.C.Gupta and V. K. Kapoor. Fundamentals of Mathematical Statistics, Sultan Chand and Sons
3. A.M. Mood, F.A. Graybill and D C Bose, Introduction to Theory of Statistics, McGraw Hill
4. John E Freund, Mathematical Statistics (6th edn), Pearson Edn, NewDelhi
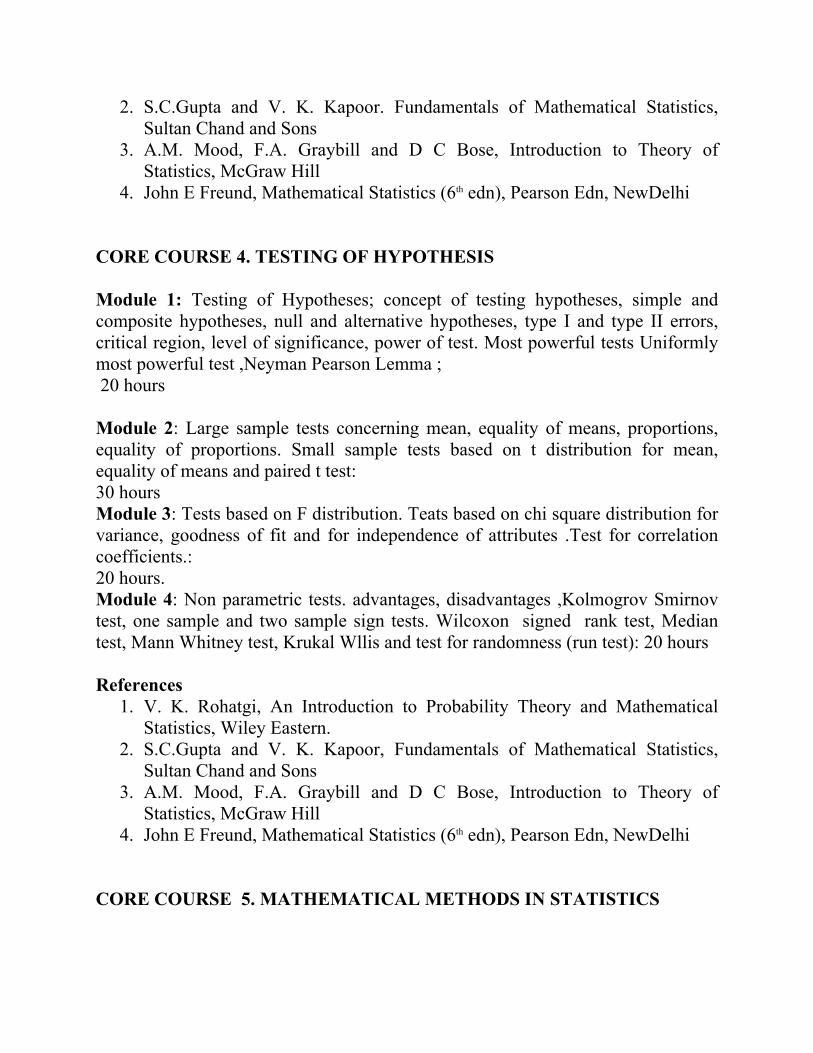
CORE COURSE 4. TESTING OF HYPOTHESIS
Module 1: Testing of Hypotheses; concept of testing hypotheses, simple and composite hypotheses, null and alternative hypotheses, type I and type II errors, critical region, level of significance, power of test. Most powerful tests Uniformly most powerful test ,Neyman Pearson Lemma ; 20 hours
Module 2: Large sample tests concerning mean, equality of means, proportions, equality of proportions. Small sample tests based on t distribution for mean, equality of means and paired t test: 30 hoursModule 3: Tests based on F distribution. Teats based on chi square distribution for variance, goodness of fit and for independence of attributes .Test for correlation coefficients.: 20 hours.Module 4: Non parametric tests. advantages, disadvantages ,Kolmogrov Smirnov test, one sample and two sample sign tests. Wilcoxon signed rank test, Median test, Mann Whitney test, Krukal Wllis and test for randomness (run test): 20 hours
References1. V. K. Rohatgi, An Introduction to Probability Theory and Mathematical
Statistics, Wiley Eastern.2. S.C.Gupta and V. K. Kapoor, Fundamentals of Mathematical Statistics,
Sultan Chand and Sons3. A.M. Mood, F.A. Graybill and D C Bose, Introduction to Theory of
Statistics, McGraw Hill4. John E Freund, Mathematical Statistics (6th edn), Pearson Edn, NewDelhi
CORE COURSE 5. MATHEMATICAL METHODS IN STATISTICS
Module 1: Real Number system: Mathematical induction, order properties of real number, Bernoulli, Cauchy, triangle inequality, absolute value, Completeness propertysuprema & infima, Archimedian property, Density theorem, nested interval property.20 hoursModule 2: Sequences: Limit, limit theorems, Squeeze theorem, convergence of sequence, root test and ratio test, monotone convergence theorem, subsequence and BolzanoWeierstrass theorem, Cauchy criterion, limits of functions, limit theorems of functions, 25 hoursModule 3: Continuous functions: Definition, Boundedness theorem, Maximumminimum theorem, Location of roots theorem, Intermediate value theorem, uniform continuity, Differentiation, Interior extremum theorem, Rolle’s theorem, Mean value theorem, Taylor’s theorem.25 hoursModule 4: Riemann Integration: Definition, Integrability criteria, integrability of continuous and monotone functions, properties of integrals, first and second fundamental theorems on integral calculus. 20 hoursBooks of references
1. Malik S.C. and Savitha Arora, Real Analysis, New Age International2. Robert G Bartle, Real Analysis, Wiely3. Shanti Narayanan, Elements of Real Analysis
CORE COURSE 6. STATISTICAL COMPUTING
Module 1: Introduction to R: R as a calculator, statistical software and a programming language, R preliminaries, getting help, data inputting methods(direct and importing from other spread sheet applications like Excel), data accessing, and indexing, Graphics in R, built in functions, saving, storing and retrieving work. 15 HoursModule 2: Descriptive statistics:, diagrammatic representation of univariate and bivariate data (box plots, stem and leaf diagrams, bar plots, pie diagram, scatter plots), measures of central tendency (mean, median and mode), partition values, measures of dispersion (range, standard deviation, mean deviation and inter quartile range), summaries of a numerical data, skewness and kurtosis, random sampling with and without replacement. 25 Hours
Module 3: Probability Distributions: R as a set of statistical tables cumulative distribution, probability density function, quantile function, and simulate from the distribution, plotting probability curves for standard distributions. 15 Hours Module 4: Statistical Inference: classical tests: One and twosample tests, ztest, ttest,Ftest, chisquare test of independence and goodness of fit, interval estimation for mean, difference of mean and variance, tests for normality (shapirowilks test, wilcoxon’s test and qq plot), Anova(one way and twoway), correlation and regression analysis(bivariate and multivariate data), polynomial regression 25 Hours
References:1. Michale J. Crawley, THE R BOOK, John Wiley & Sons, England (2009)2. Sudha G. Purohit et.al., Statistics Using R, Narosa Publishing House, ,
India(2008)3. John Verzani, simple RUsing R for Introductory Statistics,
(http://www.math.csi.cuny.edu/Statistics/R/SimpleR/Simple. )4. W. N. Venables, D. M. Smith and the R Core Team, An Introduction to R ,
Notes on R: A Programming Environment for Data Analysis and Graphics, Version 2.15.2 (20121026)
(http://www.rproject.org)
CORE COURSE 7. SAMPLE SURVEYS
Module 1: Census and Sampling, principal steps in sample surveyprobability sampling, judgment sampling, organization and execution of large sample surveys, sampling and nonsampling errors, preparation of questionnaire20 hoursModule 2: Simple random sampling with and without replacement methods of collecting simple random samples, unbiased estimate of the population mean and population totaltheir variances and estimate of these variancessimple random sampling for proportions :20 hoursModule 3: Stratified random sampling: estimation of population mean and total, proportional and Neymann allocation of sample sizescost functionoptimum allocation considering costcomparison with simple random sampling.20 hoursModule 4: Systematic Sampling: Linear and circular systematic sampling, comparison with simple random sampling.10 hours
Module 5: Cluster sampling: Clusters with equal sizesestimation of the population mean and total, comparison with simple random sampling, two stage cluster samplingestimate of variance of population mean.20 hours
Books for references1. Murthy M N, Sampling theory and methods, Statistical Publishing society,
Calcutta2. Daroja Singh and F S Chaudhary, Theory and Analysis of Sample Survey
Designs, Wiely Estrn Limitted3. Cochran W.G, Sampling Techniques, Wiely Estern
CORE COURSE 8. OPERATIONS RESEARCH AND STATISTICAL QUALITY CONTROL
Module 1: Linear programming: Mathematical formulation of LPP, Graphical and Simplex methods of solving LPPduality in linear programming20 hoursModule 2: Transportation and assignment problems, Northwest corner rules, row column and least cost methodVogel’s approximation method, Assignment problem, Hungarian algorithm of solution20 hoursModule 3: General theory of control charts, causes of variations in quality, control limits, subgrouping, summary of outofcontrol criteria, charts of attributes, np chart, p chart, c chart, Charts of variables: X bar chart, R Chart and sigma chart, Revised control charts, applications and advantages25 hoursModule 4: Principles of acceptance samplingproblems and lot acceptance, stipulation of good and bad lotsproducer’ and consumer’ risk, simple and double sampling plans, their OC functions, concepts of AQL, LTPD,AOQL, Average amount of inspection and ASN function25 hours
Books for references1. Gupta and Manmohan, Linear programming, Sulthan Chand and sons2. Hardley G, Linear programming, AddisonWesley3. Taha, Operations Research, Macmillan,

4. V.K.Kapoor, Operations Research, Sultan Chand and Sons5. S.C.Gupta and V.K.Kapoor Fundamentals of Applied Statistics, Sultan
Chand and Sons
CORE COURSE 9 PRACTICAL 1.
Topics for practical 1
Numerical questions from the following topics of the syllabi are to be asked for external examination of this paper. The questions are to be evenly chosen from these topics.
. The students have to maintain a practical record. The numerical examples of the following topics are to be done by the students of the fifth semester class under the supervision of the teachers and to be recorded in the record book. The valuation of the record shall be done internally
1. Small sample test2. Large sample test3. Construction of confidence intervals4. Sample surveys
CORE COURSE 10. TIME SERIES AND INDEX NUMBERS
Module 1: Time series analysis: Economic time series, different components, illustrations, additive and multiplicative models, determination of trends, growth curves, analysis of seasonal fluctuations, construction of seasonal indices. 25 hoursModule 2: Analysis of Income and allied distributionsPareto distribution, graphical test, fitting of Pareto’s law, illustrations, lognormal distribution and properties, Lorenz curve, Gini’s coefficient . 20 hoursModule 3: Index numbers: Meaning and definitionuses and typesproblems in the construction of index numberssimple aggregate and weighted aggregate index numbers. Test for consistency of index numbersfactor reversal , time reversal and unit test, Chain base index numbersBase shiftingsplicing and deflating of index numbers. Consumer price index numbersfamily budget enquirylimitations of index numbers. 30 hoursModule 4: Attitude Measurements and Scales: issues in attitude measurementsscaling of attitudeGuttman scaleSemantic differential scaleLikert scaleselection of appropriate scalelimitations of scales 15 hours
Books for references1. SC Gupta and V K Kapoor, Fundamentals of applied statistics, Sulthan
chand and sons2. Goon A M Gupta M K and Das Gupta, Fundamentals of Statistics Vol II,
The World press, Calcutta3. Box G E P and Jenkins G M, Time series analysis, Holden Day4. Meister David, Behavioral Analysis and Measurement methods, John Wiley
New York5. Luck et al. Marketing Research, Prentice Hall of India, New Delhi
CORE COURSE 11. DESIGNS OF EXPERIMENTS
Module 1: Linear estimation, estimability of parametric functions and BLUEGaussMarkov theoremLinear Hypothesis25 hoursModule 2: Analysis of variance, one way and two way classification (with single observation per cell), Analysis of covariance with a single observation per cell.25 hoursModule 3: Principles of designrandomizationreplicationlocal control, Completely randomized design, Randomized block designLatin square design. Missing plot techniquecomparison of efficiency.25 hoursModule 4: Basic concepts of factorial experiments, 23 factorial experiments, Duncan’s multiple range test.15 hoursBooks for references
1. S.C. Gupta and V K Kapoor, Fundamentals of applied Statistics, Sulthan Chand and Sons
2. Federer, Experimental Designs3. M N Das and N Giri, Design of Experiments, New Age international,4. DD Joshy, linear Estimation and Design of Experiments, Wiley Eastern5. Montgomeri, Design of Experiments
CORE COURSE 12 POPULATION STUDIES AND ACTUARIAL SCIENCE
Module 1: Sources of vital statistics in Indiafunctions of vital statistics, Rates and ratiosmortality ratescrude, age specific and standard death ratesfertility and reproduction ratescrude birth ratesgeneral and specific fertility ratesgross and net reproduction rates.20 hoursModule 2: Life Tablescomplete life tables and its characteristicsAbridged life tables and its characteristics, principle methods of construction of abridged life tablesReed Merrel’s method40 hoursModule 3: Fundamentals of insurance: Insurance defined meaning of loss, peril, hazard and proximate cause in insurance, Costs and benefits of insurance to societybranches of insurance. Insurable loss exposuresfeature of loss that is deal of insurance, Construction of Mortality tablecomputation of premium of life insurance for fixed duration and for the whole life.30 hoursBooks for reference
1. S.C. Gupta and V K Kapoor, Fundamentals of applied Statistics, Sulthan Chand and Sons
2. Benjamin B, Health and Vital Statistics, Allen and Unwin3. Mark S Dorfman, Introduction to Risk Management and Insurance, Prentice
Hall4. C.D.Daykin, T. Pentikainen et al, Practical Risk Theory of Acturies,
Chapman and Hill
CORE COURSE 13. REGRESSION ANALYSIS
Module 1: Least Square estimation: GaussMarkoff Setup, Normal equations and least square Method of estimation, properties of estimator, variance of estimator, Estimation of variance.25 hoursModule 2: Linear Regression: Simple linear regression model, least square estimation of parameters, Hypothesis testing of slope and intercept, coefficient of determination.20 hours
Module 3: Multiple Regressions: Model, estimation of model parameters, test for significance of regression, regression coefficient, coefficient of determination, use of ANOVA25 hoursModule 4: Polynomial and logistic regression: Models and method of estimation, logistic regressionbinarymodel and estimates 20hoursReferences
1. D C. Montegomerry, E A Peak and G G Vining, Introduction to Linear regression analysis, Wiley 2003
CORE COURSE 14. PRACTICAL 2
Topics for practical 2
Numerical questions from the following topics of the syllabi are to be asked for external examination of this paper. The questions are to be evenly chosen from these topics.
. The students have to maintain a practical record. The numerical examples of the following topics are to be done by the students of the sixth semester class under the supervision of the teachers and to be recorded in the record book. The valuation of the record shall be done internally
1. Design of Experiments2. Construction of Control charts3. Linear programming4. Time series5. Index numbers
Paper 15PROJECT
The following guidelines may be followed for project work.1. The project is offered in the fifth and sixth semester of the degree course and
the duration of the project may spread over the complete year.
2. A project may be undertaken by a group of students, the maximum number in a group shall not exceed 5. However the project report shall be submitted by each student.
3. There shall be a teacher from the department to supervise the project and the synopsis of the project should be approved by that teacher. The head of the department shall arrange teachers for supervision of the project work.
4. As far as possible, topics for the project may be selected from the applied branches of statistics, so that there is enough scope for applying and demonstrating statistical skills learnt in the degree course.
Paper 16ELECTIVE COURSES
ELECTIVE COURSE 1. PROBABILITY MODELS AND RISK THEORY
Module 1: Individual risk model for a short time: Model for individual claim random variablessums of independent random variablesApproximation for the distribution of sumApplication to insurance10 hoursModule 2: Collective risk models for a single period: The distribution of aggregate claimsselection of basic distributionsproperties of compound Poisson distributionapproximation to the distributions of aggregate claims15 hoursModule 3: Collective risk models over an extended period: Claims processThe adjustment coefficientsDiscrete time modelthe first surplus below the initial levelThe maximal aggregate loss15 hoursModule 4: Application of risk theory: Claim amount distributionsapproximating the individual modelstoploss reinsurancethe effect of reinsurance on the probability of ruin14 hoursBooks for reference
1. Institute of Actuaries, Act Ed. Study Materials2. McCutcheon, JJ, Scott William (1986): An introduction to Mathematics of
Finance3. Butcher M V, Nesbit, Cecil (1971) Mathematics of Compound Interest,
Ulrich’s book
4. Neil, Alistair, Heinemann (1977) Life contingencies5. Bowers, Newton Let et al (1997) Actuarial mathematics, society of
Actuaries, 2nd
ELECTIVE COURSE 2. STOCHASTIC MODELLING
Module 1: Concept of mathematical modeling, definition, natural testing a informal mathematical representations. 10 hoursModule 2: Concept of stochastic process, probability generating functions, convolution generating function of sum of independent random variables, Definition of a stochastic process, classification, Markov chain, transition probabilities, Chapmann and Kolmogrov equations, transition probability matrices, examples and computation.30 hoursModule 3: First passage probabilities, classification of states, recurrent, transient and ergodic states, stationary distribution, mean ergodic.14 hours
Books for reference1. V K Rohatgi, An introduction to probability theory and mathematical
statistics, Wiley eastern2. S M Ross, An Introduction to Probability Theory and Stochastic Models3. V K Rohadgi Statistical Inference, Wiley Eastern
ELECTIVE COURSE 3. RELIABILITY THEORY
Module 1: Structural properties of coherent Systems: System of componentsseries and parallel structure with exampledual structure functioncoherent structurepreservation of coherent system in terms of paths and cutsrepresentation of bridge structuretimes to failurerelative importance of componentsmodules of coherent systems.20 hoursModule 2: Reliability of Coherent systems: Reliability of a system of independent componentssome basic properties of system reliabilitycomputing exact system reliabilityinclusion exclusion methodreliability importance of components20 hoursModule 3: Parametric distributions in reliability: A notion of ageing (IFR and DFR only) with examplesexponential distributionPoisson distribution.14 hours
Books for references1. R E Barlow and F Proschan (1975) Statistical Theory of Reliability and life
testing, Holt Rinhert, Winston2. N Ravi Chandran, Reliability Theory, Wiley Eastern
OPEN COURSES
OPEN COURSE 1. ECONOMIC STATISTICS
Module 1: Time series analysis: Economic time series, different components, illustrations, additive and multiplicative models, determination of trends, growth curves, analysis of seasonal fluctuations, construction of seasonal indices24 hoursModule 2: Index numbers: Meaning and definitionuses and typesproblems in the construction of index numberssimple aggregate and weighted aggregate index numbers. Test for consistency of index numbersfactor reversal , time reversal and unit test, Chain base index numbersBase shiftingsplicing and deflating of index numbers. Consumer price index numbersfamily budget enquirylimitations of index numbers.30 hours
Books for references1. S C Gupta and V K Kapoor, Fundamentals of Applied Statistics, Sulthan
Chands and sons2. Goon A M, Gupta M K and Das Gupta, Fundamentals of Statistics Vol II,
The World Press, Calcutta
OPEN COURSE 2. QUALITY CONTROL
Module 1: General theory of control charts, causes of variations in quality, control limits, subgrouping, summary of outofcontrol criteria, charts of attributes, np chart, p chart, c chart, Charts of variables: X bar chart, R Chart and sigma chart, Revised control charts, applications and advantages30 hours
Module 2: Principles of acceptance samplingproblems of lot acceptance, stipulation of good and bad lotsproducer’ and consumer’ risk, simple and double sampling plans, their OC functions, concepts of AQL, LTPD,AOQL, Average amount of inspection and ASN function24 hours
References1. Grant E L, Statistical quality control, McGraw Hill2. Duncan A J, Quality Control and Industrial Statistics, Taraporewala and
sons3. Montegomery D C, Introduction to Statistical Quality Control, John Wiley
and sons
OPEN COURSE 3. BASIC STATISTICS
Module 1: Elements of Sample Survey: Census and Sampling, advantages, principal step in sample surveysampling and nonsampling errors. Probability sampling, judgment sampling and simple random sampling.15 hoursModule 2: Measures of Central tendency: Mean, median and mode and their empirical relationships, weighted arithmetic meanDispersion: absolute and relative measures, standard deviation and coefficient of variation.15 hoursModule 3: Fundamental characteristics of bivariate data: univariate and bivariate data, scatter diagram, curve fitting, principle of least squares, fitting of straight line. Simple correlation, Pearson’s correlation coefficient, limit of correlation coefficient, invariance of correlation coefficient under linear transformation.19 hoursModule 4: Basic probability: Random experiment, sample space, event, algebra of events, Statistical regularity, frequency definition, classical definition and axiomatic definition of probabilityaddition theorem, conditional probability, multiplication theorem and independence of events (limited to three events).20 hours
References1. V. K. Rohatgi, An Introduction to Probability Theory and Mathematical
Statistics, Wiley Eastern.2. S.C.Gupta and V. K. Kapoor, Fundamentals of Mathematical Statistics,
Sultan Chand and Sons
3. A.M. Mood, F.A. Graybill and D C Bose, Introduction to Theory of Statistics, McGraw Hill
4. John E Freund, Mathematical Statistics (6th edn), Pearson Edn, NewDelhi
COMPLEMENTARY COURSE
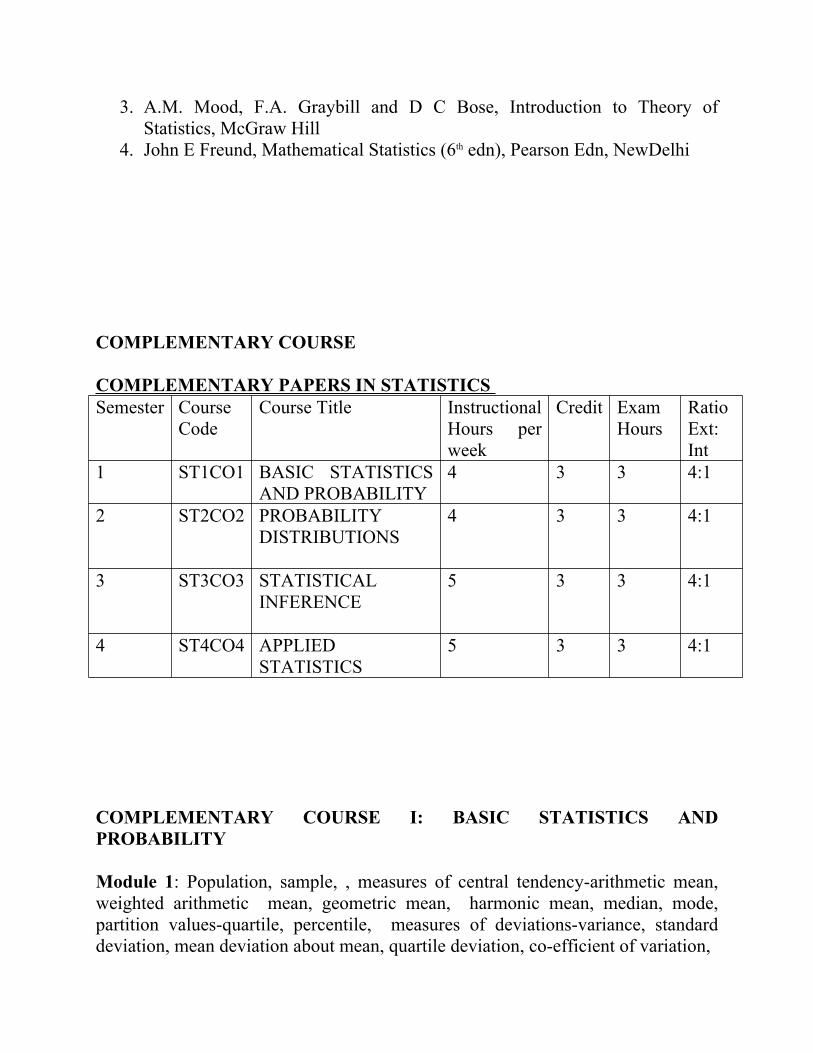
COMPLEMENTARY PAPERS IN STATISTICS Semester Course
Code Course Title Instructional
Hours per week
Credit Exam Hours
RatioExt: Int
1 ST1CO1 BASIC STATISTICS AND PROBABILITY
4 3 3 4:1
2 ST2CO2 PROBABILITY DISTRIBUTIONS
4 3 3 4:1
3 ST3CO3 STATISTICAL INFERENCE
5 3 3 4:1
4 ST4CO4 APPLIED STATISTICS
5 3 3 4:1
COMPLEMENTARY COURSE I: BASIC STATISTICS AND PROBABILITY
Module 1: Population, sample, , measures of central tendencyarithmetic mean, weighted arithmetic mean, geometric mean, harmonic mean, median, mode, partition valuesquartile, percentile, measures of deviationsvariance, standard deviation, mean deviation about mean, quartile deviation, coefficient of variation,
20 hoursModule 2: Fitting of straight line, parabola, exponential, polynomial, (least square method), correlation, regression, two regression lines, regression coefficients,properties .rank correlation, partial and multiple correlation ( 3 variables)15 hoursModule 3: Random experiment, Sample space, event, classical definition of probability, statistical regularity, relative frequency definition, field, sigma field, axiomatic definition of probability and simple properties, concept of probability measure, addition theorem (two and three events), conditional probability of two events, multiplication theorem, independence of events(pair wise and mutual), Bayes theorem. –numerical problems25 hourModule 4: Random variablediscrete and continuous, probability mass function (pmf) and probability density function (pdf)properties and examples, cumulative Distribution function and its properties, change of variable (univariate case)12 hours
References5. V. K. Rohatgi, An Introduction to Probability Theory and Mathematical
Statistics, Wiley Eastern.6. S.C.Gupta and V. K. Kapoor, Fundamentals of Mathematical Statistics,
Sultan Chan and Sons7. A.M. Mood, F.A. Graybill and D C Bose, Introduction to Theory of
Statistics, McGraw Hill8. John E Freund, Mathematical Statistics (6th edn), Pearson Edn, NewDelhi
COMPLEMENTARY COURSE II PROBABILITY DISTRIBUTIONS
Module 1: Mathematical expectations (univariate): Definition, raw and central moments (definition and relationships), moment generating function and properties, characteristic function (definition and use only), Skewness and kurtosis ( using moments) 15 hoursModule 2: Bivariate random variable: joint pmf and joint pdf, marginal and conditional probability, independence of random variables, function of random variable. Bivariate Expectations, conditional mean and variance, covariance, Karl Pearson Correlation coefficient, independence of random variables based on expectation.
15 hoursModule 3: Standard distributions: Discrete typeBernoulli, Binomial, Poisson, Geometric, negative binomial (definition, properties and applications), Uniform (mean, variance and mgf), Continuous typeUniform, exponential, gamma, Beta, Normal (definition, properties and applications), Lognormal, Pareto and Cauchy (Definition only)30 hoursModule 4:: Chebyshev’s inequality, variables, Convergence in probability weak law of large numbers (iid case), Bernoulli law of large numbers, example only), Central limit theorem (Lindberg Levyiid case)12 hours
References9. V. K. Rohatgi, An Introduction to Probability Theory and Mathematical
Statistics, Wiley Eastern.10.S.C.Gupta and V. K. Kapoor, Fundamentals of Mathematical Statistics,
Sultan Chand and Sons11.A.M. Mood, F.A. Graybill and D C Bose, Introduction to Theory of
Statistics, McGraw Hill12.John E Freund, Mathematical Statistics (6th edn), Pearson Edn, NewDelhi
COMPLEMENTARY COURSE III. STATISTICAL INFERENCE
Module 1: Sampling distributions: Statistic, Sampling distribution of a statistic, Standard error, Sampling from normal distribution, distribution of sample mean, sample variance, chisquare distribution, t distribution, and F distribution (definition, derivations and relationships only).25 hoursModule 2: Theory of Estimation: Point Estimation, desirable properties of a good estimator, unbiasedness, consistency, sufficiency, Fisher Neyman factorization theorem, efficiency.Methods of Estimation: Method of maximum likelihood, method of moments. 20 hours
Module 3: Interval Estimation: Interval estimates of mean, difference of means, variance, proportions and difference of proportions. Derivation of exact confidence
intervals for means, variance and ratio of variances based on normal, t, chi square and F distributions: 15 hoursModule 4: Testing of Hypotheses: concept of testing hypotheses, simple and composite hypotheses, null and alternative hypotheses, type I and II errors, critical region, level of significance and power of a test. Neyman Pearson approach: Large sample tests concerning mean equality of means, proportions, equality of proportions, Small sample tests based on t distribution for mean, equality of means and paired t test. Tests based on Fdistribution for ratio of variances. Tests based on Chi square distribution for variance, goodness of fit and for independence of attributes:30 hours
ReferencesV. K. Rohatgi, An Introduction to Probability Theory and Mathematical Statistics, Wiley Eastern.S.C.Gupta and V. K. Kapoor Fundamentals of Mathematical Statistics, Sultan Chand and SonsA.M. Mood, F.A. Graybill and D C Bose, Introduction to Theory of Statistics, McGraw HillJohn E Freund, Mathematical Statistics (6th edn), Pearson Edn, NewDelhi
COMPLEMENTARY COURSE IV: APPLIED STATISTICS
Module 1:Census and Sampling, Principal steps in a sample survey, different types of sampling, Organisation and execution of large scale sample surveys, errors in sampling (Sampling and nonsampling errors) preparation of questionnaire, simple random sampling with and without replacement, Systematic,stratified and cluster sampling (concept only)20 hoursModule 2:Analysis of variance; one way, two way classifications. Null hypothesis, total, between and within sum of squares. AssumptionsANOVA table..15 hoursModule 3: Time series :Components of time seriesadditive and multiplicative models, measurement of trend, moving averages, seasonal indicessimple averageratio to moving average.Index numbers: meaning and definitionuses and types problems in the construction of index numbers different types of simple and weighted index numbers. Test for an ideal index number time and factor reversal test.30 hours

Module 4:Statistical Quality Control: Concept of statistical quality control, assignable causes and chance causes, process control. Construction of control charts, 3sigma limits. Control chart for variablesMean chart and Range chart. Control chart for attributes pchart, d or np chart and chart25 hours
References1. S.C.Gupta and V. K. Kapoor, Fundamentals of Applied Statistics, Sultan
Chand and Sons2. Grant E L, Statistical quality control, McGraw Hill3. Duncan A J, Quality Control and Industrial Statistics, Taraporewala and
sons4. Montegomery D C, Introduction to Statistical Quality Control, John Wiley
and sons5. S.P.Gupta: statistical methods
SYLLABUS OF COMPLEMENTARY II ACTUARIAL SCIENCESTATISTICS: COMPLEMENTARY – IICUCCSSUG 2014 (2014 admission onwards)
Sem No
Course code
Course Title Instructional Hours/week
Credit Exam Hours
Ratio Ext: Int
1 AS1C01 FINANCIALMATHEMATICSFINANCIALMATHEMATICS
4 3 3 4:1
2 AS2C02 FINANCIALMATHEMATICS
4 3 3 4:1
3 AS3C03 LIFECONTINGENCIESAND PRINCIPLES OFINSURANCE
5 3 3 4:1
4 AS4C04 LIFECONTINGENCIESAND PRINCIPLES OFINSURANCE
5 3 3 4:1
SEMESTER ICourse IFinancial mathematics
Module I: Rates of interestSimple and Compound interest ratesEffective rate of interest Accumulation and Present value of a single paymentNominal rate of interestConstant force of interestRelationship between these rate of interest Accumulation and Present value of a single payment using these rate of interestAccumulation and Present value of a single payment using these symbolsWhen the force of interest is a function of t, δ(t).Definition of A(t1,t2),A(t),v(t1,t2) and v(t).Expressing accumulation and present values of a single payment using these symbolswhen the force of interest is a function of t, δ(t) 22hrs
Module II: Series of paymentsDefinition of annuity (Ex:real life situation) Accumulation and present vales of annuities with level payments and where the payments and interest rates have same frequencies Definition and derivation –Definition of perpetuity and derivation Accumulation and present values of annuities where payments and interest rates have different frequencies 22hrs
Module III: Increasing and decreasing annuitiesDefinition and derivation— Annuities payable continuouslyAnnuities where payments are increasing continuously and payable continuouslyDefinition and derivation 10hrs
Module IV: Loan schedulesPurchase price of annuities net of taxconsumer credit transaction 18hrs
Books for study and reference:Institute of Actuaries Act Ed. Study materialsMcCutcheon, J.J., Scott William (1986): An introduction to Mathematicsof FinanceButcher,M.V., Nesbit, Cecil. (1971)Mathematics of compound interest,Ulrich’s BooksNeill, Alistair, Heinemann, (1977): Life contingencies.Bowers, Newton Let al Actuaries, 2nd Ed
SEMESTER II
Course II Life contingencies
Module I: Survival distribution and Life tables:Probability for the age at death life tables The deterministic survivorship group. Other life table functions, assumptions for Fractional Ages Some analytical laws of mortality select and ultimate life table 25hrs
Module II: Multiple life functions: Joint life statusthe last survivor status Probabilities and expectationsInsurance and annuity benefits EvaluationSpecial mortality lawsEvaluationUniform distribution of deathSimple contingent functionsEvaluation 10hrs
Module III: Evaluation of assurance:Life assurance contracts(whole, nyear term, nyear endowment, deferred) Insurance payable at the moment of death and insurance payable at the end of year of deathRecursion equations Commutation functions 19hrs
Module IV: Life annuities: single payment contingent on survivalContinuous life annuitiesDiscrete life annuitiesLife annuities with monthly payment Commutation Function formulae for annuities with level paymentsVarying annuitiesRecursion equationscomplete annuitiesimmediate and apportion able annuity –due 18hrs
Books for study and reference:Institute of Actuaries Act Ed. Study materialsMcCutcheon, J.J., Scott William (1986): An introduction to Mathematicsof FinanceButcher,M.V., Nesbit, Cecil. (1971)Mathematics of compound interest,Ulrich’s BooksNeill, Alistair, Heinemann, (1977): Life contingencies.Bowers, Newton Let al (1997): Actuarial mathematics, society ofActuaries, 2nd Ed
SEMESTER IIICourse IIILife contingencies and Principles of insurance
Module I: Net premiums: Fully continuous premiumsfully discrete premiumsTrue mthly payment premiumsApportion able premiumsCommutation functionsAccumulation type benefits 20hrs
Module II: Fully continuous net premium reservesother formulas for fully discrete net premium resultsReserves on semi continuous basis Reserves based on semi continuous basisReserves based on apportion able or discounted continuous basisRecursive formulae for fully discrete basisReserves at fractional durationAllocation of the loss to the policy yearsDifferential equation for fully continuous reserves 25hrs
Module III: Concept of Riskthe concept of InsuranceClassification of InsuranceTypes of Life InsuranceInsurance Act, fire ,marine, motor engineering, Aviation and agriculturalAlternative classificationInsurance of propertypecuniary interest, liability &person, Distribution between Life & General InsuranceHistory of General Insurance in India. 25hrs
Module IV: The Economic of Insurance: Utility theoryInsurance and Utility melements of Insuranceoptimal insuranceMultiple decrement models 20 hrs
Books for study and reference:Institute of Actuaries Act Ed. Study materialsMcCutcheon, J.J., Scott William (1986): An introduction to Mathematicsof FinanceButcher,M.V., Nesbit, Cecil. (1971)Mathematics of compound interest,Ulrich’s BooksNeill, Alistair, Heinemann, (1977): Life contingencies.Bowers, Newton Let al (1997): Actuarial mathematics, society ofActuaries, 2nd Ed
SEMESTER IV
Course IV
Probability models and Risk theory
Module I: Individual risk model for a short time: Model for individual claim random variablesSums of independent random variable Approximation for the distribution of the sumApplication to insurance 20hrs
Module II: Collective risk models for a single period: The distribution of aggregate claimsSelection of basic distributionsProperties of compound Poisson distributions –Approximations to the distribution of aggregate claims 25hrs
Module III: Collective risk models over an extended period: Claims processThe adjustment coefficientDiscrete time modelThe first surplus below the initial levelThe maximal aggregate loss 20hrs
Module IV: Application of risk theory: Claim amount distributions Approximating the individual modelStoploss reinsuranceThe effect of reinsurance on the probability of ruin 25hrs
Books for study and reference:Institute of Actuaries Act Ed. Study materialsMcCutcheon, J.J., Scott William (1986): An introduction to Mathematicsof FinanceButcher,M.V., Nesbit, Cecil. (1971)Mathematics of compound interest,Ulrich’s BooksNeill, Alistair, Heinemann, (1977): Life contingencies.Bowers, Newton Let al (1997): Actuarial mathematics, society ofActuaries, 2nd Ed

STATISTICS: COMPLEMENTARY – I Syllabus for BSc.
CUCCSSUG 2014 (2014 admission onwards)
SYLLABUS FOR BSc. (GEOGRAPHY MAIN)
Sem No
Course code
Course Title Instructional Hours/week
Credit Exam Hours
Ratio Ext: Int
1 SG1C01 STATISTICAL METHODS
4 3 3 4:1
2 SG2C02 REGRESSION ANALYSIS,TIME SERIES AND INDEXNUMBERS
4 3 3 4:1
3 SG3C03 PROBABILITY 5 3 3 4:1
4 SG4C04 TESTING OFHYPOTHESIS
5 3 3 4:1
Semester I
CourseI (STATISTICAL METHODS)
Module 1. Meaning, Scope and limitations of Statistics – collection of data, conducting a statistical enquiry – preparation of questionnaire – primary and secondary data – classification and tabulation – Formation of frequency distribution – diagrammatic and graphic presentation of data – population and sample –advantages of sampling over census – methods of drawing random samples from a finite population. (Only a brief summary of the above topics is intended to be given by the teacher. Detailed study is expected from the part of students). 12hrs
Module 2. Measures of central tendency – Arithmetic meanweighted arithmetic mean, medium, mode, geometric mean and harmonic mean, partition values – quartiles – deciles and percentiles. 30hrs
Module 3. Measure of dispersion – relative and absolute measures of dispersion, measures of dispersion – range – quartile deviation – mean deviationstandard deviation – Lorenz curve – skewness and kurtosis. 30 hours
Semester II
CourseII Regression Analysis, Time Series and Index Numbers
Module 1. Fitting of curves of the form – linear, y=abx, y=aebx – correlation analysis – concept of correlation – methods of studying correlation – scatter diagram – Karl Pearson’s correlation coefficient – concept of rank correlation and Spearman’s rank correlation coefficient – regression analysis – linear regression – regression equations (concepts only – Derivations are beyond the scope of this syllabus). 30hrs
Module 2. Index numbers, meaning and use of index numbers – simple and weighted Index numbers – price index numbers – Laspeyer’s, Paasche’s Marshall – Edgeworth and Fisher’s index number – Test of good index number, chain base and fixed base index number – construction of cost of living index number. 20hrs
Module 3. Time series analysis – component of time series – measurement of secular trend semi average, moving average and least square methods (linear function only) concept of seasonal and cyclical variation. 22hours
Semester III
Course IIIPROBABILITY
1. Module 1. Probability theory – concept of random experiment, sample point, sample space and events – mathematical and statistical definitions of probability, limitations, axiomatic approach to probability–addition and, multiplication theorems, concept of conditional probability, probability in discrete sample space – numerical problems. 35 hours
2. Module 2. Random variable, definition of discrete and continuous type – probability mass function, distribution function – mathematical expectation, definition, numerical problems in the discrete case only. 25 hours

3. Module 3. One point, two point, Bernoulli, binomial, Poisson. Normal distributions – probability density function, properties – simple numerical problems. 30hrs
Semester IV
CourseIVTESTING OF HYPOTHESIS
Module 1. Testing of statistical hypotheses, large and small sample tests, basic ideas of sampling distribution, test of mean, proportion, difference of means, difference of proportions, tests of variance and correlation coefficient, chi squares tests. 35hours
Module 2. Non parametric tests – advantages, sign test, run test, signed rank test, ranksum test. Kolmogorov – Smirnov goodness of fit test. 30 hours
Module 3. Analysis of variance: One way and two way classifications. Null hypotheses, total, between and within sum of squares. ANOVATable. Solution of problems using ANOVA tables. 25 hours
Books for reference.
1. S.C. Gupta and V.K. Kapoor : Fundamentals of MathematicalStatistics, Sultan Chand and sons2. Mood A.M., Graybill. F.A and Boes D.CIntroduction to Theory of3. Gibbons J.D.: Non parametric Methods for Quantitative Analysis,McGraw Hill.4. S.C. Gupta & V.K.Kapoor: Fundamentals of Applied Statistics, SultanChand & Sons.5. Box, G.E.P. and G.M. Jenkins: Time Series Analysis, Holden –Day
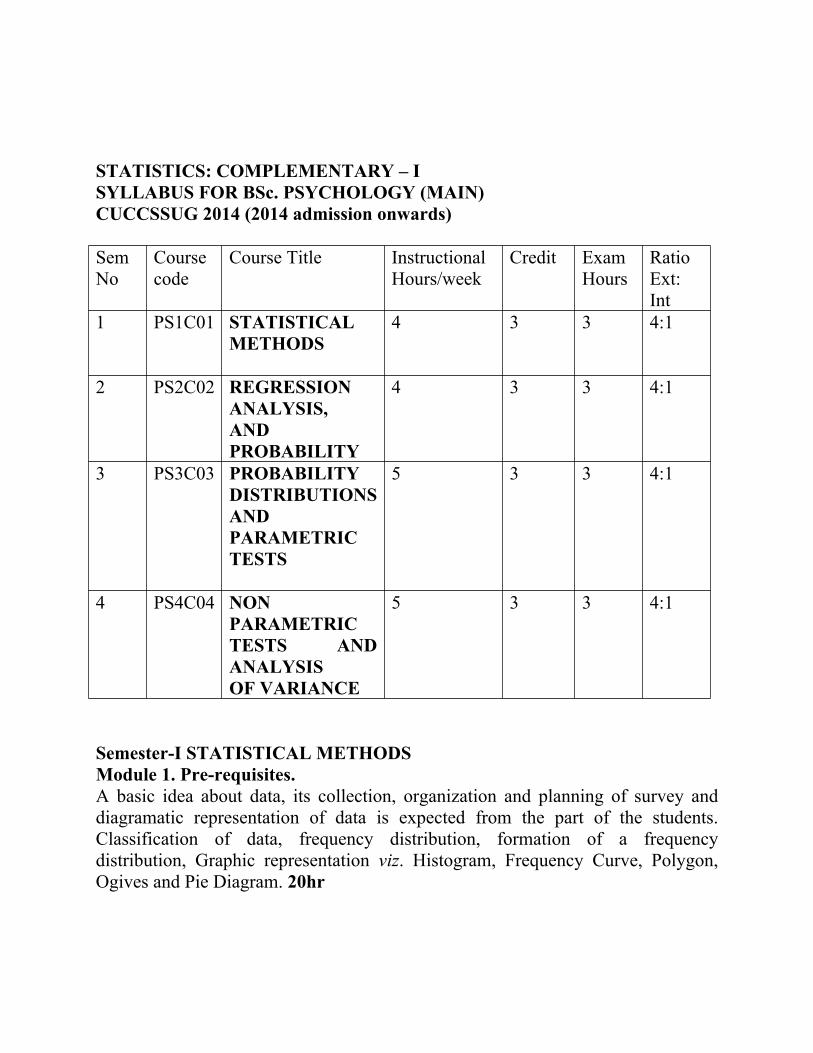
STATISTICS: COMPLEMENTARY – ISYLLABUS FOR BSc. PSYCHOLOGY (MAIN)CUCCSSUG 2014 (2014 admission onwards)
Sem No
Course code
Course Title Instructional Hours/week
Credit Exam Hours
Ratio Ext: Int
1 PS1C01 STATISTICAL METHODS
4 3 3 4:1
2 PS2C02 REGRESSION ANALYSIS,AND PROBABILITY
4 3 3 4:1
3 PS3C03 PROBABILITY DISTRIBUTIONS ANDPARAMETRIC TESTS
5 3 3 4:1
4 PS4C04 NON PARAMETRICTESTS AND ANALYSISOF VARIANCE
5 3 3 4:1
SemesterI STATISTICAL METHODSModule 1. Prerequisites.A basic idea about data, its collection, organization and planning of survey and diagramatic representation of data is expected from the part of the students. Classification of data, frequency distribution, formation of a frequency distribution, Graphic representation viz. Histogram, Frequency Curve, Polygon, Ogives and Pie Diagram. 20hr
Module 2. Measures of Central Tendency. Mean, Median, Mode, Geometric Mean, Harmonic Mean, Combined Mean, Advantages and disadvantages of each average. 20hrs
Module 3. Measures of Dispersion.Range, Quartile Deviation, Mean Deviation, Standard Deviation, Combined Standard Deviation, Percentiles, Deciles, Relative Measures of Dispersion, Coefficient of Variation.Module 4. Skewness and Kurtosis.Pearson’s Coefficient of Skewness, Bowley’s Measure, Percentile Measure of Kurtosis. 16hrs
Books for Study.
1. Gupta, S P (1988). Statistical Methods, Sultan Chand and Sons, New Delhi.2. Gupta, S C and Kapoor, V K (2002). Fundamentals of Applied Statistics, SultanChand and Sons, New Delhi.3. Garret, H E and Woodworth, R S (1996). Statistics in Psychology and Education,Vakila, Feffex and Simens Ltd., Bombay.
COURSE II SEMESTERII
REGRESSION ANALYSIS AND PROBABILITY
Module 1. Correlation and Regression.Meaning, Karl Pearson’s Coefficient of Correlation, Scatter Diagram, Calculation of Correlation From a 2way table, Interpretation of Correlation Coefficient, Rank Correlation,
Module 2. Multiple Correlation and Regression.Partial and Multiple Correlation Coefficients, Multiple Regression Equation, Interpretation of Multiple Regression Coefficients (three variable cases only). 16h
Module 3. Basic Probability.Sets, Union, Intersection, Complement of Sets, Sample Space, Events, Classical, Frequency and Axiomatic Approaches to Probability, Addition and Multiplication Theorems, Independence of Events (Upto three events). 20hrs
Module 4. Random Variables and Their Probability Distributions.Discrete and Continuous Random Variables, Probability Mass Function, Distribution Function of a Discrete Random Variable. 16hrs
Books for Study.
4. Gupta, S P (1988). Statistical Methods, Sultan Chand and Sons, New Delhi.5. Gupta, S C and Kapoor, V K (2002). Fundamentals of Applied Statistics, SultanChand and Sons, New Delhi.6. Garret, H E and Woodworth, R S (1996). Statistics in Psychology and Education,Vakila, Feffex and Simens Ltd., Bombay.
SemesterIII
Course III PROBABILITY DITRIBUTIONS AND PARAMETRIC TESTS
Module 1. Distribution Theory.Binomial, Poisson and Normal Distributions, Mean and Variance (without derivations), Numerical Problems, Fitting, Importance of Normal Distribution, Central Limit Theorem. 25hrs
Module 2. Sampling Theory.Methods of Sampling, Random and Nonrandom Sampling, Simple Random Sampling, Stratified, Systematic and Cluster Sampling. 20hrs
Module 3. Testing of Hypotheses.Fundamentals of Testing, TypeI & TypeII Errors, Critical Region, Level of Significance, Power, pvalue, Tests of Significance. Large Sample Tests – Test of a Single Mean, Equality of Two Means, Test of a Single Proportion, Equality of Two Proportions. 25hrs
Module 4. Small Sample Tests.Test of a Single Mean, Paired and Unpaired tTest, ChiSquare Test of Variance, FTest for the Equality of Variance, Tests of Correlation. 20hrs
Books for Study.
7. Gupta, S P (1988). Statistical Methods, Sultan Chand and Sons, New Delhi.
8. Gupta, S C and Kapoor, V K (2002). Fundamentals of Applied Statistics, SultanChand and Sons, New Delhi.9. Garret, H E and Woodworth, R S (1996). Statistics in Psychology and Education,Vakila, Feffex and Simens Ltd., Bombay.
SemesterIV NON PARAMETRIC TESTS AND ANALYSIS OF VARIANCE
Course IV
Module 1. Chisquare Tests.Chisquare Test of Goodness of Fit, Test of Independence of Attributes, Test of Homogeneity of Proportions. 25hrs
Module 2. NonParametric Tests. Sign Test, Wilcoxen’s Signed Rank Test, Wilcoxen’s Rank Sum Test, Run Test, KrushkalWallis Test. 20hrs
Module 3. Analysis of Variance.Oneway and Twoway Classification with Single Observation Per Cell, Critical Difference. 25hrs
Module 4. Preparation of Questionnaire, Scores and Scales of Measurement, Reliability and Validity of Test Scores. 20hrs
Books for Study.
10. Gupta, S P (1988). Statistical Methods, Sultan Chand and Sons, New Delhi.11. Gupta, S C and Kapoor, V K (2002). Fundamentals of Applied Statistics, SultanChand and Sons, New Delhi.12. Garret, H E and Woodworth, R S (1996). Statistics in Psychology and Education,Vakila, Feffex and Simens Ltd., Bombay.
∞∞∞∞∞∞∞∞∞∞∞∞∞∞UNIVERSITY OF CALICUT
(Model Question Paper)
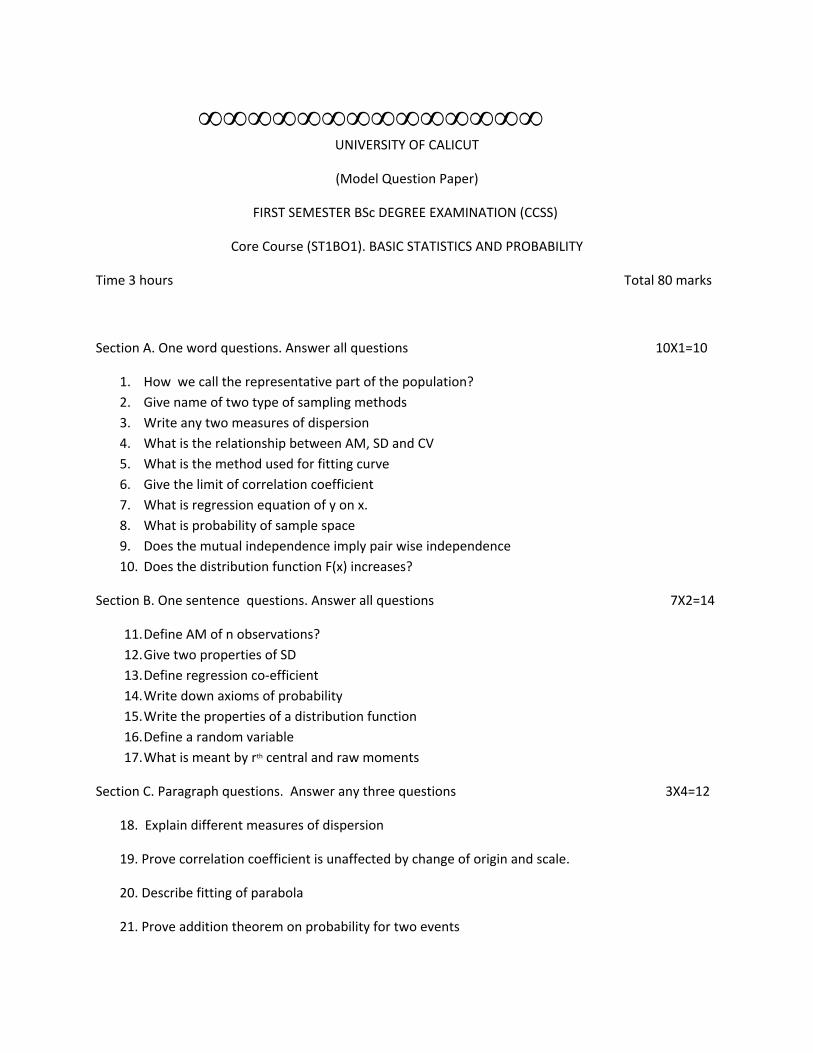
FIRST SEMESTER BSc DEGREE EXAMINATION (CCSS)
Core Course (ST1BO1). BASIC STATISTICS AND PROBABILITY
Time 3 hours Total 80 marks
Section A. One word questions. Answer all questions 10X1=10
1. How we call the representative part of the population?2. Give name of two type of sampling methods3. Write any two measures of dispersion4. What is the relationship between AM, SD and CV5. What is the method used for fitting curve6. Give the limit of correlation coefficient7. What is regression equation of y on x.8. What is probability of sample space9. Does the mutual independence imply pair wise independence10. Does the distribution function F(x) increases?
Section B. One sentence questions. Answer all questions 7X2=14
11.Define AM of n observations?12.Give two properties of SD13.Define regression co‐efficient14.Write down axioms of probability15.Write the properties of a distribution function16.Define a random variable17.What is meant by rth central and raw moments
Section C. Paragraph questions. Answer any three questions 3X4=12
18. Explain different measures of dispersion
19. Prove correlation coefficient is unaffected by change of origin and scale.
20. Describe fitting of parabola
21. Prove addition theorem on probability for two events
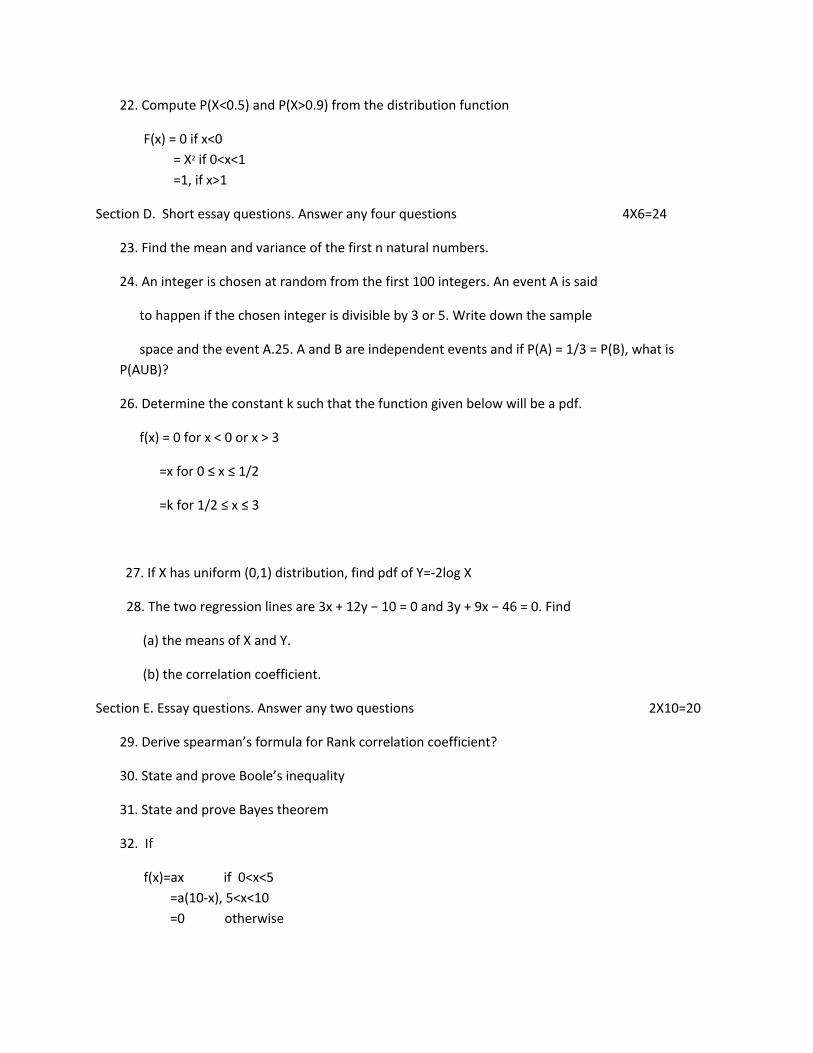
22. Compute P(X<0.5) and P(X>0.9) from the distribution function
F(x) = 0 if x<0 = X2 if 0<x<1 =1, if x>1
Section D. Short essay questions. Answer any four questions 4X6=24
23. Find the mean and variance of the first n natural numbers.
24. An integer is chosen at random from the first 100 integers. An event A is said
to happen if the chosen integer is divisible by 3 or 5. Write down the sample
space and the event A.25. A and B are independent events and if P(A) = 1/3 = P(B), what is P(AUB)?
26. Determine the constant k such that the function given below will be a pdf.
f(x) = 0 for x < 0 or x > 3
=x for 0 ≤ x ≤ 1/2
=k for 1/2 ≤ x ≤ 3
27. If X has uniform (0,1) distribution, find pdf of Y=‐2log X
28. The two regression lines are 3x + 12y − 10 = 0 and 3y + 9x − 46 = 0. Find
(a) the means of X and Y.
(b) the correlation coefficient.
Section E. Essay questions. Answer any two questions 2X10=20
29. Derive spearman’s formula for Rank correlation coefficient?
30. State and prove Boole’s inequality
31. State and prove Bayes theorem
32. If
f(x)=ax if 0<x<5 =a(10‐x), 5<x<10 =0 otherwise
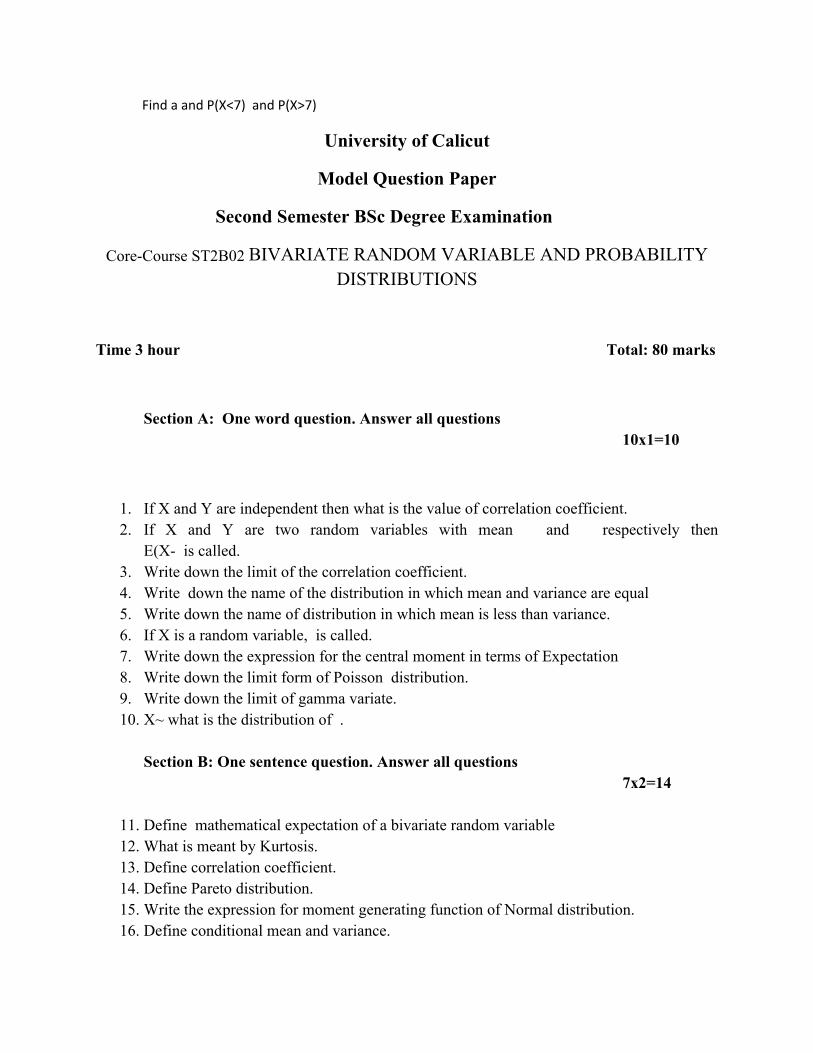
Find a and P(X<7) and P(X>7)
University of Calicut
Model Question Paper
Second Semester BSc Degree Examination
CoreCourse ST2B02 BIVARIATE RANDOM VARIABLE AND PROBABILITY DISTRIBUTIONS
Time 3 hour Total: 80 marks
Section A: One word question. Answer all questions10x1=10
1. If X and Y are independent then what is the value of correlation coefficient.2. If X and Y are two random variables with mean and respectively then
E(X is called.3. Write down the limit of the correlation coefficient.4. Write down the name of the distribution in which mean and variance are equal5. Write down the name of distribution in which mean is less than variance.6. If X is a random variable, is called.7. Write down the expression for the central moment in terms of Expectation8. Write down the limit form of Poisson distribution.9. Write down the limit of gamma variate.10. X~ what is the distribution of .
Section B: One sentence question. Answer all questions7x2=14
11. Define mathematical expectation of a bivariate random variable12. What is meant by Kurtosis.13. Define correlation coefficient.14. Define Pareto distribution.15. Write the expression for moment generating function of Normal distribution.16. Define conditional mean and variance.

17. Define Uniform distribution.
Section C: Paragraph question. Answer any three questions3x4=12
18. Find the moment generating function of Binomial distribution.19. State and prove the additive property of Normal distribution.20. Define Negative binomial distribution. Find its mean.21. Discuss Normal distribution and its properties.22. What is the importance of standard normal variable.
Section D: Short easy questions. Answer any four questions4x6=24
23. If X and Y are independent random variable, show that .
24. If X and Y are independent random variable, show that E(XY)=E(X) E(Y).25. Define Geometric distribution. Find mean and variance. Also explain lack of memory
property.26. Find the moment generating function of Negative binomial distribution.27. Explain lognormal distribution. Find the mean and variance.28. Find the mode of Poisson distribution.
Section E: Essay question. Answer any two questions2x10=20
29. Define Bivariate joint normal distribution. Find the marginal pdf. Show that if, then X and Y are independent.
30. Define Bivariate moments and conditional variance. Show that .31. Define binomial distribution. Show that under certain conditions(to be satisfied) binomial
distribution tends to Poisson distribution.32. Explain Gamma distribution. Find the moment generating function. State and prove
additive property.
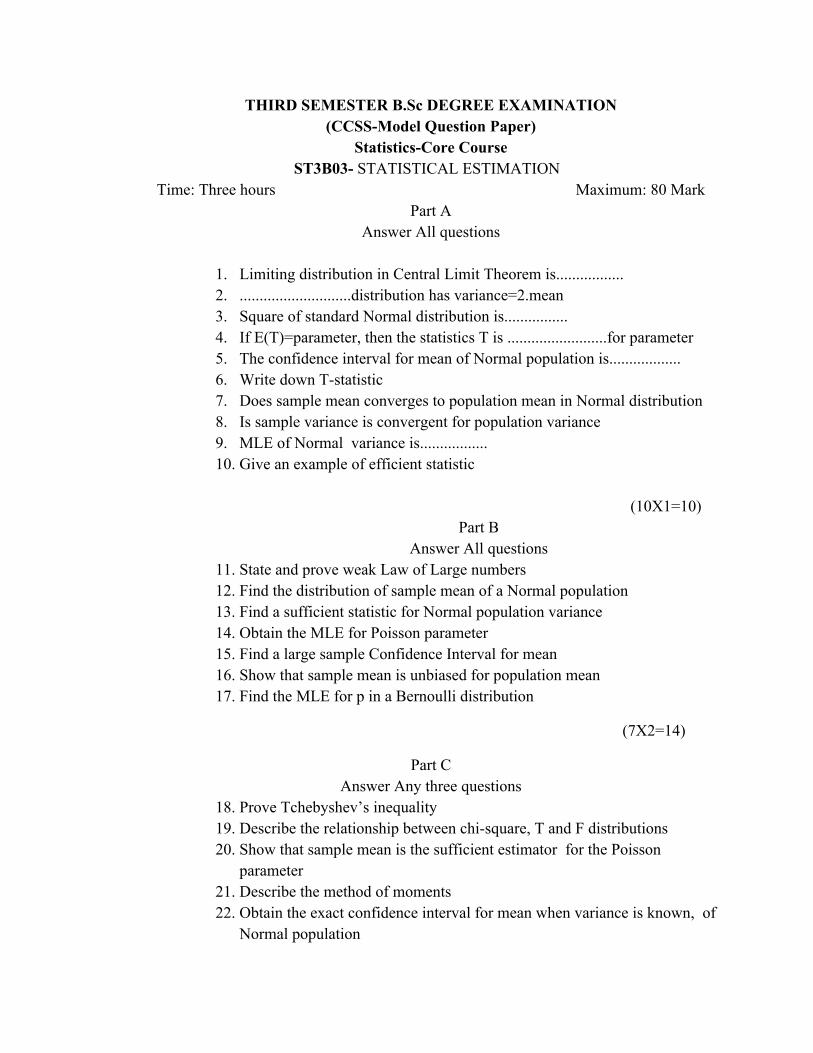
THIRD SEMESTER B.Sc DEGREE EXAMINATION(CCSSModel Question Paper)
StatisticsCore CourseST3B03 STATISTICAL ESTIMATION
Time: Three hours Maximum: 80 MarkPart A
Answer All questions
1. Limiting distribution in Central Limit Theorem is.................2. ............................distribution has variance=2.mean3. Square of standard Normal distribution is................4. If E(T)=parameter, then the statistics T is .........................for parameter5. The confidence interval for mean of Normal population is..................6. Write down Tstatistic7. Does sample mean converges to population mean in Normal distribution8. Is sample variance is convergent for population variance9. MLE of Normal variance is.................10. Give an example of efficient statistic
(10X1=10)
Part BAnswer All questions
11. State and prove weak Law of Large numbers12. Find the distribution of sample mean of a Normal population13. Find a sufficient statistic for Normal population variance14. Obtain the MLE for Poisson parameter15. Find a large sample Confidence Interval for mean 16. Show that sample mean is unbiased for population mean 17. Find the MLE for p in a Bernoulli distribution
(7X2=14)
Part CAnswer Any three questions
18. Prove Tchebyshev’s inequality19. Describe the relationship between chisquare, T and F distributions20. Show that sample mean is the sufficient estimator for the Poisson
parameter21. Describe the method of moments22. Obtain the exact confidence interval for mean when variance is known, of
Normal population
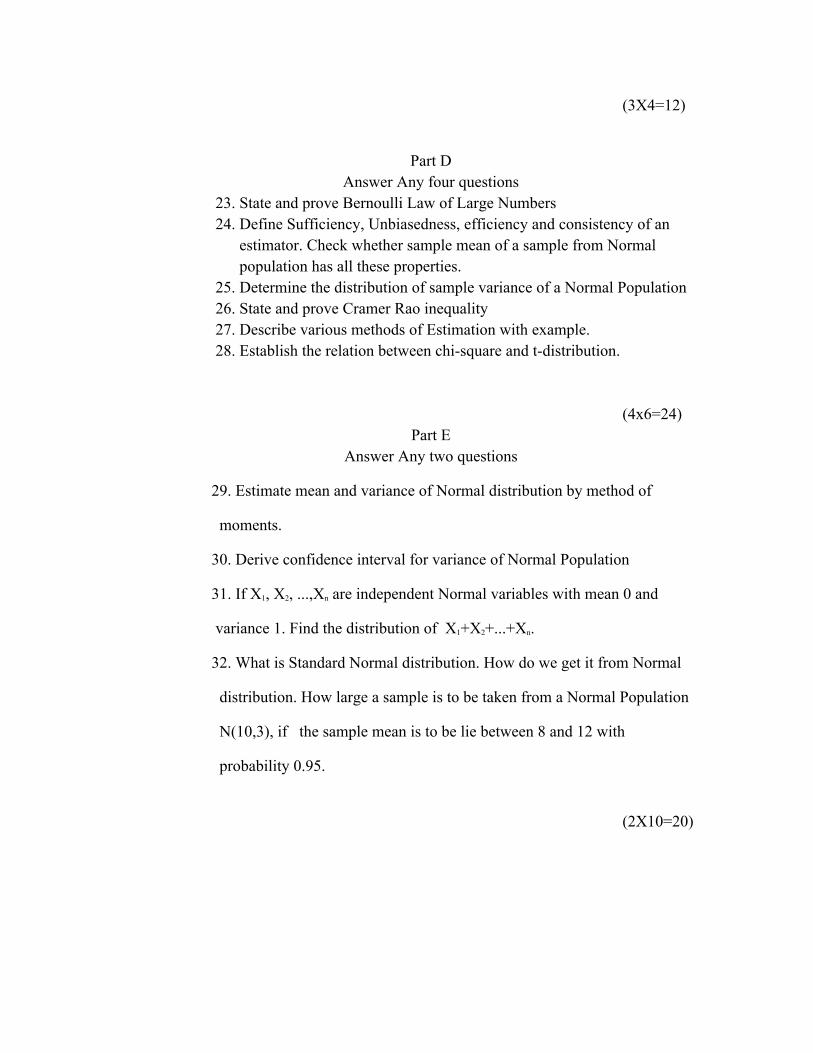
(3X4=12)
Part DAnswer Any four questions
23. State and prove Bernoulli Law of Large Numbers24. Define Sufficiency, Unbiasedness, efficiency and consistency of an
estimator. Check whether sample mean of a sample from Normal population has all these properties.
25. Determine the distribution of sample variance of a Normal Population26. State and prove Cramer Rao inequality27. Describe various methods of Estimation with example.28. Establish the relation between chisquare and tdistribution.
(4x6=24)Part E
Answer Any two questions
29. Estimate mean and variance of Normal distribution by method of
moments.
30. Derive confidence interval for variance of Normal Population
31. If X1, X2, ...,Xn are independent Normal variables with mean 0 and
variance 1. Find the distribution of X1+X2+...+Xn.
32. What is Standard Normal distribution. How do we get it from Normal
distribution. How large a sample is to be taken from a Normal Population
N(10,3), if the sample mean is to be lie between 8 and 12 with
probability 0.95.
(2X10=20)
FOURTH SEMESTER B.Sc DEGREE EXAMINATION(CCSSModel Question Paper)
StatisticsCore CourseST4B04 TESTING OF HYPOTHESIS
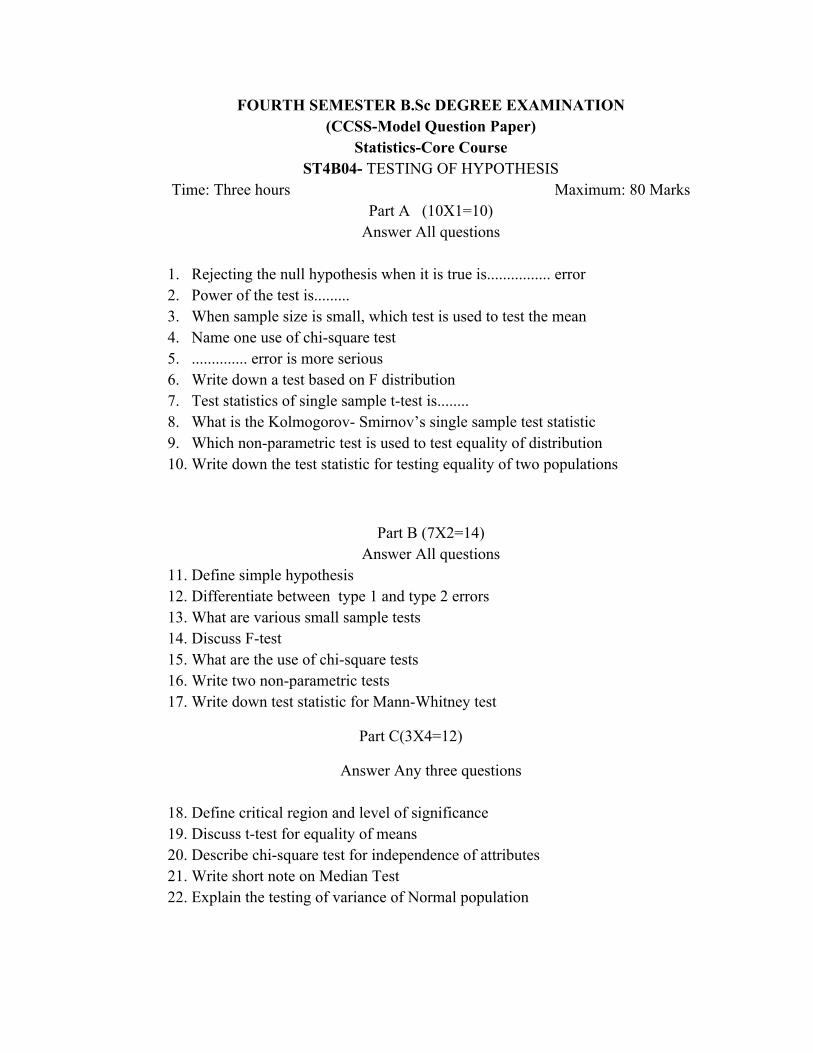
Time: Three hours Maximum: 80 MarksPart A (10X1=10)Answer All questions
1. Rejecting the null hypothesis when it is true is................ error2. Power of the test is.........3. When sample size is small, which test is used to test the mean4. Name one use of chisquare test5. .............. error is more serious6. Write down a test based on F distribution7. Test statistics of single sample ttest is........8. What is the Kolmogorov Smirnov’s single sample test statistic9. Which nonparametric test is used to test equality of distribution10. Write down the test statistic for testing equality of two populations
Part B (7X2=14)Answer All questions
11. Define simple hypothesis12. Differentiate between type 1 and type 2 errors13. What are various small sample tests14. Discuss Ftest15. What are the use of chisquare tests16. Write two nonparametric tests17. Write down test statistic for MannWhitney test
Part C(3X4=12)
Answer Any three questions
18. Define critical region and level of significance19. Discuss ttest for equality of means20. Describe chisquare test for independence of attributes21. Write short note on Median Test22. Explain the testing of variance of Normal population
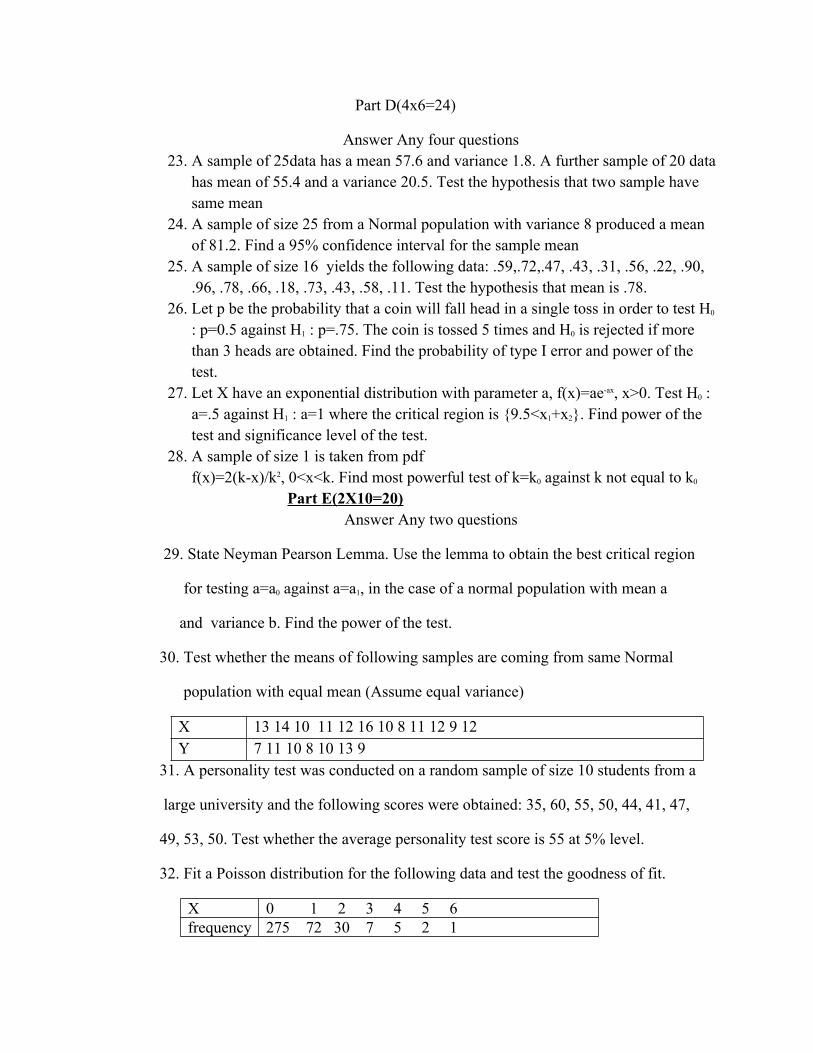
Part D(4x6=24)
Answer Any four questions23. A sample of 25data has a mean 57.6 and variance 1.8. A further sample of 20 data
has mean of 55.4 and a variance 20.5. Test the hypothesis that two sample have same mean
24. A sample of size 25 from a Normal population with variance 8 produced a mean of 81.2. Find a 95% confidence interval for the sample mean
25. A sample of size 16 yields the following data: .59,.72,.47, .43, .31, .56, .22, .90, .96, .78, .66, .18, .73, .43, .58, .11. Test the hypothesis that mean is .78.
26. Let p be the probability that a coin will fall head in a single toss in order to test H0 : p=0.5 against H1 : p=.75. The coin is tossed 5 times and H0 is rejected if more than 3 heads are obtained. Find the probability of type I error and power of the test.
27. Let X have an exponential distribution with parameter a, f(x)=aeax, x>0. Test H0 : a=.5 against H1 : a=1 where the critical region is 9.5<x1+x2. Find power of the test and significance level of the test.
28. A sample of size 1 is taken from pdf f(x)=2(kx)/k2, 0<x<k. Find most powerful test of k=k0 against k not equal to k0
Part E(2X10=20)Answer Any two questions
29. State Neyman Pearson Lemma. Use the lemma to obtain the best critical region
for testing a=a0 against a=a1, in the case of a normal population with mean a
and variance b. Find the power of the test.
30. Test whether the means of following samples are coming from same Normal
population with equal mean (Assume equal variance)
X 13 14 10 11 12 16 10 8 11 12 9 12Y 7 11 10 8 10 13 9
31. A personality test was conducted on a random sample of size 10 students from a
large university and the following scores were obtained: 35, 60, 55, 50, 44, 41, 47,
49, 53, 50. Test whether the average personality test score is 55 at 5% level.
32. Fit a Poisson distribution for the following data and test the goodness of fit. X 0 1 2 3 4 5 6frequency 275 72 30 7 5 2 1
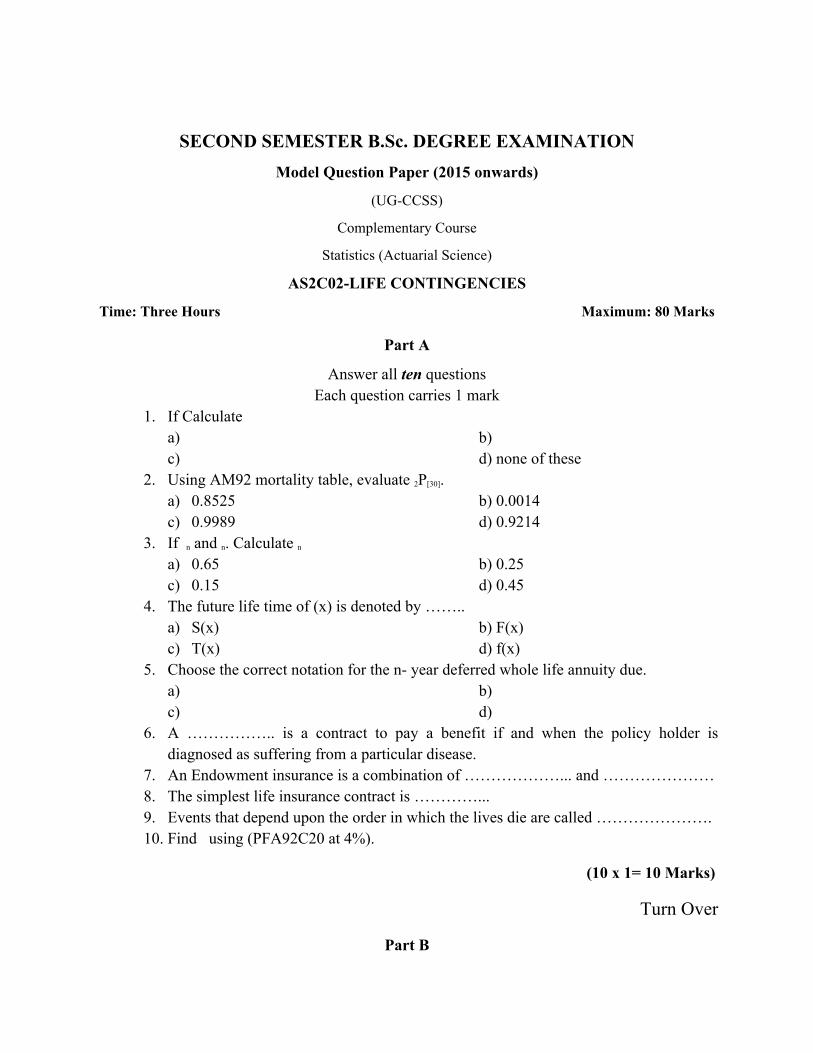
SECOND SEMESTER B.Sc. DEGREE EXAMINATIONModel Question Paper (2015 onwards)
(UGCCSS)
Complementary Course
Statistics (Actuarial Science)
AS2C02LIFE CONTINGENCIES
Time: Three Hours Maximum: 80 Marks
Part A
Answer all ten questionsEach question carries 1 mark
1. If Calculate a) b) c) d) none of these
2. Using AM92 mortality table, evaluate 2P[30].a) 0.8525 b) 0.0014c) 0.9989 d) 0.9214
3. If n and n. Calculate na) 0.65 b) 0.25c) 0.15 d) 0.45
4. The future life time of (x) is denoted by ……..a) S(x) b) F(x)c) T(x) d) f(x)
5. Choose the correct notation for the n year deferred whole life annuity due.a) b) c) d)
6. A …………….. is a contract to pay a benefit if and when the policy holder is diagnosed as suffering from a particular disease.
7. An Endowment insurance is a combination of ………………... and …………………8. The simplest life insurance contract is …………...9. Events that depend upon the order in which the lives die are called ………………….10. Find using (PFA92C20 at 4%).
(10 x 1= 10 Marks)
Turn Over
Part B
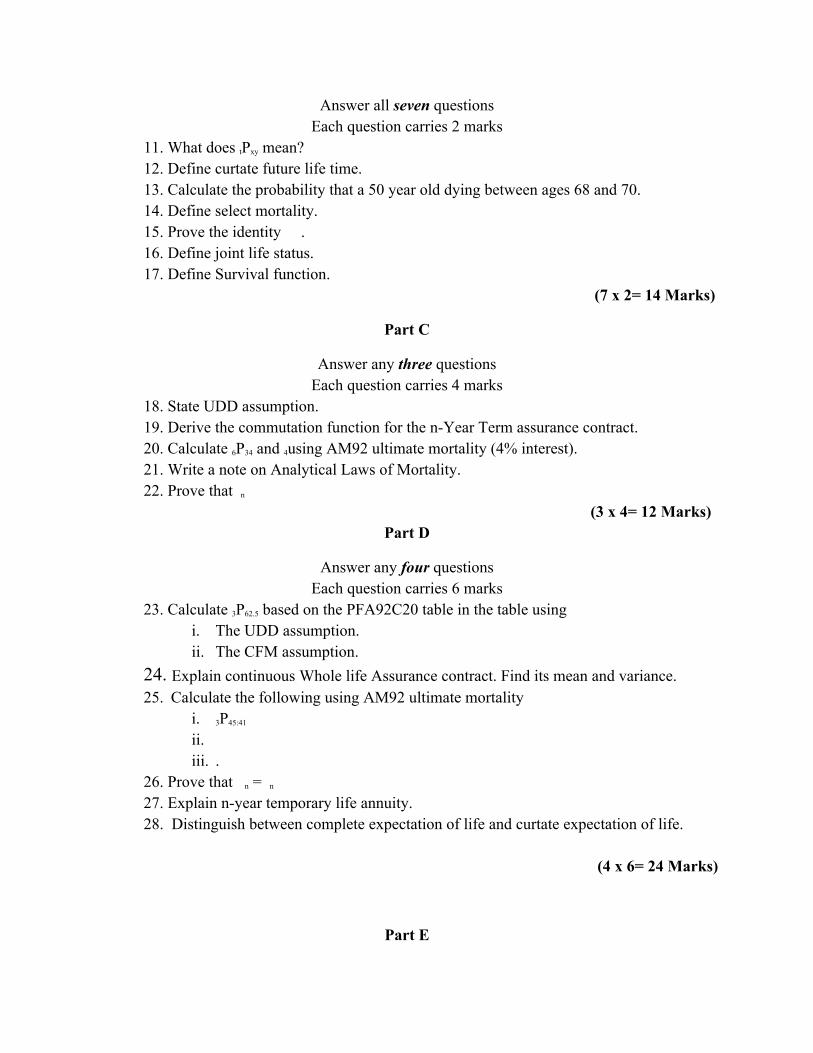
Answer all seven questionsEach question carries 2 marks
11. What does tPxy mean?12. Define curtate future life time.13. Calculate the probability that a 50 year old dying between ages 68 and 70.14. Define select mortality.15. Prove the identity .16. Define joint life status.17. Define Survival function.
(7 x 2= 14 Marks)
Part C
Answer any three questionsEach question carries 4 marks
18. State UDD assumption.19. Derive the commutation function for the nYear Term assurance contract.20. Calculate 6P34 and 4using AM92 ultimate mortality (4% interest).21. Write a note on Analytical Laws of Mortality.22. Prove that n
(3 x 4= 12 Marks)Part D
Answer any four questionsEach question carries 6 marks
23. Calculate 3P62.5 based on the PFA92C20 table in the table usingi. The UDD assumption.ii. The CFM assumption.
24. Explain continuous Whole life Assurance contract. Find its mean and variance.25. Calculate the following using AM92 ultimate mortality
i. 3P45:41
ii.iii. .
26. Prove that n = n27. Explain nyear temporary life annuity.28. Distinguish between complete expectation of life and curtate expectation of life.
(4 x 6= 24 Marks)
Part E
Answer any two questionsEach question carries 10 marks
29. Explain n year Endowment Assurance contract. Find its Mean and Variance.30. Derive the relationship between Insurance payable at the moment of death and the
end of the year of death.31. A life insurance company issues a joint life annuity to a male, aged 68, and female,
aged 65. The annuity of Rs.10000 per annum is payable annually in arrears and continues until both lives have died. The Insurance company values this benefits using PFA92C20 mortality (males or females as appropriate) and 4% p.a. interest.i. Calculate the expected present value of this annuity.ii. Derive an expression for the variance of the present of this annuity in terms of
appropriate single and jointlife assurance functions.32. Explain the following :
a) Present values of joint life and last survivor assurance.b) Present values of joint life and last survivor annuities.
(2 x 10= 20 Marks)
THIRD SEMESTER B.Sc. DEGREE EXAMINATIONModel Question Paper (2015 onwards)
(UGCCSS)
Complementary Course
Statistics (Actuarial Science)
AS3C03LIFE CONTINGENCIES AND PRINCIPLES OF INSURANCE
Time: Three Hours Maximum: 80 Marks
Part A
Answer all ten questionsEach question carries 1 mark
33.The cause that produces loss is known as ………..b) Hazard b) Perilc) Risk d) none of these
34.Which of the following represents a risk seeking investor with respective the utility function U(w).b) U’(w) >0 b) U”(w)<0c) U”(w)>0 d) U”(w)=0
35.Calculate , if nVx=0.080, =0.024 and b) 0.08 b) 0.008c) 0.08 d) 0.008
36.Premiums are always paid in …………….37.……………. contract, under which benefits are paid for by a single lump sum
premium paid at the time the contract is affected.38.The contingent payment linked to the amount of loss is called….39.Write down the form of log utility function.40.The net premium is also called……..41.The amount of money that the insurer sets aside to meet future liabilities is …42.Write down the premium equation of h –payment whole life insurance
(10 x 1= 10 Marks)
Turn Over
Part B
Answer all seven questions
Each question carries 2 marks43.Define pecuniary loss. 44.Define Apportionable premiums.45.Define exponential utility function.46.What you meant by a risk neutral investor?47.Define Prospective reserve.48.Define Aviation insurance.49.What is valuation of the policy?
(7 x 2= 14 Marks)
Part C
Answer any three questionsEach question carries 4 marks
50.Explain utility theory.51.Explain motor insurance.52.A 10year term assurance with a sum assured of £500,000 payable at the end
of the year of death, is issued to a male aged 30 for a level annual premium of £330.05. Calculate the prospective reserve at the end of the fifth year, ie just before the sixth premium has been paid, assuming AM92 Ultimate mortality and 4% pa interest.
53.Calculate the annual premium for a term assurance with a term of 10 years to a male aged 30, with a sum assured of Rs.500000, assuming AM92 ultimate mortality and interest of 4% p.a. Assume that the death benefit is payble at the end of the year of death.
54.Explain why the insurer holds reserve?
(3 x 4= 12 Marks)Part D
Answer any four questionsEach question carries 6 marks
55.Distinguish between Life Insurance and General Insurance.56.Briefly explain Fire Insurance and Marine Insurance.57. Explain benefit reserve under fully continuous Whole life Insurance.58.Explain nyear temporary life annuity.59.State and prove Jensen’s Inequalities.60.Consider a multiple decrement model with two causes of decrement, the
forces of decrement are given by
Obtain expression fora) b) c)
.(4 x 6= 24 Marks)
Part E
Answer any two questionsEach question carries 10 marks
61.State and explain Thieles differential equation.62.Explain the following:
(i) Premium under n year deferred whole life annuity.(ii) Premium under nyear endowment insurance.
63. Explain the various multiple decrement models.64. a) Briefly explain the history of insurance India.
b) Briefly explain Liability insurance.
(2 x 10= 20 Marks)
FOURTH SEMESTER B.Sc. DEGREE EXAMINATIONModel Question Paper (2015 onwards)
(UGCCSS)
Complementary Course
Statistics (Actuarial Science)
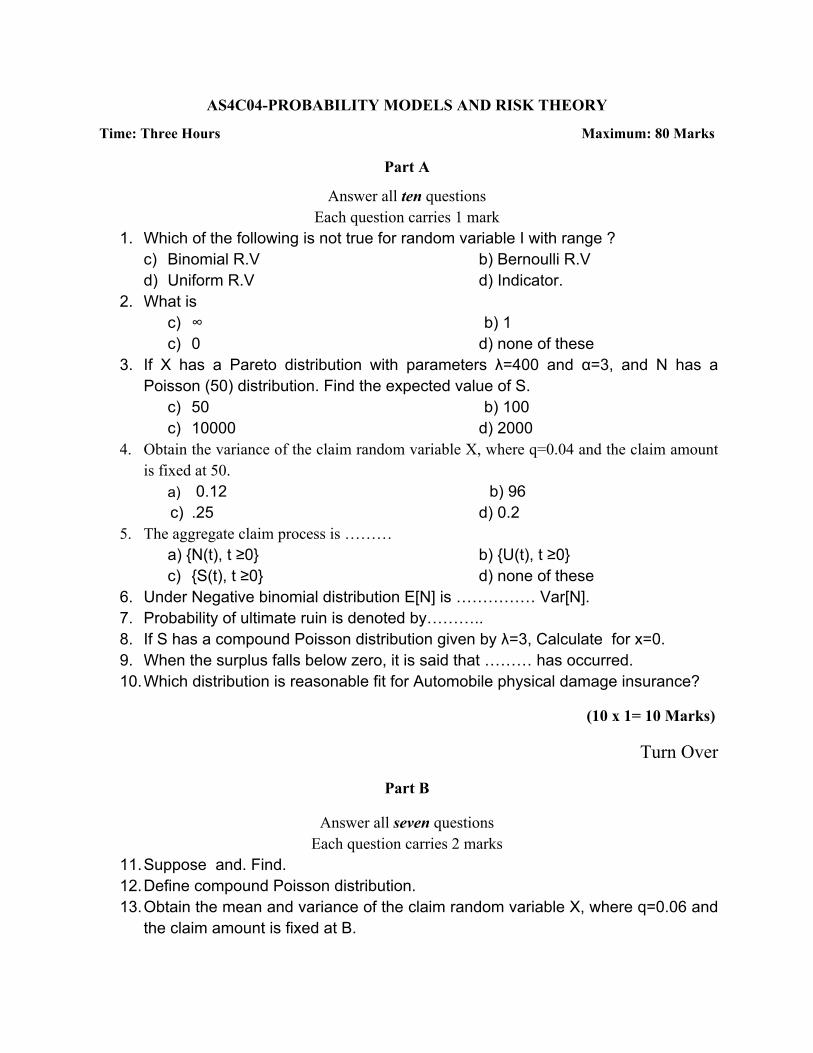
AS4C04PROBABILITY MODELS AND RISK THEORY
Time: Three Hours Maximum: 80 Marks
Part A
Answer all ten questionsEach question carries 1 mark
1. Which of the following is not true for random variable I with range ?c) Binomial R.V b) Bernoulli R.V d) Uniform R.V d) Indicator.
2. What is c) ∞ b) 1c) 0 d) none of these
3. If X has a Pareto distribution with parameters λ=400 and α=3, and N has a Poisson (50) distribution. Find the expected value of S.
c) 50 b) 100c) 10000 d) 2000
4. Obtain the variance of the claim random variable X, where q=0.04 and the claim amount is fixed at 50.
a) 0.12 b) 96 c) .25 d) 0.2
5. The aggregate claim process is ……… a) N(t), t ≥0 b) U(t), t ≥0
c) S(t), t ≥0 d) none of these6. Under Negative binomial distribution E[N] is …………… Var[N].7. Probability of ultimate ruin is denoted by………..8. If S has a compound Poisson distribution given by λ=3, Calculate for x=0.9. When the surplus falls below zero, it is said that ……… has occurred.10.Which distribution is reasonable fit for Automobile physical damage insurance?
(10 x 1= 10 Marks)
Turn Over
Part B
Answer all seven questionsEach question carries 2 marks
11.Suppose and. Find.12.Define compound Poisson distribution.13.Obtain the mean and variance of the claim random variable X, where q=0.06 and
the claim amount is fixed at B.
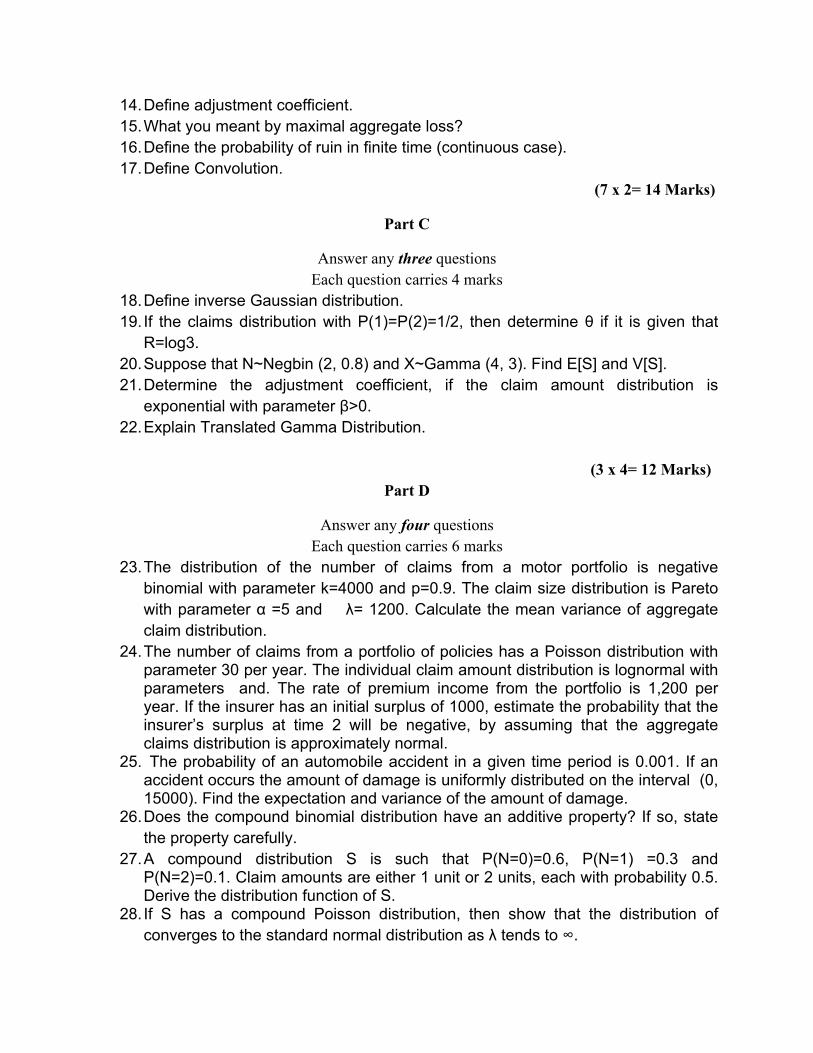
14.Define adjustment coefficient.15.What you meant by maximal aggregate loss?16.Define the probability of ruin in finite time (continuous case).17.Define Convolution.
(7 x 2= 14 Marks)
Part C
Answer any three questionsEach question carries 4 marks
18.Define inverse Gaussian distribution.19. If the claims distribution with P(1)=P(2)=1/2, then determine θ if it is given that
R=log3.20.Suppose that N~Negbin (2, 0.8) and X~Gamma (4, 3). Find E[S] and V[S].21.Determine the adjustment coefficient, if the claim amount distribution is
exponential with parameter β>0.22.Explain Translated Gamma Distribution.
(3 x 4= 12 Marks)Part D
Answer any four questionsEach question carries 6 marks
23.The distribution of the number of claims from a motor portfolio is negative binomial with parameter k=4000 and p=0.9. The claim size distribution is Pareto with parameter α =5 and λ= 1200. Calculate the mean variance of aggregate claim distribution.
24.The number of claims from a portfolio of policies has a Poisson distribution with parameter 30 per year. The individual claim amount distribution is lognormal with parameters and. The rate of premium income from the portfolio is 1,200 per year. If the insurer has an initial surplus of 1000, estimate the probability that the insurer’s surplus at time 2 will be negative, by assuming that the aggregate claims distribution is approximately normal.
25. The probability of an automobile accident in a given time period is 0.001. If an accident occurs the amount of damage is uniformly distributed on the interval (0, 15000). Find the expectation and variance of the amount of damage.
26.Does the compound binomial distribution have an additive property? If so, state the property carefully.
27.A compound distribution S is such that P(N=0)=0.6, P(N=1) =0.3 and P(N=2)=0.1. Claim amounts are either 1 unit or 2 units, each with probability 0.5. Derive the distribution function of S.
28. If S has a compound Poisson distribution, then show that the distribution of converges to the standard normal distribution as λ tends to ∞.
.(4 x 6= 24 Marks)
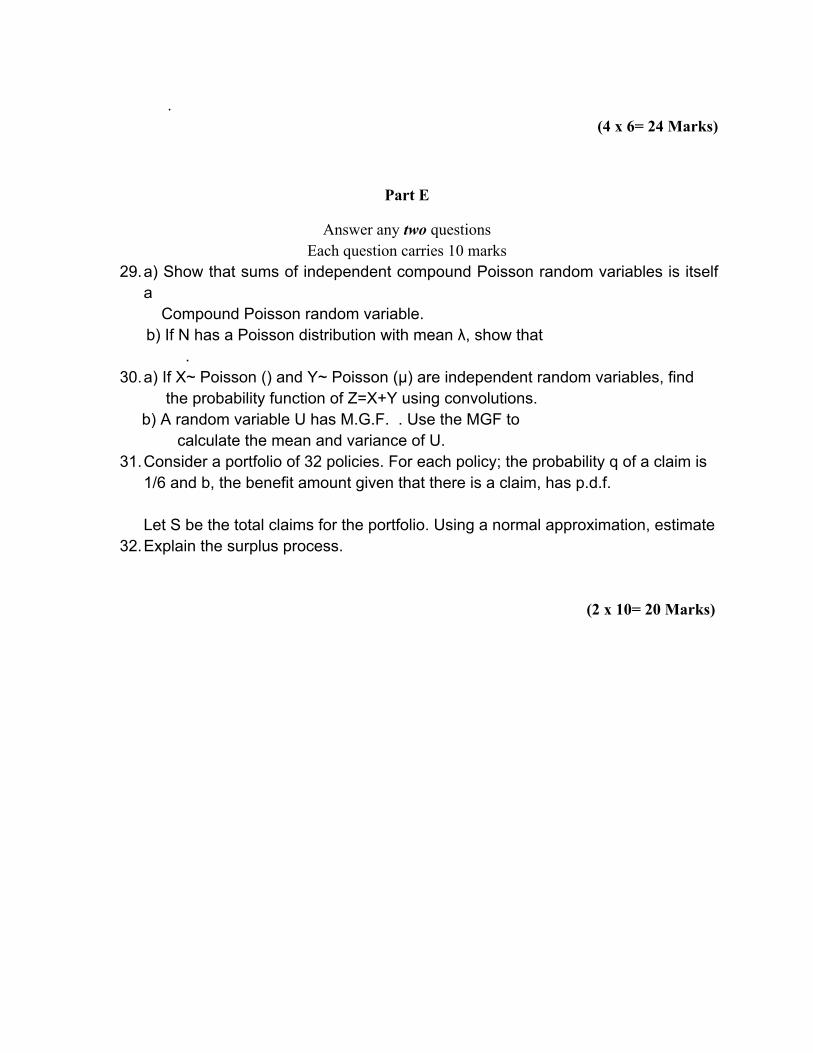
Part E
Answer any two questionsEach question carries 10 marks
29.a) Show that sums of independent compound Poisson random variables is itself a Compound Poisson random variable.
b) If N has a Poisson distribution with mean λ, show that .
30.a) If X~ Poisson () and Y~ Poisson (µ) are independent random variables, find the probability function of Z=X+Y using convolutions.
b) A random variable U has M.G.F. . Use the MGF to calculate the mean and variance of U.31.Consider a portfolio of 32 policies. For each policy; the probability q of a claim is
1/6 and b, the benefit amount given that there is a claim, has p.d.f.
Let S be the total claims for the portfolio. Using a normal approximation, estimate 32.Explain the surplus process.
(2 x 10= 20 Marks)