Embed Size (px)
Citation preview

Manual for the Cell Biology practicals and workshops Page 1
BSC IN MEDICINE
2013-2014
Block 1.1: Fundamentals of Medicine
Authors:
Prof. N.A. Bos and Dr D. Opstelten
Cell Biology Discipline Group
Faculty of Medical Sciences
University of Groningen
MANUAL
for the
CELL BIOLOGY PRACTICALS AND
WORKSHOPS

Manual for the Cell Biology practicals and workshops Page 2
Table of Contents
Activity Subject Page
Practical
Microscopic examination of blood cells 3
Workshop
Nanotomy and diabetes 17
Workshop
Protein synthesis 32
Workshop
Energy metabolism 45
Workshop
Pathology 53
Workshop
Cell division and DNA analysis 57
The following sources of information can be used during the workshops to supplement
this manual:
Digital material: Celweb
http://www.rug.nl/umcg/onderwijs/nestor/celweb
or:
via Nestor, Block 1.1,
Fundamentals of Medicine/Workshops
All assignments can be found on the web, which also contains colour versions of the
illustrations in this manual. Celweb also contains the answers to the questions in this manual.
These will be made available after a workshop has ended.
Printed material:
Your own copies of Alberts et al., Essential Cell Biology, Kerr, Functional Histology and
Jorde et al., Medical Genetics. Make sure you bring these textbooks to every workshop.

Manual for the Cell Biology practicals and workshops Page 3
Cells Practical : Blood cells Part of Block 1.1, Fundamentals of Medicine
Foreword
In these Cell Biology Workshops, you will actively study the material. You will learn to use
the microscope to make close observations, to interpret what you see and to solve problems.
The learning objectives of each practical and workshop are listed in this manual. For you to
achieve these objectives, it is vital that you prepare for each workshop. Microscopy and
discussions with fellow students and supervisors will be your main learning tools. The first
practical is compulsory because it is vital that you learn to use the microscope correctly. The
other workshops are not compulsory. The skills obtained during the practical assignments in
the workshops will be assessed in the Cells practical test. To obtain a pass for this block, you
must pass this practical test. If the pace of a workshop is too fast for you, you can complete
some of the assignments – those for which you do not have to work with the microscope –
after the workshop. Answers to questions and explanations of problems will be published on
Nestor after each practical and workshop. We hope you will enjoy the work you will do for
these workshops.
In addition to this manual, you will have access to other learning sources, which are offered
in various forms.
Digital material: http://www.rug.nl/med/onderwijs/nestor/index:
Go to: Celweb, practicals for students of Medicine
http://www.rug.nl/umcg/onderwijs/nestor/celweb/index
Printed material:
Your own copies of Alberts et al., Essential Cell Biology and Kerr, Functional Histology.
Make sure you bring these textbooks to the practical.
Cells practical: learning objectives
Students will learn to
1. adequately use the light microscope to observe cells at magnifications up to 1000x
2. use the light microscope to recognize types of blood cells in a blood smear
3. develop a systematic approach to counting cell types in a specimen
4. correctly use the concept of ‘normal range’ within the context of diagnostics
5. relate morphological characteristics of the various types of blood cells to their functions
6. explain the principles of tissue preparation for light microscopy
7. derive information about cellular or subcellular components from colours and patterns in
tissue sections or images of such sections (‘interpreting’ images)
8. make a scientific drawing
Assessment
1, 3, 7 and 8: by the supervisor or assistant during the practical
5: self-test on Nestor
2.4, 6: items in the written test, some of which will be based on images

Manual for the Cell Biology practicals and workshops Page 4
Assignm
ent
Page Content
1 4 Reading the information about the principles of the light microscope
2 6 Adjusting and focusing the microscope
3 8 Recognizing the various types of white blood cells
4 8 Performing a differential count of white blood cells
5 9 Answering the questions about the results and taking the quiz
6 10 Studying the information about staining methods and the accompanying
tables
7 13 Observing and drawing basophil and eosinophil granulocytes stained
with May-Grunwald/Giemsa and answering the questions
You must prepare for assignment 6 and part of assignment 1*. Assignment 5 may be
completed after the practical.
For a proper use of the microscope, you must have some idea of the relevance and function of
its main parts.
* It is assumed that you do not know how to work with a microscope. If you do, continue
with assignment 1 at your own pace.
Assignment 1: Carefully read the following background information about the principles
of light microscopy while referring to the actual microscope. Look at the illustration for
the position of the various parts of the microscope.
Light
The microscopes used in this practical have a light source built into the base, the light of
which shines through the specimen from underneath the slide.
Condenser
The condenser transforms the parallel light from the ‘infinite focus’ light source into a cone-
shaped beam of light. The slide must be situated in the top focus of the condenser. The
condenser is fixed at its highest position.
Objectives and numerical aperture
The beam of light from the condenser illuminates a small area of the slide. This cone-shaped
beam will exit the slide in reverse and is received by the objective. The largest cone of light
that an objective can receive is stated on the objective as the numerical aperture (sin ½ angle
of maximum cone of light). The numerical aperture is the most important parameter of an
objective lens. The larger the aperture, the larger the resolving power (the minimum distance
between distinguishable objects).

Manual for the Cell Biology practicals and workshops Page 5
Ocular lens (eyepiece)
The upper limit of magnification (objective x ocular lens) is determined by the numerical
aperture of the objective. Usually, this limit is given as 1000 x the numerical aperture. So an
objective with a numerical aperture of 0.65 has an upper limit of magnification of 650x. If
this objective has a magnification of 40, this means that the eyepiece can have a
magnification of around 16x at most (16 x 40 = 640). A higher power eyepiece will result in
deterioration of the image and loss of focus. In practice, a 10x eyepiece is suited to nearly all
purposes.
Diaphragm
Visibility of a normally stained slide is best when the cone of light from the condenser is
almost the same size as the maximum cone of light the objective can receive. This is the case
when 80 to 90 percent of the lens’s numerical aperture is used. If the aperture of the
diaphragm is increased further, the cone of light will be too large and reflected light will enter
the objective, which will make the image appear fuzzy. If the aperture is reduced too much,
the image seems sharper, that is, more details seem to appear, but these are actually artefacts
produced by light-bending phenomena.
There are two methods for setting the proper diaphragm aperture.
1. Take the eyepiece off the eyepiece tube. Near the bottom of the tube, you can see where
the diaphragm opens and closes, letting in more or less light. First close the diaphragm
completely and then open it to such an extent that the resulting opening is almost as large
as the objective opening.
2. Focus on a slide until the image is sharp. Then close the diaphragm to such an extent that
the image clearly deteriorates and open it again slightly until the image becomes sharp
again. This will achieve the optimum compromise between depth of focus, contrast and
imaging.
Oil immersion
In a system of lenses with air/glass boundaries, the aperture of the cone of light and the
objective can never exceed 1 due to the angle of total reflection at the air/glass boundary. By
using immersion oil – which has a similar refractive index as glass – between the slide and
the front lens of the objective, the aperture can be increased to around 1.3. Note that this
cannot be done with normal objectives. Special oil immersion objectives must be used for
this purpose. When working with such objectives, the diaphragm must be fully open.
General guidelines
1. Only put a slide under the microscope when the low-power objective (4x) is in position.
This also applies to slide removal. The higher power objectives (10x, 40x and 100x) have
very short working distances, which means it is easy to damage or soil their front lenses.
Focus on the specimen with the 4x objective before switching to a higher power
objective.
2. Avoid touching the front lenses. If necessary, clean them with a soft cotton cloth (clean
handkerchief) or lens paper, either dry or with a diluted solution of synthetic soap.
3. Keep adjusting the micrometer to bring the entire thickness of the specimen into focus.
4. Relax your eyes; in other words, do not try to accommodate – imagine that you are
looking into the far distance. Adjust the eyepieces of a binocular microscope until you see
a single image when looking with both eyes. (See also assignment 2)

Manual for the Cell Biology practicals and workshops Page 6
Assignment 2: Adjusting and focusing the microscope
I. Optimum distance between two eyepieces of a binocular microscope
1. Check whether you can move the eyepiece tube. If so, tighten the clamping screw.
2. Ensure maximum illumination.
3. Fully open the diaphragm with the handle under the stage. The condenser will then be
brightly lit.
4. Turn the scale on the left eye piece to zero.
5. Adjust the distance between the eyepieces until you see a single, wide and uniformly lit
area.
WRITE DOWN THE DISTANCE BETWEEN THE TWO EYEPIECES.
INTERPUPILLARY DISTANCE = …………
II. Observation of specimens
1. Rotate the nosepiece to bring the low-power objective (4x) into position.
2. Place a tissue section slide on the stage and move the stage with the stage motion knobs
to position the slide in the light.
3. Locate the specimen with the coarse adjustment knobs and focus with the fine adjustment
knob (=micrometer).
4. Rotate the 10x objective into position and focus. Use this objective to broadly examine
the specimen. Examine interesting sites in more detail with the 40x objective and then go
back to the 10x objective. Use the micrometer constantly to focus on various depth levels
of the specimen. Only remove the slide after rotating the 4x objective into position again.
5. The image may be out of focus when you are using both eyes. Perhaps the acuity of your
right and left eyes is not the same. In that case, focus with your right eye with the left eye
closed. Then close your right eye and focus the image by turning the left eyepiece.
THE POSITION OF THE LEFT EYEPIECE = ……
N.B. Do not accommodate; try to relax both eyes. Use the micrometer to focus, not your
eyes.
6. For proper illumination of the slide, the diaphragm must have the proper aperture (see
‘Diaphragm’ above).
7. Immersion oil must be used with the 100x objective (see ‘Oil immersion’ above and
assignment 7 below).

Manual for the Cell Biology practicals and workshops Page 7
Manual for the Cell Biology practicals and workshops Page 8
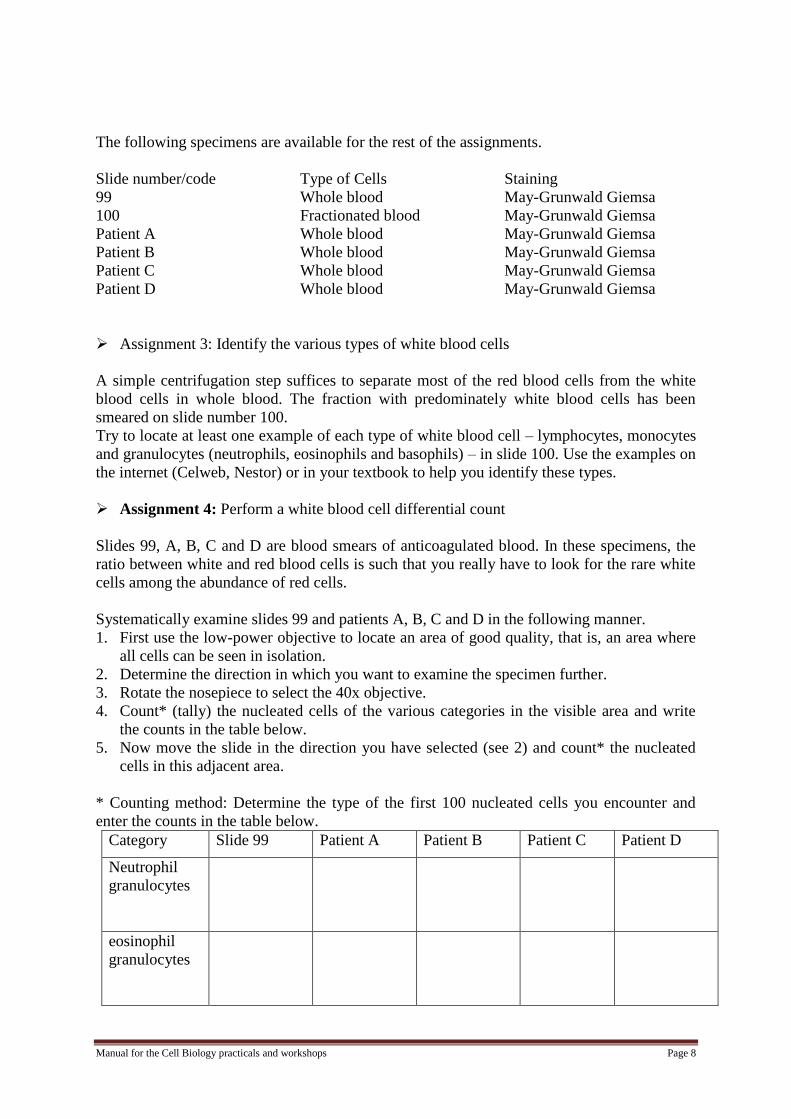
The following specimens are available for the rest of the assignments.
Slide number/code Type of Cells Staining
99 Whole blood May-Grunwald Giemsa
100 Fractionated blood May-Grunwald Giemsa
Patient A Whole blood May-Grunwald Giemsa
Patient B Whole blood May-Grunwald Giemsa
Patient C Whole blood May-Grunwald Giemsa
Patient D Whole blood May-Grunwald Giemsa
Assignment 3: Identify the various types of white blood cells
A simple centrifugation step suffices to separate most of the red blood cells from the white
blood cells in whole blood. The fraction with predominately white blood cells has been
smeared on slide number 100.
Try to locate at least one example of each type of white blood cell – lymphocytes, monocytes
and granulocytes (neutrophils, eosinophils and basophils) – in slide 100. Use the examples on
the internet (Celweb, Nestor) or in your textbook to help you identify these types.
Assignment 4: Perform a white blood cell differential count
Slides 99, A, B, C and D are blood smears of anticoagulated blood. In these specimens, the
ratio between white and red blood cells is such that you really have to look for the rare white
cells among the abundance of red cells.
Systematically examine slides 99 and patients A, B, C and D in the following manner.
1. First use the low-power objective to locate an area of good quality, that is, an area where
all cells can be seen in isolation.
2. Determine the direction in which you want to examine the specimen further.
3. Rotate the nosepiece to select the 40x objective.
4. Count* (tally) the nucleated cells of the various categories in the visible area and write
the counts in the table below.
5. Now move the slide in the direction you have selected (see 2) and count* the nucleated
cells in this adjacent area.
* Counting method: Determine the type of the first 100 nucleated cells you encounter and
enter the counts in the table below.
Category Slide 99 Patient A Patient B Patient C Patient D
Neutrophil
granulocytes
eosinophil
granulocytes

Manual for the Cell Biology practicals and workshops Page 9
basophil
granulocytes
lymphocytes
monocytes
Total
N=100
N=100
N=100
N=100
N=100
Assignment 5:
a. What are the normal ranges of the various types of blood cell?
b. Which of the slides (99, Patients A, B, C, D) you have examined has/have a normal
count and which is/are abnormal?
c. Which preliminary diagnosis or diagnoses can be made on the basis of the specimen
or specimens with an abnormal blood count?
d. Compare the counts you have found and your conclusions about these blood counts
by taking the ‘Blood smear test’ quiz on Nestor. Each student must take this quiz
individually, since it also serves to record student attendance. Each student must
therefore log on individually so that their results will be recorded correctly.
Assignment 6: Study the following principles of tissue preparation for light microscopy
To make biological material – usually tissue samples – visible under the light microscope, it
must be prepared. This preparation consists of three main steps.
A. Fixation
B. Embedding and cutting
C. Staining
In the following, the parts in italics plus the two tables are part of the core subject matter.
Manual for the Cell Biology practicals and workshops Page 10
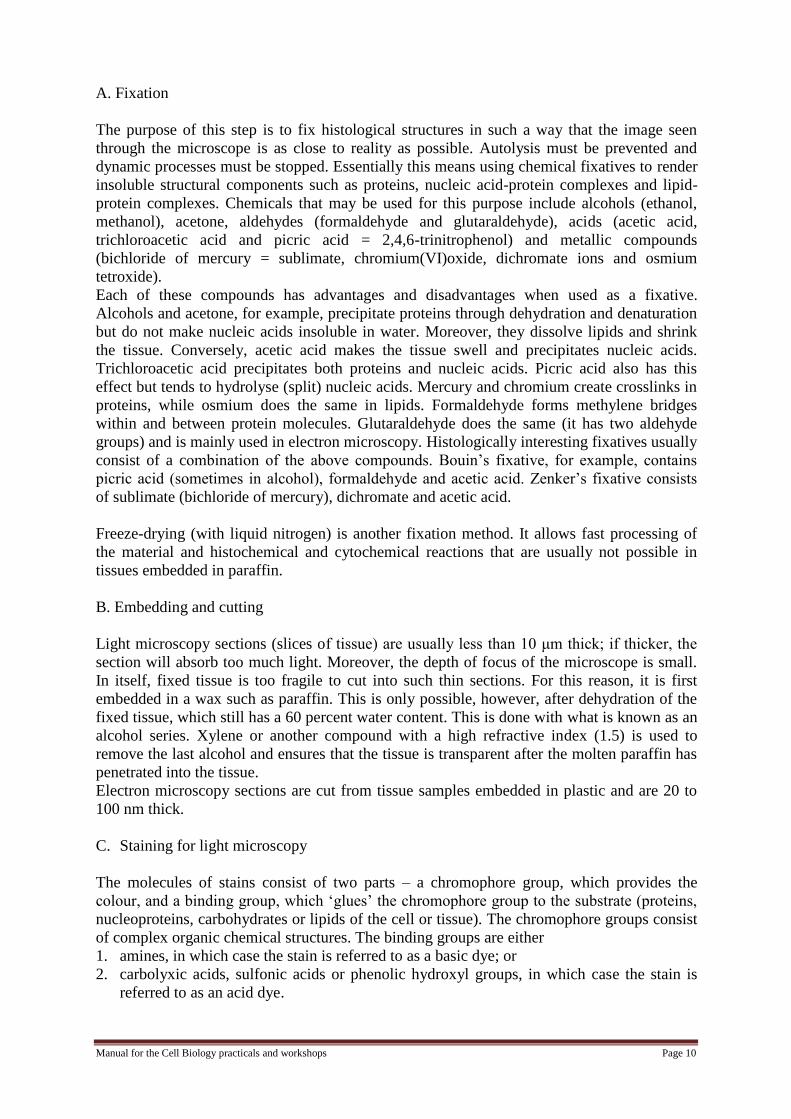
A. Fixation
The purpose of this step is to fix histological structures in such a way that the image seen
through the microscope is as close to reality as possible. Autolysis must be prevented and
dynamic processes must be stopped. Essentially this means using chemical fixatives to render
insoluble structural components such as proteins, nucleic acid-protein complexes and lipid-
protein complexes. Chemicals that may be used for this purpose include alcohols (ethanol,
methanol), acetone, aldehydes (formaldehyde and glutaraldehyde), acids (acetic acid,
trichloroacetic acid and picric acid = 2,4,6-trinitrophenol) and metallic compounds
(bichloride of mercury = sublimate, chromium(VI)oxide, dichromate ions and osmium
tetroxide).
Each of these compounds has advantages and disadvantages when used as a fixative.
Alcohols and acetone, for example, precipitate proteins through dehydration and denaturation
but do not make nucleic acids insoluble in water. Moreover, they dissolve lipids and shrink
the tissue. Conversely, acetic acid makes the tissue swell and precipitates nucleic acids.
Trichloroacetic acid precipitates both proteins and nucleic acids. Picric acid also has this
effect but tends to hydrolyse (split) nucleic acids. Mercury and chromium create crosslinks in
proteins, while osmium does the same in lipids. Formaldehyde forms methylene bridges
within and between protein molecules. Glutaraldehyde does the same (it has two aldehyde
groups) and is mainly used in electron microscopy. Histologically interesting fixatives usually
consist of a combination of the above compounds. Bouin’s fixative, for example, contains
picric acid (sometimes in alcohol), formaldehyde and acetic acid. Zenker’s fixative consists
of sublimate (bichloride of mercury), dichromate and acetic acid.
Freeze-drying (with liquid nitrogen) is another fixation method. It allows fast processing of
the material and histochemical and cytochemical reactions that are usually not possible in
tissues embedded in paraffin.
B. Embedding and cutting
Light microscopy sections (slices of tissue) are usually less than 10 μm thick; if thicker, the
section will absorb too much light. Moreover, the depth of focus of the microscope is small.
In itself, fixed tissue is too fragile to cut into such thin sections. For this reason, it is first
embedded in a wax such as paraffin. This is only possible, however, after dehydration of the
fixed tissue, which still has a 60 percent water content. This is done with what is known as an
alcohol series. Xylene or another compound with a high refractive index (1.5) is used to
remove the last alcohol and ensures that the tissue is transparent after the molten paraffin has
penetrated into the tissue.
Electron microscopy sections are cut from tissue samples embedded in plastic and are 20 to
100 nm thick.
C. Staining for light microscopy
The molecules of stains consist of two parts – a chromophore group, which provides the
colour, and a binding group, which ‘glues’ the chromophore group to the substrate (proteins,
nucleoproteins, carbohydrates or lipids of the cell or tissue). The chromophore groups consist
of complex organic chemical structures. The binding groups are either
1. amines, in which case the stain is referred to as a basic dye; or
2. carbolyxic acids, sulfonic acids or phenolic hydroxyl groups, in which case the stain is
referred to as an acid dye.

Manual for the Cell Biology practicals and workshops Page 11
In general, basic dyes are represented by the symbol B+OH-. B+ represents the staining ion –
a cation. Acid dyes are represented by the symbol H+Z-. Here, Z- represents the staining ion,
in this case an anion. The simplest model of the staining reaction is a binding of positive dye
ions to negatively charged substrate molecules or, conversely, a binding of negative dye ions
to positively charged substrate molecules. The charge of both substrate and dye depends on
the acidity of the environment. Sulfonic acid groups are negative at pH>1, phosphoric acid
groups at pH>3, carbolyxic acids at pH>4 and phenolic hydroxyl groups at pH>10. (With
respect to the phenolic-OH, incidentally, this depends strongly on the rest of the molecule;
picric acid, for example, has a negative charge at pH>0.) On the other side of the spectrum
are the amine groups, which are positive at pH<9.
As far as charge is concerned, proteins can be regarded as mosaics of COO- and NH3+
groups, which gain and lose their charge depending on the prevalent pH. There is a pH at
which the sum of all charges is zero. This is referred to as the isoelectric point (IEP). Many
serum and cytoplasm proteins have IEPs between 5 and 7. Eosin, a dye with a negative
charge at pH>3, is able to stain proteins with a nett positive charge, that is, below their IEP.
Nucleic acids have a low IEP (2 for DNA and 3 for RNA). Dyes with a positive charge (e.g.
methylene blue) can stain DNA and RNA if these have a nett negative charge, that is, above
their IEP.
Table I gives an overview of the charges of dyes at neutral pH.
To sum up, material will be stained at a certain pH, namely one at which
proteins are below their IEP (positively charged); and
nucleic acids (and acid polysaccharides) are above their IEP (negatively charged).
A suitable compromise is a pH of around 6.
Staining with hematoxylin is a more complex affair. This ‘nuclear stain’ is the most
frequently used stain in routine histological procedures. It works with a dye solution
consisting of a metal ion such as mordant and hematin (a derivative of hematoxylin). The
staining/binding mechanism cannot be described in terms of interactions between ions.
Instead, coloured complexes are formed with the metal ion (iron or aluminium). The bonds
between metal ion and substrate, but not those between dye molecules and metal ions, can be
broken by acid, which means that superfluous and non-specifically bonded dye can be
washed away. This process is referred to as differentiating. In itself, hematoxylin is useless as
a stain. It must first be oxidized to hematin. This is done in an acid environment with O2 from
the ambient air or by adding Fe3+, which is reduced to Fe2+ in the process. Aluminium-
hematin complexes first stain red. When pH is increased to 7, the stains turn indigo. This
procedure is referred to as blueing. Iron-hematin complexes are coloured blue-black. Hematin
deeply stains the cell nucleus (DNA) but does not stain basophil cytoplasm (RNA) to the
same degree.
If phosphotungstic acid or phosphomolybdic acid is added, some combinations of two acid
dyes will stain both collagen (matrix) and cytoplasmic proteins, with each of the dyes staining
one of these components. The mechanism underlying this effect is not yet understood.
Staining according to Mallory or Masson, for example, has this effect.
Table II provides information about stainings that are often used in histology.
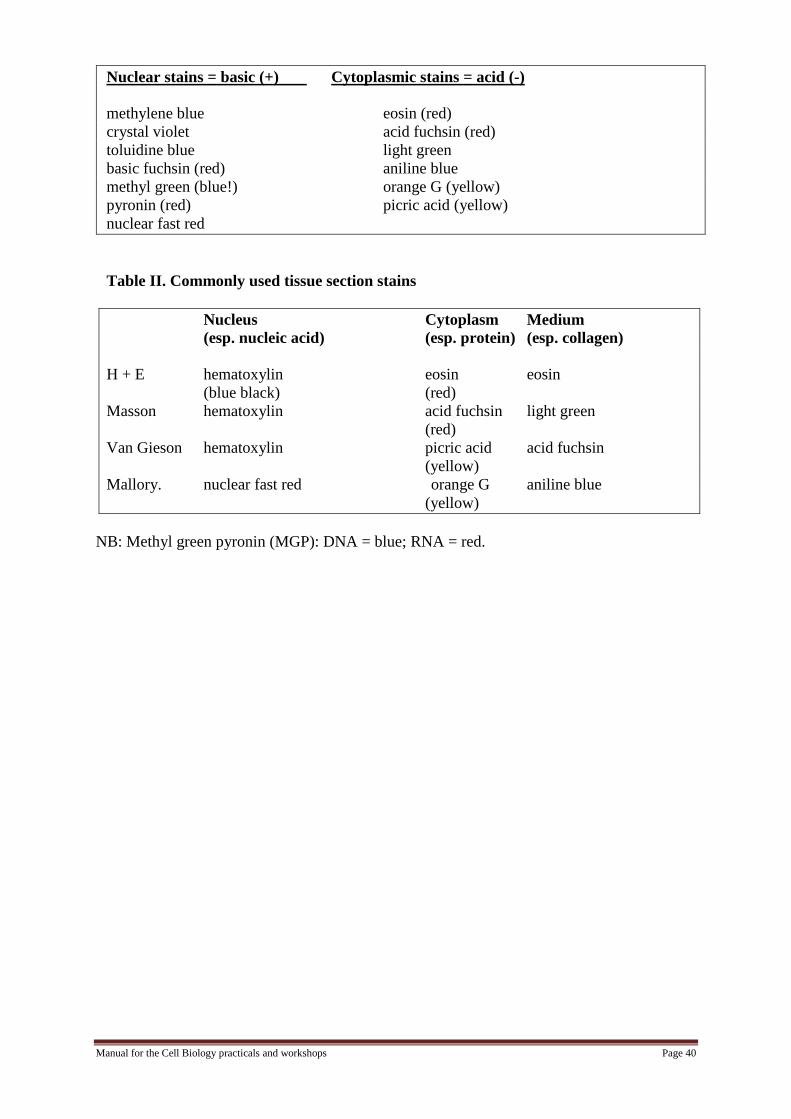
Table I. Commonly used histological stains; classification based on ability to stain either
nucleic acid (primarily nucleus) or protein (primarily cytoplasm) at pH=6

Manual for the Cell Biology practicals and workshops Page 12
Nuclear stains = basic (+) Cytoplasmic stains = acid (-)
methylene blue eosin (red)
crystal violet acid fuchsin (red)
toluidine blue light green
basic fuchsin (red) aniline blue
methyl green (blue!) orange G (yellow)
pyronin (red) picric acid (yellow)
nuclear fast red
Table II. Commonly used tissue section stains
Nucleus Cytoplasm Medium
(esp. nucleic acid) (esp. protein) (esp. collagen)
H + E hematoxylin eosin eosin
(blue black) (red)
Masson hematoxylin acid fuchsin light green
(red)
Van Gieson hematoxylin picric acid acid fuchsin
(yellow)
Mallory nuclear fast red orange G aniline blue
(yellow)
NB:
Methyl green-pyronin: DNA (blue); RNA (red); protein remains unstained
May-Grunwald/Giemsa (eosin and methylene blue + azure B): particularly suited for
staining blood and bone marrow
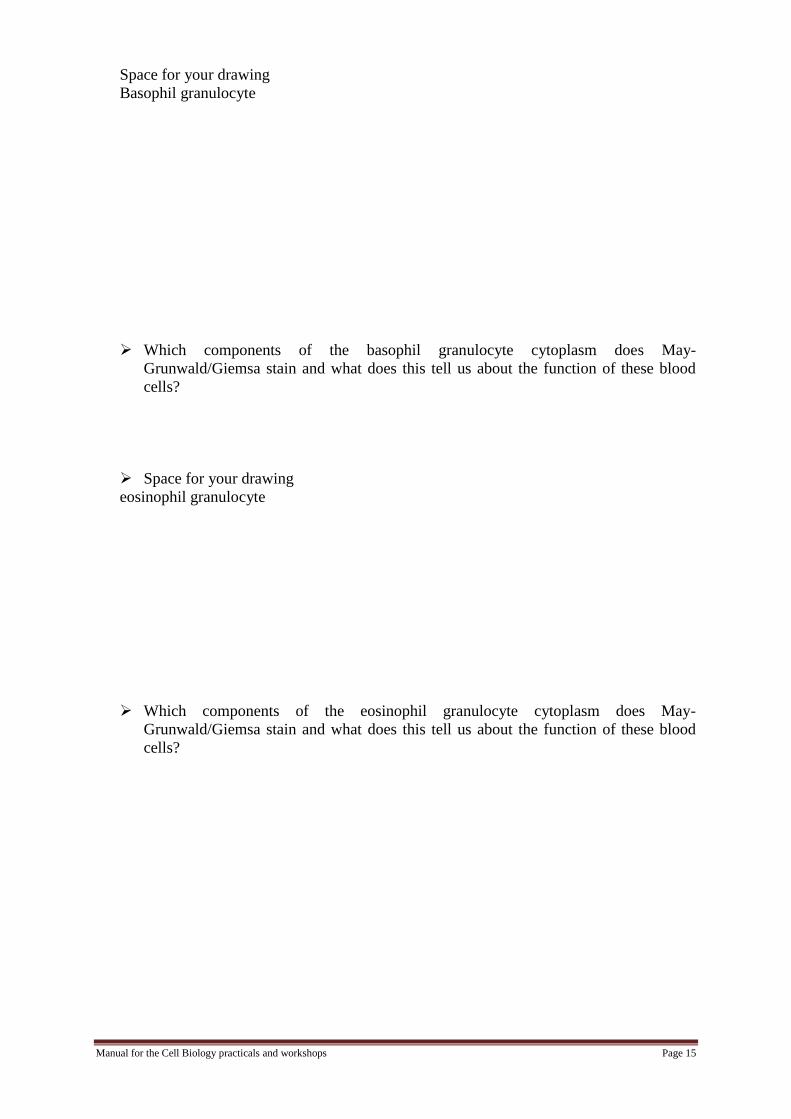
Assignment 7: Locate both a basophil and an eosinophil granulocyte in slide 100 (stained
with May-Grunwald/Giemsa) and draw it after examination with the 100x oil immersion
objective.
Instructions for using the oil immersion objective
1. Bring the specimen into focus using the 4x objective.
2. If the diaphragm is not at full aperture already, open it fully.
3. Rotate the nosepiece to the 100x objective and then rotate further to halfway between the
100x and 4x objective.
4. Place a drop of immersion oil on the specimen.
5. Rotate the 100x objective back, so that it touches the oil.
6. Focus with the micrometer.
7. Closely observe several nucleated cells and then draw them (see p. 10 for drawing
instructions).
8. When you remove the slide, ensure that no other objective comes into contact with the oil
by following these instructions:
Rotate the nosepiece to position the 4x objective above the slide.
Remove the slide and clean it immediately with a tissue.
Immediately clean the oil immersion objective also, first with a dry tissue and then
with a tissue soaked in a diluted synthetic soap solution.

Manual for the Cell Biology practicals and workshops Page 13
Read the instructions on the next page before making your first scientific drawing. You
will do many such drawings during the following workshops and practicals, which will
help you to learn how to interpret micrographs or microscopic drawings. This will be
your first hands-on experience of making such a drawing and interpreting it.

Manual for the Cell Biology practicals and workshops Page 14
Making a scientific drawing
Why?
The microscope is a tool for searching for and identifying histological and other structures.
Drawings are a good tool for studying a specimen closely. Moreover, they provide a useful
check, also after the actual examination.
How ?
1. Begin by locating a suitable part of the section (good surface area, no artefacts, sensible
diameter).
2. Write down the slide number on the drawing paper.
3. Use B/W and/or coloured pencils.
4. First do a preliminary sketch (on paper or in your mind’s eye); reserve sufficient space for
captions and any detail drawings you may wish to add.
5. Make the drawing.
Be accurate. For example, a nucleus is not a clump of chromatin with a uniform
colour; it has a particular structure that provides clues to the cell’s activity.
Ensure that you only draw what is actually visible. For example, cell membranes
CANNOT be seen under the light microscope.
Adapt the scale of your drawing to the size of the relevant details that must be
included. Perhaps these details will be too small to be rendered faithfully at the scale
you have selected.
It may be necessary, therefore, to make both a general drawing and an enlarged
detail drawing.
If you add a detail view, frame the area in that view on your general drawing.
Make a detailed drawing of just one or only a few cells and sketch in the rest.
Determine what is characteristic of this specimen and bring this out in your drawing.
6. Identify each structure or substructure with a label and connecting line.
7. Indicate the magnification or magnifications used.
Manual for the Cell Biology practicals and workshops Page 15
Space for your drawing
Basophil granulocyte
Which components of the basophil granulocyte cytoplasm does May-
Grunwald/Giemsa stain and what does this tell us about the function of these blood
cells?
Space for your drawing
eosinophil granulocyte
Which components of the eosinophil granulocyte cytoplasm does May-
Grunwald/Giemsa stain and what does this tell us about the function of these blood
cells?

Manual for the Cell Biology practicals and workshops Page 16
The next workshop cannot be completed
successfully without extensive
preparation (study of the relevant
material) in advance.
Do not forget to bring your textbook
(Alberts) and your lecture notes.

Manual for the Cell Biology practicals and workshops Page 17
Workshop : Nanotomy and diabetes Part of Block 1.1, Fundamentals of Medicine
INTRODUCTION Nanotomy applied in a rat model for Type 1 diabetes
Nanotomy is a recent development in electron microscopy (EM) that enables us to study
tissues, cells, organelles and macromolecules in a ‘Google Earth’-like fashion.
To be studied in advance:
1. Ravelli et al. SREP01804 (2013), which can be found at:
http://www.nature.com/srep/2013/130508/srep01804/full/srep01804.html
2. As an alternative, study the summary in the Dutch journal of diabetology, which can be
found via Nestor (Ravelli et al. NTD, 2013).
Learning objectives
Students will learn to
1. explain the technical principles underlying transmission, scanning and scanning
transmission electron microscopy
2. recognize and interpret various items in images obtained with electron microscopy:
tissue properties
cell types
organelles
macromolecular complexes
3. explain with an example how functional information about cell function (e.g. secretion)
can be obtained with nanotomy
4. describe the general structure of the cell, various cell organelles and macromolecular
complexes and name their functions
5. apply the above knowledge to pathophysiological analyses; in this workshop, this mainly
concerns Type 1 diabetes
Assessment
1 and 5: knowledge items in the written test
2, 3, 4 items in the practical test related to micrographs

Manual for the Cell Biology practicals and workshops Page 18
Assignment
Page
Content
1 19 Naming the cell organelles in an EM drawing
2 20 Studying the technical principles underlying transmission EM
3 21 Recognizing and interpreting a TEM image of a biomembrane
4 22 Studying membrane transport
5 23 Nanotomy: EM of tissues, cells, organelles and macromolecules
6 28 Testing what you have learnt by observing a healthy islet
7 29 Analyzing islets affected by Type 1 diabetes
8 30 Studying the technical principles underlying SEM
9 30 Recognizing and interpreting a SEM image of a cell
10 31 Comparing the main aspects of the various EM techniques
NB: Assignments can be done in advance and may also be completed after the
workshop.

Manual for the Cell Biology practicals and workshops Page 19
Assignment 1. Name the cell organelles in an EM drawing
A cell contains cell organelles that are essential to the functioning of that cell. Depending on
cellular function, one type of cell will have a higher number of certain organelles than other
types. This workshop and the ones following it pay a lot of attention to cells with various
functions. To check if you know the various cell organelles, examine the following schematic
drawing of a cell (a pancreatic exocrine cell).
1. Identify the various cell organelles by placing the right number at the right line.
2. State the main function(s) of the organelle in the table.
If necessary, consult your textbook.
The answers will be published on Celweb after this workshop.
From: Pappas GS, Laboratory Manual of Histology. Wm. C. Brown, Publ. Dubuque, IA, USA, 1990.
Structure Position Structure Position
1. centriole 9. microtubules
2. cytosol 10. mitochondria
3. Golgi complex 11. microvilli
4. nucleus 12. nucleolus
5. nuclear envelope 13. plasma membrane
6. nuclear pore 14. ribosomes
7. lysosome 15. rough endoplasmic
reticulum
8. microfilaments 16. secretion droplets

Manual for the Cell Biology practicals and workshops Page 20
Assignment 2: Study the technical principles underlying Transmission Electron
Microscopy (TEM).
In transmission EM (TEM), a high voltage generated between a heated cathode (incandescent
filament) and an anode produces a beam of electrons. One or more condenser lenses focus
this beam onto the plane of focus, in which a very thin section has been placed that can be
penetrated by the electrons. The objective lens produces a magnified image of the object,
which is projected on a screen or recorded with a camera. Modern TEM microscopes provide
magnifications of up to 300,000 times, with a resolution of approximately 2 nm, of sections
which are about 60 nm thick and have a maximum diameter of 3 mm.
The biological material in these very thin sections (mainly consisting of C, H, N and O) does
not scatter electrons sufficiently to provide an image, which is why the specimen is stained
with heavy metals, which do scatter the electrons. The most common contrast medium is
osmium tetroxide (OsO4), which specifically binds to double bonds of lipids and fixes them
by creating crosslinks, thus making membranes visible. Other common contrast media
include uranyl acetate and lead citrate, which are used when the pH is such that all cellular
components (DNA, RNA, proteins, polysaccharides) are negative and, in principle, should
therefore absorb the medium (albeit to varying degrees).

Manual for the Cell Biology practicals and workshops Page 21
Assignment 3: Recognize and interpret a TEM image of a biomembrane.
Membranes consist of a bilayer of phospholipids, with hydrophobic (apolar) tails pointing
towards each other and hydrophilic (polar) heads forming the outer boundary of the
membrane. The apolar tails may also have double bonds that may react with OsO4, as is
shown in Figure 1 on the left. This will improve the contrast of the two apolar membrane
layers in particular. If this structure is sufficiently magnified with TEM, it manifests itself as a
‘railway track’ (see Figure 1 on the right).
OsO4 binds to apolar tails ‘railway track’
OsO4
OsO4
Fig. 1. Diagram of imaging a membrane with TEM.
Fig. 2. TEM image of part of a plasma membrane.
Questions:
In cross section, the cell membrane appears to have ..... layers at the high magnification
used in Figure 2; at lower magnification, however, it would be seen as having ..... layer(s).
Chemically, the membrane can be regarded as a bilayer consisting of
………………………… .
This bilayer contains islets consisting of ………………………… .
The exterior of the bilayer is lined with ……………………… and ……………………. .
Physiologically, the membrane has ..... layers.

Manual for the Cell Biology practicals and workshops Page 22
Assignment 4. Study membrane transport
Membranes can form compartments. The plasma membrane is the boundary between the
cytoplasm and the extracellular environment. However, this boundary is dynamic; various
transport processes enable the release and uptake of substances. Examples of such processes
are shown in Fig. 3, which illustrates glucose-induced insulin secretion. Study the figure and
pay specific attention to the various molecules and substances transported across the
membrane.
Which forms of transport can be distinguished?
Possible answers: exocytosis / concentration / voltage-dependent influx / efflux inhibition
The glucose uptake by GLUT2 is mainly dependent on: ...............
The ATP-sensitive K+ pump is a form of ...............
The voltage-gated calcium pump is a form of ...............
The insulin secretion is a form of ...............
Fig 3. Insulin secretion in beta cells caused by rising blood sugar levels. Absorption of
glucose by GLUT2 and glycolytic phosphorylation of glucose cause an increase in ATP/ADP
ratio, which inactivates the potassium channel, which in turn leads to depolarization of the
membrane and the subsequent opening of a voltage-dependent calcium channel. The rise in
calcium concentration leads to the release of insulin. (Source: www.betacell.org)

Manual for the Cell Biology practicals and workshops Page 23
Fig. 4. The beta cells (Fig. 3) are grouped in islets of Langerhans in the pancreas. The
pancreas further consists of exocrine tissue producing digestive enzymes. In addition to
insulin, the endocrine tissue (islets of Langerhans) also produce other hormones. Source:
http://www.bu.edu/histology/p/10401loa.htm
Assignment 5: Nanotomy: EM of tissues, cells, organelles and macromolecules
As described above, nanotomy was applied in an animal model of diabetes. Study the
ultrastructure of an islet of Langerhans, by visiting www.nanotomy.nl and clicking the large
(grey) islet on the left. This dataset can be studied in a ‘Google Maps’-like fashion. Click the
IIP icon at the top left if you need further instructions. Study the annotations and answer the
following questions. The numbers correspond to the annotations; 1A, for example, refers to 1
Supracellular. If you mouse over this box, you will be presented with a submenu with various
items, e.g. A islet.
1. What is the largest structure that can be recognized? And what is the smallest? What are
their respective dimensions? You can move the annotation menu by right-clicking the grey
bar at the top and dragging the menu to another position to reveal the scale of the image.
Largest structure: Approx. dimensions:
Smallest structure: Approx. dimensions:
1A. What main differences between islets of Langerhans and exocrine pancreas can be used
to distinguish the one from the other?
What are their respective functions?
1B. Which cell can be found in the capillary?

Manual for the Cell Biology practicals and workshops Page 24
1C. Which two cell types can be found in the venule? What are their main differences?
1D. The centroacinar lumen is part of:
a. the endocrine pancreas and contains enzymes
b. the endocrine pancreas and contains hormones
c. the exocrine pancreas and contains enzymes
b. the exocrine pancreas and contains hormones
1E. Shown here is a cross section of a bundle of unmyelinated axons. This bundle shows up
more or less by accident; the axons are electron-lucid (lighter) and contain round tubules and
light-grey filaments. How many axons can be distinguished?
1F. The nuclei of some exocrine cells are not visible. Why?
2A. The exocrine cell contains a lot of ER for protein synthesis. Vesicles secrete it into:
a. the blood
b. the digestive tract
2B. The alpha cell produces glucagon, which is visible in the dark vesicles. What effect does
glucagon have on blood sugar levels?
a. increase
b. decrease
2C. The beta cell in this image is in poor health. The rat has diabetes. We will later study the
differences with a healthy rat. Which organelles can you distinguish? There are only a few
hormone-containing granules visible, particularly on the left below the nucleus. The crystal-
like shape is characteristic and is even more conspicuous in human beta cells. Which
hormone is this?
2D. Although somatostatin-producing delta cells are also a constituent of the islets, they only
account for a few percent of the islets’ cells. We can determine the various cell types because
their granules have different structures. How can somatostatin granules be distinguished from
glucagon or insulin granules?
2E. Is the centroacinar cell important for hormone production or for the development of
secretory ducts? How do you know?
2F. The cell in 2F (a pericyte) separates the hormone-producing ............... pancreas from the
enzyme/proenzyme-producing ............... pancreas.
2G. Inflammatory cells can be seen here because the sick rat has developed an immune
response targeting the islets. What type of leukocyte is shown here? How do you know?

Manual for the Cell Biology practicals and workshops Page 25
2H. What is the approximate size of this erythrocyte?
2I. What is characteristic of the nucleus of a monocyte?
2J. This phagocyte is (a) passive or (b) active. I know which is correct because ....
2K. The granulocytes studied in the Blood Cell practical had spherical or round shapes. These
clearly look different. What has caused this difference?
2L. The leukocyte contains black specks. What is their approximate size? What could these
be?
2M. It is clear that the small platelets have a more heterogeneous content than the adjacent
erythrocytes. How many platelets can be seen in this venule?
3A. The endoplasmic reticulum (ER) is important for ................. . The black specks are about
.... nm in size; they are ..... at the interior/exterior of the ER.
3B. It is easy to identify a mitochondrion by its:
3C. The cell nucleus contains ......... . It is possible to distinguish several kinds. Which?
Functionally this reflects a process called ........................ .
3D. The Golgi apparatus can be distinguished from the ER at the nanoanatomical scale
because it:
The Golgi apparatus is important for:
4A. Zymogen granules contain enzymes and proenzymes in the ............... cells.
4B. Insulin is produced by the ............ cells.

Manual for the Cell Biology practicals and workshops Page 26
4C,D,E. Exosomes are secreted vesicles. Is it possible to understand exosome release on the
basis of the various stages? Yes/No
How does exosome release differ from vesicle fusion in, for example, insulin secretion?
4F. Glucagon is produced by the ............ cells.
4G. Somatostatin is produced by the ............ cells.
5. Structure and function of vesicles.
5A. Dense bodies have been given their name because:
5B. Lysozomes play an important role in:
5C. What cell in this micrograph contains numerous caveolae?
5D. Caveolae are just about the smallest vesicles in existence. What is their diameter?
5E. And what is the diameter of the lipid droplets?
5F. On the basis of which two characteristics can an early endosome (as shown here) be
distinguished?
5G. Clathrin-coated pits are typically involved in (a) endocytosis or (b) exocytosis.
5H. If the multivesicular bodies fuse with the plasma membrane, the following may happen:
6A. Crystae are characteristic of:
6B. Which type of atom has accumulated in this ‘tangled’ membrane?
6C What cells can be distinguished? The fenestrae facilitate ............. .
6D. In this image, the basement membrane is situated between two types of cells. These are:
6E. The basement membrane is present as a complex whole. We are still inside the diabetic
rat. Morphologically, the two nucleated cells are obviously leukocytes; they are in different
locations, however. The left leukocyte is situated in ................ but the other is not. Explain
what may be the matter here.
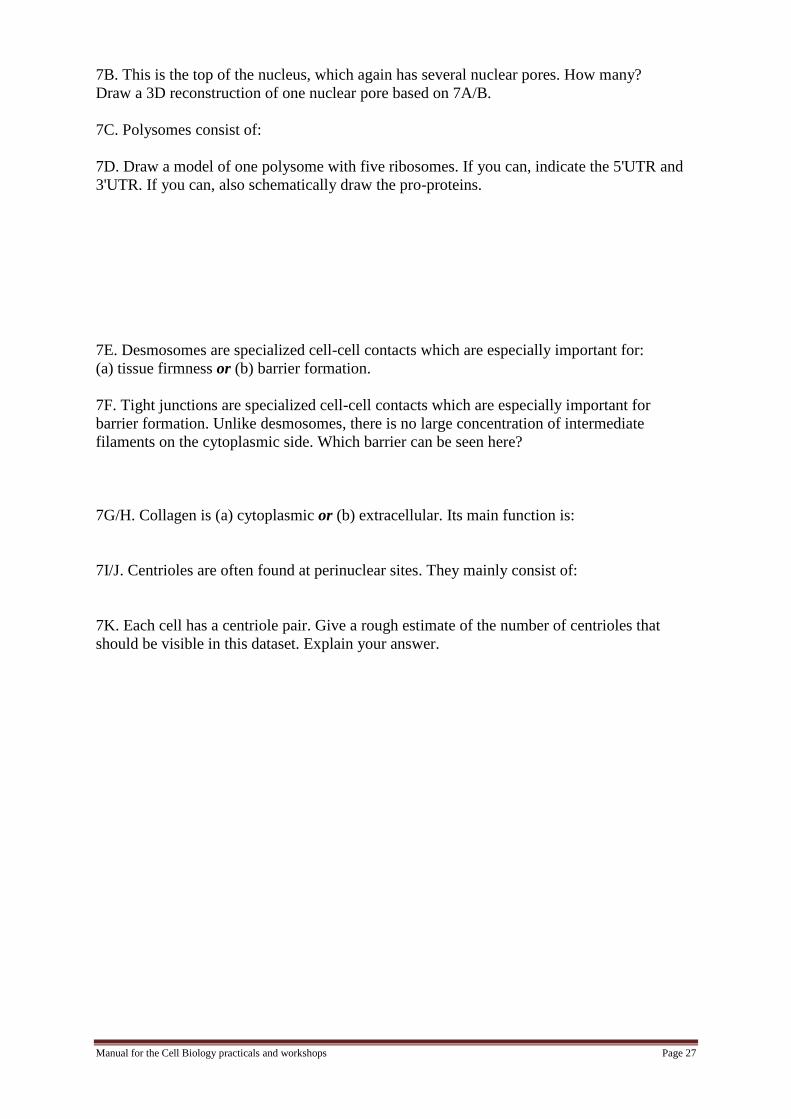
7. Macromolecules can just be distinguished at the magnification used for this image. Various
characteristics ensure that different macromolecules can be recognized.
7A. How many nuclear pores can be distinguished in the ENTIRE cross section of the nuclear
membrane?
Manual for the Cell Biology practicals and workshops Page 27
7B. This is the top of the nucleus, which again has several nuclear pores. How many?
Draw a 3D reconstruction of one nuclear pore based on 7A/B.
7C. Polysomes consist of:
7D. Draw a model of one polysome with five ribosomes. If you can, indicate the 5'UTR and
3'UTR. If you can, also schematically draw the pro-proteins.
7E. Desmosomes are specialized cell-cell contacts which are especially important for:
(a) tissue firmness or (b) barrier formation.
7F. Tight junctions are specialized cell-cell contacts which are especially important for
barrier formation. Unlike desmosomes, there is no large concentration of intermediate
filaments on the cytoplasmic side. Which barrier can be seen here?
7G/H. Collagen is (a) cytoplasmic or (b) extracellular. Its main function is:
7I/J. Centrioles are often found at perinuclear sites. They mainly consist of:
7K. Each cell has a centriole pair. Give a rough estimate of the number of centrioles that
should be visible in this dataset. Explain your answer.

Manual for the Cell Biology practicals and workshops Page 28
Assignment 6. Test what you have learnt by observing a healthy islet (dataset 1).
Distinguish ten types of cells. Which characteristics enable you to distinguish one cell type
from the other?
1.
2.
3.
4.
5.
6.
7.
8.
9.
10.
Draw four different organelles.
1.
2.
3.
4.
Draw five different macromolecules or macromolecular complexes and state a function of
each.
1.
2.
3.
4.
5.

Manual for the Cell Biology practicals and workshops Page 29
Assignment 7. Islets affected by Type 1 diabetes After this introduction to the EM of cells,
organelles and macromolecules, we will now examine the effects of Type 1 diabetes in the rat
model. Go back to the homepage (www.nanotomy.nl) and compare dataset 1 (control) with
dataset 5 (diabetes).
1. What is the blood sugar level of the healthy animal? ...... And what is the level of the
diabetic animal? ......
2. This is caused by a deficiency in:
3. This is caused by the breakdown of beta cells. Insulitis is clearly visible; in dataset 5 we
find many more:
4. Beta cell destruction can be seen from the following (name at least three characteristics):
5. Diabetes patients benefit from the following treatment:
6. Overtreatment leads to ............................... and can be compensated with
.............................. . Comatose patients benefit from: ...............................
You have now examined two stages. If there is still time left after the workshop, test what
you have learnt by studying the other stages. You can also do this at home; the data remains
available.

Manual for the Cell Biology practicals and workshops Page 30
Assignment 8: Study the technical principles underlying Scanning Electron Microscopy
(SEM).
As with TEM, Scanning EM (SEM) also involves focusing an electron beam through
condenser and objective lenses. The sample is also situated in the plane of focus. In principle,
SEM examines material that is not thin enough for the electrons to pass through. The primary
electron beam is not stationary as in TEM but scans the surface by moving along a grid. The
electron beam scans the sample surface line by line. Either secondary electrons (SE2) are set
free in the sample or the beam electrons are reflected back (backscatter electrons). Both types
can be used to produce an image of the sample surface. If the sample is a very thin section,
the electrons will obviously pass through. If a detector is then placed under the section, a
TEM image can be made with a SEM microscope. This is referred to as STEM: scanning
transmission EM.
Assignment 9: Recognize and interpret a SEM image of a cell.
Figure 5 7 is a micrograph of a liver parenchymal cell. A conspicuous feature of the gall
capillary is a membrane specialization in the form of small membrane protuberances.
Fig. 5. Rat liver parenchymal cell. SEM, 6,100 x (left) and 16,000 x (right).
What is the name given to such protuberances?
What does the cell achieve with this membrane specialization?
In which type of transport is this specialization usually involved?
What does the liver cell transport with the help of this specialization?

Manual for the Cell Biology practicals and workshops Page 31
Assignment 10: Make a succinct comparison of the EM techniques described above
(TEM, SEM, STEM). Describe the underlying technical principles and give an
application of each.

Manual for the Cell Biology practicals and workshops Page 32
Workshop : Protein synthesis Part of Block 1.1, Fundamentals of Medicine
Assignment Page Content
1 33 Answering the questions about the nuclear processes involved in
protein synthesis
2 36 Answering the questions about the cytoplasmic processes involved
in protein synthesis
3 39 Converting an EM drawing into the LM image that can be expected
after various stainings
4 41 Studying and drawing plasmablasts and comparing your
expectations with the actual images
5 42 Studying and drawing a pancreatic acinus after HE and MGP
staining. Compare the exocrine pancreatic cell with the plasmablast
Thoroughly prepare for assignments 1 and 2 by studying the relevant material.
Introduction
The biochemistry of protein synthesis will be explained in the theme lectures. This workshop
will deepen your understanding of where and how this protein synthesis occurs in the cell.
Various questions will help you to follow this process as far as it is visible in the cell and to
discuss it with your fellow students. The plasmablast (a cell that produces and secretes
immunoglobulins – antibodies) will serve as the example of a protein-synthesizing cell.
In the first part of the workshop, groups of around eight students must answer the questions
about the micrographs by actively using their textbooks (e.g. Essential Cell Biology and
Functional Histology).
This will be followed by three individual assignments focusing on the interpretation of LM
and EM images of various protein-synthesizing cells.
Learning objectives
Students will learn to
1. explain the process of protein synthesis in a eukaryote cell and identify the cell
organelles involved in this process
2. use EM images to explain the involvement of the various cell organelles in various
stages of protein synthesis
3. explain the principle of cellular protein sorting
4. convert an EM image of a cell into an LM image and vice versa
5. where possible, relate morphological characteristics of various types of protein-
synthesizing cells to their functional activity
6. efficiently use various sources of information (textbooks, lecture notes and digital
sources) to carry out the assignments.
Assessment
1, 2, 3 and 5: in the practical and written tests with, for example, items related to EM
micrographs.
4: by the lecturer or assistant during the workshop. 6: in the open-book part of the written
test.

Manual for the Cell Biology practicals and workshops Page 33
Figure 10. Diagram of a TEM image of a plasmablast.
Assignment 1: Answer the following questions and carry out the following
assignments focusing on the cell nucleus.
The following structures can be recognized in the nucleus:
1. Euchromatin.
2. parietal chromatin
3. nucleolus
4. nuclear membrane
5. nuclear pore
a. Label these structures in Figure 10 with the above numbers.
b. Which chromatin contains the DNA that is in the process of transcripting the DNA into
RNA?
Manual for the Cell Biology practicals and workshops Page 34
c. Plasmablasts and plasma cells produce immunoglobulins (antibodies). In addition to
mRNA for immunoglobulin synthesis, many other mRNA molecules are produced in the
nucleus. Estimate the percentage of mRNA in a plasma cell that codes for
immunoglobulins. Give arguments for your estimate. For which other types of proteins do
the other mRNA molecules code?
d. What is the function of the nucleolus?
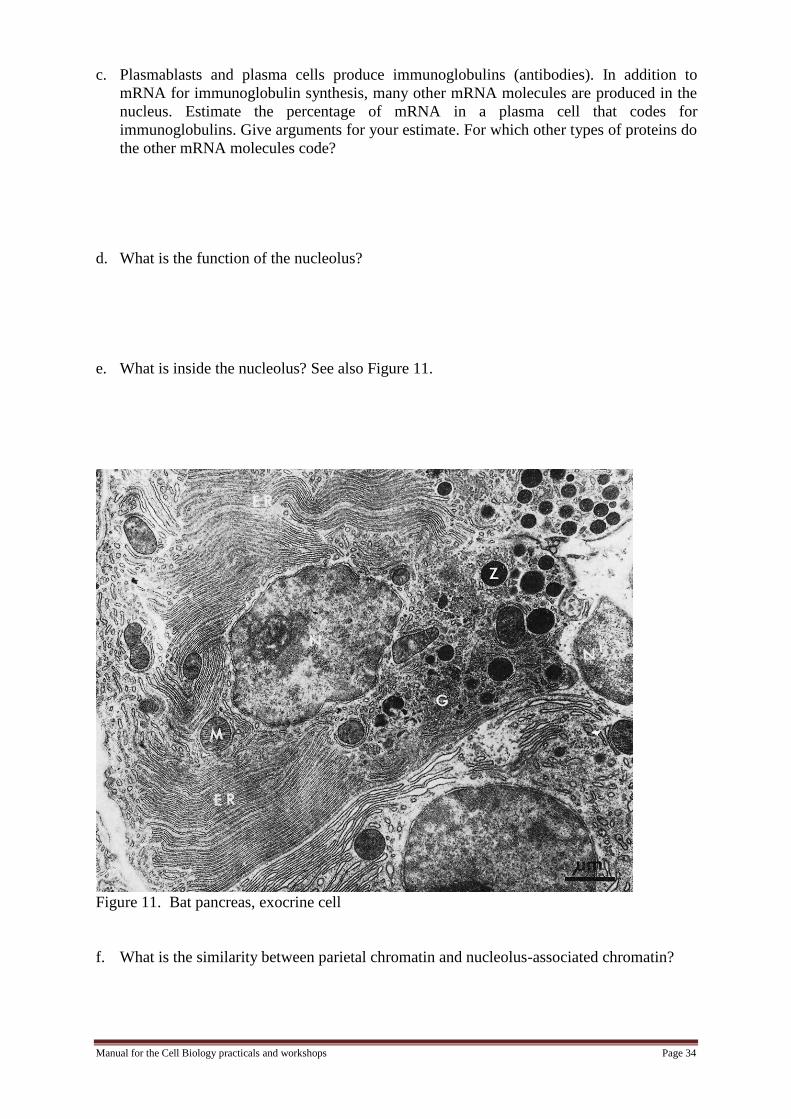
e. What is inside the nucleolus? See also Figure 11.
Figure 11. Bat pancreas, exocrine cell
f. What is the similarity between parietal chromatin and nucleolus-associated chromatin?

Manual for the Cell Biology practicals and workshops Page 35
g. Explain why the nuclear membrane is sometimes referred to as the nuclear envelope by
referring to Figures 10 and 12.
Figure 12. Rat liver parenchymal cell, RER and nuclear membrane
h. Draw a diagram of the way in which the nuclear envelope encloses the nucleus.
i. During which stage of cellular development is this nuclear envelope structure useful?
j. What can be found on the exterior of the nuclear envelope? See Figure 12.
Manual for the Cell Biology practicals and workshops Page 36
k. Where does the transport to and from the nucleus take place?
Assignment 2: Answer the following questions and carry out the following
assignments relating to the cytoplasm.
a. Place the numbers below at the correct locations in Figure 10.
6. free ribosomes
7. rough endoplasmic reticulum (RER)
8. Golgi complex
9. mitochondria
10. lysosomes
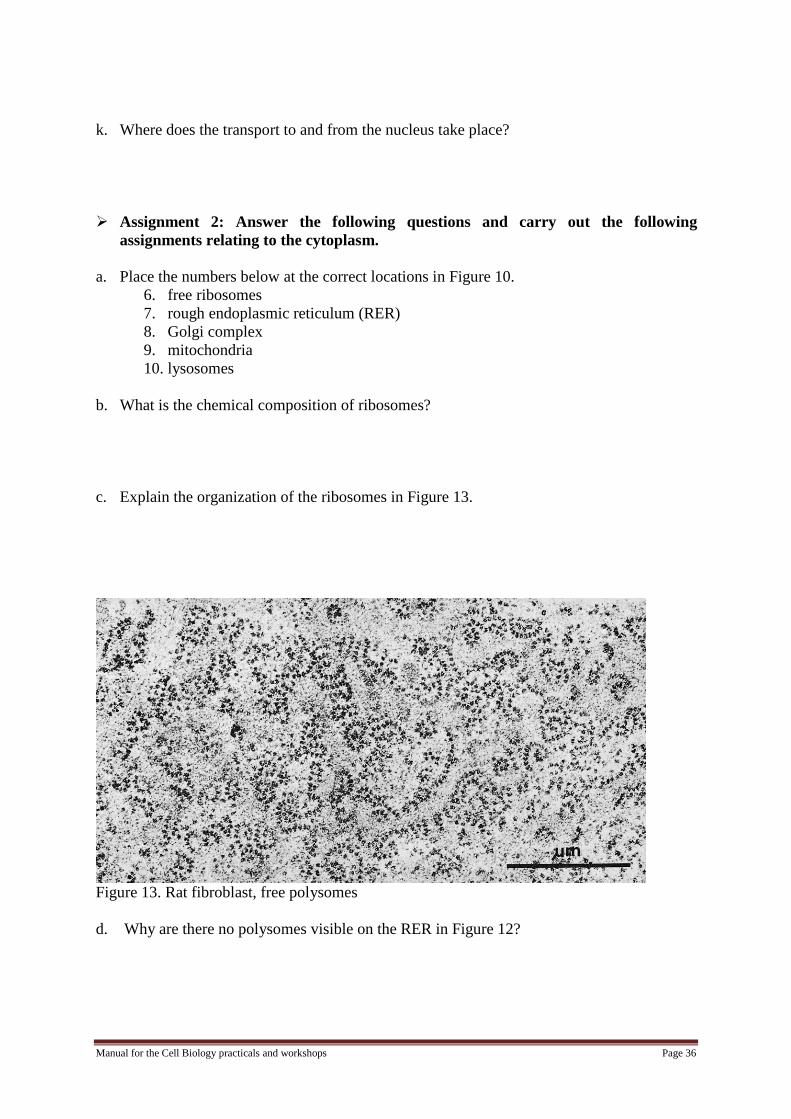
b. What is the chemical composition of ribosomes?
c. Explain the organization of the ribosomes in Figure 13.
Figure 13. Rat fibroblast, free polysomes
d. Why are there no polysomes visible on the RER in Figure 12?

Manual for the Cell Biology practicals and workshops Page 37
e. Where is the RER lumen situated in Figure 14? Mark the site with a star.
Figure 14. Rat liver parenchymal cell, RER membranes. R = ribosome.
f. What do the arrows in Figure 14 point to? Take the magnification into account!
g. There are newly formed proteins in the RER lumen. How did they get there?
h. Why is it that some proteins remain in the cytosol?
i. What happens to the primary protein chains in the RER lumen?
j. How are proteins transported from the RER to the Golgi complex?
k. What happens to proteins in the Golgi complex?
l. Figure 15 is a micrograph of a Golgi complex stained with polysaccharide.

Manual for the Cell Biology practicals and workshops Page 38
Explain the differences in density for the various components.
Figure 15. Golgi complex of human intestinal epithelial cell. Silver staining. The arrow
indicates the direction of the Golgi complex from the cis to the trans side.
m. How do proteins exit the Golgi complex?
n. Indicate the direction of the protein transport in the Golgi complex in Figure 16.
Figure 16. Golgi complex of mouse pancreatic glandular cell
o. Which compartments can the proteins go to after leaving the Golgi complex?

Manual for the Cell Biology practicals and workshops Page 39
Finally, a task that will help you to summarize the entire process:
p. Describe how and where new ribosomes are made.
Functional morphology of protein synthesis
For a better understanding of the normal or abnormal functioning of certain cells, it is
important that you are able to convert LM colour images to EM B/W images and vice versa.
Sometimes theoretical expectations are not in line with reality. It is often possible to explain
these discrepancies by taking the functional characteristics of cells into account.
Assignment 3: The drawing of a plasmablast in Figure 10 is based on EM micrographs.
Draw a plasmablast as you would expect to see it under the light microscope if stained
with hematoxylin-eosin (HE) and methyl green-pyronin (MGP). (Consult Tables I
and II below, which you will already have encountered during the Blood cells Practical
in Block 1.1.)
Commonly used histological stains; classification based on ability to stain either nucleic
acid (primarily nucleus) or protein (primarily cytoplasm) at pH=6
Manual for the Cell Biology practicals and workshops Page 40
Nuclear stains = basic (+) Cytoplasmic stains = acid (-)
methylene blue eosin (red)
crystal violet acid fuchsin (red)
toluidine blue light green
basic fuchsin (red) aniline blue
methyl green (blue!) orange G (yellow)
pyronin (red) picric acid (yellow)
nuclear fast red
Table II. Commonly used tissue section stains
Nucleus Cytoplasm Medium
(esp. nucleic acid) (esp. protein) (esp. collagen)
H + E hematoxylin eosin eosin
(blue black) (red)
Masson hematoxylin acid fuchsin light green
(red)
Van Gieson hematoxylin picric acid acid fuchsin
(yellow)
Mallory. nuclear fast red orange G aniline blue
(yellow)
NB: Methyl green pyronin (MGP): DNA = blue; RNA = red.

Manual for the Cell Biology practicals and workshops Page 41
Space for your drawing
Theoretically expected LM image of plasma cell after H+E staining
Space for your drawing
Theoretically expected LM image of plasma cell after MGP staining
Assignment 4. Observe plasmablasts in tissue sections and compare the results with
the theoretical expectations.
a. Take slide 34 (HE) and read the description.
Slides 33 and 34. Rabbit spleen, 2.5 days after intravenous injection of paratyphoid
fever, stained with methyl green pyronin (33) or hematoxylin-eosin (34). Among other
details, these specimens show the white pulpa with periarteriolar lymphoid sheath and
the follicle with follicle centre, lymphocyte ring and peripheral zone with weakly
basophilic peripheral zone cells, which are often distinguished by a light nucleus also.
A relevant feature is the presence of plasmablasts with strongly basophilic cytoplasm in
the periarteriolar lymphoid sheath.
b. Locate the plasmablasts with objectives 4x and 10x and study them at 40x. Properly
adjust the aperture diaphragm. Only then will you be able to see all the plasmablast
details, for example the parietal chromatin. You can also use the 100x lens in combination
with immersion oil for a more detailed view (see Chapter 1 Practical, Block 1.1 or
Celweb).
c. Does your observation match the drawing of your expectation made in Assignment 3? If
necessary, change your drawing.

Manual for the Cell Biology practicals and workshops Page 42
d. Also answer question (c) for slide 33 (MGP) and change your drawing if necessary.
e. How can the differences between expectation and observation be explained?
Assignment 5: Study and draw exocrine pancreatic cells in sections in which they
have been stained with various stainings. On the basis of your observations, explain
the functional difference between protein synthesis in the exocrine pancreatic cell
and in the plasmablast.
a. Study the descriptions of slides 90 and 92, Guinea pig pancreas, stained with
hematoxylin-eosin (90) or methyl green-pyronin (92).
Slide 92: Guinea pig pancreas, stained with hematoxylin-eosin.
Slide 90: Guinea pig pancreas, stained with methyl green-pyronin.
The pancreas is a protein-synthesizing alveolar gland that consists of lobules
interspersed with fatty tissue containing the larger secretion ducts, arteries and veins.
The lobules consist of acini, secretion ducts and isthmi (strips of tissue connecting the
acini and the secretion ducts).
The cytoplasm of the acinar cells exhibit strong basal basophilia (rough endoplasmic
reticulum) and strong apical acidophilia (secretion droplets).
In addition to this exocrine glandular tissue, the pancreas also contains endocrine
tissue: the pancreatic islets, where insulin and other hormones are produced. These will
be dealt with in Workshop 9, Endocrine organs.
b. Try to identify acini, isthmi, blood vessels and pancreatic islets in slide 92 under low
magnification.
c. Find a detailed section of an acinus.
d. Draw several acinar cells and label the structures that you have drawn.
Space for your drawing
Manual for the Cell Biology practicals and workshops Page 43
e. In which part of the cell (apex or base) is most of the stained protein located?
f. What does hematoxylin stain?
g. Take slide 90 (Guinea pig pancreas, stained with methyl green-pyronin) and draw some
of the acinar cells as they appear with this staining.
Space for your drawing
h. What are the differences with the HE specimen?
i. At which side of the cell is most of the RNA located?
j. Which EM-observable structures are the cause of the strong basal basophilia and strong
apical acidophilia? (See Figure 11, p. 18.)
k. How does the processing of the proteins produced in the plasma cell differ from the
processing of those produced in the pancreatic cell?

Manual for the Cell Biology practicals and workshops Page 44
The next workshop cannot be
completed successfully without
extensive preparation (study of the
relevant material) in advance.
Do not forget to bring your textbook
(Alberts) and lecture notes.

Manual for the Cell Biology practicals and workshops Page 45
Workshop : Energy metabolism Part of Block 1.1, Fundamentals of Medicine
Assignment Page Content
1 46 Studying the available energy sources.
2 47 Comparing carbohydrates and fats as energy sources.
3 47 Comparing aerobic and anaerobic metabolism.
4 48 Studying how and where glycolysis occurs
5 48 Studying how and where the citric acid cycle occurs
6 50 Studying how and where oxidative phosphorylation occurs
7 51 Answering questions about mitochondrial genetics
8 52 Calculating the energy yield of cellular respiration.
Prepare yourself for this workshop by studying the relevant material.
Introduction
Cells use ATP as an energy source. The two main sources of ATP are glycolysis and
oxidative phosphorylation. This workshop contains various assignments that will help you
understand this cellular process.
Learning objectives
Students will learn to
1. recognize and explain the structure of the mitochondrion
2. explain how the cell produces useful energy through cellular respiration
3. explain the differences between the breakdown of sugars and fats
4. explain the difference between aerobic and anaerobic metabolism
5. explain the relevance of glycolysis, citric acid cycle and oxidative phosphorylation to
energy metabolism
6. apply the principles of mitochondrial inheritance to patient diagnostics.
Assessment 1 and 5: practical test and written test.
1-8 (incl.) items in the written test testing the students’ knowledge and understanding.

Manual for the Cell Biology practicals and workshops Page 46
Assignment 1: Study the available energy sources.
The most common sugar in our body is glucose. This substance is stored in the form of
glycogen. Because the synthesis of glucose can only be achieved by green plants, we
must obtain this important fuel from our food. Our main source of glucose is starch.
a. Examine the nature of starch from a chemical perspective.
b. Where in the body is starch broken down into glucose?
c. Chemically speaking, how does this metabolic process take place?
d. Where in our body is glucose that we do not immediately need as fuel stored? Locate it
on the micrograph below (Figure 19).
Figure 19, rat liver, TEM 50,000x

Manual for the Cell Biology practicals and workshops Page 47
Assignment 2: Compare carbohydrates and fats as energy sources.
Figure 20. Chemical structure of glycogen (left) and triacylglycerol (right)
Discuss these structures to explain why fat is a much more practical storage medium than
carbohydrates.
Assignment 3: Compare aerobic and anaerobic metabolism.
When we exercise intensely for a long time, our muscles will incur an oxygen debt at some
point, when the fuels required for additional muscular effort can no longer be completely
metabolized.
a. Explain why we can still use extra carbohydrates (glucose) in such situations but not extra
fat or fatty acids to meet the increased muscular energy needs.
b. To double the muscular effort, how many times more glucose do we need under these
anaerobic circumstances than in the aerobic situation?
During the anaerobic breakdown of glucose, the muscle produces a lot of lactic acid.
c. From which substance is this lactic acid formed?
d. Give the complete chemical equation for this conversion.
e. What is the name of this type of reaction?

Manual for the Cell Biology practicals and workshops Page 48
f. Why is it highly important for the muscle that this conversion takes place?
Assignment 4: Study how and where glycolysis occurs.
Glycolysis only has one oxidation-reduction step.
a. Which step is that?
b. What precisely is oxidized and what is reduced?
c. Where does glycolysis take place in the cell and what are the three main products of
glycolysis in terms of cellular energy production?
Assignment 5: Study the citric acid cycle.
Cellular respiration takes place in the mitochondria. Figure 21 is an EM micrograph of a
mitochondrion.
a. Identify the following mitochondrial structures by placing the corresponding number at
the correct site:
1. outer membrane
2. inner membrane
3. cristae
4. matrix
5. intermembrane space

Manual for the Cell Biology practicals and workshops Page 49
Figure 21, EM of mitochondrion, liver cell, 50,000x
A cell can obtain much more energy from the same fuels by means of the citric acid cycle and
oxidative phosphorylation than through glycolysis alone.
b. Where are the enzymes of the citric acid cycle located?
Carbohydrate and fat metabolism have a common intermediate substance.
c. Which intermediate is this and how is it formed during carbohydrate metabolism and fat
metabolism respectively?
d. What is the main product of the citric acid cycle from the perspective of cellular ATP
production? How many molecules of this product are formed for each glucose molecule?
e. The citric acid cycle itself does not consume oxygen. Why then does the cell still need
oxygen to keep the citric acid cycle going?
f. Write down the net reaction of the citric acid cycle in such a way that it is clear that there
are an equal number of C, H and O atoms on either side of the reaction arrow.
Manual for the Cell Biology practicals and workshops Page 50
g. Suppose that it is possible to have the citric acid cycle run only once in a cell, with acetyl
CoA – with both C atoms radioactively marked – as the substrate. How many molecules
of radioactive CO2 would be formed during this one cycle? Explain your answer.
Assignment 6: Study oxidative phosphorylation.
a. What is the essential function of the mitochondrial inner membrane in ATP production?
b. Which general characteristics of the biological membrane allow the inner membrane to
perform that function?
Before you start on the next assignment, we advise you to study pages 93-100 of
ECB, which provide a brief summary of Chapter 3 reviewing free energy (G), free
energy change (ΔG) and other concepts. Pay special attention to the ‘chemical
equilibria’ section of Panel 3-1 and the explanation given of the relationship
between ΔG and K, the reaction equilibrium constant. Then study the following
sections in Chapter 14: ‘The redox potential is a measure of electron affinities’ (pp.
469-470) and ‘Electron transfers release large amounts of energy’ (pp. 470-472).
c. From an energy viewpoint, how many mol ATP can be produced by the oxidation of 1
mol NADH by O2? Follow this procedure to arrive at the answer:
1. Look up the values of the standard redox potentials of the NADH/NAD+ and
O2/H2O redox pairs (Panel 14-1).
2. Use these values to calculate the ΔEo of the NADH + H
+ + ½ O2 NAD
+ + H2O
reaction.
3. Then use the outcome of step 2 in the formula on page 471 to calculate the ΔGo of
this reaction.
4. Look up the value of the ΔGo for the ATP + H2O ADP + Pi reaction (Figure
13.7, p. 470).
5. Use the values found in steps 3 and 4 to calculate the maximum number of mol
ATP that can be formed by the oxidation of 1 mol NADH.

Manual for the Cell Biology practicals and workshops Page 51
(Pay attention to the + and - signs!)
d. How does the calculated value differ from the number of mol ATP that is actually
formed?
e. Can this be regarded as an efficient process? Compare it to other energy-producing
processes, for example a combustion engine.
f. What function does the proton gradient formed during the electron transport across the
inner membrane have in ATP synthesis?
The ATP formed by oxidative phosphorylation is released into the matrix.
g. How does this ATP end up in the cytosol?
Assignment 7: Answer questions about mitochondrial genetics.
Mitochondria have their own protein-synthesizing apparatus that produces several of the
enzymes involved in cellular respiration. In MELAS patients, the mechanism for producing a
particular mitochondrial tRNA is defective.
a. What consequences could this have for the energy metabolism of these patients?
b. Do transcription and translation occur in separate sites in mitochondria?
c. Where in nature do we find a protein-synthesizing mechanism similar to the one found in
the mitochondrial system?
Manual for the Cell Biology practicals and workshops Page 52
d. How do mitochondria multiply?
e. How is mitochondrial DNA inherited?
f. What effects does this have on genetic disorders that are caused by a mutation in
mitochondrial DNA?
Assignment 8: Calculate the energy yield of cellular respiration.
This final assignment may be completed at home: calculate how much ATP the cell can
obtain from carbohydrates and fats.
a. Calculate the number of ATP molecules produced per mol NADH to O2, when
1. 5 protons are pumped across the inner membrane for each electron passed on by the
respiration-enzyme complex
2. 3 protons have to undergo ATP synthase for the production of 1 ATP molecule from
ADP and Pi
3. 1 proton is used for the transport of ATP from the mitochondrion to the cytosol.
b. How much ATP is then produced by the oxidation of 1 glucose molecule through
glycolysis, pyruvate dehydrogenase and the citric acid cycle?
c. How much ATP is then produced by the oxidation of 1 palmitate molecule through fatty
acid oxidation and the citric acid cycle?
(Assume that NADH in the cytosol can yield as much ATP as NADH in the
mitochondrion and that the electrons of FADH2 can yield as much ATP as those of
NADH.)
Manual for the Cell Biology practicals and workshops Page 53
Workshop : Pathology
Part of Block 1.1, Fundamentals of Medicine
Assignme
nt
Page
Content
1 54 Normal cervix
2 54 Metaplasia
3 55 Dysplasia
4 56 Hyperplasia and atrophy
Introduction
Cells are highly adaptable to changing circumstances. Such changes are often evident from
changes in cell characteristics. The study of changes in individual cells is the subject of
Cytology. Often such changes can best be seen by investigating the cell complexes that make
up tissues. Similar changes in cells and tissues will also occur during illness. In Pathology,
the following terms are used to describe this type of adaptation or change.
Atrophy = cell size reduction
Hypertrophy = cell size increase
Hyperplasia = increase in number of cells
Metaplasia = a reversible change from one cell type to another cell type
Dysplasia = abnormal change in certain cell types
Cell death is another option for tissues to adapt to changing circumstances. Two types of cell
death are distinguished.
Apoptosis = programmed cell death (does not result in damage to surrounding tissue)
Necrosis = cell death resulting in damage to surrounding tissue
In this workshop, various physiological and pathological changes in cells and tissues will be
demonstrated with the help of several sections of epithelial tissue from the cervix and
endometrium. The function and form of epithelial cells have been explained in detail in Block
1.1.
Learning objectives
Students will learn to
1. use the concepts of atrophy, hypertrophy, hyperplasia, metaplasia and dysplasia to
describe changes in cells and tissues
2. explain the difference between apoptosis and necrosis
3. distinguish between normal and abnormal epithelium.
Assessment:
1 and 2 with knowledge items in the written test
3 with items in the practical and written tests involving the study of micrographs

Manual for the Cell Biology practicals and workshops Page 54
Assignment 1: normal cervix
To identify changes in a tissue, it is first necessary to study the normal structure of that tissue.
Micrograph 1 (see Celweb) is a histological section of the cervicovaginal junction. Study the
description. The endocervix consists of mucous epithelium, while the ectocervix consists of
stratified non-keratinizing squamous epithelium.
Draw several cells of the mucous epithelium.
Space for your drawing
Draw several cells of the stratified non-keratinizing squamous epithelium.
Space for your drawing
What is the fate of differentiated epithelial cells and how does this work?
Assignment 2: metaplasia
Epithelial cells may change from one cell type to another in response to injury. When the
damaged tissue has a normal structure but is located at the wrong site, this process is called
metaplasia. Metaplasia can be observed in the cervix, for example, when non-keratinizing
squamous epithelium is found among the cylindrical epithelium of the endocervix.
Study micrographs of the cervix taken with various magnifications (2a, 2b and 2c).
Does this epithelium look the same as the non-keratinizing squamous epithelium in image
1?
What type of injury could have caused this type of change in this tissue?
Assignment 3: dysplasia
Dysplasia occurs when the structure of the tissue becomes abnormal. Dysplasia is often
regarded as a precursor of neoplasms and can thus serve as an early indication of malignant
changes.

Manual for the Cell Biology practicals and workshops Page 55
Such changes are often first seen in cervical smears taken to detect possible tissue changes by
screening various cytological characteristics.
A database of micrographs of cytological sections has been created for this classification.
Two of these micrographs are available as examples. The first contains cells that can be
identified as normal squamous epithelium (image 3). The second contains dysplastic cells
(image 4) of which the original cell type is difficult to identify.
Draw several cells of normal squamous epithelium.
Space for your drawing
Draw several dysplastic cells.
Space for your drawing
Describe the differences between the cells in these two cytological sections.
The entire database can be accessed for further study.
When a cervical smear contains suspect cells, taking a biopsy is the next step. The next
micrograph is an example of a biopsy section.
Micrograph 5 shows poorly differentiated squamous epithelium among the normal
epithelium of the cervical crypts.
What is the ratio between nucleus and cytoplasm in normal tissue and in dysplastic
tissue?
How does the structure of the nucleus and cytoplasm differ between normal and
dysplastic tissue?
Manual for the Cell Biology practicals and workshops Page 56
Assignment 4: hyperplasia and atrophy
An example of physiological hyperplasia is the thickening of the endometrium (wall of the
uterus) during the menstrual cycle.
The number of endometrium cells increases to prepare for the implantation of a fertilized
ovum.
A large number of cell divisions can be seen in this tissue, even at higher magnifications.
Study micrograph 6 of an adult endometrium.
Draw several of the dividing endometrial cells.
Space for your drawing
Compare image 6 with image 7, a micrograph of the endometrium of a 70-year-old woman. It
clearly shows the atrophy of this tissue.
How many cell layers does the endometrium of image 6 contain and how many layers can
you count in image 7?

Manual for the Cell Biology practicals and workshops Page 57
Workshop : Cell division and DNA analysis Part of Block 1.1, Fundamentals of Medicine
Assignment Page Content
1 57 Studying cells photographed during various mitotic stages
2 60 Identifying, drawing and naming the mitotic stages in a cell section
with the help of LM.
3 61 Karyotyping the chromosomes in a human cell with the help of a
chromosome map
4 63 Discussing case 1.
5 65 Discussing case 2.
6 66 Discussing case 3.
7 67 Discussing case 4.
8 68 Discussing case 5.
Assignment 1 can be completed before the workshop begins. You can prepare for
assignments 4-8 by studying Essential Cell Biology, and finish them after the workshop,
if necessary, with the help of what you have learned.
Background information for assignments 1-3 can be found in Kerr and in this manual.
Learning objectives
Students will learn to
1. identify mitotic stages and explain the process involved
(a) in LM images of cells and tissues; and
(b) with the help of LM in sections of cultivated cells
2. identify numerical and structural chromosomal deviations in a karyogram
3. explain how a polymerase chain reaction (PCR) works
4. explain the principle underlying Southern blotting
5. explain Restriction Fragment Length Polymorphism (RFLP) and how it can be detected
6. interpret the results of an RFLP analysis for DNA diagnostic purposes
7. explain the concept of variable number of tandem repeat (VNTR)
8. interpret the results of a VNTR analysis for DNA diagnostic purposes. Assessment 1: Items in the practical and written tests involving the examination of micrographs 2: Items in the practical and written tests involving the examination of a karyogram 3-5, 7: Items in the written test, testing the student’s knowledge and understanding 6, 8: Items in the practical and written tests concerning analysis results

Manual for the Cell Biology practicals and workshops Page 58
Assignment 1: Study cells photographed during various mitotic stages.
(Use the description of cell division characteristics in the box on p. 55.)
Figures 22 to 31 are images of cells in interphase, prophase, metaphase, anaphase and
telophase in a fibroblast (connective tissue) culture. Fibroblasts are elongated cells that
sometimes have cytoplasmic processes. The cells were cultivated in a suitable medium that
stimulates their multiplication.
Staining: hematoxylin. Magnification factor: 3000x.
Fig. 22: Interphase
Fig. 23: Prophase 1
Fig. 24: Prophase 2
Fig. 25: Metaphase (frontal view)
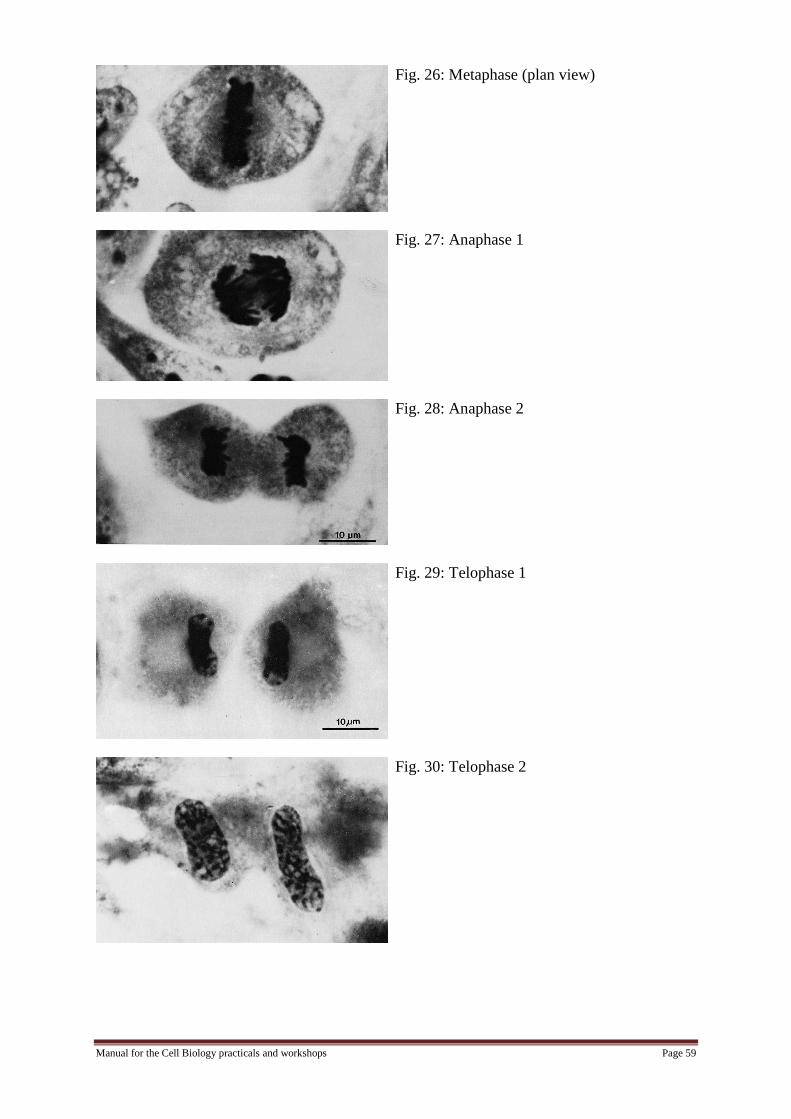
Manual for the Cell Biology practicals and workshops Page 59
Fig. 26: Metaphase (plan view)
Fig. 27: Anaphase 1
Fig. 28: Anaphase 2
Fig. 29: Telophase 1
Fig. 30: Telophase 2

Manual for the Cell Biology practicals and workshops Page 60
Fig. 31: Telophase 3
Cell division characteristics
prophase
Early prophase or Prophase I: Onset of chromosome coiling results in breakdown of
parietal chromatin. Because the parietal chromatin has disappeared, the nuclear envelope
can no longer be seen under the light microscope, but it is still intact.
Late prophase or Prophase II: the nuclear envelope disintegrates; the chromosomes are
released into the cytoplasm. The centriole is duplicated. Both centrioles migrate to the
poles; onset of microtubule formation.
metaphase
All chromosomes are aligned in the equatorial plane.
More microtubules are formed, leading to the formation of the mitotic spindle.
anaphase
The centromere divides, resulting in the compete separation of the two chromatids
(daughter chromosomes) of each metaphase chromosome.
Chromosomes migrate towards the poles.
telophase
Reconstruction of the nuclear envelope.
Uncoiling of the chromosomes.
Note that this division into stages is artificial, in the sense that the transition from one phase
to the next is a gradual process. It is difficult to distinguish cells in the late telophase from
those in the early interphase, but interphase cells are separated from each other, while
telophase cells are joined like ‘Siamese twins’.
Assignment 2: Identify, draw and name the mitotic stages in a cell section with the
help of LM.
Slide 2: Vero cell line, cultivation period 2.5 days. Staining: hematoxylin.
(Cultivated by the Virology department of the Laboratory for Medical Microbiology,
Groningen.) The etymology of the name ‘Vero cells’ is unknown. The lineage was created in
Japan when researchers cultivated renal cells from an African green monkey.
Find at least one cell in interphase, prophase, metaphase, anaphase and telophase
respectively in slide 2. Which phase is the most common? Is there a correlation between
the frequency of incidence and the duration of a particular phase? If so, which?

Manual for the Cell Biology practicals and workshops Page 61
Draw an anaphase with the help of the 100x oil immersion objective. (If you have
forgotten how, read the instructions on Celweb.)
Space for your drawing
DNA ANALYSIS: KARYOTYPING
A normal human body cell has 46 chromosomes. These chromosomes come in pairs: 22 pairs
of autosomes and one pair of sex chromosomes (XX in women and XY in men). With the
exception of the X and Y chromosomes in men, the two chromosomes in each pair are very
similar in terms of structure and function.
Chromosomes can be banded with the help of staining techniques that give each chromosome
a characteristic banding pattern. Chromosomes 1 to 22, X and Y each have a different
banding pattern that depends on their structure and function.
It is possible to distinguish and identify each chromosome on the basis of banding pattern,
length and centromere position. Assignment 3: Karyotype the chromosomes in a human cell with the help of a
chromosome map (karyogram or idiogram). Micrographs of metaphase karyograms will be published on Nestor.
Do the micrographs show any chromosomal deviations? If so, what?
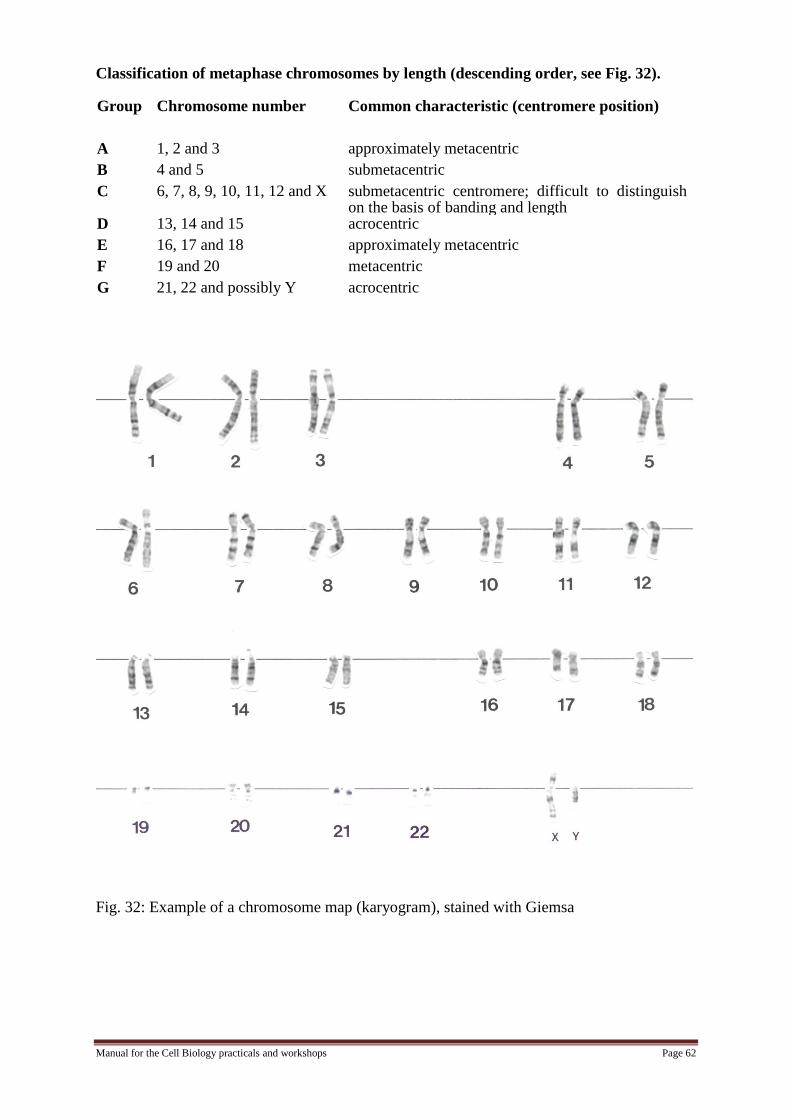
Manual for the Cell Biology practicals and workshops Page 62
Classification of metaphase chromosomes by length (descending order, see Fig. 32).
Group Chromosome number Common characteristic (centromere position)
A 1, 2 and 3 approximately metacentric
B 4 and 5 submetacentric
C 6, 7, 8, 9, 10, 11, 12 and X submetacentric centromere; difficult to distinguish on the basis of banding and length
D 13, 14 and 15 acrocentric
E 16, 17 and 18 approximately metacentric
F 19 and 20 metacentric
G 21, 22 and possibly Y acrocentric
Fig. 32: Example of a chromosome map (karyogram), stained with Giemsa
Manual for the Cell Biology practicals and workshops Page 63
DNA ANALYSIS: APPLICATIONS OF DNA TECHNOLOGY
In addition to cytogenetics, with which changes in DNA can be identified at chromosomal
level, there are various other molecular biological techniques for identifying changes in
DNA. By using these techniques, the inheritance of certain genetic disorders –
phenylketonuria, Down’s syndrome, Huntington’s disease and others – can be linked to
existing DNA polymorphisms. The techniques are particularly useful for disorders that are
not associated with an abnormal karyotype.
The cases described below concern diagnostic problems that can be solved with the help of
various molecular biological techniques. For a proper application of these techniques to the
following cases, you must understand the principles underlying them. If you have not grasped
these principles yet, you can read up on them in Chapter 10 of Essential Cell Biology.
Assignment 4: Discuss case 1
A family has the following members:
1. Peter (father)
2. Mary (mother)
3. Christine (daughter)
4. William (son)
5. Pauline (daughter)
Christine has PKU, which is inherited recessively. Mary is pregnant again, which is why the
DNA of all family members and the foetus were analysed to probe for 2-allele restriction
fragment length polymorphism (RFLP) close to the PKU locus. The results of a Southern blot
analysis are shown in Figure 33.
Websites with additional karyotyping information and exercises:
www.biology.arizona.edu; go to:
Human Biology>Karyotyping
‘Human biology’ button (bottom) > New Methods in Karyotyping (describes
multicolour spectral karyotyping)

Manual for the Cell Biology practicals and workshops Page 64
Figure 33. Southern blot for case 1. Lane 6 represents the foetus.
a. Draw up a genealogy of this family. Mark who has the disease and who is a carrier (see
Figure 34 of case 2 for the coding).
b. Does the foetus (no. 6 in the Southern blot) also have PKU, is it a heterozygous carrier or
is it a normal homozygote? Give arguments supporting your answer.
c. What is a restriction enzyme?
d. What is RFLP?
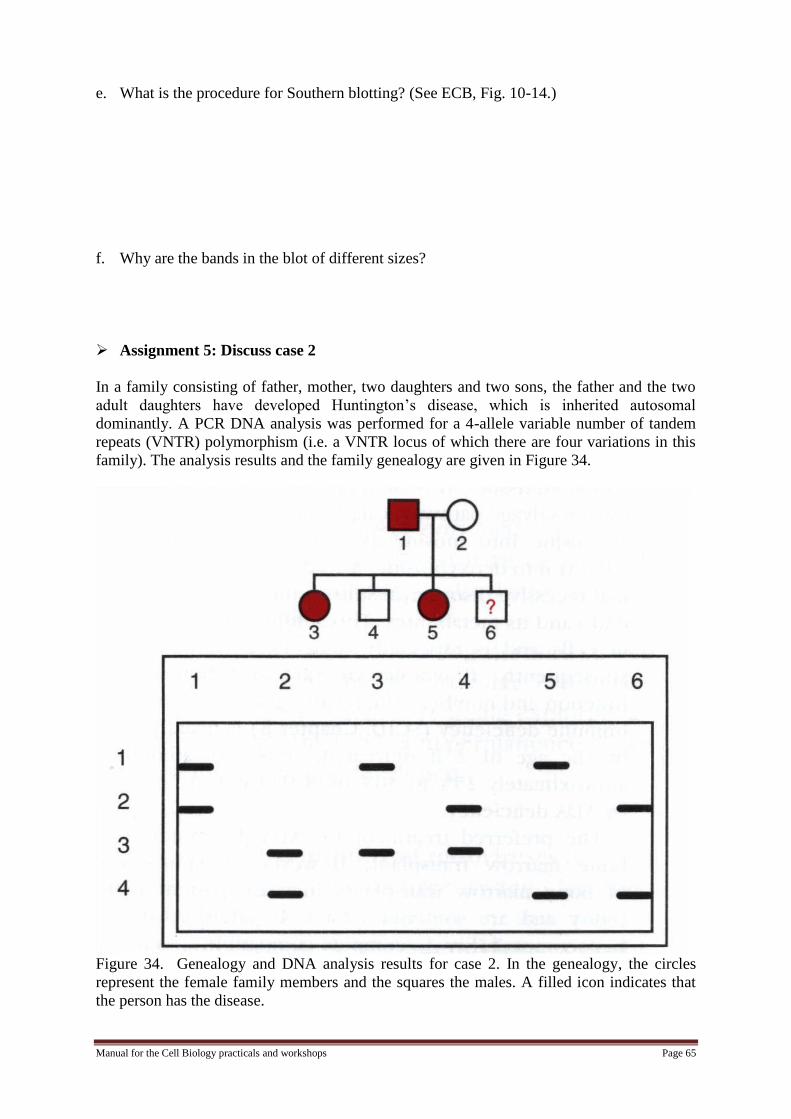
Manual for the Cell Biology practicals and workshops Page 65
e. What is the procedure for Southern blotting? (See ECB, Fig. 10-14.)
f. Why are the bands in the blot of different sizes?
Assignment 5: Discuss case 2
In a family consisting of father, mother, two daughters and two sons, the father and the two
adult daughters have developed Huntington’s disease, which is inherited autosomal
dominantly. A PCR DNA analysis was performed for a 4-allele variable number of tandem
repeats (VNTR) polymorphism (i.e. a VNTR locus of which there are four variations in this
family). The analysis results and the family genealogy are given in Figure 34.
Figure 34. Genealogy and DNA analysis results for case 2. In the genealogy, the circles
represent the female family members and the squares the males. A filled icon indicates that
the person has the disease.

Manual for the Cell Biology practicals and workshops Page 66
a. Will the son (no. 6) develop Huntington’s disease? Give arguments supporting your
answer.
b. What does VNTR mean? (See ECB, legend of Fig. 10-30.)
c. What is the procedure for PCR? (See ECB, Fig. 10-27.)
Assignment 6: Discuss case 3
Various members of a family have ornithine transcarbamylase (OTC) deficiency, which is an
X-linked recessive disorder. Male neonates with this enzyme deficiency die very soon after
birth. Enzyme activity in adults can be measured by analysing the blood ornithine level,
which is strongly elevated in heterozygous female carriers.
Figure 35 shows this family’s genealogy and an RFLP haplotyping of DNA cleaved with the
restriction enzyme MspI on which Southern blotting was performed with OTC cDNA as
probe (see ECB, Fig. 10-9, for the principles underlying this technique). The mother (I-2) and
daughters II-1 and II-5 have an elevated blood ornithine level.
Figure 35. Genealogy and DNA analysis results for case 3. The diagonal line across the two
squares means that son III-1 and 3 generation II sons have died. Their DNA was not
analysed.
Generation I
Generation II
Generation III
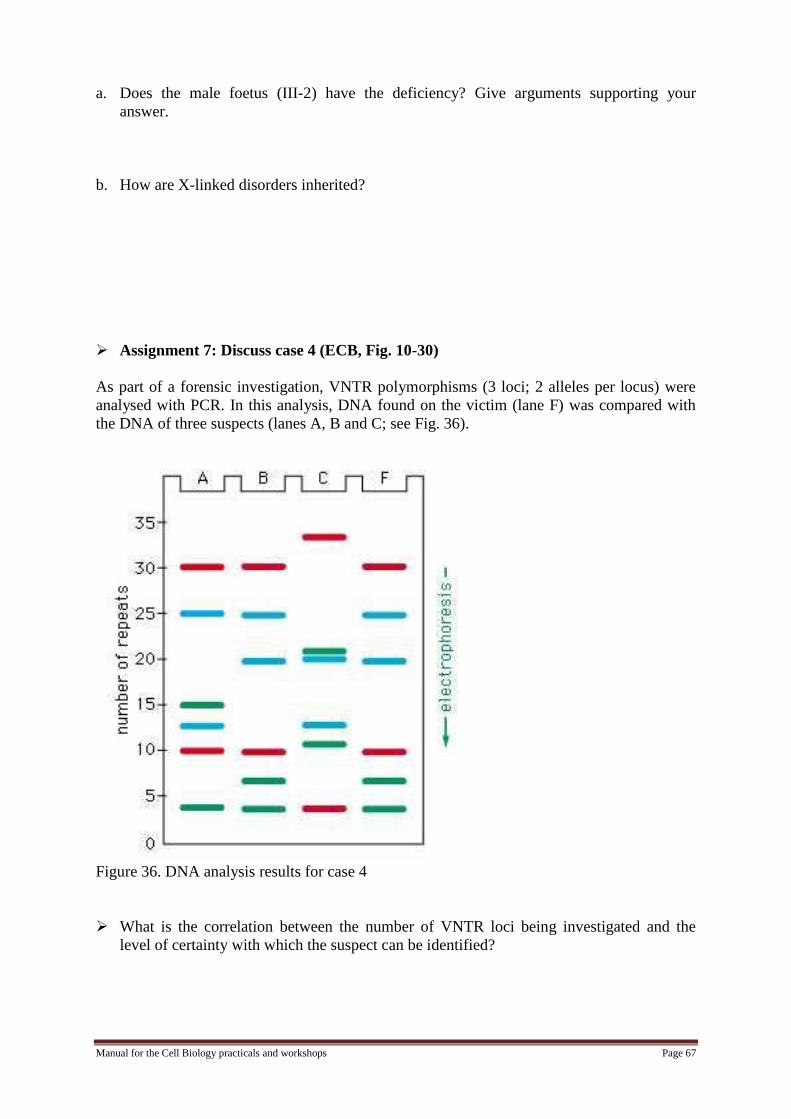
Manual for the Cell Biology practicals and workshops Page 67
a. Does the male foetus (III-2) have the deficiency? Give arguments supporting your
answer.
b. How are X-linked disorders inherited?
Assignment 7: Discuss case 4 (ECB, Fig. 10-30)
As part of a forensic investigation, VNTR polymorphisms (3 loci; 2 alleles per locus) were
analysed with PCR. In this analysis, DNA found on the victim (lane F) was compared with
the DNA of three suspects (lanes A, B and C; see Fig. 36).
Figure 36. DNA analysis results for case 4
What is the correlation between the number of VNTR loci being investigated and the
level of certainty with which the suspect can be identified?

Manual for the Cell Biology practicals and workshops Page 68
Assignment 8: Discuss case 5
Marian is the sister of Charles, who has Down’s syndrome. She wants to know if she is a
carrier of the t(14;21) that has been found in her father, his brother (not tested) and her
paternal grandmother. The test used was Southern blotting. A DNA segment that specifically
binds to chromosome 21 was used as probe. The results of the analysis are given in Figure
37.
Figure 37. DNA analysis results for case 5
a. Does this information indicate that Marian is a carrier?
b. Explain how PCR could have been used for this analysis.
c. Why could Marian’s question also have been answered with cytogenetics (karyotyping)?
For more exercises, with clear explanations, go to the source of case 4:
‘DNA profiling 2001’ in www.biology.arizona.edu