Embed Size (px)
Citation preview

© Aspire Training & Consulting v
Contents
Before you begin vii
Topic 1: Obtain information relevant to business issues 11A Review staff and customer feedback and business performance data 21B Identify, define and analyse business problems and issues 151C Identify information required to reach a decision on problems and issues 201D Source, gather and test information for reliability and validity and reject
where necessary 251E Utilise and review formal and informal networks to access corporate
knowledge not held in formal systems 32Summary 39Learning checkpoint 1: Obtain information relevant to business issues 40
Topic 2: Analyse information and knowledge 432A Ensure objectives for analyses are clear, relevant and consistent with required
decisions 442B Identify patterns and emerging trends correctly and interpret cause and effect 482C Utilise and interpret statistical analyses 572D Undertake a sensitivity analysis for all options 632E Ensure documentation reflects the evaluation and conclusions 672F Adjust management information systems to meet information processing objectives 71Summary 76Learning checkpoint 2: Analyse information and knowledge 77
Topic 3: Take decisions on business issues identified 813A Ensure information is sufficient, valid and reliable to support a decision 823B Utilise risk management plans to determine courses of action 853C Utilise appropriate quantitative methods to assist decision-making 893D Consult specialists and other relevant groups 923E Ensure decisions taken are within a person’s delegated accountability 1003F Make timely decisions consistent with organisational guidelines, procedures,
objectives and values 103Summary 109Learning checkpoint 3: Take decisions on business issues identified 110

© Aspire Training & Consulting 7
Topic 1Obtain information relevant to business issues
Review and analyse staff feedback Once data is collected, it is important that you close the loop by reviewing and acting upon it and, most importantly, by feeding back the results and actions to staff. This can be achieved by sharing at least some of the results with the whole organisation and setting benchmarks for improvement. Always involve staff in implementing initiatives towards meeting the new goals, such as a team bulletin board, regular team updates and reports in staff meetings.
In reviewing staff feedback, it may be a good idea to divide data into two categories: results to be addressed at higher management level and results to be addressed at departmental level. This way appropriate actions and decisions can be made more effectively and efficiently. Follow the steps below when reviewing feedback data.
The feedback review process
1Look for a theme
What has been reported by the most staff and who is most affected?
2Look for sub-themes
Is one team happy with the workplace culture and others not?
3Distribute findings
Compile data using appropriate analysis methods and make it available to staff, even if you are unsure of the actions to take.
4Identify areas to address
Decide where changes or actions are needed.
5Consult with a range of stakeholders
Seek input on changes from peers, management, affected staff and even customers.
6Formulate changes
Design, implement and document strategies for change.
7Develop objectives
Set targets and measures to determine if/when objectives are met.

© Aspire Training & Consulting 11
Topic 1Obtain information relevant to business issues
Tips for collecting customer feedbackThe methods you choose to collect customer feedback data depends on your customer base and the type and size of your business. However you seek or receive customer feedback, you should follow these tips:• Make it as easy as possible for your customers to give
their suggestions or ideas for improvement.• Ensure you take the time to action feedback.• Thank customers for taking the time to provide their
feedback.• Where possible, inform the customers of the action
you have taken as a result of their feedback.
Analyse customer feedbackIt is important that you analyse and act upon the data collected to identify trends and improvement opportunities and inform decision making and change as necessary. Customer feedback, coupled with your own analytical data, gives you a clearer insight into customer needs and habits and where you might be falling short in meeting those needs or capitalising fully on those habits. Here are some tips for managing the volume of feedback you may encounter.
Deal with volume
With the advent of the internet and social media, customers are actively providing feedback and you will likely have more feedback and ideas than you can manage! Analysing and reviewing this volume of data can be a real challenge for some organisations and many have employed whole departments specifically for this role.
Identify trends
No matter what you do, you will not be able to act on every piece of feedback you receive. You won’t have the resources and you may not want to act on everything. So the challenge is to analyse the data and look for trends. Issues that are mentioned often, by a range of customers and via a range of data collection methods, will be the issues that must inform your decision making and therefore must be documented and disseminated within your organisation.
Review business performance data The performance activities of an organisation must be documented to provide a record of the operation of the business. The data and information records kept are analysed to monitor, control and determine the performance and effectiveness of the systems the organisation has in place. Records are also kept in accordance with legislative requirements and can be used to reconcile various accounts, investigate anomalies, provide information to regulatory bodies and provide evidence at audit time. Performance must continue

16 © Aspire Training & Consulting
BSBINM601Manage knowledge and information
Continuous data analysisWhen data is collected on an ongoing basis, the analysis cycle must also be ongoing. Effective data analysis is critical in supporting actions and making informed decisions. Data analysis is the process of inspecting, extracting, categorising, understanding and annotating data in order to discover useful information, identify trends and issues and support decision-making. In order to analyse raw data, you need to follow a number of steps.
Annotate
• Develop a process for keeping notesfrom individual sources.
• Consolidate these pieces of informationtogether.
• Identify and note themes.
Summarise and generalise
• Draw some relative generalisations(rather than conclusions) from the wholerange of data collected.
• What patterns do you notice? • What are the deviations? • What are the emerging themes? • Summarise and generalise using figures
and quotations.
Code
• Develop classifications by which togroup your data; for example, ‘Orderprocessing’, ‘Order shipment’ and ‘Post-sales service’.
• Code data so that it can be used andinterpreted.
• Codes must be mutually exclusive. • Codes must be exhaustive. • Codes must be applied consistently
throughout.
Surmise
• What pattern do you see? • What does this graph tell you? • Who could use this data? How could
they use it? • Why is this data shown in a line graph?
Concurrent analysisOften, the concurrent analysis of two or more different sets of data, can lead to a more reliable identification of trends, problems or issues that need to be addressed. You are likely to gain information from different perspectives. The more information you receive, the better chance you have of identifying issues. Consider the following process for comparing two different samples of data collected from customer feedback.
Concurrent data analysis
• Collect data from two different sources: from surveys where responses arequantified and qualitative feedback from focus groups.
• Analyse individual findings. • Consolidate quantitative and qualitative findings to obtain a picture; for example,
response and order processing times; opinions relating to service quality. • Summarise and report the findings to enable decision-making.

32 © Aspire Training & Consulting
BSBINM601Manage knowledge and information
Corporate knowledge, often referred to as intellectual property or information ‘in someone’s head’, is one of the most valuable assets an organisation possesses. Knowledge built up over time by the teams and individuals who work for the organisation cannot be easily replaced when these people leave. Instead, it must be accessed and managed regularly through informal and formal channels. If corporate knowledge stored in people’s heads is not captured, organisations may suffer consequences resulting in loss in productivity, loss of experience and a reduced competitive edge.
Capture unrecorded knowledge and informationMost corporate knowledge is captured and recorded in a range of formal and informal ways by most organisations. However, some intellectual property and corporate knowledge may not be recorded at all and remains in the minds of those that possess it, rather than being made available for sharing and mutual benefit across the organisation. Unfortunately, such corporate knowledge is often lost when the employee retires or leaves the organisation. While some consequences may have a minimal impact, some can cause major difficulties.
Failure to capture corporate knowledge can lead to:• repetition of work or research that has already been conducted by others• loss of intangible information about a client that might help build or capitalise on
existing relationships• loss of information about a client, leading to poor or decreased service delivery• loss of competitive edge• unnecessary cost• wasted time and inefficiency finding out information that already exists• inability to foster collaboration within and across teams• staff forgetting information over time• departing staff taking the knowledge with them to a competitor if ownership by the
organisation is not established through documentation.
Example: capture knowledge Lucas is about to travel to China to meet a customer and close a deal. He searches his organisation’s client management system and finds that Jasmyn, a manager of another department, has previously done business with this client. Lucas makes an appointment with her to try to get some information about the client that might give him the inside edge. He finds out that his client speaks very little English. Jasmyn tells Lucas that she used some simple cards with both Chinese and English translations to assist discussions and aid communication. As a result of Jasmyn’s information, Lucas is able to better prepare for his trip. He wishes Jasmyn had included this information in the client database.
1E Utilise and review formal and informal networks to access corporate knowledge not held in formal systems
© Aspire Training & Consulting 45
Topic 2Analyse information and knowledge
‘How’ questions
How will these answers contribute to existing knowledge?
For example: • Confirm what we already know • Teach us more about our
customers • Challenge current thinking
How is this study relevant?
For example: • It will help us improve
performance • It will identify new selling
opportunities • It will identify cost-saving
opportunities • It will identify service
improvement opportunities
Types of objectives
Objectives for collecting data may relate to:
• providing an increasedunderstanding of operations
• identifying areas forimprovement
• identifying why we are failingor falling short of customerexpectations
• identifying new marketor product developmentopportunities
• monitoring effectiveness of anew strategy or process
• giving us an increasedunderstanding of our market
• identifying and justifying theneed for change
• calculating future resourcerequirements.
Confirm and revise objectivesAs you begin the analysis process, it might be necessary to clarify, alter or add to objectives. Once data is gathered, it may become apparent that not all the planned research objectives can be fully answered. For example, a particular section of the target audience may not have adequately responded to a survey, or respondents may not have had all the necessary information to complete specific questions.
In addition to this, you may need to add to your original objectives, especially if you discover unexpected observations. For example, a bank manager’s original objective was to determine ‘How best to manage increased customer flow in the branch at lunch times’. When she identified that the long queues were the result of difficulties with completing applications, the new objective became ‘How to better manage personal loan applications’.
50 © Aspire Training & Consulting
BSBINM601Manage knowledge and information
Analyse patternsPatterns can be identified visually; for example, by plotting data in a comparative table or graph. Different visual representations are suitable for different types of data and the objectives of your analysis. For example, pie graphs are useful for showing market share, while line graphs indicate decreases or increases over a period of time.
When data is presented, analyse it carefully to see if you recognise whether any patterns are emerging. Sometimes, viewing data presented in more than one way can assist in identifying, clarifying and confirming a pattern. For example, if you analyse sales revenue over a year for a bathing suit manufacturer, you may see a pattern emerging where sales go up in the summer and down in the winter. Not all patterns are as simple as this, but the theory remains the same: You can identify patterns that will help you to predict what may happen in the future.
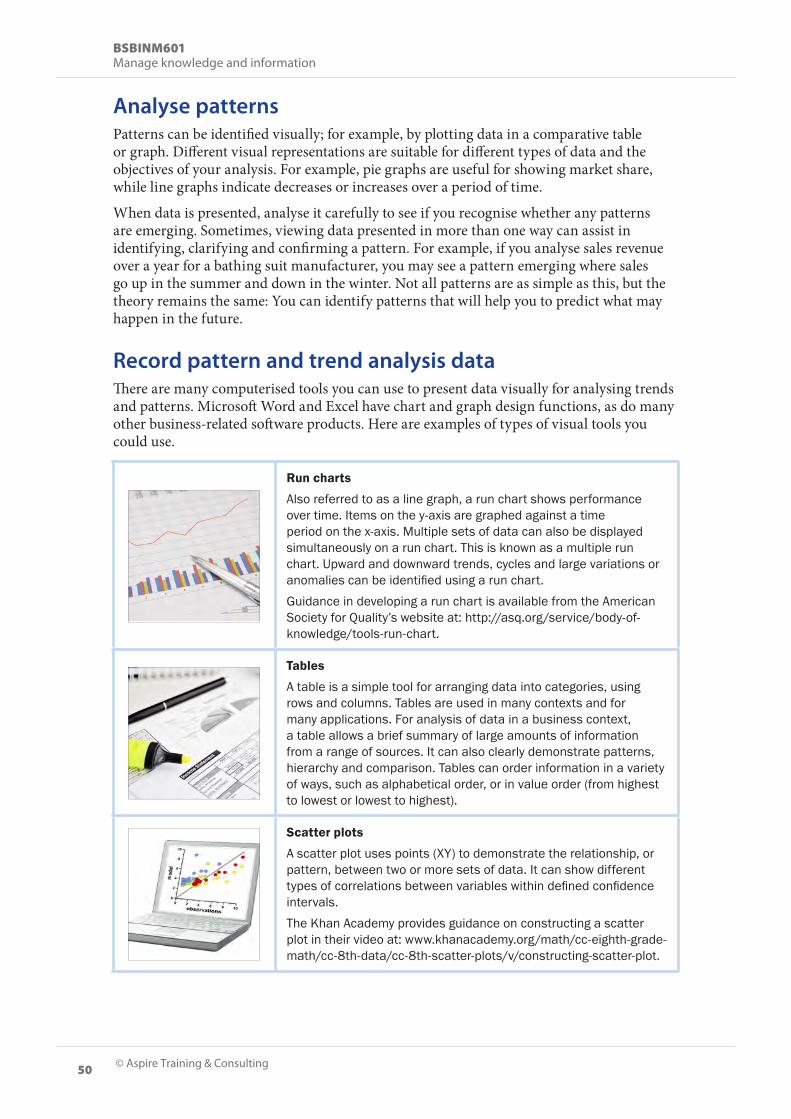
Record pattern and trend analysis dataThere are many computerised tools you can use to present data visually for analysing trends and patterns. Microsoft Word and Excel have chart and graph design functions, as do many other business-related software products. Here are examples of types of visual tools you could use.
Run charts
Also referred to as a line graph, a run chart shows performance over time. Items on the y-axis are graphed against a time period on the x-axis. Multiple sets of data can also be displayed simultaneously on a run chart. This is known as a multiple run chart. Upward and downward trends, cycles and large variations or anomalies can be identified using a run chart. Guidance in developing a run chart is available from the American Society for Quality’s website at: http://asq.org/service/body-of-knowledge/tools-run-chart.
Tables
A table is a simple tool for arranging data into categories, using rows and columns. Tables are used in many contexts and for many applications. For analysis of data in a business context, a table allows a brief summary of large amounts of information from a range of sources. It can also clearly demonstrate patterns, hierarchy and comparison. Tables can order information in a variety of ways, such as alphabetical order, or in value order (from highest to lowest or lowest to highest).
Scatter plots
A scatter plot uses points (XY) to demonstrate the relationship, or pattern, between two or more sets of data. It can show different types of correlations between variables within defined confidence intervals. The Khan Academy provides guidance on constructing a scatter plot in their video at: www.khanacademy.org/math/cc-eighth-grade-math/cc-8th-data/cc-8th-scatter-plots/v/constructing-scatter-plot.

54 © Aspire Training & Consulting
BSBINM601Manage knowledge and information
Applications
Here are some other situations/problems where a cause and effect diagram may be implemented:
• Continued staff resignations • Decreasing sales • Increasing dissatisfaction with technology • Cross-departmental communication problems • System problems • Increased injuries at work • Increased absenteeism/sick leave
Cause and effect analysis processA fishbone diagram is often used to map the outputs of cause and effect analysis. Its name derives from its appearance resembling the skeleton of a fish when completed. It is also known as a cause and effect herringbone or Ishikawa diagram (after its developer). Cause and effect diagrams provide a structured approach to help people push beyond symptoms of a problem and to reach possible root causes.
The problem is defined on the right-hand side of the diagram then the bones of the fish represent categories of causes. Further possible causes are then brainstormed for each category, identifying as many causes as possible.
There are four steps in completing a cause and effect analysis.
Cause and effect analysis
1 Identify the problem.
Begin by stating the problem; for example, ‘Employees are late for work’. Ideally, the problem would be framed as a ‘Why’ question; for example, ‘Why are employees late to work?’
2 Work out the major factors involved.
Determine a set of branches, or bones, adding them vertically off the spine of the fish. These branches are labelled with different categories and represent different factors that might be involved. The categories you use are up to you. There are a few standard choices depending on your business and the purpose and subject of the analysis. Some fishbone diagrams simply use branches labelled ‘when’, ‘what’, ‘who’, and ‘where’.

© Aspire Training & Consulting 63
Topic 2Analyse information and knowledge
Sensitivity analysis is a method used to determine how outcomes are affected by changes. Also known as what-if analysis, it is often used to compare different scenarios and their potential outcomes based on a series of ‘what ifs’.
Banks use sensitivity analysis to determine the borrowing capacity of clients. They calculate repayments based on current interest rates and compare them to income. They then apply sensitivity analysis by assuming a series of ‘what ifs’, such as:• ‘What if interest rates rise 0.25 per cent or 0.45 per
cent? Could the client still afford the repayments?’
Single variable sensitivity analysis is the analysis of the change a single variable might have on an activity; for example, upgrading equipment to improve performance; increasing the cost of a product. It is possible, and often preferable, to conduct a multi-variable, or multi-channel sensitivity analysis when more than one variable is experimented with. This better reflects real projections; for example, deciding to relocate to new premises to be able to expand operations and develop a new product range.
Uses of sensitivity analysisSensitivity analysis has broad application in business and can be applied to almost any decision making process, regardless of the problem or the industry. The information below outlines some applications and examples of sensitivity analysis.
Applications
Sensitivity analysis has many uses, including: • identifying points where values, thresholds or break-even values have
significant impact on the outcome of a situation • identifying sensitive variables • understanding relationships between input and output variables • determining the best options for a solution or strategy • eliminating inferior, inappropriate or ineffective solutions • assessing the inherent risk of a strategy or solution • testing the robustness of a decision before implementation.
2D Undertake a sensitivity analysis for all options

68 © Aspire Training & Consulting
BSBINM601Manage knowledge and information
Steps to follow
• Describe the context/objectives of data collection. • Present an overview of the situation/issue. • Include all the supporting data. • Define parameters and other terms if not obvious. • Describe methodology used. • Present findings clearly, one by one. • Draw conclusions. • Summarise findings and relate back to objectives.
Presentation do’s
• Use visual tools, such as tables and graphs, to present and support arguments. • Check for errors in your work. • Use clear, simple language. • Assume a common baseline of numeracy, literacy and understanding of content for
your audience. • Identify any limitations in the data or findings. • Use proportions to assist in understanding data; for example, ‘nearly three quarters
(74 per cent) of participants…’ • Always write figures as numbers; for example, 25% instead of twenty-five per cent. • Use rounded figures in text and raw data in tables.
Presentation don’ts
• Use jargon or department specific terms if there is also a possible wider audience. • Include data that you are unsure of or you have quality concerns about. • Assume single or specific use only of data, unless otherwise advised. • Use subjective language or descriptions; for example, ‘soared to 85 per cent’.

© Aspire Training & Consulting 73
Topic 2Analyse information and knowledge
Determine requirements
Ask yourself: What are our information needs and objectives? For example:
• Do you need information on-the-spot or within a given time frame to do your workeffectively?
• Do multiple staff need to access the same information? • Do they need to access it concurrently? • How accurate does the information need to be? • How detailed does it need to be? • Do you need information for operational or strategic purposes, or both?
Quantify needs
You should also quantify your information needs and objectives. For example, if you need information quickly – how quickly? Within 24 hours, 2 days, immediately? When you know this, you can formulate your own checklist for measuring the success of the system in meeting those objectives.
Use a checklist
Here is a simple example of points to include in a checklist. Customise it to suit your own needs and objectives.
• Policy and procedure data to be easily accessible immediately by all staff. • Only management level staff to have access to personnel files. • Access to departmental shared drives by permission only to staff within that
department. • Requests for IT assistance actioned within 24 hours.
Assess effectivenessWhen you know what your knowledge management objectives are, you then can proceed to measure the effectiveness of the system in meeting those objectives. This can be done by assessing actual performance against objectives and expectations. You can use a checklist to guide this process. Assessment can include observation, feedback from your team and other teams across the organisation, management advice and examination of anecdotal evidence or instances where there has been a problem in recent times. You may even choose to conduct an internal survey to assess effectiveness and identify areas for improvement.

© Aspire Training & Consulting 81
Topic 3 Take decisions on business issues identified
A key responsibility for a manager or leader is to make decisions based on the research data and information that has been collected and analysed. To do this make sure there is sufficient evidence to support any decisions made. In this topic you will learn how to:3A Ensure information is sufficient, valid and reliable to support a decision3B Utilise risk management plans to determine courses of action3C Utilise appropriate quantitative methods to assist decision-making3D Consult specialists and other relevant groups3E Ensure decisions taken are within a person’s delegated accountability3F Make timely decisions consistent with organisational guidelines, procedures,
objectives and values

86 © Aspire Training & Consulting
BSBINM601Manage knowledge and information
The risk management processLeaders must rely on a range of strategies when making a decision. An organisation’s risk management procedures are in place to ensure decisions made are in accordance with defined strategies and that you have considered and planned for any risks involved.
The risk management process is a continuous cycle involving the following steps.
Risk management process
Identify risks
• What are the possible risks? • How many risks are there?
Assess risks
• How serious are the risks? • How likely are they to occur?
• What are the possible impacts orconsequences?
• What priority should be placed oncontrolling these risks?
Control the risks
• What strategies can we use to controlthe risks (accept, transfer, avoid,reduce)?
• What is involved in this?
• How much will it cost? • How long will it take? • What is the desired outcome? • How will controls be implemented?
Review controls
• Did the controls work? • How effective were they?
• Could they be improved? • What else can we do?
Determine risk levelsA risk assessment matrix may be developed and used to evaluate a risk, where likelihood and impact is identified to determine the level of the risk where these intersect on the matrix. High risks become the priorities for treatment or control. Moderate risks need management focus. Some low level risks may be resolved through internal control such as routine procedures.
Consider the likelihood and impact of an activity you have been involved with relating to financial management and use the following matrix to determine the risk level.
LIK
ELIH
OO
D
VERY LIKELYAcceptable risk
MediumUnacceptable risk
HighUnacceptable risk
Extreme
LIKELYAcceptable risk
LowAcceptable risk
MediumUnacceptable risk
High
UNLIKELYAcceptable risk
LowAcceptable risk
LowAcceptable risk
MediumMINOR MODERATE MAJOR
IMPACT
90 © Aspire Training & Consulting
BSBINM601Manage knowledge and information
Modelling
└ Modelling involves building a hypothetical scenario or series of scenarios and thenapplying a range of conditions and variables to assess impact. It can also be used as a risk management tool in the final stages of the decision-making process.
Cost–benefit analysis
└ Cost–benefit analysis enables you to decide the best course of action out of two ormore possible options by measuring the value of expected benefits for each course of action and comparing them to the costs.
Break-even analysis
└ Break-even analysis enables you to determine how many units of a product or servicemust be sold in order to break even in covering its cost. If a proposed solution not only breaks even but generates a profit, then it may be considered a good option.
Feasibility study
└ A feasibility study predicts whether a solution is achievable and can be implementedprofitably. For example, does a new product have the potential to generate profit based on the expected costs and the price that will be charged for it?
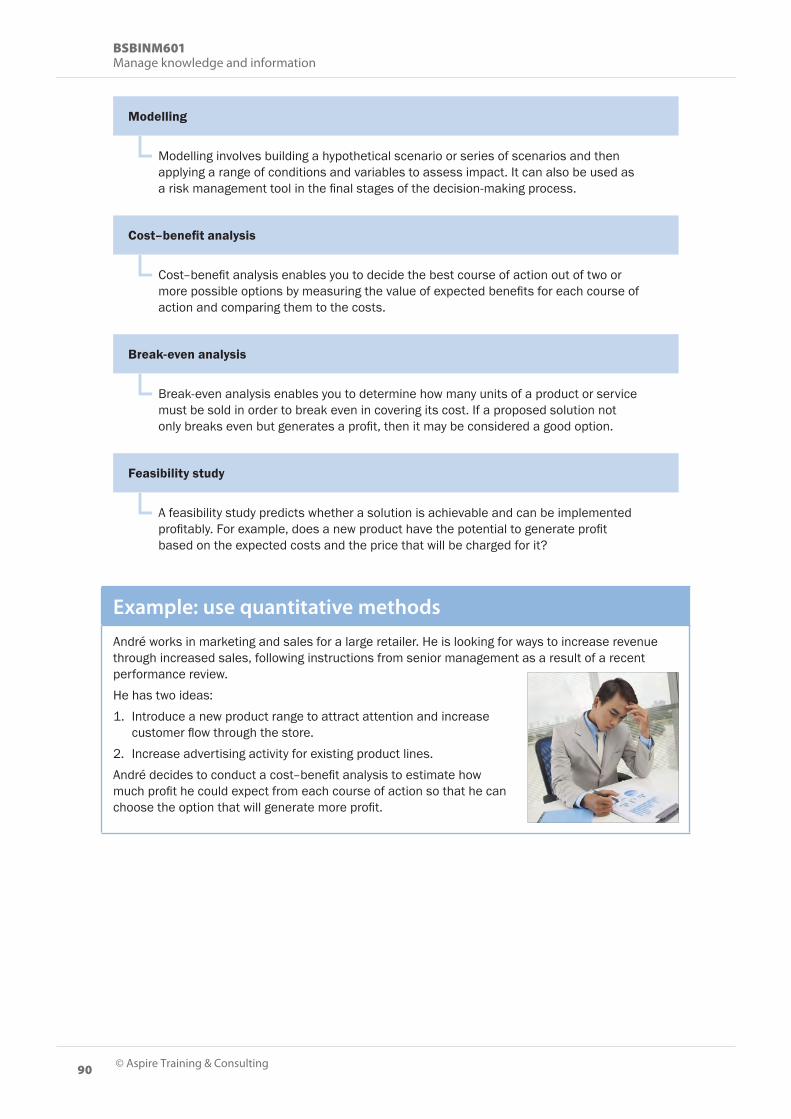
Example: use quantitative methodsAndré works in marketing and sales for a large retailer. He is looking for ways to increase revenue through increased sales, following instructions from senior management as a result of a recent performance review.He has two ideas:1. Introduce a new product range to attract attention and increase
customer flow through the store.2. Increase advertising activity for existing product lines.André decides to conduct a cost–benefit analysis to estimate how much profit he could expect from each course of action so that he can choose the option that will generate more profit.

94 U © Aspire Training & Consulting
BSBINM601Manage knowledge and information
Team/peers
Why:
• Get new ideas • Seek opinion • Test ideas • Leverage off experience
What:
• Can you think of anything else we can do? • What do you think of this? • Do you think this might work? • Has this ever happened to you before? • What did you do in a similar situation?
Managers
Why:
• Seek advice • Seek permission • Take direction
What:
• Will this be okay? • Can I …? • How do I …? • What do you want me to do about ...? • When do you need this by? • What do you want?
Staff
Why:
• Seek opinion • Seek buy-in • Seek cooperation
What:
• How would you feel if this happened? • How would it affect your job? • How can we assist you to do your job better? • How can we make you happier? • What help will you need to implement this? • Can you help us roll this out?
Community
Why:
• Seek opinion • Seek support • Gauge impact
What:
• What do you think of this? • Will you be upset if we …? • How will this impact you? • What are the pros and cons for you? • What would you like to see happen? • How will it help/hurt the community?

© Aspire Training & Consulting 121
Topic 4Disseminate information to the organisation
Once the information requested has been obtained, document it in preparation for disseminating it to the relevant people. Regardless of the simplicity or complexity of the information you need to ensure the information is uptodate, accurate, relevant and sufficient for the recipient and that is prepared for delivery in the most appropriate format. It is also important that you monitor and regularly update information held in databases that are accessed directly by others to ensure the currency of all information released.
Consider the audienceBe sure that the presentation of information is appropriate to the target audience. You can tailor the way you document the information by understanding who they are (for example, staff, customer, board member), the purpose in requesting the information, their different backgrounds, experience, skills and knowledge, the different language and literacy needs of various users, their location, and whether the information is disseminated to a group or an individual.
Examples of different audience information requirements are provided here.
1 An operator might need to accessand engage with information to
help with their day-to-day tasks while a manager may need it to make strategic improvements for the business.
2 A staff member in a remotebranch may prefer the information
documented in a written report rather than conveyed via a teleconference.
3A group may need the informationpresented in a slide format. 4A customer will need information that
is easy to understand and free of industry jargon or technical details.
4B Document information and ensure it is up to date, accurate, relevant and sufficient for the recipient

126 © Aspire Training & Consulting
BSBINM601Manage knowledge and information
A communication plan is a useful tool to help manage the appropriate, timely and effective dissemination of information within the organisation. Such a plan identifies the strategies used to distribute the information to others in line with a range of organisational policies and procedures, such as those relating to privacy and confidentiality, as well as aligning with the organisation’s overall business strategy and objectives.
A communication planA communication plan provides guidelines and strategies to help you share the information you have gathered prior to implementing a project or a change resulting from a new decision being made. It answers questions such as, ‘Does the information have restricted access?’, ‘What strategies can be used to disseminate the information?’, ‘Are there any confidentiality or privacy issues attached to the information?’, ‘What time lines need to be considered?’, ‘Do I need to consider the information’s language, style and format?’
If no plans exist it may be your job to develop them so everyone involved in the organisation understands the procedures to be followed when disseminating information.
Here is some information on the benefits and features of a communication plan.
Benefits of a communication plan
An effective communication plan assists a leader by allowing them to:
• target communicationsaccurately
• follow a predetermined structurefor dissemination
• make communications moreefficient and effective
• ensure consistent messaging • maximise access to information • manage time efficiently.
Communication plan features
An effective communication plan: • has clear objectives • defines all audience segments
and identifies their variousinformation needs
• details a time line fordissemination
• details roles and responsibilitiesfor dissemination
• identifies appropriate formatsand tools for delivery
• is accessible • aligns with organisational
values, standards andobjectives
• aligns with regulatory andlegislative requirements
• is monitored and evaluated forcontinued success.
4C Develop and review communication plans and disseminate information in accordance with privacy policies

130 © Aspire Training & Consulting
BSBINM601Manage knowledge and information
For example, an annual or progress report written for key stakeholders of the organisation would have a different tone and language conventions to an internal article on the staff intranet. Similarly, a formal meeting of board members should be conducted in a professional manner with complex information presented in a respectful and serious tone using industry terminology and sophisticated graphics. However, organisational information presented to staff in an internal training session could be lighter in tone and infused with a sense of fun to maintain audience interest and encourage participation. Pay attention to the tone of your voice and the pace at which you speak when communicating verbally.
Visit this website for further communication tips: www.business.qld.gov.au/business/running/managing-business-relationships/communicating-effectively-for-business/written-communication-for-business.
Example: adjust tone and languageWhen summarising the findings of a recent sensitivity analysis at a meeting of the finance department, the following concluding statement was made:
• As a result of the multi-level manipulation of variables, undertaken during sensitivity analysis andresultant financial modelling, a correlation coefficient of 0.89 was established between ice creamsales and warm weather, indicating a strong causal effect.
The same information was delivered to the shop assistants:
• A recent study of ice cream sales showedthere was a strong pattern between ice creamsales and weather temperatures. It showedthe warmer days were likely to result in higherice cream sales.
Disseminate informationChoose the most appropriate method of communicating the information. Always consider the number of people who need the information, the type of information, its security status, the abilities of the audience and when the information is needed.
Here is a range of different dissemination strategies for different situations. Which ones do you regularly use?
Dissemination methods
• Provide confidential information via a formal presentation to the executive committee. • Conduct a teleconference or videoconference to staff in different locations. • Email the dates of a conference to a manager. • Telephone information about a customer to the sales manager. • Hold an electronic presentation for staff. • Provide a written report and hand it personally to the person who requested it. • Provide copies of correspondence to a project manager. • Source and provide a training DVD as requested by the HR manager.
v116
5

© Aspire Training & Consulting 135
Topic 4Disseminate information to the organisation
Consequences
Failure or lack of quality can also result in the following consequences, for the overall performance of the organisation:
• Inefficiency • Failure to identify and capitalise on improvement opportunities • Failure to improve and maximise performance • Waste of time, resources, money, opportunity • Loss of competitive edge • Failure to predict trends and forecast accurately • Inability to effectively plan • Loss of business • Loss of custom
Monitor the system The proliferation of technology in the workplace has aided the collection and analysis of data in recent years. It has also meant an increase in the types and amount of data that can be captured and processed. Your KMS should undergo an ongoing continuous improvement process to ensure data is efficiently captured, processed and available for easy access. Part of your overall KMS strategy should include an action plan for scheduling and allocating responsibilities for monitoring and evaluating systems on an ongoing basis. The information below outlines how the continuous improvement cycle relates to continuous improvement of a KMS.
Plan
• Determine or revisit objectives of theKMS.
• Develop strategies to meet thoseobjectives.
Do
Implement strategies; for example: • install and roll out new systems • adjust existing systems.
Check
Evaluate the success of strategies and actions to measure success; for example: Are identified information needs of the organisation being met or exceeded? If not, why not?
Act
Make further adjustments to facilitate continuous improvement.
Make improvementsRevisit the maturity model of a KMS (basic, operational, strategic) and use it as a benchmark for measuring current performance and future goals. When suggesting improvements, you may need to monitor and review the organisation’s policies and procedures to identify whether they need to be changed to meet the improvements.

© Aspire Training & Consulting 139
Topic 4Disseminate information to the organisation
• diminished protection of confidentiality and privacy of information• ineffectiveness of security measures• barriers to work–life balance.
Example: design efficient information management systems It is important for managers to regularly conduct research and keep up to date with best practice. The following websites provide information about the risks and trends associated with BYO devices in business:
• Aspect Legal at: www.aspectlegal.com.au/article/byo-devices-the-risks-and-trends/ • CIO Magazine at: www.cio.com/article/2396336/byod/all-about-byod.html
The following report describes best practices for an efficient knowledge management system: • Getting Knowledge Management Right: Five Best Practices for a Better Service Experience,
www.oracle.com/us/products/applications/getting-knowledge-managt-right-wp-1353041.pdfIt was published by Oracle, November 2011.
Practice task 21 1. Explain why it is crucial to regularly test knowledge management systems to ensure they meet
information needs.
2. Research best practices for a knowledge management system, then choose a best practicestrategy you have identified. Determine how you might implement this strategy, and identify thebenefits and challenges of the practice. Complete this table.
Best practice:
Implementation
Benefits
Challenges