Embed Size (px)
Citation preview
BioOne sees sustainable scholarly publishing as an inherently collaborative enterprise connecting authors, nonprofit publishers, academic institutions, researchlibraries, and research funders in the common goal of maximizing access to critical research.
Species limits and integrated taxonomy of the Idaho ground squirrel (Urocitellusbrunneus): genetic and ecological differentiationAuthor(s): Jessica L. Hoisington-Lopez, Lisette P. Waits and Jack SullivanSource: Journal of Mammalogy, 93(2):589-604. 2012.Published By: American Society of MammalogistsDOI: http://dx.doi.org/10.1644/11-MAMM-A-021.1URL: http://www.bioone.org/doi/full/10.1644/11-MAMM-A-021.1
BioOne (www.bioone.org) is a nonprofit, online aggregation of core research in the biological, ecological, andenvironmental sciences. BioOne provides a sustainable online platform for over 170 journals and books publishedby nonprofit societies, associations, museums, institutions, and presses.
Your use of this PDF, the BioOne Web site, and all posted and associated content indicates your acceptance ofBioOne’s Terms of Use, available at www.bioone.org/page/terms_of_use.
Usage of BioOne content is strictly limited to personal, educational, and non-commercial use. Commercial inquiriesor rights and permissions requests should be directed to the individual publisher as copyright holder.
Species limits and integrated taxonomy of the Idaho ground squirrel(Urocitellus brunneus): genetic and ecological differentiation
JESSICA L. HOISINGTON-LOPEZ, LISETTE P. WAITS, AND JACK SULLIVAN*
Department of Fish and Wildlife, CNR Room 105, P.O. Box 441136, University of Idaho, Moscow, ID 83844-1136, USA
(JLH, LPW)
Department of Biological Sciences, LSS Room 252, P.O. Box 443051, University of Idaho, Moscow, ID 83844-3051,
USA (JS)
* Correspondent: [email protected]
Allocation of evolutionary divergence into species level versus subspecies ranks is critical for conservation and
management. Urocitellus brunneus (Idaho ground squirrel; formerly Spermophilus brunneus) is currently
apportioned into 2 subspecies, U. b. brunneus and U. b. endemicus, but recent studies have suggested elevation
to distinct species based on differences in pelage, bacular morphology, genetic data, timing of life-history cycle,
and behavior. Following recent movements toward integrated taxonomy, we use the cohesion species concept
to test whether both genetic and ecological data support species-level classification of U. b. brunneus and U. b.
endemicus. Eight microsatellite loci and mitochondrial DNA (mtDNA) sequence data were generated for 339
individuals from 14 localities for U. b. brunneus and 312 individuals from 11 localities for U. b. endemicus. The
null hypothesis of genetic interchangeability was tested with 2 independent data sets. First, we estimated an
mtDNA gene tree from control region and cytochrome-b sequences via parsimony, maximum-likelihood, and
Bayesian analyses. We then tested for evidence of recent migration using Bayesian clustering and coalescence
analyses of microsatellite data. The 2nd null hypothesis, that of ecological exchangeability, was tested using an
ecological niche-model analysis and a review of the literature based on morphology, habitat characteristics, and
behavior. Although divergence of mtDNA sequences between the subspecies was modest (,1%), there are no
haplotypes shared between the 2 taxa. There is strong support for monophyly of mtDNA haplotyes of U. b.
endemicus (posterior probability 5 0.94), with those from U. b. brunneus forming a basal grade. No evidence of
recent gene flow was detected; the Bayesian clustering algorithms of mutlilocus genotype data indicated
separate ancestry for both U. b. brunneus and U. b. endemicus. The ecological-niche model showed a
nonoverlapping niche for each taxon, allowing for the possibility of differential adaptation. We reject both null
hypotheses based on the data, which supports elevation of U. b. brunneus and U. b. endemicus as distinct
species.
Key words: cohesion species concept, control region, cytochrome b, microsatellites, phylogeny, species delimitation,
Urocitellus brunneus
E 2012 American Society of Mammalogists
DOI: 10.1644/11-MAMM-A-021.1
Species limits within the genus Urocitellus and relatives
(Helgen et al. 2009) have long been uncertain, and this is
particularly true of the taxonomy of U. brunneus (Idaho
ground squirrel). U. brunneus was 1st collected in 1913 and
described by Howell (1928) as a subspecies of Spermophilus
townsendii. Subsequently, Howell (1938) raised it to the rank
of species (and reallocated taxa from S. townsendii to S.
washingtoni), a taxonomic conclusion that has been unchal-
lenged for more than half a century. Recent molecular studies
(Harrison et al. 2003; Herron et al. 2004) have demonstrated
the paraphyly of the long-standing circumscription of
Spermophilus (Howell 1938), and the recent revision by
Helgen et al. (2009) allocated a clade of 12 species to the
genus Urocitellus. Yensen (1991) conducted a thorough study
of the morphology and distribution of U. (S.) brunneus and
suggested the recognition of 2 subspecies: U. (S.) b. brunneus
(northern Idaho ground squirrel) and U. (S.) b. endemicus
(southern Idaho ground squirrel). Several studies have
w w w . m a m m a l o g y . o r g
Journal of Mammalogy, 93(2):589–604, 2012
589
suggested that U. (S.) b. brunneus and U. (S.) b. endemicus are
more appropriately recognized as distinct species based on
differences in pelage, bacular and cranial morphology, allele
frequencies, and timing of life-history cycle and behavior
(Garner et al. 2005; Gavin et al. 1999; Gill and Yensen 1992;
Yensen 1991; Yensen and Sherman 1997).
Both subspecies of U. brunneus are narrow endemics that
occur in a region where changing land-use patterns are
degrading the habitat. U. b. brunneus is found in Adams and
Valley counties of west-central Idaho (Fig. 1) and was listed
as threatened under the United States Endangered Species Act
in 2000 (United States Fish and Wildlife Service 2000). The
primary threat is invasion of meadows by conifers due to fire
exclusion (Yensen and Sherman 1997). U. b. endemicus is
found in Washington, Gem, and Payette counties (Fig. 1) and
is a candidate for listing under the Endangered Species Act.
Primary threats to U. b. endemicus include habitat deteriora-
tion from rangeland activities and the introduction of invasive
plants such as Bromus tectorum (cheatgrass) and Tae-
niatherum asperum (medusa head—Yensen 1999; Yensen
et al. 1992).
Given the vulnerability of the species and the uncertainty in
taxonomic status, additional research is necessary to evaluate
the hypothesis that U. b. endemicus and U. b. brunneus should
be recognized as distinct species. The topic of species
delimitation has been greatly debated in the literature (e.g.,
Bacon and Bailey 2006; Harrison et al. 2003; Jouventin et al.
2006; Stockman and Bond 2007; Yu et al. 2004), and this
debate has become increasingly contentious with the ascen-
dance of DNA barcoding (e.g., Papadopoulou et al. 2009;
Rubinoff 2006). This current debate also overlaps the classical
discussion of numerous species concepts such as biological
(Mayr 1969), ecological (Wiley 1978), genetic (Nei 1972;
Palmer and Zamir 1982), phylogenetic (Cracraft 1983),
evolutionary (Simpson 1951), cladistic (Wiley 1978), and
cohesion (Templeton 1989). Furthermore, the definition and
use of the subspecies concept has been controversial (e.g.,
Burbrink et al. 2000; Haig et al. 2006; Zink 2004). Multiple
definitions have been proposed (Avise and Ball 1990; Haig
et al. 2006; Mayr 1969; Templeton 2001), whereas some have
argued that subspecies have no real objective meaning
(Burbrink et al. 2000; Wilson and Brown 1953; Zink et al.
2000). Our view is that formal recognition of groups of
populations that are differentiated from others at multiple
independent loci or character systems, or both (e.g., Giannasi
et al. 2001; Page and Charleston 1997), is both pragmatically
useful and biologically relevant.
Because most conservation legislation assigns priority
based on some index of species diversity, species delimitation
is critical to conservation, and there is consensus that species
delimitation should integrate several sources of information
(e.g., Rissler and Apodaca 2007). One species concept that
explicitly calls for integration, the cohesion species concept
(Templeton 1989), has received considerable attention as
being both general (e.g., Hull 1997) and applicable (Avila
et al. 2006; Pons et al. 2006; Templeton 2001; Weisrock and
Larson 2006). The cohesion species concept incorporates
ideas from several definitions by requiring both genetic and
ecological data, and addresses some of the weaknesses of
focusing solely on 1 type of data (Sites and Crandall 1997).
Additionally, the cohesion species concept is both predictive,
and therefore testable, and applicable to situations where
putatively distinct species are allopatric, as is the case between
the 2 subspecies of U. brunneus.
Here, we apply the cohesion species concept (Templeton
1989) to the evaluation of the taxonomic status of U.
brunneus. The current taxonomic hypothesis (that there are 2
subspecies) leads to the prediction that detectable gene flow
has occurred between U. b. brunneus and U. b. endemicus.
The hypothesis that each taxon is a distinct species (Yensen
1991) is based on strongly differentiated bacular morphology;
under the cohesion species concept the morphologically based
taxonomic hypothesis predicts ecological differentiation
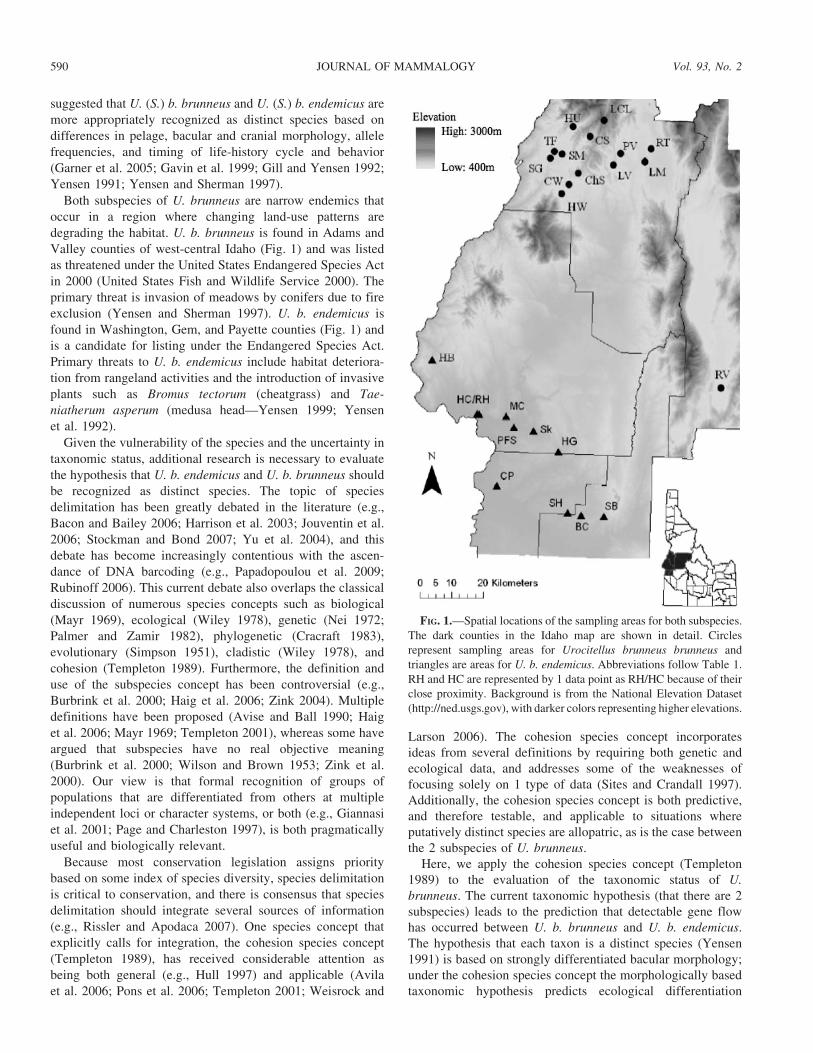
FIG. 1.—Spatial locations of the sampling areas for both subspecies.
The dark counties in the Idaho map are shown in detail. Circles
represent sampling areas for Urocitellus brunneus brunneus and
triangles are areas for U. b. endemicus. Abbreviations follow Table 1.
RH and HC are represented by 1 data point as RH/HC because of their
close proximity. Background is from the National Elevation Dataset
(http://ned.usgs.gov), with darker colors representing higher elevations.
590 JOURNAL OF MAMMALOGY Vol. 93, No. 2
between the taxa as well as genetic differentiation. Thus,
genetic differentiation is a necessary, but not sufficient,
condition for recognition of each taxon as distinct species.
Here, we collect mitochondrial DNA (mtDNA) sequence data
and microsatellite data at 14 sampling sites for U. b. brunneus
and 11 sites for U. b. endemicus and utilize phylogenetic
and population genetic analyses, as well as ecological niche
modeling, to evaluate the taxonomic status of U. brunneus
under the cohesion species concept (Templeton 1989).
MATERIALS AND METHODS
Species concept.—Application of the cohesion species
concept requires the assessment of 2 null hypotheses. The
1st of these is that the organisms sampled are derived from
a single evolutionary lineage (Templeton 2001), which must
be evaluated from a phylogenetic context. If the 1st null
hypothesis is rejected, the 2nd hypothesis of genetic or
ecological interchangeability, or both (Templeton 2001), can
be tested, for example, using ecological niche modeling
(Rissler and Apodaca 2007). Rejection of only 1 of the 2
hypotheses is evidence for subspecies classification and
rejection of both is evidence for species-level classification
(Templeton 2001). Presence of recent migration would be
evidence for retention of current classification. We view this
hypothesis-testing framework as a major strength of the
concept and as justification for its use.
Sample collection.—Hair samples were collected in 2002
(Garner et al. 2005) and 2006 (this study) from 14 sampling
areas for U. b. brunneus and 11 areas for U. b. endemicus
(Fig. 1; Table 1) using methods described by Garner et al.
(2005). Briefly, individuals were livetrapped and marked with
a small patch of dye. We then plucked approximately 50 hairs
from the tails of each individual. In the 2006 field season, we
added 7 sampling areas for U. b. brunneus (HU, HW, CW,
LCL, LM, RT, and RV; Fig. 1; Table 1) and 2 sites for U. b.
endemicus (MC and PFS) that were not sampled in 2002. We
also resampled 5 populations of U. b. brunneus (ChS, CS, LV,
SG, and TF) and 4 populations of U. b. endemicus (BC, RH,
HC, and SB). All procedures were approved by the University
of Idaho Animal Care and Use Committee (2006-35), Idaho
Fish and Game state permit (060308), and federal permit for
U. b. brunneus (subpermit FWSSRBO-5) and are consistent
with guidelines for use of wild mammals in research (Sikes et
al. 2011). Hair samples were stored in paper envelopes in a
plastic bag with silica and kept out of direct sunlight and
freezing temperatures. The desiccated samples were then
transferred to a 280uC freezer upon return to the laboratory
until DNA extraction. DNA was extracted from 10–15 hairs
using a modified protocol from the Qiagen tissue kit (Qiagen,
Valencia, California—Garner et al. 2005) and stored in 200 ml
of AE buffer in a 220uC freezer until polymerase chain
reaction amplification, which was conducted in a room
dedicated to low-quantity DNA. A negative extraction control
was included with every 16 samples to monitor for
contamination.
Mitochondrial DNA.—A 472 base-pair (bp) sequence of the
control region (CR) was obtained using the modified primer
pair L15774 and H16498 (Paetkau and Strobeck 1996; Shields
and Kocher 1991). Conditions for polymerase chain reaction
were described in Garner et al. (2005). Twenty individuals
from each sampling area were analyzed at the CR. A
subsample of ,7 individuals per study area was then
sequenced for the full 1,097-bp cytochrome-b (Cytb) gene.
The Cytb gene was sequenced in 2 shorter sections with a 200-
bp overlap because of the degraded nature of DNA extracted
using hair samples (Taberlet et al. 1999). We used a primer
pair from Harrison et al. (2003) and developed internal
primers using Primer3 (Rozen and Skaletsky 2000). The 1st
primer pair was L15033 (CCAACGGCGCATCTATATTT)
and H15915 and the 2nd pair was L14725 and H15326
(GGAATGCGAAAAATCGT). Polymerase chain reaction for
both Cytb primer pairs included negative controls and
consisted of 35 cycles (94uC for 30 s, 53uC for 60 s, and
72uC for 2 min), with an initial denaturation step of 94uCfor 5 min and final extension of 72uC for 5 min. Polymerase
chain reaction products for both loci were cleaned with
ExoSAPit (United States Biochemical Corp., Cleveland,
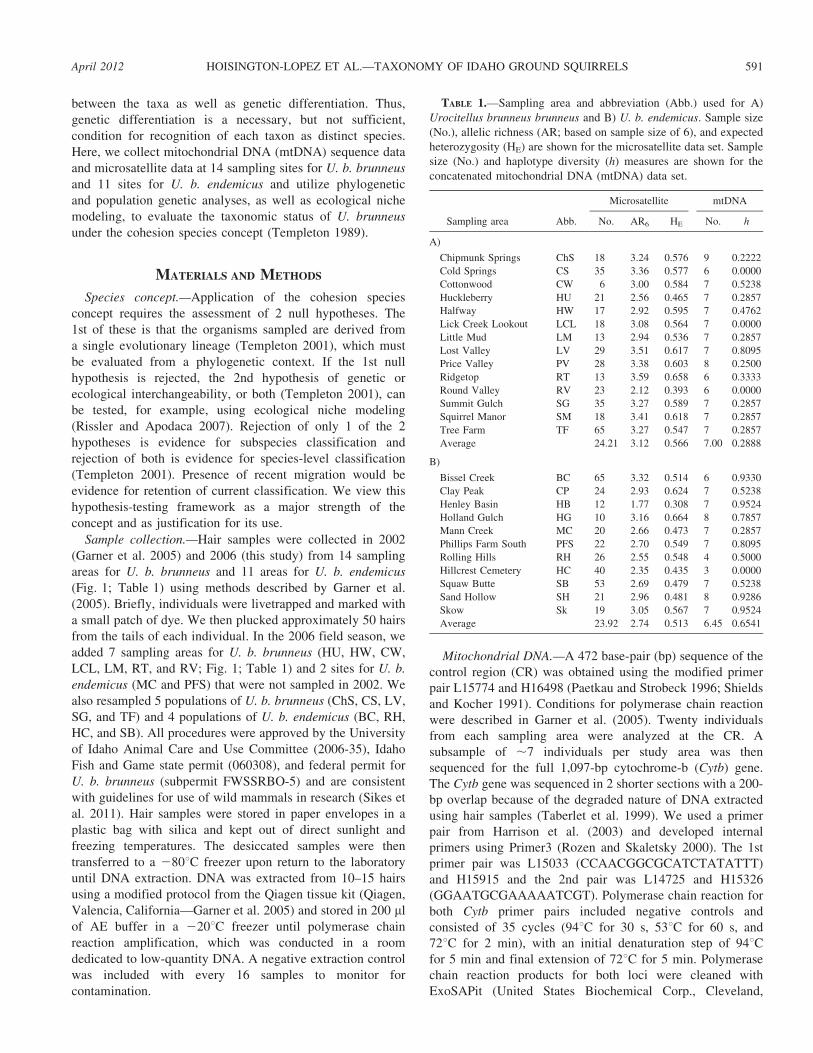
TABLE 1.—Sampling area and abbreviation (Abb.) used for A)
Urocitellus brunneus brunneus and B) U. b. endemicus. Sample size
(No.), allelic richness (AR; based on sample size of 6), and expected
heterozygosity (HE) are shown for the microsatellite data set. Sample
size (No.) and haplotype diversity (h) measures are shown for the
concatenated mitochondrial DNA (mtDNA) data set.
Sampling area Abb.
Microsatellite mtDNA
No. AR6 HE No. h
A)
Chipmunk Springs ChS 18 3.24 0.576 9 0.2222
Cold Springs CS 35 3.36 0.577 6 0.0000
Cottonwood CW 6 3.00 0.584 7 0.5238
Huckleberry HU 21 2.56 0.465 7 0.2857
Halfway HW 17 2.92 0.595 7 0.4762
Lick Creek Lookout LCL 18 3.08 0.564 7 0.0000
Little Mud LM 13 2.94 0.536 7 0.2857
Lost Valley LV 29 3.51 0.617 7 0.8095
Price Valley PV 28 3.38 0.603 8 0.2500
Ridgetop RT 13 3.59 0.658 6 0.3333
Round Valley RV 23 2.12 0.393 6 0.0000
Summit Gulch SG 35 3.27 0.589 7 0.2857
Squirrel Manor SM 18 3.41 0.618 7 0.2857
Tree Farm TF 65 3.27 0.547 7 0.2857
Average 24.21 3.12 0.566 7.00 0.2888
B)
Bissel Creek BC 65 3.32 0.514 6 0.9330
Clay Peak CP 24 2.93 0.624 7 0.5238
Henley Basin HB 12 1.77 0.308 7 0.9524
Holland Gulch HG 10 3.16 0.664 8 0.7857
Mann Creek MC 20 2.66 0.473 7 0.2857
Phillips Farm South PFS 22 2.70 0.549 7 0.8095
Rolling Hills RH 26 2.55 0.548 4 0.5000
Hillcrest Cemetery HC 40 2.35 0.435 3 0.0000
Squaw Butte SB 53 2.69 0.479 7 0.5238
Sand Hollow SH 21 2.96 0.481 8 0.9286
Skow Sk 19 3.05 0.567 7 0.9524
Average 23.92 2.74 0.513 6.45 0.6541
April 2012 HOISINGTON-LOPEZ ET AL.—TAXONOMY OF IDAHO GROUND SQUIRRELS 591
Ohio), sequenced, and analyzed on an ABI 3130 automatic
sequencer (Applied BioSystems, Bath, United Kingdom). Two
outgroups were sequenced for inclusion in the phylogenetic
analyses; sequences from U. washingtoni and U. columbianus
were obtained using the same polymerase chain reaction and
sequencing described above.
The raw sequences were aligned and verified in Sequencher
(version 4.5; Gene Codes Corporation, Inc., Ann Arbor,
Michigan) and MacClade (version 4.06; Sinauer Associates,
Sunderland, Massachusetts). Unique haplotypes were identi-
fied using TCS (version 1.2.1—Clement et al. 2000). All
haplotypes that differed by 1 or 2 mutations were verified
using the original chromatogram files at all (if .3 individuals)
or 3 randomly selected individuals. Haplotypes found in only
1 individual were reamplified and sequenced a 2nd time to
double-check the accuracy of the sequence.
Microsatellites.—Samples collected in the 2006 field season
were analyzed at the same 8 loci as samples collected in 2002
(Garner et al. 2005). Most loci were dinucleotides except for
D117, a tetranucleotide, and IGS110b, a trinucleotide repeat
(Garner et al. 2005). Polymerase chain reaction amplifications
were run in 7-ml reactions using the Qiagen multiplex kit
(Qiagen) with 3.5 ml of 23 multiplex polymerase chain
reaction master mix, 0.7 ml of 6 mM multiplex PCR Buffer
(Q-solution; Qiagen, Valencia, California), and 0.2 mM of
each primer (except 0.1 mM of IGS110b, 0.25 mM of GS26,
and 0.3 mM of GS3). The loci were divided into 2 multiplex
reactions as follows: A) GS12, GS17, GS26, and IGS110b;
and B) B109, B126, D117, and GS3. The polymerase chain
reaction amplification was the following: 1 cycle of 95uC for
15 min; a step-down procedure (0.3uC for A and 0.4uC for B)
per cycle of 94uC for 30 s, 53uC (54uC)–50uC for 90 s, 72uCfor 60 s for 10 cycles; followed by 30 cycles of 94uC for 30 s,
50uC for 90 s, 72uC for 60 s; and a final extension of 60uC for
30 min. All polymerase chain reactions contained a negative
control. Because forward primers were fluorescently labeled
(6-FAM, HEX, VIC, or NED) and size ranges of primers using
the same dyes were distinct, 1 ml of A and 1 ml of B of the
same individual were mixed with 10 ml of formamide and
0.33 ml of LIZ size standard and denaturated at 95uC for 2 min.
The denatured products were run on an ABI 3130xl (Applied
Biosystems, Carlsbad, California) and then analyzed in
Genemapper (version 3.7; Applied Biosystems). The data
collected for the 2006 season were then combined with the
data from Garner et al. (2005). In order to compare allele
sizes, four 2002 samples were rerun and used to obtain bin
ranges using the same allele sizes as Garner et al. (2005).
Phylogenetic analyses.—We created a minimum spanning
network (TCS—Clement et al. 2000), breaking the loops using
the criteria outlined in Crandall and Templeton (1993) and
Panchal and Beaumont (2007) to evaluate the relationship
between haplotypes. The mtDNA gene tree was estimated via
parsimony, maximum-likelihood, and Bayesian analyses using
PAUP* (Swofford 1998) and MrBayes (Huelsenbeck and
Ronquist 2001). Model selection was performed using DT-
ModSel (Minin et al. 2003); this method has an advantage
over the Akaike information criterion (AIC) and hierarchical
likelihood-ratio tests (e.g., Frati et al. 1997; Sullivan and
Swofford 1997) usually implemented in ModelTest (Posada
and Crandall 1998) in that it generally selects simpler models
that perform as well or better than the models selected by
likelihood-ratio tests and AIC (Abdo et al. 2005; Minin et al.
2003). Model selection was completed individually for the CR
and Cytb loci and for the combined concatenated data set. For
Cytb, the sequence was divided into multiple partitions using
1st, 2nd, and 3rd codon positions because rates usually differ
among the positions (e.g., Irwin et al. 1991). In addition, we
incorporated higher order structure of the Cytb locus by parti-
tioning the sequences into transmembrane, inner-membrane,
and outer-membrane sections using the sequences and
structure identified in Esposti et al. (1993). For each scheme
(see Table 2), we ran MrBayes for 5 million generations.
Convergence of Markoc chain Monte Carlo to the target
distribution was assessed by examining the standard deviation
of split frequencies. The harmonic mean was then calculated
for each partitioning scheme and the Bayesian information
criterion (BIC—Schwartz 1978) and DBIC scores were
calculated.
Phylogenetic trees also were estimated using a parsimony
and maximum-likelihood framework in PAUP* (version .4.0).
Searches were conducted under a heuristic framework using
the model selected for the concatenated data set. These
searches used tree-bisection-reconnection branch swapping,
on a starting tree generated by stepwise addition with 100
random-addition replicates. To estimate nodal support,
nonparametric bootstrap analyses were run with 200 replicates
and only a single tree retained (i.e., max-trees 5 1). In order to
determine statistical support for the hypothesis of reciprocal
monophyly between the 2 taxa, we conducted constrained
searches to find the best tree consistent with reciprocal
monophyly of the 2 taxa.
Analyses of genetic structure and gene flow using nuclear
DNA (nDNA) and mtDNA.—FST was calculated for mtDNA in
Arlequin (Excoffier et al. 2005) and for nDNA in GENEPOP
(Raymond and Rousset 1995). An evaluation of the hierar-
chical partitioning of mtDNA and nDNA genetic variation
within populations, among populations within subspecies,
and among subspecies was conducted with an analysis of
molecular variance (AMOVA—Excoffier et al. 1992) using
Arlequin (Excoffier et al. 2005). Additionally, we used the
microsatellite data set to evaluate the genetic distinctiveness of
subspecies by implementing Bayesian clustering algorithms
and estimating migration rates between the subspecies.
We estimated the number of migrants per generation in
GeneClass (version 2.0—Piry et al. 2004) using a Bayesian
approach with a 5 0.05 (Rannala and Mountain 1997).
Probabilities were estimated with 10,000 simulated individu-
als using the same simulation algorithm as Paetkau et al.
(2004). These calculations estimated the probability of an
individual being a resident from the sampling area (i.e., the
probability that an individual sampled is from the appropriate
taxon). In addition, we conducted assignment tests using the
592 JOURNAL OF MAMMALOGY Vol. 93, No. 2
program BayesAss (version 1.3—Wilson and Rannala 2003),
which was run for 3 million iterations with a sampling
frequency of 2,000 and a burn-in of 1 million generations.
Two independent runs with different initial seed values were
conducted to ensure convergence.
To determine the number (k) of genetic clusters (populations)
in the data set without predefined population or subspecies units,
we used a Bayesian clustering approach. STRUCTURE (version
2.1—Pritchard et al. 2000) was used to conduct several analyses
under different clustering models (k 5 2–20 clusters), each run
had a burn-in period of 50,000 Markov chain Monte Carlo
generations followed by sampling 100,000 generations. The
optimum value of k (i.e., the number of clusters suggested by the
data) was determined using criteria outlined in Pritchard et al.
(2000) and by calculating Dk (Evanno et al. 2005).
In addition, we analyzed the mtDNA data set under the
divergence with migration model (e.g., Hey and Nielsen 2004)
implemented in IMa2 (http://genfaculty.rutgers.edu/hey/soft-
ware#IMa2) to estimate migration rates between the 2 taxa and
to provide an estimate of time since divergence. We used
uniform priors, with upper bounds on h set to 200, upper bounds
for migration parameters of 5, and time since divergence set to
an upper bound of 10; we assumed a conventional mutation rate
of 1026 mutations per site per generation and a single
generation per year (Yensen and Sherman 1997). We conducted
multiple runs of 10 million generations, sampling every 100 and
with a 10,000-generation burn in. All independent runs
converged to similar parameters estimates.
Ecological interchangeability.—Even with a small number
of data points (as few as 5), one can predict potential species
distributions using ecological niche-modeling approaches
(Pearson et al. 2007). Thus, to test the hypothesis of ecological
interchangeability, we conducted ecological niche-model
analyses (Maxent version 3.0.6-beta—Phillips et al. 2006)
with 30 arc-second (approximately 1 km2) data layers of
minimum temperature, maximum temperature, precipitation,
altitude, and 19 bioclimate variables (worldclim version 1.4—
Hijmans et al. 2005; Table 3). We used the 25 localities where
genetic data were sampled (14 localities for U. b. brunneus
and 11 for U. b. endemicus). Analyses were run with response
curves, predictions, and a jackknife procedure to measure
variable importance with 10,000 simulations. Model perfor-
mance was evaluated using the receiver operating character-
istic analysis. This model evaluation is a sensitivity analysis of
the presence and absence points predicted correctly by the
model (Phillips et al. 2006). The area under the receiver
operating characteristic curve (AUC) provides an indication of
the fit of the data to the true distribution, where 0.5 5 random
distribution and 1 5 perfect fit (e.g., Carstens and Richards
2007).
RESULTS
Mitochondrial DNA diversity and structure.—Seventeen
unique haplotypes were detected for the Cytb gene region; 7 in
U. b. brunneus and 10 in U. b. endemicus. Twenty unique
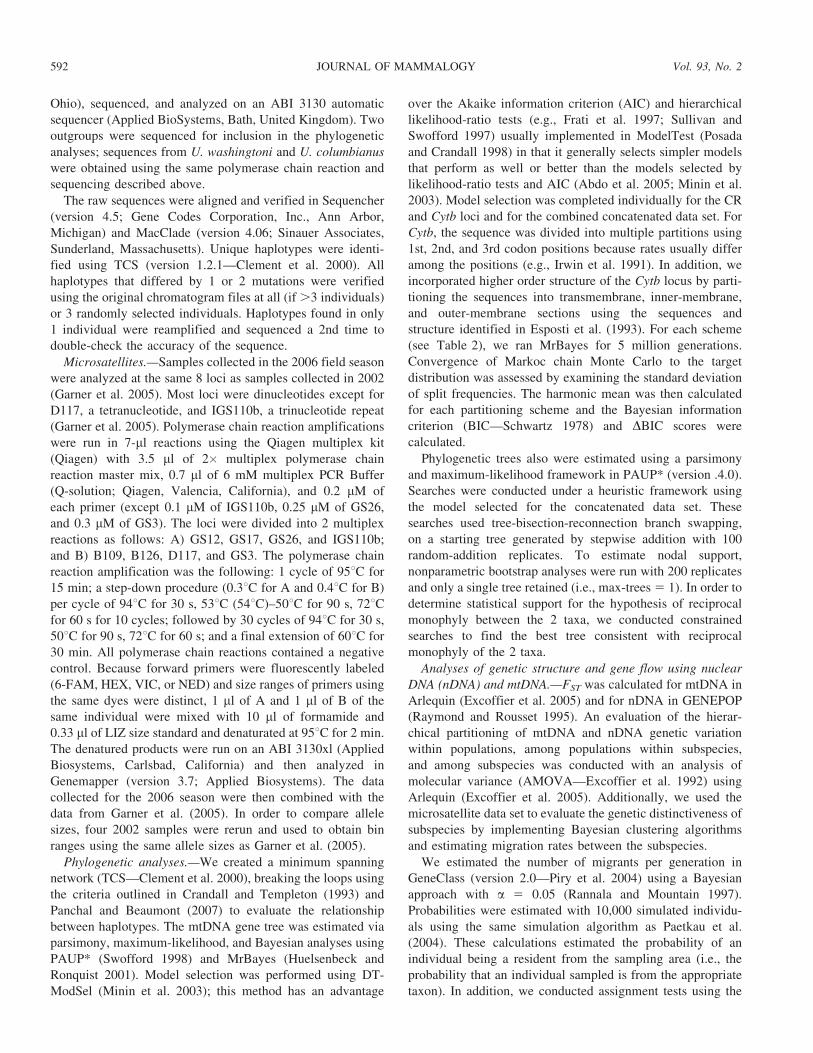
TABLE 2.—Different partitioning schemes used in DT-ModSel showing the partitioning scheme and model selected. MrBayes was run for 5
million generations for each scheme under the conditions listed in the text and the posterior probability of Urocitellus brunneus brunneus (Ubb)
and U. b. endemicus (Ube) monophyly and the probability of exclusivity was estimated. BIC 5 Bayesian information criterion; see text for
definition of partitions.
Scheme Partitions Model No. free parameters Average 2lnL BIC DBIC P (Ubb) P (Ube) P (exclusivity)
CR3codon CR HKY+I 16 23,207.9 6,466.9 0.0 0.94 0.37 0.99
CytB1st K2P
CytB2nd HKY
CytB3rd GTR
Twogene CR HKY+I 10 23,258.7 6,549.4 82.5 0.58 0.50 0.99
CytB HKY+CCRinoutrans CR HKY+I 18 23,260.0 6,577.5 110.7 0.59 0.52 0.98
inner HKY
outer HKY
transmembrane HKY+CCRsurftrans CR HKY+I 14 23,268.6 6,582.0 115.1 0.62 0.49 0.98
surface HKY
transmembrane HKY+CCRsurfQ CR HKY+I 22 23,269.4 6,609.1 142.2 0.66 0.46 0.98
surface HKY
transmembrane HKY+CQ1 HKY
Q2 HKY
CRinouQ CR HKY+I 26 23,268.3 6,619.6 152.7 0.63 0.48 0.98
inner HKY
outer HKY
transmembrane HKY+CQ1 HKY
Q2 HKY
All CR+CytB HKY+I+C 6 23,391.5 6,802.2 335.3 0.72 0.35 0.99
April 2012 HOISINGTON-LOPEZ ET AL.—TAXONOMY OF IDAHO GROUND SQUIRRELS 593
haplotypes were detected for the CR, 6 in U. b. brunneus
(Appendix I) and 14 in U. b. endemicus (Appendix II). The
concatenated data set contained 43 haplotypes, 13 in U. b.
brunneus and 30 in U. b. endemicus. There were no haplotypes
shared among subspecies. All sequences obtained were
deposited in GenBank (accession numbers JQ679123–
JQ679293). Haplotype diversity (h) within sampling areas
ranged from 0 to 0.95 (Table 1). Haplotype diversity was
higher in U. b. endemicus (0.65) than in U. b. brunneus (0.29).
Pairwise FST for mtDNA among populations within subspecies
ranged from 20.17 to 1 (0.55 average) for U. b. brunneus and
from 20.09 to 0.79 (0.28 average) for U. b. endemicus,
whereas pairwise FST between subspecies ranged from 0.12 to
1.0 (0.52 average). The AMOVAs detected significant
substructure at all hierarchical levels; 10.1% of the variation
was explained by subspecies groupings, 42.7% by variation
among populations within subspecies, and 47.2% within
populations (Table 4).
Phylogenetic analyses.—For the CR, there were 73 variable
sites, of which 40 were parsimony informative; removal of the
2 outgroups resulted in a decrease to 29 and 20, respectively.
For Cytb, there were 138 variable sites and 55 informative
sites; without outgroups there were 21 and 16, respectively.
The best partitioning scheme tested employed 4 partitions; the,
CR and Cytb into 1st, 2nd, and 3rd codon positions. This
resulted in a drastic improvement over a single partition
(DBIC 5 335.3; Table 2). Assigning the sequences into 2
partitions, CR and Cytb, also drastically improved the
likelihood score over a single partition (DBIC 5 82.5;
Table 2), whereas partitioning Cytb using the structure of
the gene improved the likelihood score from a single partition
(DBIC 5 110.7–152.7); however, this was not the best
partitioning scheme based on DBIC.
Regardless of partitioning scheme for the Bayesian
analyses, the mtDNA gene tree did not exhibit reciprocal
monophyly between the 2 U. brunneus taxa (average P-value
[exclusivity] 5 0.98; Table 2) for the concatenated data or the
CR and Cytb analyzed alone. The probability of monophyly in
either the U. b. brunneus or U. b. endemicus varied among
schemes, although a trend of a lower P-value (higher
probability) for U. b. endemicus (0.37 versus 0.94 [brunneus]
for best partitioning scheme) was observed (Table 2).
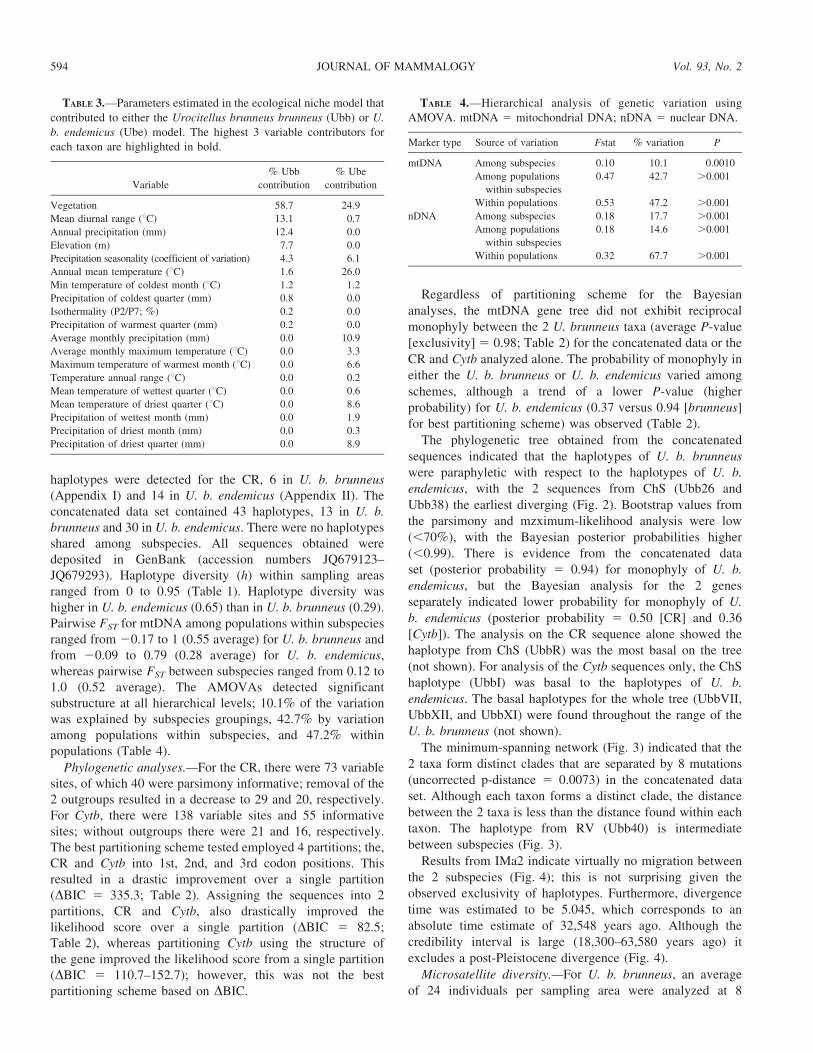
The phylogenetic tree obtained from the concatenated
sequences indicated that the haplotypes of U. b. brunneus
were paraphyletic with respect to the haplotypes of U. b.
endemicus, with the 2 sequences from ChS (Ubb26 and
Ubb38) the earliest diverging (Fig. 2). Bootstrap values from
the parsimony and mzximum-likelihood analysis were low
(,70%), with the Bayesian posterior probabilities higher
(,0.99). There is evidence from the concatenated data
set (posterior probability 5 0.94) for monophyly of U. b.
endemicus, but the Bayesian analysis for the 2 genes
separately indicated lower probability for monophyly of U.
b. endemicus (posterior probability 5 0.50 [CR] and 0.36
[Cytb]). The analysis on the CR sequence alone showed the
haplotype from ChS (UbbR) was the most basal on the tree
(not shown). For analysis of the Cytb sequences only, the ChS
haplotype (UbbI) was basal to the haplotypes of U. b.
endemicus. The basal haplotypes for the whole tree (UbbVII,
UbbXII, and UbbXI) were found throughout the range of the
U. b. brunneus (not shown).
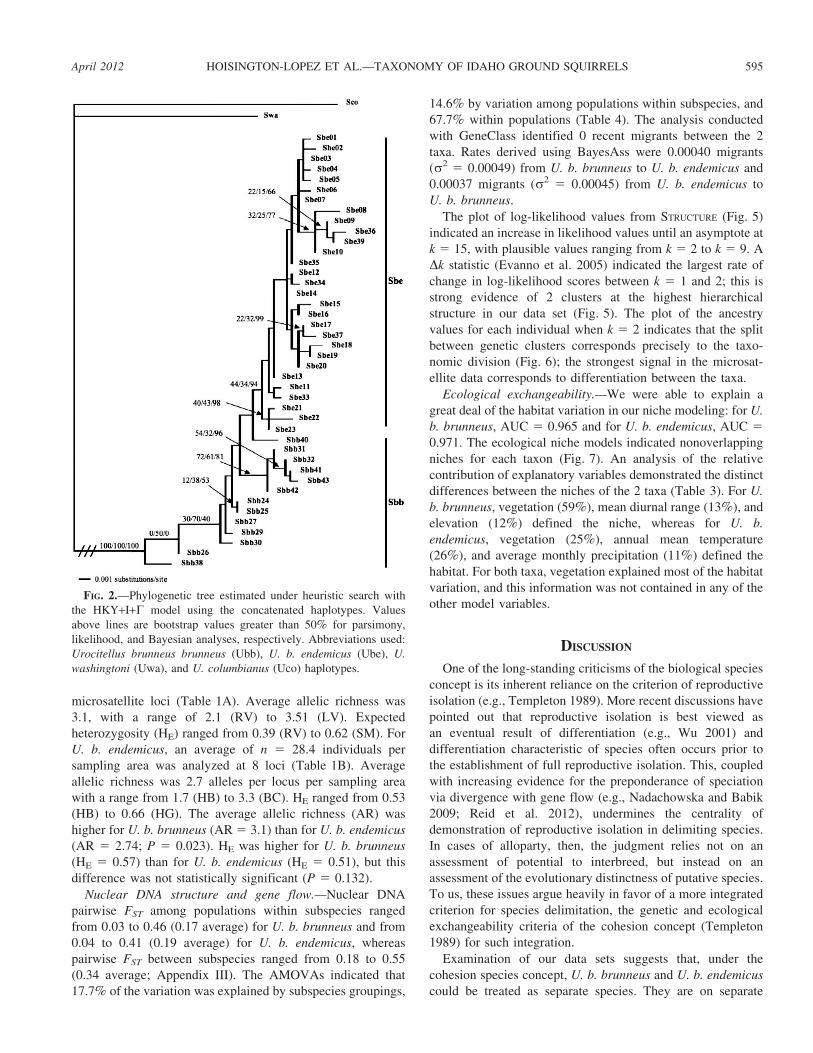
The minimum-spanning network (Fig. 3) indicated that the
2 taxa form distinct clades that are separated by 8 mutations
(uncorrected p-distance 5 0.0073) in the concatenated data
set. Although each taxon forms a distinct clade, the distance
between the 2 taxa is less than the distance found within each
taxon. The haplotype from RV (Ubb40) is intermediate
between subspecies (Fig. 3).
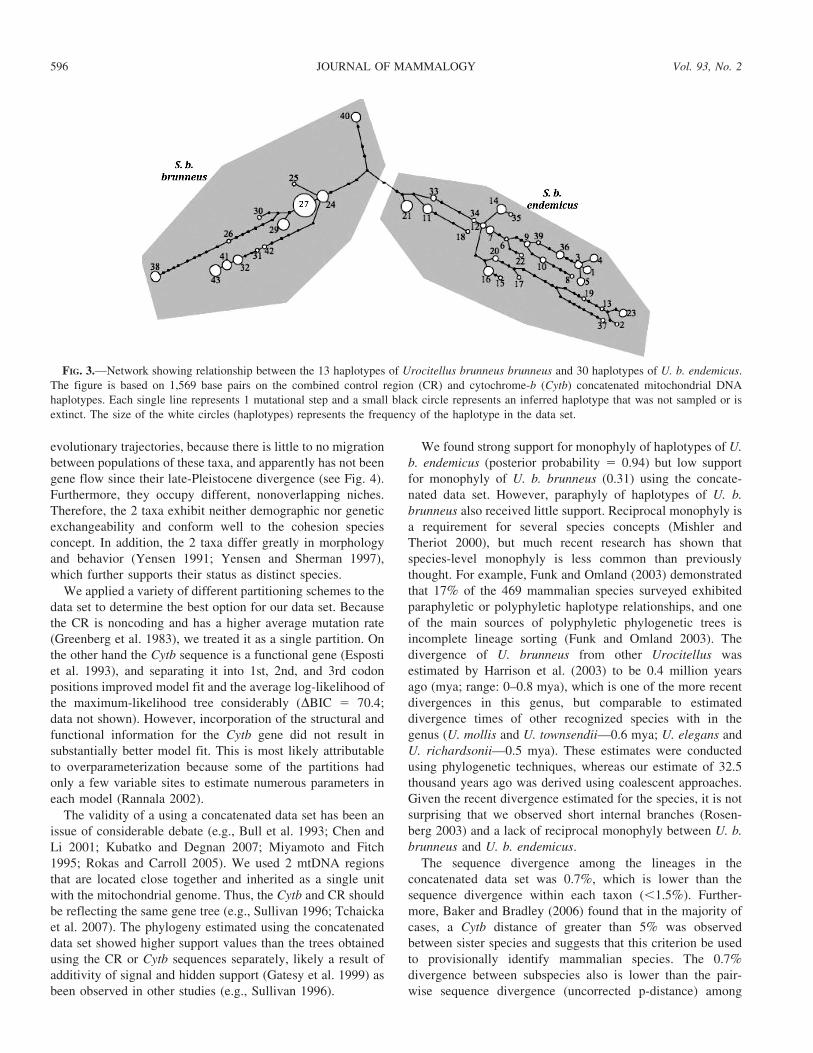
Results from IMa2 indicate virtually no migration between
the 2 subspecies (Fig. 4); this is not surprising given the
observed exclusivity of haplotypes. Furthermore, divergence
time was estimated to be 5.045, which corresponds to an
absolute time estimate of 32,548 years ago. Although the
credibility interval is large (18,300–63,580 years ago) it
excludes a post-Pleistocene divergence (Fig. 4).
Microsatellite diversity.—For U. b. brunneus, an average
of 24 individuals per sampling area were analyzed at 8
TABLE 3.—Parameters estimated in the ecological niche model that
contributed to either the Urocitellus brunneus brunneus (Ubb) or U.
b. endemicus (Ube) model. The highest 3 variable contributors for
each taxon are highlighted in bold.
Variable
% Ubb
contribution
% Ube
contribution
Vegetation 58.7 24.9
Mean diurnal range (uC) 13.1 0.7
Annual precipitation (mm) 12.4 0.0
Elevation (m) 7.7 0.0
Precipitation seasonality (coefficient of variation) 4.3 6.1
Annual mean temperature (uC) 1.6 26.0
Min temperature of coldest month (uC) 1.2 1.2
Precipitation of coldest quarter (mm) 0.8 0.0
Isothermality (P2/P7; %) 0.2 0.0
Precipitation of warmest quarter (mm) 0.2 0.0
Average monthly precipitation (mm) 0.0 10.9
Average monthly maximum temperature (uC) 0.0 3.3
Maximum temperature of warmest month (uC) 0.0 6.6
Temperature annual range (uC) 0.0 0.2
Mean temperature of wettest quarter (uC) 0.0 0.6
Mean temperature of driest quarter (uC) 0.0 8.6
Precipitation of wettest month (mm) 0.0 1.9
Precipitation of driest month (mm) 0.0 0.3
Precipitation of driest quarter (mm) 0.0 8.9
TABLE 4.—Hierarchical analysis of genetic variation using
AMOVA. mtDNA 5 mitochondrial DNA; nDNA 5 nuclear DNA.
Marker type Source of variation Fstat % variation P
mtDNA Among subspecies 0.10 10.1 0.0010
Among populations
within subspecies
0.47 42.7 .0.001
Within populations 0.53 47.2 .0.001
nDNA Among subspecies 0.18 17.7 .0.001
Among populations
within subspecies
0.18 14.6 .0.001
Within populations 0.32 67.7 .0.001
594 JOURNAL OF MAMMALOGY Vol. 93, No. 2
microsatellite loci (Table 1A). Average allelic richness was
3.1, with a range of 2.1 (RV) to 3.51 (LV). Expected
heterozygosity (HE) ranged from 0.39 (RV) to 0.62 (SM). For
U. b. endemicus, an average of n 5 28.4 individuals per
sampling area was analyzed at 8 loci (Table 1B). Average
allelic richness was 2.7 alleles per locus per sampling area
with a range from 1.7 (HB) to 3.3 (BC). HE ranged from 0.53
(HB) to 0.66 (HG). The average allelic richness (AR) was
higher for U. b. brunneus (AR 5 3.1) than for U. b. endemicus
(AR 5 2.74; P 5 0.023). HE was higher for U. b. brunneus
(HE 5 0.57) than for U. b. endemicus (HE 5 0.51), but this
difference was not statistically significant (P 5 0.132).
Nuclear DNA structure and gene flow.—Nuclear DNA
pairwise FST among populations within subspecies ranged
from 0.03 to 0.46 (0.17 average) for U. b. brunneus and from
0.04 to 0.41 (0.19 average) for U. b. endemicus, whereas
pairwise FST between subspecies ranged from 0.18 to 0.55
(0.34 average; Appendix III). The AMOVAs indicated that
17.7% of the variation was explained by subspecies groupings,
14.6% by variation among populations within subspecies, and
67.7% within populations (Table 4). The analysis conducted
with GeneClass identified 0 recent migrants between the 2
taxa. Rates derived using BayesAss were 0.00040 migrants
(s2 5 0.00049) from U. b. brunneus to U. b. endemicus and
0.00037 migrants (s2 5 0.00045) from U. b. endemicus to
U. b. brunneus.
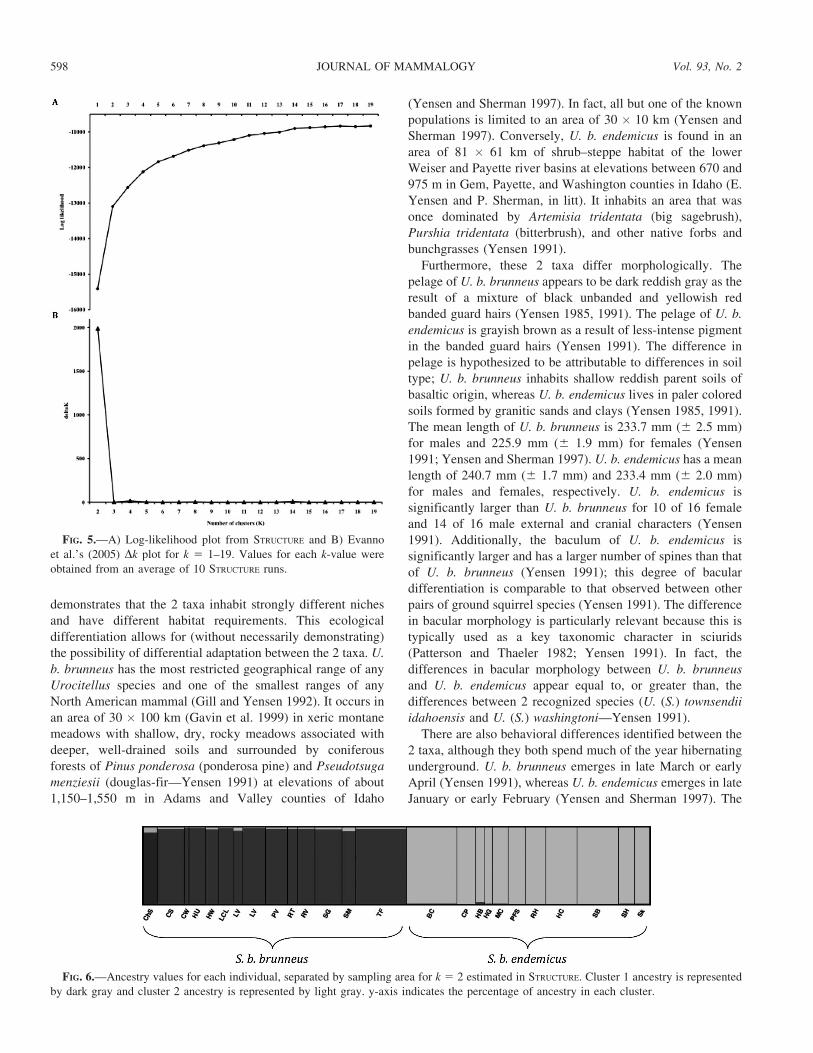
The plot of log-likelihood values from STRUCTURE (Fig. 5)
indicated an increase in likelihood values until an asymptote at
k 5 15, with plausible values ranging from k 5 2 to k 5 9. A
Dk statistic (Evanno et al. 2005) indicated the largest rate of
change in log-likelihood scores between k 5 1 and 2; this is
strong evidence of 2 clusters at the highest hierarchical
structure in our data set (Fig. 5). The plot of the ancestry
values for each individual when k 5 2 indicates that the split
between genetic clusters corresponds precisely to the taxo-
nomic division (Fig. 6); the strongest signal in the microsat-
ellite data corresponds to differentiation between the taxa.
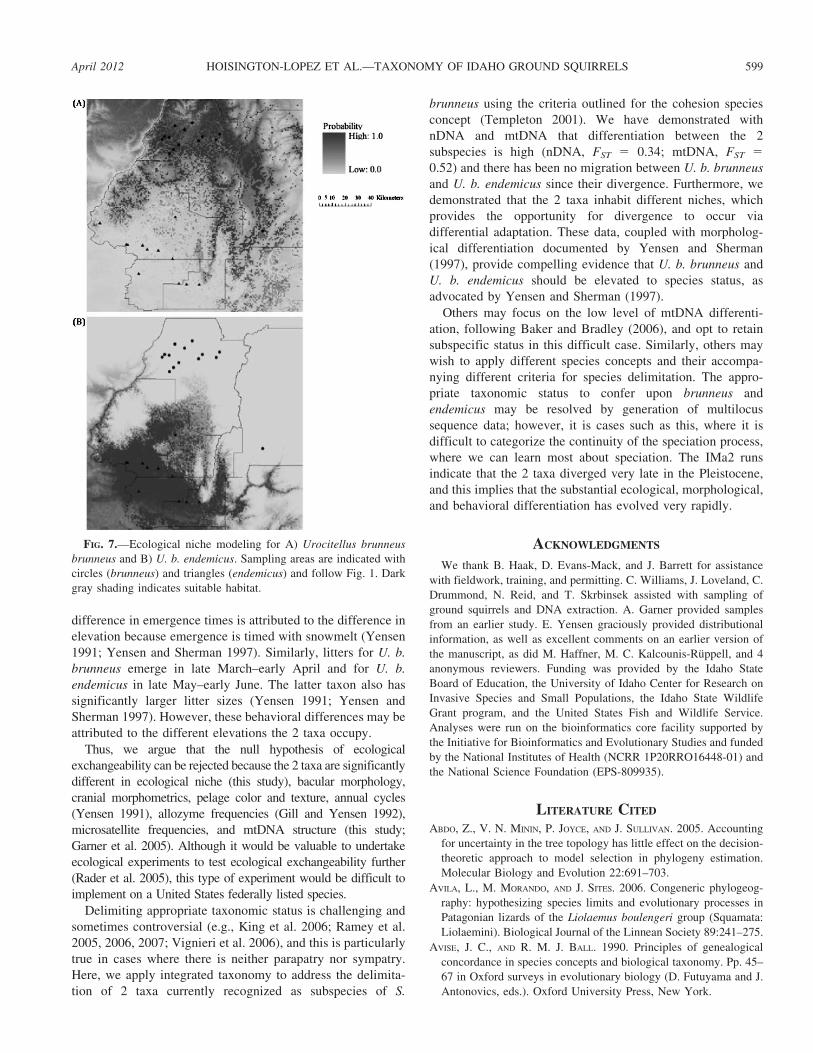
Ecological exchangeability.—We were able to explain a
great deal of the habitat variation in our niche modeling: for U.
b. brunneus, AUC 5 0.965 and for U. b. endemicus, AUC 5
0.971. The ecological niche models indicated nonoverlapping
niches for each taxon (Fig. 7). An analysis of the relative
contribution of explanatory variables demonstrated the distinct
differences between the niches of the 2 taxa (Table 3). For U.
b. brunneus, vegetation (59%), mean diurnal range (13%), and
elevation (12%) defined the niche, whereas for U. b.
endemicus, vegetation (25%), annual mean temperature
(26%), and average monthly precipitation (11%) defined the
habitat. For both taxa, vegetation explained most of the habitat
variation, and this information was not contained in any of the
other model variables.
DISCUSSION
One of the long-standing criticisms of the biological species
concept is its inherent reliance on the criterion of reproductive
isolation (e.g., Templeton 1989). More recent discussions have
pointed out that reproductive isolation is best viewed as
an eventual result of differentiation (e.g., Wu 2001) and
differentiation characteristic of species often occurs prior to
the establishment of full reproductive isolation. This, coupled
with increasing evidence for the preponderance of speciation
via divergence with gene flow (e.g., Nadachowska and Babik
2009; Reid et al. 2012), undermines the centrality of
demonstration of reproductive isolation in delimiting species.
In cases of alloparty, then, the judgment relies not on an
assessment of potential to interbreed, but instead on an
assessment of the evolutionary distinctness of putative species.
To us, these issues argue heavily in favor of a more integrated
criterion for species delimitation, the genetic and ecological
exchangeability criteria of the cohesion concept (Templeton
1989) for such integration.
Examination of our data sets suggests that, under the
cohesion species concept, U. b. brunneus and U. b. endemicus
could be treated as separate species. They are on separate
FIG. 2.—Phylogenetic tree estimated under heuristic search with
the HKY+I+C model using the concatenated haplotypes. Values
above lines are bootstrap values greater than 50% for parsimony,
likelihood, and Bayesian analyses, respectively. Abbreviations used:
Urocitellus brunneus brunneus (Ubb), U. b. endemicus (Ube), U.
washingtoni (Uwa), and U. columbianus (Uco) haplotypes.
April 2012 HOISINGTON-LOPEZ ET AL.—TAXONOMY OF IDAHO GROUND SQUIRRELS 595
evolutionary trajectories, because there is little to no migration
between populations of these taxa, and apparently has not been
gene flow since their late-Pleistocene divergence (see Fig. 4).
Furthermore, they occupy different, nonoverlapping niches.
Therefore, the 2 taxa exhibit neither demographic nor genetic
exchangeability and conform well to the cohesion species
concept. In addition, the 2 taxa differ greatly in morphology
and behavior (Yensen 1991; Yensen and Sherman 1997),
which further supports their status as distinct species.
We applied a variety of different partitioning schemes to the
data set to determine the best option for our data set. Because
the CR is noncoding and has a higher average mutation rate
(Greenberg et al. 1983), we treated it as a single partition. On
the other hand the Cytb sequence is a functional gene (Esposti
et al. 1993), and separating it into 1st, 2nd, and 3rd codon
positions improved model fit and the average log-likelihood of
the maximum-likelihood tree considerably (DBIC 5 70.4;
data not shown). However, incorporation of the structural and
functional information for the Cytb gene did not result in
substantially better model fit. This is most likely attributable
to overparameterization because some of the partitions had
only a few variable sites to estimate numerous parameters in
each model (Rannala 2002).
The validity of a using a concatenated data set has been an
issue of considerable debate (e.g., Bull et al. 1993; Chen and
Li 2001; Kubatko and Degnan 2007; Miyamoto and Fitch
1995; Rokas and Carroll 2005). We used 2 mtDNA regions
that are located close together and inherited as a single unit
with the mitochondrial genome. Thus, the Cytb and CR should
be reflecting the same gene tree (e.g., Sullivan 1996; Tchaicka
et al. 2007). The phylogeny estimated using the concatenated
data set showed higher support values than the trees obtained
using the CR or Cytb sequences separately, likely a result of
additivity of signal and hidden support (Gatesy et al. 1999) as
been observed in other studies (e.g., Sullivan 1996).
We found strong support for monophyly of haplotypes of U.
b. endemicus (posterior probability 5 0.94) but low support
for monophyly of U. b. brunneus (0.31) using the concate-
nated data set. However, paraphyly of haplotypes of U. b.
brunneus also received little support. Reciprocal monophyly is
a requirement for several species concepts (Mishler and
Theriot 2000), but much recent research has shown that
species-level monophyly is less common than previously
thought. For example, Funk and Omland (2003) demonstrated
that 17% of the 469 mammalian species surveyed exhibited
paraphyletic or polyphyletic haplotype relationships, and one
of the main sources of polyphyletic phylogenetic trees is
incomplete lineage sorting (Funk and Omland 2003). The
divergence of U. brunneus from other Urocitellus was
estimated by Harrison et al. (2003) to be 0.4 million years
ago (mya; range: 0–0.8 mya), which is one of the more recent
divergences in this genus, but comparable to estimated
divergence times of other recognized species with in the
genus (U. mollis and U. townsendii—0.6 mya; U. elegans and
U. richardsonii—0.5 mya). These estimates were conducted
using phylogenetic techniques, whereas our estimate of 32.5
thousand years ago was derived using coalescent approaches.
Given the recent divergence estimated for the species, it is not
surprising that we observed short internal branches (Rosen-
berg 2003) and a lack of reciprocal monophyly between U. b.
brunneus and U. b. endemicus.
The sequence divergence among the lineages in the
concatenated data set was 0.7%, which is lower than the
sequence divergence within each taxon (,1.5%). Further-
more, Baker and Bradley (2006) found that in the majority of
cases, a Cytb distance of greater than 5% was observed
between sister species and suggests that this criterion be used
to provisionally identify mammalian species. The 0.7%
divergence between subspecies also is lower than the pair-
wise sequence divergence (uncorrected p-distance) among
FIG. 3.—Network showing relationship between the 13 haplotypes of Urocitellus brunneus brunneus and 30 haplotypes of U. b. endemicus.
The figure is based on 1,569 base pairs on the combined control region (CR) and cytochrome-b (Cytb) concatenated mitochondrial DNA
haplotypes. Each single line represents 1 mutational step and a small black circle represents an inferred haplotype that was not sampled or is
extinct. The size of the white circles (haplotypes) represents the frequency of the haplotype in the data set.
596 JOURNAL OF MAMMALOGY Vol. 93, No. 2
species within marmotines, which range from 1% to 18.3%
(Harrison et al. 2003). Thus, if we only had mtDNA data, we
would recommend that U. b. brunneus and U. b. endemicus
remain as subspecies and others may justifiably take this
position.
However, we found no evidence of recent migration
between the 2 taxa in the microsatellite data set, the mtDNA
suggests no historical migration, and a greater amount of
genetic variation was explained at the subspecies level than
among populations within species (Table 4). Results from the
Bayesian clustering analysis (STRUCTURE) indicate 2 well-
differentiated genetic clusters in our data set (Dk 5 2),
corresponding to the 2 taxa; we detected no coancestry
between them. This is significant because there are no a priori
assignments of individuals to taxon in the STRUCTURE runs, and
multiple runs were conducted with different populations
structure (i.e., varying k); the strongest signal of genetic
substructure in the data set divided individuals into 2 groups
(Fig. 5) that coincide precisely with taxonomy (Fig. 6).
Similarly, analyses with GENECLASS and BayesAss resulted
in very low estimates of migration rate between taxa.
Additionally, we found no mtDNA haplotypes shared between
U. b. brunneus and U. b. endemicus and mtDNA migration
rates indistinguishable from zero. Thus, these 2 taxa are not
currently exchanging genes and have not exchanged genes
since their divergence in the late Pleistocene. This is
particularly relevant considering that the 2 taxa were
parapatric in historical times (E. Yensen and P. Sherman, in
litt.).
Assessment of species status under the cohesion species
concept requires an examination of ecological as well as
genetic differentiation. The ecological niche modeling (Fig. 7)
FIG. 4.—Posterior probabilities of parameters of the isolation with migration model calculated from mitochondrial DNA data using IMa2.
There is no evidence of migration from A) Urocitellus brunneus brunneus into U. b. endemicus or B) U. b. endemicus into U. b. brunneus. C)
The 2 taxa diverged 32,548 years ago, with a 95% credibility interval of 18,300–63,580 years.
April 2012 HOISINGTON-LOPEZ ET AL.—TAXONOMY OF IDAHO GROUND SQUIRRELS 597
demonstrates that the 2 taxa inhabit strongly different niches
and have different habitat requirements. This ecological
differentiation allows for (without necessarily demonstrating)
the possibility of differential adaptation between the 2 taxa. U.
b. brunneus has the most restricted geographical range of any
Urocitellus species and one of the smallest ranges of any
North American mammal (Gill and Yensen 1992). It occurs in
an area of 30 3 100 km (Gavin et al. 1999) in xeric montane
meadows with shallow, dry, rocky meadows associated with
deeper, well-drained soils and surrounded by coniferous
forests of Pinus ponderosa (ponderosa pine) and Pseudotsuga
menziesii (douglas-fir—Yensen 1991) at elevations of about
1,150–1,550 m in Adams and Valley counties of Idaho
(Yensen and Sherman 1997). In fact, all but one of the known
populations is limited to an area of 30 3 10 km (Yensen and
Sherman 1997). Conversely, U. b. endemicus is found in an
area of 81 3 61 km of shrub–steppe habitat of the lower
Weiser and Payette river basins at elevations between 670 and
975 m in Gem, Payette, and Washington counties in Idaho (E.
Yensen and P. Sherman, in litt). It inhabits an area that was
once dominated by Artemisia tridentata (big sagebrush),
Purshia tridentata (bitterbrush), and other native forbs and
bunchgrasses (Yensen 1991).
Furthermore, these 2 taxa differ morphologically. The
pelage of U. b. brunneus appears to be dark reddish gray as the
result of a mixture of black unbanded and yellowish red
banded guard hairs (Yensen 1985, 1991). The pelage of U. b.
endemicus is grayish brown as a result of less-intense pigment
in the banded guard hairs (Yensen 1991). The difference in
pelage is hypothesized to be attributable to differences in soil
type; U. b. brunneus inhabits shallow reddish parent soils of
basaltic origin, whereas U. b. endemicus lives in paler colored
soils formed by granitic sands and clays (Yensen 1985, 1991).
The mean length of U. b. brunneus is 233.7 mm (6 2.5 mm)
for males and 225.9 mm (6 1.9 mm) for females (Yensen
1991; Yensen and Sherman 1997). U. b. endemicus has a mean
length of 240.7 mm (6 1.7 mm) and 233.4 mm (6 2.0 mm)
for males and females, respectively. U. b. endemicus is
significantly larger than U. b. brunneus for 10 of 16 female
and 14 of 16 male external and cranial characters (Yensen
1991). Additionally, the baculum of U. b. endemicus is
significantly larger and has a larger number of spines than that
of U. b. brunneus (Yensen 1991); this degree of bacular
differentiation is comparable to that observed between other
pairs of ground squirrel species (Yensen 1991). The difference
in bacular morphology is particularly relevant because this is
typically used as a key taxonomic character in sciurids
(Patterson and Thaeler 1982; Yensen 1991). In fact, the
differences in bacular morphology between U. b. brunneus
and U. b. endemicus appear equal to, or greater than, the
differences between 2 recognized species (U. (S.) townsendii
idahoensis and U. (S.) washingtoni—Yensen 1991).
There are also behavioral differences identified between the
2 taxa, although they both spend much of the year hibernating
underground. U. b. brunneus emerges in late March or early
April (Yensen 1991), whereas U. b. endemicus emerges in late
January or early February (Yensen and Sherman 1997). The
FIG. 5.—A) Log-likelihood plot from STRUCTURE and B) Evanno
et al.’s (2005) Dk plot for k 5 1–19. Values for each k-value were
obtained from an average of 10 STRUCTURE runs.
FIG. 6.—Ancestry values for each individual, separated by sampling area for k 5 2 estimated in STRUCTURE. Cluster 1 ancestry is represented
by dark gray and cluster 2 ancestry is represented by light gray. y-axis indicates the percentage of ancestry in each cluster.
598 JOURNAL OF MAMMALOGY Vol. 93, No. 2
difference in emergence times is attributed to the difference in
elevation because emergence is timed with snowmelt (Yensen
1991; Yensen and Sherman 1997). Similarly, litters for U. b.
brunneus emerge in late March–early April and for U. b.
endemicus in late May–early June. The latter taxon also has
significantly larger litter sizes (Yensen 1991; Yensen and
Sherman 1997). However, these behavioral differences may be
attributed to the different elevations the 2 taxa occupy.
Thus, we argue that the null hypothesis of ecological
exchangeability can be rejected because the 2 taxa are significantly
different in ecological niche (this study), bacular morphology,
cranial morphometrics, pelage color and texture, annual cycles
(Yensen 1991), allozyme frequencies (Gill and Yensen 1992),
microsatellite frequencies, and mtDNA structure (this study;
Garner et al. 2005). Although it would be valuable to undertake
ecological experiments to test ecological exchangeability further
(Rader et al. 2005), this type of experiment would be difficult to
implement on a United States federally listed species.
Delimiting appropriate taxonomic status is challenging and
sometimes controversial (e.g., King et al. 2006; Ramey et al.
2005, 2006, 2007; Vignieri et al. 2006), and this is particularly
true in cases where there is neither parapatry nor sympatry.
Here, we apply integrated taxonomy to address the delimita-
tion of 2 taxa currently recognized as subspecies of S.
brunneus using the criteria outlined for the cohesion species
concept (Templeton 2001). We have demonstrated with
nDNA and mtDNA that differentiation between the 2
subspecies is high (nDNA, FST 5 0.34; mtDNA, FST 5
0.52) and there has been no migration between U. b. brunneus
and U. b. endemicus since their divergence. Furthermore, we
demonstrated that the 2 taxa inhabit different niches, which
provides the opportunity for divergence to occur via
differential adaptation. These data, coupled with morpholog-
ical differentiation documented by Yensen and Sherman
(1997), provide compelling evidence that U. b. brunneus and
U. b. endemicus should be elevated to species status, as
advocated by Yensen and Sherman (1997).
Others may focus on the low level of mtDNA differenti-
ation, following Baker and Bradley (2006), and opt to retain
subspecific status in this difficult case. Similarly, others may
wish to apply different species concepts and their accompa-
nying different criteria for species delimitation. The appro-
priate taxonomic status to confer upon brunneus and
endemicus may be resolved by generation of multilocus
sequence data; however, it is cases such as this, where it is
difficult to categorize the continuity of the speciation process,
where we can learn most about speciation. The IMa2 runs
indicate that the 2 taxa diverged very late in the Pleistocene,
and this implies that the substantial ecological, morphological,
and behavioral differentiation has evolved very rapidly.
ACKNOWLEDGMENTS
We thank B. Haak, D. Evans-Mack, and J. Barrett for assistance
with fieldwork, training, and permitting. C. Williams, J. Loveland, C.
Drummond, N. Reid, and T. Skrbinsek assisted with sampling of
ground squirrels and DNA extraction. A. Garner provided samples
from an earlier study. E. Yensen graciously provided distributional
information, as well as excellent comments on an earlier version of
the manuscript, as did M. Haffner, M. C. Kalcounis-Ruppell, and 4
anonymous reviewers. Funding was provided by the Idaho State
Board of Education, the University of Idaho Center for Research on
Invasive Species and Small Populations, the Idaho State Wildlife
Grant program, and the United States Fish and Wildlife Service.
Analyses were run on the bioinformatics core facility supported by
the Initiative for Bioinformatics and Evolutionary Studies and funded
by the National Institutes of Health (NCRR 1P20RRO16448-01) and
the National Science Foundation (EPS-809935).
LITERATURE CITED
ABDO, Z., V. N. MININ, P. JOYCE, AND J. SULLIVAN. 2005. Accounting
for uncertainty in the tree topology has little effect on the decision-
theoretic approach to model selection in phylogeny estimation.
Molecular Biology and Evolution 22:691–703.
AVILA, L., M. MORANDO, AND J. SITES. 2006. Congeneric phylogeog-
raphy: hypothesizing species limits and evolutionary processes in
Patagonian lizards of the Liolaemus boulengeri group (Squamata:
Liolaemini). Biological Journal of the Linnean Society 89:241–275.
AVISE, J. C., AND R. M. J. BALL. 1990. Principles of genealogical
concordance in species concepts and biological taxonomy. Pp. 45–
67 in Oxford surveys in evolutionary biology (D. Futuyama and J.
Antonovics, eds.). Oxford University Press, New York.
FIG. 7.—Ecological niche modeling for A) Urocitellus brunneus
brunneus and B) U. b. endemicus. Sampling areas are indicated with
circles (brunneus) and triangles (endemicus) and follow Fig. 1. Dark
gray shading indicates suitable habitat.
April 2012 HOISINGTON-LOPEZ ET AL.—TAXONOMY OF IDAHO GROUND SQUIRRELS 599
BACON, C., AND C. BAILEY. 2006. Taxonomy and conservation: a case
study from Chamaedorea alternans. Annals of Botany 98:755–763.
BAKER, R., AND R. BRADLEY. 2006. Speciation in mammals and the
genetic species concept. Journal of Mammalogy 87:643–662.
BULL, J. J., J. P. HUELSENECK, C. W. CUNNINGHAM, D. L. SWOFFORD,
AND P. J. WADDELL. 1993. Partitioning and combining data in
phylogenetic analysis. Systematic Biology 42:384–397.
BURBRINK, F., R. LAWSON, AND J. SLOWINSKI. 2000. Mitochondrial
DNA phylogeography of the polytypic North American rat snake
(Elaphe obsoleta): a critique of the subspecies concept. Evolution
54:2107–2118.
CARSTENS, B., AND C. RICHARDS. 2007. Integrating coalescent and
ecological niche modeling in comparative phylogeography.
Evolution 61:1439–1454.
CHEN, F., AND W. LI. 2001. Genomic divergences between humans
and other hominoids and the effective population size of the
common ancestor of humans and chimpanzees. American Journal
of Human Genetics 68:444–456.
CLEMENT, M., D. POSADA, AND K. CRANDALL. 2000. TCS: a computer
program to estimate gene genealogies. Molecular Ecology 9:1657–
1660.
CRACRAFT, J. 1983. Species concepts and speciation analysis. Current
Ornithology 1:159–187.
CRANDALL, K. A., AND A. R. TEMPLETON. 1993. Empirical tests of some
predictions from coalescent theory with applications to intraspe-
cific phylogeny reconstruction. Genetics 134:959–969.
ESPOSTI, M., S. DE VRIES, M. CRIMI, A. GHELLI, T. PATARNELLO, AND A.
MEYER. 1993. Mitochondrial cytochrome b: evolution and structure
of the protein. Biochimia et Biophysica Acta 1143:243–271.
EVANNO, G., S. REGNAUT, AND J. GOUDET. 2005. Detecting the number
of clusters of individuals using the software STRUCTURE: a
simulation study. Molecular Ecology 14:2611–2620.
EXCOFFIER, L., G. LAVAL, AND S. SCHNEIDER. 2005. Arlequin version
3.0: an integrated software package for population genetics data
analysis. Evolutionary Bioinformatics Online 1:47–50.
EXCOFFIER, L., P. E. SMOUSE, AND J. M. QUATTRO. 1992. Analysis of
molecular variance inferred from metric distances among DNA
haplotypes: application to human mitochondrial DNA restriction
data. Genetics 131:479–491.
FRATI, F., C. SIMON, J. SULLIVAN, AND D. SWOFFORD. 1997. Evolution of
the mitochondrial cytochrome oxidase II gene in Collembola.
Journal of Molecular Evolution 44:145–158.
FUNK, D., AND J. OMLAND. 2003. Species-level paraphyly and
polyphyly: frequency, causes, and consequences, with insights
from animal mitochondrial DNA. Annual Review of Ecology,
Evolution, and Systematics 34:397–423.
GARNER, A., J. RACHLOW, AND L. WAITS. 2005. Genetic diversity and
population divergence in fragmented habitats: conservation of
Idaho ground squirrels. Conservation Genetics 6:759–774.
GATESY, J., P. O’GRADY, AND R. BAKER. 1999. Corroboration among
data sets in simultaneous analysis: hidden support for phylogenetic
relationships among higher level artiodactyl taxa. Cladistics
15:271–313.
GAVIN, T. A., P. W. SHERMAN, E. YENSEN, AND B. MAY. 1999.
Population genetic structure of the northern Idaho ground squirrel
(Spermophilus brunneus brunneus). Journal of Mammalogy
80:156–168.
GIANNASI, N., A. MALHOTRA, AND R. S. THORPE. 2001. Nuclear and
mtDNA phylogenies of the Trimeresurus complex: implications
for the gene versus species tree debate. Molecular Phylogenetics
and Evolution 19:57–66.
GILL, A., AND E. YENSEN. 1992. Biochemical differentiation in the
Idaho ground squirrel, Spermophilus brunneus (Rodentia: Sciur-
idae). Great Basin Naturalist 52:155–159.
GREENBERG, B. D., J. E. NEWBOLD, AND A. SUGINO. 1983. Intraspecific
nucleotide sequence variability surrounding the origin of replica-
tion in human mitochondrial DNA. Gene 21:33–49.
HAIG, S. M., ET AL. 2006. Taxonomic considerations in listing
subspecies under the U.S. Endangered Species Act. Conservation
Biology 20:1584–1594.
HARRISON, R., S. BOGDANOWICZ, R. HOFFMANN, E. YENSEN, AND P.
SHERMAN. 2003. Phylogeny and evolutionary history of the ground
squirrels (Rodentia: Marmotinae). Journal of Mammalian Evolu-
tion 10:249–276.
HELGEN, K. M., F. R. COLE, L. E. HELGEN, AND D. E. WILSON. 2009.
Generic revision in the Holarctic ground squirrel genus Spermo-
philus. Journal of Mammalogy 90:270–305.
HERRON, M. D., T. A. CASTOE, AND C. L. PARKINSON. 2004. Sciurid
phylogeny and the paraphyly of Holarctic ground squirrels (Spermo-
philus). Molecular Phylogenetics and Evolution 31:1015–1030.
HEY, J., AND R. NIELSEN. 2004. Multilocus methods for estimating
population sizes, migration rates and divergence time, with
applications to the divergence of Drosophila pseudoobscura and
D. persimilis. Genetics 167:747–760.
HIJMANS, R., S. CAMERON, J. PARRA, P. JONES, AND A. JARVIS. 2005.
Very high resolution interpolated climate surfaces fro global land
areas. International Journal of Climatology 25:1965–1978.
HOWELL, A. 1928. Descriptions of six new North American ground
squirrels. Proceedings of the Biological Society of Washington
41:211–214.
HOWELL, A. 1938. Revision of the North American ground squirrels,
with a classification of the North American Sciuridae. North
American Fauna 56:1–256.
HUELSENBECK, J., AND F. RONQUIST. 2001. MrBayes: Bayesian
inference of phylogeny. Bioinformatics 17:754–755.
HULL, D. 1997. The ideal species concept—and why we can’t get it. Pp.
358–379 in Species: the units of biodiversity (M. Clardige, H. Dawah,
and M. Wilson, eds.). Chapman and Hall, London, United Kingdom.
IRWIN, D. M., T. D. KOCHER, AND A. C. WILSON. 1991. Evolution of the
cytochrome b gene of mammals. Journal of Molecular Evolution
32:128–144.
JOUVENTIN, P., R. CUTHBERT, AND R. OTTVALL. 2006. Genetic isolation
and divergence in sexual traits: evidence for the northern
rockhopper penguin Eudyptes moseleyi being a sibling species.
Molecular Ecology 15:3413–3423.
KING, T. L., ET AL. 2006. Comprehensive genetic analyses reveal
evolutionary distinction of a mouse (Zapus hudsonius preblei)
proposed for delisting from the U.S. Endangered Species Act.
Molecular Ecology 15:4331–4358.
KUBATKO, L., AND J. DEGNAN. 2007. Inconsistency of phylogenetic
estimates from concatenated data under coalescence. Systematic
Biology 56:17–24.
MAYR, E. 1969. The biological meaning of species. Biological Journal
of the Linnean Society 1:311–320.
MININ, V., Z. ABDO, P. JOYCE, AND J. SULLIVAN. 2003. Performance-
based selection of likelihood models for phylogeny estimation:
BIC modified by decision theory. Systematic Biology 52:674–683.
MISHLER, B., AND E. THERIOT. 2000. The phylogenic species concept
(sensu Mishler and Theriot): monophyly, apomorphy, and
phylogenetic species concepts. Pp. 55–63 in Species concepts
and phylogenetic theory: a debate (W. Wheeler and R. Meier, eds.).
Columbia University Press, New York.
600 JOURNAL OF MAMMALOGY Vol. 93, No. 2
MIYAMOTO, M., AND W. FITCH. 1995. Testing species phylogenies and
phylogenetic methods with congruence. Systematic Biology
44:64–76.
NADACHOWSKA, K., AND W. BABIK. 2009. Divergence in the face of
gene flow: the case of two newts (Amphibia, Salamandridae).
Molecular Biology and Evolution 26:829–841.
NEI, M. 1972. Genetic distance between populations. American
Naturalist 106:283–292.
PAETKAU, D., R. SLADE, M. BURDENS, AND A. ESTROUP. 2004. Genetic
assignment methods for direct, real-time estimation of migration
rate: a simulation-based exploration of accuracy and power.
Molecular Ecology 13:55–65.
PAETKAU, D., AND C. STROBECK. 1996. Mitochondrial DNA and the
phylogeography of Newfoundland black bears. Canadian Journal
of Zoology 74:192–196.
PAGE, R., AND M. A. CHARLESTON. 1997. From gene to organismal
phylogeny: reconciled trees and the gene tree/species tree problem.
Molecular Phylogenetics and Evolution 38:779–793.
PALMER, J. D., AND D. ZAMIR. 1982. Chloroplast DNA evolution and
phylogenetic relationships in Lycopersicon. Proceedings of the
National Academy of Sciences of the United States of America
79:5006–5010.
PANCHAL, M., AND M. BEAUMONT. 2007. The automation and
evaluation of nested clade phylogeographic analysis. Evolution
61:1466–1480.
PAPADOPOULOU, A., M. T. MONAGHAN, T. G. BARRACLOUGH, AND A. P.
VOGLER. 2009. Sampling error does not invalidate the Yule-
coalescent model for species delimitation. A response to Lohse
(2009). Systematic Biology 58:442–444.
PATTERSON, B., AND C. J. THAELER. 1982. The mammalian baculum:
hypotheses on the nature of bacular variability. Journal of
Mammalogy 63:1–15.
PEARSON, R., C. RAXWORTHY, M. NAKAMURA, AND A. PETERSON. 2007.
Predicting species distributions from small numbers of occurrence
records: a test case using cryptic geckos in Madagascar. Journal of
Biogeography 34:102–117.
PHILLIPS, S., R. ANDERSON, AND R. SCHAPIRE. 2006. Maximum entropy
modeling of species geographic distributions. Ecological Modeling
190:231–259.
PIRY, S., A. ALAPETITE, J. M. CORNUET, D. PAETKAU, L. BAUDOUIN, AND
A. ESTOUP. 2004. GeneClass2: a software for genetic assignment
and first-generation migrant detection. Journal of Heredity 95:536–
539.
PONS, J., ET AL. 2006. Sequence-based species delimitation for the DNA
taxonomy of undescribed insects. Systematic Biology 55:595–609.
POSADA, D., AND K. A. CRANDALL. 1998. MODELTEST: testing the
model of DNA substitution. Bioinformatics 14:817–818.
PRITCHARD, J. K., M. STEPHENS, AND D. PETER. 2000. Inference of
population structure using multilocus genotype data. Genetics
155:945–959.
RADER, R. B., M. C. BELK, D. K. SHIOZAWA, AND K. A. CRANDALL.
2005. Empirical tests for ecological exchangeability. Animal
Conservation 8:239–247.
RAMEY, R., H. LIU, C. EPPS, L. CARPENTER, AND J. WEHAUSEN. 2005.
Genetic relatedness of Preble’s meadow jumping mouse (Zapus
hudsonius preblei) to nearby subspecies of Z. hudsonius as inferred
from variation in cranial morphology, mitochondrial DNA and
microsatellite DNA: implications for taxonomy and conservation.
Animal Conservation 8:329–346.
RAMEY, R. I., J. D. WEHAUSEN, H. LIU, C. EPPS, AND L. CARPENTER.
2006. Response to Vignieri et al. (2006): should hypothesis testing
or selective post hoc interpretation of results guide the allocation of
conservation effort? Animal Conservation 9:244–247.
RAMEY, R. I., J. D. WEHAUSEN, H. LIU, C. EPPS, AND L. CARPENTER. 2007.
How King et al. (2006) define an ‘evolutionary distinction’ of a
mouse subspecies: a response. Molecular Ecology 16:3518–3521.
RANNALA, B. 2002. Identifiability of parameters in MCMC Bayesian
inference of phylogeny. Systematic Biology 51:754–760.
RANNALA, B., AND J. L. MOUNTAIN. 1997. Detecting immigration by
using multilocus genotypes. Proceedings of the National Academy
of Sciences of the United States of America 94:9197–9201.
RAYMOND, M., AND F. ROUSSET. 1995. GENEPOP (version 1.2):
population genetics software for exact tests and ecumenicism.
Journal of Heredity 86:248–249.
REID, N., J. R. DEMBOSKI, AND J. SULLIVAN. 2012. Phylogeny
estimation of the radiation of western North American chipmunks
(Tamias) in the face of introgression using reproductive protein
genes. Systematic Biology 61:44–62.
RISSLER, L. J., AND J. J. APODACA. 2007. Adding more ecology into
species delimitation: ecological niche models and phylogeography
help define cryptic species in the black salamander (Aneides
flavipunctatus). Systematic Biology 56:924–942.
ROKAS, A., AND S. CARROLL. 2005. More genes or more taxa? The
relative contribution of gene number and taxon number to
phylogenetic accuracy. Molecular Biology and Evolution 22:
1337–1344.
ROSENBERG, N. 2003. The shapes of neutral gene genealogies in two
species: probabilities of monophyly, paraphyly, and polyphyly in a
coalescent model. Evolution 57:1465–1477.
ROZEN, S., AND H. SKALETSKY. 2000. Primer3 on the WWW for
general users and for biologist programmers. Pp. 365–386 in
Bioinformatics methods and protocols: methods in molecular
biology (S. S. M. Krawets, ed.). Humana Press, Totowa, New
Jersey.
RUBINOFF, D. 2006. Utility of mitochondrial DNA barcodes in species
conservation. Conservation Biology 20:1026–1033.
SCHWARTZ, G. 1978. Estimating the dimensions of a model. Annals of
Statistics 6:461–464.
SHIELDS, G. F., AND T. D. KOCHER. 1991. Phylogenetic relationships of
North American ursids based on analysis of mitochondrial DNA.
Evolution 45:218–221.
SIKES, R. S., W. L. GANNON, AND THE ANIMAL CARE AND USE COMMITTEE
OF THE AMERICAN SOCIETY OF MAMMALOGISTS. 2011. Guidelines of
the American Society of Mammalogists for the use of wild
mammals in research. Journal of Mammalogy 92:235–253.
SIMPSON, G. 1951. The species concept. Evolution 5:285–298.
SITES, J., AND K. CRANDALL. 1997. Testing species boundaries in
biodiversity studies. Conservation Biology 11:1289–1297.
STOCKMAN, A., AND J. BOND. 2007. Delimiting cohesion species:
extreme population structuring and the role of ecological
interchangeability. Molecular Ecology 16:3374–3392.
SULLIVAN, J. 1996. Combining data with different distribution of
among-site rate variation. Systematic Biology 45:375–380.
SULLIVAN, J., AND D. L. SWOFFORD. 1997. Are guinea pigs rodents? The
importance of adequate models in molecular phylogenetics.
Journal of Mammalian Evolution 4:77–86.
SWOFFORD, D. 1998. PAUP*: phylogenetic analysis using parsimony
(*and other methods). Version 4. Sinauer Associates, Inc.,
Publishers, Sunderland, Massachusetts.
TABERLET, P., L. P. WAITS, AND G. LUIKART. 1999. Non-invasive
genetic sampling: look before you leap. Trends in Ecology &
Evolution 14:323–327.
April 2012 HOISINGTON-LOPEZ ET AL.—TAXONOMY OF IDAHO GROUND SQUIRRELS 601
TCHAICKA, L., E. EIZIRIK, T. DE OLIVIERA, J. J. CANDIDO, AND R.
FREITAS. 2007. Phylogeography and population history of the crab-
eating fox (Cerdocyon thous). Molecular Ecology 16:819–838.
TEMPLETON, A. 1989. The meaning of species and speciation: a
genetic perspective. Pp. 159–181 in Speciation and its conse-
quences (D. Otte and J. Endler, eds.). Sinauer Associates, Inc.,
Publishers, Sunderland, Massachusetts.
TEMPLETON, A. 2001. Using phylogeographic analyses of gene trees to
test species status and processes. Molecular Ecology 10:779–791.
UNITED STATES FISH AND WILDLIFE SERVICE. 2000. Endangered and
threatened wildlife and plants; determination of threatened status for
the northern Idaho ground squirrel. Federal Register 65:17779–17786.
VIGNIERI, S., ET AL. 2006. Mistaken view of taxonomic validity
undermines conservation of an evolutionarily distinctive mouse: a
response to Ramey et al. Animal Conservation 9:237–243.
WEISROCK, D., AND A. LARSON. 2006. Testing hypotheses of speciation
in the Plethodon jordani species complex with allozymes and
mitochondrial DNA sequences. Biological Journal of the Linnaean
Society 89:25–51.
WILEY, E. 1978. Island biogeography: ecology, evolution, and
conservation. Oxford University Press, Oxford, United Kingdom.
WILSON, E., AND W. BROWN. 1953. The subspecies concept and its
taxonomic application. Systematic Zoology 2:97–111.
WILSON, G. A., AND B. RANNALA. 2003. Bayesian inference of recent
migration rates using multilocus genotypes. Genetics 163:1177–
1191.
WU, C.-I. 2001. The genic view of the process of speciation. Journal
of Evolutionary Biology. 14:851–865.
YENSEN, E. 1985. Final report: taxonomy, distribution, and population
status of the Idaho ground squirrel, Spermophilus brunneus. A
report prepared for the Idaho Department of Fish and Game and
United States Fish and Wildlife Service, Boise, Idaho.
YENSEN, E. 1991. Taxonomy and distribution of the Idaho ground
squirrel, Spermophilus brunneus. Journal of Mammalogy 72:583–
600.
YENSEN, E. 1999. Population survey of the southern Idaho ground
squirrel, Spermophilus brunneus endemicus. United States Fish and
Wildlife Service report. Albertson College, Caldwell, Idaho.
YENSEN, E., D. QUINNEY, K. JOHNSON, K. TIMMERMAN, AND K.
STEENHOF. 1992. Fire, vegetation changes, and population fluctu-
ations of Townsend’s ground squirrels. American Midland
Naturalist 128:299–312.
YENSEN, E., AND P. SHERMAN. 1997. Spermophilus brunneus.
Mammalian Species 560:1–5.
YU, L., Q. W. LI, O. RYDER, AND Y. ZHANG. 2004. Phylogenetic
relationships within mammalian order Carnivora indicated by
sequences of two nuclear DNA genes. Molecular Phylogenetics
and Evolution 33:694–705.
ZINK, R. M. 2004. The role of subspecies in obscuring avian
biological diversity and misleading conservation policy. Proceed-
ings of the Royal Society of London, B. Biological Sciences
271:561–564.
ZINK, R. M., G. F. BARROWCLOUGH, J. L. ATWOOD, AND R. C.
BLACKWELL-RAGO. 2000. Genetics, taxonomy, and conservation of
the threatened California gnatcatcher. Conservation Biology
14:1394–1405.
Submitted 18 January 2011. Accepted 30 August 2011.
Associate Editor was Matina Kalcounis-Ruppell.
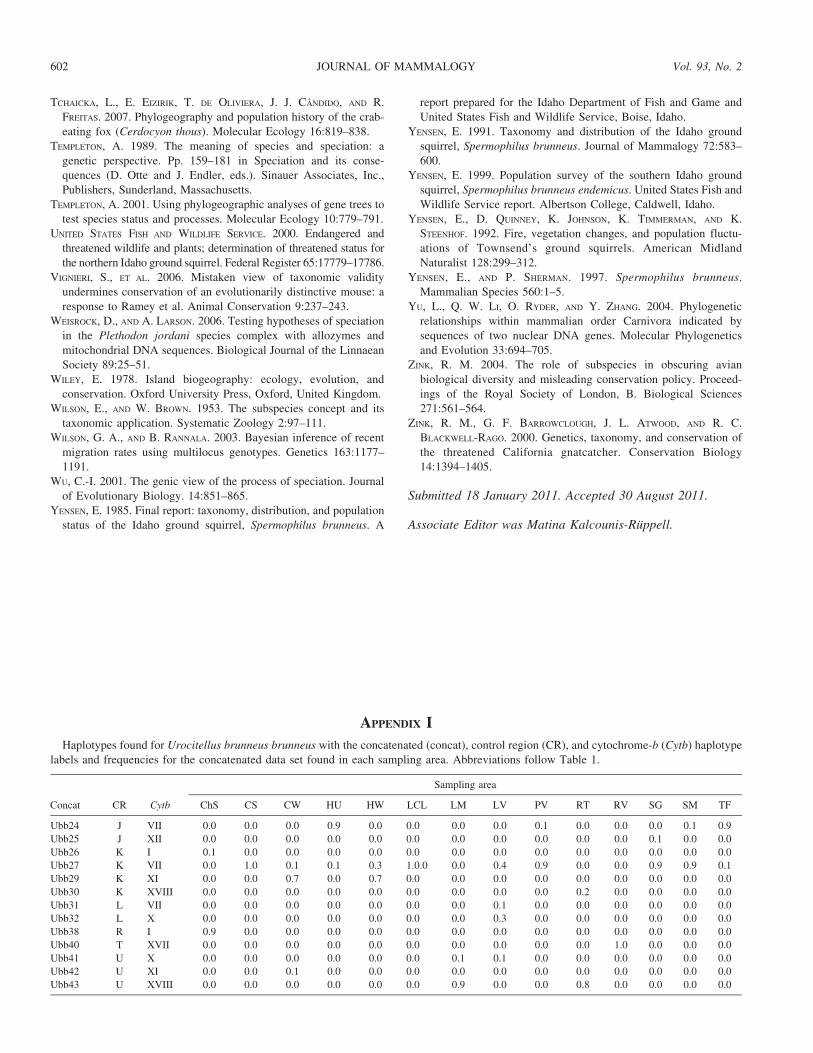
APPENDIX I
Haplotypes found for Urocitellus brunneus brunneus with the concatenated (concat), control region (CR), and cytochrome-b (Cytb) haplotype
labels and frequencies for the concatenated data set found in each sampling area. Abbreviations follow Table 1.
Concat CR Cytb
Sampling area
ChS CS CW HU HW LCL LM LV PV RT RV SG SM TF
Ubb24 J VII 0.0 0.0 0.0 0.9 0.0 0.0 0.0 0.0 0.1 0.0 0.0 0.0 0.1 0.9
Ubb25 J XII 0.0 0.0 0.0 0.0 0.0 0.0 0.0 0.0 0.0 0.0 0.0 0.1 0.0 0.0
Ubb26 K I 0.1 0.0 0.0 0.0 0.0 0.0 0.0 0.0 0.0 0.0 0.0 0.0 0.0 0.0
Ubb27 K VII 0.0 1.0 0.1 0.1 0.3 1.0.0 0.0 0.4 0.9 0.0 0.0 0.9 0.9 0.1
Ubb29 K XI 0.0 0.0 0.7 0.0 0.7 0.0 0.0 0.0 0.0 0.0 0.0 0.0 0.0 0.0
Ubb30 K XVIII 0.0 0.0 0.0 0.0 0.0 0.0 0.0 0.0 0.0 0.2 0.0 0.0 0.0 0.0
Ubb31 L VII 0.0 0.0 0.0 0.0 0.0 0.0 0.0 0.1 0.0 0.0 0.0 0.0 0.0 0.0
Ubb32 L X 0.0 0.0 0.0 0.0 0.0 0.0 0.0 0.3 0.0 0.0 0.0 0.0 0.0 0.0
Ubb38 R I 0.9 0.0 0.0 0.0 0.0 0.0 0.0 0.0 0.0 0.0 0.0 0.0 0.0 0.0
Ubb40 T XVII 0.0 0.0 0.0 0.0 0.0 0.0 0.0 0.0 0.0 0.0 1.0 0.0 0.0 0.0
Ubb41 U X 0.0 0.0 0.0 0.0 0.0 0.0 0.1 0.1 0.0 0.0 0.0 0.0 0.0 0.0
Ubb42 U XI 0.0 0.0 0.1 0.0 0.0 0.0 0.0 0.0 0.0 0.0 0.0 0.0 0.0 0.0
Ubb43 U XVIII 0.0 0.0 0.0 0.0 0.0 0.0 0.9 0.0 0.0 0.8 0.0 0.0 0.0 0.0
602 JOURNAL OF MAMMALOGY Vol. 93, No. 2
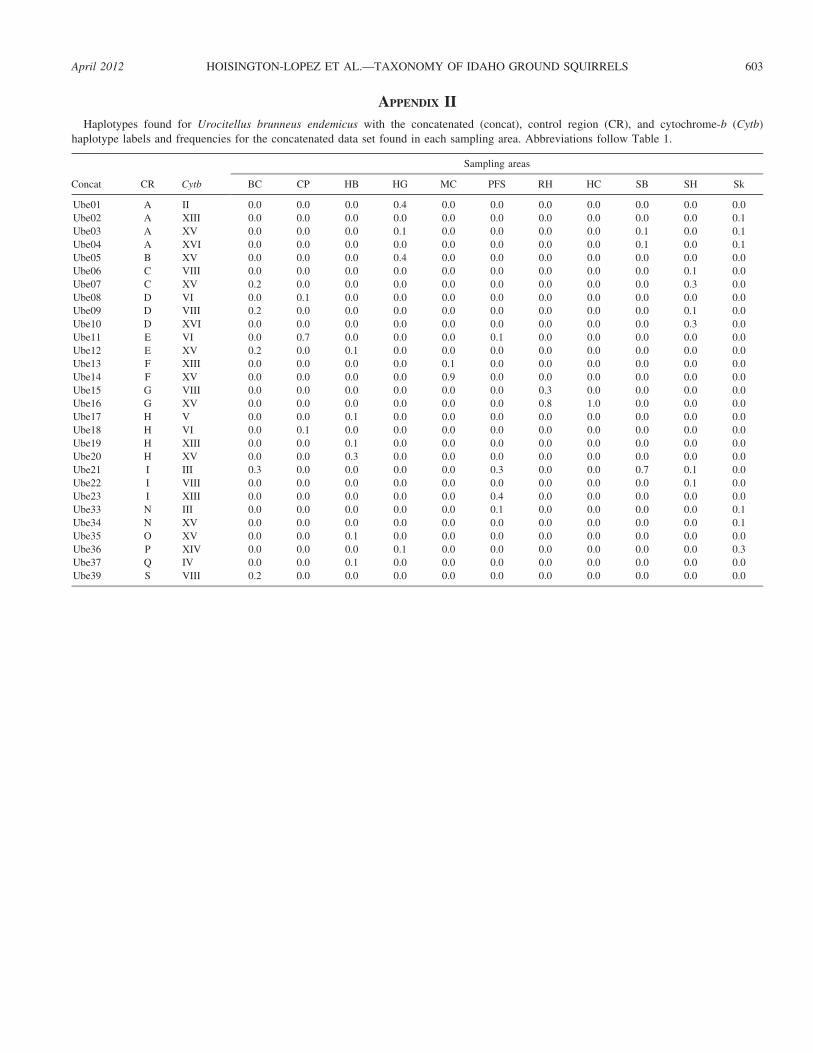
APPENDIX II
Haplotypes found for Urocitellus brunneus endemicus with the concatenated (concat), control region (CR), and cytochrome-b (Cytb)
haplotype labels and frequencies for the concatenated data set found in each sampling area. Abbreviations follow Table 1.
Concat CR Cytb
Sampling areas
BC CP HB HG MC PFS RH HC SB SH Sk
Ube01 A II 0.0 0.0 0.0 0.4 0.0 0.0 0.0 0.0 0.0 0.0 0.0
Ube02 A XIII 0.0 0.0 0.0 0.0 0.0 0.0 0.0 0.0 0.0 0.0 0.1
Ube03 A XV 0.0 0.0 0.0 0.1 0.0 0.0 0.0 0.0 0.1 0.0 0.1
Ube04 A XVI 0.0 0.0 0.0 0.0 0.0 0.0 0.0 0.0 0.1 0.0 0.1
Ube05 B XV 0.0 0.0 0.0 0.4 0.0 0.0 0.0 0.0 0.0 0.0 0.0
Ube06 C VIII 0.0 0.0 0.0 0.0 0.0 0.0 0.0 0.0 0.0 0.1 0.0
Ube07 C XV 0.2 0.0 0.0 0.0 0.0 0.0 0.0 0.0 0.0 0.3 0.0
Ube08 D VI 0.0 0.1 0.0 0.0 0.0 0.0 0.0 0.0 0.0 0.0 0.0
Ube09 D VIII 0.2 0.0 0.0 0.0 0.0 0.0 0.0 0.0 0.0 0.1 0.0
Ube10 D XVI 0.0 0.0 0.0 0.0 0.0 0.0 0.0 0.0 0.0 0.3 0.0
Ube11 E VI 0.0 0.7 0.0 0.0 0.0 0.1 0.0 0.0 0.0 0.0 0.0
Ube12 E XV 0.2 0.0 0.1 0.0 0.0 0.0 0.0 0.0 0.0 0.0 0.0
Ube13 F XIII 0.0 0.0 0.0 0.0 0.1 0.0 0.0 0.0 0.0 0.0 0.0
Ube14 F XV 0.0 0.0 0.0 0.0 0.9 0.0 0.0 0.0 0.0 0.0 0.0
Ube15 G VIII 0.0 0.0 0.0 0.0 0.0 0.0 0.3 0.0 0.0 0.0 0.0
Ube16 G XV 0.0 0.0 0.0 0.0 0.0 0.0 0.8 1.0 0.0 0.0 0.0
Ube17 H V 0.0 0.0 0.1 0.0 0.0 0.0 0.0 0.0 0.0 0.0 0.0
Ube18 H VI 0.0 0.1 0.0 0.0 0.0 0.0 0.0 0.0 0.0 0.0 0.0
Ube19 H XIII 0.0 0.0 0.1 0.0 0.0 0.0 0.0 0.0 0.0 0.0 0.0
Ube20 H XV 0.0 0.0 0.3 0.0 0.0 0.0 0.0 0.0 0.0 0.0 0.0
Ube21 I III 0.3 0.0 0.0 0.0 0.0 0.3 0.0 0.0 0.7 0.1 0.0
Ube22 I VIII 0.0 0.0 0.0 0.0 0.0 0.0 0.0 0.0 0.0 0.1 0.0
Ube23 I XIII 0.0 0.0 0.0 0.0 0.0 0.4 0.0 0.0 0.0 0.0 0.0
Ube33 N III 0.0 0.0 0.0 0.0 0.0 0.1 0.0 0.0 0.0 0.0 0.1
Ube34 N XV 0.0 0.0 0.0 0.0 0.0 0.0 0.0 0.0 0.0 0.0 0.1
Ube35 O XV 0.0 0.0 0.1 0.0 0.0 0.0 0.0 0.0 0.0 0.0 0.0
Ube36 P XIV 0.0 0.0 0.0 0.1 0.0 0.0 0.0 0.0 0.0 0.0 0.3
Ube37 Q IV 0.0 0.0 0.1 0.0 0.0 0.0 0.0 0.0 0.0 0.0 0.0
Ube39 S VIII 0.2 0.0 0.0 0.0 0.0 0.0 0.0 0.0 0.0 0.0 0.0
April 2012 HOISINGTON-LOPEZ ET AL.—TAXONOMY OF IDAHO GROUND SQUIRRELS 603
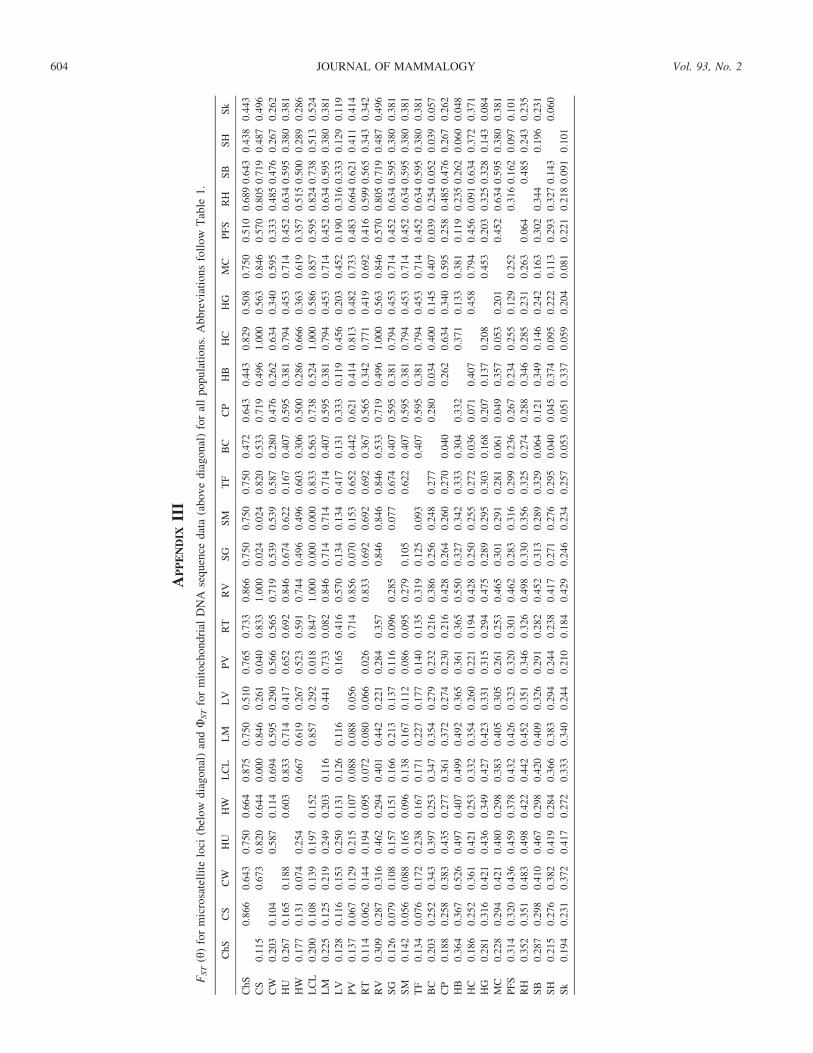
AP
PE
ND
IXII
I
FS
T(h
)fo
rm
icro
sate
llit
elo
ci(b
elo
wd
iag
on
al)
andW
ST
for
mit
och
on
dri
alD
NA
seq
uen
ced
ata
(ab
ov
ed
iag
on
al)
for
all
po
pu
lati
on
s.A
bb
rev
iati
on
sfo
llo
wT
able
1.
ChS
CS
CW
HU
HW
LC
LL
ML
VP
VR
TR
VS
GS
MT
FB
CC
PH
BH
CH
GM
CP
FS
RH
SB
SH
Sk
ChS
0.8
66
0.6
43
0.7
50
0.6
64
0.8
75
0.7
50
0.5
10
0.7
65
0.7
33
0.8
66
0.7
50
0.7
50
0.7
50
0.4
72
0.6
43
0.4
43
0.8
29
0.5
08
0.7
50
0.5
10
0.6
89
0.6
43
0.4
38
0.4
43
CS
0.1
15
0.6
73
0.8
20
0.6
44
0.0
00
0.8
46
0.2
61
0.0
40
0.8
33
1.0
00
0.0
24
0.0
24
0.8
20
0.5
33
0.7
19
0.4
96
1.0
00
0.5
63
0.8
46
0.5
70
0.8
05
0.7
19
0.4
87
0.4
96
CW
0.2
03
0.1
04
0.5
87
0.1
14
0.6
94
0.5
95
0.2
90
0.5
66
0.5
65
0.7
19
0.5
39
0.5
39
0.5
87
0.2
80
0.4
76
0.2
62
0.6
34
0.3
40
0.5
95
0.3
33
0.4
85
0.4
76
0.2
67
0.2
62
HU
0.2
67
0.1
65
0.1
88
0.6
03
0.8
33
0.7
14
0.4
17
0.6
52
0.6
92
0.8
46
0.6
74
0.6
22
0.1
67
0.4
07
0.5
95
0.3
81
0.7
94
0.4
53
0.7
14
0.4
52
0.6
34
0.5
95
0.3
80
0.3
81
HW
0.1
77
0.1
31
0.0
74
0.2
54
0.6
67
0.6
19
0.2
67
0.5
23
0.5
91
0.7
44
0.4
96
0.4
96
0.6
03
0.3
06
0.5
00
0.2
86
0.6
66
0.3
63
0.6
19
0.3
57
0.5
15
0.5
00
0.2
89
0.2
86
LC
L0
.20
00
.10
80
.139
0.1
97
0.1
52
0.8
57
0.2
92
0.0
18
0.8
47
1.0
00
0.0
00
0.0
00
0.8
33
0.5
63
0.7
38
0.5
24
1.0
00
0.5
86
0.8
57
0.5
95
0.8
24
0.7
38
0.5
13
0.5
24
LM
0.2
25
0.1
25
0.2
19
0.2
49
0.2
03
0.1
16
0.4
41
0.7
33
0.0
82
0.8
46
0.7
14
0.7
14
0.7
14
0.4
07
0.5
95
0.3
81
0.7
94
0.4
53
0.7
14
0.4
52
0.6
34
0.5
95
0.3
80
0.3
81
LV
0.1
28
0.1
16
0.1
53
0.2
50
0.1
31
0.1
26
0.1
16
0.1
65
0.4
16
0.5
70
0.1
34
0.1
34
0.4
17
0.1
31
0.3
33
0.1
19
0.4
56
0.2
03
0.4
52
0.1
90
0.3
16
0.3
33
0.1
29
0.1
19
PV
0.1
37
0.0
67
0.1
29
0.2
15
0.1
07
0.0
88
0.0
88
0.0
56
0.7
14
0.8
56
0.0
70
0.1
53
0.6
52
0.4
42
0.6
21
0.4
14
0.8
13
0.4
82
0.7
33
0.4
83
0.6
64
0.6
21
0.4
11
0.4
14
RT
0.1
14
0.0
62
0.1
44
0.1
94
0.0
95
0.0
72
0.0
80
0.0
66
0.0
26
0.8
33
0.6
92
0.6
92
0.6
92
0.3
67
0.5
65
0.3
42
0.7
71
0.4
19
0.6
92
0.4
16
0.5
99
0.5
65
0.3
43
0.3
42
RV
0.3
09
0.2
87
0.3
16
0.4
62
0.2
94
0.4
01
0.4
42
0.2
21
0.2
84
0.3
57
0.8
46
0.8
46
0.8
46
0.5
33
0.7
19
0.4
96
1.0
00
0.5
63
0.8
46
0.5
70
0.8
05
0.7
19
0.4
87
0.4
96
SG
0.1
26
0.0
79
0.1
08
0.1
57
0.1
51
0.1
66
0.2
13
0.1
37
0.1
16
0.0
96
0.2
85
0.0
77
0.6
74
0.4
07
0.5
95
0.3
81
0.7
94
0.4
53
0.7
14
0.4
52
0.6
34
0.5
95
0.3
80
0.3
81
SM
0.1
42
0.0
56
0.0
88
0.1
65
0.0
96
0.1
38
0.1
67
0.1
12
0.0
86
0.0
95
0.2
79
0.1
05
0.6
22
0.4
07
0.5
95
0.3
81
0.7
94
0.4
53
0.7
14
0.4
52
0.6
34
0.5
95
0.3
80
0.3
81
TF
0.1
34
0.0
76
0.1
72
0.2
38
0.1
67
0.1
71
0.2
27
0.1
77
0.1
40
0.1
35
0.3
19
0.1
25
0.0
93
0.4
07
0.5
95
0.3
81
0.7
94
0.4
53
0.7
14
0.4
52
0.6
34
0.5
95
0.3
80
0.3
81
BC
0.2
03
0.2
52
0.3
43
0.3
97
0.2
53
0.3
47
0.3
54
0.2
79
0.2
32
0.2
16
0.3
86
0.2
56
0.2
48
0.2
77
0.2
80
0.0
34
0.4
00
0.1
45
0.4
07
0.0
39
0.2
54
0.0
52
0.0
39
0.0
57
CP
0.1
88
0.2
58
0.3
83
0.4
35
0.2
77
0.3
61
0.3
72
0.2
74
0.2
30
0.2
16
0.4
28
0.2
64
0.2
60
0.2
70
0.0
40
0.2
62
0.6
34
0.3
40
0.5
95
0.2
58
0.4
85
0.4
76
0.2
67
0.2
62
HB
0.3
64
0.3
67
0.5
26
0.4
97
0.4
07
0.4
99
0.4
92
0.3
65
0.3
61
0.3
65
0.5
50
0.3
27
0.3
42
0.3
33
0.3
04
0.3
32
0.3
71
0.1
33
0.3
81
0.1
19
0.2
35
0.2
62
0.0
60
0.0
48
HC
0.1
86
0.2
52
0.3
61
0.4
21
0.2
53
0.3
32
0.3
54
0.2
60
0.2
21
0.1
94
0.4
28
0.2
50
0.2
55
0.2
72
0.0
36
0.0
71
0.4
07
0.4
58
0.7
94
0.4
56
0.0
91
0.6
34
0.3
72
0.3
71
HG
0.2
81
0.3
16
0.4
21
0.4
36
0.3
49
0.4
27
0.4
23
0.3
31
0.3
15
0.2
94
0.4
75
0.2
89
0.2
95
0.3
03
0.1
68
0.2
07
0.1
37
0.2
08
0.4
53
0.2
03
0.3
25
0.3
28
0.1
43
0.0
84
MC
0.2
28
0.2
94
0.4
21
0.4
80
0.2
98
0.3
83
0.4
05
0.3
05
0.2
61
0.2
53
0.4
65
0.3
01
0.2
91
0.2
81
0.0
61
0.0
49
0.3
57
0.0
53
0.2
01
0.4
52
0.6
34
0.5
95
0.3
80
0.3
81
PF
S0
.31
40
.32
00
.436
0.4
59
0.3
78
0.4
32
0.4
26
0.3
23
0.3
20
0.3
01
0.4
62
0.2
83
0.3
16
0.2
99
0.2
36
0.2
67
0.2
34
0.2
55
0.1
29
0.2
52
0.3
16
0.1
62
0.0
97
0.1
01
RH
0.3
52
0.3
51
0.4
83
0.4
98
0.4
22
0.4
42
0.4
52
0.3
51
0.3
46
0.3
26
0.4
98
0.3
30
0.3
56
0.3
25
0.2
74
0.2
88
0.3
46
0.2
85
0.2
31
0.2
63
0.0
64
0.4
85
0.2
43
0.2
35
SB
0.2
87
0.2
98
0.4
10
0.4
67
0.2
98
0.4
20
0.4
09
0.3
26
0.2
91
0.2
82
0.4
52
0.3
13
0.2
89
0.3
29
0.0
64
0.1
21
0.3
49
0.1
46
0.2
42
0.1
63
0.3
02
0.3
44
0.1
96
0.2
31
SH
0.2
15
0.2
76
0.3
82
0.4
19
0.2
84
0.3
66
0.3
83
0.2
94
0.2
44
0.2
38
0.4
17
0.2
71
0.2
76
0.2
95
0.0
40
0.0
45
0.3
74
0.0
95
0.2
22
0.1
13
0.2
93
0.3
27
0.1
43
0.0
60
Sk
0.1
94
0.2
31
0.3
72
0.4
17
0.2
72
0.3
33
0.3
40
0.2
44
0.2
10
0.1
84
0.4
29
0.2
46
0.2
34
0.2
57
0.0
53
0.0
51
0.3
37
0.0
59
0.2
04
0.0
81
0.2
21
0.2
18
0.0
91
0.1
01
604 JOURNAL OF MAMMALOGY Vol. 93, No. 2