Embed Size (px)
Citation preview
UIL Holdings Corporation 157 Church Street PO Box 1564 New Haven, CT 06506-0901 Phone 203.499.2000
November 27, 2013
Robert Stein
Chairman
Connecticut Siting Council
Ten Franklin Square
New Britain, CT 06051
Re: Docket No. F-2012/2013 - UI Written Comments
Dear Chairman Stein:
I enclose The United Illuminating Company’s comments to the Connecticut Siting
Council draft report dated November 7, 2013.
Please do not hesitate to contact me at (203) 499-2422 if you have any questions
regarding this filing.
Bruce L. McDermott
Bruce L. McDermott
Managing Counsel – Operations
On Behalf of The United Illuminating Company
cc: Service List
Enclosure
Docket No. F-2012/2013 Page 2 of 61
Forecast Report
COMMENTS OF THE UNITED ILLUMINATING COMPANY
11-27-13
DOCKET NO. F-2012/2013 – Connecticut Siting Council Review of the
Ten-Year Forecast of Connecticut Electric Loads and Resources Draft Final Report
11/07/2013
Docket No. F-2012/2013 Page 2 of 61
Forecast Report
TABLE OF CONTENTS
Introduction .................................................................................................................................. 5
Electric Demand ........................................................................................................................... 6
Load and Load Forecasting ............................................................................................. 6
Peak Load Forecasting .................................................................................................... 7
Normal Weather (50/50) Peak Load Forecasting ............................................................ 8
Hot Weather (90/10) Peak Forecast .............................................................................. 12
Past Accuracy of Peak Load Forecasts .......................................................................... 14
Electric Energy Consumption..................................................................................................... 15
Forecasting Electric Energy Consumption .................................................................... 15
Electric Vehicles ........................................................................................................... 18
Conservation and Load Management and Distributed Generation............................................. 20
LREC/ZREC Program .................................................................................................. 23
Distributed Generation Forecast ................................................................................... 24
Electric Supply ........................................................................................................................... 24
New Generation ............................................................................................................. 24
Public Act 07-242 ............................................................................................. 25
Project 150 ........................................................................................................ 26
Wind Renewable Projects ................................................................................ 27
Solar Renewable Projects ................................................................................. 27
Generation for Backup Power/Microgrids ....................................................... 28
Existing Generation .................................................................................................................... 29
Nuclear Powered Generation ............................................................................ 29
Coal Powered Generation ................................................................................. 29
Petroleum Powered Generation ........................................................................ 30
Natural Gas Powered Generation ..................................................................... 31
Hydroelectric Power Generation ...................................................................... 32
Solid Waste Powered Generation ..................................................................... 32
Landfill Gas Powered Generation .................................................................... 33
Miscellaneous Distributed Generation ............................................................. 33
Fuel Cells .......................................................................................................... 33
Other Miscellaneous Distributed Generation ...................................... 34
Docket No. F-2012/2013 Page 2 of 61
Forecast Report
Fuel Mix ..................................................................................................................................... 34
Import Capacity .......................................................................................................................... 35
Demand/Supply Balance ............................................................................................................ 35
Market Rules Affecting Supply .................................................................................................. 37
Forward Capacity Market (FCM) ................................................................................. 37
Other ISO-NE Markets .................................................................................................. 38
Legislation Affecting Supply ..................................................................................................... 39
Regional Greenhouse Gas Initiative (RGGI) ............................................................... 39
Carbon Dioxide Pollution Standard for New Power Plants .......................................... 40
Transmission System .................................................................................................................. 40
Substations and Switching Stations ............................................................................... 41
Interstate Connections and Imports ............................................................................... 41
New England East – West Solution (NEEWS) ......................................................................... 41
The Interstate Reliability Project ................................................................................... 42
The Greater Springfield Reliability Project ................................................................... 42
The Central Connecticut Reliability Project .................................................................. 42
The Rhode Island Reliability Project ............................................................................ 42
Transmission associated with Renewable Portfolio Standards .................................................. 42
The Northern Pass Project ............................................................................................. 43
Electric Transmission in Southwest Connecticut ....................................................................... 44
Bethel-Norwalk Project and Middletown-Norwalk Project - Dockets 217 and 272 ..... 44
Glenbrook-Norwalk Cable Project ................................................................................ 44
Stamford Reliability Project Cable Project – Docket 435 ............................................. 45
New Transmission Technologies ............................................................................................... 45
Materials and Construction ........................................................................................... 45
Storage ........................................................................................................................... 45
Smart Grid .................................................................................................................................. 45
Climate Change Effects on Electric Substations and Mitigation Plans ...................................... 46
Docket No. F-2012/2013 Page 2 of 61
Forecast Report
Resource Planning ...................................................................................................................... 47
Connecticut Siting Council ........................................................................................... 47
Department of Energy and Environmental Protection (DEEP) .................................... 47
Integrated Resource Plan (IRP) .................................................................................... 48
Comprehensive Energy Strategy (CES) ........................................................................ 48
Conclusion .................................................................................................................................. 50
End Notes ................................................................................................................................... 51
Glossary ...................................................................................................................................... 54
Docket No. F-2012/2013 Page 2 of 61
Forecast Report
INTRODUCTION
Connecticut’s electric system provides service to approximately 3.5 million residents and
approximately 78 thousand businesses and impacts our lives in many ways. The system’s
infrastructure includes 109 generating units whose electrical energy is dispatched onto
the regional supply network—over 1,800 circuit-miles of high-voltage conductors that
form the transmission grid and more than 130 substations that direct electricity to
individual users via the distribution system.
This network of electric connections must be highly reliable, reflecting its importance not
only for our State, but for our region. Reliability is a special challenge, given current
global circumstances, volatile fuel prices, new energy technologies, and climate change
concerns. Daily operations of the grid, including both power flows and transactions
within the wholesale market for electricity, are managed by the Independent Systems
Operator for New England. ISO New England Inc. (ISO-NE) is a private, not-for-profit
corporation, governed by an independent board of directors and overseen by the Federal
Energy Regulatory Commission (FERC). Reliability standards set or approved by FERC
are carried out through ISO-NE by its member companies. This centralized regional
authority for management helps to ensure that the system functions reliably and
efficiently. ISO-NE also directs annual forward planning for electric transmission needs
in our region. Members choose to participate The main participants in this regional
planning process in one of the following sectorsare: generators, suppliers, alternative
resources (including suppliers of renewable resources), transmission owners, publicly-
owned utilities, and end users. Nonetheless, since each state regulates the power facilities
in-state only, and affects future electric reliability by establishing energy policies for in-
state businesses and citizens, the prudent state must carefully review forecasts of
anticipated electric supply and demand within its own borders.
Since 1972, the Connecticut General Assembly has mandated the Connecticut Siting
Council (Council) to provide an annual review of the forecasts of our State’s electricity
needs and resources. Specifically, since the passage of Public Act (PA) 01-144 in 2001,
the requirement is to review a ten-year forecast of needs and resources. As is to be
expected, the utility companies themselves provide these forecasts/projections. Most of
Connecticut’s electric system data is used in common by all the State and regional
planners and is supplied by Connecticut generators and by our State’s two largest
transmission and distribution companies, The Connecticut Light and Power Company
(CL&P) and The United Illuminating Company (UI), as well as by the Connecticut
Municipal Electric Energy Cooperative (CMEEC). These data have been developed for
their own internal planning. Other planning groups model these data to emphasize fuel
characteristics, cost issues, efficiency, and so forth. As more and more forecasting has
been undertaken by different parties to make sure, in different ways, that the electric
system will remain reliable, the more the Council has tried, in its annual forecast review,
to emphasize openness, to clarify differences in approach, and to assess consistency.
Docket No. F-2012/2013 Page 2 of 61
Forecast Report
Pursuant to PA 11-80, the Department of Energy and Environmental Protection (DEEP),
in consultation with the Connecticut Energy Advisory Board (CEAB) and the electric
distribution companies, is mandated to create an Integrated Resource Plan (IRP). Its
most important features, to be discussed below in more detail, are its coordinated
approach to procurement and its emphasis on energy reliability and efficiency. In the end,
all of Connecticut’s and New England’s plans for the future of the electric system are
designed to make changes in the system happen more smoothly, so electric service will
not be disrupted, and more efficiently, so electric service will be worth its price.
Furthermore, in accordance with PA 11-80, DEEP is also mandated to create a
Comprehensive Energy Strategy (CES). The CES, while taking into account the findings
of the IRP, lays out a coordinated approach to address our collective energy, economic,
and environmental challenges while aiming towards a cheaper, cleaner, and more reliable
energy future. While the CES covers multiple energy areas, the Council’s report will
focus on the electric side, as required by statute.
ELECTRIC DEMAND
Load and Load Forecasting
The principal term for describing electric load is “demand,” which can be thought of as
the rate at which electrical energy is consumed. (This is not to be confused with
“energy”, which is the total work done over a given period of time by the electricity and
will be discussed later.) The most familiar unit of load or demand is a “Watt.” On a
household scale, a kilowatt (kW) or unit of 1,000 Watts is used. However, since utility
companies serve loads on a much larger scale, forecasts typically use the unit of a
megawatt (MW), or one million watts1.
Loads increase with any increase in the number of electrical devices being used at the
same time. Demand also depends on the type of electrical loads and how much work is
being performed by those devices. Generally, the higher the electrical loads, the more the
stress on the electrical infrastructure. Higher loads result in more generators having to
run, and run at higher output levels. Transmission lines must carry more current to
transformers located at the various substations. The transformers in turn must carry more
electrical load, and supply it to the distribution feeders, which must carry more current to
supply the end users. In order to maintain reliability and predict when infrastructure must
be added, upgraded, and replaced to serve customers adequately, utilities must have a
meaningful and reasonably accurate estimate or projection of future loads. The process
of calculating future loads is called “load forecasting.”
Load forecasting by the three Connecticut utilities is broken down by each company’s
respective service area. UI serves 17 municipalities in the New Haven area near the coast
from Fairfield to North Branford and north to Hamden. The Connecticut Municipal
Electric Energy Cooperative (CMEEC) collectively serves all of the municipal utilities in
Connecticut, namely the cities of Groton and Norwich; the Borough of Jewett City; the
Second (South Norwalk) and Third (East Norwalk) Taxing Districts of the City of
Docket No. F-2012/2013 Page 2 of 61
Forecast Report
Norwalk; the towns of Wallingford2 and Groton; and the Mohegan Tribal Utility
Authority. The largest transmission/distribution company is CL&P. CL&P serves all of
the remaining municipalities in Connecticut. Collectively, at a given time, the sum of
CL&P, UI, and CMEEC loads is equal to the Connecticut load. The Council is mandated
by statute to review these three forecasts for the Connecticut load.
In addition to producing its regional forecast, ISO-NE prepares individual forecasts for
each of the New England states, including Connecticut. The Council acknowledges the
importance of this forecast by reviewing it in parallel with the sum of the CL&P, UI, and
CMEEC forecasts, even though the statute does not specifically require the Council to do
so.
By statute, the Connecticut utilities must provide ten-year forecasts of loads and
resources to the Council by March 1 of each year. ISO-NE’s forecasts also include
projections for ten years based on their planning horizon. In a ten-year forecast, peak
loads and electrical energy consumption are predicted for the calendar year that the
forecast report is issued and for nine years into the future. Thus, a 2013 ten-year forecast
does not predict peak loads and energy usage through 2023, but rather 2022. The 2013
utility and ISO-NE forecast reports will be subjects of the Council’s report as they are the
most up to date available at this time.
Peak Load Forecasting
Load forecasting focuses primarily on peak load, that is, the highest hourly load
experienced during the year. Peak load is more important than typical or average load
because the peak represents a clearly-defined worst-case stress on the electric system.
Connecticut experiences its peak load during a hot, humid summer day. This is because
air conditioning generally creates one of the largest components of demand for power.
While winter months in Connecticut do have periods of significant loads, winter peaks
are generally lower than summer peaks because much of the energy for heating is
supplied directly by fossil fuels consumed on the customer’s premises, not by electricity3.
While natural gas, propane, or oil heating systems do typically require electricity for
blowers/fans, control systems, pumps, etc., this electrical load is generally smaller than
the load from air conditioning, which runs entirely on electricity4. Conversely, in areas
where electric heat is common and there is less demand for air conditioning, such as the
Canadian province of Québec, a winter peak load can result.
While a detailed discussion of peak loads would have to include additional factors such
as customer usage, demographics, conservation efforts, economic conditions, and others,
the most important factor is weather—specifically the temperature and humidity. Higher
temperatures result in more frequent use of air conditioning, and the units work harder,
consuming more electricity. Also, higher humidity can exacerbate the situation, as it can
make the temperature feel hotter than it actually is (raising what is sometimes called the
“heat index”) and further encourage air conditioning use.
Docket No. F-2012/2013 Page 2 of 61
Forecast Report
In order to account for weather effects as accurately as possible (for financial planning
purposes, not infrastructure planning), the Connecticut transmission/distribution
companies provide a forecast based on “normal weather”, or assumed temperatures
consistent with approximately the past 30 years of meteorological data. This is also
referred to as the “50/50” forecast, which means that, in a given year, the probability of
the projected peak load being exceeded is 50 percent, while the probability that the actual
peak load would be less than predicted is also 50 percent. Another way of considering
this 50/50 forecast would be to say that it has the probability of being exceeded, on
average, once every two years.
Normal Weather (50/50) Peak Load Forecast
In its normal weather (50/50) forecast, CL&P predicted a peak load of 5,048 MW for its
service area during 2013. This load is expected to grow during the forecast period at a
compound annual growth rate (CAGR) of 0.16 percent, reaching 5,121 MW in 2022. UI
predicted, in its normal weather (50/50) forecast, a peak load of 1,272 MW for its service
area during 2013. This load is expected to grow during the forecast period at a CAGR of
1.20 percent, reaching 1,416 MW in 2022. CMEEC predicted, in its normal weather
(50/50) forecast, a peak load of 379 MW for its service area during 2013. This load is
expected to grow during the forecast period at a CAGR of 0.82 percent, reaching 408
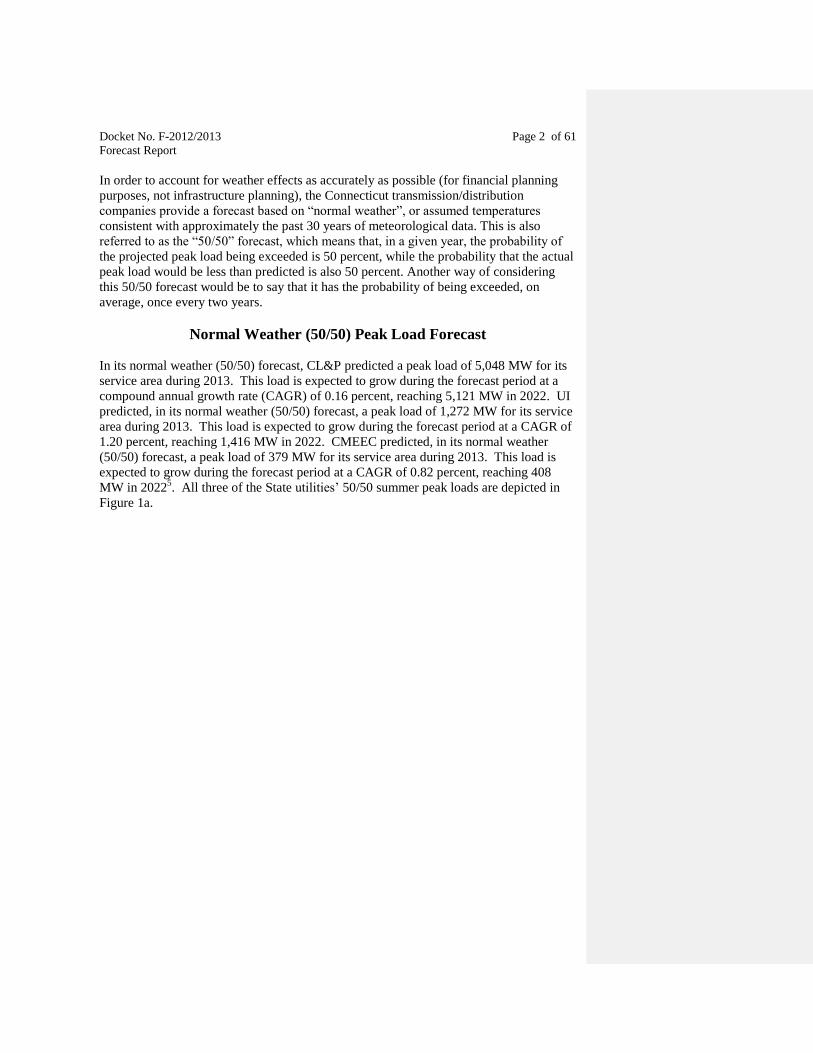
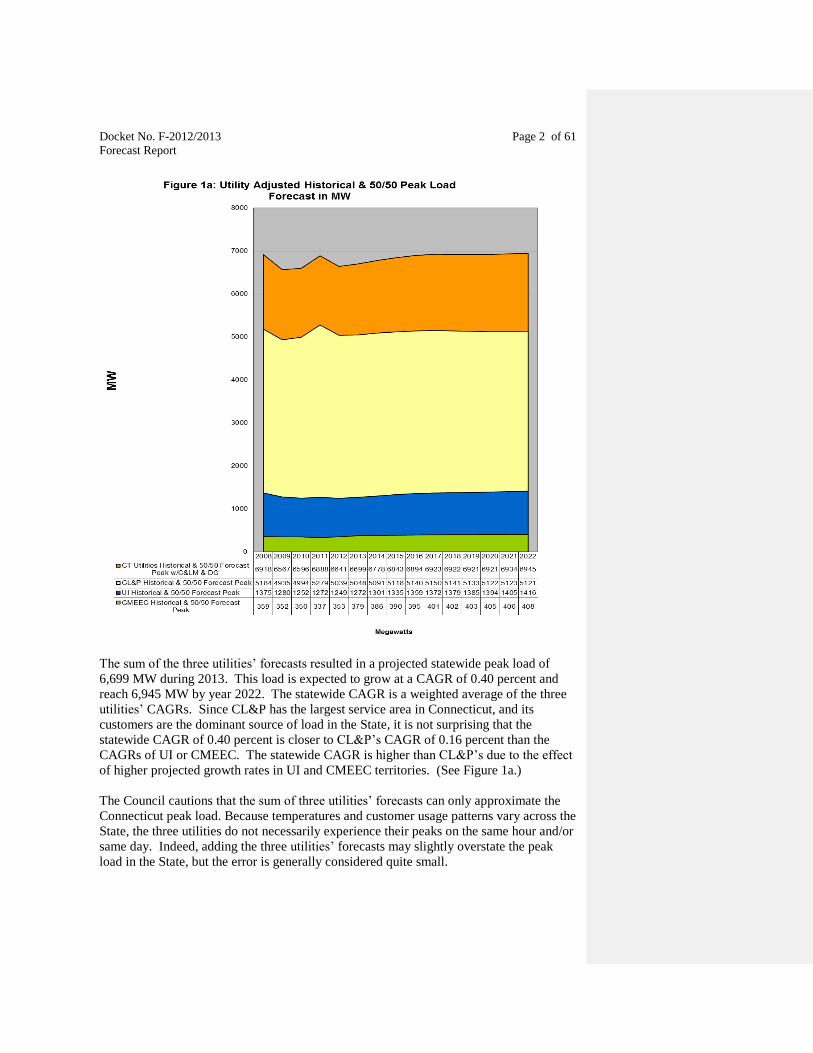
MW in 20225. All three of the State utilities’ 50/50 summer peak loads are depicted in
Figure 1a.
Docket No. F-2012/2013 Page 2 of 61
Forecast Report
The sum of the three utilities’ forecasts resulted in a projected statewide peak load of
6,699 MW during 2013. This load is expected to grow at a CAGR of 0.40 percent and
reach 6,945 MW by year 2022. The statewide CAGR is a weighted average of the three
utilities’ CAGRs. Since CL&P has the largest service area in Connecticut, and its
customers are the dominant source of load in the State, it is not surprising that the
statewide CAGR of 0.40 percent is closer to CL&P’s CAGR of 0.16 percent than the
CAGRs of UI or CMEEC. The statewide CAGR is higher than CL&P’s due to the effect
of higher projected growth rates in UI and CMEEC territories. (See Figure 1a.)
The Council cautions that the sum of three utilities’ forecasts can only approximate the
Connecticut peak load. Because temperatures and customer usage patterns vary across the
State, the three utilities do not necessarily experience their peaks on the same hour and/or
same day. Indeed, adding the three utilities’ forecasts may slightly overstate the peak
load in the State, but the error is generally considered quite small.
Docket No. F-2012/2013 Page 2 of 61
Forecast Report
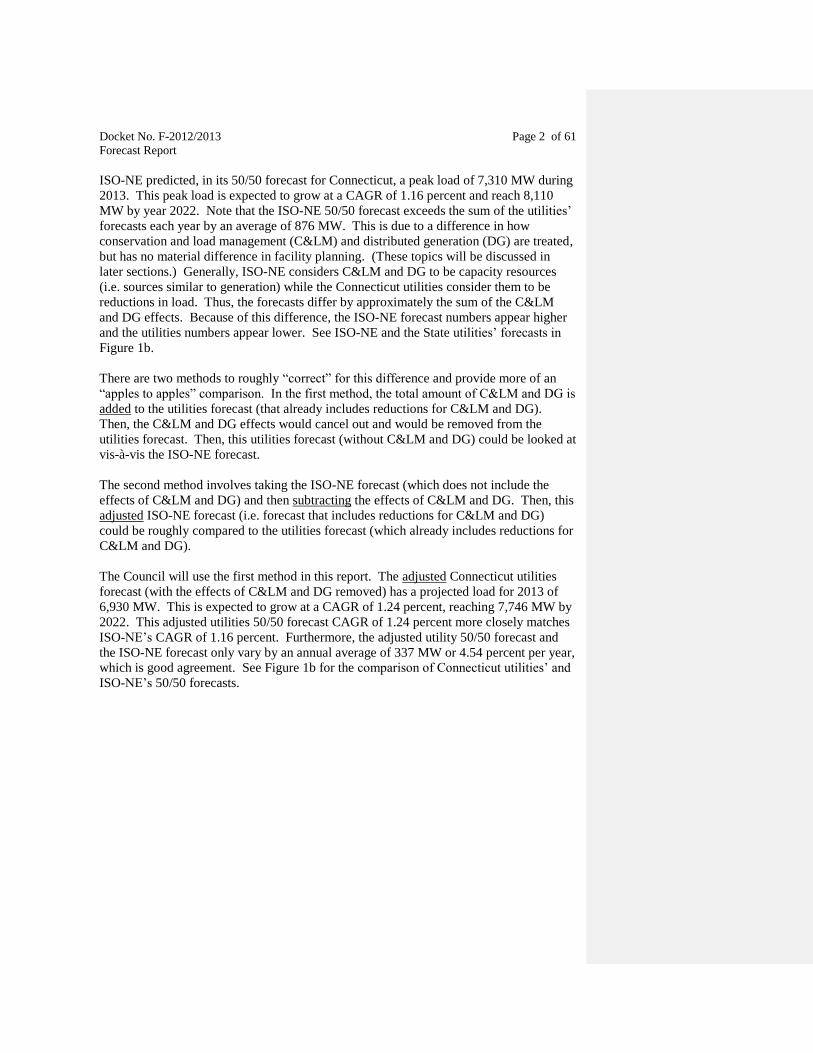
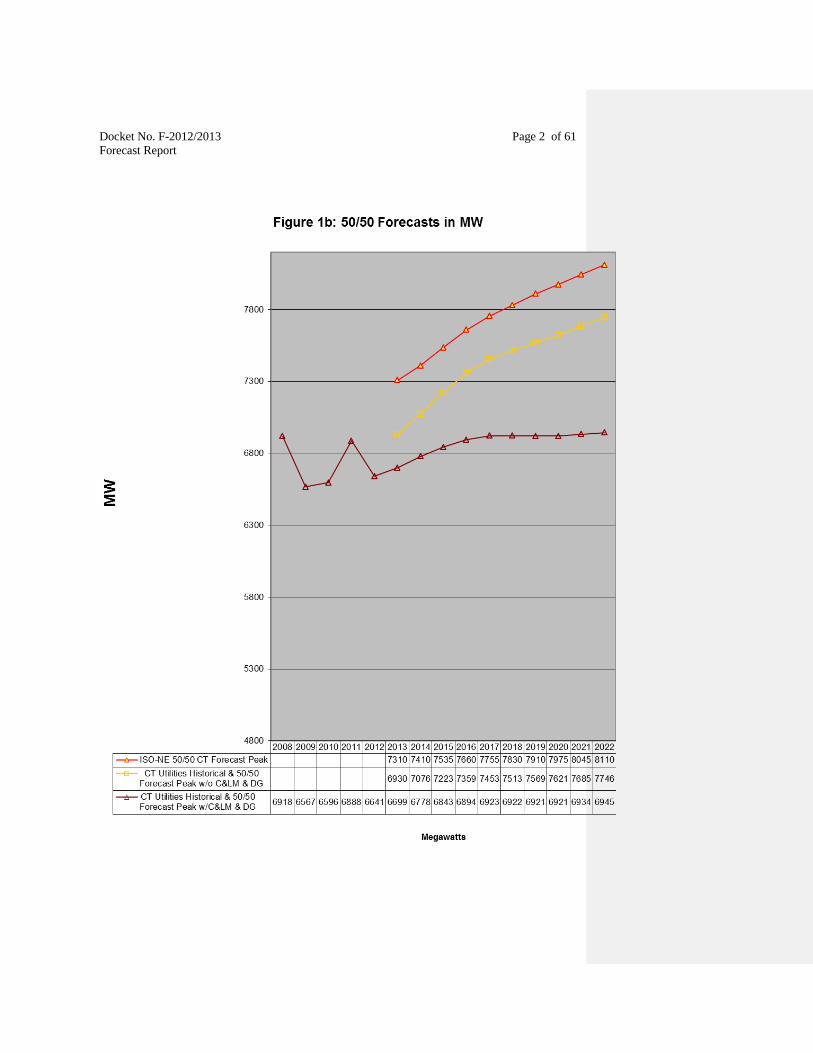
ISO-NE predicted, in its 50/50 forecast for Connecticut, a peak load of 7,310 MW during
2013. This peak load is expected to grow at a CAGR of 1.16 percent and reach 8,110
MW by year 2022. Note that the ISO-NE 50/50 forecast exceeds the sum of the utilities’
forecasts each year by an average of 876 MW. This is due to a difference in how
conservation and load management (C&LM) and distributed generation (DG) are treated,
but has no material difference in facility planning. (These topics will be discussed in
later sections.) Generally, ISO-NE considers C&LM and DG to be capacity resources
(i.e. sources similar to generation) while the Connecticut utilities consider them to be
reductions in load. Thus, the forecasts differ by approximately the sum of the C&LM
and DG effects. Because of this difference, the ISO-NE forecast numbers appear higher
and the utilities numbers appear lower. See ISO-NE and the State utilities’ forecasts in
Figure 1b.
There are two methods to roughly “correct” for this difference and provide more of an
“apples to apples” comparison. In the first method, the total amount of C&LM and DG is
added to the utilities forecast (that already includes reductions for C&LM and DG).
Then, the C&LM and DG effects would cancel out and would be removed from the
utilities forecast. Then, this utilities forecast (without C&LM and DG) could be looked at
vis-à-vis the ISO-NE forecast.
The second method involves taking the ISO-NE forecast (which does not include the
effects of C&LM and DG) and then subtracting the effects of C&LM and DG. Then, this
adjusted ISO-NE forecast (i.e. forecast that includes reductions for C&LM and DG)
could be roughly compared to the utilities forecast (which already includes reductions for
C&LM and DG).
The Council will use the first method in this report. The adjusted Connecticut utilities
forecast (with the effects of C&LM and DG removed) has a projected load for 2013 of
6,930 MW. This is expected to grow at a CAGR of 1.24 percent, reaching 7,746 MW by
2022. This adjusted utilities 50/50 forecast CAGR of 1.24 percent more closely matches
ISO-NE’s CAGR of 1.16 percent. Furthermore, the adjusted utility 50/50 forecast and
the ISO-NE forecast only vary by an annual average of 337 MW or 4.54 percent per year,
which is good agreement. See Figure 1b for the comparison of Connecticut utilities’ and
ISO-NE’s 50/50 forecasts.
Docket No. F-2012/2013 Page 2 of 61
Forecast Report

Docket No. F-2012/2013 Page 2 of 61
Forecast Report
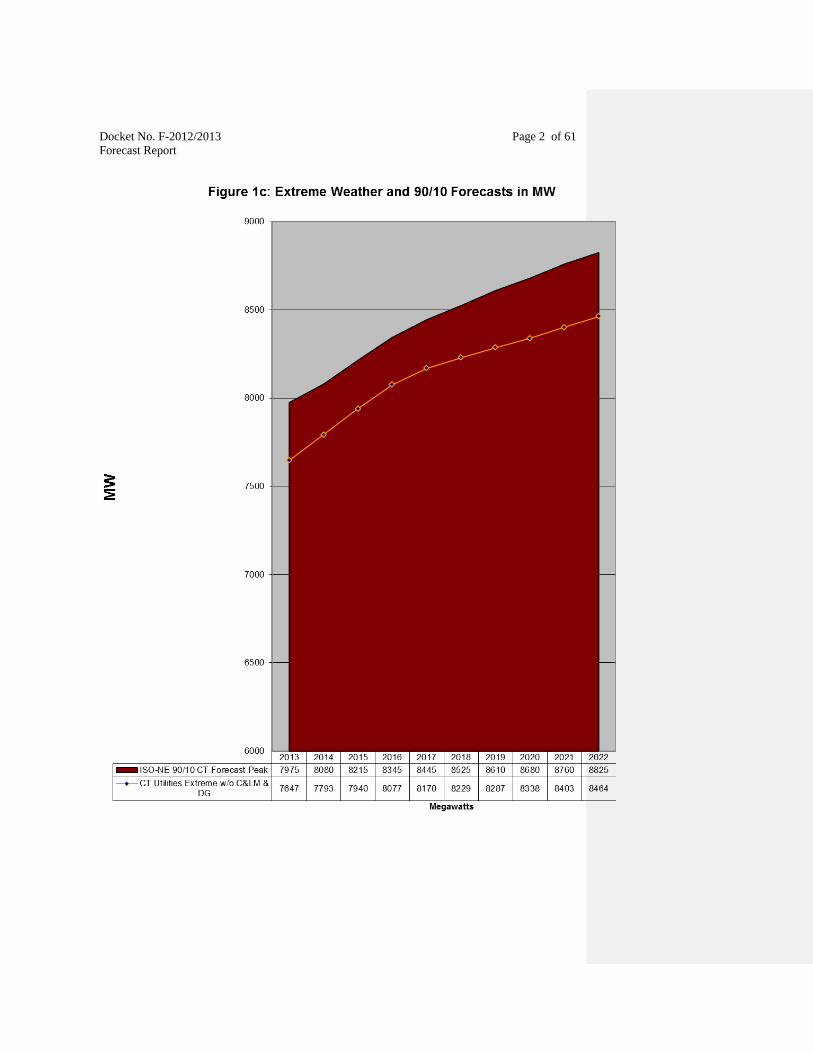
Hot Weather (90/10) Peak Forecast
The more significant forecast to be discussed in this review is the 90/10 forecast
produced by ISO-NE. It is separate from the normal weather (50/50) forecasts offered by
ISO-NE and the Connecticut utilities. However, it is the one used by both ISO-NE and
by the Connecticut utilities for utility infrastructure planning, including both transmission
and generation.
A 90/10 forecast is a plausible worst-case hot weather scenario. It means there is only a
10 percent chance that the projected peak load would be exceeded in a given year, while
the odds are 90 percent that it would not be exceeded in a given year. Put another way,
the forecast would be exceeded, on average, only once every ten years. While this
projection is quite conservative, it is reasonable for facility planning because of the
potentially severe disruptive consequences of inadequate facilities: brownouts, blackouts,
damage to equipment, and other failures.
Utility planners must be conservative in estimating risk because they cannot afford the
alternative. Just as bank planners should ensure the health of the financial system by
maintaining sufficient collateral to meet worst-case liquidity risks, so load forecasters
must ensure the reliability of the electric system by maintaining adequate facilities to
meet peak loads in worst-case weather conditions. While over-forecasting can have
economic penalties due to excessive and/or unnecessary expenditures on infrastructure,
the consequences of under-forecasting can be much more serious. Accordingly, the
Council will base its analysis in this review on the ISO-NE 90/10 forecast.
Specifically, ISO-NE’s 90/10 forecast has a projected (worst-case) peak load for
Connecticut of 7,975 MW in 2013. This load is expected to grow at a CAGR of
1.13 percent and reach 8,825 MW by 2022.
The Connecticut utilities also have extreme weather forecasts, which are approximately
the same as 90/10 forecasts. For the extreme weather forecasts, it is also necessary to
adjust for C&LM and DG to properly compare the utility projections to ISO-NE’s
projections. Specifically, the sum of the utilities’ extreme weather forecasts adjusted by
removing the effects of C&LM and DG is 7,647 MW for 2013. This would grow at a
CAGR of 1.13 percent to reach 8,464 MW in 2022.
These adjusted utility extreme weather forecasts only differ from ISO-NE’s 90/10
forecast by an annual average of 311 MW or about 3.83 percent, which is good
agreement. The CAGRs are equal to three significant figures, which is very good
agreement. See Figure 1c for the extreme weather forecasts.
Docket No. F-2012/2013 Page 2 of 61
Forecast Report
Docket No. F-2012/2013 Page 2 of 61
Forecast Report
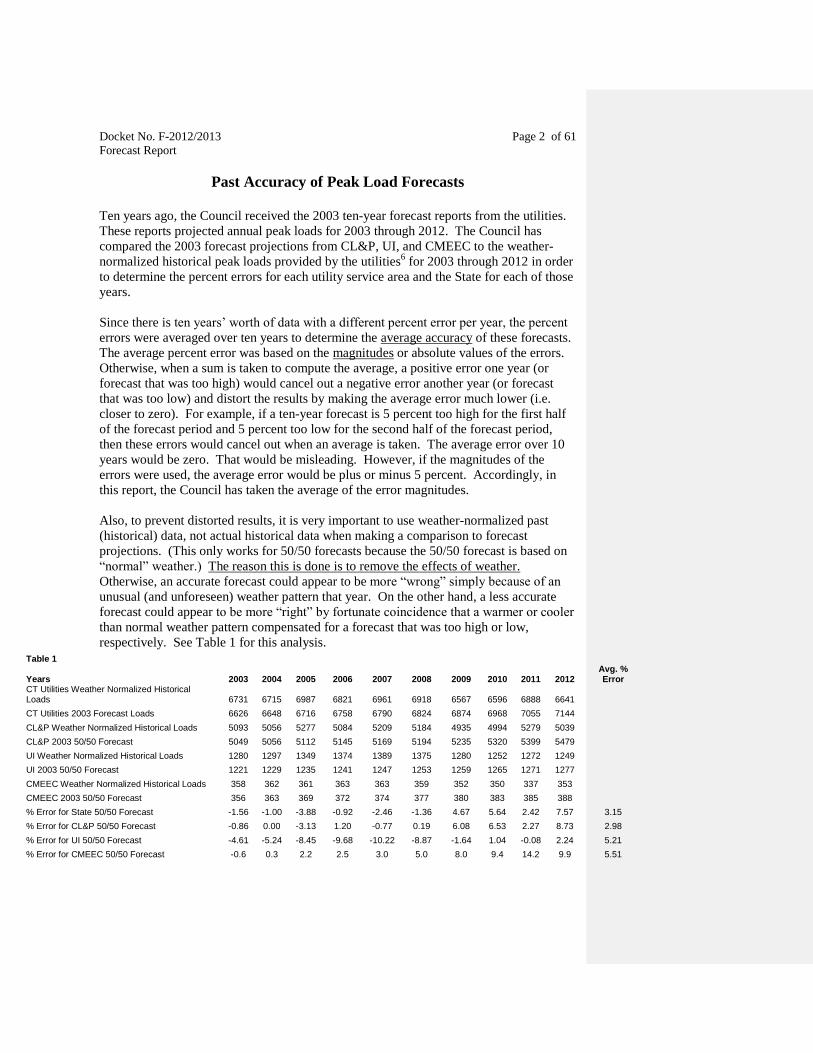
Past Accuracy of Peak Load Forecasts
Ten years ago, the Council received the 2003 ten-year forecast reports from the utilities.
These reports projected annual peak loads for 2003 through 2012. The Council has
compared the 2003 forecast projections from CL&P, UI, and CMEEC to the weather-
normalized historical peak loads provided by the utilities6 for 2003 through 2012 in order
to determine the percent errors for each utility service area and the State for each of those
years.
Since there is ten years’ worth of data with a different percent error per year, the percent
errors were averaged over ten years to determine the average accuracy of these forecasts.
The average percent error was based on the magnitudes or absolute values of the errors.
Otherwise, when a sum is taken to compute the average, a positive error one year (or
forecast that was too high) would cancel out a negative error another year (or forecast
that was too low) and distort the results by making the average error much lower (i.e.
closer to zero). For example, if a ten-year forecast is 5 percent too high for the first half
of the forecast period and 5 percent too low for the second half of the forecast period,
then these errors would cancel out when an average is taken. The average error over 10
years would be zero. That would be misleading. However, if the magnitudes of the
errors were used, the average error would be plus or minus 5 percent. Accordingly, in
this report, the Council has taken the average of the error magnitudes.
Also, to prevent distorted results, it is very important to use weather-normalized past
(historical) data, not actual historical data when making a comparison to forecast
projections. (This only works for 50/50 forecasts because the 50/50 forecast is based on
“normal” weather.) The reason this is done is to remove the effects of weather.
Otherwise, an accurate forecast could appear to be more “wrong” simply because of an
unusual (and unforeseen) weather pattern that year. On the other hand, a less accurate
forecast could appear to be more “right” by fortunate coincidence that a warmer or cooler
than normal weather pattern compensated for a forecast that was too high or low,
respectively. See Table 1 for this analysis.
Table 1
Years 2003 2004 2005 2006 2007 2008 2009 2010 2011 2012 Avg. % Error
CT Utilities Weather Normalized Historical Loads 6731 6715 6987 6821 6961 6918 6567 6596 6888 6641
CT Utilities 2003 Forecast Loads 6626 6648 6716 6758 6790 6824 6874 6968 7055 7144 CL&P Weather Normalized Historical Loads 5093 5056 5277 5084 5209 5184 4935 4994 5279 5039 CL&P 2003 50/50 Forecast 5049 5056 5112 5145 5169 5194 5235 5320 5399 5479 UI Weather Normalized Historical Loads 1280 1297 1349 1374 1389 1375 1280 1252 1272 1249 UI 2003 50/50 Forecast 1221 1229 1235 1241 1247 1253 1259 1265 1271 1277 CMEEC Weather Normalized Historical Loads 358 362 361 363 363 359 352 350 337 353 CMEEC 2003 50/50 Forecast 356 363 369 372 374 377 380 383 385 388 % Error for State 50/50 Forecast -1.56 -1.00 -3.88 -0.92 -2.46 -1.36 4.67 5.64 2.42 7.57 3.15
% Error for CL&P 50/50 Forecast -0.86 0.00 -3.13 1.20 -0.77 0.19 6.08 6.53 2.27 8.73 2.98
% Error for UI 50/50 Forecast -4.61 -5.24 -8.45 -9.68 -10.22 -8.87 -1.64 1.04 -0.08 2.24 5.21
% Error for CMEEC 50/50 Forecast -0.6 0.3 2.2 2.5 3.0 5.0 8.0 9.4 14.2 9.9 5.51
Docket No. F-2012/2013 Page 2 of 61
Forecast Report
As noted in Table 1, CL&P’s average percent error for the ten-year (2003 through 2012)
forecast period is 2.98 percent. UI’s average percent error is 5.21 percent. CMEEC’s is
5.51 percent. This results in a weighted average state-wide forecast error of 3.15 percent.
(As already noted, the state-wide average is weighted more towards CL&P because they
serve the largest load.)
In the Council’s Interim Forecast Report dated December 27, 2012, the Council reported
that the statewide 2002 forecast had an average accuracy of 5.16 percent. Thus, the
Council notes a significant increase in accuracy in the 2003 forecast with the percent
error declining to 3.15 percent.
Overall, an average Connecticut utilities’ forecast accuracy to approximately plus or
minus 3.15 percent is excellent7. In addition, the utilities continue to refine their
forecasts, so future forecast accuracy is expected to improve.
ELECTRIC ENERGY CONSUMPTION
Forecasting Electric Energy Consumption
Energy consumption is the product of the average load and time. As an analogy, load (or
rate of energy consumption) can be thought of as the gallons per minute running out of a
water faucet to fill a sink. Energy consumption can be thought of as the total number of
gallons of water that accumulate in the sink, or average gallons per minute multiplied by
the number of minutes.
Energy consumption is also the total work done by the electricity over time. Therefore, a
smaller load operating for a longer period of time could consume as much energy as
larger load operating for a smaller amount of time8.
Energy consumption is represented in units of load multiplied by time or Watt-hours. On
a household scale and for most electric sales, a unit of kilowatt-hours is used (kWh, or
one thousand watt-hours) for energy. A household or business electric meter essentially
records the sum of the energy in kilowatt-hours of all loads that have operated on the
premises during the billing period9.
For residential customers, CL&P reports an average monthly usage of 700 kWh. UI
reports 650 kWh. CMEEC’s most recent data shows 717 kWh for a typical residential
customer for one month. This results in a weighted statewide average of about 692 kWh
per month for residential customers. This is about 26.4 percent below the national
average of 940 kWh reported by the U.S. Department of Energy (DOE) in 201110
.
On a larger statewide scale, the units used are megawatt-hours (MWh or one million
watt-hours), or gigawatt-hours (GWh, or one billion watt-hours). While load (demand) is
measured as an instantaneous snapshot of time (usually recorded hourly by utilities) and
can go up or down, annual energy consumption acts like a “running total” that starts at
zero at the beginning of the calendar year and increases all during the year, reaching a
Docket No. F-2012/2013 Page 2 of 61
Forecast Report
final annual total at year-end. Also, unlike annual peak loads, every season in
Connecticut affects the total annual energy consumption, including winter.
The three transmission/distribution utilities maintain records of total energy consumption
in their service area. This total is generally the sum of the customers’ consumption, the
utilities’ internal consumption, and losses in the system. The sum of the three utilities’
energy consumption approximates the electric energy consumption in Connecticut.
CL&P predicts a total electrical energy consumption in its service area of 23,273 GWh
for calendar year 2013. The calculated CAGR is -0.48 percent. This means annual
energy consumption in CL&P’s service territory is forecast to decrease over time and
reach 22,281 GWh by 2022.
UI predicts a total electrical energy consumption in its service area of 5,359 GWh for
2013. UI’s projections result in a CAGR of -0.23 percent. That is, UI’s annual electric
energy consumption is expected to decrease over the forecast period to reach 5,250 GWh
by 2022.
CMEEC predicts a total electrical energy consumption in its service area of 1,802 GWh
for 2013. This number is expected to grow at a CAGR of 0.96 percent, reaching 1,964
GWh by 2022.
Taken together, these data result in a projected statewide electrical energy consumption
of approximately 30,434 GWh for 2013. This number is expected to decrease due to a
(weighted) CAGR of -0.35 percent and reach 29,495 GWh by 2022.
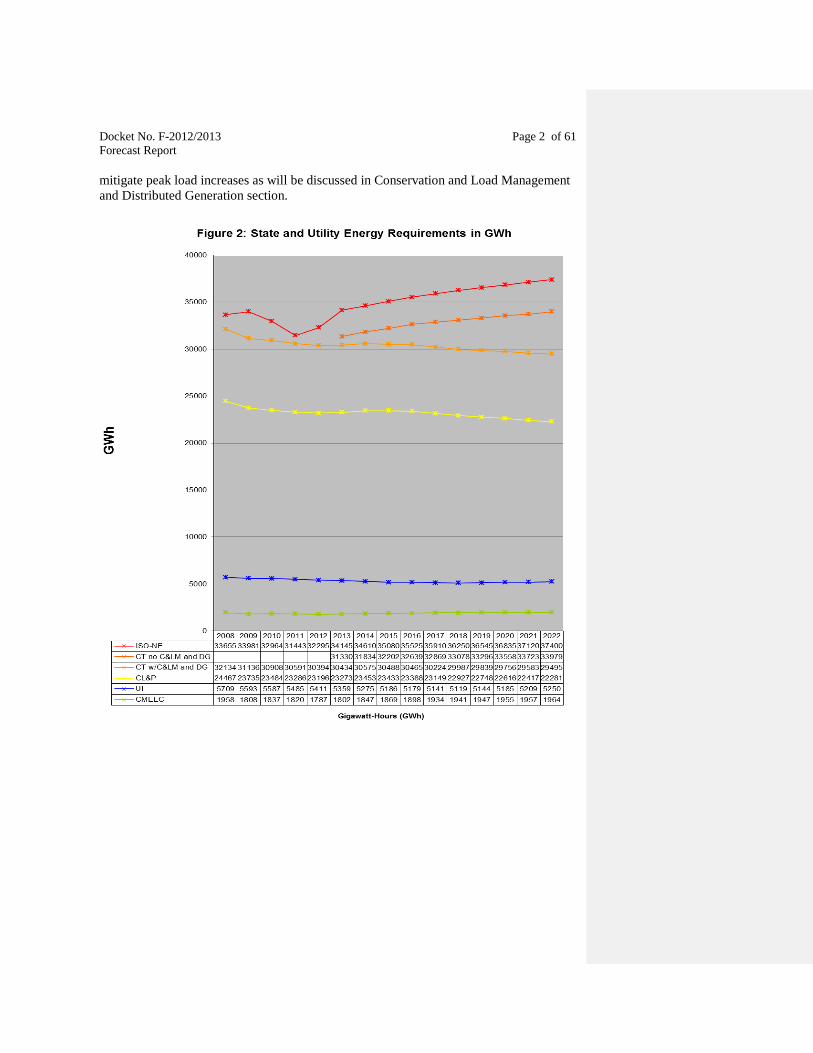
Just as ISO-NE forecasts electric load for Connecticut, is also forecasts the State’s energy
consumption. Specifically, ISO-NE predicts electric energy consumption in Connecticut
to be 34,145 GWh in 2013. This number is expected to grow at a CAGR of 1.02 percent
and reach 37,400 GWh by 2022. Figure 2 depicts the four requirement forecasts.
Figure 2 also includes two curves showing Connecticut both with and without C&LM
and DG. Similar to the 50/50 peak load forecasts, the curve for Connecticut adjusted by
removing C&LM and DG is closer to the ISO-NE curve because of different approaches
to C&LM and DG in the modeling done by ISO-NE and the Connecticut utilities.
Accordingly, the CAGR for the adjusted Connecticut utilities annual energy consumption
forecast total is approximately 0.91 percent, which is comparable to ISO-NE’s CAGR of
1.02 percent.
On the surface, the statewide energy consumption CAGR of -0.35 percent (taking into
account C&LM and DG effects) might seem inconsistent compared with the +0.40
percent CAGR of peak electric load in the State (also taking into account C&LM and
DG). Furthermore, when the effects of C&LM and DG are removed, the Connecticut
utilities annual energy consumption CAGR becomes positive. The only explanation is
that C&LM and DG are predicted to eliminate the average increases in electric energy
consumption. While not eliminating the peak load growth, C&LM and DG help to
Docket No. F-2012/2013 Page 2 of 61
Forecast Report
mitigate peak load increases as will be discussed in Conservation and Load Management
and Distributed Generation section.
Docket No. F-2012/2013 Page 2 of 61
Forecast Report
Electric Vehicles
Electric vehicles (EVs) are propelled by an electric motor (or motors) powered by
rechargeable battery packs. They have several advantages over internal combustion
vehicles such as higher efficiency, lower noise, and zero tailpipe emissions11
. The
tradeoffs are the battery size and weight, cost, and concerns about limited range.
Some vehicles are known as hybrids. Hybrid vehicles have a gasoline engine and an
electric motor. For some hybrid vehicles, the motor is only a supplement to the engine.
Other hybrid vehicles can operate in electric (motor) only mode for a certain distance
before the gasoline engine must start in order to charge the batteries. Furthermore, there
are also “plug-in hybrids” that can be charged at home at night. Thus, someone with a
plug-in hybrid and a relatively short commute could operate in electric mode during their
commute and recharge their vehicle at home at night. They would have many of the
benefits of an electric vehicle, but would still have the added range afforded by the
gasoline engine if needed.
Of the three transmission/distribution companies, currently only CL&P expects that EVs
would materially affect its forecast. Most charging would be performed at night, so no
impact on the peak loads would be expected. But electric vehicles are projected to
impact CL&P’s energy forecast.
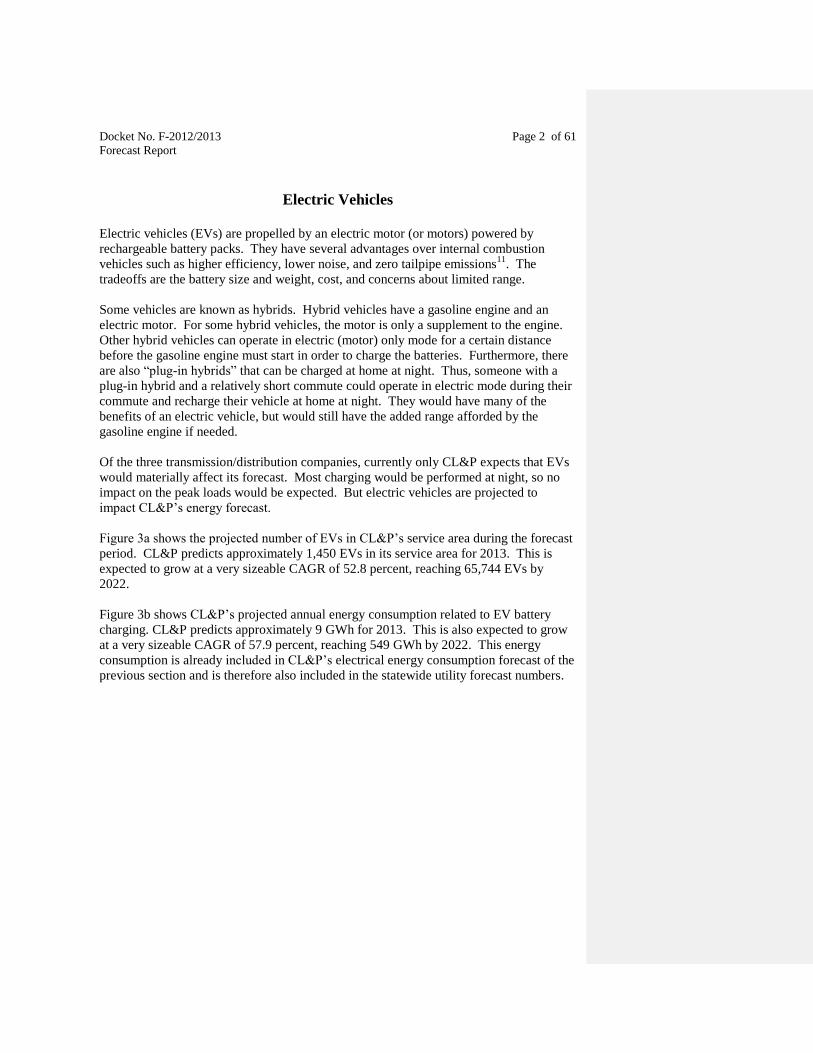
Figure 3a shows the projected number of EVs in CL&P’s service area during the forecast
period. CL&P predicts approximately 1,450 EVs in its service area for 2013. This is
expected to grow at a very sizeable CAGR of 52.8 percent, reaching 65,744 EVs by
2022.
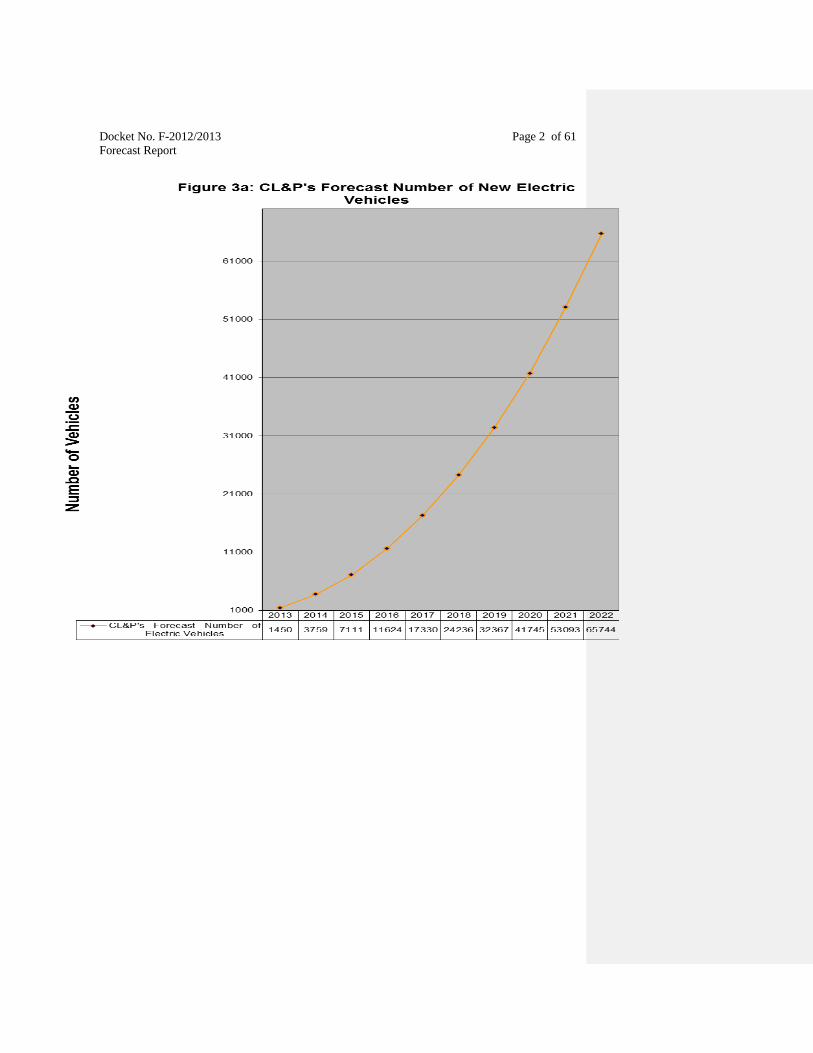
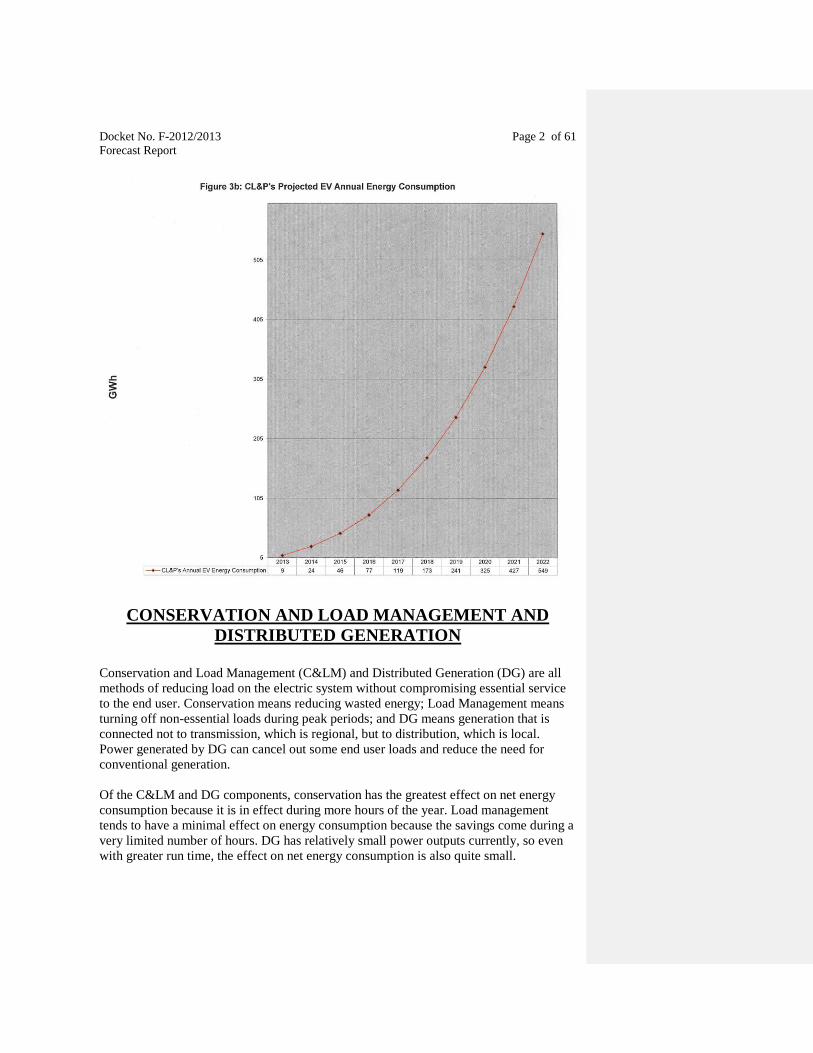
Figure 3b shows CL&P’s projected annual energy consumption related to EV battery
charging. CL&P predicts approximately 9 GWh for 2013. This is also expected to grow
at a very sizeable CAGR of 57.9 percent, reaching 549 GWh by 2022. This energy
consumption is already included in CL&P’s electrical energy consumption forecast of the
previous section and is therefore also included in the statewide utility forecast numbers.
Docket No. F-2012/2013 Page 2 of 61
Forecast Report
Docket No. F-2012/2013 Page 2 of 61
Forecast Report
CONSERVATION AND LOAD MANAGEMENT AND
DISTRIBUTED GENERATION
Conservation and Load Management (C&LM) and Distributed Generation (DG) are all
methods of reducing load on the electric system without compromising essential service
to the end user. Conservation means reducing wasted energy; Load Management means
turning off non-essential loads during peak periods; and DG means generation that is
connected not to transmission, which is regional, but to distribution, which is local.
Power generated by DG can cancel out some end user loads and reduce the need for
conventional generation.
Of the C&LM and DG components, conservation has the greatest effect on net energy
consumption because it is in effect during more hours of the year. Load management
tends to have a minimal effect on energy consumption because the savings come during a
very limited number of hours. DG has relatively small power outputs currently, so even
with greater run time, the effect on net energy consumption is also quite small.
Docket No. F-2012/2013 Page 2 of 61
Forecast Report
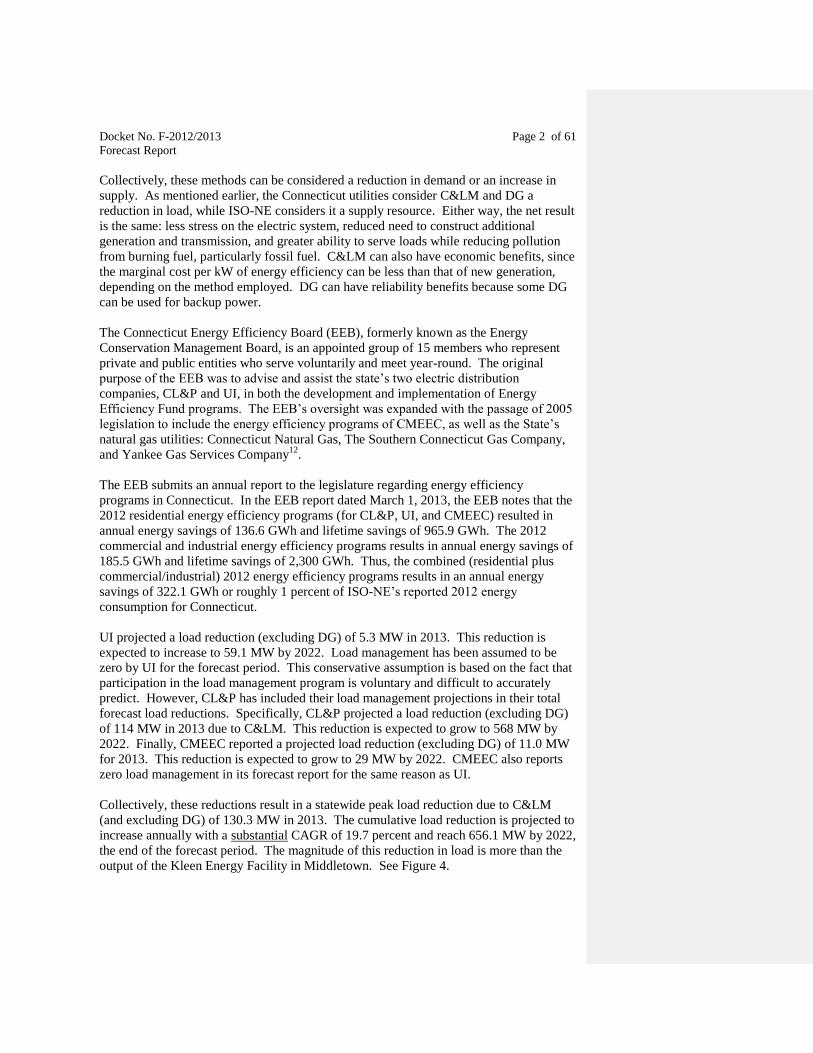
Collectively, these methods can be considered a reduction in demand or an increase in
supply. As mentioned earlier, the Connecticut utilities consider C&LM and DG a
reduction in load, while ISO-NE considers it a supply resource. Either way, the net result
is the same: less stress on the electric system, reduced need to construct additional
generation and transmission, and greater ability to serve loads while reducing pollution
from burning fuel, particularly fossil fuel. C&LM can also have economic benefits, since
the marginal cost per kW of energy efficiency can be less than that of new generation,
depending on the method employed. DG can have reliability benefits because some DG
can be used for backup power.
The Connecticut Energy Efficiency Board (EEB), formerly known as the Energy
Conservation Management Board, is an appointed group of 15 members who represent
private and public entities who serve voluntarily and meet year-round. The original
purpose of the EEB was to advise and assist the state’s two electric distribution
companies, CL&P and UI, in both the development and implementation of Energy
Efficiency Fund programs. The EEB’s oversight was expanded with the passage of 2005
legislation to include the energy efficiency programs of CMEEC, as well as the State’s
natural gas utilities: Connecticut Natural Gas, The Southern Connecticut Gas Company,
and Yankee Gas Services Company12
.
The EEB submits an annual report to the legislature regarding energy efficiency
programs in Connecticut. In the EEB report dated March 1, 2013, the EEB notes that the
2012 residential energy efficiency programs (for CL&P, UI, and CMEEC) resulted in
annual energy savings of 136.6 GWh and lifetime savings of 965.9 GWh. The 2012
commercial and industrial energy efficiency programs results in annual energy savings of
185.5 GWh and lifetime savings of 2,300 GWh. Thus, the combined (residential plus
commercial/industrial) 2012 energy efficiency programs results in an annual energy
savings of 322.1 GWh or roughly 1 percent of ISO-NE’s reported 2012 energy
consumption for Connecticut.
UI projected a load reduction (excluding DG) of 5.3 MW in 2013. This reduction is
expected to increase to 59.1 MW by 2022. Load management has been assumed to be
zero by UI for the forecast period. This conservative assumption is based on the fact that
participation in the load management program is voluntary and difficult to accurately
predict. However, CL&P has included their load management projections in their total
forecast load reductions. Specifically, CL&P projected a load reduction (excluding DG)
of 114 MW in 2013 due to C&LM. This reduction is expected to grow to 568 MW by
2022. Finally, CMEEC reported a projected load reduction (excluding DG) of 11.0 MW
for 2013. This reduction is expected to grow to 29 MW by 2022. CMEEC also reports
zero load management in its forecast report for the same reason as UI.
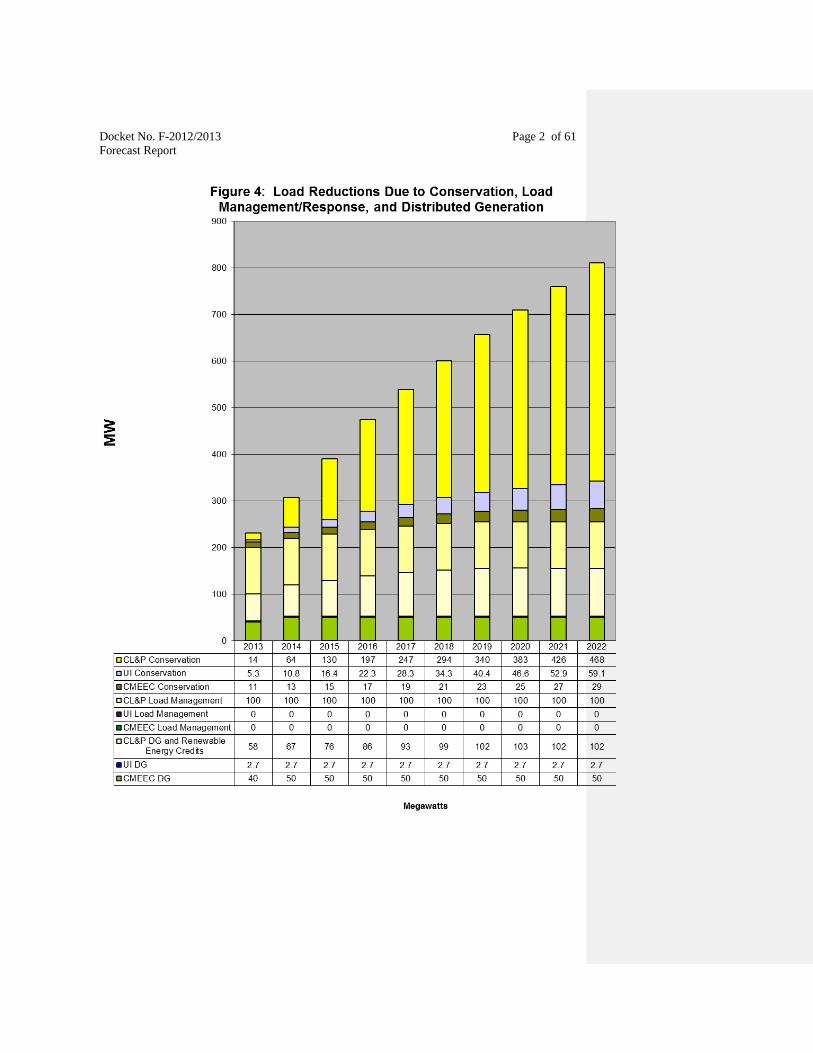
Collectively, these reductions result in a statewide peak load reduction due to C&LM
(and excluding DG) of 130.3 MW in 2013. The cumulative load reduction is projected to
increase annually with a substantial CAGR of 19.7 percent and reach 656.1 MW by 2022,
the end of the forecast period. The magnitude of this reduction in load is more than the
output of the Kleen Energy Facility in Middletown. See Figure 4.
Docket No. F-2012/2013 Page 2 of 61
Forecast Report
Docket No. F-2012/2013 Page 2 of 61
Forecast Report
The Council believes that energy efficiency and related programs are an extremely
important part of Connecticut’s electric energy strategy. Increased efficiency allows the
State’s electric needs to be met, in part, without incurring the financial costs and the
incremental pollution that would be caused by dispatching generation to serve the
additional load. Reductions in peak load due to increased efficiency can also impact the
schedule of necessary changes to existing utility infrastructure, such as transmission lines
and substation equipment (transformers, distribution feeders, etc.) and hence tend to hold
down utility costs. Electric energy efficiency also reduces federal congestion charges and
the costs of new generation. Currently, Connecticut ranks sixth fifth for energy
efficiency in the national rankings put out by the American Council for an Energy-
Efficient Economy for 2012. (See annual scorecard at http://aceee.org/sector/state-
policy/scorecard.)
Regarding total per capita energy usage, in 2011, according to the United States
Department of Energy – Energy Information Administration, Connecticut had one of the
lowest amounts of total energy consumed per capita in the U.S. Specifically, Connecticut
ranked 49th
out of 51 (i.e. 50 states plus District of Columbia) in per capita energy
consumption. Wyoming had the highest energy consumption of 975 million British
Thermal Units13
(BTUs) per person. The lowest was Rhode Island at 51st place at 175
million BTUs. Connecticut was near the lowest at 207 million BTUs.
LREC/ZREC Program
As part of Public Act 11-80, the State of Connecticut directed CL&P and UI to launch a
program to promote, fund, and expand renewable DG installed behind the utility
customer’s meter. This program, sometimes referred to as the Low Emissions Renewable
Energy Credit/Zero Emissions Renewable Energy Credit (LREC/ZREC) Program,
creates a market-driven bidding process for projects to compete to obtain a 15-year
revenue stream from the sale of renewable energy credits (RECs) to the electric utilities14
.
The utilities would solicit these projects for up to a six year period via requests for
proposals (RFP).
LREC projects are low emissions projects 2,000 kW (or 2 MW) or less in size. One
example of a low emissions project would be a fuel cell that operates on natural gas. See
the Fuel Cell section of this report.
ZREC projects are zero emissions projects. Examples would be solar and wind power.
ZREC projects are broken down into two sizes. Medium size ZREC projects range in
size from 100 kW to 250 kW. Large ZREC programs range in size from 250 kW to
1,000 kW (or 1 MW).
CL&P and UI jointly issued their first request for proposals (RFP) in May 2012.
A total of 150 bids for medium-sized ZRECs were received in 2012. 60 projects were
selected. A total of 162 bids for large-sized ZRECs were received in 2012. 27 projects
were selected.
Comment [BLM1]: Rhode Island is ranked 6th.
Docket No. F-2012/2013 Page 2 of 61
Forecast Report
CL&P’s forecast includes LREC and ZREC projects in both its energy and peak load
forecasts. Since LREC/ZREC projects are a form of DG, the Council has included them
along with other DG in Figure 4 on page 22. UI’s approach is slightly more conservative.
UI included the winning LREC/ZREC bidders for the energy forecast; but for the load
forecast, UI only included LREC/ZREC DG projects that have filed interconnection
applications with UI. Thus, the projects believed to be the most likely to go forward are
included as reductions in UI’s peak load forecast.
Distributed Generation Forecast
CL&P forecasts a total of 58 MW of DG for 2013, including LREC and ZREC projects.
This is expected to grow at a CAGR of 6.47 percent and reach 102 MW by 2022.
CL&P’s forecasts 58 MW of DG (includes LREC and ZREC projects) for 2013. This is
expected to grow at a CAGR of 6.47 percent and reach 102 MW by 2022. UI forecasts
2.7 MW of conventional DG for the entire forecast period. LREC and ZREC projects in
UI’s territory appear to be separate and included in the forecast itself. CMEEC forecasts
40 MW for 2013 and 50 MW for the remainder for the forecast period. This 10 MW
increment is associated with 10 MW of approved backup generation for Backus Hospital
in the City of Norwich. See section titled “New Generation.” Taking into account the
three utilities’ DG forecasts, this results in a statewide total of 100.7 MW for 2013 which
is expected to grow at an CAGR of 4.89 percent and reach 154.7 MW by 2022.
ELECTRIC SUPPLY
While peak loads occur during the summer, the electric system is further challenged by
the fact that generation capability is at its lowest during the summer. This is largely due
to lower thermodynamic efficiencies of many plants when the outside temperatures are
higher. Accordingly, generators report two different power outputs to ISO-NE. They are
referred to as Summer and Winter Seasonal Claimed Capabilities, respectively. (See
Appendix A.) For instance, Connecticut’s September 2013 ISO-NE dispatched
generation output is 7,908 MW in the summer and 8,355 MW during the winter15
.
Even taking into account the most conservative forecast (the ISO-NE 90/10 forecast), and
the worst-case generating output (the summer output), the Council anticipates that
electric generation supply during the forecast period will be adequate to meet demand.
Neglecting retirements, going forward, Connecticut has a surplus of generation during the
forecast period. Plant retirements would decrease generation; however, the New England
East West Solution (NEEWS) transmission projects would offset generation losses by
increasing import capacity. See Table 4, and also the section on Transmission.
New Generation
The largest addition to Connecticut’s generation resources in recent years is the Kleen
Energy facility in Middletown. Kleen is a 620 MW natural gas-fired (with oil pipeline
backup) combined-cycle generating facility. The plant was approved by the Council in
Docket No. 225. Kleen was later selected by the former Department of Public Utility
Docket No. F-2012/2013 Page 2 of 61
Forecast Report
Control (DPUC) as a project that would significantly reduce federally mandated
congestion charges (FMCCs). It went into service on July 12, 2011. Accordingly, the
Kleen Energy plant is reflected in the load/resource balance table (Table 4). Other recent
additions to Connecticut’s electric generation fleet include Waterbury Generation, a 96
MW natural gas-fueled combustion turbine facility. Along with Kleen Energy and
Waterside Power, the Waterbury Generation project was one of the generating projects
selected to reduce FMCCs. This project went into commercial operation in May 2009.
In June/July of 2010, Devon Units #15 through #18 in Milford went into commercial
operation. These units are natural gas turbines. Each unit has a summer rating of
approximately 46.9 MW per ISO-NE. Combined, they provide nearly 188 MW of
available generation for Connecticut.
In June 2011, Middletown units #12 through #15 went into commercial operation. These
units are also natural gas turbines with a summer rating of 46.9 MW each per ISO-NE.
Combined, they also provide nearly 188 MW of generation for Connecticut.
In May 2012, the New Haven Harbor Units #2 through #4 in New Haven went into
commercial operation. These units are also natural gas turbines. Each unit has a summer
rating of 43.2 MW per ISO-NE. Combined, they provide nearly 130 MW of available
generation for Connecticut.
Public Act 07-242
Public Act 07-242, An Act Concerning Electricity and Energy Efficiency, included an
expedited Council review and approval process to facilitate the siting of certain new
power plants. (This section was updated by Public Act 11-80.) The Council is mandated
to approve by declaratory ruling:
the construction of a facility solely for the purpose of generating electricity, other
than an electric generating facility that uses nuclear materials or coal as a fuel, at a
site where an electric generating facility operated prior to July 1, 2004;
the construction or location of any fuel cell—unless the Council finds a
substantial adverse environmental effect—or of any customer-side distributed
resources project or facility or grid-side distributed resources project or facility
with a capacity of not more than 65 megawatts, so long as such the project meets
the air and water quality standards of the Department of Energy and
Environmental Protection;
the siting of temporary generation solicited by the Public Utilities Regulatory
Authority pursuant to section 16-19ss.
Many projects, instead of being submitted to the Council as applications for Certificates
of Environmental Compatibility and Public Need, were submitted as petitions for
declaratory rulings under this provision. Several Project 150 proposals (see below) were
in this category.
Docket No. F-2012/2013 Page 2 of 61
Forecast Report
Project 150
Project 150 is a program funded by the Connecticut Clean Energy Finance and
Investment Authority (CCEFIA) formerly known as the Connecticut Clean Energy Fund
(CCEF). The aim of this program is to stimulate Class I renewable energy generation.
Furthermore, Project 150 was created because large renewable energy projects are
difficult to finance without long-term contracts. The legislation requires local
distribution companies to enter into long-term electric purchase agreements (EPAs) for
no less than 150 MW with generators of Class I renewable energy.
In the implementation process, the CCEF16
was charged with issuing requests for
proposals from developers as well as conducing conducting initial screening and
evaluation and selection of projects to recommend to PURA, formerly known as the
Department of Public Utility Control. The projects were then forwarded to CL&P and UI
for contract negotiation. Those projects approved by PURA for long-term EPAs received
financial support from CCEFIA.
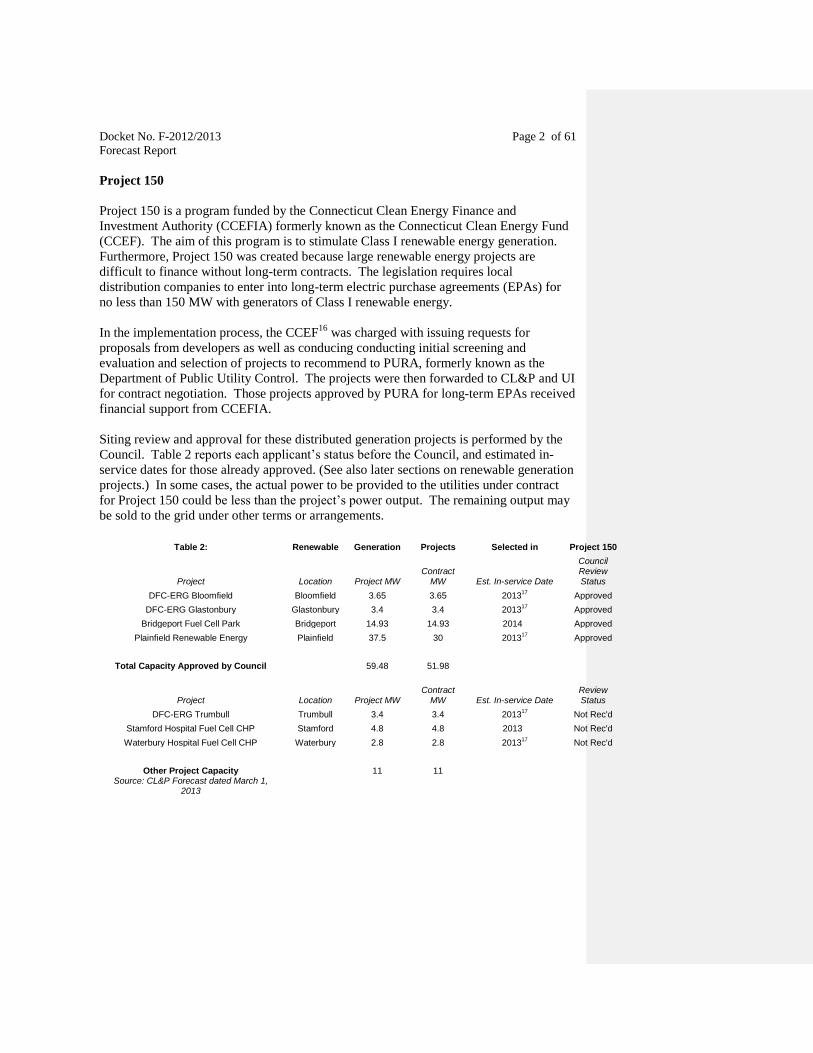
Siting review and approval for these distributed generation projects is performed by the
Council. Table 2 reports each applicant’s status before the Council, and estimated in-
service dates for those already approved. (See also later sections on renewable generation
projects.) In some cases, the actual power to be provided to the utilities under contract
for Project 150 could be less than the project’s power output. The remaining output may
be sold to the grid under other terms or arrangements.
Table 2: Renewable Generation Projects Selected in Project 150
Council
Project Location Project MW Contract
MW Est. In-service Date Review Status
DFC-ERG Bloomfield Bloomfield 3.65 3.65 201317
Approved
DFC-ERG Glastonbury Glastonbury 3.4 3.4 201317
Approved
Bridgeport Fuel Cell Park Bridgeport 14.93 14.93 2014 Approved
Plainfield Renewable Energy Plainfield 37.5 30 201317
Approved
Total Capacity Approved by Council
59.48 51.98
Project Location Project MW
Contract MW Est. In-service Date
Review Status
DFC-ERG Trumbull Trumbull 3.4 3.4 201317
Not Rec'd
Stamford Hospital Fuel Cell CHP Stamford 4.8 4.8 2013 Not Rec'd
Waterbury Hospital Fuel Cell CHP Waterbury 2.8 2.8 201317
Not Rec'd
Other Project Capacity
11 11
Source: CL&P Forecast dated March 1, 2013
Docket No. F-2012/2013 Page 2 of 61
Forecast Report
Wind Renewable Projects
On November 17, 2010, BNE Energy Inc. (BNE), submitted a petition to the Council for
a declaratory ruling that no Certificate is required for the construction, maintenance, and
operation of a 3.2 MW Wind Renewable Generating facility at 178 New Haven Road in
Prospect, Connecticut. The proposed project is referred to as “Wind Prospect.” The
Wind Prospect project (Petition No. 980) was denied by the Council on May 12, 201118
.
On December 6, 2010, BNE submitted a petition to the Council for a declaratory ruling
that no Certificate is required for the construction, maintenance, and operation of a 4.8
MW Wind Renewable Generating facility at Flagg Hill Road in Colebrook, Connecticut.
The proposed project is referred to as “Wind Colebrook South.” The Wind Colebrook
South project (Petition No. 983) was approved by the Council on June 2, 201119
.
On December 13, 2010, BNE submitted a petition to the Council for a declaratory ruling
that no Certificate is required for the construction, operation, and maintenance of a 4.8
MW Wind Renewable Generating facility located on Winsted-Norfolk Road (Route 44)
and Rock Hall Road in Colebrook, Connecticut. The project is referred to as “Wind
Colebrook North.” The Wind Colebrook North project (Petition No. 984) was approved
by the Council on June 9, 201120
.
While a total of 9.6 MW of new wind generation has been approved by the Council, the
precise in-service dates of the projects are not yet known. BNE has partially begun
construction on the Colebrook South site and has been in litigation for more than two
years. Accordingly, to be conservative, the wind projects have not yet been included in
the current Council forecast.
PA 11-245 placed a moratorium on future wind development projects pending the
adoption of regulations regarding the siting of wind projects. Specifically, the Council
cannot act on any application or petition for the siting of a new wind turbine until after
the adoption of regulations. These regulations would include but not be limited to
setbacks, flicker, requirements to decommission the facility at the end of its useful life,
ice throw, blade shear, noise, impact on natural resources, and a requirement for a public
hearing. The regulations were to be adopted on or before July 1, 2012. The regulations
were submitted to the Legislative Regulations Review Committee (LRRC) and have been
re-submitted several times with modifications per LRRC recommendations. This is an
ongoing, iterative process. The latest version of the draft wind regulations was submitted
to the LRRC on September 3, 2013 for review and approval. The LRRC, despite the
recommendation in the Legislative Commissioner’s Office Report to approve the draft
wind regulations in whole, rejected the draft wind regulations without prejudice for the
third time at a LRRC meeting held on September 24, 2013.
Solar Renewable Projects
In PA 11-80, section 127, an electric distribution company or owner or developer of
generation projects that emit no pollutants may submit a proposal to DEEP to build, own
Docket No. F-2012/2013 Page 2 of 61
Forecast Report
or operate one or more generation facilities up to an aggregate of 30 MW using Class I
renewable energy sources. Each facility shall be greater than one MW and less than five
MW. Solar projects are a natural fit for this description given the size, zero emissions
requirement, and Class I renewable status.
Accordingly, on October 31, 2012, Somers Solar Center, LLC (SSC) submitted a petition
to the Council for a declaratory ruling that no Certificate is required for the construction,
maintenance, and operation of a 5.0 MW alternating current (AC) solar photovoltaic
generating facility at 458 and 488 South Road in Somers, Connecticut. This project
(Petition No. 1042) was approved by the Council on March 21, 201321
. The project is
expected to be in service by 2014. This is reflected in Table 4.
On December 17, 2012, GRE 314 East Lyme, LLC (GRE) submitted a petition to the
Council for a declaratory ruling that no Certificate is required for the construction,
maintenance, and operation of a 5.0 MW AC solar photovoltaic generating facility at
Grassy Hill Road and Walnut Hill Road in East Lyme, Connecticut. This project
(Petition No. 1056) was approved by the Council on May 16, 201322
. The project is
expected to be in service in 2014. This is reflected in Table 4.
Generation for Backup Power/Microgrids
Per Section 7 of PA 12-148, a “microgrid” means “a group of interconnected loads and
distributed energy resources within clearly defined electrical boundaries that acts as a
single controllable entity with respect to the grid and that connects and disconnects from
such grid to enable it to operate in both grid-connected or island mode.”
Pursuant to the same section, DEEP was charged with establishing a microgrid grant and
loan program to support local distributed generation for critical facilities. DEEP issued
an RFP and as a result, nine projects in the following municipalities were selected for
microgrids: Windham, Bridgeport, Fairfield, Woodbridge, Groton, Hartford, Middletown,
and Mansfield (Storrs).
While Norwich Public Utilities (NPU) in Norwich was not selected for an award for a
microgrid, NPU went forward with its own proposal. Specifically, on July 28, 2013, the
Council received a petition from CMEEC for a declaratory ruling that no Certificate of
Environmental Compatibility and Public Need is required for the proposed installation of
four 2.49 MW generating units at 4 Matlack Road, Norwich. As part of the microgrid
project, in the event of a long term blackout, the generators would provide back-up power
to Backus Hospital as a priority recipient and to other “critical facilities” defined under
Section 7 of PA 12-148 as “a hospital, police station, fire station, water treatment plant,
sewage treatment plant or commercial area of a municipality.” The proposed generators
could also be utilized to minimize peak demand on the regional power grid. This
generation project was approved by the Council on August 9, 2013. The projected is
expected to be in service in 2014. The approximately 10 MW associated with this project
is already included in Figure 4 beginning in 2014.
Docket No. F-2012/2013 Page 2 of 61
Forecast Report
Existing Generation
Nuclear Powered Generation
Nuclear plants use nuclear fission (a reaction in which uranium atoms split apart) to
produce heat, which in turn generates steam, and the steam pressure operates the turbines
that spin the generators. Since no step in the process involves combustion (burning),
nuclear plants produce electricity with zero air emissions. Pollutants emitted by fossil-
fueled plants are avoided, such as sulfur dioxide (SOx), nitrogen oxides (NOx), mercury,
and carbon monoxide. (SOx and NOx contribute to acid rain and smog.) Nuclear plants
also do not emit carbon dioxide (CO2), which is a significant advantage in the effort to
curb greenhouse gas emissions. However, issues remain with regard to security, the
short and long-term storage of nuclear waste, and the cost of new plants.
Connecticut currently has two operational nuclear electric generating units (Millstone
Unit 2 and Unit 3) contributing a total of 2,097 MW of summer capacity, approximately
26.5 percent of the State’s peak generating capacity. The Millstone facility is the largest
generating facility in Connecticut by power output.
The former Millstone 1 reactor has been decommissioned in place. Dominion Nuclear
Connecticut Inc. (Dominion), owner of the Millstone units, has no plans at this time to
construct another nuclear power generating unit at the site.
While the number of active nuclear units in Connecticut remains unchanged at two,
nuclear power output has gradually increased over time due to modifications that improve
the output of the units. Ten years ago, the Council reported in its 2003 Forecast Report
that Connecticut had approximately 1,928 MW of nuclear electric generating capacity
from the two units. Today, we have 2,097 MW or a total of 8.06 percent increase over
the past ten years.
Dominion submitted license renewal applications to the United States Nuclear Regulatory
Commission (NRC) on January 22, 2004. On November 28, 2005, the NRC announced
that it had renewed the operating licenses of Unit 2 and Unit 3 for an additional 20 years.
With this renewal, the operating license for Unit 2 is extended to July 31, 2035 and the
operating license for Unit 3 is extended to November 25, 2045.
Coal Powered Generation
In conventional coal-fired plants, coal is pulverized into a dust and burned to heat steam
for operating the turbines. Now that the AES Thames plant in Montville retired from
service in 2011, Connecticut’s only active coal-fired generation facility is the Bridgeport
Harbor #3 facility located in Bridgeport. It has a summer power output of approximately
383 MW, or approximately 4.8 percent of the State’s current capacity.
Ten years ago, the Council reported approximately 553 MW of coal-fired generating
capacity in Connecticut. This was the sum of AES Thames at 181 MW and Bridgeport
Docket No. F-2012/2013 Page 2 of 61
Forecast Report
Harbor #3 at 372 MW. With the loss of AES Thames and a power increase of about 11
MW at Bridgeport Harbor #3, we have a total net loss of 170 MW or a 30.8 percent
reduction in coal fired generation capacity in Connecticut in the past ten years.
In general, using coal as fuel has the advantages of an abundant domestic supply (US
reserves are projected to last approximately 222 years23
), and an existing rail
infrastructure to transport the coal. Despite the advantages of domestic coal, generators
sometimes find imported coal more economical to use.
However, burning coal to make electricity causes air pollution. Pollutants emitted
include sulfur dioxide, carbon dioxide, and mercury. Coal-fired power plants also have
high CO2 emissions relative to plants using other fuels; thus, they are considered
particularly significant contributors to global warming. In addition, fossil-fueled power
plants, in general, are facing more stringent standards with regard to CO2 emissions.
Given the tightening CO2 emissions standards and higher carbon content than other fossil
fuels, no new coal-fired generation is expected in Connecticut at this time. See the
sections on the “Regional Greenhouse Gas Initiative” and “Carbon Dioxide Pollution
Standard for New Power Plants” for more on the legislative and regulatory requirements
relative to CO2 emissions.
Petroleum Powered Generation
Connecticut currently has 36 oil-fired electric generating facilities contributing 2,484
MW, or 31.4 percent of the State’s current peak generating capacity.
The Council notes that oil-fueled peak power output in Connecticut has declined. Ten
years ago, the Council reported in its 2003 Forecast Report that Connecticut had
approximately 2,611 MW of petroleum-fueled generation capacity. Today, we have
2,484 MW or a total of 4.86 percent decline over the past ten years. This is likely due to
the increasing age of the fleet and the loss of Devon 7 (107 MW) and Devon 8 (107
MW). However, these reductions were largely offset by the installation of Cos Cob units
#13 and #14 (about 38 MW total), CMEEC John Street (6 MW), CMEEC Norden (6
MW), CMEEC Norwich Wastewater Treatment Facility (2 MW), and the largest of the
recent additions: Waterside Power (69 MW).
Additional oil-fired generation is not likely in the near future, due to market volatility and
mounting oil prices: the price of crude oil currently is about $104 per barrel as of October
8, 2013. This is compared to approximately $27 per barrel ten years ago (i.e. October
2003). However, replacement and/or repowering of existing aging units may occur.
Moreover, oil-fired generation presents environmental problems, particularly related to
the sulfur content of the oil, and faces tighter air-emissions standards particularly related
to CO2. Oil-fired power plants are also significantly affected because oil is the second
highest carbon fossil fuel. See the sections on the “Regional Greenhouse Gas Initiative”
and “Carbon Dioxide Pollution Standard for New Power Plants” for more on the
legislative and regulatory requirements relative to CO2 emissions.
Comment [BLM2]: CMEEC John Street made a Non-Price Retirement Request to ISO-NE September
2013. ISO-NE accepted the request October 2013.
The John Street facility should be considered retired as a result of ISO-NE retirement analysis acceptance.
Docket No. F-2012/2013 Page 2 of 61
Forecast Report
Some of the oil-fired generating facilities in Connecticut are dual-fueled, meaning that
they can switch to natural gas if necessary. Currently, four generating units in
Connecticut (Middletown #2 and #3; Montville #5; and New Haven Harbor #1), totaling
approximately 880 MW, have the ability to change from oil to gas. The Council believes
that dual-fuel capability is an important part of diversifying the fuel mix for electric
generation, with the benefit of avoiding overdependence on a particular fuel.
Natural Gas Powered Generation
Connecticut currently has 29 natural gas-fired generating units (not including Lake
Road24
which is electrically more a part of Rhode Island than Connecticut) contributing a
total of 2,657 MW, or 33.6 percent of the State’s generating capacity. This includes
additions such as Waterbury Generation, Kleen Energy, Middletown #12-15, and Devon
#15-18 with summer ratings of 96 MW, 620 MW, 188 MW, and 188 MW, respectively.
The Council also notes that natural gas fueled-generation has been the fastest growing
type of electrical generation in Connecticut. Ten years ago, the Council reported in its
2003 Forecast Report that Connecticut had approximately 879 MW of natural gas-fueled
electric generating capacity (also not including Lake Road). Today, we have 2,657 MW
or a total of 202 percent increase over the past ten years.
Natural gas-fired electric generating facilities are preferred over those burning coal or oil
primarily because of higher efficiency, lower initial cost per MW, and lower air pollution.
Natural gas is also the lowest carbon fossil-fuel, which is a significant environmental
advantage given tightening CO2 standards. See the sections on the “Regional Greenhouse
Gas Initiative” and “Carbon Dioxide Pollution Standard for New Power Plants” for more
information on the legislative and regulatory requirements relative to CO2 emissions.
Some natural gas generating plants, such as Bridgeport Energy, Milford Power, Lake
Road, and the new Kleen Energy plant are combined-cycle. Added to the primary cycle,
in which gas turbines turn the generators to make electricity, is a second cycle, in which
waste heat from the first process is used to generate steam: steam pressure then drives
another turbine that generates even more electricity. Thus, a combined-cycle plant is
highly efficient, with an efficiency on the order of 60 percent. However, the tradeoffs are
higher initial costs and increased space requirements for the extra generating unit.
Natural gas generating facilities also have the advantage of being linked directly to their
domestic or North American fuel source via a pipeline. Furthermore, abundant domestic
natural gas supplies and lower fuel costs also make natural gas attractive. Overall,
natural gas-fired generation is expected to remain a popular choice for new generation as
well as repowering older generation, but concerns do exist about possible overreliance on
natural gas as a fuel as fuel diversity decreases.
Docket No. F-2012/2013 Page 2 of 61
Forecast Report
Hydroelectric Power Generation
Connecticut’s hydroelectric generation consists of 28 facilities contributing
approximately 118 MW, or 1.5 percent of the State’s current peak generating capacity.
Hydroelectric generating facilities use a renewable energy source, emit zero air
pollutants, and have a long operating life. Also, some hydro units have black start
capability. The main obstacle to the development of additional hydroelectric generation
in Connecticut is a lack of suitable sites.
The Council also notes that hydroelectric power output in Connecticut has been
declining. The Council reported in its 2003 Forecast Report that Connecticut had
approximately 150 MW of hydroelectric energy capacity. Today, we have 118 MW or a
total of a 21.3 percent decline over the past ten years. This is likely the result of naturally
changing water flows.
FirstLight Power Enterprises, Inc. (FirstLight), Connecticut’s largest provider of
hydroelectric power, owns the following hydroelectric facilities: Bantam, Bulls Bridge,
Falls Village, Robertsville, Scotland, Stevenson, Taftville, Tunnel 1-2, Rocky River, and
Tunnel 10. Other hydroelectric facilities (over 5 MW) not owned by FirstLight include
Derby Dam and Rainbow Dam located in Shelton and Windsor, respectively.
Solid Waste Power Generation
Connecticut currently has approximately 165 MW of solid waste-fueled generation, or
approximately 2.1 percent of the State’s peak generation capacity. The Exeter generating
plant in Sterling burns used tires, and has a summer rating of approximately 9.5 MW.
The remaining approximately 156 MW of solid waste-fueled generation includes:
Bridgeport Wheelabrator; Bristol Resource Recovery Facility (RRF); Lisbon RRF;
Preston RRF; Wallingford (Covanta) RRF; and the Connecticut Resource Recovery
Agency South Meadows facility. See Table 3.
Table 3
Solid Waste-fueled Generation MW
Bridgeport Wheelabrator 59.27
Bristol Resource Recovery Facility 12.22
Lisbon Resource Recovery Facility 13.46
Preston Resource Recovery Facility 16.10
Wallingford Resource Recovery (Covanta) Facility 6.88
Connecticut Resource Recovery Agency - South Meadows Unit #5 26.42
Connecticut Resource Recovery Agency - South Meadows Unit #6 21.21
Exeter Tire-burning Facility 9.50
Total 165.06
The Council notes that waste-to-energy peak power output in Connecticut has declined.
Ten years ago, the Council reported in its 2003 Forecast Report that Connecticut had
approximately 186 MW of solid waste-fueled generation capacity. Today, we have 165
Docket No. F-2012/2013 Page 2 of 61
Forecast Report
MW or a total of 11.4 percent decline over the past ten years. This is likely due to the
increasing age of the fleet.
Solid waste has the advantage of being a renewable, locally supplied fuel and it
contributes to Connecticut’s fuel diversity. It is not affected by market price volatility,
nor supply disruptions—significant advantages over fossil fuels. In addition, the
combustion of solid waste reduces the amount of space needed for landfills. Solid waste-
fueled facilities are considered Class II renewable resources.
Landfill Gas Power Generation
Connecticut’s landfill gas generation consists of three facilities contributing
approximately 3.92 MW, or a negligible 0.05 percent of the State’s current peak
generating capacity. These facilities are located in Hartford, East Windsor, and New
Milford and have power outputs of 1.56 MW, 0.98 MW, and 1.38 MW, respectively.
Landfill gas (essentially methane), like solid waste, has the advantage of being a locally
supplied fuel. In addition, landfill gas-fueled facilities are considered Class I renewable
resources.
Ten years ago, in the 2003 Forecast Report, the Council reported 5.58 MW of landfill gas
generating capacity. As of today, there is a net reduction of 1.66 MW or a total reduction
of 42.3 percent since 2003. The amount of methane gas available at a given landfill site
at a given time is variable and depends on many factors. Landfill gas power outputs can
vary as conditions and decomposition rates change.
Miscellaneous Distributed Generation
Fuel Cells
The number of petitions for distribution-connected fuel cells that are being filed with the
Council has increased significantly. Specifically, the Council has approved four projects
totaling 1,600 kW or 1.6 MW in 2012. From the beginning of calendar year 2013
through the end of September 2013, the Council has received and approved 12 fuel cell
projects totaling 5,850 kW or 5.85 MW. Thus, the number of petitions being filed has
increased from 0.33 petitions per month (or one every three months) for 2012 to 1.33
petitions per month (or 12 per nine months) for 2013. This is a substantial increase of
300 percent for 2013 versus 2012. This is largely due to the success of the LREC/ZREC
Program. See previous section titled, “LREC/ZREC Program.”
Fuel cells have not been included in Table 4 because they are not ISO-NE dispatched.
Many of these fuel cells provide base load power to the customer and serve to reduce
load on the system. Some do sell excess power to the grid, but it is at the distribution
level and thus not under ISO-NE’s control.
Fuel cells have very low emissions compared with other generation technologies. Some
fuel cells can offer waste heat for use for domestic heating, hot water, industrial
processes, etc. This can further increase overall efficiency. Fuel cells are also considered
Formatted: Underline
Formatted: Underline
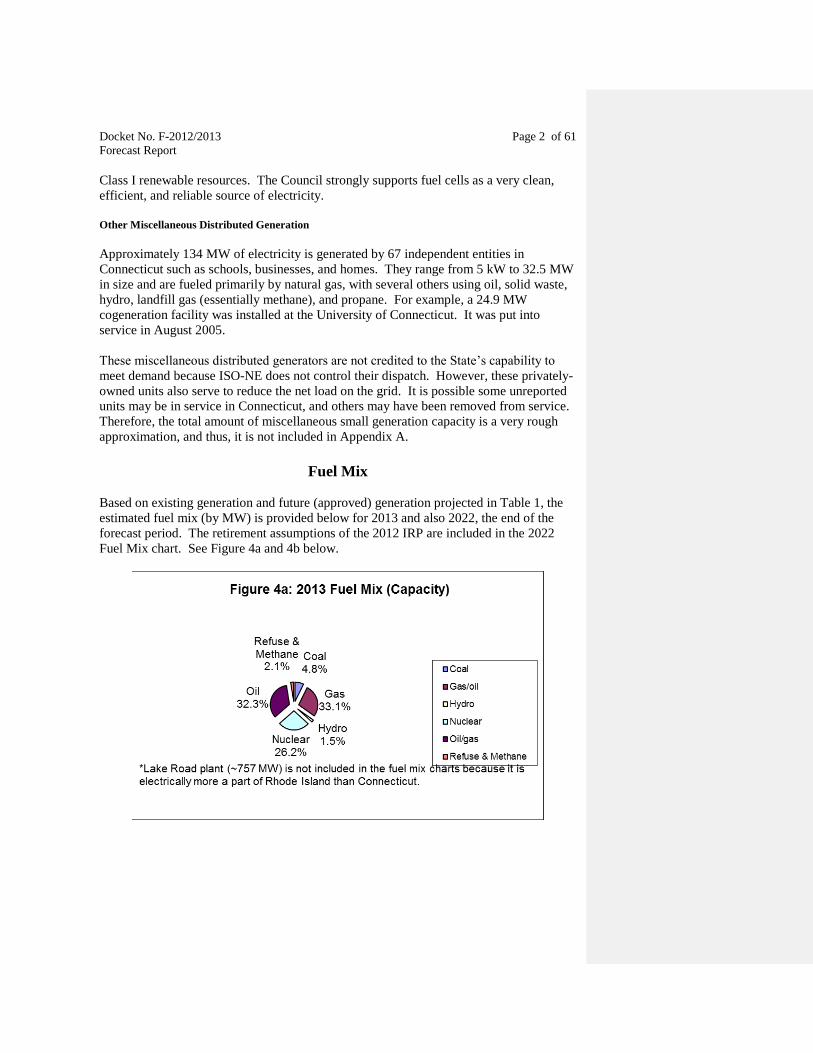
Docket No. F-2012/2013 Page 2 of 61
Forecast Report
Class I renewable resources. The Council strongly supports fuel cells as a very clean,
efficient, and reliable source of electricity.
Other Miscellaneous Distributed Generation
Approximately 134 MW of electricity is generated by 67 independent entities in
Connecticut such as schools, businesses, and homes. They range from 5 kW to 32.5 MW
in size and are fueled primarily by natural gas, with several others using oil, solid waste,
hydro, landfill gas (essentially methane), and propane. For example, a 24.9 MW
cogeneration facility was installed at the University of Connecticut. It was put into
service in August 2005.
These miscellaneous distributed generators are not credited to the State’s capability to
meet demand because ISO-NE does not control their dispatch. However, these privately-
owned units also serve to reduce the net load on the grid. It is possible some unreported
units may be in service in Connecticut, and others may have been removed from service.
Therefore, the total amount of miscellaneous small generation capacity is a very rough
approximation, and thus, it is not included in Appendix A.
Fuel Mix
Based on existing generation and future (approved) generation projected in Table 1, the
estimated fuel mix (by MW) is provided below for 2013 and also 2022, the end of the
forecast period. The retirement assumptions of the 2012 IRP are included in the 2022
Fuel Mix chart. See Figure 4a and 4b below.
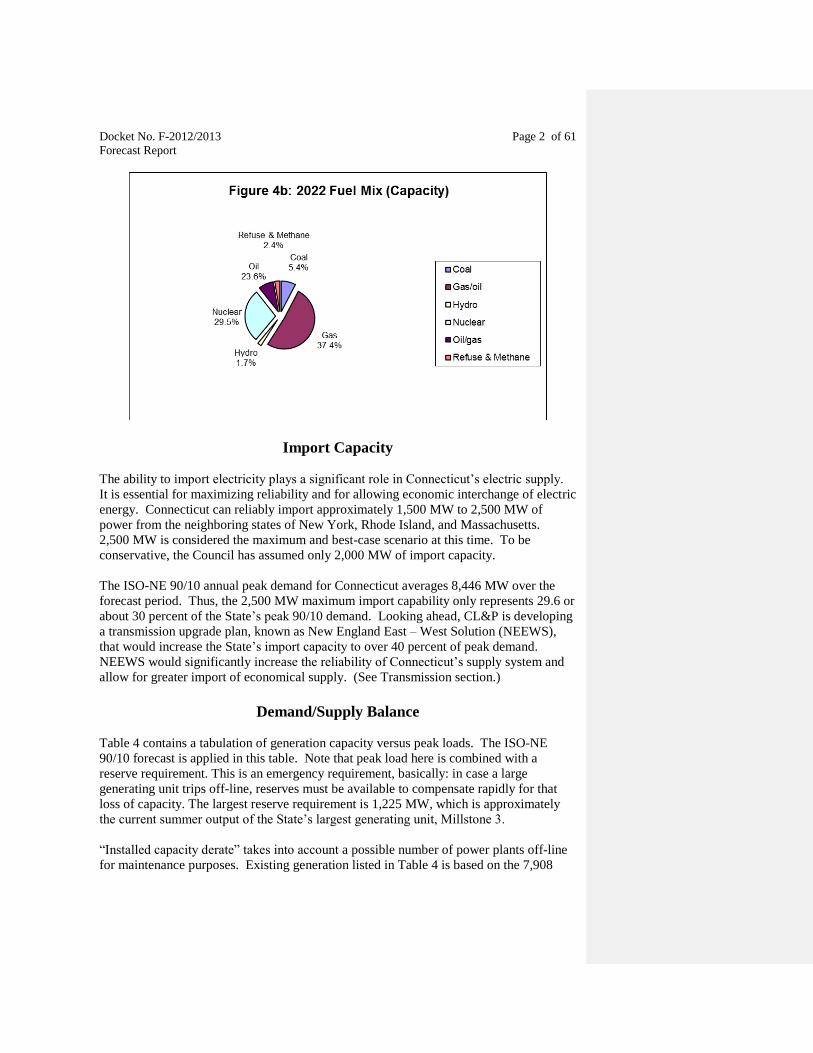
Docket No. F-2012/2013 Page 2 of 61
Forecast Report
Import Capacity
The ability to import electricity plays a significant role in Connecticut’s electric supply.
It is essential for maximizing reliability and for allowing economic interchange of electric
energy. Connecticut can reliably import approximately 1,500 MW to 2,500 MW of
power from the neighboring states of New York, Rhode Island, and Massachusetts.
2,500 MW is considered the maximum and best-case scenario at this time. To be
conservative, the Council has assumed only 2,000 MW of import capacity.
The ISO-NE 90/10 annual peak demand for Connecticut averages 8,446 MW over the
forecast period. Thus, the 2,500 MW maximum import capability only represents 29.6 or
about 30 percent of the State’s peak 90/10 demand. Looking ahead, CL&P is developing
a transmission upgrade plan, known as New England East – West Solution (NEEWS),
that would increase the State’s import capacity to over 40 percent of peak demand.
NEEWS would significantly increase the reliability of Connecticut’s supply system and
allow for greater import of economical supply. (See Transmission section.)
Demand/Supply Balance
Table 4 contains a tabulation of generation capacity versus peak loads. The ISO-NE
90/10 forecast is applied in this table. Note that peak load here is combined with a
reserve requirement. This is an emergency requirement, basically: in case a large
generating unit trips off-line, reserves must be available to compensate rapidly for that
loss of capacity. The largest reserve requirement is 1,225 MW, which is approximately
the current summer output of the State’s largest generating unit, Millstone 3.
“Installed capacity derate” takes into account a possible number of power plants off-line
for maintenance purposes. Existing generation listed in Table 4 is based on the 7,908
Docket No. F-2012/2013 Page 2 of 61
Forecast Report
MW of total existing generation in Connecticut listed in Appendix A. Appendix A data
is from ISO-NE’s September 2013 Seasonal Claimed Capability report. Approved
generation projects (not yet constructed and/or complete) are also included in Table 4.
As indicated in Table 4, in-service dates for these facilities are estimates and may be
subject to change.
The retirement of older generating units is difficult to predict because it is the result of
many factors such as market conditions, environmental regulations and the generating
companies’ business plans. Specifically, the 2012 IRP assumes that Bridgeport Harbor
#2 (130 MW) and AES Thames (183 MW) would retire in 2013. AES Thames is retired
and has been deleted from Appendix A (Existing Generation) data. The status of
Bridgeport Harbor #2 is unclear at this time. However, ISO-NE reports the Seasonal
Claimed Capability of Bridgeport Harbor #2 to be zero; this is reported in Appendix A
accordingly. Thus, AES Thames and Bridgeport Harbor #2 are not deducted from Table
4 in the 2012 IRP retirement section to avoid “double counting.”
The 2012 IRP also assumes the retirement of Middletown #4 (400 MW) and Montville #6
(405 MW) in 2015. Accordingly, Table 4 reflects this assumption.
Approved generation associated with Project 150 (from Table 2), as well as two approved
solar projects have been included in Table 4 as new generation resources. Other new
generation resources such as Kleen Energy, Devon #15 through #18, Middletown #12
through #15, New Haven Harbor #2, #3 and #43, and Waterbury Generation are not listed
on Table 4 because they are already reflected in the existing generation listed in
Appendix A.
Import capacity into Connecticut is expected to increase as a result of the Greater
Springfield NEEWS project and the Interstate Reliability NEEWS project. These
projects would increase import by 100 MW in 2014 and 800 MW in 2016, respectively.
These estimated import increases, as reported in the 2012 IRP, have been reflected in
Table 4. Lake Road is not included in the existing generation total of Table 4 because
ISO-NE does not currently consider it a Connecticut resource. However, the
transmission system upgrades associated with the Interstate Reliability Project will allow
Lake Road to count as a Connecticut resource. Per the 2012 IRP, Lake Road is included
in Table 4, beginning in approximately 2016.
Comment [BLM3]: PSEG made a Non-Price
Retirement Request to ISO-NE September 20, 2013. ISO-NE accepted the retirement request October
2013. Since the Seasonal Claimed Capability of
Bridgeport Harbor #2 is zero, to avoid double accounting, Bridgeport Harbor #2 is not deducted
from Table 4 in the 2012 IRP retirement section.
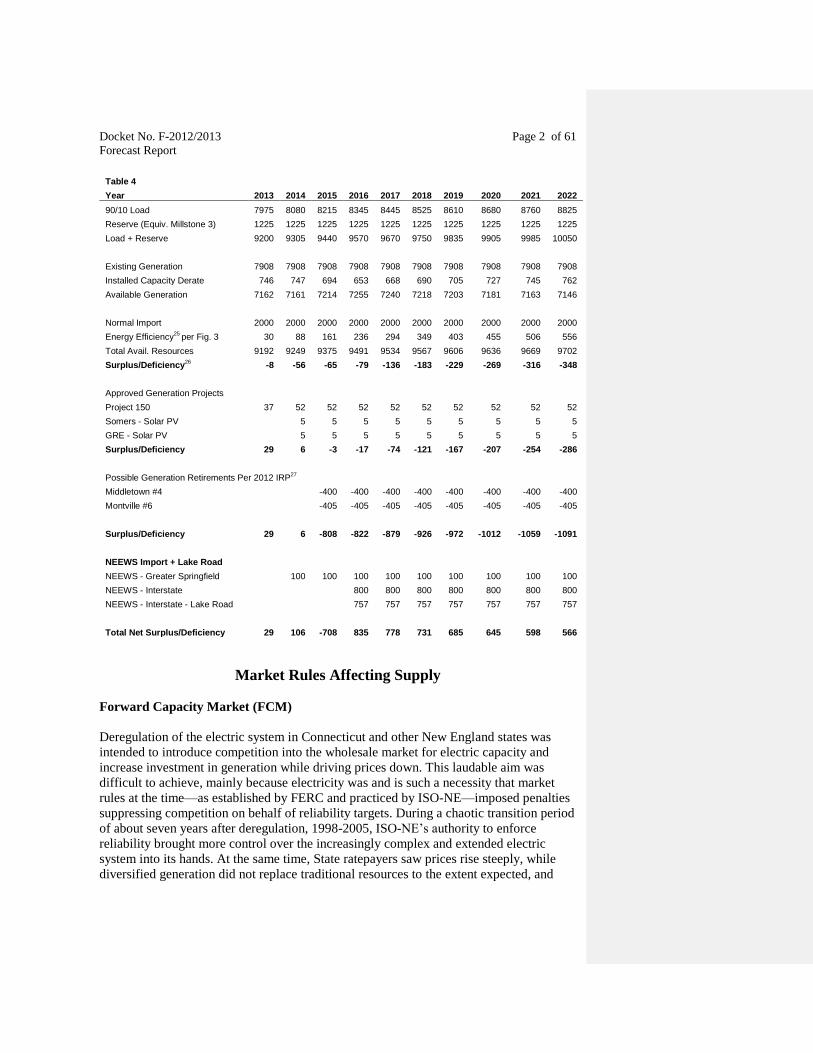
Docket No. F-2012/2013 Page 2 of 61
Forecast Report
Table 4 Year 2013 2014 2015 2016 2017 2018 2019 2020 2021 2022
90/10 Load 7975 8080 8215 8345 8445 8525 8610 8680 8760 8825
Reserve (Equiv. Millstone 3) 1225 1225 1225 1225 1225 1225 1225 1225 1225 1225
Load + Reserve 9200 9305 9440 9570 9670 9750 9835 9905 9985 10050
Existing Generation 7908 7908 7908 7908 7908 7908 7908 7908 7908 7908
Installed Capacity Derate 746 747 694 653 668 690 705 727 745 762
Available Generation 7162 7161 7214 7255 7240 7218 7203 7181 7163 7146
Normal Import 2000 2000 2000 2000 2000 2000 2000 2000 2000 2000
Energy Efficiency25
per Fig. 3 30 88 161 236 294 349 403 455 506 556
Total Avail. Resources 9192 9249 9375 9491 9534 9567 9606 9636 9669 9702
Surplus/Deficiency26
-8 -56 -65 -79 -136 -183 -229 -269 -316 -348
Approved Generation Projects
Project 150 37 52 52 52 52 52 52 52 52 52
Somers - Solar PV
5 5 5 5 5 5 5 5 5
GRE - Solar PV
5 5 5 5 5 5 5 5 5
Surplus/Deficiency 29 6 -3 -17 -74 -121 -167 -207 -254 -286
Possible Generation Retirements Per 2012 IRP
27
Middletown #4
-400 -400 -400 -400 -400 -400 -400 -400
Montville #6
-405 -405 -405 -405 -405 -405 -405 -405
Surplus/Deficiency 29 6 -808 -822 -879 -926 -972 -1012 -1059 -1091
NEEWS Import + Lake Road
NEEWS - Greater Springfield
100 100 100 100 100 100 100 100 100
NEEWS - Interstate
800 800 800 800 800 800 800
NEEWS - Interstate - Lake Road
757 757 757 757 757 757 757
Total Net Surplus/Deficiency 29 106 -708 835 778 731 685 645 598 566
Market Rules Affecting Supply
Forward Capacity Market (FCM)
Deregulation of the electric system in Connecticut and other New England states was
intended to introduce competition into the wholesale market for electric capacity and
increase investment in generation while driving prices down. This laudable aim was
difficult to achieve, mainly because electricity was and is such a necessity that market
rules at the time—as established by FERC and practiced by ISO-NE—imposed penalties
suppressing competition on behalf of reliability targets. During a chaotic transition period
of about seven years after deregulation, 1998-2005, ISO-NE’s authority to enforce
reliability brought more control over the increasingly complex and extended electric
system into its hands. At the same time, State ratepayers saw prices rise steeply, while
diversified generation did not replace traditional resources to the extent expected, and
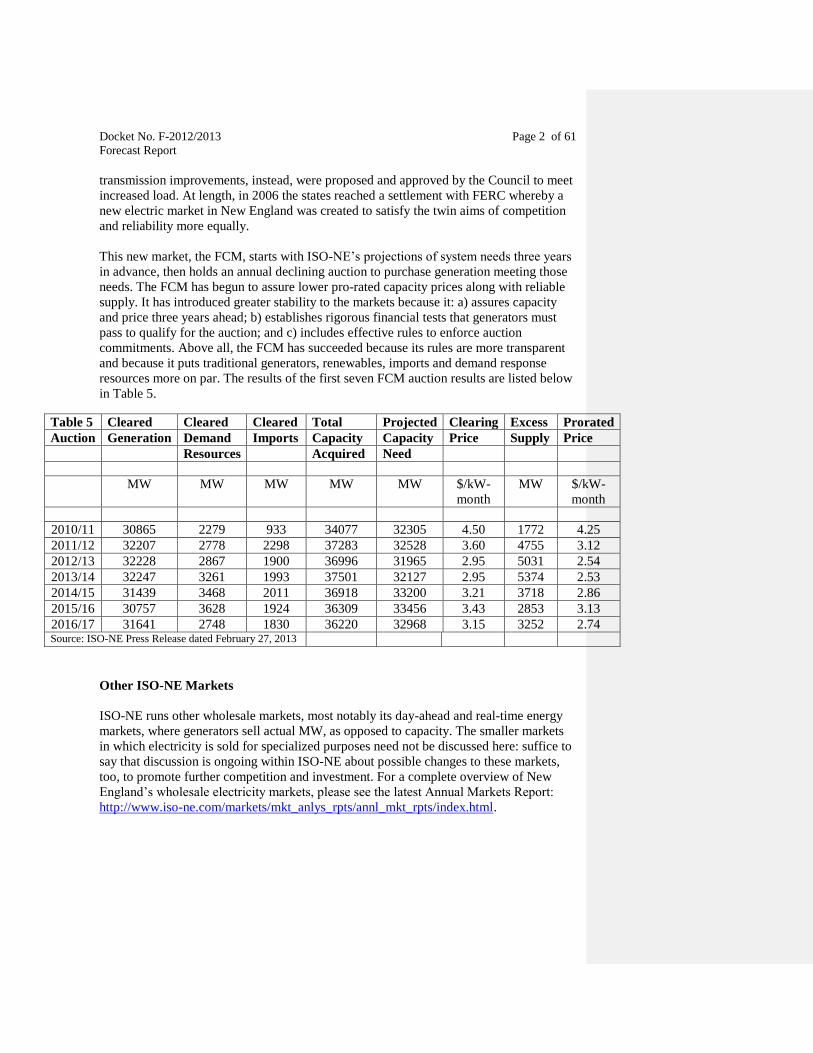
Docket No. F-2012/2013 Page 2 of 61
Forecast Report
transmission improvements, instead, were proposed and approved by the Council to meet
increased load. At length, in 2006 the states reached a settlement with FERC whereby a
new electric market in New England was created to satisfy the twin aims of competition
and reliability more equally.
This new market, the FCM, starts with ISO-NE’s projections of system needs three years
in advance, then holds an annual declining auction to purchase generation meeting those
needs. The FCM has begun to assure lower pro-rated capacity prices along with reliable
supply. It has introduced greater stability to the markets because it: a) assures capacity
and price three years ahead; b) establishes rigorous financial tests that generators must
pass to qualify for the auction; and c) includes effective rules to enforce auction
commitments. Above all, the FCM has succeeded because its rules are more transparent
and because it puts traditional generators, renewables, imports and demand response
resources more on par. The results of the first seven FCM auction results are listed below
in Table 5.
Table 5 Cleared Cleared Cleared Total Projected Clearing Excess Prorated
Auction Generation Demand Imports Capacity Capacity Price Supply Price
Resources Acquired Need
MW MW MW MW MW $/kW-
month
MW $/kW-
month
2010/11 30865 2279 933 34077 32305 4.50 1772 4.25
2011/12 32207 2778 2298 37283 32528 3.60 4755 3.12
2012/13 32228 2867 1900 36996 31965 2.95 5031 2.54
2013/14 32247 3261 1993 37501 32127 2.95 5374 2.53
2014/15 31439 3468 2011 36918 33200 3.21 3718 2.86
2015/16 30757 3628 1924 36309 33456 3.43 2853 3.13
2016/17 31641 2748 1830 36220 32968 3.15 3252 2.74 Source: ISO-NE Press Release dated February 27, 2013
Other ISO-NE Markets
ISO-NE runs other wholesale markets, most notably its day-ahead and real-time energy
markets, where generators sell actual MW, as opposed to capacity. The smaller markets
in which electricity is sold for specialized purposes need not be discussed here: suffice to
say that discussion is ongoing within ISO-NE about possible changes to these markets,
too, to promote further competition and investment. For a complete overview of New
England’s wholesale electricity markets, please see the latest Annual Markets Report:
http://www.iso-ne.com/markets/mkt_anlys_rpts/annl_mkt_rpts/index.html.
Docket No. F-2012/2013 Page 2 of 61
Forecast Report
Legislation Affecting Supply
Regional Greenhouse Gas Initiative (RGGI)
The Regional Greenhouse Gas Initiative (RGGI) is the nation’s first mandatory, market-
based program to reduce CO2emissions CO2, the principal human-caused greenhouse gas.
The states participating in RGGI (CT, DE, MA, MD, ME, NH, NY, RI, and VT) have
established a regional cap on CO2 emissions from the power sector and are requiring
power plants to possess a tradable CO2 allowance for each ton of CO2 they emit.
RGGI is composed of individual CO2 budget trading programs in each state, based on
each state’s independent legal authority. A CO2 allowance represents a limited
authorization to emit one ton of CO2 as issued by a respective state. A regulated power
plant must hold CO2 allowances. RGGI compliance occurs in three-year control periods.
At the end of each control period, each power plant must submit the required CO2
allowances. The first control period began on January 1, 2009, and extended through
December 31, 2011. The second control period began on January 1, 2012, and extends
through December 31, 2014. RGGI applies to fossil-fueled power plants 25 MW or
greater in size. The annual cap for power sector emissions in the region was 165 million
tons per year through 201428
.
The auction proceeds for the region through December 5, 2012 exceed $1.1B, of which,
$65M is for Connecticut. Overall, 80 percent is invested in consumer benefit programs,
including energy efficiency, renewable energy, direct energy bill assistance, and other
greenhouse gas reduction programs.
However, falling natural gas prices (due in large part to new Marcellus gas supplies) have
encouraged power plants to switch to burning natural gas wherever feasible. Since
natural gas is the lowest carbon fuel of the three fossil fuels (coal, oil, natural gas), power
plant carbon emissions in this region have plummeted to record low levels. Annual
carbon emissions are on the order of 91 million tons, which is about 45 percent below the
previous RGGI cap of 165 million tons29
.
Upon further review and analysis, changes were made to RGGI to address this issue. The
Updated Model Rule and Program Review Recommendations Summary released on
February 7, 2013 made changes that will take effect on January 1, 2014. These changes
include but are not limited to the following.
A reduction of the 2014 regional CO2 budget (RGGI Cap) from 165 million to 91
million tons – a reduction of 45 percent. The RGGI Cap would decline 2.5
percent every year from 2015 to 2020.
Unsold 2012 and 2013 CO2 allowances will not be re-offered.
Regulated entities will be required to hold allowances equal to at least 50 percent
of their emissions in each of the first two years of the three-year compliance
period, in addition to demonstrating full compliance at the end of each three-year
compliance period30
.
Docket No. F-2012/2013 Page 2 of 61
Forecast Report
A continuing uncertainty is how RGGI will relate to new standards for carbon emissions
set by the U.S. Environmental Protection Agency (EPA). See next section. Also, the
lack of a national cap-and-trade bill has isolated RGGI. On account of these and other
uncertainties, RGGI’s impacts to Connecticut’s electric loads and resources cannot yet be
quantified for 2013-2022.
Carbon Dioxide Pollution Standard for New Power Plants
On September 20, 2013, the U.S. Environmental Protection Agency (EPA) proposed
Clean Air Act Standards to cut carbon pollution from new power plants in order to
combat climate change and improve public health. Under this proposal, new large
natural gas-fired turbines would need to meet a limit of 1,000 pounds of CO2 per
megawatt-hour, while new small natural gas-fired turbines would need to meet a limit of
1,100 pounds of CO2 per megawatt-hour. New coal-fired units would need to meet a
limit of 1,100 pounds of CO2 per megawatt-hour and would have the option to meet a
somewhat tighter limit if they choose to average emissions over multiple years, giving
those units additional operational flexibility.
The proposed standards would ensure that new power plants are built with available clean
technologies that are already being made in the power industry. Additionally, some of
these standards provide flexibility by allowing sources to phase in the use of some of
these technologies, and they ensure that the power plants of the future use cleaner energy
technologies such as efficient natural gas, advanced coal technology, nuclear power, and
renewable energy like wind and solar. EPA is seeking comments on this proposal for 60
days, will hold a public hearing, and will take the input into account as it completes the
rulemaking process.
In accordance with the June 25, 2013 Presidential Memorandum31
, EPA will issue
proposed standards for existing power plants by June 1, 2014. It is too soon to tell how
Connecticut’s existing and future generation fleet would be affected.
TRANSMISSION SYSTEM Transmission is often referred to as the “backbone” of the electric system, since it
transports large amounts of electricity over long distances efficiently by using high
voltage. High voltages are efficient because the laws of physics dictate that the greater
the voltage, the greater the amount of electricity the lines can carry, and the smaller the
amount of electric energy wasted from the lines as heat.
In Connecticut, electric lines with a line voltage of 69 kilovolts (kV) or more are
considered transmission lines. The highest transmission line voltage in Connecticut is
345-kV.
Docket No. F-2012/2013 Page 2 of 61
Forecast Report
Distribution lines are those below 69-kV. They are the lines that come down our streets
to connect (via a transformer) with even lower-voltage lines supplying each residence or
business.
Large generating units are typically connected to the 345-kV transmission system
because they are higher capacity lines32
. Older, smaller units are connected to the 115-
kV system.
Substations and Switching Stations
A substation is a grouping of electrical equipment including switches, circuit breakers,
buses, transformers and controls for switching power circuits and transforming electricity
from one voltage to another. One common type of substation connects the transmission
system to the distribution system. For example, the input might be 115-kV transmission
and the output might be 13.8-kV distribution. Another type of substation connects a
generator to the grid. Since a generator’s output voltage is much less than the
transmission voltage, it has to be raised before the power generated can be fed into the
grid. Lastly, some substations, called switching stations, simply interconnect transmission
lines to others at the same voltage.
As depicted in Appendix C, as many as five new substations are planned for the next six
years to address high load areas within the State. Other new substations and/or upgrades
to existing substations are also being considered, with the estimated in-service dates to be
determined.
Predicting the pace and location of substation development is difficult. Even if predicted
load growth overall is low, growth in certain geographical areas can exceed predicted
levels due to unplanned population shifts and consequent economic development.
Interstate Connections and Imports
Connections with other systems outside the State are critical to overall reliability and
economic efficiency. There are 11 such AC connections or ties: one at 69-kV; one at
138-kV (the underwater set of cables from Norwalk to Long Island); six at 115-kV; and
three at 345-kV. In addition, the Cross Sound Cable, a DC tie between New Haven and
Long Island, is at 150-kV.
Of these interstate connections, the most prominent are a 345-kV tie with National Grid
in Rhode Island; a 345-kV tie with Central Hudson in New York Sstate; and five ties (one
345-kV and four 115-kV) with the Western Massachusetts Electric Company (WMECO).
New England East –West Solution (NEEWS)
In approximately 2004, a working group consisting of National Grid – a utility company
that provides service in various parts of New England outside of Connecticut, The
Northeast Utilities Service Company, and ISO-NE began planning a major tri-state
Docket No. F-2012/2013 Page 2 of 61
Forecast Report
transmission upgrade to improve electricity transfers between Connecticut,
Massachusetts, and Rhode Island. Known as NEEWS, the large-scale upgrade is
comprised of four separate projects, described below.
The Interstate Reliability Project is the most comprehensive. It consists of a new 345-
kV transmission line to tie National Grid’s Millbury Substation in central Massachusetts
with CL&P’s Card Street Substation in Lebanon, thus connecting electric service more
efficiently from Massachusetts to eastern Connecticut, at the location of an existing
connection point with Rhode Island. When combined with the three other projects within
NEEWS, this one increases the east-west power transfer capability across New England
in general and may allow Lake Road to count towards Connecticut’s generation capacity.
This Connecticut portion of the project was approved by the Council on December 27,
2012.
The Greater Springfield Reliability Project improves connections between
Connecticut and Massachusetts to address particular problems in the Springfield,
Massachusetts area. New 345-kV facilities were built to tie WMECO’s Ludlow
Substation with its Agawam Substation and also connect Agawam Substation with
CL&P’s North Bloomfield Substation in Bloomfield. This portion of the project is in the
restoration phase. Also, the 345-kV connections from Manchester Substation to the south
to Meekville Junction to the north have been improved. This portion of the transmission
project is complete.
The Central Connecticut Reliability Project is intended to increase the reliability of
power transfers from eastern Connecticut to western and southwestern Connecticut. A
new 345-kV transmission line would connect the North Bloomfield Substation in
Bloomfield and the Frost Bridge Substation in Watertown. Associated upgrades to the
115-kV facilities in the area would also be necessary. This project is still under review
by the utilities and ISO-NE. To date, no application has been received by the Council.
The Rhode Island Reliability Project principally would affect Rhode Island. New 115-
kV and 345-kV facilities would be built to improve Rhode Island’s access to the regional
345-kV grid and decrease its dependence on local generation. National Grid would
construct the facilities. This transmission project is complete.
Overall, the aggregate of the southern New England transmission reinforcements
provided by NEEWS is expected to increase Connecticut’s import capacity significantly.
Transmission associated with Renewable Portfolio Standards (RPS)
The requirements that certain percentages of electrical energy for Connecticut come from
Class I, Class II, and Class III renewable resources increase annually during the forecast
period. See Table 6 below.
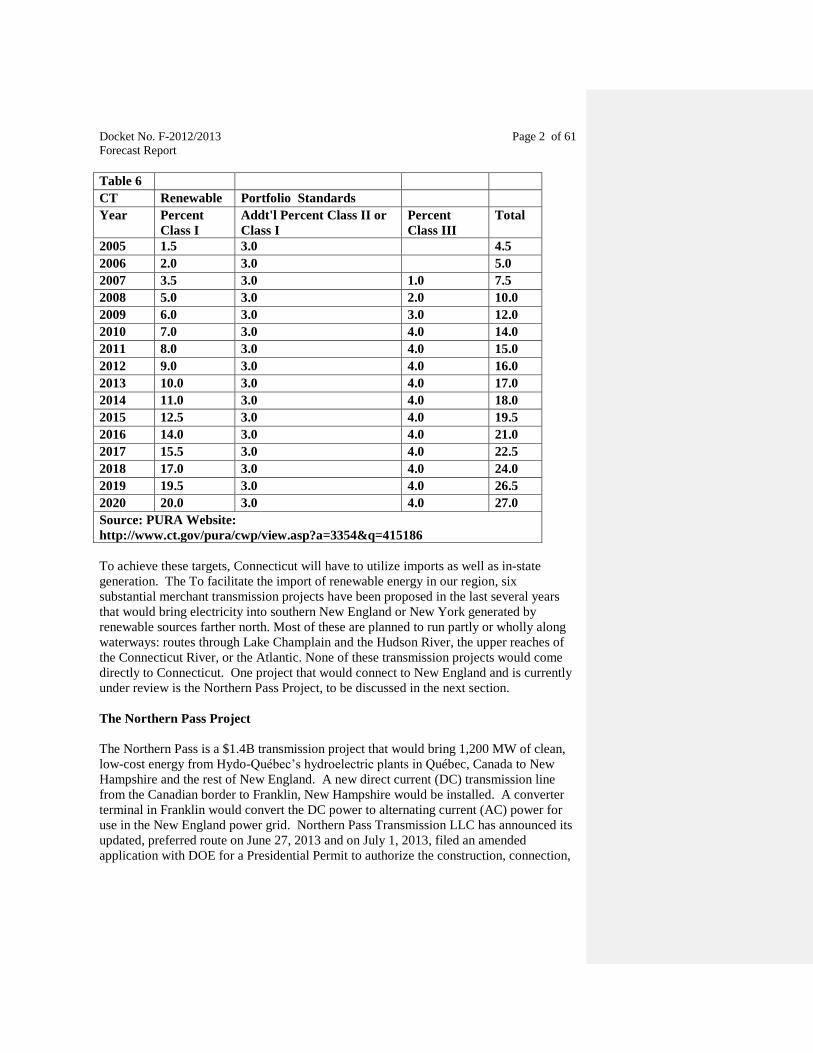
Docket No. F-2012/2013 Page 2 of 61
Forecast Report
Table 6
CT Renewable Portfolio Standards
Year Percent
Class I
Addt'l Percent Class II or
Class I
Percent
Class III
Total
2005 1.5 3.0 4.5
2006 2.0 3.0 5.0
2007 3.5 3.0 1.0 7.5
2008 5.0 3.0 2.0 10.0
2009 6.0 3.0 3.0 12.0
2010 7.0 3.0 4.0 14.0
2011 8.0 3.0 4.0 15.0
2012 9.0 3.0 4.0 16.0
2013 10.0 3.0 4.0 17.0
2014 11.0 3.0 4.0 18.0
2015 12.5 3.0 4.0 19.5
2016 14.0 3.0 4.0 21.0
2017 15.5 3.0 4.0 22.5
2018 17.0 3.0 4.0 24.0
2019 19.5 3.0 4.0 26.5
2020 20.0 3.0 4.0 27.0
Source: PURA Website:
http://www.ct.gov/pura/cwp/view.asp?a=3354&q=415186
To achieve these targets, Connecticut will have to utilize imports as well as in-state
generation. The To facilitate the import of renewable energy in our region, six
substantial merchant transmission projects have been proposed in the last several years
that would bring electricity into southern New England or New York generated by
renewable sources farther north. Most of these are planned to run partly or wholly along
waterways: routes through Lake Champlain and the Hudson River, the upper reaches of
the Connecticut River, or the Atlantic. None of these transmission projects would come
directly to Connecticut. One project that would connect to New England and is currently
under review is the Northern Pass Project, to be discussed in the next section.
The Northern Pass Project
The Northern Pass is a $1.4B transmission project that would bring 1,200 MW of clean,
low-cost energy from Hydo-Québec’s hydroelectric plants in Québec, Canada to New
Hampshire and the rest of New England. A new direct current (DC) transmission line
from the Canadian border to Franklin, New Hampshire would be installed. A converter
terminal in Franklin would convert the DC power to alternating current (AC) power for
use in the New England power grid. Northern Pass Transmission LLC has announced its
updated, preferred route on June 27, 2013 and on July 1, 2013, filed an amended
application with DOE for a Presidential Permit to authorize the construction, connection,
Docket No. F-2012/2013 Page 2 of 61
Forecast Report
operation, and maintenance of facilities for the transmission of electricity at an
international border.
Electric Transmission in Southwest Connecticut
Bethel-Norwalk Project and Middletown-Norwalk Project – Dockets 217 and 272
Lying close to New York and along the coast of Long Island Sound, Southwest
Connecticut (SWCT) is the most densely-populated part of the State. Well before the turn
of the century, it became evident that the 115-kV lines serving SWCT were reaching the
limit of their ability to support the area’s current and projected loads reliably and
economically. ISO-NE, CL&P, and UI devised a large-scale, long-term plan to
supplement the existing 115-kV transmission lines with a new 345-kV “loop” though
SWCT that would integrate the area better with the 345-kV system in the rest of the State
and New England, and provide electricity more efficiently. Council Docket No. 5 was
the first phase of this “macro” upgrade: approved in 1975, it connected New Milford and
Danbury.
The second phase of the upgrade plan was the subject of Council Docket No. 217 and
involved the construction of a 345-kV transmission line from Plumtree Substation in
Bethel to the Norwalk Substation in Norwalk. This was the subject of Council Docket
No. 217, approved by the Council on July 14, 2003. Construction is complete, and the
line was activated in October 2006.
The third phase of the upgrade plan was the subject of Council Docket No. 272. This
proposal was to construct a 345-kV transmission line from Middletown to Norwalk
Substation. It was approved by the Council on April 7, 2005. Construction began in
2006. The project went into service in late 2008.
Glenbrook-Norwalk Cable Project – Docket 292
Within SWCT, a critical sub-area is called the Norwalk-Stamford Sub-Area.
Historically, Norwalk and Stamford have relied on local generation. Since generation has
become less economical, given electric restructuring, and given the age of generating
plants around Norwalk and Stamford, the Norwalk-Stamford Sub-Area had to look at an
additional 115-kV transmission line, rather than generation, to meet its increasing needs.
To address these needs, the Council reviewed and approved the construction of two new
115-kV underground transmission cables between the Norwalk Substation in Norwalk
and the Glenbrook Substation in Stamford. This project, proposed by CL&P, was
designed to bring the reliability benefits of the new 345-kV transmission loop to the large
load center in Stamford. It is currently in service.
While the Bethel-Norwalk, Middletown-Norwalk, and Glenbrook-Norwalk projects
relieved transmission congestion in SWCT for the near term, as part of prudent planning,
ISO-NE is continually reviewing the New England grid to determine future needs.
Docket No. F-2012/2013 Page 2 of 61
Forecast Report
Stamford Reliability Cable Project - Docket 435
On January 18, 2013, CL&P submitted an application to the Council for a new 115-kV
underground transmission circuit, to extend approximately 1.5 miles between CL&P’s
Glenbrook and South End Substations in Stamford, and to make related improvements at
both substations. This project is designed to strengthen the 115-kV transmission system
serving the Stamford-Greenwich Sub-area and eliminate reliability criteria violations by
relieving power flows and thus ensuring compliance with mandatory national and
regional reliability standards. This project would also provide the Stamford-Greenwich
Sub-area with a strong electrical supply source from the new transmission lines installed
in SWCT since 2006 by adding a new and alternate path to relieve power flows. Finally,
the project advances a long-range plan for expansion of Connecticut’s power grid. This
project was approved by the Council on September 5, 2013.
New Transmission Technologies
Materials and Construction
Within the electric system overall, transmission has been the component slowest to
change. In Connecticut, a few innovations have been made, as reported in earlier forecast
reviews. Helicopters have been used to install overhead conductors; transmission towers
fabricated with new materials are being installed; conductors designed with special-
purpose metals and ceramics are being tested elsewhere and could be applied at certain
sites in Connecticut; new techniques have been employed for laying cables underground.
Storage
Storage is a hybrid in the electricity sector. Because it can sometimes act as a type of
generation (pumped hydro, for instance), it is attracting a great deal of basic and
engineering research. Building-sized battery “farms” have been developed; storage
systems have been devised using cheap electricity at night to make ice that supplies
cooling during the day; flywheels have been engineered that take excess electricity from
the grid and return it super-efficiently to balance load; compressed-air storage is quite
common; the list goes on. Particularly of interest to Connecticut is the form of storage
that uses off-peak electricity to charge electric vehicles (EVs): the entire collection of
EVs, in this concept, can function as a medium of storage. Connecticut is one of the few
states to have inaugurated an EV charging station, since CL&P has committed to
supporting EVs. See section on Electric Vehicles.
Smart Grid
The technological advances most needed are ones that would improve the working of the
grid as a whole. In particular, sweeping improvements are needed in the electronics that
control the grid, since, as one expert says “[Today’s] switches…operate at a speed that is
Docket No. F-2012/2013 Page 2 of 61
Forecast Report
the equivalent of being 10 days late, relative to the speed of light.”33
A major innovation
in control electronics is at hand that will likely change the organization of transmission,
even its operating characteristics: this innovation is known as the “Smart Grid.”
The Smart Grid is a suite of bundled electronic technologies, some currently available,
others only speculative. Many of them apply to electricity distribution, but transmission is
importantly involved in the Smart Grid too. Although the Smart Grid can be defined in
many different ways, a useful definition here comes from the Energy Security and
Independence Act of 2007 (EISA), as reported by ISO-NE: “The goal is to use advanced,
information-based technologies to increase power grid efficiency, reliability, and
flexibility, and reduce the rate at which electric utility infrastructure needs to be built.”34
Having anticipated the evolution of the Smart Grid, the Connecticut utilities have already
taken some steps to implement it. For instance, UI has installed four phasor measurement
units in its service area. CL&P has installed 13 phasor measurement units in its service
area. These units increase the reliability of the power grid and can help prevent the
spread of local outages to neighboring regions. In addition, CL&P has installed digital
fault recorders to identify data that can be used to determine what happened during a
disturbance in the system.
The driver of the Smart Grid at its inception was reliability; the driver currently is
efficiency; the driver going forward will be flexibility—that is, the need to integrate
renewable resources, and storage. Given the scale of the Smart Grid effort—thousands of
billions of dollars over decades—it is difficult to predict how much of an effect it will
have on any Connecticut transmission projects during 2013-2022.
Climate Change Effects on Electric Infrastructure and Mitigation Plans
In accordance with provisions of Public Act 04-252 (AAC Climate Change) the State has
taken on various initiatives to study and prepare plans to respond to climate change as we
know it. At this time, the Council directs the utilities to consult the Connecticut Climate
Preparedness Plan 2011 for adaptation strategies for agricultural, infrastructure (i.e.
electric and communications), natural resources and public health climate change
vulnerabilities.35
With the recent increase in storm activity and severity, flooding is a concern for
substation facilities given the presence of live electrical equipment. In the worse-case
scenario, it may be necessary to shut down and de-energize a substation for safety
reasons and to protect the equipment in the event of severe flooding. Unfortunately, this
can result in an outage for many customers served by the substation. Accordingly, the
Connecticut utilities have been taking proactive steps to protect their substation facilities.
Specifically, UI has put together an interim plan to ensure that if storm surge comparable
to that of Storm Sandy occurred or even three feet higher, UI would be able to get
through the storm without having to de-energize their substations. Six or seven of UI’s
substations would be part of this plan. (Three of these substations had flooding issues
Docket No. F-2012/2013 Page 2 of 61
Forecast Report
during Storm Sandy.) UI is also evaluating the long-term solutions such as raising
equipment at substations, relocating substations, etc.
CL&P’s situation is different because more of its facilities are located inland than UI’s.
CL&P did not experience substation flooding during either of the Two Storms.36
However, one substation – the South End Substation in Stamford is of concern with
respect to flooding in future storms. CL&P has taken active measures to mitigate
flooding risk to this substation.
Generally, two well-known flood elevations are associated with the 100-year and 500-
year flood zones, respectively. The 100-year flood elevation, on average, has a one
percent chance of being reached or exceeded by a flood in a given year. The 500-year
flood elevation, on average, has a 0.2 percent chance of being reached or exceeded in a
given year. Whether to design or upgrade the substation to the 100-year or 500-year
flood zone is a judgment call based on the cost and complexity of the upgrades versus the
risk. Nevertheless, the Council has been proactively looking at flood elevations during
its review of new substation applications as well as petitions to modify existing
substations.
RESOURCE PLANNING
Connecticut Siting Council
The Connecticut Siting Council (Council), formerly known as the Power Facility
Evaluation Council, was established in 1971 to balance the need for adequate and reliable
public services at the lowest reasonable cost to consumers while protecting the
environment and ecology of Connecticut. Generally, most power plants over 1 MW, all
fuel cells, substations and switching stations (at or above 69 kV), and transmission
projects (at or above 69 kV) are under the jurisdiction of the Council.
The Council is also charged with reviewing the Connecticut utility forecasts of electric
loads and resources and holding an annual public hearing. The Council also reviews the
life cycle costs of electric transmission lines and issues a report every five years. The
Council has completed its 2012 review of life cycle costs of electric transmission lines37
.
Department of Energy and Environmental Protection (DEEP)
PA 11-80 merged the Departments of Environmental Protection and Public Utility
Control. Various other energy planning groups were also drawn under the DEEP’s
umbrella, principally the CEAB. In addition, the executive-legislative liaison regarding
energy planning was re-designed, with new DEEP personnel. Perhaps most importantly,
the Governor appointed as Commissioner of DEEP—Dan Esty— a person with extensive
credentials at the intersection of environmental policy and energy resource planning.
Docket No. F-2012/2013 Page 2 of 61
Forecast Report
Integrated Resource Plan (IRP)
PA 11-80 requires an IRP every even-number year. The IRP provides an in-depth
assessment of the State’s energy and capacity resources. With analysis of electric supply
and demand, the IRP is intended to outline a plan for securing resources to meet the
State’s energy needs in a way that will minimize cost and maximize benefits consistent
with the State’s environmental goals and standards.
On June 14, 2012, DEEP issued the 2012 Integrated Resource Plan for Connecticut
(2012 IRP).38
In the “Forecast for Future Electricity Supply and Demand” section, the
2012 IRP found the following:
Connecticut’s electricity consumption declined sharply during the economic
recession and is not expected to exceed 2005 levels until 2022.
Adequate generating resources will likely be available in Connecticut to serve
electricity loads reliably through 2022.
The deliverability of natural gas fuel to electric generators requires monitoring to
assure the reliability of electricity supply.
Connecticut is beginning to experience lower Generation Service Charges and can
expect the downward trend to continue over the next five years.
Between 2017 and 2022, Generation Service Charges are projected to rise by
more than three cents per kilowatt-hour in real terms.
Air pollution in Connecticut has decreased, as low-cost natural gas-fired
generation is displacing coal and oil-fired generation.
A gap between projected available renewable generation and demand mandated
by the Connecticut’s and other New England states’ renewable generation targets
is expected to emerge in 2018.
Comprehensive Energy Strategy (CES)
Section 51 of PA 11-80 requires that DEEP, in consultation with the CEAB, prepare a
CES every three years beginning in 2012. The CES is intended to address energy
opportunities and challenges, as well as provide a foundation for policy, regulatory, and
legislative decisions and better choices at the household and business energy level. In
accordance with the legislation, on February 19, 2013, DEEP issued the final version of
its first CES.39
The CES covers all fuels in all sections with a planning horizon out to
2050. It offers analysis of the State’s current energy circumstances and a set of
recommendations designed to advance the Governor’s agenda of moving Connecticut
toward a cheaper, cleaner, and more reliable energy future. Specifically, the CES offers
recommendations in five major priority areas: energy efficiency, industrial energy needs,
electricity supply (including renewable power), natural gas, and transportation. As
energy efficiency and electric supply are most directly applicable to the Council’s
forecast report, those recommendations are noted below.
In the Energy Efficiency section, the following recommendations were made:
Provide sufficient and consistent long-term funding for efficiency programs;
Docket No. F-2012/2013 Page 2 of 61
Forecast Report
Revamp existing efficiency fund programs to ensure maximum impact for each
ratepayer dollar spent;
Develop financing programs to make residential clean energy investments more
affordable;
Establish commercial property assessed clean energy districts in municipalities
across the State;
Develop programs to address health and safety pre-weatherization measures;
Incorporate energy efficiency measures into upgrades of State-administered
housing;
Improve existing means-tested energy assistance programs;
Target funding to address split incentives;
Expand outreach and financing options for businesses in low-income
communities to achieve energy efficiency;
Implement decoupling to align utility incentives with energy efficiency;
Adopt and enforce the latest codes and standards to ensure high-performing
buildings;
Work with regional organizations to support stricter federal product efficiency
standards;
Empower consumers with information about efficiency benefits;
Train professionals on code compliance and efficient building design and
construction; and
Empower building owners to market their energy efficiency improvements.
In the Electricity Sector Strategy section, the following recommendations were made:
Expand C&LM funding to invest in all cost-effective electric efficiency;
Reduce peak demand and improve load factor through technology and pricing;
Align utilities’ incentives with achieved efficiency savings and other performance
metrics;
Engage vigorously in regional and federal regulatory processes;
Work with municipalities to expand programs and policies that drive down the
cost of in-state renewable resources;
Evaluate options for waste-to-energy in Connecticut;
Expand virtual net metering opportunities to promote deployment of large-scale
renewable systems;
Strengthen the regional carbon dioxide cap as called for by the RGGI program
review;
Develop submetering protocols to promote the use of renewable energy and
combined heat and power in multi-tenant buildings;
Develop and deploy microgrids to support critical services and ensure public
safety during an electricity outage crises;
Implement the reliability recommendations of the Two Storm Panel;
Charge PURA with cyber security review of the State’s public utilities and water
companies; and
Docket No. F-2012/2013 Page 2 of 61
Forecast Report
Transition current standard service customers to competitive supplier
marketplace.
CONCLUSION
This Council has considered Connecticut’s electric energy future and finds that even
taking into account the most conservative prediction, the ISO-NE 90/10 forecast, the
electric generation supply during 2013-2022 will be adequate to meet demand.
Neglecting retirements, going forward, Connecticut has a surplus of generation during the
forecast period. When possible retirements are taken into account, the NEEWS projects
will provide additional import capacity to offset such losses. Even if these retirements
occur in 2015, prior to the significant Interstate Reliability Project import upgrade and
inclusion of Lake Road in 2016, the deficit could be fairly easily made up by having all
generation active, using active demand response resources, etc.
Connecticut’s largest recent gain in generating capacity is associated with the new 620
MW Kleen Energy power plant in Middletown.
The Council calls attention to the significant improvements to our transmission system
that are complete and/or underway. Several transmission projects in SWCT are up and
running. One NEEWS project has been reviewed and approved by the Council and is
nearing the completion of construction; another NEEWS project is currently approved by
the Council and in the Development and Management Plan review phase. Another
NEEWS application has not yet been received yet. Also, a transmission project to further
improve reliability in the Stamford area was recently approved by the Council.
C&LM and DG (including LREC/ZREC) are projected to eliminate Connecticut’s
increases in energy consumption and reduce the increase in load growth during the
forecast period. Specifically, with these measures, annual energy consumption is
expected to decrease at a CAGR of 0.35 percent per year. Without such measures, annual
energy consumption in Connecticut would increase at a CAGR of 0.91 percent per year.
Such measures also reduce the rate of load growth from a CAGR of 1.24 percent to 0.40
percent per year.
Finally, the Council reviewed the accuracy of past forecasting. Specifically, the 2003
utilities’ load forecast was compared to the weather-normalized historical data. The
utilities’ forecasts were, on (weighted) average, accurate to plus or minus 3.15 percent,
which is remarkable.
The Council makes the following further observations based on the information presented
in this 2013-2022 review.
Fuel diversity, which is key to Connecticut’s policy of energy independence, has
been decreasing at the level of power production within the Council’s jurisdiction.
At the level of DG, however, largely outside the Council’s jurisdiction, fuel
diversity is markedly increasing.
Docket No. F-2012/2013 Page 2 of 61
Forecast Report
Smart Grid improvements offer the potential for significant innovation in
transmission, particularly with regard to integrating renewables and storage.
The deactivation/retirement of older generating facilities is foreseeable during this
forecast period, and replacing/repowering these facilities offers opportunities for
innovation.
End Notes
1. A one MW load would be the equivalent of simultaneously operating 10,000 light
bulbs of 100 Watts each. Put another way, 1 MW could serve between 300 and
1,000 homes, with 500 being a typical number.
2. Wallingford Public Utilities is expected to separate from CMEEC and become its
own independent municipal utility on January 1, 2014.
3. According to the U.S. Department of Energy, roughly 83 percent of Connecticut
homes heat with fossil fuels such as heating oil or natural gas or propane. See
http://apps1.eere.energy.gov/states/residential.cfm/state=CT.
4. There are some natural gas-powered air conditioning systems, but they are much
less common than electric air conditioning.
5. A very small amount of CMEEC load is the result of providing service to Fisher’s
Island, New York via a connection to a substation in Groton, Connecticut. The
peak load is on the order of 1 MW and thus considered negligible relative to the
Connecticut load.
6. During the June 12, 2012 hearing, ISO-NE testified that it does not weather
normalize peak data. Thus, the Council is unable to include the ISO-NE 50/50
forecast in this comparison at this time.
7. Plus or minus 5 percent is generally considered a reasonable tolerance for most
(rough or preliminary) engineering calculations.
8. For example, a 23-Watt compact fluorescent light bulb consumes electricity at a
rate of 23 Watts. If the bulb were on for ten hours, the total energy consumed
would be 230 Watt-hours or 0.23 kWh. A much larger load, for example, a 1,500
Watt electric heater, would only have to run for approximately 9.2 minutes (0.15
hours) to consume 0.23 kWh of energy.
9. For larger accounts, meters also record the instantaneous load or demand.
10. http://www.eia.gov/tools/faqs/faq.cfm?id=97&t=3
Docket No. F-2012/2013 Page 2 of 61
Forecast Report
11. The only emissions are those associated with generating the electricity.
12. Natural gas conservation measures are outside the scope of this report.
13. To put this into perspective, it takes about 8.34 BTUs of heat energy to warm one
gallon of water by one degree F.
14. See the PURA Decision in Docket No. 11-12-06.
http://www.dpuc.state.ct.us/FINALDEC.NSF/2b40c6ef76b67c438525644800692
943/1b95b48c34af2ee285257a3a000bca13?OpenDocument
15. In this report, to be conservative, the summer (not winter) power outputs of
existing generation will be considered. To also find the winter power outputs, see
Appendix A.
16. http://ctcleanenergy.com/default.aspx?tabid=97
17. While some of these projects have in-service dates estimated at 2013, the actual
in-service dates may be later due to the possibility of extensions of time.
18. http://www.ct.gov/csc/cwp/view.asp?a=2397&q=468692
19. http://www.ct.gov/csc/cwp/view.asp?a=2397&q=469520
20. http://www.ct.gov/csc/cwp/view.asp?a=2397&q=469902
21. http://www.ct.gov/csc/cwp/view.asp?a=2397&q=513338
22. http://www.ct.gov/csc/lib/csc/pendingproceeds/petition_1056/1056decisionpacka
ge.pdf
23. http://www.eia.gov/todayinenergy/detail.cfm?id=2930
24. While the Lake Road power plant does provide electricity to Connecticut under
normal operating conditions, it is not considered a Connecticut resource by ISO-
NE due to the existing transmission configuration. This is expected to change
when the Interstate Reliability Project is constructed. See section titled,
“Demand/Supply Balance.”
25. This takes into account only passive (non-dispatched) demand reductions such as
energy efficiency, to be conservative.
26. This is based on a one-in-ten-years event and assumes conservative import
capacity, no load response, and no newly-approved DG.
Docket No. F-2012/2013 Page 2 of 61
Forecast Report
27. Such retirements are hypothetical based on certain conditions and are difficult to
predict with certainty at this time.
28. RGGI Fact Sheet updated 9/28/2012.
http://www.rggi.org/docs/Documents/RGGI_Fact_Sheet_2012_09_28.pdf
29. The Connecticut Mirror article “Overhaul is near for Regional Greenhouse Gas
Initiative” by Jan Ellen Spiegel and dated December 11, 2012.
http://ctmirror.com/story/18431/overhaul-ner-regional-greenhouse-gas-initiative
30. RGGI press release dated September 6, 2013
31. http://www.whitehouse.gov/the-press-office/2013/06/25/presidential-
memorandum-power-sector-carbon-pollution-standards
32. Since power is directly proportional to voltage, all else being equal, a 345-kV line
can carry three times as much power as a 115-kV line. A typical 345-kV line has
two conductors per phase, whereas a typical 115-kV line has one, thus turning the
three times power-carrying advantage of a 345-kV line to six times.
33. David Wagman, Power Engineering (March 2011, p. 4).
34. ISO-NE, “Overview of the Smart Grid—Policies, Initiatives, and Needs”
(February 17, 2009), p. 1
35. http://www.ct.gov/deep/lib/deep/climatechange/connecticut_climate_preparednes
s_plan_2011.pdf
36. http://www.governor.ct.gov/malloy/lib/malloy/two_storm_panel_final_report.pdf
37. http://www.ct.gov/csc/cwp/view.asp?a=895&q=246816.
38. See the 2012 Integrated Resource Plan.
http://www.dpuc.state.ct.us/DEEPEnergy.nsf/c6c6d525f7cdd1168525797d0047c5
bf/cb827b1ffa58b2fd85257a1d0060c374?OpenDocument
39. See the 2013 Comprehensive Energy Strategy for Connecticut.
http://www.ct.gov/deep/lib/deep/energy/cep/2013_ces_final.pdf
Docket No. F-2012/2013 Page 2 of 61
Forecast Report
Glossary
50/50 forecast: A projection of peak electric load assuming normal weather conditions.
The 50/50 projected peak load has a 50 percent chance of being exceeded in a given year.
90/10 forecast: A projection of peak electric load assuming extreme (hot) weather
conditions. The 90/10 forecast has a 10 percent chance of being exceeded in a given
year. This forecast is used for transmission facility planning.
AC (Alternating Current): An electric current that reverses (alternates) its direction of
flow periodically. In the United States, this occurs 60 times per second (60 cycles or 60
Hz).
Ampere (amp): A unit measure for the flow (current) of electricity. As load increases, so
does the amperage at any given voltage.
Baseload generator: A generator that operates nearly 24/7 regardless of the system load:
for example, a nuclear unit.
Blackout: A total disruption of the power system, usually involving a substantial or total
loss of load and generation over a large geographical area.
Black start capability: The capability of a power plant to start generating electricity by
itself without any outside source of power, for instance, during a general blackout.
British thermal unit (BTU): The amount of energy required to heat or cool one pound of
water by one degree Fahrenheit.
C&LM (Conservation and load management): Any measures to reduce electric usage and
provide savings. See Conservation. See Demand response.
Cable: A fully insulated conductor usually installed underground.
CAGR (Compound annual growth rate): The percentage by which a quantity (such as
load or energy) increases per year over the forecast period, on average, while taking into
account compounding effects. It is analogous to a computed compound interest rate on a
bank account based on a beginning balance and final balance several years later
(assuming no deposits other than interest and no withdrawals). Since it is nine years from
the first year of the forecast period to the last, CAGR = (100%*(((Final Value/Initial
Value)^(1/9)) – 1).
CEAB (Connecticut Energy Advisory Board): The CEAB is a 15-member body
responsible for coordinating State energy planning, representing the State in regional
energy planning, participating in the Council’s annual load forecast proceeding, and
reviewing the procurement plans submitted by electric distribution companies.
Docket No. F-2012/2013 Page 2 of 61
Forecast Report
CELT (Capacity, Energy, Load and Transmission Report): An annual ISO-NE report
including data and projections for New England’s electric system over the next ten years.
CHP (Combined heat and power): Term used interchangeably with cogeneration. See
Cogen.
Circuit: A system of conductors (three conductors or three bundles of conductors)
through which electrical energy flows between substations. Circuits can be supported
above ground by transmission structures or placed underground.
Circuit breaker: A device designed to open and close a circuit manually and also to open
the circuit automatically on a predetermined overload of current.
Class I renewable energy source: “(A) energy derived from solar power, wind power, a
fuel cell, methane gas from landfills, ocean thermal power, wave or tidal power, low
emission advanced renewable energy conversion technologies, a run-of-the-river
hydropower facility provided such facility has a generating capacity of not more than five
megawatts, does not cause an appreciable change in the river flow, and began operation
after the effective date of this section, or a biomass facility, including, but not limited to,
a biomass gasification plant that utilizes land clearing debris, tree stumps or other
biomass that regenerates or the use of which will not result in a depletion of resources,
provided such biomass is cultivated and harvested in a sustainable manner and the
average emission rate for such facility is equal to or less than .075 pounds of nitrogen
oxides per million BTU of heat input for the previous calendar quarter except that energy
derived from a biomass facility with a capacity of less than five hundred kilowatts that
began construction before July 1, 2003, may be considered a Class I renewable energy
source, provided such biomass is cultivated and harvested in a sustainable manner, or (B)
any electrical generation, including distributed generation, generated from a Class I
renewable energy source.” (Conn. Gen. Stat. § 16-1(a)(26))
Class II renewable energy source: “Energy derived from a trash-to-energy facility, a
biomass facility that began operation before July 1, 1998, provided the average emission
rate for such facility is equal to or less than 0.2 pounds of nitrogen oxides per million
BTU of heat input for the previous calendar quarter, or a run-of-the-river hydropower
facility provided such facility has a generating capacity of not more than five megawatts,
does not cause an appreciable change in the riverflow, and began operation prior to the
effective date of this section.” (Conn. Gen. Stat. § 16-1(a)(27))
Class III renewable energy source: “The electricity output from combined heat and power
systems with an operating efficiency level of no less than fifty percent that are part of
customer-side distributed resources developed at commercial and industrial facilities in
this state on or after January 1, 2006, a waste heat recovery system installed on or after
April 1, 2007, that produces electrical or thermal energy by capturing preexisting waste
heat or pressure from industrial or commercial processes, or the electricity savings
Docket No. F-2012/2013 Page 2 of 61
Forecast Report
created in this state from conservation and load management programs begun on or after
January 1, 2006.” (Conn. Gen. Stat. § 16-1(a)(44))
CL&P (The Connecticut Light and Power Company): CL&P is the largest
transmission/distribution company in Connecticut.
CMEEC (The Connecticut Municipal Electric Energy Cooperative): An “umbrella”
group comprised of all of the municipal electric utilities in Connecticut. It manages
coordinated generation and transmission/distribution services on their behalf.
Combined-cycle: A power plant that uses its waste heat from a gas turbine to generate
even more electricity for a higher overall efficiency (on the order of 60 percent).
Conductor: A metallic wire, bus bar, rod, tube or cable, usually made of copper or
aluminum, that serves as a path for electric flow.
Compound Annual Growth Rate (CAGR): The percentage by which a quantity (such as
load or energy) increases per year over the forecast period, on average, while taking into
account compounding effects. It is analogous to a computed compound interest rate on a
bank account based on a beginning balance and final balance nine years later (assuming
no deposits other than interest and no withdrawals). Since it is nine years from the first
year of the forecast period to the last, CAGR = (100%*(((Final Value/Initial
Value)^(1/9)) – 1).
Cogen (Cogeneration plant): A power plant that produces electricity and uses its waste
heat for a useful purpose. For example, cogeneration plants heat buildings, provide
domestic hot water, or provide heat or steam for industrial processes.
Conservation: The act of using less electricity. Conservation can be achieved by cutting
out certain activities that use electricity, or by adopting energy efficiencies.
Customer-side distributed resource: “The generation of electricity from a unit with a
rating of not more than sixty-five megawatts on the premises of a retail end user within
the transmission and distribution system including, but not limited to, fuel cells,
photovoltaic systems or small wind turbines, or a reduction in demand for electricity on
the premises of a retail end user in the distribution system through methods of
conservation and load management, including, but not limited to, peak reduction systems
and demand response systems.” (Conn. Gen. Stat. § 16-1(a)(40))
DC (Direct Current): An electric current that flows continuously in one direction as
contrasted to an alternating current (AC).
Dual-fuel: The ability of a generator to operate on two different fuels, typically oil and
natural gas. Economics, the availability of fuels and environmental (e.g. air emission)
restrictions are factors that generating companies consider when deciding which fuel to
burn.
Docket No. F-2012/2013 Page 2 of 61
Forecast Report
Demand: The total amount of electricity required at any given instant by an electric
customers. “Demand” can be used interchangeably with the term “load”. See Load.
Demand response: The ability to reduce load during peak hours, by turning down/off air
conditioning units, industrial equipment, etc. Demand response resources on a scale
large enough to affect transmission are typically aggregated through a third party, using
automated controls.
Distribution: The part of the electric delivery system that operates at less than 69,000
volts. Generally, the distribution system connects a substation to an end user.
Distributed generation: Generating units (usually on the customer’s premises) that
connect to the electric distribution system, not to the transmission system. These units are
generally smaller than their counterparts.
Energy (electric): The total work done by electricity. Energy is the product of the
average load and time. The unit is kilowatt hours (kWh).
Energy efficiency (in the case of an electric generator or of any dynamic process): The
actual amount of energy required to accomplish a task, as opposed to a theoretical 100
percent efficiency.
Feeder: Conductors forming a circuit that are part of the distribution system. See
Distribution. See Circuit.
Fuel cell: Fuel cells are devices that produce electricity and heat by combining fuel and
oxygen in an electrochemical reaction. A battery is a form of fuel cell. Fuel cells can
operate on a variety of fuels, including natural gas, propane, landfill gas, and hydrogen.
Unlike traditional generating technologies, fuel cells do not use a combustion process that
converts fuel into heat and mechanical energy. Rather, a fuel cell converts chemical
energy into heat and electrical energy. This process results in quiet operation, low
emissions, and high efficiencies. Nearly all commercially-installed fuel cells operate in a
cogeneration mode. See Cogen. In addition, fuel cells provide very reliable electricity and
are therefore potentially attractive to customers operating sensitive electronic equipment.
Generator: A device that produces electricity. See Baseload generator, Intermediate
generator, and Peaking generator.
Grid: A system of interconnected power lines and generators that is managed so that the
generators are dispatched as needed to meet the overall requirements of the customers
connected to the grid at various points. “Grid” has the same meaning as “bulk power
system.”
Grid-side distributed resource: “The generation of electricity from a unit with a rating of
not more than sixty-five megawatts that is connected to the transmission or distribution
Docket No. F-2012/2013 Page 2 of 61
Forecast Report
system, which units may include, but are not limited to, units used primarily to generate
electricity to meet peak demand.” (Conn. Gen. Stat. § 16-1(a)(43))
ISO-NE: (ISO New England): An entity charged by the federal government to oversee
the bulk power system and the electric energy market in the New England region.
Intermediate generator: A generator that operates approximately 50 to 60 percent of the
time, depending on the system load.
kV (kilovolt): One thousand volts (i.e. 345 kV = 345,000 volts). See Volt.
Line: A series of overhead transmission structures that support one or more circuits; or, in
the case of underground construction, a single electric circuit.
Load: Amount of power delivered, as required, at any point or points in the system. Load
is created by the aggregate load (demand) of customers’ equipment (residential,
commercial, and industrial).
Load management: Steps taken to reduce demand for electricity at peak load times or to
shift some of the demand to off-peak times. The reduction may be made with reference to
peak hours, peak days or peak seasons. Electric peaks are mainly caused by high air-
conditioning use, so air-conditioners are the prime targets for load management efforts.
Utilities or businesses that provide load management services pay customers to reduce
load through a variety of manual or remotely-controlled methods.
Loss or losses: Electric energy that is lost as heat and cannot be used to serve end users.
There are losses in both the transmission and the distribution system. Higher voltages
help reduce losses.
LREC (Low Emissions Renewable Energy Credit): A Class I Renewable Energy
Certificate from a low-emissions project as defined in Section 110 of Public Act 11-80.
LREC-qualified projects are Connecticut generation projects that are located behind
company customer meters, achieve commercial operation on or after July 1, 2011, and
have emissions of no more than 0.07 pounds per megawatt-hour (MWh) of nitrogen
oxides, 0.10 pounds per MWh of carbon monoxide, 0.02 pounds per MWh of volatile
organic compounds, and one grain per 100 standard cubic feet. To qualify for the
LREC/ZREC Program, LREC projects may not be larger than 2,000 kilowatts (kW).
Megawatt (MW): One million Watts. A measure of the rate at which useful work is
done by electricity.
Microgrid: A localized grouping of electricity generation, energy storage, and loads that
normally operates connected to a traditional centralized grid or macrogrid. This single
point of common coupling with the macrogrid can be disconnected. The microgrid can
then function autonomously.
Docket No. F-2012/2013 Page 2 of 61
Forecast Report
Normal weather: Temperatures and humidity consistent with past meteorological data.
Peak load: The highest electric load experienced during a given time period. See Load.
Peaking unit: A generator that can start under short notice (e.g. 10 to 30 minutes).
Peaking units typically operate less than 10 percent of the hours in a year.
Phasor measurement unit (PMU): A device which measures electrical waves on the
electric grid via synchronized real-time measurements of multiple remote points on the
grid. This monitoring improves reliability. PMUs are also called synchrophasors.
REC (Renewable Energy Credit) : A certificate that represents proof that megawatt-hour
of electricity has been generated from an eligible renewable energy resource. In
Connecticut, a REC is an electronic certificate created by the New England Power Pool
Generation Information System. RECs can be sold or traded.
Smart meter: An electrical meter that records consumption of electric energy in intervals
of an hour or less and communicates that information at least daily back to the utility for
monitoring and billing purposes.
Substation: Electric facilities that use equipment to switch, control and change voltages
for the transmission and distribution of electrical energy.
Switching station: A type of substation where no change in voltage occurs.
Terminal structure: A structure typically within a substation that physically ends a section
of transmission line.
Transformer: A device used to change voltage levels to facilitate the efficient transfer of
electrical energy from the generating plant to the ultimate customer.
Transmission line: Any electric line operating at 69,000 or more volts.
Transmission tie-line or tie: A transmission line that connects two separate transmission
systems. In the context of this report, a tie is a transmission line that crosses state
boundaries and connects the transmission systems of two states.
UI (The United Illuminating Company): A transmission/distribution company that serves
customers in the New Haven – Bridgeport area and its vicinity.
Voltage or volts: A measure of electric force.
Wire: See Conductor.
Docket No. F-2012/2013 Page 2 of 61
Forecast Report
ZREC (Zero Emissions Renewable Energy Credit): A Class I Renewable Energy
Certificate from a zero emissions project as defined in Section 107 of Public Act 11-80.
ZREC-qualified projects are Connecticut generation projects that are located behind
company customer meters, achieve commercial operation on or after July 1, 2011, and
emit no pollutants. To qualify for the LREC/ZREC Program, ZREC projects may not be
larger than 1,000 kW.