Embed Size (px)
Citation preview

Bru
ce D
. Bak
er, A
EF
A 2
009
Rearranging Deck Chairs in Dallas: Contextual Constraints and Within District
Resource Re-allocation in Urban Texas School Districts
Bruce D. Baker
Rutgers University
Bru
ce D
. Bak
er, A
EF
A 2
009
AEFA 2009
Nashville, TN

Bru
ce D
. Bak
er, A
EF
A 2
009
Research questions• How do aggregate resource levels and teacher characteristics of
urban core districts compare with their surroundings?
• How do fiscal resources and teacher characteristics vary across schools within large urban districts?
• How does need and cost related variation within large urban districts fit within the broader labor market of resource variation among schools in surrounding districts?
– That is, is the district a sinking ship facing potential constraints on within district re-allocation?
• To what extent does existing variation in resources account for the marginal costs of providing equal educational opportunity across schools within large urban districts and between large urban districts and their surroundings?
Bru
ce D
. Bak
er, A
EF
A 2
009
Bru
ce D
. Bak
er, A
EF
A 2
009
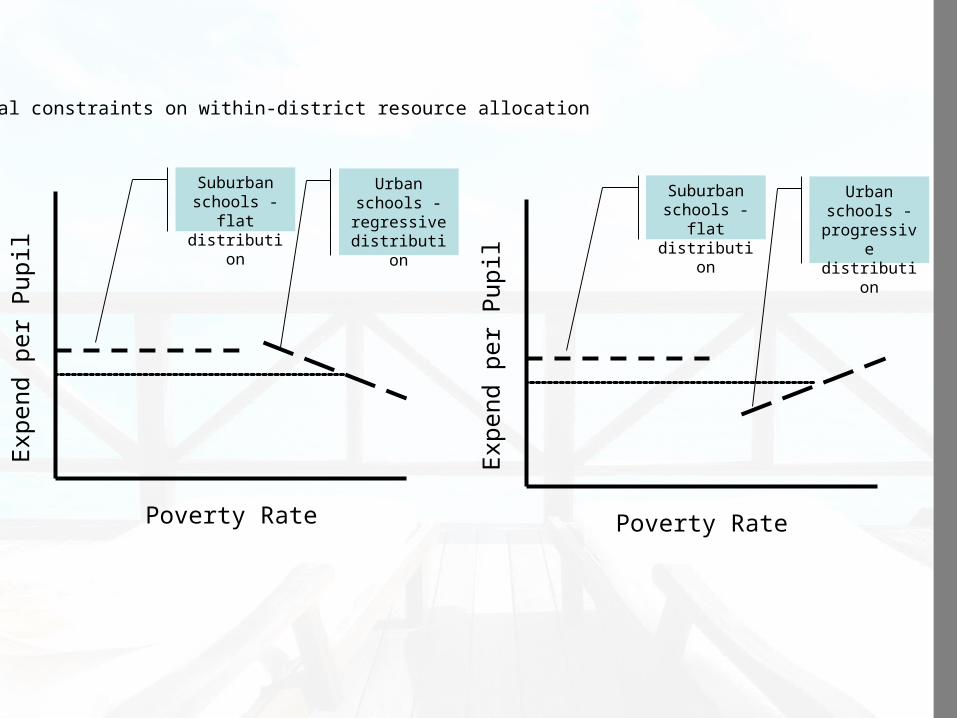
Exp
end
per
Pupi
l
Poverty Rate
Suburban schools - flat distribution
Urban schools - regressive
distribution
Exp
end
per
Pupi
lPoverty Rate
Suburban schools - flat distribution
Urban schools - progressive distribution
Figure 1Contextual constraints on within-district resource allocation
Bru
ce D
. Bak
er, A
EF
A 2
009

Bru
ce D
. Bak
er, A
EF
A 2
009
Data & Analyses• 3-year panel of 1409 Texas Elementary Schools in 5 major cities in 4 Core
Based Statistical Areas– Why only 3 years?
• To be able to estimate marginal cost model based on consistent outcome measurement.
• Models– Expenditure decomposition
• ln(expend) = f(size, students [se, lep, pov])– Drop SE marginal expend– Drop small schools– Models estimated within city districts
• Poverty slope projection– ln(expend) = f(Pov x District)– Excluding SE and small schools– Estimated for each CBSA, with Pov x City District interaction
» How does the district’s poverty slope fit within the CBSA (and how do the intercepts align? (is the district a sinking ship?)
– Cost model • Expenditure function, including outcomes (instrumented) & efficiency controls• Model estimated across all districts within 4 metros
Bru
ce D
. Bak
er, A
EF
A 2
009

Bru
ce D
. Bak
er, A
EF
A 2
009
Austin Dallas Ft. Worth HoustonSan
Antonio
Elem in District [1] 56 110 62 140 54Students (2007) 34,016 70,834 34,503 86,155 27,167
Elem in CBSA (excl. dist) 67 481 529 343 158Students (2007) 45,743 288,990 325,321 262,107 100,308
Demographics% Free/Reduced
District 82% 91% 82% 85% 92%CBSA (excl. dist) 46% 55% 60% 58% 64%
% BlackDistrict 14% 26% 28% 29% 6%CBSA (excl. dist) 11% 18% 18% 19% 8%
% HispanicDistrict 71% 69% 60% 62% 91%CBSA (excl. dist) 43% 39% 43% 45% 65%
Mean Spending (Including SE)In District $6,232 $4,840 $5,775 $5,896 $5,825
Coefficient of Variation 15% 19% 11% 11% 11%In CBSA $5,023 $5,546 $5,368 $5,294 $5,857
Coefficient of Variation 14% 14% 16% 13% 14%Mean Spending (Excluding SE)
In District $5,082 $4,531 $5,288 $5,192 $5,057Coefficient of Variation 13% 20% 12% 10% 9%
In CBSA $4,138 $4,739 $4,636 $4,559 $4,838Coefficient of Variation 11% 14% 15% 13% 13%
City
Table 1Characteristics of Urban Core and other districts sharing CBSA (2007)
Bru
ce D
. Bak
er, A
EF
A 2
009
Bru
ce D
. Bak
er, A
EF
A 2
009
$3,000
$3,500
$4,000
$4,500
$5,000
$5,500
$6,000
$6,500
Elementary Middle Senior Mean
Grade Level
Per
Pu
pil
Exp
end
itu
re
Houston City
Houston CBSA
$3,000
$3,500
$4,000
$4,500
$5,000
$5,500
$6,000
$6,500
Elementary Middle Senior Mean
Grade Level
Per
Pu
pil
Exp
end
itu
re
Dallas City
Dallas CBSA
Ft Worth City
Ft Worth CBSA
$3,000
$3,500
$4,000
$4,500
$5,000
$5,500
$6,000
$6,500
Elementary Middle Senior Mean
Grade Level
Per
Pu
pil
Exp
end
itu
re
Austin City
Austin CBSA
$3,000
$3,500
$4,000
$4,500
$5,000
$5,500
$6,000
$6,500
Elementary Middle Senior Mean
Grade Level
Per
Pu
pil
Exp
end
itu
re
San Antonio City
San Antonio CBSA
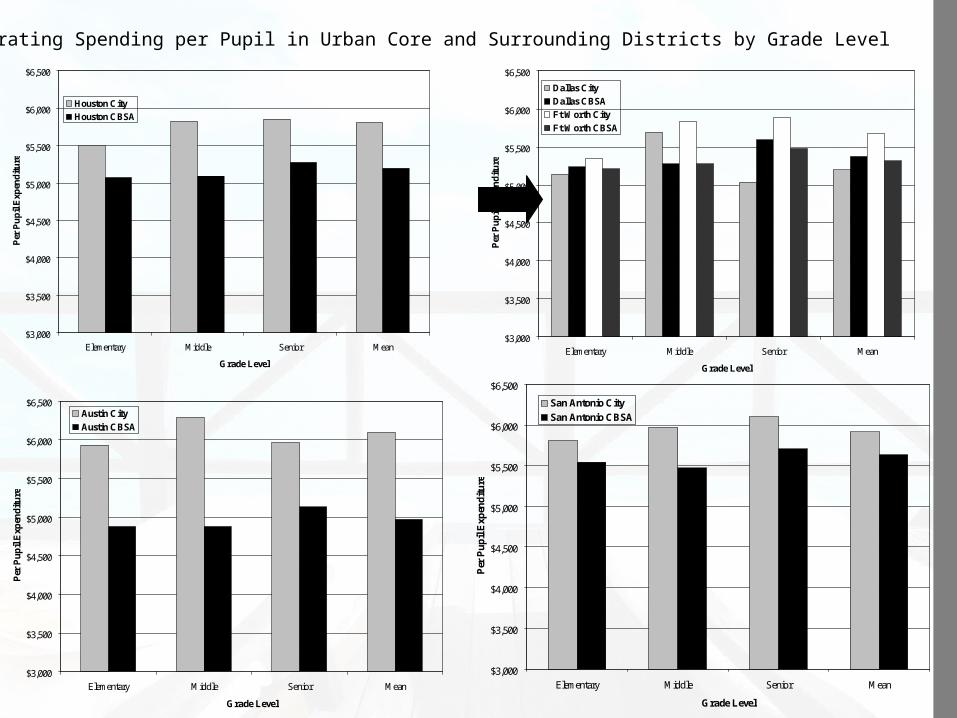
Figure 2Current Operating Spending per Pupil in Urban Core and Surrounding Districts by Grade Level
Bru
ce D
. Bak
er, A
EF
A 2
009

Bru
ce D
. Bak
er, A
EF
A 2
009
0%
5%
10%
15%
20%
25%
30%
Dallas Ft. Worth Houston Austin San Antonio
City District
Per
cen
t F
aile
d P
edag
ogy
Exa
m
CBSA
City District
0%
5%
10%
15%
20%
25%
30%
Dallas Ft. Worth Houston Austin San Antonio
City District
% N
ovic
e T
each
ers
CBSA
City District
10
11
12
13
14
15
16
17
18
Dallas Ft. Worth Houston Austin San Antonio
City District
Pu
pil
to T
each
er R
atio
CBSA
City District
Figure 3Teacher Characteristics in Urban Core and Surrounding Districts (Elementary Schools)
Bru
ce D
. Bak
er, A
EF
A 2
009

Bru
ce D
. Bak
er, A
EF
A 2
009
Table 2Models of Current Spending and Teacher Characteristics in Texas Cities
*p<.05, **p<.10
Bru
ce D
. Bak
er, A
EF
A 2
009
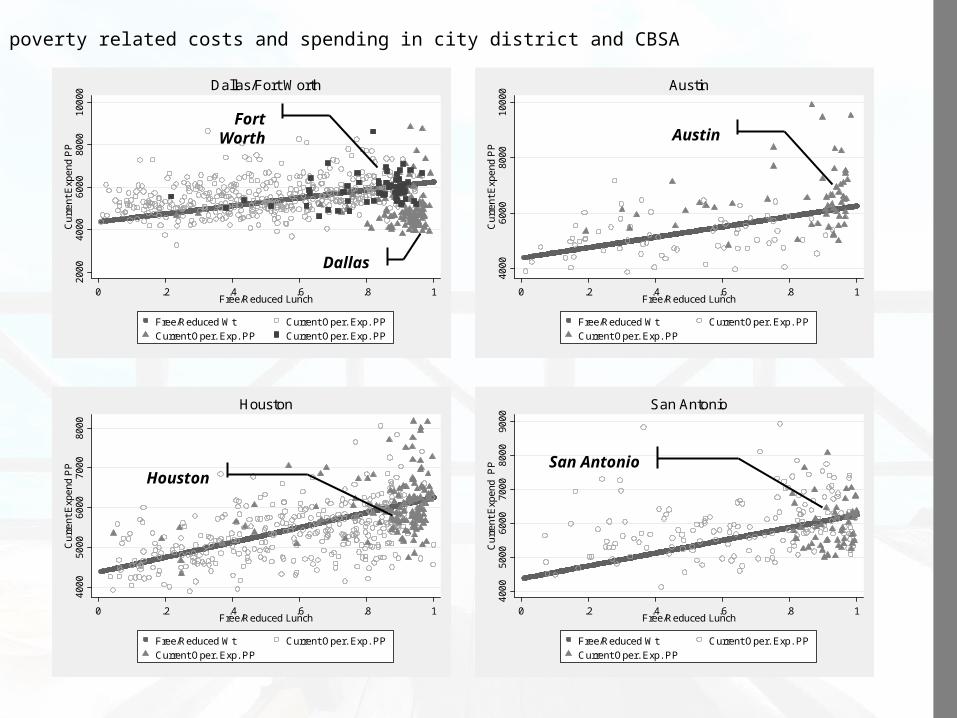
Houston’s allocation is least sensitive to poverty among the districts in the analysis.
Coef. Std. Err. P>t Coef. Std. Err. P>t Coef. Std. Err. P>t Coef. Std. Err. P>t Coef. Std. Err. P>t Coef. Std. Err. P>t
Dallas% Disability 0.270 0.535 -0.907 0.558 -0.636 0.395 -1.014 0.249 * 0.109 0.278 -14.553 4.743 *% At Risk 0.190 0.200 0.201 0.216 0.344 0.141 * 0.341 0.073 * 0.184 0.061 * -1.595 1.199% LEP/ELL -0.341 0.068 * -0.360 0.073 * -0.333 0.080 * -0.118 0.043 * 0.259 0.039 * 1.849 0.936 **Enroll 100 to 300 0.332 0.090 * 0.376 0.087 * 0.056 0.032 ** -0.013 0.021 -4.474 0.547 *Enroll 300 to 500 0.200 0.039 * 0.195 0.041 * 0.053 0.019 * -0.009 0.016 -2.213 0.297 *Year = 2006 0.036 0.010 * 0.032 0.010 * 0.024 0.010 * 0.008 0.007 -0.017 0.009 ** 0.386 0.112 *Year = 2007 -0.026 0.011 * -0.027 0.012 * -0.022 0.012 ** 0.018 0.010 ** 0.004 0.013 -0.359 0.167 *Constant 8.414 0.207 * 8.425 0.223 * 8.268 0.118 * 0.012 0.065 -0.024 0.055 18.371 1.091 *R-Squared
Fort Worth% Disability 0.688 0.309 * -0.551 0.391 -0.239 0.413 0.468 0.642 -1.019 0.473 * -17.458 4.469 *% At Risk 0.303 0.052 * 0.390 0.065 * 0.505 0.115 * 0.371 0.065 * 0.179 0.080 * -2.548 0.667 *% LEP/ELL -0.065 0.046 -0.081 0.049 -0.101 0.067 -0.124 0.079 -0.086 0.065 0.437 0.675Enroll 100 to 300 0.255 0.041 * 0.261 0.043 * -0.065 0.037 ** -0.041 0.062 -2.664 0.636 *Enroll 300 to 500 0.109 0.015 * 0.112 0.017 * -0.024 0.026 0.017 0.021 -0.989 0.201 *Year = 2006 -0.012 0.008 -0.023 0.008 * -0.032 0.010 * 0.005 0.009 -0.029 0.010 * 0.370 0.124 *Year = 2007 0.040 0.011 * 0.030 0.011 * 0.008 0.012 0.001 0.010 -0.019 0.013 0.158 0.199Constant 8.318 0.041 * 8.262 0.058 * 8.164 0.088 * -0.096 0.063 0.184 0.070 * 20.562 0.553 *R-Squared
Houston% Disability 1.238 0.223 * -0.432 0.291 -0.342 0.285 0.305 0.360 -0.642 0.316 * -15.573 4.168 *% At Risk 0.118 0.042 * 0.090 0.041 * 0.122 0.041 * 0.409 0.044 * 0.106 0.048 * 0.001 0.795% LEP/ELL -0.013 0.033 0.006 0.031 -0.023 0.033 -0.106 0.052 ** 0.003 0.049 -0.203 0.557Enroll 100 to 300 0.157 0.021 * 0.157 0.024 * -0.023 0.055 0.004 0.052 -2.034 0.579 *Enroll 300 to 500 0.108 0.015 * 0.090 0.014 * -0.010 0.024 0.010 0.024 -0.043 0.318Year = 2006 0.021 0.005 * 0.012 0.005 * 0.022 0.005 * 0.009 0.006 -0.023 0.007 * -0.076 0.112Year = 2007 0.053 0.007 * 0.037 0.007 * 0.043 0.007 * 0.015 0.008 ** -0.022 0.010 * -0.150 0.207Constant 8.413 0.036 * 8.454 0.044 * 8.427 0.044 * -0.071 0.040 ** 0.189 0.041 * 18.241 0.690 *R-Squared
Austin% Disability 1.513 0.272 * -0.470 0.267 ** -0.513 0.519 -0.611 0.218 * -0.429 0.354 -15.050 2.288 *% At Risk 0.299 0.074 * 0.407 0.085 * 0.338 0.094 * 0.251 0.056 * 0.267 0.076 * -1.897 0.687 *% LEP/ELL -0.123 0.102 -0.179 0.103 ** -0.080 0.121 -0.151 0.068 * 0.104 0.096 0.752 0.818Enroll 100 to 300 0.245 0.031 * 0.297 0.040 * 0.006 0.020 0.001 0.036 -2.582 0.263 *Enroll 300 to 500 0.115 0.027 * 0.132 0.026 * -0.026 0.019 0.012 0.022 -1.470 0.262 *Year = 2006 -0.017 0.012 -0.019 0.011 ** -0.019 0.011 ** 0.017 0.006 * 0.005 0.008 0.077 0.138Year = 2007 0.040 0.016 * -0.012 0.015 -0.011 0.020 -0.003 0.009 -0.020 0.016 -0.441 0.158 *Constant 8.349 0.045 * 8.292 0.045 * 8.311 0.066 * 0.034 0.030 0.053 0.040 17.419 0.414 *R-Squared
San Antonio% Disability 1.572 0.305 * -0.016 0.260 -0.142 0.256 0.597 0.535 -0.320 0.416 -15.085 4.173 *% At Risk -0.147 0.137 -0.077 0.122 0.213 0.118 ** 0.074 0.204 0.173 0.126 0.935 1.979% LEP/ELL 0.149 0.050 * 0.217 0.056 * 0.149 0.059 * 0.156 0.114 -0.136 0.073 ** -1.995 0.814 *Enroll 100 to 300 0.256 0.029 * 0.227 0.021 * -0.042 0.048 -0.007 0.030 -2.168 0.409 *Enroll 300 to 500 0.109 0.016 * 0.102 0.015 * 0.036 0.028 -0.002 0.018 -1.088 0.216 *Year = 2006 0.028 0.009 * 0.033 0.009 * 0.030 0.009 * -0.017 0.010 0.019 0.011 ** 0.299 0.166 **Year = 2007 0.009 0.009 0.022 0.009 * 0.016 0.010 -0.017 0.011 0.031 0.014 * 0.029 0.204Constant 8.571 0.133 * 8.487 0.117 * 8.249 0.111 * 0.036 0.206 0.043 0.121 18.062 1.948 *R-Squared
Current Expenditure Models Teacher Characteristics Models
0.293 0.445 0.692
Failed Pedagogy Exam (Tobit, ll=0)
% Novice (Tobit, ll=0)
Pupil to Teacher Ratio
0.196 0.269
0.110 0.054 0.371
0.204 0.125 0.332
0.245 0.051 0.082
0.431
0.656 0.643 0.351
0.663 0.611 0.268
0.568 0.596 0.425
0.487 0.289 0.146
Total Current Operating Expend.
Excludes Special Education Scale Efficient Only
0.463 0.405 0.190

Bru
ce D
. Bak
er, A
EF
A 2
009
4000
4500
5000
5500
Pre
dict
ed C
urre
nt E
xpen
d (n
o S
E)
0 .2 .4 .6 .8 1% Free/Reduced Lunch
Predicted Current Expend (no SE) Predicted Current Expend (no SE)
Predicted Current Expend (no SE)
4000
4500
5000
5500
Pre
dict
ed C
urre
nt E
xpen
d (n
o S
E)
0 .2 .4 .6 .8 1% Free/Reduced Lunch
Predicted Current Expend (no SE) Predicted Current Expend (no SE)
3500
4000
4500
5000
5500
Pre
dict
ed C
urre
nt E
xpen
d (n
o S
E)
0 .2 .4 .6 .8 1% Free/Reduced Lunch
Predicted Current Expend (no SE) Predicted Current Expend (no SE)
4200
4400
4600
4800
5000
5200
Pre
dict
ed C
urre
nt E
xpen
d (n
o S
E)
0 .2 .4 .6 .8 1% Free/Reduced Lunch
Predicted Current Expend (no SE) Predicted Current Expend (no SE)
Dallas CBSA
Ft. Worth
ISD
Dallas ISD
Houston ISD
Houston CBSA
Austin CBSA
Austin ISD
San Antonio CBSA
San A
ntonio
ISD
Figure 4Predicted spending by poverty for scale-efficient elementary schools
Bru
ce D
. Bak
er, A
EF
A 2
009

Bru
ce D
. Bak
er, A
EF
A 2
009
Dallas & Mesquite ISDPer Pupil Spending(elementary schools)
Dallas & Mesquite ISD% Free/Reduced Lunch(elementary schools)
Figure 5Proximity of City Elementary Schools to Neighbors (Dallas City and CBSA)
Bru
ce D
. Bak
er, A
EF
A 2
009

Bru
ce D
. Bak
er, A
EF
A 2
009
Coef. Std. Err. P>z Coef. Std. Err. P>zPotential Cost Factors
% Proficient (Grades 3 & 4) 0.543 0.207 * 0.355 0.177 *% Disability 1.376 0.122 *% Free/Reduced 0.323 0.060 * 0.328 0.053 *Enroll 100 to 300 0.197 0.033 * 0.203 0.034 *Enroll 300 to 500 0.131 0.009 * 0.116 0.009 *
District Mean Efficiency FactorsDistrict Students per School 0.046 0.017 * 0.013 0.016District CBSA Enrollment Share 0.343 0.065 * 0.234 0.056 *
YearYear = 2006 0.007 0.006 0.005 0.005Year = 2007 0.025 0.008 * 0.017 0.006 *
CBSA Fixed EffectsAustin -0.003 0.012 -0.045 0.011 *San Antonio 0.001 0.011 -0.015 0.011Dallas 0.007 0.009 0.003 0.008
Constant 5.502 0.931 * 6.544 0.809 *Partial FHansen J (p-value)
Includes Special Education
Excludes Special Education
0.82728.38023.600
0.565
Table 3Global Cost Model
Estimated using instrumental variables, where excluded instruments include (a) the mean percent black students among all other (excl. observation) elementary schools in the same district and (b) the ratio of the elementary school aged population in the district to the adult population of the district (from Census 2000). These instruments prove to be relevant instruments, and strong ones, which also pass tests for over-identification. *p<.05, **p<.10 B
ruce
D. B
aker
, AE
FA
200
9
Bru
ce D
. Bak
er, A
EF
A 2
009
4000
5000
6000
7000
8000
9000
Cur
rent
Exp
end
PP
0 .2 .4 .6 .8 1Free/Reduced Lunch
Free/Reduced Wt Current Oper. Exp. PP
Current Oper. Exp. PP
San Antonio
4000
5000
6000
7000
8000
Cur
rent
Exp
end
PP
0 .2 .4 .6 .8 1Free/Reduced Lunch
Free/Reduced Wt Current Oper. Exp. PP
Current Oper. Exp. PP
Houston
4000
6000
8000
1000
0C
urre
nt E
xpen
d P
P
0 .2 .4 .6 .8 1Free/Reduced Lunch
Free/Reduced Wt Current Oper. Exp. PP
Current Oper. Exp. PP
Austin20
0040
0060
0080
0010
000
Cur
rent
Exp
end
PP
0 .2 .4 .6 .8 1Free/Reduced Lunch
Free/Reduced Wt Current Oper. Exp. PP
Current Oper. Exp. PP Current Oper. Exp. PP
Dallas/Fort Worth
Dallas
Fort Worth Austin
HoustonSan Antonio
Figure 6Predicted poverty related costs and spending in city district and CBSA
Bru
ce D
. Bak
er, A
EF
A 2
009

Bru
ce D
. Bak
er, A
EF
A 2
009
Table 4Factors associated with Cost Adjusted current spending
*p<.05, **p<.10
Coef. Std. Err. P>t Coef. Std. Err. P>t
Dallas% Disability -1.252 0.732 ** -1.314 0.744 **% At Risk -0.244 0.199 -0.192 0.210% LEP/ELL -0.256 0.081 * -0.322 0.087 *Enroll 100 to 300 0.035 0.049 0.069 0.049Enroll 300 to 500 0.066 0.036 ** 0.065 0.038 **Constant 8.830 0.215 * 8.713 0.225 *R-Squared
Fort Worth% Disability -0.274 0.462 -0.287 0.521% At Risk -0.131 0.081 -0.046 0.083% LEP/ELL 0.106 0.059 ** 0.059 0.061Enroll 100 to 300 0.146 0.064 * 0.155 0.073 *Enroll 300 to 500 0.006 0.020 0.033 0.021Constant 8.704 0.070 * 8.527 0.077 *R-Squared
Houston% Disability -0.098 0.302 -0.395 0.357% At Risk -0.170 0.049 * -0.187 0.051 *% LEP/ELL 0.017 0.040 0.001 0.041Enroll 100 to 300 -0.062 0.024 * -0.069 0.043Enroll 300 to 500 -0.027 0.021 -0.029 0.021Constant 8.791 0.044 * 8.688 0.051 *R-Squared
Austin% Disability 0.858 0.349 * -0.149 0.385% At Risk -0.161 0.093 ** 0.016 0.094% LEP/ELL 0.014 0.113 -0.133 0.110Enroll 100 to 300 0.037 0.040 0.046 0.042Enroll 300 to 500 -0.005 0.027 0.020 0.028Constant 8.750 0.049 * 8.574 0.049 *R-Squared
San Antonio% Disability 0.303 0.350 0.281 0.313% At Risk -0.378 0.167 * -0.304 0.155 **% LEP/ELL 0.151 0.060 * 0.197 0.077 *Enroll 100 to 300 0.076 0.026 * 0.035 0.028Enroll 300 to 500 -0.010 0.021 -0.002 0.019Constant 8.848 0.155 * 8.645 0.145 *R-Squared
0.179 0.116
0.212 0.185
0.171 0.159
0.150 0.181
Adj. Current Expend (Incl. Sped)
Adj. Current Expend (Excl. Sped)
0.227 0.245
Bru
ce D
. Bak
er, A
EF
A 2
009
Dallas “underfunds” schools which have more students with disabilities (relative to cost model)
Houston “underfunds” higher poverty schools relative to marginal costs of equal opportunity (average outcomes)
Ft. Worth and Austin achieve neutrality (statistically) with respect to marginal costs related to poverty concentrations

Bru
ce D
. Bak
er, A
EF
A 2
009
Table 5Cost Adjusted Mean School Level Expenditures
Mean St.Dev. CV Mean St.Dev. CVDallas
CBSA 5,772.8 695.3 12% 4,904.3 598.6 12%District 4,603.1 780.8 17% 4,160.9 744.1 18%
Ft. WorthCBSA 5,542.2 886.1 16% 4,740.5 719.3 15%District 5,545.8 387.3 7% 4,922.4 368.5 7%
HoustonCBSA 5,628.0 598.4 11% 4,765.4 435.9 9%District 5,654.6 499.7 9% 4,879.9 451.6 9%
AustinCBSA 5,515.2 718.0 13% 4,696.2 484.5 10%District 5,971.0 601.8 10% 5,027.0 415.1 8%
San AntonioCBSA 5,862.6 721.8 12% 4,982.0 514.6 10%District 5,229.7 347.5 7% 4,616.9 261.2 6%
Adjusted Current Expend (with SE)
Adjusted Current Expend (No SE)
Parity in Houston & Ft. Worth
Deficits in Dallas & San Antonio
Deficits in Dallas & San Antonio
Surplus in Austin

Bru
ce D
. Bak
er, A
EF
A 2
009
Conclusions/Policy Implications
• Austin and Ft. Worth ISD seem to be best targeting resources on the basis of school level poverty, but are also reasonably well positioned to do so.
• Houston has accomplished a relatively flat distribution, whereby the Houston poverty slope is lower than the marginal cost slope. In this sense, Houston’s WSF has actually worked against the goal of providing equal educational opportunity.
• Dallas appears to be resource constrained when considering only elementary school budgets. These constraints severely limit Dallas’ re-allocation options. It’s like …– Dallas appears to fund middle schools well, but also allocates less to
high schools– District level finance data provide conflicting evidence regarding
available resources in Dallas
Bru
ce D
. Bak
er, A
EF
A 2
009

Bru
ce D
. Bak
er, A
EF
A 2
009
Coef. Std. Err. P>z Coef. Std. Err. P>zPotential Cost Factors
% Proficient (Grades 3 & 4) 0.589 0.243 * 0.351 0.191 **% Disability 1.346 0.150 *% Free/Reduced 0.347 0.086 * 0.323 0.069 *% LEP -0.034 0.038 0.005 0.029Enroll 100 to 300 0.197 0.033 * 0.203 0.033 *Enroll 300 to 500 0.129 0.009 * 0.116 0.008 *
District Mean Efficiency FactorsDistrict Students per School 0.033 0.019 ** 0.011 0.018District CBSA Enrollment Share 0.305 0.082 * 0.229 0.070 *Wage Index (Taylor, 2004) 0.229 0.156 0.021 0.148
YearYear = 2006 0.006 0.007 0.005 0.006Year = 2007 0.023 0.009 * 0.017 0.007 *
CBSA Fixed EffectsAustin 0.003 0.013 -0.045 0.012 *San Antonio -0.006 0.015 -0.015 0.013Dallas 0.007 0.010 0.003 0.008
Constant 5.098 1.086 * 6.550 0.871 *Partial FHansen J (p-value) 0.306 0.804
Includes Special Education
Excludes Special Education
18.410 25.420
Table A1Alternative Global Cost Model with District Level Wage Adjustment
Estimated using instrumental variables, where excluded instruments include (a) the mean percent black students among all other (excl. observation) elementary schools in the same district and (b) the ratio of the elementary school aged population in the district to the adult population of the district (from Census 2000). These instruments prove to be relevant instruments, and strong ones, which also pass tests for over-identification. *p<.05, **p<.10
Bru
ce D
. Bak
er, A
EF
A 2
009
Bru
ce D
. Bak
er, A
EF
A 2
009
Bru
ce D
. Bak
er, A
EF
A 2
009
District NameTotal Enrollment
Relative Poverty
Relative Current
Spending District NameTotal Enrollment
Relative Poverty
Relative Current
Spending
BOSTON 57,349 3.48 1.58 OAKLAND UNIFIED 48,135 2.15 1.14PITTSBURGH SCHOOL DISTRICT 32,506 2.06 1.54 DUVAL COUNTY SCHOOL DISTRICT 126,662 1.47 1.13NEWARK CITY 41,857 3.09 1.50 MILWAUKEE 92,395 7.38 1.13CINCINNATI CITY SCHOOL DISTRICT 36,872 2.63 1.48 DALLAS INDEPENDENT SCHOOL DISTRIC 161,244 2.50 1.13DISTRICT OF COLUMBIA PUBLIC SCHOO 59,616 3.66 1.46 DETROIT CITY SCHOOL DISTRICT 133,255 2.46 1.13ATLANTA CITY SCHOOL DISTRICT 50,770 2.50 1.44 SAN JOSE UNIFIED 31,646 1.12 1.10BUFFALO CITY SCHOOL DISTRICT 36,706 3.98 1.42 STOCKTON CITY UNIFIED 38,936 1.71 1.09INDIANAPOLIS PUBLIC SCHOOLS 38,142 2.75 1.37 FRESNO UNIFIED 79,046 2.17 1.09PHOENIX UNION HIGH SCHOOL DISTRIC 25,010 1.76 1.36 JEFFERSON COUNTY SCHOOL DISTRICT 98,537 1.29 1.08MINNEAPOLIS 38,538 2.59 1.35 OMAHA PUBLIC SCHOOLS 46,686 3.48 1.07TOLEDO CITY SCHOOL DISTRICT 30,423 2.98 1.33 HOUSTON INDEPENDENT SCHOOL DISTRI 210,292 1.74 1.07ST LOUIS CITY 40,841 3.26 1.33 CORPUS CHRISTI INDEPENDENT SCHOOL 39,213 1.49 1.06KANSAS CITY SCHOOL DISTRICT 34,730 3.13 1.30 SANTA ANA UNIFIED 59,310 1.71 1.06ST. PAUL 41,274 2.44 1.30 BAKERSFIELD CITY ELEMENTARY 27,890 1.70 1.05COLUMBUS CITY SCHOOL DISTRICT 58,961 3.00 1.29 EAST SIDE UNION HIGH 25,817 1.23 1.05NASHVILLE-DAVIDSON COUNTY SCHOOL 72,713 1.80 1.28 ANAHEIM UNION HIGH 33,112 1.23 1.05DENVER COUNTY 1 72,312 2.54 1.26 ANAHEIM ELEMENTARY 20,690 1.58 1.03COLORADO SPRINGS 11 30,959 1.38 1.26 BALTIMORE CITY PUBLIC SCHOOL SYST 87,643 4.53 1.03PORTLAND SCHOOL DISTRICT 1J 47,089 1.54 1.25 CHARLOTTE-MECKLENBURG SCHOOLS 123,789 1.29 1.03LOS ANGELES UNIFIED 727,319 1.33 1.24 ALIEF INDEPENDENT SCHOOL DISTRICT 47,595 1.41 1.03MEMPHIS CITY SCHOOL DISTRICT 120,275 2.35 1.23 VIRGINIA BEACH CITY PUBLIC SCHOOL 74,303 1.51 1.02TULSA 41,568 2.33 1.22 EL PASO INDEPENDENT SCHOOL DISTRI 63,811 1.11 1.02CLEVELAND MUNICIPAL SCHOOL DISTRI 58,788 3.26 1.20 ALBUQUERQUE PUBLIC SCHOOLS 94,022 1.49 1.01SEATTLE 46,085 1.57 1.20 CITY OF CHICAGO SCHOOL DISTRICT 2 420,982 2.61 0.99WICHITA USD 259 48,547 2.02 1.19 LONG BEACH UNIFIED 93,589 1.18 0.95SACRAMENTO CITY UNIFIED 50,408 1.46 1.17 NYC-CHANCELLOR'S OFFICE 1,014,058 2.05 0.94OKLA CITY 40,322 2.48 1.17 CARTWRIGHT ELEMENTARY DISTRICT 20,310 1.40 0.92AUSTIN INDEPENDENT SCHOOL DISTRIC 81,155 3.12 1.16 SAN FRANCISCO UNIFIED 56,236 1.86 0.89FORT WORTH INDEPENDENT SCHOOL DIS 80,336 2.10 1.15 ADAMS-ARAPAHOE 28J 33,301 1.62 0.88SAN DIEGO CITY UNIFIED 132,482 1.40 1.15 PHILADELPHIA CITY SCHOOL DISTRICT 184,560 4.75 0.79SAN ANTONIO INDEPENDENT SCHOOL DI 56,422 1.80 1.14
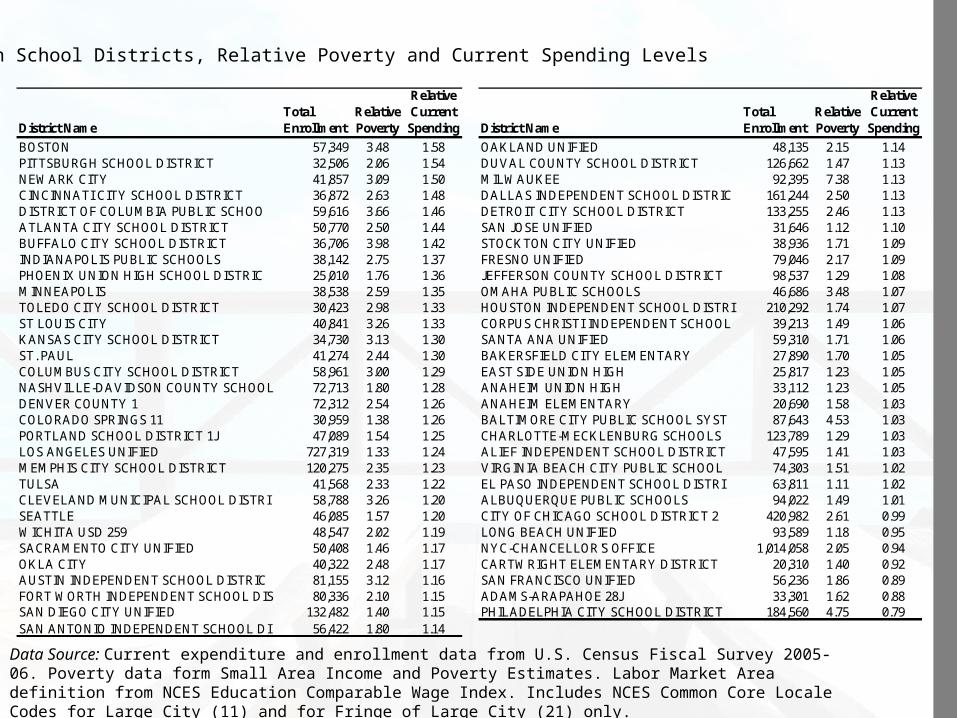
Table BMajor Urban School Districts, Relative Poverty and Current Spending Levels
Data Source: Current expenditure and enrollment data from U.S. Census Fiscal Survey 2005-06. Poverty data form Small Area Income and Poverty Estimates. Labor Market Area definition from NCES Education Comparable Wage Index. Includes NCES Common Core Locale Codes for Large City (11) and for Fringe of Large City (21) only.