Embed Size (px)
Citation preview

29© 2004 The Anthropological Society of Nippon
ANTHROPOLOGICAL SCIENCE
Vol. 112, 29-40, 2004
Post-Pleistocene diachronic change in East Asian facial skeletons: the size, shape and volume of the orbits
PETER BROWN1,2*, TOMOKO MAEDA1
Department of Anatomy and Anthropology, Tohoku University School of Medicine, Sendai, Japan,1
Palaeoanthropology, School of Human & Environmental Studies, University of New England, Armidale, NSW 2351, Australia2
Received 14 April 2003; accepted 18 July 2003
Abstract Globally there was a reduction in the size and robusticity of the human orofacial skeletonand dentition after the Pleistocene. There was also diachronic change in brain size and skeletal massin general. Anthropologists have developed numerous models in explanation of the evolutionary pro-cess, with the majority linked to the cultural developments of the Neolithic. These cultural models arechallenged by the skeletal evidence from societies with contrasting culture histories. In China there isa reduction in facial breadth, height and prognathism, posterior tooth size, brain volume and cranialrobusticity from the Neolithic to the modern period. However, the height of the orbits increases ratherthan decreases. Examination of the structural relationships between orbit and facial dimensions inTohoku Japanese and Australian Aboriginal crania suggests a steady reduction in orbit volume inChina. This may have resulted in a more anterior placement of the eyeball and associated structuresin modern East Asians than in their Neolithic counterparts.
Key words: Post-Pleistocene, Neolithic, China, human facial skeleton, orbit
Introduction
For our own species there is now a considerable body ofdata describing an apparently global trend for directionalreduction in body mass, skeletal size and robusticity, andtooth size in the post-Pleistocene period. Preservation and agreater understanding of the genetic and phenotypic contri-butions to tooth size has resulted in a concentration on dentalmetrics, with claims for dental reduction in Europe (Frayer,1978; Formicola, 1987; y’Edynak, 1989), South and EastAsia (Brace et al., 1984; Kennedy, 1984; Lukacs, 1984),Eastern Mediterranean, Africa and the Levant (Le Blanc andBlack, 1974; Calcagno, 1986; Smith et al., 1986), Mexico(Christensen, 1998) and Australia (Brown, 1992a). Impor-tantly, however, where the oro-facial skeleton, cranial vaultand other parts of the skeleton are also present it appears thatthere has been a significant reduction in the entire mastica-tory system, brain volume, and skeletal mass in general(Carlson, 1976; Carlson and Van Gervan, 1977; Smith et al.,1984, 1985, 1986; Brown, 1987, 1992b; Henneberg andSteyn, 1993).
While there is general agreement as to the presence of thisdiachronic trend, there is considerable debate as to the evo-lutionary mechanism involved. In part this reflects a concen-tration of many researchers on a single aspect of our skeletal,or dental, system rather than considering the organism as awhole. The majority of anthropologists have argued for
some connection between cultural development and theobserved changes in phenotype. This is particularly true forthe masticatory system, where the focus has been on therelaxation of selection for large tooth size associated withthe cooking of food (Brace and Mahler, 1971; Le Blanc andBlack, 1974; Carlson and Van Gervan, 1977; y’Edynak,1978; Calcagno, 1986; Calcagno and Gibson, 1988; Jacobs,1994). Others have argued that the diachronic trend inhuman dental proportions is secondary to a change in bodysize (Sofaer et al., 1971; Sofaer, 1973), with either a reduc-tion in the developmental areas available for teeth, or someallometric scaling effect.
One of the more intriguing aspects of the evidence forpost-Pleistocene change is that at a global level there aresimilar alterations in craniofacial proportions, and theseevents occur over the same time period. As cultural develop-ments do not have similar levels of global coordination, thisprovides both a test, and a challenge, for cultural explana-tions of the evolutionary process (Brown, 1992b). Whileresearch has focused on the diachronic trend for tooth size,and to a lesser degree body size, there are associated changesin the facial skeleton which are both unexpected and unex-plained. In Australia (Brown, 1992b), North Africa (Cal-cagno, 1986; Calcagno and Gibson, 1988) and East Asia(Brown, 1992b) reducing facial height and prognathism isaccompanied by a relative and absolute increase in orbitheight and a decrease in orbit breadth. The functional impli-cations of these changes in orbit dimensions have not previ-ously been explored. This paper will consider diachronicchange in the size, shape and volume of the orbits in the con-text of the post-Pleistocene period in China. The fragile andoften incomplete preservation of the posterior orbital plate in
* Corresponding author. e-mail: [email protected]
Published online 16 April 2004in J-STAGE (www.jstage.jst.go.jp) DOI: 10.1537/ase.00072

30 P. BROWN AND T. MAEDA ANTHROPOLOGICAL SCIENCE
the Chinese Neolithic samples prevented the direct measure-ment of orbital volume in these crania. Therefore, the struc-tural associations between orbit volume, and other aspects oforbit size and shape, are first examined in two skeletallycontrasting modern human populations; Australian Aborigi-nes and Tohoku Japanese. These two groups were selectedas the differences in their average facial proportions parallelthose between early Neolithic and modern populations inChina. The Australians having size and shape relationshipswhich are similar to generalized early Neolithic populations.
Materials and Methods
MaterialsEvidence of diachronic change in China was provided by
an extended sequence of Neolithic crania, predominantlyYangshao and Lungshan, dating to between 7000 and 2000years BP, and a comparative northern Chinese modern sam-ple (Table 1). These crania are in the collections of the Insti-tute of Archaeology, Chinese Academy of Social Science,and the Institute of Vertebrate Paleontology and Paleoan-thropology, Academia Sinica, Bejing. Observations on all ofthese were recorded by PB. In order to maximize samplesizes and facilitate examination of diachronic change, theskeletons from these sites were grouped into 1000 year inter-vals. These raw data are available at Brown (1998–2003).
Examination of the relationship between dimensions ofthe orbits and orofacial skeleton was made through a com-parison of Australian Aboriginal and Tohoku Japanese cra-nia. These two groups were chosen due to their contrastingorbit dimensions, craniofacial proportions and tooth size.The Australian Aboriginal crania, 19 male and 16 female,are in the collection of the Natural History Museum, Lon-don. These crania were collected between 1890 and 1930,mainly from south-eastern Australia. Selected crania wereprimarily from young adults, without extensive tooth lossand alveolar resorption due to acute tooth wear. Sex wasdetermined through an examination of cranial morphology,and the use of discriminant function analysis, as described inBrown (1989).
The Tohoku Japanese crania, 27 males and 17 females,were of known sex and age and form part of the collection inthe Department of Anatomy and Anthropology, Tohoku Uni-versity Medical School. The Tohoku modern collection con-tains approximately 200 crania, which were collectedbetween 1900 and 1942, along with records giving for each
individual the place and date of birth, as well as date andcause of death. Most of them were born in the Tohoku dis-trict of northern Japan. An additional 20 crania from this col-lection were used to test the accuracy of regressionequations.
MethodsStandard osteometric instruments and measurements were
used to record dimensions of the cranial vault and orofacialskeleton. These follow the descriptions in Brown (1989),with the majority drawn from Martin and Saller (1957).Orbital breadth and height follow the procedures in Bass(1971, page 69). Procedures were devised for measuring thevolume of the orbit, and the area of the orbital aperture asdefined by its margins. Where preservation allowed, thesewere recorded from the right orbit, as were orbital height andbreadth.
Orbit volume was measured with mustard seed. The lacri-mal duct, orbital fissures, and infraorbital duct (if open)were first covered with thin mending tape, and the opticforamen filled with a standardized piece of cotton wool. Theorbit was then filled with mustard seeds level with the orbitalmargins, represented by a line at which the walls of the orbitmeet the anterior aspect of the bone forming the rim(Schultz, 1940). Mustard seed volume was measured to thenearest 0.5 ml with a standard volumetric cylinder, and thenthis measurement procedure was repeated. If the differencebetween the two trials did not exceed 0.5 ml, the first mea-surement was accepted; otherwise the average of the two tri-als was used. This decision was based on the results of theobserver error trial described below.
Orbit area was measured from standardized digital photo-graphs of the right orbit. A 100 mm2 scale, suspended onstrands of thread, was placed in the middle of the orbit, levelwith the inferior and superior orbital margins. A high resolu-tion digital photograph was taken of the orbit and transferredto a computer. The image was opened with Adobe Illustrator9 software (Adobe Systems Incorporated) and the outline ofthe orbital margin, and 100 mm2 scale, traced with the beziercurve pen tool. The background image of the orbit was thendeleted, and the area of the orbit and scale measured withScion Image 4 software (Scion Corporation). The area of thescale was used to correct the area of the orbit for photo-graphic enlargement, and the life size area calculated.
Prior to significance testing all data were examined fordistributional normality and the presence of outliers, using
Table 1. The Neolithic and modern Chinese male samples
Location N Date range Dating methods References
Baoji, Huaxian 21 �5,500 �6,500 14C charcoal and wood 1, 2, 3Hejiawan, Xixiahou, Changzhi, Dawenkou, Hemudu, Jiangzhai
15 �4,500 �5,500 14C charcoal, wood, and bone 1, 4, 6
Miaodigou, Wangying 29 �3,500 �4,500 14C charcoal, wood, and bone 1, 5Xiaxihe, Xiawanggang, Yingxu, Yanbulaka, Xunhua, Yangshan
77 �2,500 �3,500 14C charcoal and wood 1, 7, 8
Modern north China 37 9
Details of the samples and radiocarbon dating of each of the Neolithic localities can be found in 1: The Institute of Archaeology (1991), 2: Yanet al. (1960), 3: Yan (1962), 4: Yan (1972, 1973), 5: Han and Pan (1979), 6: Han and Pan (1983), 7: Han (1990), 8: Wu and Zhang (1985), 9: Black(1928).

POST-PLEISTOCENE EAST ASIAN FACIAL SKELETON 31Vol. 112, 2004
normal probability plots, stem and leaf plots, and the Sha-piro-Wilk statistic (Brown, 1989). Two of the Tohoku Japa-nese “females” were extreme outliers in terms of their shapeand size characteristics. As there was some doubt as to theaccuracy of their documented age and sex they wereexcluded from the analysis. Where a significant difference ingroup variance was indicated by Levene’s F-test, t-tests werecalculated using separate variance estimates. The pattern ofassociation between variables was examined using Pear-son’s correlation coefficient, scatter plots, single and multi-ple regressions, and plots of residuals. Statisticalcalculations were performed using SYSTAT 10 (Systat,2002) and SPSS 11 (SPSS, 1990).
Observer errorOrbit volume and area were recorded on 20 of the Tohoku
Japanese crania on two different occasions, separated byseven days. These were blind trials with the entire proce-dures repeated. Results were compared using paired t-testsand Pearson’s correlation coefficient (Table 2). Recordingorbit volume and area involved some measurement error;however, the differences between the trial means were smalland insignificant, and the two sets of results highly corre-lated. Measurement errors of ±19.04 mm2 for orbit area, and±0.35 ml for orbit volume, were considered acceptable giventhe scale of the original measurements, and the magnitude ofthe population differences discussed below.
Results
Diachronic change in ChinaTable 3 shows summary statistics for the Chinese
Neolithic and recent samples, with Figure 1 displaying boxplots of the distributions of some additional indicators ofcranial size, robusticity and tooth size. Average facial pro-portions, in lateral view, for early Neolithic and modern Chi-nese males are compared in Figure 2.
From the early Neolithic to the recent period there is atrend towards reducing endocranial volume and cranial
Table 2. Observer error in 20 blind repeats of orbital area and orbital volume measurements with Tohoku Japanese crania
N=20 Areatrial 1
Areatrial 2
Volume trial 1
Volume trial 2
Area difference
Volume difference
mean 1157.6 1158.3 23.8 24.1 31.5 0.60s.d. 103.62 112.64 2.67 2.57 19.04 0.35
Mean difference s.d. difference t P r P
Area trials31.5 19.04 �0.082 0.936 0.94 0.000
Volume trials0.60 0.35 �1.322 0.202 0.97 0.000
Descriptive statistics, paired t-test, and Pearson’s correlation coeffi-cient.
Table 3. Descriptive statistics and significance tests for the Chinese Neolithic and modern male facial dimensions
Dimension Samples N Mean s.d. F (sample pairs) P t (sample pairs) P
Basion-nasion 1 6.5–5.5 kyr 12 106.5 3.52 (1–2) 4.14 .055 (1–2) 0.82 .4212 5.5–4.5 kyr 11 104.5 7.39 (2–3) 2.78 .107 (2–3) �0.02 .9853 4.5–3.5 kyr 17 104.6 4.47 (3–4) 0.65 .423 (3–4) 2.25 .0274 3.5–2.5 kyr 69 102.2 3.66 (4–5) 0.05 .824 (4–5) 3.80 .0005 Modern 37 102.1 4.84 (1–5) 0.06 .799 (1–5) �5.67 .000
Basion-prosthion 1 6.5–5.5 kyr 11 105.3 5.78 (1–2) 0.00 .991 (1–2) 0.73 .4722 5.5–4.5 kyr 11 103.5 5.26 (2–3) 0.09 .766 (2–3) 2.61 .0153 4.5–3.5 kyr 16 98.4 4.81 (3–4) 0.42 .518 (3–4) �0.90 .3714 3.5–2.5 kyr 54 99.6 4.59 (4–5) 0.90 .765 (4–5) 4.91 .0005 Modern 35 94.9 4.05 (1–5) 1.23 .272 (1–5) �6.63 .000
Maximum 1 6.5–5.5 kyr 15 107.1 4.06 (1–2) 0.31 .580 (1–2) 0.94 .926supraorbital breadth 2 5.5–4.5 kyr 13 107.0 3.34 (2–3) 0.53 .471 (2–3) 0.05 .956
3 4.5–3.5 kyr 26 106.9 4.39 (3–4) 0.72 .398 (3–4) 2.94 .0044 3.5–2.5 kyr 65 104.2 3.74 (4–5) 0.01 .904 (4–5) 2.35 .0215 Modern 37 102.5 3.48 (1–5) 0.35 .556 (1–5) �4.17 .000
Nasion-prosthion 1 6.5–5.5 kyr 14 75.7 3.96 (1–2) 0.04 .841 (1–2) 0.23 .8222 5.5–4.5 kyr 13 75.4 3.54 (2–3) 4.64 .038 (2–3) �0.13 .8983 4.5–3.5 kyr 24 75.6 6.17 (3–4) 6.64 .012 (3–4) 1.19 .2394 3.5–2.5 kyr 55 73.9 4.28 (4–5) 0.02 .872 (4–5) 0.21 .8275 Modern 35 73.8 3.68 (1–5) 0.36 .548 (1–5) �1.63 .110
Orbital height 1 6.5–5.5 kyr 15 32.8 2.11 (1–2) 0.10 .755 (1–2) �1.14 .2642 5.5–4.5 kyr 13 33.8 2.73 (2–3) 0.21 .642 (2–3) �0.21 .8373 4.5–3.5 kyr 25 34.0 1.82 (3–4) 2.50 .117 (3–4) 0.68 .4944 3.5–2.5 kyr 66 33.6 2.39 (4–5) 1.20 .275 (4–5) �5.70 .0005 Modern 37 36.2 1.95 (1–5) 0.24 .621 (1–5) 5.67 .000
Orbital breadth 1 6.5–5.5 kyr 15 41.1 2.63 (1–2) 0.98 .330 (1–2) 0.25 .8062 5.5-4.5 kyr 13 40.7 3.67 (2–3) 0.76 .387 (2–3) -0.44 .6643 4.5–3.5 kyr 24 41.2 2.41 (3–4) 0.82 .368 (3–4) 0.64 .5184 3.5–2.5 kyr 65 40.8 2.17 (4–5) 1.13 .290 (4–5) 1.35 .1785 Modern 37 40.3 1.71 (1–5) 0.45 .505 (1–5) �1.24 .218

32 P. BROWN AND T. MAEDA ANTHROPOLOGICAL SCIENCE
robusticity (cranial vault thickness and supraorbital breadth)in China. Over the same time period there is a reduction inposterior tooth size, particularly maxillary first molars, withassociated loss of alveolar bone and reduction in lower facialprognathism (basion-prosthion). The rate and extent of thischange in cranial and facial dimensions is greater after 3,500years BP, than before. Facial height, prognathism andsupraorbital breadth reduce substantially over the last 3,500years. However, the height of the orbits increases whilefacial height and prognathism are decreasing (Table 3, Fig-ures 1 and 2). Orbit breadth reduces slightly between theearly Neolithic and recent period. Orbital volumes could notbe directly measured in the Neolithic crania, as the orbitalcavities were often incomplete and remaining sections oforbital plate extremely fragile.
Orbit and facial dimensions in Tohoku Japanese andAustralian Aborigines
Table 4 shows summary statistics for the male and femaleTohoku Japanese and Australian Aboriginal samples, withFigure 3 a comparison of average facial proportions in themale Japanese and Aboriginal samples. Male Aborigineshave significantly larger orofacial skeletons than femalesand this is reflected in measures of facial breadth (supraor-bital breadth and orbit breadth) and projection (basion-nasion and basion-prosthion). Males also have significiantlygreater orbital volumes and areas than females, but there islittle difference in orbit height. Relative to facial height(nasion-prosthion) female Aborigines have relatively higherorbits than males.
The matrix of sex-based differences is broadly similar in
Figure 1. Diachronic change in male cranial and dental dimensions in China.

POST-PLEISTOCENE EAST ASIAN FACIAL SKELETON 33Vol. 112, 2004
Tohoku Japanese to those in Australian Aborigines. MaleJapanese crania have significantly larger orofacial skeletonsthan females. Facial height (nasion-prosthion), projection
(basion-nasion and basion-prosthion), supraorbital breadthand orbital volume are greater in males. Orbit height followsthe same pattern seen in Aborigines, with females havingrelatively high orbits. In contrast to the Aboriginal sample,the differences between the male and female orbit areas arenot significant.
Australian Aboriginal male crania have significantlygreater orbit volumes, supraorbital breadth and lower facialprognathism (basion-prosthion) than Tohoku Japanesemales (Aboriginal male mean gnathic index 101.4, Japanesemale mean gnathic index 96.9). While Aboriginal facialskeletons are more prognathic, they are significantly shorterthan those in Tohoku Japanese, the latter also having signif-icantly taller orbits. Australian Aboriginal orbits are charac-terized by relatively great volume and breadth, and reducedheight. Mean orbit areas are similar between the maleAboriginal and Japanese samples, with the greater height inJapanese orbits compensating for the reduced breadth.
To a great extent the comparison of Tohoku Japanese andAustralian Aboriginal female facial dimensions agrees withthat for the males. Australian Aboriginal female crania havesignificantly greater orbit volumes and facial prognathism(Aboriginal female mean gnathic index 102.6, Japanesefemale mean gnathic index 99.1) (Table 4, Figure 3). TheAustralian females have significantly greater supraorbitalbreadths, and wider orbits, with the Japanese females havingtaller faces and higher orbits. As in males, orbit area differ-ences are minimal.
Orbit and face relationships in Tohoku Japanese andAustralian Aborigines
The pattern of structural relationships between dimen-sions of the orbit and face were explored in the individualsexed samples, and the total pooled sample. Table 5 displaysthe Pearson’s correlation matrix for the pooled sample. In allsamples orbit volume had high levels of correlation withmeasures of facial breadth, particularly supraorbital breadth,and projection, but not with facial height. Orbit area hasreduced levels of correlation with the same variables, and astronger association with facial height. In all of the samplesorbit height appeared to have no consistent relationship withother facial dimensions, while orbit breadth displayed simi-lar relationships to orbit volume and area. Orbit index(orbital height×100/orbital breadth) expresses the relation-ship of height to breadth, with relatively wide orbits obtain-ing a lower score. Most of the correlations involving thisindex are low, and negative, with slightly stronger correla-tions with facial projection and breadth. This reflects bothintra and interpopulation variation, with the broader andmore prognathic faces having a generally lower orbit index.
Several facial breadth dimensions, most notably orbitalbreadth, bi-ectoconchion and supraorbital breadth, cover aclosely related anatomical region and this would haveinflated the level of correlation between them. Orbitalbreadth and bi-ectoconchion also share a common lateralpoint and this would have contributed to their level of corre-lation. While these three dimensions are closely related mea-sures of upper facial breadth, population based variation ininterorbital breadth (bi-lacrimale) increases the complexityof their structural relationship.
Figure 2. Diachronic change in the average size and shape charac-teristics of Chinese male facial skeletons, 6,000 BP to modern. Solidarrows indicate areas of facial reduction, hollow arrows expansion.
Figure 3. Lateral view of the average size and shape characteris-tics of the Australian Aboriginal and Tohoku Japanese male facialskeletons used in this study. Note the size of the orbits, the extent ofupper facial flatness, posterior tooth size, and lower facial prog-nathism. Both are to the same scale.
34 P. BROWN AND T. MAEDA ANTHROPOLOGICAL SCIENCE
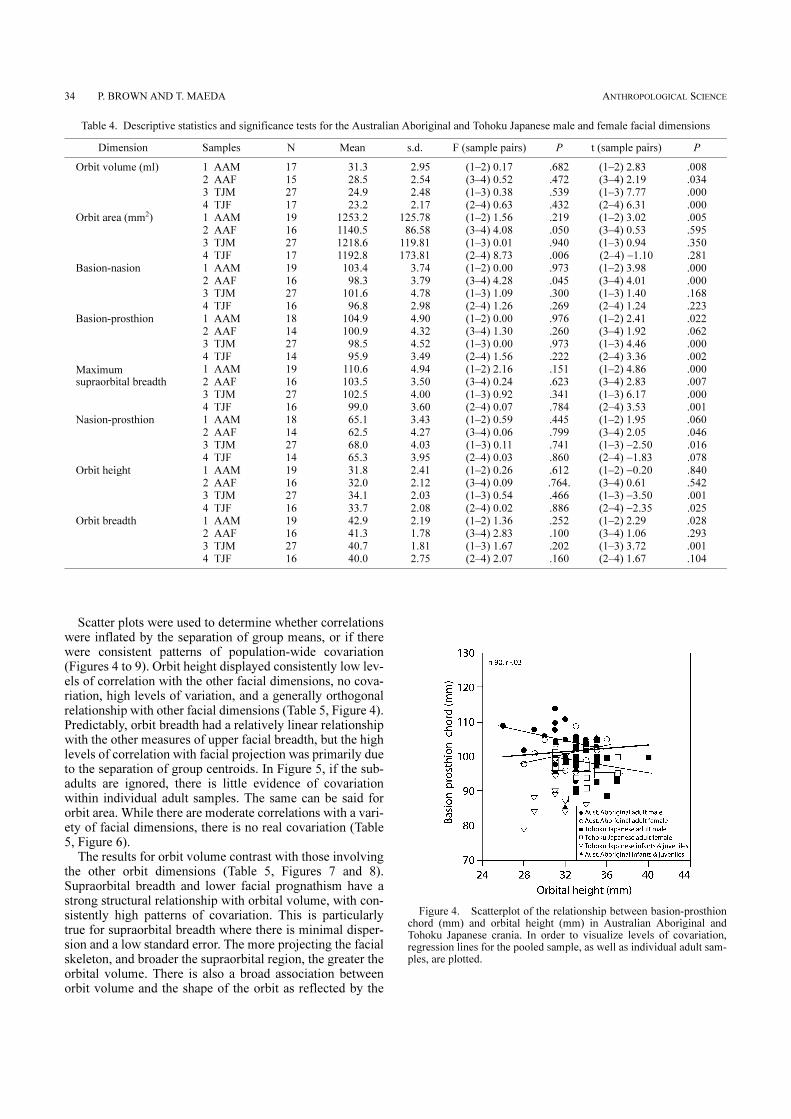
Scatter plots were used to determine whether correlationswere inflated by the separation of group means, or if therewere consistent patterns of population-wide covariation(Figures 4 to 9). Orbit height displayed consistently low lev-els of correlation with the other facial dimensions, no cova-riation, high levels of variation, and a generally orthogonalrelationship with other facial dimensions (Table 5, Figure 4).Predictably, orbit breadth had a relatively linear relationshipwith the other measures of upper facial breadth, but the highlevels of correlation with facial projection was primarily dueto the separation of group centroids. In Figure 5, if the sub-adults are ignored, there is little evidence of covariationwithin individual adult samples. The same can be said fororbit area. While there are moderate correlations with a vari-ety of facial dimensions, there is no real covariation (Table5, Figure 6).
The results for orbit volume contrast with those involvingthe other orbit dimensions (Table 5, Figures 7 and 8).Supraorbital breadth and lower facial prognathism have astrong structural relationship with orbital volume, with con-sistently high patterns of covariation. This is particularlytrue for supraorbital breadth where there is minimal disper-sion and a low standard error. The more projecting the facialskeleton, and broader the supraorbital region, the greater theorbital volume. There is also a broad association betweenorbit volume and the shape of the orbit as reflected by the
Table 4. Descriptive statistics and significance tests for the Australian Aboriginal and Tohoku Japanese male and female facial dimensions
Dimension Samples N Mean s.d. F (sample pairs) P t (sample pairs) P
Orbit volume (ml) 1 AAM 17 31.3 2.95 (1–2) 0.17 .682 (1–2) 2.83 .0082 AAF 15 28.5 2.54 (3–4) 0.52 .472 (3–4) 2.19 .0343 TJM 27 24.9 2.48 (1–3) 0.38 .539 (1–3) 7.77 .0004 TJF 17 23.2 2.17 (2–4) 0.63 .432 (2–4) 6.31 .000
Orbit area (mm2) 1 AAM 19 1253.2 125.78 (1–2) 1.56 .219 (1–2) 3.02 .0052 AAF 16 1140.5 86.58 (3–4) 4.08 .050 (3–4) 0.53 .5953 TJM 27 1218.6 119.81 (1–3) 0.01 .940 (1–3) 0.94 .3504 TJF 17 1192.8 173.81 (2–4) 8.73 .006 (2–4) �1.10 .281
Basion-nasion 1 AAM 19 103.4 3.74 (1–2) 0.00 .973 (1–2) 3.98 .0002 AAF 16 98.3 3.79 (3–4) 4.28 .045 (3–4) 4.01 .0003 TJM 27 101.6 4.78 (1–3) 1.09 .300 (1–3) 1.40 .1684 TJF 16 96.8 2.98 (2–4) 1.26 .269 (2–4) 1.24 .223
Basion-prosthion 1 AAM 18 104.9 4.90 (1–2) 0.00 .976 (1–2) 2.41 .0222 AAF 14 100.9 4.32 (3–4) 1.30 .260 (3–4) 1.92 .0623 TJM 27 98.5 4.52 (1–3) 0.00 .973 (1–3) 4.46 .0004 TJF 14 95.9 3.49 (2–4) 1.56 .222 (2–4) 3.36 .002
Maximum 1 AAM 19 110.6 4.94 (1–2) 2.16 .151 (1–2) 4.86 .000supraorbital breadth 2 AAF 16 103.5 3.50 (3–4) 0.24 .623 (3–4) 2.83 .007
3 TJM 27 102.5 4.00 (1–3) 0.92 .341 (1–3) 6.17 .0004 TJF 16 99.0 3.60 (2–4) 0.07 .784 (2–4) 3.53 .001
Nasion-prosthion 1 AAM 18 65.1 3.43 (1–2) 0.59 .445 (1–2) 1.95 .0602 AAF 14 62.5 4.27 (3–4) 0.06 .799 (3–4) 2.05 .0463 TJM 27 68.0 4.03 (1–3) 0.11 .741 (1–3) �2.50 .0164 TJF 14 65.3 3.95 (2–4) 0.03 .860 (2–4) �1.83 .078
Orbit height 1 AAM 19 31.8 2.41 (1–2) 0.26 .612 (1–2) �0.20 .8402 AAF 16 32.0 2.12 (3–4) 0.09 .764. (3–4) 0.61 .5423 TJM 27 34.1 2.03 (1–3) 0.54 .466 (1–3) �3.50 .0014 TJF 16 33.7 2.08 (2–4) 0.02 .886 (2–4) �2.35 .025
Orbit breadth 1 AAM 19 42.9 2.19 (1–2) 1.36 .252 (1–2) 2.29 .0282 AAF 16 41.3 1.78 (3–4) 2.83 .100 (3–4) 1.06 .2933 TJM 27 40.7 1.81 (1–3) 1.67 .202 (1–3) 3.72 .0014 TJF 16 40.0 2.75 (2–4) 2.07 .160 (2–4) 1.67 .104
Figure 4. Scatterplot of the relationship between basion-prosthionchord (mm) and orbital height (mm) in Australian Aboriginal andTohoku Japanese crania. In order to visualize levels of covariation,regression lines for the pooled sample, as well as individual adult sam-ples, are plotted.

POST-PLEISTOCENE EAST ASIAN FACIAL SKELETON 35Vol. 112, 2004
orbital index (Figure 9). Orbits with relatively great heighttend to have lower volumes than orbits which are lower, andmore rectangular in shape.
Estimation of orbit volumes in the Chinese Neolithicsamples
Poor preservation prevented direct measurement oforbital volumes in the Chinese Neolithic samples. In order toestimate these volumes, a standard multiple regression wasperformed with the pooled Australian Aboriginal andTohoku Japanese data sets with orbit volume as the depen-dent variable and basion-prosthion, supraorbital breadth,and infraorbital breadth as independent variables. Presenceof outliers, normality, linearity, and homoscedasticity ofresiduals were evaluated. With the use of a p�.001 criterionfor Mahalanobis distance no outliers among the cases werefound. Table 6 displays the correlations between the vari-
ables, the unstandardized regression coefficients (B) andintercept, the standardized regression coefficients (�), R2,and adjusted R2. R for regression was significantly differentfrom zero, F(3, 83)�165.54, p�.001. All three coefficientsdiffered significantly from zero, and all IV’s contributed sig-nificantly to the prediction of orbit volume. The confidencelimits for basion-prosthion were 0.126 to 0.316, supraorbitalbreadth 0.419 to 0.635, and infraorbital breadth �0.721 to �0.219.
The prediction equation (orbit volume��37.418�0.221basion-prosthion�0.527 supraorbital br. �0.524 infraorbitalbr.) was then used to estimate the orbit volumes in 20Tohoku Japanese crania, with known orbit volumes, whichhad not been part of the original sample. Known volumesand estimated volumes were compared using paired t-testsand Pearson’s correlation coefficient (Table 7). Sample
Figure 5. Scatterplot of the relationship between basion-prosthionchord (mm) and orbital breadth (mm) in Australian Aboriginal andTohoku Japanese crania.
Figure 6. Scatterplot of the relationship between basion-prosthionchord (mm) and orbit area (mm2) in Australian Aboriginal and TohokuJapanese crania.
Figure 7. Scatterplot of the relationship between maximumsupraorbital breadth (mm) and the volume of the right orbit (ml) inAustralian Aboriginal and Tohoku Japanese crania.
Figure 8. Scatterplot of the relationship between basion-prosthionchord (mm) and orbit volume (ml) in Australian Aboriginal andTohoku Japanese crania.

36 P. BROWN AND T. MAEDA ANTHROPOLOGICAL SCIENCE
means were similar, differences between the means not sig-nificant, and there was a significant correlation betweenknown and estimated volumes. Scatterplots, and examina-tion of the raw data, indicated that errors in estimation weregreatest with large orbit volumes.
The multiple regression equation was then used to esti-mate orbit volume in the four Chinese Neolithic samplesusing basion-prosthion, supraorbital breadth, and infraor-bital breadth as the independent variables (Figure 10). Theseresults suggest a gradual decline in orbit volume through theNeolithic, with a similar diachronic trend to that recorded forendocranial volume, facial breadth and prognathism andposterior tooth size, Fig 1. As the volume of the orbitdecreased there was a corresponding increase in orbit height.
Discussion
Post-Pleistocene diachronic change in ChinaThe evidence for post-Pleistocene diachronic change in
human cranial and oro-facial dimensions in China, which wedescribe, follows a similar pattern to that previouslyrecorded for north Africa and the Levant, and Australia(Carlson, 1976; Carlson and Van Gervan, 1977; Smith et al.,1985, 1986; Calcagno, 1986; Brown, 1987, 1992a; Hen-neberg and Steyn, 1993). Endocranial volumes decrease,cranial superstructures become less robust, and there is areduction in lower facial prognathism, facial height, supraor-bital breadth and posterior tooth size.
Figure 9. Scatterplot of the relationship between orbital index andthe volume of the right orbit (ml) in Australian Aboriginal and TohokuJapanese crania.
Table 5. Pearson’s r correlation matrix for orbital and facial dimensions in the pooled Tohoku Japanese and
Australian Aboriginal sample (n�86)
Variable list Orbit volume
Orbit area
Orbit height
Orbit breadth
Orbit index
Orbit area 0.57Orbit height �0.09 0.46Orbit breadth 0.76 0.73 0.24Orbit index �0.55 �0.38 0.14 �0.48Basion-nasion 0.73 0.64 0.15 0.74 �0.29Basion-nasospinale 0.83 0.54 �0.01 0.74 �0.38Basion-prosthion 0.85 0.51 �0.03 0.74 �0.44Supraorbital breadth 0.88 0.63 �0.00 0.82 �0.47Bi-zygion 0.72 0.63 0.14 0.71 �0.35Nasion-nasospinale 0.49 0.61 0.44 0.63 �0.36Nasion-prosthion 0.43 0.61 0.48 0.61 �0.25Nasospinale-prosthion 0.17 0.36 0.32 0.35 0.00Nasal breadth 0.59 0.33 �0.02 0.55 �0.39Infraorbital breadth 0.40 0.50 0.26 0.56 �0.14Bi-FMO 0.85 0.67 0.07 0.87 �0.46
Table 6. Standard multiple regression of basion-prosthion, supraorbital breadth and infraorbital breadth on orbit volume
Orbit volume (DV)
Basion-prosthion
Supra-orbital
Infra-orbital
mean 25.3 97.8 101.8 23.9
s.d. 4.91 7.68 7.34 2.75
Pearson’s r B � sr2 (unique)
Basion-pros. .83 0.221 0.34 0.04
Supraorbital .88 .83 0.527 0.79 0.16
Infraorbital .42 .58 .66 �0.524 �0.29 0.05
Intercept��37.418
R2�.86*, adjusted R2�.85, R�.92, p�.001, *unique variability�0.07,shared variability�0.79
Table 7. Comparison of known orbit volumes with estimated orbit volumes in 20 Tohoku Japanese crania
N�20 Known volume
Estimated volume
Volume difference
t P r P
mean 24.3 24.6 1.76 �0.78 0.444 0.70 0.001s.d. 2.97 2.01 1.17
Paired t-test and Pearson’s correlation coefficient.
Figure 10. Box plots of diachronic change in predicted male orbitvolume between 6,500 and 2,500 years BP in China.

POST-PLEISTOCENE EAST ASIAN FACIAL SKELETON 37Vol. 112, 2004
Preferential preservation and ease of measurement haveresulted in most of the previous studies of post-Pleistocenechange concentrating on tooth size (Bailit and Friedlaender,1966; Brace and Mahler, 1971; Brose and Wolpoff, 1971; LeBlanc and Black, 1974; Frayer, 1977; Calcagno, 1986; Mac-chiarelli and Bondioli, 1986; Smith et al., 1986; Brace et al.,1987; Formicola, 1987). Where samples are sexed, anddimensions unaffected by wear are recorded, the evidencefor directional reduction in posterior tooth size after 10,000years BP is clear. In this study posterior dental reduction ismost evident before 3,500 BP, with no significant change inthe last 2000 years. This contrasts with other indicators ofbody size (endocranial volume) and facial size and robustic-ity which indicate substantial reduction after 2000 years BP.
Explanations of post-Pleistocene diachronic change inhuman cranio-facial size and morphology and tooth dimen-sions usually emphasize the impact of some aspect of theNeolithic transition. For directional change in tooth size it isoften claimed that the improvement in food preparationtechnologies and the use of softer and less abrasive carbohy-drate staples reduced the selective pressures for large, slowwearing teeth (Brace and Mahler, 1971; Le Blanc and Black,1974; Brace, 1978; y’Edynak, 1978; Kennedy, 1984). Whythis might result in tooth size reduction is not clear, as theselective advantages of smaller teeth, or disadvantages ofmaintaining larger teeth without an impact on reproductivefitness, are never stated. Alternatively, tooth size reductioncould be the allometric byproduct of reduction in body size.Something like an extended version of the modern seculargrowth trend, but set in reverse (Tanner, 1981). Under thismodel, the sedentary village lifestyles, higher populationdensities, and potentially greater competition for resourcesmay have favored the reproductive success of smaller bod-ied individuals (Frisancho et al., 1973; Macchiarelli andBondioli, 1986).
Cross cultural comparisons of post-Pleistocene change infacial and dental proportions highlight problems with theexisting explanatory models. In Australia the founding pop-ulation were hunter-gatherer’s, with an essentiallyMesolithic level of technology (Mulvaney and Kamminga,1999). Both at European contact and at the end of the Pleis-tocene the first Australians were characterized by extremelyhigh levels of tooth wear. Selection for a large and robustmasticatory system seems to have been maintained over the�40,000 years in which Australia was occupied, and there islittle evidence of gene flow from smaller toothed popula-tions in south-east Asia. However, between 12,000 and4,000 years BP there is significant reduction in tooth size,and the size, prognathism and robusticity of the orofacialskeleton (Brown, 1989, 1992a, b). At the same time popula-tion densities remain relatively low, permanent villages andagriculture are not present, and premasticatory preparationof food is minimal. It is unlikely that diachronic change inAustralian Aboriginal facial skeletons was a response to therelaxation of selection for large teeth, or selection favoringsmaller body size due to competition for resources.
It also appears that the prevailing anthropological expla-nations for the post-Pleistocene diachronic trend for reduc-tion in tooth size, and change in oro-facial dimensions, donot work particularly well for China. Millet based agricul-
ture, use of pottery cooking vessels, and village lifestyleswere present in the Chinese river valleys by 7,000 BP (Yan,1992; Liu, 1996). Through the Yangshao and Longshanarchaeological data suggest a decreased reliance on non-domesticated food resources and increasing population den-sities, which continued into the Dynastic periods. However,while there is a significant reduction in posterior tooth size,levels of tooth wear remain high and do not indicate anyrelaxation of the selection for slower wearing teeth (Pechen-kina et al., 2002; PB personal observation). In northeasternChina it is more likely that the reduction in body size, cranialdimensions and tooth size is linked to either retarded growth,or selection for smaller body size, which is reflected in thedeterioration in community health towards the end of theLongshan period, around 4,000 BP (Pechenkina et al.,2002).
The orbitsIn China while there is a reduction in facial height, prog-
nathism of the lower face and supraorbital breadth throughthe Neolithic period, there is a relative and absolute increasein the height of the orbits. This increase in orbit height isconsistent with the pattern of post-Pleistocene change inother parts of the world where trends in facial size and shapeover this time period have been examined (Carlson, 1976;Brown, 1989, 1992b). The functional associations of orbitsize, shape and volume were examined in two groups ofmodern human crania, with contrasting cranial vault andoro-facial morphologies. These two groups, Tohoku Japa-nese and Australian Aborigines, were chosen as to someextent they mirrored the differences between early Neolithicand modern Chinese populations. The Australian samplewas characterized by a dolichocranic cranial vault, broadand robust supraorbital region, prognathic lower face andlow, rectangular orbits; the Tohoku Japanese by a brachyc-ranic cranial vault, minimal facial prognathism, and high,rounded orbits.
Consistent patterns of sexual dimorphism in facial dimen-sions, and orbit height, breadth, area and volume were foundin the Australian Aboriginal and Tohoku Japanese samples.While male orbital and facial dimensions are generally sig-nificantly larger than those in females, relative to the size ofthe facial skeleton female orbits are slightly larger. The lowand rectangular orbits in the Australian samples were associ-ated with significantly greater orbital volumes than in theJapanese samples. The individual, and pooled, modern sam-ples were used to examine the functional relationshipsbetween dimensions of the orbit, other parts of the facialskeleton, and cranial base. Bivariate correlation, scatterplotsand multiple regression results indicated that orbit volumecould be predicted from a combination of supraorbitalbreadth, infraorbital breadth and lower facial prognathism.Orbital height displayed little covariation with other facialdimensions, partly due to relatively tall orbits in the smallerfemale orofacial skeletons. The regression equation devel-oped to predict orbit volume was tested on an independentTohoku Japanese sample and then applied to the NeolithicChinese crania. While orbit heights are increasing throughthe Chinese Neolithic, orbit volumes are decreasing.
Human orbits are complex structures, with seven bones

38 P. BROWN AND T. MAEDA ANTHROPOLOGICAL SCIENCE
forming the walls of the somewhat pear-shaped twin cavi-ties, where the stalk end represents the optic canal (Warwick,1976). The primary role of the orbits is to protect the eyes,provide attachment for the muscles controlling eye move-ment, and help support the frontal lobes of the brain. Princi-pal contents of the orbits include the eyeballs, extraocularmuscles, orbital fat, nerves and blood supply, and lacrimalglands. Variation is evident in the size and morphology ofthe orbital apertures, as well as in the shape of the cavities,the foramina and grooves within them, and the individualbones of which the orbits are comprised (Adachi, 1904b;Pan, 1933; Woo, 1937–38; Schultz, 1940; Ray, 1955; Rie-senfeld, 1956; Kier, 1966; Post, 1969; Ossenberg, 1970;Warwick, 1976)
The growth of the eyes follows the rapid pattern of neuralgrowth, although slower than the brain, and this is reflectedin the relatively large size of the orbits in infants and chil-dren (Todd et al., 1940; Moore and Lavelle, 1974). Up untilthe expansion of the maxilla which accompanies the devel-opment of the permanent dentition, the orbits dominate thefacial skeleton. Most of the increase in facial height duringlater growth is suborbital, with orbital height showing rela-tive stability. Orbital breadth increases with the growth ofthe supraorbital region, and the increase in interorbital widthdue to the expansion of the ethmoidal air cells. In humans,unlike the reasonably close association between the contoursand volume of the brain and the endocranial surface, the eye-ball only occupies approximately 32 percent of orbit volumein adulthood (Schultz, 1940; Warwick, 1976), and eyeballsize does not appear to be correlated with either endocranialvolume or body size (Todd et al., 1940). Most of the remain-ing orbital volume is filled by the recti muscles and orbitalfat. If orbital volumes are large, with a long antero-posterioraxis to the orbit and great supraorbital breadth, it is possiblefor the eyeballs to be relatively deeply set.
Where crania have a shorter cranial base, in associationwith a less projecting lower face and reduced upper facialbreadth, orbit volumes are reduced. This would decrease thevolume available for the recti muscles, and orbital nervesand blood vessels, pushing the eyeball into a more anterioror relatively protruding position. A situation analogous tothis in the degree of protrusion of the eye, and extent offacial flatness, occurs in domestic breeds of dog. While thereis only limited comparative evidence to support this view inhumans, Adachi (1904a) suggested that this was the situa-tion in modern Japanese when compared with other modernhuman populations with more projecting facial skeletons(Adachi, 1904a, b). This is in marked contrast with fossilhominids like Arago 21 (right orbit volume 44 ml, measuredfrom a cast) and Kabwe (right orbit volume 46 ml) whosesupraorbital development, facial projection and orbit vol-umes exceed the modern human range of variation (modernhuman adult orbit volume range is 18–38 ml).
Conclusions
The associations between dimensions of the orbit, facialskeleton and neurocranium were examined in morphologi-cally contrasting modern human samples, Tohoku Japaneseand Australian Aborigines. While some orbital dimensions
display consistent patterns of covariation with craniofacialdimensions, others do not. In the Australian and Japanesesamples orbit volumes could be predicted with regressionequations based on dimensions of upper facial breadth andfacial prognathism. Applying these equations to Neolithicpopulations in China indicates that orbital volumes decreasebetween 6,000 and 3,000 years BP, while orbital height isincreasing and facial height decreasing. Reducing facialprognathism, supraorbital breadth and a shorter, morebrachycranic, cranial vault reduce the length and breadth ofthe orbital cavity. If the volume of the orbit is reduced thecontents of the orbit might be forced into a more anteriorposition. While the correlations between orbit volume andsize of the eyeball are low (Schultz, 1940; Todd et al., 1940;Warwick, 1976), the correlations between the total contentsof the orbit and orbit volume would be high as the orbits areusually full. If it is the total volume occupied by the eyeball,extraocular muscles, nerves and blood supply which areimportant, rather than just the size of the eyeball, then therewould need to be some functional compensation for any sig-nificant reduction in orbit length and volume. While thisrequires further research, it is possible that the tendency fororbit heights to increase, when orbit volumes decrease,reflect an expansion of the anterior third of the orbit for arepositioned eyeball and associated musculature.
Acknowledgements
For access to skeletal materials in their care PB would liketo thank Professor Han Kangxin and Zhang Yajun, Instituteof Archaeology, Academy of Social Sciences, Beijing; Pro-fessor’s Wu Rukang, Wu Xinzhi, and Zhang Yinyun, Insti-tute of Vertebrate Paleontology and Paleoanthropology,Academia Sinica, Beijing; Professor Chris Stringer andRobert Kruszynski, Natural History Museum, London, andProfessor Yukio Dodo, Tohoku University School of Medi-cine. Phoebe Newman provided assistance while collectingdata in China. This research was completed while PB wasvisiting Research Professor in the Department of Anatomyand Anthropology, Tohoku University School of Medicine.He is extremely grateful to Yukio Dodo, and the staff andstudents of the Department for the help and friendship theyprovided while in Japan. PB and TM would also like tothank Dr. Yuji Mizoguchi, National Science Museum,Tokyo, for encouragement and organisation of the session atthe International Congress where this paper was presented,and the two anonymous reviewers of the original manu-script.
References
Adachi B. (1904a) Die Orbita und die Hauptmasse des Schädelsder Japaner und die Methode der Orbitalmessung. Zeitschriftfuer Morphologie und Anthropologie, 7: 379-480.
Adachi B. (1904b) Topographische Lage des Augapfels der Japa-ner. Zeitschrift fuer Morphologie und Anthropologie, 7: 481-501.
Bailit H.L. and Friedlaender J.S. (1966) Tooth size reduction: aHominid trend. American Anthropologist, 68: 665-672.
Bass W.M. (1971) Human Osteology: A Laboratory and FieldManual of the Human Skeleton. Missouri Archaeological

POST-PLEISTOCENE EAST ASIAN FACIAL SKELETON 39Vol. 112, 2004
Society, Columbia.Brace C.L. (1978) Tooth reduction in the Orient. Asian Perspec-
tives, 19: 203-219.Brace C.L. and Mahler P.E. (1971) Post-Pleistocene changes in the
human dentition. American Journal of Physical Anthropol-ogy, 34: 191-204.
Brace C.L., Shae X-Q., and Zhang Z-B. (1984) Prehistoric andmodern tooth size in China. In: Smith F.H. and Spencer F.(eds.) “The Origins of Modern Humans,” Alan R. Liss, NewYork, pp. 485-516.
Brace C.L., Rosenberg K.R., and Hunt K.D. (1987) Gradualchange in human tooth size in the late Pleistocene and post-Pleistocene. Evolution, 41: 705-720.
Brose D.S. and Wolpoff M.H. (1971) Early Upper Paleolithic manand late Middle Paleolithic tools. American Anthropologist.73: 1156-1194.
Brown P. (1987) Pleistocene homogeneity and Holocene sizereduction: the Australian human skeletal evidence. Archaeol-ogy in Oceania, 22: 41-71.
Brown P. (1989) Coobool Creek: a morphological and metricalanalysis of the crania, mandibles and dentitions of a prehis-toric Australian human population. Terra Australis 13,Department of Prehistory, Australian National University,Canberra.
Brown P. (1992a) Post-Pleistocene change in Australian Aborigi-nal tooth size: dental reduction or relative expansion? In:Brown T. and Molnar S. (eds.) “Human Craniofacial Varia-tion in Pacific Populations,” Anthropology and Genetics Lab-oratory, University of Adelaide, pp. 33-52.
Brown P. (1992b) Recent human evolution in East Asia and Aus-tralasia. Philosophical Transactions of the Royal Society ofLondon, Series B 337: 235-242.
Brown P. (1998–2003) Australian and Asian Palaeoanthropology.http://metz.une.edu.au/~pbrown3/palaeo.html
Calcagno J.M. (1986) Dental reduction in post-Pleistocene Nubia.American Journal of Physical Anthropology, 70: 349-363.
Calcagno J.M. and Gibson K.R. (1988) Human dental reduction:natural selection or the probable mutation effect. AmericanJournal of Physical Anthropology, 77: 505-517.
Carlson D.S. (1976) Temporal variation in prehistoric Nubian cra-nia. American Journal of Physical Anthropology, 45: 467-484.
Carlson D.S. and Van Gervan D.P. (1977) Masticatory functionand post-Pleistocene evolution in Nubia. American Journal ofPhysical Anthropology, 46: 495-506.
Christensen A.F. (1998) Odontometric microevolution in the Val-ley of Oaxaca, Mexico. Journal of Human Evolution, 34: 333-360.
Formicola V. (1987) Neolithic transition and dental changes: thecase of an Italian site. Journal of Human Evolution, 16: 231-240.
Frayer D.W. (1977) Metric dental changes in the European UpperPaleolithic and Mesolithic. American Journal of PhysicalAnthropology, 46: 109-120.
Frayer D.W (1978) The evolution of the dentition in Upper Pale-olithic and Mesolithic Europe. Monographs in Anthropology,No. 10, University of Kansas.
Frisancho A.R., Sanchez J., Pallardel D., and Yanez L. (1973)Adaptive significance of small body size under poor socio-economic conditions in southern Peru. American Journal ofPhysical Anthropology, 39: 255-262.
Henneberg M. and Steyn M. (1993) Trends in cranial capacity andcranial index in Subsaharan Africa during the holocene.American Journal of Human Biology, 5: 473-479.
Jacobs K. (1994) Human dento-gnathic metric variation inMesolithic/Neolithic Ukraine-possible evidence of demic dif-fusion in the Dnieper Rapids region. American Journal ofPhysical Anthropology, 95: 1-26.
Kennedy K.A.R. (1984) Biological adaptations and affinities of
Mesolithic South Asians. In: Lukacs J.R. (ed.) “The People ofSouth Asia,” Plenum Press, New York, pp. 29-58.
Kier E.L. (1966) Embryology of the normal optic canal and itsanomolies. Investigative Radiology, 1: 346-362.
Le Blanc S.A. and Black B. (1974) A long term trend in tooth sizein the eastern Mediterranean. American Journal of PhysicalAnthropology, 41: 417-422.
Liu L. (1996) Settlement patterns, chiefdom variability, and thedevelopment of early states in North China. Journal ofAnthropological Archaeology, 15: 237-288.
Lukacs J.R. (1984) Dental anthropology of South Asian popula-tions. In: JR Lukacs (ed.): “The People of South Asia,” Ple-num Press, New York, pp. 133-158.
Macchiarelli R. and Bondioli L. (1986) Post-Pleistocene reduc-tions in human dental structure: a reappraisal in terms ofincreasing population density. Human Evolution, 1: 405-418.
Martin R. and Saller K. (1957) Lehrbuch der Anthropologie.Gustav Fischer Verlag, Stuttgart.
Moore W.J. and Lavelle C.L.B. (1974) Growth of the Facial Skele-ton in the Hominoidea. Academic Press, London.
Mulvaney J. and Kamminga J. (1999) Prehistory of Australia.Allen and Unwin, Sydney.
Ossenberg N.S. (1970) The influence of artificial cranial deforma-tion on discontinuous morphological traits. American Journalof Physical Anthropology, 33: 357-372.
Pan T.H. (1933) Measurement of the Chinese orbit. Journal ofAnatomy, 67: 596-598.
Pechenkina E.A., Benfer R.A., and Wang Z. (2002) Diet and healthchanges at the end of the Chinese Neolithic: the Yangshao/Longshan transition in Shaanxi Province. American Journalof Physical Anthropology, 117: 15-36.
Post R.H. (1969) Tear duct size differences of age, sex and race.American Journal of Physical Anthropology, 30: 85-88.
Ray C.D. (1955) Configuration and lateral closure of the superiororbital fissure. American Journal of Physical Anthropology,13: 309-321.
Riesenfeld A. (1956) Multiple infraorbital, ethmoidal and mentalforamina in the races of man. American Journal of PhysicalAnthropology, 14: 85-100.
Schultz A.H. (1940) The size of the orbit and of the eye in pri-mates. American Journal of Physical Anthropology, 26: 389-408.
Smith P., Bloom R.A., and Berkovitz J. (1984) Diachronic trendsin humeral cortical thickness. Journal of Human Evolution,13: 603-611.
Smith P., Wax Y., Becher A., and Einy S. (1985) Diachronic varia-tion in cranial thickness. American Journal of PhysicalAnthropology, 67: 127-133.
Smith P., Wax Y., Adler F, Silberman D., and Heinic G. (1986)Post-Pleistocene changes in tooth root and jaw relationships.American Journal of Physical Anthropology, 70: 339-348.
Sofaer J.A. (1973) A model relating developmental interaction anddifferential evolutionary reduction of tooth size. Evolution,27: 427-434.
Sofaer J.A., Bailit H.L., and MacLean C.J. (1971) A developmen-tal basis for differential tooth reduction during hominid evo-lution. Evolution, 25: 509-517.
SPSS (1990) SPSS Reference Guide. SPSS Inc, Chicago.Systat (2002) SYSTAT 10.2. Systat Software Inc, Richmond.Tanner J.M. (1981) A History of the Study of Human Growth.
Cambridge University Press, Cambridge.Todd T.W., Beecher H., Williams G.H., and Todd A.W. (1940) The
weight and growth of the human eyeball. Human Biology, 12:1-20.
Warwick R. (1976) Eugene Wolf’s Anatomy of the Eye and Orbit.H.K. Lewis and Co. Ltd, London.
Woo T.L. (1937-38) A biometric study of the human malar bone.Biometrica, 29: 113-123.
Yan W. (1992) Origins of agriculture and animal husbandry in

40 P. BROWN AND T. MAEDA ANTHROPOLOGICAL SCIENCE
China. In: Aikens C.M. and Rhee S.N. (eds.) “Pacific North-east Asia in Prehistory,” Washington State University Press,Pullman, pp. 113-123.
y’Edynak G. (1978) Culture, diet, and dental reduction in
Mesolithic forager-fishers of Yugoslavia. Current Anthropol-ogy, 19: 616-618.
y’Edynak G. (1989) Yugoslav Mesolithic dental reduction. Ameri-can Journal of Physical Anthropology, 78: 17-36.