Embed Size (px)
DESCRIPTION
Brown Bag Buildings. David E. Culler Building Innovations Workshop Feb 24, 2009. What they say about buldings. Source: U.S. Department of Energy 2007 Building Energy Data Book. Sept 2007. The Numbers Tell the Story $370 Billion Total U.S. Annual Energy Costs 200% - PowerPoint PPT Presentation
Citation preview
10-8-2008 1
Brown Bag Buildings
David E. Culler
Building Innovations Workshop
Feb 24, 2009
10-8-2008 2
What they say about buldings
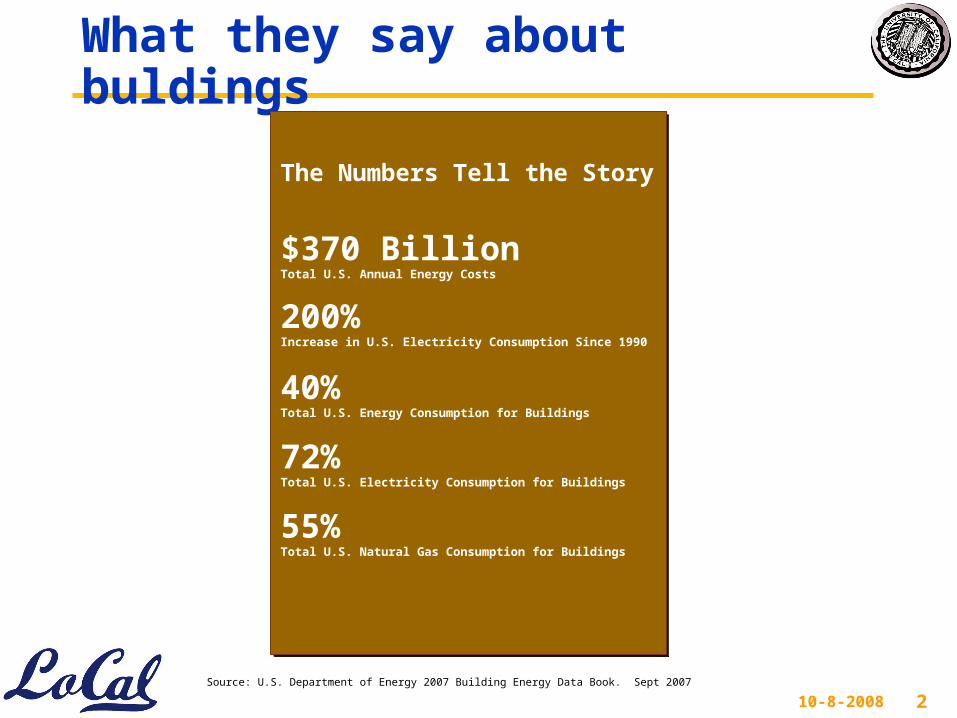
Source: U.S. Department of Energy 2007 Building Energy Data Book. Sept 2007
The Numbers Tell the Story
$370 BillionTotal U.S. Annual Energy Costs
200%Increase in U.S. Electricity Consumption Since 1990
40%Total U.S. Energy Consumption for Buildings
72%Total U.S. Electricity Consumption for Buildings
55%Total U.S. Natural Gas Consumption for Buildings
The Numbers Tell the Story
$370 BillionTotal U.S. Annual Energy Costs
200%Increase in U.S. Electricity Consumption Since 1990
40%Total U.S. Energy Consumption for Buildings
72%Total U.S. Electricity Consumption for Buildings
55%Total U.S. Natural Gas Consumption for Buildings
10-8-2008 3
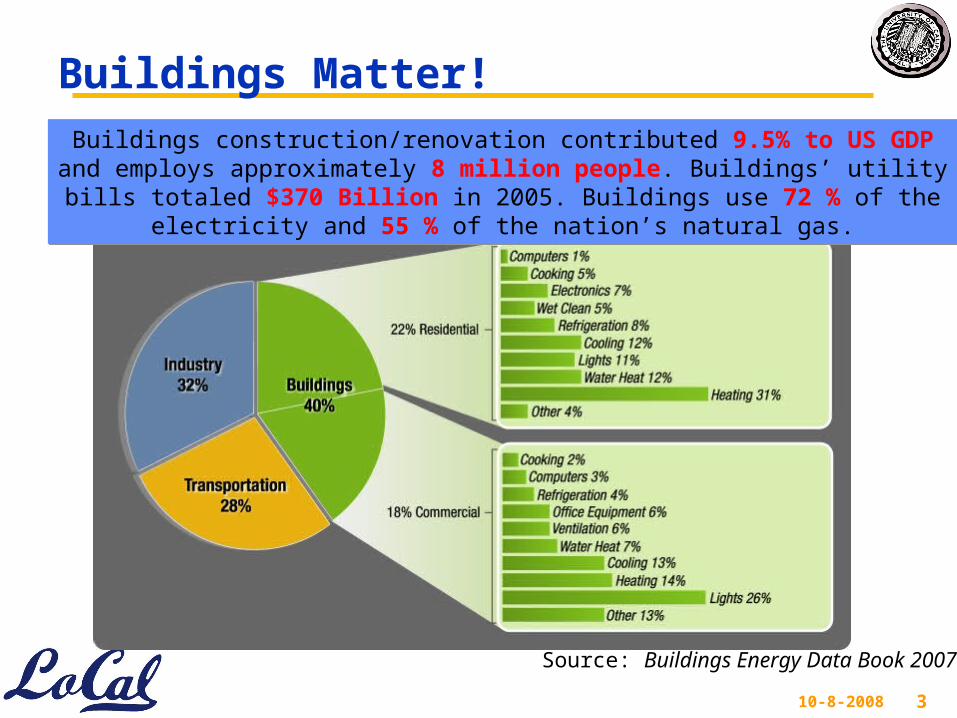
Buildings Matter! Buildings construction/renovation contributed 9.5% to US GDP and employs
approximately 8 million people. Buildings’ utility bills totaled $370 Billion in 2005. Buildings use 72 % of the electricity and 55 % of the nation’s natural gas.
Buildings construction/renovation contributed 9.5% to US GDP and employs approximately 8 million people. Buildings’ utility bills totaled $370 Billion in 2005.
Buildings use 72 % of the electricity and 55 % of the nation’s natural gas.
Source: Buildings Energy Data Book 2007
10-8-2008 4
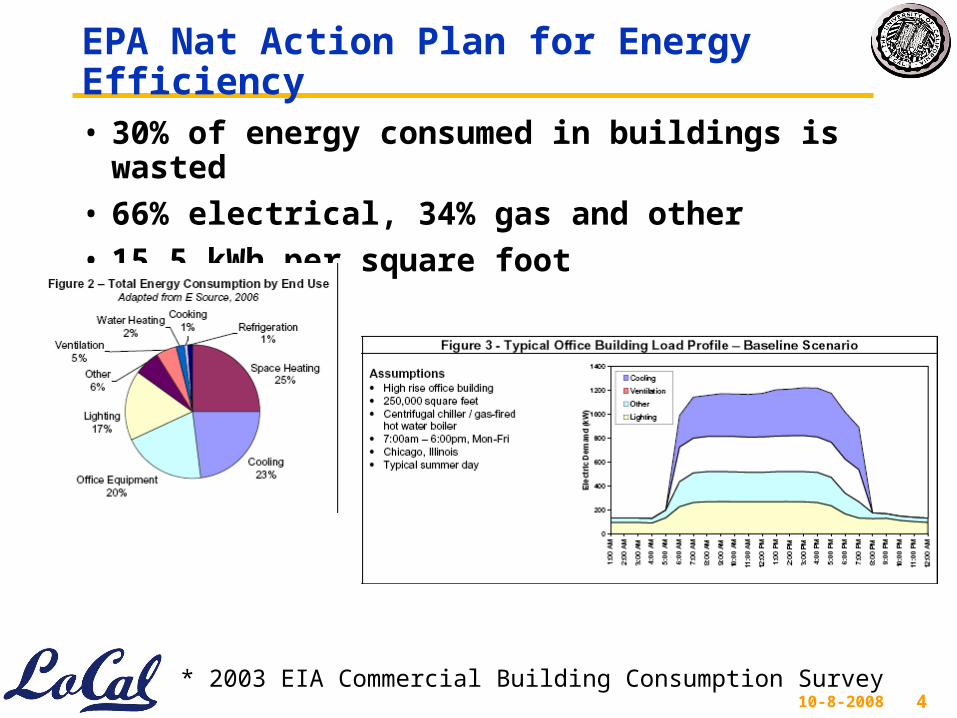
EPA Nat Action Plan for Energy Efficiency
• 30% of energy consumed in buildings is wasted
• 66% electrical, 34% gas and other
• 15.5 kWh per square foot
* 2003 EIA Commercial Building Consumption Survey
10-8-2008 5
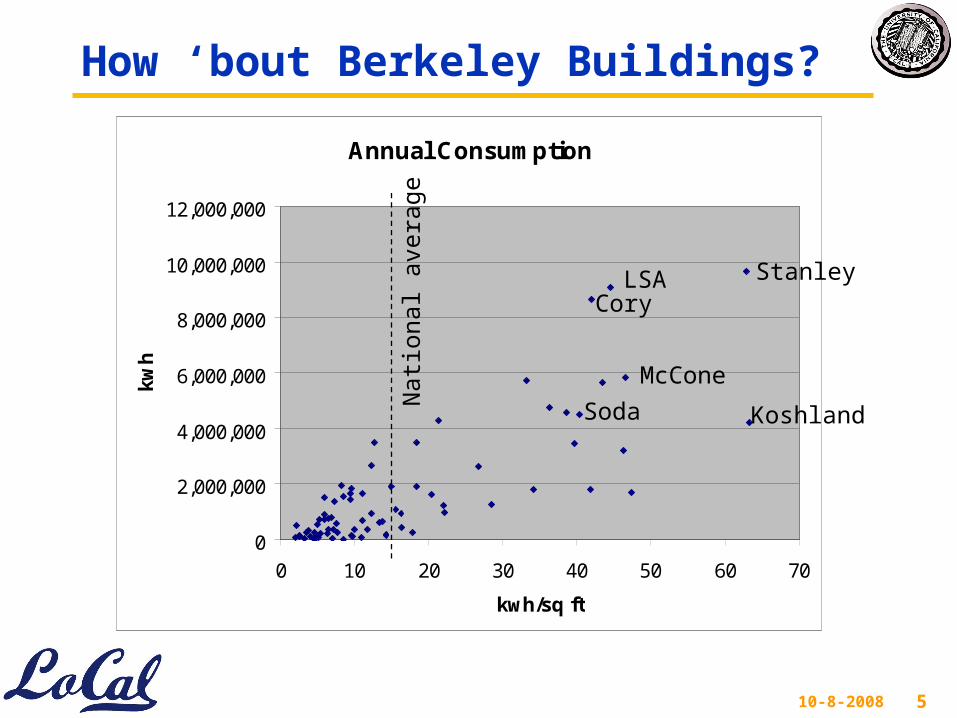
How ‘bout Berkeley Buildings?
Annual Consumption
0
2,000,000
4,000,000
6,000,000
8,000,000
10,000,000
12,000,000
0 10 20 30 40 50 60 70
kwh/sq ft
kwh
Stanley
KoshlandSoda
CoryLSA
McConeNat
iona
l ave
rage
10-8-2008 6
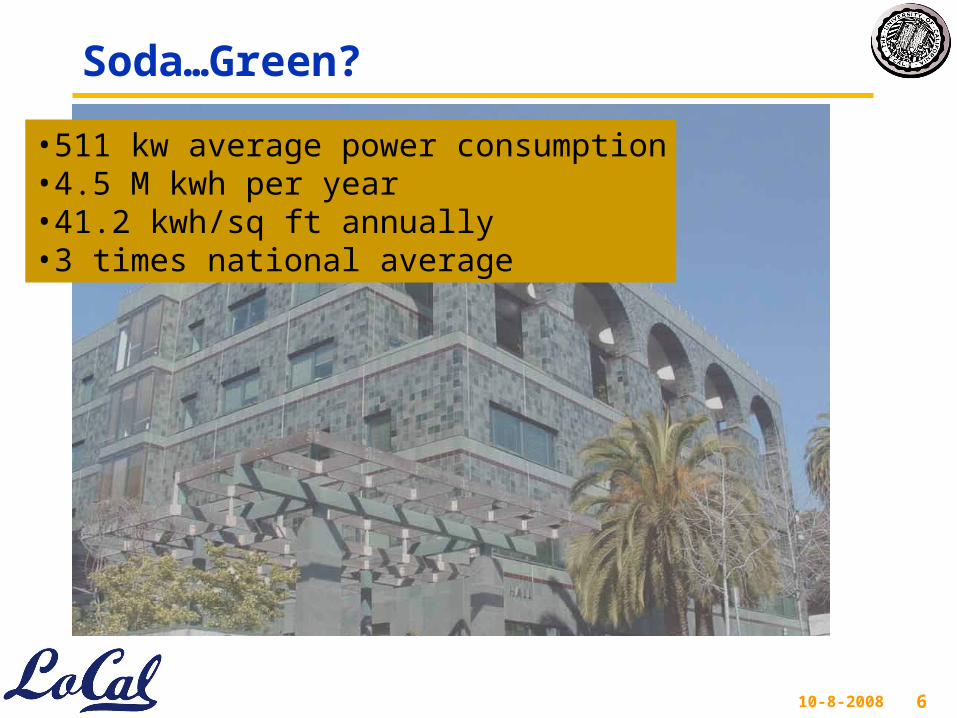
Soda…Green?
•511 kw average power consumption•4.5 M kwh per year•41.2 kwh/sq ft annually•3 times national average
10-8-2008 7
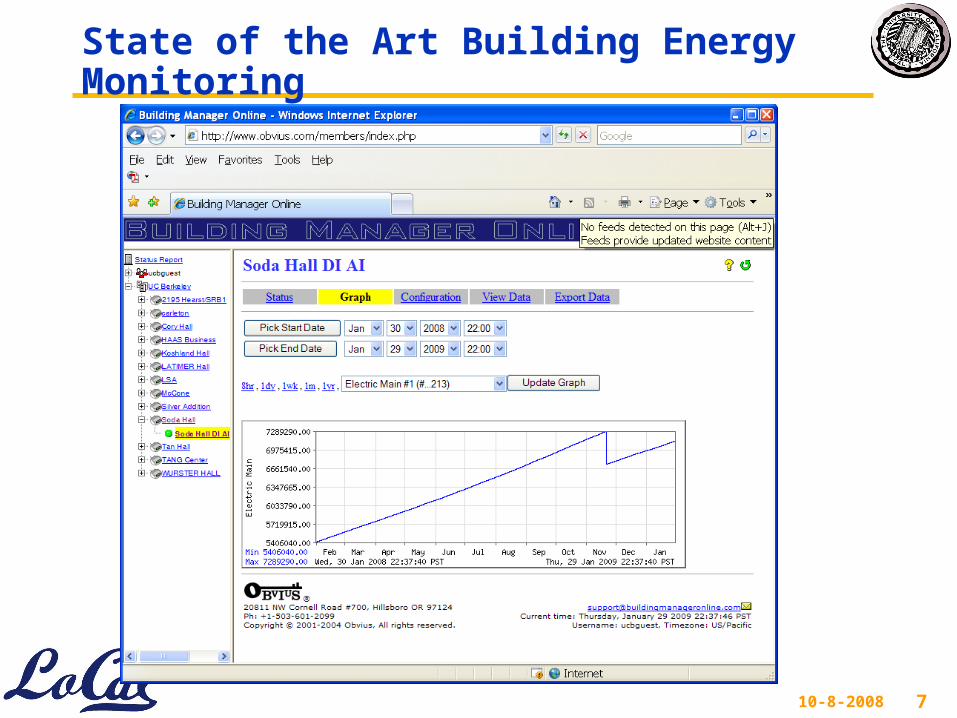
State of the Art Building Energy Monitoring
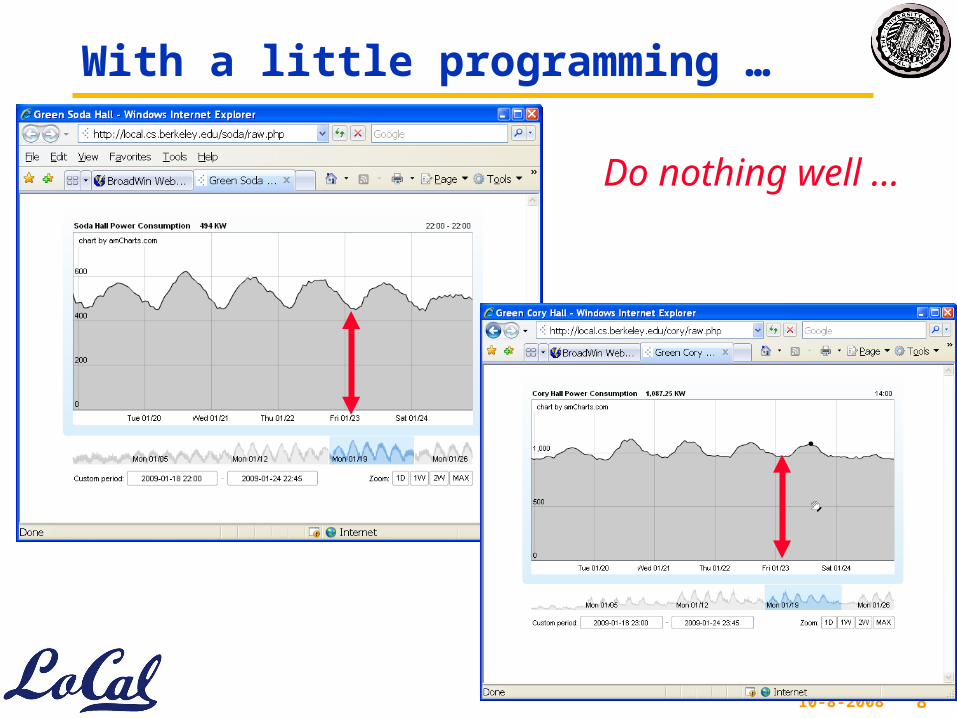
10-8-2008 8
With a little programming …
Do nothing well …
10-8-2008 9
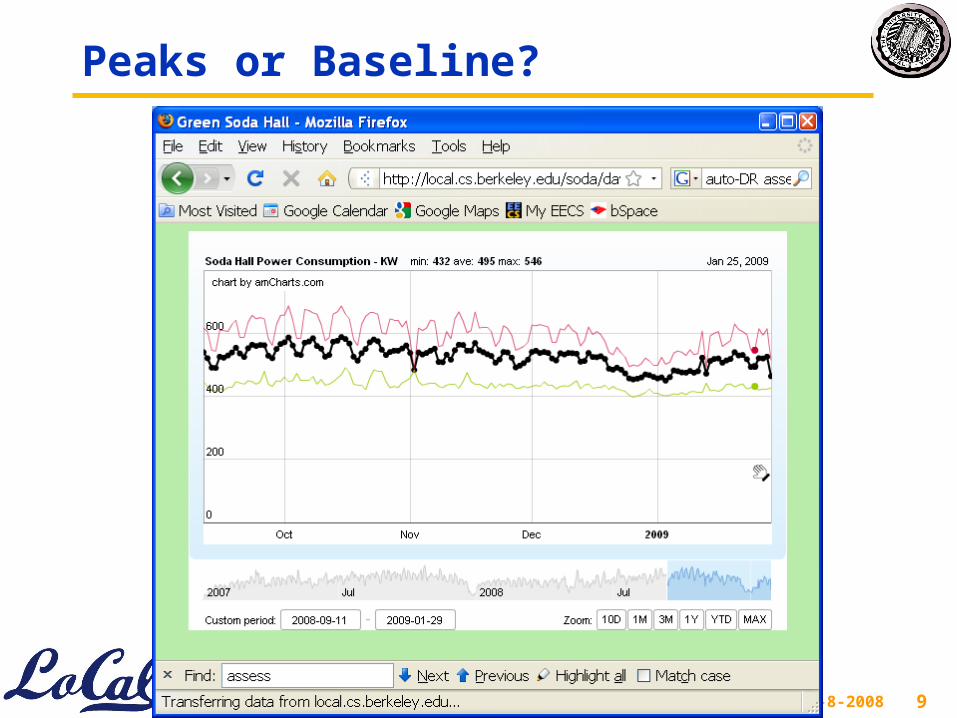
Peaks or Baseline?
10-8-2008 10
Where does it all go?
• Lighting?
• Heating, Ventilation and Cooling (HVAC)?
• Plug Loads – desktops, laptops, kitchenettes?
• Servers?
• Microfab?
10-8-2008 11
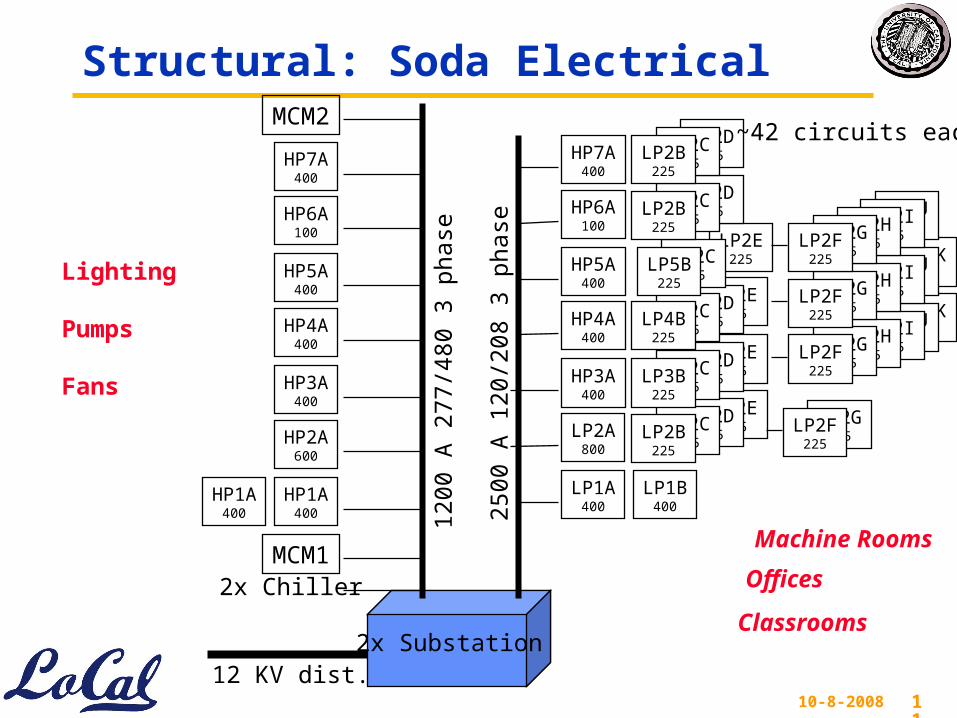
Structural: Soda Electrical
12 KV dist.2x Substation
1200
A 2
77/4
80 3
pha
se
2500
A 1
20/2
08 3
pha
se
2x ChillerMCM1
HP1A400
HP1A400
HP2A600
HP3A400
HP4A400
HP5A400
HP6A100
HP7A400
MCM2
Lighting
Pumps
Fans
Machine Rooms
Offices
Classrooms
LP2E225
LP2D225
LP2C225
LP1A400
LP2A800
HP3A400
HP4A400
HP5A400
HP6A100
HP7A400
LP1B400
LP2B225
LP2G225
LP2F225
LP2E225
LP2D225
LP2C225
LP3B225
LP2E225
LP2D225
LP2C225
LP4B225
LP2E225LP2C
225LP5B
225
LP2D225
LP2C225
LP2B225
LP2D225
LP2C225
LP2B225
LP2K225
LP2J225
LP2I225
LP2H225
LP2G225
LP2F225
LP2K225
LP2J225
LP2I225
LP2H225
LP2G225
LP2F225
LP2J225
LP2I225
LP2H225
LP2G225
LP2F225
~42 circuits each
10-8-2008 12
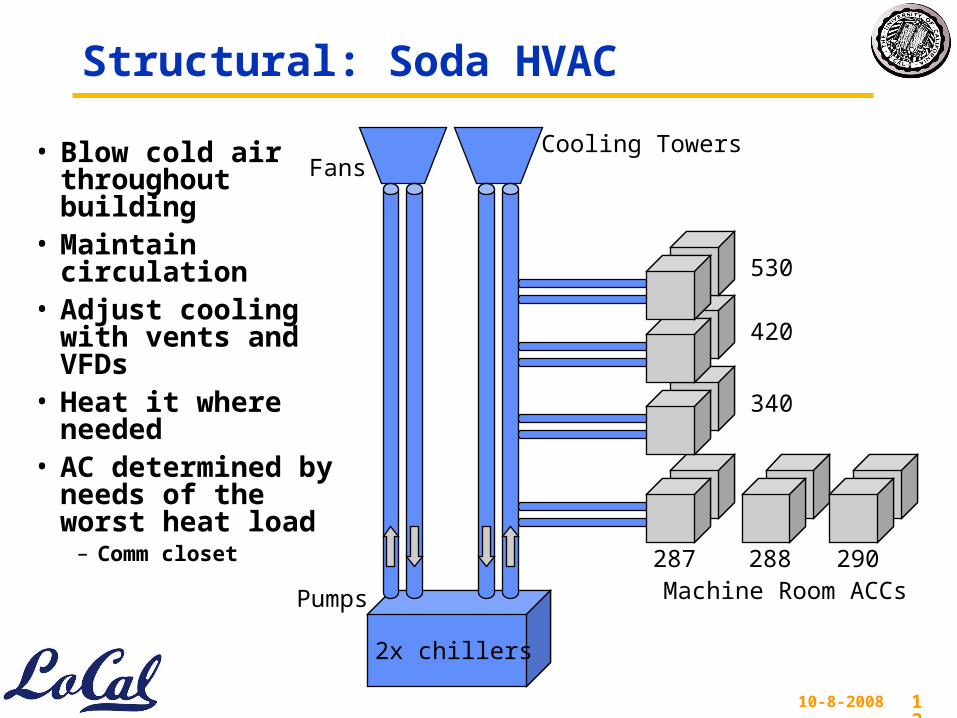
Structural: Soda HVAC
• Blow cold air throughout building
• Maintain circulation• Adjust cooling with
vents and VFDs• Heat it where
needed• AC determined by
needs of the worst heat load
– Comm closet
2x chillers
Cooling Towers
287 288 290
340
420
530
Pumps
Fans
Machine Room ACCs
10-8-2008 13
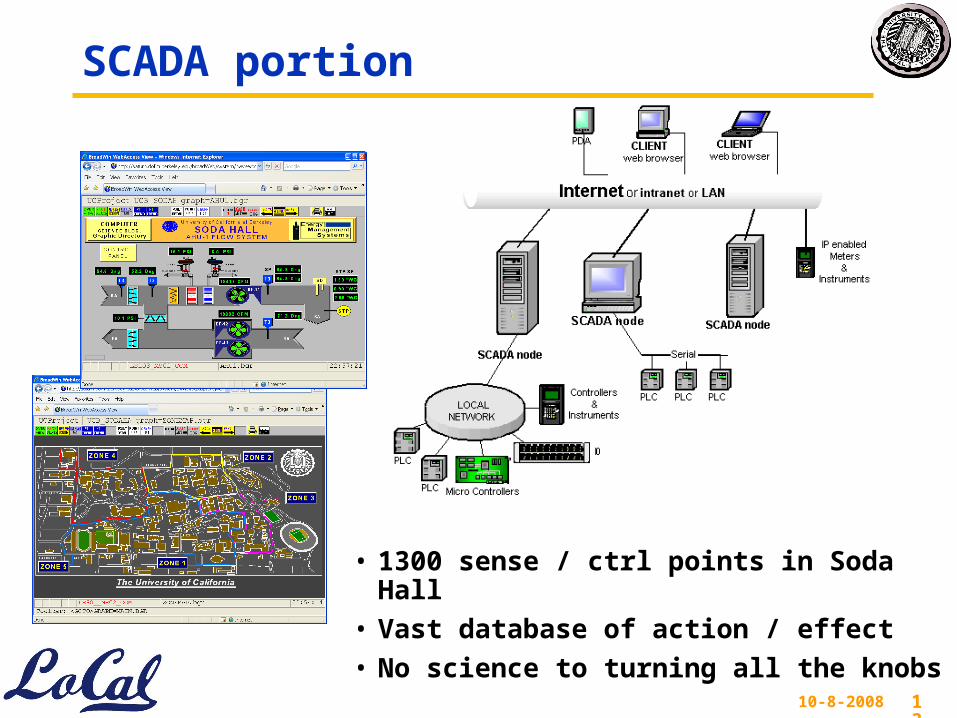
SCADA portion
• 1300 sense / ctrl points in Soda Hall
• Vast database of action / effect
• No science to turning all the knobs
10-8-2008 14
Some initial steps
• When you don’t (cant) have the sensors you want, get as much as you can with the ones you have.
• Take inventory
• Build models
• Point measurements
• Sample in time, space, population
10-8-2008 15
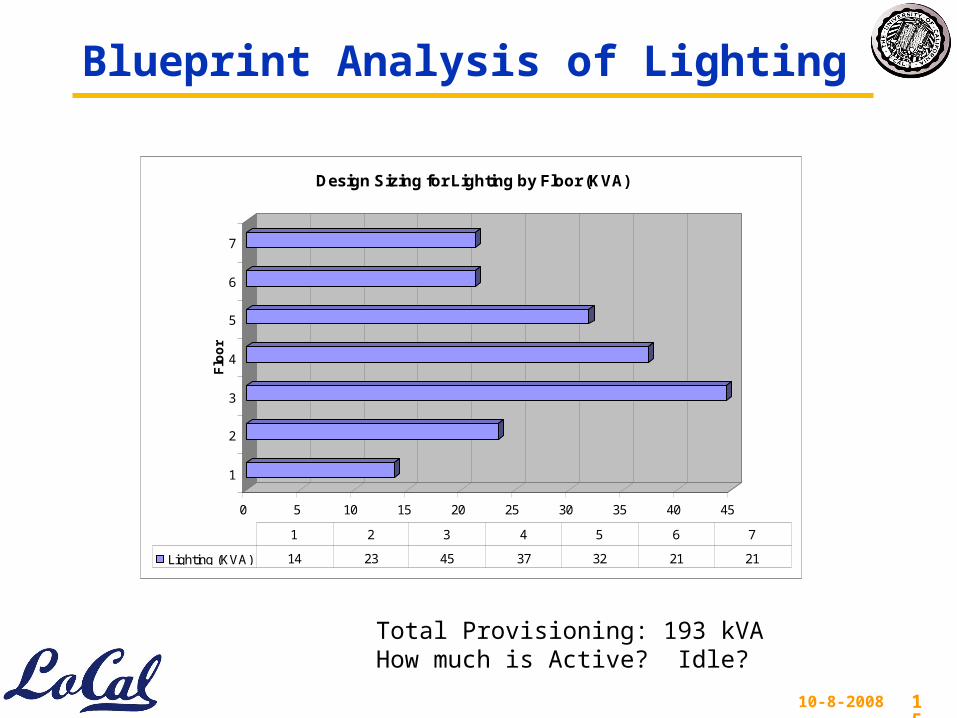
Blueprint Analysis of Lighting
0 5 10 15 20 25 30 35 40 45
1
2
3
4
5
6
7
Flo
or
Design Sizing for Lighting by Floor (KVA)
Lighting (KVA) 14 23 45 37 32 21 21
1 2 3 4 5 6 7
Total Provisioning: 193 kVAHow much is Active? Idle?
10-8-2008 16
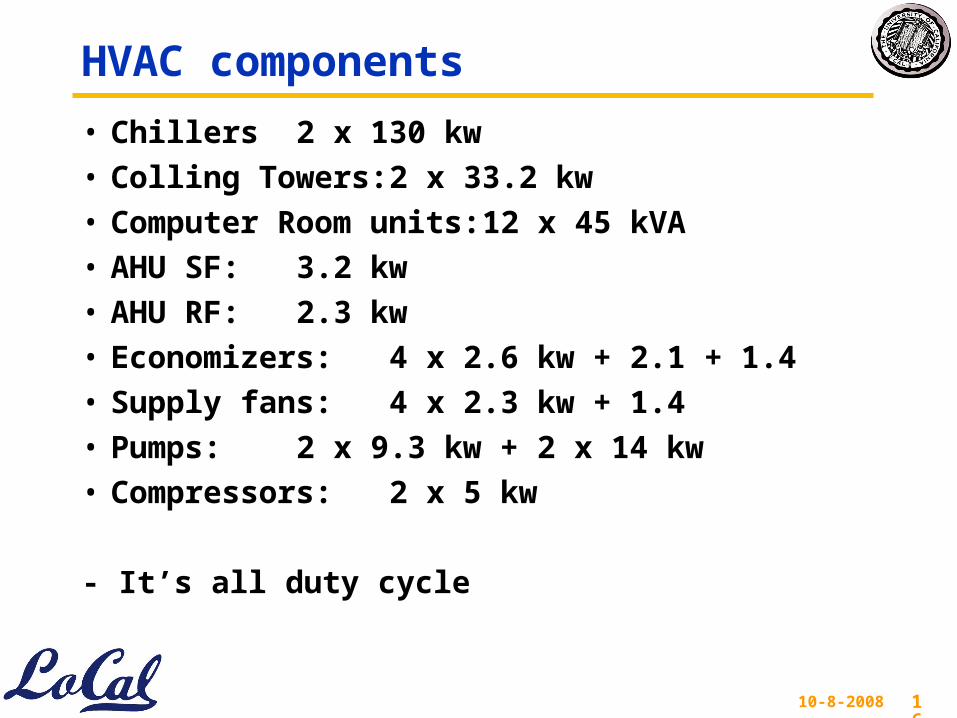
HVAC components
• Chillers 2 x 130 kw
• Colling Towers: 2 x 33.2 kw
• Computer Room units: 12 x 45 kVA
• AHU SF: 3.2 kw
• AHU RF: 2.3 kw
• Economizers: 4 x 2.6 kw + 2.1 + 1.4
• Supply fans: 4 x 2.3 kw + 1.4
• Pumps: 2 x 9.3 kw + 2 x 14 kw
• Compressors: 2 x 5 kw
- It’s all duty cycle
10-8-2008 17
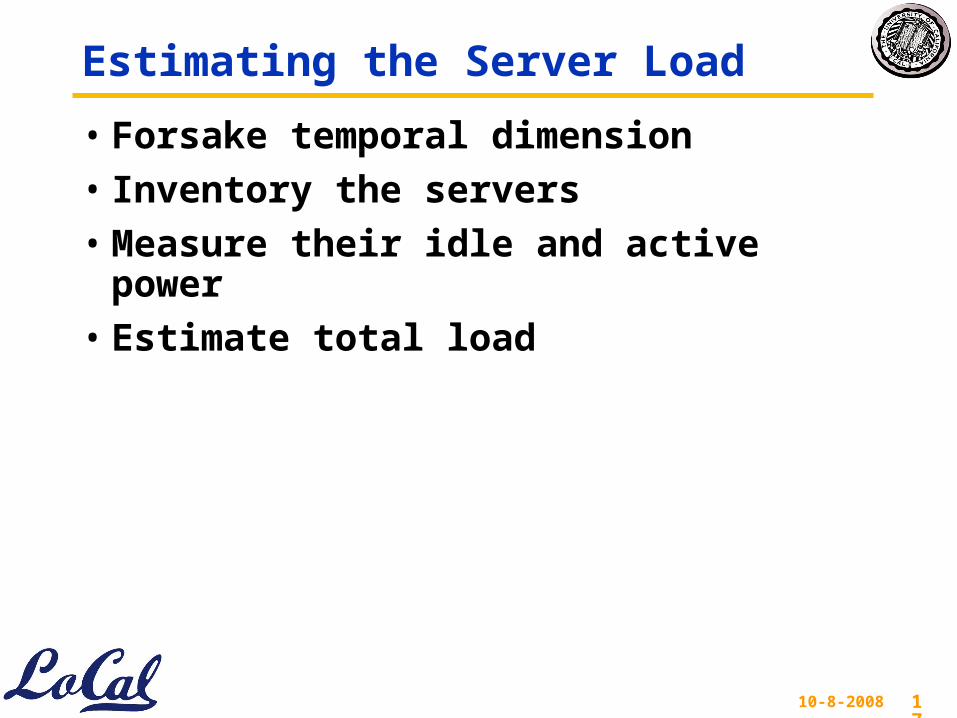
Estimating the Server Load
• Forsake temporal dimension
• Inventory the servers
• Measure their idle and active power
• Estimate total load
10-8-2008 18
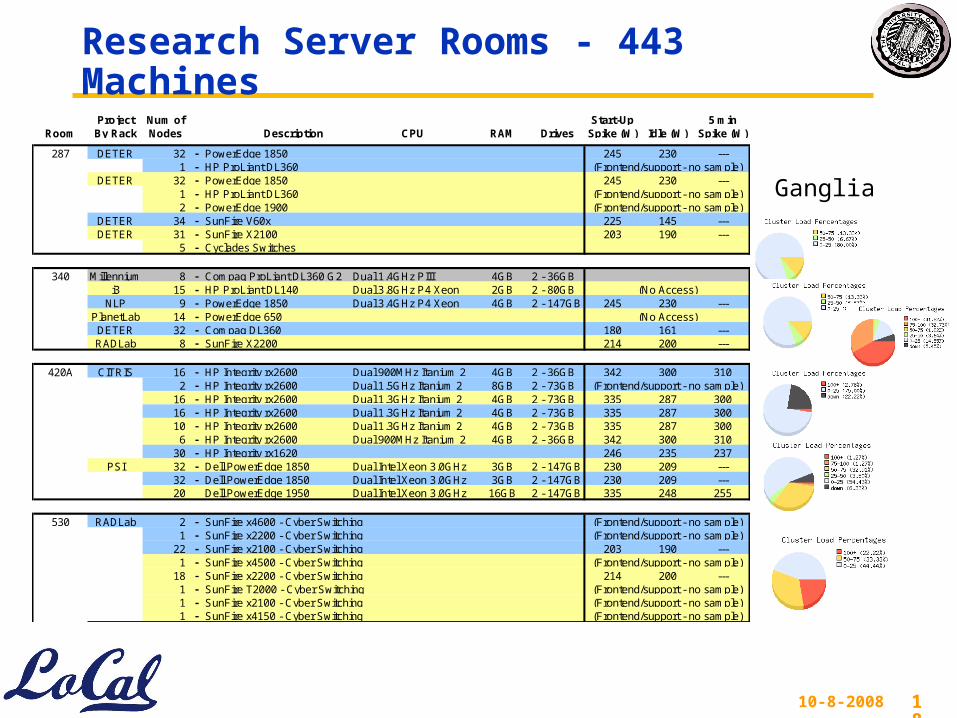
Research Server Rooms - 443 Machines Project Num of Start-Up 5 min
Room By Rack Nodes Description CPU RAM Drives Spike (W) Idle (W) Spike (W)
287 DETER 32 - PowerEdge 1850 245 230 ---1 - HP ProLiant DL360 (Frontend/support - no sample)
DETER 32 - PowerEdge 1850 245 230 ---1 - HP ProLiant DL360 (Frontend/support - no sample)2 - PowerEdge 1900 (Frontend/support - no sample)
DETER 34 - SunFire V60x 225 145 ---DETER 31 - SunFire X2100 203 190 ---
5 - Cyclades Switches
340 Millennium 8 - Compaq ProLiant DL360 G2 Dual 1.4GHz PIII 4GB 2 - 36GBi3 15 - HP ProLiant DL140 Dual 3.8GHz P4 Xeon 2GB 2 - 80GB (No Access)
NLP 9 - PowerEdge 1850 Dual 3.4GHz P4 Xeon 4GB 2 - 147GB 245 230 ---PlanetLab 14 - PowerEdge 650 (No Access)DETER 32 - Compaq DL360 180 161 ---RADLab 8 - SunFire X2200 214 200 ---
420A CITRIS 16 - HP Integrity rx2600 Dual 900MHz Itanium 2 4GB 2 - 36GB 342 300 3102 - HP Integrity rx2600 Dual 1.5GHz Itanium 2 8GB 2 - 73GB (Frontend/support - no sample)
16 - HP Integrity rx2600 Dual 1.3GHz Itanium 2 4GB 2 - 73GB 335 287 30016 - HP Integrity rx2600 Dual 1.3GHz Itanium 2 4GB 2 - 73GB 335 287 30010 - HP Integrity rx2600 Dual 1.3GHz Itanium 2 4GB 2 - 73GB 335 287 3006 - HP Integrity rx2600 Dual 900MHz Itanium 2 4GB 2 - 36GB 342 300 310
30 - HP Integrity rx1620 246 235 237PSI 32 - Dell PowerEdge 1850 Dual Intel Xeon 3.0GHz 3GB 2 - 147GB 230 209 ---
32 - Dell PowerEdge 1850 Dual Intel Xeon 3.0GHz 3GB 2 - 147GB 230 209 ---20 Dell PowerEdge 1950 Dual Intel Xeon 3.0GHz 16GB 2 - 147GB 335 248 255
530 RADLab 2 - SunFire x4600 - Cyber Switching (Frontend/support - no sample)1 - SunFire x2200 - Cyber Switching (Frontend/support - no sample)
22 - SunFire x2100 - Cyber Switching 203 190 ---1 - SunFire x4500 - Cyber Switching (Frontend/support - no sample)
18 - SunFire x2200 - Cyber Switching 214 200 ---1 - SunFire T2000 - Cyber Switching (Frontend/support - no sample)1 - SunFire x2100 - Cyber Switching (Frontend/support - no sample)1 - SunFire x4150 - Cyber Switching (Frontend/support - no sample)
Ganglia
10-8-2008 19
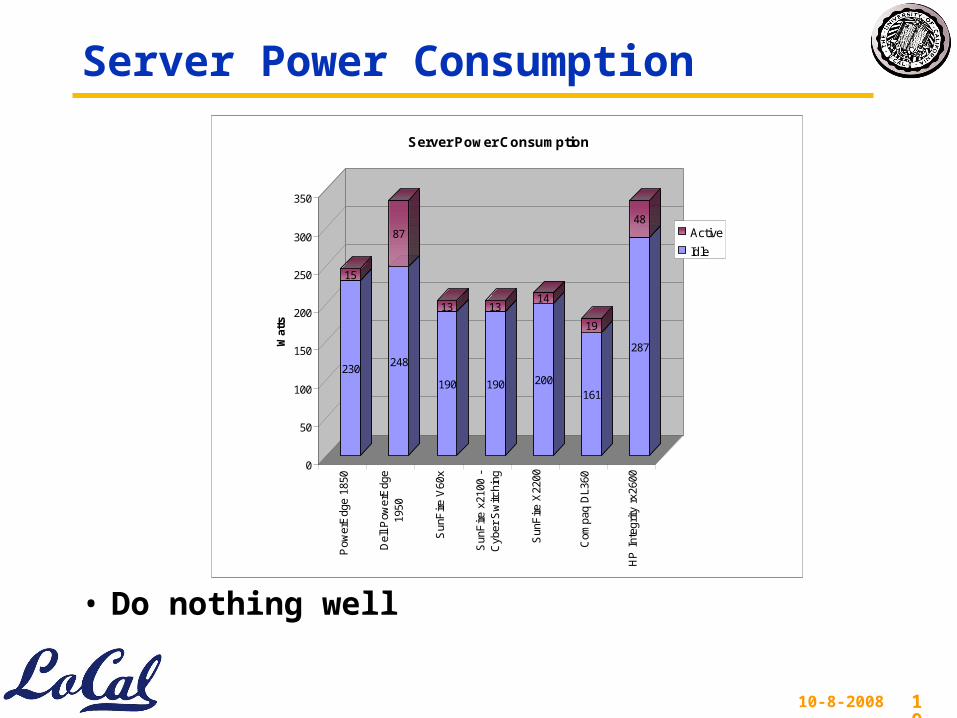
Server Power Consumption
• Do nothing well
230
15
248
87
190
13
190
13
200
14
161
19
287
48
0
50
100
150
200
250
300
350
Wat
ts
Pow
erE
dge
1850
Del
l Pow
erE
dge
1950
Sun
Fire
V60
x
Sun
Fire
x21
00 -
Cyb
er S
witc
hing
Sun
Fire
X22
00
Com
paq
DL3
60
HP
Int
egrit
y rx
2600
Server Power Consumption
Active
Idle
10-8-2008 20
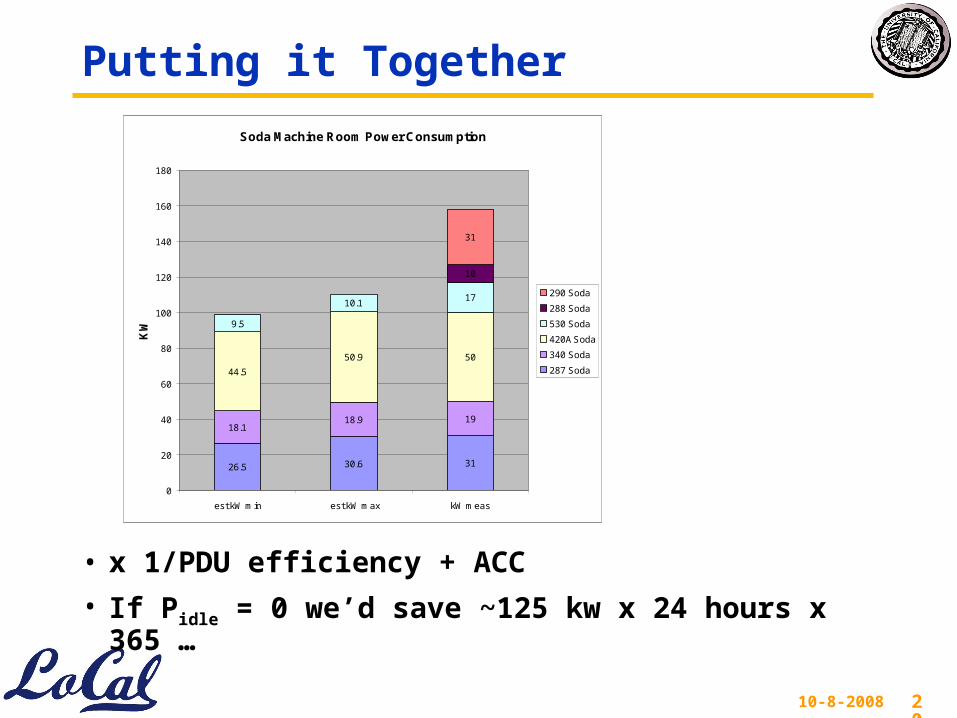
Putting it Together
• x 1/PDU efficiency + ACC
• If Pidle = 0 we’d save ~125 kw x 24 hours x 365 …
Soda Machine Room Power Consumption
26.5 30.6 31
18.118.9 19
44.5
50.9 50
9.5
10.117
10
31
0
20
40
60
80
100
120
140
160
180
est kW min est kW max kW meas
KW
290 Soda
288 Soda
530 Soda
420A Soda
340 Soda
287 Soda
10-8-2008 21
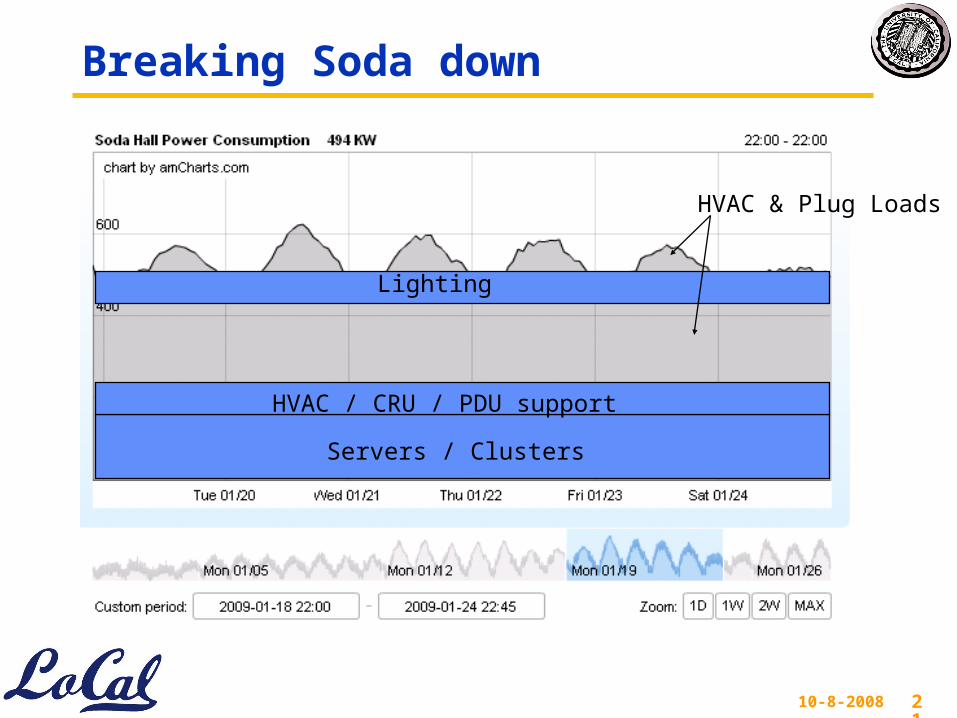
Breaking Soda down
Servers / Clusters
HVAC / CRU / PDU support
Lighting
HVAC & Plug Loads
10-8-2008 22
Plug Loads
• 1178 Hosts (desktops, laptops, switches) in network database
– Power profile, duty cycle?
• Kitchens
• Projectors
• …
10-8-2008 23
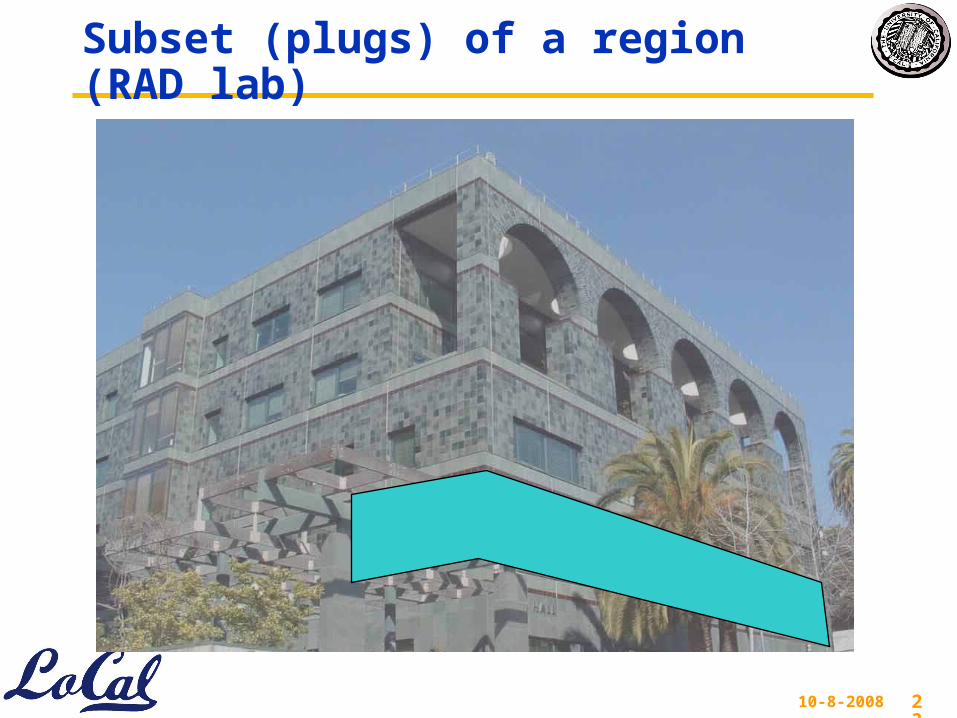
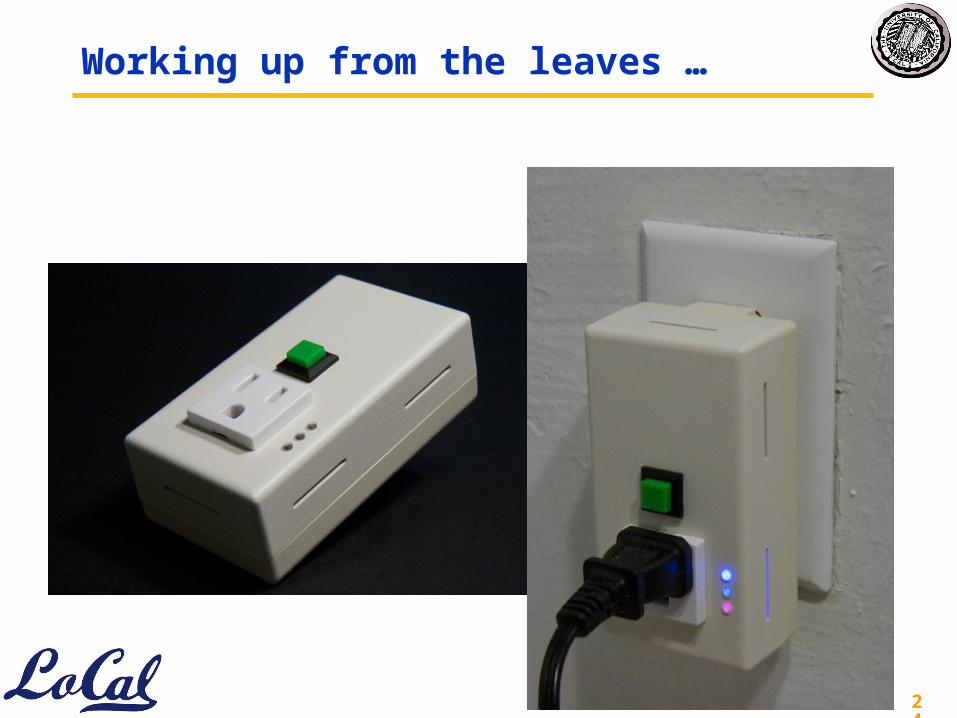
Subset (plugs) of a region (RAD lab)
10-8-2008 24
Working up from the leaves …
10-8-2008 25
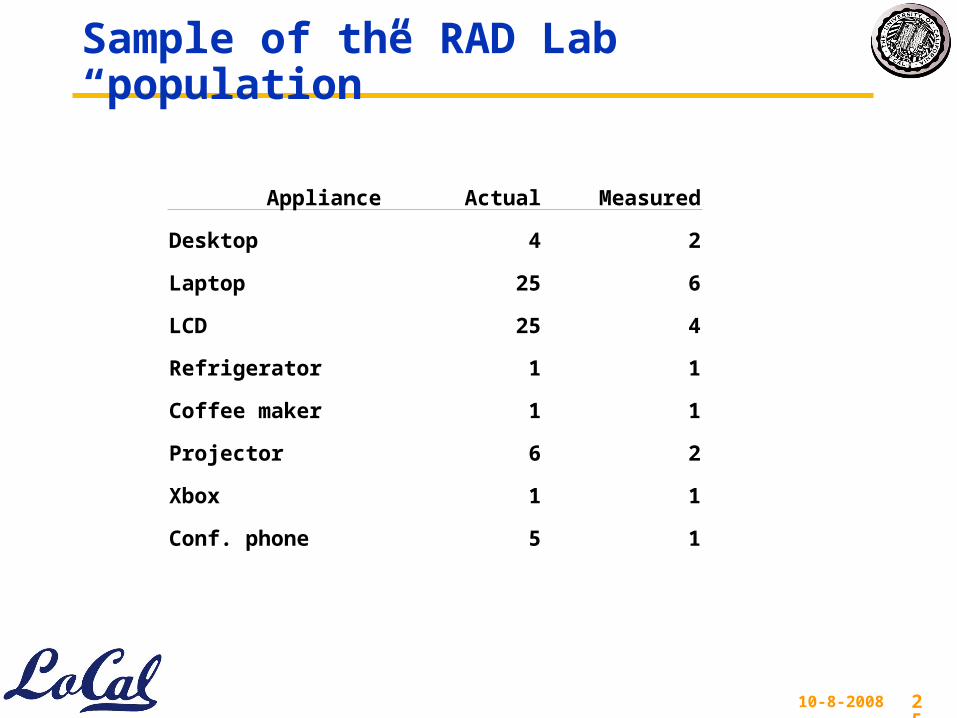
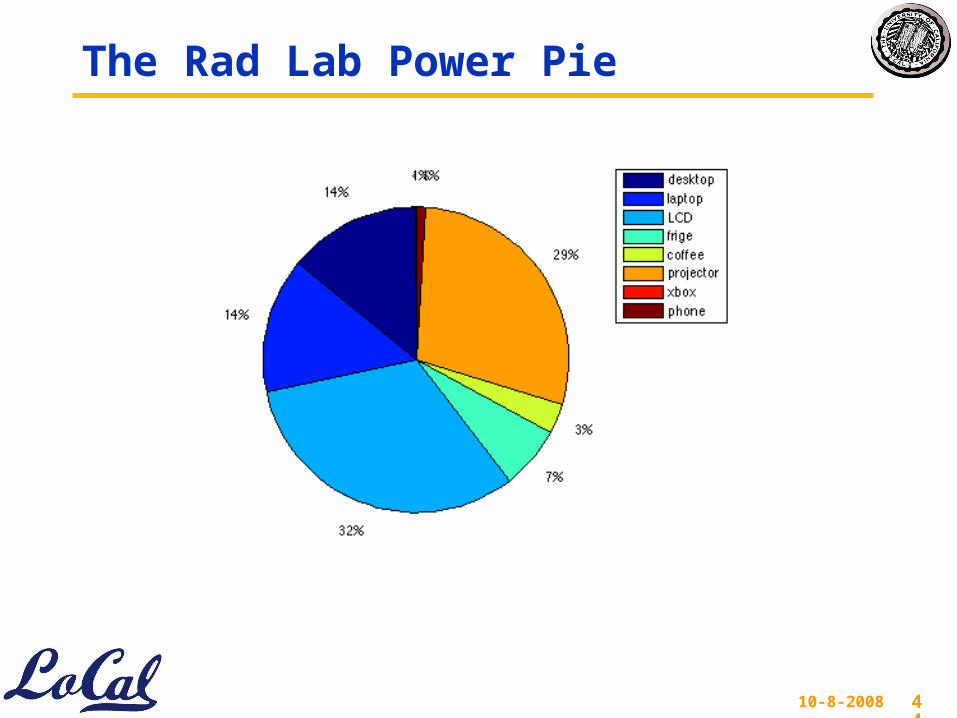
Sample of the RAD Lab “population”
Appliance Actual Measured
Desktop 4 2
Laptop 25 6
LCD 25 4
Refrigerator 1 1
Coffee maker 1 1
Projector 6 2
Xbox 1 1
Conf. phone 5 1
10-8-2008 26
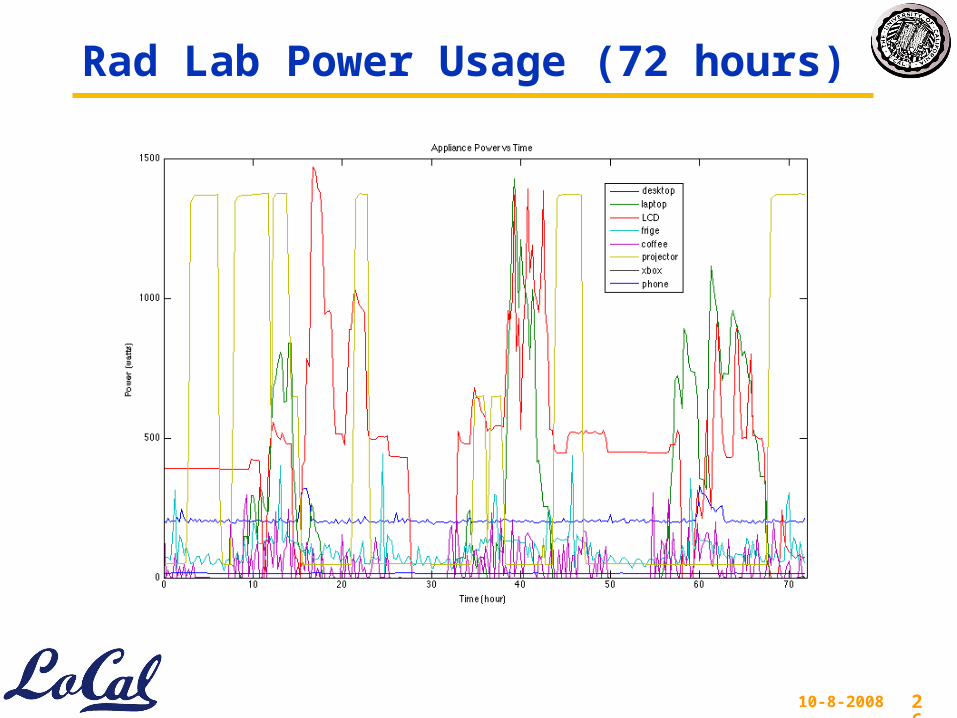
Rad Lab Power Usage (72 hours)
10-8-2008 27
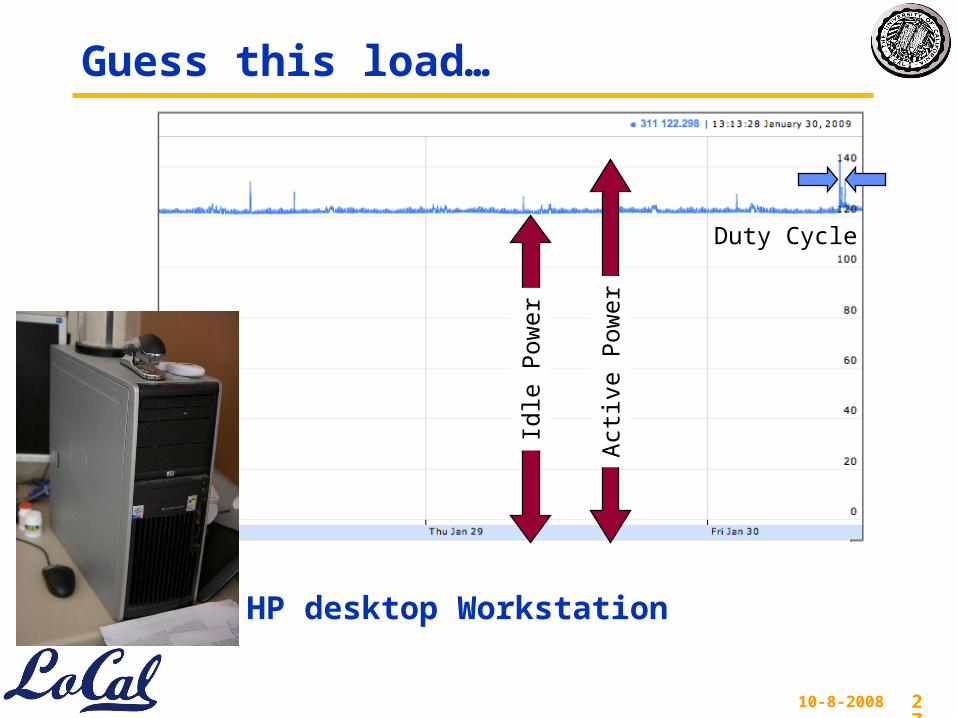
Guess this load…
HP desktop Workstation
Idle
Pow
er
Act
ive
Pow
er
Duty Cycle
10-8-2008 28
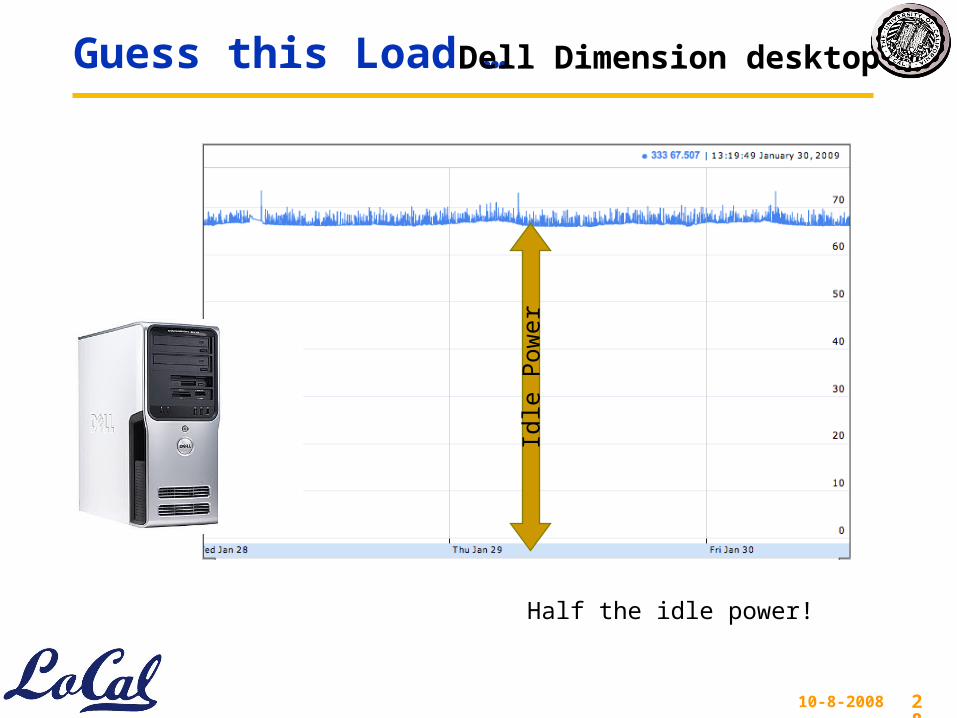
Guess this Load … Dell Dimension desktop
Idle
Pow
er
Half the idle power!
10-8-2008 29
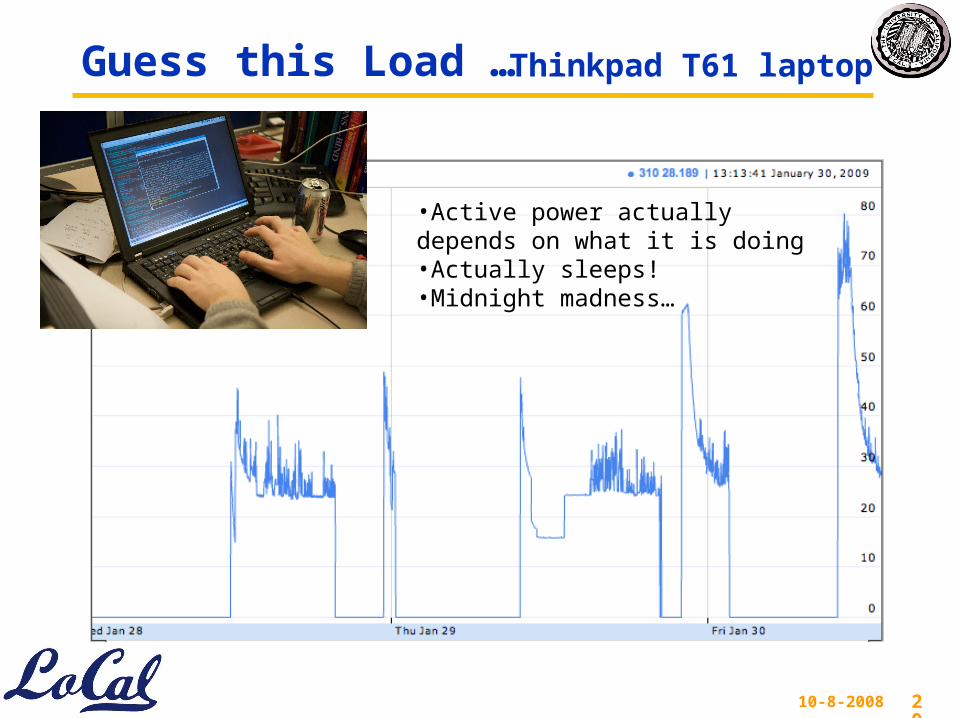
Guess this Load … Thinkpad T61 laptop
•Active power actually depends on what it is doing•Actually sleeps!•Midnight madness…
10-8-2008 30
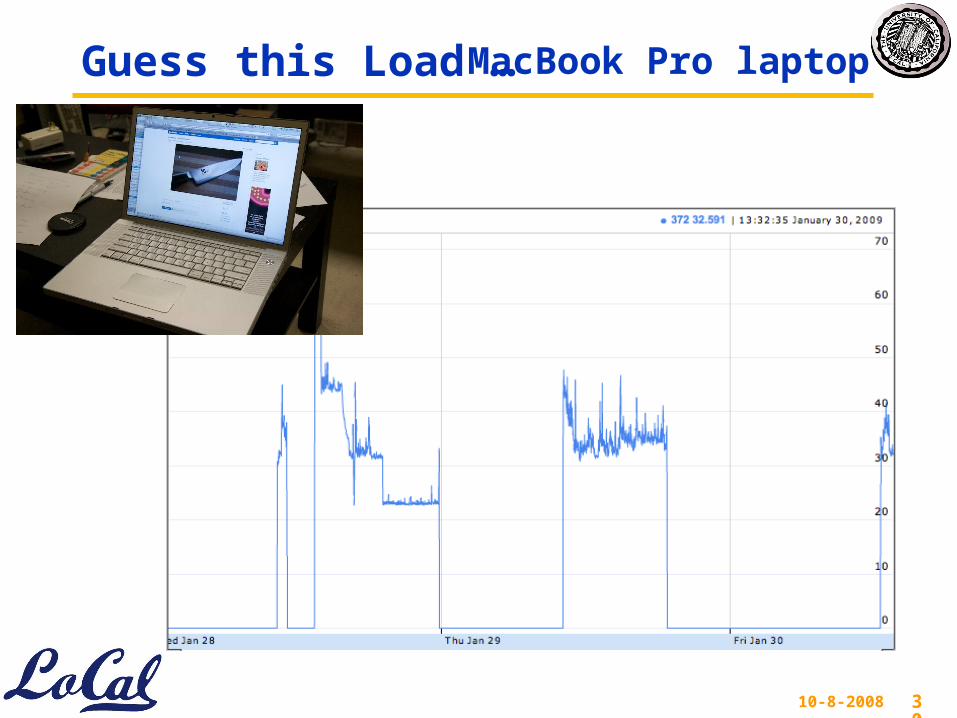
Guess this Load … MacBook Pro laptop
10-8-2008 31
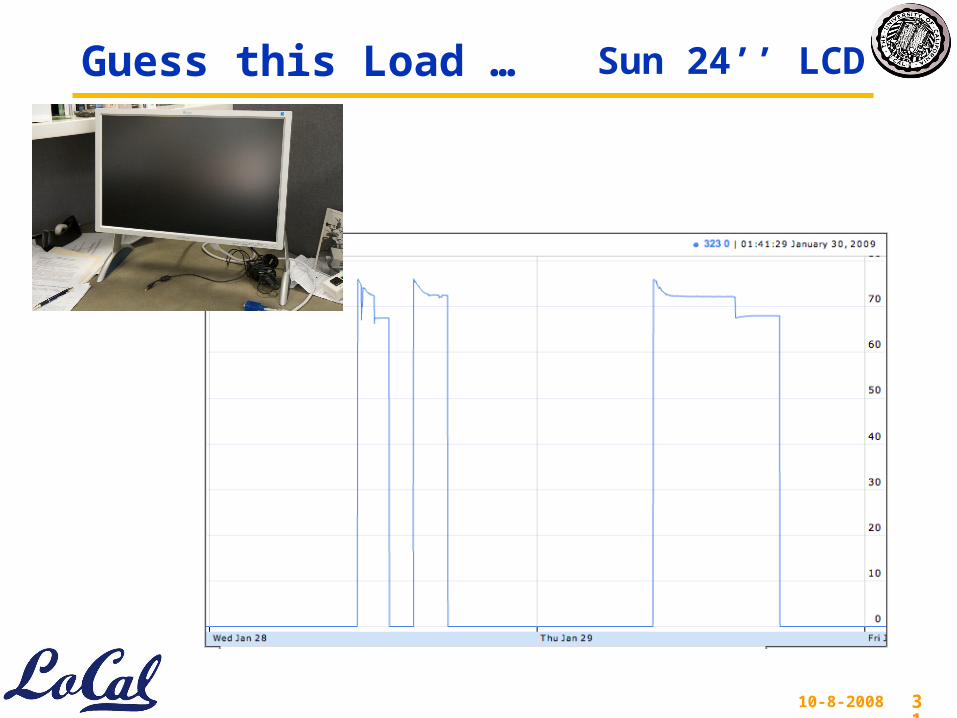
Guess this Load … Sun 24’’ LCD
10-8-2008 32
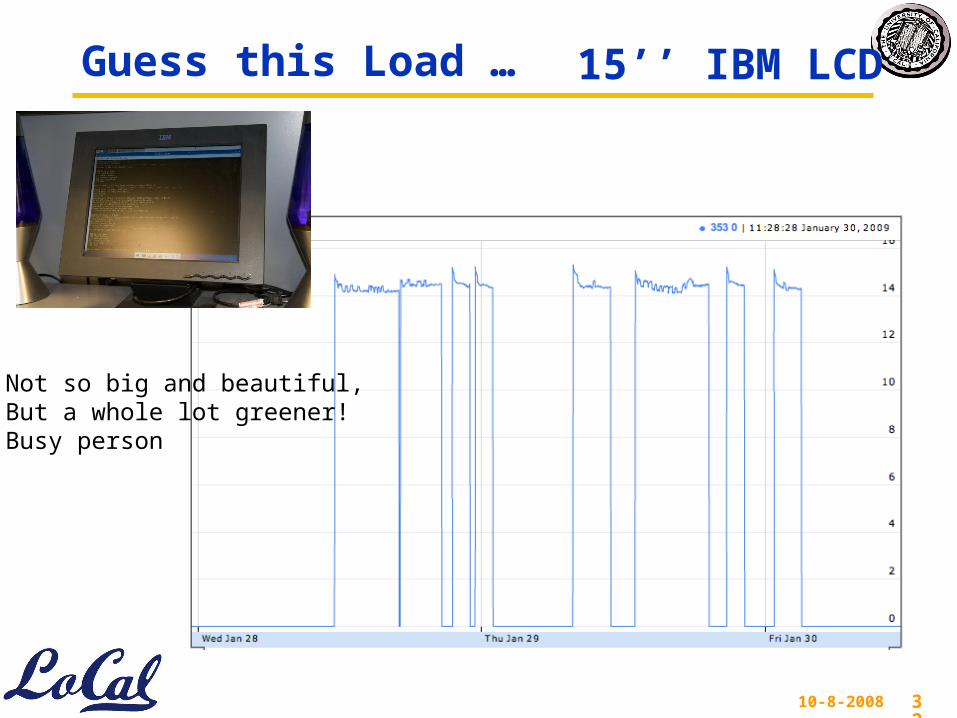
Guess this Load … 15’’ IBM LCD
Not so big and beautiful,But a whole lot greener!Busy person
10-8-2008 33
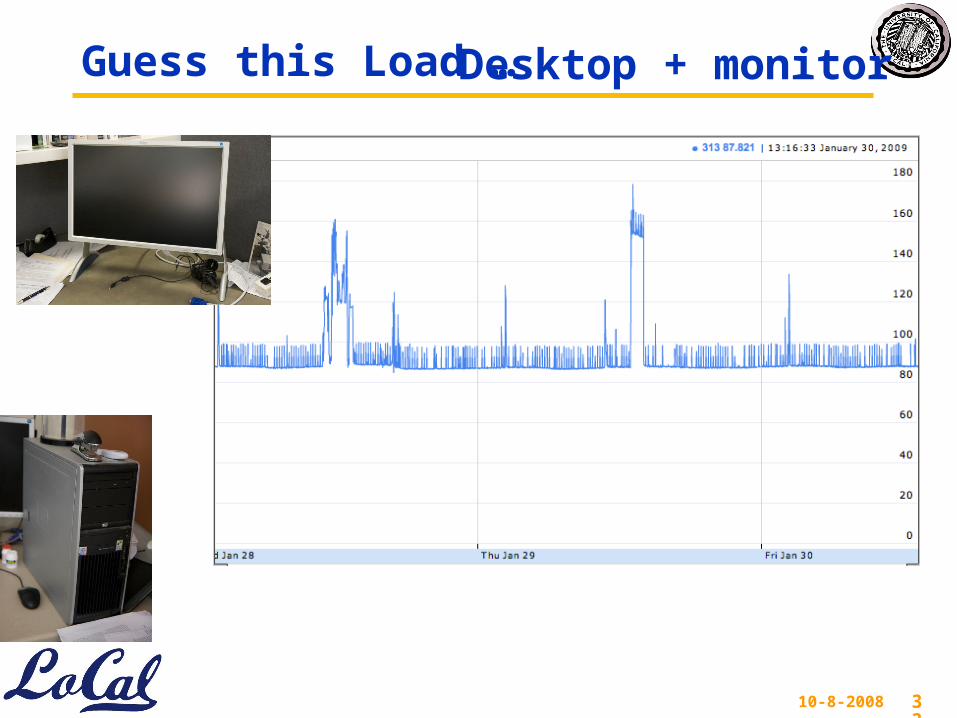
Guess this Load … Desktop + monitor
10-8-2008 34
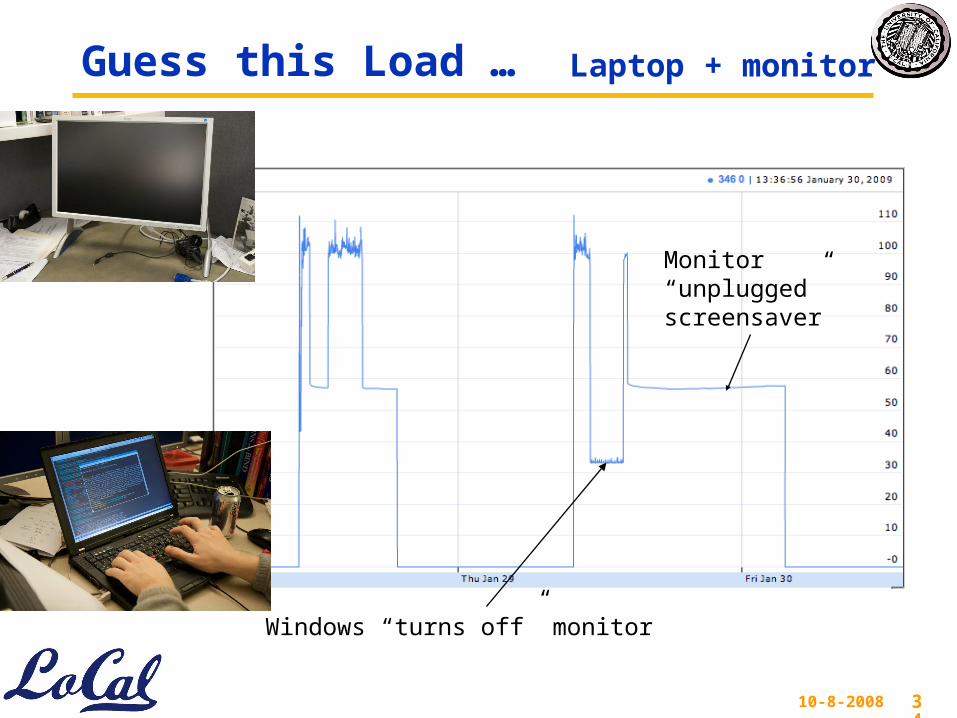
Guess this Load … Laptop + monitor
Windows “turns off” monitor
Monitor “unplugged” screensaver
10-8-2008 35
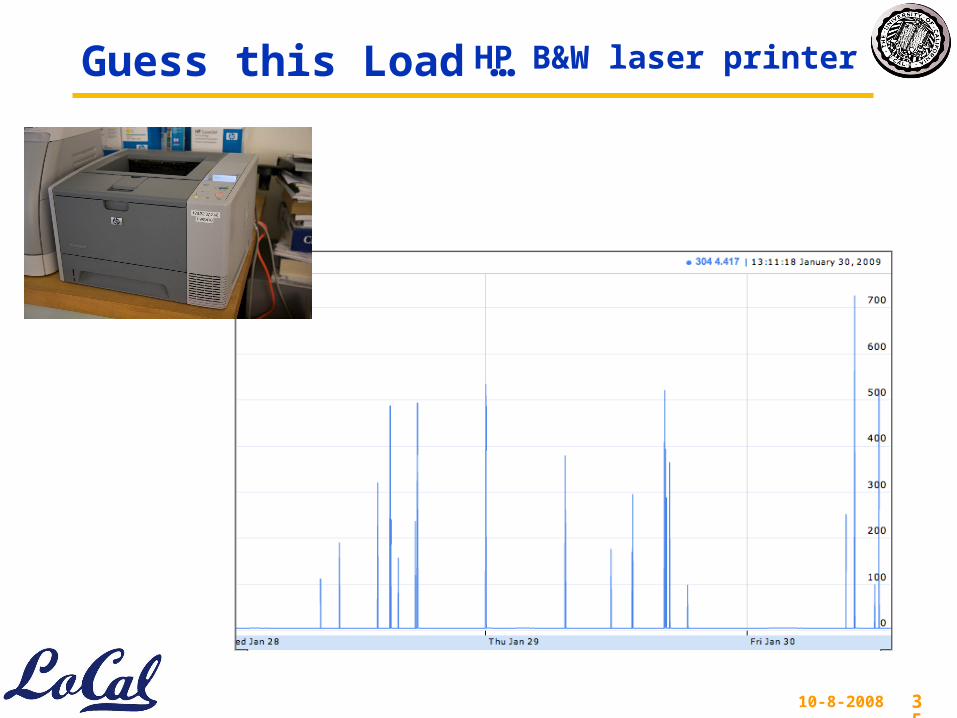
Guess this Load … HP B&W laser printer
10-8-2008 36
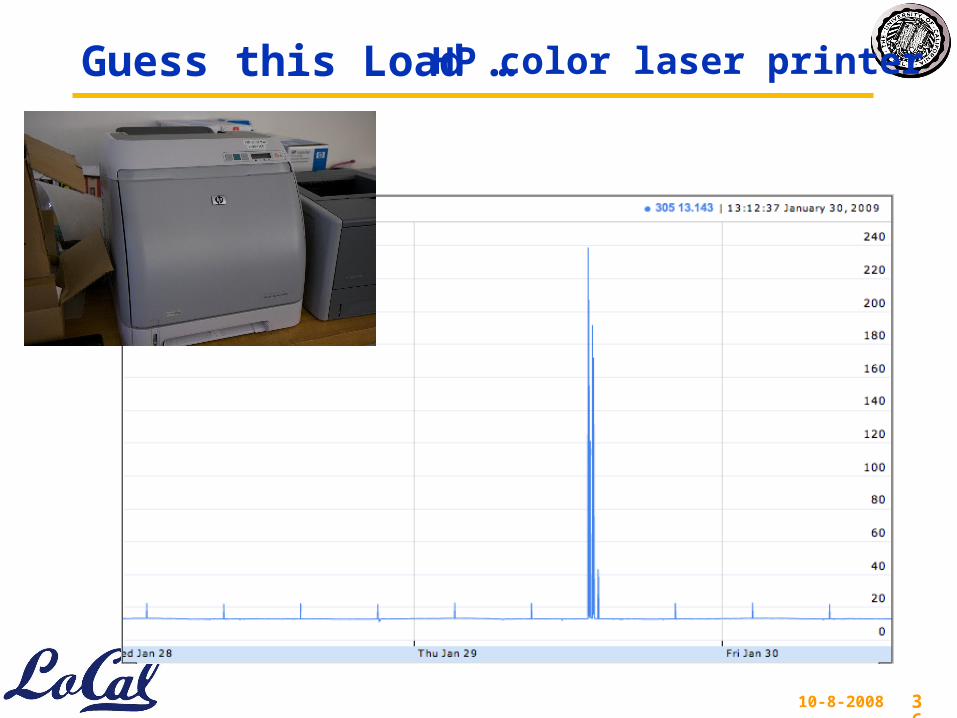
Guess this Load … HP color laser printer
10-8-2008 37
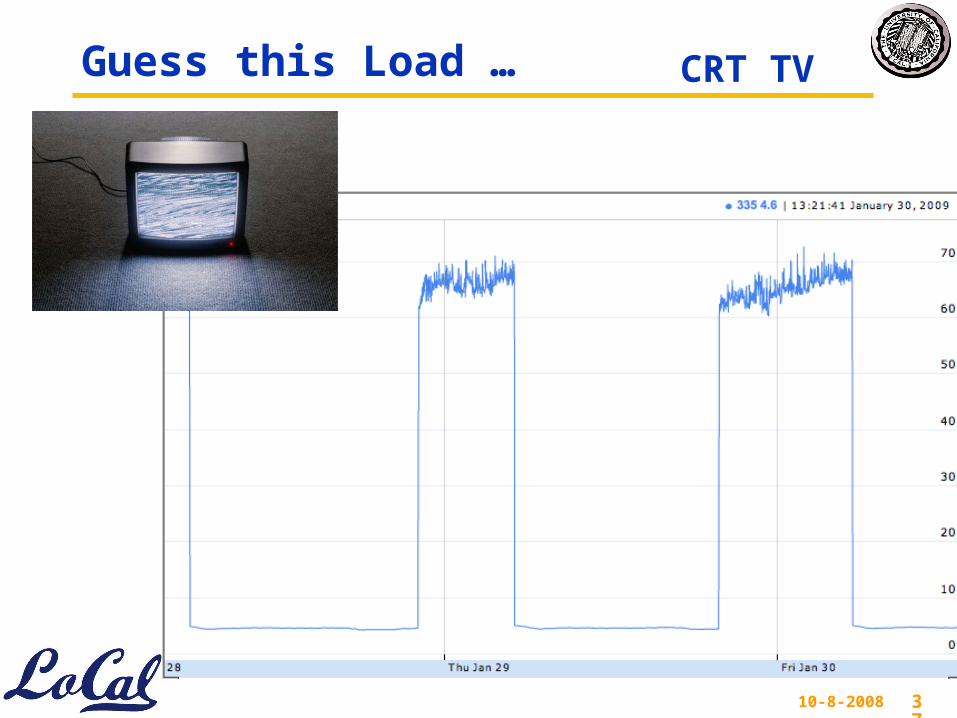
Guess this Load … CRT TV
10-8-2008 38
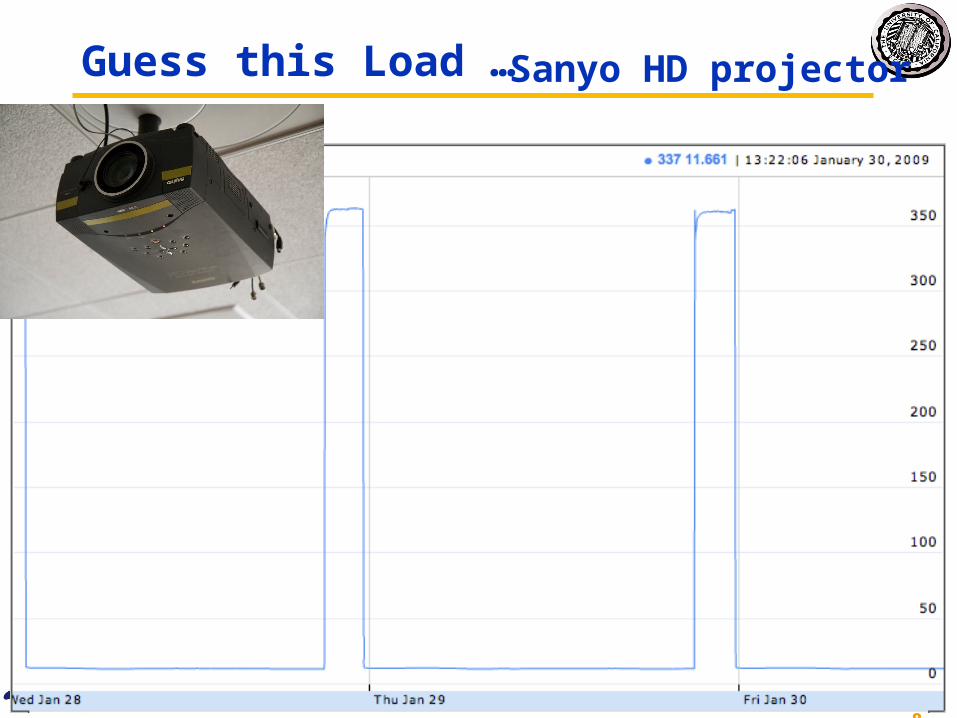
Guess this Load … Sanyo HD projector
10-8-2008 39
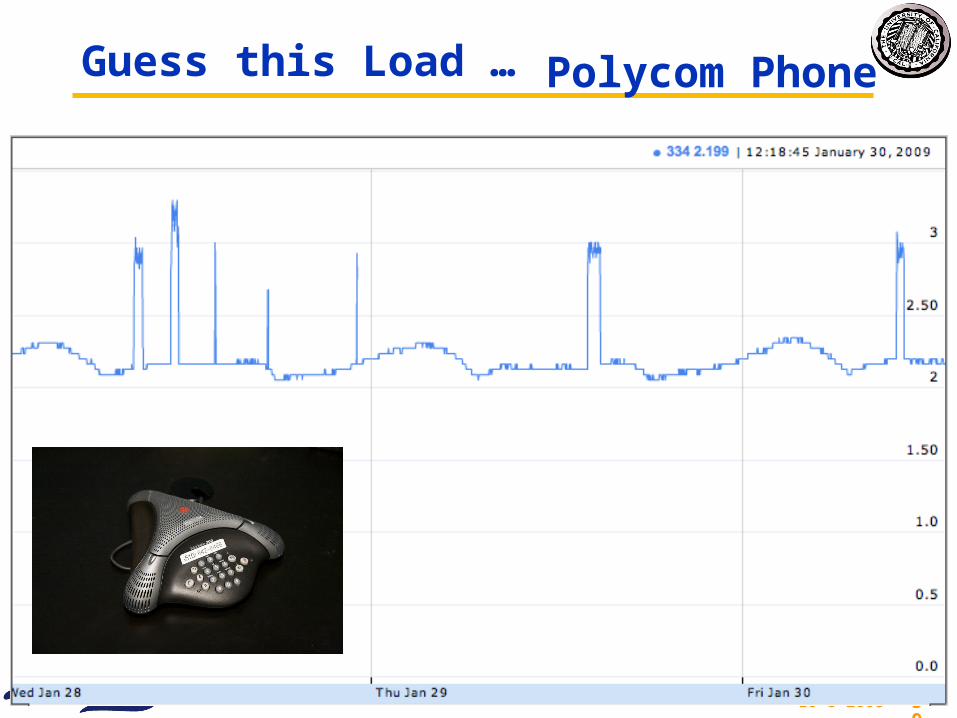
Guess this Load … Polycom Phone
10-8-2008 40
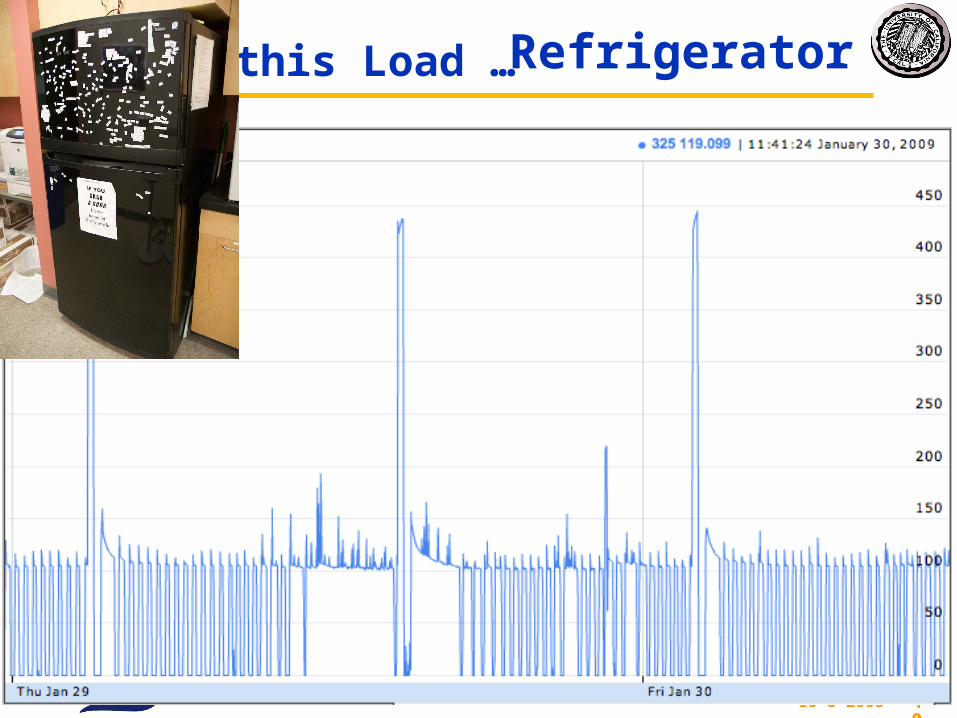
Guess this Load … Refrigerator
10-8-2008 41
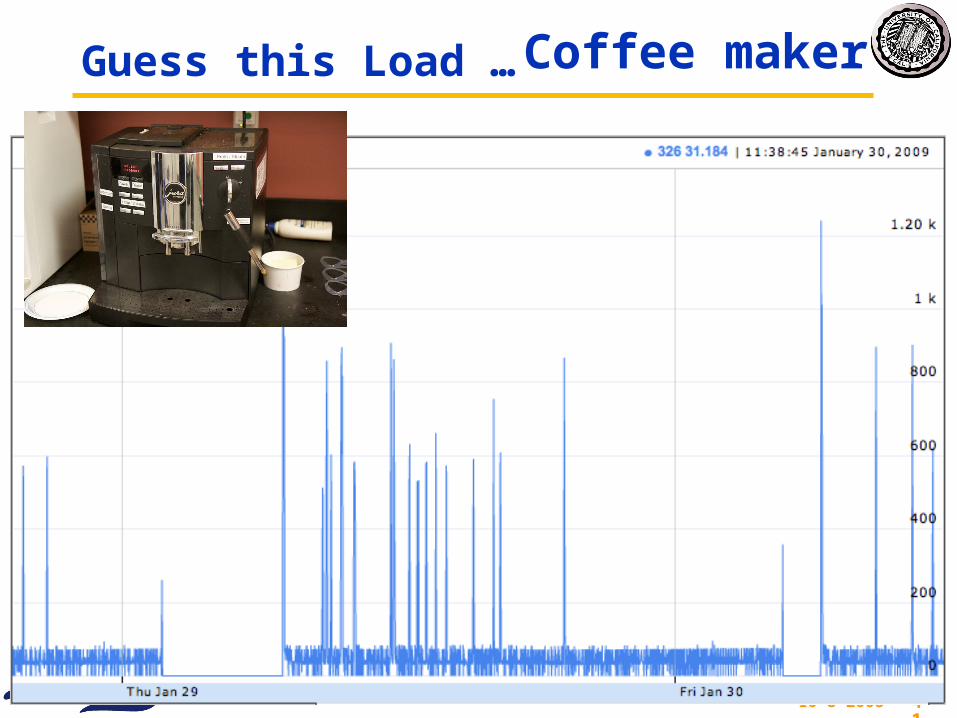
Guess this Load … Coffee maker
10-8-2008 42
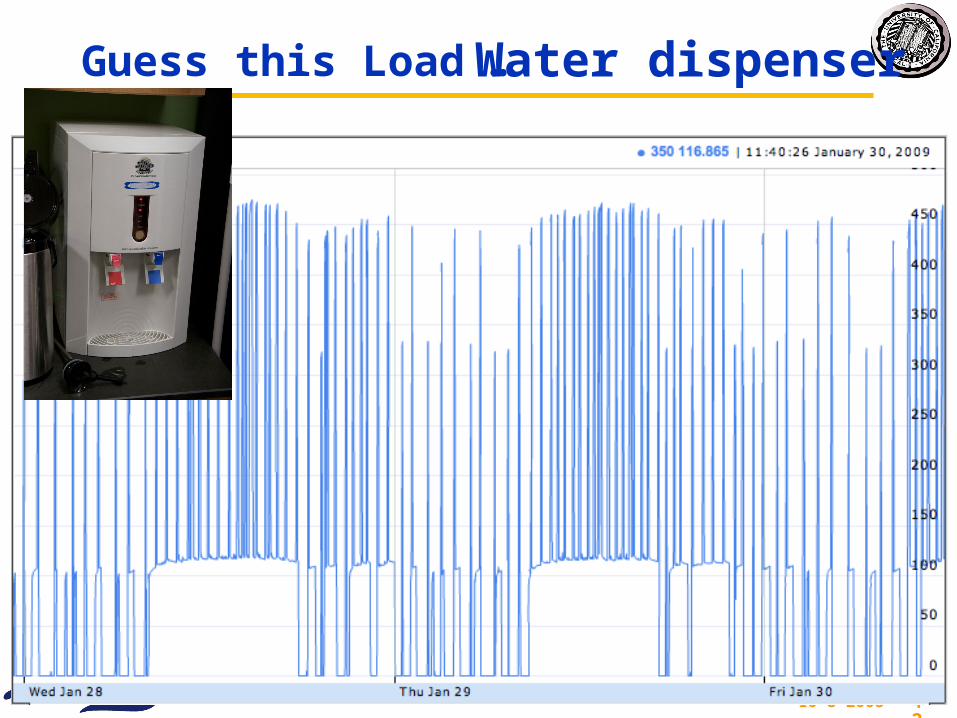
Guess this Load … Water dispenser
10-8-2008 43
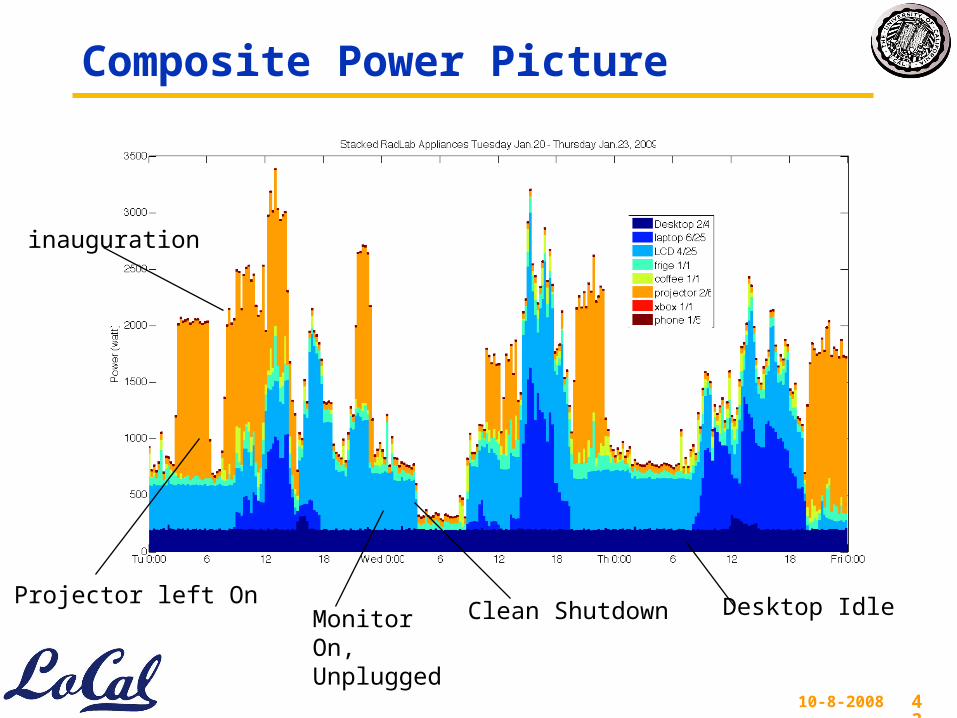
Composite Power Picture
Monitor On, Unplugged
Desktop Idle
inauguration
Projector left OnClean Shutdown
10-8-2008 44
The Rad Lab Power Pie
10-8-2008 45
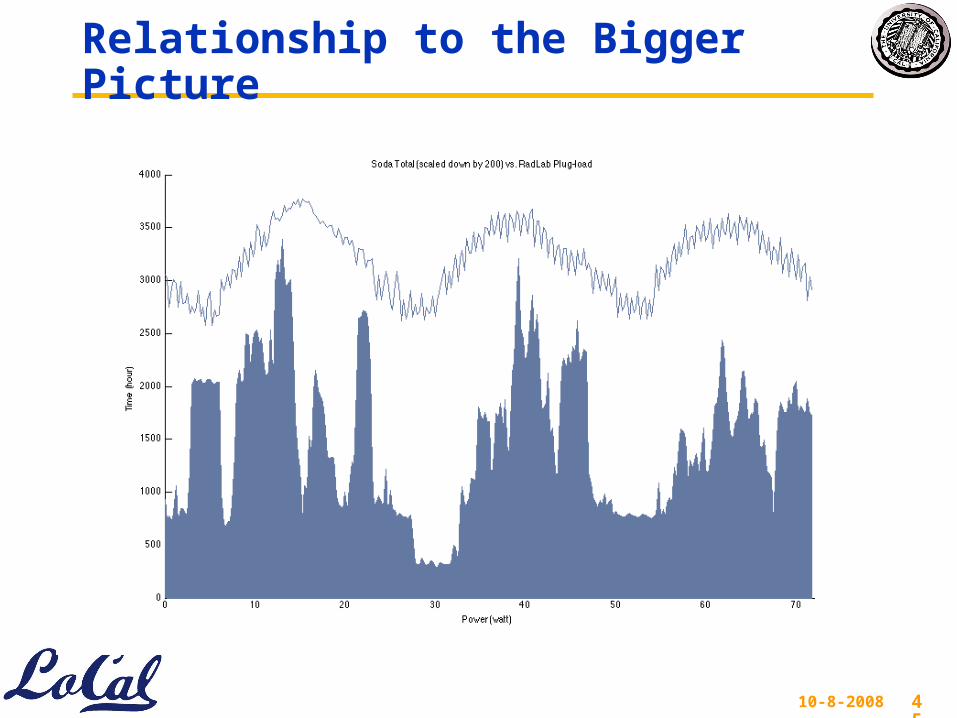
Relationship to the Bigger Picture
10-8-2008 46
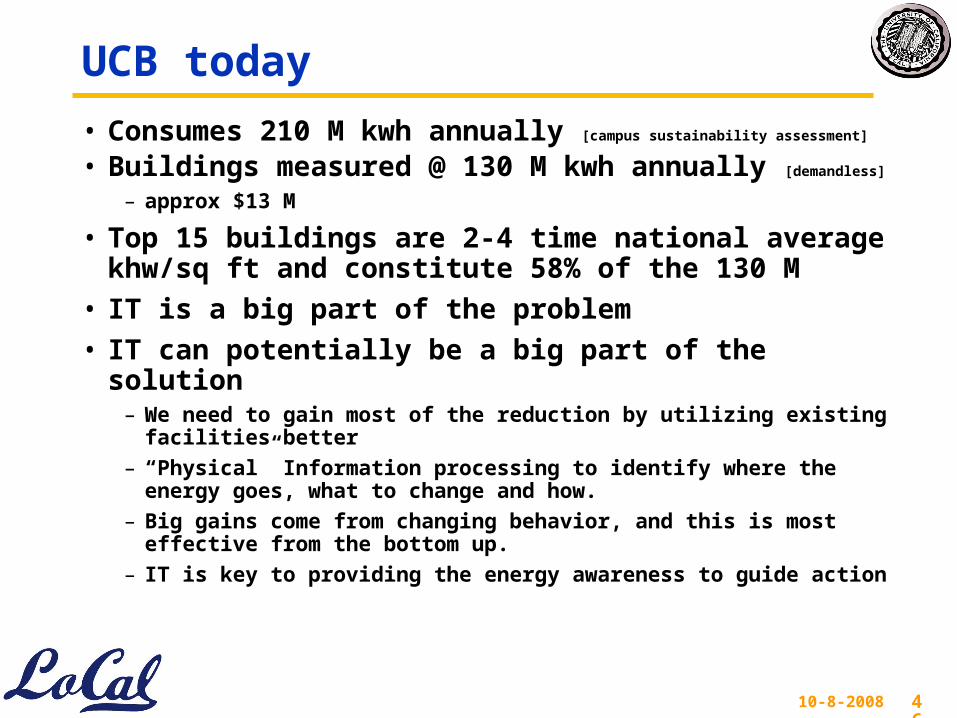
UCB today
• Consumes 210 M kwh annually [campus sustainability assessment]
• Buildings measured @ 130 M kwh annually [demandless]
– approx $13 M
• Top 15 buildings are 2-4 time national average khw/sq ft and constitute 58% of the 130 M
• IT is a big part of the problem
• IT can potentially be a big part of the solution– We need to gain most of the reduction by utilizing existing
facilities better
– “Physical” Information processing to identify where the energy goes, what to change and how.
– Big gains come from changing behavior, and this is most effective from the bottom up.
– IT is key to providing the energy awareness to guide action
10-8-2008 47
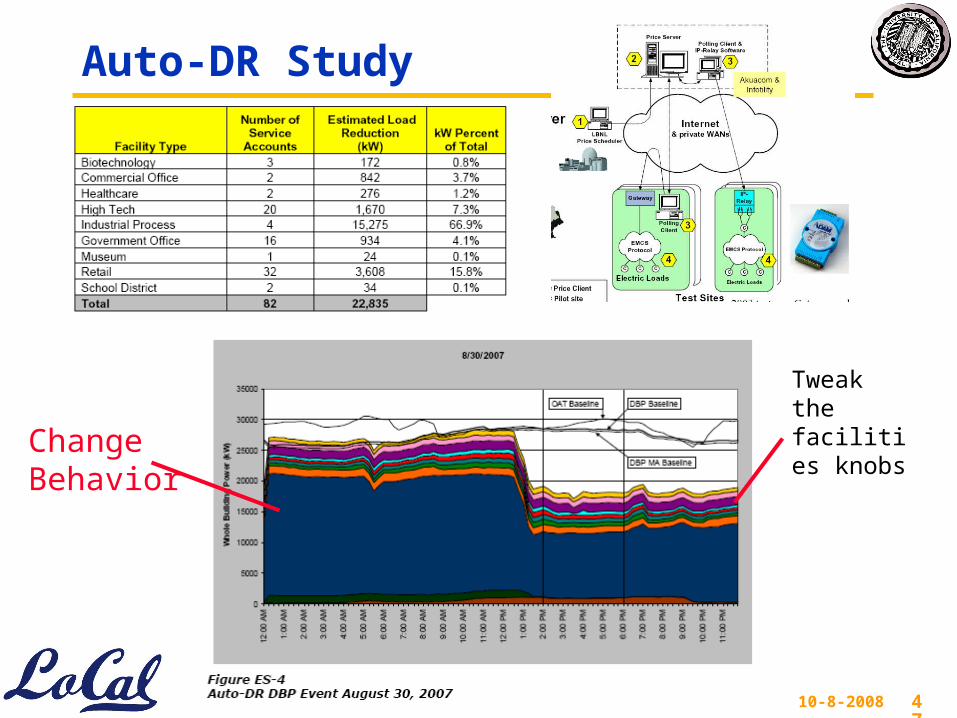
Auto-DR Study
Tweak the facilities knobsChange
Behavior
10-8-2008 48
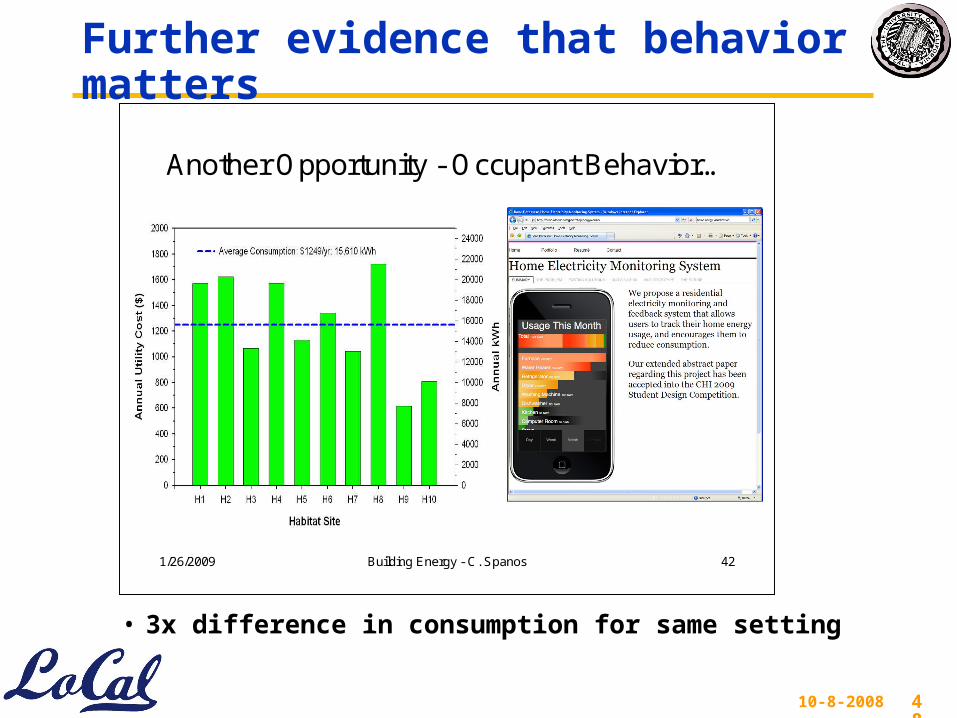
Further evidence that behavior matters
• 3x difference in consumption for same setting
1/26/2009 Building Energy - C. Spanos 42
Another Opportunity - Occupant Behavior…
10-8-2008 49
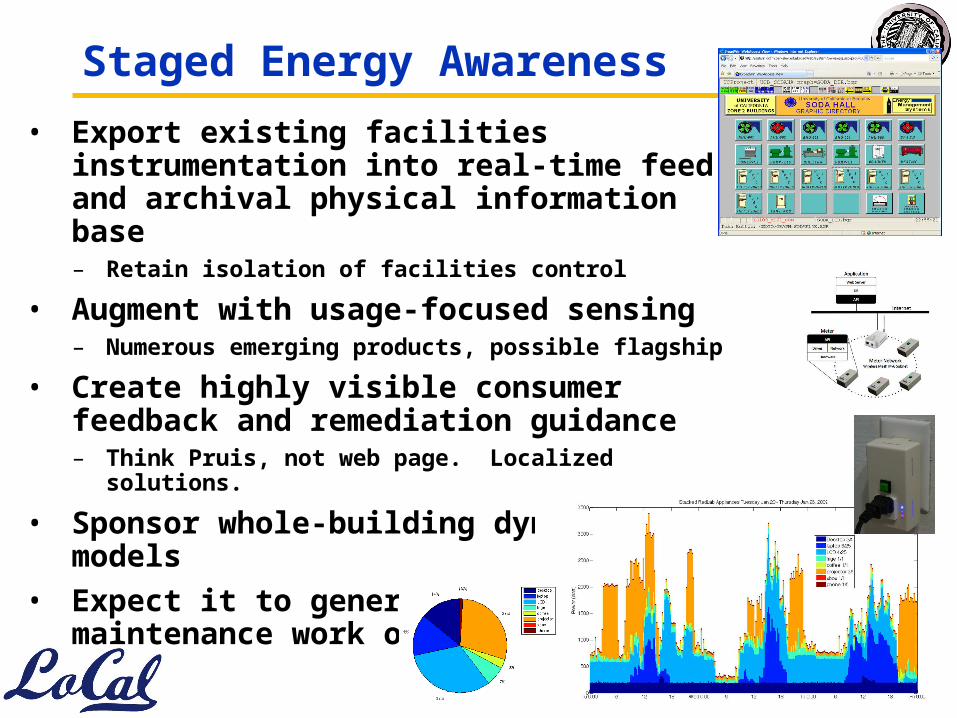
Staged Energy Awareness
• Export existing facilities instrumentation into real-time feed and archival physical information base– Retain isolation of facilities control
• Augment with usage-focused sensing– Numerous emerging products, possible flagship
• Create highly visible consumer feedback and remediation guidance– Think Pruis, not web page. Localized solutions.
• Sponsor whole-building dynamic models
• Expect it to generate maintenance work orders
10-8-2008 50
Resources
• http://www.demandless.org/building/
• http://www.epa.gov/cleanenergy/documents/sector-meeting/4bi_officebuilding.pdf
• http://sustainability.berkeley.edu/
• http://acme.cs.berkeley.edu/