Embed Size (px)
Citation preview
BROWARD COUNTY BB&T CENTER
DUE DILIGENCE REPORT
PREPARED BY: STIFEL, NICOLAUS & COMPANY, INC.
BARRETT SPORTS GROUP, LLC
OCTOBER 13, 2015
Page 1
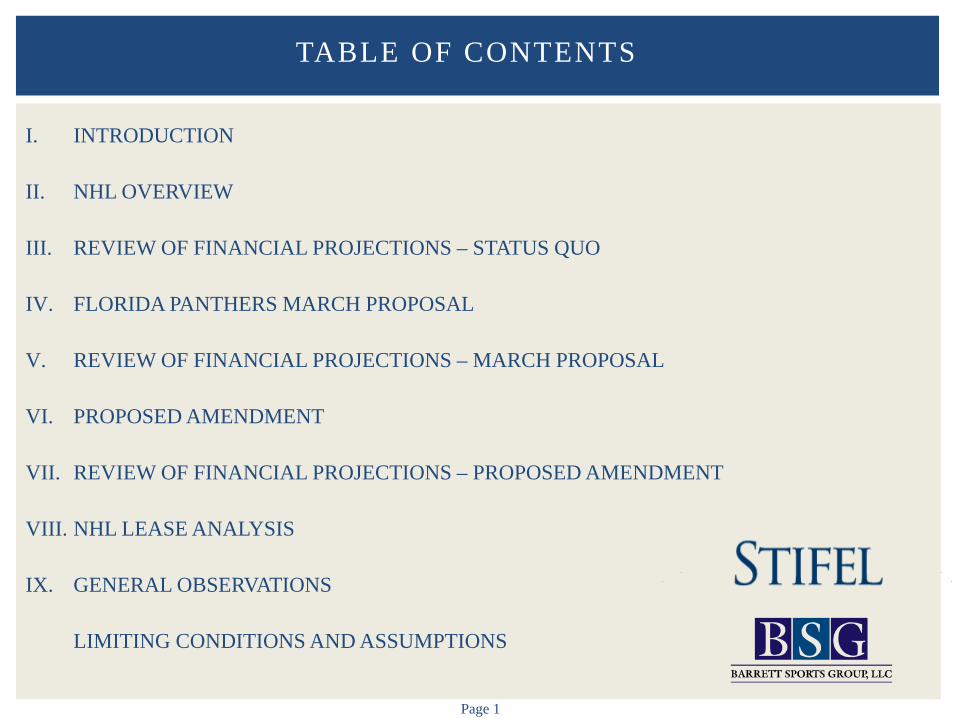
I. INTRODUCTION
II. NHL OVERVIEW
III. REVIEW OF FINANCIAL PROJECTIONS – STATUS QUO
IV. FLORIDA PANTHERS MARCH PROPOSAL
V. REVIEW OF FINANCIAL PROJECTIONS – MARCH PROPOSAL
VI. PROPOSED AMENDMENT
VII. REVIEW OF FINANCIAL PROJECTIONS – PROPOSED AMENDMENT
VIII. NHL LEASE ANALYSIS
IX. GENERAL OBSERVATIONS LIMITING CONDITIONS AND ASSUMPTIONS
TABLE OF CONTENTS

I. INTRODUCTION
Page 3
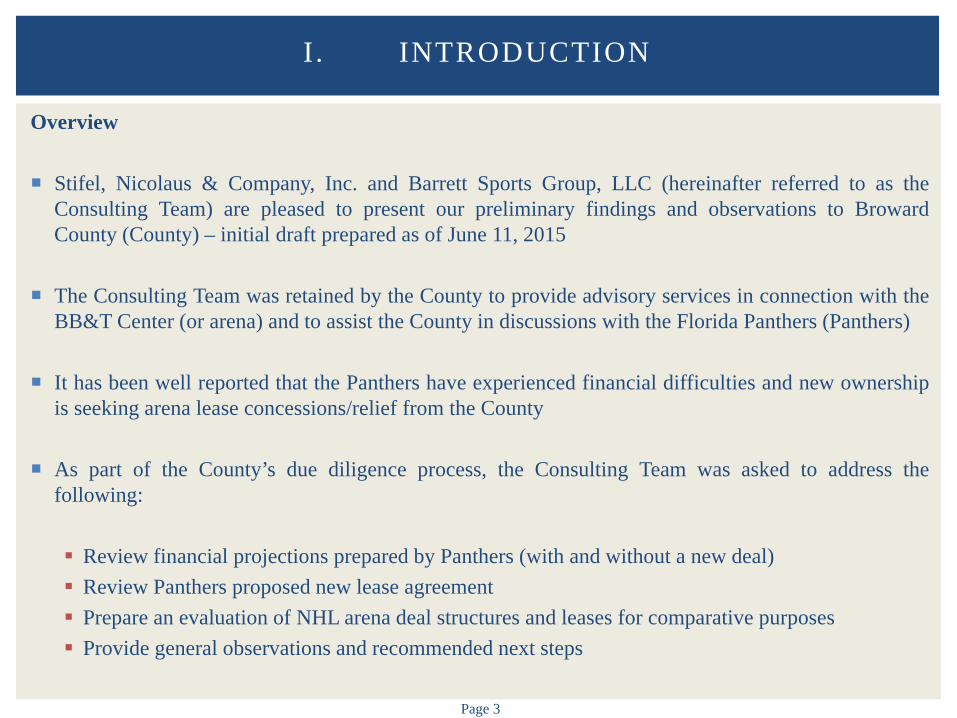
Overview
Stifel, Nicolaus & Company, Inc. and Barrett Sports Group, LLC (hereinafter referred to as the Consulting Team) are pleased to present our preliminary findings and observations to Broward County (County) – initial draft prepared as of June 11, 2015
The Consulting Team was retained by the County to provide advisory services in connection with the BB&T Center (or arena) and to assist the County in discussions with the Florida Panthers (Panthers)
It has been well reported that the Panthers have experienced financial difficulties and new ownership is seeking arena lease concessions/relief from the County
As part of the County’s due diligence process, the Consulting Team was asked to address the following: Review financial projections prepared by Panthers (with and without a new deal) Review Panthers proposed new lease agreement Prepare an evaluation of NHL arena deal structures and leases for comparative purposes Provide general observations and recommended next steps
I . INTRODUCTION

II. NHL OVERVIEW
Page 5
Overview
NHL is the world’s premier professional hockey league Established in 1917 with “Original Six” teams NHL is currently comprised of 30 teams (7 teams are located in Canada)
Since the league was established, there have been several expansion periods 1920s – four expansion franchises 1960s – seven expansion franchises 1970s – eight expansion franchises 1990s – seven expansion franchises 2000 – two expansion franchises
Gary Bettman was named NHL Commissioner on February 1, 1993 – other key executives Bill Daly – Deputy Commissioner John Collins – COO Colin Campbell – Senior Executive VP/Hockey Operations Craig Harnett – CFO David Zimmerman – Executive VP/Chief Legal Officer & General Counsel Joseph Desousa – Executive VP/Finance David Proper – Executive VP/Media Strategies & Distribution
II. NHL OVERVIEW
Page 6
Overview
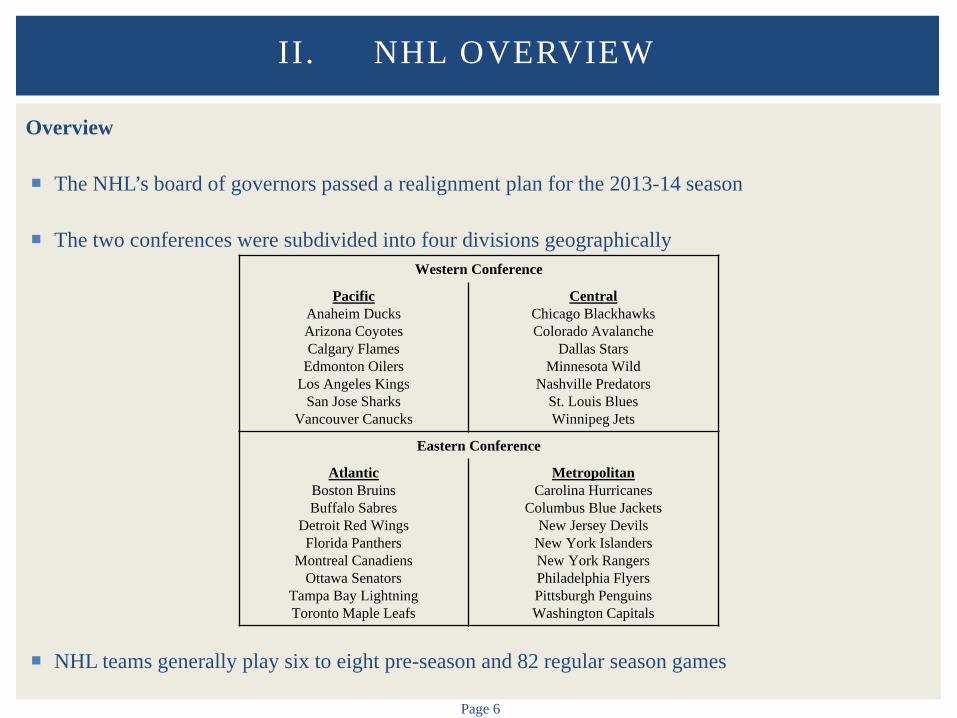
The NHL’s board of governors passed a realignment plan for the 2013-14 season
The two conferences were subdivided into four divisions geographically
NHL teams generally play six to eight pre-season and 82 regular season games
II. NHL OVERVIEW
Western Conference
Pacific Anaheim Ducks Arizona Coyotes Calgary Flames
Edmonton Oilers Los Angeles Kings
San Jose Sharks Vancouver Canucks
Central Chicago Blackhawks Colorado Avalanche
Dallas Stars Minnesota Wild
Nashville Predators St. Louis Blues Winnipeg Jets
Eastern Conference
Atlantic Boston Bruins Buffalo Sabres
Detroit Red Wings Florida Panthers
Montreal Canadiens Ottawa Senators
Tampa Bay Lightning Toronto Maple Leafs
Metropolitan Carolina Hurricanes
Columbus Blue Jackets New Jersey Devils
New York Islanders New York Rangers Philadelphia Flyers Pittsburgh Penguins Washington Capitals
Page 7
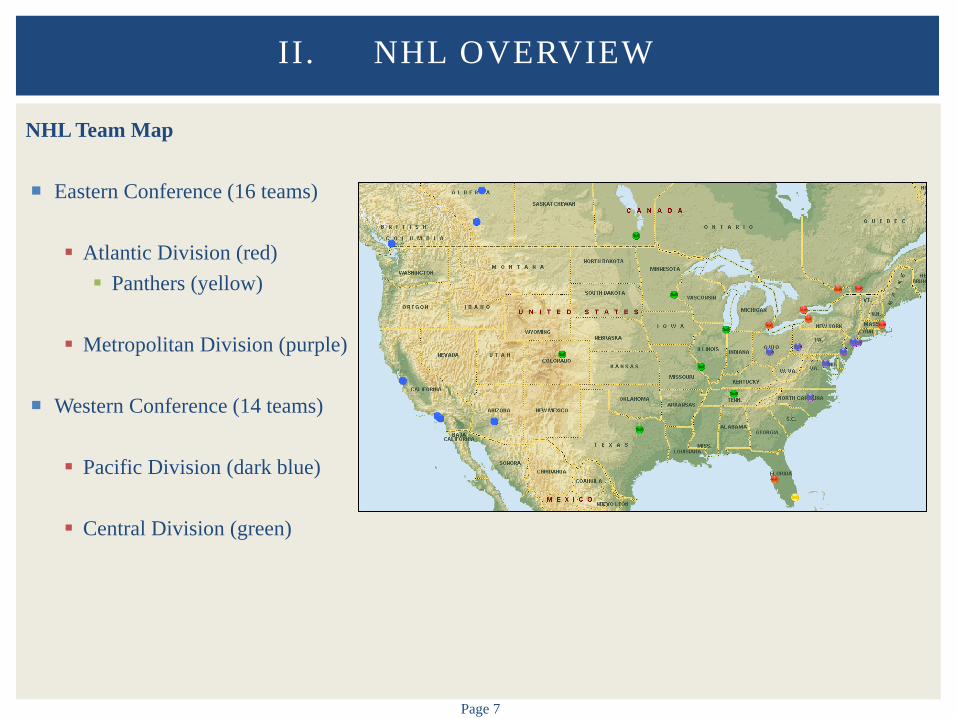
NHL Team Map
Eastern Conference (16 teams)
Atlantic Division (red) Panthers (yellow)
Metropolitan Division (purple)
Western Conference (14 teams)
Pacific Division (dark blue)
Central Division (green)
II. NHL OVERVIEW
Page 8
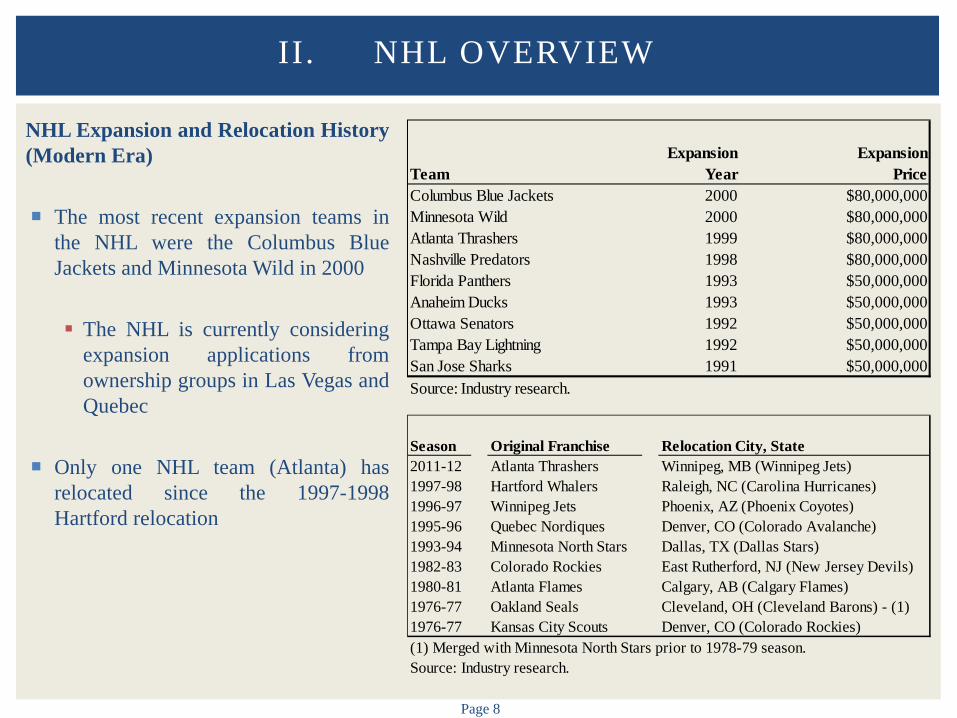
NHL Expansion and Relocation History (Modern Era)
The most recent expansion teams in
the NHL were the Columbus Blue Jackets and Minnesota Wild in 2000
The NHL is currently considering
expansion applications from ownership groups in Las Vegas and Quebec
Only one NHL team (Atlanta) has
relocated since the 1997-1998 Hartford relocation
II. NHL OVERVIEW
Season Original Franchise Relocation City, State2011-12 Atlanta Thrashers Winnipeg, MB (Winnipeg Jets)1997-98 Hartford Whalers Raleigh, NC (Carolina Hurricanes)1996-97 Winnipeg Jets Phoenix, AZ (Phoenix Coyotes)1995-96 Quebec Nordiques Denver, CO (Colorado Avalanche)1993-94 Minnesota North Stars Dallas, TX (Dallas Stars)1982-83 Colorado Rockies East Rutherford, NJ (New Jersey Devils)1980-81 Atlanta Flames Calgary, AB (Calgary Flames)1976-77 Oakland Seals Cleveland, OH (Cleveland Barons) - (1)1976-77 Kansas City Scouts Denver, CO (Colorado Rockies)(1) Merged with Minnesota North Stars prior to 1978-79 season.Source: Industry research.
Expansion ExpansionTeam Year PriceColumbus Blue Jackets 2000 $80,000,000Minnesota Wild 2000 $80,000,000Atlanta Thrashers 1999 $80,000,000Nashville Predators 1998 $80,000,000Florida Panthers 1993 $50,000,000Anaheim Ducks 1993 $50,000,000Ottawa Senators 1992 $50,000,000Tampa Bay Lightning 1992 $50,000,000San Jose Sharks 1991 $50,000,000Source: Industry research.
Page 9
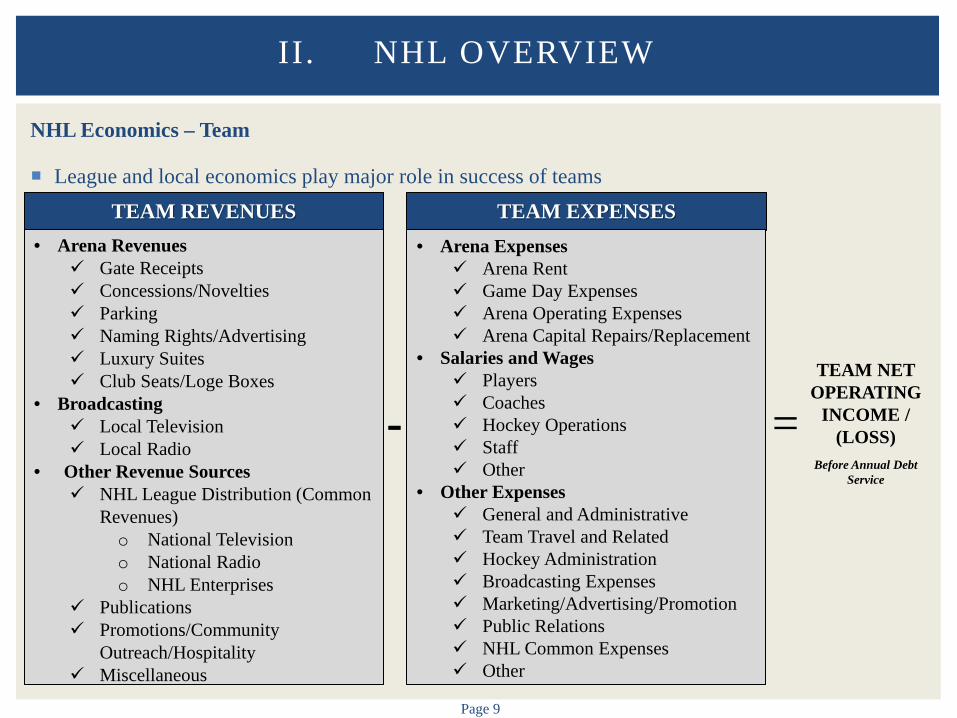
NHL Economics – Team
League and local economics play major role in success of teams
II. NHL OVERVIEW
TEAM REVENUES • Arena Revenues
Gate Receipts Concessions/Novelties Parking Naming Rights/Advertising Luxury Suites Club Seats/Loge Boxes
• Broadcasting Local Television Local Radio
• Other Revenue Sources NHL League Distribution (Common
Revenues) o National Television o National Radio o NHL Enterprises
Publications Promotions/Community
Outreach/Hospitality Miscellaneous
TEAM EXPENSES • Arena Expenses
Arena Rent Game Day Expenses Arena Operating Expenses Arena Capital Repairs/Replacement
• Salaries and Wages Players Coaches Hockey Operations Staff Other
• Other Expenses General and Administrative Team Travel and Related Hockey Administration Broadcasting Expenses Marketing/Advertising/Promotion Public Relations NHL Common Expenses Other
- = TEAM NET
OPERATING INCOME /
(LOSS)
Before Annual Debt Service
Page 10
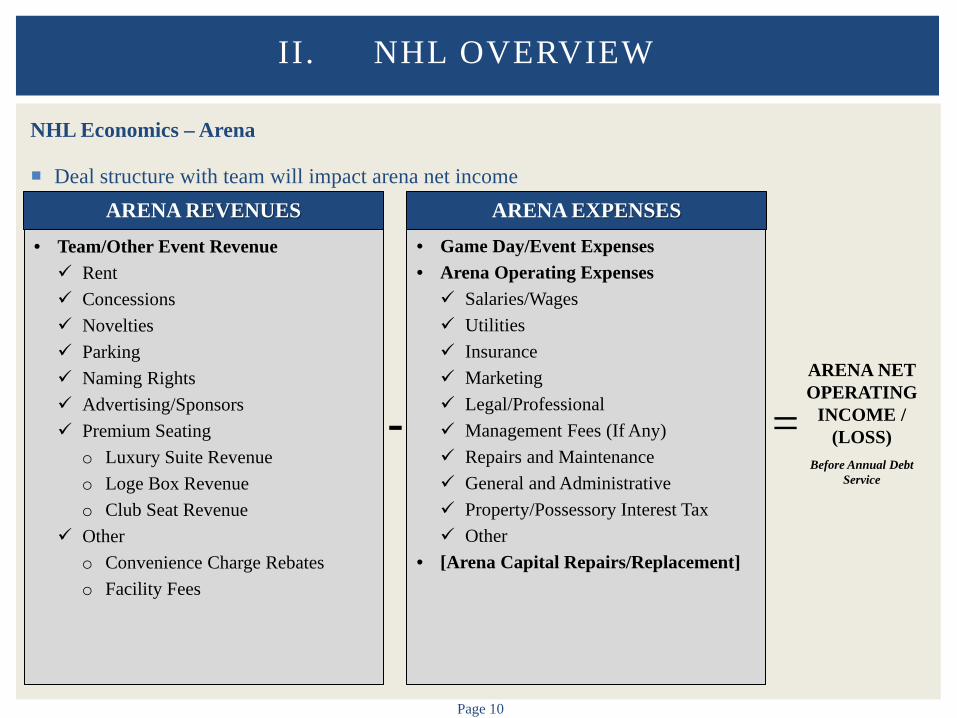
NHL Economics – Arena
Deal structure with team will impact arena net income
II. NHL OVERVIEW
-
ARENA REVENUES • Team/Other Event Revenue Rent Concessions Novelties Parking Naming Rights Advertising/Sponsors Premium Seating
o Luxury Suite Revenue o Loge Box Revenue o Club Seat Revenue
Other o Convenience Charge Rebates o Facility Fees
ARENA EXPENSES • Game Day/Event Expenses • Arena Operating Expenses Salaries/Wages Utilities Insurance Marketing Legal/Professional Management Fees (If Any) Repairs and Maintenance General and Administrative Property/Possessory Interest Tax Other
• [Arena Capital Repairs/Replacement]
= ARENA NET OPERATING
INCOME / (LOSS)
Before Annual Debt
Service
Page 11
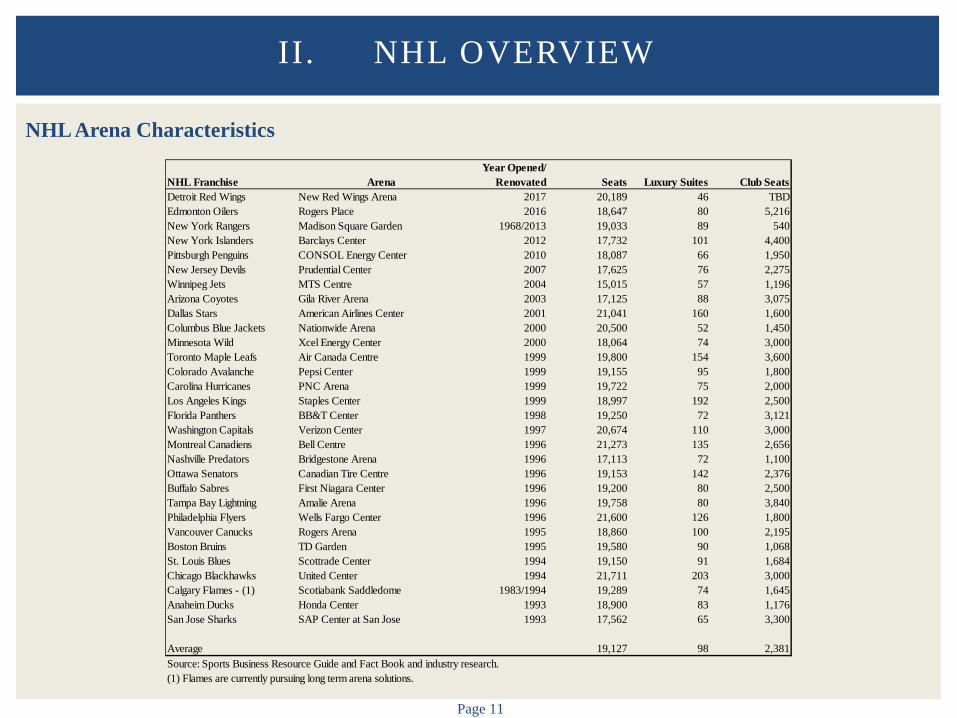
NHL Arena Characteristics
II. NHL OVERVIEW
NHL Franchise ArenaYear Opened/
Renovated Seats Luxury Suites Club SeatsDetroit Red Wings New Red Wings Arena 2017 20,189 46 TBDEdmonton Oilers Rogers Place 2016 18,647 80 5,216New York Rangers Madison Square Garden 1968/2013 19,033 89 540New York Islanders Barclays Center 2012 17,732 101 4,400Pittsburgh Penguins CONSOL Energy Center 2010 18,087 66 1,950New Jersey Devils Prudential Center 2007 17,625 76 2,275Winnipeg Jets MTS Centre 2004 15,015 57 1,196Arizona Coyotes Gila River Arena 2003 17,125 88 3,075Dallas Stars American Airlines Center 2001 21,041 160 1,600Columbus Blue Jackets Nationwide Arena 2000 20,500 52 1,450Minnesota Wild Xcel Energy Center 2000 18,064 74 3,000Toronto Maple Leafs Air Canada Centre 1999 19,800 154 3,600Colorado Avalanche Pepsi Center 1999 19,155 95 1,800Carolina Hurricanes PNC Arena 1999 19,722 75 2,000Los Angeles Kings Staples Center 1999 18,997 192 2,500Florida Panthers BB&T Center 1998 19,250 72 3,121Washington Capitals Verizon Center 1997 20,674 110 3,000Montreal Canadiens Bell Centre 1996 21,273 135 2,656Nashville Predators Bridgestone Arena 1996 17,113 72 1,100Ottawa Senators Canadian Tire Centre 1996 19,153 142 2,376Buffalo Sabres First Niagara Center 1996 19,200 80 2,500Tampa Bay Lightning Amalie Arena 1996 19,758 80 3,840Philadelphia Flyers Wells Fargo Center 1996 21,600 126 1,800Vancouver Canucks Rogers Arena 1995 18,860 100 2,195Boston Bruins TD Garden 1995 19,580 90 1,068St. Louis Blues Scottrade Center 1994 19,150 91 1,684Chicago Blackhawks United Center 1994 21,711 203 3,000Calgary Flames - (1) Scotiabank Saddledome 1983/1994 19,289 74 1,645Anaheim Ducks Honda Center 1993 18,900 83 1,176San Jose Sharks SAP Center at San Jose 1993 17,562 65 3,300
Average 19,127 98 2,381Source: Sports Business Resource Guide and Fact Book and industry research.(1) Flames are currently pursuing long term arena solutions.
Page 12
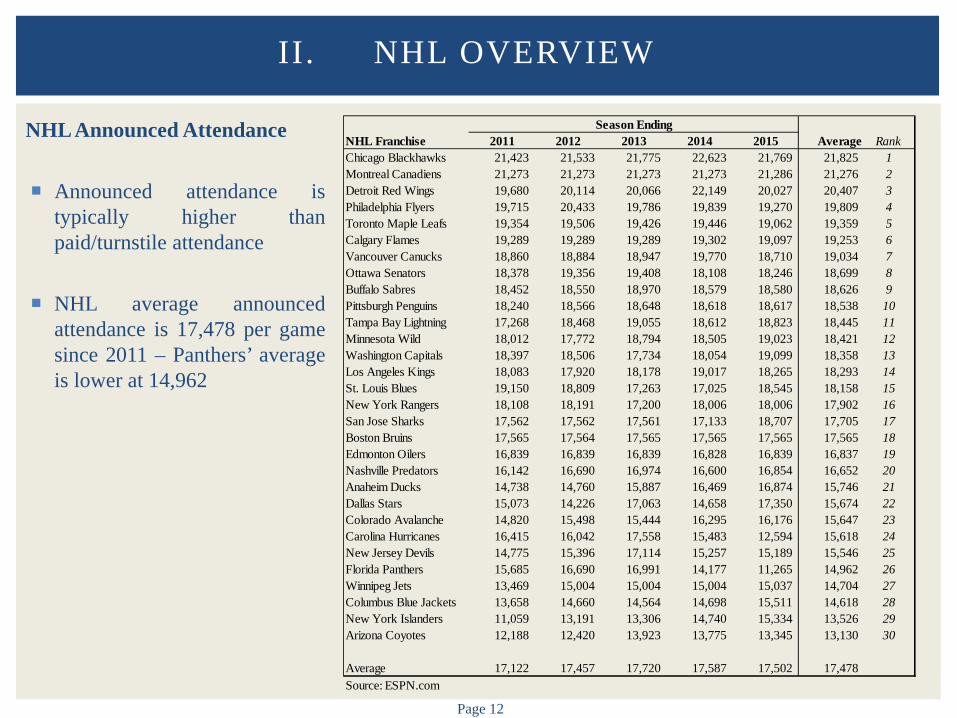
NHL Announced Attendance
Announced attendance is typically higher than paid/turnstile attendance
NHL average announced attendance is 17,478 per game since 2011 – Panthers’ average is lower at 14,962
II. NHL OVERVIEW
NHL Franchise 2011 2012 2013 2014 2015 Average RankChicago Blackhawks 21,423 21,533 21,775 22,623 21,769 21,825 1Montreal Canadiens 21,273 21,273 21,273 21,273 21,286 21,276 2Detroit Red Wings 19,680 20,114 20,066 22,149 20,027 20,407 3Philadelphia Flyers 19,715 20,433 19,786 19,839 19,270 19,809 4Toronto Maple Leafs 19,354 19,506 19,426 19,446 19,062 19,359 5Calgary Flames 19,289 19,289 19,289 19,302 19,097 19,253 6Vancouver Canucks 18,860 18,884 18,947 19,770 18,710 19,034 7Ottawa Senators 18,378 19,356 19,408 18,108 18,246 18,699 8Buffalo Sabres 18,452 18,550 18,970 18,579 18,580 18,626 9Pittsburgh Penguins 18,240 18,566 18,648 18,618 18,617 18,538 10Tampa Bay Lightning 17,268 18,468 19,055 18,612 18,823 18,445 11Minnesota Wild 18,012 17,772 18,794 18,505 19,023 18,421 12Washington Capitals 18,397 18,506 17,734 18,054 19,099 18,358 13Los Angeles Kings 18,083 17,920 18,178 19,017 18,265 18,293 14St. Louis Blues 19,150 18,809 17,263 17,025 18,545 18,158 15New York Rangers 18,108 18,191 17,200 18,006 18,006 17,902 16San Jose Sharks 17,562 17,562 17,561 17,133 18,707 17,705 17Boston Bruins 17,565 17,564 17,565 17,565 17,565 17,565 18Edmonton Oilers 16,839 16,839 16,839 16,828 16,839 16,837 19Nashville Predators 16,142 16,690 16,974 16,600 16,854 16,652 20Anaheim Ducks 14,738 14,760 15,887 16,469 16,874 15,746 21Dallas Stars 15,073 14,226 17,063 14,658 17,350 15,674 22Colorado Avalanche 14,820 15,498 15,444 16,295 16,176 15,647 23Carolina Hurricanes 16,415 16,042 17,558 15,483 12,594 15,618 24New Jersey Devils 14,775 15,396 17,114 15,257 15,189 15,546 25Florida Panthers 15,685 16,690 16,991 14,177 11,265 14,962 26Winnipeg Jets 13,469 15,004 15,004 15,004 15,037 14,704 27Columbus Blue Jackets 13,658 14,660 14,564 14,698 15,511 14,618 28New York Islanders 11,059 13,191 13,306 14,740 15,334 13,526 29Arizona Coyotes 12,188 12,420 13,923 13,775 13,345 13,130 30
Average 17,122 17,457 17,720 17,587 17,502 17,478 Source: ESPN.com
Season Ending
Page 13
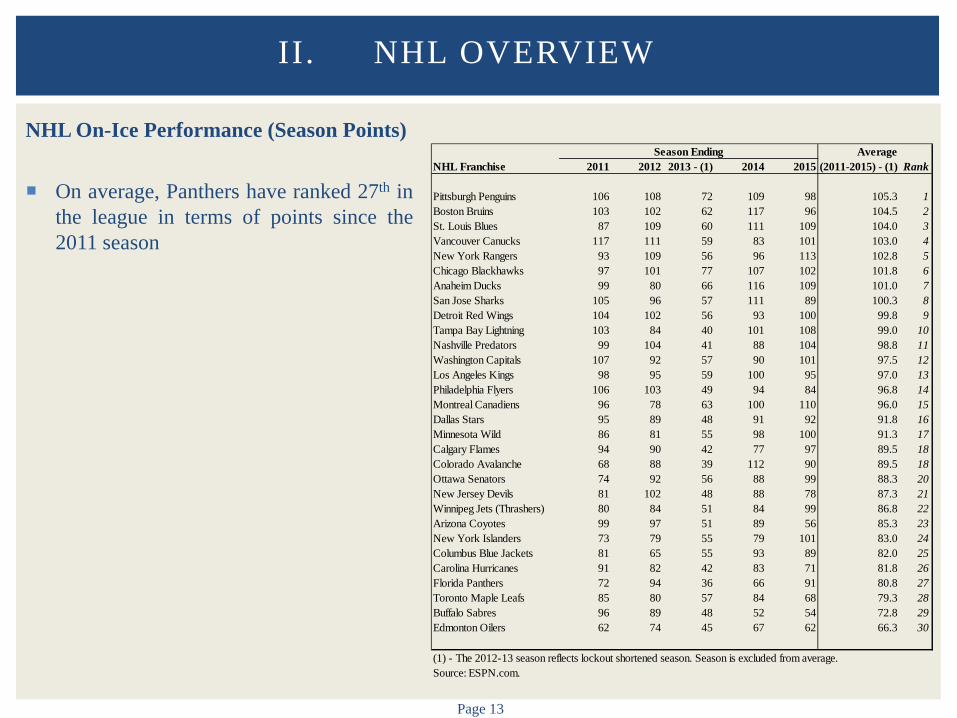
NHL On-Ice Performance (Season Points) On average, Panthers have ranked 27th in
the league in terms of points since the 2011 season
II. NHL OVERVIEW
AverageNHL Franchise 2011 2012 2013 - (1) 2014 2015 (2011-2015) - (1) Rank
Pittsburgh Penguins 106 108 72 109 98 105.3 1Boston Bruins 103 102 62 117 96 104.5 2St. Louis Blues 87 109 60 111 109 104.0 3Vancouver Canucks 117 111 59 83 101 103.0 4New York Rangers 93 109 56 96 113 102.8 5Chicago Blackhawks 97 101 77 107 102 101.8 6Anaheim Ducks 99 80 66 116 109 101.0 7San Jose Sharks 105 96 57 111 89 100.3 8Detroit Red Wings 104 102 56 93 100 99.8 9Tampa Bay Lightning 103 84 40 101 108 99.0 10Nashville Predators 99 104 41 88 104 98.8 11Washington Capitals 107 92 57 90 101 97.5 12Los Angeles Kings 98 95 59 100 95 97.0 13Philadelphia Flyers 106 103 49 94 84 96.8 14Montreal Canadiens 96 78 63 100 110 96.0 15Dallas Stars 95 89 48 91 92 91.8 16Minnesota Wild 86 81 55 98 100 91.3 17Calgary Flames 94 90 42 77 97 89.5 18Colorado Avalanche 68 88 39 112 90 89.5 18Ottawa Senators 74 92 56 88 99 88.3 20New Jersey Devils 81 102 48 88 78 87.3 21Winnipeg Jets (Thrashers) 80 84 51 84 99 86.8 22Arizona Coyotes 99 97 51 89 56 85.3 23New York Islanders 73 79 55 79 101 83.0 24Columbus Blue Jackets 81 65 55 93 89 82.0 25Carolina Hurricanes 91 82 42 83 71 81.8 26Florida Panthers 72 94 36 66 91 80.8 27Toronto Maple Leafs 85 80 57 84 68 79.3 28Buffalo Sabres 96 89 48 52 54 72.8 29Edmonton Oilers 62 74 45 67 62 66.3 30
(1) - The 2012-13 season reflects lockout shortened season. Season is excluded from average.Source: ESPN.com.
Season Ending
Page 14
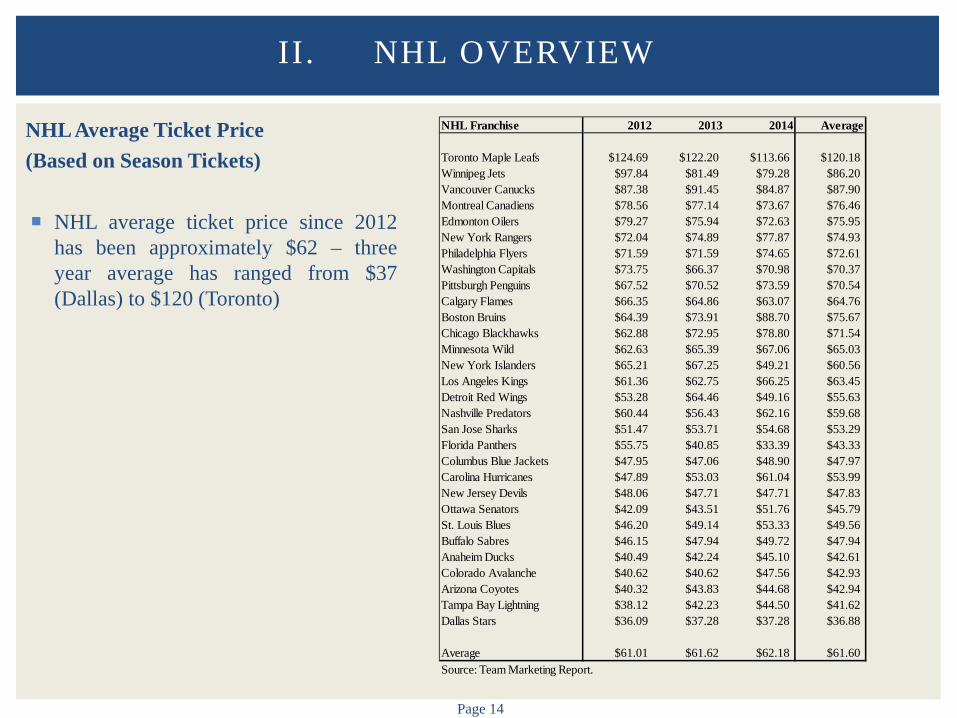
NHL Average Ticket Price (Based on Season Tickets)
NHL average ticket price since 2012
has been approximately $62 – three year average has ranged from $37 (Dallas) to $120 (Toronto)
II. NHL OVERVIEW
NHL Franchise 2012 2013 2014 Average
Toronto Maple Leafs $124.69 $122.20 $113.66 $120.18Winnipeg Jets $97.84 $81.49 $79.28 $86.20Vancouver Canucks $87.38 $91.45 $84.87 $87.90Montreal Canadiens $78.56 $77.14 $73.67 $76.46Edmonton Oilers $79.27 $75.94 $72.63 $75.95New York Rangers $72.04 $74.89 $77.87 $74.93Philadelphia Flyers $71.59 $71.59 $74.65 $72.61Washington Capitals $73.75 $66.37 $70.98 $70.37Pittsburgh Penguins $67.52 $70.52 $73.59 $70.54Calgary Flames $66.35 $64.86 $63.07 $64.76Boston Bruins $64.39 $73.91 $88.70 $75.67Chicago Blackhawks $62.88 $72.95 $78.80 $71.54Minnesota Wild $62.63 $65.39 $67.06 $65.03New York Islanders $65.21 $67.25 $49.21 $60.56Los Angeles Kings $61.36 $62.75 $66.25 $63.45Detroit Red Wings $53.28 $64.46 $49.16 $55.63Nashville Predators $60.44 $56.43 $62.16 $59.68San Jose Sharks $51.47 $53.71 $54.68 $53.29Florida Panthers $55.75 $40.85 $33.39 $43.33Columbus Blue Jackets $47.95 $47.06 $48.90 $47.97Carolina Hurricanes $47.89 $53.03 $61.04 $53.99New Jersey Devils $48.06 $47.71 $47.71 $47.83Ottawa Senators $42.09 $43.51 $51.76 $45.79St. Louis Blues $46.20 $49.14 $53.33 $49.56Buffalo Sabres $46.15 $47.94 $49.72 $47.94Anaheim Ducks $40.49 $42.24 $45.10 $42.61Colorado Avalanche $40.62 $40.62 $47.56 $42.93Arizona Coyotes $40.32 $43.83 $44.68 $42.94Tampa Bay Lightning $38.12 $42.23 $44.50 $41.62Dallas Stars $36.09 $37.28 $37.28 $36.88
Average $61.01 $61.62 $62.18 $61.60Source: Team Marketing Report.
Page 15
Collective Bargaining Agreement/Revenue Sharing Overview
The NHL has experienced four work stoppages since 1992
Most recent work stoppage: September 2012 to January 2013
Key issues Players’ guaranteed share of Hockey Related Revenue Contract term limits Salary arbitration Other free agency rule modifications
New Collective Bargaining Agreement (CBA) agreed to in January 2013
10-year term expires September 15, 2022 NHL has option to terminate by September 1, 2019 NHLPA has option to terminate by September 15, 2019
Players’ share of Hockey Related Revenues (HRR) is 50%
HRR includes all revenue related to playing NHL hockey games and NHL-related events
II. NHL OVERVIEW
Page 16
Collective Bargaining Agreement/Revenue Sharing Overview
Player contracts are limited to seven years
If a team re-signs a player, the limit is eight years
Team owners share in the pool of NHL common revenues and generate other local revenues, which are not subject to league sharing
Under the previous CBA, teams in large markets were ineligible for revenue sharing
New CBA removed the disqualification criteria for large markets
II. NHL OVERVIEW
Page 17
Collective Bargaining Agreement/Revenue Sharing Overview
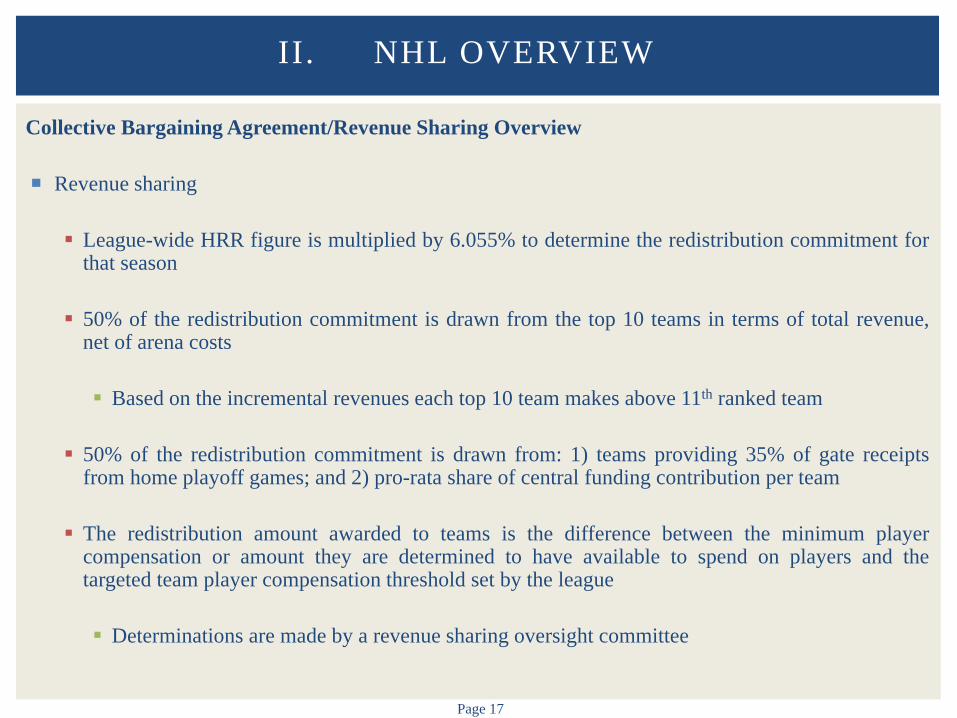
Revenue sharing League-wide HRR figure is multiplied by 6.055% to determine the redistribution commitment for
that season 50% of the redistribution commitment is drawn from the top 10 teams in terms of total revenue,
net of arena costs
Based on the incremental revenues each top 10 team makes above 11th ranked team
50% of the redistribution commitment is drawn from: 1) teams providing 35% of gate receipts from home playoff games; and 2) pro-rata share of central funding contribution per team
The redistribution amount awarded to teams is the difference between the minimum player compensation or amount they are determined to have available to spend on players and the targeted team player compensation threshold set by the league
Determinations are made by a revenue sharing oversight committee
II. NHL OVERVIEW
Page 18
Player Payroll Overview
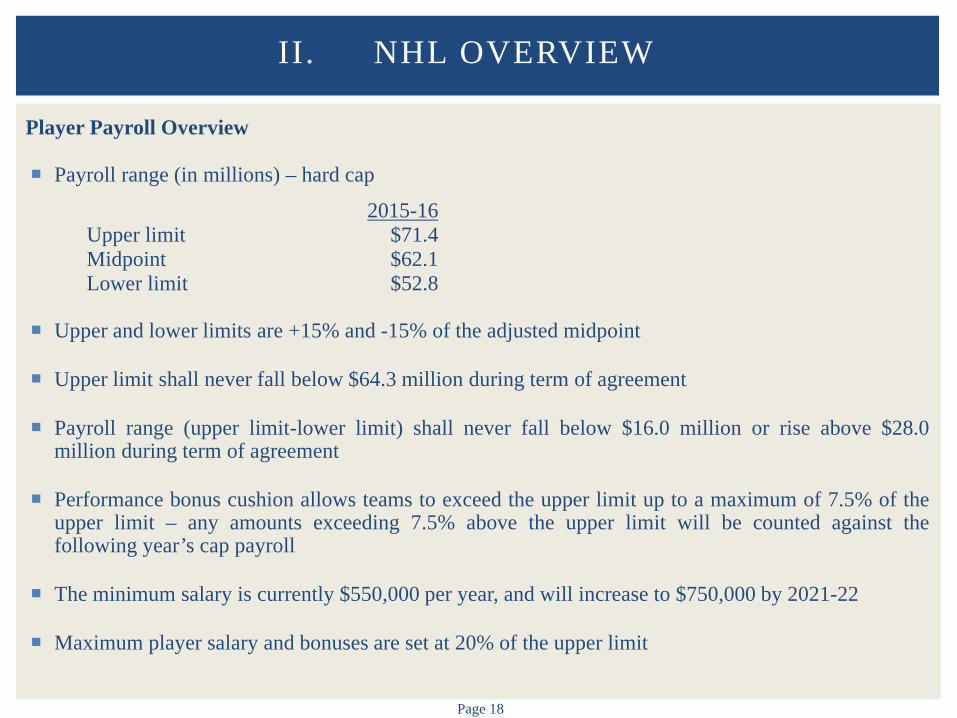
Payroll range (in millions) – hard cap
2015-16 Upper limit $71.4 Midpoint $62.1 Lower limit $52.8
Upper and lower limits are +15% and -15% of the adjusted midpoint
Upper limit shall never fall below $64.3 million during term of agreement
Payroll range (upper limit-lower limit) shall never fall below $16.0 million or rise above $28.0
million during term of agreement
Performance bonus cushion allows teams to exceed the upper limit up to a maximum of 7.5% of the upper limit – any amounts exceeding 7.5% above the upper limit will be counted against the following year’s cap payroll
The minimum salary is currently $550,000 per year, and will increase to $750,000 by 2021-22
Maximum player salary and bonuses are set at 20% of the upper limit
II. NHL OVERVIEW
Page 19
NHL Salaries
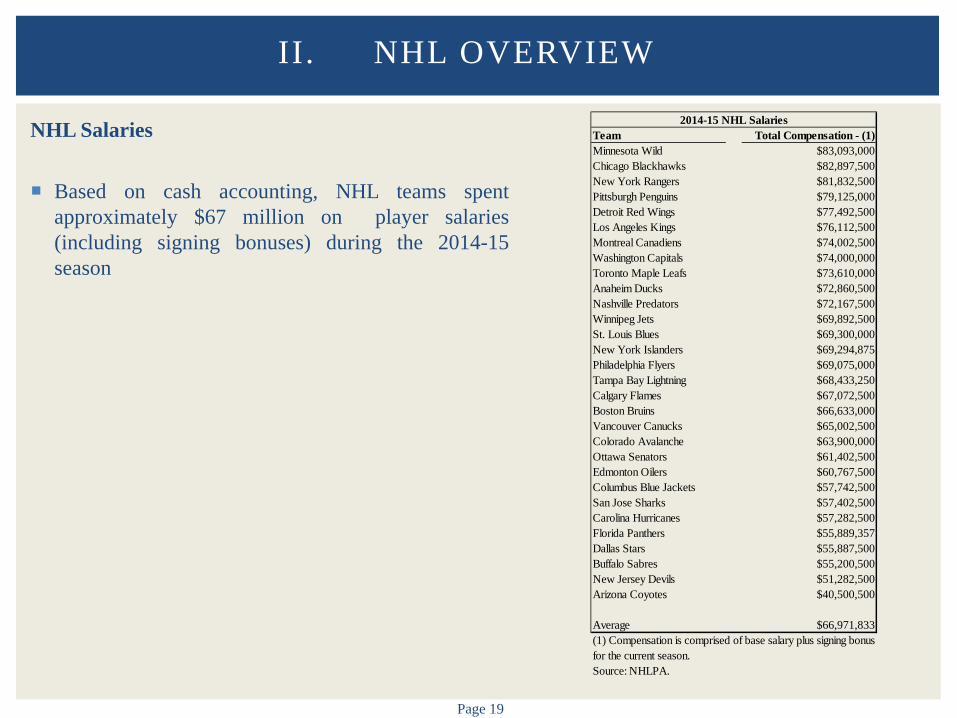
Based on cash accounting, NHL teams spent approximately $67 million on player salaries (including signing bonuses) during the 2014-15 season
II. NHL OVERVIEW
Team Total Compensation - (1)Minnesota Wild $83,093,000Chicago Blackhawks $82,897,500New York Rangers $81,832,500Pittsburgh Penguins $79,125,000Detroit Red Wings $77,492,500Los Angeles Kings $76,112,500Montreal Canadiens $74,002,500Washington Capitals $74,000,000Toronto Maple Leafs $73,610,000Anaheim Ducks $72,860,500Nashville Predators $72,167,500Winnipeg Jets $69,892,500St. Louis Blues $69,300,000New York Islanders $69,294,875Philadelphia Flyers $69,075,000Tampa Bay Lightning $68,433,250Calgary Flames $67,072,500Boston Bruins $66,633,000Vancouver Canucks $65,002,500Colorado Avalanche $63,900,000Ottawa Senators $61,402,500Edmonton Oilers $60,767,500Columbus Blue Jackets $57,742,500San Jose Sharks $57,402,500Carolina Hurricanes $57,282,500Florida Panthers $55,889,357Dallas Stars $55,887,500Buffalo Sabres $55,200,500New Jersey Devils $51,282,500Arizona Coyotes $40,500,500
Average $66,971,833
Source: NHLPA.
2014-15 NHL Salaries
(1) Compensation is comprised of base salary plus signing bonus for the current season.
Page 20
NHL Debt Restrictions/Other
Team secured debt is limited to the lesser of 50% of the team value or $125.0 million
Debt limits are not imposed on unsecured debt
NHL does not permit arena cross default (e.g. arenas cannot take team into default)
II. NHL OVERVIEW
Page 21
Television
NHL has national and international broadcasting contracts in the U.S. and Canada
NHL and NBC sports reached a 10-year deal in 2011 (through the 2021-22 season) for broadcast and multimedia rights in the U.S.
Contract is reportedly worth $2.0 billion
NHL and Rogers Communications reached a 12-year deal in 2013 (through the 2025-26 season) for
broadcast and multimedia rights in Canada
Contract is reportedly worth $5.2 billion (Canadian)
Canadian Broadcasting Corporation (CBC) and TVA Group, Inc. (TVA) will still broadcast games through a sublicensing deal
II. NHL OVERVIEW
Page 22
Canadian Exchange Rate Overview
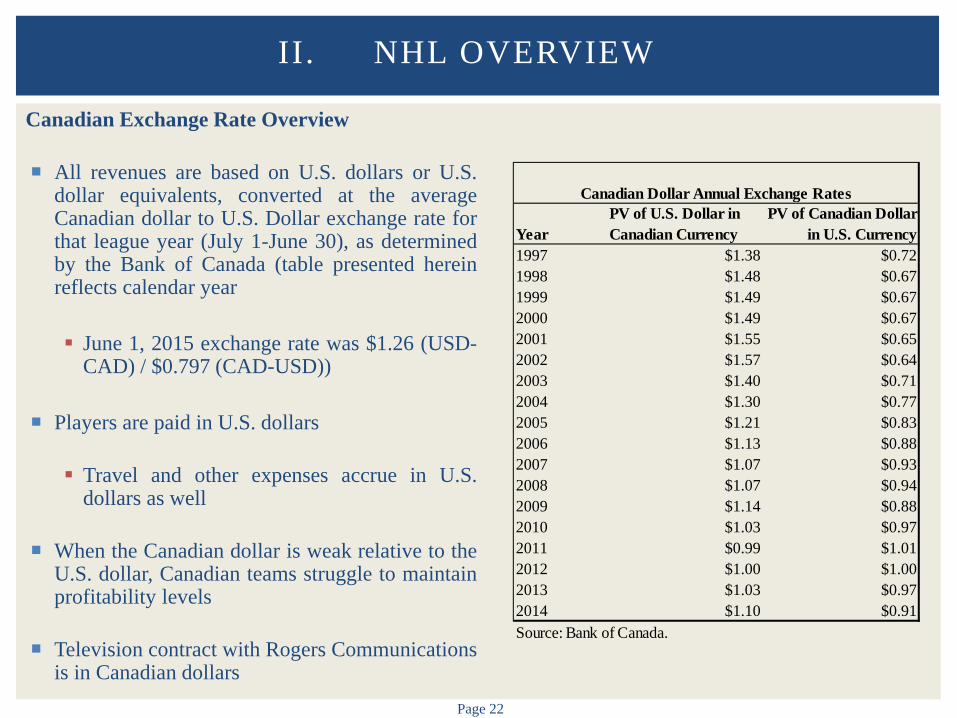
All revenues are based on U.S. dollars or U.S. dollar equivalents, converted at the average Canadian dollar to U.S. Dollar exchange rate for that league year (July 1-June 30), as determined by the Bank of Canada (table presented herein reflects calendar year
June 1, 2015 exchange rate was $1.26 (USD-
CAD) / $0.797 (CAD-USD))
Players are paid in U.S. dollars
Travel and other expenses accrue in U.S. dollars as well
When the Canadian dollar is weak relative to the U.S. dollar, Canadian teams struggle to maintain profitability levels
Television contract with Rogers Communications
is in Canadian dollars
II. NHL OVERVIEW
YearPV of U.S. Dollar in Canadian Currency
PV of Canadian Dollar in U.S. Currency
1997 $1.38 $0.721998 $1.48 $0.671999 $1.49 $0.672000 $1.49 $0.672001 $1.55 $0.652002 $1.57 $0.642003 $1.40 $0.712004 $1.30 $0.772005 $1.21 $0.832006 $1.13 $0.882007 $1.07 $0.932008 $1.07 $0.942009 $1.14 $0.882010 $1.03 $0.972011 $0.99 $1.012012 $1.00 $1.002013 $1.03 $0.972014 $1.10 $0.91Source: Bank of Canada.
Canadian Dollar Annual Exchange Rates
Page 23
General Market Overview
Review of demographic characteristics of NHL markets NHL market comparison
CBSA designation
Base demographics Adjusted demographics
Geographic ring designation 20 mile ring statistics Base demographics
30 mile ring statistics Base demographics
Drive time designation 30 minute drive Base demographics
II. NHL OVERVIEW
Page 24
General Market Overview
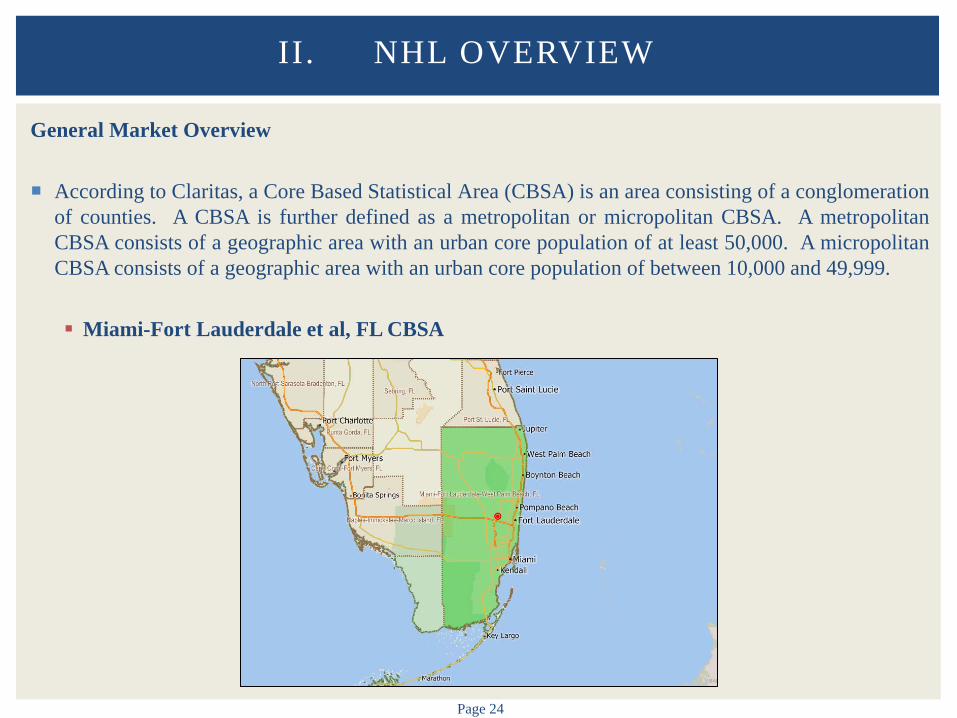
According to Claritas, a Core Based Statistical Area (CBSA) is an area consisting of a conglomeration of counties. A CBSA is further defined as a metropolitan or micropolitan CBSA. A metropolitan CBSA consists of a geographic area with an urban core population of at least 50,000. A micropolitan CBSA consists of a geographic area with an urban core population of between 10,000 and 49,999.
Miami-Fort Lauderdale et al, FL CBSA
II. NHL OVERVIEW
Page 25
II. NHL OVERVIEW
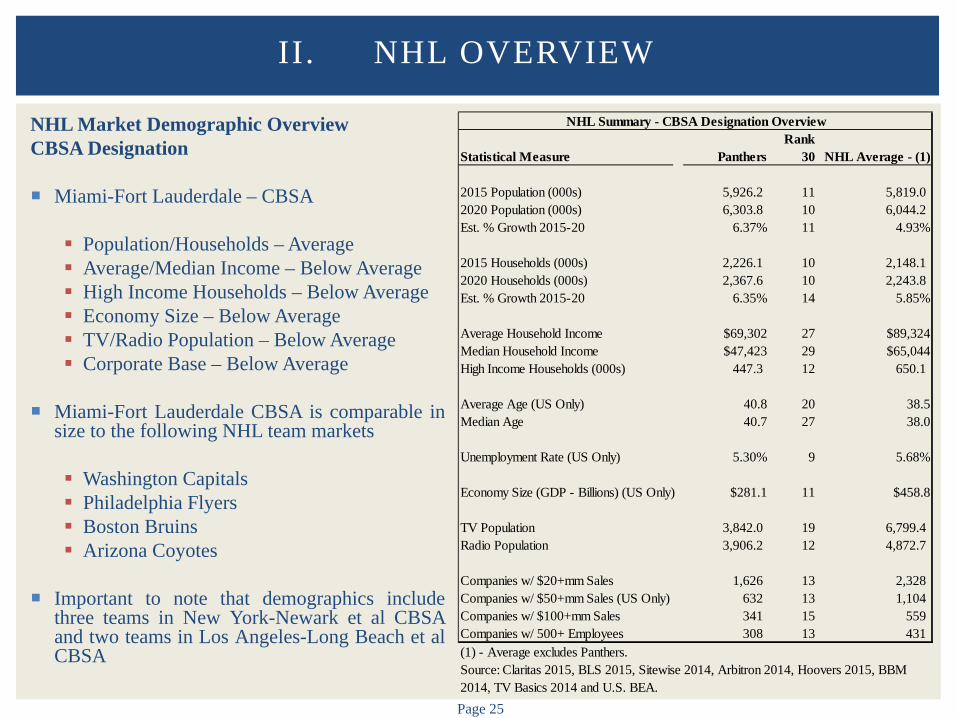
NHL Market Demographic Overview CBSA Designation Miami-Fort Lauderdale – CBSA
Population/Households – Average Average/Median Income – Below Average High Income Households – Below Average Economy Size – Below Average TV/Radio Population – Below Average Corporate Base – Below Average
Miami-Fort Lauderdale CBSA is comparable in
size to the following NHL team markets Washington Capitals Philadelphia Flyers Boston Bruins Arizona Coyotes
Important to note that demographics include
three teams in New York-Newark et al CBSA and two teams in Los Angeles-Long Beach et al CBSA
Statistical Measure PanthersRank
30 NHL Average - (1)
2015 Population (000s) 5,926.2 11 5,819.0 2020 Population (000s) 6,303.8 10 6,044.2 Est. % Growth 2015-20 6.37% 11 4.93%
2015 Households (000s) 2,226.1 10 2,148.1 2020 Households (000s) 2,367.6 10 2,243.8 Est. % Growth 2015-20 6.35% 14 5.85%
Average Household Income $69,302 27 $89,324Median Household Income $47,423 29 $65,044High Income Households (000s) 447.3 12 650.1
Average Age (US Only) 40.8 20 38.5Median Age 40.7 27 38.0
Unemployment Rate (US Only) 5.30% 9 5.68%
Economy Size (GDP - Billions) (US Only) $281.1 11 $458.8
TV Population 3,842.0 19 6,799.4 Radio Population 3,906.2 12 4,872.7
Companies w/ $20+mm Sales 1,626 13 2,328Companies w/ $50+mm Sales (US Only) 632 13 1,104Companies w/ $100+mm Sales 341 15 559Companies w/ 500+ Employees 308 13 431
NHL Summary - CBSA Designation Overview
Source: Claritas 2015, BLS 2015, Sitewise 2014, Arbitron 2014, Hoovers 2015, BBM 2014, TV Basics 2014 and U.S. BEA.
(1) - Average excludes Panthers.
Page 26
II. NHL OVERVIEW
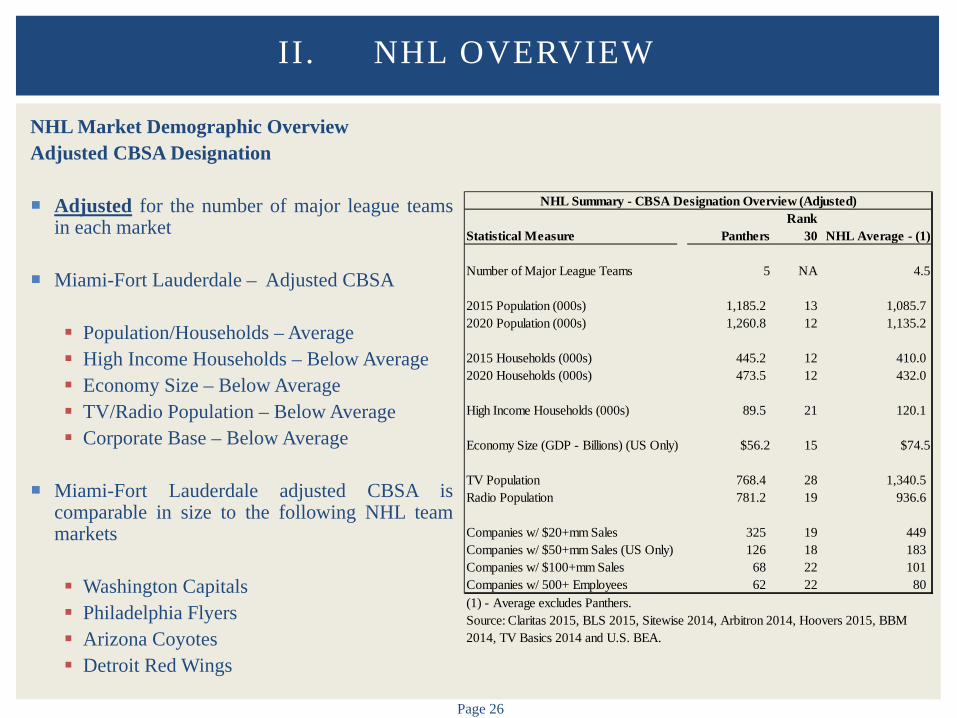
NHL Market Demographic Overview Adjusted CBSA Designation Adjusted for the number of major league teams
in each market
Miami-Fort Lauderdale – Adjusted CBSA Population/Households – Average High Income Households – Below Average Economy Size – Below Average TV/Radio Population – Below Average Corporate Base – Below Average
Miami-Fort Lauderdale adjusted CBSA is
comparable in size to the following NHL team markets Washington Capitals Philadelphia Flyers Arizona Coyotes Detroit Red Wings
Statistical Measure PanthersRank
30 NHL Average - (1)
Number of Major League Teams 5 NA 4.5
2015 Population (000s) 1,185.2 13 1,085.7 2020 Population (000s) 1,260.8 12 1,135.2
2015 Households (000s) 445.2 12 410.0 2020 Households (000s) 473.5 12 432.0
High Income Households (000s) 89.5 21 120.1
Economy Size (GDP - Billions) (US Only) $56.2 15 $74.5
TV Population 768.4 28 1,340.5 Radio Population 781.2 19 936.6
Companies w/ $20+mm Sales 325 19 449Companies w/ $50+mm Sales (US Only) 126 18 183Companies w/ $100+mm Sales 68 22 101Companies w/ 500+ Employees 62 22 80
NHL Summary - CBSA Designation Overview (Adjusted)
(1) - Average excludes Panthers.Source: Claritas 2015, BLS 2015, Sitewise 2014, Arbitron 2014, Hoovers 2015, BBM 2014, TV Basics 2014 and U.S. BEA.
Page 27
II. NHL OVERVIEW
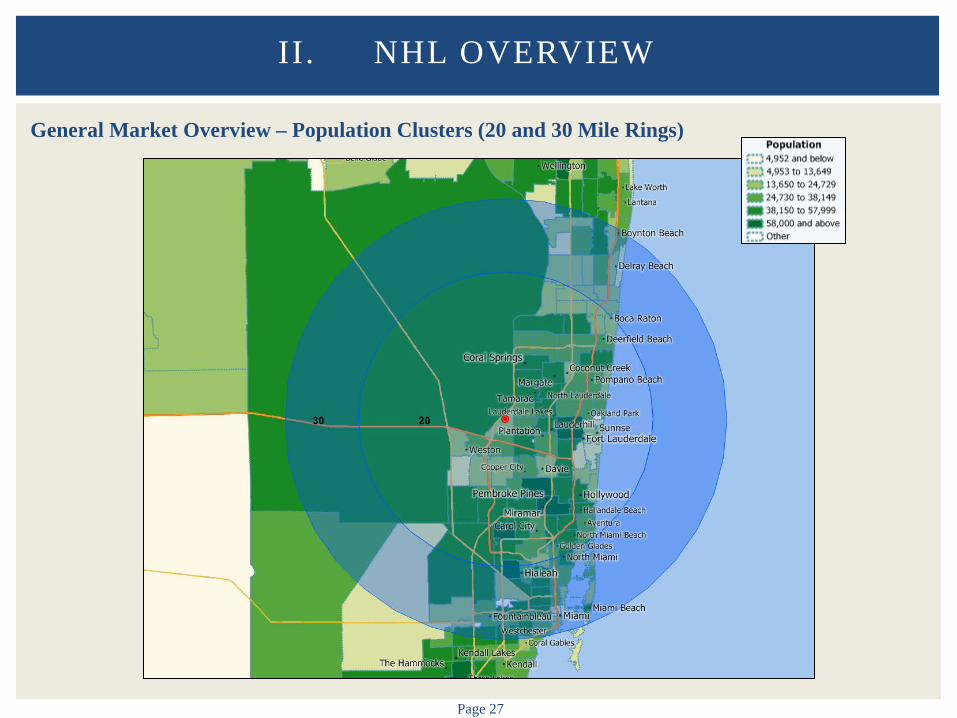
General Market Overview – Population Clusters (20 and 30 Mile Rings)
Page 28
II. NHL OVERVIEW
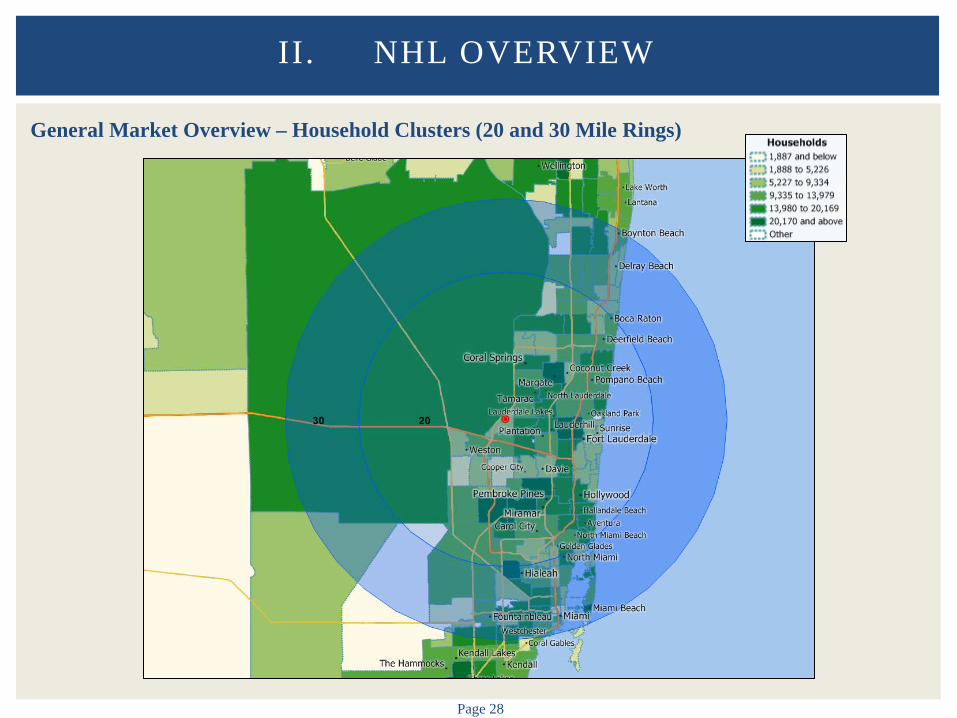
General Market Overview – Household Clusters (20 and 30 Mile Rings)
Page 29
II. NHL OVERVIEW
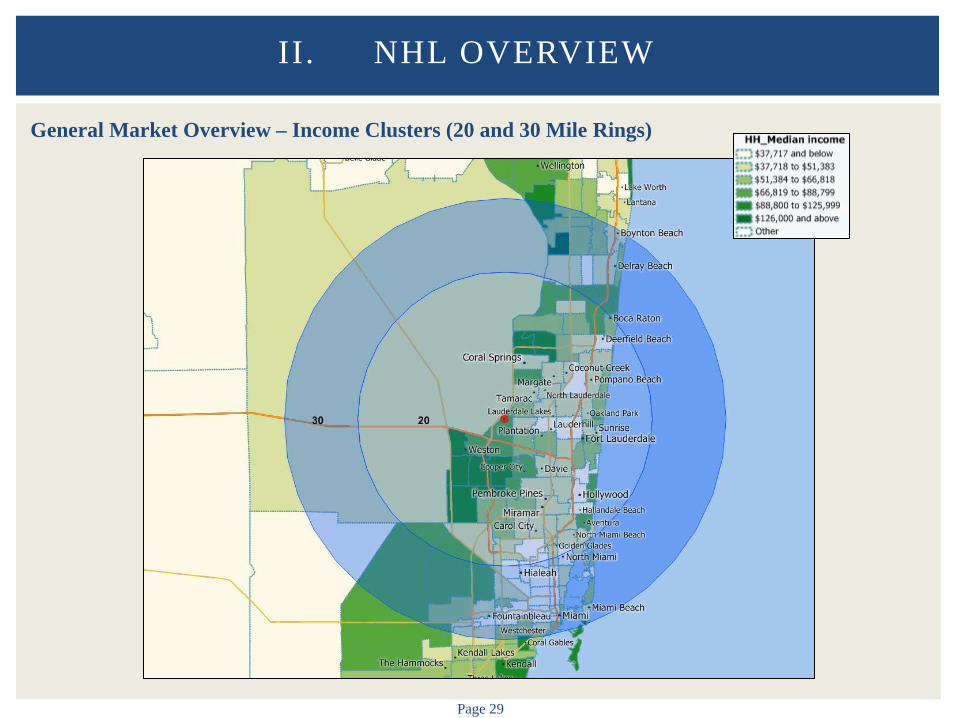
General Market Overview – Income Clusters (20 and 30 Mile Rings)
Page 30
II. NHL OVERVIEW
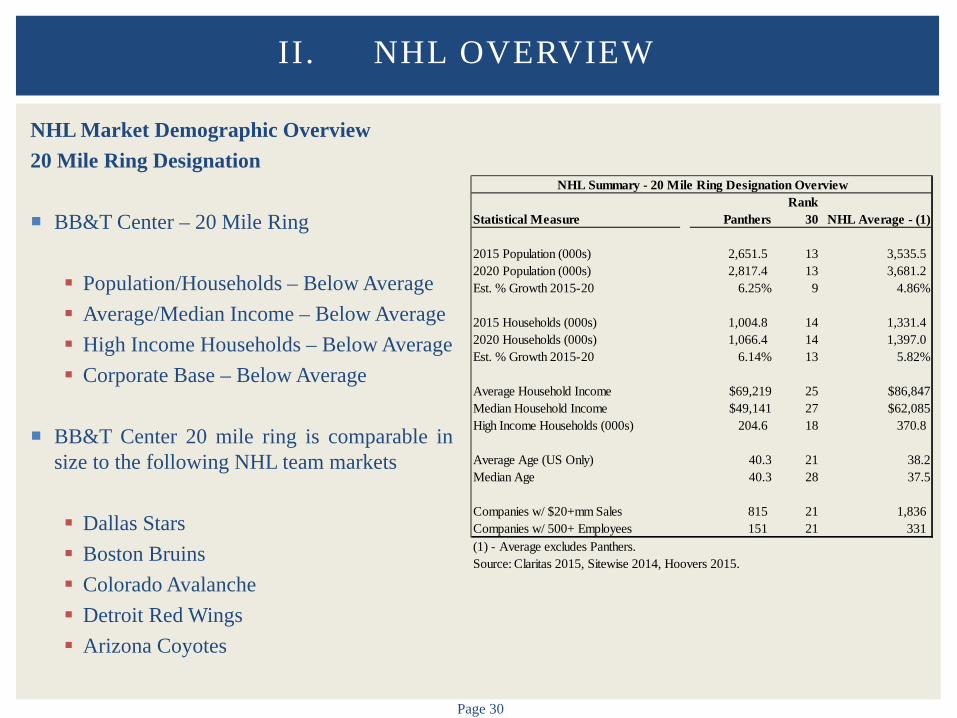
NHL Market Demographic Overview 20 Mile Ring Designation BB&T Center – 20 Mile Ring
Population/Households – Below Average Average/Median Income – Below Average High Income Households – Below Average Corporate Base – Below Average
BB&T Center 20 mile ring is comparable in
size to the following NHL team markets Dallas Stars Boston Bruins Colorado Avalanche Detroit Red Wings Arizona Coyotes
Statistical Measure PanthersRank
30 NHL Average - (1)
2015 Population (000s) 2,651.5 13 3,535.5 2020 Population (000s) 2,817.4 13 3,681.2 Est. % Growth 2015-20 6.25% 9 4.86%
2015 Households (000s) 1,004.8 14 1,331.4 2020 Households (000s) 1,066.4 14 1,397.0 Est. % Growth 2015-20 6.14% 13 5.82%
Average Household Income $69,219 25 $86,847Median Household Income $49,141 27 $62,085High Income Households (000s) 204.6 18 370.8
Average Age (US Only) 40.3 21 38.2Median Age 40.3 28 37.5
Companies w/ $20+mm Sales 815 21 1,836Companies w/ 500+ Employees 151 21 331
NHL Summary - 20 Mile Ring Designation Overview
(1) - Average excludes Panthers.Source: Claritas 2015, Sitewise 2014, Hoovers 2015.
Page 31
II. NHL OVERVIEW
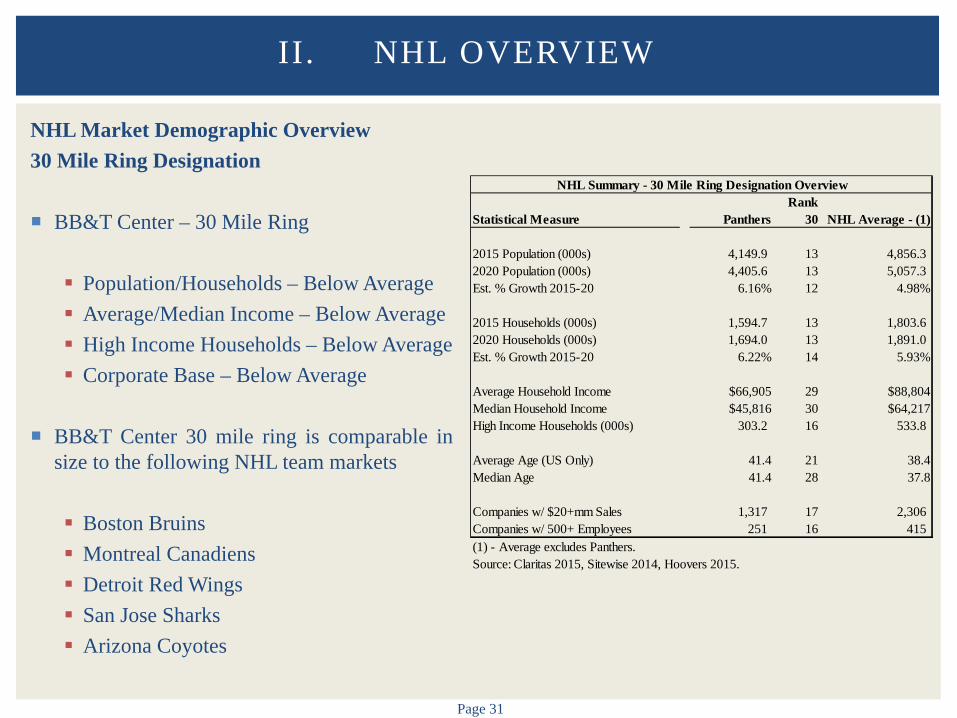
NHL Market Demographic Overview 30 Mile Ring Designation BB&T Center – 30 Mile Ring
Population/Households – Below Average Average/Median Income – Below Average High Income Households – Below Average Corporate Base – Below Average
BB&T Center 30 mile ring is comparable in
size to the following NHL team markets Boston Bruins Montreal Canadiens Detroit Red Wings San Jose Sharks Arizona Coyotes
Statistical Measure PanthersRank
30 NHL Average - (1)
2015 Population (000s) 4,149.9 13 4,856.3 2020 Population (000s) 4,405.6 13 5,057.3 Est. % Growth 2015-20 6.16% 12 4.98%
2015 Households (000s) 1,594.7 13 1,803.6 2020 Households (000s) 1,694.0 13 1,891.0 Est. % Growth 2015-20 6.22% 14 5.93%
Average Household Income $66,905 29 $88,804Median Household Income $45,816 30 $64,217High Income Households (000s) 303.2 16 533.8
Average Age (US Only) 41.4 21 38.4Median Age 41.4 28 37.8
Companies w/ $20+mm Sales 1,317 17 2,306Companies w/ 500+ Employees 251 16 415
NHL Summary - 30 Mile Ring Designation Overview
(1) - Average excludes Panthers.Source: Claritas 2015, Sitewise 2014, Hoovers 2015.
Page 32
II. NHL OVERVIEW
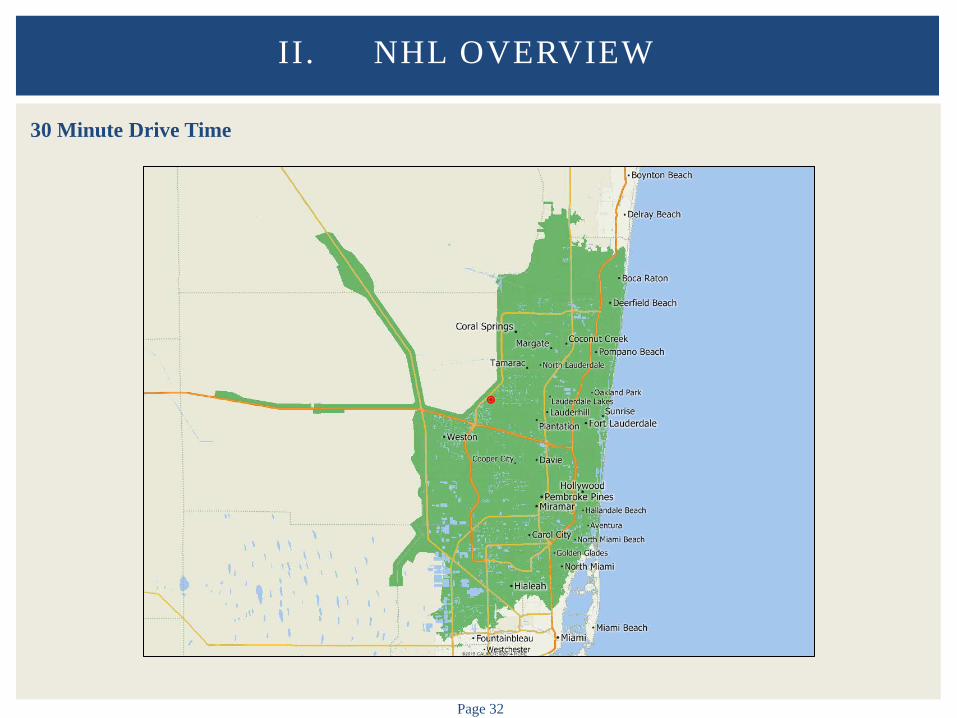
30 Minute Drive Time
Page 33
II. NHL OVERVIEW
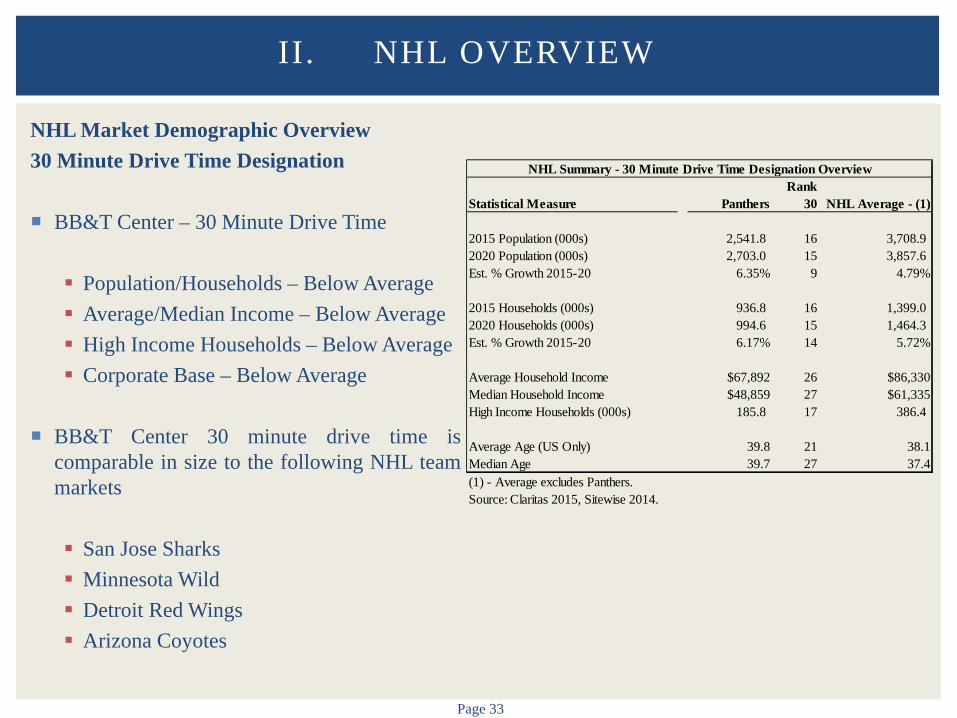
NHL Market Demographic Overview 30 Minute Drive Time Designation BB&T Center – 30 Minute Drive Time
Population/Households – Below Average Average/Median Income – Below Average High Income Households – Below Average Corporate Base – Below Average
BB&T Center 30 minute drive time is
comparable in size to the following NHL team markets San Jose Sharks Minnesota Wild Detroit Red Wings Arizona Coyotes
Statistical Measure PanthersRank
30 NHL Average - (1)
2015 Population (000s) 2,541.8 16 3,708.9 2020 Population (000s) 2,703.0 15 3,857.6 Est. % Growth 2015-20 6.35% 9 4.79%
2015 Households (000s) 936.8 16 1,399.0 2020 Households (000s) 994.6 15 1,464.3 Est. % Growth 2015-20 6.17% 14 5.72%
Average Household Income $67,892 26 $86,330Median Household Income $48,859 27 $61,335High Income Households (000s) 185.8 17 386.4
Average Age (US Only) 39.8 21 38.1Median Age 39.7 27 37.4
NHL Summary - 30 Minute Drive Time Designation Overview
(1) - Average excludes Panthers.Source: Claritas 2015, Sitewise 2014.

III. REVIEW OF FINANCIAL PROJECTIONS – STATUS QUO
Page 35
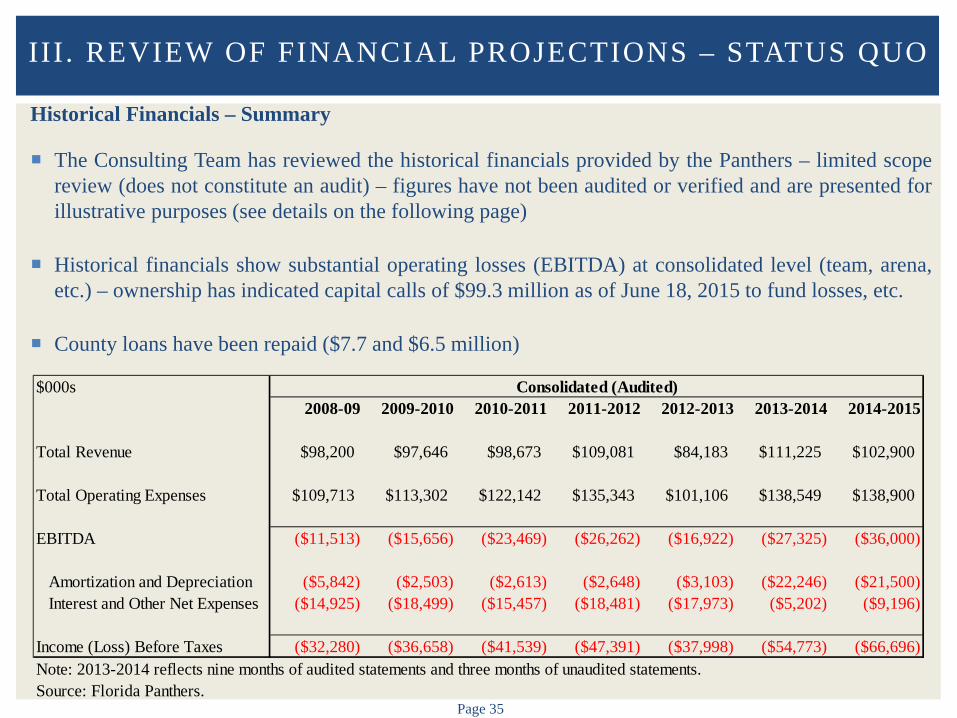
Historical Financials – Summary
The Consulting Team has reviewed the historical financials provided by the Panthers – limited scope review (does not constitute an audit) – figures have not been audited or verified and are presented for illustrative purposes (see details on the following page)
Historical financials show substantial operating losses (EBITDA) at consolidated level (team, arena, etc.) – ownership has indicated capital calls of $99.3 million as of June 18, 2015 to fund losses, etc.
County loans have been repaid ($7.7 and $6.5 million)
I II . REVIEW OF FINANCIAL PROJECTIONS – STATUS QUO
$000s2008-09 2009-2010 2010-2011 2011-2012 2012-2013 2013-2014 2014-2015
Total Revenue $98,200 $97,646 $98,673 $109,081 $84,183 $111,225 $102,900
Total Operating Expenses $109,713 $113,302 $122,142 $135,343 $101,106 $138,549 $138,900
EBITDA ($11,513) ($15,656) ($23,469) ($26,262) ($16,922) ($27,325) ($36,000)
Amortization and Depreciation ($5,842) ($2,503) ($2,613) ($2,648) ($3,103) ($22,246) ($21,500)Interest and Other Net Expenses ($14,925) ($18,499) ($15,457) ($18,481) ($17,973) ($5,202) ($9,196)
Income (Loss) Before Taxes ($32,280) ($36,658) ($41,539) ($47,391) ($37,998) ($54,773) ($66,696)Note: 2013-2014 reflects nine months of audited statements and three months of unaudited statements.Source: Florida Panthers.
Consolidated (Audited)
Page 36
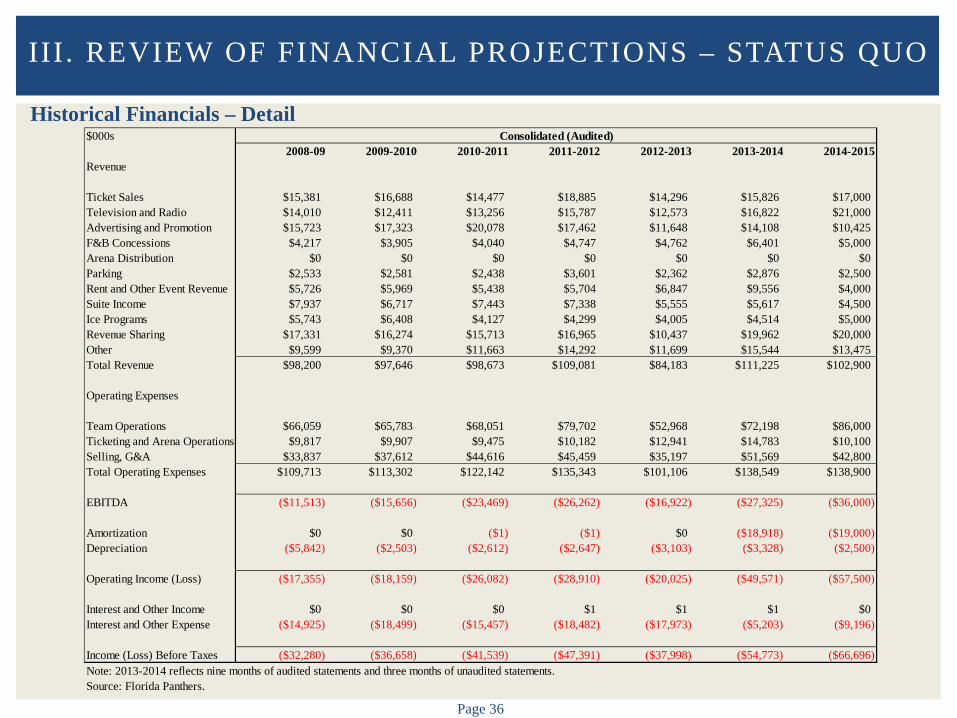
Historical Financials – Detail
I II . REVIEW OF FINANCIAL PROJECTIONS – STATUS QUO
$000s2008-09 2009-2010 2010-2011 2011-2012 2012-2013 2013-2014 2014-2015
Revenue
Ticket Sales $15,381 $16,688 $14,477 $18,885 $14,296 $15,826 $17,000Television and Radio $14,010 $12,411 $13,256 $15,787 $12,573 $16,822 $21,000Advertising and Promotion $15,723 $17,323 $20,078 $17,462 $11,648 $14,108 $10,425F&B Concessions $4,217 $3,905 $4,040 $4,747 $4,762 $6,401 $5,000Arena Distribution $0 $0 $0 $0 $0 $0 $0Parking $2,533 $2,581 $2,438 $3,601 $2,362 $2,876 $2,500Rent and Other Event Revenue $5,726 $5,969 $5,438 $5,704 $6,847 $9,556 $4,000Suite Income $7,937 $6,717 $7,443 $7,338 $5,555 $5,617 $4,500Ice Programs $5,743 $6,408 $4,127 $4,299 $4,005 $4,514 $5,000Revenue Sharing $17,331 $16,274 $15,713 $16,965 $10,437 $19,962 $20,000Other $9,599 $9,370 $11,663 $14,292 $11,699 $15,544 $13,475Total Revenue $98,200 $97,646 $98,673 $109,081 $84,183 $111,225 $102,900
Operating Expenses
Team Operations $66,059 $65,783 $68,051 $79,702 $52,968 $72,198 $86,000Ticketing and Arena Operations $9,817 $9,907 $9,475 $10,182 $12,941 $14,783 $10,100Selling, G&A $33,837 $37,612 $44,616 $45,459 $35,197 $51,569 $42,800Total Operating Expenses $109,713 $113,302 $122,142 $135,343 $101,106 $138,549 $138,900
EBITDA ($11,513) ($15,656) ($23,469) ($26,262) ($16,922) ($27,325) ($36,000)
Amortization $0 $0 ($1) ($1) $0 ($18,918) ($19,000)Depreciation ($5,842) ($2,503) ($2,612) ($2,647) ($3,103) ($3,328) ($2,500)
Operating Income (Loss) ($17,355) ($18,159) ($26,082) ($28,910) ($20,025) ($49,571) ($57,500)
Interest and Other Income $0 $0 $0 $1 $1 $1 $0Interest and Other Expense ($14,925) ($18,499) ($15,457) ($18,482) ($17,973) ($5,203) ($9,196)
Income (Loss) Before Taxes ($32,280) ($36,658) ($41,539) ($47,391) ($37,998) ($54,773) ($66,696)Note: 2013-2014 reflects nine months of audited statements and three months of unaudited statements.Source: Florida Panthers.
Consolidated (Audited)
Page 37
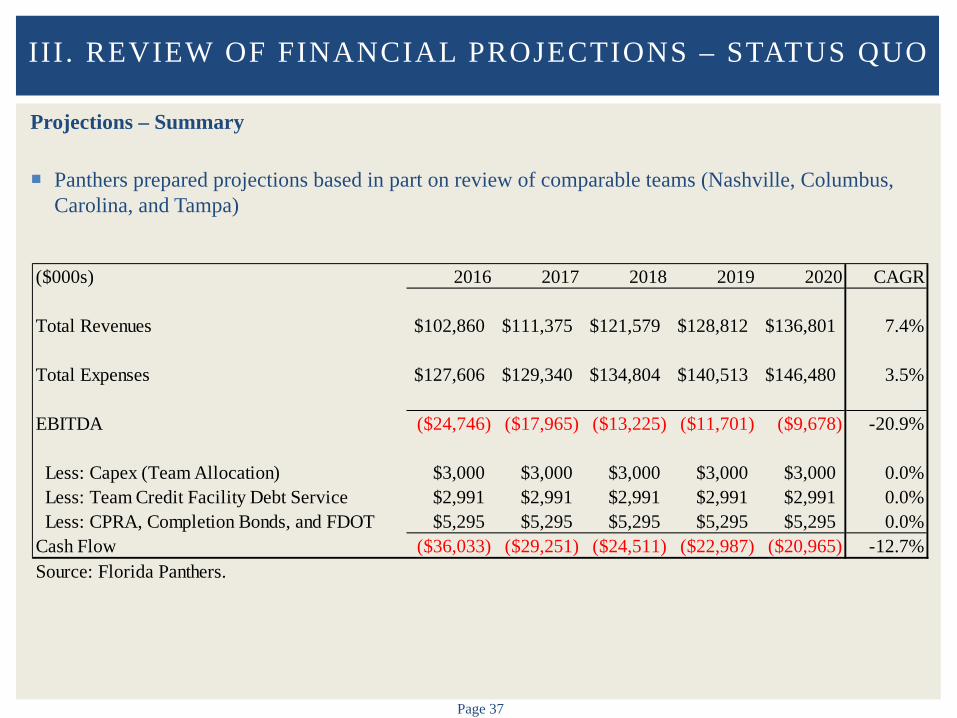
Projections – Summary Panthers prepared projections based in part on review of comparable teams (Nashville, Columbus,
Carolina, and Tampa)
III . REVIEW OF FINANCIAL PROJECTIONS – STATUS QUO
($000s) 2016 2017 2018 2019 2020 CAGR
Total Revenues $102,860 $111,375 $121,579 $128,812 $136,801 7.4%
Total Expenses $127,606 $129,340 $134,804 $140,513 $146,480 3.5%
EBITDA ($24,746) ($17,965) ($13,225) ($11,701) ($9,678) -20.9%
Less: Capex (Team Allocation) $3,000 $3,000 $3,000 $3,000 $3,000 0.0%Less: Team Credit Facility Debt Service $2,991 $2,991 $2,991 $2,991 $2,991 0.0%Less: CPRA, Completion Bonds, and FDOT $5,295 $5,295 $5,295 $5,295 $5,295 0.0%
Cash Flow ($36,033) ($29,251) ($24,511) ($22,987) ($20,965) -12.7%Source: Florida Panthers.
Page 38
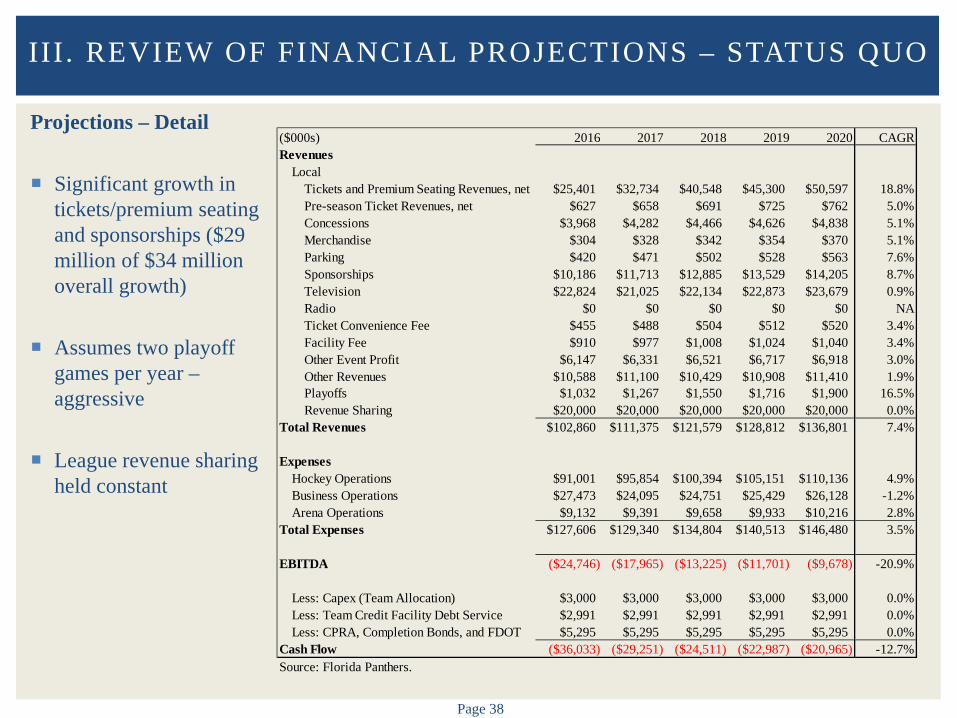
Projections – Detail Significant growth in
tickets/premium seating and sponsorships ($29 million of $34 million overall growth)
Assumes two playoff games per year – aggressive
League revenue sharing held constant
III . REVIEW OF FINANCIAL PROJECTIONS – STATUS QUO
($000s) 2016 2017 2018 2019 2020 CAGRRevenues
LocalTickets and Premium Seating Revenues, net $25,401 $32,734 $40,548 $45,300 $50,597 18.8%Pre-season Ticket Revenues, net $627 $658 $691 $725 $762 5.0%Concessions $3,968 $4,282 $4,466 $4,626 $4,838 5.1%Merchandise $304 $328 $342 $354 $370 5.1%Parking $420 $471 $502 $528 $563 7.6%Sponsorships $10,186 $11,713 $12,885 $13,529 $14,205 8.7%Television $22,824 $21,025 $22,134 $22,873 $23,679 0.9%Radio $0 $0 $0 $0 $0 NATicket Convenience Fee $455 $488 $504 $512 $520 3.4%Facility Fee $910 $977 $1,008 $1,024 $1,040 3.4%Other Event Profit $6,147 $6,331 $6,521 $6,717 $6,918 3.0%Other Revenues $10,588 $11,100 $10,429 $10,908 $11,410 1.9%Playoffs $1,032 $1,267 $1,550 $1,716 $1,900 16.5%Revenue Sharing $20,000 $20,000 $20,000 $20,000 $20,000 0.0%
Total Revenues $102,860 $111,375 $121,579 $128,812 $136,801 7.4%
ExpensesHockey Operations $91,001 $95,854 $100,394 $105,151 $110,136 4.9%Business Operations $27,473 $24,095 $24,751 $25,429 $26,128 -1.2%Arena Operations $9,132 $9,391 $9,658 $9,933 $10,216 2.8%
Total Expenses $127,606 $129,340 $134,804 $140,513 $146,480 3.5%
EBITDA ($24,746) ($17,965) ($13,225) ($11,701) ($9,678) -20.9%
Less: Capex (Team Allocation) $3,000 $3,000 $3,000 $3,000 $3,000 0.0%Less: Team Credit Facility Debt Service $2,991 $2,991 $2,991 $2,991 $2,991 0.0%Less: CPRA, Completion Bonds, and FDOT $5,295 $5,295 $5,295 $5,295 $5,295 0.0%
Cash Flow ($36,033) ($29,251) ($24,511) ($22,987) ($20,965) -12.7%Source: Florida Panthers.
IV. FLORIDA PANTHERS MARCH PROPOSAL
Page 40
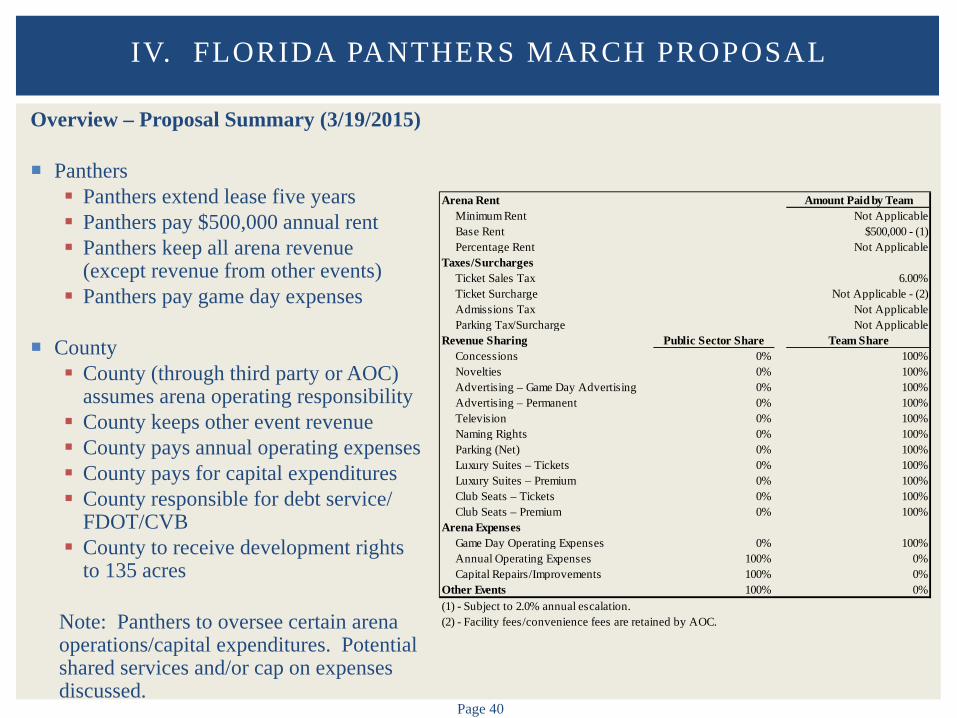
Overview – Proposal Summary (3/19/2015) Panthers Panthers extend lease five years Panthers pay $500,000 annual rent Panthers keep all arena revenue
(except revenue from other events) Panthers pay game day expenses
County County (through third party or AOC)
assumes arena operating responsibility County keeps other event revenue County pays annual operating expenses County pays for capital expenditures County responsible for debt service/
FDOT/CVB County to receive development rights
to 135 acres
Note: Panthers to oversee certain arena operations/capital expenditures. Potential shared services and/or cap on expenses discussed.
IV. FLORIDA PANTHERS MARCH PROPOSAL
Arena Rent Amount Paid by Team Minimum Rent Not Applicable Base Rent $500,000 - (1) Percentage Rent Not ApplicableTaxes/Surcharges Ticket Sales Tax 6.00% Ticket Surcharge Not Applicable - (2) Admissions Tax Not Applicable Parking Tax/Surcharge Not ApplicableRevenue Sharing Public Sector Share Team Share Concessions 0% 100% Novelties 0% 100% Advertising – Game Day Advertising 0% 100% Advertising – Permanent 0% 100% Television 0% 100% Naming Rights 0% 100% Parking (Net) 0% 100% Luxury Suites – Tickets 0% 100% Luxury Suites – Premium 0% 100% Club Seats – Tickets 0% 100% Club Seats – Premium 0% 100%Arena Expenses Game Day Operating Expenses 0% 100% Annual Operating Expenses 100% 0% Capital Repairs/Improvements 100% 0%Other Events 100% 0%(1) - Subject to 2.0% annual escalation.(2) - Facility fees/convenience fees are retained by AOC.
Page 41
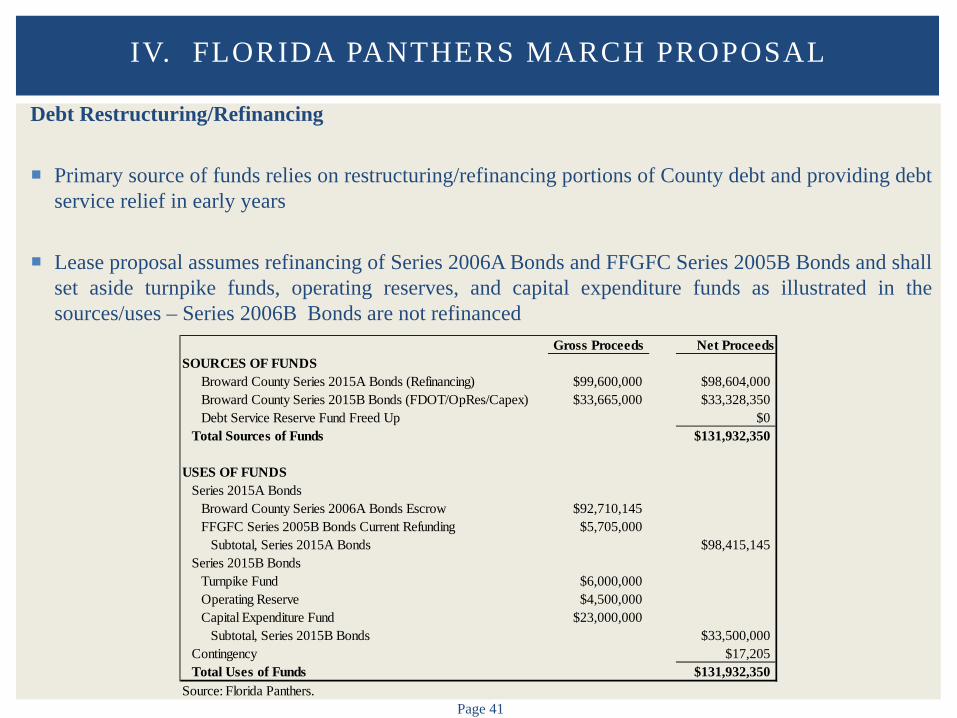
Debt Restructuring/Refinancing Primary source of funds relies on restructuring/refinancing portions of County debt and providing debt
service relief in early years
Lease proposal assumes refinancing of Series 2006A Bonds and FFGFC Series 2005B Bonds and shall set aside turnpike funds, operating reserves, and capital expenditure funds as illustrated in the sources/uses – Series 2006B Bonds are not refinanced
IV. FLORIDA PANTHERS MARCH PROPOSAL
Gross Proceeds Net ProceedsSOURCES OF FUNDS
Broward County Series 2015A Bonds (Refinancing) $99,600,000 $98,604,000Broward County Series 2015B Bonds (FDOT/OpRes/Capex) $33,665,000 $33,328,350Debt Service Reserve Fund Freed Up $0
Total Sources of Funds $131,932,350
USES OF FUNDSSeries 2015A Bonds
Broward County Series 2006A Bonds Escrow $92,710,145FFGFC Series 2005B Bonds Current Refunding $5,705,000
Subtotal, Series 2015A Bonds $98,415,145Series 2015B Bonds
Turnpike Fund $6,000,000Operating Reserve $4,500,000Capital Expenditure Fund $23,000,000
Subtotal, Series 2015B Bonds $33,500,000Contingency $17,205Total Uses of Funds $131,932,350
Source: Florida Panthers.
Page 42
Debt Restructuring/Refinancing Proposal extends County debt obligation five years
Reduces short term debt service, significantly increases debt service payments during extension
Refinancing creates sources of funds (from savings) that could be used to fund arena operations
and/or capital expenditures – savings decreases over time from $6.2 million (2016) to a deficit starting in 2027 – additional funding source(s) for arena operations and/or capital expenditures will need to be identified as savings decrease
Significant payments during extension years ($109.5 million over 5 years) – significant issue
Proposal states there would be no impact on County bond rating – aggressive assumption
Schedule includes Series 2006B Bonds annual debt service payments of approximately $4.4 million through 2028 – not refinanced
Refer to table on following page
IV. FLORIDA PANTHERS MARCH PROPOSAL
Page 43
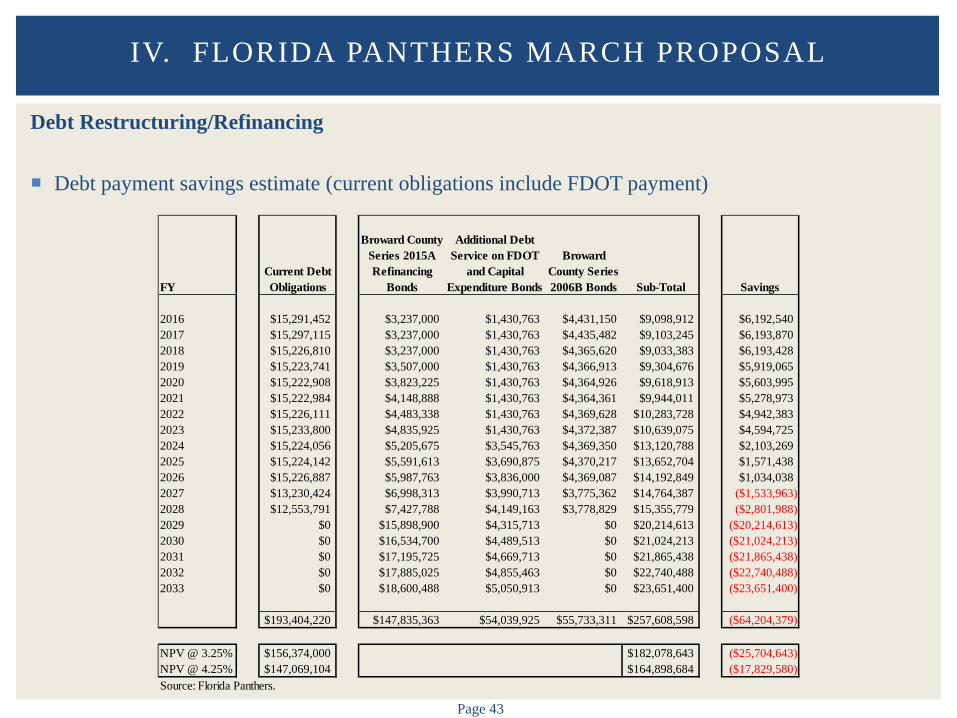
Debt Restructuring/Refinancing Debt payment savings estimate (current obligations include FDOT payment)
IV. FLORIDA PANTHERS MARCH PROPOSAL
FYCurrent Debt Obligations
Broward County Series 2015A Refinancing
Bonds
Additional Debt Service on FDOT
and Capital Expenditure Bonds
Broward County Series 2006B Bonds Sub-Total Savings
2016 $15,291,452 $3,237,000 $1,430,763 $4,431,150 $9,098,912 $6,192,5402017 $15,297,115 $3,237,000 $1,430,763 $4,435,482 $9,103,245 $6,193,8702018 $15,226,810 $3,237,000 $1,430,763 $4,365,620 $9,033,383 $6,193,4282019 $15,223,741 $3,507,000 $1,430,763 $4,366,913 $9,304,676 $5,919,0652020 $15,222,908 $3,823,225 $1,430,763 $4,364,926 $9,618,913 $5,603,9952021 $15,222,984 $4,148,888 $1,430,763 $4,364,361 $9,944,011 $5,278,9732022 $15,226,111 $4,483,338 $1,430,763 $4,369,628 $10,283,728 $4,942,3832023 $15,233,800 $4,835,925 $1,430,763 $4,372,387 $10,639,075 $4,594,7252024 $15,224,056 $5,205,675 $3,545,763 $4,369,350 $13,120,788 $2,103,2692025 $15,224,142 $5,591,613 $3,690,875 $4,370,217 $13,652,704 $1,571,4382026 $15,226,887 $5,987,763 $3,836,000 $4,369,087 $14,192,849 $1,034,0382027 $13,230,424 $6,998,313 $3,990,713 $3,775,362 $14,764,387 ($1,533,963)2028 $12,553,791 $7,427,788 $4,149,163 $3,778,829 $15,355,779 ($2,801,988)2029 $0 $15,898,900 $4,315,713 $0 $20,214,613 ($20,214,613)2030 $0 $16,534,700 $4,489,513 $0 $21,024,213 ($21,024,213)2031 $0 $17,195,725 $4,669,713 $0 $21,865,438 ($21,865,438)2032 $0 $17,885,025 $4,855,463 $0 $22,740,488 ($22,740,488)2033 $0 $18,600,488 $5,050,913 $0 $23,651,400 ($23,651,400)
$193,404,220 $147,835,363 $54,039,925 $55,733,311 $257,608,598 ($64,204,379)
NPV @ 3.25% $156,374,000 $182,078,643 ($25,704,643)NPV @ 4.25% $147,069,104 $164,898,684 ($17,829,580)Source: Florida Panthers.
Page 44
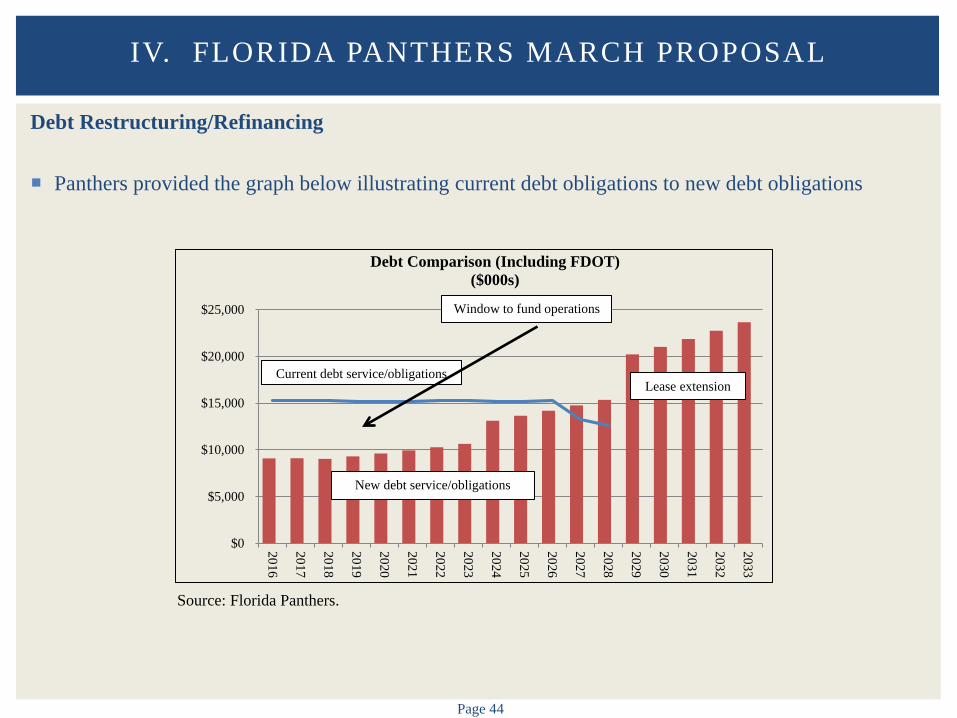
Debt Restructuring/Refinancing Panthers provided the graph below illustrating current debt obligations to new debt obligations
IV. FLORIDA PANTHERS MARCH PROPOSAL
Source: Florida Panthers.
$0
$5,000
$10,000
$15,000
$20,000
$25,000
2016
2017
2018
2019
2020
2021
2022
2023
2024
2025
2026
2027
2028
2029
2030
2031
2032
2033
Debt Comparison (Including FDOT) ($000s)
Current debt service/obligations
New debt service/obligations
Window to fund operations
Lease extension
Page 45
Preliminary Observations Panthers to commit to five year lease extension
Proposal provides significant financial relief and limits risk to the Panthers Eliminates rent payments for CPRA, Completion Bonds, FDOT payment, and CVB payment Eliminates responsibility for arena operating expenses Eliminates capital expenditure obligations
Proposal shifts significant financial responsibility and risk to the County County retains other event revenues County assumes financial shortfall responsibility for arena County assumes capital expenditure responsibility County assumes debt service requirements
It is unclear how the proposal incentivizes the Panthers to generate new (or sustained) revenue for
the County through other events as proposal suggests – Panthers currently incentivized based on lease structure and limited profit sharing
IV. FLORIDA PANTHERS MARCH PROPOSAL
Page 46
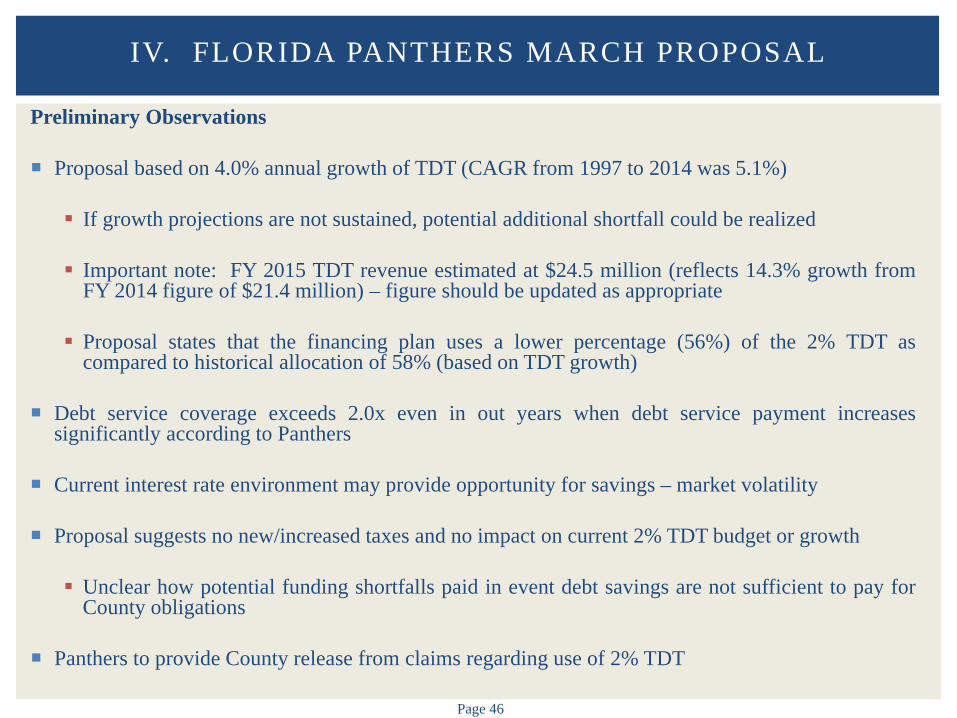
Preliminary Observations Proposal based on 4.0% annual growth of TDT (CAGR from 1997 to 2014 was 5.1%)
If growth projections are not sustained, potential additional shortfall could be realized
Important note: FY 2015 TDT revenue estimated at $24.5 million (reflects 14.3% growth from
FY 2014 figure of $21.4 million) – figure should be updated as appropriate
Proposal states that the financing plan uses a lower percentage (56%) of the 2% TDT as compared to historical allocation of 58% (based on TDT growth)
Debt service coverage exceeds 2.0x even in out years when debt service payment increases significantly according to Panthers
Current interest rate environment may provide opportunity for savings – market volatility
Proposal suggests no new/increased taxes and no impact on current 2% TDT budget or growth Unclear how potential funding shortfalls paid in event debt savings are not sufficient to pay for
County obligations
Panthers to provide County release from claims regarding use of 2% TDT
IV. FLORIDA PANTHERS MARCH PROPOSAL
V. REVIEW OF FINANCIAL PROJECTIONS – MARCH PROPOSAL
Page 48
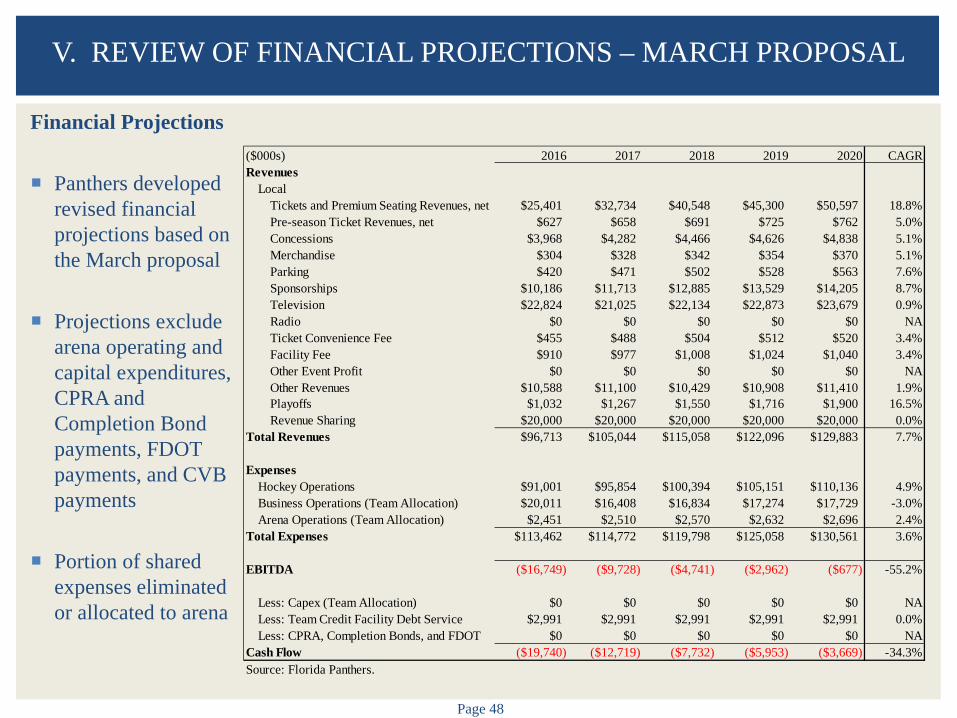
Financial Projections Panthers developed
revised financial projections based on the March proposal
Projections exclude arena operating and capital expenditures, CPRA and Completion Bond payments, FDOT payments, and CVB payments
Portion of shared expenses eliminated or allocated to arena
V. REVIEW OF FINANCIAL PROJECTIONS – MARCH PROPOSAL
($000s) 2016 2017 2018 2019 2020 CAGRRevenues
LocalTickets and Premium Seating Revenues, net $25,401 $32,734 $40,548 $45,300 $50,597 18.8%Pre-season Ticket Revenues, net $627 $658 $691 $725 $762 5.0%Concessions $3,968 $4,282 $4,466 $4,626 $4,838 5.1%Merchandise $304 $328 $342 $354 $370 5.1%Parking $420 $471 $502 $528 $563 7.6%Sponsorships $10,186 $11,713 $12,885 $13,529 $14,205 8.7%Television $22,824 $21,025 $22,134 $22,873 $23,679 0.9%Radio $0 $0 $0 $0 $0 NATicket Convenience Fee $455 $488 $504 $512 $520 3.4%Facility Fee $910 $977 $1,008 $1,024 $1,040 3.4%Other Event Profit $0 $0 $0 $0 $0 NAOther Revenues $10,588 $11,100 $10,429 $10,908 $11,410 1.9%Playoffs $1,032 $1,267 $1,550 $1,716 $1,900 16.5%Revenue Sharing $20,000 $20,000 $20,000 $20,000 $20,000 0.0%
Total Revenues $96,713 $105,044 $115,058 $122,096 $129,883 7.7%
ExpensesHockey Operations $91,001 $95,854 $100,394 $105,151 $110,136 4.9%Business Operations (Team Allocation) $20,011 $16,408 $16,834 $17,274 $17,729 -3.0%Arena Operations (Team Allocation) $2,451 $2,510 $2,570 $2,632 $2,696 2.4%
Total Expenses $113,462 $114,772 $119,798 $125,058 $130,561 3.6%
EBITDA ($16,749) ($9,728) ($4,741) ($2,962) ($677) -55.2%
Less: Capex (Team Allocation) $0 $0 $0 $0 $0 NALess: Team Credit Facility Debt Service $2,991 $2,991 $2,991 $2,991 $2,991 0.0%Less: CPRA, Completion Bonds, and FDOT $0 $0 $0 $0 $0 NA
Cash Flow ($19,740) ($12,719) ($7,732) ($5,953) ($3,669) -34.3%Source: Florida Panthers.
Page 49
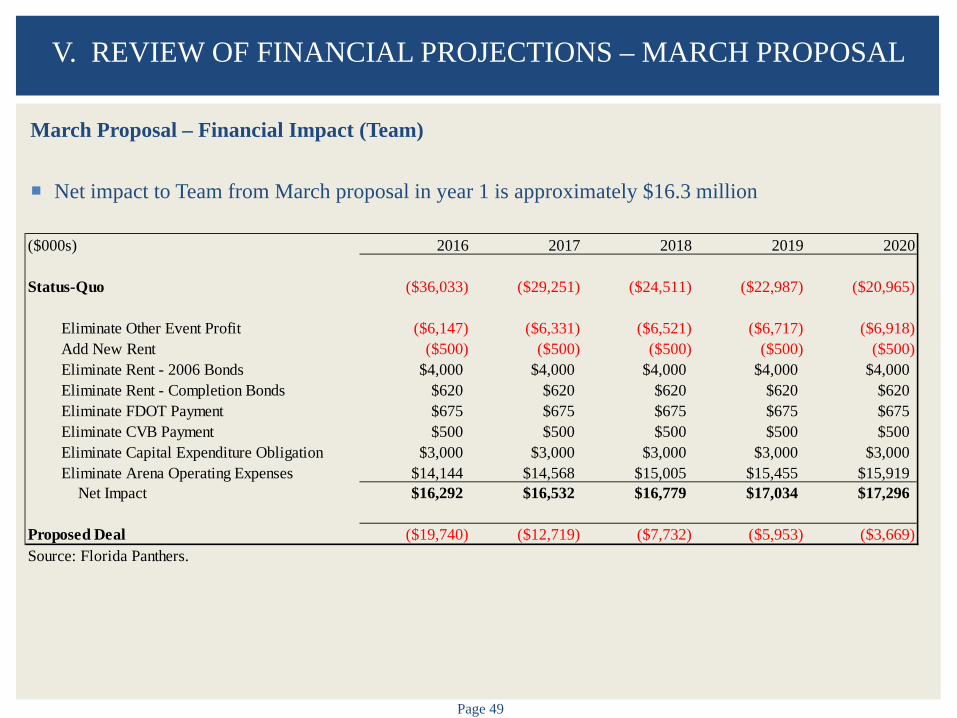
March Proposal – Financial Impact (Team) Net impact to Team from March proposal in year 1 is approximately $16.3 million
V. REVIEW OF FINANCIAL PROJECTIONS – MARCH PROPOSAL
($000s) 2016 2017 2018 2019 2020
Status-Quo ($36,033) ($29,251) ($24,511) ($22,987) ($20,965)
Eliminate Other Event Profit ($6,147) ($6,331) ($6,521) ($6,717) ($6,918)Add New Rent ($500) ($500) ($500) ($500) ($500)Eliminate Rent - 2006 Bonds $4,000 $4,000 $4,000 $4,000 $4,000Eliminate Rent - Completion Bonds $620 $620 $620 $620 $620Eliminate FDOT Payment $675 $675 $675 $675 $675Eliminate CVB Payment $500 $500 $500 $500 $500Eliminate Capital Expenditure Obligation $3,000 $3,000 $3,000 $3,000 $3,000Eliminate Arena Operating Expenses $14,144 $14,568 $15,005 $15,455 $15,919
Net Impact $16,292 $16,532 $16,779 $17,034 $17,296
Proposed Deal ($19,740) ($12,719) ($7,732) ($5,953) ($3,669)Source: Florida Panthers.
Page 50
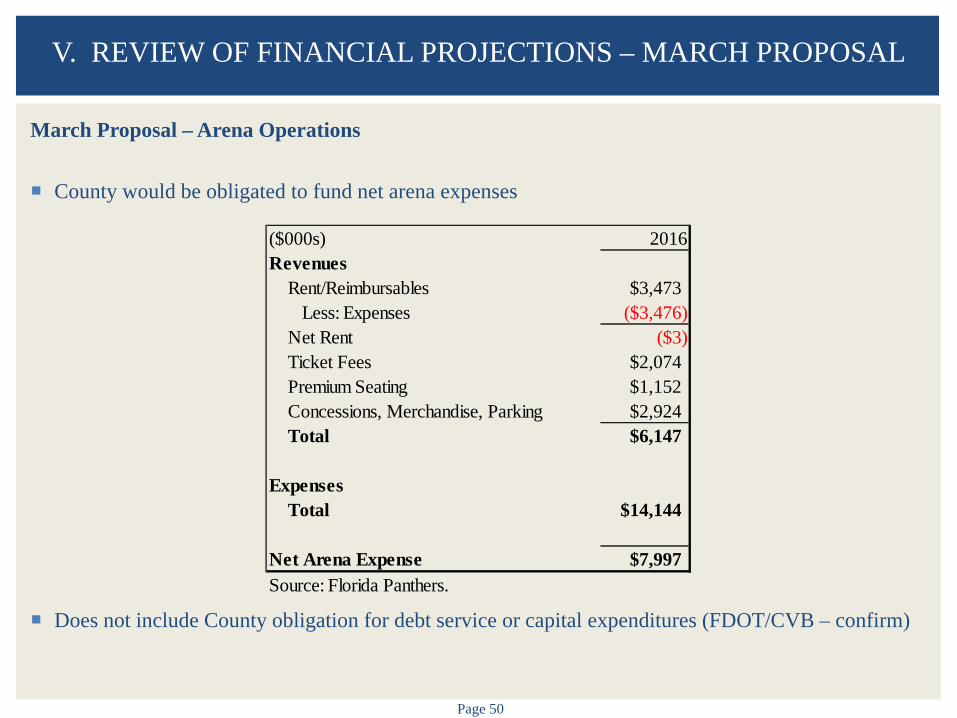
March Proposal – Arena Operations County would be obligated to fund net arena expenses
Does not include County obligation for debt service or capital expenditures (FDOT/CVB – confirm)
V. REVIEW OF FINANCIAL PROJECTIONS – MARCH PROPOSAL
($000s) 2016Revenues
Rent/Reimbursables $3,473 Less: Expenses ($3,476)Net Rent ($3)Ticket Fees $2,074Premium Seating $1,152Concessions, Merchandise, Parking $2,924Total $6,147
ExpensesTotal $14,144
Net Arena Expense $7,997Source: Florida Panthers.
VI. PROPOSED AMENDMENT
Page 52
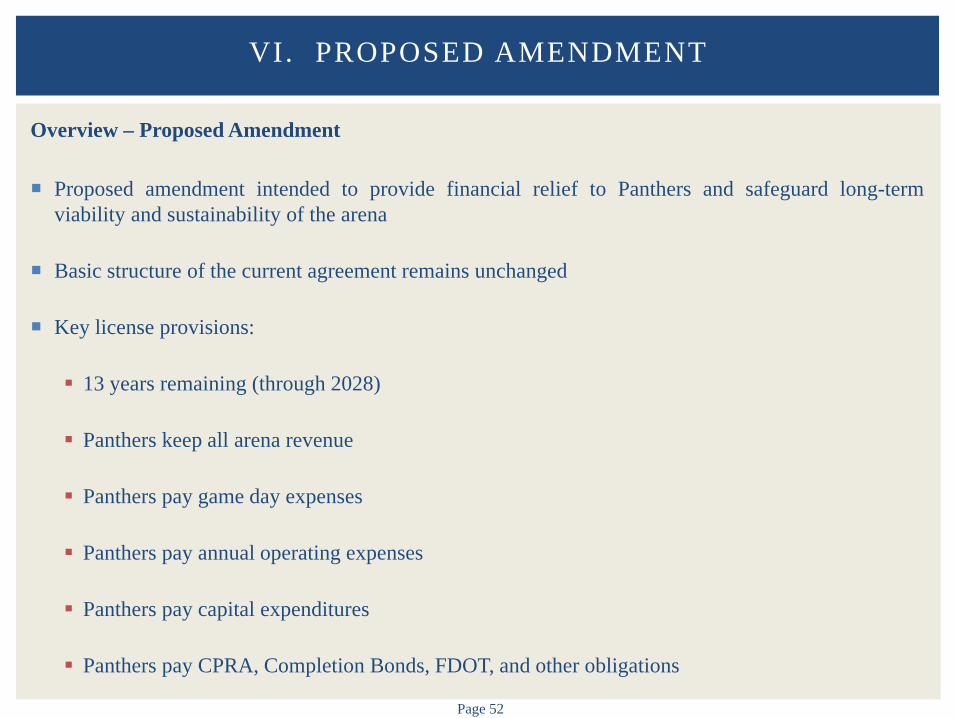
Overview – Proposed Amendment
Proposed amendment intended to provide financial relief to Panthers and safeguard long-term viability and sustainability of the arena
Basic structure of the current agreement remains unchanged
Key license provisions: 13 years remaining (through 2028)
Panthers keep all arena revenue
Panthers pay game day expenses
Panthers pay annual operating expenses
Panthers pay capital expenditures
Panthers pay CPRA, Completion Bonds, FDOT, and other obligations
VI. PROPOSED AMENDMENT
Page 53
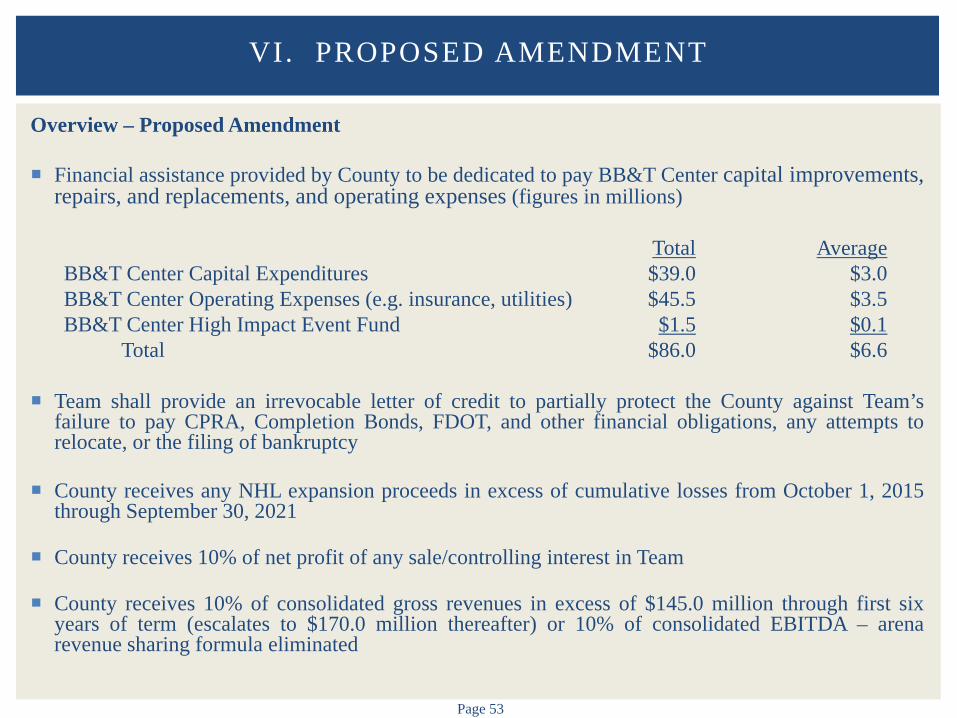
Overview – Proposed Amendment
Financial assistance provided by County to be dedicated to pay BB&T Center capital improvements, repairs, and replacements, and operating expenses (figures in millions) Total Average BB&T Center Capital Expenditures $39.0 $3.0 BB&T Center Operating Expenses (e.g. insurance, utilities) $45.5 $3.5 BB&T Center High Impact Event Fund $1.5 $0.1 Total $86.0 $6.6
Team shall provide an irrevocable letter of credit to partially protect the County against Team’s
failure to pay CPRA, Completion Bonds, FDOT, and other financial obligations, any attempts to relocate, or the filing of bankruptcy
County receives any NHL expansion proceeds in excess of cumulative losses from October 1, 2015 through September 30, 2021
County receives 10% of net profit of any sale/controlling interest in Team
County receives 10% of consolidated gross revenues in excess of $145.0 million through first six years of term (escalates to $170.0 million thereafter) or 10% of consolidated EBITDA – arena revenue sharing formula eliminated
VI. PROPOSED AMENDMENT
Page 54
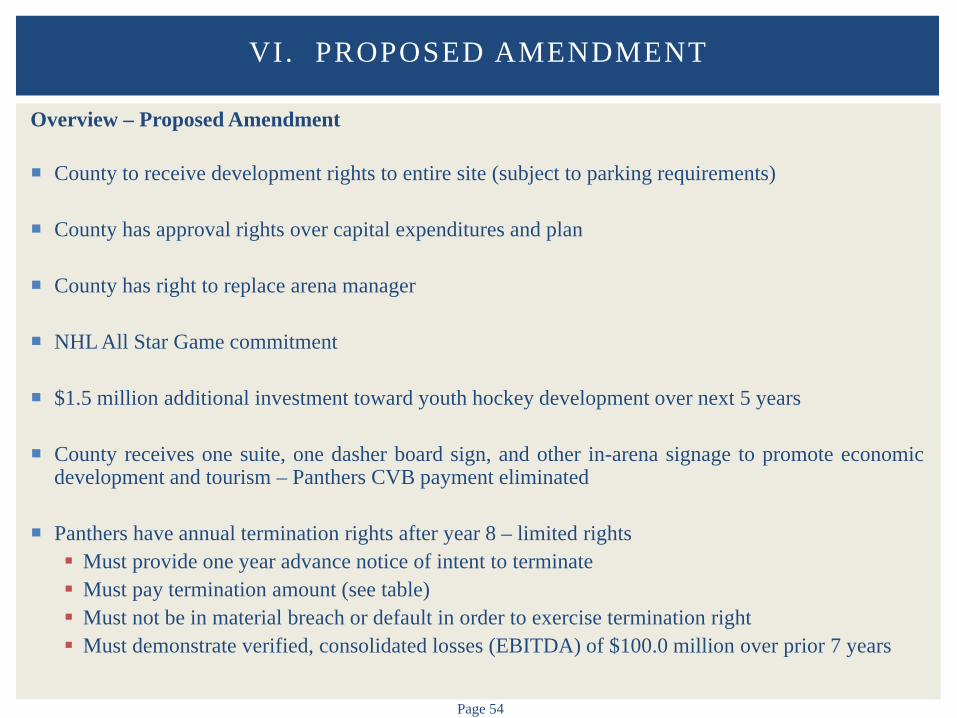
Overview – Proposed Amendment
County to receive development rights to entire site (subject to parking requirements)
County has approval rights over capital expenditures and plan
County has right to replace arena manager
NHL All Star Game commitment
$1.5 million additional investment toward youth hockey development over next 5 years
County receives one suite, one dasher board sign, and other in-arena signage to promote economic development and tourism – Panthers CVB payment eliminated
Panthers have annual termination rights after year 8 – limited rights Must provide one year advance notice of intent to terminate Must pay termination amount (see table) Must not be in material breach or default in order to exercise termination right Must demonstrate verified, consolidated losses (EBITDA) of $100.0 million over prior 7 years
VI. PROPOSED AMENDMENT
Page 55
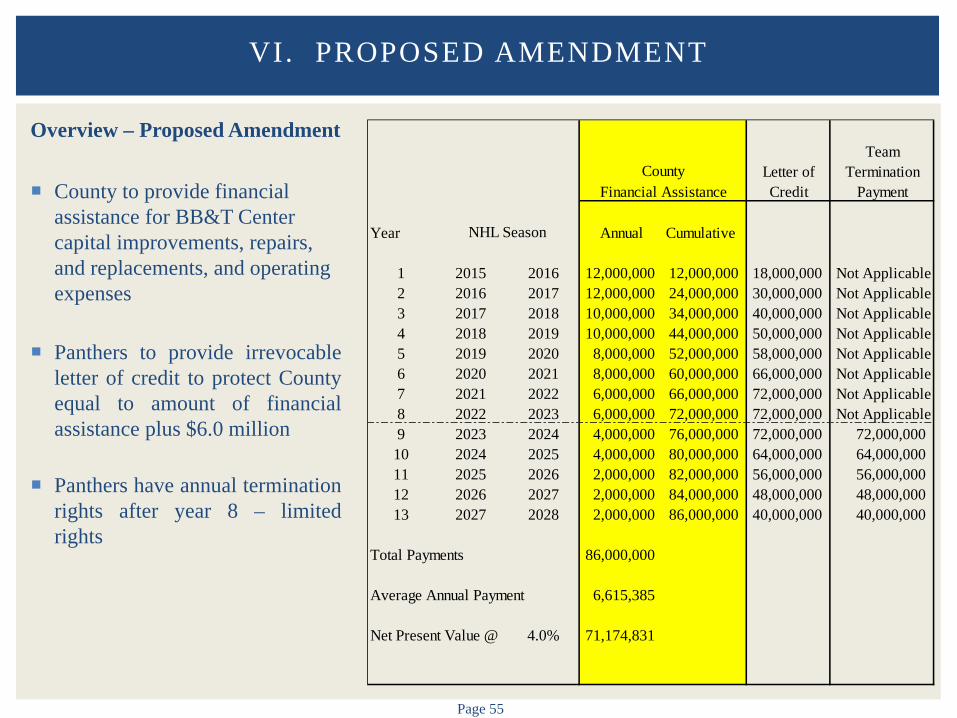
Overview – Proposed Amendment
County to provide financial assistance for BB&T Center capital improvements, repairs, and replacements, and operating expenses
Panthers to provide irrevocable letter of credit to protect County equal to amount of financial assistance plus $6.0 million
Panthers have annual termination rights after year 8 – limited rights
VI. PROPOSED AMENDMENT
TeamLetter of TerminationCredit Payment
Year Annual Cumulative
1 2015 2016 12,000,000 12,000,000 18,000,000 Not Applicable2 2016 2017 12,000,000 24,000,000 30,000,000 Not Applicable3 2017 2018 10,000,000 34,000,000 40,000,000 Not Applicable4 2018 2019 10,000,000 44,000,000 50,000,000 Not Applicable5 2019 2020 8,000,000 52,000,000 58,000,000 Not Applicable6 2020 2021 8,000,000 60,000,000 66,000,000 Not Applicable7 2021 2022 6,000,000 66,000,000 72,000,000 Not Applicable8 2022 2023 6,000,000 72,000,000 72,000,000 Not Applicable9 2023 2024 4,000,000 76,000,000 72,000,000 72,000,00010 2024 2025 4,000,000 80,000,000 64,000,000 64,000,00011 2025 2026 2,000,000 82,000,000 56,000,000 56,000,00012 2026 2027 2,000,000 84,000,000 48,000,000 48,000,00013 2027 2028 2,000,000 86,000,000 40,000,000 40,000,000
Total Payments 86,000,000
Average Annual Payment 6,615,385
Net Present Value @ 4.0% 71,174,831
CountyFinancial Assistance
NHL Season
Page 56
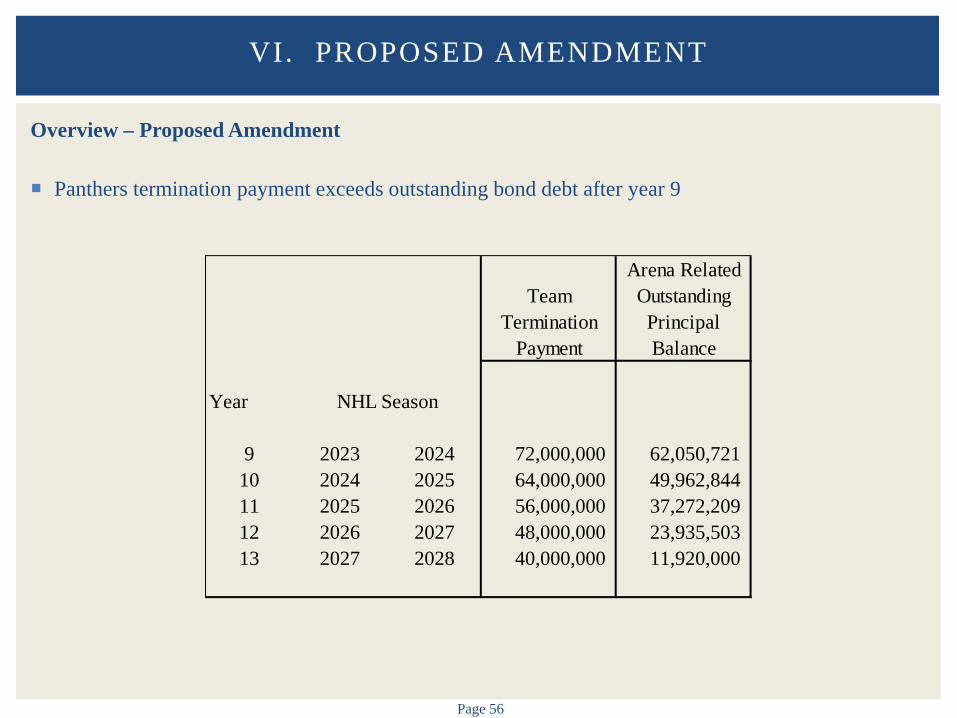
Overview – Proposed Amendment
Panthers termination payment exceeds outstanding bond debt after year 9
VI. PROPOSED AMENDMENT
Arena RelatedTeam Outstanding
Termination PrincipalPayment Balance
Year
9 2023 2024 72,000,000 62,050,72110 2024 2025 64,000,000 49,962,84411 2025 2026 56,000,000 37,272,20912 2026 2027 48,000,000 23,935,50313 2027 2028 40,000,000 11,920,000
NHL Season
VII. REVIEW OF FINANCIAL PROJECTIONS – PROPOSED
AMENDMENT
Page 58
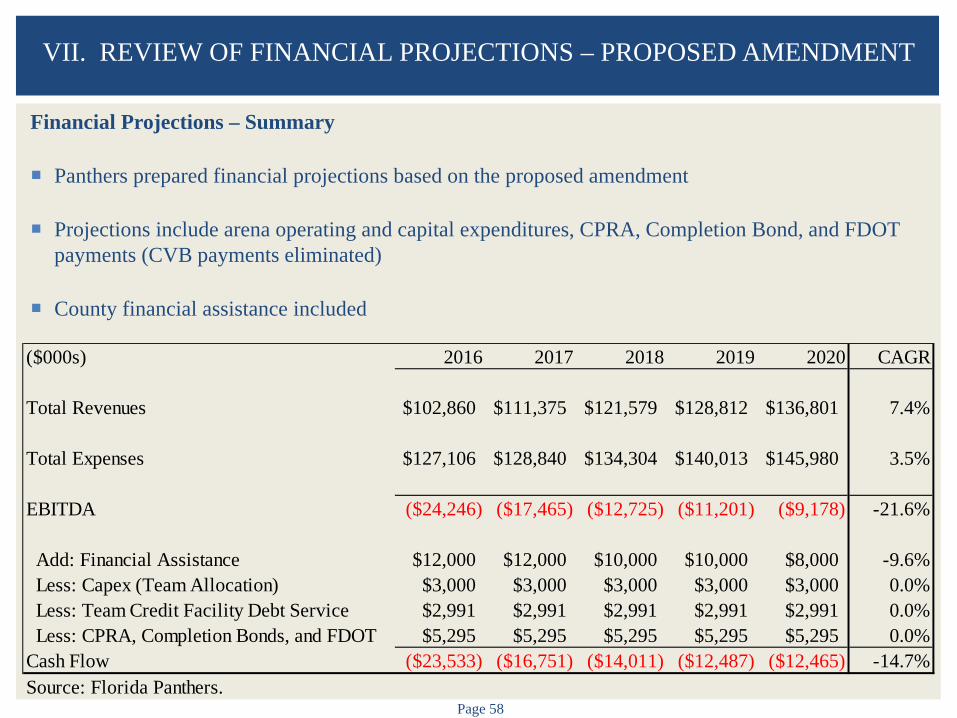
Financial Projections – Summary Panthers prepared financial projections based on the proposed amendment
Projections include arena operating and capital expenditures, CPRA, Completion Bond, and FDOT
payments (CVB payments eliminated)
County financial assistance included
VII. REVIEW OF FINANCIAL PROJECTIONS – PROPOSED AMENDMENT
($000s) 2016 2017 2018 2019 2020 CAGR
Total Revenues $102,860 $111,375 $121,579 $128,812 $136,801 7.4%
Total Expenses $127,106 $128,840 $134,304 $140,013 $145,980 3.5%
EBITDA ($24,246) ($17,465) ($12,725) ($11,201) ($9,178) -21.6%
Add: Financial Assistance $12,000 $12,000 $10,000 $10,000 $8,000 -9.6%Less: Capex (Team Allocation) $3,000 $3,000 $3,000 $3,000 $3,000 0.0%Less: Team Credit Facility Debt Service $2,991 $2,991 $2,991 $2,991 $2,991 0.0%Less: CPRA, Completion Bonds, and FDOT $5,295 $5,295 $5,295 $5,295 $5,295 0.0%
Cash Flow ($23,533) ($16,751) ($14,011) ($12,487) ($12,465) -14.7%Source: Florida Panthers.
Page 59
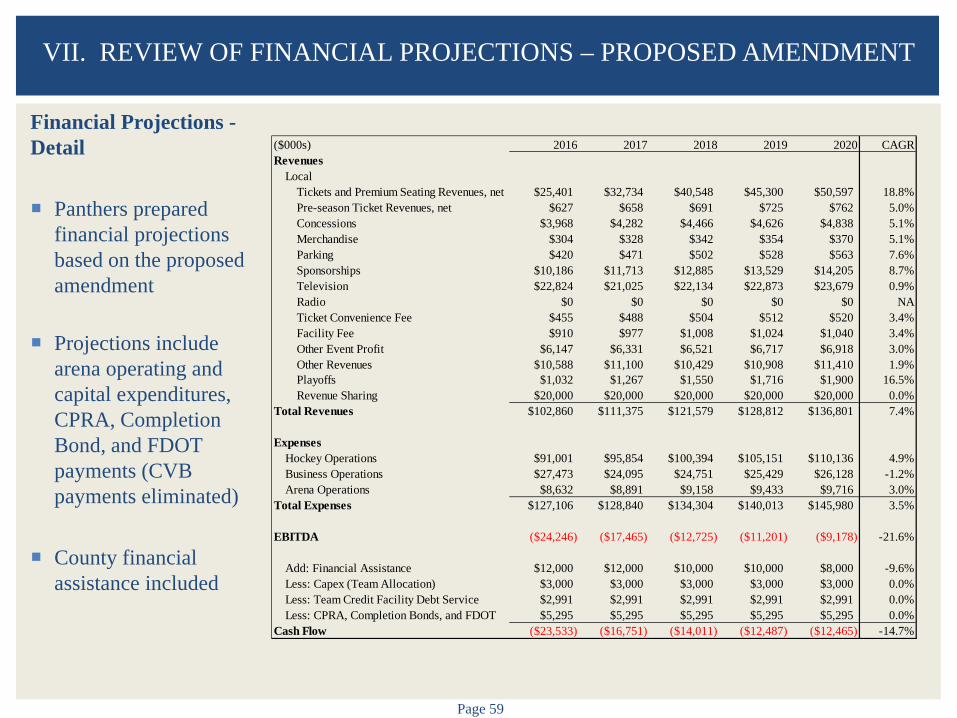
Financial Projections - Detail Panthers prepared
financial projections based on the proposed amendment
Projections include arena operating and capital expenditures, CPRA, Completion Bond, and FDOT payments (CVB payments eliminated)
County financial assistance included
VII. REVIEW OF FINANCIAL PROJECTIONS – PROPOSED AMENDMENT
($000s) 2016 2017 2018 2019 2020 CAGRRevenues
LocalTickets and Premium Seating Revenues, net $25,401 $32,734 $40,548 $45,300 $50,597 18.8%Pre-season Ticket Revenues, net $627 $658 $691 $725 $762 5.0%Concessions $3,968 $4,282 $4,466 $4,626 $4,838 5.1%Merchandise $304 $328 $342 $354 $370 5.1%Parking $420 $471 $502 $528 $563 7.6%Sponsorships $10,186 $11,713 $12,885 $13,529 $14,205 8.7%Television $22,824 $21,025 $22,134 $22,873 $23,679 0.9%Radio $0 $0 $0 $0 $0 NATicket Convenience Fee $455 $488 $504 $512 $520 3.4%Facility Fee $910 $977 $1,008 $1,024 $1,040 3.4%Other Event Profit $6,147 $6,331 $6,521 $6,717 $6,918 3.0%Other Revenues $10,588 $11,100 $10,429 $10,908 $11,410 1.9%Playoffs $1,032 $1,267 $1,550 $1,716 $1,900 16.5%Revenue Sharing $20,000 $20,000 $20,000 $20,000 $20,000 0.0%
Total Revenues $102,860 $111,375 $121,579 $128,812 $136,801 7.4%
ExpensesHockey Operations $91,001 $95,854 $100,394 $105,151 $110,136 4.9%Business Operations $27,473 $24,095 $24,751 $25,429 $26,128 -1.2%Arena Operations $8,632 $8,891 $9,158 $9,433 $9,716 3.0%
Total Expenses $127,106 $128,840 $134,304 $140,013 $145,980 3.5%
EBITDA ($24,246) ($17,465) ($12,725) ($11,201) ($9,178) -21.6%
Add: Financial Assistance $12,000 $12,000 $10,000 $10,000 $8,000 -9.6%Less: Capex (Team Allocation) $3,000 $3,000 $3,000 $3,000 $3,000 0.0%Less: Team Credit Facility Debt Service $2,991 $2,991 $2,991 $2,991 $2,991 0.0%Less: CPRA, Completion Bonds, and FDOT $5,295 $5,295 $5,295 $5,295 $5,295 0.0%
Cash Flow ($23,533) ($16,751) ($14,011) ($12,487) ($12,465) -14.7%
Page 60
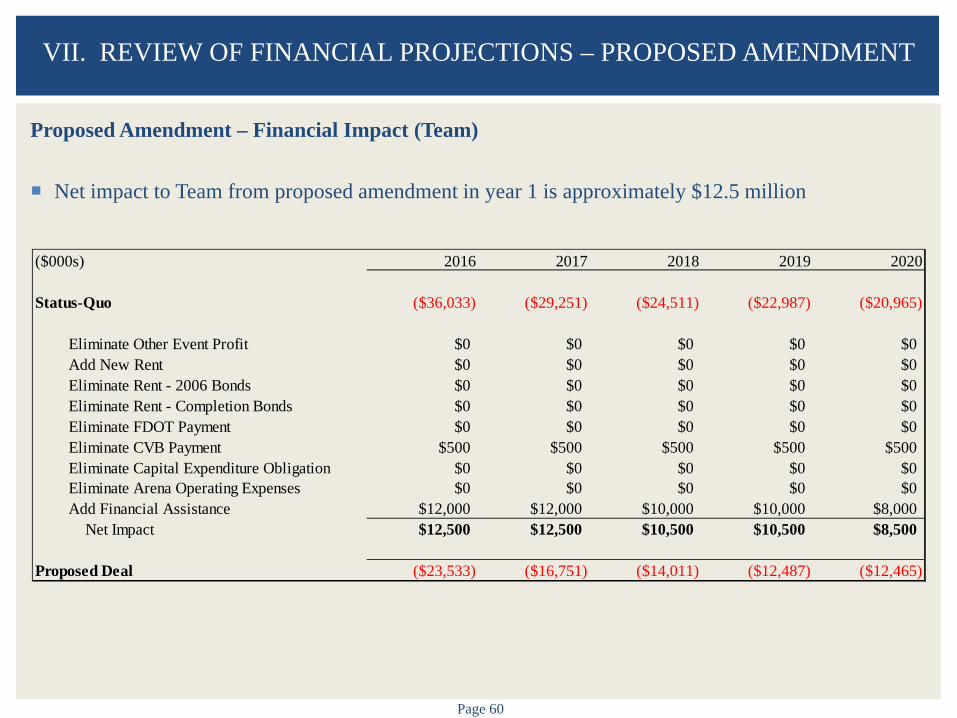
Proposed Amendment – Financial Impact (Team) Net impact to Team from proposed amendment in year 1 is approximately $12.5 million
VII. REVIEW OF FINANCIAL PROJECTIONS – PROPOSED AMENDMENT
($000s) 2016 2017 2018 2019 2020
Status-Quo ($36,033) ($29,251) ($24,511) ($22,987) ($20,965)
Eliminate Other Event Profit $0 $0 $0 $0 $0Add New Rent $0 $0 $0 $0 $0Eliminate Rent - 2006 Bonds $0 $0 $0 $0 $0Eliminate Rent - Completion Bonds $0 $0 $0 $0 $0Eliminate FDOT Payment $0 $0 $0 $0 $0Eliminate CVB Payment $500 $500 $500 $500 $500Eliminate Capital Expenditure Obligation $0 $0 $0 $0 $0Eliminate Arena Operating Expenses $0 $0 $0 $0 $0Add Financial Assistance $12,000 $12,000 $10,000 $10,000 $8,000
Net Impact $12,500 $12,500 $10,500 $10,500 $8,500
Proposed Deal ($23,533) ($16,751) ($14,011) ($12,487) ($12,465)
VIII. NHL LEASE ANALYSIS
Page 62
Methodology BSG has developed a methodology to evaluate and compare NHL arena deal structures and leases
Analysis isolates lease terms to allow for accurate and meaningful comparisons
We have attempted to identify all of the lease components (e.g. rent, revenue sharing) and account for
other significant costs of occupancy (e.g. direct and indirect equity contributions – or prepaid rent)
Analysis is intended to estimate the arena occupancy costs for each team
Arena occupancy costs are compared to other teams
Arena occupancy costs are divided by the estimated arena revenues, gross gate receipts, net gate receipts (additional approaches may be utilized for further comparison)
Comparison allows better understanding of the impact of the deal structure/lease terms on team
Due to confidentiality issues, summary level information only is provided
VIII. NHL LEASE ANALYSIS
Page 63
Methodology (Continued) Market area size and characteristics will have an important impact on the ability of the team to
generate revenue and this must be considered when evaluating deal structure/lease terms
Market rate deal should reflect and consider the anticipated operating characteristics and revenue potential for the market area and the specific team
Anticipated performance of the team in the market area over the lease term needs to be taken into account
When the performance of a team is expected to deviate from the average performance of the league over the long-term, deal structure/lease should account for the expected deviation
VIII. NHL LEASE ANALYSIS
Page 64
Arena Occupancy Costs Individual line items identified as arena occupancy costs
Rent (annualized over term of lease if escalation factor included) Minimum rent Base rent Additional rent Percentage rent
Taxes/surcharges Ticket sales tax Admissions tax Ticket surcharge Parking tax/surcharge
Revenue sharing Concessions Novelties Advertising Naming rights Parking Luxury suites (premium/tickets) Club seats (premium/tickets) Other
VIII. NHL LEASE ANALYSIS
Page 65
Arena Occupancy Costs (Continued)
Individual line items identified as arena occupancy costs (continued) Arena expenses Game day operating expenses Annual operating expenses Capital expenditures/improvements Other
Upfront payments/financing (annualized) Team contribution Permanent/personal seat licenses (PSLs) Naming rights Concessionaire Other
VIII. NHL LEASE ANALYSIS
Page 66
Comparable Leases
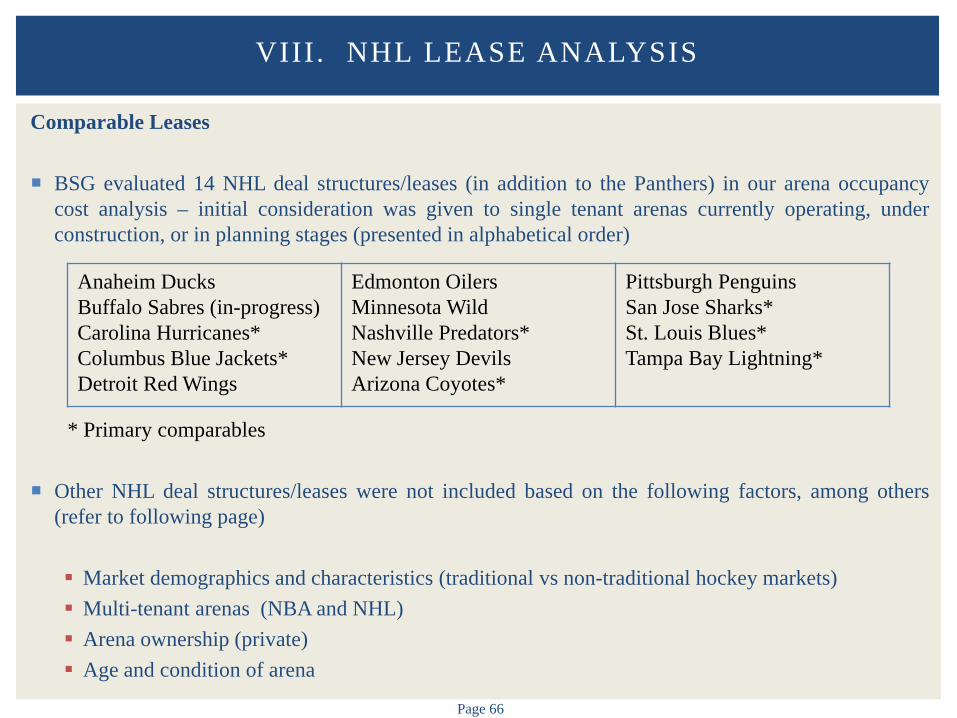
BSG evaluated 14 NHL deal structures/leases (in addition to the Panthers) in our arena occupancy cost analysis – initial consideration was given to single tenant arenas currently operating, under construction, or in planning stages (presented in alphabetical order)
* Primary comparables
Other NHL deal structures/leases were not included based on the following factors, among others (refer to following page)
Market demographics and characteristics (traditional vs non-traditional hockey markets) Multi-tenant arenas (NBA and NHL) Arena ownership (private) Age and condition of arena
VIII. NHL LEASE ANALYSIS
Anaheim Ducks Buffalo Sabres (in-progress) Carolina Hurricanes* Columbus Blue Jackets* Detroit Red Wings
Edmonton Oilers Minnesota Wild Nashville Predators* New Jersey Devils Arizona Coyotes*
Pittsburgh Penguins San Jose Sharks* St. Louis Blues* Tampa Bay Lightning*
Page 67
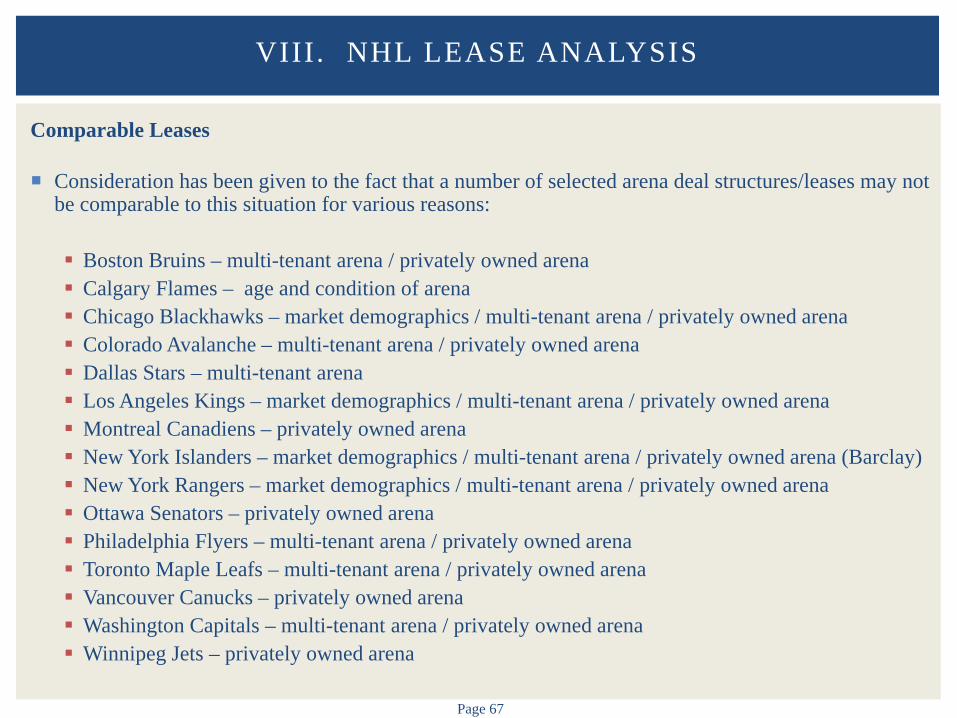
Comparable Leases
Consideration has been given to the fact that a number of selected arena deal structures/leases may not be comparable to this situation for various reasons: Boston Bruins – multi-tenant arena / privately owned arena Calgary Flames – age and condition of arena Chicago Blackhawks – market demographics / multi-tenant arena / privately owned arena Colorado Avalanche – multi-tenant arena / privately owned arena Dallas Stars – multi-tenant arena Los Angeles Kings – market demographics / multi-tenant arena / privately owned arena Montreal Canadiens – privately owned arena New York Islanders – market demographics / multi-tenant arena / privately owned arena (Barclay) New York Rangers – market demographics / multi-tenant arena / privately owned arena Ottawa Senators – privately owned arena Philadelphia Flyers – multi-tenant arena / privately owned arena Toronto Maple Leafs – multi-tenant arena / privately owned arena Vancouver Canucks – privately owned arena Washington Capitals – multi-tenant arena / privately owned arena Winnipeg Jets – privately owned arena
VIII. NHL LEASE ANALYSIS
Page 68
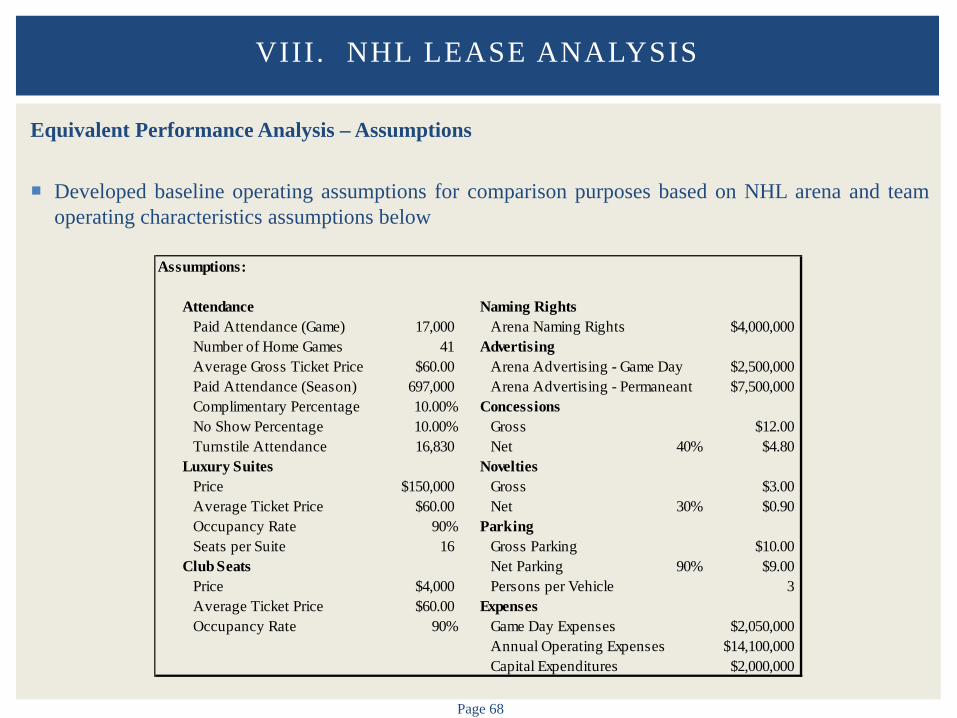
Equivalent Performance Analysis – Assumptions
Developed baseline operating assumptions for comparison purposes based on NHL arena and team operating characteristics assumptions below
VIII. NHL LEASE ANALYSIS
Assumptions:
Attendance Naming RightsPaid Attendance (Game) 17,000 Arena Naming Rights $4,000,000Number of Home Games 41 AdvertisingAverage Gross Ticket Price $60.00 Arena Advertising - Game Day $2,500,000Paid Attendance (Season) 697,000 Arena Advertising - Permaneant $7,500,000Complimentary Percentage 10.00% ConcessionsNo Show Percentage 10.00% Gross $12.00Turnstile Attendance 16,830 Net 40% $4.80
Luxury Suites NoveltiesPrice $150,000 Gross $3.00Average Ticket Price $60.00 Net 30% $0.90Occupancy Rate 90% ParkingSeats per Suite 16 Gross Parking $10.00
Club Seats Net Parking 90% $9.00Price $4,000 Persons per Vehicle 3Average Ticket Price $60.00 ExpensesOccupancy Rate 90% Game Day Expenses $2,050,000
Annual Operating Expenses $14,100,000Capital Expenditures $2,000,000
Page 69
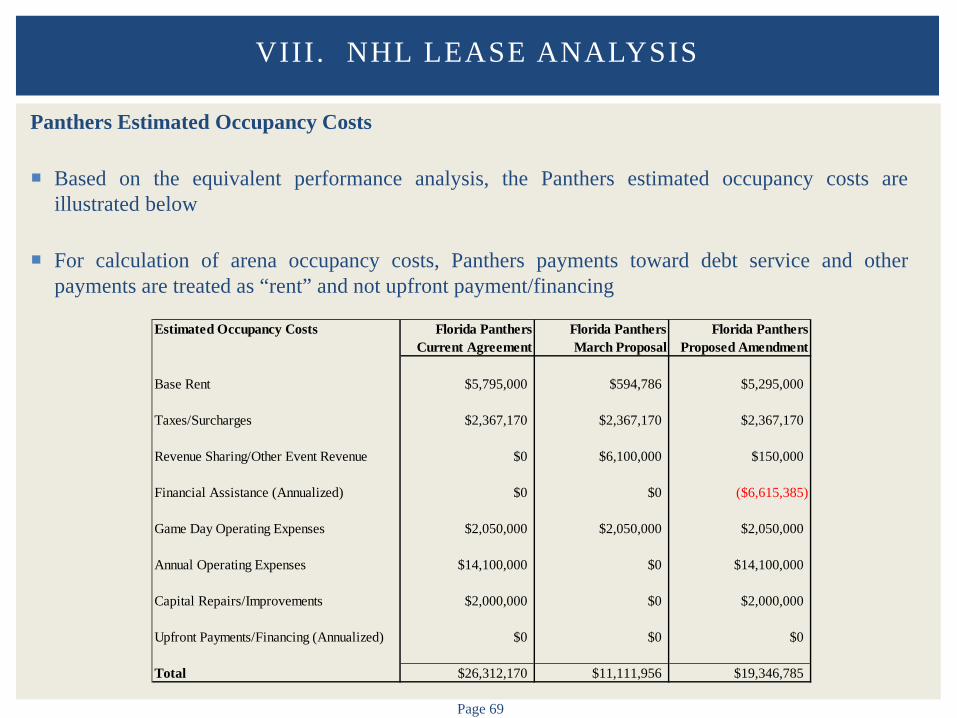
Panthers Estimated Occupancy Costs
Based on the equivalent performance analysis, the Panthers estimated occupancy costs are illustrated below
For calculation of arena occupancy costs, Panthers payments toward debt service and other payments are treated as “rent” and not upfront payment/financing
VIII. NHL LEASE ANALYSIS
Estimated Occupancy Costs Florida Panthers Florida Panthers Florida PanthersCurrent Agreement March Proposal Proposed Amendment
Base Rent $5,795,000 $594,786 $5,295,000
Taxes/Surcharges $2,367,170 $2,367,170 $2,367,170
Revenue Sharing/Other Event Revenue $0 $6,100,000 $150,000
Financial Assistance (Annualized) $0 $0 ($6,615,385)
Game Day Operating Expenses $2,050,000 $2,050,000 $2,050,000
Annual Operating Expenses $14,100,000 $0 $14,100,000
Capital Repairs/Improvements $2,000,000 $0 $2,000,000
Upfront Payments/Financing (Annualized) $0 $0 $0
Total $26,312,170 $11,111,956 $19,346,785
Page 70
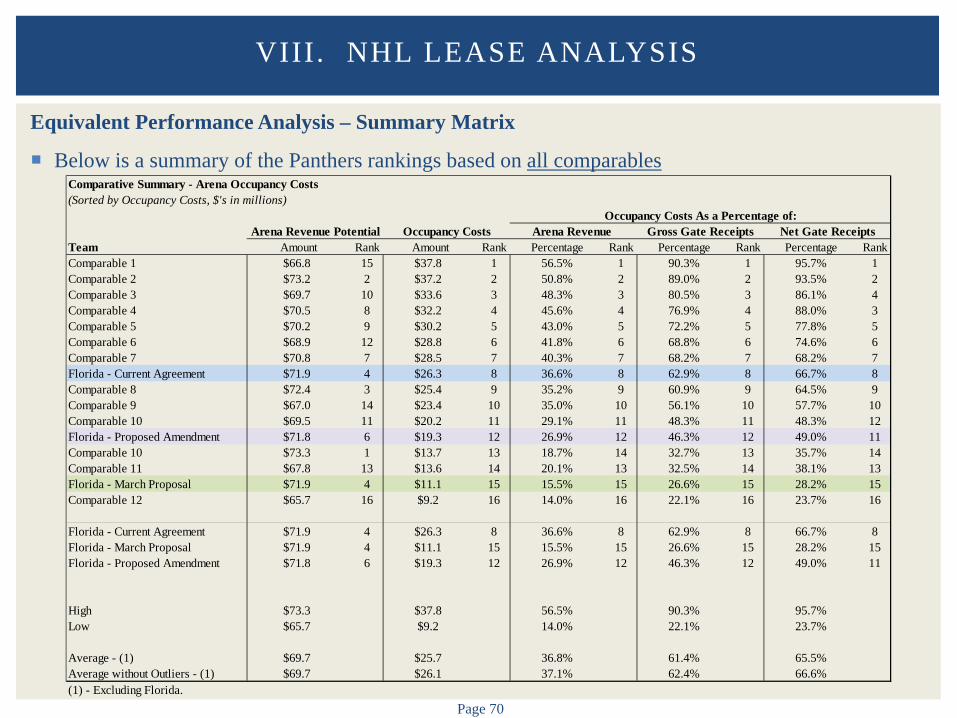
Equivalent Performance Analysis – Summary Matrix
Below is a summary of the Panthers rankings based on all comparables
VIII. NHL LEASE ANALYSIS
Comparative Summary - Arena Occupancy Costs(Sorted by Occupancy Costs, $'s in millions)
Occupancy Costs As a Percentage of:Arena Revenue Potential Occupancy Costs Arena Revenue Gross Gate Receipts Net Gate Receipts
Team Amount Rank Amount Rank Percentage Rank Percentage Rank Percentage RankComparable 1 $66.8 15 $37.8 1 56.5% 1 90.3% 1 95.7% 1Comparable 2 $73.2 2 $37.2 2 50.8% 2 89.0% 2 93.5% 2Comparable 3 $69.7 10 $33.6 3 48.3% 3 80.5% 3 86.1% 4Comparable 4 $70.5 8 $32.2 4 45.6% 4 76.9% 4 88.0% 3Comparable 5 $70.2 9 $30.2 5 43.0% 5 72.2% 5 77.8% 5Comparable 6 $68.9 12 $28.8 6 41.8% 6 68.8% 6 74.6% 6Comparable 7 $70.8 7 $28.5 7 40.3% 7 68.2% 7 68.2% 7Florida - Current Agreement $71.9 4 $26.3 8 36.6% 8 62.9% 8 66.7% 8Comparable 8 $72.4 3 $25.4 9 35.2% 9 60.9% 9 64.5% 9Comparable 9 $67.0 14 $23.4 10 35.0% 10 56.1% 10 57.7% 10Comparable 10 $69.5 11 $20.2 11 29.1% 11 48.3% 11 48.3% 12Florida - Proposed Amendment $71.8 6 $19.3 12 26.9% 12 46.3% 12 49.0% 11Comparable 10 $73.3 1 $13.7 13 18.7% 14 32.7% 13 35.7% 14Comparable 11 $67.8 13 $13.6 14 20.1% 13 32.5% 14 38.1% 13Florida - March Proposal $71.9 4 $11.1 15 15.5% 15 26.6% 15 28.2% 15Comparable 12 $65.7 16 $9.2 16 14.0% 16 22.1% 16 23.7% 16
Florida - Current Agreement $71.9 4 $26.3 8 36.6% 8 62.9% 8 66.7% 8Florida - March Proposal $71.9 4 $11.1 15 15.5% 15 26.6% 15 28.2% 15Florida - Proposed Amendment $71.8 6 $19.3 12 26.9% 12 46.3% 12 49.0% 11
High $73.3 $37.8 56.5% 90.3% 95.7%Low $65.7 $9.2 14.0% 22.1% 23.7%
Average - (1) $69.7 $25.7 36.8% 61.4% 65.5%Average without Outliers - (1) $69.7 $26.1 37.1% 62.4% 66.6%(1) - Excluding Florida.
Page 71
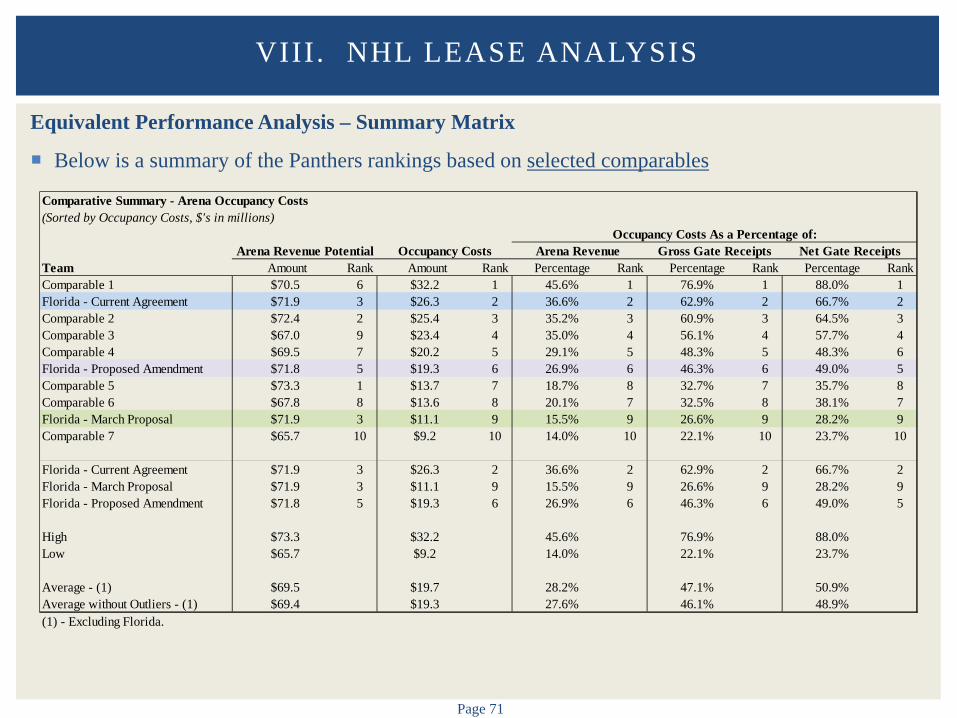
Equivalent Performance Analysis – Summary Matrix
Below is a summary of the Panthers rankings based on selected comparables
VIII. NHL LEASE ANALYSIS
Comparative Summary - Arena Occupancy Costs(Sorted by Occupancy Costs, $'s in millions)
Occupancy Costs As a Percentage of:Arena Revenue Potential Occupancy Costs Arena Revenue Gross Gate Receipts Net Gate Receipts
Team Amount Rank Amount Rank Percentage Rank Percentage Rank Percentage RankComparable 1 $70.5 6 $32.2 1 45.6% 1 76.9% 1 88.0% 1Florida - Current Agreement $71.9 3 $26.3 2 36.6% 2 62.9% 2 66.7% 2Comparable 2 $72.4 2 $25.4 3 35.2% 3 60.9% 3 64.5% 3Comparable 3 $67.0 9 $23.4 4 35.0% 4 56.1% 4 57.7% 4Comparable 4 $69.5 7 $20.2 5 29.1% 5 48.3% 5 48.3% 6Florida - Proposed Amendment $71.8 5 $19.3 6 26.9% 6 46.3% 6 49.0% 5Comparable 5 $73.3 1 $13.7 7 18.7% 8 32.7% 7 35.7% 8Comparable 6 $67.8 8 $13.6 8 20.1% 7 32.5% 8 38.1% 7Florida - March Proposal $71.9 3 $11.1 9 15.5% 9 26.6% 9 28.2% 9Comparable 7 $65.7 10 $9.2 10 14.0% 10 22.1% 10 23.7% 10
Florida - Current Agreement $71.9 3 $26.3 2 36.6% 2 62.9% 2 66.7% 2Florida - March Proposal $71.9 3 $11.1 9 15.5% 9 26.6% 9 28.2% 9Florida - Proposed Amendment $71.8 5 $19.3 6 26.9% 6 46.3% 6 49.0% 5
High $73.3 $32.2 45.6% 76.9% 88.0%Low $65.7 $9.2 14.0% 22.1% 23.7%
Average - (1) $69.5 $19.7 28.2% 47.1% 50.9%Average without Outliers - (1) $69.4 $19.3 27.6% 46.1% 48.9%(1) - Excluding Florida.
Page 72
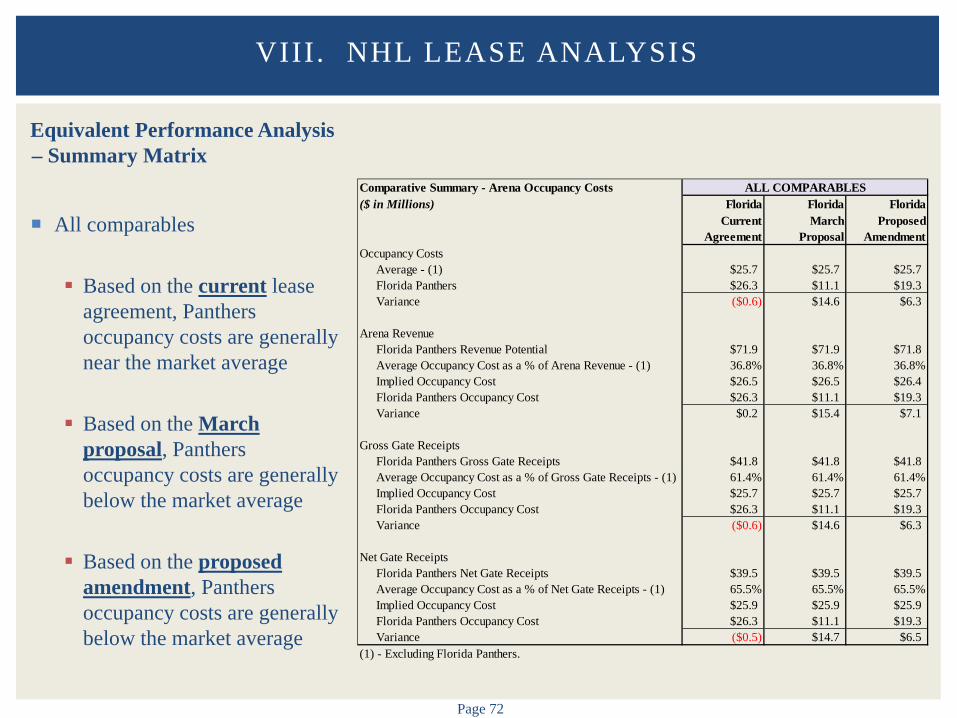
Equivalent Performance Analysis – Summary Matrix
All comparables
Based on the current lease
agreement, Panthers occupancy costs are generally near the market average
Based on the March
proposal, Panthers occupancy costs are generally below the market average
Based on the proposed amendment, Panthers occupancy costs are generally below the market average
VIII. NHL LEASE ANALYSIS
Comparative Summary - Arena Occupancy Costs($ in Millions) Florida Florida Florida
Current Agreement
March Proposal
Proposed Amendment
Occupancy CostsAverage - (1) $25.7 $25.7 $25.7Florida Panthers $26.3 $11.1 $19.3Variance ($0.6) $14.6 $6.3
Arena RevenueFlorida Panthers Revenue Potential $71.9 $71.9 $71.8Average Occupancy Cost as a % of Arena Revenue - (1) 36.8% 36.8% 36.8%Implied Occupancy Cost $26.5 $26.5 $26.4Florida Panthers Occupancy Cost $26.3 $11.1 $19.3Variance $0.2 $15.4 $7.1
Gross Gate ReceiptsFlorida Panthers Gross Gate Receipts $41.8 $41.8 $41.8Average Occupancy Cost as a % of Gross Gate Receipts - (1) 61.4% 61.4% 61.4%Implied Occupancy Cost $25.7 $25.7 $25.7Florida Panthers Occupancy Cost $26.3 $11.1 $19.3Variance ($0.6) $14.6 $6.3
Net Gate ReceiptsFlorida Panthers Net Gate Receipts $39.5 $39.5 $39.5Average Occupancy Cost as a % of Net Gate Receipts - (1) 65.5% 65.5% 65.5%Implied Occupancy Cost $25.9 $25.9 $25.9Florida Panthers Occupancy Cost $26.3 $11.1 $19.3Variance ($0.5) $14.7 $6.5
(1) - Excluding Florida Panthers.
ALL COMPARABLES

Page 73
Equivalent Performance Analysis – Summary Matrix
Selected comparables
Based on the current lease
agreement, Panthers occupancy costs are generally above the market average
Based on the March
proposal, Panthers occupancy costs are generally below the market average
Based on the proposed amendment, Panthers occupancy costs are generally near the market average
VIII. NHL LEASE ANALYSIS
Comparative Summary - Arena Occupancy Costs($ in Millions) Florida Florida Florida
Current Agreement
March Proposal
Proposed Amendment
Occupancy CostsAverage - (1) $19.7 $19.7 $19.7Florida Panthers $26.3 $11.1 $19.3Variance ($6.6) $8.6 $0.3
Arena RevenueFlorida Panthers Revenue Potential $71.9 $71.9 $71.8Average Occupancy Cost as a % of Arena Revenue - (1) 28.2% 28.2% 28.2%Implied Occupancy Cost $20.3 $20.3 $20.3Florida Panthers Occupancy Cost $26.3 $11.1 $19.3Variance ($6.0) $9.2 $0.9
Gross Gate ReceiptsFlorida Panthers Gross Gate Receipts $41.8 $41.8 $41.8Average Occupancy Cost as a % of Gross Gate Receipts - (1) 47.1% 47.1% 47.1%Implied Occupancy Cost $19.7 $19.7 $19.7Florida Panthers Occupancy Cost $26.3 $11.1 $19.3Variance ($6.6) $8.6 $0.3
Net Gate ReceiptsFlorida Panthers Net Gate Receipts $39.5 $39.5 $39.5Average Occupancy Cost as a % of Net Gate Receipts - (1) 50.9% 50.9% 50.9%Implied Occupancy Cost $20.1 $20.1 $20.1Florida Panthers Occupancy Cost $26.3 $11.1 $19.3Variance ($6.2) $9.0 $0.7
(1) - Excluding Florida Panthers.
SELECTED COMPARABLES

IX. GENERAL OBSERVATIONS
Page 75
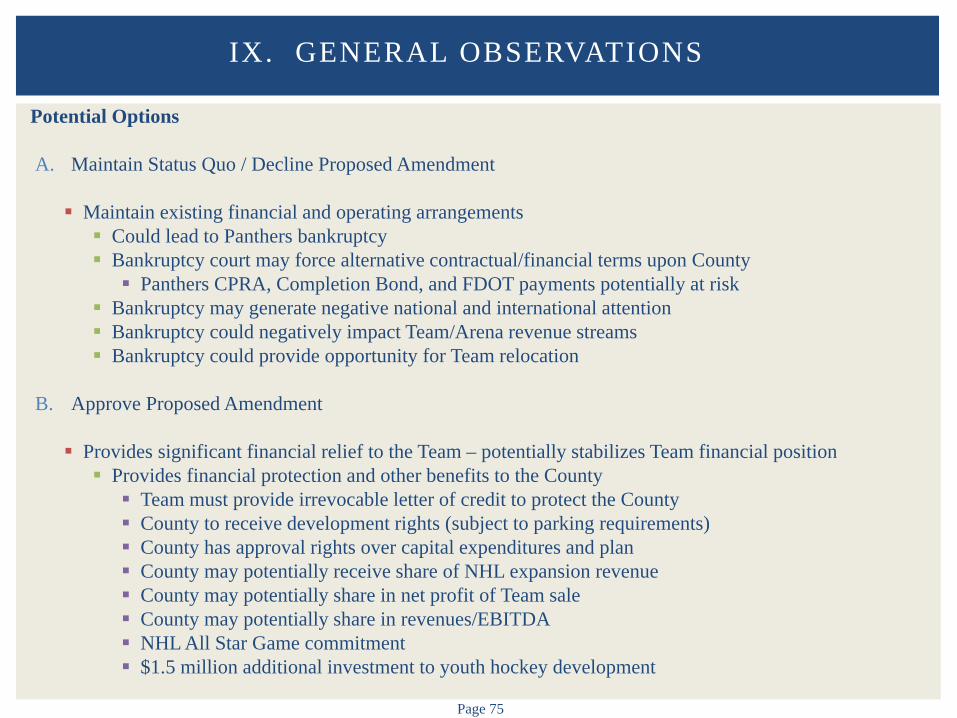
Potential Options
A. Maintain Status Quo / Decline Proposed Amendment
Maintain existing financial and operating arrangements Could lead to Panthers bankruptcy Bankruptcy court may force alternative contractual/financial terms upon County Panthers CPRA, Completion Bond, and FDOT payments potentially at risk
Bankruptcy may generate negative national and international attention Bankruptcy could negatively impact Team/Arena revenue streams Bankruptcy could provide opportunity for Team relocation
B. Approve Proposed Amendment
Provides significant financial relief to the Team – potentially stabilizes Team financial position Provides financial protection and other benefits to the County Team must provide irrevocable letter of credit to protect the County County to receive development rights (subject to parking requirements) County has approval rights over capital expenditures and plan County may potentially receive share of NHL expansion revenue County may potentially share in net profit of Team sale County may potentially share in revenues/EBITDA NHL All Star Game commitment $1.5 million additional investment to youth hockey development
IX. GENERAL OBSERVATIONS
Page 76
Potential Options
C. Continue to Negotiate Proposed Amendment
D. Negotiate Terms to Allow Panthers to Buyout License Agreement
Continue to operate arena / develop portion of site Demolish arena / develop entire site
IX. GENERAL OBSERVATIONS

LIMITING CONDITIONS AND ASSUMPTIONS
Page 78
This analysis is subject to our contractual terms, as well as the following limiting conditions and assumptions: The analysis has been prepared for internal decision making purposes of the Client only and shall not be used for any other purposes
without the prior written permission of Barrett Sports Group, LLC. The analysis includes findings and recommendations; however, all decisions in connection with the implementation of such findings
and recommendations shall be Client’s responsibility. Ownership and management of the stadium are assumed to be in competent and responsible hands. Ownership and management can
materially impact the findings of this analysis. Any estimates of historical or future prices, revenues, rents, expenses, occupancy, net operating income, mortgage debt service, capital
outlays, cash flows, inflation, capitalization rates, yield rates or interest rates are intended solely for analytical purposes and are not to be construed as predictions of the analysts. They represent only the judgment of the authors based on information provided by operators and owners active in the market place, and their accuracy is in no way guaranteed.
Our work has been based in part on review and analysis of information provided by unrelated sources which are believed accurate, but cannot be assured to be accurate. No audit or other verification has been completed.
Current and anticipated market conditions are influenced by a large number of external factors. We have not knowingly withheld any pertinent facts, but we do not guarantee that we have knowledge of all factors which might influence the operating potential of the facility. Due to rapid changes in the external factors, the actual results may vary significantly from estimates presented in this report.
The analysts reserve the right to make such adjustments to the analyses, opinions, and conclusions set forth in this report as may be required by consideration of additional data or more reliable data which may become available.
The analysis is intended to be read and used as a whole and not in parts. Separation of any section or page from the main body of the report is expressly forbidden and invalidates the analysis.
Possession of the analysis does not carry with it the right of publication. It shall be used for its intended purpose only and by the parties to whom it is addressed. Other parties should not rely on the findings of this report for any purpose and should perform their own due diligence.
Our performance of the tasks completed does not constitute an opinion of value or appraisal, or a projection of financial performance or audit of the facility in accordance with generally accepted audit standards. Estimates of value (ranges) have been prepared to illustrate current and possible future market conditions.
The analysis shall not be used in any matters pertaining to any financing, or real estate or other securities offering, registration, or exemption with any state or with the federal Securities and Exchange Commission.
No liability is assumed for matters which are legal or environmental in nature.
LIMITING CONDITIONS AND ASSUMPTIONS