Embed Size (px)
Citation preview
PATENTS, INNOVATION, ANDDEVELOPMENT
Bronwyn H. HallUC Berkeley, NBER, IFS London, and
MPI Munich
Outline
• Lecture 1– Penrose and this topic– Some facts and a brief patent primer– Patents and innovation
• What happens when countries join a regional system?
• Lecture 2– Patents and innovation in the development context
• What happens when patent system is strengthened – Chilean experience?
– Focus on pharmaceutical patents
March 2018 Penrose Lectures ‐ SOAS 2
Penrose on patents
• The Economics of the International Patent System (thesis, 1951)
• International patenting and the less‐developed countries (EJ 1983)
• Some discussion of entry barriers for small firms in the Theory of the Growth of the Firm (1959)
March 2018 Penrose Lectures ‐ SOAS 3
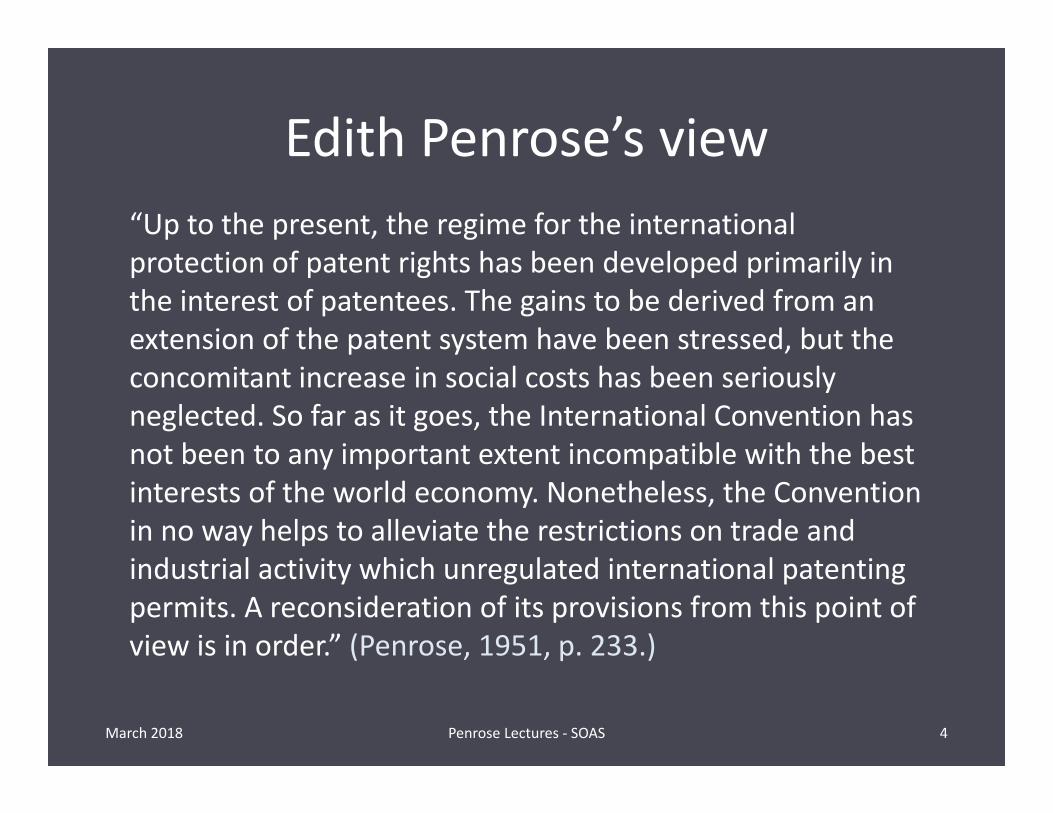
Edith Penrose’s view“Up to the present, the regime for the international protection of patent rights has been developed primarily in the interest of patentees. The gains to be derived from an extension of the patent system have been stressed, but the concomitant increase in social costs has been seriously neglected. So far as it goes, the International Convention has not been to any important extent incompatible with the best interests of the world economy. Nonetheless, the Convention in no way helps to alleviate the restrictions on trade and industrial activity which unregulated international patenting permits. A reconsideration of its provisions from this point of view is in order.” (Penrose, 1951, p. 233.)
March 2018 Penrose Lectures ‐ SOAS 4
At the present time
• “International Convention” reference ‐ the Paris convention of 1883
• Replace “International Convention” with “TRIPS” –statement remains true today
• Most significant differences today:– Increased salience of patents– Rapid growth in patenting (especially Chinese)– Entry and growth of several new countries in global patenting
March 2018 Penrose Lectures ‐ SOAS 5
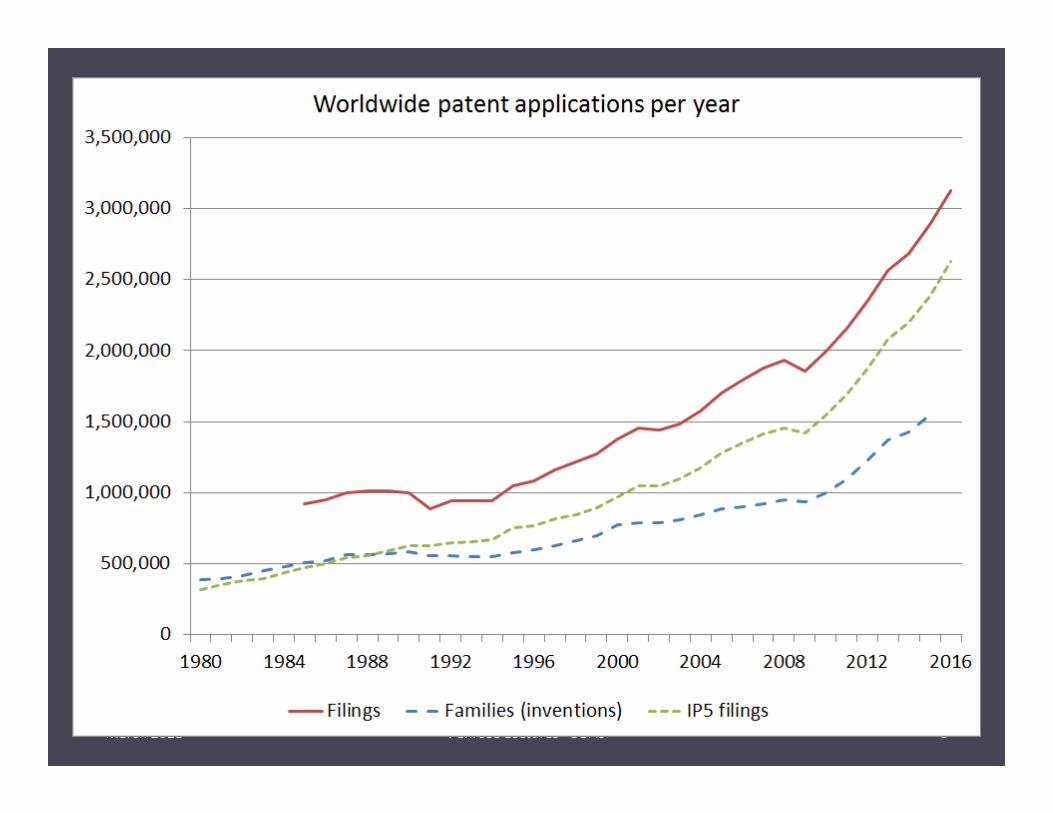
March 2018 Penrose Lectures ‐ SOAS 6
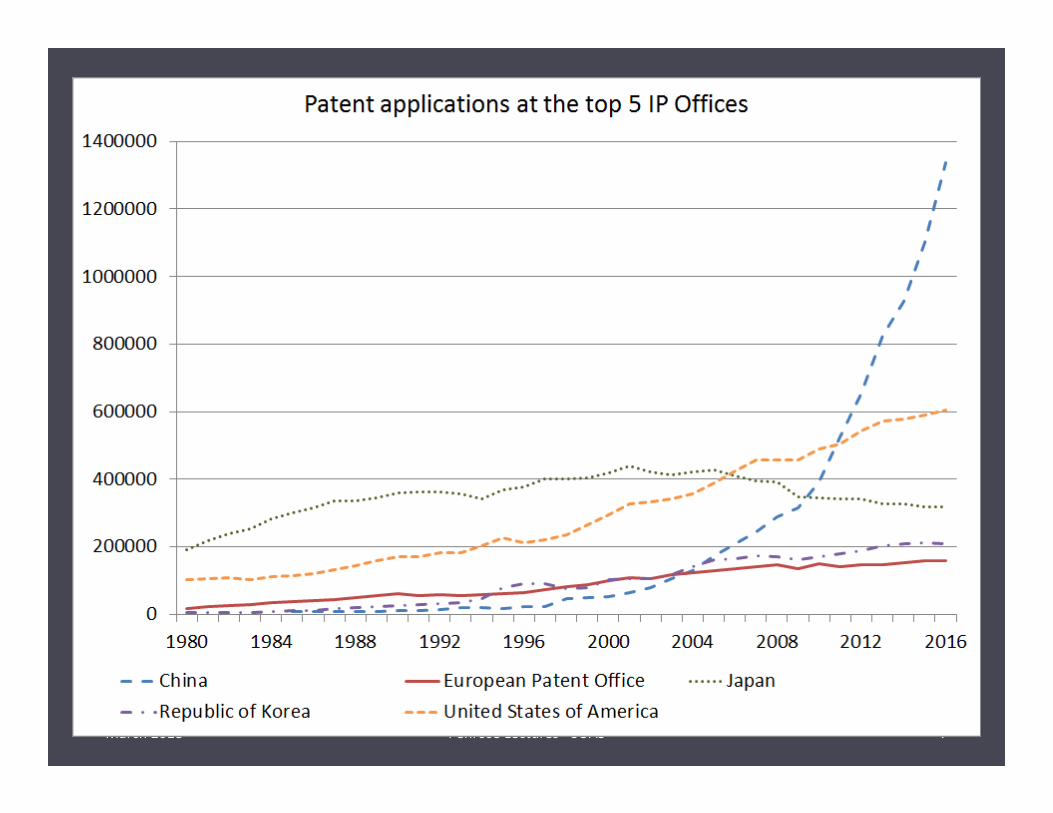
March 2018 Penrose Lectures ‐ SOAS 7
Domestic vs. foreign patenting
• WIPO statistics track applications by residents (which may include subsidiaries of foreign cos) and non‐residents.
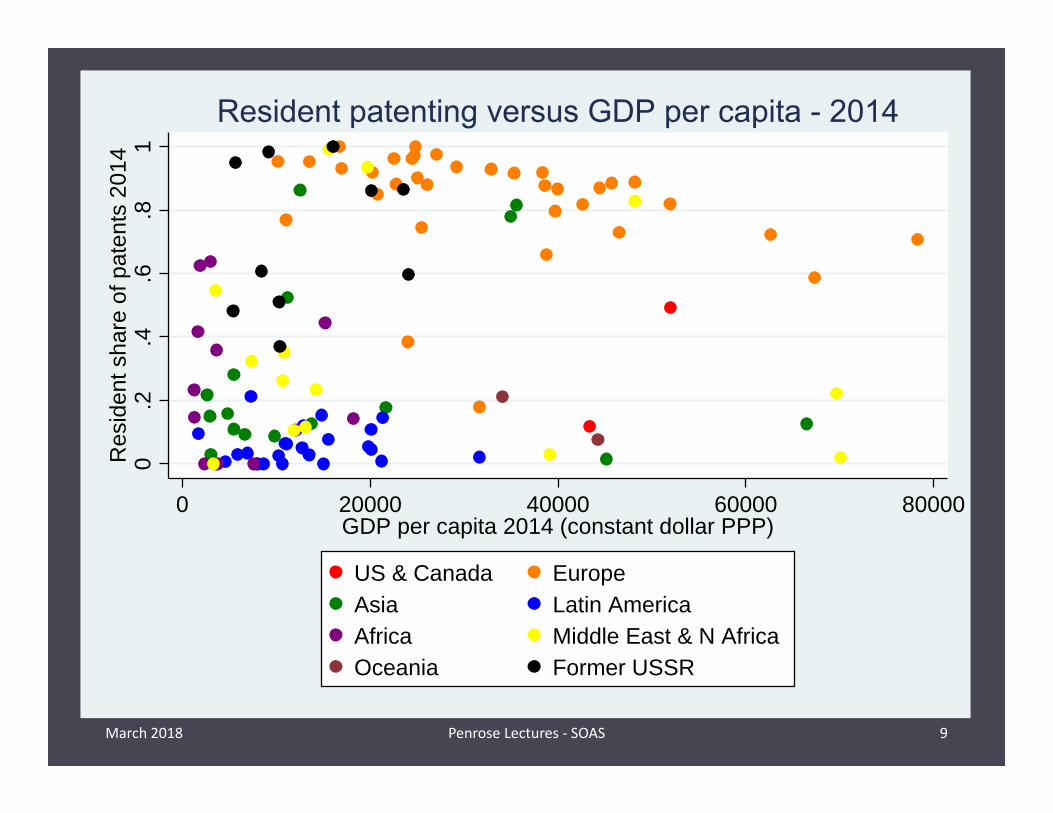
• Next slide: GDP/capita (PPP‐adjusted) versus resident share of patent filings in 2014
• Correlation of GDP/capita with share = 0.29• Correlation of population with share = 0.21
March 2018 Penrose Lectures ‐ SOAS 8
March 2018 Penrose Lectures ‐ SOAS 9
0.2
.4.6
.81
Res
iden
t sha
re o
f pat
ents
201
4
0 20000 40000 60000 80000GDP per capita 2014 (constant dollar PPP)
US & Canada EuropeAsia Latin AmericaAfrica Middle East & N AfricaOceania Former USSR
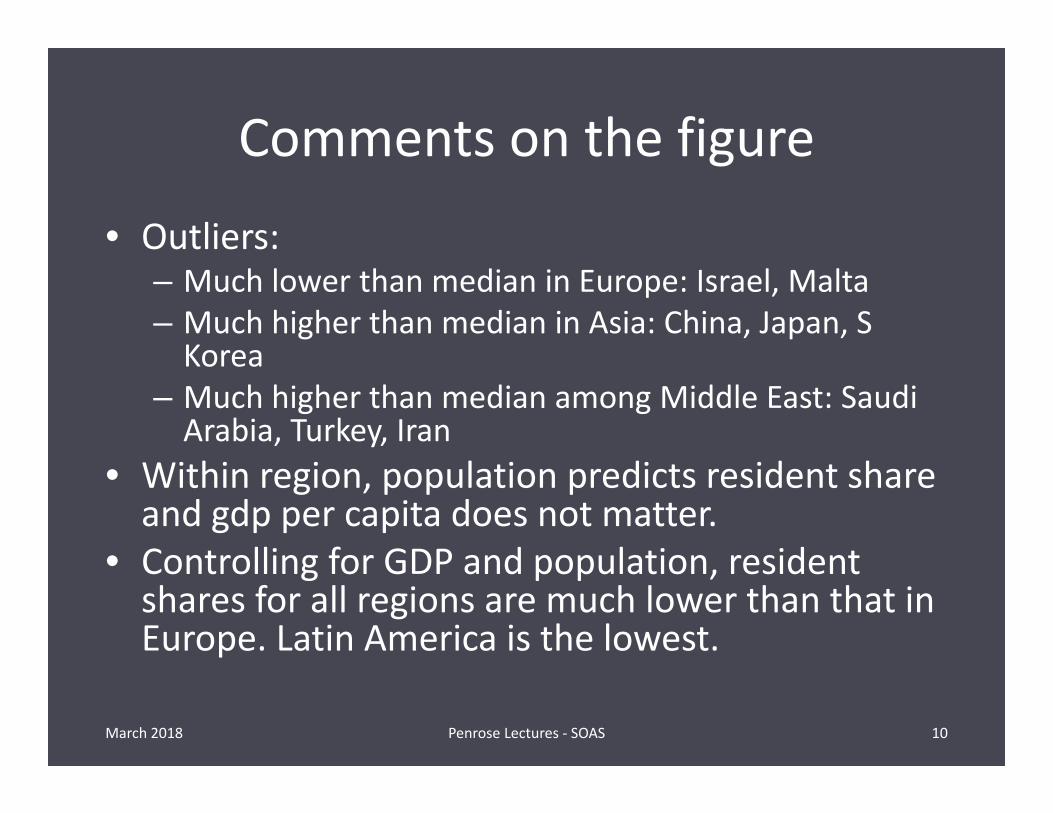
Comments on the figure
• Outliers:– Much lower than median in Europe: Israel, Malta– Much higher than median in Asia: China, Japan, S Korea
– Much higher than median among Middle East: Saudi Arabia, Turkey, Iran
• Within region, population predicts resident share and gdp per capita does not matter.
• Controlling for GDP and population, resident shares for all regions are much lower than that in Europe. Latin America is the lowest.
March 2018 Penrose Lectures ‐ SOAS 10
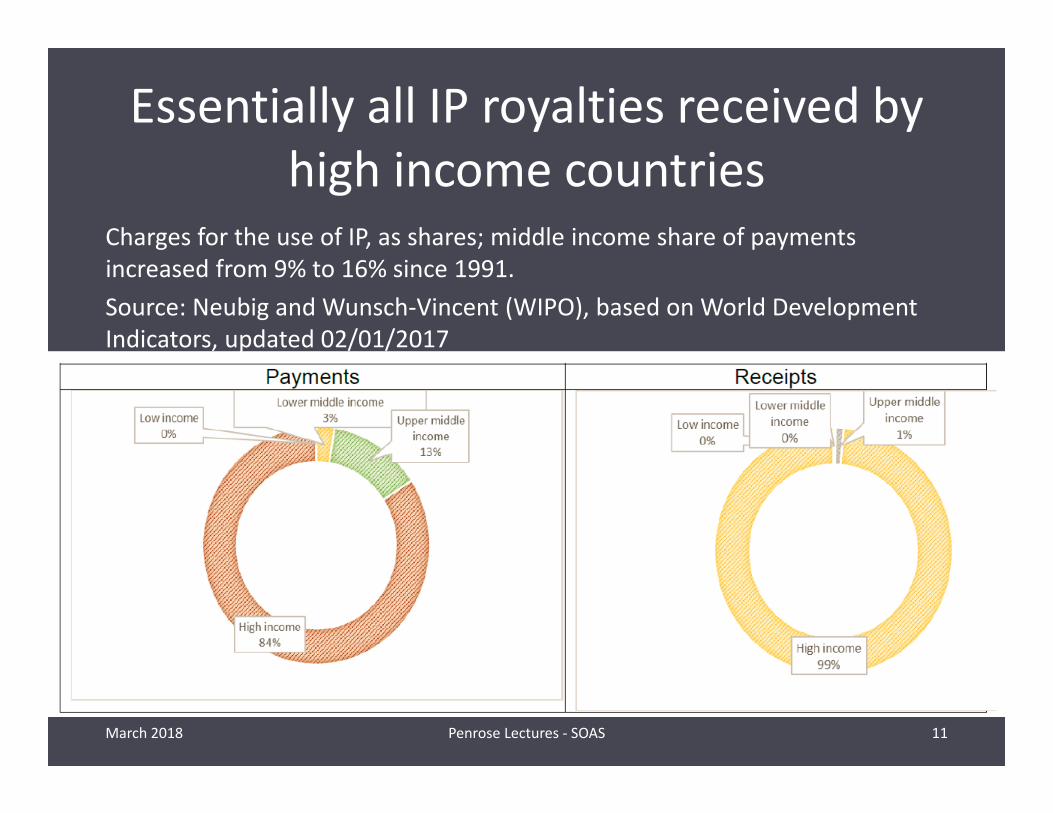
Essentially all IP royalties received by high income countries
Charges for the use of IP, as shares; middle income share of payments increased from 9% to 16% since 1991.Source: Neubig and Wunsch‐Vincent (WIPO), based on World Development Indicators, updated 02/01/2017
March 2018 Penrose Lectures ‐ SOAS 11
Brief patent primer• In most systems, a patent can be obtained on any invention that is
novel, nonobvious, and useful, without regard to subject matter– At different times and places, subject matter restrictions have been
present• Apply at national/regional office, search & examination, patent
grant valid only in jurisdiction where granted.– Countries determine some aspects of their IP rights systems
• International agreements:– Paris Convention 1883 facilitates patenting in multiple jurisdictions
(defines priority right, mandates national treatment)– Patent Cooperation Treaty (PCT) facilitates patenting in multiple
jurisdictions through single application (WIPO)– TRIPS regulates and harmonizes national IP systems
• Regional patent systems (EPO, ARIPO, OAPI, EAPO)
March 2018 Penrose Lectures ‐ SOAS 12
Intl. patent systems ‐ theory• Non‐cooperative equilibria choose more IP protection in
developed countries than less developed (Grossman and Lai, AER 2004)
• Welfare effects depend on relative income levels in North and South – negative if gap is large (Angeles, BE Macro 2005)
• Scotchmer (JLEO 2004) – Assume innovation provided either by IP or public sponsorship– National treatment and harmonization both lead to too much IP
protection and too little public sponsorship in all countries relative to social welfare optimum
– Small countries will favor more extensive IP rights than large countries (c.p.) ‐ they lose more via spillovers
– More innovative countries will favor more extensive IP rights (c.p.)
March 2018 Penrose Lectures ‐ SOAS 13
Patents and innovation• Does the existence of a patent system increase innovative activity?– Hard question to answer (no experiments)
• Can’t use patents to measure innovation for this purpose• Response to policy shifts often slow; related to other macro variables
• Controlling for country effects may leave little additional variability– Historical cross‐country evidence says no, but changes direction away from secrecy
• Review recent evidence on impacts– Patents/patent strength on innovative activity (mostly R&D)
– Patents/patent strength on growth
March 2018 Penrose Lectures ‐ SOAS 14
Patents and innovative activity
• Does the strength of the patent system (G‐P index) affect innovative activity?– Patent importance (from innovation survey) affects R&D more in larger countries
• OECD (2009) – 8 Countries, 2002‐2004, firm level– Longrun response of R&D intensity to one unit move in GP index is about 1.3 per cent (fairly large)
• Lederman and Maloney (2003) ‐ 73 countries, 1975‐2000, system GMM
March 2018 Penrose Lectures ‐ SOAS 15
Patents and innovative activity
• Strong positive effect of patent laws on invention– Chen (2008) – 14 Countries, 1750‐1950, 614 major inventions – Warning: no time effect in regression!
• Contemporaneous relationship of IP strength & R&D/patenting, but not for developing countries– Kanwar & Evenson (2003) – 30 countries, 1981‐1990 (2 five‐year periods)– Allred & Park (2007) – 100 countries, 1965‐2000 (five‐year periods)– No correction for simultaneity
• IPRs have a positive effect on patenting in US– Confirms predicted U‐shaped relationship between IP strength and
development level (first decreases, then increases)– Weak identification: trade openness and WTO membership assumed to
influence IPRs and not innovation– Chen and Puttitanum (JDE 2004) ‐ 64 dev. countries 1975‐2000; G‐P index
March 2018 Penrose Lectures ‐ SOAS 16
Patents and economic growth• IPR strength (GP‐Fraser) grows in importance over time and
is more important for growth in patent‐intensive industries– Hu & Png (2012) – cross country & 45 industries, 1981‐2000, GP‐
Fraser index X patent intensity• IPR strength (GP) impacts R&D in the more developed half,
no direct impact on GDP growth– Park & Ginarte (1997) – cross country growth regressions for 60
countries, 1960‐1990 (5 year periods, GP index lagged)• Simple causality tests show simultaneity between patenting
and growth, with patenting‐> growth somewhat stronger than growth‐>patenting– Hasan & Tucci (2010) – cross country growth regressions for 58
countries, 1980‐2003
March 2018 Penrose Lectures ‐ SOAS 17
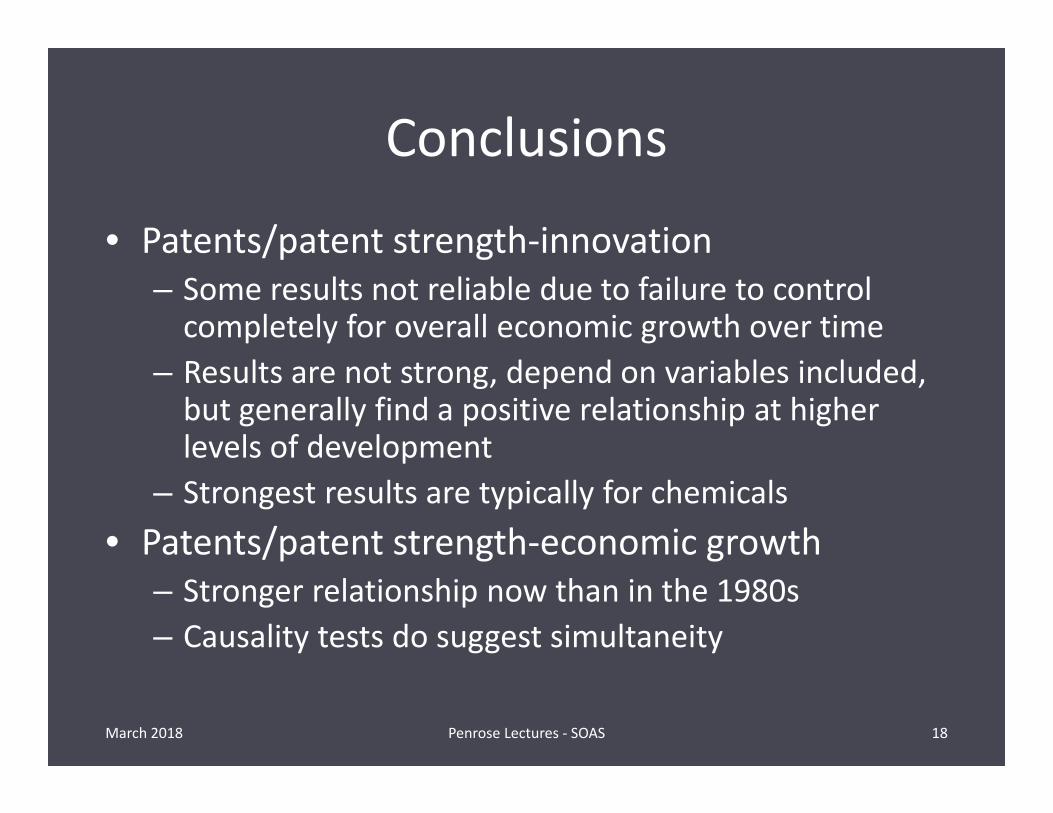
Conclusions
• Patents/patent strength‐innovation– Some results not reliable due to failure to control completely for overall economic growth over time
– Results are not strong, depend on variables included, but generally find a positive relationship at higher levels of development
– Strongest results are typically for chemicals• Patents/patent strength‐economic growth
– Stronger relationship now than in the 1980s– Causality tests do suggest simultaneity
March 2018 Penrose Lectures ‐ SOAS 18
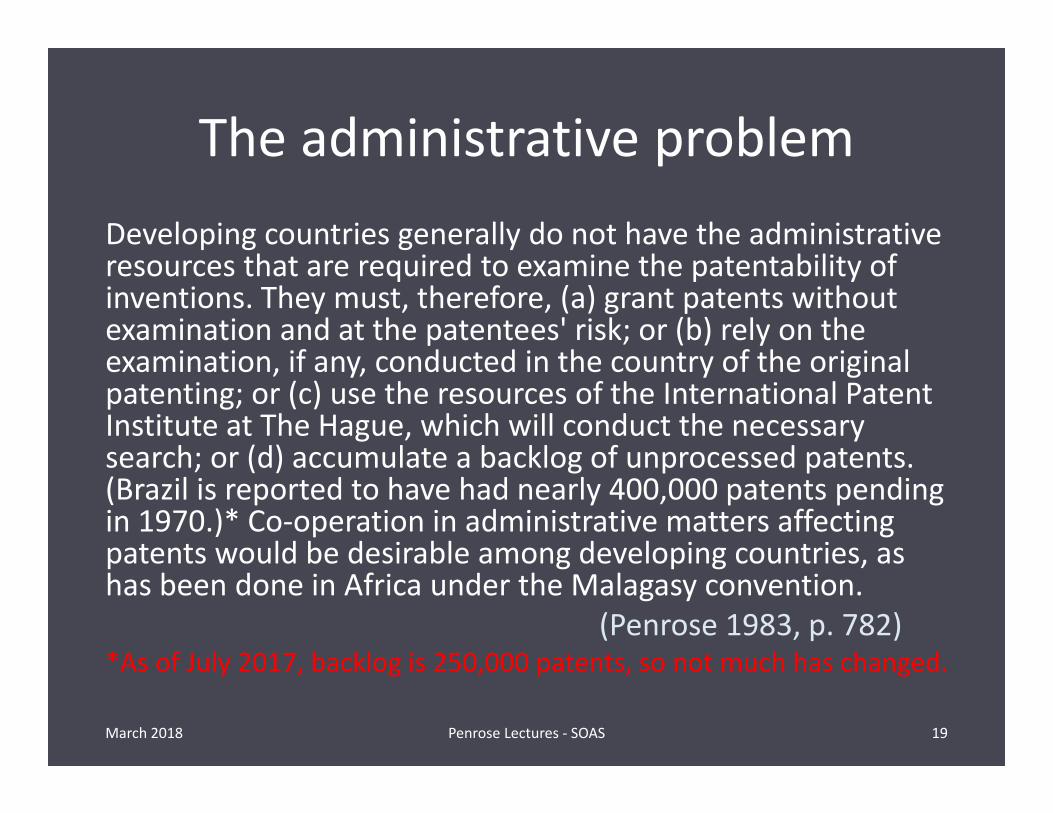
The administrative problemDeveloping countries generally do not have the administrative resources that are required to examine the patentability of inventions. They must, therefore, (a) grant patents without examination and at the patentees' risk; or (b) rely on the examination, if any, conducted in the country of the original patenting; or (c) use the resources of the International Patent Institute at The Hague, which will conduct the necessary search; or (d) accumulate a backlog of unprocessed patents. (Brazil is reported to have had nearly 400,000 patents pending in 1970.)* Co‐operation in administrative matters affecting patents would be desirable among developing countries, as has been done in Africa under the Malagasy convention.
(Penrose 1983, p. 782)*As of July 2017, backlog is 250,000 patents, so not much has changed.
March 2018 Penrose Lectures ‐ SOAS 19
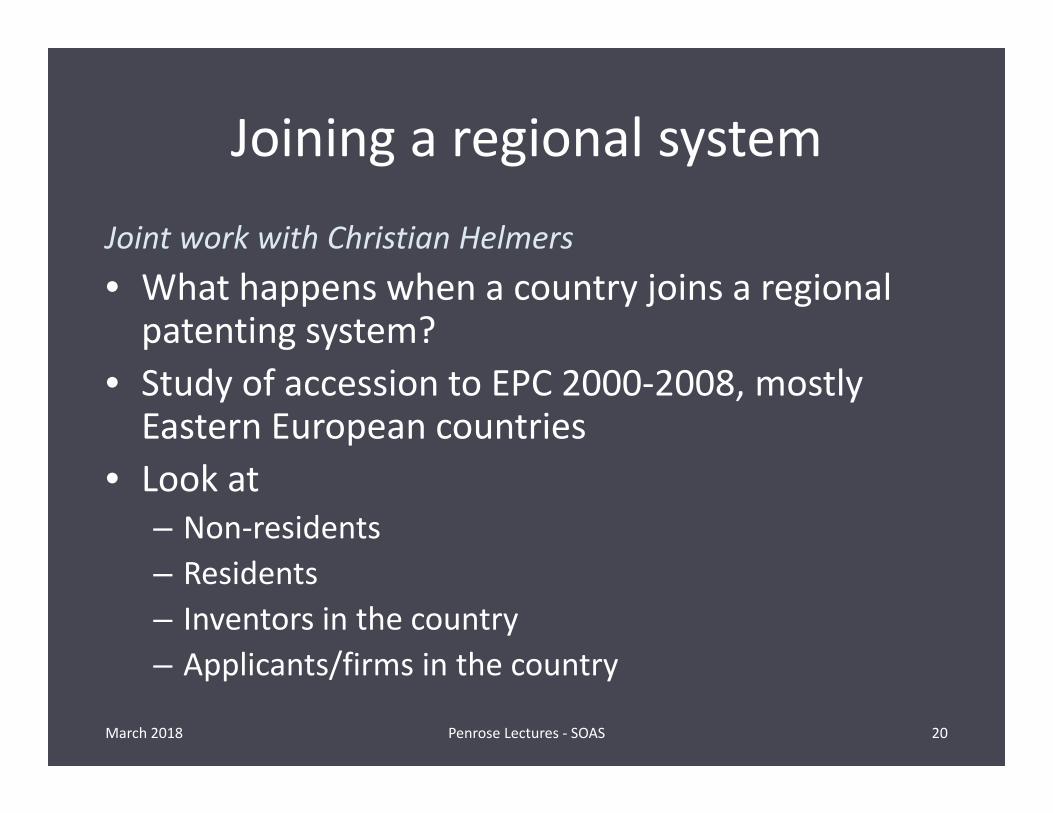
Joining a regional system
Joint work with Christian Helmers• What happens when a country joins a regional patenting system?
• Study of accession to EPC 2000‐2008, mostly Eastern European countries
• Look at– Non‐residents– Residents– Inventors in the country– Applicants/firms in the country
March 2018 Penrose Lectures ‐ SOAS 20
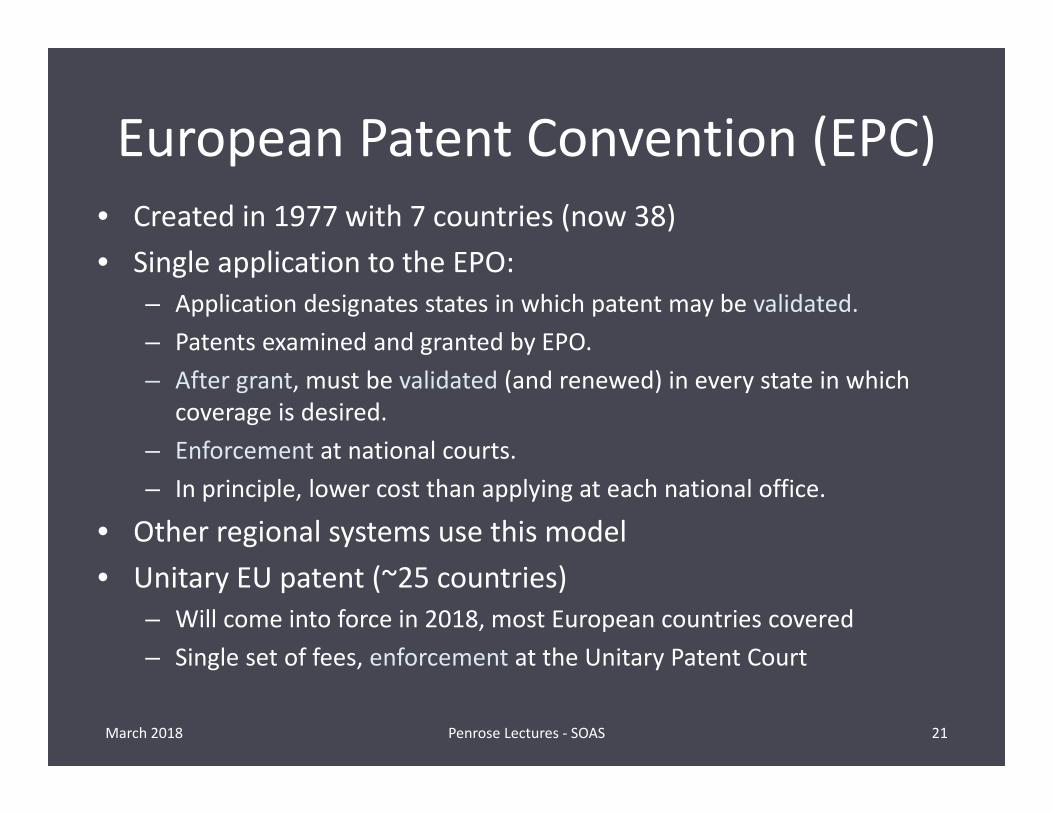
European Patent Convention (EPC)• Created in 1977 with 7 countries (now 38)• Single application to the EPO:
– Application designates states in which patent may be validated.– Patents examined and granted by EPO.– After grant, must be validated (and renewed) in every state in which
coverage is desired.– Enforcement at national courts.– In principle, lower cost than applying at each national office.
• Other regional systems use this model• Unitary EU patent (~25 countries)
– Will come into force in 2018, most European countries covered– Single set of fees, enforcement at the Unitary Patent Court
March 2018 Penrose Lectures ‐ SOAS 21
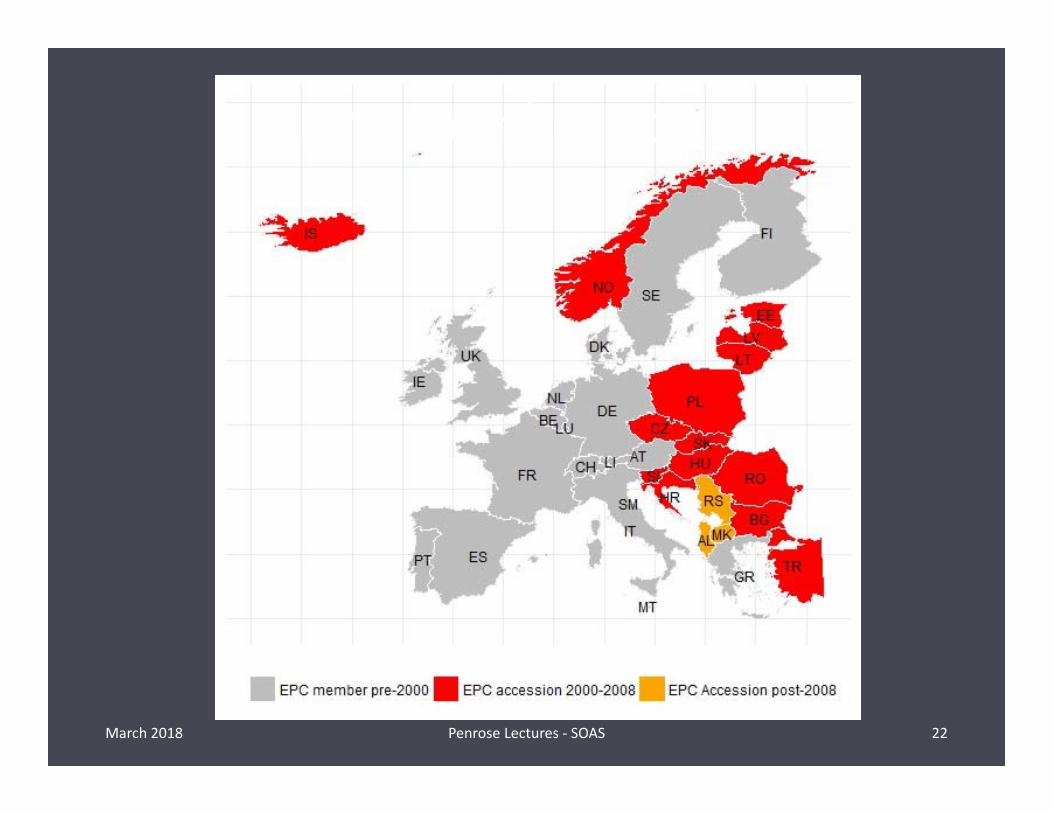
EPC member states
March 2018 Penrose Lectures ‐ SOAS 22
Also San Marino
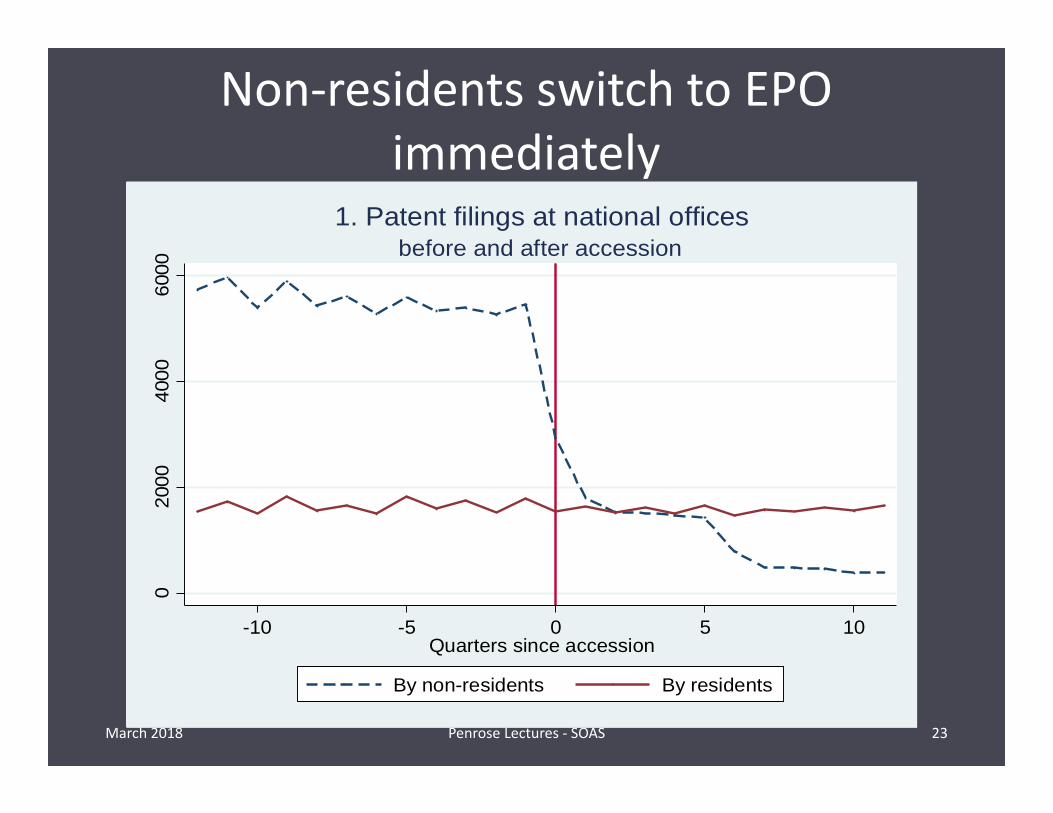
Non‐residents switch to EPO immediately
March 2018 Penrose Lectures ‐ SOAS 23
020
0040
0060
00
-10 -5 0 5 10Quarters since accession
By non-residents By residents
before and after accession1. Patent filings at national offices
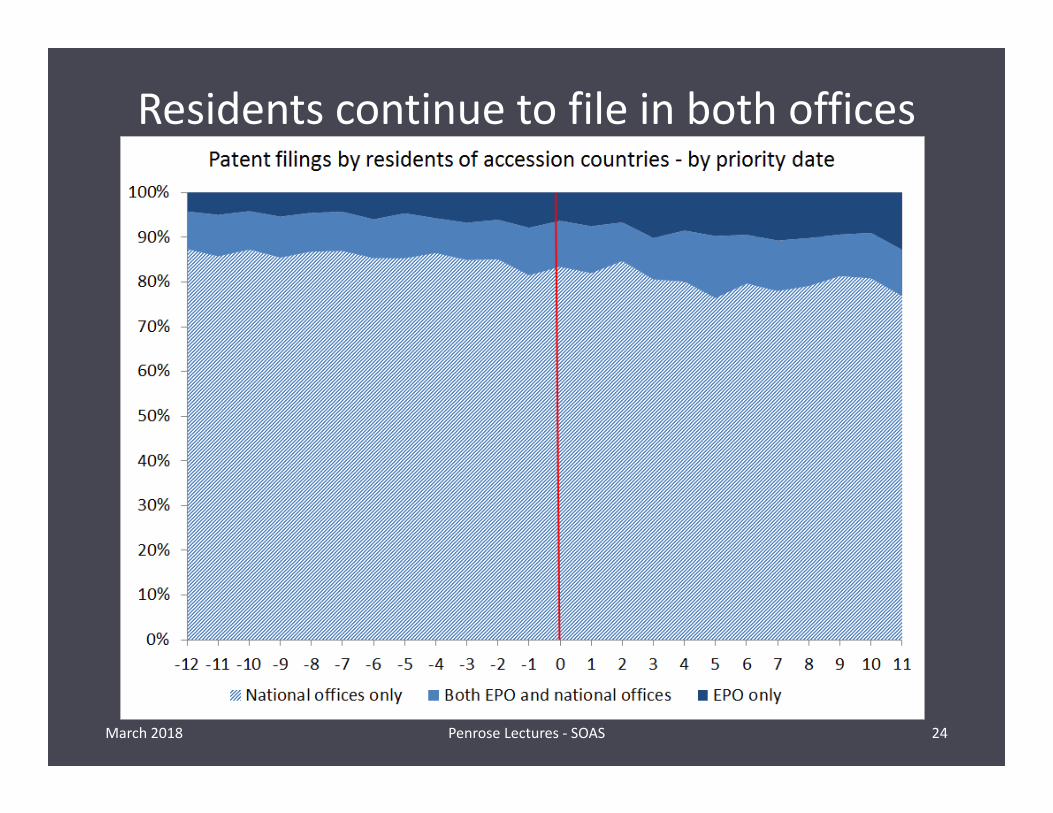
Residents continue to file in both offices
March 2018 Penrose Lectures ‐ SOAS 24
March 2018 Penrose Lectures ‐ SOAS 25
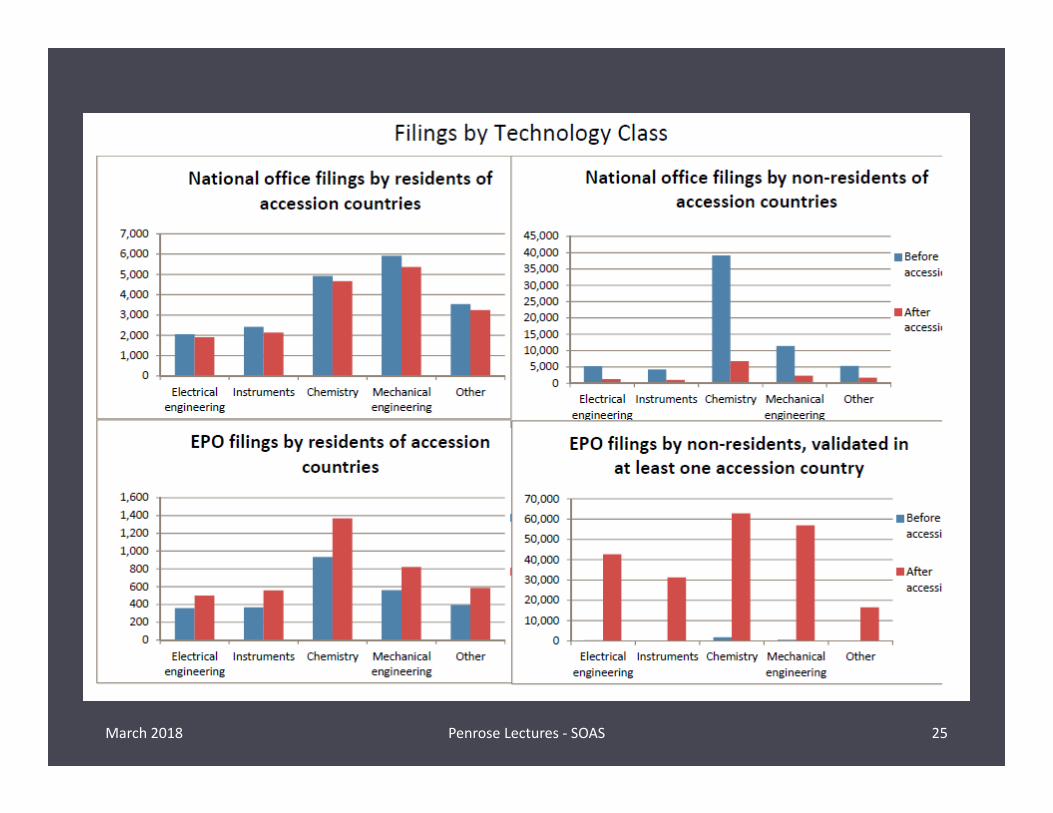
Filings by technology class
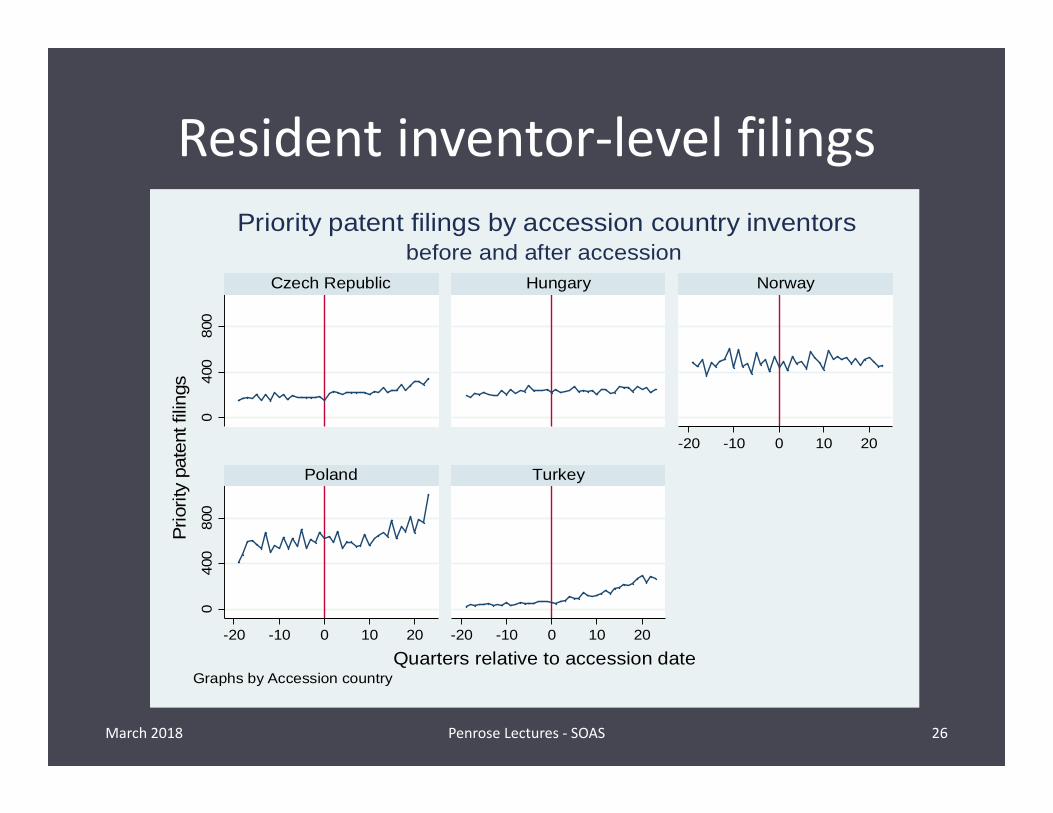
Resident inventor‐level filings
March 2018 Penrose Lectures ‐ SOAS 26
040
080
00
400
800
-20 -10 0 10 20
-20 -10 0 10 20 -20 -10 0 10 20
Czech Republic Hungary Norway
Poland Turkey
Prio
rity
pate
nt fi
lings
Quarters relative to accession dateGraphs by Accession country
before and after accessionPriority patent filings by accession country inventors
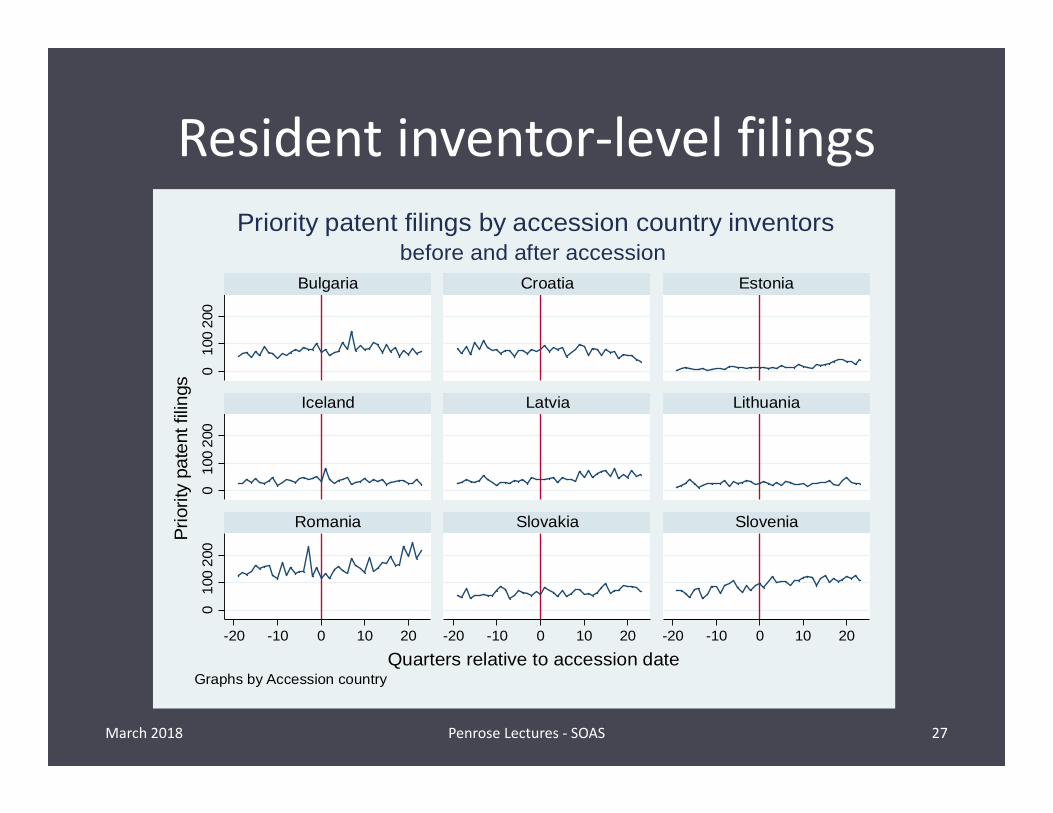
Resident inventor‐level filings
March 2018 Penrose Lectures ‐ SOAS 27
010
020
00
100
200
010
020
0
-20 -10 0 10 20 -20 -10 0 10 20 -20 -10 0 10 20
Bulgaria Croatia Estonia
Iceland Latvia Lithuania
Romania Slovakia Slovenia
Prio
rity
pate
nt fi
lings
Quarters relative to accession dateGraphs by Accession country
before and after accessionPriority patent filings by accession country inventors
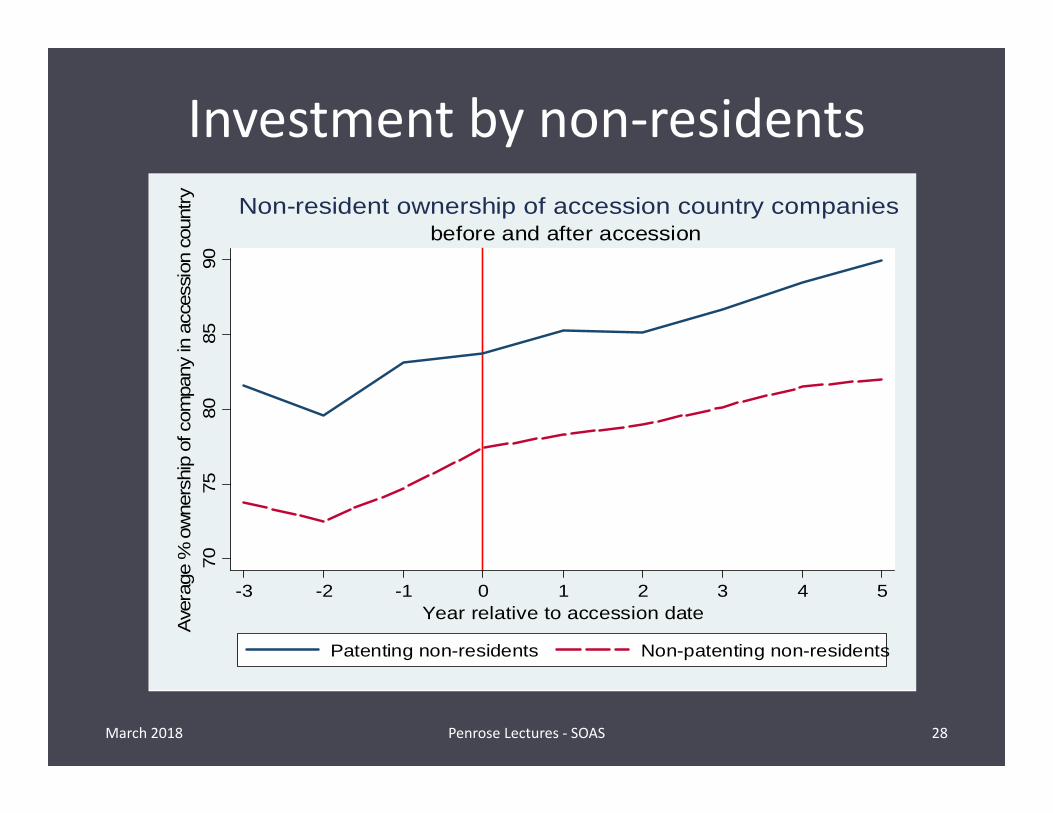
Investment by non‐residents
March 2018 Penrose Lectures ‐ SOAS 28
7075
8085
90A
vera
ge %
ow
ners
hip
of c
ompa
ny in
acc
essi
on c
ount
ry
-3 -2 -1 0 1 2 3 4 5Year relative to accession date
Patenting non-residents Non-patenting non-residents
before and after accessionNon-resident ownership of accession country companies

Conclusions
• Impact of introduction of an international patent system on lower‐ and middle income economies:– Resident applicants hardly respond to accession;– Resident inventors respond slightly;– Non‐resident applicants respond strongly to accession;– However, little visible change in FDI
• Lessons– Improving access to intl pat system not a magic bullet– But is this a special case? – countries had already joined the EU, and cost differences were low
March 2018 Penrose Lectures ‐ SOAS 29
Interim summary
• Lots of reasons to think that having a patent system is not an important ingredient of policy for low or even middle income countries– Historical cross country evidence– Little impact on invention from regional system– Theoretical analysis supports the idea that more innovative and richer countries will favor stronger IP
– More to come…..
March 2018 Penrose Lectures ‐ SOAS 30