Embed Size (px)
Citation preview
BRONTE SUB-REGION INTEGRATED REGIONAL RESOURCE PLAN Part of the Burlington-Nanticoke Planning Region | June 30, 2016
9ieso Connecting Today. Powering Tomorrow.
Integrated Regional Resource Plan
Bronte Sub-region
This Integrated Regional Resource Plan (“IRRP”) was prepared by the Independent Electricity
System Operator (“IESO”) pursuant to the terms of its Ontario Energy Board licence, EI-2013
0066.
The IESO prepared the IRRP on behalf of the Bronte Sub-Region Working Group (the “Working
Group”), which included the following members:
• Independent Electricity System Operator • Oakville Hydro Electricity Distribution Inc. • Burlington Hydro Inc. • Hydro One Networks Inc. (Distribution) • Hydro One Networks Inc. (Transmission)
The Working Group assessed the adequacy of electricity supply to customers in the Bronte Sub
region over a 20-year period; developed a flexible, comprehensive, integrated plan that considers opportunities for coordination in anticipation of potential demand growth scenarios
and varying supply conditions in the Bronte Sub-region and developed an implementation plan
for the recommended options, while maintaining flexibility in order to accommodate changes in key conditions over time.
The Working Group members agree with the IRRP’s recommendations and support implementation of the plan through the recommended actions, subject to obtaining all
necessary regulatory and other approvals.
Copyright © 2016 Independent Electricity System Operator. All rights reserved.
Page i
Table of Contents
1. Introduction 1 ..................................................................................................................................
2. The Integrated Regional Resource Plan 3 .................................................................................
2.1 Near-Term and Medium-Term Plan (2015 through 2024) 4 ........................................
36T 2.236T 36T Longer-Term Plan (2025-2034)36T. 5 ......................................................................................
36T 3.36T 36T Development of the IRRP36T . 6 .........................................................................................................
36T 3.136T 36T The Regional Planning Process36T . 6 ....................................................................................
36T 3.236T 36T The IESO’s Approach to Regional Planning36T . 9 ...............................................................
36T 3.336T 36T Bronte Sub-region Working Group and I RRP Development36T . 10 .................................
36T 4.36T 36T Background and Study Scope36T . 12 ................................................................................................
36T 4.136T 36T Study Scope36T . 12 ...................................................................................................................
36T 4.236T 36T Bulk Transmission System Study36T . 14 ...............................................................................
.. .16
.......................................................................................................
.................................................................................
....................................................................
...................................................
........................................................................................................
..........................................................................................................................................
...............................................................................
............................................................................................................................
.................................................................................................
.....................................................
..........................................................................
36T 6.2.436T 36T Oakville TS #2 – Capacitor Bank Operation36T .28 .......................................................
36T 6.2.536T 36T Restoration Needs36T ..29 .................................................................................................
36T 6.336T 36T Needs Summary3 .33 6T ...........................................................................................................
36T 7.36T 36T Near- and Medium-Term Plan36T ..36 ..............................................................................................
36T 7.136T 36T Alternatives f or Meeting Near- and Medium-Term Needs36T ..36 ..................................
36T 7.1.136T 36T Conservation36T 36 ...........................................................................................................
36T 6.2.336T 36T Cumberland TS – Power Factor .28 36T .
36T 6.2.236T 36T Bronte TS – Post Contingency Voltage Drop36T .27
36T 6.2.136T 36T Overload of B7/B836T . 27 .
36T 6.236T 36T Needs36T .26 .
36T 6.136T 36T Needs Assessment Methodology36 .25 T
36T 6.36T 36T Needs36T . 25
36T 5.636T 36T Planning Forecasts36T 23
36T 5.536T 36T Distributed Generation Assumed in the Forecast36T . 23
36T 5.336T 36T Gross Demand Forecast36T .. .20 .............................................................................................
36T 5.436T 36T Conservation Assumed in the Forecast36T . .21
36T 5.236T 36T Demand Forecast Methodology36T . 18
36T 5.36T 36T Demand Forecast36T ....................................................................................................................
36T 5.136T 36T Historical Demand36T . 16
Page ii
36T 7.1.236T 36T Local Generation36T ..38 ...................................................................................................
36T 7.1.336T 36T Transmission and Distribution36 .40 T ............................................................................
36T 7.236T 36T Recommended Near- and Medium-Term Plan ..44 36T ......................................................
36T 7.336T 36T Implementation of Near- and Medium-Term Plan ..44 36T ................................................
36T 7.3.136T 36T Implementation Challenges3 .45 6T .................................................................................
36T 8.36T 36T Long-Term Plan36 ..47 T .......................................................................................................................
.
6T ..................................................................................................................................10.36T 36T Conclusion3 50
36T 9.36T 36T Engagement Activities36T ..49 ...........................................................................................................
36T
Page iii
List of Figures
Figure 1-1: Map of Bronte Sub-region . 1 ...................................................................................................
Figure 3-1: Levels of Electricity System Planning . 8
.
...............................................................................
...................................................................................................
.......................................................................................
.......................................................................
........................................................
.............................
...................................................................................
.....................................................................................
.
....................................................................................
........................................
.............................
...............................................
Figure 3-2: Steps in the IRRP Process 10
Figure 4-1: Regional Transmission Facilities . 13
Figure 4-2: Bronte Sub-region Electrical Sub-systems . 14
........................................................................................
................................................................................
Figure 5-1: Historical Peak Demand in the Bronte Sub-region . 17
Figure 5-2: Historical Peak Demand in the Bronte Sub-region, Gross and Net . 18
Figure 5-3: Development of Demand Forecast . 19
Figure 5-4: Bronte Sub-region Gross Forecast . 20
Figure 5-5: Categories of Conservation Savings . 21
Figure 6-1: ORTAC Load Restoration Criteria . 30
Figure 6-2: Restoration Pocket for T38/39B . . 31
Figure 6-3: Restoration Pocket for Southwest GTA, West of Cooksville . 32
Figure 6-4: Loading Limits on Bronte TS, Multiple Constraints, for Loss of B7 34
Figure 7-1: Effect of Conservation Targets on Bronte TS Peak Load . 37
Page iv
List of Tables
Table 5-1: Peak Demand MW Savings from 2013 LTEP Conservation Targets, Select Years . 22 ......
Table 6-1: Peak Load and Restoration Requirements for West of Cooksville Pocket . 32 ...................
Table 6-2: Summary of Needs in Bronte Sub-region . 35 ..........................................................................
Table 7-1: Summary of Needs and Recommended Actions in Bronte Sub-region . 44 .......................
List of Appendices
36T Appendix A: Demand Forecast36T
36T Appendix B: Needs Assessment36T
Page v
Page vi
List of Abbreviations
Abbreviations Descriptions
A Amp
ACSR Aluminum Conductor, Steel Reinforced
Burlington Hydro or BHI Burlington Hydro Inc.
CCRA Connection Cost Recovery Agreement
CDM or Conservation Conservation and Demand Management
CFF Conservation First Framework
CHP Combined Heat and Power
DG Distributed Generation
DR Demand Response
Enersource Enersource Hydro Mississauga Inc.
FIT Feed-in Tariff
GTA Greater Toronto Area
Haldimand Power Haldimand County Power Inc.
HHH Halton Hills Hydro Inc.
Hydro One Hydro One Networks Inc.
IAP Industrial Accelerator Program
IESO Independent Electricity System Operator
IRRP Integrated Regional Resource Plan
kV Kilovolt
LAC Local Advisory Committee
LDC Local Distribution Company
LMC Load Meeting Capability
LTEP (2013) Long-Term Energy Plan
LTR Limited Time Rating
MCOD Maximum Commercial Operation Date
MTS Municipal Transformer Station
MW Megawatt
Norfolk Power Norfolk Power Distribution Inc.
NWGTA North West Greater Toronto Area
Oakville Hydro
OEB or Board
Oakville Hydro Electricity Distribution Inc.
Ontario Energy Board
OPA Ontario Power Authority
ORTAC Ontario Resource and Transmission Assessment Criteria
Pickering NGS Pickering Nuclear Generation Station
PPWG Planning Process Working Group
PPWG Report
QEW
Planning Process Working Group Report to the Board
Queen Elizabeth Way
RIP Regional Infrastructure Plan
SS Switching Station
TOU Time-of-Use
TS Transformer Station
TWh Terawatt-Hours
Working Group Technical Working Group for Bronte Sub-region IRRP
Abbreviations Descriptions
Page vii
1. Introduction
This Integrated Regional Resource Plan (“IRRP”) addresses the electricity needs for the Bronte
Sub-region over the next 20 years. This report was prepared by the Independent Electricity System Operator (“IESO”) on behalf of the Technical Working Group composed of the IESO,
Oakville Hydro Electricity Distribution Inc. (“Oakville Hydro”), Burlington Hydro Inc. (“Burlington Hydro”), Hydro One Distribution and Hydro One Transmission 1
P P (the “Working
Group”).
The Bronte Sub-region is within the Burlington-Nanticoke planning region. In municipal terms,
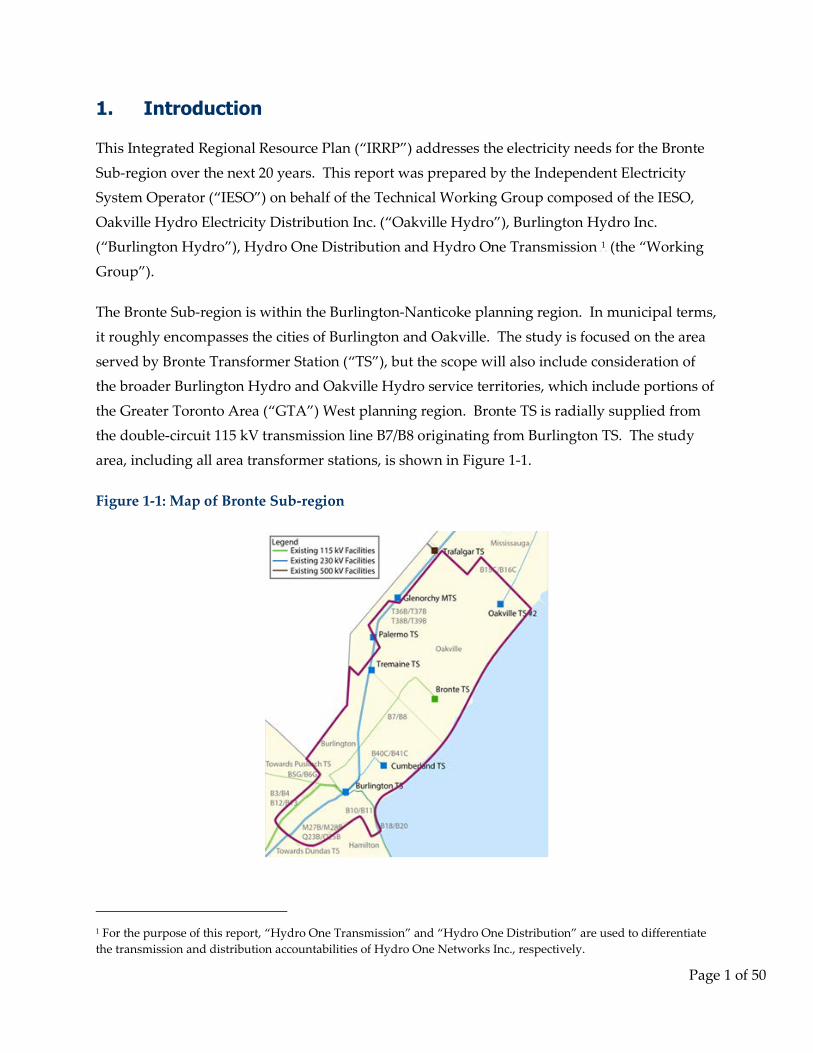
it roughly encompasses the cities of Burlington and Oakville. The study is focused on the area
served by Bronte Transformer Station (“TS”), but the scope will also include consideration of the broader Burlington Hydro and Oakville Hydro service territories, which include portions of
the Greater Toronto Area (“GTA”) West planning region. Bronte TS is radially supplied from the double-circuit 115 kV transmission line B7/B8 originating from Burlington TS. The study
area, including all area transformer stations, is shown in Figure 1-1.
Figure 1-1: Map of Bronte Sub-region
1 For the purpose of this report, “Hydro One Transmission” and “Hydro One Distribution” are used to differentiate the transmission and distribution accountabilities of Hydro One Networks Inc., respectively.
Page 1 of 50
In Ontario, planning to meet the electrical supply and reliability needs of a large area or region is done through regional electricity planning, a process that was formalized by the Ontario
Energy Board (“OEB” or “Board”) in 2013. In accordance with the OEB regional planning process, transmitters, distributers and the IESO are required to carry out regional planning
activities for 21 electricity planning regions at least once every five years.
This IRRP identifies power system capacity and reliability requirements, and coordinates the options to meet customer needs in the sub-region over the next 20 years. Specifically, this IRRP
identifies investments for immediate implementation necessary to meet near- and medium-term needs in the sub-region, respecting the lead time for development.
This IRRP also identifies options to meet long-term needs, but given forecast uncertainty, the longer development lead time and the potential for technological change, the plan maintains
flexibility for long-term options and does not recommend specific projects at this time. Instead,
the long-term plan identifies near-term actions to consider and develop alternatives, engage with the community and gather information and lay the groundwork for future options. These
actions are intended to be completed before the next IRRP cycle, scheduled for 2020 or sooner, depending on demand growth, so that the results can inform decisions should any decisions
need to be made at that time.
This report is organized as follows:
• A summary of the recommended plan for the Bronte Sub-region is provided in Section 2; • The process and methodology used to develop the plan are discussed in Section 3; • The context for electricity planning in the Bronte Sub-region and the study scope are
discussed in Section 4; • Demand forecast scenarios, and conservation and distributed generation (“DG”)
assumptions, are described in Section 5; • Electricity needs in the Bronte Sub-region are presented in Section 6; • Alternatives and recommendations for meeting needs are addressed in Sections 7 and 8; • A summary of engagement to date and moving forward is provided in Section 9; and • A conclusion is provided in Section 10.
Page 2 of 50
2. The Integrated Regional Resource Plan
The Bronte Sub-region IRRP provides recommendations to address the sub-region’s forecast
electricity needs over the next 20 years, based on the application of the IESO’s Ontario Resource and Transmission Assessment Criteria (“ORTAC”). This IRRP identifies forecast electricity
needs in the sub-region over the near term (0-5 years, or 2015 through 2019), medium term (6-10 years, or 2020 through 2024) and longer term (11- 20 years, or 2025 through 2034). These
planning horizons are distinguished in the IRRP to reflect the different levels of forecast certainty, lead time for development and planning commitment required over these time
horizons. The IRRP was developed based on consideration of planning criteria, including
reliability, cost, feasibility, and maximization of the use of the existing electricity system, where it is economic to do so.
This IRRP identifies and recommends specific projects for implementation in the near term. This is necessary to ensure that they are in-service in time to address the area’s more urgent
needs, respecting the shorter lead t ime for development of the recommended projects or
actions. This IRRP also identifies possible longer-term electricity needs. However, as these needs are forecast to arise in the future, it is not necessary, nor would it be prudent given
forecast uncertainty and the potential for technological change to r ecommend specific projects at this time. Instead, near-term actions are identified to gather information and lay the
groundwork for future options. These actions are intended to be completed before the next
IRRP cycle so that their results can inform further discussion at that time.
Page 3 of 50

2.1 Near-Term and Medium-Term Plan (2015 through 2024)
By 2018, peak summer electrical demand on
Bronte TS is expected to exceed 135 MW, triggering overloads on the supplying B7/B8
circuits following the loss of the companion
circuit. By 2021, forecast station loading is expected to exceed the maximum 10% post
contingency voltage drop criteria; although it may be possible to delay this occurrence by as
much as 10 years by better distributing load between buses. Since both of these needs are the direct result of loading on Bronte TS, the near-term plan considered options to immediately
lower peak electrical demand and the longer-term plan considered ways to maintain total load
below 135 MW.
Near/Medium-Term Needs and Plan
• Thermal loading of B7/B8 exceeds capacity following loss of companion circuit – 2018 • Post contingency voltage drop exceeds 10%
at Bronte TS – 2021 • Address both needs by transferring one
feeder (approximately 15 MW) of load from Bronte TS to Tremaine TS - 2018 • Details of implementation to be developed
as part of RIP process.
Two near-term options were identified, each capable of meeting near- and medium-term needs:
1. Upgrade transmission line supplying Bronte TS, and redistribute loads between buses 2. Transfer one feeder of load from Bronte TS to Tremaine TS
51T Recommended Actions
1. Transfer one feeder of load from Bronte TS to Tremaine TS
The shortest lead-time option for reducing load at Bronte TS is to transfer load to an adjacent station. This can be accomplished by constructing additional distribution infrastructure to
enable either temporary or permanent connections between the service areas of Bronte TS and a
nearby station (Tremaine TS). If a transfer can be accomplished for $9.7 million or less (the alternate cost of a transmission solution), then it is the most economic course of action.
Burlington Hydro has indicated that it would be possible to construct additional transfer capability between Bronte TS and Tremaine TS by 2019 for an approximate cost of $4.5 million.
This is significantly less expensive than the alternative of upgrading the limiting section of
B7/B8 supply circuits, at an estimated cost of $9.7 million. Oakville Hydro has indicated that it is not technically feasible to transfer loads from the Bronte TS service territory to other stations
serving its franchise territory.
Page 4 of 50
Transferring one feeder worth of load will reduce peak electrical demand at Bronte TS by approximately 15 MW, reducing total station load to approximately 120 MW in the near term,
and permitting up to 15 MW of continued growth at the station in the mid and long term. Based on the planning forecast, this new capacity would primarily support Oakville Hydro
customers, particularly those located in the Bronte village and midtown regions.
Burlington Hydro has indicated that it is concerned about longer-term growth in the Bronte service area impacting future costs. As a result, Burlington Hydro is concerned with
relinquishing capacity at Bronte TS on a permanent basis. As part of the implementation Burlington Hydro has proposed a long-term (i.e., 10 years) lease arrangement. Details related to
implementation will be developed as part of the Regional Infrastructure Plan (“RIP”).
The IESO has committed to working with affected parties to ensure that costs borne by LDCs
for the construction and operation of distribution infrastructure are appropriately allocated
between the benefiting parties. The specific cost allocation challenges for this option are further discussed in Section 7.3.1.
2.2 Longer-Term Plan (2025-2034)
In the event that long-term load growth within the Burlington service territory requires a return
of the 15 MW of capacity to Bronte TS, an alternative infrastructure solution will be required to serve the anticipated 15 MW of incremental Oakville Hydro growth. Oakville Hydro has
indicated that distribution transfers from Bronte TS are not feasible at this time, but this assumption should be revisited in the future as changes to system configurations may occur.
Assuming distribution transfers are not feasible, the alternative would be to upgrade the transmission line supplying Bronte TS.
If higher than anticipated load growth materializes in the long term, other measures, such as
incremental DG or demand response (“DR”) programs may become effective options to defer future infrastructure investment. These options will be considered during future regional
planning studies when the nature of the long-term needs, alternatives, and associated costs become clearer. In the meantime, Working Group members will continue to engage with local
planning bodies to coordinate community planning initiatives and identify cost effective
opportunities for supplying local energy needs.
Page 5 of 50
3. Development of the IRRP
3.1 The Regional Planning Process
In Ontario, planning to meet the electricity needs of customers at a regional level is done through regional planning. Regional planning assesses the interrelated needs of a region—
defined by common electricity supply infrastructure—over the near, medium, and long term and develops a plan to ensure cost-effective, reliable electricity supply. Regional plans consider
the existing electricity infrastructure in an area, forecast growth and customer reliability,
evaluate options for addressing needs, and recommend actions.
Regional planning has been conducted on an as needed basis in Ontario for many years. Most
recently, the former Ontario Power Authority (“OPA”) carried out planning activities to address regional electricity supply needs. The OPA conducted joint regional planning studies
with distributors, transmitters, the IESO and other stakeholders in regions where a need for
coordinated regional planning had been identified.
In the fall of 2012, the Board convened a Planning Process Working Group (“PPWG”) to
develop a more structured, transparent, and systematic regional planning process. This group was composed of industry stakeholders including electricity agencies, utilities, and
stakeholders, and in May 2013, the PPWG released its report to the Board2 P P (“PPWG Report”),
setting out the new regional planning process. Twenty-one electricity planning regions were identified in the PPWG Report, and a phased schedule for completion was outlined. The Board
endorsed the PPWG Report and formalized the process timelines through changes to the Transmission System Code and Distribution System Code in August 2013, as well as through
changes to the OPA’s licence in October 2013. The OPA’s licence changes required it to lead a number of aspects of regional planning. After the merger of the IESO and the OPA on January
1, 2015, the regional planning responsibilities identified in the OPA’s licence were transferred to
the IESO.
The regional planning process begins with a Needs Screening process performed by the
transmitter, which determines whether there are needs requiring regional coordination. If regional planning is required, the IESO then conducts a Scoping Assessment to determine
whether a comprehensive IRRP is required, which considers conservation, generation,
2 http://www.ontarioenergyboard.ca/OEB/_Documents/EB-20110043/PPWG_Regional_Planning_Report_to_the_Board_App.pdf
Page 6 of 50
transmission, and distribution solutions, or whether a more limited “wires” solution is the preferable option such that a transmission and distribution focused Regional Infrastructure Plan
(“RIP”) can be undertaken instead. The Scoping Assessment determines what type of planning is required for each region. There may also be regions where infrastructure investments do not
require regional coordination and so can be planned directly by the distributor and transmitter
outside of the regional planning process. At the conclusion of the Scoping Assessment, the IESO produces a report that includes the results of the Needs Screening process and a
preliminary Terms of Reference. If an IRRP is the identified outcome, the IESO is required to complete the IRRP within 18 months. If an RIP is the identified outcome, the transmitter takes
the lead and has six months to complete it. Both RIPs and IRRPs are to be updated at least every five years. The draft Scoping Assessment Outcome Report is posted to the IESO’s website
for a 2-week comment period prior to finalization.
The final IRRPs and RIPs are posted on the IESO’s and relevant transmitter’s websites, and may be referenced and submitted to the Board as supporting evidence in rate or “Leave to
Construct” applications for specific infrastructure investments. These documents are also useful for municipalities, First Nation communities and Métis community councils for planning,
conservation and energy management purposes, as information for individual large customers
that may be involved in the region, and for other parties seeking an understanding of local electricity growth, CDM and infrastructure requirements. Regional planning is not the only
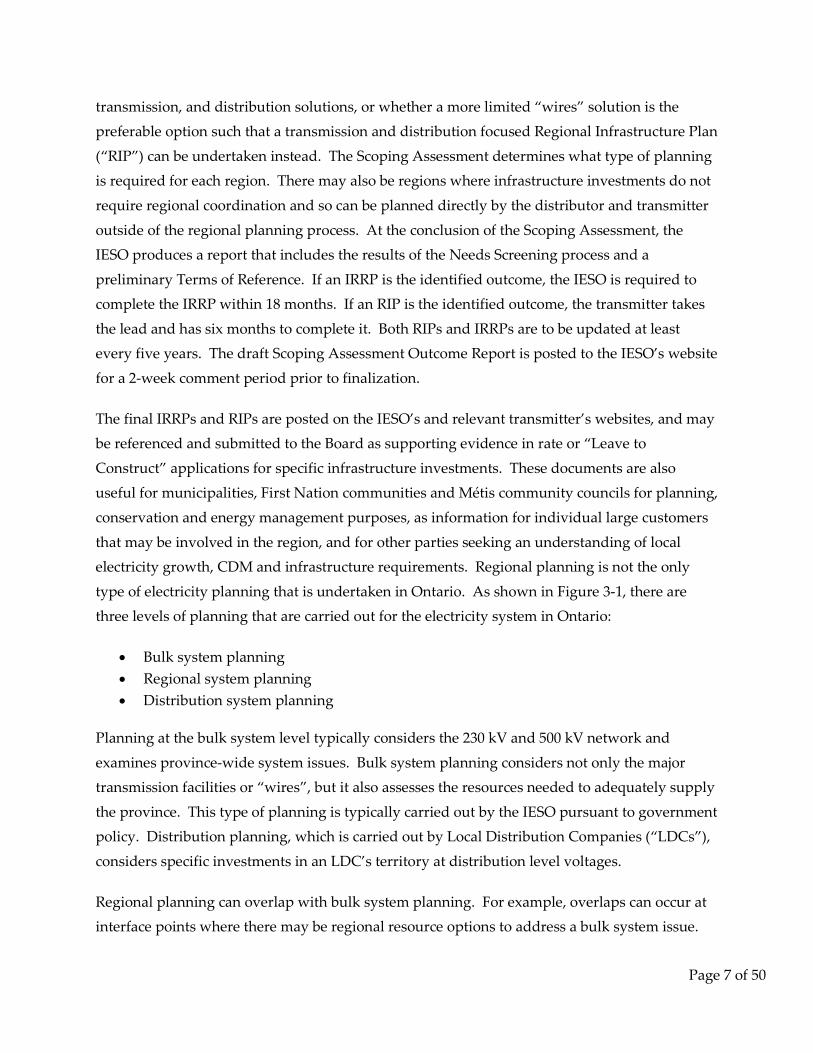
type of electricity planning that is undertaken in Ontario. As shown in Figure 3-1, there are three levels of planning that are carried out for the electricity system in Ontario:
• Bulk system planning • Regional system planning • Distribution system planning
Planning at the bulk system level typically considers the 230 kV and 500 kV network and
examines province-wide system issues. Bulk system planning considers not only the major transmission facilities or “wires”, but it also assesses the resources needed to adequately supply
the province. This type of planning is typically carried out by the IESO pursuant to government policy. Distribution planning, which is carried out by Local Distribution Companies (“LDCs”),
considers specific investments in an LDC’s territory at distribution level voltages.
Regional planning can overlap with bulk system planning. For example, overlaps can occur at interface points where there may be regional resource options to address a bulk system issue.
Page 7 of 50
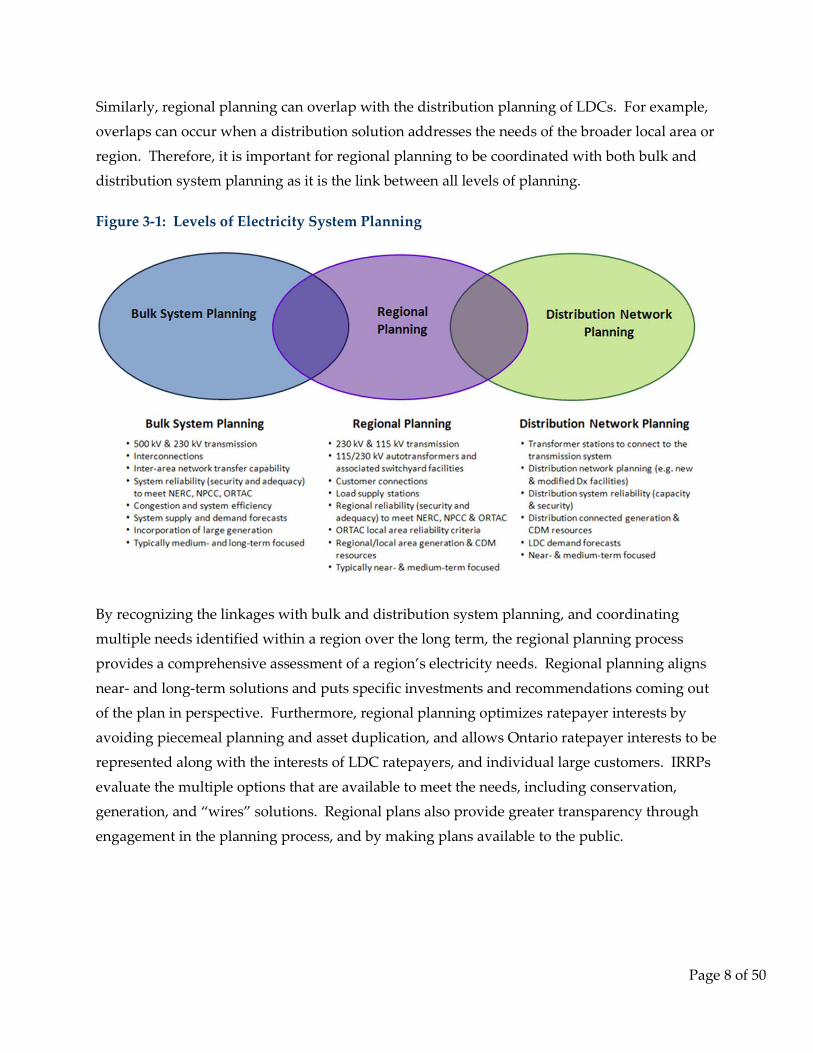
Similarly, regional planning can overlap with the distribution planning of LDCs. For example, overlaps can occur when a distribution solution addresses the needs of the broader local area or
region. Therefore, it is important for regional planning to be coordinated with both bulk and distribution system planning as it is the link between all levels of planning.
Figure 3-1: Levels of Electricity System Planning
By recognizing the linkages with bulk and distribution system planning, and coordinating multiple needs identified within a region over the long term, the regional planning process
provides a comprehensive assessment of a region’s electricity needs. Regional planning aligns
near- and long-term solutions and puts specific investments and recommendations coming out of the plan in perspective. Furthermore, regional planning optimizes ratepayer interests by
avoiding piecemeal planning and asset duplication, and allows Ontario ratepayer interests to be represented along with the interests of LDC ratepayers, and individual large customers. IRRPs
evaluate the multiple options that are available to meet the needs, including conservation, generation, and “wires” solutions. Regional plans also provide greater transparency through
engagement in the planning process, and by making plans available to the public.
Page 8 of 50
3.2 The IESO’s Approach to Regional Planning
IRRPs assess electricity system needs f or a region over a 20-year period. The 20-year outlook anticipates long-term trends so that n ear-term actions are developed within the context of a
longer-term view. This enables coordination and consistency with the long-term plan, rather than simply reacting to immediate needs.
In developing an IRRP, a different approach is taken to developing the plan for the first 10 years
of the plan—the near and medium term—than for the longer-term period of 10-20 years. The plan for the first 10 years is developed based on best available information on demand,
conservation, and other local developments. Given the long lead time to develop electricity infrastructure, near-term electricity needs require prompt action to enable the specified
solutions in a timely manner. By contrast, the long-term plan is characterized by greater
forecast uncertainty and longer development lead time; as such solutions do not need to be committed to immediately. Given the potential for changing conditions and technological
development, the IRRP for the long term is more directional, focusing on developing and maintaining the viability of options for the future, and continuing to monitor demand forecast
scenarios.
In developing an IRRP, the IESO and the Working Group (see Figure 3-2 below) carry out a number of steps. These steps include electricity demand forecasts; technical studies to
determine electricity needs and the timing of these needs; the development of potential options; and, a recommended plan including actions for the near and long term. Throughout this
process, engagement is carried out with stakeholders and First Nation and Métis communities who may have an interest in the area. The steps of an IRRP are illustrated in Figure 3-2, below.
Page 9 of 50
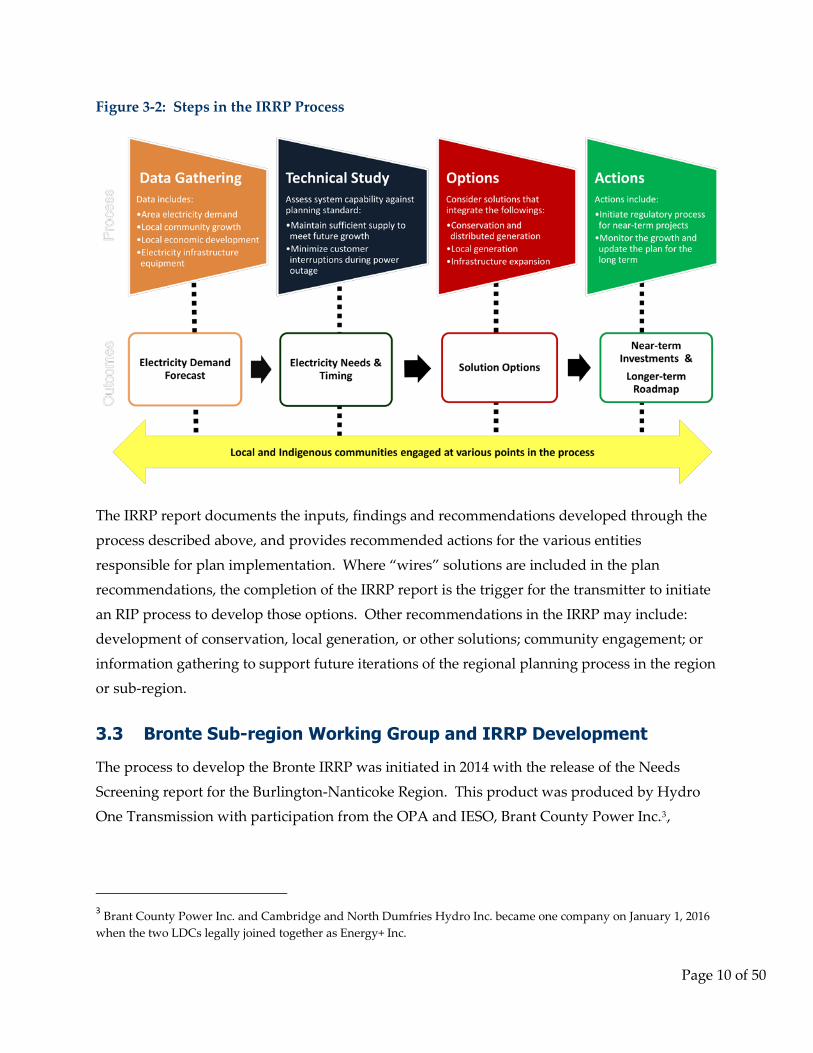
Figure 3-2: Steps in the IRRP Process
The IRRP report documents the inputs, findings and recommendations developed through the
process described above, and provides recommended actions for the various entities
responsible for plan implementation. Where “wires” solutions are included in the plan recommendations, the completion of the IRRP report is the trigger for the transmitter to initiate
an RIP process to develop those options. Other recommendations in the IRRP may include: development of conservation, local generation, or other solutions; community engagement; or
information gathering to support future iterations of the regional planning process in the region or sub-region.
3.3 Bronte Sub-region Working Group and IRRP Development
The process to develop the Bronte IRRP was initiated in 2014 with the release of the Needs
Screening report for the Burlington-Nanticoke Region. This product was produced by Hydro One Transmission with participation from the OPA and IESO, Brant County Power Inc.3
P P,
3 Brant County Power Inc. and Cambridge and North Dumfries Hydro Inc. became one company on January 1, 2016 when the two LDCs legally joined together as Energy+ Inc.
Page 10 of 50
Brantford Power Inc., Burlington Hydro Inc., Haldimand County Hydro Inc.4 P P, Horizon Utilities
Corporation, Hydro One Distribution, Norfolk Power Distribution Inc.5 ,P P and Oakville Hydro
Electricity Distribution Inc. The Needs Screening process was carried out to identify needs which may require coordinated regional planning in those sub-regions of Burlington-Nanticoke
which had not already undergone a regional planning process. The subsequent Scoping
Assessment Report recommended that the needs identified for the Bronte Sub-region should be further pursued through an IRRP owing to the potential for coordinated solutions.
In 2015 the Working Group was formed to develop a Terms of Reference for this IRRP, gather data, identify near- to long-term needs in the sub-region, and recommend the near and medium
term actions.
4 On March 12, 2015, the OEB approved Hydro One Network Inc.'s (“Hydro One”) acquisition (EB-2014-0244) of all of the issued and outstanding shares of Haldimand County Power Inc. (“Haldimand Power”). The OEB also approved the transfer of distribution assets from Haldimand Power to Hydro One. 5 On July 3, 2014, the OEB approved Hydro One’s acquisition (EB-2013-0187) of all of the issued and outstanding
shares of Norfolk Power Distribution Inc. (“Norfolk Power”). The OEB also approved the transfer of distribution
assets from Norfolk Power to Hydro One.
Page 11 of 50
4. Background and Study Scope
This report presents an integrated regional resource plan for the Bronte Sub-region for the 20
year period from 2015 to 2034.
To set the context for this IR RP, the scope of the planning study and the sub-region’s existing
electricity system are described in Section 4.1. A brief outline of the ongoing bulk system study being undertaken in the same general area, including considerations for coordination, is
included in Section 4.2.
4.1 Study Scope
This IRRP develops and recommends options to meet supply needs of the Bronte Sub-region in the near-, medium and long term. The plan was prepared by the IESO on behalf of the Working
Group. The plan includes consideration of forecast electricity demand growth, conservation and demand management (“CDM” or “conservation”) in the area, transmission and
distribution system capability, relevant community plans, developments on the bulk
transmission system, Feed-in Tariff (“FIT”) and other generation uptake through province-wide programs.
This IRRP addresses regional needs in the Bronte Sub-region, including adequacy, security and relevant asset end-of-life consideration.
The following existing transmission facilities and assumptions were included in the scope of this study:
• Stations—Bronte TS, Cumberland TS, Palermo TS, Tremaine TS, Glenorchy MTS, Oakville TS #2 and Burlington DESN
• Transmission circuits—B7/B8, B40/41C, T36/37B, B15/16C
The Bronte IRRP was developed by completing the following steps:
• Preparing a 20-year electricity demand forecast and establishing needs over this timeframe.
• Examining the Load Meeting Capability (“LMC”) and reliability of the existing transmission system supplying the Bronte Sub-region, taking into account facility ratings and performance of transmission elements, transformers, local generation, and other facilities such as reactive power devices. Needs were established by applying ORTAC.
Page 12 of 50
• Establishing feasible integrated alternatives to address needs, including a mix of CDM, generation, transmission and distribution facilities, and other electricity system initiatives.
• Evaluating options using decision-making criteria which included: technical feasibility, cost, reliability performance, flexibility, environmental and social factors.
• Developing and communicating findings, conclusions and recommendations.
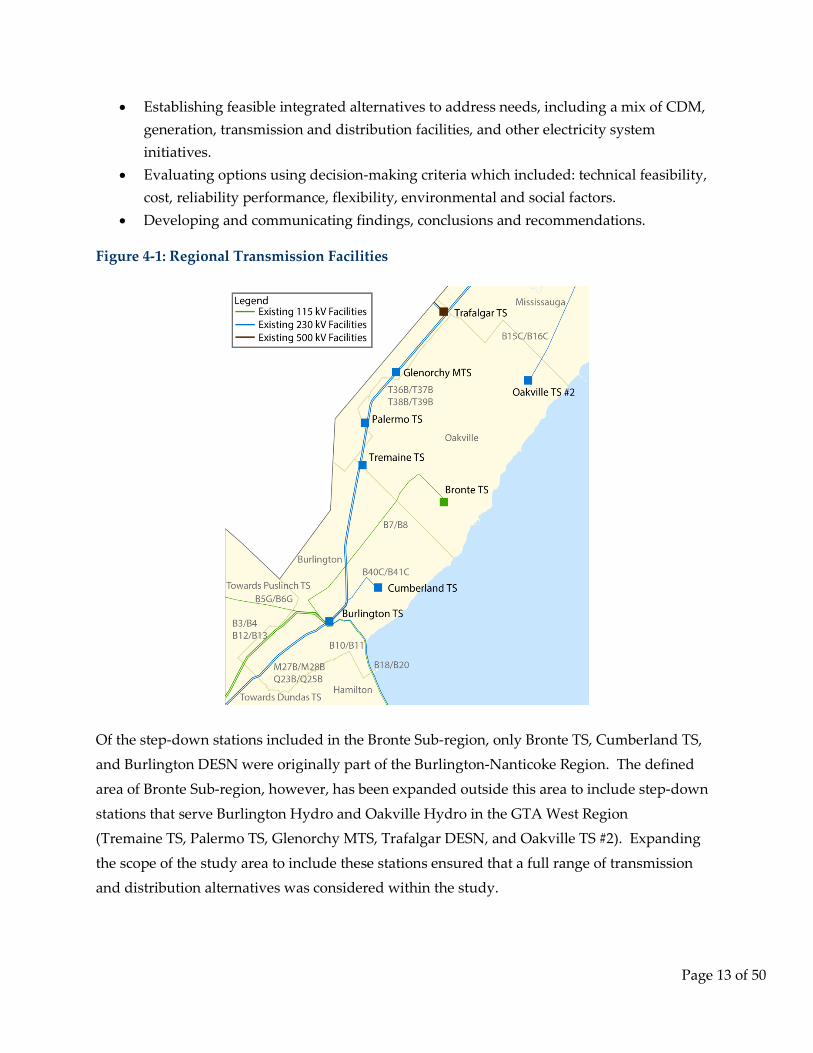
Figure 4-1: Regional Transmission Facilities
Of the step-down stations included in the Bronte Sub-region, only Bronte TS, Cumberland TS, and Burlington DESN were originally part of the Burlington-Nanticoke Region. The defined
area of Bronte Sub-region, however, has been expanded outside this area to include step-down
stations that serve Burlington Hydro and Oakville Hydro in the GTA West Region (Tremaine TS, Palermo TS, Glenorchy MTS, Trafalgar DESN, and Oakville TS #2). Expanding
the scope of the study area to include these stations ensured that a full range of transmission and distribution alternatives was considered within the study.
Page 13 of 50
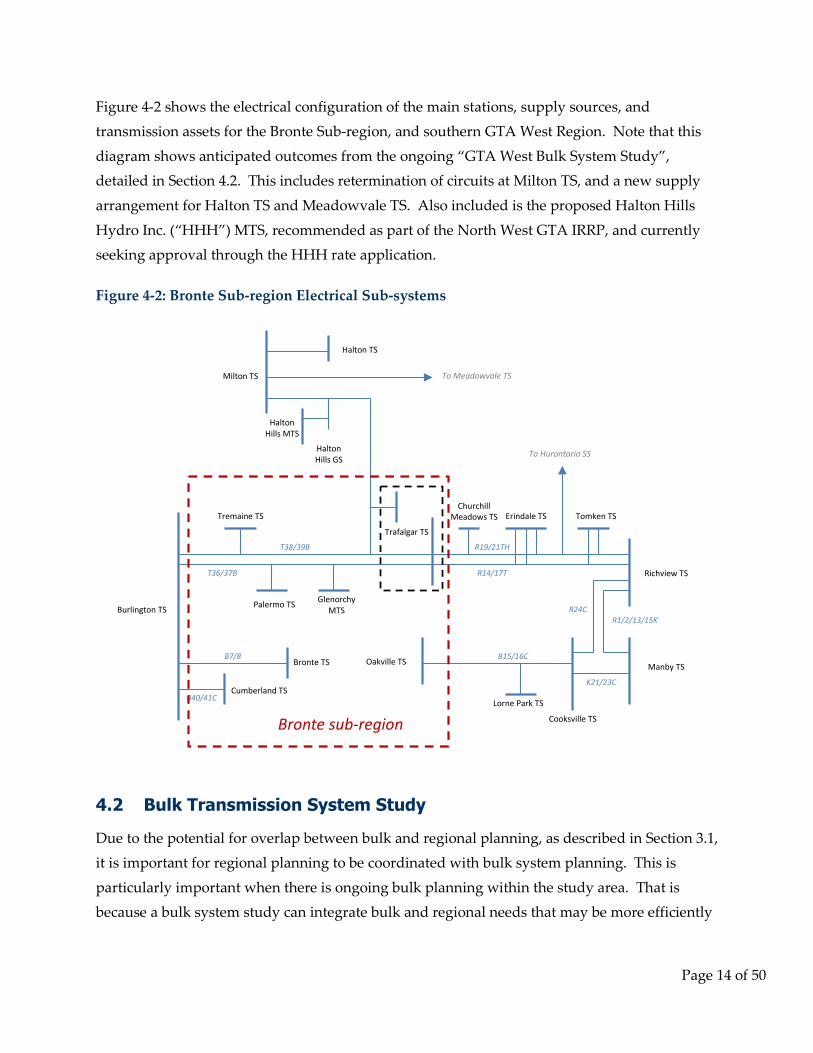
Figure 4-2 shows the electrical configuration of the main stations, supply sources, and transmission assets for the Bronte Sub-region, and southern GTA West Region. Note that this
diagram shows anticipated outcomes from the ongoing “GTA West Bulk System Study”, detailed in Section 4.2. This includes retermination of circuits at Milton TS, and a new supply
arrangement for Halton TS and Meadowvale TS. Also included is the proposed Halton Hills
Hydro Inc. (“HHH”) MTS, recommended as part of the North West GTA IRRP, and currently seeking approval through the HHH rate application.
Figure 4-2: Bronte Sub-region Electrical Sub-systems
Richview TS
Burlington TS
Manby TS Bronte TS
Cumberland TS
Oakville TS
Lorne Park TS
Cooksville TS
Tomken TS Erindale TS Churchill
Meadows TS
Trafalgar TS
Glenorchy MTS
Palermo TS
Halton Hills GS
Halton Hills MTS
Milton TS
Halton TS
To Meadowvale TS
To Hurontario SS
B7/8
T38/39B
T36/37B
R19/21TH
R14/17T
R24C
B15/16C
R1/2/13/15K
K21/23C
B40/41C
Tremaine TS
Bronte sub-region
4.2 Bulk Transmission System Study
Due to the potential for overlap between bulk and regional planning, as described in Section 3.1, it is important for regional planning to be coordinated with bulk system planning. This is
particularly important when there is ongoing bulk planning within the study area. That is because a bulk system study can integrate bulk and regional needs that may be more efficiently
Page 14 of 50

solved through bulk system evaluations. Regional planning therefore needs to account for planned bulk system upgrades.
A bulk system study was initiated by the IESO for GTA West in 2014 to identify and recommend solutions to address emerging b ulk transmission system needs. These needs differ
from those driving the regional plan, as they are impacted by changes in the broader Ontario
electricity system, rather than the local system. These needs include planned refurbishment and retirement of nuclear generation facilities, incorporating renewable generation in southwest
Ontario and changes in electricity consumption patterns across the GTA.
Preliminary results indicated that u pgrades to the bulk transmission system in the GTA West
area are linked to the retirement of Pickering Nuclear Generation Station (“Pickering NGS”). Recommended upgrades include the installation of new autotransformers at Milton Switching
Station (“SS”), incorporation of a 230 kV switchyard, and reconfiguration of the 230 kV
transmission system serving the area.
In early 2016 the Ontario government and IESO announced plans for the extended operation of
Pickering NGS to 2024. This updated generation assumption requires that the original bulk system study be revised. This work is currently underway.
Following the completion of the updated bulk system study and the release of the 2017 LTEP, a
review will be conducted to ensure that any outcomes of the Bronte Sub-region IRRP remain valid in light of any changing assumptions.
Page 15 of 50
5. Demand Forecast
This section outlines the forecast of electricity demand within the Bronte Sub-region. It
highlights the assumptions made for peak-demand load forecasts, and the contribution of conservation and DG to reducing peak demand. The resulting net demand forecast is used in
assessing the electricity needs of the area over the planning horizon.
To evaluate the adequacy of the electric system, the regional planning process involves
measuring the demand observed at e ach station for the hour of the year when overall demand in the study area is at a maximum. This is called “coincident peak demand” and represents the
moment when assets are most stressed and resources most constrained. This differs from a
non-coincident peak, which is measured by summing each station’s individual peak, regardless of whether the stations’ peaks occur at different times of the area’s overall peak.
Within the Bronte Sub-region, the peak loading hour for each year typically occurs in mid-afternoon of the hottest weekday during summer, driven by the air conditioning loads of
residential and commercial customers. This typically occurs on the same day as the overall
provincial peak, but may occur at a different hour in the day.
Section 5.1 begins by describing the historic electricity demand trends in the sub-region from
2005 to 2014. Section 5.2 describes the demand forecast used in this study and the methodology used to develop it.
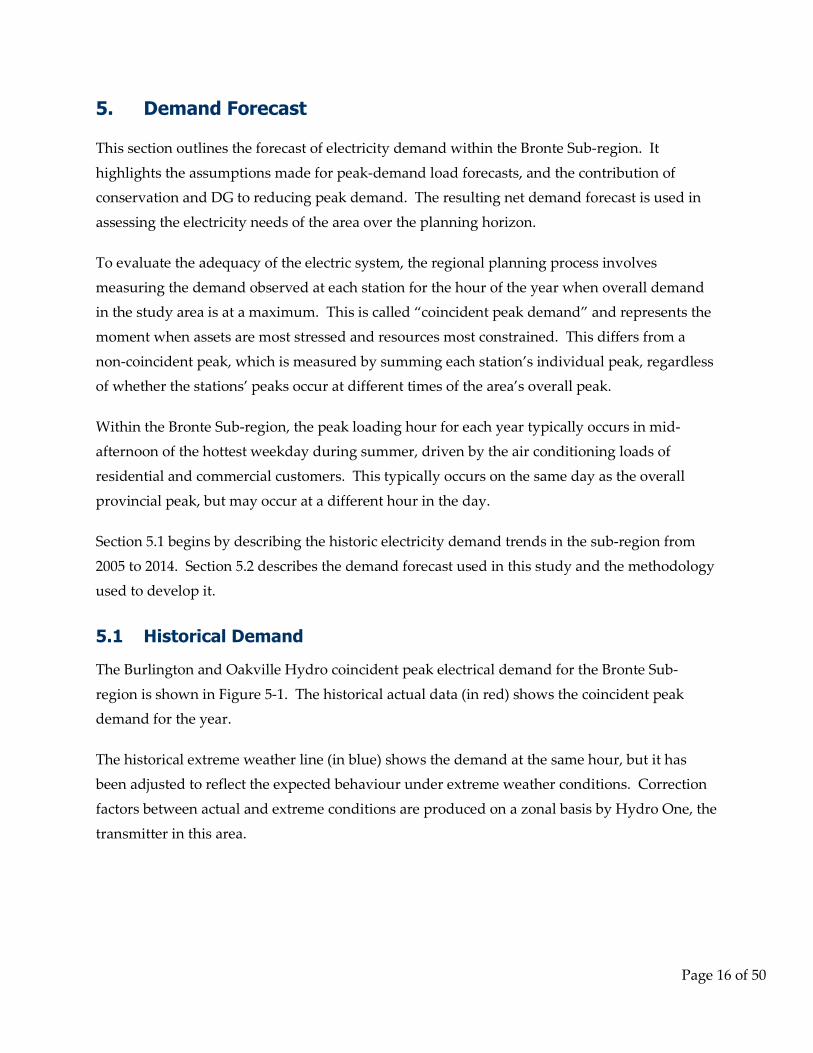
5.1 Historical Demand
The Burlington and Oakville Hydro coincident peak electrical demand for the Bronte Sub
region is shown in Figure 5-1. The historical actual data (in red) shows the coincident peak demand for the year.
The historical extreme weather line (in blue) shows the demand at the same hour, but it has been adjusted to reflect the expected behaviour under extreme weather conditions. Correction
factors between actual and extreme conditions are produced on a zonal basis by Hydro One, the
transmitter in this area.
Page 16 of 50
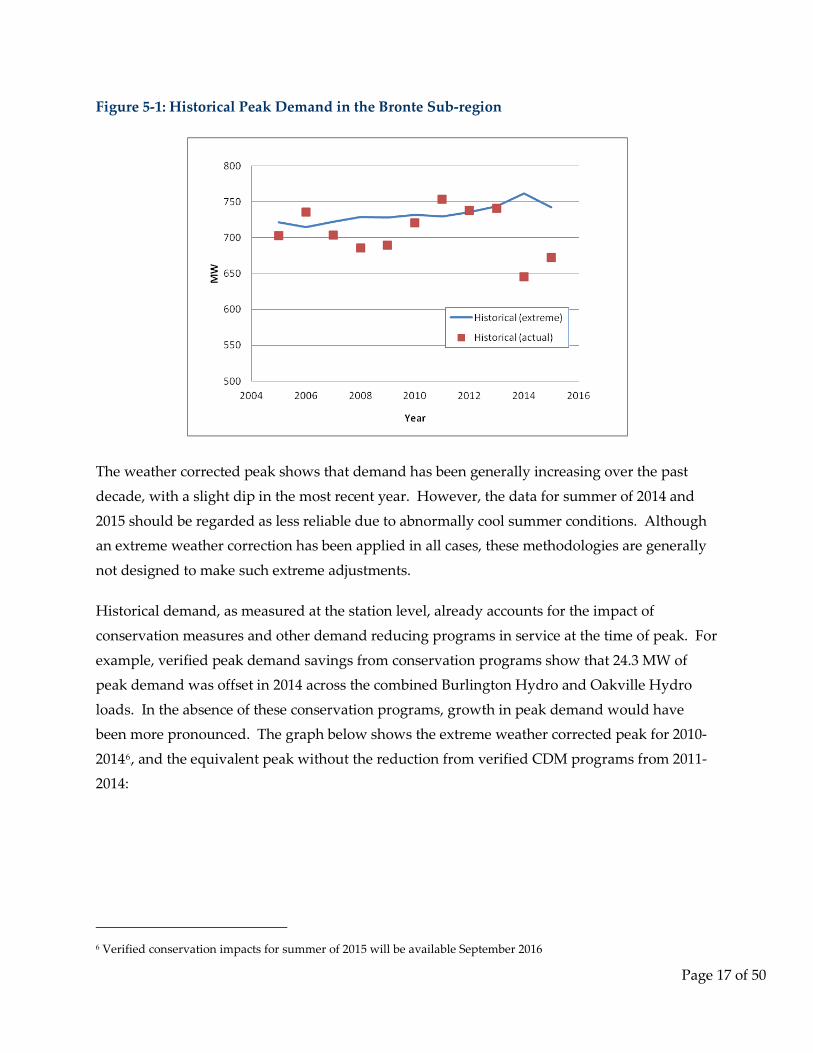
Figure 5-1: Historical Peak Demand in the Bronte Sub-region
The weather corrected peak shows that demand has been generally increasing over the past
decade, with a slight dip in the most recent year. However, the data for summer of 2014 and
2015 should be regarded as less reliable due to abnormally cool summer conditions. Although an extreme weather correction has been applied in all cases, these methodologies are generally
not designed to make such extreme adjustments.
Historical demand, as measured at the station level, already accounts for the impact of
conservation measures and other demand reducing programs in service at the time of peak. For
example, verified peak demand savings from conservation programs show that 24.3 MW of peak demand was offset in 2014 across the combined Burlington Hydro and Oakville Hydro
loads. In the absence of these conservation programs, growth in peak demand would have been more pronounced. The graph below shows the extreme weather corrected peak for 2010
20146 P P, and the equivalent peak without the reduction from verified CDM programs from 2011
2014:
6 Verified conservation impacts for summer of 2015 will be available September 2016
Page 17 of 50
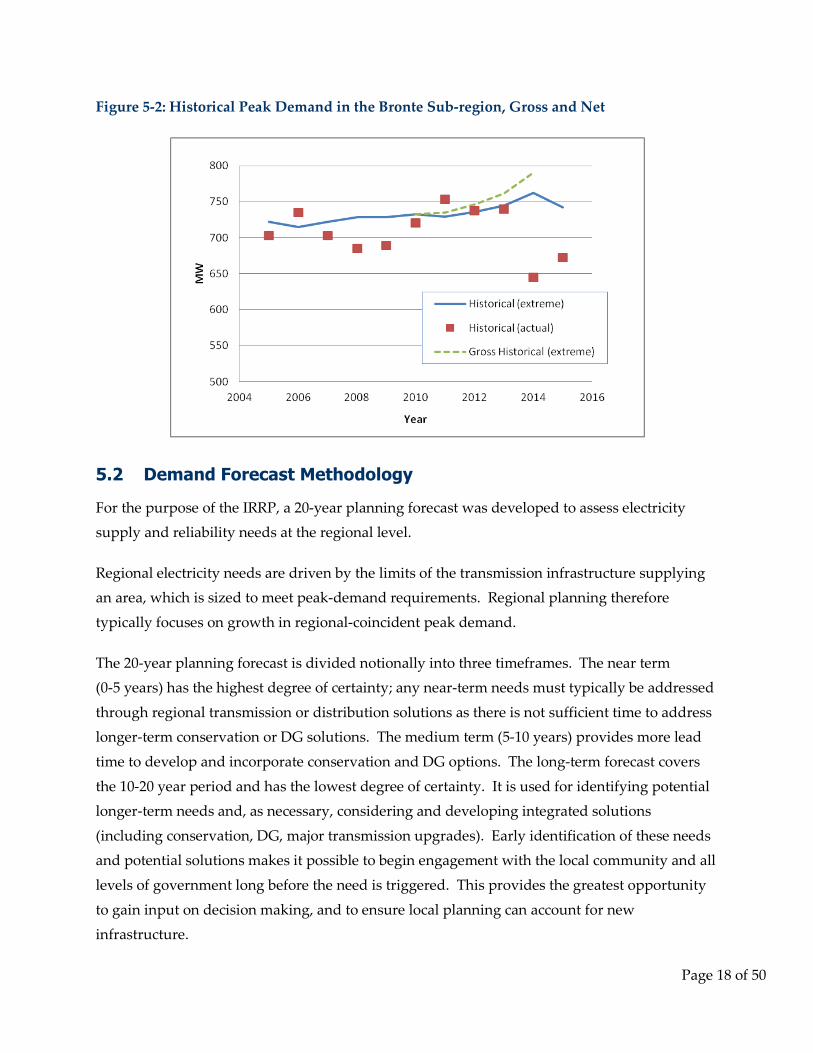
Figure 5-2: Historical Peak Demand in the Bronte Sub-region, Gross and Net
5.2 Demand Forecast Methodology
For the purpose of the IRRP, a 20-year planning forecast was developed to assess electricity supply and reliability needs at the regional level.
Regional electricity needs are driven by the limits of the transmission infrastructure supplying an area, which is sized to meet peak-demand requirements. Regional planning therefore
typically focuses on growth in regional-coincident peak demand.
The 20-year planning forecast is divided notionally into three timeframes. The near term (0-5 years) has the highest degree of certainty; any near-term needs must typically be addressed
through regional transmission or distribution solutions as there is not sufficient ti me to address longer-term conservation or DG solutions. The medium term (5-10 years) provides more lead
time to develop and incorporate conservation and DG options. The long-term forecast covers
the 10-20 year period and has the lowest degree of certainty. It is used for identifying potential longer-term needs and, as necessary, considering and developing integrated solutions
(including conservation, DG, major transmission upgrades). Early identification of these needs and potential solutions makes it possible to begin engagement with the local community and all
levels of government long before the need is triggered. This provides the greatest opportunity
to gain input on decision making, and to ensure local planning can account for new infrastructure.
Page 18 of 50
The regional peak demand forecast was developed as shown in
Figure 5-3. Gross demand forecasts, assuming normal-year weather conditions, were provided
by the LDCs and the transmission-connected customers in the LDC’s service territory. The LDC forecasts are based on growth projections included in regional and municipal plans, which in
turn reflect the province’s Places to Grow policy. These forecasts were then modified to
produce a planning forecast ― i.e., they were adjusted to reflect the peak demand impacts of provincial conservation targets and DG contracted through provincial programs such as FIT
and microFIT and to reflect extreme weather conditions. The planning forecast was then used to assess any growth-related electricity needs in the region.
Figure 5-3: Development of Demand Forecast
Using a planning forecast that is net of provincial conservation targets is consistent with the
province’s Conservation First policy. However, it also assumes that the targets will be met and that the targets, which are energy-based, will produce corresponding local peak demand
reductions. An important aspect of plan implementation will be monitoring the actual peak demand impacts of conservation programs delivered by the local LDCs and, as necessary,
adapting the plan. Additional details related to the development of the demand forecast are
provided in Appendix A.
Page 19 of 50
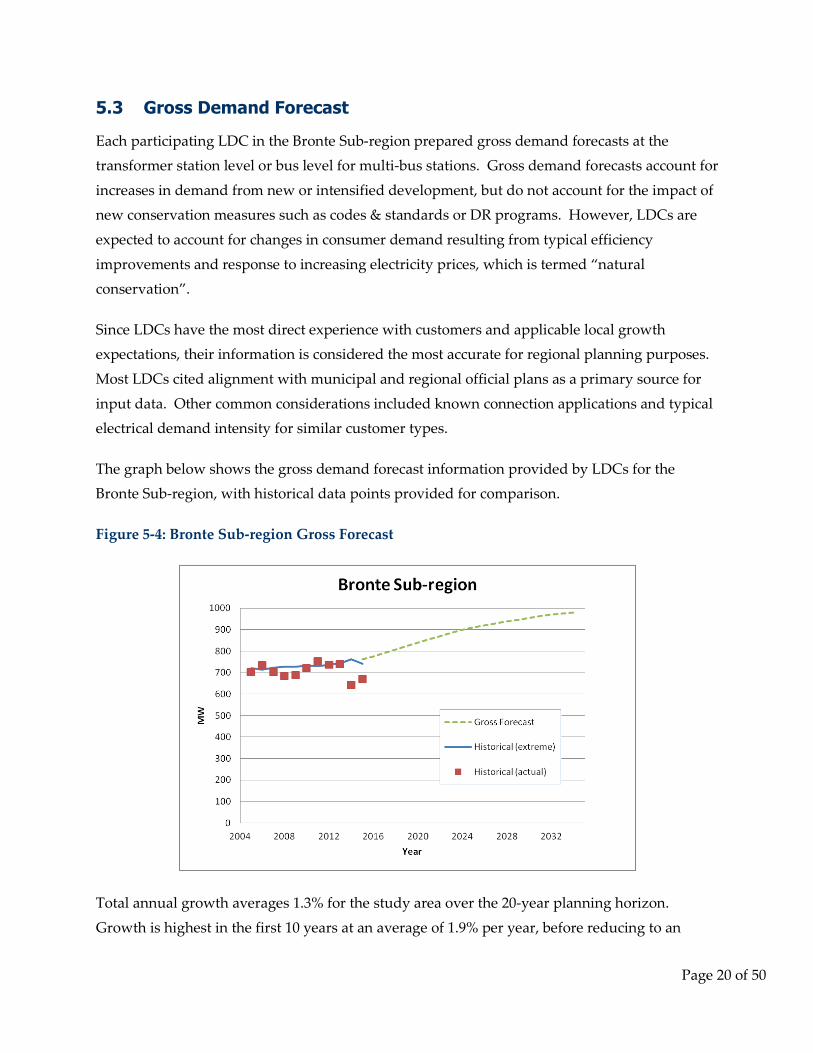
5.3 Gross Demand Forecast
Each participating LDC in the Bronte Sub-region prepared gross demand forecasts at the transformer station level or bus level for multi-bus stations. Gross demand forecasts account for
increases in demand from new or intensified development, but do not account for the impact of new conservation measures such as codes & standards or DR programs. However, LDCs are
expected to account for changes in consumer demand resulting from typical efficiency
improvements and response to increasing electricity prices, which is termed “natural conservation”.
Since LDCs have the most direct experience with customers and applicable local growth expectations, their information is considered the most accurate for regional planning purposes.
Most LDCs cited alignment with municipal and regional official plans as a primary source for
input data. Other common considerations included known connection applications and typical electrical demand intensity for similar customer types.
The graph below shows the gross demand forecast information provided by LDCs for the Bronte Sub-region, with historical data points provided for comparison.
Figure 5-4: Bronte Sub-region Gross Forecast
Total annual growth averages 1.3% for the study area over the 20-year planning horizon.
Growth is highest in the first 10 years at an average of 1.9% per year, before reducing to an
Page 20 of 50
average of 0.8% per year for the second 10 years. Although the forecast is shown for the entire study area, individual stations are forecast to experience different growth rates.
Forecasts were provided based on best available information and, as appropriate, will be updated going forward. The gross demand forecasts by station are provided in Appendix A.
5.4 Conservation Assumed in the Forecast
Conservation is the first resource to be considered in planning, approval and procurement
processes. It plays a key role in maximizing the utilization of existing infrastructure and maintaining reliable supply by keeping demand within equipment capability. Conservation is
achieved through a mix of program-related activities, rate structures, and mandated efficiencies from building codes and equipment standards. The conservation savings forecast for the
Bronte Sub-region have been applied to the gross peak-demand forecast, along with DG
resources (described in Section 5.5), to determine the net peak demand for the sub-region.
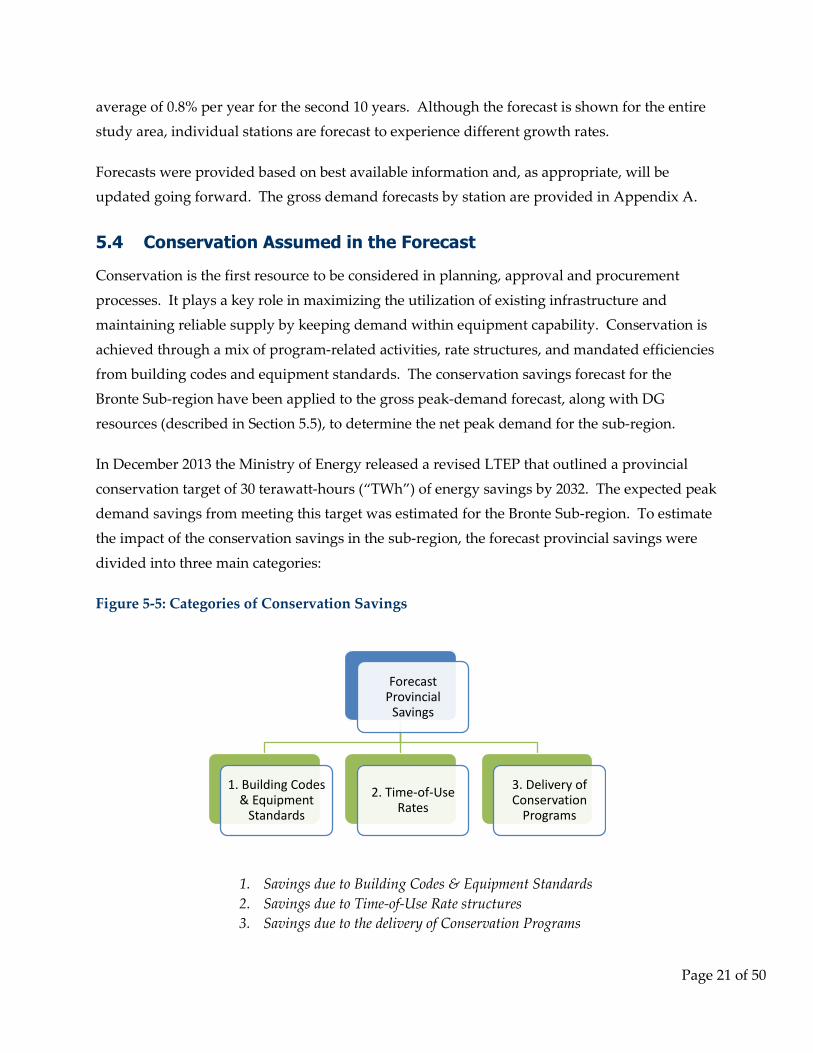
In December 2013 the Ministry of Energy released a revised LTEP that outlined a provincial
conservation target of 30 terawatt-hours (“TWh”) of energy savings by 2032. The expected peak demand savings from meeting this target was estimated for the Bronte Sub-region. To estimate
the impact of the conservation savings in the sub-region, the forecast provincial savings were
divided into three main categories:
Figure 5-5: Categories of Conservation Savings
Forecast Provincial
Savings
1. Building Codes & Equipment
Standards
2. Time-of-Use Rates
3. Delivery of Conservation
Programs
1. Savings due to Building Codes & Equipment Standards 2. Savings due to Time-of-Use Rate structures 3. Savings due to the delivery of Conservation Programs
Page 21 of 50
The impact o f estimated savings for each category was further broken down for the Bronte Subregion by the residential, commercial and industrial customer sectors. The IESO worked
together with the LDCs to establish a methodology to estimate the electrical demand impacts of the energy targets by the three customer sectors. This provides a better resolution of forecast
conservation, as conservation potential estimates vary by sector due to different energy
consumption characteristics and applicable measures.
For the Bronte Sub-region, LDCs were requested to provide a breakdown of their gross demand
forecast, and a breakdown of electrical demand by sector for the forecast, at each TS. For TSs that an LDC could not provide gross load segmentation, the IESO and the LDC worked together
using best available information and assumptions to derive sectoral gross demand. For example, LDC information found in the OEB’s Yearbook of Electricity Distributors7
P P was used to
help estimate the breakdown of demand. Once sectoral gross demand at each TS was
estimated, the next step was to estimate peak demand savings for each conservation category: codes and standards, time-of-use rates, and conservation programs. The estimates for each of
the three savings groups were done separately due to their unique characteristics and available data.
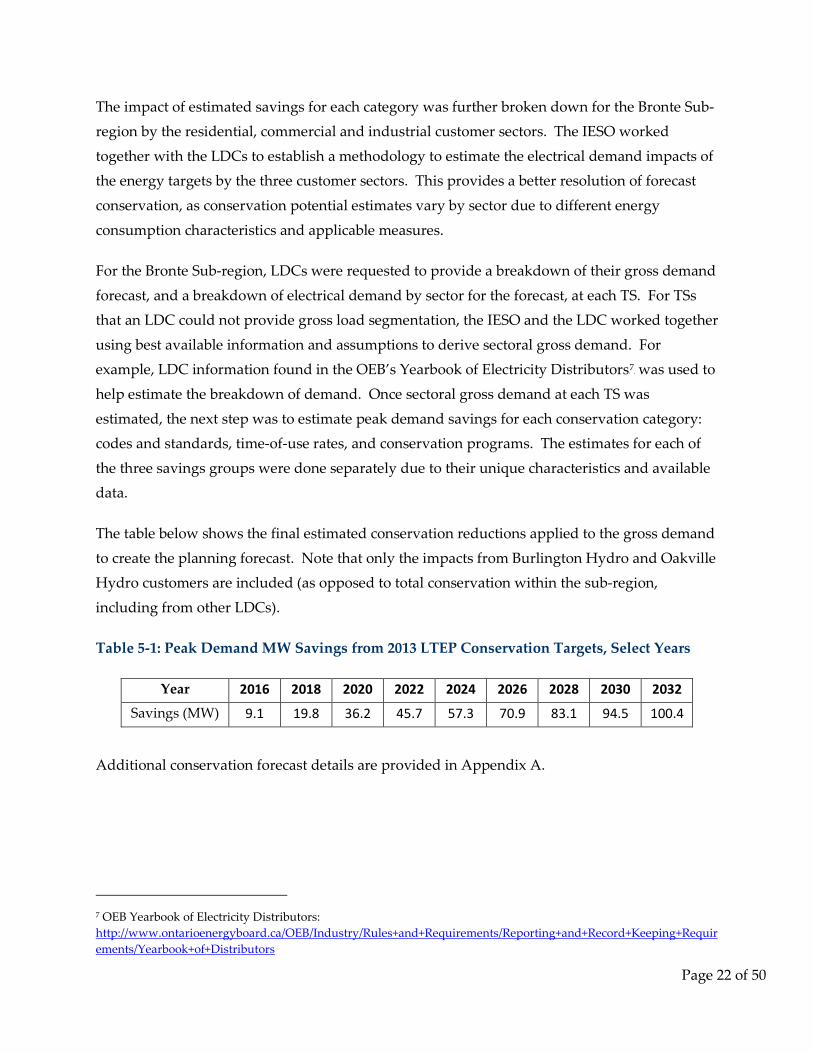
The table below shows the final estimated conservation reductions applied to the gross demand
to create the planning forecast. Note that only the impacts from Burlington Hydro and Oakville Hydro customers are included (as opposed to total conservation within the sub-region,
including from other LDCs).
Table 5-1: Peak Demand MW Savings from 2013 LTEP Conservation Targets, Select Years
Year 2016 2018 2020 2022 2024 2026 2028 2030 2032 Savings (MW) 9.1 19.8 36.2 45.7 57.3 70.9 83.1 94.5 100.4
Additional conservation forecast details are provided in Appendix A.
7 OEB Yearbook of Electricity Distributors: http://www.ontarioenergyboard.ca/OEB/Industry/Rules+and+Requirements/Reporting+and+Record+Keeping+Requir ements/Yearbook+of+Distributors
Page 22 of 50
5.5 Distributed Generation Assumed in the Forecast
In addition to conservation resources, DG in the Bronte Sub-region is also forecast to offset peak demand requirements. The introduction of the Green Energy and Green Economy Act, 2009, and
the associated development of Ontario’s FIT program, has increased the significance of distributed renewable generation in Ontario. This renewable generation, while intermittent in
nature, contributes to meeting the electricity demands of the province.
After applying the conservation savings to the demand forecast as described above, the forecast is further reduced by the expected peak contribution from contracted, but not yet in-service, DG
in the sub-region. The effects of projects that were already in-service prior to the base year of the forecast were not included as they are already embedded in the actual demand which is the
starting point for the forecast. Potential future (but uncontracted) DG uptake was not included
and is instead considered as an option for meeting identified needs.
Based on the IESO contract list as of September 2015, new DG projects are expected to offset an
incremental 2.68 MW of peak demand within the Bronte Sub-region by 2018. All contracts are for small scale solar projects (<500 kW). A capacity contribution of 34% has been assumed to
account for expected output during peak summer conditions.
Additional details of the regional demand reductions from province-wide DG programs are provided in Appendix A.
5.6 Planning Forecasts
After taking into consideration the combined impacts of conservation and DG, a 20-year planning forecast was produced.
Figure 5-6 below illustrates the planning forecast, along with historic demand in the area. Note
that the net forecast is for extreme weather conditions. Further details of the planning forecast scenarios are provided in Appendix A.
Page 23 of 50
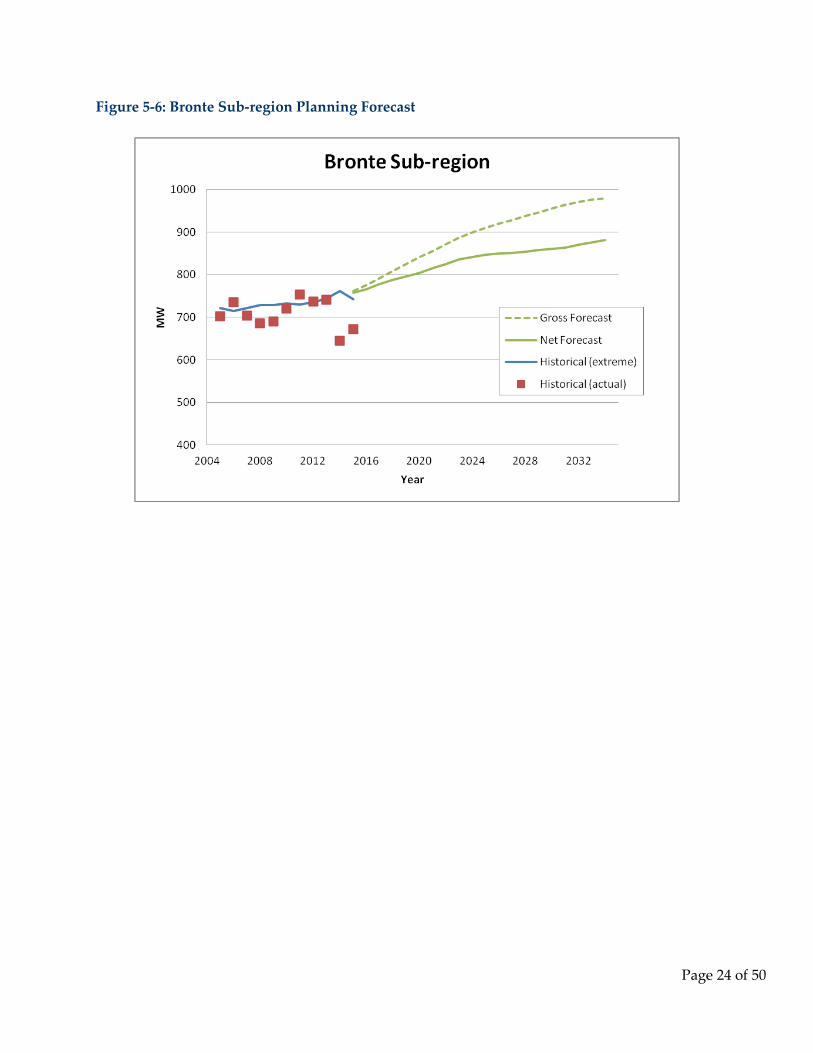
Figure 5-6: Bronte Sub-region Planning Forecast
Page 24 of 50
6. Needs
Based on the planning forecasts, system capability, and application of provincial planning
criteria, the Bronte Sub-region Working Group identified electricity needs in the near, medium, and long term. This section describes the identified needs for these three time horizons in the
Bronte Sub-region.
6.1 Needs Assessment Methodology
ORTAC8 P P, the provincial standard for assessing the reliability of the transmission system, was
applied to assess supply capacity and reliability needs. ORTAC includes criteria related to the
assessment of the bulk transmission system, as well as the assessment of local or regional reliability requirements (see Appendix B for more details).
Through the application of these criteria, four broad categories of needs have been identified for the Bronte Sub-region IRRP:
• Transformer Station Capacity is the electricity system’s ability to deliver power to the local distribution network through the regional transformer stations. This is limited by the 10-day Limited Time Rating (“LTR”) of the step-down transformer stations in the local area. Transformer station capacity need is identified when the peak demand at step-down transformer stations in the local area exceeds the combined LTR ratings.
• Supply Capacity is the electricity system’s ability to provide continuous supply to a local area. This is limited by the load meeting capability (“LMC”) of the transmission lines supplying the area. The LMC is the maximum demand that can be supplied on a transmission line or group of lines as prescribed by ORTAC. LMC studies are conducted using power system simulations analysis (see Appendix B for more details). Supply capacity needs are identified when peak demand on the transmission lines exceeds the LMC.
• Load Security and Restoration is the electricity system’s ability to keep the magnitude of electrical demand interrupted after a major prolonged transmission outage within the levels specified in ORTAC, including the time required to restore service. A major transmission outage would include a contingency on a double-circuit tower line resulting in the prolonged loss of both circuits. Load security concerns the magnitude of peak customer electrical demand which is susceptible to supply interruption in the event of a major transmission outage. Load restoration concerns the time periods within
8 http://www.ieso.ca/imoweb/pubs/marketadmin/imo_req_0041_transmissionassessmentcriteria.pdf
Page 25 of 50
which the interrupted customer demand should be restored following a major prolonged transmission outage. The specific load security and restoration requirements prescribed by ORTAC are described in Appendix B.
• Service quality concerns factors which can impact the effective, efficient, or economic operation of the local power system, both under normal operating conditions and following contingency events. This includes maintaining voltage within specified limits, and overall reliability performance.
The needs assessment may also identify requirements related to equipment end-of-life and planned sustainment activities. Equipment reaching end-of-life and planned sustainment
activities may have an impact on the needs assessment and option development.
6.2 Needs
Two separate needs were identified which impact the ability of Bronte TS to serve local loads:
1. Overloads of 115 kV B7/B8 circuits. The two 115 kV circuits supplying Bronte TS are limited by a 3 km line section which is rated at 750 A and is susceptible to overloading. This is lower than the 850 A for the remaining 14 km, which is not overloaded. As a result, load at Bronte TS must be kept below approximately 135 MW in order to respect the long-term emergency rating of the line.
2. Post contingency voltage drop below acceptable criteria. Bronte TS is made up of two separate buses, BY and Q. When load on BY exceeds approximately 80 MW, and total station load exceeds approximately 149 MW, the bus voltage drops more than 10% following the loss of circuit B7. Voltage drops of this magnitude are not acceptable under ORTAC. The exact loading limit for Bronte TS depends on the load balance between the two buses.
In addition to the two issues impacting Bronte TS, the following needs were also identified
within the broader sub-region:
1. Power Factor at Cumberland TS. The IESO Market Rules require a station to be operated with a power factor of 0.9 or higher. Lower ratings indicate less efficient operation and can trigger thermal and voltage issues.
2. Capacitor bank operation at Oakville TS #2. Due to concerns over voltage imbalance, a station capacitor bank cannot currently be used. This limits the amount of load which can be served.
3. Restoration needs. Two areas within the Bronte study area have been identified as being at risk for not meeting restoration levels as defined in ORTAC.
Page 26 of 50
These needs are described in greater detail in the following sections.
6.2.1 Overload of B7/B8
Bronte TS is served by two 115 kV circuits (B7 and B8) which emanate from Burlington TS and
end at Bronte TS. Under ORTAC, each circuit must be capable of supplying total peak load for Bronte TS, without the need to curtail (reject) load, following the sudden loss of the companion
circuit.
For the B7/B8 circuits, the most limiting contingency is the loss of B7, as the Long Term Emergency (“LTE”) rating of B8 is the lower of the two, at 750 A (compared to 770 A). Further,
the limiting section of B8 is 3 km in length, while the remaining 14 km has a slightly higher rating, at 850 A. Since the lowest rating must be respected, the effective LTE rating of the entire
line is therefore 750 A.
The load in MW that can be accommodated by a rating of 750 A can vary depending on system conditions (including customer power factor and system voltage). In this case, it was
determined to be approximately 135 MW based on prevailing conditions.
Total Bronte TS load is forecast to exceed 135 MW beginning in 2018 however this limit has
already been exceeded during the 2012 and 2013 summer peaks. In each of these instances, B7 and B8 circuits were both in service, and as a result operated within their thermal limits. Had
one of the lines experienced a sudden fault during these peaks, system operators would have
required the immediate transfer of load away from the station, or load shedding, to keep the remaining circuit below it s LTE. Actual LTE at the time of any fault would have been
influenced by actual weather conditions, including temperature, sunlight, and wind.
Although the sudden loss of circuit is a relatively rare event, ORTAC requires that the system
be capable of supplying all peak load in the event of this type of contingency.
6.2.2 Bronte TS – Post Contingency Voltage Drop
Immediately following the loss of any one system element, ORTAC requires that voltage on the distribution side of a step-down station drop no more than 10%.
The risk of a large sudden voltage drop is greater with radially supplied loads, and increases as more load is being supplied, particularly as the thermal limit of the station transformers is
approached. These conditions apply at Bronte TS, making it particularly vulnerable.
Page 27 of 50
Due to the configuration of Bronte TS, the loss of the B7 circuit triggers a larger voltage drop than the loss of B8, so it is again the more limiting of the two contingencies.
Voltage drop is also impacted by the distribution of load between the two Bronte TS buses. Based on the loading profiles provided by LDCs when developing the load forecast, the 10%
post contingency voltage drop constraint is expected to become limiting when total station load
reaches 143 MW, which is forecast to occur in 2021. This assumes BY bus loading of 83 MW, and Q bus loading of 60 MW.
However, if load is optimally distributed between the two buses, up to 149 MW of load could be served before reaching the 10% post contingency voltage drop, which is forecast to occur in
2033. This assumes BY bus loading of 79 MW, and Q bus loading of 70 MW.
Additional information on this need is provided in Appendix B.
6.2.3 Cumberland TS – Power Factor
An investigation was undertaken over the course of the IRRP to examine reported power factor
issues at the Cumberland TS.
Based on historical records of hourly power factor data, it was determined that Cumberland TS
has been frequently operating below a 0.9 power factor over the past several years. Lower power factors represent a less efficient operation of the system (by lowering the amount of
active power which can be provided to customers), and can have a negative impact on local
service quality. In addition, the high voltage side of a transformer must maintain a power factor of 0.9 or higher (leading or lagging) as per ORTAC.
This particular issue can be addressed by “wires” infrastructure. Hydro One and Burlington Hydro will further assess this issue and develop a mitigation plan as part of the RIP.
6.2.4 Oakville TS #2 – Capacitor Bank Operation
Oakville TS #2 station capacity is dependent on the operation of the capacitor bank located at
one of the two buses. If not in operation, station loading is limited to around 138 MW, in order to respect 10% post contingency voltage drop. If the capacitor bank is in operation, up to
152 MW can be accommodated at the station. Although use of the capacitor bank improves load meeting capability as well as providing additional local benefits (power factor control), it
has not been used over the past few years. Hydro One indicated that the reason it has not been
Page 28 of 50
operated is that energizing the bank could create a voltage imbalance of over 7% between the two buses, which may lead to false operation of protections at the station. Protections quickly
disconnect faults which could endanger safety or cause damage to equipment if it remains energized. False operation of protections cause unnecessary interruption to customers and
should be avoided.
Adding a second capacitor bank (such that both buses have equal voltage support) would eliminate this constraint and effectively increase Oakville TS #2 l oading capacity from 138 MW
to 169 MW. This would cost approximate $3 million.
It should be noted, however, that, even with this increased station capacity, Oakville TS #2 is
not a suitable location for providing supply to Bronte TS (see Section 7.1.3.2), and as a result it is not anticipated that additional capacity will be required over the study period at this station. In
the event that electrical demand at Oakville TS #2 exceeds 138 MW (which may occur if a large
customer connects), it is recommended that this constraint be reviewed. This need will not be considered further in the scope of this IRRP.
6.2.5 Restoration Needs
Restoration needs refer to the ability of the system to restore sufficient amount of load within required periods of time following the prolonged loss of a major supply source from the
transmission system.
Several areas within the Bronte Sub-region have been identified as being at risk for not meeting restoration levels as defined in ORTAC. ORTAC indicates that, for the loss of two elements,
any load in excess of 250 MW should be restored within 30-minutes and any load in excess of 150 MW should be restored within 4 hours. The assessment also considers restoration of all
loads within eight hours. These restoration levels are summarized in Figure 6-1, below.
Page 29 of 50
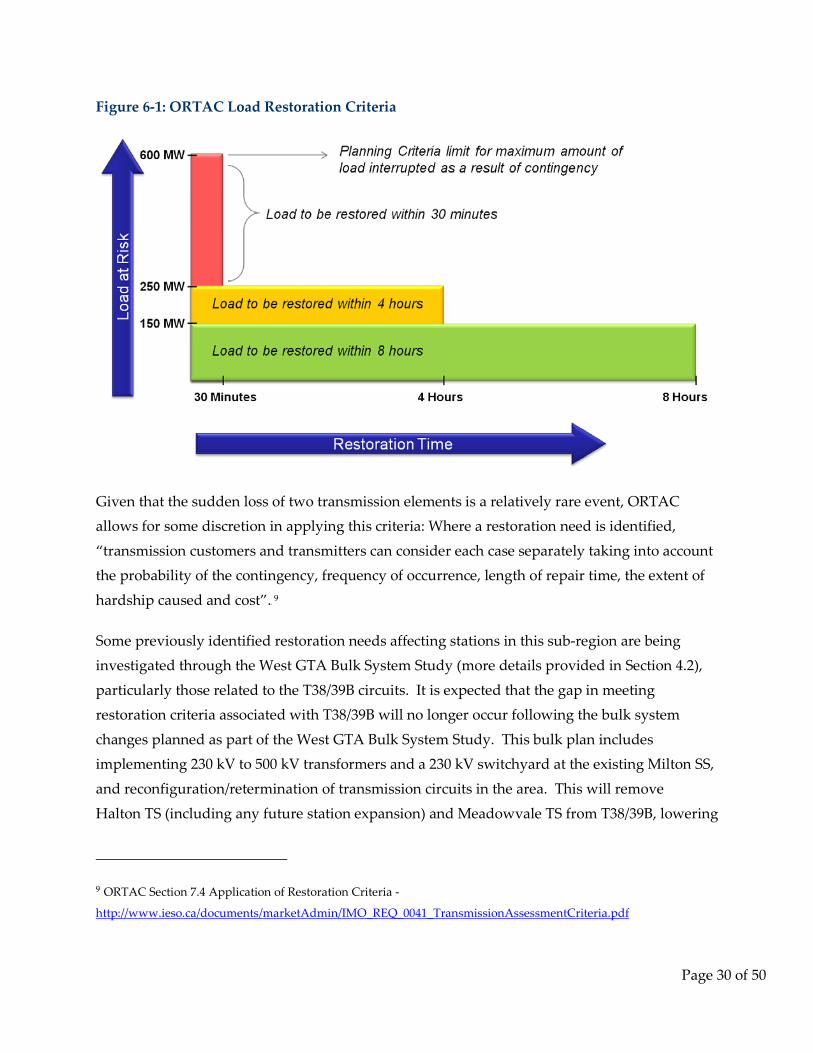
Figure 6-1: ORTAC Load Restoration Criteria
Given that the sudden loss of two transmission elements is a relatively rare event, ORTAC allows for some discretion in applying this criteria: Where a restoration need is identified,
“transmission customers and transmitters can consider each case separately taking into account the probability of the contingency, frequency of occurrence, length of repair time, the extent of
hardship caused and cost”. 9 P
Some previously identified restoration needs affecting stations in this sub-region are being investigated through the West GTA Bulk System Study (more details provided in Section 4.2),
particularly those related to the T38/39B circuits. It is e xpected that the gap in meeting restoration criteria associated with T38/39B will no longer occur following the bulk system
changes planned as part of the West GTA Bulk System Study. This bulk plan includes implementing 230 kV to 500 kV transformers and a 230 kV switchyard at the existing Milton SS,
and reconfiguration/retermination of transmission circuits in the area. This will remove
Halton TS (including any future station expansion) and Meadowvale TS from T38/39B, lowering
9 ORTAC Section 7.4 Application of Restoration Criteria -
http://www.ieso.ca/documents/marketAdmin/IMO_REQ_0041_TransmissionAssessmentCriteria.pdf
Page 30 of 50
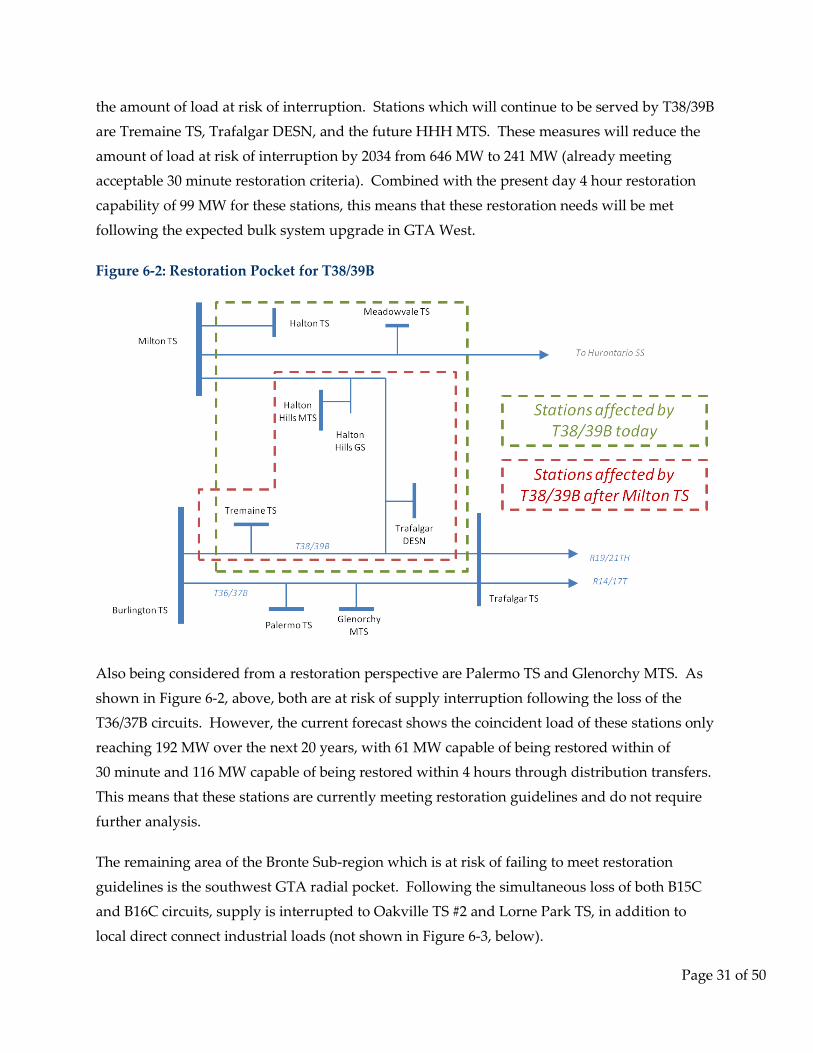
the amount of load at risk of interruption. Stations which will continue to be served by T38/39B are Tremaine TS, Trafalgar DESN, and the future HHH MTS. These measures will reduce the
amount of load at risk of interruption by 2034 from 646 MW to 241 MW (already meeting acceptable 30 minute restoration criteria). Combined with the present day 4 hour restoration
capability of 99 MW for these stations, this means that these restoration needs will be met
following the expected bulk system upgrade in GTA West.
Figure 6-2: Restoration Pocket for T38/39B
Also being considered from a restoration perspective are Palermo TS and Glenorchy MTS. As
shown in Figure 6-2, above, both are at risk of supply interruption following the loss of the T36/37B circuits. However, the current forecast s hows the coincident load of these stations only
reaching 192 MW over the next 20 years, with 61 MW capable of being restored within of 30 minute and 116 MW capable of being restored within 4 hours through distribution transfers.
This means that these stations are currently meeting restoration guidelines and do not require
further analysis.
The remaining area of the Bronte Sub-region which is at risk of failing to meet restoration
guidelines is the southwest GTA radial pocket. Following the simultaneous loss of both B15C and B16C circuits, supply is interrupted to Oakville TS #2 and Lorne Park TS, in addition to
local direct connect industrial loads (not shown in Figure 6-3, below).
Page 31 of 50
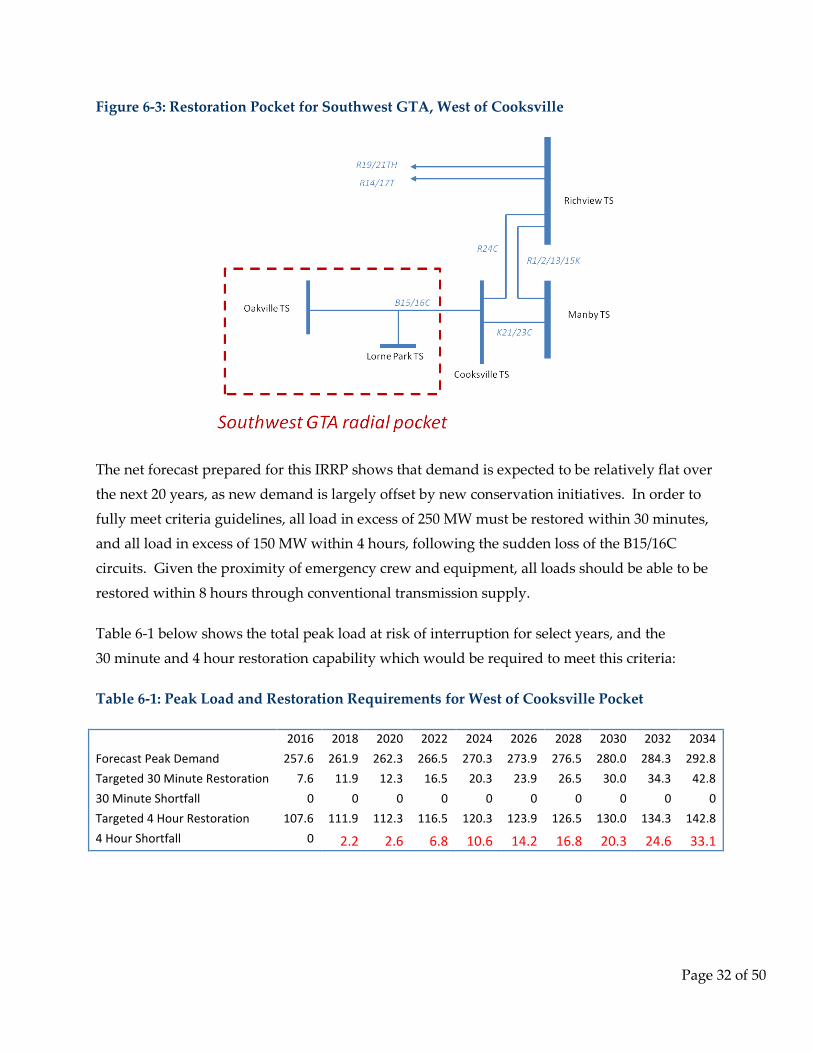
Figure 6-3: Restoration Pocket for Southwest GTA, West of Cooksville
The net forecast prepared for this IRRP shows that demand is expected to be relatively flat over the next 20 years, as new demand is largely offset by new conservation initiatives. In order to
fully meet criteria guidelines, all load in excess of 250 MW must be restored within 30 minutes, and all load in excess of 150 MW within 4 hours, following the sudden loss of the B15/16C
circuits. Given the proximity of emergency crew and equipment, all loads should be able to be
restored within 8 hours through conventional transmission supply.
Table 6-1 below shows the total peak load at risk of interruption for select years, and the
30 minute and 4 hour restoration capability which would be required to meet this criteria:
Table 6-1: Peak Load and Restoration Requirements for West of Cooksville Pocket
2016 2018 2020 2022 2024 2026 2028 2030 2032 2034 Forecast Peak Demand 257.6 261.9 262.3 266.5 270.3 273.9 276.5 280.0 284.3 292.8
Targeted 30 Minute Restoration 30 Minute Shortfall
7.6 0
11.9 0
12.3 0
16.5 0
20.3 0
23.9 0
26.5 0
30.0 0
34.3 0
42.8 0
Targeted 4 Hour Restoration 4 Hour Shortfall
107.6 0
111.9
2.2 112.3
2.6 116.5
6.8 120.3
10.6 123.9
14.2 126.5
16.8 130.0
20.3 134.3
24.6 142.8
33.1
Page 32 of 50
Based on discussions with area LDCs, up to 46 MW can be restored through distribution transfers within 30 minutes under the current supply arrangement and 110 MW within
4 hours.10 P P The West of Cooksville pocket is expected to be able to meet the 30 minute
restoration criteria over the entire study period. This leaves a 4 hour restoration shortfall
beginning in year 2018, and extending throughout the rest of the study period, up to a
maximum of 33 MW by 2034.
Although the magnitude of the 4 hour restoration need is small, the vulnerability to loss of
supply for customers in the West of Cooksville area was highlighted during the July 8, 2013 summer rain storm. This section of line was interrupted for several hours due to outages at
Richview TS and Manby TS. The likelihood of a similar outage occurring in the future is low, as preventative measures have been implemented, based on root cause analysis. However,
Enersource Hydro Mississauga Inc. (“Enersource”) and Oakville Hydro have indicated that
there are ongoing concerns about this reliability risk. It should be noted the bulk plan for the area is considering options which may address this situation.
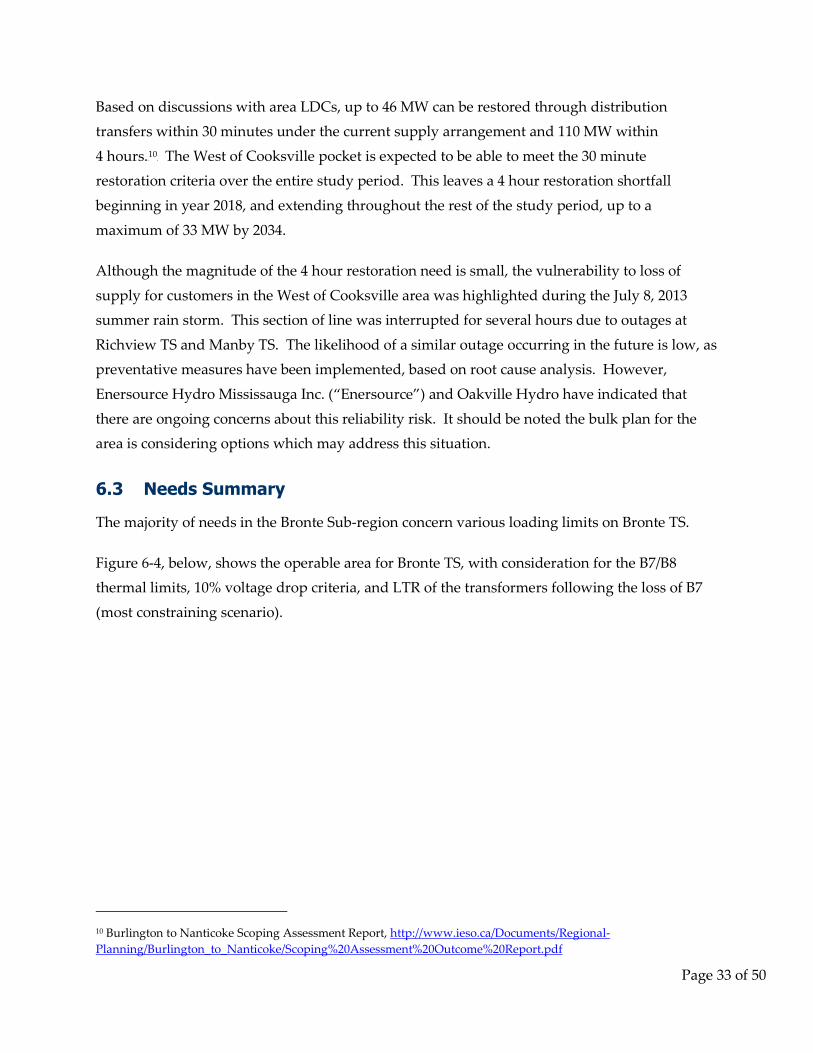
6.3 Needs Summary
The majority of needs in the Bronte Sub-region concern various loading limits on Bronte TS.
Figure 6-4, below, shows the operable area for Bronte TS, with consideration for the B7/B8 thermal limits, 10% voltage drop criteria, and LTR of the transformers following the loss of B7
(most constraining scenario).
10 Burlington to Nanticoke Scoping Assessment Report, http://www.ieso.ca/Documents/RegionalPlanning/Burlington_to_Nanticoke/Scoping%20Assessment%20Outcome%20Report.pdf
Page 33 of 50
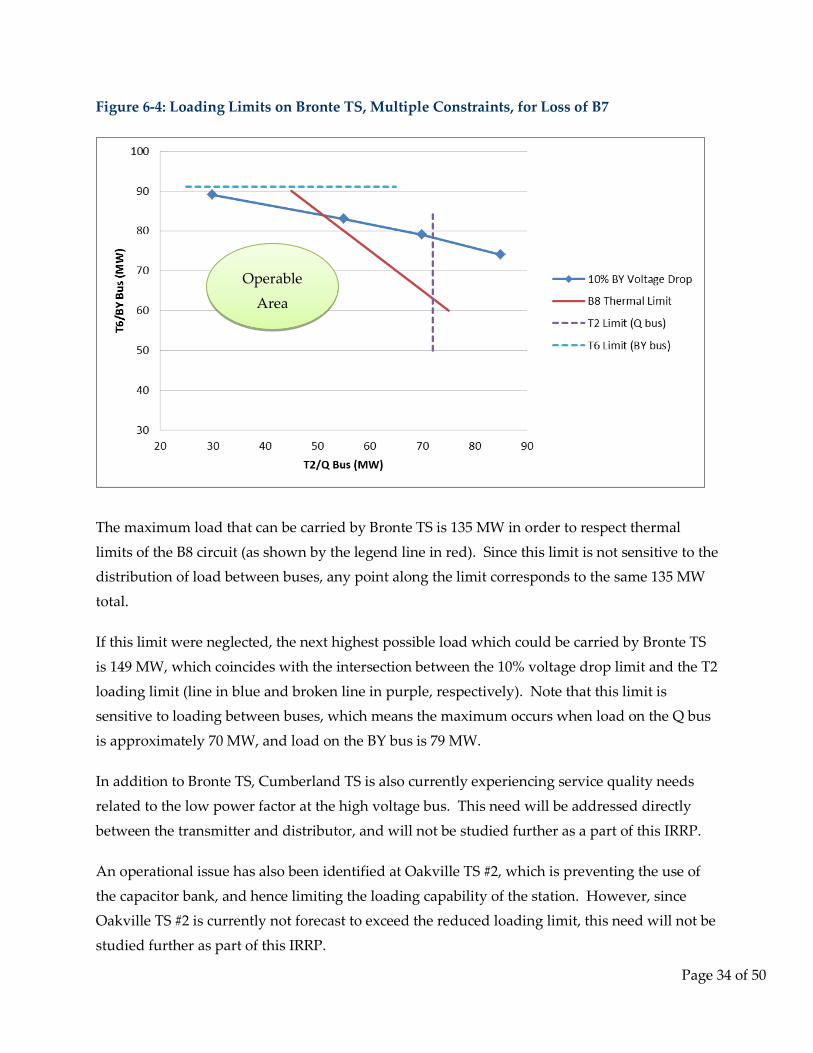
Figure 6-4: Loading Limits on Bronte TS, Multiple Constraints, for Loss of B7
Operable
Area
The maximum load that can be carried by Bronte TS is 135 MW in order to respect thermal
limits of the B8 circuit (as shown by the legend line in red). Since this limit is not sensitive to the distribution of load between buses, any point along the limit corresponds to the same 135 MW
total.
If this limit were neglected, the next highest possible load which could be carried by Bronte TS
is 149 MW, which coincides with the intersection between the 10% voltage drop limit and the T2
loading limit (line in blue and broken line in purple, respectively). Note that this limit is sensitive to loading between buses, which means the maximum occurs when load on the Q bus
is approximately 70 MW, and load on the BY bus is 79 MW.
In addition to Bronte TS, Cumberland TS is also currently experiencing service quality needs
related to the low power factor at the high voltage bus. This need will be addressed directly
between the transmitter and distributor, and will not be studied further as a part of this IRRP.
An operational issue has also been identified at Oakville TS #2, which is preventing the use of
the capacitor bank, and hence limiting the loading capability of the station. However, since Oakville TS #2 is currently not forecast to exceed the reduced loading limit, this need will not be
studied further as part of this IRRP.
Page 34 of 50
Finally, two restoration needs currently exist in the Bronte Sub-region: T38/39B, and the West of Cooksville radial pocket. The former need is expected to be addressed through the
implementation following the GTA West Bulk System Study, and as a result will not be studied further as a part of this IRRP.
The table below provides a brief summary of needs which will be considered during the
development of options for the plan.
Table 6-2: Summary of Needs in Bronte Sub-region
Area Need Description Need Date
Flows on B8 circuit exceeds Long Term Emergency Rating
following loss of B7 when load is in excess of 135 MW
Bronte TS Thermal limit of B7/B8 2018
Voltage at Bronte TS may drop
by more than 10% following loss of B7 when load is in
excess of 143 MW (or 149 MW of loads can be redistributed
between buses)
Bronte TS Post contingency 10%
voltage drop 2021
West of
Cooksville Restoration
Restoration shortfall for the 4 hour timeline defined by
ORTAC
2018
Page 35 of 50
7. Near- and Medium-Term Plan
This section describes the alternatives c onsidered in developing the near- and medium-term
plan for the Bronte Sub-region, provides details of and rationale for the recommended plan, and outlines an implementation plan.
7.1 Alternatives for Meeting Near- and Medium-Term Needs
In developing the near- and medium-term plan, the Working Group considered a range of integrated options. The Working Group further considered technical feasibility, cost and
consistency with long-term needs and options in the Bronte Sub-region when evaluating
alternatives. Solutions that maximize the use of existing infrastructure were given priority, where they were otherwise determined to be cost effective.
The following sections detail the alternatives considered and address their performance in the context of the criteria described above. The alternatives are grouped according to three major
solution categories: (1) conservation, (2) local generation and (3) transmission and distribution.
7.1.1 Conservation
Conservation was considered as part of the planning forecast, which includes the local peak-demand effects of the provincial conservation targets (see Section 5.4). Across the planning
area, the LTEP energy reduction targets account for approximately 57 MW, or 41% of the forecast demand growth during the first 10 years of the study. Achieving the estimated peak
demand reductions of the provincial conservation targets significantly reduces the extent of the Bronte TS thermal and voltage drop needs. This results in only a 15 MW capacity gap, which
makes a distribution solution viable. It also effectively offsets new demand growth at this
station from 2023-2030. As a result, a solution developed to address near-term needs would be sufficient for the area until roughly 2030.
In Figure 7-1, below, Bronte TS load is shown under both the gross and net forecasts (accounting for expected c onservation and contracted DG) . The thermal limit of B7/B8 is also
shown, as it is the more constraining of the two needs identified at Bronte TS.
Page 36 of 50
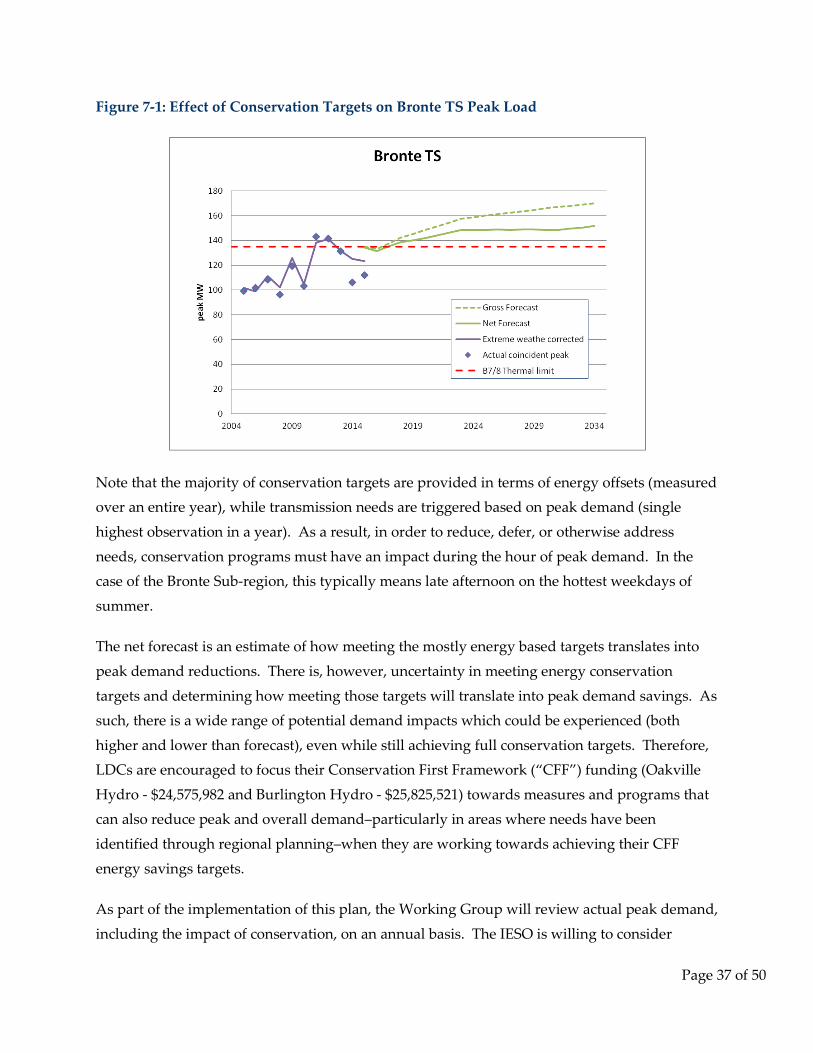
Figure 7-1: Effect of Conservation Targets on Bronte TS Peak Load
Note that the majority of conservation targets are provided in terms of energy offsets (measured over an entire year), while transmission needs are triggered based on peak demand (single
highest observation in a year). As a result, in order to reduce, defer, or otherwise address
needs, conservation programs must have an impact during the hour of peak demand. In the case of the Bronte Sub-region, this typically means late afternoon on the hottest weekdays of
summer.
The net forecast is an estimate of how meeting the mostly energy based targets translates into
peak demand reductions. There is, however, uncertainty in meeting energy conservation
targets and determining how meeting those targets will translate into peak demand savings. As such, there is a wide range of potential demand impacts which could be experienced (both
higher and lower than forecast), even while still achieving full conservation targets. Therefore, LDCs are encouraged to focus their Conservation First Framework (“CFF”) funding (Oakville
Hydro - $24,575,982 and Burlington Hydro - $25,825,521) towards measures and programs that can also reduce peak and overall demand–particularly in areas where needs have been
identified through regional planning–when they are working towards achieving their CFF
energy savings targets.
As part of the implementation of this plan, the Working Group will review actual peak demand,
including the impact of conservation, on an annual basis. The IESO is willing to consider
Page 37 of 50
requests from LDCs for support with the development of a localized achievable potential study to determine the specific conservation savings potential associated with Bronte TS. The study
could be used to help design conservation/DSM programs that deliver optimal customer and system benefits. If net demand trends lower at Bronte TS than expected, need dates may be
deferred. On the other hand, if growth trends higher, and cannot be offset through
conservation or other peak reducing activities (such as DG), additional measures may be required to address needs.
The other major need identified in the Bronte Sub-region is the restoration need following a loss of transmission supply in the West of Cooksville radial pocket. Restoration is required
following a loss of supply. Power must be restored through an alternate electrical supply path, or when the original fault is cleared. Conservation does not have a bearing on these factors, and
as a result is not a suitable option for addressing these types of needs.
7.1.2 Local Generation
Large, transmission-connected generation and small-scale distribution-connected DG options were ruled out as viable alternatives for meeting near-term needs in the Bronte Sub-region. The
sections below explain why.
7.1.2.1 Generation-based Solution to Address Bronte TS Needs
Two sets of needs are associated with Bronte TS: overloads on the B7/B8 supply circuits, and
post contingency voltage drop at the station itself.
Based on the planning forecast, a transmission connected generator of approximately 20 MW
would be suitable for addressing the circuit overload needs expected to emerge in 2018, but would not impact the voltage drop needs expected to begin in 2021. Although this could
address some of the near-term Bronte TS needs, it was still not considered an appropriate
solution for several reasons. First, it is not technically feasible to approve and construct this type of facility within the short lead time required to meet near-term needs. Second, it would
be difficult and possibly infeasible to find a suitable location to host this type of facility in close proximity to Bronte TS, which is located within a highly developed area of southwest Oakville.
Third, local generation would add t o the overall generation capacity for the province and
therefore the generation capacity situation at the provincial level must be considered. Currently, the province has a surplus of generation capacity, and no new capacity is forecast to
be needed until the mid-2020s at the earliest.
Page 38 of 50
Instead of a single large transmission connected generation facility, 20 MW worth of DG projects could address both the B7/B8 overload and Bronte TS voltage drop needs into the long
term. However, DG projects were also determined to be technically, logistically and economically infeasible for addressing these needs because the DG facilities would need to be
optimally dispersed across a number of distribution feeders. Generation would, in effect, have
to fully offset any incremental demand, and be matched precisely where local demand requires. Developing and implementing such a complex solution within the time period of the need in
this densely developed area was determined to be impractical.
While DG projects are not suitable for addressing near-term needs, they offer good potential for
managing ongoing load growth, and thereby deferring longer-term needs. New development in the Town of Oakville offers potential to identify opportunities for large steam host customers
to integrate combined heat and power (“CHP”) projects at the earliest stage of community
design to meet demand and heat needs. Typically large commercial or institutional customers have suitable profiles to accommodate this type of facility. The Town of Oakville has identified
goal 2.1.1 in their Environmental Strategic Plan to “Work with Oakville Hydro and other community partners to expand, access and promote alternative green energy resources
(geothermal, solar, combined heat and power, etc.)”. [1] 22T P P22T Additionally, the City of Burlington has
proposed a target of 12.5 MW of peak electrical demand to be met through local sustainable generation by 2031.11
P P Locating distributed energy resources in the Bronte TS service territory
could provide value in deferring the need for additional investments.
Based on the planning forecast, long-term growth within the Bronte TS area is expected to
average less than 1 MW per year. Assuming the recommended option (described in greater
detail in Section 7.2) is adopted, new needs may begin to emerge after 2030. Acquiring approximately 10 MW of DG capacity, with the ability to dispatch during local peak demand,
would thereby defer potential long-term needs for over a decade.
Potential for incremental DG to address long-term needs will be reviewed as part of future
regional planning cycles, while actual uptake will be monitored on a yearly basis.
[1] Oakville Environmental Strategic Plan, 2011 Update, http://www.oakville.ca/assets/general%20%20environment/2011_ESP_FINAL.pdf
11 Burlington Community Energy Plan, https://www.burlington.ca/en/live-and
play/resources/Environment/Burlington_Community_Energy_Plan.pdf
Page 39 of 50
7.1.2.2 Generation-based Solution to Address Restoration Needs
Generation was ruled out as a possible option to address restoration needs in the West of
Cooksville radial pocket. Large generation is not a suitable option for addressing restoration needs, as it would require the facility to have blackstart and islanded operation capabilities, a
costly generation and system design feature. Additionally, finding a suitable location for major
generation infrastructure could be challenging given that the West of Cooksville area is largely built up with significant residential zoning.
Smaller scale DG was determined to be impractical from a technical and economic perspective, given the scale and number of facilities that would be required within the sub-region. In order
to provide restoration, each of these facilities would also have to be able to supply their local
loads in islanded mode. Some high value loads (such as pumping and water purification facilities) are typically developed with on-site gas or diesel generation to ensure they can
continue to operate during a power supply outage. While there is benefit to building this type of supply redundancy to ensure restoration capability for some loads, it is impractical on a large
scale to address local restoration needs.
7.1.3 Transmission and Distribution
A number of transmission and distribution, or “wires,” solutions were considered by the
Working Group to meet the near-term needs. “Wires” infrastructure solutions can refer to new
or upgraded transmission or distribution system assets, including lines, stations, or related equipment. These solutions are often characterized by high upfront capital costs, but have high
reliability over the lifetime of the asset.
If net growth at Bronte TS cannot be fully offset through conservation, DR, or local generation
initiatives, constraints on the transmission system will have to be addressed through an
electricity infrastructure based solution. Even under the full achievement of conservation targets, peak demand is forecast to exceed the existing transmission system capacity by 15 MW
over the next 15 years. There are potential transmission and distribution solutions to address the Bronte TS need; these are described in greater detail in Sections 7.1.3.1 and 7.1.3.2.
Likewise, an electricity infrastructure based solution could address the restoration need for the
West of Cooksville radial pocket. However, given the high costs associated with electricity infrastructure solutions, low exposure to risk represented by this event, and low likelihood of
Page 40 of 50
occurrence, any measure would have to be assessed to ensure it is economic before it is recommended. This is further discussed and investigated in Section 7.1.3.3.
7.1.3.1 Transmission-based Solution to Address Bronte TS Need
The two 115 kV circuits supplying Bronte TS are limited by a 3 km section which is r ated at
750 A for circuit B8, and 770 A for circuit B7. These are lower ratings than the remaining 14 km
of the lines (850 A for B8, and 880 A for B7). As a result, load at Bronte TS must be kept below approximately 135 MW in order to respect the 750 A minimum LTE rating of the line. If the
limiting 3 km line section was uprated, the new thermal limit of the remaining section would be approximately 150 MW (corresponding to 850 A). Assuming full achievement of CDM targets,
this measure would successfully defer the thermal need until 2033 (assuming load distributed
optimally between buses according to: maximum 79 MW on BY bus, 70 MW on Q bus). At this loading level, needs associated with post contingency voltage drop would also become limiting,
and no incremental load could be served at Bronte TS. This transmission upgrade would therefore enable the full usage of the step-down transformer facilities.
B7/B8 Palermo Junction to Bronte TS (3 km) is the limiting line section. Uprating will require complete rebuild of this line section using new steel poles and 585 kcmil 26/7 Aluminum
Conductor, Steel Reinforced (“ACSR”) conductor. Hydro One has indicated that budgetary
estimate for rebuilding this 3 km line section is approximately $9.7 million.
The estimated time required for uprating Palermo Junction to Bronte TS line section is about
three years which includes the OEB leave to construct application (Section 92), and environmental approvals.
7.1.3.2 Distribution-based Solution to Address Bronte TS Need
As an alternative to uprating the limiting section of B7/B8, needs associated with Bronte TS could be addressed by keeping the total station load below 135 MW. Assuming full
achievement of conservation targets, this would require approximately 15 MW of additional capacity relief to defer the need past 2030. This relief could be achieved by transferring 15 MW
of load (approximately 1 feeder worth) from Bronte TS to a neighboring station. This would
require investment in the distribution system to expand the service territory of another station into an area w hich is c urrently served by Bronte TS.
Page 41 of 50
There are four stations within the general vicinity of Bronte TS which are forecast to have remaining station capacity over the 20-year planning horizon, and which currently serve load
from either Burlington Hydro or Oakville Hydro. These stations were reviewed to determine suitability for load transfer:
1. Glenorchy MTS is located approximately 14 km north and east of Bronte TS, and primarily serves Oakville Hydro load, with some embedded demand. Under the current planning forecast, over 40 MW of capacity will be available at this station over the next 20 years. Oakville Hydro has indicated that it would not be technically or economically feasible to build transfer capability between Bronte TS and Glenorchy MTS, mainly due to the presence of the Queen Elizabeth Way (“QEW”) highway, which would have to be spanned or tunneled under for a connection between the two systems to be made.
2. Trafalgar TS is approximately 17 km north and east of Bronte TS, and serves Oakville Hydro load exclusively. Load at this station is forecast to remain steady over the next 20 years, and could accommodate up to 40 additional MW of demand. However, 17 km is too far for 27.6 kV distribution feeders to span and supply dense urban loads without a negative impact on voltage.
3. Oakville TS #2 is located approximately 10 km east of Bronte TS, and serves load from Oakville Hydro and Enersource (City of Mississauga). This station is forecast to have at least 40 MW of available capacity over the next 20 years. Although Oakville Hydro has existing emergency transfer capability between Bronte TS and Oakville TS #2, it has indicated that it would not be technically feasible to build enhanced ties, or operate emergency transfers for prolonged periods of time.
4. Tremaine TS is located 8 km north and east of Bronte TS, and serves load from Burlington Hydro and Milton Hydro. Under the planning forecast, Tremaine TS is expected to have at least 80 MW of available capacity over the next 20 years. Burlington Hydro has indicated that it would be technically feasible to expand the Tremaine TS service territory southward to create an alternate supply path for the western Bronte service territory, at a cost of approximately $4.5 million.
Given that the alternative to the distribution transfer is to upgrade the transmission supply circuits at approximately two times the cost, the Tremaine TS distribution transfer is
recommended as the preferred option for the near-term Bronte TS need. Burlington Hydro
expects that the transfer could be made within two years.
Page 42 of 50
7.1.3.3 Infrastructure-based Solution to Address Cooksville West Restoration Need
Infrastructure, such as a transmission or distribution facility, is typically the only suitable solution to address restoration needs. It provides a means of isolating a faulted section and
restoring electrical demand from an alternate source. However, building redundant supply paths can be a high cost solution, depending on the configuration of the local system.
Accordingly, ORTAC allows for some discretion when applying this criteria: where a restoration need is identified, “transmission customers and transmitters can consider each case
separately taking into account the probability of the contingency, frequency of occurrence,
length of repair time, the extent of hardship caused and cost”. 12 P P Additionally, these parties
may also agree on higher or lower levels of reliability for technical, economic, safety and
environmental reasons.
Additionally, as described in Section 4.2, a bulk system study is currently underway in West
GTA to address overload issues on the 500 kV and some 230 kV transmission assets in the area.
The bulk transmission study will investigate major changes to the transmission system. Some local restoration needs (such as the Halton radial pocket (T38/39B), described in Section 6.2.5),
are already expected to be addressed through planned system upgrades.
Work on the GTA West Bulk System Study i s still underway, and final configuration and timing
have not yet been determined. As a result, standalone infrastructure solutions to address
restoration needs for the West of Cooksville radial pocket will not be further investigated in this IRRP.
If these restoration needs ar e not adequately addressed through the bulk transmission study, they will be revisited as part of the regional planning process. The criteria outlined in ORTAC
(probability of the contingency, frequency of occurrence, length of repair time, the extent of hardship caused and cost) will be considered before a solution is recommended to address this
need.
12 ORTAC Section 7.4 Application of Restoration Criteria -
http://www.ieso.ca/documents/marketAdmin/IMO_REQ_0041_TransmissionAssessmentCriteria.pdf
Page 43 of 50
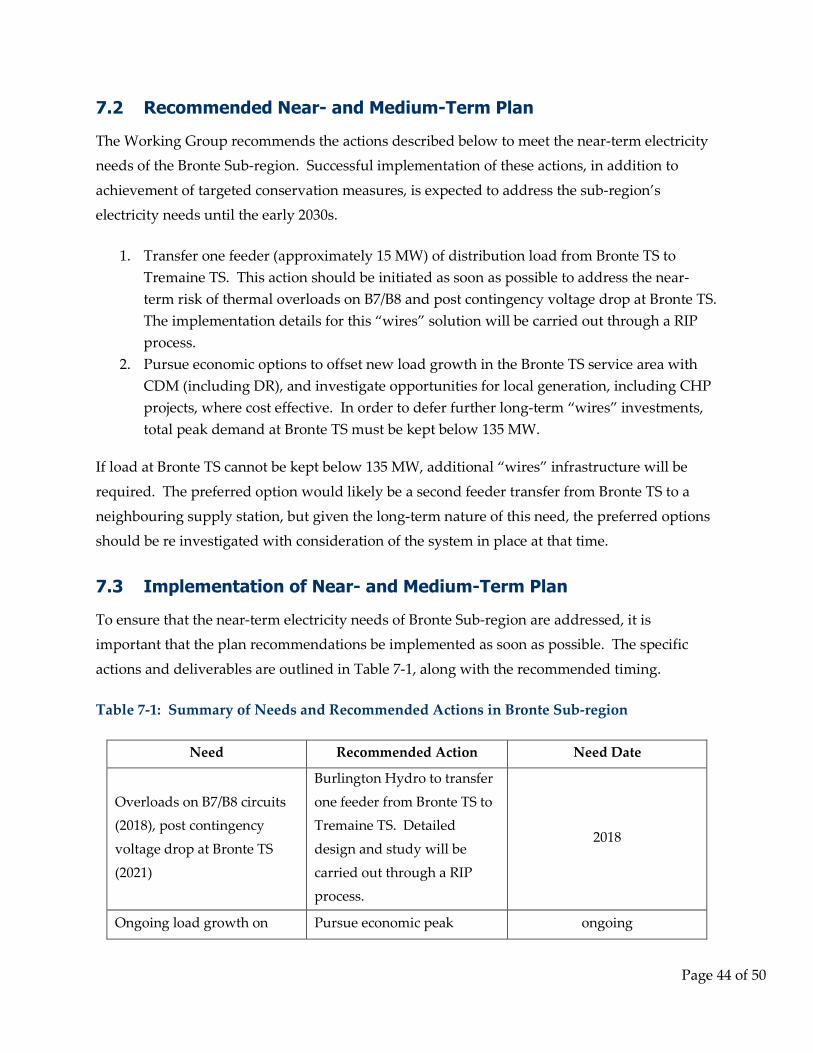
7.2 Recommended Near- and Medium-Term Plan
The Working Group recommends the actions described below to meet the near-term electricity needs of the Bronte Sub-region. Successful implementation of these actions, in addition to
achievement of targeted conservation measures, is expected to address the sub-region’s electricity needs until the early 2030s.
1. Transfer one feeder (approximately 15 MW) of distribution load from Bronte TS to Tremaine TS. This action should be initiated as soon as possible to address the near-term risk of thermal overloads on B7/B8 and post contingency voltage drop at Bronte TS. The implementation details for this “wires” solution will be carried out through a RIP process.
2. Pursue economic options to offset new load growth in the Bronte TS service area with CDM (including DR), and investigate opportunities for local generation, including CHP projects, where cost effective. In order to defer further long-term “wires” investments, total peak demand at Bronte TS must be kept below 135 MW.
If load at Bronte TS cannot be kept below 135 MW, additional “wires” infrastructure will be
required. The preferred option would likely be a second feeder transfer from Bronte TS to a
neighbouring supply station, but given the long-term nature of this need, the preferred options should be re investigated with consideration of the system in place at that time.
7.3 Implementation of Near- and Medium-Term Plan
To ensure that the near-term electricity needs of Bronte Sub-region are addressed, it is important that the plan recommendations be implemented as soon as possible. The specific
actions and deliverables are outlined in Table 7-1, along with the recommended timing.
Table 7-1: Summary of Needs and Recommended Actions in Bronte Sub-region
Need Recommended Action Need Date
Burlington Hydro to transfer
one feeder from Bronte TS to Tremaine TS. Detailed
design and study will be
carried out through a RIP process.
Overloads on B7/B8 circuits (2018), post contingency
voltage drop at Bronte TS
(2021)
2018
Ongoing load growth on Pursue economic peak ongoing
Page 44 of 50
Need Recommended Action Need Date
Bronte TS potentially triggering same needs in the
medium to long term
demand reducing measures, including CDM and DG, to
keep Bronte TS demand below 135 MW
In order to implement the recommended near-term actions in a timely manner, an RIP should be initiated for the Bronte Sub-region upon IRRP completion. This process will allow for
detailed design and study of distribution infrastructure expansion required to complete this
transfer. Both LDCs have indicated that revisions to their load forecasts may be required within the next few months, which will help inform the local “wires” plan.
The outcome of the RIP will be a more detailed development plan, including a refined estimate of expected costs and benefits to customers.
7.3.1 Implementation Challenges
Under the net forecast used in this IRRP, near-term load growth at Bronte TS is expected to be driven by Oakville Hydro, the result of intensification within Oakville’s Bronte village and the
midtown core. Burlington Hydro i s not forecasting to increase electrical demand at this TS.
This means that under the recommended solution, Burlington Hydro would implement infrastructure that serves growth in Oakville.
However, there may be additional benefits to Burlington Hydro as a result of transferring load from Bronte TS to Tremaine TS. Tremaine TS is a relatively new Hydro One Transmission
owned station, currently only loaded at 45% of rated capacity. Transferring this load should
contribute to Burlington Hydro’s outstanding “true-up” charges. Determining the amount of relief which Burlington Hydro could expect from this transfer would require a detailed
evaluation of the Connection Cost Recovery Agreement (“CCRA”) in place between the two parties, in particular, as related to the Tremaine and Bronte stations. This evaluation should
consider the nature and circumstances of the transfer, namely, would the transfer be on a
permanent basis, or only occur during high load periods (seasonal transfer) or following the loss of a circuit when load is high (emergency transfer). It is the IESO’s view that seasonal or
emergency transfers would provide value to local customers by addressing the Bronte TS
Page 45 of 50
capacity needs in a least cost manner, and should therefore be given consideration when revising true up agreements.
In discussing implementation considerations, Burlington Hydro has indicated that it is concerned about longer-term growth in the Bronte TS service area impacting future costs. As a
result, Burlington Hydro is concerned with relinquishing capacity at Bronte TS on a permanent
basis. As part of the implementation Burlington Hydro has proposed a long-term (ie, 10 year) lease arrangement. Details related to implementation will be developed as part of the RIP.
The IESO has committed to working with the affected parties to assist with any regulatory matters which may arise, including providing rationale for the attribution of costs among the
benefiting entities.
Page 46 of 50
8. Long-Term Plan
Based on the electrical demand forecasts provided by Burlington Hydro and Oakville Hydro,
implementation of the recommended near-term plan is expected to address long-term needs in the Bronte Sub-region until the early 2030s.Due to the inherent uncertainty associated with
producing long-term load forecasts, there is potential that additional load could materialize
within the Bronte TS service territory, potentially exceeding the load meeting capability. The solutions available to address this potential risk are dependent on the magnitude and pace of
the longer-term electrical demand which may materialize.
If the magnitude and pace of growth in electrical demand is moderate in nature (up to 1.5% per
year gross), it is likely that the needs over the next 20 years will be small and manageable. The
anticipated needs (small in scale, spread out over many customers, and driven more by intensification than by significant new greenfield developments) are well suited to community
driven solutions. This may include implementation of local distributed energy resource projects (such as small scale CHP, solar and/or storage technologies) or targeted conservation initiatives
that contribute to peak demand reduction (such as DR programs). Identifying potential
candidate projects or initiatives should be part of the ongoing planning and engagement process between the Working Group, local communities/ municipalities, and other stakeholders
in the area. The development of local Community Energy Plans provide a valuable resource for aligning the local electricity needs with municipal goals and objectives, where appropriate.
In the event that the magnitude and pace of growth in electrical demand is higher (over 2% per year gross), an infrastructure solution may be required. Such increased demand could be the
result of a single new customer (such as a data centre), changing demand profiles of existing
customers (for example, as a result of widespread adoption of electrification technologies), or a combination of these factors. Higher long-term electrical demand within the Bronte Sub-region
could also result from the return of the 15 MW transfer to Bronte TS, due to changed operational circumstances. This would trigger an alternative long-term infrastructure solution
to serve the anticipated 15 MW of incremental Oakville Hydro growth (Burlington Hydro load
would be returned to its present level). Oakville Hydro has indicated that distribution transfers from Bronte TS are not feasible at this time, but this assumption may need to be revisited in the
future as changes to system configurations may occur in the interim. Assuming distribution transfers are not feasible, a likely alternative solution would be to upgrade the transmission line
supplying Bronte TS.
Page 47 of 50

The Working Group will work with the local communities to monitor leading indicators for growth in the Bronte Sub-region. This includes monitoring changes to growth targets, the
composition and location of specific customer segments (residential, commercial, industrial) and effects on electricity related to the implementation of community energy plans. If these or
other factors impact service reliability or capacity of the local electricity delivery systems a new
IRRP process may be initiated ahead of the 5 year planning cycle. The potential for other measures, such as incremental DG or DR programs, will continue to be discussed through
engagement with local municipalities, and in particular as the nature of the long-term needs, alternatives, and associated costs become clearer.
Page 48 of 50
9. Engagement Activities
Keeping communities up-to-date on regional electricity planning is important. For the Bronte
IRRP, this included meetings with the City of Burlington and the Town of Oakville to share the needs identified in the regional plan and the actions being undertaken by the IESO,
Transmission Company and LDCs to ensure a reliable and economic level of service is maintained. The meetings also provided an opportunity to begin discussions with the
municipalities on planning for the longer term. While no longer-term needs have been identified for the Bronte Sub-region in this planning cycle, discussions that take place now on
community energy planning and municipal sustainability initiatives will help to inform future
electricity plans and bring all of these processes closer together.
While this dialogue for the longer-term continues with municipalities and communities, and as
future planning initiatives unfold, the Working Group will engage in accordance with the established community engagement principles.13 Any updates will be posted on the dedicated
Bronte planning webpage14 on the IESO website. Since the Bronte planning area includes part
of the broader Burlington to Nanticoke, and the GTA West planning regions, updates will be sent to all subscribers who have requested updates on these regions.
13 http://www.ieso.ca/Pages/Participate/Regional-Planning/default.aspx
14 http://www.ieso.ca/Pages/Ontario%27s-Power-System/Regional-Planning/Burlington-to-Nanticoke/Bronte.aspx
Page 49 of 50
10. Conclusion
This report documents an IRRP that has been carried out for the Bronte area, a sub-region of the
OEB’s Burlington-Nanticoke planning region. The IRRP identifies electricity needs in the Bronte Sub-region over the 20-year period from 2015-2034, identifies a preferred “wires”
solution to address near-term needs, and lays out actions to monitor, defer, and address needs
that may arise in the long term.
In order to further refine and implement the preferred near-term “wires” solution, it is
recommended that an RIP be initiated. The RIP is to be led by Hydro One Transmission and include Burlington Hydro and Oakville Hydro as working group members.
The IESO will continue to provide support throughout the RIP process, and assist with any
regulatory matters which may arise as challenges to plan implementation.
The Bronte Sub-region Working Group will continue to meet at regular intervals to monitor
developments in the sub-region and to track progress toward the plan deliverables. In particular, the actions and deliverables associated with peak demand reducing initiatives will
require annual review of system demand and program achievement to determine whether new
initiatives are required. In the event that underlying assumptions change significantly, local plans may be revisited through an amendment, or by initiating a new regional planning cycle
sooner than the OEB-mandated 5-year schedule.
Page 50 of 50