Embed Size (px)
Citation preview

Brocade Communications Systems, Inc.130 Holger Way, San Jose, CA 95134www.brocade.com
Notice of 2011 Annual Meeting of Stockholders, Proxy Statement, and Annual Report on Form 10-Kfor the Fiscal Year Ended October 30, 2010.
Meeting Date:April 12, 2011


Brocade Communications Systems, Inc.130 Holger Way, San Jose, CA 95134www.brocade.com
To the Stockholders of Brocade Communications Systems, Inc.:
You are cordially invited to attend the 2011 Annual Meeting of Stockholders (the “Annual Meeting”) ofBrocade Communications Systems, Inc. (“Brocade” or the “Company”) to be held on April 12, 2011, at3:00 p.m. Pacific Time, at our corporate offices located at 130 Holger Way, San Jose, California 95134. At theAnnual Meeting, we will ask you to consider the following proposals:
• To elect three directors;
• To approve the non-binding advisory resolution regarding executive compensation;
• To approve the non-binding advisory resolution regarding the frequency of the non-binding vote onexecutive compensation; and
• To ratify the appointment of KPMG LLP as our independent registered public accountants for the fiscalyear ending October 29, 2011.
Stockholders of record as of February 18, 2011 may vote at the Annual Meeting.
Your vote is important. Whether or not you plan to attend the meeting in person, it is important that yourshares be represented. Please vote as soon as possible.
Sincerely,
Dave House Michael KlaykoChairman of the Board Chief Executive Officer


Brocade Communications Systems, Inc.130 Holger Way, San Jose, CA 95134www.brocade.com
NOTICE OF ANNUALMEETING OF STOCKHOLDERSTO BE HELD ON APRIL 12, 2011
On April 12, 2011, Brocade Communications Systems, Inc. will hold its 2011 Annual Meeting ofStockholders at 3:00 p.m. Pacific Time. The meeting will be held at Brocade’s corporate offices located at 130Holger Way, San Jose, California 95134 for the following purposes:
• to elect John Gerdelman, Glenn Jones and Michael Klayko as directors;
• to approve the non-binding advisory resolution regarding executive compensation;
• to approve the non-binding advisory resolution regarding the frequency of the non-binding vote onexecutive compensation;
• to ratify the appointment of KPMG LLP as our independent registered public accountants for the fiscalyear ending October 29, 2011; and
• to transact such other business that may properly come before the meeting or at any adjournment orpostponement thereof.
More information about these business items is described in the proxy statement accompanying this notice.Any of the above matters may be considered at the Annual Meeting at the date and time specified above or at anadjournment or postponement of such meeting.
Your vote is important. Whether or not you plan to attend the meeting in person, it is important that yourshares be represented. To ensure that your vote is counted at the meeting, please vote as soon as possible.
For Brocade’s Board of Directors,
Tyler WallVice President, General Counsel andCorporate Secretary
San Jose, CaliforniaFebruary 23, 2011
YOUR VOTE IS IMPORTANT.
WHETHER OR NOT YOU PLAN TO ATTEND THE MEETING, PLEASE COMPLETE,SIGN, DATE AND RETURN THE PROXY CARD OR VOTING INSTRUCTION CARD ASINSTRUCTED OR VOTE BY TELEPHONE OR USING THE INTERNET AS INSTRUCTED ONTHE PROXY CARD, VOTING INSTRUCTION CARD OR THE NOTICE OF INTERNETAVAILABILITY OF PROXYMATERIALS.

TABLE OF CONTENTS
Page
QUESTIONS AND ANSWERS ABOUT THE PROXY MATERIALS AND OUR ANNUALMEETING . . . . . . . . . . . . . . . . . . . . . . . . . . . . . . . . . . . . . . . . . . . . . . . . . . . . . . . . . . . . . . . . . . . . . . . . . . 1
BOARD OF DIRECTORS MEETINGS AND COMMITTEES . . . . . . . . . . . . . . . . . . . . . . . . . . . . . . . . . . . 7Information About the Directors and Nominees . . . . . . . . . . . . . . . . . . . . . . . . . . . . . . . . . . . . . . . . . . . 7Committees of the Board of Directors . . . . . . . . . . . . . . . . . . . . . . . . . . . . . . . . . . . . . . . . . . . . . . . . . . . 10Compensation Committee Interlocks and Insider Participation . . . . . . . . . . . . . . . . . . . . . . . . . . . . . . . . 13Annual Meeting Attendance . . . . . . . . . . . . . . . . . . . . . . . . . . . . . . . . . . . . . . . . . . . . . . . . . . . . . . . . . . . 13Communications with the Board of Directors . . . . . . . . . . . . . . . . . . . . . . . . . . . . . . . . . . . . . . . . . . . . . 13Code of Ethics . . . . . . . . . . . . . . . . . . . . . . . . . . . . . . . . . . . . . . . . . . . . . . . . . . . . . . . . . . . . . . . . . . . . . . 13Board Leadership and Role in Risk Oversight . . . . . . . . . . . . . . . . . . . . . . . . . . . . . . . . . . . . . . . . . . . . . 14Director Compensation . . . . . . . . . . . . . . . . . . . . . . . . . . . . . . . . . . . . . . . . . . . . . . . . . . . . . . . . . . . . . . . 14
SECURITY OWNERSHIP OF CERTAIN BENEFICIAL OWNERS AND MANAGEMENT . . . . . . . . . . 18PROPOSAL ONE: ELECTION OF DIRECTORS . . . . . . . . . . . . . . . . . . . . . . . . . . . . . . . . . . . . . . . . . . . . . 20
Nominees . . . . . . . . . . . . . . . . . . . . . . . . . . . . . . . . . . . . . . . . . . . . . . . . . . . . . . . . . . . . . . . . . . . . . . . . . 20Vote Required . . . . . . . . . . . . . . . . . . . . . . . . . . . . . . . . . . . . . . . . . . . . . . . . . . . . . . . . . . . . . . . . . . . . . . 20
PROPOSAL TWO: ADVISORY VOTE ON EXECUTIVE COMPENSATION . . . . . . . . . . . . . . . . . . . . . . 21Vote Required . . . . . . . . . . . . . . . . . . . . . . . . . . . . . . . . . . . . . . . . . . . . . . . . . . . . . . . . . . . . . . . . . . . . . . 22
PROPOSAL THREE: ADVISORY VOTE ON FREQUENCY OF RESOLUTION ON EXECUTIVECOMPENSATION . . . . . . . . . . . . . . . . . . . . . . . . . . . . . . . . . . . . . . . . . . . . . . . . . . . . . . . . . . . . . . . . . . . . 23Vote Required . . . . . . . . . . . . . . . . . . . . . . . . . . . . . . . . . . . . . . . . . . . . . . . . . . . . . . . . . . . . . . . . . . . . . . 23
PROPOSAL FOUR: RATIFICATION OF SELECTION OF INDEPENDENT REGISTERED PUBLICACCOUNTANTS . . . . . . . . . . . . . . . . . . . . . . . . . . . . . . . . . . . . . . . . . . . . . . . . . . . . . . . . . . . . . . . . . . . . . 24Fees Billed by KPMG LLP During Fiscal Years 2010 and 2009 . . . . . . . . . . . . . . . . . . . . . . . . . . . . . . . 24Vote Required . . . . . . . . . . . . . . . . . . . . . . . . . . . . . . . . . . . . . . . . . . . . . . . . . . . . . . . . . . . . . . . . . . . . . . 25
EXECUTIVE OFFICERS . . . . . . . . . . . . . . . . . . . . . . . . . . . . . . . . . . . . . . . . . . . . . . . . . . . . . . . . . . . . . . . . 26EXECUTIVE COMPENSATION AND OTHER MATTERS . . . . . . . . . . . . . . . . . . . . . . . . . . . . . . . . . . . . 28
Compensation Discussion and Analysis . . . . . . . . . . . . . . . . . . . . . . . . . . . . . . . . . . . . . . . . . . . . . . . . . . 30Executive Compensation Philosophy and Objectives . . . . . . . . . . . . . . . . . . . . . . . . . . . . . . . . . . . . . . . 30Governance of Our Executive Compensation Program . . . . . . . . . . . . . . . . . . . . . . . . . . . . . . . . . . . . . . 33Fiscal 2010 Compensation Components and Decisions for NEOs . . . . . . . . . . . . . . . . . . . . . . . . . . . . . 34Base Salary . . . . . . . . . . . . . . . . . . . . . . . . . . . . . . . . . . . . . . . . . . . . . . . . . . . . . . . . . . . . . . . . . . . . . . . . 34Annual Cash Incentives (Executive Leadership Plan) . . . . . . . . . . . . . . . . . . . . . . . . . . . . . . . . . . . . . . . 34Cash Compensation . . . . . . . . . . . . . . . . . . . . . . . . . . . . . . . . . . . . . . . . . . . . . . . . . . . . . . . . . . . . . . . . . 37Long-Term Equity Incentives . . . . . . . . . . . . . . . . . . . . . . . . . . . . . . . . . . . . . . . . . . . . . . . . . . . . . . . . . . 37Benefits and Perquisites . . . . . . . . . . . . . . . . . . . . . . . . . . . . . . . . . . . . . . . . . . . . . . . . . . . . . . . . . . . . . . 38Post-Employment Compensation Arrangements . . . . . . . . . . . . . . . . . . . . . . . . . . . . . . . . . . . . . . . . . . . 38Reasonableness of Compensation . . . . . . . . . . . . . . . . . . . . . . . . . . . . . . . . . . . . . . . . . . . . . . . . . . . . . . 39Other Compensation Policies . . . . . . . . . . . . . . . . . . . . . . . . . . . . . . . . . . . . . . . . . . . . . . . . . . . . . . . . . . 39Tax and Accounting Considerations . . . . . . . . . . . . . . . . . . . . . . . . . . . . . . . . . . . . . . . . . . . . . . . . . . . . . 39Compensation and Risk . . . . . . . . . . . . . . . . . . . . . . . . . . . . . . . . . . . . . . . . . . . . . . . . . . . . . . . . . . . . . . 40Compensation Committee Report . . . . . . . . . . . . . . . . . . . . . . . . . . . . . . . . . . . . . . . . . . . . . . . . . . . . . . 41Summary Compensation Table . . . . . . . . . . . . . . . . . . . . . . . . . . . . . . . . . . . . . . . . . . . . . . . . . . . . . . . . 422010 Grants of Plan-Based Awards . . . . . . . . . . . . . . . . . . . . . . . . . . . . . . . . . . . . . . . . . . . . . . . . . . . . . 44Outstanding Equity Awards at 2010 Fiscal Year End . . . . . . . . . . . . . . . . . . . . . . . . . . . . . . . . . . . . . . . 45Option Exercises and Stock Vested in Fiscal Year 2010 . . . . . . . . . . . . . . . . . . . . . . . . . . . . . . . . . . . . . 47Employment, Change of Control and Severance Arrangements . . . . . . . . . . . . . . . . . . . . . . . . . . . . . . . 482010 Potential Payments upon Termination or Change in Control . . . . . . . . . . . . . . . . . . . . . . . . . . . . . 49Equity Compensation Plan Information . . . . . . . . . . . . . . . . . . . . . . . . . . . . . . . . . . . . . . . . . . . . . . . . . . 50
SECTION 16(a) BENEFICIAL OWNERSHIP REPORTING COMPLIANCE . . . . . . . . . . . . . . . . . . . . . . . 51CERTAIN RELATIONSHIPS AND RELATED TRANSACTIONS . . . . . . . . . . . . . . . . . . . . . . . . . . . . . . . 51AUDIT COMMITTEE REPORT . . . . . . . . . . . . . . . . . . . . . . . . . . . . . . . . . . . . . . . . . . . . . . . . . . . . . . . . . . . 52OTHER BUSINESS . . . . . . . . . . . . . . . . . . . . . . . . . . . . . . . . . . . . . . . . . . . . . . . . . . . . . . . . . . . . . . . . . . . . . 53HOUSEHOLDING . . . . . . . . . . . . . . . . . . . . . . . . . . . . . . . . . . . . . . . . . . . . . . . . . . . . . . . . . . . . . . . . . . . . . . 53INCORPORATION BY REFERENCE . . . . . . . . . . . . . . . . . . . . . . . . . . . . . . . . . . . . . . . . . . . . . . . . . . . . . . 53


BROCADE COMMUNICATIONS SYSTEMS, INC.
PROXY STATEMENT FOR 2011 ANNUALMEETING OF STOCKHOLDERS
Brocade’s Board of Directors (the “Board”) is providing these proxy materials to you for use in connectionwith the 2011 Annual Meeting of Stockholders to be held on April 12, 2011 at 3:00 p.m. Pacific Time, and at anypostponement or adjournment of the meeting. The Annual Meeting will be held at our offices located at 130Holger Way, San Jose, California 95134. Stockholders of record as of February 18, 2011 (the “Record Date”) areinvited to attend the Annual Meeting and are asked to vote on the proposals described in this proxy statement.
The Notice of Internet Availability (the “Notice”) was first mailed on or about February 28, 2011 tostockholders of record as of the Record Date, and these proxy solicitation materials combined with the AnnualReport on Form 10-K for the fiscal year ended October 30, 2010, including financial statements, were first madeavailable to you on the Internet, on or about February 28, 2011. Our principal executive offices are located at 130Holger Way, San Jose, California 95134, and our telephone number is (408) 333-8000. We maintain a website atwww.brocade.com. The information on our website is not a part of this Proxy Statement.
QUESTIONS AND ANSWERS ABOUT THE PROXYMATERIALSAND OUR ANNUALMEETING
Q: What is the purpose of the Annual Meeting?
A: To vote on the following proposals:
• to elect John Gerdelman, Glenn Jones and Michael Klayko as directors;
• to approve the non-binding advisory resolution regarding executive compensation;
• to approve the non-binding advisory resolution regarding the frequency of the non-binding vote onexecutive compensation; and
• to ratify the appointment of KPMG LLP as our independent registered public accountants for the fiscalyear ending October 29, 2011.
To transact such other business that may properly come before the Annual Meeting or at any adjournment orpostponement thereof.
Q: How does the Board of Directors recommend I vote on these proposals?
A: The Board recommends a vote:
• FOR the election of John Gerdelman, Glenn Jones and Michael Klayko as directors;
• FOR the proposal on the non-binding advisory resolution regarding executive compensation;
• FOR the vote every two years in the non-binding advisory resolution regarding the frequency of thenon-binding vote regarding executive compensation; and
• FOR the ratification of the appointment of KPMG LLP as our independent registered public accountantsfor the fiscal year ending October 29, 2011.
Q: Why did I receive a one-page notice in the mail regarding the Internet availability of proxy materialsthis year instead of a full set of proxy materials?
A: Pursuant to the rules of the Securities and Exchange Commission (the “SEC”), we have provided access toour proxy materials over the Internet. Accordingly, we are sending the Notice to our stockholders of recordand beneficial owners as of the Record Date. Instructions on how to access the proxy materials over the
1

Internet or to request a printed copy by mail may be found on the Notice. In addition, the Notice providesinformation on how stockholders may request to receive proxy materials in printed form by mail orelectronically by email on an ongoing basis.
Q: Who is making this solicitation?
A: This proxy is being solicited on behalf of Brocade’s Board of Directors.
Q: Who is entitled to vote at the meeting?
A: Stockholders Entitled to Vote. Stockholders who our records show owned shares of Brocade as of theclose of business on the Record Date may vote at the Annual Meeting. On the Record Date, we had a totalof 471,379,760 shares of Brocade common stock (“Common Stock”) issued and outstanding, which wereheld of record by approximately 1,377 stockholders and no shares of preferred stock were outstanding. Eachshare of Common Stock is entitled to one vote. The stock transfer books will not be closed between theRecord Date and the date of the Annual Meeting.
Registered Stockholders. If your shares are registered directly in your name with Brocade’s transfer agent,you are considered the stockholder of record with respect to those shares, and the Notice was provided toyou directly by Brocade. As the stockholder of record, you have the right to grant your voting proxy directlyto the individuals listed on the proxy card or to vote in person at the Annual Meeting.
Street Name Stockholders. If your shares are held in a stock brokerage account or by a bank or othernominee, you are considered the beneficial owner of shares held in street name and the Notice wasforwarded to you by your broker or nominee, who is considered, with respect to those shares, thestockholder of record. As the beneficial owner, you have the right to direct your broker or nominee how tovote your shares. Beneficial owners are also invited to attend the Annual Meeting. However, since you arenot the stockholder of record, you may not vote your shares in person at the Annual Meeting unless youfollow your broker’s procedures for obtaining a legal proxy. If you request a printed copy of the proxymaterials by mail, your broker or nominee will provide a voting instruction card for you to use.
Q: Can I attend the meeting in person?
A: You are invited to attend the Annual Meeting if you are a registered stockholder or a street namestockholder as of the Record Date. In addition, you must also present a form of photo identificationacceptable to us, such as a valid driver’s license or passport.
Q: How can I get electronic access to the proxy materials?
A: The Notice will provide you with instructions regarding how to:
• view our proxy materials for the Annual Meeting on the Internet; and
• request us to send our future proxy materials to you by mail or by email.
By accessing the proxy materials on the Internet or choosing to receive your future proxy materials byemail, you will save us the cost of printing and mailing documents to you and will reduce the impact of ourannual stockholders’ meetings on the environment. If you choose to receive future proxy materials by email,you will receive an email next year with instructions containing a link to those materials and a link to theproxy voting site. If you choose to receive future proxy materials by mail, you will receive a paper copy ofthose materials, including a form of proxy. Your election to receive proxy materials by mail or email willremain in effect until you notify us that you are terminating your request.
Q: How can I vote my shares?
A: Registered Stockholders: Registered stockholders may vote in person at the Annual Meeting or by one ofthe following methods:
• By Mail. If you requested printed copies of the proxy materials to be mailed to you, you can complete,sign and date the proxy card and return it in the prepaid envelope provided;
2

• By Telephone. Call the toll-free telephone number on the Notice and follow the recorded instructions; or
• By Internet. Access Brocade’s secure website registration page through the Internet, as identified on theNotice, and follow the instructions.
Please note that the Internet and telephone voting facilities for registered stockholders will close at11:59 PM Eastern Time on April 11, 2011.
Street Name Stockholders: If your shares are held by a broker, bank or other nominee, you should havereceived instructions on how to vote or instruct the broker to vote your shares from your broker, bank orother nominee. Please follow their instructions carefully. Also, please note that if the holder of record ofyour shares is a broker, bank or other nominee and you wish to vote at the Annual Meeting, you mustrequest a legal proxy from the bank, broker or other nominee that holds your shares and present that proxyand proof of identification at the Annual Meeting to vote your shares.
Street name stockholders may generally vote by one of the following methods:
By Mail. If you requested printed copies of the proxy materials to be mailed to you, you may vote bysigning, dating and returning your voting instruction card in the enclosed pre-addressed envelope;
By Methods Listed on Voting Instruction Card. Please refer to your voting instruction card or otherinformation provided by your bank, broker or other holder of record to determine whether you may voteby telephone or electronically on the Internet, and follow the instructions on the voting instruction card orother information provided by the record holder; or
In Person With a Proxy from the Record Holder. A street name stockholder who wishes to vote at theAnnual Meeting will need to obtain a legal proxy from his or her bank or brokerage firm. Please consultthe voting instruction card provided to you by your bank or broker to determine how to obtain a legalproxy in order to vote in person at the Annual Meeting.
Q: If I submit a proxy, how will it be voted?
A: When proxies are properly dated, executed and returned, the shares represented by such proxies will bevoted at the Annual Meeting in accordance with the instructions of the stockholder. If no specificinstructions are given, however, the shares will be voted in accordance with the recommendations of ourBoard of Directors as described above. If any matters not described in the Proxy Statement are properlypresented at the Annual Meeting, the proxy holders will use their own judgment to determine how to voteyour shares. If the Annual Meeting is adjourned, the proxy holders can vote your shares on the new meetingdate as well, unless you have revoked your proxy instructions, as described below under “Can I change myvote?”
Q: Can I change my vote?
A: You may change your vote at any time prior to the vote at the Annual Meeting. To revoke your proxyinstructions and change your vote if you are a holder of record, you must (i) attend the Annual Meeting andvote your shares in person, (ii) advise our Corporate Secretary at our principal executive office (130 HolgerWay, San Jose, California 95134) in writing before the proxy holders vote your shares, (iii) deliver laterdated and signed proxy instructions (which must be received prior to the Annual Meeting) or (iv) vote againon a later date on the Internet or by telephone (only your latest Internet or telephone proxy submitted priorto the Annual Meeting will be counted).
Q: What happens if I decide to attend the Annual Meeting but I have already voted or submitted a proxycovering my shares?
A: You may attend the meeting and vote in person even if you have already voted or submitted a proxy. Pleasebe aware that attendance at the Annual Meeting will not, by itself, revoke a proxy. If a bank, broker or othernominee holds your shares and you wish to attend the Annual Meeting and vote in person, you must obtain alegal proxy from the record holder of the shares giving you the right to vote the shares.
3
Q: What quorum is required for the Annual Meeting?
A: At the Annual Meeting, the presence in person or by proxy of a majority of the outstanding shares ofCommon Stock entitled to vote at the Annual Meeting is required for the Annual Meeting to proceed. If youhave returned valid proxy instructions or attend the Annual Meeting in person, your Common Stock will becounted for the purpose of determining whether there is a quorum, even if you wish to abstain from votingon some or all matters at the meeting.
Q: How are votes counted?
A: Each share of our common stock outstanding on the Record Date is entitled to one vote on each of the threedirector nominees and one vote on each other matter.
Each director is elected by a majority of the votes cast at the annual meeting (i.e., the number of sharesvoted “for” a director nominee must exceed the number of votes cast “against” that nominee), except in thecase of a contested election. If a nominee who is currently serving as a director is not elected at the AnnualMeeting, under Delaware law the director will continue to serve on the Board as a “holdover director.”However, as a condition to re-nomination, incumbent directors are required to submit a resignation of theirdirectorships in writing to the Chairman of the Nominating and Corporate Governance Committee of theBoard. The resignation will become effective only if the director fails to receive a majority of votes cast forre-election and the Board accepts the resignation. In the event of a contested election in accordance with ourbylaws, as amended (“Bylaws”), directors shall be elected by the vote of a plurality of the votes cast.Abstentions and broker non-votes will have no effect on the outcome of the vote.
Approval of the advisory resolution on executive compensation requires the approval of a majority of theshares represented in person or by proxy and entitled to vote at the Annual Meeting. Abstentions are treatedas shares represented in person or by proxy and entitled to vote at the Annual Meeting and, therefore, willhave the same effect as a vote “Against” the proposal. Broker non-votes will have no effect on the outcomeof the vote. For purposes of the proposal regarding the frequency of the non-binding vote on executivecompensation, the option of one year, two years or three years that receives the highest number of votes castby stockholders will be the frequency for the advisory vote on executive compensation that has beenselected by stockholders. Abstentions and broker non-votes will have no effect on the outcome of the vote.However, because each of these is an advisory vote, the result will not be binding on the Company’s Boardor the Company. The Board and/or subcommittee of the Board will consider the outcome of the vote whendetermining how often the Company should submit to stockholders an advisory vote to approve thecompensation of its named executive officers included in the Company’s proxy statement.
The ratification of independent registered public accountants requires the affirmative vote of a majority ofshares present in person or represented by proxy and entitled to vote on such proposal. Abstentions aretreated as shares present and entitled to vote for purposes of such proposal and, therefore, will have the sameeffect as a vote “against” the proposal. Broker non-votes will have no effect on the outcome of the vote.
Q: What are broker non-votes?
A: Broker non-votes are shares held by brokers that do not have discretionary authority to vote on the matterand have not received voting instructions from their clients. If your broker holds your shares in its name andyou do not instruct your broker how to vote, your broker will nevertheless have discretion to vote yourshares on our sole “routine” matter — the ratification of the appointment of the Company’s independentregistered public accounting firm. Your broker will not have discretion to vote on the following “non-routine” matters absent direction from you: the election of directors, an advisory vote on executivecompensation and an advisory vote on the frequency of holding an advisory vote on executivecompensation.
Q: Who will tabulate the votes?
A: Brocade has designated a representative of Wells Fargo Shareowner Services as the Inspector of Electionwho will tabulate the votes.
4

Q: Who pays for the proxy solicitation process?
A: Brocade will pay the cost of preparing, assembling, printing, mailing and distributing these proxy materialsand soliciting votes. We have retained Alliance Advisors to assist with the solicitation for an estimated feeof $5,500, plus reasonable out-of-pocket expenses. We may, on request, reimburse brokerage firms andother nominees for their expenses in forwarding proxy materials to beneficial owners. In addition tosoliciting proxies by mail, we expect that our directors, officers and employees may solicit proxies in personor by telephone or facsimile. None of these individuals will receive any additional or special compensationfor doing this, although we will reimburse these individuals for their reasonable out-of-pocket expenses.
Q: May I propose actions for consideration at next year’s annual meeting of stockholders or nominateindividuals to serve as directors?
A: You may present proposals for action at a future meeting or submit nominations for election of directorsonly if you comply with the requirements of the proxy rules established by the SEC and our Bylaws, asapplicable. In order for a stockholder proposal to be included in our proxy statement and form of proxyrelating to the meeting for our 2012 Annual Meeting of Stockholders under rules set forth in the SecuritiesExchange Act of 1934, as amended (the “Exchange Act”), the proposal must be received by us no later thanOctober 31, 2011. If a stockholder intends to submit a proposal that is not intended to be included in ourproxy statement, or a nomination for director for our 2012 Annual Meeting of Stockholders, the stockholdermust give us notice in accordance with the requirements set forth in our Bylaws no later than the 45th dayand no earlier than the 75th day prior to the anniversary of the mailing of the proxy statement for the 2011Annual Meeting. If the date of the 2012 Annual Meeting is more than 30 days before or more than 60 daysafter such anniversary date, notice by the stockholder must be received no earlier than 90 days prior to the2012 Annual Meeting and no later than the later of (i) the 60th day prior to the date of the 2012 AnnualMeeting or (ii) the 10th day following the date on which public announcement of the date of the 2012Annual Meeting is first made by Brocade. Our Bylaws require that certain information andacknowledgments with respect to the proposal or the nominee, applicable, and the stockholder making theproposal or the nomination be set forth in the notice. Our Bylaws have been publicly filed with the SEC andcan also be found on our website at www.brocade.com in the Corporate Governance section of our investorrelations webpage.
Q: What should I do if I get more than one proxy or voting instruction card?
A: Stockholders may receive more than one set of voting materials, including multiple copies of the Notice,these proxy materials and multiple proxy cards or voting instruction cards. For example, stockholders whohold shares in more than one brokerage account may receive separate Notices for each brokerage account inwhich shares are held. Stockholders of record whose shares are registered in more than one name willreceive more than one Notice. You should vote in accordance with all of the Notices you receive relating toour Annual Meeting to ensure that all of your shares are voted.
Q: How do I obtain a separate set of proxy materials or request a single set for my household?
A: We have adopted a procedure approved by the SEC called “householding.” Under this procedure,stockholders who have the same address and last name and do not participate in electronic delivery of proxymaterials will receive only one copy of our annual report and proxy statement unless one or more of thesestockholders notifies us that they wish to continue receiving individual copies. This procedure reduces ourprinting costs and postage fees. Each stockholder who participates in householding will continue to be ableto access or receive a separate proxy card.
If you wish to receive a separate Notice, proxy statement or annual report at this time, please request theadditional copy by contacting our transfer agent, Wells Fargo Shareowner Services, by telephone at800-468-9716, or by facsimile at 651-450-4033. If any stockholders in your household wish to receive aseparate annual report and a separate proxy statement in the future, they may call our Investor Relations
5

group at 408-333-4000 or write to Investor Relations, Brocade Communications Systems, Inc., 130 HolgerWay, San Jose, CA 95134. They may also send an email to our Investor Relations Group at [email protected]. Other stockholders who have multiple accounts in their names or who share anaddress with other stockholders can authorize us to discontinue mailings of multiple annual reports andproxy statements by calling or writing to Investor Relations.
Q: What if I have questions about lost stock certificates or need to change my mailing address?
A: You may contact our transfer agent, Wells Fargo Shareowner Services, by telephone at 800-468-9716, or byfacsimile at 651-450-4033, if you have lost your stock certificate or need to change your mailing address.
6

BOARD OF DIRECTORS MEETINGS AND COMMITTEES
The Board of Directors is presently composed of nine members: Judy Bruner, Renato (Renny) A.DiPentima, Alan L. Earhart, John W. Gerdelman, David L. House, Glenn C. Jones, Michael Klayko, L. WilliamKrause, and Sanjay Vaswani. Mr. House serves as Chairman of the Board of Directors. The Board of Directorshas determined that each of the directors other than Mr. Klayko is an independent director within the meaning setforth in the NASDAQ listing rules and as required by the rules and regulations of the SEC, as currently in effect.There are no family relationships between any director and an executive officer.
The Board of Directors held six meetings during fiscal year 2010. The Board also acted three times byunanimous written consent. Each director attended at least 75% of the aggregate number of meetings of ourBoard of Directors and the committees on which such director served during fiscal year 2010.
Information About the Directors and Nominees
The Board of Directors was previously divided into three classes, with each class serving for a three-yearterm. Beginning with our 2011 annual meeting, director nominees that are elected will serve for a one-year termuntil the next annual meeting of stockholders. Set forth below is information regarding our directors and thenominees as of January 20, 2011:
Name Age PositionDirectorSince
Class I Directors whose terms expire at the 2012 Annual MeetingJudy Bruner . . . . . . . . . . . . . . . . . . . . . . . . . . . . . . . . . . . . . . . . . . . . . . . . . . . . 52 Director 2009David L. House . . . . . . . . . . . . . . . . . . . . . . . . . . . . . . . . . . . . . . . . . . . . . . . . . 67 Chairman 2004L. William Krause . . . . . . . . . . . . . . . . . . . . . . . . . . . . . . . . . . . . . . . . . . . . . . . 68 Director 2004
Class II Directors whose terms expire at the 2013 Annual MeetingRenato (Renny) A. DiPentima . . . . . . . . . . . . . . . . . . . . . . . . . . . . . . . . . . . . . . 70 Director 2007Alan L. Earhart . . . . . . . . . . . . . . . . . . . . . . . . . . . . . . . . . . . . . . . . . . . . . . . . . 67 Director 2009Sanjay Vaswani . . . . . . . . . . . . . . . . . . . . . . . . . . . . . . . . . . . . . . . . . . . . . . . . . 51 Director 2004
Class III Directors whose terms expire at the 2011 Annual MeetingJohn W. Gerdelman . . . . . . . . . . . . . . . . . . . . . . . . . . . . . . . . . . . . . . . . . . . . . . 58 Director 2007Glenn C. Jones . . . . . . . . . . . . . . . . . . . . . . . . . . . . . . . . . . . . . . . . . . . . . . . . . . 65 Director 2006Michael Klayko . . . . . . . . . . . . . . . . . . . . . . . . . . . . . . . . . . . . . . . . . . . . . . . . . 56 CEO and Director 2005
Business Experience and Qualifications of Directors
Nominees — Terms Would Expire at the 2012 Annual Meeting if Elected at the Upcoming Annual Meeting
John W. Gerdelman has served as a director since January 2007 when he was appointed to the Board inconnection with Brocade’s acquisition of McDATA Corporation. Since January 2004, Mr. Gerdelman has beenthe Chairman of Intelliden Corporation, a company he co-founded that provides software solutions that enablenetworks to operate more intelligently by automating network change management and enforcing business policyin network operations. From April 2002 to December 2003, Mr. Gerdelman was the Chief Executive Officer forMetromedia Fiber Networks. From January 2000 until March 2002, Mr. Gerdelman worked with several newventures as Managing Member of Mortonsgroup LLC. From April 1999 to December 1999, he served as thePresident and CEO of USA.NET. From 1986 until 1999, Mr. Gerdelman held various positions with MCICommunications Corporation in Sales, Marketing, Sales Operations, Network Operations and InformationTechnology, including President of the Network and Information Technology Division and served as CEO ofLong Lines Limited, a startup call center company, and currently serves as a director and president. Beforejoining MCI, Mr. Gerdelman was with Baxter Travenol Corporation in Sales Operations and served in the U.S.Navy as a Naval Aviator. Mr. Gerdelman also currently serves as a director of the following public companies:Sycamore Networks, Inc., an optical switching company, Proxim Wireless Corporation (formerly, TerabeamCorporation), a broadband provider, and Owens & Minor, Inc., a national distributor of medical and surgical
7

supplies and healthcare supply-chain management. During the last five years, he also previously served as adirector for the following public company: APAC Customer Services, Inc. He received his B.S. degree inchemistry from the College of William and Mary, where he now serves on the Board of Visitors.
Mr. Gerdelman’s years of executive leadership and management experience in the high technology industry,his experience in the finance and accounting fields, his service on other public company boards and committees,and his more than four years of service as a director of Brocade make him an invaluable member of our Board ofDirectors.
Glenn C. Jones has served as a director since April 2006. Mr. Jones has served as a business consultant totechnology companies since 1998. Mr. Jones previously served as Chief Financial Officer of Cirrus Logic, Inc. aswell as Chief Financial Officer of PMC-Sierra, Inc. Prior to these public company roles, he was Chief FinancialOfficer for Metaphor Computer Systems, Inc., a privately held company, and served as General Manager ofMetaphor’s computer systems business which was acquired by IBM Corporation. He also was the founding ChiefFinancial Officer and Vice President of Operations for Gain Computer Systems, which was acquired by SybaseCorp. Mr. Jones, a Certified Public Accountant, received a B.S. degree in accounting from the University ofIllinois and an M.B.A. from Golden Gate University.
Mr. Jones’s years of executive leadership and management experience in the high technology industry, hisexperience in the finance and accounting fields, and his more than four years of service as a director of Brocademake him an invaluable member of our Board of Directors.
Michael Klayko has served as our Chief Executive Officer and as a director since January 2005. Prior tothat, he served as Vice President, Worldwide Sales from May 2004 until January 2005. From April 2003 untilMay 2004, Mr. Klayko served as Vice President, Worldwide Marketing and Support, and from January 2003until April 2003, he was Vice President, OEM Sales. From May 2001 to January 2003, Mr. Klayko was ChiefExecutive Officer and President of Rhapsody Networks, a privately held technology company acquired byBrocade. From December 1998 to April 2001, Mr. Klayko served as Executive Vice President of McDATACorporation. From March 1995 to November 1998, Mr. Klayko was Senior Vice President for North AmericanSales at EMC Corporation, a provider of information storage systems products. Mr. Klayko also held variousexecutive sales and marketing positions at Hewlett-Packard Company and IBM Corporation. Mr. Klaykoreceived a B.S. degree in electronic engineering from Ohio Institute of Technology, in Columbus, Ohio.
Mr. Klayko’s more than 30 years of experience in the technology and data networking industries, hisexecutive leadership and management experience in the those same industries and his more than six years ofservice as Chief Executive Officer and a director of Brocade make him an invaluable member of our Board ofDirectors. Mr. Klayko’s qualifications for membership on the Board of Directors also include his vision ofinnovation and expertise in technology, economic competitiveness and tax reform policies that have led him toserve as Vice Chair of the Silicon Valley Leadership Group, a non-profit entity that focuses on issues and policywhich affect companies in the Silicon Valley, and also serve on the board of the Tech Museum in Silicon Valley.
Directors with Terms Continuing After the Annual Meeting
Class II Directors — Terms Expire at the 2013 Annual Meeting
Renato (Renny) A. DiPentima has served as a director since January 2007 when he was appointed to theBoard in connection with Brocade’s acquisition of McDATA Corporation. Dr. DiPentima is the retired Presidentand Chief Executive Officer of SRA International, a provider of technology and strategic consulting services andsolutions, where he served from January 2005 until March 2007. From November 2003 to January 2005, heserved as SRA’s President and Chief Operating Officer. Prior to that, Dr. DiPentima served as Senior VicePresident and President of SRA’s consulting and systems integration division since the division’s formation inJanuary 2001. From July 1997 to January 2001, he served as President of SRA’s government sector, overseeinggovernment business, projects, and contracts. From July 1995 to July 1997, Dr. DiPentima served as Vice
8

President and as SRA’s Chief Information Officer. Prior to joining SRA, Dr. DiPentima held several seniormanagement positions in the U.S. federal government, most recently serving as deputy commissioner for systemsat the Social Security Administration, from May 1990 to June 1995. During the last five years, Dr. DiPentimaalso previously served as a director for the following public company: SRA International, Inc. Dr. DiPentimaalso serves on several governmental and corporate advisory boards. Dr. DiPentima received a B.A. degree fromNew York University, an M.A. degree from George Washington University and a Ph.D. degree from theUniversity of Maryland. He has also completed the program for Senior Managers at the John F. Kennedy Schoolof Government at Harvard University.
Mr. DiPentima’s years of executive leadership and management experience in the high technology industry,his service on other public company boards and committees, and his more than four years of service as a directorof Brocade make him an invaluable member of our Board of Directors.
Alan L. Earhart has served as a director since February 2009. Mr. Earhart served as a member of the Boardof Directors of Foundry Networks, Inc. from August 2003 until December 2008 when Foundry was acquired byBrocade. From 1970 until he retired in 2001, Mr. Earhart held a variety of positions with Coopers & Lybrand andits successor entity, PricewaterhouseCoopers LLP, an accounting and consulting firm, including most recently asthe Managing Partner for PricewaterhouseCoopers’ Silicon Valley office. Mr. Earhart also currently serves as adirector for the following public companies: Rovi Corporation (formerly Macrovision Solutions Corporation) andNetApp, Inc. (formerly Network Appliance, Inc.). During the last five years, Mr. Earhart also previously servedas a director for the following public companies: Quantum Corporation and Monolithic Power Systems, Inc.Mr. Earhart received a B.S. degree in accounting from the University of Oregon.
Mr. Earhart’s years of executive leadership and management experience in the high technology industry, hisexperience in the finance and accounting fields, his service on other public company boards and committees, andhis more than seven years of combined service as a director of Foundry and Brocade make him an invaluablemember of our Board of Directors.
Sanjay Vaswani has served as a director since April 2004. Mr. Vaswani has been a managing partner of theCenter for Corporate Innovation, Inc., a professional services firm, since 1990. From 1987 to 1990 he was withMcKinsey & Company. Prior to that, Mr. Vaswani was employed by Intel Corporation. Mr. Vaswani serves as adirector of Blue Star Infotech Ltd., an Indian publicly traded software services firm. Mr. Vaswani earned a B.A.degree from the University of Texas at Austin and an M.B.A. degree from the Wharton School of Business at theUniversity of Pennsylvania.
Mr. Vaswani’s years of executive leadership and management experience in the high technology industry,his service on other public company boards, and his more than six years of service as a director of Brocade makehim an invaluable member of our Board of Directors.
Class I Directors — Terms Expire at the 2012 Annual Meeting
Judy Bruner has served as a director since January 2009. Ms. Bruner has been the Executive Vice President,Administration and Chief Financial Officer of SanDisk Corporation, a supplier of flash storage products, sinceJune 2004. Ms. Bruner served as Senior Vice President and Chief Financial Officer of Palm, Inc., a provider ofhandheld computing and communications solutions, from September 1999 until June 2004. Prior to Palm, Inc.,Ms. Bruner held financial management positions with 3Com Corporation, Ridge Computers and Hewlett-PackardCompany. Ms. Bruner holds a B.A. degree in economics from the University of California, Los Angeles and anM.B.A. degree from Santa Clara University.
Ms. Bruner’s years of executive leadership and management experience in the high technology industry, herexperience in the finance and accounting fields, and her more than two years of service as a director of Brocademake her an invaluable member of our Board of Directors.
9

David L. House has served as a director since 2004 and as the Chairman of our Board of Directors sinceDecember 2005. From January 2005 through December 2005, he served as Executive Chairman of the Board.Mr. House served as Chairman and Chief Executive Officer of Allegro Networks, a privately held provider ofvoice data and broadband services, from January 2001 until April 2003. Prior to that, he served as President ofNortel Networks Corp. from August 1998 until August 1999. Mr. House joined Nortel Networks Corp. when itwas merged with Bay Networks, Inc., where he served as Chairman of the Board, President and Chief ExecutiveOfficer from October 1996 until August 1998. Mr. House served in senior management positions at IntelCorporation for 23 years. During the last five years, Mr. House also previously served as a director for thefollowing public company: Credence Systems Corporation. Mr. House received a B.S.E.E. degree from MichiganTechnological University and an M.S.E.E. degree from Northeastern University.
Mr. House’s years of executive leadership and management experience in the high technology industry andhis more than seven years of service as a director of Brocade make him an invaluable member of our Board ofDirectors.
L. William Krause has served as a director since 2004. Mr. Krause has been President of LWK Ventures, aprivate investment firm since 1991. In addition, Mr. Krause served as Chairman of the Board of CaspianNetworks, Inc., an IP networking systems provider, from April 2002 to September 2006 and as Chief ExecutiveOfficer from April 2002 until June 2004. From September 2001 to February 2002, Mr. Krause was Chairman andChief Executive Officer of Exodus Communications, Inc. which he guided through Chapter 11 Bankruptcy to asale of assets. He also served as President and Chief Executive Officer of 3Com Corporation, a global datanetworking company, from 1981 to 1990, and as its Chairman from 1987 to 1993 when he retired. Mr. Krausecurrently serves as director for the following public companies: Coherent, Inc., a leading supplier ofPhotonic-based systems, CommScope Inc., a networking infrastructure company and Core-Mark Holdings, Inc.,a distributor of packaged consumer goods. During the last five years, Mr. Krause also previously served as adirector for the following public companies: Sybase, Inc., Packeteer, Inc. and TriZetto Group, Inc. Mr. Krauseholds a B.S. degree in electrical engineering and received an honorary Doctorate of Science from The Citadel.
Mr. Krause’s years of executive leadership and management experience in the high technology industry, hisservice on other public company boards and committees, and his more than six years of service as a director ofBrocade make him an invaluable member of our Board of Directors.
Committees of the Board of Directors
The Board of Directors has the following standing committees: Audit, Compensation, Nominating andCorporate Governance, and Corporate Development. The Board of Directors has adopted a written charter foreach of these committees, copies of which can be found on our website at www.brocade.com in the CorporateGovernance section of our investor relations webpage. In addition, the Board of Directors had established aSpecial Litigation Committee, which was dissolved effective May 31, 2010. The Board of Directors hasdetermined that all members of each committee of the Board of Directors are independent under the applicablerules and regulations of NASDAQ and the SEC, as currently in effect, except Mr. Klayko, who serves asChairman of our Corporate Development Committee.
10

The following chart details the membership of each standing committee as of January 20, 2011 and thenumber of meetings each committee held in fiscal year 2010.
Name of Director Audit Compensation
Nominating &CorporateGovernance
CorporateDevelopment
Judy Bruner . . . . . . . . . . . . . . . . . . . . . . . . . . . . . . . . . . . . . . . . M
Renato A. DiPentima . . . . . . . . . . . . . . . . . . . . . . . . . . . . . . . . . M M
Alan L. Earhart . . . . . . . . . . . . . . . . . . . . . . . . . . . . . . . . . . . . . M
John W. Gerdelman . . . . . . . . . . . . . . . . . . . . . . . . . . . . . . . . . . M M
David L. House . . . . . . . . . . . . . . . . . . . . . . . . . . . . . . . . . . . . . M M M
Glenn C. Jones . . . . . . . . . . . . . . . . . . . . . . . . . . . . . . . . . . . . . . C
Michael Klayko . . . . . . . . . . . . . . . . . . . . . . . . . . . . . . . . . . . . . C
L. William Krause . . . . . . . . . . . . . . . . . . . . . . . . . . . . . . . . . . . M C
Sanjay Vaswani . . . . . . . . . . . . . . . . . . . . . . . . . . . . . . . . . . . . . C M
Number of Meetings in Fiscal 2010 . . . . . . . . . . . . . . . . . . . . . 14 13 5 3M = MemberC = Chair
Audit Committee
The Audit Committee oversees our accounting, financial reporting and audit processes; appoints, determinesthe compensation of, and oversees, the independent registered public accountants; pre-approves audit andnon-audit services provided by the independent registered public accountants; reviews the results and scope ofaudit and other services provided by the independent registered public accountants; reviews the accountingprinciples and practices and procedures used in preparing our financial statements; oversees the Company’sinternal audit function; and reviews our internal controls.
The Audit Committee works closely with management and our independent registered public accountants.The Audit Committee also meets with our independent registered public accountants without members ofmanagement present, on a quarterly basis, following completion of our independent registered publicaccountants’ quarterly reviews and annual audit and prior to our earnings announcements, to review the results oftheir work. The Audit Committee also meets with our independent registered public accountants to approve theannual scope and fees for the audit services to be performed.
The Nominating and Corporate Governance Committee has determined that each of Ms. Bruner andMessrs. Earhart, Jones and Gerdelman is an “audit committee financial expert” as defined by SEC rules, ascurrently in effect.
The Audit Committee Report is included in this proxy statement on page 52. A copy of the AuditCommittee’s written charter is available on our website at www.brocade.com in the Corporate GovernanceSection of our investor relations webpage.
Compensation Committee
The Compensation Committee has overall responsibility for (i) overseeing the Company’s compensationand benefits policies generally; (ii) overseeing, evaluating and approving executive officer and directorcompensation plans, policies and programs; and (iii) reviewing, and discussing with management, theCompensation Discussion and Analysis section of the Company’s annual proxy statement and preparing theCompensation Committee Report that is required by Securities and Exchange Commission rules to be included inthe Company’s annual proxy statement.
11
The Compensation Committee Report is included herein on page 41. A copy of the CompensationCommittee’s written charter is available on our website at www.brocade.com in the Corporate Governancesection of our investor relations webpage.
Nominating and Corporate Governance Committee
The Nominating and Corporate Governance Committee (i) considers and periodically reports on mattersrelating to the identification, selection and qualification of the Board of Directors and candidates nominated tothe Board of Directors and its committees; (ii) develops and recommends governance principles applicable toBrocade; (iii) oversees the evaluation of the Board of Directors and management from a corporate governanceperspective; and (iv) reviews Brocade’s reporting in documents filed with the SEC to the extent related tocorporate governance.
A copy of the Nominating and Corporate Governance Committee’s written charter is available on ourwebsite at www.brocade.com in the Corporate Governance section of our investor relations webpage.
Stockholder Recommendations. The Nominating and Corporate Governance Committee considersproperly submitted stockholder recommendations for candidates for membership on the Board of Directors asdescribed below under “Identification and Evaluation of Nominees for Directors.” In evaluating suchrecommendations, the Nominating and Corporate Governance Committee seeks to achieve a balance ofknowledge, experience and capability on the Board of Directors and to address the membership criteria set forthunder “Director Qualifications.” Any stockholder recommendations submitted for consideration by theNominating and Corporate Governance Committee should include the candidate’s name and qualifications formembership on the Board of Directors and should be addressed to the attention of our Corporate Secretary re:stockholder director recommendation. In addition, procedures for stockholder direct nomination of directors arediscussed in the section titled “Questions and Answers about the Proxy Materials and our Annual Meeting,” andare discussed in detail in our Bylaws, a copy of which is available on the SEC’s EDGAR website at www.sec.govas Exhibit 3.2 to our Form 8-K filed with the SEC on April 13, 2010 and on the investor relations section of ourwebsite at www.brocade.com.
Director Qualifications. The Nominating and Corporate Governance Committee does not have anyspecific, minimum qualifications that must be met by a Nominating and Corporate Governance Committee-recommended nominee, but uses a variety of criteria to evaluate the qualifications and skills necessary formembers of our Board of Directors, including, among others, independence, diversity, skills and experience.Under these criteria, members of the Board of Directors should have the highest professional and personal ethicsand values. A director should have broad experience at the policy-making level in business, government,education, technology or public interest. A director should be committed to enhancing stockholder value andshould have sufficient time to carry out his or her duties, and to provide insight and practical wisdom based ontheir past experience. A director’s service on other boards of public companies should be limited to a number thatpermits him or her, given his or her individual circumstances, to perform responsibly his or her director duties,but no director should serve on more than four additional public company boards. Each director must representthe interests of Brocade stockholders.
Identification and Evaluation of Nominees for Directors. The Nominating and Corporate GovernanceCommittee utilizes a variety of methods for identifying and evaluating nominees for director. The Nominatingand Corporate Governance Committee regularly assesses the appropriate size of the Board of Directors, andwhether any vacancies on the Board of Directors are expected due to retirement or otherwise. In the event thatvacancies are anticipated, or otherwise arise, the Nominating and Corporate Governance Committee considersvarious potential candidates for director. Candidates may come to the attention of the Nominating and CorporateGovernance Committee through current members of the Board of Directors, professional search firms,stockholders or other persons. These candidates are evaluated at regular or special meetings of the Nominatingand Corporate Governance Committee, and may be considered at any point during the year. The Nominating and
12

Corporate Governance Committee considers properly submitted stockholder recommendations for candidates forthe Board of Directors. In evaluating such recommendations, the Nominating and Corporate GovernanceCommittee uses the qualifications standards discussed above and seeks to achieve a balance of knowledge,experience and capability on the Board of Directors.
In addition to the foregoing, effective following the 2008 Annual Meeting of Stockholders, we implementedmajority voting for directors. As a condition to re-nomination, incumbent directors are required to submit aresignation of their directorships in writing to the Chairman of the Nominating and Corporate GovernanceCommittee of the Board. The resignation will become effective only if the director fails to receive a sufficientnumber of votes for re-election at the meeting of stockholders, as described in the Company’s Bylaws, asamended, and the Board accepts the resignation.
Corporate Development Committee
The Corporate Development Committee works with management to review, consider and consult onpotential strategic investment transactions that are consistent with the Company’s strategy. The CorporateDevelopment Committee has the authority to approve certain transactions; and for certain other transactions, theCorporate Development Committee submits a recommendation to the Board of Directors for its consideration.
A copy of the Corporate Development Committee’s written charter is available on our website atwww.brocade.com in the Corporate Governance section of our investor relations webpage.
Compensation Committee Interlocks and Insider Participation
During fiscal year 2010, Messrs. DiPentima, House, Krause and Vaswani served as members of theCompensation Committee. No member of the Compensation Committee during fiscal 2010 was an officer oremployee of Brocade. In addition, no member of the Compensation Committee or executive officer of Brocadeserved as a member of the Board of Directors or Compensation Committee of any entity that has an executiveofficer serving as a member of our Board of Directors or Compensation Committee.
Annual Meeting Attendance
We do not have a formal policy regarding attendance by members of the Board of Directors at our annualmeetings of stockholders although directors are encouraged to attend annual meetings of Brocade stockholders.All members of the Board of Directors attended the 2010 Annual Meeting of Stockholders, either in person or viateleconference.
Communications with the Board of Directors
Although we do not have a formal policy regarding communications with the Board of Directors,stockholders may communicate with the Board of Directors by submitting an email to [email protected] or by writing to us at Brocade Communications Systems, Inc., Attention: InvestorRelations, 130 Holger Way, San Jose, California 95134. Stockholders who would like their submission directedto a particular member of the Board of Directors may so specify. All communications will be reviewed by theGeneral Counsel or Vice President of Investor Relations. All appropriate business-related communications asreasonably determined by the General Counsel or Vice President of Investor Relations will be forwarded to theBoard of Directors or, if applicable, to the individual director.
Code of Ethics
The Board of Directors has adopted a Code of Ethics for Principal Executive and Senior Financial Officers(the “Code of Ethics”), which applies to our Chief Executive Officer, Chief Financial Officer and any otherprincipal financial officer, Controller and any other principal accounting officer, and any other person performing
13

similar functions. The Code of Ethics is posted on our website at www.brocade.com in the Corporate Governancesection of our investor relations webpage. Brocade will disclose any amendment to the Code of Ethics or waiver ofa provision of the Code of Ethics that applies to the Company’s Chief Executive Officer, Chief Financial Officerand any other principal financial officer, Controller and any other principal accounting officer, and any other personperforming similar functions and relates to certain elements of the Code of Ethics, including the name of the officerto whom the waiver was granted, on our website at www.brocade.com, on our investor relations webpage.
Board Leadership and Role in Risk Oversight
The Board of Directors believes in the value of an independent board of directors. Currently, eight of thenine members of the Board of Directors are independent. This includes all members of the Audit Committee, theCompensation Committee, and the Nomination and Corporate Governance Committee. Brocade’s Chairman ofthe Board of Directors is also independent and maintains a separate role from the Chief Executive Officer. TheBoard believes this structure enables the Board to benefit from enabling the Chief Executive Officer to focus onoperational and strategic matters while enabling the Chairman to focus on Board process and governance matters.The independent members of the Board of Directors also meet regularly without management present.
Brocade believes that risk is inherent in innovation and the pursuit of long-term growth opportunities.Brocade’s management is responsible for day-to-day risk management activities. The Board of Directors, actingdirectly and through its committees, is responsible for the oversight of Brocade’s risk management. With theoversight of the Board of Directors, Brocade has implemented practices and programs designed to help managethe risks to which we are exposed in our business and to align risk-taking appropriately with our efforts toincrease shareholder value. As an example of one such program, Brocade has implemented an enterprise riskmanagement (“ERM”) program to identify, assess, govern and manage risks and Brocade’s response to thoserisks. The structure of the ERM program includes quarterly reviews by members of senior management. TheAudit Committee receives regular reports on ERM. In addition, as part of the overall risk oversight framework,other committees of the Board of Directors also oversee certain categories of risk associated with their respectiveareas of responsibility. For example, the Compensation Committee oversees compensation-related riskmanagement, as discussed further under “Compensation Discussion and Analysis” on page 40.
Director Compensation
The following tables provide information about the compensation earned by non-employee directors whoserved during the 2010 fiscal year.
2010 Compensation of Non-Employee Directors
NameFees Earned
or Paid in CashOption
Awards(1)
Restricted StockUnit
Awards(2) Total
Judy Bruner . . . . . . . . . . . . . . . . . . . . . . . . . . . . . . . . . . $ 59,000 $46,460(3) $63,200(3) $168,660
Renato A. DiPentima . . . . . . . . . . . . . . . . . . . . . . . . . . . $ 85,750 $46,460(3) $63,200(3) $195,410
Alan Earhart . . . . . . . . . . . . . . . . . . . . . . . . . . . . . . . . . . $ 60,000 $46,460(3) $63,200(3) $169,660
John W. Gerdelman . . . . . . . . . . . . . . . . . . . . . . . . . . . . $ 86,250 $46,460(3) $63,200(3) $195,910
David L. House . . . . . . . . . . . . . . . . . . . . . . . . . . . . . . . $100,500 $70,210(4) $63,200(4) $233,910
Glenn C. Jones . . . . . . . . . . . . . . . . . . . . . . . . . . . . . . . . $ 75,000 $46,460(3) $63,200(3) $184,660
L. William Krause . . . . . . . . . . . . . . . . . . . . . . . . . . . . . $ 71,000 $46,460(3) $63,200(3) $180,660
Sanjay Vaswani . . . . . . . . . . . . . . . . . . . . . . . . . . . . . . . $ 74,000 $46,460(3) $63,200(3) $183,660
(1) These amounts reflect the grant date fair value as computed under FASB ASC Topic 718 for awards ofoptions granted during fiscal 2010 and do not reflect the actual amounts earned. For additional information,see Note 14 of our financial statements in the Form 10-K for the year ended October 30, 2010, as filed withthe SEC. For information on the valuation assumptions for grants made prior to fiscal year 2010, see thenotes in our financial statements in the Form 10-K for the respective year.
14
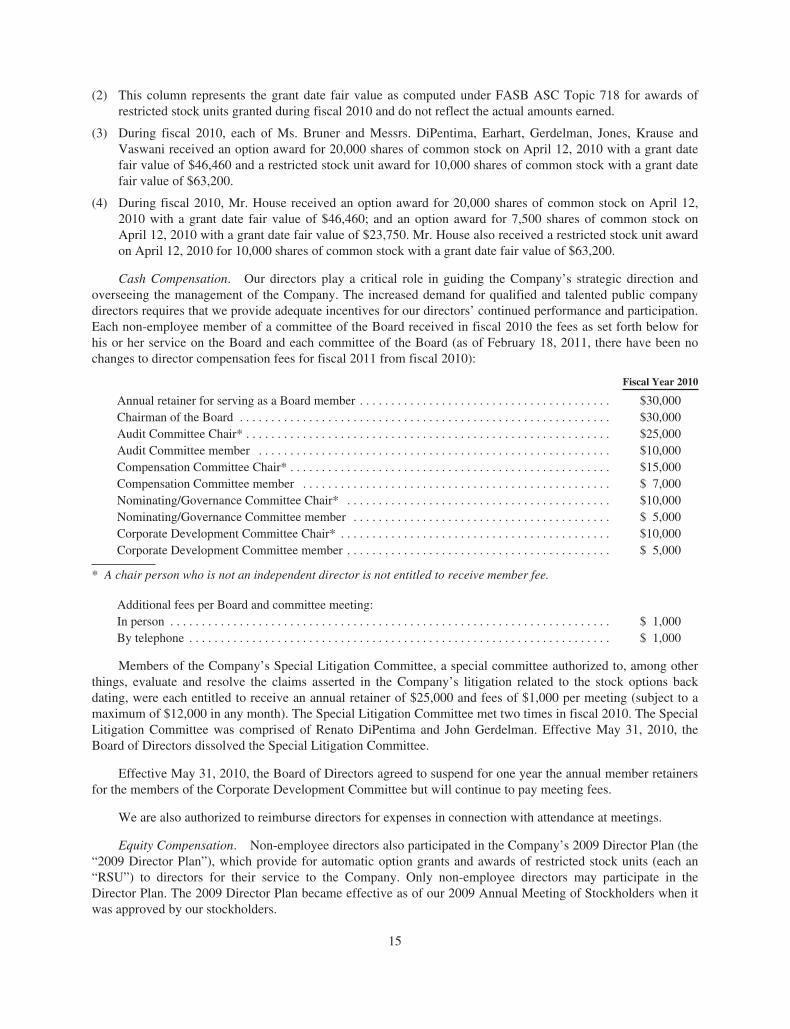
(2) This column represents the grant date fair value as computed under FASB ASC Topic 718 for awards ofrestricted stock units granted during fiscal 2010 and do not reflect the actual amounts earned.
(3) During fiscal 2010, each of Ms. Bruner and Messrs. DiPentima, Earhart, Gerdelman, Jones, Krause andVaswani received an option award for 20,000 shares of common stock on April 12, 2010 with a grant datefair value of $46,460 and a restricted stock unit award for 10,000 shares of common stock with a grant datefair value of $63,200.
(4) During fiscal 2010, Mr. House received an option award for 20,000 shares of common stock on April 12,2010 with a grant date fair value of $46,460; and an option award for 7,500 shares of common stock onApril 12, 2010 with a grant date fair value of $23,750. Mr. House also received a restricted stock unit awardon April 12, 2010 for 10,000 shares of common stock with a grant date fair value of $63,200.
Cash Compensation. Our directors play a critical role in guiding the Company’s strategic direction andoverseeing the management of the Company. The increased demand for qualified and talented public companydirectors requires that we provide adequate incentives for our directors’ continued performance and participation.Each non-employee member of a committee of the Board received in fiscal 2010 the fees as set forth below forhis or her service on the Board and each committee of the Board (as of February 18, 2011, there have been nochanges to director compensation fees for fiscal 2011 from fiscal 2010):
Fiscal Year 2010
Annual retainer for serving as a Board member . . . . . . . . . . . . . . . . . . . . . . . . . . . . . . . . . . . . . . . . $30,000Chairman of the Board . . . . . . . . . . . . . . . . . . . . . . . . . . . . . . . . . . . . . . . . . . . . . . . . . . . . . . . . . . . $30,000Audit Committee Chair* . . . . . . . . . . . . . . . . . . . . . . . . . . . . . . . . . . . . . . . . . . . . . . . . . . . . . . . . . . $25,000Audit Committee member . . . . . . . . . . . . . . . . . . . . . . . . . . . . . . . . . . . . . . . . . . . . . . . . . . . . . . . . $10,000Compensation Committee Chair* . . . . . . . . . . . . . . . . . . . . . . . . . . . . . . . . . . . . . . . . . . . . . . . . . . . $15,000Compensation Committee member . . . . . . . . . . . . . . . . . . . . . . . . . . . . . . . . . . . . . . . . . . . . . . . . . $ 7,000Nominating/Governance Committee Chair* . . . . . . . . . . . . . . . . . . . . . . . . . . . . . . . . . . . . . . . . . . $10,000Nominating/Governance Committee member . . . . . . . . . . . . . . . . . . . . . . . . . . . . . . . . . . . . . . . . . $ 5,000Corporate Development Committee Chair* . . . . . . . . . . . . . . . . . . . . . . . . . . . . . . . . . . . . . . . . . . . $10,000Corporate Development Committee member . . . . . . . . . . . . . . . . . . . . . . . . . . . . . . . . . . . . . . . . . . $ 5,000
* A chair person who is not an independent director is not entitled to receive member fee.
Additional fees per Board and committee meeting:In person . . . . . . . . . . . . . . . . . . . . . . . . . . . . . . . . . . . . . . . . . . . . . . . . . . . . . . . . . . . . . . . . . . . . . . $ 1,000By telephone . . . . . . . . . . . . . . . . . . . . . . . . . . . . . . . . . . . . . . . . . . . . . . . . . . . . . . . . . . . . . . . . . . . $ 1,000
Members of the Company’s Special Litigation Committee, a special committee authorized to, among otherthings, evaluate and resolve the claims asserted in the Company’s litigation related to the stock options backdating, were each entitled to receive an annual retainer of $25,000 and fees of $1,000 per meeting (subject to amaximum of $12,000 in any month). The Special Litigation Committee met two times in fiscal 2010. The SpecialLitigation Committee was comprised of Renato DiPentima and John Gerdelman. Effective May 31, 2010, theBoard of Directors dissolved the Special Litigation Committee.
Effective May 31, 2010, the Board of Directors agreed to suspend for one year the annual member retainersfor the members of the Corporate Development Committee but will continue to pay meeting fees.
We are also authorized to reimburse directors for expenses in connection with attendance at meetings.
Equity Compensation. Non-employee directors also participated in the Company’s 2009 Director Plan (the“2009 Director Plan”), which provide for automatic option grants and awards of restricted stock units (each an“RSU”) to directors for their service to the Company. Only non-employee directors may participate in theDirector Plan. The 2009 Director Plan became effective as of our 2009 Annual Meeting of Stockholders when itwas approved by our stockholders.
15

Under the 2009 Director Plan, each non-employee director is entitled to receive the following automatic,non-discretionary grants of options:
Initial grant upon joining the Board(1) . . . . . . . . . . . . . . . . . . . . . . . . . . . . . . . . . . . . . . 50,000 sharesAutomatic grant at each annual stockholders meeting(2)(3) . . . . . . . . . . . . . . . . . . . . . 20,000 shares
(1) Vests as to 1/3rd of the shares annually and fully vested on the 3rd anniversary of the date of grant.
(2) Vests fully on the earlier of the one year anniversary of the date of grant or the next annual stockholdersmeeting.
(3) At the first (and only the first) Annual Meeting after a non-employee director first becomes an director, suchdirector will receive at such Annual Meeting, a proportionate amount of the annual option grant (in lieu ofthe full annual option grant) based on the fiscal quarter in which such director was appointed.
All options have a term of 7 years under the 2009 Director Plan. The exercise price of options granted underthe 2009 Director Plan is 100 percent of the fair market value of the Common Stock, as determined by referenceto the closing sales price of the Company’s Common Stock as reported on the Nasdaq Global Select Market onthe date of grant.
In addition to the grants above, the Chairman of the Board was and is entitled to receive an automatic grantat each annual stockholders meeting of an option to purchase 7,500 shares of Common Stock under theCompany’s 2009 Stock Plan (the “2009 Stock Plan”). The option has an exercise price equal to 100 percent ofthe fair market value of the Common Stock as determined by reference to the closing sales price of theCompany’s Common Stock as reported on the Nasdaq Global Select Market on the date of grant, has a term of 7years and vests as to 1/4th of the shares each quarter, commencing on the 3rd anniversary of the date of grant andwill be fully vested on the fourth anniversary of each grant.
In the event of a change in control as defined under the 2009 Director Plan, and if the option is not assumedor substituted in the applicable transaction, each option granted under the 2009 Director Plan becomes fullyvested and exercisable. In such event, the option holder shall be notified that the option will be fully exercisablefor a period of 30 days from the date of the notice. Upon expiration of the 30-day period, the option shallterminate. If the option is assumed or substituted, and the option holder’s status as a director of Brocade or thesuccessor corporation, as applicable, is terminated other than upon a voluntary resignation by such option holder,the option shall be accelerated and become fully exercisable with respect to all shares.
Options granted under the 2009 Director Plan may be exercised within 3 months following the date adirector’s board service terminates, or within 12 months if termination of service was due to death or disability,but only to the extent that the director was entitled to exercise the option on the date of termination. If an optionis not exercised within such 3 or 12-month time period, as applicable, the option shall terminate. In any event, adirector may not exercise any option later than the expiration of the applicable term.
Under the 2009 Director Plan, each non-employee director is entitled to receive the following automatic,non-discretionary awards of RSUs (in addition to the grant of options described above):
Initial grant upon joining the Board(1) . . . . . . . . . . . . . . . . . . . . . . . . . . . . . . . . . . . . . . 15,000 RSUsAutomatic grant at each annual stockholders meeting(2)(3) . . . . . . . . . . . . . . . . . . . . . . 10,000 RSUs
(1) Vests as to 1/3rd of the shares annually and fully vested on the 3rd anniversary of the date of grant.
(2) Vests fully on the earlier of the one year anniversary of the date of grant or the next annual stockholdersmeeting.
(3) At the first (and only the first) Annual Meeting after a non-employee director first becomes an director, suchdirector will receive at such Annual Meeting, a proportionate amount of the annual RSU award (in lieu ofthe full annual RSU award) based on the fiscal quarter in which such director was appointed.
16

An RSU is a bookkeeping entry representing an amount equal to the fair market value of one share ofcommon stock and is settled in stock. Each RSU represents an unfunded and unsecured obligation of theCompany. The 2009 Director Plan requires settlement of earned restricted stock units to be made as soon aspracticable after the date set forth in the award agreement evidencing the terms and conditions of the grant. Onthe participant’s termination as a director, all unvested RSUs will be forfeited to the Company.
Non-employee director cash and equity compensation is determined by the Compensation Committee.Independent, outside consultants meet with and provide recommendations of the form and amounts ofcompensation for non-employee directors to the Compensation Committee.
17
SECURITY OWNERSHIP OF CERTAIN BENEFICIAL OWNERS ANDMANAGEMENT
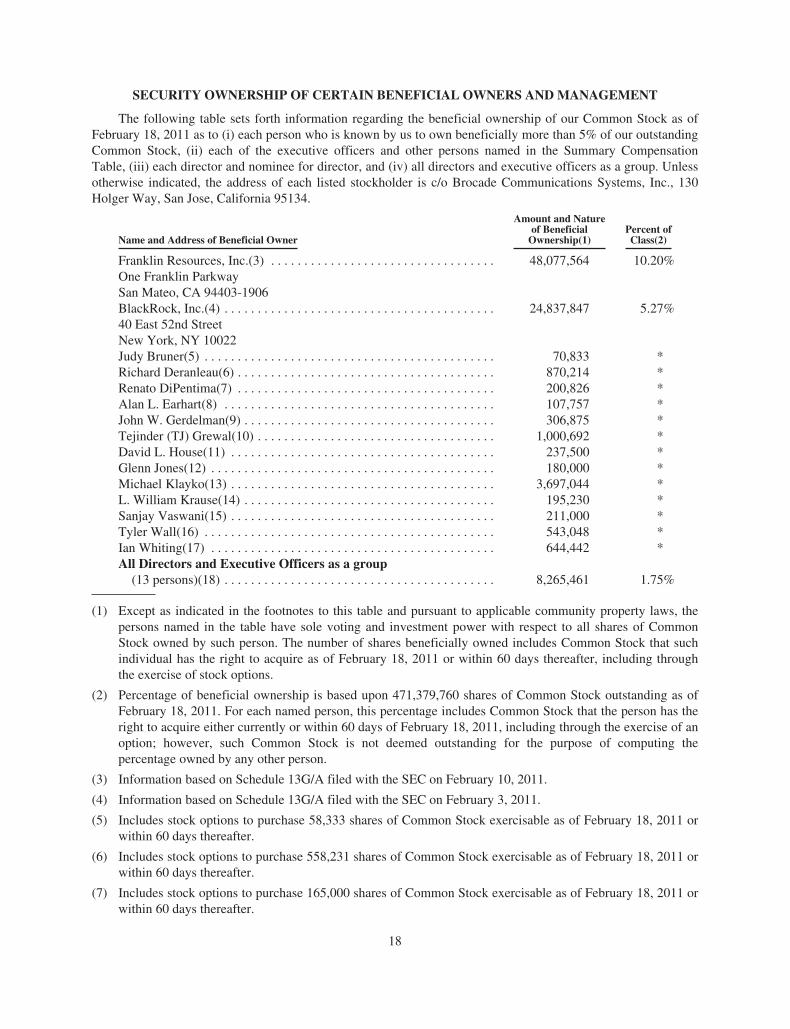
The following table sets forth information regarding the beneficial ownership of our Common Stock as ofFebruary 18, 2011 as to (i) each person who is known by us to own beneficially more than 5% of our outstandingCommon Stock, (ii) each of the executive officers and other persons named in the Summary CompensationTable, (iii) each director and nominee for director, and (iv) all directors and executive officers as a group. Unlessotherwise indicated, the address of each listed stockholder is c/o Brocade Communications Systems, Inc., 130Holger Way, San Jose, California 95134.
Name and Address of Beneficial Owner
Amount and Natureof BeneficialOwnership(1)
Percent ofClass(2)
Franklin Resources, Inc.(3) . . . . . . . . . . . . . . . . . . . . . . . . . . . . . . . . . .One Franklin ParkwaySan Mateo, CA 94403-1906
48,077,564 10.20%
BlackRock, Inc.(4) . . . . . . . . . . . . . . . . . . . . . . . . . . . . . . . . . . . . . . . . .40 East 52nd StreetNew York, NY 10022
24,837,847 5.27%
Judy Bruner(5) . . . . . . . . . . . . . . . . . . . . . . . . . . . . . . . . . . . . . . . . . . . . 70,833 *Richard Deranleau(6) . . . . . . . . . . . . . . . . . . . . . . . . . . . . . . . . . . . . . . . 870,214 *Renato DiPentima(7) . . . . . . . . . . . . . . . . . . . . . . . . . . . . . . . . . . . . . . . 200,826 *Alan L. Earhart(8) . . . . . . . . . . . . . . . . . . . . . . . . . . . . . . . . . . . . . . . . . 107,757 *John W. Gerdelman(9) . . . . . . . . . . . . . . . . . . . . . . . . . . . . . . . . . . . . . . 306,875 *Tejinder (TJ) Grewal(10) . . . . . . . . . . . . . . . . . . . . . . . . . . . . . . . . . . . . 1,000,692 *David L. House(11) . . . . . . . . . . . . . . . . . . . . . . . . . . . . . . . . . . . . . . . . 237,500 *Glenn Jones(12) . . . . . . . . . . . . . . . . . . . . . . . . . . . . . . . . . . . . . . . . . . . 180,000 *Michael Klayko(13) . . . . . . . . . . . . . . . . . . . . . . . . . . . . . . . . . . . . . . . . 3,697,044 *L. William Krause(14) . . . . . . . . . . . . . . . . . . . . . . . . . . . . . . . . . . . . . . 195,230 *Sanjay Vaswani(15) . . . . . . . . . . . . . . . . . . . . . . . . . . . . . . . . . . . . . . . . 211,000 *Tyler Wall(16) . . . . . . . . . . . . . . . . . . . . . . . . . . . . . . . . . . . . . . . . . . . . 543,048 *Ian Whiting(17) . . . . . . . . . . . . . . . . . . . . . . . . . . . . . . . . . . . . . . . . . . . 644,442 *All Directors and Executive Officers as a group(13 persons)(18) . . . . . . . . . . . . . . . . . . . . . . . . . . . . . . . . . . . . . . . . . 8,265,461 1.75%
(1) Except as indicated in the footnotes to this table and pursuant to applicable community property laws, thepersons named in the table have sole voting and investment power with respect to all shares of CommonStock owned by such person. The number of shares beneficially owned includes Common Stock that suchindividual has the right to acquire as of February 18, 2011 or within 60 days thereafter, including throughthe exercise of stock options.
(2) Percentage of beneficial ownership is based upon 471,379,760 shares of Common Stock outstanding as ofFebruary 18, 2011. For each named person, this percentage includes Common Stock that the person has theright to acquire either currently or within 60 days of February 18, 2011, including through the exercise of anoption; however, such Common Stock is not deemed outstanding for the purpose of computing thepercentage owned by any other person.
(3) Information based on Schedule 13G/A filed with the SEC on February 10, 2011.
(4) Information based on Schedule 13G/A filed with the SEC on February 3, 2011.
(5) Includes stock options to purchase 58,333 shares of Common Stock exercisable as of February 18, 2011 orwithin 60 days thereafter.
(6) Includes stock options to purchase 558,231 shares of Common Stock exercisable as of February 18, 2011 orwithin 60 days thereafter.
(7) Includes stock options to purchase 165,000 shares of Common Stock exercisable as of February 18, 2011 orwithin 60 days thereafter.
18

(8) Includes stock options to purchase 53,330 shares of Common Stock exercisable as of February 18, 2011 orwithin 60 days thereafter.
(9) Includes stock options to purchase 213,375 shares of Common Stock exercisable as of February 18, 2011 orwithin 60 days thereafter.
(10) Includes stock options to purchase 991,145 shares of Common Stock exercisable as of February 18, 2011 orwithin 60 days thereafter.
(11) Includes stock options to purchase 187,500 shares of Common Stock exercisable as of February 18, 2011 orwithin 60 days thereafter.
(12) Includes stock options to purchase 160,000 shares of Common Stock exercisable as of February 18, 2011 orwithin 60 days thereafter.
(13) Includes stock options to purchase 2,768,941 shares of Common Stock exercisable as of February 18, 2011or within 60 days thereafter. Includes 22,889 shares indirectly owned by daughter.
(14) Includes stock options to purchase 175,000 shares of Common Stock exercisable as of February 18, 2011 orwithin 60 days thereafter.
(15) Includes stock options to purchase 190,000 shares of Common Stock exercisable as of February 18, 2011 orwithin 60 days thereafter.
(16) Includes stock options to purchase 455,103 shares of Common Stock exercisable as of February 18, 2011 orwithin 60 days thereafter.
(17) Includes stock options to purchase 510,572 shares of Common Stock exercisable as of February 18, 2011 orwithin 60 days thereafter.
(18) Includes stock options to purchase 6,486,530 shares of Common Stock exercisable as of February 18, 2011or within 60 days thereafter.
19
PROPOSAL ONE:
ELECTION OF DIRECTORS
The Board of Directors currently consists of nine directors that were previously divided into three classes,each of which was elected for a three year term: three Class I directors (whose terms expire in 2012), threeClass II directors (whose terms expire in 2013) and three Class III directors (whose current terms expire in 2011).At our 2010 annual meeting, our stockholders approved a proposal to declassify our board of directors andprovide for annual elections of directors. Accordingly, each of the directors elected at the 2011 annual meetingwill be elected for a one year term expiring at the 2012 annual meeting. At the 2012 annual meeting, each of thedirectors elected (as well as directors elected at the 2011 annual meeting whose terms are expiring) will beelected for a one year term and in 2013 and thereafter, all directors will be elected for a one year term. Terms ofdirectors elected prior to this 2011 annual meeting will not be shortened.
Nominees
The Nominating and Corporate Governance Committee of the Board of Directors recommended, and theBoard of Directors approved, John Gerdelman, Glenn Jones and Michael Klayko as nominees for election at theAnnual Meeting to the Board of Directors. If elected, John Gerdelman, Glenn Jones and Michael Klayko willserve as directors until our annual meeting in 2012, and until a successor is qualified and elected or until his orher earlier resignation or removal. Each of the nominees is currently a director of the Company. Please see“Nominees — Terms Would Expire at the 2012 Annual Meeting if Elected at the Upcoming Annual Meeting” onpage 7 of this Proxy Statement for information concerning our incumbent directors standing for re-election.
Unless otherwise instructed, the proxy holders will vote the proxies received by them FOR each of JohnGerdelman, Glenn Jones and Michael Klayko. If the nominees are unable or decline to serve as a director at thetime of the Annual Meeting, the proxies will be voted for another nominee designated by the Board of Directors.We are not aware of any reason that a nominee would be unable or unwilling to serve as a director.
Vote Required
Provided a quorum is present, directors are elected by a majority of the votes cast at the annual meeting (i.e.,the number of shares voted “for” a director nominee must exceed the number of votes cast “against” thatnominee), except in the case of a contested election. If a nominee who is currently serving as a director is notelected at the Annual Meeting, under Delaware law the director will continue to serve on the Board as a“holdover director.” However, as a condition to re-nomination, incumbent directors are required to submit aresignation from the Board in writing to the Chairman of the Nominating and Corporate Governance Committeeof the Board. The resignation will become effective only if the director fails to receive a majority of votes castfor re-election and the Board accepts the resignation. In the event of a contested election in accordance with ourBylaws, directors shall be elected by the vote of a plurality of the votes cast.
Abstentions and broker non-votes will have no effect on the election of directors.
The Board of Directors unanimously recommends that stockholders vote “FOR” the election of each ofJohn Gerdelman, Glenn Jones and Michael Klayko.
20
PROPOSAL TWO:
ADVISORY VOTE ON EXECUTIVE COMPENSATION
Executive compensation is an important matter for Brocade and our stockholders. This proposal providesBrocade’s stockholders with the opportunity to cast an advisory vote on executive compensation.
The core of Brocade’s executive compensation philosophy and practice continues to be based on apay-for-performance philosophy. Brocade’s executive officers are compensated in a manner consistent withBrocade’s strategy, competitive practice, sound corporate governance principles, and stockholder interests andconcerns. We believe our compensation program is strongly aligned with the long-term interests of ourstockholders.
We urge you to carefully read the Compensation Discussion and Analysis (“CD&A”) section of this proxystatement for additional details on Brocade’s executive compensation, including Brocade’s compensationphilosophy and objectives and the 2010 compensation of the named executive officers.
The following highlights key aspects of executive compensation with respect to our named executiveofficers in fiscal year 2010:
• Approximately 55% to 63% of total compensation is variable and tied to achievement of internalperformance targets or Company stock price performance compared to the Nasdaq-100 index;
• Base salaries in fiscal year 2010 were maintained at their 2009 levels;
• The Company’s performance was below internal performance targets that resulted in funding (the“Corporate Performance Multiplier” described below in the Compensation Discussion and Analysis) forthe annual cash incentive plan at 67.4% of the target level;
• The Company granted long-term equity awards that link the interests of our executives with those of ourshareholders. Specifically, these awards include performance-based Market Stock Units (MSUs), whichare earned based on a comparison of the Company’s stock price performance to the Nasdaq-100 indexover a 2-year performance period;
• Executive officers are not entitled to any tax gross-up treatment on any severance or change-of-controlbenefits;
• Change-of-control benefits are based on a double-trigger philosophy, i.e., requiring a change-of-controlplus a qualifying termination of employment before benefits are paid;
• Brocade’s compensation programs were reviewed by the Compensation Committee and determined not tocreate inappropriate or excessive risk that is likely to have a material adverse effect on the Company;
• Brocade’s overall burn rate for fiscal year 2010 was 3.5%, well below industry guidelines recommendedby Institutional Shareholder Services (ISS) and others; and
• Brocade’s overhang trended down in fiscal year 2010, as further discussed in the following paragraph.
In addition, in January 2011, the Compensation Committee, with the assistance of an independentcompensation consulting firm, reviewed Brocade’s compensation policies and practices and determined thatBrocade’s compensation policies and practices do not create inappropriate or excessive risk that is likely to havea material adverse effect on the Company.
Based on the above, we request that stockholders approve the compensation of Brocade’s named executiveofficers as described pursuant to the disclosure rules of the Securities and Exchange Commission pursuant to thefollowing resolution:
RESOLVED, that the compensation paid to the Company’s named executive officers, as disclosed pursuantto Item 402 of Regulation S-K, including the “Compensation Discussion and Analysis” section,compensation tables and narrative discussion, is hereby APPROVED.
21

Vote Required
The affirmative vote of a majority of the shares of Brocade common stock present or represented by proxyand voting at the annual meeting is required for approval of this proposal. Abstentions are treated as sharesrepresented in person or by proxy and entitled to vote at the Annual Meeting and, therefore, will have the sameeffect as a vote “Against” the proposal. Broker non-votes will have no effect on the outcome of the vote.
As an advisory vote, this proposal is non-binding. Although the vote is non-binding, the Board of Directorsand the Compensation Committee value the opinions of our stockholders, and will consider the outcome of thevote when making future compensation decisions for our named executive officers.
The Board of Directors recommends that stockholders vote “FOR” Proposal Two.
22

PROPOSAL THREE:
ADVISORY VOTE ON FREQUENCY OF RESOLUTION ON EXECUTIVE COMPENSATION
As described in Proposal Two above, Brocade’s stockholders are being provided the opportunity to cast anadvisory vote on Brocade’s executive compensation program. The advisory vote on executive compensationdescribed above is referred to as a “say-on-pay vote.”
This Proposal Three provides our stockholders the opportunity to cast an advisory vote on how oftenBrocade should include a say-on-pay vote in its proxy materials for future annual stockholder meetings (orspecial stockholder meeting for which Brocade must include executive compensation information in the proxystatement for that meeting). Under this Proposal Three, stockholders may vote to have the say-on-pay vote everyyear, every two years or every three years.
Brocade believes that say-on-pay votes should be conducted every two years for the following reasons:
• A substantial portion of executive compensation is in the form of long-term equity awards withperformance periods of 2 or more years. Biennial votes will provide stockholders sufficient time toevaluate the effectiveness of such long-term compensation strategies and related business outcomes ofBrocade.
• Biennial votes will provide Brocade with the time to thoughtfully consider the results of the say-on-payvotes, respond to stockholders sentiments and implement changes. The Compensation Committeegenerally implements changes to executive compensation practices each November/December and anychange implemented applies to the following year. Accordingly, a change made in year one would beeffective in year two, and Brocade and our stockholders would see the results from those changes mostlikely in year two or three.
• In contrast, annual votes would not allow for changes to Brocade’s compensation program to be in placelong enough to evaluate whether the changes were effective and may unduly disrupt longer-termcompensation strategies tied to Company performance.
Vote Required
The option of one year, two years or three years that receives the highest number of votes cast bystockholders will be the frequency for the advisory vote on executive compensation that has been selected bystockholders. Abstentions and broker non-votes will have no effect on the outcome of the vote. As an advisoryvote, the vote on Proposal Three is not binding on us. However, the Board of Directors and/or subcommittee ofthe Board of Directors value the opinions of our stockholders, and will consider the outcome of the vote whensetting the frequency of the advisory vote on executive compensation.
The Board recommends that stockholders vote on Proposal Three to hold say-on-pay votes EVERY TWOYEARS (as opposed to every year or every three years).
23
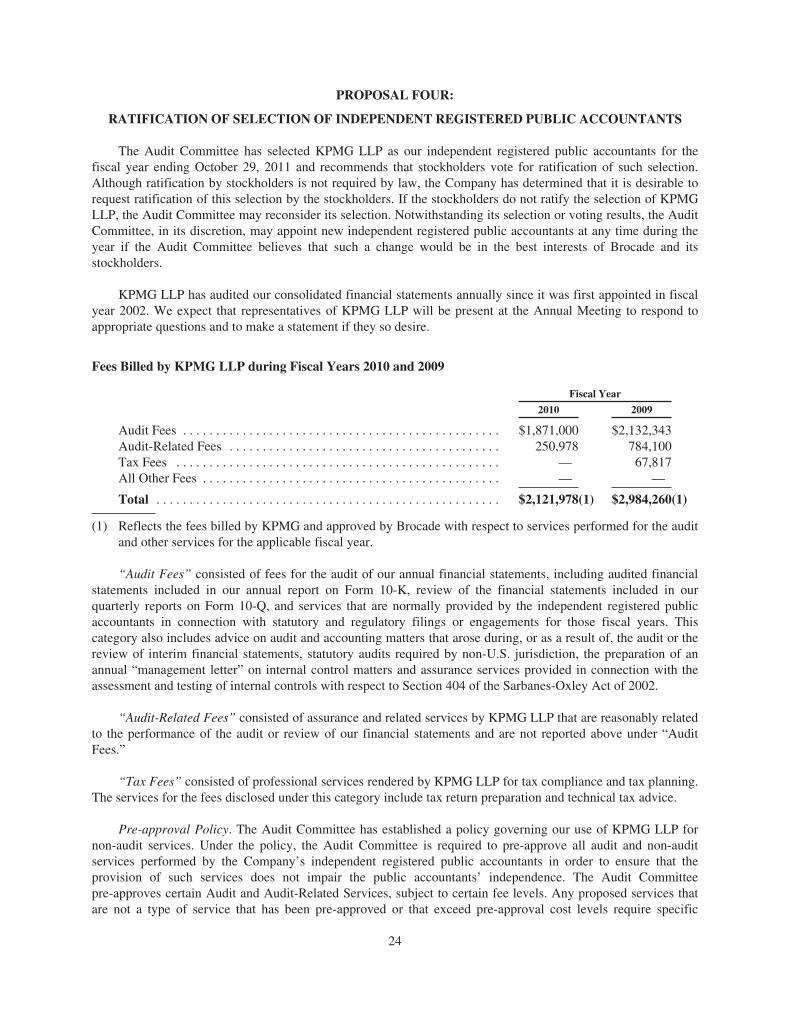
PROPOSAL FOUR:
RATIFICATION OF SELECTION OF INDEPENDENT REGISTERED PUBLIC ACCOUNTANTS
The Audit Committee has selected KPMG LLP as our independent registered public accountants for thefiscal year ending October 29, 2011 and recommends that stockholders vote for ratification of such selection.Although ratification by stockholders is not required by law, the Company has determined that it is desirable torequest ratification of this selection by the stockholders. If the stockholders do not ratify the selection of KPMGLLP, the Audit Committee may reconsider its selection. Notwithstanding its selection or voting results, the AuditCommittee, in its discretion, may appoint new independent registered public accountants at any time during theyear if the Audit Committee believes that such a change would be in the best interests of Brocade and itsstockholders.
KPMG LLP has audited our consolidated financial statements annually since it was first appointed in fiscalyear 2002. We expect that representatives of KPMG LLP will be present at the Annual Meeting to respond toappropriate questions and to make a statement if they so desire.
Fees Billed by KPMG LLP during Fiscal Years 2010 and 2009
Fiscal Year
2010 2009
Audit Fees . . . . . . . . . . . . . . . . . . . . . . . . . . . . . . . . . . . . . . . . . . . . . . . . $1,871,000 $2,132,343Audit-Related Fees . . . . . . . . . . . . . . . . . . . . . . . . . . . . . . . . . . . . . . . . . 250,978 784,100Tax Fees . . . . . . . . . . . . . . . . . . . . . . . . . . . . . . . . . . . . . . . . . . . . . . . . . — 67,817All Other Fees . . . . . . . . . . . . . . . . . . . . . . . . . . . . . . . . . . . . . . . . . . . . . — —
Total . . . . . . . . . . . . . . . . . . . . . . . . . . . . . . . . . . . . . . . . . . . . . . . . . . . . $2,121,978(1) $2,984,260(1)
(1) Reflects the fees billed by KPMG and approved by Brocade with respect to services performed for the auditand other services for the applicable fiscal year.
“Audit Fees” consisted of fees for the audit of our annual financial statements, including audited financialstatements included in our annual report on Form 10-K, review of the financial statements included in ourquarterly reports on Form 10-Q, and services that are normally provided by the independent registered publicaccountants in connection with statutory and regulatory filings or engagements for those fiscal years. Thiscategory also includes advice on audit and accounting matters that arose during, or as a result of, the audit or thereview of interim financial statements, statutory audits required by non-U.S. jurisdiction, the preparation of anannual “management letter” on internal control matters and assurance services provided in connection with theassessment and testing of internal controls with respect to Section 404 of the Sarbanes-Oxley Act of 2002.
“Audit-Related Fees” consisted of assurance and related services by KPMG LLP that are reasonably relatedto the performance of the audit or review of our financial statements and are not reported above under “AuditFees.”
“Tax Fees” consisted of professional services rendered by KPMG LLP for tax compliance and tax planning.The services for the fees disclosed under this category include tax return preparation and technical tax advice.
Pre-approval Policy. The Audit Committee has established a policy governing our use of KPMG LLP fornon-audit services. Under the policy, the Audit Committee is required to pre-approve all audit and non-auditservices performed by the Company’s independent registered public accountants in order to ensure that theprovision of such services does not impair the public accountants’ independence. The Audit Committeepre-approves certain Audit and Audit-Related Services, subject to certain fee levels. Any proposed services thatare not a type of service that has been pre-approved or that exceed pre-approval cost levels require specific
24
approval by the Audit Committee in advance. The Audit Committee periodically reviews the lists ofpre-approved service types set forth in the policy. In fiscal years 2010 and 2009, all fees identified above underthe captions “Audit Fees,” “Audit-Related Fees” and “Tax Fees” that were billed by KPMG LLP were approvedby the Audit Committee in accordance with SEC requirements.
The Audit Committee has determined that the rendering of other professional services for tax complianceand tax advice by KPMG LLP is compatible with maintaining their independence.
Vote Required
The affirmative vote of the holders of a majority of the shares of Common Stock present in person orrepresented by proxy and entitled to vote on the matter is necessary to ratify the selection of KPMG LLP as ourindependent registered public accountants for fiscal year 2011. Abstentions will have the effect of a vote“against” the ratification of KPMG LLP as our independent registered public accountants. Broker non-votes willhave no effect on the outcome of the vote.
The Board of Directors, on behalf of the Audit Committee, recommends that stockholders vote “FOR”the ratification of the selection of KPMG LLP as Brocade’s independent registered public accountants for thefiscal year ending October 29, 2011.
25

EXECUTIVE OFFICERS
Set forth below is information regarding our executive and certain key officers as of January 20, 2011.
Name Age Position
Michael Klayko . . . . . . . . . . . . . . . . . . . 56 Chief Executive Officer and Director
Richard Deranleau . . . . . . . . . . . . . . . . 52 Vice President, Finance and Chief Financial Officer
Tejinder (TJ) Grewal . . . . . . . . . . . . . . 43 Vice President, Corporate Development
Tyler Wall . . . . . . . . . . . . . . . . . . . . . . . 45 Vice President, General Counsel, Chief ComplianceOfficer and Corporate Secretary
Ian Whiting . . . . . . . . . . . . . . . . . . . . . . 46 Senior Vice President, Worldwide Sales
Michael Klayko has served as our Chief Executive Officer and as a director since January 2005. Prior tothat, he served as Vice President, Worldwide Sales from May 2004 until January 2005. From April 2003 untilMay 2004, Mr. Klayko served as Vice President, Worldwide Marketing and Support, and from January 2003until April 2003, he was Vice President, OEM Sales. From May 2001 to January 2003, Mr. Klayko was ChiefExecutive Officer and President of Rhapsody Networks, a privately held technology company acquired byBrocade. From December 1998 to April 2001, Mr. Klayko served as Executive Vice President of McDATACorporation. From March 1995 to November 1998, Mr. Klayko was Senior Vice President for North AmericanSales at EMC Corporation, a provider of information storage systems products. Mr. Klayko also held variousexecutive sales and marketing positions at Hewlett-Packard Company and IBM Corporation. Mr. Klaykoreceived a B.S. degree in electronic engineering from Ohio Institute of Technology, in Columbus, Ohio.
Richard Deranleau has served as our Chief Financial Officer since May 2006 and as Vice President ofFinance since November 2005. Mr. Deranleau served as our interim Chief Financial Officer from December2005 until May 2006. He held the title Controller and Treasurer from May 2003 until December 2005. From1992 to May 2003, Mr. Deranleau served in various management positions for Polycom, Inc., including VicePresident of Finance and Treasurer from January 2001 to May 2003. Prior to Polycom, Mr. Deranleau heldvarious accounting and finance positions at Tandem Computers and Coopers & Lybrand, LLC. Mr. Deranleaureceived a B.S. degree in economics from Iowa State University, an M.B.A. from San Jose State University, andis a Certified Public Accountant.
Tejinder (TJ) Grewal has served as Vice President, Corporate Development since August 2004, and isresponsible for developing and managing strategic Brocade corporate initiatives, including mergers andacquisitions, key business initiatives and strategic investments. From 1999 through August 2004, Mr. Grewalworked with McKinsey & Company, where he advised software, semiconductor, and consumer hardware clientsas part of the company’s High Technology Practice. Prior to joining McKinsey, he was a senior manager inErnst & Young’s technology practice. Mr. Grewal received an M.B.A. from McMaster University and a B.A.from York University, both in Canada.
Tyler Wall has served as Vice President and General Counsel since June 2005 and as Corporate Secretaryand Chief Compliance Officer since July 2005. Prior to joining Brocade, from February 2000 until June 2005, heserved as Vice President and General Counsel of Chordiant Software, Inc., an enterprise software applicationscorporation, where he was also Corporate Secretary from January 2004 until June 2005. From 1998 to February2000, he served as Chordiant’s Director of Legal Affairs. Prior to joining Chordiant, Mr. Wall worked at OracleCorporation, a provider of database and application software, where he served as Corporate Counsel for thecommercial licensing and distribution group. Mr. Wall received a B.S. degree in economics from University ofUtah, a J.D. from Santa Clara University School of Law, and an M.B.A. from Santa Clara University School ofBusiness.
Ian Whiting has served as Senior Vice President, Worldwide Sales since March 2010. Prior to that,Mr. Whiting served as our Senior Vice President, Worldwide Sales & Marketing since January 2009, Vice
26

President and General Manager, Data Center Infrastructure (DCI) since November 2007 and as our VicePresident, Worldwide Sales & Services since May 2005. From 2003 to May 2005, Mr. Whiting served as VicePresident of EMEA and Latin America, and from 2001 through 2002, as Executive Director of Partner Sales forEMEA. Prior to joining Brocade in 2001, he was Director of Compaq Storage Works EMEA. Mr. Whitingreceived a bachelor’s degree in French and German from the University College Swansea, an M.A. in EuropeanBusiness Studies from Cranfield School of Management, and a diploma of marketing from the Chartered Instituteof Marketing in Maidenhead, United Kingdom.
27

EXECUTIVE COMPENSATION AND OTHERMATTERS
Executive Summary
Business Performance
Brocade provides comprehensive data networking solutions to organizations across the globe. For fiscalyear 2010, Brocade reported annual revenues of $2.09 billion, compared to $1.95 billion in fiscal year 2009,which represented year-over-year growth of 7.2%. Because Brocade acquired Foundry Networks, Inc. inDecember 2008 (i.e., during Q1 of Brocade’s 2009 fiscal year), Brocade’s fiscal year 2009 results do not includea full twelve months of revenue related to the Foundry business. Brocade also reported diluted earnings per share(EPS) of $0.25 on a GAAP basis and $0.53 on a non-GAAP basis for fiscal year 2010, which represented animprovement compared to fiscal year 2009. In fiscal year 2009, Brocade reported a loss of ($0.20) diluted EPSon a GAAP basis and $0.25 diluted EPS on a non-GAAP basis.
Pay for Performance Philosophy
Our executive compensation program is based on an overarching pay-for-performance philosophy. We aimto provide compensation and benefit levels that will attract, retain, and motivate a highly talented executive team,while seeking to ensure that the compensation provided to our executives is linked to shareholder value. Thetable below illustrates the relationship between our CEO’s compensation over our last five fiscal years and ourindexed total shareholder return for those same five years.
2006
$3,063
$5,788
$3,813
$9,176
$4,62178.3%
106.0%
46.5%
117.3%100.0%
2007 2008 2009 2010$0
$1,000
$2,000
$3,000
$4,000
$5,000
$6,000
$7,000
$8,000
$9,000
$10,000
CE
O T
DC
($0
00)
5-Yr CEO Total Direct Compensation vs. Company TSR
Ind
exed T
SR
0.0%
20.0%
40.0%
60.0%
80.0%
100.0%
120.0%
140.0%
Actual Total Direct Compensation One Year TSR
Notes:
• The chart above reflects the grant date fair value of equity awards as disclosed in Brocade’s proxystatements.
• TSR (Total Shareholder Return) is calculated based on the closing stock price on the date of the fiscalyear end per Yahoo finance. The indexed TSR represents the percentage change over the 2006 fiscal yearend price of $8.11.
28

Summary of 2010 Executive Compensation
While annual revenues for fiscal year 2010 represented an all-time high for the Company, the Company’sfinancial performance did not meet the internal targets set by management and the Company’s Board ofDirectors. As a result, compensation for the Company’s Named Executive Officers (NEOs), which, as notedabove, is largely driven by a pay-for-performance philosophy, was below target compensation levels.
The following lists key compensation matters for fiscal year 2010 with respect to our Named ExecutiveOfficers:
• Approximately 55% to 63% of total compensation is variable and tied to achievement of internalperformance targets or Company stock price performance compared to the Nasdaq-100 index;
• Base salaries in fiscal year 2010 were maintained at their 2009 levels;
• The Company’s performance was below internal performance targets that resulted in funding (the“Corporate Performance Multiplier” described below in the Compensation Discussion and Analysis) forthe annual cash incentive plan at 67.4% of the target level; and
• The Company granted long-term equity awards that link the interests of our executives with those of ourshareholders. Specifically, these awards include performance-based Market Stock Units (MSUs), whichare earned based on a comparison of the Company’s stock price performance to the Nasdaq-100 indexover a 2-year performance period.
Other Important Matters
In addition to the compensation details provided above and discussed further below, other important detailsare as follows:
• Executive officers are not entitled to any tax gross-up treatment on any severance or change-of-controlbenefits;
• Change-of-control benefits are based on a double-trigger philosophy, i.e., requiring a change-of-controlplus a qualifying termination of employment before benefits are paid;
• Brocade’s compensation programs were reviewed by the Compensation Committee (the “Committee”)and determined not to create inappropriate or excessive risk that is likely to have a material adverse effecton the Company;
• Brocade’s overall burn rate for fiscal year 2010 was 3.5%, well below industry guidelines recommendedby Institutional Shareholder Services (ISS) and others; and
• Brocade’s overhang trended down in fiscal year 2010, as further discussed in the following paragraph.
Overhang is a quotient, the numerator of which is generally calculated as the number of outstanding optionsand equity awards, and the denominator of which is the total number of outstanding shares. Because theCompany’s acquisition of Foundry Networks, Inc. in December 2008 was structured as an all-cash transaction,the number of outstanding options and equity awards (the numerator in the overhang calculation) increasedsignificantly due to the Company’s assumption of outstanding equity awards held by employees of FoundryNetworks, without a corresponding increase in the total number of outstanding shares of the combined company(the denominator in the overhang calculation). As a result, the Company’s overhang increased fromapproximately 12% to 28% from 2008 to 2009. Had the acquisition been structured using equity, or acombination of equity-and-cash, the total number of outstanding shares of the combined company would haveincreased and the impact to the Company’s overhang calculation would have been less significant. Brocade’soverhang fell year-over-year from approximately 28% in 2009 to approximately 23% in 2010.
29
Compensation Discussion and Analysis
This Compensation Discussion and Analysis describes the 2010 compensation program for our principalexecutive officer, our principal financial officer, and the three executive officers included in the SummaryCompensation Table on page 42, who were the most highly compensated executive officers of the Companyduring fiscal 2010 (the “Named Executive Officers” or “NEOs”). During fiscal 2010, these individuals were:
• Michael Klayko, Chief Executive Officer;
• Richard Deranleau, Vice President, Finance and Chief Financial Officer;
• Tejinder Grewal, Vice President, Corporate Development;
• Tyler Wall, Vice President, General Counsel and Corporate Secretary; and
• Ian Whiting, Senior Vice President, Worldwide Sales.
This Compensation Discussion and Analysis describes the material elements of our executive compensationprogram during fiscal 2010 as well as key changes for the Company’s 2011 executive compensation program. Italso provides an overview of our executive compensation philosophy and objectives. Finally, it analyzes how andwhy the Committee arrived at the specific compensation decisions for our executive officers, including ourNEOs, for fiscal 2010, including the key factors that the Committee considered in determining theircompensation.
This Compensation Discussion and Analysis is divided into the following sections:
• Our executive compensation philosophy and objectives;
• The governance of our executive compensation program;
• Our fiscal 2010 compensation components and decisions for our NEOs;
• Other compensation policies; and
• Tax and accounting considerations.
Executive Compensation Philosophy and Objectives
Compensation Philosophy
As noted above, our executive compensation program is based on an overarching pay-for-performancephilosophy. Generally, the types of compensation and benefits provided to the NEO’s are also provided to otherofficers reporting to the Chief Executive Officer.
Compensation Objectives
Consistent with our philosophy, we designed our executive compensation program to achieve the followingprimary objectives:
• Provide compensation and benefit levels that will attract, retain, and motivate a highly talented executiveteam within the context of responsible cost management;
• Establish a direct link between the Company’s financial results and individual/team performance andcompensation; and
• Align the interests and objectives of our executives with those of our stockholders by linking executiveequity awards to shareholder value creation.
30
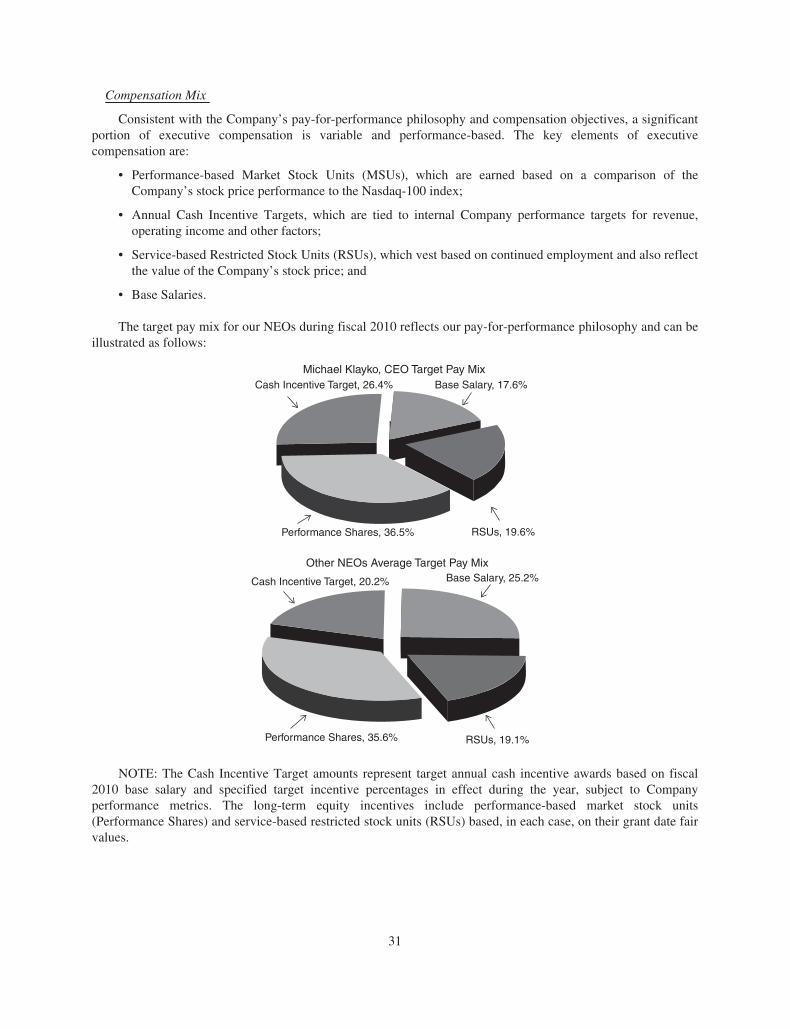
Compensation Mix
Consistent with the Company’s pay-for-performance philosophy and compensation objectives, a significantportion of executive compensation is variable and performance-based. The key elements of executivecompensation are:
• Performance-based Market Stock Units (MSUs), which are earned based on a comparison of theCompany’s stock price performance to the Nasdaq-100 index;
• Annual Cash Incentive Targets, which are tied to internal Company performance targets for revenue,operating income and other factors;
• Service-based Restricted Stock Units (RSUs), which vest based on continued employment and also reflectthe value of the Company’s stock price; and
• Base Salaries.
The target pay mix for our NEOs during fiscal 2010 reflects our pay-for-performance philosophy and can beillustrated as follows:
Michael Klayko, CEO Target Pay MixCash Incentive Target, 26.4% Base Salary, 17.6%
RSUs, 19.6%Performance Shares, 36.5%
Other NEOs Average Target Pay Mix
Cash Incentive Target, 20.2% Base Salary, 25.2%
RSUs, 19.1%Performance Shares, 35.6%
NOTE: The Cash Incentive Target amounts represent target annual cash incentive awards based on fiscal2010 base salary and specified target incentive percentages in effect during the year, subject to Companyperformance metrics. The long-term equity incentives include performance-based market stock units(Performance Shares) and service-based restricted stock units (RSUs) based, in each case, on their grant date fairvalues.
31

We also provide our NEOs with (i) health and welfare benefits on substantially the same terms andconditions as they are provided to most of our other employees, and (ii) severance and change-in-controlprotection.
Competitive Positioning
The Committee’s philosophy of maintaining compensation programs that are competitive includes a balancebetween aggressively hiring and retaining the best possible talent and maintaining a reasonable and responsiblecost structure. The Committee does not establish a specific target percentile for the target compensation of ourNEOs (i.e., we do not engage in “benchmarking” as that term is commonly used). When setting the amount ofeach compensation component for the NEO’s, the Committee considers the following factors:
• The Company’s performance relative to its peer group.
• The Company’s performance against financial goals and objectives established by the Committee andBoard of Directors at the beginning of the year.
• Each individual NEO’s skills, experience, and qualifications relative to other similarly-situated executivesat companies in the Company’s peer group.
• The scope of the NEO’s role compared to other similarly-situated executives at companies in theCompany’s peer group.
• The performance of each individual NEO, is based on a subjective assessment of his or her contributionsto the Company’s overall performance, ability to lead his or her business unit or function, work as part ofa team, and reflect the Company’s core values.
• The compensation practices of the Company’s peer group and the positioning of each NEO’scompensation in a ranking of peer compensation.
These factors provide the framework for compensation decision-making and final decisions regarding thecompensation opportunity for an executive officer. No single factor above is determinative in setting pay levels,nor was the impact of any factor on the determination of pay levels quantifiable.
For purposes of comparing our executive compensation against the competitive market, the Committeeutilizes a peer group of 19 high-technology companies. The companies in the peer group were selected on thebasis of their similarity to the Company in size (as determined by revenue, market capitalization, net income, andemployee base), business strategy and industry. The Committee reviews the Company’s peer group at leastannually and makes adjustments to its composition, taking into account changes in both the Company’s businessand the businesses of the companies in the peer group.
The fiscal 2010 peer group was as follows:
• ADC Telecommunications • Juniper Networks • Polycom
• BMC Software • KLA-Tencor • Synopsys
• Broadcom • Lam Research • Tellabs
• Cadence Design System • LSI • Teradyne
• Citrix Systems • NetApp • Trimble Navigation
• Imation • Novellus Systems • VMware
• JDS Uniphase
32

To analyze the compensation practices of the peer group companies, Compensia, Inc. (“Compensia”)gathered data from public filings and from Radford’s High-Technology Executive Survey database. This peergroup data was then used as a reference point to assess the Company’s current compensation levels for theCommittee in the course of its deliberations on compensation forms and amounts.
Governance of Our Executive Compensation Program
Role of the Compensation Committee
The purpose of the Committee is to discharge the Board of Directors’ responsibilities relating to thecompensation of our executive officers and directors. The Committee has overall responsibility for (i) overseeingthe Company’s compensation and benefits policies, (ii) overseeing, evaluating, and approving executive officerand director compensation plans, policies, and programs, and (iii) evaluating our CEO’s performance andestablishing his compensation. With respect to the Company’s CEO, the Committee sets, and with respect to theNEOs, (other than the CEO), the Committee reviews and approves their:
• Annual base salaries;
• Annual incentive compensation;
• Long-term incentive compensation;
• Employment agreements (including severance and change-in-control arrangements); and
• Other compensation, perquisites, or special benefit items, if any.
Management Interaction with Committee
In carrying out its responsibilities, the Committee works with members of our management team, includingour CEO. The management team assists the Committee by providing information on Company and individualperformance, market data, and management’s perspective and recommendations on compensation matters. TheCommittee solicits and reviews management’s (including the CEO’s) recommendations and proposals withrespect to annual cash compensation adjustments, long-term equity incentive awards, program structures, andother compensation-related matters (other than for the CEO). The Committee uses management’srecommendations and proposals as one of many factors in making compensation decisions for the Company’sexecutive officers.
Compensation Review Cycle
The Committee reviews and monitors the base salary levels of our executive officers, including our NEOs,as well as their annual cash incentive opportunities and equity awards each year in the fall, or more frequently aswarranted. Adjustments are generally effective at the beginning of the fiscal year. Each quarter the Committeereviews Company performance and the corresponding projected payouts under the executive cash incentive planand equity grants, including performance-based awards.
Use of External Advisors
Beginning in fiscal 2006, the Committee engaged Compensia to provide the Committee with information,recommendations, and other advice relating to executive compensation. Compensia serves at the discretion of theCommittee and regularly meets with the Committee, both with and without management present. Compensia’sfees and expenses for the services provided to the Committee for fiscal year 2010 totaled $161,485.
In fiscal 2010, Compensia regularly participated in Committee meetings and provided assistance to theCommittee, including:
• A review and analysis related to our executive officers’ base salary, annual cash incentive compensation,and long-term incentive compensation levels and plan structures for fiscal 2010 and 2011;
• A review of our historical equity utilization practices; and
33
• Preparation of “tally sheets” which the Committee reviewed to ensure that it had a comprehensive view ofour executive officers’ compensation arrangements, including cash compensation (fixed and variable),long-term equity incentive compensation (past awards and the current and projected values of theseawards), and post-employment obligations (severance and change-of control-benefits).
Compensia did not provide any other services beyond advising on executive compensation matters to theCompany in fiscal 2010.
Fiscal 2010 Compensation Components and Decisions for NEOs
The primary elements of our executive compensation program are:
• Base salary;
• Annual cash incentives; and
• Long-term equity incentives.
Base Salary
Base salary represents the most basic, fixed portion of our executive officers’ compensation and is animportant element of compensation intended to retain and motivate highly talented executive officers. TheCommittee reviews the base salaries of our executive officers, including our NEOs, annually, taking intoconsideration Compensia’s market analyses and salary adjustment recommendations for our executive officers(including our CEO), and the factors described under “Competitive Positioning” above. Adjustments, if any, arebased on an individual’s current and expected future performance, pay relative to the competitive market, andinternal equity.
In December 2009, the Committee reviewed the base salaries of our executive officers based on theconsiderations described above and, given the challenging economic environment, no adjustments to basesalaries for our NEOs were made during fiscal 2010.
Executive Title
Beginning Fiscal2009 BaseSalary
Fiscal 2010BaseSalary
(Effective11/1/09)
Total PercentageIncrease
Michael Klayko . . . . . . . . . . . . . . . . CEO $750,000 $750,000 0%
Richard Deranleau . . . . . . . . . . . . . . VP, Finance and CFO $400,000 $400,000 0%
Tejinder Grewal . . . . . . . . . . . . . . . . VP, Corporate Development $330,000 $330,000 0%
Tyler Wall . . . . . . . . . . . . . . . . . . . . . VP, General Counsel $330,000 $330,000 0%
Ian Whiting . . . . . . . . . . . . . . . . . . . . Sr VP, Worldwide Sales $400,000 $400,000 0%
Annual Cash Incentives (Executive Leadership Plan)
For fiscal 2010, the Committee reviewed the structure of the annual cash incentive plan and determined thata renewed focus on growth was appropriate, particularly with respect to the Company’s Ethernet business, aswell as a continued focus on profitability. The Committee also determined that the impact of above targetperformance on cash incentive payouts should be moderated compared to the fiscal 2009 cash incentive plan. Infiscal 2010, only our NEOs participated in the Executive Leadership Plan (ELP), which is the Company’s short-term cash incentive plan.
The objectives of the Executive Leadership Plan are to:
• Drive revenue growth and operating income achievement so that the senior leaders of the organization arefocused on these critical business outcomes and expense management;
34
• Drive execution of operating plan and strategic financial objectives; and
• Reward executives proportional to how well Brocade meets these objectives.
Amounts paid under the ELP are contingent upon the achievement of the above performance goals asapproved by the Company’s Board of Directors.
In fiscal 2010, the annual cash incentive award payouts under the ELP were determined using the followingformula.
Bonus Payout = (Corporate Performance Multiplier1) x (Individual Performance Multiplier2) x(Annual Incentive Target %) x (Annual Salary)
The Corporate Performance Multiplier
• Utilizes the following weighting: 75% on non-GAAP operating income3 performance metrics and 25% onrevenue performance metrics;
• Participants must achieve minimum operating income performance of 80% of target operating incomebefore any awards are paid (i.e., achieving threshold operating income serves as a gate for all paymentsunder the ELP);
• Assuming threshold operating income is achieved, funding/payouts are calculated independently for eachof the operating income and revenue metrics;
• Participants must achieve minimum revenue performance of 80% of target revenue to be entitled to earnany portion of the revenue metric;
• If Company performance is between the threshold and target there is a loss of 2 percentage points ofpayout per each percentage point below target (e.g., 80% performance would mean a payout of 60%);
• If Company performance is above target there is a gain of 3 percentage points of payout per eachpercentage point above target (e.g., 125% performance would mean a payout of 175%) (previouslyperformance above target resulted in a gain of 4 percentage points of payout per percentage point ofperformance); and
• Plan payouts are uncapped.
Individual Performance Percentage
At the beginning of fiscal 2010, our CEO and each of the other NEOs completed a performance contract.The Performance Contract outlined Company and functional specific goals and objectives for each such NEO forthe fiscal year. The CEO reviewed and approved the performance contracts of his direct reports (including each
1 The Corporate Performance Multiplier is based on the following performance metrics and weighting:(a) non-GAAP operating income performance with a 75% weighting, and (b) revenue performance with a25% weighting.
2 The Individual Performance Multiplier is based on individual performance relative to achieving individualperformance and departmental goals and may range from 90-100%. The Individual Performance Multiplieris not applicable to the CEO, whose bonus payout is entirely based on non-GAAP operating income andrevenue performance.
3 Non-GAAP operating income performance excludes certain gains or losses and benefits or costs consistentwith the Company’s reporting of non-GAAP financial performance on a quarterly basis. The Company’sreporting of financial performance on a quarterly basis includes a detailed reconciliation with GAAPfinancial measures.
35

of the other NEOs). The Compensation Committee reviewed the Performance Contracts at the beginning of thefiscal year and reviewed them again prior to the determination of the 2010 Annual Cash Incentive Awards.
Following the end of the fiscal year, the CEO conducted a subjective evaluation of the individualperformance of each executive officer (including each of the NEOs) against goals previously set in the NEO’srespective performance contracts. Both achievement against goals and relative performance between peers isapplied to finalize scores. Each NEO was assigned a percentage performance rating based on his performance forthe year that could range from 90% - 100%. Thus, the subjective assessment of each NEO’s performance couldreduce the ELP award payout by up to 10%. The Committee reviewed and approved the percentage performancerating determined by the CEO for each executive officer (including each of the NEOs other than the CEO). Thisfigure is the individual performance percentage in the formula above.
Since our CEO has responsibility for all aspects of our business, we have not assigned him a separateindividual performance percentage. His award under the ELP is determined solely on the basis of the operatingincome and revenue multiplier percentages and his target annual cash incentive opportunity.
Annual Incentive Target Percentage
For 2010, the Committee determined not to make any changes to the annual incentive target percentages forour NEOs (as a percentage of base salary) from 2009 levels. The annual incentive target percentage opportunityfor the CEO is 150% of base salary, 100% of base salary for Mr. Whiting and 75% of base salary for the otherNEOs.
2010 Annual Cash Incentive Award Determinations
In fiscal 2010, targets under the ELP were intended to be achievable, but only with significant effort. Weexperienced modest operational success as measured by our financial performance against our business plan.Fiscal year 2010 non-GAAP operating income was $443 million, representing 3.8% growth over fiscal year 2009and revenue was $2,094 million, representing 7.2% growth over fiscal year 2009.
• FY10 actual non-GAAP operating income was 81.8% of target, which resulted in a 63.5% operatingincome performance for the formula above
• FY10 actual revenue was 89.5% of target, which resulted in a 79.0% revenue performance for the formulaabove
Thus, the Corporate Performance Multiplier, or plan funding amount, was 67.4% [(63.5% x 75%) + (79% x25%)]. Each NEO’s actual payout was determined and calculated based on their individual performance scoreand their target incentive bonus amount as described above. The target Individual Performance Multiplier scorerange was from 90%-100% however, the actual Individual Performance Multiplier scores were between95%-100%.
As an example, the Bonus Payout for Richard Deranleau (VP, Finance and CFO) was calculated as follows(subject to rounding for presentation purposes): Corporate Performance Multiplier [(non-GAAP operatingincome 63.5% x 75%) + (Revenue 79.0% x 25%)] x Individual Performance Multiplier [100%] x AnnualIncentive Target percentage [(75%] x Annual Salary [$400K] = $202,230
Change to Annual Cash Incentive Plan for Fiscal 2011
During fiscal 2010, the Committee reviewed the structure of the annual cash incentives and determined thatwhile continuing to focus on profitability was important an even greater focus on revenue growth wasappropriate. Accordingly, for fiscal 2011, after consultation with management and Compensia, the Committeemodified the weightings in the annual cash incentive structure in the following ways:
• The weighting of the revenue component has been increased to 60% (or 66-2/3% for the CEO), reflectingthe Company’s focus on growth;
36

• The weighting of the operating income component is 30% (or 33-1/3% for the CEO), reflecting theCompany’s continued focus on profitability; and
• The weighting of the individual component is 10% (or 0% for the CEO, whose annual cash incentivecompensation is entirely tied to revenue and operating income targets), and can now be scored to reflectunder-performance (down to 0% of the target 10%) and over-performance (up to 110% of the target10%).
Cash Compensation
The following table summarizes the target and actual cash compensation paid to the Company’s NEOs infiscal year 2010, including annual cash incentives and base salary.
Annual Cash Incentive
Named ExecutiveOfficer Title Base
Target%
TargetIncentive $
ActualIncentive $
Total CashComp
Michael Klayko . . . . . CEO $750,000 150% $1,125,000 $758,363 $1,508,363Richard Deranleau . . . VP, Finance and CFO $400,000 75% $ 300,000 $202,230 $ 602,230Tejinder Grewal . . . . . VP, Corporate Development $330,000 75% $ 247,500 $166,840 $ 496,840Tyler Wall . . . . . . . . . VP, General Counsel $330,000 75% $ 247,500 $166,840 $ 496,840Ian Whiting . . . . . . . . Sr VP, Worldwide Sales $400,000 100% $ 400,000 $256,158 $ 656,158
Long-Term Equity Incentives
The Committee believes that long-term equity incentives should focus our executive officers on stockholdervalue creation through long-term Company performance, as well as motivate them and retain their services in acompetitive job market by providing significant long-term earnings potential. To achieve these objectives, we uselong-term equity incentives both as part of the regular annual compensation program for our executive officersand to address special situations as they may arise from time to time and on a case by case basis. The Company’sequity award practices have been designed to reflect a balance between:
• Stockholders’ dilution concerns;
• The Company’s need to remain competitive in recruiting; and
• The Company’s need to motivate and retain executive talent.
The Committee believes restricted stock unit (RSU) awards provide an incentive for our NEO’s to focus ondriving increased stockholder value over their vesting period, use fewer shares than stock options, provide rewardfor growth in our stock price and long-term value creation, and an incentive to remain employed with theCompany. The Company’s RSU awards can take the form of performance-based and service-based awards.
The following table summarizes long-term performance-based and service-based equity awards granted tothe NEOs in December 2009 for fiscal year 2010 as part of the Compensation Committee’s annual focal reviewprocess. The Committee allocated to the NEO’s approximately 75% of equity award value in performance-basedRSUs and 25% of equity award value in service-based RSUs.
Award Type GrantDate
Vesting Detail/Date
REGULAR ANNUAL AWARDS
Performance Based RSU’s December2009
2-year performance period ending October2011; 50% vests in 2011 and 50% vests in2012
Service Based RSU’s December2009
Vests over 3 years with 1/3 vesting annually
37

Performance-based RSUs are designed to link executive compensation with increased stockholder value.The actual number of shares of our common stock issuable under the performance award is variable based onover- or under-performance of Brocade’s stock compared to the Nasdaq-100 Index during the performanceperiod.
Service-based RSUs require executives to remain continuously employed by the Company through theapplicable vesting dates. The value of service-based RSU awards is tied to the price of the Company’s commonstock and thus aligned with stockholder interests.
The following table shows the target equity awards granted to the NEOs in December 2009 for FY10 andreflects approximately 75% of target equity award value in performance-based RSU’s and approximately 25% oftarget equity award value in service-based RSU’s. The actual number of shares of common stock issuable underthe performance-based awards is variable based on over- or under-performance of Brocade’s stock pricecompared to the Nasdaq-100 index over the performance period.
Named Executive Officer
Performance-BasedAwards Service-Based Awards
Total ValueRSUs
Granted*Grant DateFair Value
RSUsGranted
GrantDate FairValue
Michael Klayko . . . . . . . . . . . . . . . . . . . . . . . . . . . . . 210,000 $2,444,610 113,000 $837,330 $3,281,940Richard Deranleau . . . . . . . . . . . . . . . . . . . . . . . . . . . 67,000 $ 779,947 36,000 $266,760 $1,046,707Tejinder Grewal . . . . . . . . . . . . . . . . . . . . . . . . . . . . . 67,000 $ 779,947 36,000 $266,760 $1,046,707Tyler Wall . . . . . . . . . . . . . . . . . . . . . . . . . . . . . . . . . 52,300 $ 608,824 28,100 $208,221 $ 817,045Ian Whiting . . . . . . . . . . . . . . . . . . . . . . . . . . . . . . . . . 100,500 $1,169,921 54,000 $400,140 $1,570,061
* The number of shares listed above reflects the target number of shares and is adjusted pursuant to the termsof the award based on over- or under-performance.
Our actual annual average “burn rate” (that is, the number of shares granted subject to long-term equityincentives divided by the total number of shares of the Company’s common stock outstanding), excludingacquisitions, was approximately 3.5% during the period from fiscal 2007 through fiscal 2010, which is within thepermitted guidelines of the major proxy advisory firms.
Benefits and Perquisites
Our NEOs are provided with an Executive health and welfare benefit program offered by the StanfordLifeLong Health Program. In addition, our NEOs have the opportunity to participate in a Section 401(k) profit-sharing plan. We also offer our employees, including our NEOs, the opportunity to purchase shares of theCompany’s common stock at a discount under the Company’s employee stock purchase plan. The Company hasaccess to a fractional interest in an aircraft for certain business travel purposes. Under certain circumstances, andwith prior approval, the Company permits certain executive officers, including the Named Executive Officers, touse the aircraft for personal use subject to reimbursement for equivalent first class airfare for such use.Historically this has been used infrequently.
Except as disclosed in the Summary Compensation Table on page 42 of this proxy statement, we do notprovide any additional perquisites or other personal benefits to our NEOs.
Post-Employment Compensation Arrangements
We believe that concerns about potential job loss and/or the possibility or occurrence of a change-in-controlof the Company can create uncertainty for our executive officers that may unduly affect their performance. Infiscal 2007, after careful review of market practices and input from Compensia, the Committee amended theemployment agreements of our executive officers, including our NEOs, to harmonize the severance andchange-in-control protection for our executives and to ensure that this protection was consistent with peercompany and market practices.
38

For information on the specific terms and conditions of the employment agreements of our NEOs, see thediscussion of “Employment, Change of Control and Severance Arrangements” beginning on page 48 of thisproxy statement. In addition, for information on the severance and change-in-control arrangements for our NEOs,as well as an estimate of the potential payments and benefits payable under these arrangements as of the end offiscal 2010, see “2010 Potential Payments Upon Termination or Change in Control” beginning on page 49 of thisproxy statement.
Reasonableness of Compensation
The Committee believes that the Company is operating in accordance with its compensation philosophy andis achieving its compensation objectives. The Committee also believes that the target pay positioning and paymix for our NEOs are reasonable and appropriate. Specifically, the Committee believes that our NEOs areappropriately rewarded for the creation of stockholder value, the achievement of operational success, and theirindividual contributions.
Other Compensation Policies
Equity Grant Practices
Our equity grant practices are set forth in our “Equity Awards Granting Policy.” In accordance with thispolicy, the annual equity awards granted to our NEOs are typically made, and grant prices set, on the secondThursday of December. Grant dates for new hire awards are set on the fourth Thursday of each month (other thanin December, in which case it is the second Thursday of the month). In the case of annual, promotional awardsand new hire awards, grant dates are set irrespective of blackout periods. The exercise price of stock optiongrants is approved based on the closing market price of the Company’s common stock on the date of grant.Awards are determined by the Committee, or its designated subcommittee, in accordance with both theCommittee’s charter and the Company’s “Equity Awards Granting Policy.”
Equity awards (other than acquisition-related awards) are made subject to an annual equity pool approvedby the Committee, which in fiscal 2010 was a net pool of approximately 15 million shares or 3.4% of theCompany’s outstanding shares.
Rule 10b5-1 Trading Plans
Each of our NEOs and directors may enter into a written plan for the automatic trading of securities inaccordance with Exchange Act Rule 10b5-1. The Company may also enter into a written plan for the automatictrading of securities in accordance with Rule 10b5-1 with respect to its stock repurchase program.
Tax and Accounting Considerations
Income Tax Considerations
In making compensation decisions, the Committee considers the potential effects of Section 162(m) of theInternal Revenue Code on the compensation paid to our NEOs. Section 162(m) disallows an income taxdeduction to any publicly-held corporation for individual remuneration paid to certain executive officersexceeding $1 million in any taxable year, unless the remuneration is “performance-based.”
The Committee has examined our current executive compensation program and understands that somecompensation paid to our NEOs during fiscal 2010 may or may not be deductible under Section 162(m).However, based on its examination, the Committee does not believe that the loss of any income tax deductionswill be likely to have a material negative financial impact on the Company. The Committee also believes that it isimportant to retain the flexibility to motivate superior performance through awards or programs that do not meetall of the requirements of Section 162(m). The Committee will continue to monitor the issue of deductibility, andmake adjustments to our executive compensation program to maximize the deductibility of our executivecompensation to the extent that it believes such result is consistent with the objectives of individualcompensation elements and the interests of our stockholders.
39
Nonqualified Deferred Compensation
Section 409A of the Internal Revenue Code imposes significant taxes in the event that an NEO, director, orother service provider receives “deferred compensation” that does not satisfy the requirements of the provision.Although we do not maintain a traditional nonqualified deferred compensation plan, Section 409A also applies tocertain equity awards and severance arrangements which we maintain. Consequently, to assist our NEOs,directors, and employees in avoiding additional tax under Section 409A, we have developed the severancearrangements as described in the Proxy and structured our equity awards in a manner intended to either avoid theapplication of Section 409A or, to the extent doing so is not possible, comply with the applicable requirements.
Accounting for Stock-Based Compensation
We follow the applicable accounting rules for our stock-based compensation awards. The applicableaccounting rules require companies to calculate the grant date “fair value” of their stock-based awards grantsusing a variety of assumptions. This calculation is performed for accounting purposes and reported in thecompensation tables below, even though recipients may never realize any value from their awards. Theapplicable accounting rules also require companies to recognize the compensation cost of their stock-basedcompensation awards in their income statements over the period that a recipient is required to render service inexchange for the option or other award.
Compensation and Risk
In December of 2010 and January of 2011, with the assistance of Compensia, we carefully reviewed ourcompensation policies and practices and determined that they do not encourage our employees to, or reward ouremployees for, taking inappropriate or excessive risks or create risks that are reasonably likely to have a materialadverse effect on the Company. We believe the following characteristics of our compensation programs work toreduce the possibility of our employees, including our executive officers, either individually or as a group,making excessively risky business decisions that could maximize short-term results at the expense of long-termvalue:
• We base our compensation policies and practices on a well-defined and appropriate pay philosophy, peergroup and market positioning for each employee group.
• We structure employee compensation packages to reflect a balance between cash and equity-basedcompensation, and short- and long-term performance focus, based on the nature of each employeegroups’ responsibilities and market practices.
• Performance objectives are set with a reasonable probability of achievement and tied to the annualoperating budget and long-term strategic planning objectives approved by our Board of Directors.
• We attempt to structure our compensation policies and practices so that they are based on consistentperformance objectives across the company, including annual targets that are based on companyperformance.
• In the case of our executive compensation program:
• We use multiple performance measures in the annual cash incentive plan.
• The performance-based equity incentives are subject to annual maximum payouts.
• The Committee has retained an external executive compensation consultant to advise on marketpractices and the suitability of its compensation actions and decisions.
40

Compensation Committee Report
The Committee has reviewed and discussed the Compensation Discussion and Analysis required byItem 402(b) of Regulation S-K with management. Based on such review and discussions, the Committee hasrecommended to the Board of Directors that the Compensation Discussion and Analysis be included in theCompany’s annual report on Form 10-K and this proxy statement.
Respectfully submitted by the members of the Compensation Committee of the Board of Directors:
Sanjay Vaswani (Chair)Renato DiPentimaDavid L. HouseL. William Krause
41

The following table sets forth summary information concerning compensation paid or accrued for servicesrendered to the Company in all capacities to (i) the Company’s Chief Executive Officer, (ii) the Company’sChief Financial Officer and (iii) the Company’s other three most highly compensated executive officers whowere serving as executive officers at the end of fiscal year 2010.
Summary Compensation Table
Name and Principal Position YearSalary($)(1)
StockAwards ($)(2)
OptionAwards ($)(3)
Non-EquityIncentive PlanCompensation
($)(4)
All OtherCompensation
($)(5) Total ($)
Michael Klayko, . . . . . . . . . .Chief Executive Officer
2010 744,231 3,281,940 — 758,363 20,341 4,804,8752009 726,924 3,631,181 2,399,100 2,421,953 9,032 9,188,1902008 725,000 821,100 929,150 1,337,549 23,158 3,835,957
Richard Deranleau, . . . . . . . .VP, Finance and ChiefFinancial Officer
2010 396,923 1,046,707 — 202,230 6,500 1,652,3602009 387,693 2,095,281 608,462 645,854 29,801 3,767,0912008 340,000 214,200 292,019 376,358 5,531 1,228,108
Tejinder Grewal, . . . . . . . . . .VP, CorporateDevelopment
2010 327,462 1,046,707 — 166,840 6,500 1,547,5092009 319,847 2,168,181 678,799 532,830 32,401 3,732,0582008 315,000 214,200 225,651 348,685 3,000 1,106,536
Tyler Wall, . . . . . . . . . . . . . .VP, General Counsel(6)
2010 330,000 817,045 — 166,840 6,500 1,320,3852009 317,308 2,134,381 508,222 532,830 29,801 3,522,542
Ian Whiting, . . . . . . . . . . . . .Sr VP, WW Sales
2010 400,000 1,570,061 — 256,158 9,732 2,235,9512009 384,616 2,095,281 608,462 861,139 41,947 3,991,4452008 375,840 321,300 331,840 416,036 33,564 1,478,580
(1) Actual salary earned during fiscal 2009 reflects a company-wide mandatory unpaid time-off program.
(2) These amounts reflect the grant date fair value for these awards computed in accordance with FASB ASCTopic 718 and do not reflect the actual amounts earned. Pursuant to applicable SEC rules, awards listed inthe above table for fiscal 2009 and 2008 reflect a different method (grant date fair value) than amountsdisclosed for the same years in previous proxy statements. For additional information, see Note 14 of ourfinancial statements in the Form 10-K for the year ended October 30, 2010, as filed with the SEC. See alsothe “2010 Grants of Plan-Based Awards” table for information on stock awards granted in 2010.
(3) These amounts reflect the grant date fair value for these awards and do not reflect the actual amountsearned. Pursuant to applicable SEC rules, awards listed in the above table for fiscal 2009 and 2008 reflect adifferent method (grant date fair value) than amounts disclosed for the same years in previous proxystatements. See the “2010 Grants of Plan-Based Awards” table for information on stock option awardsgranted in fiscal year 2010.
(4) For fiscal 2010 and 2009, these amounts include payments under the Senior Leadership Plan. The actualpayments under that plan are included in the “Actual Payouts Under Non-Equity Incentive Plan” column ofthe “2009 Grants of Plan-Based Awards” table below. See the “Compensation Discussion and Analysis”section above for more information. For fiscal 2008, these amounts include payments under the SeniorLeadership Plan.
(5) For fiscal 2010, these amounts consist of benefits rendered by participating in the Stanford Health Programand expenses paid by the Company for participating in the Company’s 401(k) plan match program, guestexpenses paid by the Company on a business-related trip and limited personal use of the Company’s accessto a fractional interest in an aircraft by the Company’s Chief Executive Officer, which amount includes onlyvariable operating costs incurred for the particular flight activity net of reimbursement for equivalent firstclass airfare. For fiscal 2009, these amounts consist of expenses paid by the Company for participating in
42

the Company’s 401(k) plan match program, guest expenses paid by the Company on a business-related trip,and housing and certain other expenses paid by the Company for a personal trip as a special spot bonus andbenefits rendered by participating in the Stanford Health Program. For fiscal 2008, these amounts consist ofexpenses paid by the Company for participating in the Company’s 401(k) match program, guest expensespaid by the Company on a business-related trip and benefits rendered by participating in the Stanford HealthProgram.
(6) No data provided for fiscal 2008 for Mr. Wall pursuant to applicable SEC rules.
43

The
follo
wingtableshow
sallplan-based
awards
grantedto
thenamed
executiveofficers
during
fiscal
year
2010.The
SLPaw
ards
arecash
awards
andtheothers
arenon-cash
awards.T
heop
tionaw
ards
andtheunvested
portionof
thestockaw
ards
identifiedin
thetablebelow
arealso
reported
inthe
“Outstanding
Equity
Awards
at2010
FiscalYear-End”tablebelow.
2010
Grantsof
Plan-Based
Awards
Estim
ated
PossiblePayou
tsUnd
erNon
-Equ
ityIncentivePlanAwards
Estim
ated
FuturePayou
tsUnd
erEqu
ityIncentivePlanAwards
Nam
eTyp
e(1)
Grant
Date
Thresho
ld($)
Target($)
Maxim
um($)
Actua
lPayou
tsUnd
erNon
-Equ
ity
Incentive
Plan($)
Thresho
ld#
Target#
Maxim
um#
Stock
Awards:
Num
ber
ofSh
ares
ofStock
orUnits
(#)
Grant
DateFair
Value
ofStockan
dOption
Awards(2)
MichaelKlayko...............
SLP
405,000
1,125,000
758,363
RSU
12/11/09
113,000
837,330
MSU
12/11/09
210,000
545,000
2,444,610
Richard
Deranleau
.............
SLP
97,200
300,000
202,230
RSU
12/11/09
36,000
266,760
MSU
12/11/09
67,000
175,000
779,947
TejinderGrewal
..............
SLP
80,190
247,500
166,840
RSU
12/11/09
36,000
266,760
MSU
12/11/09
67,000
175,000
779,947
Tyler
Wall...................
SLP
80,190
247,500
166,840
RSU
12/11/09
28,100
208,221
MSU
12/11/09
52,300
135,000
608,824
IanWhitin
g..................
SLP
129,600
400,000
256,158
RSU
12/11/09
54,000
400,140
MSU
12/11/09
100,500
260,000
1,169,921
(1)
RSU
means
arestricted
stockunitthat
vestsifthegranteeremains
employed
bytheCom
pany
atcertaintim
es.SL
Pmeans
Senior
LeadershipPlan.
MSU
means
aMarketS
tock
Unit.See“C
ompensationDiscussionandAnalysis”
aboveformoredetails.
(2)
These
amountsreflectthegrantdate
fair
valueof
such
awardcomputedin
accordance
with
FASB
ASC
Topic
718anddo
notreflecttheactual
amountsearned.Fo
radditio
nalinform
ation,
seeNote14
ofourfinancialstatem
entsin
theFo
rm10-K
fortheyear
endedOctober
30,2
010,
asfiled
with
theSE
C.
44
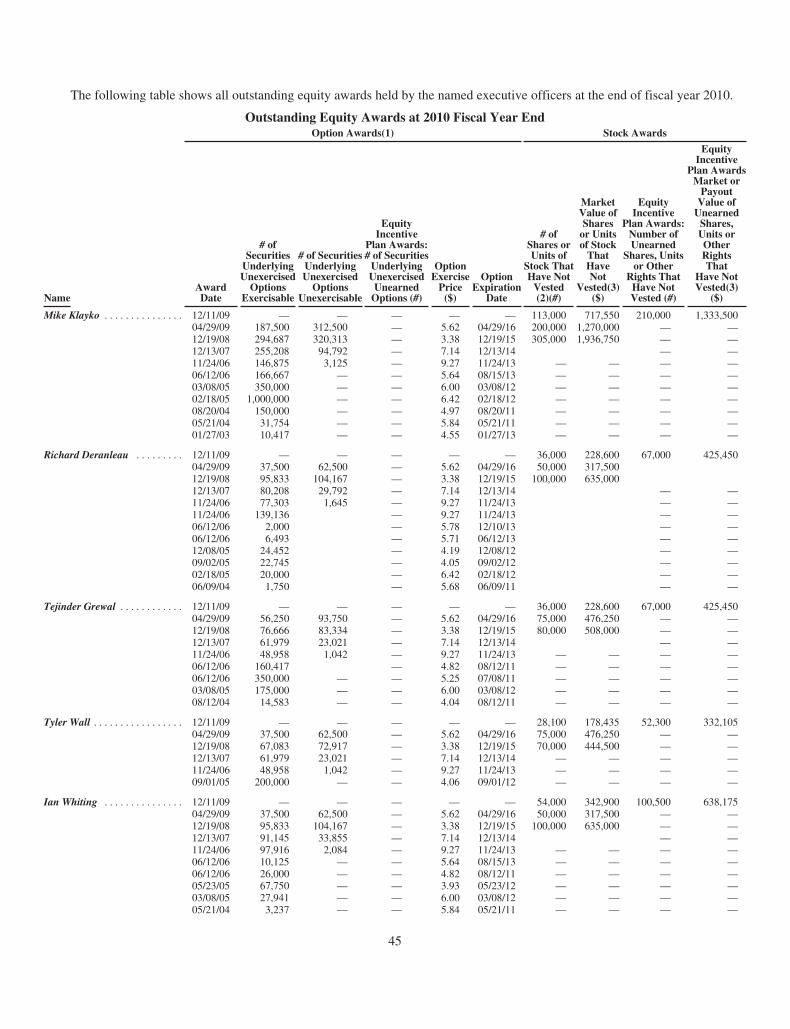
The following table shows all outstanding equity awards held by the named executive officers at the end of fiscal year 2010.
Outstanding Equity Awards at 2010 Fiscal Year EndOption Awards(1) Stock Awards
NameAwardDate
# ofSecuritiesUnderlyingUnexercisedOptions
Exercisable
# of SecuritiesUnderlyingUnexercisedOptions
Unexercisable
EquityIncentive
Plan Awards:# of SecuritiesUnderlyingUnexercisedUnearnedOptions (#)
OptionExercisePrice($)
OptionExpiration
Date
# ofShares orUnits of
Stock ThatHave NotVested(2)(#)
MarketValue ofSharesor Unitsof StockThatHaveNot
Vested(3)($)
EquityIncentive
Plan Awards:Number ofUnearned
Shares, Unitsor Other
Rights ThatHave NotVested (#)
EquityIncentive
Plan AwardsMarket orPayoutValue ofUnearnedShares,Units orOtherRightsThat
Have NotVested(3)
($)
Mike Klayko . . . . . . . . . . . . . . . 12/11/09 — — — — — 113,000 717,550 210,000 1,333,50004/29/09 187,500 312,500 — 5.62 04/29/16 200,000 1,270,000 — —12/19/08 294,687 320,313 — 3.38 12/19/15 305,000 1,936,750 — —12/13/07 255,208 94,792 — 7.14 12/13/14 — —11/24/06 146,875 3,125 — 9.27 11/24/13 — — — —06/12/06 166,667 — — 5.64 08/15/13 — — — —03/08/05 350,000 — — 6.00 03/08/12 — — — —02/18/05 1,000,000 — — 6.42 02/18/12 — — — —08/20/04 150,000 — — 4.97 08/20/11 — — — —05/21/04 31,754 — — 5.84 05/21/11 — — — —01/27/03 10,417 — — 4.55 01/27/13 — — — —
Richard Deranleau . . . . . . . . . 12/11/09 — — — — — 36,000 228,600 67,000 425,45004/29/09 37,500 62,500 — 5.62 04/29/16 50,000 317,50012/19/08 95,833 104,167 — 3.38 12/19/15 100,000 635,00012/13/07 80,208 29,792 — 7.14 12/13/14 — —11/24/06 77,303 1,645 — 9.27 11/24/13 — —11/24/06 139,136 — 9.27 11/24/13 — —06/12/06 2,000 — 5.78 12/10/13 — —06/12/06 6,493 — 5.71 06/12/13 — —12/08/05 24,452 — 4.19 12/08/12 — —09/02/05 22,745 — 4.05 09/02/12 — —02/18/05 20,000 — 6.42 02/18/12 — —06/09/04 1,750 — 5.68 06/09/11 — —
Tejinder Grewal . . . . . . . . . . . . 12/11/09 — — — — — 36,000 228,600 67,000 425,45004/29/09 56,250 93,750 — 5.62 04/29/16 75,000 476,250 — —12/19/08 76,666 83,334 — 3.38 12/19/15 80,000 508,000 — —12/13/07 61,979 23,021 — 7.14 12/13/14 — —11/24/06 48,958 1,042 — 9.27 11/24/13 — — — —06/12/06 160,417 — 4.82 08/12/11 — — — —06/12/06 350,000 — — 5.25 07/08/11 — — — —03/08/05 175,000 — — 6.00 03/08/12 — — — —08/12/04 14,583 — — 4.04 08/12/11 — — — —
Tyler Wall . . . . . . . . . . . . . . . . . 12/11/09 — — — — — 28,100 178,435 52,300 332,10504/29/09 37,500 62,500 — 5.62 04/29/16 75,000 476,250 — —12/19/08 67,083 72,917 — 3.38 12/19/15 70,000 444,500 — —12/13/07 61,979 23,021 — 7.14 12/13/14 — — — —11/24/06 48,958 1,042 — 9.27 11/24/13 — — — —09/01/05 200,000 — — 4.06 09/01/12 — — — —
Ian Whiting . . . . . . . . . . . . . . . 12/11/09 — — — — — 54,000 342,900 100,500 638,17504/29/09 37,500 62,500 — 5.62 04/29/16 50,000 317,500 — —12/19/08 95,833 104,167 — 3.38 12/19/15 100,000 635,000 — —12/13/07 91,145 33,855 — 7.14 12/13/14 — —11/24/06 97,916 2,084 — 9.27 11/24/13 — — — —06/12/06 10,125 — — 5.64 08/15/13 — — — —06/12/06 26,000 — — 4.82 08/12/11 — — — —05/23/05 67,750 — — 3.93 05/23/12 — — — —03/08/05 27,941 — — 6.00 03/08/12 — — — —05/21/04 3,237 — — 5.84 05/21/11 — — — —
45

(1) All options vest at the rate of 1/48th per month and vest completely after four years as long as the grantee remains employed by theCompany, except as follows: the options granted on 6/12/06 were granted in connection with the Section 409A option exchange and vestbased on the schedule of the original underlying grant which originally was at the rate of 1/48th per month; the option granted on 2/18/05vests one half after two years and the rest at the rate of 1/24th per month over the remaining two years; the options granted on 8/20/04vest at the rate of 1/36th per month and vest completely after 3 years; the options granted on 1/27/03 vest one quarter after one year andthe rest at the rate of 1/36th per month over the remaining 3 years.
(2) The RSUs granted 12/19/08 and 12/11/09 vest two years from 11/1/08 and 11/1/09, respectively, as long as the grantee remainsemployed by the Company. The RSUs granted 4/29/09 vest 50% on the 2nd anniversary of the grant date and the remaining 50% on the3rd anniversary of the grant date as long as the grantee remains employed by the Company.
(3) Calculations based on the closing price of the Company’s common stock of $6.35 per share at the Company’s 2010 fiscal year end.
46
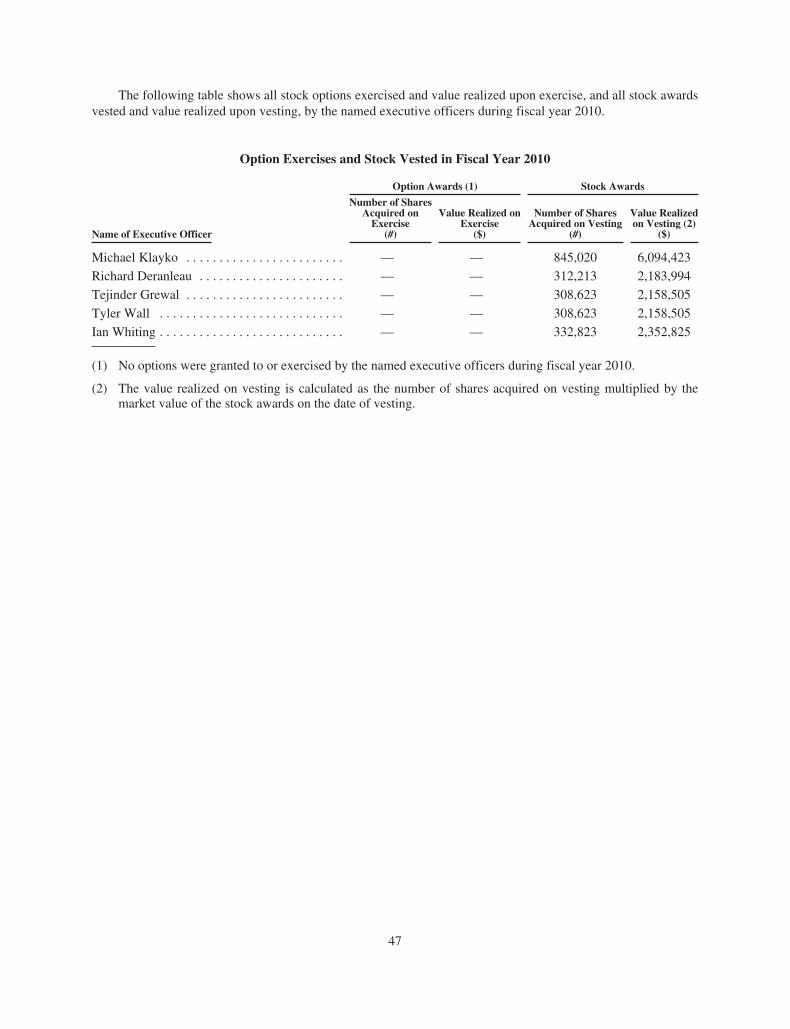
The following table shows all stock options exercised and value realized upon exercise, and all stock awardsvested and value realized upon vesting, by the named executive officers during fiscal year 2010.
Option Exercises and Stock Vested in Fiscal Year 2010
Option Awards (1) Stock Awards
Name of Executive Officer
Number of SharesAcquired onExercise
(#)
Value Realized onExercise
($)
Number of SharesAcquired on Vesting
(#)
Value Realizedon Vesting (2)
($)
Michael Klayko . . . . . . . . . . . . . . . . . . . . . . . . — — 845,020 6,094,423
Richard Deranleau . . . . . . . . . . . . . . . . . . . . . . — — 312,213 2,183,994
Tejinder Grewal . . . . . . . . . . . . . . . . . . . . . . . . — — 308,623 2,158,505
Tyler Wall . . . . . . . . . . . . . . . . . . . . . . . . . . . . — — 308,623 2,158,505
Ian Whiting . . . . . . . . . . . . . . . . . . . . . . . . . . . . — — 332,823 2,352,825
(1) No options were granted to or exercised by the named executive officers during fiscal year 2010.
(2) The value realized on vesting is calculated as the number of shares acquired on vesting multiplied by themarket value of the stock awards on the date of vesting.
47
Employment, Change of Control and Severance Arrangements
On May 11, 2007, the Compensation Committee approved Amended and Restated Change of ControlRetention Agreements for our Named Executive Officers (each a “Retention Agreement,” and collectively, the“Retention Agreements”). Each Retention Agreement has a five-year term, subject to mutual renewal and certainautomatic extensions if Brocade enters into a definitive agreement regarding a change of control (as defined inthe Retention Agreements). Pursuant to the terms of the Retention Agreements, if the employment of a NamedExecutive Officer is terminated by Brocade without “cause” (as defined in the Retention Agreements) and suchtermination does not occur in connection with a change of control (as defined in the Retention Agreements), then,subject to the Named Executive Officer signing a release of claims in favor of Brocade and agreeing not todisparage Brocade for a period of 12 months following termination, the Named Executive Officer shall beentitled to receive (1) a lump sum payment equal to six months’ base salary and 50% of the Named ExecutiveOfficer’s target cash bonus under the Senior Leadership Plan for the fiscal year in which the termination occurs(12 months’ base salary and 100% of target cash bonus for Mr. Klayko), and (2) Brocade-paid COBRA benefitsfor six months (12 months for Mr. Klayko). In the event the Named Executive Officer’s employment isterminated by Brocade without cause or by such executive for “good reason” (as defined in the RetentionAgreements) within 30 days prior to, or 12 months after, a “change of control” (as defined in the RetentionAgreements), then the Named Executive Officer instead will be eligible to receive, subject to signing a release ofclaims in favor of Brocade and agreeing not to disparage Brocade for a period of 12 months followingtermination, (1) a lump sum payment equal to 12 months’ base salary and 100% of the Named ExecutiveOfficer’s target cash bonus under the Senior Leadership Plan for the fiscal year in which termination occurs (24months’ base salary and 200% of target cash bonus for Mr. Klayko), (2) Brocade-paid COBRA benefits for12 months (18 months for Mr. Klayko), and (3) full accelerated vesting with respect to the Named ExecutiveOfficer’s then outstanding, unvested equity awards. In the event severance payments and benefits trigger excisetaxation under Sections 280G and 4999 of the Internal Revenue Code of 1986, as amended, severance shall beeither (1) paid in full, or (2) reduced so the Named Executive Officer is not subject to excise taxation, whicheverresults in the Named Executive Officer’s receipt of the greatest after-tax severance amount. In December 2008,Brocade and each of the Named Executive Officers entered into certain amendments to the RetentionAgreements to ensure documentary compliance with Section 409A of the Internal Revenue Code of 1986, asamended, and any final regulations and official guidance promulgated thereunder (together, “Section 409A”) inorder to avoid the imposition of any unintended, additional tax under Section 409A. In addition, the RetentionAgreements do not include any tax gross-up provisions, whether in connection with Sections 280G or 4999 of theInternal Revenue Code of 1986, as amended, or otherwise.
The 1999 Stock Plan provides that, in the event of a “merger” or “asset sale” (as defined in that plan), andthe 2009 Stock Plan provides that, in the event of a “change in control” (as defined in that plan), outstandingequity awards immediately vest in full, unless outstanding awards are assumed by the acquirer or new awards areprovided in substitution for existing awards.
48

The following table quantifies the estimated payments and benefits that would be provided to each namedexecutive officer upon termination in the regular course of business or termination in connection with achange-of-control of the Company as of the last day of our fiscal year 2010.
2010 Potential Payments upon Termination or Change in ControlTermination Without
Cause Not inConnection with aChange of Control
Change of Control(apart fromtermination)
InvoluntaryTermination in
Connection with aChange of Control(1)
Michael Klayko . . . . . . . . . Salary $ 750,000 $0 $1,500,000Bonus $1,125,000 $0 $2,250,000COBRA $ 15,401 $0 $ 23,102Equity Acceleration(2) $ 0 $0 $5,444,782280G Excise Tax Reduction — — —Total $1,890,401 $0 9,225,584
Richard Deranleau . . . . . . . Salary $ 200,000 $0 $ 400,000Bonus $ 150,000 $0 $ 300,000COBRA $ 4,702 $0 $ 9,405Equity Acceleration(2) $ 0 $0 $1,644,903280G Excise Tax Reduction — — —Total $ 354,702 $0 $2,354,308
Tejinder Grewal . . . . . . . . Salary $ 165,000 $0 $ 330,000Bonus $ 123,750 $0 $ 247,500COBRA $ 7,962 $0 $ 15,924Equity Acceleration(2) $ 0 $0 $1,637,591280G Excise Tax Reduction — — —Total $ 296,712 $0 $2,231,015
Tyler Wall . . . . . . . . . . . . . Salary $ 165,000 $0 $ 330,000Bonus $ 123,750 $0 $ 247,500COBRA $ 8,982 $0 $ 17,964Equity Acceleration(2) $ 0 $0 $1,446,305280G Excise Tax Reduction — — —Total $ 297,732 $0 $2,041,770
Ian Whiting . . . . . . . . . . . . Salary $ 200,000 $0 $ 400,000Bonus $ 200,000 $0 $ 400,000COBRA $ 8,007 $0 $ 16,013Equity Acceleration(2) $ 0 $0 $1,813,609280G Excise Tax Reduction — — —Total $ 408,007 $0 $2,629,622
(1) Based on calculated severance amounts, no executive would be subject to excise taxes under Sections 280Gand 4999 of the Internal Revenue Code. 280G value of severance and benefit payments for each NamedExecutive Officer was calculated assuming (1) an October 31, 2010 change of control and termination ofemployment, (2) 0.49% and 2.07% short- and mid-term present value factors, (3) a 2.63% risk free rate,(4) 51.30% stock option volatility (which is the average volatility for options granted by Brocade in 2010),(5) three-month remaining life on stock options, and (6) no Named Executive Officer received a paymentthat is contingent on a change of control.
(2) Reflects Brocade’s closing stock price of $6.35 on October 31, 2010, or, since that date was a Sunday, onthe most recent prior day in which the national stock exchanges including the NASDAQ Global SelectMarket were open for trading, minus the exercise price for stock options and $6.35 minus the purchase pricefor restricted shares and restricted stock units, multiplied by the number of shares covered by eachaccelerating award. In the event of a change of control where the acquirer refuses to assume or substitute foroutstanding equity awards, vesting of such awards accelerates in full. In such an event, and assuming anOctober 31, 2010 change of control and a $6.35/share transaction price, the value of each named executiveofficer’s equity acceleration equals the equity acceleration value set forth in the column labeled InvoluntaryTermination in Connection with a Change of Control.
49

Equity Compensation Plan Information
The following table summarizes information with respect to shares of the Company’s common stock thatmay be issued under the Company’s existing equity compensation plans as of October 30, 2010 (in thousands,except per share amounts):
A B C
Plan Category
Number of Securitiesto be Issued
Upon Exercise ofOutstanding Options
Weighted-AverageExercise Price of
Outstanding Options
Number of SecuritiesRemaining Availablefor Future Issuance
Under EquityCompensation Plans(Excludes Securities
Reflected in Column A)
Equity compensation plans approved bystockholders(1) . . . . . . . . . . . . . . . . . . . . . . . . 66,533(2) $4.64 48,377(3)
Equity compensation plans not approved bystockholders(4)(5) . . . . . . . . . . . . . . . . . . . . . . 5,956 $6.63 —
Total . . . . . . . . . . . . . . . . . . . . . . . . . . . . . . . . . . 72,489 $4.80 48,377
(1) Primarily consists of the 2009 ESPP, the 2009 and 1999 Director Plans, and the 2009 and 1999 Stock Plans.
(2) Amount excludes purchase rights accrued under the 2009 ESPP. As of October 30, 2010, the 2009 ESPPhad a stockholder-approved reserve of 35.0 million shares, of which 27.2 million shares were available forfuture issuance.
(3) Amount consists of shares available for future issuance under the 2009 ESPP, the 2009 Director Plan andthe 2009 Stock Plan.
(4) Consist solely of the 1999 NSO Plan described in Note 12 to the financial statements contained in theCompany’s annual report on Form 10-K for the fiscal year ended October 30, 2010 and Foundry’s 2000NSO Plan, which was assumed in connection with our acquisition of Foundry.
(5) Substantially all shares were granted prior to the fiscal year ended October 25, 2003. Information relating toequity compensation plans is set forth in Note 12 to the financial statements contained in the Company’sannual report on Form 10-K for the fiscal year ended October 30, 2010.
For a description of the material features of the compensation plans under which equity securities of theCompany are authorized for issuance which were adopted without approval by stockholders, see Note 14 to thefinancial statements contained in the Company’s annual report on Form 10-K for the fiscal year endedOctober 30, 2010 which descriptions are incorporated herein by reference.
50
SECTION 16(a) BENEFICIAL OWNERSHIP REPORTING COMPLIANCE
Section 16(a) of the Exchange Act requires our executive officers, directors and ten percent stockholders tofile reports of ownership and changes in ownership with the SEC. The same persons are required to furnish uswith copies of all Section 16(a) forms they file. Based solely on our review of such forms furnished to us duringthe most recent fiscal year, we believe that all of our executive officers, directors and ten percent stockholderscomplied with the applicable filing requirements.
CERTAIN RELATIONSHIPS AND RELATED TRANSACTIONS
Except for the compensation agreements and other arrangements that are described under “Employment,Change of Control and Severance Arrangements” and indemnification agreements with each of its directors andcertain executive officers which require the Company to indemnify such individuals, to the fullest extentpermitted by Delaware law, for certain liabilities to which they may become subject as a result of their affiliationwith the Company, there was not during fiscal year 2010 nor is there currently proposed, any transaction or seriesof similar transactions to which Brocade was or is to be a party in which the amount involved exceeds $120,000and in which any director, executive officer, five percent stockholder or any member of the immediate family ofany of the foregoing persons had or will have a direct or indirect material interest.
The Audit Committee is responsible for reviewing and approving in advance any proposed related persontransactions. The Audit Committee reviews any such proposed related person transactions on a quarterly basis, ormore frequently as appropriate. In cases in which a transaction has been identified as a potential related persontransaction, management must present information regarding the proposed transaction to the Audit Committeefor consideration and approval or ratification. During fiscal 2010, the Audit Committee was also responsible forreviewing the Company’s policies with respect to related person transactions and overseeing compliance withsuch practices. During fiscal 2010, Matthew Roberts, the son-in-law of the Company’s Chief Executive Officer,Michael Klayko, was hired as a business development specialist at the Company, an on-going, full-time, position.Mr. Roberts is not an “executive officer” of the Company and does not directly report to Mr. Klayko.Mr. Roberts is currently compensated at a level that the Company believes is comparable to other employees insimilar positions of responsibility. During fiscal 2010, Keri Sponseller, the daughter of the Company’s ChiefExecutive Officer, Michael Klayko, was employed as a marketing communications specialist at the Company, anon-going, full-time, position. Ms. Sponseller is not an “executive officer” of the Company and does not directlyreport to Mr. Klayko. Ms. Sponseller is currently compensated at a level that the Company believes iscomparable to other employees in similar positions of responsibility. The Audit Committee has reviewed bothtransactions and recommended them for inclusion here.
51

AUDIT COMMITTEE REPORT
The following is the report of the Audit Committee of the Board of Directors. The Audit Committee hasreviewed and discussed our audited financial statements for the fiscal year ended October 30, 2010 with ourmanagement. In addition, the Audit Committee has discussed with KPMG LLP, our independent accountants, thematters required to be discussed by standards promulgated by the AICPA and Public Company AccountingOversight Board (PCAOB), including Statement on Auditing Standards No. 61 as amended (AICPA,Professional Standards, Vol. 1. AU Section 380), as adopted by the PCAOB in Rule 3200T. The AuditCommittee also has received the written disclosures and the letter from KPMG LLP as required by the applicablerequirements of the PCAOB regarding the independent accountant’s communications with the Audit Committeeconcerning independence, and the Audit Committee has discussed with KPMG LLP the independence of KPMGLLP.
Based on the Audit Committee’s review of the matters noted above and its discussions with our independentaccountants and our management, the Audit Committee recommended to the Board of Directors that the financialstatements be included in our Annual Report on Form 10-K for the fiscal year ended October 30, 2010.
Respectfully submitted by:
Glenn C. Jones (Chair)Judy BrunerAlan L. EarhartJohn W. Gerdelman
52

OTHER BUSINESS
The Board of Directors does not presently intend to bring any other business before the meeting, and, so faras is known to the Board of Directors, no matters are to be brought before the meeting except as specified in theNotice of Annual Meeting. As to any business that may properly come before the meeting, however, it isintended that proxies, in the form enclosed, will be voted in respect thereof in accordance with the judgment ofthe persons voting such proxies.
HOUSEHOLDING
Please see the discussion of “householding” on page 5 above.
INCORPORATION BY REFERENCE
The information contained above under the captions “Compensation Committee Report” and “AuditCommittee Report” shall not be deemed to be “soliciting material” or to be “filed” with the SEC, nor will suchinformation be incorporated by reference into any future SEC filing except to the extent that Brocade specificallyincorporates it by reference into such filing.
For the Board of Directors
Tyler WallVice President, General Counsel andCorporate Secretary
February 23, 2011
53

[THIS PAGE INTENTIONALLY LEFT BLANK]

MAP AND DIRECTIONS TO BROCADE COMMUNICATIONS SYSTEMS, INC.
Brocade Communications Systems, Inc.130 Holger WaySan Jose, CA 95134
From San Francisco — Traveling South on Interstate 280
• South on Interstate 280 and take the Highway 85 N exit toward Mountain View.
• Take the 237 E exit towards Alviso/Milpitas.
• Take the North First Street exit, and turn left onto North First Street.
• Turn left at Holger Way.
• Turn left into the Brocade parking garage at 130 Holger Way.
From San Francisco — Traveling South on Highway 101
• South on Highway 101 and take the Highway 237 E exit toward Alviso/Milpitas.
• Take the North First Street exit, and turn left onto North First Street.
• Turn left at Holger Way.
• Turn left into the Brocade parking garage at 130 Holger Way.
From San Jose — Traveling North on Highway 101
• North on Highway 101 and take Interstate 880 N toward Oakland.
• Take the Montague Expressway W exit and merge onto Montague Expressway.
• Turn right at North First Street.
• Turn right at Holger Way.
• Turn left into the Brocade parking garage at 130 Holger Way.

[THIS PAGE INTENTIONALLY LEFT BLANK]

Annual Report on Form 10-K for the Fiscal Year Ended October 30, 2010

[THIS PAGE INTENTIONALLY LEFT BLANK]

UNITED STATES SECURITIES AND EXCHANGE COMMISSIONWashington, D.C. 20549
FORM 10-K(Mark One)Í ANNUAL REPORT PURSUANT TO SECTION 13 OR 15(d) OF THE SECURITIES
EXCHANGE ACT OF 1934For the fiscal year ended October 30, 2010
OR‘ TRANSITION REPORT PURSUANT TO SECTION 13 OR 15(d) OF THE SECURITIES
EXCHANGE ACT OF 1934For the transition period from to
Commission file number: 000-25601
Brocade Communications Systems, Inc.(Exact name of registrant as specified in its charter)
Delaware 77-0409517(State or other jurisdiction ofincorporation or organization)
(I.R.S. EmployerIdentification No.)
130 Holger WaySan Jose, CA 95134
(408) 333-8000(Address, including zip code, of registrant’s principal executive offices and
telephone number, including area code)Securities registered pursuant to Section 12(b) of the Act:
Title of each class Name of each exchange on which registered
Common stock, $0.001 par value The NASDAQ Stock Market LLCSecurities registered pursuant to Section 12(g) of the Act:
NoneIndicate by check mark if the registrant is a well-known seasoned issuer, as defined in Rule 405 of the Securities
Act. Yes ‘ No ÍIndicate by check mark if the registrant is not required to file reports pursuant to Section 13 or Section 15(d) of the
Act. Yes ‘ No ÍIndicate by check mark whether the registrant (1) has filed all reports required to be filed by Section 13 or 15(d) of the
Securities Exchange Act of 1934 during the preceding 12 months (or for such shorter period that the registrant was required to filesuch reports), and (2) has been subject to such filing requirements for the past 90 days. Yes Í No ‘
Indicate by check mark whether the registrant has submitted electronically and posted on its corporate Web site, if any, everyInteractive Data File required to be submitted and posted pursuant to Rule 405 of Regulation S-T during the preceding 12 months (orfor such shorter period that the registrant was required to submit and post such files). Yes Í No ‘
Indicate by check mark if disclosure of delinquent filers pursuant to Item 405 of Regulation S-K (§229.405 of this chapter) isnot contained herein, and will not be contained, to the best of registrant’s knowledge, in definitive proxy or information statementsincorporated by reference in Part III of this Form 10-K or any amendment to this Form 10-K. ‘
Indicate by check mark whether the registrant is a large accelerated filer, an accelerated filer, a non-accelerated filer, or asmaller reporting company. See the definitions of “large accelerated filer,” “accelerated filer” and “smaller reporting company” inRule 12b-2 of the Exchange Act. (Check one):Í Large accelerated filer ‘ Accelerated filer ‘ Non-accelerated filer ‘ Smaller reporting company
(Do not check if a smaller reporting company)Indicate by check mark whether the registrant is a shell company (as defined in Rule 12b-2 of the Exchange
Act). Yes ‘ No ÍThe aggregate market value of the voting and non-voting common equity held by non-affiliates of the registrant, based upon the
closing price of a share of the registrant’s common stock on April 30, 2010 as reported by the NASDAQ Global Select Market onthat date, was approximately $2,873,753,097. This calculation does not reflect a determination that certain persons are affiliates ofthe registrant for any other purpose.
The number of shares outstanding of the registrant’s common stock as of December 10, 2010 was 466,582,079 shares.
DOCUMENTS INCORPORATED BY REFERENCEPortions of the registrant’s Proxy Statement for its 2011 Annual Meeting of Stockholders (the “Proxy Statement”), to be filed
with the Securities and Exchange Commission, are incorporated by reference into Part III of this Annual Report on Form 10-Kwhere indicated.
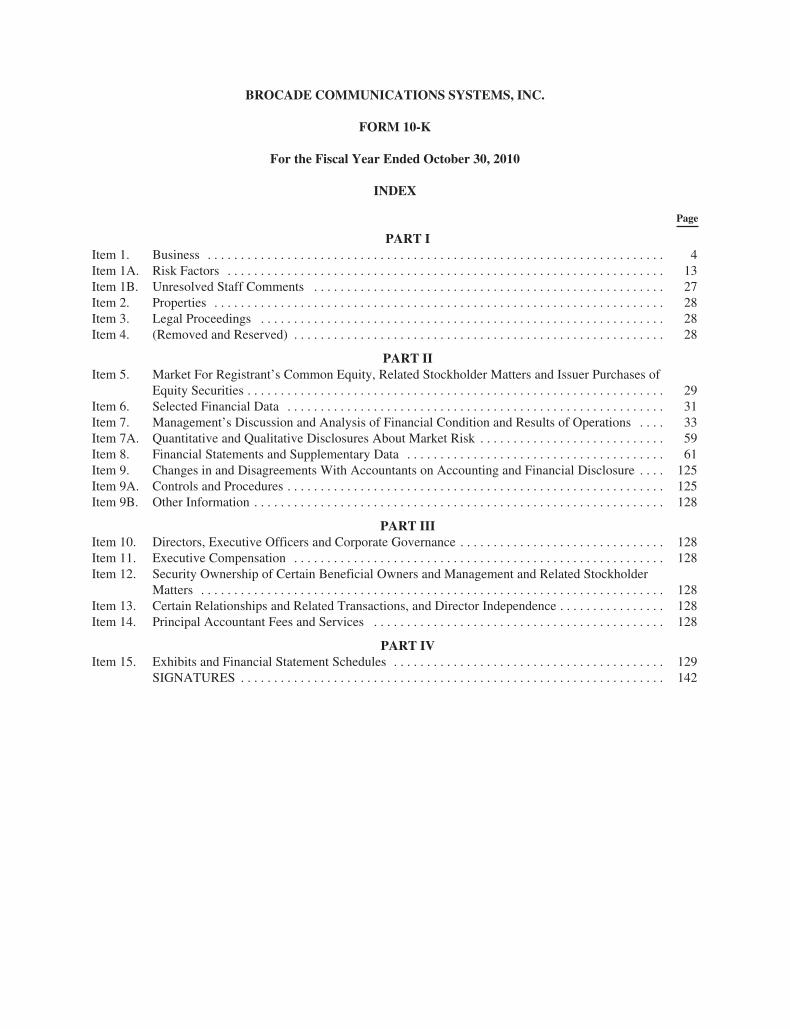
BROCADE COMMUNICATIONS SYSTEMS, INC.
FORM 10-K
For the Fiscal Year Ended October 30, 2010
INDEX
Page
PART IItem 1. Business . . . . . . . . . . . . . . . . . . . . . . . . . . . . . . . . . . . . . . . . . . . . . . . . . . . . . . . . . . . . . . . . . . . . . 4Item 1A. Risk Factors . . . . . . . . . . . . . . . . . . . . . . . . . . . . . . . . . . . . . . . . . . . . . . . . . . . . . . . . . . . . . . . . . . 13Item 1B. Unresolved Staff Comments . . . . . . . . . . . . . . . . . . . . . . . . . . . . . . . . . . . . . . . . . . . . . . . . . . . . . 27Item 2. Properties . . . . . . . . . . . . . . . . . . . . . . . . . . . . . . . . . . . . . . . . . . . . . . . . . . . . . . . . . . . . . . . . . . . . 28Item 3. Legal Proceedings . . . . . . . . . . . . . . . . . . . . . . . . . . . . . . . . . . . . . . . . . . . . . . . . . . . . . . . . . . . . . 28Item 4. (Removed and Reserved) . . . . . . . . . . . . . . . . . . . . . . . . . . . . . . . . . . . . . . . . . . . . . . . . . . . . . . . . 28
PART IIItem 5. Market For Registrant’s Common Equity, Related Stockholder Matters and Issuer Purchases of
Equity Securities . . . . . . . . . . . . . . . . . . . . . . . . . . . . . . . . . . . . . . . . . . . . . . . . . . . . . . . . . . . . . . . 29Item 6. Selected Financial Data . . . . . . . . . . . . . . . . . . . . . . . . . . . . . . . . . . . . . . . . . . . . . . . . . . . . . . . . . 31Item 7. Management’s Discussion and Analysis of Financial Condition and Results of Operations . . . . 33Item 7A. Quantitative and Qualitative Disclosures About Market Risk . . . . . . . . . . . . . . . . . . . . . . . . . . . . 59Item 8. Financial Statements and Supplementary Data . . . . . . . . . . . . . . . . . . . . . . . . . . . . . . . . . . . . . . . 61Item 9. Changes in and Disagreements With Accountants on Accounting and Financial Disclosure . . . . 125Item 9A. Controls and Procedures . . . . . . . . . . . . . . . . . . . . . . . . . . . . . . . . . . . . . . . . . . . . . . . . . . . . . . . . . 125Item 9B. Other Information . . . . . . . . . . . . . . . . . . . . . . . . . . . . . . . . . . . . . . . . . . . . . . . . . . . . . . . . . . . . . . 128
PART IIIItem 10. Directors, Executive Officers and Corporate Governance . . . . . . . . . . . . . . . . . . . . . . . . . . . . . . . 128Item 11. Executive Compensation . . . . . . . . . . . . . . . . . . . . . . . . . . . . . . . . . . . . . . . . . . . . . . . . . . . . . . . . 128Item 12. Security Ownership of Certain Beneficial Owners and Management and Related Stockholder
Matters . . . . . . . . . . . . . . . . . . . . . . . . . . . . . . . . . . . . . . . . . . . . . . . . . . . . . . . . . . . . . . . . . . . . . . 128Item 13. Certain Relationships and Related Transactions, and Director Independence . . . . . . . . . . . . . . . . 128Item 14. Principal Accountant Fees and Services . . . . . . . . . . . . . . . . . . . . . . . . . . . . . . . . . . . . . . . . . . . . 128
PART IVItem 15. Exhibits and Financial Statement Schedules . . . . . . . . . . . . . . . . . . . . . . . . . . . . . . . . . . . . . . . . . 129
SIGNATURES . . . . . . . . . . . . . . . . . . . . . . . . . . . . . . . . . . . . . . . . . . . . . . . . . . . . . . . . . . . . . . . . 142

Forward-Looking Statements
This Annual Report on Form 10-K contains forward-looking statements regarding future events and futureresults. All statements other than statements of historical fact are statements that could be deemed forward-looking statements, including, but not limited to, statements regarding future revenue, margins, expenses, taxprovisions, earnings, cash flows, benefit obligations, debt repayments, share repurchases or other financial items;any statements of the plans, strategies and objectives of management for future operations; any statementsconcerning expected development, performance or market share relating to products or services; any statementsregarding future economic conditions or performance; any statements regarding pending litigation, includingclaims or disputes; any statements of expectation or belief; and any statements of assumptions underlying any ofthe foregoing. Words such as “expects,” “anticipates,” “assumes,” “targets,” “goals,” “projects,” “intends,”“plans,” “believes,” “seeks,” “estimates,” “continues,” “may,” variations of such words and similar expressionsare intended to identify such forward-looking statements. These statements are based on current expectations,estimates, forecasts and projections about the industries in which Brocade operates, and the beliefs andassumptions of management. Readers are cautioned that these forward-looking statements are only predictionsand are subject to risks, uncertainties and assumptions that are difficult to predict, including those identifiedbelow, under “Part I—Item 1A. Risk Factors” and elsewhere herein. Therefore, actual results may differmaterially and adversely from those expressed in any forward-looking statements. Further, Brocade undertakesno obligation to revise or update any forward-looking statements for any reason.
3

PART I
Item 1. Business
General
Brocade Communications Systems, Inc. (“Brocade” or the “Company”) is a leading supplier of networkingequipment, including end-to-end Internet Protocol (“IP”)-based Ethernet networking solutions and storage areanetworking solutions for businesses and organizations of all types and sizes, including global enterprises, andservice providers such as telecommunication firms, cable operators and mobile carriers. Brocade offers acomprehensive line of high-performance networking hardware and software products and services that enablebusinesses and organizations to make their networks and data centers more efficient, reliable and adaptable.Brocade’s products, services and solutions simplify information technology (“IT”) infrastructure, increaseresource utilization, ensure availability of mission critical applications, and support advanced data, voice, videoand mobility applications.
Brocade products and services are marketed, sold and supported worldwide to end-user customers throughdistribution partners, including original equipment manufacturers (“OEMs”), distributors, systems integrators,value-added resellers (“VARs”) and directly to end-users by the Brocade direct sales force.
For revenue and other information regarding Brocade’s operating segments, see Note 16 “SegmentInformation,” of the Notes to Consolidated Financial Statements, which is incorporated herein by reference.
Products and Services
Data Storage
Brocade’s storage networking products and services are designed to help customers reduce the cost andcomplexity of managing business information within a shared data storage environment, while enabling highlevels of availability of mission critical business applications. In addition, Brocade’s products and services assistcustomers in the development and delivery of storage and server consolidation, disaster recovery and datasecurity, and in meeting compliance issues regarding data management. Customers use Brocade’s products tobuild storage area networks (“SAN”s), which we refer to as “fabrics.” Brocade’s products are generally used inconjunction with servers and storage subsystems, SAN interconnection components such as host bus adapters(“HBAs”), and server and storage management software applications and tools. By utilizing a shared storage, ornetworked storage solution, enterprises of all types and sizes can more easily share and consolidate server andstorage resources, centralize and simplify data management, scale and provision storage resources moreeffectively, and improve application efficiency, performance and availability. As a result, these enterprises areable to better utilize IT assets, improve productivity of IT personnel, reduce capital and operational expenditures,and more reliably and securely store, manage and administer business information.
Brocade’s family of Fibre Channel SAN backbones, directors, fabric and embedded switches provideinterconnections, bandwidth and high-speed routing of data between servers and storage devices. Product modelsrange from entry-level 8-port fabric switches to 896-port directors with multiple options, addressing the needs ofsmall departments and global enterprises alike. These high-performance solutions are available to supportrequirements both for open systems and mainframe operations. Switches and directors support key applicationssuch as data backup, remote mirroring and high-availability clustering, as well as high-volume transactionprocessing applications such as enterprise resource planning and data warehousing. Brocade’s storagenetworking products have been designed to meet the storage networking needs of end-users in environmentsranging from small and medium-sized businesses to large enterprises with storage network fabrics that scale tothousands of ports, spread across multiple locations around the world. Brocade’s storage networking productsalso include HBAs, which connect host computers to a Fibre Channel (“FC”) network.
Brocade offers a variety of fabric extension, switching and routing solutions that are designed to connecttwo or more data centers over long distances to enhance business continuity and disaster recovery. Brocade’s
4
fabric extension solutions support SAN extension (Fibre Channel), mainframe extension (Fibre Connectivity), aswell as other multiprotocol switching and routing technologies including optical, asynchronous transfer mode,and IP networks. Through its Data Center Fabric Manager, Brocade offers end-to-end management acrossmultiple fabrics with high levels of scalability and performance designed to maximize data availability even overextended distances.
To enable industry-leading encryption-based security, Brocade offers high-speed, highly reliable hardwarein both modular and fixed-switch form factors that provides fabric-based encryption and compression services.Brocade works with industry-leading security solution vendors to offer customers a wide choice of enterprise-class key management systems options. These solutions provide high-performance disk encryption processingpower to meet the needs of the most demanding enterprise environments with flexible, on-demand performance.
Brocade recently announced its commitment to support the next generation of FC industry standard, whichwill offer 16 gigabits per second (“Gbps”) performance. Brocade’s commitment to 16 Gbps FC builds upon itsmarket leadership in FC storage networking solutions, which includes the flagship Brocade DCX(R) Backbonefamily along with SAN directors, switches and HBAs. Brocade has also led the industry through every FCtechnology cycle, including the evolution from 1, 2, 4, 8 and now 16 Gbps technologies.
Brocade also offers a new class of data center networking products that support an emerging technologycalled Fibre Channel over Ethernet (“FCoE”). Brocade is one of the pioneers of FCoE technology and has beeninstrumental in driving the protocol toward standardization. FCoE enables the consolidation of serverconnectivity by being able to support both Fibre Channel and Ethernet connections simultaneously. Customersbenefit from this consolidation by having to deploy fewer switches and peripheral cards inside of servers, therebyreducing costs and complexity. Brocade is one of the industry’s first vendors to offer customers a comprehensivesuite of FCoE products that includes both switches and FCoE peripheral cards known as converged networkadapters (“CNAs”).
Ethernet Products—IP Layer 2-3
Brocade’s enterprise-class Layer 2 and Layer 3 switches and routers are designed to connect users in anenterprise network, enabling network connectivity such as access to the Internet, network-based communicationssuch as voice over IP (“VOIP”), and higher levels of collaboration through unified messaging applications andgreater degrees of productivity through mobility. Brocade offers a variety of platforms to allow customers todesign a network to meet their needs, including the Brocade BigIron, FastIron, EdgeIron and TurboIron productfamilies. Brocade’s Layer 2 and Layer 3 switches provide cost-effective delivery of the intelligence, speed andmanageability required to support the increasing use of bandwidth-intensive and Internet-based applications.
Brocade’s carrier-class switches and routers are designed to handle network traffic within and across serviceprovider networks, whether telecommunications providers, cable multiservice operators or mobile carriers.Brocade offers a full portfolio of Ethernet-optimized platforms designed for service provider environments thatinclude support for legacy technologies such as Synchronous Optical Network to ease the migration to an all-IPservice provider network architecture. Brocade specializes in offering products and technologies that supportvarious service provider network environments including the data center, metro aggregation and high-capacityIP/Multiprotocol Label Switching core. Brocade also offers an industry-leading portfolio of service provider-specialized Carrier Ethernet products from the metro edge into the network core, including the Brocade NetIronMLX and XMR router families, as well as the Brocade NetIron CES switches. Brocade’s Metro and Internetrouters are designed to deliver the capabilities and performance needed to provide efficient and reliable routingservices to Internet data centers around the world.
Brocade has also introduced a new category of Layer 2 switches called the Brocade VDX Data CenterSwitch which we expect to begin shipping in early 2011. The Brocade VDX switches deliver on Brocade VirtualCluster Switching or VCS technology, which we expect will transform data center networks through innovations
5

that are optimized for highly virtualized and cloud environments. Brocade VCS enables the VDX switches toform the first true Ethernet Fabric that would simplify configuration management and significantly reduce thenumber of elements being managed in the Fabrics to reduce operating costs and complexity. The new technologyis expected to advance the adoption of fully virtualized and cloud-enabled data centers.
Ethernet Products—IP Layer 4-7/Application Delivery Products (“IP Layer 4-7/ADP”)
Brocade’s Layers 4-7 platforms, including the Brocade ServerIron and ServerIron ADX family of products,are designed for application traffic management and server load balancing, allowing customers to enable specificfeatures to improve the performance of specific applications or improve the performance of a server farm. Thesehigh-performance data center traffic management systems with network intelligence capabilities allowenterprises and service providers to build reliable network infrastructures that efficiently manage the flow oftraffic over extended distances, known as metro area networks and wide area networks.
Global Services
Brocade offers a wide range of consulting and support services that assist customers in designing,implementing, deploying and managing advanced networking solutions, as well as post-contract customersupport (“PCS”) and separately priced extended warranties. These services address a number of customerpriorities that must be managed during the life cycle of a storage network or data center infrastructure and aremeaningful to customers because we bring valuable experience and expertise to a customer challenge. Brocade’sservices may be delivered directly to end-user customers or via partners as a component of a broader service andsupport offering.
Industry Initiatives and Standards Development
Brocade believes that, as the need for networking solutions continues to grow, enterprises will look tofurther simplify the tasks of storing, managing and administering their data, while also looking to maximize theirIT investments and reduce both capital and operational expenditures. Data networking solutions provide aplatform that helps enterprises optimize their IT assets and support future data growth, and have been installed atmany of the world’s leading companies since the mid-1990s. Brocade also believes enterprises will continue toexpand the size and scope of their networks and the number and types of applications that these networkssupport.
Brocade believes that the future evolution of networking and data center management markets will be led bythe providers of products and services that simplify the management of heterogeneous server and storageenvironments and maximize end-users’ IT investments on an ongoing basis. Brocade also believes that datanetworking and data center infrastructure solutions will evolve to provide increased capabilities that enable newtypes of data management applications that simplify the management of data, increase operational efficienciesand reduce operating expense. As a result, many of Brocade’s initiatives and investments are aimed at expandingthe capabilities enabled by networks, increasing end-to-end interoperability, protecting end-user investments inexisting and new IT resources, and making it easier for Brocade and its partners to deliver solutions that provideefficiencies in managing large, complex and growing enterprise data center environments.
Brocade works with industry-leading organizations to facilitate the development of standards, technologies,products and services that focus on the simplification of data center infrastructure management and theimplementation and management of data networking environments. Brocade has a partner-centric approach tobuilding solutions and works with nearly every leading provider of server, storage and storage networkmanagement applications and technologies.
Brocade has a long history of being a major contributor to the evolution of industry standards ranging fromFibre Channel communication technology to storage network interoperability to storage and storage network
6

management. Brocade contributes to related industry standards committees and has authored or co-authored themajority of the Fibre Channel protocol standards in existence today. As Brocade continues to expand itsleadership presence in new technologies, Brocade’s participation in associated standards groups continues togrow. In fiscal year 2010, Brocade was a member of the Ethernet Alliance, the IETF, the IEEE, FCIA Board,SNIA Technical Council, DMTF Technical Council and Fibre Channel-related industry associations andstandards bodies. Brocade also currently chairs the INCITS T11 Committee, the lead governing body for allFibre Channel-related standards, which includes FCoE.
Education and Technical Certification Services
Brocade’s education and training organization delivers technical education and training on Brocadetechnology that encompasses design, implementation and management solutions to its partners and theircustomers. This education and training curriculum is delivered worldwide using diverse methodologies, whichinclude instructor-led classes and an online web-based training portfolio as well as a “live” virtual classroomcapability. Brocade Education Services trains approximately 35,600 IT professionals annually. The BrocadeCertification Programs offer certification on Brocade solutions for IT professionals who have completed certaintests administered by an independent testing organization. These certification programs are designed to measurethe knowledge and proficiency of IT professionals in Brocade data center and data management solutions andtechnologies, and to help ensure that Brocade’s customers receive superior customer service and support.Approximately 22,593 certification tests have been delivered with approximately 10,222 IT professionalscertified worldwide since inception of the program. Brocade’s education and training services are made availablethrough its own education facilities and through its worldwide training provider network.
Distribution Channels
Brocade’s products and services are marketed, sold and supported worldwide to end-user customers throughdistribution partners, including OEMs, distributors, systems integrators, VARs, and directly to end-users by theBrocade direct sales force.
• Brocade’s OEM partners are leading server, storage and systems providers who offer Brocade’sproducts under their own private label or as Brocade-branded solutions. Sales of these products throughOEM partners comprise the majority of Brocade’s business.
• Other distribution partners include a global network of authorized distributors, systems integrators andVARs. Brocade authorizes these partners to market, sell and support its products and services. Some ofthese partners also sell training and other value-added services.
Brocade has OEM or distribution agreements with most of the major companies that sell enterprise serversand storage systems. In addition, Brocade employs a worldwide sales force to assist its distribution partners inmarketing Brocade solutions, assessing customer requirements and designing, implementing and maintainingBrocade-based solutions.
Customers
For the fiscal years ended October 30, 2010, October 31, 2009, and October 25, 2008, EMC Corporation(“EMC”), Hewlett-Packard Company (“HP”) and International Business Machines Corporation (“IBM”) eachrepresented greater than 10% of Brocade’s total net revenues for combined totals of 47% (EMC with 16%, HPwith 14% and IBM with 17%), 48% (EMC with 18%, HP with 13% and IBM with 17%) and 65% (EMC with25%, HP with 18% and IBM with 22%) of its total net revenues, respectively. The level of sales to any OEMcustomer may vary from quarter to quarter. Brocade expects that it will continue to expand its routes-to-market tosell its products through distributors, direct to end-users, global systems integrators and VARs in addition to itsOEM channel.
7
In the Ethernet market, Brocade cultivates business through its distributors in a number of key customermarkets such as the U.S. government, education and service provider segments. Customers in these marketsegments represented a significant part of Brocade’s overall business. Brocade’s strategy includes leveragingcustomer markets in which it has a significant presence to expand its sales of Ethernet products, includinginternational markets, Global 1000 customers, financial services companies and OEMs. As an example, Brocaderecently expanded its OEM partnerships with IBM and Dell Inc. (“Dell”), which enables IBM and Dell torebrand and sell certain of Brocade’s enterprise Ethernet networking products. EMC has also recently expandedits partnership with Brocade which enables EMC to resell Ethernet networking products.
Geographic Information
For the year ended October 30, 2010, domestic and international revenues were approximately 64% and36% of total net revenues, respectively. For the year ended October 31, 2009, domestic and internationalrevenues were approximately 65% and 35% of total net revenues, respectively. For the year ended October 25,2008, domestic and international revenues were approximately 63% and 37% of total net revenues, respectively.International revenues primarily consist of sales to customers in Western Europe, the greater Asia Pacific regionand Japan. For the year ended October 30, 2010, international revenues increased as a percentage of total netrevenues primarily due to growth in the Asia Pacific region. For the year ended October 31, 2009, internationalrevenues decreased as a percentage of total net revenues primarily as a result of Brocade’s acquisition of FoundryNetworks, Inc. (“Foundry”), which had a higher concentration of its customer base in North America.
Revenues are attributed to geographic areas based on where Brocade’s products are shipped. However,certain OEM customers take possession of Brocade’s products domestically and then distribute these products totheir international customers. Because Brocade accounts for all of those OEM revenues as domestic revenues,Brocade cannot be certain of the extent to which its domestic and international revenue mix is impacted by thepractices of its OEM customers. Nevertheless, data provided by OEM customers indicate that internationalcustomers may account for a higher percentage of end-user demand than that indicated by Brocade’s mix ofdomestic and international revenues.
The majority of Brocade’s assets as of October 30, 2010 were attributable to its United States operations.For additional geographic information on Brocade’s revenues and long lived assets, see Note 16 “SegmentInformation,” of the Notes to Consolidated Financial Statements, which is incorporated herein by reference.Also, for a discussion of the risks attendant to Brocade’s foreign operations, see Part I, Item 1A. Risk Factors ofthis Form 10-K, which is incorporated herein by reference.
Acquisitions and Investments
Brocade’s acquisition and investment strategy is focused on facilitating the evolution and expansion ofshared storage, data management and Ethernet networking.
On December 18, 2008, Brocade completed its acquisition of Foundry, a performance and total solutionsleader for Ethernet network switching and routing. This acquisition positioned Brocade as a leading supplier ofend-to-end networking solutions that help enterprises and service providers connect and manage theirinformation.
On March 17, 2008, Brocade completed its acquisition of Strategic Business Systems, Inc. (“SBS”), aprivately held provider of IT professional services for medium-size and large enterprises in both the commercialand federal government sectors. This acquisition expanded Brocade’s professional service offerings and wasconsistent with its goal of building an end-to-end services portfolio.
On January 29, 2007, Brocade completed its acquisition of McDATA Corporation (“McDATA”), a providerof storage networking and data infrastructure solutions. McDATA is a wholly-owned subsidiary of Brocade. This
8

acquisition enabled Brocade to build stronger relationships with its customers and partners, and provide greaterscale and efficiencies to accelerate its growth.
On January 5, 2007, Brocade completed its acquisition of Silverback Systems, Inc. (“Silverback”), aprivately held provider of network acceleration technology. This acquisition further enabled Brocade to provideEthernet-based solutions for data center networks.
From time to time, Brocade has made equity investments in companies that develop technology or provideservices that are complementary to or broaden the markets for its products or services and further its businessobjectives.
Research and Development
The industry in which Brocade competes is subject to rapid technological developments, evolving industrystandards, changes in customer requirements, new product introductions and consolidation. As a result,Brocade’s success depends, in part, on its ability to continue to enhance its existing solutions and to develop andintroduce new solutions that improve performance and reduce the total cost of ownership in the storageenvironment. Brocade has invested significantly in product research and development. Brocade continues toenhance and extend its products and increase the speed, performance and port-density of its switching platform.Brocade also continues to expand the value-added services of its intelligent platform to further simplify storagemanagement and to enable more functionality for end-user customers, OEM partners and application partners.
Brocade products are designed to support current industry standards and may continue to support emergingstandards that are consistent with its product strategy. Brocade products have been designed around a commonplatform architecture which facilitates the product design, development and testing cycle, and reduces the time tomarket for new products and features. Brocade intends to continue to leverage this common architecture todevelop and introduce additional hardware and software products and enhancements in the future.
Brocade’s product development process includes the certification of certain of its products by itsOEM partners. During this process, Brocade supports its OEM partners in the testing of its new products toensure they meet quality, functionality and inoperability requirements. The process is completed once the OEMpartner has certified the product and announced general availability of that product to their customers.
For the years ended October 30, 2010, October 31, 2009 and October 25, 2008, Brocade’s research anddevelopment expenses totaled $354.3 million, $354.8 million and $255.6 million, respectively. All expendituresfor research and development costs have been expensed as incurred. In fiscal year 2011, Brocade expects toincrease its level of investment, in absolute dollars, in research and development.
Competition
The market for networking solutions is intensely competitive. In particular, Cisco Systems, Inc. (“Cisco”)maintains a large position in the Ethernet and SAN markets and a number of its products compete directly withBrocade’s products. Brocade also competes with other companies, such as Alcatel-Lucent, Arista Networks,Enterasys Networks, Inc., Extreme Networks, Inc., F5 Networks, Inc., Force10 Networks, Inc., HP, HuaweiTechnologies Co. Ltd., IBM, Juniper Networks, Inc. (“Juniper”) and Oracle Corporation. Some of Brocade’scurrent and potential competitors have greater market leverage, longer operating histories, greater financial,technical, sales, marketing and other resources, more name recognition and larger installed customer bases.
In addition, Brocade faces significant competition from providers of storage networking products forinterconnecting servers and storage. These principal competitors include Cisco and QLogic Corporation(“QLogic”). Brocade also faces other competitors in markets adjacent to the SAN market, such as Cisco and F5Networks, Inc. in the Layers 4-7 networking market and QLogic and Emulex Corporation in the HBA/CNAmarkets.
9
New competitors are likely to emerge from the existing Ethernet networking companies in the market as theFCoE standard becomes finalized and additional products come to market. These competitors are likely to useemerging technologies and various routes-to-market to compete with Brocade. In addition, Brocade’s OEMpartners, who also have relationships with some of Brocade’s current competitors, could become newcompetitors by developing, acquiring or introducing products that compete with Brocade’s product offerings, bychoosing to sell its competitors’ products instead of Brocade’s products, or by offering preferred pricing orpromotions on competitors’ products. Competitive pressure will also likely intensify as technology trends mayimpact long-standing alliances, partnerships and go-to-market routes.
In addition, as the networking solutions market evolves, additional technologies may become available forinterconnecting servers and storage. To the extent that products based upon these technologies provide the abilityto connect network servers and storage and support high-performance storage applications, they are likely tocompete with Brocade’s current and future products. Competitive technologies include, but are not limited to,emerging products based on 1 Gigabit Ethernet (“GbE”), 10 GbE, 100 GbE, FCoE, Data Center Bridging(“DCB”), InfiniBand and Internet Small Computer System Interface (“iSCSI”) protocols, as well as other storagesolutions such as Network Attached Storage and Direct Attached Storage. In addition, networking companies,manufacturers of networking equipment, and other companies may develop competitive products andtechnologies. Brocade’s OEM partners or other partners could also develop and introduce products that competewith Brocade’s product offerings. Brocade believes the competitive factors in this market include productperformance and features, product reliability, price, size, extent of installed base, ability to meet deliveryschedules, customer service, technical support and distribution channels.
Manufacturing
Brocade has manufacturing arrangements with Hon Hai Precision Industry Co., Ltd. (“Foxconn”),Sanmina-SCI Corporation (“Sanmina”), Asteel Flash Group (“Flash”), Accton Wireless Broadband Corporation(“Accton”), Motorola, Inc. (“Motorola”) and Quanta Computer Incorporated (“Quanta”) (collectively the “CMs”)under which Brocade provides product forecasts and places purchase orders in advance of the scheduled deliveryof products to Brocade’s customers. The required lead time for placing orders with the CMs depends on thespecific product. The CMs invoice Brocade based on prices and payment terms mutually agreed upon and setforth in purchase orders Brocade issues to them. Although the purchase orders Brocade places with its CMs arecancelable, the terms of the agreements require Brocade to purchase all inventory materials not returnable, usableby, or sold to other customers of the CMs. In addition, Flextronics International Ltd. (“Flextronics”) is Brocade’sservice repair operations provider.
Brocade uses the CMs for final turnkey product assembly; however, Brocade also maintains key componentselection and qualification expertise internally. Brocade designs and develops the key components of itsproducts, including application-specific integrated circuits (“ASICs”), operating system and other software, aswell as certain details in the fabrication and enclosure of its products. In addition, Brocade determines thecomponents that are incorporated into its products and selects appropriate suppliers of those components.
Although Brocade uses standard parts and components for its products where possible, Brocade’s CMscurrently purchase, on Brocade’s behalf, several key components used in the manufacture of its products fromsingle or limited supplier sources. Brocade’s principal single source components include ASICs, built by third-parties based on Brocade’s designs, and Brocade’s principal limited source components include memory, certainoscillators, microprocessors, certain connectors, certain logic chips, certain power supplies, enclosures,programmable logic devices, certain printed circuit boards, certain optical components, packet processors andswitching fabrics. In addition, Brocade licenses certain software from third parties that is incorporated into itsfabric operating system and other software. See Part I, Item 1A. Risk Factors of this Form 10-K, which isincorporated herein by reference.
10

Environmental Matters
Brocade is subject to various environmental and other regulations governing product safety, materials usage,packaging and other environmental impacts in the various countries where its products are sold. For example,many of Brocade’s products are subject to laws and regulations that restrict the use of lead, mercury, hexavalentchromium, cadmium and other substances, and require producers of electrical and electronic equipment toassume responsibility for collecting, treating, recycling and disposing of its products when they have reached theend of their useful life. In Europe, substance restrictions apply to products Brocade sells, and certain ofBrocade’s OEM partners require compliance with these or more stringent requirements. Recycling, labeling,financing and related requirements also apply to products Brocade sells in Europe. China has also enacted similarlegislation with similar requirements for Brocade’s products or its OEM partners. Brocade may be required toredesign its products to ensure that they comply with any new requirements as well as related requirementsimposed by its OEM customers. Brocade also continues to work with its suppliers to ensure they provideBrocade with compliant materials, parts and components. Various other countries and states in the United Stateshave issued, or are in the process of issuing, other environmental regulations that may impose additionalrestrictions or obligations and require further changes to Brocade’s products.
Patents, Intellectual Property and Licensing
Brocade relies on a combination of patent, copyright, trademark and trade secret laws, and contractualrestrictions on disclosure to protect its intellectual property rights in these proprietary technologies. Despite theseprecautions, the measures Brocade undertakes may not prevent misappropriation or infringement of itsproprietary technology. These measures also may not preclude competitors from independently developingproducts with functionality or features similar to its products.
Brocade maintains a program to identify and obtain patent protection for its selected inventions. As ofDecember 10, 2010, Brocade has 311 patents in the United States and 13 patents in various foreign countries(based on certain U.S. patents or patent applications) that are currently in force and has approximately 317 patentapplications pending in the United States and approximately 11 patent applications pending in various foreigncountries (based on certain U.S. patents or patent applications). The normal expiration dates of Brocade’s issuedpatents in the United States range from 2010 to approximately 2027. Although Brocade has patent applicationspending, there can be no assurance that patents will be issued from pending applications or that claims allowedon any future patents will be sufficiently broad to protect its technology.
Many of Brocade’s products are designed to include software or other intellectual property licensed fromthird parties. While it may be necessary in the future to seek or renew licenses relating to various aspects of itsproducts, Brocade believes that such licenses generally could be obtained on commercially reasonable terms.However, failure to obtain such licenses on commercially reasonable terms could materially harm Brocade’sbusiness. See Part I, Item 1A. Risk Factors of this Form 10-K, which is incorporated herein by reference.
From time to time, third parties have asserted patent, copyright and trade secret rights to technologies andstandards that are important to Brocade. Third parties assert patent infringement claims against Brocade fromtime to time in the form of letters, lawsuits and other forms of communication. In addition, from time to time,Brocade receives notification from customers claiming that they are entitled to indemnification or otherobligations from Brocade related to infringement claims made against them by third parties.
Seasonality
Historically, our first and fourth fiscal quarters are seasonally stronger quarters from a revenue perspectivethan our second and third fiscal quarters.
11

Backlog
Brocade’s business is characterized by short lead-time orders and fast delivery schedules. Sales of itsproducts are generally made pursuant to contracts and purchase orders that are cancelable without significantpenalties. These commitments are subject to price negotiations and to changes in quantities of products anddelivery schedules in order to reflect changes in customers’ requirements and manufacturing availability. Inaddition, actual shipments depend on the manufacturing capacity of suppliers and the availability of productsfrom such suppliers. As a result of the foregoing factors, Brocade does not believe that backlog at any given timeis a meaningful indicator of its ability to achieve any particular level of revenue or financial performance.
Employees
As of October 30, 2010, Brocade had 4,651 employees. Brocade has not experienced any work stoppagesand considers its relations with its employees to be good. Brocade’s employees are currently located in theUnited States headquarters in San Jose, California, as well as facilities in Broomfield, Colorado, Herndon,Virginia, Plymouth, Minnesota, the European headquarters in Geneva, Switzerland, the Asia Pacific headquartersin Singapore, and other offices throughout North America, Europe, Asia Pacific, Japan and Central and SouthAmerica.
Other
Brocade was incorporated in California on August 24, 1995 and reincorporated in Delaware on May 14,1999. Brocade’s mailing address and executive offices are located at 130 Holger Way, San Jose,California 95134. Brocade’s telephone number is (408) 333-8000. Brocade’s corporate Web site iswww.brocade.com. Brocade’s Annual Report on Form 10-K, Quarterly Reports on Form 10-Q, Current Reportson Form 8-K and amendments to those reports filed or furnished pursuant to Section 13(a) or 15(d) of theSecurities Exchange Act of 1934, as amended, are available free of charge on Brocade’s Web site when suchreports are available on the U.S. Securities and Exchange Commission (“SEC”) Web site. The public may readand copy any materials filed by Brocade with the SEC at the SEC’s Public Reference Room at 100 F Street, NE,Washington, D.C. 20549. The public may obtain information on the operation of the Public Reference Room bycalling the SEC at 1-800-SEC-0330. The SEC maintains a Web site at www.sec.gov that contains reports, proxyand information statements, and other information regarding issuers that file electronically with the SEC. Thecontent of any Web site referred to in this Form 10-K is not incorporated by reference into this filing. Further,Brocade’s references to the Uniform Resource Locators (“URLs”) for these Web sites are intended to be inactivetextual references only.
Brocade, the B-wing symbol, BigIron, DCFM, DCX, Fabric OS, FastIron, IronView, NetIron, SAN Health,ServerIron, TurboIron, and Wingspan are registered trademarks, and Brocade Assurance, Brocade NET Health,Brocade One, Extraordinary Networks, MyBrocade, VCS, and VDX are trademarks of Brocade CommunicationsSystems, Inc. in the United States (“U.S.”) and/or in other countries. Other brands, products, or service namesmentioned are or may be trademarks or service marks of their respective owners.
12

Item 1A. Risk Factors
Intense competition in the market for networking solutions could prevent Brocade from increasing ormaintaining revenue, profitability and cash flows with respect to its networking solutions.
The networking market is becoming increasingly competitive. While Cisco maintains a dominant position inthe Ethernet networking market, other companies have strengthened their networking portfolio throughacquisitions, including HP’s acquisition of 3Com and IBM’s acquisition of Blade Network Technologies. BothHP and IBM are important OEM partners for Brocade in the Fibre Channel switching market, yet also arecompetitive with Brocade in other respects. EMC, one of Brocade’s top OEM customers in terms of FibreChannel sales and a go-to-market and technology partner since 1997, has formed a coalition with Cisco andVMware called the “Virtual Computing Environment” (VCE) through which VCE and its business partnerswould sell packaged “cloud computing” and data center virtualization solutions. Further, Cisco and EMCannounced a joint venture, which is designed to serve as a support and services arm of VCE. The above-referenced acquisition and business partnerships demonstrate the increasingly complex nature of relationshipswithin the networking industry.
Other competitors in the Ethernet networking market include Arista Networks, Alcatel-Lucent, EnterasysNetworks, Inc., Extreme Networks, Inc., F5 Networks, Inc., Force10 Networks, Inc., Huawei Technologies Co.Ltd., Juniper Networks, Inc. and most recently, Oracle Corporation through its acquisition of Sun Microsystems,Inc. Brocade also competes with Cisco and QLogic Corporation in the Fibre Channel switching market and withQLogic and Emulex Corporation in the server connectivity or HBA market. Some of these competitors havegreater market leverage, longer operating histories, greater financial, technical, sales, marketing and otherresources, more name recognition and larger installed customer bases. Brocade’s competitors could also adoptmore aggressive pricing policies than Brocade. Brocade believes that competition based on price may becomemore aggressive than it has traditionally experienced. As a result of these factors, Brocade’s competitors couldalso devote greater resources to the development, promotion and sale of their products than Brocade and, as aresult, may be able to respond more quickly to changes in customer or market requirements. Brocade’s failure tosuccessfully compete in the market would harm Brocade’s business and financial results.
In addition, the advent and customer adoption of new technologies such as Fibre Channel over Ethernet(“FCoE”) and Data Center Bridging (“DCB”), formerly called Converged Enhanced Ethernet (“CEE”), maydisplace existing solutions in actual customer implementations, leading to erosion of the total addressable market(“TAM”) for Fibre Channel products of the type that Brocade currently delivers. While Brocade offers FCoEproducts and has recently introduced a new family of DCB products as part of its overall networking portfolio,the potential for reduction of Fibre Channel TAM where Brocade is a market leader may harm Brocade’sbusiness and financial results.
Brocade’s future revenue growth depends on its ability to introduce new products and services on a timelybasis and achieve market acceptance of these new products and services.
The market for networking solutions is characterized by rapidly changing technology, accelerating productintroduction cycles, changes in customer requirements and evolving industry standards. Brocade’s future successdepends largely upon its ability to address the rapidly changing needs of its customers by developing andsupplying high-quality, cost-effective products, product enhancements and services on a timely basis and bykeeping pace with technological developments and emerging industry standards. This risk will likely becomemore pronounced as the networking markets become more competitive and as demand for new and improvedtechnologies increases.
Brocade has introduced a significant number of new products in the last 12 months, including productsacross its family of Ethernet and Data Storage networking solutions, which accounts for a substantial portion ofBrocade’s revenues. Brocade has also invested significant R&D resources in developing new products based onEthernet Fabric technology for server virtualization within data centers. Specifically, Brocade has recently
13
introduced the Brocade VDX Ethernet Fabric Switches powered by its Virtual Cluster Switching (“VCS”)technologies as the first products within this category.
Developing new offerings requires significant upfront investments that may not result in revenue for anextended period of time, if at all. Brocade must achieve widespread market acceptance of Brocade’s new productand service offerings on a timely basis in order to realize the benefits of Brocade’s investments. Additionally,Brocade recently focused substantial resources to emphasize the Ethernet networking market through a channelsstrategy, including the hiring of incremental new sales persons focused primarily on Brocade’s Ethernetnetworking products. This focus towards the Ethernet networking market may negatively impact Brocade’s otherbusinesses such as its Data Storage networking products because management’s attention and limited resourcessuch as employees may be reallocated away from Brocade’s Data Storage products and towards Ethernetproducts instead.
The success of Brocade’s product and service offerings depends on numerous factors, including its abilityto:
• Properly determine the market for and define new products and services;
• Develop and introduce the new products and services in a timely manner;
• Differentiate Brocade’s new products and services from its competitors’ technology and productofferings;
• Address the complexities of interoperability of Brocade’s products with its installed base, OEMpartners’ server and storage products and its competitors’ products; and
• Maintain high levels of product quality and reliability.
Various factors impacting market acceptance are outside of Brocade’s control, including the following:
• The availability and price of competing products and alternative technologies;
• The cost of certain product subcomponents, which could reduce Brocade’s gross margins;
• Product qualification requirements by Brocade’s OEM partners, which can cause delays in the marketacceptance;
• The timing of the adoption of new industry standards relative to Brocade’s development of newtechnologies and products;
• The ability of its OEM partners to successfully distribute, support and provide training for its products;and
• Customer acceptance of Brocade’s products, including its Ethernet solutions.
If Brocade is not able to successfully develop and market new and enhanced products and services on atimely basis, its business and results of operations will likely be harmed.
As Brocade introduces new or enhanced products, Brocade must also successfully manage the transitionfrom older products to minimize disruption in customers’ ordering patterns, avoid excessive levels of olderproduct inventories and provide sufficient supplies of new products to meet customer demands. When Brocadeintroduces new or enhanced products, Brocade faces numerous risks relating to product transitions, including theinability to accurately forecast demand, manage excess and obsolete inventories, address new or higher productcost structures, and manage different sales and support requirements due to the type or complexity of the newproducts. In addition, any customer uncertainty regarding the timeline for rolling out new products or Brocade’splans for future support of existing products may negatively impact customer purchase decisions.
14
The prices of Brocade’s products have declined in the past and Brocade expects the prices of Brocade’sproducts to continue to decline, which could reduce Brocade’s revenues, gross margins and profitability.
The average selling price for Brocade’s products has declined in the past, and Brocade expects it to continueto decline in the future as a result of changes in competitive pricing pressure, broader macroeconomic factors,product mix, increased sales discounts, new product introductions by Brocade or Brocade’s competitors, theentrance of new competitors and other factors. Brocade expects that average selling prices per port for DataStorage products will continue to decline at rates consistent with historical rates of low single digits per quarter,and that average selling prices per port for Brocade’s Ethernet products will decline in the low- to mid-singledigits; however, average selling prices could decline much faster. Price declines may also increase as competitorsramp up product releases that compete with Brocade’s products. Furthermore, as a result of cautious capitalspending in the technology sector, coupled with broader macroeconomic factors, both Brocade and itscompetitors may pursue more aggressive pricing strategies in an effort to maintain or seek to increase saleslevels. If Brocade is unable to offset any negative impact that changes in competitive pricing pressures, broadermacroeconomic factors, product mix, increased sales discounts, enhanced marketing programs, new productintroductions by Brocade or Brocade’s competitors, or other factors may have on the average selling price ofBrocade’s products by increasing the volume of products shipped or reducing product manufacturing costs,Brocade’s total revenues and gross margins will be negatively impacted.
In addition, to maintain Brocade’s gross margins, Brocade must maintain or increase the number of productsshipped, develop and introduce new products and product enhancements, and continue to reduce themanufacturing costs of Brocade’s products. While Brocade has successfully reduced the cost of manufacturingBrocade’s products in the past, Brocade may not be able to continue to reduce cost of production at historicalrates. Moreover, most of Brocade’s expenses are fixed in the short-term or incurred in advance of receipt ofcorresponding revenue. As a result, Brocade may not be able to decrease its spending quickly enough or insufficient amounts to offset any unexpected shortfall in revenues. If this occurs, Brocade could incur losses andBrocade’s operating results and gross margins could be below expectations. Additionally, Brocade’s grossmargins may be negatively affected by fluctuations in manufacturing volumes, component costs, foreigncurrency exchange rates, the mix of product configurations sold and the mix of distribution channels throughwhich its products are sold. In addition, if product or related warranty costs associated with Brocade’s productsare greater than previously experienced, Brocade’s gross margins may also be adversely affected. Finally,increased costs resulting from higher-than-anticipated oil prices and the volatility of the value of the U.S. dollarmay affect the costs of components used in Brocade’s products and negatively affect Brocade’s gross margins.
The failure to accurately forecast demand for Brocade’s products or the failure to successfully manage theproduction of Brocade’s products could negatively affect the supply of key components for Brocade’sproducts and Brocade’s ability to manufacture and sell Brocade’s products.
Brocade provides product forecasts to its contract manufacturers and places purchase orders with them inadvance of the scheduled delivery of products to Brocade’s customers. Moreover, in preparing sales and demandforecasts, Brocade relies largely on input from its partners and its resellers and end-user customers. Therefore, ifBrocade or its partners are unable to accurately forecast demand, or if Brocade fails to effectively communicatewith its distribution partners about end-user demand or other time-sensitive information, the sales and demandforecasts may not reflect the most accurate, up-to-date information. If these forecasts are inaccurate, Brocademay be unable to obtain adequate manufacturing capacity from its contract manufacturers to meet customers’delivery requirements or Brocade may accumulate excess inventories. Furthermore, Brocade may not be able toidentify forecast discrepancies until late in its fiscal quarter. Consequently, Brocade may not be able to makeadjustments to its business model. If Brocade is unable to obtain adequate manufacturing capacity from itscontract manufacturers, or if Brocade is unable to make necessary adjustments to Brocade’s business model,revenue may be delayed or even lost to Brocade’s competitors and Brocade’s business and financial results maybe harmed. If excess inventories accumulate, Brocade’s gross margins may be negatively impacted by write-downs for excess and/or obsolete inventory. In addition, Brocade may experience higher fixed costs as it expands
15

its contract manufacturer capabilities, which could negatively affect Brocade’s ability to react quickly if demandsuddenly decreases.
Brocade’s ability to accurately forecast demand also may become increasingly more difficult as Brocadeenters new or adjacent markets, introduces new products, begins phasing out certain products, or acquires othercompanies or businesses. Forecasting demand for new or adjacent markets, particularly where the markets arenot yet well-established, may be highly speculative and uncertain. For products that are nearing end of life or arebeing replaced by new versions, it may be difficult to forecast how quickly to decrease production on the olderproducts and ramp up production on the new products. Brocade may be unable to obtain adequate supply of newproduct components and/or manufacturing capacity from its contract manufacturers to meet customers’ deliveryrequirements that may negatively impact revenues, or Brocade may accumulate excess inventories that maynegatively impact gross margins due to write-downs for excess and/or obsolete inventory. In addition, acquiredcompanies or businesses may offer less visibility into demand than Brocade typically has experienced, may causecustomer uncertainty regarding purchasing decisions, and may use different measures to evaluate demand thatare less familiar to Brocade and thus more difficult to accurately predict.
In addition, although the purchase orders placed with Brocade’s contract manufacturers are cancelable incertain circumstances, Brocade could be required to purchase certain unused material not returnable, usable by,or sold to other customers if Brocade cancels any of Brocade’s orders. This purchase commitment exposure isparticularly high in periods of new product introductions and product transitions. If Brocade is required topurchase unused material from Brocade’s contract manufacturers, Brocade could incur unanticipated expenses,including write-downs for excess and/or obsolete inventory, and Brocade’s business and financial results couldbe negatively affected. In the past, Brocade has experienced delays in shipments of its Ethernet products from itscontract manufacturers and OEMs, which in turn delayed product shipments to its customers. Brocade may in thefuture experience similar delays or other problems, such as insufficient quantity of product, acquisition by acompetitor or business failure of any of its OEMs, any of which could harm Brocade’s business and operatingresults.
Brocade is subject to, and may in the future be subject to other, intellectual property infringement claimsand litigation that are costly to defend and/or settle, and that could result in significant damage and costawards against Brocade and limit Brocade’s ability to use certain technologies in the future.
Brocade competes in markets that are frequently subject to claims and related litigation regarding patent andother intellectual property rights. From time to time, third parties have asserted patent, copyright, trade secret,and/or other IP-related claims against Brocade and/or employees of Brocade. These claims may be, and havebeen in the past, made against Brocade’s products and services, subcomponents of its products, methodsperformed by its products or used in its operations, or uses of its products by its customers, or may concernBrocade’s hiring of a former employee of the third party claimant. Brocade and companies acquired by Brocade,such as Foundry, have in the past incurred, are currently incurring and will in the future incur substantialexpenses to defend against such third-party claims. For instance, Brocade currently is defending patent-relatedlawsuits, including lawsuits originally filed against Foundry by Enterasys Networks, Inc. and Chrimar Systems,Inc. In addition, Brocade may be subject to indemnification obligations with respect to infringement of third-party intellectual property rights pursuant to Brocade agreements with suppliers, OEM and channel partners orcustomers. The opposing litigants and other third party asserters of such intellectual property claims may beunreasonable in their positions, or in their demands, or may simply refuse to settle, which could lead to expensivesettlement payments, prolonged periods of litigation expenses, additional burden on employees or other resourcesand distraction from Brocade’s business initiatives and operations. In the event of an adverse determination,Brocade could incur substantial monetary liability and be prohibited from utilizing certain technology, hiringcertain people, shipping or importing certain products or incorporating necessary components into Brocade’sproducts. Suppliers of components or OEM systems to Brocade may be unwilling to, or not be able to, defend orindemnify Brocade against third-party assertions directed at the components or systems they supply to Brocade,and may be unwilling to take licenses that would assure Brocade’s supply of such components or OEM systems.
16

Customers may perceive such third-party intellectual property claims as risks, and may, as a result, be lesswilling to do business with Brocade. Such litigation could also negatively impact Brocade’s recruiting efforts orability to retain its employees. Any of the above scenarios could have a material adverse effect on Brocade’sfinancial position, results of operations, cash flows, and future business prospects.
Brocade’s intellectual property rights may be infringed or misappropriated by others, and Brocade maynot be able to protect or enforce its intellectual property rights.
Brocade’s intellectual property rights may be infringed or misappropriated by others. In some cases, suchinfringement or misappropriation may be undetectable, or enforcement of Brocade’s rights may be impractical.Brocade has filed, and may in the future file, lawsuits against third parties in an effort to enforce its intellectualproperty rights. For instance, Brocade filed in the fourth quarter of fiscal year 2010 a patent infringement,copyright infringement, trade secret misappropriation and unfair competition lawsuit against A10 Networks, Inc.and certain individuals. Intellectual property litigation is expensive and unpredictable. There can be no assurancethat Brocade will prevail in such enforcement efforts, either on the merits, or with respect to particular reliefsought, such as damages or an injunction. Further, the opposing party may attempt to prove that the assertedintellectual property rights are invalid or unenforceable, and, if successful, may seek recompense for its attorneyfees and costs. Further, the opposing party may counterclaim against Brocade, for example, for infringement ofits own patents or intellectual property rights, or other intellectual property, tort or contract claims, which couldlead to further expense and potential exposure for Brocade.
Brocade relies on a combination of patent, copyright, trademark and trade secret laws, physical andoperational security and contractual restrictions on disclosure, to protect its intellectual property rights in itsproprietary technologies, but none of these methods of protection may be entirely reliable, due to, for instance,employee hiring and turnover, geographic dispersion of employees, technology disclosures with suppliers,customers, and partners, unpredictable events, misappropriation or negligence, operations in various countriesthat do not have well-established or reliable enforcement institutions or customs, and other aspects of doingbusiness on the scale of Brocade’s operations. Brocade attempts to identify its technological developments forassessment of whether to file patent applications, but there can be no assurance that all patentable technologicaldevelopments will be captured in patent applications. Further, although Brocade has patent applications pending,there can be no assurance that patents will be issued from pending applications, or that claims allowed on anyfuture patents will be sufficiently broad to protect its technology. Further, physical and operational security canbe adversely affected by employee carelessness or disregard for policies, malfeasors, or changes in technology,such as the now-near-ubiquitous availability of portable memory devices. The value, validity, and enforceabilityof intellectual property rights generated by Brocade’s operations, obtained from acquired companies, orpurchased from third parties, are subject to many unknowns, and may not ultimately have the value originallyanticipated. In addition, due to less developed intellectual property regimes in certain jurisdictions, Brocade maynot be able to protect fully its intellectual property as Brocade expands its operations globally.
Brocade uses several different routes to market for executing on its sales strategy including use of an OEMsales model focused on a few major OEM partners, and an expanded channel sales model. The loss of anyof these OEM customers or channel partners or any other significant failure to execute on Brocade’soverall sales strategy could significantly reduce Brocade’s revenues and negatively affect Brocade’sfinancial results.
Brocade recently began to offer its products through new and expanded channels, including through OEMs,resellers, distributors and direct. For example, Brocade recently announced that EMC, in addition to previousannouncements with IBM and Dell, would sell Brocade’s Ethernet networking products. However, these new andexpanded channels may not generate much, if any, revenue opportunities for Brocade. Offerings through newchannels may also require Brocade to make certain significant upfront or ongoing investments. These additionalcosts may not be recovered or may not provide the desired return on investment if the anticipated benefits are notultimately successful. These costs may also be larger than anticipated if the expenses associated with this new
17

channels strategy are greater than planned. If Brocade cannot successfully expand its sales channels, Brocademay fail to maintain or grow its business, which would negatively impact its financial results.
Brocade depends on recurring purchases from a limited number of large OEM partners for a substantialportion of its revenues. As a result, these large OEM partners have a significant influence on Brocade’s quarterlyand annual financial results. For fiscal years 2010, 2009 and 2008, the same three customers each represented10% or more of Brocade’s total net revenues. Brocade’s agreements with its OEM partners are typicallycancelable, non-exclusive, have no minimum purchase requirements and have no specific timing requirementsfor purchases. Brocade’s OEM partners could also elect to eliminate, reduce, or rebalance, the amount theypurchase from Brocade and/or increase the amount purchased from Brocade’s competitors. Also, one or more ofBrocade’s OEM partners could elect to consolidate or enter into a strategic partnership with one of Brocade’scompetitors, which could reduce or eliminate Brocade’s future revenue opportunities with that OEM partner.Brocade anticipates that a significant portion of its revenues and operating results will continue to depend onsales to a relatively small number of OEM partners. The loss of any one significant OEM partner, or a decreasein the level of sales to any one significant OEM partner, or unsuccessful quarterly negotiation on key terms,conditions or timing of purchase orders placed during a quarter, would likely cause serious harm to Brocade’sbusiness and financial results.
Brocade’s OEM partners evaluate and qualify Brocade’s products for a limited time period before theybegin to market and sell them. Assisting Brocade’s OEM partners through the evaluation process requiressignificant sales, marketing and engineering management efforts on Brocade’s part, particularly if Brocade’sproducts are being qualified with multiple distribution partners at the same time. In addition, once Brocade’sproducts have been qualified, its customer agreements have no minimum purchase commitments. Brocade maynot be able to effectively maintain or expand its distribution channels, manage distribution relationshipssuccessfully, or market its products through distribution partners. Brocade must continually assess, anticipate andrespond to the needs of its distribution partners and their customers, and ensure that its products integrate withtheir solutions. Brocade’s failure to successfully manage its distribution relationships or the failure of itsdistribution partners to sell Brocade’s products could reduce Brocade’s revenues significantly. In addition,Brocade’s ability to respond to the needs of its distribution partners in the future may depend on third partiesproducing complementary products and applications for Brocade’s products. If Brocade fails to respondsuccessfully to the needs of these groups, its business and financial results could be harmed.
The loss or delay of continued orders from any of Brocade’s more significant customers, such as the U.S.government or individual agencies within the U.S. government, or companies within the financial services,education and health sectors, could also cause its revenue and profitability to suffer. For example, if Brocade isunable to offer qualified products to such government customers due to regulations and requirements withrespect to country of origin designation, or if Brocade experiences governmental procurement delays due to thetiming of approval of the federal budget or other reasons. Brocade’s government orders could decrease, whichwould negatively impact its revenue and operating results. In addition, Brocade’s ability to attract new customerswill depend on a variety of factors, including the cost-effectiveness, reliability, scalability, breadth and depth ofits products. In addition, a change in the mix of Brocade’s customers, or a change in the mix of direct andindirect sales, could adversely affect its revenue and gross margins.
Brocade is dependent on sole source and limited source suppliers for certain key components, the loss ofwhich may significantly impact results of operations.
Although Brocade uses standard parts and components for its products where possible, Brocade’s contractmanufacturers currently purchase, on Brocade’s behalf, several key components used in the manufacture of itsproducts from single or limited supplier sources. Brocade’s principal single source components include itsapplication-specific integrated circuits (“ASICs”) and Brocade’s principal limited source components includememory, certain oscillators, microprocessors, certain connectors, certain logic chips, power supplies,programmable logic devices, printed circuit boards, certain optical components, packet processors and switching
18

fabrics. Brocade generally acquires these components through purchase orders and has no long-termcommitments regarding supply or pricing with such suppliers. If Brocade is unable to obtain these and othercomponents when required or if Brocade experiences significant component defects, Brocade may not be able todeliver Brocade’s products to Brocade’s customers in a timely manner. In addition, a challenging economic orindustry environment could cause some of these sole source or limited source suppliers to delay or haltproduction or to go out of business or be acquired by third parties, which could result in a disruption in Brocade’ssupply chain. Brocade’s supply chain could also be disrupted in a variety of other circumstances that may impactits suppliers and partners, including adverse results from intellectual property litigation or natural disasters. As aresult, Brocade’s business and financial results could be harmed.
In addition, the loss of any of Brocade’s major third-party contract manufacturers could significantly impactBrocade’s ability to produce its products for an indefinite period of time. Qualifying a new contract manufacturerand commencing volume production is typically a lengthy and expensive process. If Brocade is required tochange any of its contract manufacturers or if any of its contract manufacturer experiences delays, disruptions,capacity constraints, component parts shortages or quality control problems in its manufacturing operations,shipment of Brocade’s products to Brocade’s customers could be delayed and result in loss of revenues andBrocade’s competitive position and relationship with customers could be harmed.
Changes in industry structure and market conditions could lead to charges related to discontinuances ofcertain of Brocade’s products or businesses and asset impairments.
Brocade carries a substantial amount of acquired intangible assets, goodwill and deferred tax assets on itsbalance sheet. The goodwill and acquired intangibles predominately relate to the Ethernet business in connectionwith Brocade’s acquisition of Foundry in December 2008. Brocade’s determination of fair value of long-livedassets relies on management’s assumptions of future revenues, operating costs, and other relevant factors. Inresponse to changes in industry and market conditions, Brocade may be required to realign its resourcesstrategically and consider restructuring, disposing of, or otherwise exiting businesses. Any decision to limitinvestment in, or dispose of or otherwise exit businesses may result in the recording of special charges, such asinventory and technology-related write-offs, workforce reduction costs, charges relating to consolidation ofexcess facilities, or claims from third parties who were resellers or users of discontinued products. Similarly, ifmanagement’s estimates of future operating results change or if there are changes to other assumptions, such asthe discount rate applied to future cash flows, the estimate of the fair value of Brocade’s reporting units couldchange significantly, which could result in goodwill impairment charges. Brocade’s estimates with respect to theuseful life or ultimate recoverability of Brocade’s carrying basis of assets, including purchased intangible assets,could change as a result of such assessments and decisions. For example, during the three months ended May 2,2009, Brocade recorded a non-cash $53.3 million impairment charge in connection with the decision to no longeroffer Brocade’s suite of Files products. Brocade is required to perform goodwill impairment tests on an annualbasis and between annual tests in certain circumstances, and future goodwill impairment tests may result in acharge to earnings (see Note 4, “Goodwill and Intangible Assets,” of the Notes to Condensed ConsolidatedFinancial Statements, and sensitivity analysis performed in Item 2. Management’s Discussion and Analysis ofFinancial Condition and Results of Operations).
Brocade concludes that it is more-likely-than-not that the Company will realize its deferred tax assets basedon positive evidence of its history of profits and projections of future income. Accordingly, the Company onlyapplies a valuation allowance on the deferred tax assets relating to capital loss and investment loss carryforwards.In the event future income by jurisdiction is less than what is currently projected, Brocade may be required toapply a valuation allowance to these deferred tax assets in jurisdictions where realization of such assets are nolonger more-likely-than-not (see Note 15, “Income Taxes”, of the Notes to Consolidated Financial Statements).
Brocade’s estimates relating to the liabilities for excess facilities are also affected by changes in real estatemarket conditions. In addition, Brocade has made investments in certain private companies which could becomeimpaired if the operating results of those companies change adversely.
19

Brocade may not realize the anticipated benefits of past or future acquisitions and strategic investments,and integration of acquired companies or technologies may negatively impact Brocade’s business.
Brocade has in the past acquired, or made strategic investments in, other companies, products ortechnologies, and Brocade expects to make additional acquisitions and strategic investments in the future.Examples of recent acquisitions include Foundry in December 2008, Strategic Business Systems, Inc. in March2008 and McDATA Corporation in January 2007. Brocade may not realize the anticipated benefits of any of itsacquisitions or strategic investments, which involve numerous risks, including:
• Difficulties in successfully integrating the acquired businesses;
• Inability to effectively coordinate sales and marketing efforts to communicate the capabilities of thecombined company;
• Revenue attrition in excess of anticipated levels if existing customers alter or reduce their historicalbuying patterns;
• Unanticipated costs, litigation and other contingent liabilities;
• Diversion of management’s attention from Brocade’s daily operations and business;
• Adverse effects on existing business relationships with suppliers and customers;
• Risks associated with entering into markets in which Brocade has limited or no prior experience;
• Inability to attract and retain key employees;
• Inability to retain key customers, distributors, vendors and other business partners of the acquiredbusiness;
• Inability to successfully develop new products and services on a timely basis that address the marketopportunities of the combined company;
• Inability to compete effectively against companies already serving the broader market opportunitiesexpected to be available to the combined company;
• Inability to qualify the combined company’s products with OEM partners on a timely basis, or at all;
• Failure to consolidate the combined company’s professional services and customer supportorganizations;
• Inability to successfully integrate and harmonize financial reporting and information technologysystems;
• Failure to successfully manage additional remote locations, including the additional infrastructure andresources necessary to support and integrate such locations;
• Assumption or incurrence of debt and contingent liabilities and related obligations to service suchliabilities and Brocade’s ability to satisfy financial and other negative operating covenants;
• Additional costs such as increased costs of manufacturing and service costs, costs associated withexcess or obsolete inventory, costs of employee redeployment, relocation and retention, includingsalary increases or bonuses, accelerated amortization of deferred equity compensation and severancepayments, reorganization or closure of facilities, taxes, advisor and professional fees, and terminationof contracts that provide redundant or conflicting services;
• Incurrence of significant exit charges if products acquired in business combinations are unsuccessful;
• Incurrence of acquisition and integration related costs, accounting charges, or amortization costs foracquired intangible assets, that could negatively impact Brocade’s operating results and financialcondition;
20
• Potential write-down of goodwill, acquired intangible assets and/or deferred tax assets, which aresubject to impairment testing on an annual basis, and could significantly impact Brocade’s operatingresults; and
• Dilution of the ownership percentage held by Brocade’s stockholders to the extent equity is used asconsideration or option plans are assumed, such as in the case of the Foundry acquisition, in whichapproximately 125.1 million additional shares of Brocade common stock became issuable inconnection with the assumption or substitution of Foundry equity awards.
If Brocade is not able to successfully integrate businesses, products, technologies or personnel that Brocadeacquires, or to realize expected benefits of Brocade’s acquisitions or strategic investments, Brocade’s businessand financial results would be adversely affected.
Brocade’s quarterly and annual revenues and operating results may fluctuate in future periods due to anumber of factors, which make predicting results of operations difficult and could adversely affect thetrading price of Brocade’s stock.
Information technology spending is subject to cyclical and uneven fluctuations. It can be difficult to predictthe degree to which the seasonality and uneven sales patterns of Brocade’s OEM partners or other customers willaffect Brocade’s business in the future, particularly as Brocade releases new products. While Brocade’s first andfourth fiscal quarters have typically been seasonally stronger quarters than its second and third fiscal quarters,particularly for storage networking products, future buying patterns may differ from historical seasonality. Inaddition, the Federal budget for government IT spending can be subject to delay and uncertainty from time totime due to political and legislative volatility, which can cause Brocade’s financial results to fluctuate unevenlyand unpredictably.
Uneven sales patterns are not only difficult to predict, but also can result in irregular shipment patterns thatcan cause shortages or underutilized capacity, increase costs due to higher inventory levels, and otherwiseadversely impact inventory planning. For example, Brocade’s Ethernet networking business has experiencedsignificantly higher levels of sales towards the end of a period. Orders received towards the end of the periodmay not ship within the period due to Brocade’s manufacturing lead times. This exposes Brocade to additionalinventory risk because Brocade must order products in anticipation of expected future orders and additional salesrisk if Brocade is unable to fulfill unanticipated demand. In addition, receipt of a high number of customer orderstowards the end of a fiscal quarter will increase reported receivables outstanding as a fraction of reported salesand result in higher days sales outstanding.
Brocade’s quarterly and annual revenues and operating results may vary significantly in the future due to thefactors noted above as well as other factors, including but not limited to, the following:
• Disruptions, or a continued decline, in general economic conditions, particularly in the informationtechnology industry;
• Announcements of pending or completed acquisitions or other strategic transactions by Brocade, itscompetitors or its partners;
• Announcements, introductions and transitions of new products by Brocade, its competitors or itspartners;
• The timing of customer orders, product qualifications and product introductions of Brocade’s partners;
• Long and complex sales cycles;
• Internal supply and inventory management objectives of Brocade’s OEM partners and other customers;
• Brocade’s ability to timely produce products that comply with new environmental restrictions orrelated requirements of its customers;
21

• Brocade’s ability to obtain sufficient supplies of sole- or limited-sourced components, includingASICs, microprocessors, certain connectors, certain logic chips and programmable logic devices;
• Increases in prices of components used in the manufacture of Brocade’s products;
• Variations in the mix of Brocade’s products sold and the mix of distribution channels and geographiesthrough which they are sold;
• Pending or threatened litigation, including any settlements or judgments related to such litigation;
• Stock-based compensation expense that is affected by Brocade’s stock price;
• Examinations by government tax authorities that may have unfavorable outcomes and subject Brocadeto additional tax liabilities;
• New legislation and regulatory developments, including increases to tax rates or changes to treatmentof an income or expense item; and
• Other risk factors detailed in this section.
Accordingly, Brocade’s quarterly and annual revenues and operating results may vary significantly infuture. The results of any prior periods should not be relied upon as an indication of future performance. Brocadecannot assure you that in some future quarter Brocade’s revenues or operating results will not be belowBrocade’s projections or the expectations of stock market analysts or investors, which could cause Brocade’sstock price to decline.
The recent economic slowdown adversely affected Brocade’s operating results and financial condition andeconomic slowdowns in the future may have similar or greater negative impact.
In the past, unfavorable or uncertain economic conditions and reduced global information technologyspending rates have resulted in growth rates below historical patterns and have adversely affected Brocade’soperating results. For example, the domestic and global economies recently underwent a period of significantuncertainty and slowdown, which resulted in reduced demand for information technology, including high-performance data networking solutions. In addition, the domestic and global economies could experience aprolonged slowdown or even a “double dip” recession that could further reduce demand for informationtechnology products. Brocade is particularly susceptible to reductions in information technology spendingbecause the purchase of IT-related products is often discretionary and may involve a significant commitment ofcapital and other resources. Different geographic regions (e.g., EMEA or Japan) may experience greatereconomic slowdowns and/or longer recovery periods, which may adversely impact IT spending in those regions.Future delays or reductions in information technology spending, domestically and/or internationally, could harmBrocade’s business, results of operations and financial condition in a number of ways, including longer salescycles, increased inventory provisions, increased production costs, lowered prices for its products and reducedsales volumes. Similarly, if Brocade’s suppliers face challenges in obtaining credit or otherwise in operating theirbusinesses, they may become unable to continue to offer the materials Brocade uses to manufacture its productsor may offer the materials at higher prices. These events have caused, and future slowdowns may cause,reductions in Brocade’s revenue, profitability and cash flows; increased price competition and operating costs;longer fulfillment cycles; and may cause many other risks noted in this filing, which could adversely affectBrocade’s business, results of operations and financial condition.
Economic slowdowns can also make it difficult for Brocade, its customers and its suppliers to accuratelyforecast future product demand. This reduced visibility could cause Brocade to produce excess products thatwould increase its inventory carrying costs and result in obsolete inventory. Alternatively, this forecastingdifficulty could cause a shortage of products or materials used in Brocade’s products that would result in itsinability to satisfy demand for its products and a loss of market share.
22

Brocade has extensive international operations, which subjects it to additional business risks.
A significant portion of Brocade’s sales occur in international jurisdictions. In addition, Brocade’s contractmanufacturers have significant operations in China. Brocade plans to continue to expand its internationaloperations and sales activities. Brocade’s international sales of its Ethernet networking products have primarilydepended on its resellers, including Pan Dacom GmbH in Europe, Stark Technology Inc. in Taiwan, Net OneSystems in Japan and Samsung Corporation in Korea. The failure by international resellers to sell Brocade’sproducts could limit its ability to sustain and grow revenue. Maintenance or expansion of international operationsinvolves inherent risks that Brocade may not be able to control, including:
• Exposure to economic instability or fluctuations in international markets;
• Reduced or limited protection of intellectual property rights, particularly in jurisdictions that have lessdeveloped intellectual property regimes such as China and India;
• Managing research and development teams in geographically diverse locations, including teamsdivided between the United States and India;
• Significant wage inflation in certain growing economies such as India;
• Increased exposure to foreign currency exchange rate fluctuations, including the appreciation of foreigncurrencies such as the Chinese yuan;
• Supporting multiple languages;
• Recruiting sales and technical support personnel with the skills to design, manufacture, sell and supportBrocade’s products;
• Complying with governmental regulation of encryption technology and regulation of imports andexports, including obtaining required import or export approval for its products;
• Increased complexity and costs of managing international operations;
• Commercial laws and business practices that favor local competition;
• Multiple, potentially conflicting, and changing governmental laws, regulations and practices, includingdiffering export, import, tax, labor, anti-bribery and employment laws;
• Longer sales cycles and manufacturing lead times;
• Increased costs of local labor, including labor markets in China and India;
• Difficulties in collecting accounts receivable; and
• Increased complexity of logistics and distribution arrangements.
Failure to manage expansion effectively could seriously harm Brocade’s business, financial condition andprospects. In addition, international political instability may halt or hinder Brocade’s ability to do business andmay increase Brocade’s costs. Various events, including the occurrence or threat of terrorist attacks, increasednational security measures in the United States and other countries, and military action and armed conflicts, maysuddenly increase international tensions. Such events may have an adverse effect on the world economy andcould adversely affect Brocade’s business operations or the operations of Brocade’s OEM partners, contractmanufacturers and suppliers.
To date, no material amount of Brocade’s international revenues and cost of revenues have beendenominated in foreign currencies. As a result, an increase in the value of the U.S. dollar relative to foreigncurrencies could make Brocade’s products more expensive and, thus, not competitively priced in foreignmarkets. Additionally, a decrease in the value of the U.S. dollar relative to foreign currencies could increaseBrocade’s product and operating costs in foreign locations (e.g., appreciation of the Chinese yuan). In the future,a larger portion of Brocade’s international revenues may be denominated in foreign currencies, which will
23

subject Brocade to additional risks associated with fluctuations in those foreign currencies. In addition, Brocademay be unable to successfully hedge against any such fluctuations.
Business interruptions could adversely affect Brocade’s business.
Brocade’s operations and the operations of its suppliers, contract manufacturers and customers arevulnerable to interruptions by fire, earthquake, hurricane, power loss, telecommunications failure and otherevents beyond Brocade’s control. For example, a substantial portion of Brocade’s facilities, including itscorporate headquarters, is located near major earthquake faults. Brocade does not have multiple site capacity forall of its services in the event of any such occurrence. In the event of a major earthquake, Brocade couldexperience business interruption, destruction of facilities and loss of life. Brocade carries a limited amount ofearthquake insurance, which may not be sufficient to cover earthquake-related losses, and has not set aside fundsor reserves to cover other potential earthquake-related losses. Additionally, major public health issues such as anoutbreak of a pandemic or epidemic may interrupt business operations in those geographic regions affected bythat particular health issue. In addition, one of Brocade’s contract manufacturers has a major facility located in anarea that is subject to hurricanes. In the event that a material business interruption occurs that affects Brocade, itssuppliers, contract manufacturers or customers, shipments could be delayed and Brocade’s business and financialresults could be harmed. Despite Brocade’s implementation of network security measures, its servers may bevulnerable to computer viruses, break-ins, and similar disruptions from unauthorized tampering with its computersystems. Brocade may not carry sufficient insurance to compensate for losses that may occur as a result of any ofthese events.
Undetected software or hardware errors could increase Brocade’s costs, reduce Brocade’s revenues anddelay market acceptance of Brocade’s products.
Networking products frequently contain undetected software or hardware errors, or bugs, when firstintroduced or as new versions are released. Brocade’s products are becoming increasingly complex andparticularly, as Brocade continues to expand its product portfolio to include software-centric products, includingsoftware licensed from third parties, errors may be found from time to time in Brocade’s products. In addition,through its acquisitions, Brocade has assumed, and may in the future assume, products previously developed byan acquired company that have not been through the same level of product development, testing and qualitycontrol processes used by Brocade, and may have known or undetected errors. Some types of errors also may notbe detected until the product is installed in a heavy production or user environment. In addition, Brocade’sproducts are often combined with other products, including software, from other vendors, and these productsoften need to interface with existing networks, each of which have different specifications and utilize multipleprotocol standards and products from other vendors. As a result, when problems occur, it may be difficult toidentify the source of the problem. These problems may cause Brocade to incur significant warranty and repaircosts, may divert the attention of engineering personnel from product development efforts, and may causesignificant customer relations problems. Moreover, the occurrence of hardware and software errors, whethercaused by another vendor’s storage, data management or Ethernet products or Brocade’s, could delay marketacceptance of Brocade’s new products.
If Brocade loses key talent or is unable to hire additional qualified talent, Brocade’s business may beharmed.
Brocade’s success depends, to a significant degree, upon the continued contributions of key management,engineering, sales and other talent, many of whom would be difficult to replace. Brocade believes its futuresuccess will also depend, in large part, upon Brocade’s ability to attract and retain highly skilled managerial,engineering, sales and other talent, and on the ability of management to operate effectively, both individually andas a group, in geographically diverse locations. There is a limited number of qualified talent in each applicablemarket and competition for such employees is strong. In particular, Brocade operates in various locations withcompetitive labor markets including Bangalore, India and San Jose, California, as well as certain emerging labor
24

markets, such as the Eastern European and Latin American markets. In the past, Brocade has experienceddifficulty in hiring qualified talent in areas such as ASICs, software, system and test, sales, marketing, service,key management and customer support. Any future declines in Brocade’s stock price will reduce the value ofequity awards and may result in additional “underwater” stock options held by its employees. If such a decline inBrocade’s stock price were to occur, Brocade’s ability to incentivize or retain qualified talent could be negativelyimpacted. Brocade’s ability to retain qualified talent may also be affected by future and recent acquisitions,which may cause uncertainty and loss of key talent. The loss of the services of any of Brocade’s key employees,the inability to attract or retain qualified talent in the future, or delays in hiring required talent, particularlyengineers and sales talent, could delay the development and introduction of Brocade’s products or services, andnegatively affect Brocade’s ability to sell its products or services.
In addition, companies in the computer storage, networking and server industries whose employees acceptpositions with competitors may claim that their competitors have engaged in unfair hiring practices or that therewill be inappropriate disclosure of confidential or proprietary information. Brocade may be subject to suchclaims in the future as Brocade seeks to hire additional qualified talent. Such claims could result in litigation. Asa result, Brocade could incur substantial costs in defending against these claims, regardless of their merits, and besubject to additional restrictions if any such litigation is resolved against Brocade.
Brocade incurred substantial indebtedness to finance the acquisition of Foundry that decreases Brocade’sbusiness flexibility and access to capital, and increases its borrowing costs, which may adversely affectBrocade’s operations and financial results.
Upon completion of the acquisition of Foundry in December 2008, Brocade increased its indebtedness byapproximately $1.1 billion, which is substantially greater than its indebtedness prior to the acquisition. The $1.1billion debt was originally issued under a term loan facility. While the amount of the debt has been refinancedand reduced in part, the financial and other covenants agreed to by Brocade in connection with such indebtednessand the increased indebtedness and higher debt-to-equity ratio of Brocade in comparison to that of Brocade on arecent historical basis will have the effect, among other things, of reducing Brocade’s flexibility to respond tochanging business and economic conditions and increasing borrowing costs, and may adversely affect Brocade’soperations and financial results. The increased indebtedness may also adversely affect Brocade’s ability to accesssources of capital or incur certain liens. In addition, Brocade’s failure to comply with these covenants couldresult in a default under the applicable debt financing agreements, which could permit the holders to acceleratesuch debt or demand payment in exchange for a waiver of such default. If any of Brocade’s debt is accelerated,Brocade may not have sufficient funds available to repay such debt. The current debt under the Senior SecuredCredit Facility has a floating interest rate and an increase in interest rates may negatively impact Brocade’sfinancial results. The mandatory debt repayment schedule on the Senior Secured Credit Facility may negativelyimpact Brocade’s cash position and reduce Brocade’s financial flexibility. In addition, any negative changes byrating agencies to Brocade’s credit rating may negatively impact the value and liquidity of Brocade’s debt andequity securities and Brocade’s ability to access sources of capital.
Brocade’s business is subject to increasingly complex corporate governance, public disclosure, accountingand tax requirements, and environmental regulations that could adversely affect Brocade’s business andfinancial results.
Brocade is subject to changing rules and regulations of federal and state government as well as the stockexchange on which Brocade’s common stock is listed. These entities, including the Public Company AccountingOversight Board, the FASB, the SEC, the IRS and NASDAQ, have issued a significant number of new andincreasingly complex requirements and regulations over the course of the last several years and continue todevelop additional regulations and requirements in response to laws enacted by Congress. In addition, theDepartment of Treasury, the SEC and various Congressional representatives have recently proposed additionalrules and regulations that may go into effect in the near future. On July 21, 2010, the Dodd-Frank Wall StreetReform and Protection Act was enacted. The Act included significant corporate governance and executive
25
compensation-related provisions and also required the SEC to adopt additional rules and regulations in areas suchas “say on pay” and proxy access. Brocade is also subject to various rules and regulations of certain foreignjurisdictions, including applicable tax regulations. Brocade’s efforts to comply with these requirements haveresulted in, and are likely to continue to result in, an increase in expenses and a diversion of management’s timefrom other business activities. Similarly, any change in the tax law in the jurisdictions in which Brocade doesbusiness, including an increase in tax rates or an adverse change in the treatment of an item of income orexpense, could result in a material increase in Brocade’s tax expense. For example, in both the 2010 and 2011budget proposals, the President of the United States and the U.S. Treasury Department proposed changing certainof the U.S. tax rules for U.S. corporations doing business outside the United States. In August 2010, the Presidentenacted into law certain legislation impacting the use of foreign tax credits prospectively. Brocade is evaluatingthe provisions, but does not expect them to have a material impact to its financial results. Other legislation hasnot yet been proposed or enacted, but it is possible that these or other changes in the U.S. tax laws could increaseBrocade’s U.S. income tax liability in the future.
Brocade is subject to periodic audits or other reviews by such governmental agencies. For example, Brocadeis under examination by the IRS for its domestic federal income tax return for the fiscal years 2004 through 2008.In addition, Foundry’s California income tax returns for calendar years 2006 and 2007 are currently beingexamined by the California Franchise Tax Board. All these examination cycles remain open as of October 30,2010. Brocade resolved its California income tax audit for the years ended October 25, 2003 and October 30,2004. To the extent carryforwards from these years are used in the future, the California Franchise Tax Board hasthe right to audit the carryforward amounts. The SEC also periodically reviews Brocade’s public companyfilings. Any such examination or review frequently requires management’s time and diversion of internalresources and, in the event of an unfavorable outcome, may result in additional liabilities or adjustments toBrocade’s historical financial results.
The IRS is contesting Brocade’s transfer pricing for the cost sharing and buy-in arrangements with itsforeign subsidiaries. Brocade appealed the Revenue Agent’s Report to the Appeals Office of the IRS for theyears under examination through 2006. The IRS is also examining Brocade’s fiscal year 2007 and 2008 incometax returns. The IRS may make similar claims against Brocade’s transfer pricing arrangements in futureexaminations. Audits by the IRS are subject to inherent uncertainties and an unfavorable outcome could occur,such as fines or penalties. The occurrence of an unfavorable outcome in any specific period could have a materialadverse effect on Brocade’s results of operations for that period or future periods. The expense of defending andresolving such an audit may be significant. The amount of time to resolve an audit is unpredictable and defendingBrocade may divert management’s attention from Brocade’s day-to-day business operations, which couldadversely affect Brocade’s business.
Brocade is subject to various environmental and other regulations governing product safety, materials usage,packaging and other environmental impacts in the various countries where Brocade’s products are sold. Forexample, many of Brocade’s products are subject to laws and regulations that restrict the use of lead, mercury,hexavalent chromium, cadmium and other substances, and require producers of electrical and electronicequipment to assume responsibility for collecting, treating, recycling and disposing of Brocade’s products whenthey have reached the end of their useful life. For example, in Europe, substance restrictions apply to productssold, and certain of Brocade’s partners require compliance with these or more stringent requirements. In addition,recycling, labeling, financing and related requirements apply to products Brocade sells in Europe. China has alsoenacted similar legislation with similar requirements for Brocade’s products or its partners. Despite Brocade’sefforts to ensure that its products comply with new and emerging requirements, Brocade cannot provide absoluteassurance that its products will, in all cases, comply with such requirements. If Brocade’s products do not complywith the substance restrictions under local environmental laws, Brocade could become subject to fines, civil orcriminal sanctions and contract damage claims. In addition, Brocade could be prohibited from shippingnon-compliant products into one or more jurisdictions and required to recall and replace any non-compliantproducts already shipped, which would disrupt its ability to ship products and result in reduced revenue,increased obsolete or excess inventories, and harm to Brocade’s business and customer relationships. Brocade’s
26

suppliers may also fail to provide it with compliant materials, parts and components despite Brocade’srequirement to do so, which could impact Brocade’s ability to timely produce compliant products and,accordingly, could disrupt its business.
Brocade relies on licenses from third parties and the loss or inability to obtain any such license could harmits business.
Many of Brocade’s products are designed to include software or other intellectual property licensed fromthird parties. While it may be necessary in the future to seek or renew licenses relating to various aspects of itsproducts, Brocade believes that, based upon past experience and standard industry practice, such licensesgenerally can be obtained on commercially reasonable terms. Nonetheless, there can be no assurance that thenecessary licenses will be available on acceptable terms, if at all. Brocade’s inability to obtain certain licenses orother rights on favorable terms could have an adverse effect on Brocade’s business (including its ability tocontinue to distribute or support effected products), operating results and financial condition. In addition, ifBrocade fails to carefully manage the use of “open source” software in Brocade’s products, Brocade may berequired to license key portions of Brocade’s products on a royalty-free basis or expose key parts of source code.
Brocade is exposed to various risks related to legal proceedings or claims that could adversely affect itsoperating results.
Brocade is a party to lawsuits in the normal course of its business. Litigation in general can be expensive,lengthy and disruptive to normal business operations. Moreover, the results of complex legal proceedings aredifficult to predict. Responding to lawsuits brought against Brocade, or legal actions initiated by Brocade, canoften be expensive and time-consuming. Unfavorable outcomes from these claims and/or lawsuits couldadversely affect Brocade’s business, results of operations, or financial condition, and Brocade could incursubstantial monetary liability and/or be required to change its business practices.
Provisions in Brocade’s charter documents, customer agreements and Delaware law could prevent ordelay a change in control of Brocade, which could hinder stockholders’ ability to receive a premium forBrocade’s stock.
Provisions of Brocade’s certificate of incorporation and bylaws may discourage, delay or prevent a mergeror mergers that a stockholder may consider favorable. These provisions include:
• Authorizing the issuance of preferred stock without stockholder approval;
• Prohibiting cumulative voting in the election of directors;
• Limiting the persons who may call special meetings of stockholders; and
• Prohibiting stockholder actions by written consent.
Certain provisions of Delaware law also may discourage, delay or prevent someone from acquiring ormerging with Brocade, and Brocade’s agreements with certain of Brocade’s customers require that Brocade giveprior notice of a change of control and grant certain manufacturing rights following a change of control.Brocade’s various change-of-control provisions could prevent or delay a change in control of Brocade, whichcould hinder stockholders’ ability to receive a premium for Brocade’s stock.
Item 1B. Unresolved Staff Comments
None.
27

Item 2. Properties
Brocade’s principal administrative, sales, marketing, education, customer support, and research anddevelopment facilities are located in approximately 667,000 square feet in San Jose, California. Additionaladministrative and research and development facilities are located in approximately 213,000 square feet, inaggregate, in Broomfield, Colorado and Plymouth, Minnesota. Approximately 150,000 square feet of such spaceis leased and 730,000 square feet is owned. Brocade believes that its existing properties, including both ownedand leased, are in good condition and are suitable for the conduct of its business. Brocade also productivelyutilizes the majority of the space in its facilities.
Brocade’s leased properties have expirations through November 2020. In addition to the noted facilities,Brocade leases administrative, sales and marketing office space in various locations to serve its customersthroughout the world. On May 23, 2008, the Company purchased property located in San Jose, California, whichconsisted of three unimproved building parcels that were entitled for approximately 562,000 square feet of spacein three buildings. In connection with the purchase, Brocade also engaged a third party as development managerto manage the development and construction of improvements on the property. The construction of the campus,including three office buildings, was completed in fiscal year 2010, and serves as the Company’s headquarters.
Brocade has four operating segments. Due to the interrelation of these segments, these segments usesubstantially all of the properties at least in part, and Brocade retains the flexibility to use each of the propertiesin whole or in part for each of the segments.
Brocade’s properties are subject to a perfected first interest in and mortgages on its tangible and intangibleassets as further described in Note 9 (see “Borrowing” of Note 9) of the Notes to Consolidated FinancialStatements in Part II, Item 8 of this Form 10-K.
Item 3. Legal Proceedings
The information set forth in Note 10 (see “Legal Proceedings” of Note 10) of the Notes to ConsolidatedFinancial Statements in Part II, Item 8 of this Form 10-K is incorporated herein by reference.
Item 4. (Removed and Reserved)
28

PART II
Item 5. Market for Registrant’s Common Equity, Related Stockholder Matters and Issuer Purchases ofEquity Securities
Brocade’s common stock is quoted on the NASDAQ Global Select Market under the symbol “BRCD.” Priorto Brocade’s initial public offering on May 24, 1999, there was no public market for its common stock.Information regarding the high and low closing sales prices per share of Brocade’s common stock as reported onthe NASDAQ Global Select Market for each full quarterly period for the last two fiscal years is set forth in“Quarterly Summary” in Part II, Item 8 of this Form 10-K.
According to records of Brocade’s transfer agent, Brocade had 969 stockholders of record as ofDecember 10, 2010 and it believes there is a substantially greater number of beneficial holders. Brocade hasnever declared or paid any cash dividends on its common stock. Brocade currently expects to retain any futureearnings for use in the operation and expansion of its business and does not anticipate paying any cash dividendsin the foreseeable future. Information with respect to restrictions on paying dividends is set forth in Note 9 (see“Borrowing” of Note 9) of the Notes to Consolidated Financial Statements in Part II, Item 8 of this Form 10-K.
There were no unregistered sales of equity securities during the fiscal year ended October 30, 2010.Information with respect to securities authorized for issuance under equity compensation plans is set forth inNote 12 (see “Equity Compensation Plans” of Note 12) of the Notes to Consolidated Financial Statements in PartII, Item 8 of this Form 10-K.
There were no share repurchases during the three months ended October 30, 2010.
29
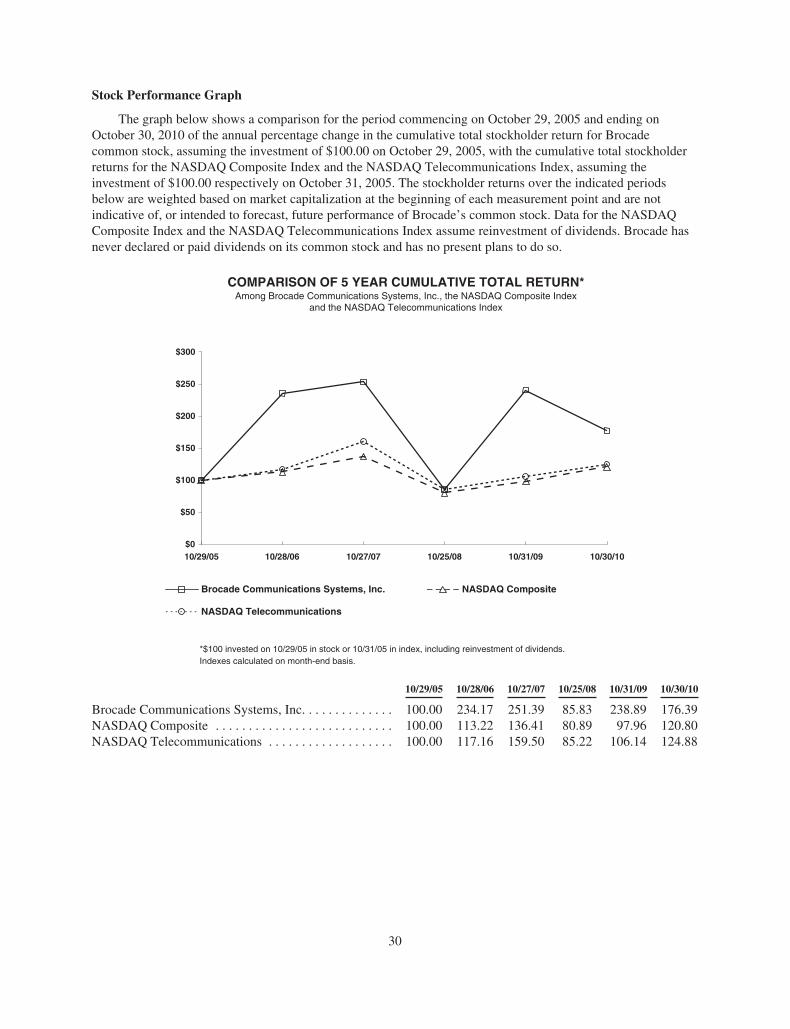
Stock Performance Graph
The graph below shows a comparison for the period commencing on October 29, 2005 and ending onOctober 30, 2010 of the annual percentage change in the cumulative total stockholder return for Brocadecommon stock, assuming the investment of $100.00 on October 29, 2005, with the cumulative total stockholderreturns for the NASDAQ Composite Index and the NASDAQ Telecommunications Index, assuming theinvestment of $100.00 respectively on October 31, 2005. The stockholder returns over the indicated periodsbelow are weighted based on market capitalization at the beginning of each measurement point and are notindicative of, or intended to forecast, future performance of Brocade’s common stock. Data for the NASDAQComposite Index and the NASDAQ Telecommunications Index assume reinvestment of dividends. Brocade hasnever declared or paid dividends on its common stock and has no present plans to do so.
COMPARISON OF 5 YEAR CUMULATIVE TOTAL RETURN*
$0
$50
$100
$150
$200
$300
$250
Brocade Communications Systems, Inc. NASDAQ Composite
NASDAQ Telecommunications
10/29/05 10/28/06 10/27/07 10/25/08 10/31/09 10/30/10
Among Brocade Communications Systems, Inc., the NASDAQ Composite Indexand the NASDAQ Telecommunications Index
*$100 invested on 10/29/05 in stock or 10/31/05 in index, including reinvestment of dividends.Indexes calculated on month-end basis.
10/29/05 10/28/06 10/27/07 10/25/08 10/31/09 10/30/10
Brocade Communications Systems, Inc. . . . . . . . . . . . . . 100.00 234.17 251.39 85.83 238.89 176.39NASDAQ Composite . . . . . . . . . . . . . . . . . . . . . . . . . . . 100.00 113.22 136.41 80.89 97.96 120.80NASDAQ Telecommunications . . . . . . . . . . . . . . . . . . . 100.00 117.16 159.50 85.22 106.14 124.88
30

Item 6. Selected Financial Data
The following selected financial data should be read in conjunction with the Consolidated FinancialStatements and related notes, “Management’s Discussion and Analysis of Financial Condition and Results ofOperations,” and other financial information appearing elsewhere in this Annual Report on Form 10-K. Theinformation set forth below is not necessarily indicative of Brocade’s future financial condition or results ofoperations.
Fiscal Year Ended
October 30,2010 (1)
October 31,2009 (2)
October 25,2008 (3)
October 27,2007 (4)
October 28,2006
(In thousands, except per share amounts)Consolidated Statements of Operations Data:Net revenues . . . . . . . . . . . . . . . . . . . . . . . . . . . . . . . . . . . . . . . $2,094,363 $1,952,926 $1,466,937 $1,236,863 $750,592Cost of revenues . . . . . . . . . . . . . . . . . . . . . . . . . . . . . . . . . . . . 860,033 919,426 606,565 575,451 305,184
Gross margin . . . . . . . . . . . . . . . . . . . . . . . . . . . . . . . . . . 1,234,330 1,033,500 860,372 661,412 445,408
Operating expenses:Research and development . . . . . . . . . . . . . . . . . . . . . . . . . . . . 354,260 354,809 255,571 213,311 164,843Sales and marketing . . . . . . . . . . . . . . . . . . . . . . . . . . . . . . . . . 534,458 385,155 274,311 211,168 139,434General and administrative . . . . . . . . . . . . . . . . . . . . . . . . . . . . 67,848 84,962 58,172 46,980 31,089Legal fees associated with indemnification obligations, SECinvestigation and other related costs, net . . . . . . . . . . . . . . . (163) 23,941 48,673 46,257 13,654
Provision for class action lawsuit . . . . . . . . . . . . . . . . . . . . . . . — — 160,000 — —Provision for SEC settlement . . . . . . . . . . . . . . . . . . . . . . . . . . — — — — 7,000Amortization of intangible assets . . . . . . . . . . . . . . . . . . . . . . . 65,623 68,718 31,484 24,719 2,294Acquisition and integration costs . . . . . . . . . . . . . . . . . . . . . . . 204 5,127 682 19,354 9,646Restructuring costs and facilities lease loss (benefit), net . . . . 1,059 2,329 2,731 — 3,775In-process research and development . . . . . . . . . . . . . . . . . . . . — 26,900 — — —Goodwill and acquisition-related intangible assetsimpairment . . . . . . . . . . . . . . . . . . . . . . . . . . . . . . . . . . . . . . — 53,306 — — —
Total operating expenses . . . . . . . . . . . . . . . . . . . . . . . . . . . . . 1,023,289 1,005,247 831,624 561,789 371,735
Income from operations . . . . . . . . . . . . . . . . . . . . . . . . . . . . . . 211,041 28,253 28,748 99,623 73,673Interest income . . . . . . . . . . . . . . . . . . . . . . . . . . . . . . . . . . . . . 763 4,896 24,568 36,989 29,233Other income (loss), net . . . . . . . . . . . . . . . . . . . . . . . . . . . . . . (7,215) (7,278) 2,299 1,512 (135)Interest expense (5) . . . . . . . . . . . . . . . . . . . . . . . . . . . . . . . . . . (85,858) (99,294) (17,249) (11,295) (7,082)Gain (loss) on sale of investments and property, net . . . . . . . . (8,551) (602) (6,874) 13,205 2,663Loss on impairment of portfolio investments . . . . . . . . . . . . . . — — (8,751) — —
Income (loss) before provision for (benefit from) incometaxes (5) . . . . . . . . . . . . . . . . . . . . . . . . . . . . . . . . . . . . . . . . 110,180 (74,025) 22,741 140,034 98,352
Income tax provision (benefit) (5) . . . . . . . . . . . . . . . . . . . . . . (8,672) 7,359 (144,651) 68,043 30,723
Net income (loss) (5) . . . . . . . . . . . . . . . . . . . . . . . . . . . . . . . . $ 118,852 $ (81,384) $ 167,392 $ 71,991 $ 67,629
Net income (loss) per share—basic (5) . . . . . . . . . . . . . . . . . . $ 0.27 $ (0.20) $ 0.45 $ 0.20 $ 0.25
Net income (loss) per share—diluted (5) . . . . . . . . . . . . . . . . . $ 0.25 $ (0.20) $ 0.44 $ 0.19 $ 0.25
Shares used in per share calculation—basic . . . . . . . . . . . . . . . 446,996 398,948 375,303 362,070 269,602
Shares used in per share calculation—diluted . . . . . . . . . . . . . 482,741 398,948 385,641 375,250 274,142
Consolidated Balance Sheet Data:Cash, cash equivalents, investments, and marketable equitysecurities . . . . . . . . . . . . . . . . . . . . . . . . . . . . . . . . . . . . . . . . $ 335,982 $ 338,871 $ 820,125 $ 793,330 $582,554
Working capital . . . . . . . . . . . . . . . . . . . . . . . . . . . . . . . . . . . . 305,168 30,088 239,700 502,499 428,233Total assets (5) . . . . . . . . . . . . . . . . . . . . . . . . . . . . . . . . . . . . . 3,654,175 3,671,420 3,306,151 1,930,100 900,718Non-current liabilities associated with facilities leaselosses . . . . . . . . . . . . . . . . . . . . . . . . . . . . . . . . . . . . . . . . . . . 3,984 10,150 15,007 25,742 11,105
Term loan, current and long-term portion . . . . . . . . . . . . . . . . 325,897 898,936 1,055,005 — —Senior secured notes . . . . . . . . . . . . . . . . . . . . . . . . . . . . . . . . . 595,373 — — — —Convertible subordinated debt (5) . . . . . . . . . . . . . . . . . . . . . . — 169,332 159,157 149,814 —Total stockholders’ equity (5) . . . . . . . . . . . . . . . . . . . . . . . . . 2,046,301 1,778,004 1,300,246 1,284,342 616,230
31
(1) The fiscal year ended October 30, 2010 reflects the reclassification of system engineer costs from cost of revenues tosales and marketing expenses. Fiscal years ended October 31, 2009 and October 25, 2008 have not been updated for thenew cost classification implemented in 2010 (see “Gross margin (loss)” and “Sales and marketing expenses” withinManagement’s Discussion and Analysis of Financial Condition and Results of Operations in Part II, Item 7 and Note 1,“Basis of Presentation and Reclassification,” of the Notes to Consolidated Financial Statements in Part II, Item 8 of thisForm 10-K).
(2) The fiscal year ended October 31, 2009 includes the impact of the acquisition of Foundry, which was completed in thefirst fiscal quarter (see Note 3, “Acquisitions,” of the Notes to Consolidated Financial Statements), and the one-time$26.9 million in-process research and development charge in connection with this acquisition. The fiscal year endedOctober 31, 2009 also includes the impact of the impairment of the Files reporting unit (see Note 4, “Goodwill andIntangible Assets,” of the Notes to Consolidated Financial Statements in Part II, Item 8 of this Form 10-K).
(3) The fiscal year ended October 25, 2008 includes the impact of the release of the valuation allowance of deferred taxassets which resulted in a tax benefit of $174.4 million during the year ended October 25, 2008. The fiscal year endedOctober 25, 2008 also includes the provision for a class action lawsuit of $160.0 million relating to a preliminarysettlement reached between Brocade and the lead plaintiffs for the federal securities class action on May 30, 2008.
(4) The fiscal year ended October 27, 2007 includes the impact of the acquisition of McDATA, which was completed in thesecond fiscal quarter of 2007.
(5) As adjusted due to the adoption of update to ASC 470-20 relating to accounting for convertible debt instruments (seeNote 2, “Summary of Significant Accounting Policies” of the Notes to Consolidated Financial Statements in Part II,Item 8 of this Form 10-K).
32

Item 7. Management’s Discussion and Analysis of Financial Condition and Results of Operations
The following discussion and analysis should be read in conjunction with the consolidated financialstatements and related notes appearing elsewhere in this Annual Report on Form 10-K.
Overview
We are a leading supplier of end-to-end networking solutions and services for businesses and organizationsof all types and sizes, including global enterprises, and service providers. Our business model is driven by ourtwo key markets, namely our core Data Storage business, where we offer directors, switches, top-of-rackswitches, end-of-row switches, HBAs, converged network products and server virtualization solutions, and ournewer Ethernet business, which we acquired in December 2008 as part of our acquisition of Foundry, where weoffer modular and stackable 1 GbE, 10 GbE, and 100 GbE solutions, as well as application delivery, security andwireless solutions.
Growth opportunities in the Data Storage market is expected to be driven by the requirements of key ITinitiatives among enterprises such as server virtualization, data center consolidation and migration to higherperformance technologies. We have recently implemented several initiatives to help drive both immediate andlong-term growth in our Ethernet business. Our Ethernet business strategies are intended to increase net-newenterprise Ethernet accounts, and expand our market share. Moreover, we plan to continue to support our DataStorage and Ethernet growth plans by enhancing our existing partnerships and forming new ones, and throughcontinuous innovation and new product introductions.
We do face challenges, some within and some outside our control, such as the uncertainty in the worldwidemacroeconomic climate and its impact on IT spending patterns globally as well as the federal government budgetin the United States. While the diversification of our business model helps mitigate some of these challenges andwe expect IT spending levels to generally rise in the long-term, it is difficult to offset any such resulting short-term reductions of IT spending.
Going forward, we expect the number of Data Storage and Ethernet ports we ship to fluctuate depending onthe demand for our existing and recently introduced Ethernet products and Data Storage products, as well as thetiming of product transitions by our OEM partners. We currently expect that average selling prices per port forour Data Storage products will likely decline at rates consistent with historical rates of low single digits perquarter, and that average selling prices per port for our Ethernet products will likely decline in the low-tomid-single digits per quarter.
In an effort to increase our Ethernet revenues and increase our market share, we plan to invest in sales andmarketing expenses. Also, with the completion of our Company campus, we expect reduced rent expense tobenefit cash flow from operations and reduced capital expenditures. We expect our cash flows to increase infiscal year 2011 as compared to fiscal year 2010, with which we intend to reduce our existing term loan, buildcash balances and/or repurchase our Company’s stock.
Results of Operations
We report our fiscal year on a 52/53-week period ending on the last Saturday in October. As is customaryfor companies that use the 52/53-week convention, every fifth year contains a 53-week year. Our fiscal year 2010is a 52-week fiscal year. Our fiscal year 2009 was a 53-week fiscal year, with our second quarter of fiscal year2009 consisting of fourteen weeks, which was one week longer than a typical quarter. Our next 53-week fiscalyear will be fiscal year 2014 and our next 14-week quarter will be in the second quarter of fiscal year 2014.
Effective November 1, 2009, we adopted a new accounting standard which required the separation of theliability and equity components of our convertible subordinated debt that may be settled in cash upon conversion
33

in a manner that reflects our economic interest cost. Accordingly, we bifurcated the debt into debt and equitycomponents and amortized the debt discount that resulted in the “economic interest cost” in our ConsolidatedStatements of Operations. We have retrospectively applied the change in accounting to all periods presented, andhave recast the Consolidated Financial Statements presented in this report.
During fiscal year 2010, we reviewed our cost classification, primarily related to our system engineer(“SE”) costs that were previously classified within cost of revenues. The SE’s primary role has migrated overtime from assisting with customer support to primarily performing pre-sales activity to generate future business,which was enabled by the growth of our support organization, such that in 2010 the majority of the SE’s timewas spent on pre-sales activity. As a result of this change, we have reclassified the SE costs within ourConsolidated Statements of Operations starting in fiscal year 2010. These costs are now presented within salesand marketing expenses, as opposed to cost of revenues. Prior period amounts have not been updated for the newcost classification implemented in fiscal year 2010. See impact of this adjustment within “Gross margin (loss)”and “Sales and marketing expenses” below for comparative purposes.
Our results of operations for the years ended October 30, 2010, October 31, 2009 and October 25, 2008 arereported in this discussion and analysis as a percentage of total net revenues, except for gross margin (loss) withrespect to each segment, which is indicated as a percentage of the respective segment net revenues.
Revenues. Our revenues are derived primarily from sales of our Data Storage products, sales of our Ethernetproducts, and our service and support offerings related to those products.
Our total net revenues are summarized as follows (in thousands, except percentages):
Fiscal Year Ended
October 30,2010
% of NetRevenues
October 31,2009
% of NetRevenues
Increase/(Decrease)
%Change
Data Storage . . . . . . . . . . . . . . . . . . . . . . . . . $1,243,836 59.4% $1,191,077 61.0% $ 52,759 4.4%Ethernet Products . . . . . . . . . . . . . . . . . . . . . 488,188 23.3% 424,434 21.7% 63,754 15.0%Global Services . . . . . . . . . . . . . . . . . . . . . . 362,339 17.3% 337,415 17.3% 24,924 7.4%
Total net revenues . . . . . . . . . . . . . . . . . . . . $2,094,363 100.0% $1,952,926 100.0% $141,437 7.2%
Fiscal Year Ended
October 31,2009
% of NetRevenue
October 25,2008
% of NetRevenue
Increase/(Decrease)
%Change
Data Storage . . . . . . . . . . . . . . . . . . . . . . . . . $1,191,077 61.0% $1,224,156 83.5% $ (33,079) (2.7)%Ethernet Products . . . . . . . . . . . . . . . . . . . . . 424,434 21.7% 6,581 0.4% 417,853 6,349.4%Global Services . . . . . . . . . . . . . . . . . . . . . . 337,415 17.3% 236,200 16.1% 101,215 42.9%
Total net revenues . . . . . . . . . . . . . . . . . . . . $1,952,926 100.0% $1,466,937 100.0% $485,989 33.1%
The increase in total net revenues for the year ended October 30, 2010 compared with the year endedOctober 31, 2009 reflects growth in sales across all segments.
• The increase in Data Storage product revenues for the fiscal year 2010 reflects a 14.3% increase in thenumber of ports shipped, and mix shift from 4 Gb director and switch products to 8 Gb director andswitch products, which carry a higher price per port. This was partially offset by a decrease in averageselling price per port of 8.7%;
• Ethernet Products revenues for the fiscal year 2010 increased as a result of the inclusion of Foundry,which was acquired during the first fiscal quarter of 2009, for the full first fiscal quarter of 2010, andreflects the implementation of initiatives to drive both immediate and long-term growth in our Ethernetbusiness, which offset the decrease in average selling price of approximately 12.2% during fiscal year2010; and
34

• The increase in Global Services revenues was primarily a result of the inclusion of Foundry, which wasacquired during the first fiscal quarter of 2009, for the full first fiscal quarter of 2010, and higherproduct revenues during fiscal year 2010.
The increase in total net revenues for the year ended October 31, 2009 compared with the year endedOctober 25, 2008 reflects growth in sales of Ethernet Products and Global Services offerings.
• Data Storage product revenues for the period were slightly down and reflect a 3.3% decrease in thenumber of ports shipped from our director and switch products and a decrease in average selling priceper port of 10.4%, offset by a mix shift from 4 Gb director and switch products to 8 Gb directorproducts, which carry a higher price per port. We believe the decline in revenues was related to themacroeconomic environment during fiscal year 2009;
• The increase in revenues from Ethernet Products was due to sales of network switching and routerproducts acquired as part of our acquisition of Foundry in December 2008; and
• The increase in Global Services revenues was a result of the acquisition of Foundry in December 2008and the inclusion of SBS, which was acquired in March 2008, for the full fiscal year 2009, as well asthe continued expansion of our installed base.
Our total net revenues by geographical area are summarized as follows (in thousands, except percentages):
Fiscal Year Ended
October 30,2010
% of NetRevenues
October 31,2009
% of NetRevenues
Increase/(Decrease)
%Change
United States . . . . . . . . . . . . . . . . . . . . . . . . $1,340,319 64.0% $1,268,551 65.0% $ 71,768 5.7%Europe, the Middle East and Africa (1) . . . . 483,860 23.1% 451,002 23.1% 32,858 7.3%Asia Pacific . . . . . . . . . . . . . . . . . . . . . . . . . 173,243 8.3% 141,511 7.2% 31,732 22.4%Japan . . . . . . . . . . . . . . . . . . . . . . . . . . . . . . 58,914 2.8% 59,771 3.1% (857) (1.4)%Canada, Central and South America . . . . . . 38,027 1.8% 32,091 1.6% 5,936 18.5%
Total net revenues . . . . . . . . . . . . . . . . . . . . $2,094,363 100.0% $1,952,926 100.0% $141,437 7.2%
Fiscal Year Ended
October 31,2009
% of NetRevenues
October 25,2008
% of NetRevenues
Increase/(Decrease)
%Change
United States . . . . . . . . . . . . . . . . . . . . . . . . $1,268,551 65.0% $ 931,280 63.5% $337,271 36.2%Europe, the Middle East and Africa (1) . . . . 451,002 23.1% 359,678 24.5% 91,324 25.4%Asia Pacific . . . . . . . . . . . . . . . . . . . . . . . . . 141,511 7.2% 116,925 8.0% 24,586 21.0%Japan . . . . . . . . . . . . . . . . . . . . . . . . . . . . . . 59,771 3.1% 37,977 2.6% 21,794 57.4%Canada, Central and South America . . . . . . 32,091 1.6% 21,077 1.4% 11,014 52.3%
Total net revenues . . . . . . . . . . . . . . . . . . . . $1,952,926 100.0% $1,466,937 100.0% $485,989 33.1%
(1) Includes net revenues of $254.4 million, $177.0 million and $85.1 million for the years ended October 30,2010, October 31, 2009 and October 25, 2008 respectively, relating to the Netherlands.
International revenues increased as a percentage of total net revenues for the year ended October 30, 2010compared with fiscal year 2009 primarily as a result of increased revenues in the Asia Pacific region.International revenues decreased as a percentage of total net revenues for the year ended October 31, 2009compared with fiscal year 2008 primarily as a result of the higher concentration of revenue in United Statesassociated with the Foundry acquisition. Revenues are attributed to geographic areas based on where ourproducts are shipped. However, certain OEM partners take possession of our products domestically and thendistribute these products to their international customers. Because we account for all of those OEM revenues asdomestic revenues, we cannot be certain of the extent to which our domestic and international revenue mix isimpacted by the practices of our OEM partners, but we believe that international revenues comprise a largerpercentage of our total net revenues than the attributed revenues may indicate.
35

A significant portion of our revenue is concentrated among a relatively small number of OEM customers.For the years ended October 30, 2010, October 31, 2009 and October 25, 2008, the same three customers eachrepresented 10% or more of our total net revenues for a combined total of 47% (EMC with 16%, HP with 14%and IBM with 17%), 48% (EMC with 18%, HP with 13% and IBM with 17%) and 65% (EMC with 25%, HPwith 18% and IBM with 22%), respectively, of our total net revenues. We expect that a significant portion of ourfuture revenues will continue to come from sales of products to a relatively small number of OEM partners andto the U.S. government or individual agencies within the U.S. government through our distributors. Therefore,the loss of, or a decrease in the level of sales to, or a change in the ordering pattern of any one of these customerscould seriously harm our financial condition and results of operations.
A majority of our accounts receivable balance is derived from sales to OEM partners in the computerstorage and server industry. As of October 30, 2010, three customers accounted for 17%, 14% and 10%,respectively, of total accounts receivable. As of October 31, 2009, two customers accounted for 16% and 11%,respectively, of total accounts receivable. We perform ongoing credit evaluations of our customers and generallydo not require collateral or security interests on accounts receivable balances. We have established reserves forcredit losses, sales allowances, and other allowances. While we have not experienced material credit losses inany of the periods presented, there can be no assurance that we will not experience material credit losses in thefuture.
Gross margin (loss). Gross margin (loss) as stated below is indicated as a percentage of the respectivesegment net revenues, except for total gross margin, which is stated as a percentage of total net revenues. Grossmargin (loss) are summarized as follows (in thousands, except percentages):
Fiscal Year Ended
October 30,2010
% of NetRevenues
October 31,2009
% of NetRevenues
Increase/(Decrease)
% PointsChange
Data Storage . . . . . . . . . . . . . . . . . . . . . . . . $ 849,330 68.3% $ 723,581 60.8% $125,749 7.5%Ethernet Products . . . . . . . . . . . . . . . . . . . . 199,208 40.8% 152,576 35.9% 46,632 4.9%Global Services . . . . . . . . . . . . . . . . . . . . . 185,792 51.3% 157,343 46.6% 28,449 4.7%
Total gross margin . . . . . . . . . . . . . . . . . . . $1,234,330 58.9% $1,033,500 52.9% $200,830 6.0%
Fiscal Year Ended
October 31,2009
% of NetRevenues
October 25,2008
% of NetRevenues
Increase/(Decrease)
% PointsChange
Data Storage . . . . . . . . . . . . . . . . . . . . . . . . $ 723,581 60.8% $ 775,111 63.3% $ (51,530) (2.5)%Ethernet Products . . . . . . . . . . . . . . . . . . . . 152,576 35.9% (4,224) (64.2)% 156,800 100.1%Global Services . . . . . . . . . . . . . . . . . . . . . 157,343 46.6% 89,485 37.9% 67,858 8.7%
Total gross margin . . . . . . . . . . . . . . . . . . . $1,033,500 52.9% $ 860,372 58.7% $173,128 (5.8)%
Starting fiscal year 2010, gross margin excludes SE costs which have been reclassified as operating expense.For comparative purposes, had the reclassification been affected for fiscal years 2009 and 2008, the adjustedgross margins would have been as follows (in thousands, except percentages):
Fiscal Year Ended
October 30,2010
% of NetRevenues
October 31,2009
% of NetRevenues
Increase/(Decrease)
% PointsChange
Data Storage . . . . . . . . . . . . . . . . . . . . . . . . $ 849,330 68.3% $ 783,051 65.7% $66,279 2.6%Ethernet Products . . . . . . . . . . . . . . . . . . . . 199,208 40.8% 195,526 46.1% 3,682 (5.3)%Global Services . . . . . . . . . . . . . . . . . . . . . . 185,792 51.3% 175,469 52.0% 10,323 (0.7)%
Total gross margin . . . . . . . . . . . . . . . . . . . $1,234,330 58.9% $1,154,046 59.1% $80,284 (0.2)%
36

Fiscal Year Ended
October 31,2009
% of NetRevenues
October 25,2008
% of NetRevenues
Increase/(Decrease)
% PointsChange
Data Storage . . . . . . . . . . . . . . . . . . . . . . . . . $ 783,051 65.7% $830,873 67.9% $ (47,822) (2.2)%Ethernet Products . . . . . . . . . . . . . . . . . . . . . 195,526 46.1% (3,552) (54.0)% 199,078 100.1%Global Services . . . . . . . . . . . . . . . . . . . . . . 175,469 52.0% 94,818 40.1% 80,651 11.9%
Total gross margin . . . . . . . . . . . . . . . . . . . . $1,154,046 59.1% $922,139 62.9% $231,907 (3.8)%
For the year ended October 30, 2010 compared with fiscal year 2009, total gross margin increased inabsolute dollars primarily due to higher revenues and exclusion of SE costs in fiscal year 2010. Total grossmargin percentage also increased primarily due to the exclusion of SE costs from gross margin. Assuming the SEreclassification was made for fiscal year 2009 on a pro forma basis for comparative purposes, the total grossmargin percentage decreased in fiscal year 2010 primarily due to lower Ethernet Products gross margins, as wellas lower margins on Global Services, which offset the improved margins in the Data Storage segment.
Gross margin percentage by reportable segment increased or decreased for the year ended October 30, 2010compared with fiscal year 2009 primarily due to the following factors which reflect the pro forma reclassificationof SE costs in fiscal year 2009 for comparative purposes (the percentages below reflect the impact on grossmargin):
• Data Storage gross margins relative to net revenues increased due to a 1.0% decrease in amortization ofintangible assets related to the McDATA acquisition, and a 1.9% decrease in other manufacturingcosts. This was partially offset by an increase in product costs of 0.3% relative to net revenues,primarily due to a decline in average selling price;
• Ethernet Products gross margins relative to net revenues decreased due to a 2.4% increase in productcosts relative to net revenues due to lower average selling prices and shifting product mix, partiallyoffset by cost savings, and the impact of purchase price accounting adjustment for the fiscal year 2009related to deferred revenues. Additionally, other manufacturing costs increased 2.9% primarily onaccount of inventory write-downs due to product transitions, and higher manufacturing costs tied tonew products; and
• Global Services gross margins relative to net revenues decreased due to a 1.3% increase in service andsupport costs, primarily on account of inventory write-downs in fiscal year 2010 and cash paymentpursuant to a one-time settlement of a litigation matter during the first fiscal quarter of 2010. This waspartially offset by a 0.6% decrease in stock-based compensation relative to net revenues.
For the year ended October 31, 2009 compared with fiscal year 2008, total gross margin increased inabsolute dollars, but total gross margin percentage decreased primarily due to increased mix of Ethernet Productsrevenue, which carries a lower overall gross margin, purchase accounting adjustments associated with theFoundry acquisition, increased stock-based compensation and increased amortization of intangible assetsacquired under the Foundry acquisition.
In addition, gross margin percentage by reportable segment increased or decreased for the year endedOctober 31, 2009 compared with fiscal year 2008 primarily due to the following factors, which do not reflect thepro forma reclassification of SE costs from cost of revenues to sales and marketing expenses:
• Data Storage product costs relative to net revenues slightly increased primarily due to a 3.4% increasein manufacturing costs and a 0.4% increase in stock-based compensation, both of which are due toheadcount growth, partially offset by a 0.8% decrease in product costs and a 0.5% decrease inamortization of intangible assets related to the McDATA acquisition;
• Ethernet Products costs relative to net revenues decreased primarily due to an increase in revenue as aresult of the Foundry acquisition, offset by an increase in product costs, amortization of intangible
37

assets and stock-based compensation. The gross loss in Ethernet Products for the year endedOctober 25, 2008 reflects the former Files operating segment, which has been included within theEthernet Products reportable segment for the year ended October 31, 2009; and
• Global Services operating costs relative to net revenues decreased primarily due to a 11.2% decrease inservice and support spending relative to net revenues as a result of additional revenue generated fromthe Foundry and SBS acquisitions, partially offset by a 1.6% increase in stock-based compensation anda 0.8% increase in amortization of intangible assets as a result of the SBS acquisition.
Gross margin is primarily affected by average selling price per port, number of ports shipped and cost ofrevenues. As described above, we expect that average selling prices per port for our Data Storage products willcontinue to decline at rates consistent with historical rates of low single digits per quarter, and the average sellingprice per port of our Ethernet Products will decline in the low-to mid-single digits, unless they are furtheraffected by accelerated pricing pressures, new product introductions by us or our competitors, or other factorsthat may be beyond our control. We believe that we have the ability to partially mitigate the effect of declines inaverage selling price per port on gross margins by reducing our product and manufacturing operations costs.
Stock-based compensation expense. Stock-based compensation expense is summarized as follows (inthousands, except percentages):
October 30,2010
% of NetRevenues
October 31,2009
% of NetRevenues
Increase/(Decrease)
%Change
Fiscal year ended . . . . . . . . . . . . . . . . . . . . . . . $101,625 4.9% $137,219 7.0% $(35,594) (25.9)%
October 31,2009
% of NetRevenues
October 25,2008
% of NetRevenues
Increase/(Decrease)
%Change
Fiscal year ended . . . . . . . . . . . . . . . . . . . . . . . $137,219 7.0% $ 39,036 2.7% $ 98,183 251.5%
The decrease in stock-based compensation expense for the year ended October 30, 2010 compared with thefiscal year ended 2009 was primarily due to the decrease in Foundry-related deferred compensation and thecompletion of the Company’s long-term, performance-based equity incentive plan on October 31, 2009. Thedecrease was partially offset by the adoption in fiscal year 2009 of our 2009 Employee Stock Purchase Plan(“ESPP”) for which compensation expense is recognized using the graded vesting method over the twenty-fourmonth offering period in comparison to the six-month offering period under our 1999 ESPP, which was effectivefor the first seven fiscal months of 2009.
The increase in stock-based compensation expense for the year ended October 31, 2009 compared withfiscal year 2008 was primarily due to increased headcount related to the acquisition of Foundry in December2008, as well as the adoption of our 2009 ESPP for which compensation expense is recognized using the gradedvesting method over the twenty-four month offering period.
Research and development expenses. Research and development (“R&D”) expenses consist primarily ofsalaries and related expenses for personnel engaged in engineering and R&D activities, fees paid to consultantsand outside service providers, nonrecurring engineering charges, prototyping expenses related to the design,development, testing and enhancement of our products, depreciation related to engineering and test equipment,and related IT and facilities expenses.
38

R&D expenses are summarized as follows (in thousands, except percentages):
October 30,2010
% of NetRevenues
October 31,2009
% of NetRevenues
Increase/(Decrease)
%Change
Fiscal year ended . . . . . . . . . . . . . . . . . . . . . . . $354,260 16.9% $354,809 18.2% $ (549) (0.2)%
October 31,2009
% of NetRevenues
October 25,2008
% of NetRevenues
Increase/(Decrease)
%Change
Fiscal year ended . . . . . . . . . . . . . . . . . . . . . . . $354,809 18.2% $255,571 17.4% $99,238 38.8%
R&D expenses decreased for the year ended October 30, 2010 compared with the year ended October 31,2009 due to the following:
$ Change2009 to 2010Year-to-Date(“YTD”)
Salaries and wages . . . . . . . . . . . . . . . . . . . . . . . . . . . . . . . . . . . . . . . . . . . . . . . . . . . . . . . $(16,150)Stock-based compensation . . . . . . . . . . . . . . . . . . . . . . . . . . . . . . . . . . . . . . . . . . . . . . . . . (12,570)The decrease in R&D expenses was partially offset by the increase in the following:
Expenses related to IT, facilities and other shared functions . . . . . . . . . . . . . . . . . . . 8,933Depreciation and amortization . . . . . . . . . . . . . . . . . . . . . . . . . . . . . . . . . . . . . . . . . . 6,805Equipment and furniture . . . . . . . . . . . . . . . . . . . . . . . . . . . . . . . . . . . . . . . . . . . . . . . 5,321Outside services . . . . . . . . . . . . . . . . . . . . . . . . . . . . . . . . . . . . . . . . . . . . . . . . . . . . . . 5,185Nonrecurring engineering expenses . . . . . . . . . . . . . . . . . . . . . . . . . . . . . . . . . . . . . . 1,518Various individually insignificant items . . . . . . . . . . . . . . . . . . . . . . . . . . . . . . . . . . . 409
Total change . . . . . . . . . . . . . . . . . . . . . . . . . . . . . . . . . . . . . . . . . . . . . . . . . . . . . . . . . . . . $ (549)
Salaries and wages decreased primarily due to lower bonuses, partially offset by headcount growth.Expenses related to IT, facilities and other shared functions increased primarily due to headcount growth andmoving costs associated with preparing our new Company campus for occupancy. Depreciation and amortizationincreased primarily due to the build-up of our labs. Equipment and furniture increased primarily due to increasedequipment purchases. Outside services increased primarily due to projects and certification costs related to ourproduct offerings. Nonrecurring engineering expenses increased primarily due to continued development of newand enhanced products.
R&D expenses increased for the year ended October 31, 2009 compared with the year ended October 25,2008 due to the following:
$ Change2008 to 2009
YTD
Salaries and wages . . . . . . . . . . . . . . . . . . . . . . . . . . . . . . . . . . . . . . . . . . . . . . . . . . . . . . . . $56,712Stock-based compensation . . . . . . . . . . . . . . . . . . . . . . . . . . . . . . . . . . . . . . . . . . . . . . . . . . 30,041Expenses related to IT, facilities and other shared functions . . . . . . . . . . . . . . . . . . . . . . . . 7,823Nonrecurring engineering expenses . . . . . . . . . . . . . . . . . . . . . . . . . . . . . . . . . . . . . . . . . . . 5,175Depreciation and amortization . . . . . . . . . . . . . . . . . . . . . . . . . . . . . . . . . . . . . . . . . . . . . . . 4,545Various individually insignificant items . . . . . . . . . . . . . . . . . . . . . . . . . . . . . . . . . . . . . . . 2,292Outside services . . . . . . . . . . . . . . . . . . . . . . . . . . . . . . . . . . . . . . . . . . . . . . . . . . . . . . . . . . (7,350)
Total change . . . . . . . . . . . . . . . . . . . . . . . . . . . . . . . . . . . . . . . . . . . . . . . . . . . . . . . . . . . . . $99,238
The increases in salaries and wages, expenses related to IT, facilities and other shared functions,nonrecurring engineering expenses, depreciation and amortization were primarily the result of headcount growth
39

from the Foundry acquisition. In addition, salaries and wages were higher for the year ended October 31, 2009compared with fiscal year 2008 due to the extra week during the second quarter of our fiscal year 2009, partiallyoffset by an average of nine days of unpaid time resulting from the implementation of a Company-wide unpaidtime off program during fiscal year 2009.
Sales and marketing expenses. Sales and marketing expenses consist primarily of salaries, commissions andrelated expenses for personnel engaged in sales, marketing and customer service functions, costs associated withpromotional and marketing programs, travel expenses, and related IT and facilities expenses.
Sales and marketing expenses are summarized as follows (in thousands, except percentages):
October 30,2010
% of NetRevenues
October 31,2009
% of NetRevenues
Increase/(Decrease)
%Change
Fiscal year ended . . . . . . . . . . . . . . . . . . . . . . . $534,458 25.5% $385,155 19.7% $149,303 38.8%
October 31,2009
% of NetRevenues
October 25,2008
% of NetRevenues
Increase/(Decrease)
%Change
Fiscal year ended . . . . . . . . . . . . . . . . . . . . . . . $385,155 19.7% $274,311 18.7% $110,844 40.4%
Starting fiscal year 2010, the Company classifies its SE costs as sales and marketing expenses. Forcomparative purposes, had the reclassification of SE costs from cost of revenues to sales and marketing expensesbeen affected for fiscal years 2009 and 2008, the pro forma sales and marketing expenses would have been asfollows (in thousands, except percentages):
October 30,2010
% of NetRevenues
October 31,2009
% of NetRevenues
Increase/(Decrease)
%Change
Fiscal year ended . . . . . . . . . . . . . . . . . . . . . . . $534,458 25.5% $505,701 25.9% $ 28,757 5.7%
October 31,2009
% of NetRevenues
October 25,2008
% of NetRevenues
Increase/(Decrease)
%Change
Fiscal year ended . . . . . . . . . . . . . . . . . . . . . . . $505,701 25.9% $336,078 22.9% $169,623 50.5%
Sales and marketing expenses increased for the year ended October 30, 2010 compared with the year endedOctober 31, 2009 due to the following, which reflects the pro forma reclassification of SE costs in fiscal year2009 for comparative purposes:
$ Change2009 to 2010
YTD
System engineering costs . . . . . . . . . . . . . . . . . . . . . . . . . . . . . . . . . . . . . . . . . . . . . . . . . . . $ 13,760Other increases (decreases):Expenses related to IT, facilities and other shared functions . . . . . . . . . . . . . . . . . . . . . . . . 10,930Salaries and wages . . . . . . . . . . . . . . . . . . . . . . . . . . . . . . . . . . . . . . . . . . . . . . . . . . . . . . . . 8,409Outside services . . . . . . . . . . . . . . . . . . . . . . . . . . . . . . . . . . . . . . . . . . . . . . . . . . . . . . . . . . 5,493Travel expenses . . . . . . . . . . . . . . . . . . . . . . . . . . . . . . . . . . . . . . . . . . . . . . . . . . . . . . . . . . 2,584The increase in sales and marketing expenses was partially offset by the decrease in thefollowing:Stock-based compensation . . . . . . . . . . . . . . . . . . . . . . . . . . . . . . . . . . . . . . . . . . . . . . (11,689)Various individually insignificant items . . . . . . . . . . . . . . . . . . . . . . . . . . . . . . . . . . . (730)
Total change . . . . . . . . . . . . . . . . . . . . . . . . . . . . . . . . . . . . . . . . . . . . . . . . . . . . . . . . . . . . . $ 28,757
System engineering costs increased primary due to head count growth. Expenses related to IT, facilities andother shared functions increased primarily due to headcount growth and moving costs associated with our new
40

Company campus. Salaries and wages increased primarily due to headcount growth and higher commissions.Outside services increased primarily due to channel-related marketing and promotions and corporate brandmarketing. Travel expenses increased due to headcount growth and initiatives to drive incremental revenue.
Sales and marketing expenses increased for the year ended October 31, 2009 compared with the year endedOctober 25, 2008 due to the following, which does not reflect the pro forma reclassification of SE costs from costof revenues:
$ Change2008 to 2009
YTD
Salaries and wages . . . . . . . . . . . . . . . . . . . . . . . . . . . . . . . . . . . . . . . . . . . . . . . . . . . . . . . . $ 63,498Stock-based compensation . . . . . . . . . . . . . . . . . . . . . . . . . . . . . . . . . . . . . . . . . . . . . . . . . . 38,168Expenses related to IT, facilities and other shared functions . . . . . . . . . . . . . . . . . . . . . . . . 7,193Outside services . . . . . . . . . . . . . . . . . . . . . . . . . . . . . . . . . . . . . . . . . . . . . . . . . . . . . . . . . . 4,776Facility expenses . . . . . . . . . . . . . . . . . . . . . . . . . . . . . . . . . . . . . . . . . . . . . . . . . . . . . . . . . 4,090Various individually insignificant items . . . . . . . . . . . . . . . . . . . . . . . . . . . . . . . . . . . . . . . 1,743Advertising and branding expense . . . . . . . . . . . . . . . . . . . . . . . . . . . . . . . . . . . . . . . . . . . . (8,624)
Total change . . . . . . . . . . . . . . . . . . . . . . . . . . . . . . . . . . . . . . . . . . . . . . . . . . . . . . . . . . . . . $110,844
The increases in salaries and wages, expenses related to IT, facilities and other shared functions, outsideservices and facility expenses were primarily the result of the Foundry acquisition. In addition, salaries andwages and stock-based compensation were higher for the year ended October 31, 2009 compared with fiscal year2008 due to the extra week during the second quarter of our fiscal year 2009, partially offset by an average ofnine days of unpaid time resulting from the implementation of a Company-wide unpaid time off program duringfiscal year 2009. The decrease in advertising and branding expenses was primarily due to higher product launchexpenses in 2008.
General and administrative expenses. General and administrative (“G&A”) expenses consist primarily ofsalaries and related expenses for corporate executives, finance, human resources, legal and investor relations, aswell as recruiting expenses, professional fees, other corporate expenses, and related IT and facilities expenses.
G&A expenses are summarized as follows (in thousands, except percentages):
October 30,2010
% of NetRevenues
October 31,2009
% of NetRevenues
Increase/(Decrease)
%Change
Fiscal year ended . . . . . . . . . . . . . . . . . . . . . . . $67,848 3.2% $84,962 4.4% $(17,114) (20.1)%
October 31,2009
% of NetRevenues
October 25,2008
% of NetRevenues
Increase/(Decrease)
%Change
Fiscal year ended . . . . . . . . . . . . . . . . . . . . . . . $84,962 4.4% $58,172 4.0% $ 26,790 46.1%
41
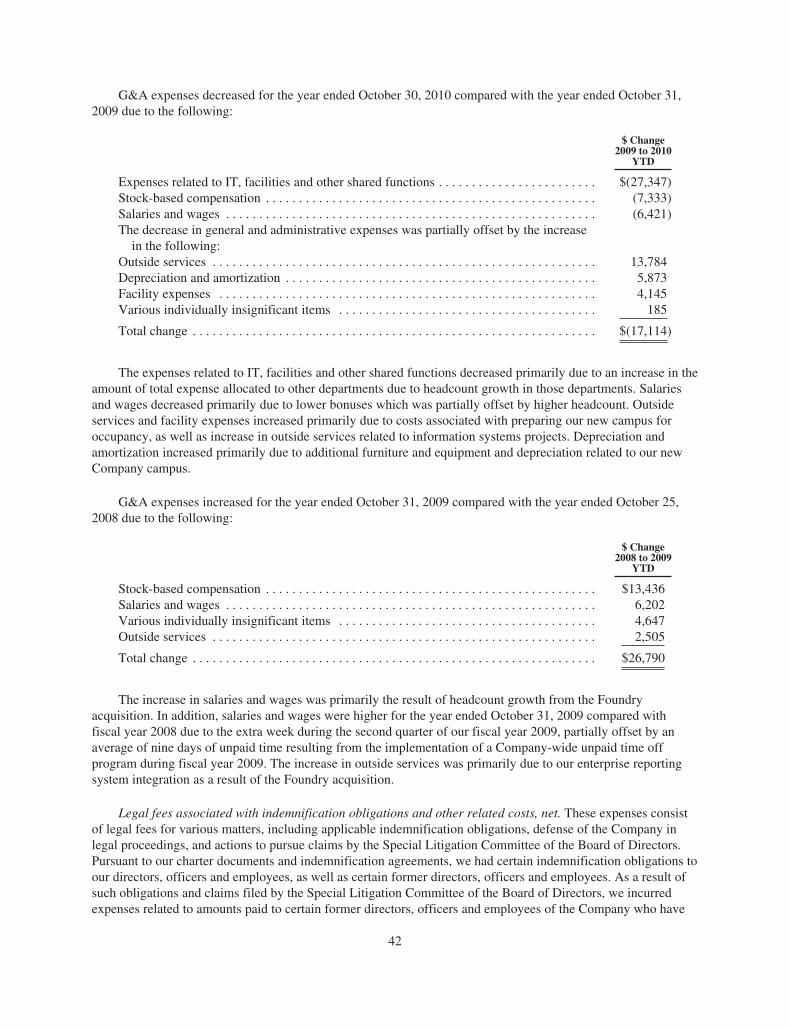
G&A expenses decreased for the year ended October 30, 2010 compared with the year ended October 31,2009 due to the following:
$ Change2009 to 2010
YTD
Expenses related to IT, facilities and other shared functions . . . . . . . . . . . . . . . . . . . . . . . . $(27,347)Stock-based compensation . . . . . . . . . . . . . . . . . . . . . . . . . . . . . . . . . . . . . . . . . . . . . . . . . . (7,333)Salaries and wages . . . . . . . . . . . . . . . . . . . . . . . . . . . . . . . . . . . . . . . . . . . . . . . . . . . . . . . . (6,421)The decrease in general and administrative expenses was partially offset by the increasein the following:
Outside services . . . . . . . . . . . . . . . . . . . . . . . . . . . . . . . . . . . . . . . . . . . . . . . . . . . . . . . . . . 13,784Depreciation and amortization . . . . . . . . . . . . . . . . . . . . . . . . . . . . . . . . . . . . . . . . . . . . . . . 5,873Facility expenses . . . . . . . . . . . . . . . . . . . . . . . . . . . . . . . . . . . . . . . . . . . . . . . . . . . . . . . . . 4,145Various individually insignificant items . . . . . . . . . . . . . . . . . . . . . . . . . . . . . . . . . . . . . . . 185
Total change . . . . . . . . . . . . . . . . . . . . . . . . . . . . . . . . . . . . . . . . . . . . . . . . . . . . . . . . . . . . . $(17,114)
The expenses related to IT, facilities and other shared functions decreased primarily due to an increase in theamount of total expense allocated to other departments due to headcount growth in those departments. Salariesand wages decreased primarily due to lower bonuses which was partially offset by higher headcount. Outsideservices and facility expenses increased primarily due to costs associated with preparing our new campus foroccupancy, as well as increase in outside services related to information systems projects. Depreciation andamortization increased primarily due to additional furniture and equipment and depreciation related to our newCompany campus.
G&A expenses increased for the year ended October 31, 2009 compared with the year ended October 25,2008 due to the following:
$ Change2008 to 2009
YTD
Stock-based compensation . . . . . . . . . . . . . . . . . . . . . . . . . . . . . . . . . . . . . . . . . . . . . . . . . . $13,436Salaries and wages . . . . . . . . . . . . . . . . . . . . . . . . . . . . . . . . . . . . . . . . . . . . . . . . . . . . . . . . 6,202Various individually insignificant items . . . . . . . . . . . . . . . . . . . . . . . . . . . . . . . . . . . . . . . 4,647Outside services . . . . . . . . . . . . . . . . . . . . . . . . . . . . . . . . . . . . . . . . . . . . . . . . . . . . . . . . . . 2,505
Total change . . . . . . . . . . . . . . . . . . . . . . . . . . . . . . . . . . . . . . . . . . . . . . . . . . . . . . . . . . . . . $26,790
The increase in salaries and wages was primarily the result of headcount growth from the Foundryacquisition. In addition, salaries and wages were higher for the year ended October 31, 2009 compared withfiscal year 2008 due to the extra week during the second quarter of our fiscal year 2009, partially offset by anaverage of nine days of unpaid time resulting from the implementation of a Company-wide unpaid time offprogram during fiscal year 2009. The increase in outside services was primarily due to our enterprise reportingsystem integration as a result of the Foundry acquisition.
Legal fees associated with indemnification obligations and other related costs, net. These expenses consistof legal fees for various matters, including applicable indemnification obligations, defense of the Company inlegal proceedings, and actions to pursue claims by the Special Litigation Committee of the Board of Directors.Pursuant to our charter documents and indemnification agreements, we had certain indemnification obligations toour directors, officers and employees, as well as certain former directors, officers and employees. As a result ofsuch obligations and claims filed by the Special Litigation Committee of the Board of Directors, we incurredexpenses related to amounts paid to certain former directors, officers and employees of the Company who have
42
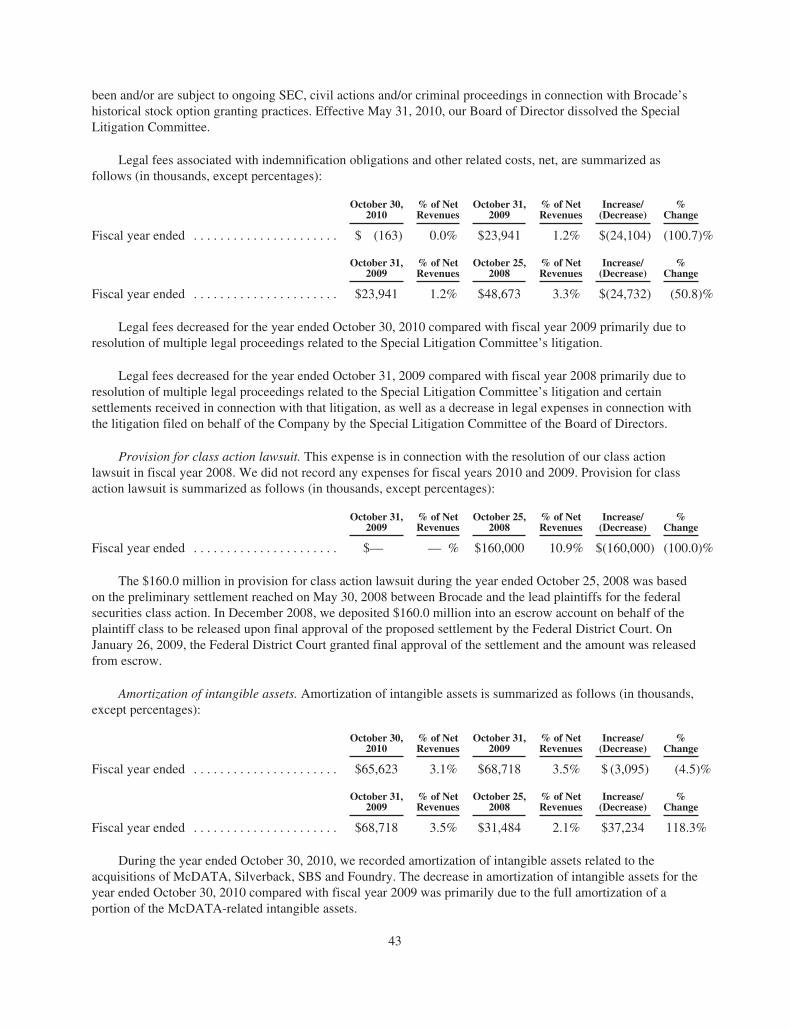
been and/or are subject to ongoing SEC, civil actions and/or criminal proceedings in connection with Brocade’shistorical stock option granting practices. Effective May 31, 2010, our Board of Director dissolved the SpecialLitigation Committee.
Legal fees associated with indemnification obligations and other related costs, net, are summarized asfollows (in thousands, except percentages):
October 30,2010
% of NetRevenues
October 31,2009
% of NetRevenues
Increase/(Decrease)
%Change
Fiscal year ended . . . . . . . . . . . . . . . . . . . . . . $ (163) 0.0% $23,941 1.2% $(24,104) (100.7)%
October 31,2009
% of NetRevenues
October 25,2008
% of NetRevenues
Increase/(Decrease)
%Change
Fiscal year ended . . . . . . . . . . . . . . . . . . . . . . $23,941 1.2% $48,673 3.3% $(24,732) (50.8)%
Legal fees decreased for the year ended October 30, 2010 compared with fiscal year 2009 primarily due toresolution of multiple legal proceedings related to the Special Litigation Committee’s litigation.
Legal fees decreased for the year ended October 31, 2009 compared with fiscal year 2008 primarily due toresolution of multiple legal proceedings related to the Special Litigation Committee’s litigation and certainsettlements received in connection with that litigation, as well as a decrease in legal expenses in connection withthe litigation filed on behalf of the Company by the Special Litigation Committee of the Board of Directors.
Provision for class action lawsuit. This expense is in connection with the resolution of our class actionlawsuit in fiscal year 2008. We did not record any expenses for fiscal years 2010 and 2009. Provision for classaction lawsuit is summarized as follows (in thousands, except percentages):
October 31,2009
% of NetRevenues
October 25,2008
% of NetRevenues
Increase/(Decrease)
%Change
Fiscal year ended . . . . . . . . . . . . . . . . . . . . . . $— — % $160,000 10.9% $(160,000) (100.0)%
The $160.0 million in provision for class action lawsuit during the year ended October 25, 2008 was basedon the preliminary settlement reached on May 30, 2008 between Brocade and the lead plaintiffs for the federalsecurities class action. In December 2008, we deposited $160.0 million into an escrow account on behalf of theplaintiff class to be released upon final approval of the proposed settlement by the Federal District Court. OnJanuary 26, 2009, the Federal District Court granted final approval of the settlement and the amount was releasedfrom escrow.
Amortization of intangible assets. Amortization of intangible assets is summarized as follows (in thousands,except percentages):
October 30,2010
% of NetRevenues
October 31,2009
% of NetRevenues
Increase/(Decrease)
%Change
Fiscal year ended . . . . . . . . . . . . . . . . . . . . . . $65,623 3.1% $68,718 3.5% $ (3,095) (4.5)%
October 31,2009
% of NetRevenues
October 25,2008
% of NetRevenues
Increase/(Decrease)
%Change
Fiscal year ended . . . . . . . . . . . . . . . . . . . . . . $68,718 3.5% $31,484 2.1% $37,234 118.3%
During the year ended October 30, 2010, we recorded amortization of intangible assets related to theacquisitions of McDATA, Silverback, SBS and Foundry. The decrease in amortization of intangible assets for theyear ended October 30, 2010 compared with fiscal year 2009 was primarily due to the full amortization of aportion of the McDATA-related intangible assets.
43

During the year ended October 31, 2009, we recorded amortization of intangible assets related to theacquisitions of McDATA, Silverback, SBS and Foundry. The increase in amortization of intangible assets for theyear ended October 31, 2009 compared with fiscal year 2008 was primarily due to the acquisition of Foundry inDecember 2008 and the acquisition of SBS in March 2008.
Intangible assets are recorded based on estimates of fair value at the time of the acquisition and identifiableintangible assets are amortized on a straight-line basis over their estimated useful lives (see Note 4, “Goodwilland Intangible Assets,” of the Notes to Consolidated Financial Statements in Part II, Item 8 of this Form 10-K).
Acquisition and integration costs. Acquisition and integration costs are summarized as follows (inthousands, except percentages):
October 30,2010
% of NetRevenues
October 31,2009
% of NetRevenues
Increase/(Decrease)
%Change
Fiscal year ended . . . . . . . . . . . . . . . . . . . . . . . $ 204 — % $5,127 0.3% $(4,923) (96.0)%
October 31,2009
% of NetRevenues
October 25,2008
% of NetRevenues
Increase/(Decrease)
%Change
Fiscal year ended . . . . . . . . . . . . . . . . . . . . . . . $5,127 0.3% $ 682 — % $ 4,445 651.8%
For each of the years ended October 30, 2010, October 31, 2009 and October 25, 2008, we recordedacquisition and integration costs primarily for consulting services and other professional fees in connection withour acquisition and integration of Foundry which we acquired on December 18, 2008.
Restructuring costs and facilities lease loss (benefit), net. Restructuring costs and facilities lease lossbenefit, net, are summarized as follows (in thousands, except percentages):
October 30,2010
% of NetRevenues
October 31,2009
% of NetRevenues
Increase/(Decrease)
%Change
Fiscal year ended . . . . . . . . . . . . . . . . . . . . . . . $1,059 0.1% $2,329 0.1% $(1,270) (54.5)%
October 31,2009
% of NetRevenues
October 25,2008
% of NetRevenues
Increase/(Decrease)
%Change
Fiscal year ended . . . . . . . . . . . . . . . . . . . . . . . $2,329 0.1% $2,731 0.2% $ (402) (14.7)%
Restructuring costs and facilities lease loss (benefit), net, for the year ended October 30, 2010 was due to$0.5 million of restructuring costs, primarily severance payments related to certain realignment within our globalservices segment and $0.5 million related to estimated facility lease losses, net of expected sublease incomerecorded during the year ended October 30, 2010.
Restructuring costs and facilities lease loss (benefit), net, for the year ended October 31, 2009 was primarilydue to $2.7 million in restructuring costs primarily related to severance payments in connection with the decisionto no longer offer our suite of Files products, partially offset by a benefit of $0.3 million related to estimatedfacilities lease losses, net of expected sublease income, recorded during the year ended October 31, 2009. Thisbenefit represented a change in estimate. We revised certain estimates and assumptions, including those relatedto estimated sublease rates, estimated time to sublease the facilities, expected future operating costs, andexpected future use of the facilities.
Restructuring costs and facilities lease loss (benefit), net, for the year ended October 25, 2008 was primarilydue to the restructuring of our Files business in the fourth fiscal quarter of 2008 to better align the cost structurewith revenue performance, which resulted in $3.3 million in restructuring costs. This was partially offset by abenefit of $0.6 million related to estimated facilities lease losses, net of expected sublease income. This benefitrepresented a change in estimate associated with the reoccupation of expected sublease space by us.
44

In-process research and development. We did not record any in-process research and development(“IPR&D”) charge for the years ended October 30, 2010 and October 25, 2008. IPR&D for the year endedOctober 31, 2009 and October 25, 2008 is summarized as follows (in thousands, except percentages):
October 31,2009
% of NetRevenues
October 25,2008
% of NetRevenues
Increase/(Decrease)
%Change
Fiscal year ended . . . . . . . . . . . . . . . . . . . . . . . $26,900 1.4% $— — % $26,900 100.0%
On December 18, 2008, we completed our acquisition of Foundry. In connection with this acquisition, werecorded a $26.9 million IPR&D charge (see Note 3, “Acquisitions,” of the Notes to Consolidated FinancialStatements in Part II, Item 8 of this Form 10-K).
The IPR&D was written off because the acquired technologies had not reached technological feasibility andhad no alternative uses. Technological feasibility is defined as being equivalent to completion of a beta-phaseworking prototype in which there is no remaining risk relating to the development. At the time of the acquisitionin December 2008, Foundry was developing new products in multiple product areas that qualify as IPR&D.These efforts included FastIron SuperX Family, FastIron CX, NetIron CER, TurboIron and various otherprojects. Development efforts for these projects have been completed.
Goodwill and acquisition-related intangible assets impairment. We did not record any goodwill andacquisition-related intangible assets impairment for the years ended October 30, 2010 and October 25, 2008.Goodwill and acquisition-related intangible assets impairment for the year ended October 31, 2009 issummarized as follows (in thousands, except percentages):
October 31,2009
% of NetRevenues
October 25,2008
% of NetRevenues
Increase/(Decrease)
%Change
Fiscal year ended . . . . . . . . . . . . . . . . . . . . . . . $53,306 2.7% $— — % $53,306 100.0%
During the second quarter of fiscal year 2009, we made a decision to no longer offer our suite of Filesproducts. After the acquisition of Foundry, Files was combined with IP Layer 4-7/ADP to create the IP Layer4-7/ADP operating segment. The integration of Files into the IP Layer 4-7/ADP operating segment was at apreliminary stage when the decision was made to cease development of the Files business. Accordingly, weassessed the potential impairment of the goodwill and long-lived assets relating to the Files business on astandalone basis.
As a result of the goodwill impairment analysis, we determined that all of the goodwill and acquisition-related intangible assets associated with the Files business were impaired. During the three months ended May 2,2009, we recorded a $53.3 million impairment charge, which is comprised of a non-cash goodwill impairmentcharge of $45.8 million and a non-cash acquisition-related intangible assets impairment charge of $7.5 million.
Consistent with prior years, we performed our annual goodwill impairment test using measurement data asof the first day of the second fiscal quarter of 2010. The estimated fair value of IP Layer 2-3 exceeded itscarrying value by approximately $58 million and the estimated fair value of IP Layer 4-7/ADP also exceeded itscarrying value by approximately $58 million. The respective fair values of our remaining reporting unitsexceeded carrying value by a much larger amount. Based on the goodwill impairment test results, our reportingunits passed step one of the impairment test and no further testing is required. The sensitivity of these test resultsis discussed under the “Critical Accounting Estimates” section below.
45

Interest and other income (loss), net. Interest and other income (loss), net, are summarized as follows (inthousands, except percentages):
October 30,2010
% of NetRevenues
October 31,2009
% of NetRevenues
Increase/(Decrease)
%Change
Fiscal year ended . . . . . . . . . . . . . . . . . . . . . . . $(6,452) (0.3)% $ (2,382) (0.1)% $ (4,070) (170.9)%
October 31,2009
% of NetRevenues
October 25,2008
% of NetRevenues
Increase/(Decrease)
%Change
Fiscal year ended . . . . . . . . . . . . . . . . . . . . . . . $(2,382) (0.1)% $26,867 1.8% $(29,249) (108.9)%
For the year ended October 30, 2010 compared with the corresponding periods in fiscal year 2009, thedecrease in interest and other income (loss), net, was primarily due to lower interest income in fiscal year 2010resulting from a decrease in investment balances, as well as foreign exchange losses recognized in fiscal year2010.
For the year ended October 31, 2009 compared with the corresponding periods in fiscal year 2008, thedecrease in interest and other income (loss), net, was primarily related to a decrease in investment balances dueto the Foundry acquisition, as well as a $4.4 million increase in acquisition-related financing charges.
Interest expense. Interest expense primarily represents the interest cost associated with our term loan, seniorsecured notes and convertible subordinated debt (see Note 9, “Borrowings,” of the Notes to ConsolidatedFinancial Statements). Interest expense is summarized as follows (in thousands, except percentages):
October 30,2010
% of NetRevenues
October 31,2009
% of NetRevenues
Increase/(Decrease)
%Change
Fiscal year ended . . . . . . . . . . . . . . . . . . . . . . . $(85,858) (4.1)% $(99,294) (5.1)% $(13,436) (13.5)%
October 31,2009
% of NetRevenues
October 25,2008
% of NetRevenues
Increase/(Decrease)
%Change
Fiscal year ended . . . . . . . . . . . . . . . . . . . . . . . $(99,294) (5.1)% $(17,249) (1.2)% $ 82,045 475.7%
Interest expense decreased for the year ended October 30, 2010 compared with fiscal year 2009 primarily asa result of the Company electing to make accelerated payments towards the principal of the term loan since itwas obtained in the fourth fiscal quarter of 2008 and the retirement of convertible subordinated debt onFebruary 16, 2010.
Interest expense increased for the year ended October 31, 2009 compared with fiscal year 2008 primarily asa result of $92.3 million in interest expense incurred on the term loan and the revolving credit facility which wereobtained to finance the Foundry acquisition, partially offset by capitalization of interest cost in connection withthe development of our campus during the year ended October 31, 2009.
We obtained the term loan during the fourth fiscal quarter of 2008. In January 2010, we issued $600 millionof long-term fixed rate notes and used the proceeds to pay down a substantial portion of the outstanding termloan, and retire the convertible subordinated debt. As of October 30, 2010 and October 31, 2009, the carryingvalue of the outstanding balance of our term loan was $325.9 million and $898.9 million, respectively. TheCompany fully paid off the principal of the convertible subordinated debt assumed from the McDATAacquisition for a total amount of $172.5 million on February 16, 2010.
46

Gain (loss) on sale of investments and property, net. Gain (loss) on sale of investments and property, net, issummarized as follows (in thousands, except percentages):
October 30,2010
% of NetRevenues
October 31,2009
% of NetRevenues
Increase/(Decrease)
%Change
Fiscal year ended . . . . . . . . . . . . . . . . . . . . . . . $(8,551) (0.4)% $ (602) (0.0)% $ 7,949 1,320.4%
October 31,2009
% of NetRevenues
October 25,2008
% of NetRevenues
Increase/(Decrease)
%Change
Fiscal year ended . . . . . . . . . . . . . . . . . . . . . . . $ (602) (0.0)% $(6,874) (0.5)% $(6,272) (91.2)%
For the year ended October 30, 2010 compared with fiscal year 2009, the increase in loss on sale ofinvestments and property, net, was primarily related to the $8.7 million loss on the sale of owned property in SanJose during the first quarter of fiscal year 2010 to an unrelated third party (see Note 13, “Sale-LeasebackTransaction” of the Notes to Consolidated Financial Statements).
Loss on sale of investments, net, decreased for the year ended October 31, 2009 compared with fiscal year2008. The $0.6 million in loss on sale of investments for the year ended October 31, 2009 was due to a loss of$0.6 million on the disposition of portfolio investments at amounts below the carrying value. We had a $6.9million loss on sales of investment for the year ended October 25, 2008 due to a loss of $6.0 million on sale ofour equity investments in a publicly traded company and a loss of $0.9 million on the disposition of portfolioinvestments at amounts below carrying value.
Loss on impairment of portfolio investments. We did not record any loss on impairment of portfolioinvestments for the years ended October 30, 2010 and October 31, 2009. Loss on impairment of portfolioinvestments for fiscal year ended October 25, 2008 is summarized as follows (in thousands, except percentages):
October 31,2009
% of NetRevenues
October 25,2008
% of NetRevenues
Increase/(Decrease)
%Change
Fiscal year ended . . . . . . . . . . . . . . . . . . . . . . . $— — % $(8,751) (0.6)% $(8,751) 100.0%
As of October 25, 2008, we determined that the declines in the fair value for certain of our portfolioinvestments primarily associated with non-marketable investments were other than temporary due to thesignificant deterioration of the financial condition of the investees. As a result, for the year ended October 25,2008, we recorded impairment charges of $8.8 million.
Income tax provision (benefit). Income tax provision (benefit) and the effective tax rates are summarized asfollows (in thousands, except effective tax rates):
Fiscal Year Ended
October 30,2010
October 31,2009
October 25,2008
Income tax provision (benefit) . . . . . . . . . . . . . . . . . . . . . . . . . $(8,672) $7,359 $(144,651)Effective tax rate . . . . . . . . . . . . . . . . . . . . . . . . . . . . . . . . . . . . (7.9)% (10.0)% (636.1)%
We recorded a tax benefit for the year ended October 30, 2010 compared to a tax provision in fiscal year2009 primarily due to the following on a net basis (additionally, see Note 15, “Income Taxes,” of the Notes toConsolidated Financial Statements in Part II, Item 8 of this Form 10-K):
• A benefit from the release of certain reserves relates to the settlement of the Company’s fiscal year2003 IRS audit;
• A benefit from the release of pre fiscal year 2005 California R&D credit reserves as a result of theNotice of Proposed Adjusted Carryover Amount issued by the FTB;
47

• A benefit from the release of certain reserves relating to foreign subsidiaries;
• A benefit from the confirmation by the U.S. Court of Appeals for the Ninth Circuit of the tax court’sdecision in Xilinx, Inc. v. Commissioner related to certain stock option treatment;
• A benefit from the recent IRS decision to concede the intercompany gross receipts issue for R&Dcredit calculations;
• A benefit from the settlement of the Foundry IRS audit;
• A nonrecurring loss on the sale of property; and
• A benefit from a law change allowing 5-year carryback on net operating losses as a result of theAmerican Recovery and Reinvestment Act of 2009 effective on November 20, 2009; partially offset by
• The lapse of the Federal R&D credit periods after December 31, 2009.
Based on the fiscal year 2011 financial forecast, we currently expect the effective tax rate to be higher thanfiscal year 2010. As estimates and judgments are used to project such domestic and international earnings, theimpact to our tax provision could vary if the current planning or assumptions change. Given that the tax rate isdriven by several different factors, it is not possible to estimate our future tax rate with a high degree of certainty.
Our effective tax rate increased for the year ended October 31, 2009 compared with fiscal year 2008primarily due to a one-time valuation allowance release in the second fiscal quarter of 2008.
To the extent that international revenues and earnings differ from those historically achieved, a factorlargely influenced by the buying behavior of our customers and OEM partners or by unfavorable prospective andretrospective effects of changing tax laws and regulations, our income tax provision could change.
Estimates and judgments are required in the determination of the recoverability of certain deferred taxassets, which arise from variable stock option expense, net operating losses, tax carry forwards and temporarydifferences between the tax and financial statement recognition of revenues and expenses.
We apply a recognition threshold and measurement attribute for the financial statement recognition andmeasurement of an income tax position taken or expected to be taken on a tax return. Recognition of a taxposition is determined when it is more likely than not that a tax position will be sustained upon examination,including resolution of any related appeals or litigation processes. A tax position that meets the more-likely-than-not recognition threshold is measured at the largest amount of benefit that is greater than 50% likely ofbeing realized upon ultimate settlement with a taxing authority.
The calculation of tax liabilities involves significant judgment in estimating the impact of uncertainties inthe application of complex tax laws. The threshold and measurement attribute we apply for the accounting foruncertainty in income taxes recognized in the financial statements will continue to require significant judgmentby management. Resolution of these uncertainties in a manner inconsistent with our expectations could have amaterial impact on our results of operations.
The IRS and other tax authorities regularly examine our income tax returns. We are currently undernegotiations with the Appeals division of the IRS for the audit of fiscal years 2004 through 2006, which weexpect to resolve during the next twelve months. In addition, we are in negotiations with the foreign taxauthorities to receive collateral relief on transfer pricing settlements with the IRS. We believe that our reservesfor unrecognized tax benefits are adequate for open tax years. The timing of the resolution of income taxexaminations, as well as the amounts and timing of related settlements, is highly uncertain. The Companybelieves that before the end of fiscal year 2011, it is reasonably possible that either certain audits will conclude orthe statute of limitations relating to certain income tax examination periods will expire, or both. Given the
48

uncertainty as to settlement terms, the timing of payments and the impact of such settlements on other uncertaintax positions, the range of estimated potential decreases in underlying uncertain tax positions is between $0and $15 million. For additional discussion, see Note 15, “Income Taxes,” of the Notes to Consolidated FinancialStatements in Part II, Item 8 of this Form 10-K.
Liquidity and Capital ResourcesOctober 30,
2010October 31,
2009Increase/(Decrease)
(in thousands) (in thousands)
Cash and cash equivalents . . . . . . . . . . . . . . . . . . . . . . . . . . . . . . . . . . . . . $333,984 $334,193 $ (209)Short-term investments . . . . . . . . . . . . . . . . . . . . . . . . . . . . . . . . . . . . . . . 1,998 4,678 (2,680)Restricted cash . . . . . . . . . . . . . . . . . . . . . . . . . . . . . . . . . . . . . . . . . . . . . . — 12,502 (12,502)
Total . . . . . . . . . . . . . . . . . . . . . . . . . . . . . . . . . . . . . . . . . . . . . . . . . . $335,982 $351,373 $(15,391)
Percentage of total assets . . . . . . . . . . . . . . . . . . . . . . . . . . . . . . . . . . . . . . 9% 10%
We use cash generated by operations as our primary source of liquidity. We expect that cash provided byoperating activities may fluctuate in future periods as a result of a number of factors, including fluctuations in ouroperating results, the rate at which products are shipped during the quarter, accounts receivable collections,inventory and supply chain management, and the timing and amount of tax and other payments. For additionaldiscussion, see “Part I—Item 1A. Risk Factors.”
Based on past performance and current expectations, we believe that internally generated cash flows aregenerally sufficient to support business operations, capital expenditures, contractual obligations, and otherliquidity requirements associated with our operations for at least the next twelve months. Also, we have up to$125 million available under our revolving credit facility, and we can factor our trade receivables up to themaximum amount available at any time of our $50 million factoring facility to provide additional liquidity. Wepaid off our convertible subordinated debt due on February 15, 2010 through our existing cash on hand, togetherwith proceeds from the Senior Secured Notes issued on January 20, 2010. There are no other transactions,arrangements, or other relationships with unconsolidated entities or other persons that are reasonably likely tomaterially affect liquidity and the availability of and our requirements for capital resources.
Financial Condition
Cash and cash equivalents, restricted cash and short-term investments as of October 30, 2010 decreased by$15.4 million over the balance as of October 31, 2009 primarily due to the accelerated payments towards theprincipal of the term loan and payments made to retire our convertible subordinated debt and revolving creditfacility, as well as increased purchases of property and equipment, and shares we repurchased during the fiscalyear ended October 30, 2010, partially offset by proceeds from our senior secured notes and increased cashprovided by operating activities. For the fiscal ended October 30, 2010, we generated $298.5 million in cash fromoperating activities, which was higher than our net income for the same period primarily as a result ofadjustments to net income for non-cash items related to depreciation and amortization, amortization of debtissuance costs and stock-based compensation expense, partially offset by a decrease in accounts payable, andaccrued employee compensation and an increase in accounts receivable.
Accounts receivable days sales outstanding, which is a measure of the average number of days that acompany takes to collect revenue after a sale has been made, for the year ended October 30, 2010 was 57 days,flat from 57 days for the year ended October 31, 2009.
Net cash used in investing activities for the year ended October 30, 2010 totaled $168.4 million and wasprimarily the result of $201.6 million in purchase of property and equipment, offset by $30.2 million in proceedsresulting from the sale of property.
49

Net cash used in financing activities for the year ended October 30, 2010 totaled $127.7 million and wasprimarily the result of payment of principal related to the term loan of $583.0 million, payment to retire theconvertible subordinated debt and revolving credit facility of $172.5 million and $14.1 million, respectively, andcommon stock repurchases of $25.0 million, partially offset by net proceeds from the issuance of Senior SecuredNotes of $588.0 million and proceeds from the issuance of common stock from ESPP purchases and stock optionexercises of $81.6 million.
Net proceeds from the issuance of common stock in connection with employee participation in our equitycompensation plans have historically been a significant component of our liquidity. The extent to which ouremployees participate in these programs generally increases or decreases based upon changes in the market priceof our common stock. As a result, our cash flow resulting from the issuance of common stock in connection withemployee participation in equity compensation plans will vary.
Fiscal Year 2010 Compared to Fiscal Year 2009
Operating Activities. Net cash provided by operating activities increased by $183.0 million for the yearended October 30, 2010 compared with fiscal year 2009. The increase was primarily due to an increase in netincome, and the $160.0 million payment of the liability associated with the settlement of the class action lawsuitin fiscal year 2009. This increase was partially offset by a decrease in accrued employee compensation, andaccounts payable during fiscal year 2010.
Investing Activities. Net cash used in investing activities decreased by $30.7 million for the year endedOctober 30, 2010 compared with fiscal year 2009. The decrease was primarily due to cash paid in connectionwith the Foundry acquisition during the fiscal year ended October 31, 2009 and increased proceeds from the saleof property during the fiscal year ended October 30, 2010. This decrease was partially offset by a decrease inrestricted cash which was released to finance a portion of the Foundry acquisition, as well as increased purchaseof property and equipment and decreased proceeds from maturities and sale of short-term and long-terminvestments.
Financing Activities. Net cash used in financing activities increased by $90.1 million for the year endedOctober 30, 2010 compared with fiscal year 2009. The increase was primarily due to increased payment ofprincipal related to the term loan, payment to retire the convertible subordinated debt and revolving creditfacility, decreased proceeds from the issuance of common stock, and increased common stock repurchases madeduring the year ended October 30, 2010, partially offset by increased proceeds from the issuance of SeniorSecured Notes and decreased payment of senior underwriting fees related to the term loan.
Fiscal Year 2009 Compared to Fiscal Year 2008
Operating Activities. Net cash provided by operating activities decreased by $323.0 million for the yearended October 31, 2009 compared with fiscal year 2008. The decrease was primarily due to net loss, the $160.0million payment of the liability associated with the settlement of the class action lawsuit, decreased accountsreceivable collections and increased payments with respect to accounts payable, accrued employee compensationand other accrued liabilities during the year ended October 31, 2009.
Investing Activities. Net cash used in investing activities decreased by $1,040.4 million for the year endedOctober 31, 2009 compared with fiscal year 2008. The decrease was primarily due to a decrease in restricted cashwhich was released to finance a portion of the Foundry acquisition, as well as decreased purchases ofinvestments and marketable equity securities as we continued to prioritize our use of cash for debt repayment.The decrease was partially offset by cash paid in connection with the Foundry acquisition and decreasedproceeds from the maturities and sales of investments and marketable equity securities.
Financing Activities. Net cash provided by financing activities decreased by $982.3 million for the yearended October 31, 2009 compared with fiscal year 2008. The decrease was primarily due to the proceeds
50

received in fiscal year 2008 from the term loan and the payment of principal and senior underwriting fees infiscal year 2009 related to the term loan, partially offset by decreased common stock repurchases and increasedproceeds from the issuance of common stock from ESPP and stock option exercises, and proceeds from therevolving credit facility.
Liquidity
Manufacturing and Purchase Commitments.We have manufacturing arrangements with contractmanufacturers under which we provide twelve-month product forecasts and place purchase orders in advance ofthe scheduled delivery of products to our customers. Our purchase commitments reserve reflects our estimate ofpurchase commitments we do not expect to consume in normal operations within the next twelve months, inaccordance with our policy (see Note 10, “Commitments and Contingencies,” of the Notes to ConsolidatedFinancial Statements in Part II, Item 8 of this Form 10-K).
Company Campus Contractual Obligations. On May 23, 2008, we purchased property located in San Jose,California, which consisted of three unimproved building parcels that were entitled for approximately 562,000square feet of space in three buildings. Construction of the Company campus was completed in third fiscalquarter of 2010 and serves as the Company’s headquarters. For additional discussion, see Note 10,“Commitments and Contingencies,” of the Notes to Consolidated Financial Statements in Part II, Item 8 of thisForm 10-K.
Income Taxes. We accrue U.S. income taxes on the earnings of our foreign subsidiaries unless the earningsare considered indefinitely reinvested outside of the United States. We intend to reinvest current and accumulatedearnings of our foreign subsidiaries for expansion of our business operations outside the United States for anindefinite period of time.
The IRS and other tax authorities regularly examine our income tax returns (see Note 15, “Income Taxes,”of the Notes to Consolidated Financial Statements in Part II, Item 8 of this Form 10-K). We believe we haveadequate reserves for all open tax years.
Senior Secured Credit Facility. A portion of our outstanding debt is related to the financing of the Foundryacquisition, the costs and expenses related to the merger, and the ongoing working capital and other generalcorporate purposes of the combined organization after consummation of the merger (see Note 9, “Borrowings,”of the Notes to Consolidated Financial Statements in Part II, Item 8 of this Form 10-K). We have the followingresources available to obtain short-term or long-term financing, if we need additional liquidity, as of October 30,2010 (in thousands):
Original AmountAvailable
October 30, 2010
Used Available
Revolving credit facility . . . . . . . . . . . . . . . . . . . . . . . . . . . . . . . $125,000 $— $125,000
Total . . . . . . . . . . . . . . . . . . . . . . . . . . . . . . . . . . . . . . . . . . $125,000 $— $125,000
Trade Receivables Factoring Facility. We have an agreement with a financial institution to sell certain ofour trade receivables from customers with limited, non-credit related, recourse provisions. The sale ofreceivables eliminates our credit exposure in relation to these receivables. Total trade receivables sold under ourfactoring facility are summarized as follows (in thousands):
Fiscal Year Ended
October 30,2010
October 31,2009
Trade receivables sold under factoring agreement . . . . . . . . . . . . . $61,408 $—
51
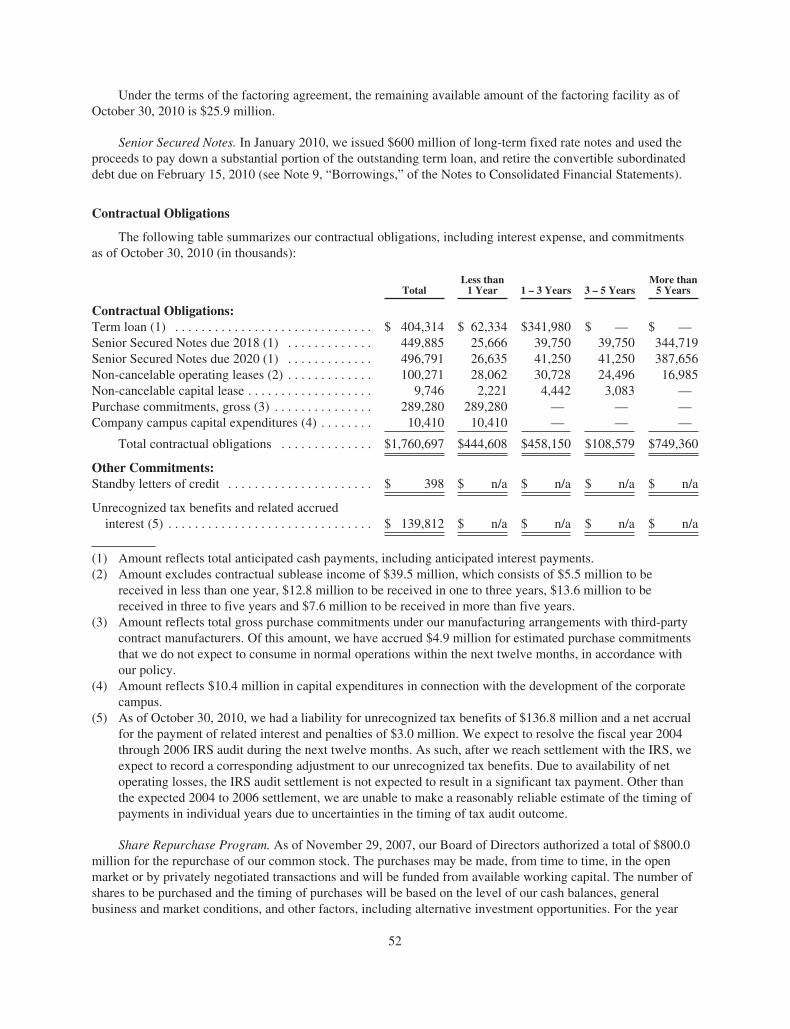
Under the terms of the factoring agreement, the remaining available amount of the factoring facility as ofOctober 30, 2010 is $25.9 million.
Senior Secured Notes. In January 2010, we issued $600 million of long-term fixed rate notes and used theproceeds to pay down a substantial portion of the outstanding term loan, and retire the convertible subordinateddebt due on February 15, 2010 (see Note 9, “Borrowings,” of the Notes to Consolidated Financial Statements).
Contractual Obligations
The following table summarizes our contractual obligations, including interest expense, and commitmentsas of October 30, 2010 (in thousands):
TotalLess than1 Year 1 – 3 Years 3 – 5 Years
More than5 Years
Contractual Obligations:Term loan (1) . . . . . . . . . . . . . . . . . . . . . . . . . . . . . . $ 404,314 $ 62,334 $341,980 $ — $ —Senior Secured Notes due 2018 (1) . . . . . . . . . . . . . 449,885 25,666 39,750 39,750 344,719Senior Secured Notes due 2020 (1) . . . . . . . . . . . . . 496,791 26,635 41,250 41,250 387,656Non-cancelable operating leases (2) . . . . . . . . . . . . . 100,271 28,062 30,728 24,496 16,985Non-cancelable capital lease . . . . . . . . . . . . . . . . . . . 9,746 2,221 4,442 3,083 —Purchase commitments, gross (3) . . . . . . . . . . . . . . . 289,280 289,280 — — —Company campus capital expenditures (4) . . . . . . . . 10,410 10,410 — — —
Total contractual obligations . . . . . . . . . . . . . . $1,760,697 $444,608 $458,150 $108,579 $749,360
Other Commitments:Standby letters of credit . . . . . . . . . . . . . . . . . . . . . . $ 398 $ n/a $ n/a $ n/a $ n/a
Unrecognized tax benefits and related accruedinterest (5) . . . . . . . . . . . . . . . . . . . . . . . . . . . . . . . $ 139,812 $ n/a $ n/a $ n/a $ n/a
(1) Amount reflects total anticipated cash payments, including anticipated interest payments.(2) Amount excludes contractual sublease income of $39.5 million, which consists of $5.5 million to be
received in less than one year, $12.8 million to be received in one to three years, $13.6 million to bereceived in three to five years and $7.6 million to be received in more than five years.
(3) Amount reflects total gross purchase commitments under our manufacturing arrangements with third-partycontract manufacturers. Of this amount, we have accrued $4.9 million for estimated purchase commitmentsthat we do not expect to consume in normal operations within the next twelve months, in accordance withour policy.
(4) Amount reflects $10.4 million in capital expenditures in connection with the development of the corporatecampus.
(5) As of October 30, 2010, we had a liability for unrecognized tax benefits of $136.8 million and a net accrualfor the payment of related interest and penalties of $3.0 million. We expect to resolve the fiscal year 2004through 2006 IRS audit during the next twelve months. As such, after we reach settlement with the IRS, weexpect to record a corresponding adjustment to our unrecognized tax benefits. Due to availability of netoperating losses, the IRS audit settlement is not expected to result in a significant tax payment. Other thanthe expected 2004 to 2006 settlement, we are unable to make a reasonably reliable estimate of the timing ofpayments in individual years due to uncertainties in the timing of tax audit outcome.
Share Repurchase Program. As of November 29, 2007, our Board of Directors authorized a total of $800.0million for the repurchase of our common stock. The purchases may be made, from time to time, in the openmarket or by privately negotiated transactions and will be funded from available working capital. The number ofshares to be purchased and the timing of purchases will be based on the level of our cash balances, generalbusiness and market conditions, and other factors, including alternative investment opportunities. For the year
52

ended October 30, 2010, we repurchased 4.5 million shares for an aggregate purchase price of $25.0 million.Approximately $389.1 million remains authorized for future repurchases under this program as of October 30,2010. We are subject to certain covenants relating to our borrowings that restrict the amount of our Company’sshares that we can repurchase. As of October 30, 2010, we can repurchase up to an additional $75 million of ourCompany’s shares under the terms of our senior secured credit facility, provided our consolidated senior securedleverage ratio as defined in the credit agreement is under 2.00. We made no repurchases for the year endedOctober 31, 2009 due to prioritizing our use of cash for debt repayment following the close of the Foundryacquisition.
Off-Balance Sheet Arrangements
As part of our ongoing business, we do not participate in transactions that generate material relationshipswith unconsolidated entities or financial partnerships, such as entities often referred to as structured finance orspecial purpose entities, which would have been established for the purpose of facilitating off-balance sheetarrangements or for other contractually narrow or limited purposes. As of October 30, 2010, we did not have anysignificant off-balance sheet arrangements, as defined in Item 303(a)(4)(ii) of SEC Regulation S-K.
Critical Accounting Estimates
Our discussion and analysis of financial condition and results of operations are based upon our consolidatedfinancial statements, which have been prepared in accordance with U.S. generally accepted accountingprinciples. The preparation of these Consolidated Financial Statements requires us to make estimates andjudgments that affect the reported amounts of assets, liabilities, revenues and expenses, and related disclosure ofcontingent assets and liabilities. We evaluate, on an ongoing basis, our estimates and judgments, including, butnot limited to, those related to sales allowances and programs, bad debts, stock-based compensation, allocation ofpurchase price of acquisitions, excess inventory and purchase commitments, restructuring costs, facilities leaselosses, impairment of goodwill and intangible assets, litigation, income taxes and investments. We base ourestimates on historical experience and assumptions that we believe to be reasonable under the circumstances, theresults of which form the basis for making judgments about the carrying values of assets and liabilities that arenot readily apparent from other sources. Actual results may differ from these estimates.
The methods, estimates and judgments we use in applying our most critical accounting policies have asignificant impact on the results that we report in our Consolidated Financial Statements. We believe thefollowing critical accounting policies, among others, require significant estimates and judgments used in thepreparation of our consolidated financial statements.
Revenue recognition. Our multiple-element product offerings include networking hardware with embeddedsoftware products and support, which are considered separate units of accounting. For certain of our products,software and non-software components function together to deliver the tangible products’ essential functionality.We allocate revenue to each element in a multiple-element arrangement based upon their relative selling price.When applying the relative selling price method, we determine the selling price for each deliverable usingvendor-specific objective evidence (“VSOE”) of selling price, if it exists, or third-party evidence (“TPE”) ofselling price. If neither VSOE nor TPE of selling price exist for a deliverable, we use our best estimate of sellingprice for that deliverable. Revenue allocated to each element is then recognized when the basic revenuerecognition criteria are met for each element.
Consistent with our methodology under previous accounting guidance, we determine VSOE based on ournormal pricing and discounting practices for the specific product or service when sold separately. In determiningVSOE, we require that a substantial majority of the selling prices for a product or service fall within a reasonablynarrow pricing range, generally evidenced by approximately 80% of such historical stand-alone transactionsfalling within ±15% of the median rates. For post-contract customer support, however, we consider statedrenewal rates in determining VSOE.
53
In most instances, we are not able to establish VSOE for all deliverables in an arrangement with multipleelements. This may be due to us infrequently selling each element separately, not pricing products within anarrow range, or only having a limited sales history. When VSOE cannot be established, we attempt to establishselling price for each element based on TPE. TPE is determined based on competitor prices for similardeliverables when sold separately. Generally, our go-to-market strategy differs from that of our peers and ourofferings contain a significant level of customization and differentiation such that the comparable pricing ofproducts with similar functionality cannot be obtained. Furthermore, we are unable to reliably determine whatsimilar competitor products’ selling prices are on a stand-alone basis. Therefore, we are typically not able todetermine TPE.
When we are unable to establish selling price using VSOE or TPE, we use estimated selling price (“ESP”)in our allocation of the arrangement consideration. The objective of ESP is to determine the price at which wewould transact a sale if the product or service were sold on a stand-alone basis. ESP is generally used forofferings that are not typically sold on a stand-alone basis or for new or highly customized offerings.
We determine ESP for a product or service by considering multiple factors including, but not limited to,geographies, market conditions, competitive landscape, internal costs, gross margin objectives and pricingpractices. The determination of ESP is made through consultation with and formal approval by our management,taking into consideration the go-to-market strategy. If circumstances related to our estimates for revenuerecognition change, our allocation of revenue to each element in a multiple-element arrangement may alsochange.
Stock-based compensation. We grant stock options for shares in the Company’s common stock, restrictedstock units and other types of equity compensation awards to our employees and directors under various equitycompensation plans. For additional discussion, see Note 14, “Stock-Based Compensation,” of the Notes toConsolidated Financial Statements in Part II, Item 8 of this Form 10-K.
The compensation expense for stock-based awards is adjusted for an estimated impact of forfeitures and isrecognized over the expected term of the award under a graded vesting method. In addition, we record stock-based compensation expense in connection with shares issued under our employee stock purchase plan using thegraded vesting method over the twenty-four month offering period.
We use the Black-Scholes option pricing model to determine the fair value of stock options granted whenthe measurement date is certain. We also use the Black-Scholes option pricing model to determine the fair valueof the option component of employee stock purchase plan shares. The determination of the fair value of stock-based awards using the option pricing model is affected by our stock price as well as assumptions regarding anumber of complex and subjective variables. These variables include our expected stock price volatility over theexpected term of the awards, projected and actual employee stock option exercise behaviors, risk-free interestrates, estimated forfeitures and expected dividends.
We estimate the expected term of stock options granted by calculating the average term from our historicalstock option exercise experience. We do not anticipate paying any cash dividends in the foreseeable future, andtherefore we use an expected dividend yield of zero in the option pricing model. We are required to estimateforfeitures at the time of grant and revise those estimates in subsequent periods if actual forfeitures differ fromthose estimates. We use historical data to estimate pre-vesting option forfeitures and record stock-basedcompensation expense only for those awards that are expected to vest. We use implied volatilities from tradedoptions of the Company’s common stock and historical volatilities of the Company’s common stock to estimatevolatility over the expected term of the awards.
The assumptions used in calculating the fair value of stock-based awards represent management’s bestestimates, but these estimates involve inherent uncertainties and the application of management judgment. As aresult, if factors change and we use different assumptions, our stock-based compensation expense could bematerially different in the future.
54

Acquisitions—Purchase Price Allocation. We allocate the purchase price of an acquired business to theassets acquired and liabilities assumed, including identifiable intangible assets, based on their respective fairvalues at the acquisition date. The excess of the purchase price over the fair value of the underlying acquired nettangible and intangible assets, if any, is recorded as goodwill. Management estimates the fair value of assets andliabilities based upon quoted market prices, the carrying value of the acquired assets and widely acceptedvaluation techniques. We adjust the preliminary purchase price allocation, as necessary, typically up to one yearafter the acquisition closing date as we obtain more information regarding asset valuations and liabilitiesassumed. For additional discussion, see Note 3, “Acquisitions,” of the Notes to Consolidated FinancialStatements in Part II, Item 8 of this Form 10-K.
Inventory valuation and purchase commitment liabilities. We write down inventory and record purchasecommitment liabilities for estimated excess and obsolete inventory equal to the difference between the cost ofinventory and the estimated fair value based upon forecast of future product demand, product transition cyclesand market conditions. Any significant unanticipated changes in demand or technological development couldhave a significant impact on the value of our inventory and purchase commitments, and our reported results. Ifactual market conditions are less favorable than those projected, additional inventory write-downs, purchasecommitment liabilities and charges against earnings may be required. For additional discussion, see Note 10,“Commitments and Contingencies,” of the Notes to Consolidated Financial Statements in Part II, Item 8 of thisForm 10-K.
Restructuring costs and facilities lease losses. We monitor and regularly evaluate our organizationalstructure and associated operating expenses. Depending on events and circumstances, we may decide to takeadditional actions to reduce future operating costs as our business requirements evolve. In determiningrestructuring charges, we analyze our future operating requirements, including the required headcount bybusiness functions and facility space requirements. Our restructuring costs and any resulting accruals involvesignificant estimates made by management using the best information available at the time the estimates aremade. In recording severance accruals, we record a liability when all of the following conditions have been met:employees’ rights to receive compensation for future absences is attributable to employees’ services alreadyrendered; the obligation relates to rights that vest or accumulate; payment of the compensation is probable; andthe amount can be reasonably estimated. In recording facilities lease loss accruals, we make various assumptions,including the time period over which the facilities are expected to be vacant, expected sublease terms, expectedsublease rates, expected future operating costs, and expected future use of the facilities. Our estimates involve anumber of risks and uncertainties, some of which are beyond our control, including future real estate marketconditions and our ability to successfully enter into subleases or lease termination agreements with terms asfavorable as those assumed when arriving at our estimates. We regularly evaluate a number of factors todetermine the appropriateness and reasonableness of our restructuring and facilities lease loss accruals, includingthe various assumptions noted above. If actual results differ significantly from our estimates, we may be requiredto adjust our restructuring and facilities lease loss accruals in the future. For additional discussion, see Note 5,“Liabilities Associated with Facilities Lease Losses,” of the Notes to Consolidated Financial Statements in PartII, Item 8 of this Form 10-K.
Impairment of goodwill and intangible assets. Goodwill is generated as a result of business combinations.We conduct our goodwill impairment test annually, as of the first day of the second fiscal quarter, or wheneverevents or changes in facts and circumstances indicate that the fair value of the reporting unit may be less than itscarrying amount. Events which might indicate impairment include, but are not limited to, strategic decisionsmade in response to economic and competitive conditions, the impact of the economic environment on ourcustomer base, material negative changes in relationships with significant customers, and/or a significant declinein our stock price for a sustained period. For additional discussion, see Note 4, “Goodwill and Intangible Assets,”of the Notes to Consolidated Financial Statements in Part II, Item 8 of this Form 10-K.
We apply a two-step approach in testing goodwill for impairment for each reporting unit, which we havedetermined to be at the operating segment level. The reporting units are determined by the components of our
55
operating segments that constitute a business for which both (i) discrete financial information is available and(ii) segment management regularly reviews the operating results of that component. Data Storage, IP Layer 2-3,which includes Open System Interconnection Reference Model (“OSI”) Layer 2-3 products, IP Layer 4-7/ADP,which includes OSI Layer 4-7 products, and Global Services are our four reporting units.
The first step tests for potential impairment by comparing the fair value of reporting units with reportingunits’ net asset values. If the fair value of the reporting unit exceeds the carrying value of the reporting unit’s netassets, then goodwill is not impaired and no further testing is required. If the fair value of reporting unit is belowthe reporting unit’s carrying value, then the second step is required to measure the amount of potentialimpairment. The second step requires an assignment of the reporting unit’s fair value to the reporting unit’sassets and liabilities, using the initial acquisition accounting guidance in ASC 805 Business Combinations, todetermine the implied fair value of the reporting unit’s goodwill. The implied fair value of the reporting unit’sgoodwill is then compared with the carrying amount of the reporting unit’s goodwill to determine the goodwillimpairment loss to be recognized, if any. If the carrying value of a reporting unit’s goodwill exceeds its impliedfair value, we record an impairment loss equal to the difference.
To determine the reporting unit’s fair values, we use the income approach, the market approach, or acombination thereof. The income approach provides an estimate of fair value based on discounted expectedfuture cash flows. The market approach provides an estimate of the fair value of our four reporting units usingvarious price or market multiples applied to the reporting unit’s operating results and then applying anappropriate control premium. During our fiscal year 2010 annual goodwill impairment test under the first step,we used a combination of approaches to estimate reporting units’ fair values, but we relied primarily on theincome approach results, using management’s recent, post-recession cash flow projections for each reporting unitand risk-adjusted discount rates. We believe that the income approach is more representative of reporting units’fair value compared to market approach results due to conditions of current financial markets and other marketfactors.
Determining the fair value of a reporting unit or an intangible asset is judgmental in nature and involves theuse of significant estimates and assumptions. We based our fair value estimates on assumptions we believe to bereasonable, but that are unpredictable and inherently uncertain. Estimates and assumptions with respect to thedetermination of the fair value of our reporting units using the income approach include, among other inputs:
• Our operating forecasts;
• Revenue growth rates; and
• Risk-commensurate discount rates and costs of capital.
Our estimates of revenues and costs are based on historical data, various internal estimates and a variety ofexternal sources, and are developed as part of our regular long-range planning process. The control premiumused in market or combined approaches is determined by considering control premiums offered as part ofacquisitions that have occurred in a reporting unit’s comparable market segments.
Based on our step one analysis results, we believe that all our reporting units pass the step one test and nofurther testing is required. However, because some of the inherent assumptions and estimates used in determiningthe fair value of these reportable segments are outside the control of management, changes in these underlyingassumptions can adversely impact fair value. The sensitivity analysis below quantifies the impact of keyassumptions on our reporting units’ fair value estimates. The principal key assumptions impacting our estimateswere (i) discount rates and (ii) discounted expected future cash flows (“DCF”) terminal value multipliers. As thediscount rates, ultimately, reflect the risk of achieving reporting units’ revenue and cash flow projections, wedon’t believe that a separate sensitivity analysis for changes in revenue and cash flow projections is meaningfulor useful.
56
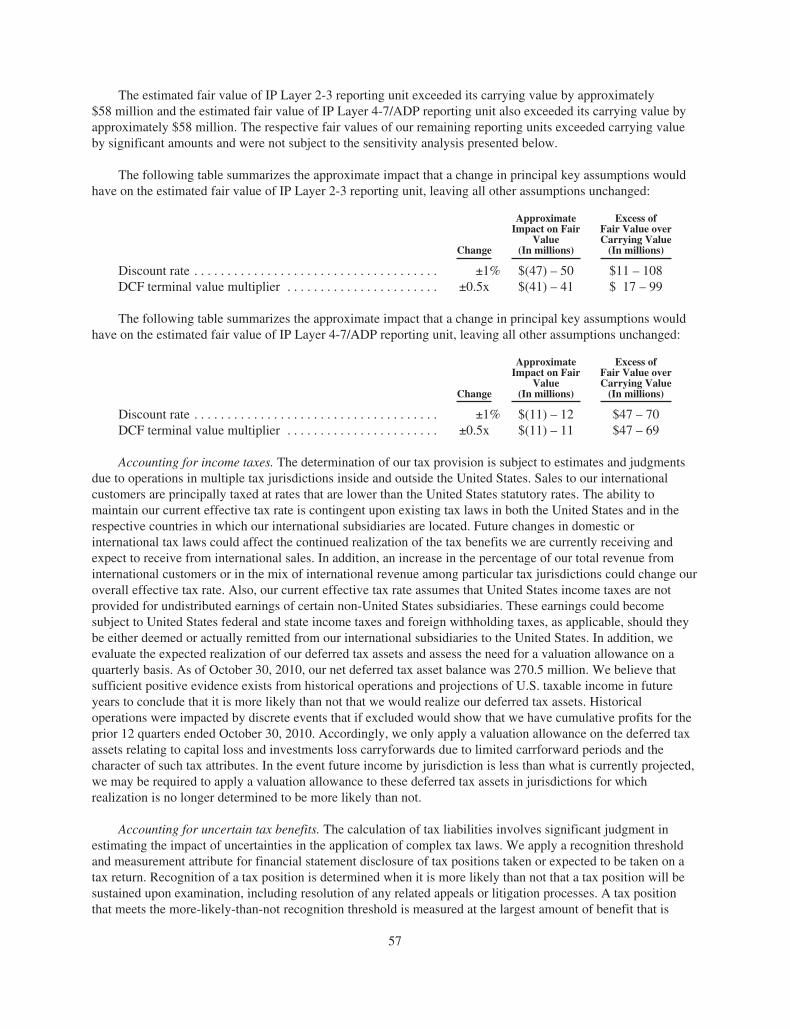
The estimated fair value of IP Layer 2-3 reporting unit exceeded its carrying value by approximately$58 million and the estimated fair value of IP Layer 4-7/ADP reporting unit also exceeded its carrying value byapproximately $58 million. The respective fair values of our remaining reporting units exceeded carrying valueby significant amounts and were not subject to the sensitivity analysis presented below.
The following table summarizes the approximate impact that a change in principal key assumptions wouldhave on the estimated fair value of IP Layer 2-3 reporting unit, leaving all other assumptions unchanged:
Change
ApproximateImpact on Fair
Value(In millions)
Excess ofFair Value overCarrying Value(In millions)
Discount rate . . . . . . . . . . . . . . . . . . . . . . . . . . . . . . . . . . . . . ±1% $(47) – 50 $11 – 108DCF terminal value multiplier . . . . . . . . . . . . . . . . . . . . . . . ±0.5x $(41) – 41 $ 17 – 99
The following table summarizes the approximate impact that a change in principal key assumptions wouldhave on the estimated fair value of IP Layer 4-7/ADP reporting unit, leaving all other assumptions unchanged:
Change
ApproximateImpact on Fair
Value(In millions)
Excess ofFair Value overCarrying Value(In millions)
Discount rate . . . . . . . . . . . . . . . . . . . . . . . . . . . . . . . . . . . . . ±1% $(11) – 12 $47 – 70DCF terminal value multiplier . . . . . . . . . . . . . . . . . . . . . . . ±0.5x $(11) – 11 $47 – 69
Accounting for income taxes. The determination of our tax provision is subject to estimates and judgmentsdue to operations in multiple tax jurisdictions inside and outside the United States. Sales to our internationalcustomers are principally taxed at rates that are lower than the United States statutory rates. The ability tomaintain our current effective tax rate is contingent upon existing tax laws in both the United States and in therespective countries in which our international subsidiaries are located. Future changes in domestic orinternational tax laws could affect the continued realization of the tax benefits we are currently receiving andexpect to receive from international sales. In addition, an increase in the percentage of our total revenue frominternational customers or in the mix of international revenue among particular tax jurisdictions could change ouroverall effective tax rate. Also, our current effective tax rate assumes that United States income taxes are notprovided for undistributed earnings of certain non-United States subsidiaries. These earnings could becomesubject to United States federal and state income taxes and foreign withholding taxes, as applicable, should theybe either deemed or actually remitted from our international subsidiaries to the United States. In addition, weevaluate the expected realization of our deferred tax assets and assess the need for a valuation allowance on aquarterly basis. As of October 30, 2010, our net deferred tax asset balance was 270.5 million. We believe thatsufficient positive evidence exists from historical operations and projections of U.S. taxable income in futureyears to conclude that it is more likely than not that we would realize our deferred tax assets. Historicaloperations were impacted by discrete events that if excluded would show that we have cumulative profits for theprior 12 quarters ended October 30, 2010. Accordingly, we only apply a valuation allowance on the deferred taxassets relating to capital loss and investments loss carryforwards due to limited carrforward periods and thecharacter of such tax attributes. In the event future income by jurisdiction is less than what is currently projected,we may be required to apply a valuation allowance to these deferred tax assets in jurisdictions for whichrealization is no longer determined to be more likely than not.
Accounting for uncertain tax benefits. The calculation of tax liabilities involves significant judgment inestimating the impact of uncertainties in the application of complex tax laws. We apply a recognition thresholdand measurement attribute for financial statement disclosure of tax positions taken or expected to be taken on atax return. Recognition of a tax position is determined when it is more likely than not that a tax position will besustained upon examination, including resolution of any related appeals or litigation processes. A tax positionthat meets the more-likely-than-not recognition threshold is measured at the largest amount of benefit that is
57

greater than 50% likely of being realized upon ultimate settlement with a taxing authority. The threshold andmeasurement attribute requires significant judgment by management. Resolution of these uncertainties in amanner inconsistent with our expectations could have a material impact on our results of operations.
Recent Accounting Pronouncements
For a description of recent accounting pronouncements, including the expected dates of adoption andestimated effects, if any, on our consolidated financial statements, see Note 2, “Summary of SignificantAccounting Policies,” of the Notes to Consolidated Financial Statements in Part II, Item 8 of this Form 10-K.
58

Item 7A. Quantitative and Qualitative Disclosures About Market Risk
In the normal course of business, we are exposed to market risks related to changes in interest rates, foreigncurrency exchange rates and equity prices that could impact our financial position and results of operations. Ourrisk management strategy with respect to these three market risks may include the use of derivative financialinstruments. We use derivative contracts only to manage existing underlying exposures of the Company.Accordingly, we do not use derivative contracts for speculative purposes. Our risks and risk management strategyare outlined below. Actual gains and losses in the future may differ materially from the sensitivity analysespresented below based on changes in the timing and amount of interest rates and our actual exposures andhedges.
Interest Rate Risk
Our exposure to market risk due to changes in the general level of United States interest rates relatesprimarily to our term loan and cash equivalents.
We are exposed to changes in interest rates as a result of our borrowings under our term loan. As ofOctober 30, 2010, the weighted-average interest rate on the term loan was 7.0%, which represents the minimuminterest rate under the credit agreement. The current market rates are such that a 1% increase in market rateswould still result in a 7.0% interest rate on the term loan. However, based on outstanding principal indebtednessof $350.9 million under our term loan as of October 30, 2010, if market rates average 1% above the interest ratefloor over the remaining term of the debt, which would result from an increase in market rates of approximately3.2%, our annual interest expense would increase by approximately $7.6 million.
Our cash and cash equivalents are primarily maintained at five major financial institutions in the UnitedStates. The primary objective of our investment activities is the preservation of principal while maximizinginvestment income and minimizing risk.
The Company did not have any material investments as of October 30, 2010 and October 31, 2009 that aresensitive to changes in interest rates.
Foreign Currency Exchange Rate Risk
We are exposed to foreign currency exchange rate risk inherent in conducting business globally in numerouscurrencies, of which the most significant to our operations for fiscal year 2010 were the Chinese yuan, the euro,the Japanese yen, the British pound, the Singapore dollar and the Swiss franc. We are primarily exposed toforeign currency fluctuations related to operating expenses and cost of inventory components denominated incurrencies other than the U.S. dollar. As such, we benefit from a stronger U.S. dollar and may be adverselyaffected by a weaker U.S. dollar relative to the foreign currency. We use foreign currency forward contractsdesignated as cash flow hedges to protect against the foreign currency exchange rate risks inherent in ourforecasted operating expenses denominated in currencies other than the U.S. dollar. We recognize the gains andlosses on foreign currency forward contracts in the same period as the remeasurement losses and gains of therelated foreign currency denominated exposures.
We also may enter into other non-designated derivatives that consist primarily of forward contracts tominimize the risk associated with the foreign exchange effects of revaluing monetary assets and liabilities.Monetary assets and liabilities denominated in foreign currencies and any associated outstanding forwardcontracts are marked-to-market with realized and unrealized gains and losses included in “Other income (loss),net.”
Alternatively, we may choose not to hedge the foreign currency risk associated with our foreign currencyexposures if such exposure acts as a natural foreign currency hedge for other offsetting amounts denominated in
59

the same currency or if the currency is difficult or too expensive to hedge. As of October 30, 2010, we held$112.0 million in cash flow derivative instruments denominated in the Euro, Japanese yen, British pound,Singapore dollar and Swiss franc. The maximum length of time over which we are hedged as of October 30,2010 is through November 4, 2011.
We have performed a sensitivity analysis as of October 30, 2010, using a modeling technique that measuresthe change in the fair values arising from a hypothetical 10% adverse movement in the levels of foreign currencyexchange rates relative to the U.S. dollar, with all other variables held constant. The analysis covers all of ourforeign currency contracts offset by the underlying exposures. The foreign currency exchange rates we used werebased on market rates in effect at October 30, 2010. The sensitivity analysis indicated that a hypothetical 10%adverse movement in foreign currency exchange rates would not result in a material foreign exchange loss as ofOctober 30, 2010.
Equity Price Risk
We had no investments in publicly traded equity securities as of October 30, 2010 and October 31, 2009.We monitor our equity investments for impairment on a periodic basis. In the event that the carrying value of theequity investment exceeds its fair value, and we determine the decline in value to be other-than-temporary, wereduce the carrying value to its current fair value. Generally, we do not attempt to reduce or eliminate our marketexposure on these equity securities. We do not purchase our equity securities with the intent to use them forspeculative purposes. The aggregate cost of our equity investments in non-publicly traded companies was $7.0million and $6.8 million at October 30, 2010 and October 31, 2009.
Our common stock is quoted on the NASDAQ Global Select Market under the symbol “BRCD.” OnOctober 29, 2010, the last business day of our fourth fiscal quarter of 2010, the last reported sale price of ourcommon stock on the NASDAQ Global Select Market was $6.35 per share.
60

Item 8. Financial Statements and Supplementary Data
BROCADE COMMUNICATIONS SYSTEMS, INC.INDEX TO CONSOLIDATED FINANCIAL STATEMENTS
Page
Report of Independent Registered Public Accounting Firm . . . . . . . . . . . . . . . . . . . . . . . . . . . . . . . . . . . . . . 62Consolidated Statements of Operations . . . . . . . . . . . . . . . . . . . . . . . . . . . . . . . . . . . . . . . . . . . . . . . . . . . . . . 63Consolidated Balance Sheets . . . . . . . . . . . . . . . . . . . . . . . . . . . . . . . . . . . . . . . . . . . . . . . . . . . . . . . . . . . . . . 64Consolidated Statements of Stockholders’ Equity and Comprehensive Income . . . . . . . . . . . . . . . . . . . . . . . 65Consolidated Statements of Cash Flows . . . . . . . . . . . . . . . . . . . . . . . . . . . . . . . . . . . . . . . . . . . . . . . . . . . . . 66Notes to Consolidated Financial Statements . . . . . . . . . . . . . . . . . . . . . . . . . . . . . . . . . . . . . . . . . . . . . . . . . . 68Quarterly Summary (Unaudited) . . . . . . . . . . . . . . . . . . . . . . . . . . . . . . . . . . . . . . . . . . . . . . . . . . . . . . . . . . . 124
61

REPORT OF INDEPENDENT REGISTERED PUBLIC ACCOUNTING FIRM
The Board of Directors and StockholdersBrocade Communications Systems, Inc.:
We have audited the accompanying consolidated balance sheets of Brocade Communications Systems, Inc.and subsidiaries (the Company) as of October 30, 2010 and October 31, 2009, and the related consolidatedstatements of operations, stockholders’ equity and comprehensive income, and cash flows for each of the years inthe three-year period ended October 30, 2010. In connection with our audit of the consolidated financialstatements, we also have audited the accompanying financial statement schedule. These consolidated financialstatements and financial statement schedule are the responsibility of the Company’s management. Ourresponsibility is to express an opinion on these consolidated financial statements and financial statement schedulebased on our audits.
We conducted our audits in accordance with the auditing standards of the Public Company AccountingOversight Board (United States). Those standards require that we plan and perform the audit to obtain reasonableassurance about whether the financial statements are free of material misstatement. An audit includes examining,on a test basis, evidence supporting the amounts and disclosures in the financial statements, assessing theaccounting principles used and significant estimates made by management, as well as evaluating the overallfinancial statement presentation. We believe that our audits provide a reasonable basis for our opinion.
In our opinion, the consolidated financial statements referred to above present fairly, in all material respects,the financial position of Brocade Communications Systems, Inc. and subsidiaries as of October 30, 2010 andOctober 31, 2009, and the results of their operations and their cash flows for each of the years in the three-yearperiod ended October 30, 2010, in conformity with U.S. generally accepted accounting principles. Also, in ouropinion, the related financial statement schedule, when considered in relation to the basic consolidated financialstatements taken as a whole, presents fairly, in all material respects, the information set forth therein.
As discussed in note 2 to the consolidated financial statements, the Company adopted new accountingstandards for convertible debt instruments and revenue recognition as of November 1, 2009. The Company alsochanged its method of accounting for uncertainty in income taxes and recorded a cumulative effect adjustment asof the beginning of the year ended October 25, 2008.
We also have audited, in accordance with the standards of the Public Company Accounting Oversight Board(United States), the Company’s internal control over financial reporting as of October 30, 2010, based on criteriaestablished in Internal Control—Integrated Framework issued by the Committee of Sponsoring Organizations ofthe Treadway Commission (COSO), and our report dated December 17, 2010 expressed an unqualified opinionon the effectiveness of the Company’s internal control over financial reporting.
/s/ KPMG LLP
Mountain View CaliforniaDecember 17, 2010
62

BROCADE COMMUNICATIONS SYSTEMS, INC.
CONSOLIDATED STATEMENTS OF OPERATIONS
Fiscal Year Ended
October 30,2010
October 31,2009
October 25,2008
(In thousands, except per share amounts)Net revenues
Product . . . . . . . . . . . . . . . . . . . . . . . . . . . . . . . . . . . . . . . . . . . . . . . . . . . . . . . . . $1,732,024 $1,615,511 $1,230,737Service . . . . . . . . . . . . . . . . . . . . . . . . . . . . . . . . . . . . . . . . . . . . . . . . . . . . . . . . . 362,339 337,415 236,200
Total net revenues . . . . . . . . . . . . . . . . . . . . . . . . . . . . . . . . . . . . . . . . . . . . 2,094,363 1,952,926 1,466,937Cost of revenues (1)
Product (1) . . . . . . . . . . . . . . . . . . . . . . . . . . . . . . . . . . . . . . . . . . . . . . . . . . . . . . 683,486 739,354 459,850Service (1) . . . . . . . . . . . . . . . . . . . . . . . . . . . . . . . . . . . . . . . . . . . . . . . . . . . . . . 176,547 180,072 146,715
Total cost of revenues . . . . . . . . . . . . . . . . . . . . . . . . . . . . . . . . . . . . . . . . . 860,033 919,426 606,565
Gross marginProduct . . . . . . . . . . . . . . . . . . . . . . . . . . . . . . . . . . . . . . . . . . . . . . . . . . . . . . . . . 1,048,538 876,157 770,887Service . . . . . . . . . . . . . . . . . . . . . . . . . . . . . . . . . . . . . . . . . . . . . . . . . . . . . . . . . 185,792 157,343 89,485
Total gross margin . . . . . . . . . . . . . . . . . . . . . . . . . . . . . . . . . . . . . . . . . . . . 1,234,330 1,033,500 860,372Operating expenses:
Research and development . . . . . . . . . . . . . . . . . . . . . . . . . . . . . . . . . . . . . . . . . . 354,260 354,809 255,571Sales and marketing (1) . . . . . . . . . . . . . . . . . . . . . . . . . . . . . . . . . . . . . . . . . . . . 534,458 385,155 274,311General and administrative . . . . . . . . . . . . . . . . . . . . . . . . . . . . . . . . . . . . . . . . . . 67,848 84,962 58,172Legal fees associated with indemnification obligations and other related costs,net . . . . . . . . . . . . . . . . . . . . . . . . . . . . . . . . . . . . . . . . . . . . . . . . . . . . . . . . . . . (163) 23,941 48,673
Provision for class action lawsuit . . . . . . . . . . . . . . . . . . . . . . . . . . . . . . . . . . . . . — — 160,000Amortization of intangible assets . . . . . . . . . . . . . . . . . . . . . . . . . . . . . . . . . . . . . 65,623 68,718 31,484Acquisition and integration costs . . . . . . . . . . . . . . . . . . . . . . . . . . . . . . . . . . . . . 204 5,127 682Restructuring costs and facilities lease loss (benefit), net . . . . . . . . . . . . . . . . . . 1,059 2,329 2,731In-process research and development . . . . . . . . . . . . . . . . . . . . . . . . . . . . . . . . . — 26,900 —Goodwill and acquisition-related intangible assets impairment . . . . . . . . . . . . . — 53,306 —
Total operating expenses . . . . . . . . . . . . . . . . . . . . . . . . . . . . . . . . . . . . . . . 1,023,289 1,005,247 831,624
Income from operations . . . . . . . . . . . . . . . . . . . . . . . . . . . . . . . . . . . . . . . . . . . . . . . . 211,041 28,253 28,748Interest income . . . . . . . . . . . . . . . . . . . . . . . . . . . . . . . . . . . . . . . . . . . . . . . . . . . . . . . 763 4,896 24,568Other income (loss), net . . . . . . . . . . . . . . . . . . . . . . . . . . . . . . . . . . . . . . . . . . . . . . . . (7,215) (7,278) 2,299Interest expense (2) . . . . . . . . . . . . . . . . . . . . . . . . . . . . . . . . . . . . . . . . . . . . . . . . . . . (85,858) (99,294) (17,249)Gain (loss) on sale of investments and property, net . . . . . . . . . . . . . . . . . . . . . . . . . . (8,551) (602) (6,874)Loss on impairment of portfolio investments . . . . . . . . . . . . . . . . . . . . . . . . . . . . . . . — — (8,751)
Income (loss) before income tax provision (benefit) (2) . . . . . . . . . . . . . . . . . . . . . . . 110,180 (74,025) 22,741Income tax provision (benefit) (2) . . . . . . . . . . . . . . . . . . . . . . . . . . . . . . . . . . . . . . . . (8,672) 7,359 (144,651)
Net income (loss) (2) . . . . . . . . . . . . . . . . . . . . . . . . . . . . . . . . . . . . . . . . . . . . . . . . . . $ 118,852 $ (81,384) $ 167,392
Net income (loss) per share—basic (2) . . . . . . . . . . . . . . . . . . . . . . . . . . . . . . . . . . . . $ 0.27 $ (0.20) $ 0.45
Net income (loss) per share—diluted (2) . . . . . . . . . . . . . . . . . . . . . . . . . . . . . . . . . . . $ 0.25 $ (0.20) $ 0.44
Shares used in per share calculation—basic . . . . . . . . . . . . . . . . . . . . . . . . . . . . . . . . 446,996 398,948 375,303
Shares used in per share calculation—diluted . . . . . . . . . . . . . . . . . . . . . . . . . . . . . . . 482,741 398,948 385,641
(1) Fiscal year 2010 reflects the reclassification of system engineer costs from cost of revenues to sales and marketingexpenses. Fiscal years 2009 and 2008 have not been updated for the new cost classification implemented in 2010. SeeNote 1, “Basis of Presentation and Reclassification,” of the Notes to Consolidated Financial Statements.
(2) As adjusted due to adoption of update to ASC 470-20 relating to accounting for convertible debt instruments. See Note 2,“Summary of Significant Accounting Policies,” of the Notes to Consolidated Financial Statements.
See accompanying notes to consolidated financial statements.
63

BROCADE COMMUNICATIONS SYSTEMS, INC.
CONSOLIDATED BALANCE SHEETS
October 30,2010
October 31,2009
(In thousands, except par value)ASSETS
Current assets:Cash and cash equivalents . . . . . . . . . . . . . . . . . . . . . . . . . . . . . . . . . . . . . . . . . . . . . . . . . . . . $ 333,984 $ 334,193Short-term investments . . . . . . . . . . . . . . . . . . . . . . . . . . . . . . . . . . . . . . . . . . . . . . . . . . . . . . 1,998 4,678Restricted cash . . . . . . . . . . . . . . . . . . . . . . . . . . . . . . . . . . . . . . . . . . . . . . . . . . . . . . . . . . . . . — 12,502
Total cash, cash equivalents, short-term investments and restricted cash . . . . . . . . . . . 335,982 351,373Accounts receivable, net of allowances of $6,721 and $12,573 at October 30, 2010 andOctober 31, 2009, respectively . . . . . . . . . . . . . . . . . . . . . . . . . . . . . . . . . . . . . . . . . . . . . . 329,564 297,819
Inventories . . . . . . . . . . . . . . . . . . . . . . . . . . . . . . . . . . . . . . . . . . . . . . . . . . . . . . . . . . . . . . . . 76,808 72,152Deferred tax assets . . . . . . . . . . . . . . . . . . . . . . . . . . . . . . . . . . . . . . . . . . . . . . . . . . . . . . . . . . 67,080 84,629Prepaid expenses and other current assets . . . . . . . . . . . . . . . . . . . . . . . . . . . . . . . . . . . . . . . 65,017 79,302
Total current assets . . . . . . . . . . . . . . . . . . . . . . . . . . . . . . . . . . . . . . . . . . . . . . . . . . . . . 874,451 885,275Property and equipment, net . . . . . . . . . . . . . . . . . . . . . . . . . . . . . . . . . . . . . . . . . . . . . . . . . . . . . . 539,117 442,408Goodwill (1) . . . . . . . . . . . . . . . . . . . . . . . . . . . . . . . . . . . . . . . . . . . . . . . . . . . . . . . . . . . . . . . . . . 1,644,950 1,659,934Intangible assets, net . . . . . . . . . . . . . . . . . . . . . . . . . . . . . . . . . . . . . . . . . . . . . . . . . . . . . . . . . . . . 344,000 470,872Non-current deferred tax assets (1) . . . . . . . . . . . . . . . . . . . . . . . . . . . . . . . . . . . . . . . . . . . . . . . . . 203,454 184,713Other assets . . . . . . . . . . . . . . . . . . . . . . . . . . . . . . . . . . . . . . . . . . . . . . . . . . . . . . . . . . . . . . . . . . . 48,203 28,218
Total assets . . . . . . . . . . . . . . . . . . . . . . . . . . . . . . . . . . . . . . . . . . . . . . . . . . . . . . . . . . . $3,654,175 $3,671,420
LIABILITIES AND STOCKHOLDERS’ EQUITYCurrent liabilities:
Accounts payable . . . . . . . . . . . . . . . . . . . . . . . . . . . . . . . . . . . . . . . . . . . . . . . . . . . . . . . . . . $ 147,130 $ 181,249Accrued employee compensation . . . . . . . . . . . . . . . . . . . . . . . . . . . . . . . . . . . . . . . . . . . . . . 91,688 160,832Deferred revenue . . . . . . . . . . . . . . . . . . . . . . . . . . . . . . . . . . . . . . . . . . . . . . . . . . . . . . . . . . . 185,623 174,870Current liabilities associated with facilities lease losses . . . . . . . . . . . . . . . . . . . . . . . . . . . . 5,992 10,769Current portion of capital lease obligations . . . . . . . . . . . . . . . . . . . . . . . . . . . . . . . . . . . . . . 1,761 —Revolving credit facility . . . . . . . . . . . . . . . . . . . . . . . . . . . . . . . . . . . . . . . . . . . . . . . . . . . . . — 14,050Current portion of term loan . . . . . . . . . . . . . . . . . . . . . . . . . . . . . . . . . . . . . . . . . . . . . . . . . . 28,779 38,822Convertible subordinated debt (1) . . . . . . . . . . . . . . . . . . . . . . . . . . . . . . . . . . . . . . . . . . . . . . — 169,332Other accrued liabilities . . . . . . . . . . . . . . . . . . . . . . . . . . . . . . . . . . . . . . . . . . . . . . . . . . . . . 108,310 105,263
Total current liabilities . . . . . . . . . . . . . . . . . . . . . . . . . . . . . . . . . . . . . . . . . . . . . . . . . . 569,283 855,187Non-current capital lease obligations, net of current portion . . . . . . . . . . . . . . . . . . . . . . . . . . . . . 6,782 —Term loan, net of current portion . . . . . . . . . . . . . . . . . . . . . . . . . . . . . . . . . . . . . . . . . . . . . . . . . . 297,118 860,114Senior Secured Notes . . . . . . . . . . . . . . . . . . . . . . . . . . . . . . . . . . . . . . . . . . . . . . . . . . . . . . . . . . . 595,373 —Non-current liabilities associated with facilities lease losses . . . . . . . . . . . . . . . . . . . . . . . . . . . . . 3,984 10,150Non-current deferred revenue . . . . . . . . . . . . . . . . . . . . . . . . . . . . . . . . . . . . . . . . . . . . . . . . . . . . . 65,242 60,575Non-current income tax liability . . . . . . . . . . . . . . . . . . . . . . . . . . . . . . . . . . . . . . . . . . . . . . . . . . . 61,421 92,276Other non-current liabilities . . . . . . . . . . . . . . . . . . . . . . . . . . . . . . . . . . . . . . . . . . . . . . . . . . . . . . 8,671 15,114
Total liabilities . . . . . . . . . . . . . . . . . . . . . . . . . . . . . . . . . . . . . . . . . . . . . . . . . . . . . . . . . 1,607,874 1,893,416
Commitments and contingencies (Note 10)Stockholders’ equity:
Preferred stock, $0.001 par value, 5,000 shares authorized, no shares issued andoutstanding . . . . . . . . . . . . . . . . . . . . . . . . . . . . . . . . . . . . . . . . . . . . . . . . . . . . . . . . . . . . . — —
Common stock, $0.001 par value, 800,000 shares authorized:Issued and outstanding: 461,291 and 433,988 shares at October 30, 2010 andOctober 31, 2009, respectively . . . . . . . . . . . . . . . . . . . . . . . . . . . . . . . . . . . . . . . . . . 461 434
Additional paid-in capital (1) . . . . . . . . . . . . . . . . . . . . . . . . . . . . . . . . . . . . . . . . . . . . . . . . . . . . . 2,047,563 1,901,238Accumulated other comprehensive loss . . . . . . . . . . . . . . . . . . . . . . . . . . . . . . . . . . . . . . . . . . . . . (2,827) (5,920)Retained earnings (Accumulated deficit) (1) . . . . . . . . . . . . . . . . . . . . . . . . . . . . . . . . . . . . . . . . . 1,104 (117,748)
Total stockholders’ equity . . . . . . . . . . . . . . . . . . . . . . . . . . . . . . . . . . . . . . . . . . . . . . . . 2,046,301 1,778,004
Total liabilities and stockholders’ equity . . . . . . . . . . . . . . . . . . . . . . . . . . . . . . . . . . . . $3,654,175 $3,671,420
(1) As adjusted due to adoption of update to ASC 470-20 relating to accounting for convertible debt instruments. See Note 2,“Summary of Significant Accounting Policies,” of the Notes to Consolidated Financial Statements.
See accompanying notes to consolidated financial statements.
64

BROCADE COMMUNICATIONS SYSTEMS, INC.
CONSOLIDATED STATEMENTS OF STOCKHOLDERS’ EQUITY ANDCOMPREHENSIVE INCOME
Common Stock AdditionalPaid-InCapital
AccumulatedOther
ComprehensiveLoss
RetainedEarnings
(AccumulatedDeficit)
TotalStockholders’
EquityComprehensiveIncome (loss)
Number ofShares Amount
(In thousands)Balance at October 27, 2007 (1) . . 387,406 $387 $1,491,970 $ (1,180) $(206,835) $1,284,342 $ 71,628Adjustment to accumulated deficitupon adoption of ASC740-10 . . . . . . . . . . . . . . . . . . . . — — — — 3,079 3,079 —
Issuance of common stock . . . . . . . 8,070 8 46,433 — — 46,441 —Retirement of common stock . . . . . (839) (1) (2,149) — — (2,150) —Common stock repurchases . . . . . . (22,779) (22) (168,310) — — (168,332) —Tax benefit from employee stockplans . . . . . . . . . . . . . . . . . . . . . . — — 16,146 — — 16,146 —
Stock-based compensation . . . . . . . — — 38,025 — — 38,025 —Change in net unrealized gains(losses) on marketable equitysecurities, cash flow hedges andinvestments . . . . . . . . . . . . . . . . — — — (75,432) — (75,432) (75,432)
Change in cumulative translationadjustments . . . . . . . . . . . . . . . . — — — (9,265) — (9,265) (9,265)
Net income . . . . . . . . . . . . . . . . . . . — — — — 167,392 167,392 167,392
Balance at October 25, 2008 . . . . . 371,858 $372 $1,422,115 $(85,877) $ (36,364) $1,300,246 $ 82,695Issuance of common stock . . . . . . . 62,141 62 105,035 — — 105,097 —Retirement of common stock . . . . . (11) — — — — — —Stock options and awards assumedupon the Foundry acquisition . . — — 254,312 — — 254,312 —
Tax benefit from employee stockplans . . . . . . . . . . . . . . . . . . . . . . — — (794) — — (794) —
Stock-based compensation . . . . . . . — — 120,570 — — 120,570 —Change in net unrealized gains(losses) on marketable equitysecurities, cash flow hedges andinvestments . . . . . . . . . . . . . . . . — — — 78,183 — 78,183 78,183
Change in cumulative translationadjustments . . . . . . . . . . . . . . . . — — — 1,774 — 1,774 1,774
Net loss . . . . . . . . . . . . . . . . . . . . . — — — — (81,384) (81,384) (81,384)
Balance at October 31, 2009 . . . . . 433,988 $434 $1,901,238 $ (5,920) $(117,748) $1,778,004 $ (1,427)Issuance of common stock . . . . . . . 31,757 32 68,900 — — 68,932 —Common stock repurchases . . . . . . (4,454) (5) (24,999) — — (25,004) —Settlement of stock awardsassumed upon the Foundryacquisition . . . . . . . . . . . . . . . . . — — (1,362) — — (1,362)
Tax benefit from employee stockplans . . . . . . . . . . . . . . . . . . . . . . — — 2,161 — — 2,161 —
Stock-based compensation . . . . . . . — — 101,625 — — 101,625 —Change in net unrealized gains oncash flow hedges . . . . . . . . . . . . — — — 5,346 — 5,346 5,346
Change in cumulative translationadjustments . . . . . . . . . . . . . . . . — — — (2,253) — (2,253) (2,253)
Net income . . . . . . . . . . . . . . . . . . . — — — — 118,852 118,852 118,852
Balance at October 30, 2010 . . . . . 461,291 $461 $2,047,563 $ (2,827) $ 1,104 $2,046,301 $121,945
(1) As adjusted due to adoption of update to ASC 470-20 relating to accounting for convertible debt instruments. See Note 2,“Summary of Significant Accounting Policies,” of the Notes to Consolidated Financial Statements.
See accompanying notes to consolidated financial statements.
65
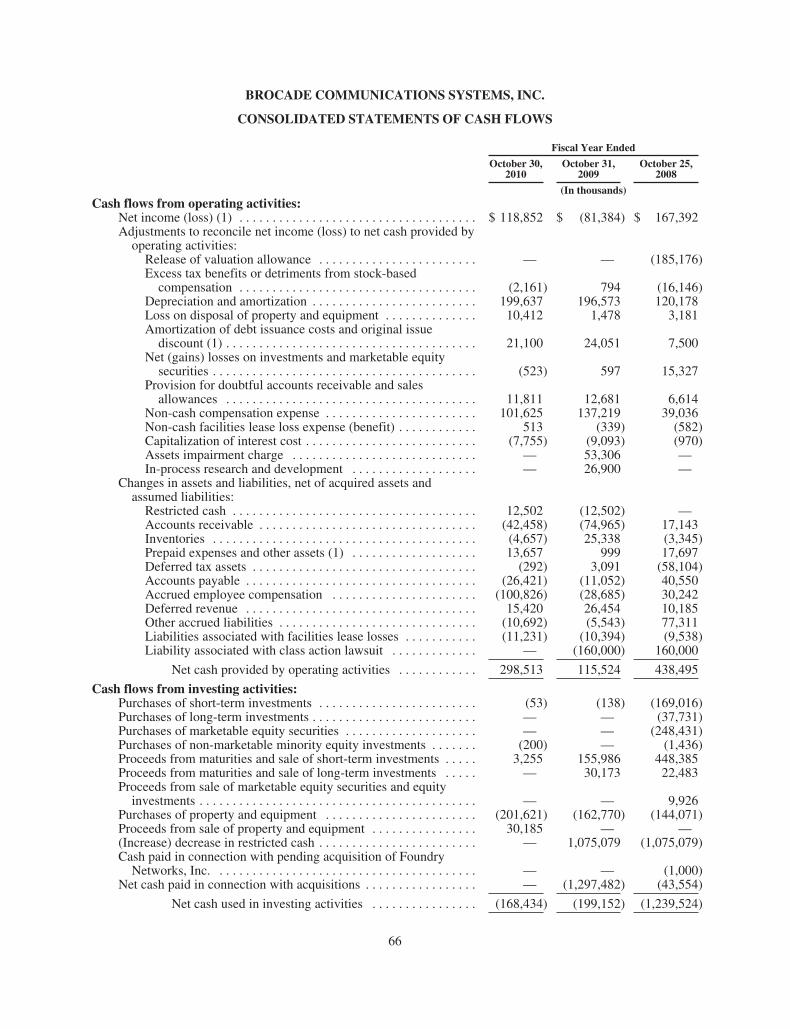
BROCADE COMMUNICATIONS SYSTEMS, INC.
CONSOLIDATED STATEMENTS OF CASH FLOWS
Fiscal Year Ended
October 30,2010
October 31,2009
October 25,2008
(In thousands)Cash flows from operating activities:
Net income (loss) (1) . . . . . . . . . . . . . . . . . . . . . . . . . . . . . . . . . . . . $ 118,852 $ (81,384) $ 167,392Adjustments to reconcile net income (loss) to net cash provided byoperating activities:Release of valuation allowance . . . . . . . . . . . . . . . . . . . . . . . . — — (185,176)Excess tax benefits or detriments from stock-basedcompensation . . . . . . . . . . . . . . . . . . . . . . . . . . . . . . . . . . . . (2,161) 794 (16,146)
Depreciation and amortization . . . . . . . . . . . . . . . . . . . . . . . . . 199,637 196,573 120,178Loss on disposal of property and equipment . . . . . . . . . . . . . . 10,412 1,478 3,181Amortization of debt issuance costs and original issuediscount (1) . . . . . . . . . . . . . . . . . . . . . . . . . . . . . . . . . . . . . . 21,100 24,051 7,500
Net (gains) losses on investments and marketable equitysecurities . . . . . . . . . . . . . . . . . . . . . . . . . . . . . . . . . . . . . . . . (523) 597 15,327
Provision for doubtful accounts receivable and salesallowances . . . . . . . . . . . . . . . . . . . . . . . . . . . . . . . . . . . . . . 11,811 12,681 6,614
Non-cash compensation expense . . . . . . . . . . . . . . . . . . . . . . . 101,625 137,219 39,036Non-cash facilities lease loss expense (benefit) . . . . . . . . . . . . 513 (339) (582)Capitalization of interest cost . . . . . . . . . . . . . . . . . . . . . . . . . . (7,755) (9,093) (970)Assets impairment charge . . . . . . . . . . . . . . . . . . . . . . . . . . . . — 53,306 —In-process research and development . . . . . . . . . . . . . . . . . . . — 26,900 —
Changes in assets and liabilities, net of acquired assets andassumed liabilities:Restricted cash . . . . . . . . . . . . . . . . . . . . . . . . . . . . . . . . . . . . . 12,502 (12,502) —Accounts receivable . . . . . . . . . . . . . . . . . . . . . . . . . . . . . . . . . (42,458) (74,965) 17,143Inventories . . . . . . . . . . . . . . . . . . . . . . . . . . . . . . . . . . . . . . . . (4,657) 25,338 (3,345)Prepaid expenses and other assets (1) . . . . . . . . . . . . . . . . . . . 13,657 999 17,697Deferred tax assets . . . . . . . . . . . . . . . . . . . . . . . . . . . . . . . . . . (292) 3,091 (58,104)Accounts payable . . . . . . . . . . . . . . . . . . . . . . . . . . . . . . . . . . . (26,421) (11,052) 40,550Accrued employee compensation . . . . . . . . . . . . . . . . . . . . . . (100,826) (28,685) 30,242Deferred revenue . . . . . . . . . . . . . . . . . . . . . . . . . . . . . . . . . . . 15,420 26,454 10,185Other accrued liabilities . . . . . . . . . . . . . . . . . . . . . . . . . . . . . . (10,692) (5,543) 77,311Liabilities associated with facilities lease losses . . . . . . . . . . . (11,231) (10,394) (9,538)Liability associated with class action lawsuit . . . . . . . . . . . . . — (160,000) 160,000
Net cash provided by operating activities . . . . . . . . . . . . 298,513 115,524 438,495
Cash flows from investing activities:Purchases of short-term investments . . . . . . . . . . . . . . . . . . . . . . . . (53) (138) (169,016)Purchases of long-term investments . . . . . . . . . . . . . . . . . . . . . . . . . — — (37,731)Purchases of marketable equity securities . . . . . . . . . . . . . . . . . . . . — — (248,431)Purchases of non-marketable minority equity investments . . . . . . . (200) — (1,436)Proceeds from maturities and sale of short-term investments . . . . . 3,255 155,986 448,385Proceeds from maturities and sale of long-term investments . . . . . — 30,173 22,483Proceeds from sale of marketable equity securities and equityinvestments . . . . . . . . . . . . . . . . . . . . . . . . . . . . . . . . . . . . . . . . . . — — 9,926
Purchases of property and equipment . . . . . . . . . . . . . . . . . . . . . . . (201,621) (162,770) (144,071)Proceeds from sale of property and equipment . . . . . . . . . . . . . . . . 30,185 — —(Increase) decrease in restricted cash . . . . . . . . . . . . . . . . . . . . . . . . — 1,075,079 (1,075,079)Cash paid in connection with pending acquisition of FoundryNetworks, Inc. . . . . . . . . . . . . . . . . . . . . . . . . . . . . . . . . . . . . . . . — — (1,000)
Net cash paid in connection with acquisitions . . . . . . . . . . . . . . . . . — (1,297,482) (43,554)
Net cash used in investing activities . . . . . . . . . . . . . . . . (168,434) (199,152) (1,239,524)
66
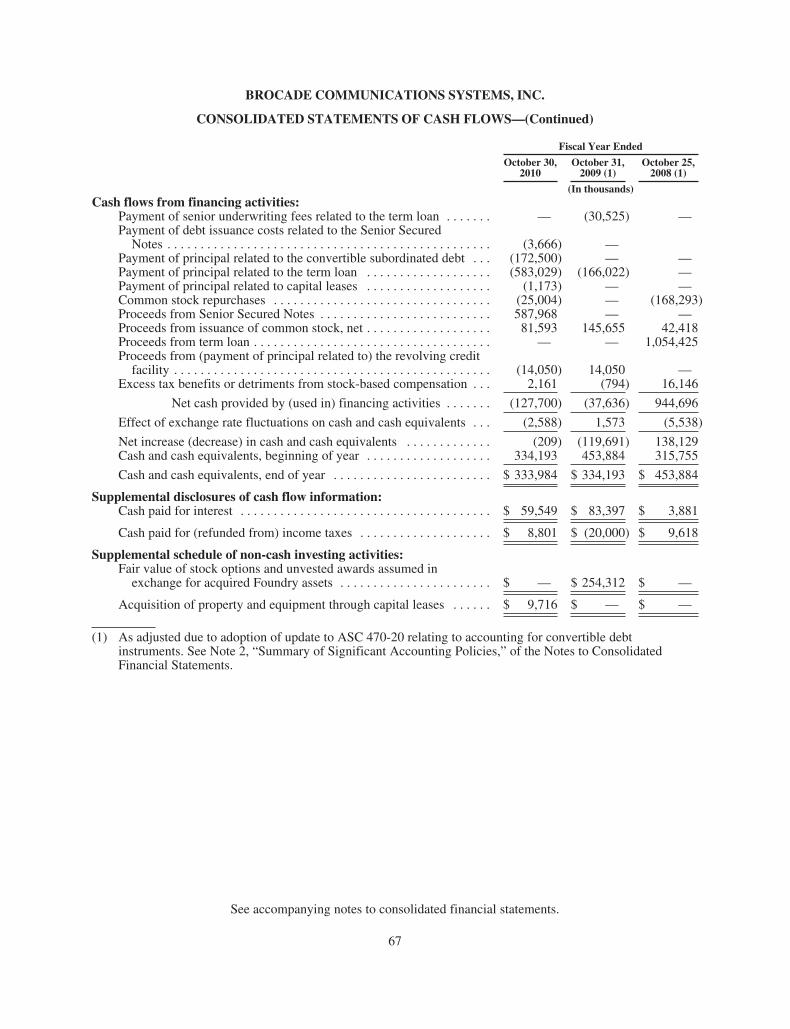
BROCADE COMMUNICATIONS SYSTEMS, INC.
CONSOLIDATED STATEMENTS OF CASH FLOWS—(Continued)
Fiscal Year Ended
October 30,2010
October 31,2009 (1)
October 25,2008 (1)
(In thousands)Cash flows from financing activities:
Payment of senior underwriting fees related to the term loan . . . . . . . — (30,525) —Payment of debt issuance costs related to the Senior SecuredNotes . . . . . . . . . . . . . . . . . . . . . . . . . . . . . . . . . . . . . . . . . . . . . . . . . (3,666) —
Payment of principal related to the convertible subordinated debt . . . (172,500) — —Payment of principal related to the term loan . . . . . . . . . . . . . . . . . . . (583,029) (166,022) —Payment of principal related to capital leases . . . . . . . . . . . . . . . . . . . (1,173) — —Common stock repurchases . . . . . . . . . . . . . . . . . . . . . . . . . . . . . . . . . (25,004) — (168,293)Proceeds from Senior Secured Notes . . . . . . . . . . . . . . . . . . . . . . . . . . 587,968 — —Proceeds from issuance of common stock, net . . . . . . . . . . . . . . . . . . . 81,593 145,655 42,418Proceeds from term loan . . . . . . . . . . . . . . . . . . . . . . . . . . . . . . . . . . . . — — 1,054,425Proceeds from (payment of principal related to) the revolving creditfacility . . . . . . . . . . . . . . . . . . . . . . . . . . . . . . . . . . . . . . . . . . . . . . . . (14,050) 14,050 —
Excess tax benefits or detriments from stock-based compensation . . . 2,161 (794) 16,146
Net cash provided by (used in) financing activities . . . . . . . (127,700) (37,636) 944,696
Effect of exchange rate fluctuations on cash and cash equivalents . . . (2,588) 1,573 (5,538)
Net increase (decrease) in cash and cash equivalents . . . . . . . . . . . . . (209) (119,691) 138,129Cash and cash equivalents, beginning of year . . . . . . . . . . . . . . . . . . . 334,193 453,884 315,755
Cash and cash equivalents, end of year . . . . . . . . . . . . . . . . . . . . . . . . $ 333,984 $ 334,193 $ 453,884
Supplemental disclosures of cash flow information:Cash paid for interest . . . . . . . . . . . . . . . . . . . . . . . . . . . . . . . . . . . . . . $ 59,549 $ 83,397 $ 3,881
Cash paid for (refunded from) income taxes . . . . . . . . . . . . . . . . . . . . $ 8,801 $ (20,000) $ 9,618
Supplemental schedule of non-cash investing activities:Fair value of stock options and unvested awards assumed inexchange for acquired Foundry assets . . . . . . . . . . . . . . . . . . . . . . . $ — $ 254,312 $ —
Acquisition of property and equipment through capital leases . . . . . . $ 9,716 $ — $ —
(1) As adjusted due to adoption of update to ASC 470-20 relating to accounting for convertible debtinstruments. See Note 2, “Summary of Significant Accounting Policies,” of the Notes to ConsolidatedFinancial Statements.
See accompanying notes to consolidated financial statements.
67

BROCADE COMMUNICATIONS SYSTEMS, INC.
NOTES TO CONSOLIDATED FINANCIAL STATEMENTS
1. Basis of Presentation and Reclassification
The fiscal year for Brocade Communications Systems, Inc. (“Brocade” or the “Company”) is the 52 or 53weeks ending on the last Saturday in October. As is customary for companies that use the 52/53-weekconvention, every fifth year contains a 53-week year. Fiscal year 2010 is a 52-week fiscal year and fiscal year2009 and 2008 were 53-week and 52-week fiscal years, respectively. The second quarter of fiscal year 2009consisted of fourteen weeks, which was one week longer than a typical quarter. The Company’s next 53-weekfiscal year will be fiscal year 2014 and our next 14-week quarter will be in the second quarter of fiscal year 2014.The Consolidated Financial Statements include the accounts of Brocade and its wholly-owned subsidiaries. Allsignificant intercompany accounts and transactions have been eliminated.
Reclassification
During fiscal year 2010, we reviewed our cost classification, primarily related to our system engineer(“SE”) costs that were previously classified within cost of revenues. The SE’s primary role has migrated overtime from assisting with customer support to primarily performing pre-sales activity to generate future business,which was enabled by the growth of our support organization, such that in 2010 the majority of the SE’s timewas spent on pre-sale activity. As a result of this change, we have reclassified the SE costs within ourConsolidated Statements of Operations starting in fiscal year 2010. These costs are now presented within salesand marketing expenses, as opposed to cost of revenues. This reclassification did not impact revenues, incomefrom operations, net income, or earnings per share for 2010. Prior period amounts have not been updated for thenew cost classification implemented in fiscal year 2010.
For fiscal year 2010, $134.3 million of SE costs are included in sales and marketing expenses. Forcomparative purposes, had the reclassification been affected for fiscal years 2009 and 2008, the pro forma cost ofrevenues for each of the Company’s reportable segment and sales and marketing expenses would have been asfollows (in thousands):
Pro Forma Amount
Fiscal Year EndedOctober 31, 2009
Fiscal Year EndedOctober 25, 2008
Cost of revenuesData Storage . . . . . . . . . . . . . . . . . . . . . $408,026 $393,283Ethernet Products . . . . . . . . . . . . . . . . . 228,908 10,133Global Services . . . . . . . . . . . . . . . . . . . 161,946 141,382
Total cost of revenues . . . . . . . . . . . . . . . . . . 798,880 544,798Sales and marketing expenses . . . . . . . . . . . $505,701 $336,078
2. Summary of Significant Accounting Policies
Cash and Cash Equivalents
The Company considers all highly liquid investments with an original or remaining maturity of threemonths or less at the date of purchase to be cash equivalents.
Restricted Cash
During fiscal year 2009, the Company entered into an agreement with one of the defendants in connectionwith the Special Litigation Committee’s litigation. Under this agreement, the Company received $12.5 million,which was held in restricted cash pending settlement of certain contingencies. On February 3, 2010, thesecontingencies were satisfied and the restrictions on the cash were removed.
68
BROCADE COMMUNICATIONS SYSTEMS, INC.
NOTES TO CONSOLIDATED FINANCIAL STATEMENTS—(Continued)
Investments and Equity Securities
Investment securities with an original maturity of more than three months that mature less than one yearfrom the Consolidated Balance Sheet date are considered short-term investments. Investment securities with anoriginal or remaining maturity of one year or more and which the Company has the ability and intent to hold areconsidered long-term investments. Investments are classified as available-for-sale and are recorded on theaccompanying Consolidated Balance Sheets at fair value.
Equity securities are classified as available-for-sale when there are no restrictions on the Company’s abilityto immediately liquidate such securities. Marketable equity securities are recorded at fair value.
Unrealized holding gains and losses related to the Company’s investments and equity securities are includedas a separate component of accumulated other comprehensive loss on the accompanying Consolidated BalanceSheets, net of any related tax effect. Realized gains and losses are calculated based on the specific identificationmethod and are included in “Other income (loss), net,” on the Consolidated Statements of Operations.
The Company recognizes an impairment charge when the declines in the fair values of its investments andequity securities below the cost basis are assessed to be other-than-temporary. An other-than-temporaryimpairment is triggered when there is an intent to sell the security, it is more likely than not that the security willbe required to be sold before recovery, or the security is not expected to recover the entire amortized cost basis ofthe security. The Company also considers various factors in determining whether to recognize an impairmentcharge, including the length of time and extent to which the fair value has been less than the cost basis and thefinancial condition and near-term prospects of the investee. For impairments involving credit losses, theCompany recognizes the credit loss component in earnings and the remainder of the impairment is recorded inaccumulated other comprehensive loss.
From time to time the Company makes equity investments in non-publicly traded companies. Theseinvestments are included in “Other assets” on the accompanying Consolidated Balance Sheets and are generallyaccounted for under the cost method as the Company does not have the ability to exercise significant influenceover the respective investee’s operating and financial policies nor does it have a liquidation preference that issubstantive. The Company monitors its investments in non-publicly traded companies for impairment on aquarterly basis and makes appropriate reductions in carrying values when such impairments are determined to beother-than-temporary. Impairment charges are included in “Other income (loss), net,” on the ConsolidatedStatements of Operations. Factors considered in determining an impairment include, but are not limited to, thecurrent business environment including competition and uncertainty of financial condition, going concernconsiderations such as the rate at which the investee company utilizes cash and the investee company’s ability toobtain additional private financing to fulfill its stated business plan, the need for changes to the investeecompany’s existing business model due to changing business environments and its ability to successfullyimplement necessary changes, and comparable valuations. If an investment is determined to be impaired, adetermination is made as to whether such impairment is other-than-temporary.
Fair Value of Financial Instruments
The fair value of the Company’s financial instruments, including cash and cash equivalents, accountsreceivable, restricted cash, accounts payable and accrued liabilities, approximate cost because of their shortmaturities. The fair value of the Company’s investments is primarily determined using quoted market prices forthose securities or similar financial instruments.
69

BROCADE COMMUNICATIONS SYSTEMS, INC.
NOTES TO CONSOLIDATED FINANCIAL STATEMENTS—(Continued)
Convertible Debt Instruments
In the first fiscal quarter of 2010, the Company adopted a new standard issued by the Financial AccountingStandards Board (“FASB”) that changed the accounting for convertible debt instruments with cash settlementfeatures. As of adoption, this new accounting standard applied to the Company’s convertible subordinated debt.Under the previous accounting standard, the convertible subordinated debt was recognized entirely as a liability.In accordance with adopting this new accounting standard, Brocade retrospectively recognized both a liabilityand an equity component of the convertible subordinated debt at fair value. The liability component is recognizedas the fair value of a similar instrument that does not have a conversion feature at issuance. The equitycomponent, which is the value of the conversion feature at issuance, is recognized as the difference between theproceeds from the issuance of the convertible subordinated debt and the fair value of the liability component,after adjusting for the deferred tax impact. The convertible subordinated debt was issued at a coupon rate of2.25%, which was below that of a comparable instrument that does not have a conversion feature (8.75%).Therefore, the valuation of the debt component, using the income approach, resulted in a debt discount. The debtdiscount is reduced over the expected life of the debt, which is also the stated life of the debt. For additionaldiscussion, see Note 9, “Borrowings,” of the Notes to Consolidated Financial Statements.
As a result of applying this new accounting standard retrospectively to all periods presented, the Companyrecognized the following incremental effects on individual line items on the Consolidated Statements ofOperations (in thousands, except per share amounts):
Fiscal Year Ended October 31, 2009
Before Adoption Adjustments After Adoption
Interest expense . . . . . . . . . . . . . . . . . . . . . . $(91,281) $(8,013) $(99,294)Income tax provision (benefit) . . . . . . . . . . . $ 10,573 $(3,214) $ 7,359Net loss . . . . . . . . . . . . . . . . . . . . . . . . . . . . . $(76,585) $(4,799) $(81,384)Net loss per share—basic . . . . . . . . . . . . . . . $ (0.19) $ (0.01) $ (0.20)Net loss per share—diluted . . . . . . . . . . . . . $ (0.19) $ (0.01) $ (0.20)
Fiscal Year Ended October 25, 2008
Before Adoption Adjustments After Adoption
Interest expense . . . . . . . . . . . . . . . . . . . . . . $ (10,068) $(7,181) $ (17,249)Income tax benefit . . . . . . . . . . . . . . . . . . . . $(137,148) $(7,503) $(144,651)Net income . . . . . . . . . . . . . . . . . . . . . . . . . . $ 167,070 $ 322 $ 167,392Net income per share—basic . . . . . . . . . . . . $ 0.45 $ 0.00 $ 0.45Net income per share—diluted . . . . . . . . . . . $ 0.43 $ 0.01 $ 0.44
In addition, the Company recognized the following incremental effects on individual line items on theConsolidated Balance Sheets (in thousands):
As of October 31, 2009
Before Adoption Adjustments After Adoption
Goodwill . . . . . . . . . . . . . . . . . . . . . . . . . . . . $1,648,217 $ 11,717 $1,659,934Non-current deferred tax assets . . . . . . . . . . $ 185,713 $ (1,000) $ 184,713Convertible subordinated debt . . . . . . . . . . . $ 171,822 $ (2,490) $ 169,332Additional paid-in capital . . . . . . . . . . . . . . . $1,872,050 $ 29,188 $1,901,238Accumulated deficit . . . . . . . . . . . . . . . . . . . $ (101,767) $(15,981) $ (117,748)
70

BROCADE COMMUNICATIONS SYSTEMS, INC.
NOTES TO CONSOLIDATED FINANCIAL STATEMENTS—(Continued)
Derivative Financial Instruments
In the normal course of business, the Company is exposed to fluctuations in interest rates and the exchangerates associated with foreign currencies. The derivatives entered into by the Company qualify for and aredesignated as foreign currency cash flow hedges.
The derivatives are recognized on the Consolidated Balance Sheets at their respective fair values. Changesin fair values of outstanding cash flow hedges that are highly effective are recorded in accumulated othercomprehensive loss until earnings are affected by the variability of cash flows of the underlying hedgedtransaction. In most cases, amounts recorded in accumulated other comprehensive loss will be released toearnings at maturity of the related derivative. The recognition of effective hedge results offsets the gains or losseson the underlying exposure. Cash flows from derivative transactions are classified according to the nature of therisk being hedged.
The Company formally documents all relationships between hedging instruments and hedged items, as wellas the risk-management objective and strategy for undertaking hedge transactions. This documentation includeslinking all derivatives either to specific assets and liabilities on the consolidated balance sheets or specific firmcommitments or forecasted transactions. The Company also formally assesses both at the hedge’s inception andon an ongoing basis whether the derivatives used in hedging transactions have been highly effective in offsettingchanges in the cash flows of hedged items and whether those derivatives may be expected to remain highlyeffective in future periods. When it is determined that a derivative is not, or has ceased to be, highly effective as ahedge, the Company discontinues hedge accounting prospectively, as discussed below.
The Company discontinues hedge accounting prospectively when (i) the derivative is no longer highlyeffective in offsetting changes in the cash flows of a hedged item (including hedged items such as firmcommitments or forecasted transactions); (ii) the derivative expires or is sold, terminated or exercised; (iii) it isno longer probable that the forecasted transaction will occur; or (iv) management determines that designating thederivative as a hedging instrument is no longer appropriate.
When the Company discontinues hedge accounting, but it continues to be probable that the forecastedtransaction will occur in the originally expected period, the gain or loss on the derivative remains in accumulatedother comprehensive loss and is reclassified into earnings when the forecasted transaction affects earnings.However, if it is no longer probable that a forecasted transaction will occur by the end of the originally specifiedtime period or within an additional two-month period of time thereafter, the gain or loss that was in accumulatedother comprehensive loss will be recognized immediately in earnings. In all situations in which hedge accountingis discontinued and the derivative remains outstanding, the Company will carry the derivative at its fair value onthe Consolidated Balance Sheet until maturity and will recognize future changes in the fair value in currentperiod earnings. Any hedge ineffectiveness is recorded in current period earnings within “Other income (loss),net.” Effectiveness is assessed based on the comparison of current forward rates to the rates established on theCompany’s hedges.
Inventories
Inventories are stated at the lower of cost or market, using the first-in, first-out method. Inventory costsinclude material, labor and overhead. The Company records inventory write-downs based on excess and obsoleteinventory determined primarily by future demand forecast. A portion of the Company’s inventory is locatedoffsite at customers’ hubs, service depots and at contract manufacturers’ locations. Cash flows related to the saleof inventories are classified as cash flows from operating activities.
71
BROCADE COMMUNICATIONS SYSTEMS, INC.
NOTES TO CONSOLIDATED FINANCIAL STATEMENTS—(Continued)
Property and Equipment
Property and equipment are stated at cost less accumulated depreciation and amortization. Depreciation iscomputed using the straight-line method over the estimated useful lives of the assets. An estimated useful life of4 years is used for computer equipment and software, except for the Company’s enterprise-wide, integratedbusiness information system which is depreciated over 5 to 7 years. Effective May 1, 2010, the Companyprospectively changed the estimated useful life of its furniture from 4 years to 7 years for furniture placed inservice on or after that date, including furniture on capital lease. The Company will continue to use the straight-line method to depreciate furniture. The change in useful life was adopted because the life of the new furniture isestimated to be longer than previously purchased furniture. Furniture placed in service prior to May 1, 2010 willcontinue to be depreciated over 4 years using the straight-line method. Estimated useful lives of up to 4 years areused for engineering and other equipment and an estimated useful life of 30 years is used for buildings.Leasehold improvements are amortized using the straight-line method over the shorter of the useful life of theasset or the remaining term of the lease.
Brocade evaluates long-lived assets, such as property and equipment, for impairment whenever events orchanges in circumstances indicate that the carrying value of an asset may not be recoverable in accordance withASC 360-10 Property, Plant and Equipment. Brocade assesses the fair value of the assets based on theundiscounted future cash flow the assets are expected to generate and recognizes an impairment loss whenestimated undiscounted future cash flow expected to result from the use of the asset plus net proceeds expected toresult from the disposition of the asset, if any, are less than the carrying value of the asset. When Brocadeidentifies an impairment, Brocade reduces the carrying amount of the asset to its estimated fair value based on adiscounted cash flow approach or, when available and appropriate, to comparable market values.
Goodwill and Intangible Assets
The Company capitalizes goodwill at cost and evaluates goodwill on an annual basis during its second fiscalquarter or whenever events or changes in circumstances indicate that the carrying amount of an asset may not berecoverable. An impairment loss is recognized to the extent that the carrying amount of goodwill exceeds theasset’s implied fair value. Events which might indicate impairment include, but are not limited to, strategicdecisions made in response to economic and competitive conditions, the impact of the economic environment onthe Company’s customer base, material negative changes in relationships with significant customers, and/or asignificant decline in the Company’s stock price for a sustained period.
Intangible assets are carried at cost less accumulated amortization. Amortization is recognized over theestimated useful life of the respective asset. The Company evaluates intangible assets for impairment wheneverevents or changes in circumstances indicate that the carrying value of such assets may not be recoverable.Examples of such events or circumstances include, but are not limited to, significant underperformance relativeto historical or projected future operating results, significant changes in the manner of use of acquired assets orthe strategy for the Company’s business, significant negative industry or economic trends, and/or a significantdecline in the Company’s stock price for a sustained period. Impairment is recognized based on the differencebetween the fair value of the asset and its carrying value, and fair value is generally measured based ondiscounted cash flow analyses. For additional discussion, see Note 4, “Goodwill and Intangible Assets,” of theNotes to Consolidated Financial Statements.
Trade Receivables Factoring Facility
During April 2010, the Company entered into a trade receivables factoring facility with a financialinstitution to sell certain of its trade receivables from customers with limited, non-credit related, recourseprovisions. The sale of receivables eliminates the credit exposure of the Company in relation to these receivables.
72

BROCADE COMMUNICATIONS SYSTEMS, INC.
NOTES TO CONSOLIDATED FINANCIAL STATEMENTS—(Continued)
The Company pays facility administration fees to the financial institution on a quarterly basis. Under the terms ofthe factoring agreement, the maximum available amount of the factoring facility outstanding at any one time is$50.0 million, which is subject to change based on the financial institution’s approval. During the fiscal yearended October 30, 2010, $61.4 million of trade receivables were sold under the terms of the factoring facility.Sales of trade receivables are recorded as a reduction of trade accounts receivable. The losses resulting from thediscount on the sale of receivables for the fiscal year ended October 30, 2010 were immaterial and are includedin “Other income (loss), net” on the Consolidated Statement of Operations. Facility administration fees for thefiscal year ended October 30, 2010 were immaterial and are included in “General and administrative expenses”on the Consolidated Statements of Operations.
Litigation Costs
The Company is subject to the possibility of legal actions arising in the ordinary course of business. TheCompany regularly monitors the status of pending legal actions to evaluate both the magnitude and likelihood ofany potential losses. An accrual for these potential losses is made when they are probable and the amount of loss,or possible range of loss, can be reasonably estimated. In addition, recoveries are shown as a reduction inlitigation costs in the period in which they are realized.
Concentrations
Financial instruments that potentially subject the Company to concentrations of credit risk consist primarilyof cash, cash equivalents, short-term investments and accounts receivable. Cash, cash equivalents and short-terminvestments are primarily maintained at five major financial institutions in the United States. Deposits held withbanks may be redeemed upon demand and may exceed the amount of insurance provided on such deposits.
A majority of the Company’s accounts receivable balance is derived from sales to OEM partners in thecomputer storage and server industry. As of October 30, 2010, three customers accounted for 17%, 14% and10%, respectively, of total accounts receivable. As of October 31, 2009, two customers accounted for 16% and11%, respectively, of total accounts receivable. The Company performs ongoing credit evaluations of itscustomers and generally does not require collateral on accounts receivable balances. The Company hasestablished reserves for credit losses, sales allowances, and other allowances.
For the years ended October 30, 2010, October 31, 2009 and October 25, 2008, the same three customerseach represented 10% or more of our total net revenues for a combined total of 47% (EMC with 16%, HP with14% and IBM with 17%), 48% (EMC with 18%, HP with 13% and IBM with 17%) and 65% (EMC with 25%,HP with 18% and IBM with 22%), respectively.
The Company currently relies on single and limited sources for multiple key components used in themanufacture of its products. Additionally, the Company relies on multiple contract manufacturers for theproduction of its products, including Hon Hai Precision Industry Co., Ltd., Sanmina-SCI Corporation, AsteelFlash Group, Accton Wireless Broadband Corporation, Motorola, Inc. and Quanta Computer Incorporated(collectively the “CMs”). Although the Company uses standard parts and components for its products wherepossible, the Company’s CMs currently purchase, on their behalf, several key components used in themanufacture of products from single or limited supplier sources.
Revenue Recognition
Product revenue. Substantially all of the Company’s products are integrated with software that is essentialto the functionality of the equipment. Additionally, the Company provides unspecified software upgrades and
73

BROCADE COMMUNICATIONS SYSTEMS, INC.
NOTES TO CONSOLIDATED FINANCIAL STATEMENTS—(Continued)
enhancements related to the equipment through its maintenance contracts for most of its products. Productrevenue is generally recognized when all of the following criteria have been met:
• Persuasive evidence of an arrangement exists;
• Delivery has occurred;
• The fee is fixed or determinable; and
• Collectability is reasonably assured or collection is probable.
For newly introduced products, many of the Company’s large OEM customers require a productqualification period during which the Company’s products are tested and approved by the OEM customers forsale to their customers. Revenue recognition and related cost are deferred for shipments to new OEM customersand for shipments of newly introduced products to existing OEM customers until satisfactory evidence ofcompletion of the product qualification has been received from the OEM customer. In addition, revenue fromsales to the Company’s distributor customers is recognized in the same period in which the product is actuallysold by the distributor (sell-through).
The Company reduces revenue for estimated sales allowances at the time of shipment and sales programs atthe later of revenue recognition or communication of the commitment for sales incentives. Sales allowances areestimated based on historical sales returns. Sales programs are estimated based on approved sales programsversus claims under such sales programs, current trends and the Company’s expectations regarding futureactivity. In addition, the Company maintains an allowance for doubtful accounts, which is also accounted for as areduction in revenue. The Company establishes the allowance for doubtful accounts to ensure accountsreceivables are not overstated due to uncollectability. The Company maintains bad debt reserves based upon theanalysis of accounts receivable, historical collection patterns, customer concentrations, customercreditworthiness, current economic trends, changes in customer payment terms and practices, and customercommunication. The Company records a specific reserve for individual accounts when it becomes aware of acustomer’s likely inability to meet its financial obligations, such as in the case of bankruptcy filings ordeterioration in the customer’s operating results or financial position. If circumstances related to customerschange, the Company would further adjust estimates of the recoverability of receivables.
In October 2009, the FASB amended the accounting standards for revenue recognition to remove tangibleproducts containing software components and non-software components that function together to deliver theproducts’ essential functionality from the scope of industry-specific software revenue recognition guidance. InOctober 2009, the FASB also amended the accounting standards for multiple deliverable revenue arrangementsto:
• provide updated guidance on whether multiple deliverables exist, how the deliverables in anarrangement should be separated, and how the consideration should be allocated;
• require an entity to allocate revenue in an arrangement using estimated selling price (“ESP”) ofdeliverables if a vendor does not have vendor-specific objective evidence (“VSOE”) of selling price orthird-party evidence (“TPE”) of selling price; and
• eliminate the use of the residual method and require an entity to allocate revenue using the relativeselling price method.
The Company elected to early adopt this accounting guidance at the beginning of its first quarter of fiscalyear 2010 on a prospective basis for applicable transactions originating or materially modified after October 31,2009.
74
BROCADE COMMUNICATIONS SYSTEMS, INC.
NOTES TO CONSOLIDATED FINANCIAL STATEMENTS—(Continued)
Multiple-element arrangements. The Company’s multiple-element product offerings include networkinghardware with embedded software products and support, which are considered separate units of accounting. Forcertain of the Company’s products, software and non-software components function together to deliver thetangible products’ essential functionality.
For transactions entered into prior to the first quarter of fiscal year 2010, the Company allocated revenue toeach element in a multiple-element arrangement based upon VSOE of the fair value of the element, or if VSOEwas not available for the delivered element, by application of the residual method. In the application of theresidual method, the Company allocated revenue to the undelivered elements based on VSOE of fair value forthose elements and allocated the residual revenue to the delivered elements. VSOE of the fair value for anelement was based upon the price charged when the element was sold separately. Revenue allocated to eachelement was then recognized when the basic revenue recognition criteria was met for each element. For sales ofproducts that contained multiple elements and where software was incidental, the Company determined theseparate units of accounting that existed within the arrangement. If more than one unit of accounting existed, thearrangement consideration was allocated to each unit of accounting using the residual fair value method.Revenue was recognized for each unit of accounting when all the revenue recognition criteria had been met forthat unit of accounting.
Under the new accounting guidance, the Company allocates revenue to each element in a multiple-elementarrangement based upon their relative selling price. When applying the relative selling price method, theCompany determines the selling price for each deliverable using VSOE of selling price, if it exists, or TPE ofselling price. If neither VSOE nor TPE of selling price exist for a deliverable, the Company uses its best estimateof selling price for that deliverable. Revenue allocated to each element is then recognized when the basic revenuerecognition criteria are met for each element.
Consistent with its methodology under previous accounting guidance, the Company determines VSOEbased on its normal pricing and discounting practices for the specific product or service when sold separately. Indetermining VSOE, the Company requires that a substantial majority of the selling prices for a product or servicefall within a reasonably narrow pricing range, generally evidenced by approximately 80% of such historicalstand-alone transactions falling within ±15% of the median rates. For post-contract customer support (“PCS”),however, the Company considers stated renewal rates in determining VSOE.
In most instances, the Company is not able to establish VSOE for all deliverables in an arrangement withmultiple elements. This may be due to the Company infrequently selling each element separately, not pricingproducts within a narrow range, or only having a limited sales history. When VSOE cannot be established, theCompany attempts to establish selling price for each element based on TPE. TPE is determined based oncompetitor prices for similar deliverables when sold separately. Generally, the Company’s go-to-market strategydiffers from that of its peers and its offerings contain a significant level of customization and differentiation suchthat the comparable pricing of products with similar functionality cannot be obtained. Furthermore, the Companyis unable to reliably determine what similar competitor products’ selling prices are on a stand-alone basis.Therefore, the Company is typically not able to determine TPE.
When the Company is unable to establish selling price using VSOE or TPE, the Company uses ESP in itsallocation of the arrangement consideration. The objective of ESP is to determine the price at which theCompany would transact a sale if the product or service were sold on a stand-alone basis. ESP is generally usedfor offerings that are not typically sold on a stand-alone basis or for new or highly customized offerings.
The Company determines ESP for a product or service by considering multiple factors including, but notlimited to, geographies, market conditions, competitive landscape, internal costs, gross margin objectives and
75

BROCADE COMMUNICATIONS SYSTEMS, INC.
NOTES TO CONSOLIDATED FINANCIAL STATEMENTS—(Continued)
pricing practices. The determination of ESP is made through consultation with and formal approval by theCompany’s management, taking into consideration the go-to-market strategy.
The Company regularly reviews VSOE, TPE and ESP and maintains internal controls over the establishmentand updates of these estimates. There was no material impact on revenues during the fiscal year ended October 30,2010 nor does the Company expect a material impact in the near term from changes in VSOE, TPE or ESP.
The following table shows total net revenues as reported and unaudited pro forma total net revenues thatwould have been reported during the fiscal year ended October 30, 2010 if the transactions entered into ormaterially modified after October 31, 2009 were subject to previous accounting guidance:
As Reported
Pro Forma Basisas if the Previous
Accounting GuidanceWas in Effect
In thousands
Total net revenues for the twelve months ended October 30, 2010 . . . . . . . . . . $2,094,363 $2,084,353
The impact to total net revenues during the fiscal year ended October 30, 2010 of the accounting guidancewas primarily to net product revenues. Since the use of the residual method is eliminated under the newaccounting standards, any discounts offered by the Company are allocated to all deliverables, rather than onlyproducts delivered upfront.
The new accounting standards for revenue recognition if applied in the same manner to the year endedOctober 31, 2009 would not have had a material impact on total net revenues for that fiscal year. In terms of thetiming and pattern of revenue recognition, the new accounting guidance for revenue recognition is not expectedto have a significant effect on total net revenues in periods after the initial adoption when applied to multiple-element arrangements based on current go-to-market strategies due to the existence of VSOE on PCS andconsistent ESP across most of our product offerings.
Services revenue. Services revenue consists of training and maintenance arrangements, including PCS,separately priced extended warranties and other professional services. PCS services are offered under renewable,annual fee-based contracts or as part of multiple-element arrangements, and typically include telephone support andupgrades and enhancements to the Company’s operating system software. Revenue related to PCS elements isdeferred and recognized ratably over the contractual period. PCS contracts are typically one to three years in length.
Professional services are offered under hourly or fixed fee-based contracts or as part of multiple-elementarrangements. Professional services revenue is recognized as services are performed. Training revenue isrecognized upon completion of the training.
Warranty Expense
The Company provides standard warranties on its products ranging from one year to limited lifetimewarranties. Estimated future warranty costs are accrued at the time of shipment and charged to cost of revenuesbased upon historical experience, current trends and the Company’s expectations regarding future experience.
Foreign Currency
Assets and liabilities of the Company’s international subsidiaries in which the local currency is thefunctional currency are translated into U.S. dollars at period-end exchange rates. Income and expenses are
76

BROCADE COMMUNICATIONS SYSTEMS, INC.
NOTES TO CONSOLIDATED FINANCIAL STATEMENTS—(Continued)
translated into U.S. dollars at the average exchange rates during the period. The resulting translation adjustmentsare included in the Company’s Consolidated Balance Sheets in the stockholders’ equity section as a componentof accumulated other comprehensive loss. Foreign exchange gains and losses for assets and liabilities of theCompany’s international subsidiaries in which the local currency is the U.S. dollar are recorded in theCompany’s Consolidated Statement of Operations.
Software Development Costs
Eligible software development costs are capitalized upon the establishment of technological feasibility,which is defined as being equivalent to completion of a beta-phase working prototype. Total eligible softwaredevelopment costs have not been material to date.
Costs related to internally developed software and software purchased for internal use are capitalized. As ofOctober 30, 2010 and October 31, 2009 a net book value of $3.7 million and $5.4 million, respectively, related tothe purchase and subsequent implementation and upgrade of the Company’s enterprise wide integrated businessinformation system was included in “Property and equipment, net.” These costs are being depreciated over theestimated useful lives of five to seven years.
Advertising Costs
The Company expenses all advertising costs as incurred. Advertising costs were $7.9 million, $5.9 millionand $8.4 million for the years ended October 30, 2010, October 31, 2009 and October 25, 2008, respectively.
Capitalized Interest Costs
Interest costs related to major construction projects, specifically the Company campus project, arecapitalized until the asset is ready for service. Capitalized interest is calculated by multiplying the weighted-average interest rate on the Senior Secured Credit Facility, Senior Secured Notes and convertible debt by thequalifying costs. Interest capitalized may not exceed gross interest expense for the period. As the qualifying assetis moved to the depreciation and amortization pool, the related capitalized interest is also transferred and isamortized over the useful life of the related asset. Interest costs of $7.8 million, $9.1 million and $1.0 millionwere capitalized for the years ended October 30, 2010, October 31, 2009 and October 25, 2008, respectively.Construction of the Company campus was completed in the third quarter of fiscal year 2010.
Income Taxes
The Company accounts for income taxes under the assets and liabilities method. Under this method, theCompany recognizes income tax expense for the amount of taxes payable or refundable for the current year.Deferred tax assets and liabilities are recognized for the expected tax consequences of temporary differencesbetween the tax bases of assets and liabilities and their reported amounts, along with net operating loss carryforwards and credit carry forwards. A valuation allowance is recognized to the extent that it is more likely thannot that the tax benefits will not be realized. For additional discussion, see Note 15, “Income Taxes,” of the Notesto Consolidated Financial Statements.
The Company adopted the provisions of ASC 740-10 Income Taxes (“ASC 740-10”), effective at thebeginning of fiscal year 2008. ASC 740-10 prescribes a recognition threshold and measurement attribute forfinancial statement purposes of tax positions taken or expected to be taken on a tax return. Recognition of a taxposition is determined when it is more likely than not that a tax position will be sustained upon examination,including resolution of any related appeals or litigation processes. Upon its adoption of ASC 740-10, the Company
77

BROCADE COMMUNICATIONS SYSTEMS, INC.
NOTES TO CONSOLIDATED FINANCIAL STATEMENTS—(Continued)
applied the provisions of ASC 740-10 to all income tax positions. The cumulative effect of applying the provisionsof ASC 740-10 in the amount of $3.1 million has been reported as an adjustment to the opening balance ofaccumulated deficit on the Company’s Consolidated Balance Sheet as of the beginning of fiscal year 2008.
Computation of Net Income (Loss) per Share
Basic net income (loss) per share is computed using the weighted-average number of common sharesoutstanding during the period, less shares subject to repurchase. Diluted net income per share is computed using theweighted-average number of common shares outstanding and potentially dilutive common shares outstanding duringthe period that have a dilutive effect on earnings per share. Potentially dilutive common shares result from theassumed exercise of outstanding stock options, assumed vesting of outstanding restricted stock units and awards,assumed issuance of stock under the employee stock purchase plan using the treasury stock method, and the assumedconversion of outstanding convertible subordinated debt using the if-converted method. In a net loss position, dilutednet loss per share is computed using only the weighted-average number of common shares outstanding during theperiod, less shares subject to repurchase, as any additional common shares would be antidilutive.
Stock-Based Compensation
The Company accounts for employee equity awards under the fair value method. Accordingly, the Companymeasures stock-based compensation at the grant date based on the fair value of the award. The fair value of stockoptions and the Employee Stock Purchase Plan (“ESPP”) is estimated using the Black-Scholes option pricingmodel. Estimated compensation cost relating to restricted stock units is based on the fair value of the Company’scommon stock on the date of the grant. The Company records stock-based compensation expense over thetwenty-four month offering period in connection with shares issued under its ESPP. The compensation expensefor stock-based awards is reduced by an estimate for forfeitures and is recognized over the expected term of theaward under a graded vesting method. For additional discussion, see Note 14, “Stock-Based Compensation,” ofthe Notes to Consolidated Financial Statements.
The Company accounts for the tax effects of share-based payment awards using the alternative transitionmethod, which includes simplified methods to establish the beginning balance of the additional paid-in capitalpool (“APIC Pool”) related to the tax effects of employee stock-based compensation and to determine thesubsequent impact on the APIC Pool and consolidated statement of cash flows of the tax effects of employeestock-based compensation awards.
Use of Estimates in Preparation of Consolidated Financial Statements
The preparation of consolidated financial statements and related disclosures in conformity withU.S. generally accepted accounting principles requires management to make estimates and judgments that affectthe amounts reported in the consolidated financial statements and accompanying notes. Estimates are used for,but not limited to sales allowances and programs, allowance for doubtful account, stock-based compensation,purchase price allocations, warranty obligations, inventory valuation and purchase commitments, restructuringcosts, facilities lease losses, impairment of goodwill and intangible assets, litigation, income taxes andinvestments. Actual results may differ materially from these estimates.
Recent Accounting Pronouncements
In January 2010, the FASB issued an update to ASC 820-10 Measuring Liabilities at Fair Values (“ASC820-10”). The update to ASC 820-10 requires disclosure of significant transfers in and out of Level 1 and Level 2measurements and the reasons for the transfers, and a gross presentation of activity within the Level 3
78

BROCADE COMMUNICATIONS SYSTEMS, INC.
NOTES TO CONSOLIDATED FINANCIAL STATEMENTS—(Continued)
rollforward, presenting separately information about purchases, sales issuances and settlements. The update toASC 820-10 was adopted by the Company in the second quarter of fiscal year 2010, except for the grosspresentation of the Level 3 rollforward which will be adopted by the Company in the second quarter of fiscalyear 2011. The Company does not expect the adoption of the update to ASC 820-10 to have a material impact onits financial position, results of operations, or cash flows.
In April 2010, the FASB issued an update to ASC 718 Compensation—Stock Compensation (“ASC 718”).The update to ASC 718 clarifies that a share-based payment award with an exercise price denominated in thecurrency of a market in which a substantial portion of the Company’s equity securities trades should not beconsidered to contain a condition that is not a market, performance, or service condition. Therefore, such anaward should not be classified as a liability if it otherwise qualifies as equity. The update to ASC 718 will beadopted by the Company in the first quarter of fiscal year 2012, with earlier adoption permitted. The Company iscurrently evaluating the impact of the update to ASC 718, but does not expect the adoption to have a materialimpact on its financial position, results of operations, or cash flows.
3. Acquisitions
Foundry Networks, Inc.
On December 18, 2008, the Company completed its acquisition of Foundry Networks, Inc. (“Foundry”) inaccordance with the Agreement and Plan of Merger, which the Company entered into on July 21, 2008, as wellas with Amendment No. 1 to the Agreement and Plan of Merger, which the Company entered into onNovember 7, 2008 (as amended, the “Foundry Merger Agreement”). As a result of the merger, Foundry is now awholly-owned subsidiary of the Company and was converted to a limited liability company under applicableDelaware law in the third fiscal quarter of 2009.
The Company recorded the acquisition using the purchase method of accounting and, accordingly, hasincluded the results of operations of Foundry in the accompanying Consolidated Statements of Operations fromDecember 18, 2008, the date the acquisition was completed.
The total purchase price of the Foundry acquisition was $2.8 billion and is comprised of the following (inthousands):
Amount(in thousands)
Cash tendered for shares of outstanding common stock of Foundry (1) . . . . . . . . . . . . . . . . . . . . . . . $2,506,474Fair value of stock options and awards assumed and accelerated in connection with acquisition . . . 254,312Direct transaction costs . . . . . . . . . . . . . . . . . . . . . . . . . . . . . . . . . . . . . . . . . . . . . . . . . . . . . . . . . . . . 27,395
Total purchase price . . . . . . . . . . . . . . . . . . . . . . . . . . . . . . . . . . . . . . . . . . . . . . . . . . . . . . . . . . . . . . . $2,788,181
(1) This amount includes $248.4 million paid by the Company to acquire 14.0 million shares of Foundrycommon stock in the open market before the consummation of the acquisition, net of $3.5 million individends received.
Direct transaction costs include investment banking, legal and accounting fees and other external costsdirectly related to the acquisition.
The Company allocated the total purchase consideration to the net assets acquired and liabilities assumed,including identifiable intangible assets, based on their respective fair values at the acquisition date, resulting ininitial goodwill of approximately $1,475.6 million, which is not deductible for income tax purposes. Goodwill
79
BROCADE COMMUNICATIONS SYSTEMS, INC.
NOTES TO CONSOLIDATED FINANCIAL STATEMENTS—(Continued)
represents the excess of the purchase price over the fair value of the underlying acquired net tangible andintangible assets. The factors that contributed to the recognition of goodwill included securing buyer-specificsynergies that increase revenue and profits and are not otherwise available to a marketplace participant, acquiringa talented workforce, and significant cost-saving opportunities. The allocation of the purchase price reflectsvarious estimates and analyses.
The Company also allocated $26.9 million to in-process research and development (“IPR&D”) which wascharged to operating expense at the consummation of the business combination. The value assigned to theFoundry IPR&D was determined by estimating costs to develop the purchased IPR&D into commercially viableproducts, estimating the resulting net cash flows from the projects when completed, and discounting the net cashflows to their present values. The revenue estimates used in the net cash flow forecasts were based on estimatesof relevant market sizes and growth factors, expected trends in technology, and the nature and expected timing ofnew product introductions by Foundry and its competitors.
The rate utilized to discount the net cash flows to their present values was based on Foundry’s weighted-average cost of capital. The weighted-average cost of capital was adjusted to reflect the difficulties anduncertainties in completing each project and thereby achieving technological feasibility, the percentage ofcompletion of each project, anticipated market acceptance and penetration, market growth rates, and risks relatedto the impact of potential changes in future target markets. Based on these factors, a discount rate of 12.5% wasdeemed appropriate for valuing the IPR&D. The estimates used in valuing IPR&D were based upon assumptionsbelieved to be reasonable but which are inherently uncertain and unpredictable.
Of the total purchase price, approximately $392.3 million has been allocated to amortizable intangible assetsacquired. The amortizable intangible assets are being amortized on a straight-line basis over their estimateduseful lives as follows:
Amount(in thousands)
Weighted-Average
Useful Life(in years)
Developed products technology . . . . . . . . . . . . . . . . . . $191,300 5.00Customer relationships . . . . . . . . . . . . . . . . . . . . . . . . . $194,500 5.00Order backlog . . . . . . . . . . . . . . . . . . . . . . . . . . . . . . . . $ 6,500 0.25
The following unaudited pro forma financial information for the twelve months ended October 30, 2009 andOctober 25, 2008 presents a summary of the results of operations of the Company assuming the acquisition ofFoundry occurred at the beginning of the period presented. The unaudited pro forma financial information ispresented for informational purposes only and is not indicative of the results of operations that would have beenachieved if the merger had taken place at the beginning of each of the periods presented, nor is it indicative offuture operating results (in thousands, except per share amounts):
Twelve MonthsEnded
Twelve MonthsEnded
October 31,2009 (1) (3)
October 25,2008 (2) (3)
Total net revenues . . . . . . . . . . . . . . . . . . . . . . . . . . . $2,029,973 $2,112,229Pretax loss . . . . . . . . . . . . . . . . . . . . . . . . . . . . . . . . . (60,903) (43,226)Net income (loss) . . . . . . . . . . . . . . . . . . . . . . . . . . . (55,070) 156,733Basic net income (loss) per share . . . . . . . . . . . . . . . (0.14) 0.42Diluted net income (loss) per share . . . . . . . . . . . . . . $ (0.14) $ 0.40
(1) The unaudited pro forma financial results for the twelve months ended October 31, 2009 include Brocade’shistorical results for the twelve months ended October 31, 2009, which include Foundry’s results subsequent
80
BROCADE COMMUNICATIONS SYSTEMS, INC.
NOTES TO CONSOLIDATED FINANCIAL STATEMENTS—(Continued)
to December 18, 2008, and Foundry’s historical results for the period October 26, 2008 to December 18,2008, including goodwill and acquisition-related intangible assets impairment of $53.3 million, amortizationfor acquired intangible assets, elimination of IPR&D charge and acquisition-related fees, and related taxeffects.
(2) The unaudited pro forma financial results for the twelve months ended October 25, 2008 include Brocade’shistorical results for the twelve months ended October 25, 2008 and Foundry’s historical results for the threemonths ended December 31, 2007 and nine months ended September 30, 2008, including provision for classaction lawsuit of $160.0 million, release of the valuation allowance of $174.4 million, amortization foracquired intangible assets, adjustment to interest expense, and related tax effects.
(3) Brocade’s historical results for the twelve months ended October 31, 2009 and October 25, 2008 reflect theincremental effects on individual line items on the Consolidated Statement of Operation as a result ofretrospectively applying the new accounting standard for convertible debt instruments (see Note 2,“Summary of Significant Accounting Policies,” of the Notes to Consolidated Financial Statements).
Strategic Business Systems, Inc.
On March 17, 2008, the Company completed its acquisition of Strategic Business Systems, Inc. (“SBS”), aprivately held provider of IT professional services for medium-size and large enterprises in both the commercialand federal government sectors. This acquisition expanded the Company’s professional service offerings and wasconsistent with its goal of building an end-to-end services portfolio.
The results of operations of SBS are included in the accompanying Consolidated Statements of Operationsfrom the date of the acquisition. The Company does not consider the acquisition of SBS to be material to itsresults of operations and is therefore not presenting pro forma financial information of operations.
4. Goodwill and Intangible Assets
The following table summarizes goodwill activity by reportable segment during the fiscal year endedOctober 30, 2010 and October 31, 2009 (in thousands):
DataStorage
EthernetProducts
GlobalServices Total
Balance at October 25, 2008Goodwill (1) . . . . . . . . . . . . . . . . . . . . . . . . . . . . . . . . . . . . . . . $184,272 $ 45,832 $ 39,814 $ 269,918Accumulated impairment losses . . . . . . . . . . . . . . . . . . . . . . . . — — — —
$184,272 $ 45,832 $ 39,814 $ 269,918Acquisition of Foundry . . . . . . . . . . . . . . . . . . . . . . . . . . . . . . . — 1,357,855 117,748 1,475,603Goodwill impairment (2) . . . . . . . . . . . . . . . . . . . . . . . . . . . . . . — (45,832) — (45,832)Tax and other adjustments (3) . . . . . . . . . . . . . . . . . . . . . . . . . . (7,283) (31,999) (473) (39,755)Balance at October 31, 2009Goodwill . . . . . . . . . . . . . . . . . . . . . . . . . . . . . . . . . . . . . . . . . . $176,989 $1,371,688 $157,089 $1,705,766Accumulated impairment losses . . . . . . . . . . . . . . . . . . . . . . . . — (45,832) — (45,832)
176,989 1,325,856 157,089 1,659,934Tax and other adjustments (4) . . . . . . . . . . . . . . . . . . . . . . . . . . — (14,984) — (14,984)Balance at October 30, 2010Goodwill . . . . . . . . . . . . . . . . . . . . . . . . . . . . . . . . . . . . . . . . . . $176,989 $1,356,704 $157,089 $1,690,782Accumulated impairment losses . . . . . . . . . . . . . . . . . . . . . . . . — (45,832) — (45,832)
$176,989 $1,310,872 $157,089 $1,644,950
81
BROCADE COMMUNICATIONS SYSTEMS, INC.
NOTES TO CONSOLIDATED FINANCIAL STATEMENTS—(Continued)
(1) As adjusted due to adoption of update to ASC 470-20 relating to accounting for convertible debtinstruments. See Note 2, “Summary of Significant Accounting Policies,” of the Notes to ConsolidatedFinancial Statements.
(2) During the second quarter of fiscal year 2009, the Company made a decision to no longer offer its suite ofFiles products and concluded that the fair value of the Files reporting unit was less than its carrying amount.The fair value of the Files business was determined using comparable companies’ data. The Companyconducted the second step of the goodwill impairment test and determined that all of the Files goodwill wasimpaired. Accordingly, the Company recorded a goodwill impairment charge of $45.8 million for the threemonths ended May 2, 2009.
(3) The goodwill adjustment of $39.8 million was primarily a result of the realization of deferred tax assets andtax benefit of stock options exercised from acquired companies and includes $1.7 million of Foundrypurchase accounting adjustments, and the adjustment resulting from the adoption of a new accountingstandard for its convertible debt from acquired companies. See Note 2, “Summary of Significant AccountingPolicies,” of the Notes to Consolidated Financial Statements.
(4) The goodwill adjustment of $15.0 million was primarily a result of realization of deferred tax assets and taxbenefit of stock options exercised from acquired companies, partially offset by the impact of adoption of thenew accounting standard for its convertible debt from acquired companies.
The Company conducts its goodwill impairment test annually, as of the first day of the second fiscal quarter,or whenever events or changes in facts and circumstances indicate that the fair value of the reporting unit may beless than its carrying amount. For the fiscal year 2010 annual goodwill impairment test, the Company used theincome approach, the market approach, or a combination thereof, to determine each reporting unit’s fair value.The income approach provides an estimate of fair value based on discounted expected future cash flows. Themarket approach provides an estimate of fair value using various price or market multiples applied to thereporting unit’s operating results and then applying an appropriate control premium. During the fiscal year 2010annual goodwill impairment test under the first step, the Company used a combination of approaches to estimateeach reporting unit’s fair value, but relied primarily on the income approach results, using management’s recent,post-recession cash flow projections for each reporting unit and risk-adjusted discount rates. The Companybelieves that the income approach is more representative of a reporting unit’s fair value compared to marketapproach results due to conditions of current financial markets and other market factors.
Determining the fair value of a reporting unit or an intangible asset requires judgment and involves the useof significant estimates and assumptions. The Company based its fair value estimates on assumptions it believesto be reasonable, but that are unpredictable and inherently uncertain. Estimates and assumptions with respect tothe determination of the fair value of its reporting units using the income approach include, among other inputs:
• The Company’s operating forecasts;
• Revenue growth rates; and
• Risk-commensurate discount rates and costs of capital.
The Company’s estimates of revenues and costs are based on historical data, various internal estimates and avariety of external sources, and are developed as part of our regular long-range planning process. The controlpremium used in market or combined approaches is determined by considering control premiums offered as partof the acquisitions that have occurred in the reporting units’ comparable market segments. Based on goodwillimpairment analysis results during the second fiscal quarter of 2010, the Company determined that noimpairment needed to be recorded. During the fiscal year ended October 30, 2010, there were no facts andcircumstances that indicated that the fair value of the reporting units may be less than their current carryingamount.
82

BROCADE COMMUNICATIONS SYSTEMS, INC.
NOTES TO CONSOLIDATED FINANCIAL STATEMENTS—(Continued)
The Company records impairment losses on long-lived assets used in operations when indications ofimpairment are present and the undiscounted cash flows estimated to be generated by those assets are less thanthe assets’ carrying amounts. If such assets are considered to be impaired, the impairment charge recognized isthe amount by which the carrying amount of the assets exceeds the fair value of the assets. As a result of theimpairment of the Files reporting unit in fiscal year 2009, the Company performed an impairment analysis forlong-lived Files assets, including its intangible assets. The analysis indicated that all of the intangible assetsassociated with the Files business were not recoverable. As a result, the Company recorded an acquisition-relatedintangible assets impairment charge associated with the Files business of $7.5 million during the second quarterof fiscal year 2009.
Intangible assets other than goodwill are amortized over the following estimated remaining useful lives,unless the Company has determined these lives to be indefinite. The following tables present details of theCompany’s intangible assets (in thousands, except for weighted-average remaining useful life):
GrossCarryingValue
AccumulatedAmortization
NetCarryingValue
Weighted-Average
RemainingUseful Life(in years)
October 30, 2010Tradename . . . . . . . . . . . . . . . . . . . . . . . . . . . . . . . . . . . . . . . . . . $ 13,941 $ 11,150 $ 2,791 9.24Core/developed technology . . . . . . . . . . . . . . . . . . . . . . . . . . . . . 338,158 189,643 148,515 2.75Customer relationships . . . . . . . . . . . . . . . . . . . . . . . . . . . . . . . . . 364,981 172,287 192,694 3.23
Total intangible assets . . . . . . . . . . . . . . . . . . . . . . . . . . . . . . . . . $717,080 $373,080 $344,000 3.07
GrossCarryingValue
AccumulatedAmortization
NetCarryingValue
Weighted-Average
RemainingUseful Life(in years)
October 31, 2009Tradename . . . . . . . . . . . . . . . . . . . . . . . . . . . . . . . . . . . . . . . . . . $ 13,941 $ 9,980 $ 3,961 8.05Core/developed technology . . . . . . . . . . . . . . . . . . . . . . . . . . . . . 338,158 129,843 208,315 3.63Customer relationships . . . . . . . . . . . . . . . . . . . . . . . . . . . . . . . . . 364,981 106,385 258,596 4.13
Total intangible assets . . . . . . . . . . . . . . . . . . . . . . . . . . . . . . . . . $717,080 $246,208 $470,872 3.94
The following table presents the amortization of intangible assets included on the Consolidated Statementsof Operations (in thousands):
Fiscal Year Ended
October 30,2010
October 31,2009
October 25,2008
Cost of revenues . . . . . . . . . . . . . . . . . . . . . . . . . . . $ 61,249 $ 65,803 $37,400Operating expenses . . . . . . . . . . . . . . . . . . . . . . . . . $ 65,623 $ 68,718 $31,484
Total . . . . . . . . . . . . . . . . . . . . . . . . . . . . . . . . $126,872 $134,521 $68,884
83

BROCADE COMMUNICATIONS SYSTEMS, INC.
NOTES TO CONSOLIDATED FINANCIAL STATEMENTS—(Continued)
The following table presents the estimated future amortization of intangible assets as of October 30, 2010(in thousands):
Fiscal Year
EstimatedFuture
Amortization
2011 . . . . . . . . . . . . . . . . . . . . . . . . . . . . . . . . . . . . . . . . . . . . . . . . . . . $119,7702012 . . . . . . . . . . . . . . . . . . . . . . . . . . . . . . . . . . . . . . . . . . . . . . . . . . . 107,0622013 . . . . . . . . . . . . . . . . . . . . . . . . . . . . . . . . . . . . . . . . . . . . . . . . . . . 94,0572014 . . . . . . . . . . . . . . . . . . . . . . . . . . . . . . . . . . . . . . . . . . . . . . . . . . . 16,8162015 . . . . . . . . . . . . . . . . . . . . . . . . . . . . . . . . . . . . . . . . . . . . . . . . . . . 1,449Thereafter . . . . . . . . . . . . . . . . . . . . . . . . . . . . . . . . . . . . . . . . . . . . . . 4,846
Total . . . . . . . . . . . . . . . . . . . . . . . . . . . . . . . . . . . . . . . . . . . . . . . . . . $344,000
5. Liabilities Associated with Facilities Lease Losses
The Company reevaluates its estimates and assumptions on a quarterly basis and makes adjustments to thereserve balance if necessary. The following table summarizes the activity related to the facilities lease lossreserve, net of expected sublease income (in thousands):
Lease LossReserve
Reserve balance at October 25, 2008 . . . . . . . . . . . . . . . . . . . . . . . . . . . $ 28,429Additional reserve related to acquisition of Foundry (1) . . . . . . . . . . . . 3,224Cash payments on facilities leases . . . . . . . . . . . . . . . . . . . . . . . . . . . . . (11,273)Non-cash charges and other adjustments, net . . . . . . . . . . . . . . . . . . . . 539
Reserve balance at October 31, 2009 . . . . . . . . . . . . . . . . . . . . . . . . . . . $ 20,919Cash payments on facilities leases . . . . . . . . . . . . . . . . . . . . . . . . . . . . . (11,413)Other adjustments, net . . . . . . . . . . . . . . . . . . . . . . . . . . . . . . . . . . . . . . 470
Reserve balance at October 30, 2010 . . . . . . . . . . . . . . . . . . . . . . . . . . . $ 9,976
(1) During the year ended October 31, 2009, the Company recorded a purchase accounting adjustment of $3.2million related to estimated facilities lease losses as a result of the acquisition of Foundry, net of expectedsublease income. The Company reevaluates its estimates and assumptions on a quarterly basis and makesadjustments to the reserve balance if necessary.
Cash payments for facilities leases related to the above noted facilities lease losses will be paid over therespective lease terms through fiscal year 2017.
84
BROCADE COMMUNICATIONS SYSTEMS, INC.
NOTES TO CONSOLIDATED FINANCIAL STATEMENTS—(Continued)
6. Balance Sheet Details
The following table provides details of selected balance sheet items (in thousands):
October 30,2010
October 31,2009
Accounts Receivable:Accounts receivable . . . . . . . . . . . . . . . . . . . . . . . . . . . . . . . . . . . . . . . . . . . . . . . . . . $ 336,285 $ 310,392Allowance for doubtful accounts . . . . . . . . . . . . . . . . . . . . . . . . . . . . . . . . . . . . . . . . (1,838) (3,954)Sales allowances . . . . . . . . . . . . . . . . . . . . . . . . . . . . . . . . . . . . . . . . . . . . . . . . . . . . . (4,883) (8,619)
Total . . . . . . . . . . . . . . . . . . . . . . . . . . . . . . . . . . . . . . . . . . . . . . . . . . . . . . . . . . $ 329,564 $ 297,819
Inventories:Raw materials . . . . . . . . . . . . . . . . . . . . . . . . . . . . . . . . . . . . . . . . . . . . . . . . . . . . . . . $ 19,384 $ 4,605Finished goods . . . . . . . . . . . . . . . . . . . . . . . . . . . . . . . . . . . . . . . . . . . . . . . . . . . . . . 57,424 67,547
Total . . . . . . . . . . . . . . . . . . . . . . . . . . . . . . . . . . . . . . . . . . . . . . . . . . . . . . . . . . $ 76,808 $ 72,152
Property and equipment, net: (1)Computer equipment and software . . . . . . . . . . . . . . . . . . . . . . . . . . . . . . . . . . . . . . . $ 47,949 $ 122,219Engineering and other equipment . . . . . . . . . . . . . . . . . . . . . . . . . . . . . . . . . . . . . . . . 296,383 258,116Furniture and fixtures (2) . . . . . . . . . . . . . . . . . . . . . . . . . . . . . . . . . . . . . . . . . . . . . . 28,283 14,691Leasehold improvements . . . . . . . . . . . . . . . . . . . . . . . . . . . . . . . . . . . . . . . . . . . . . . 20,908 64,186Land and building (3) . . . . . . . . . . . . . . . . . . . . . . . . . . . . . . . . . . . . . . . . . . . . . . . . . 381,480 300,095
Subtotal . . . . . . . . . . . . . . . . . . . . . . . . . . . . . . . . . . . . . . . . . . . . . . . . . . . . . . . . 775,003 759,307Less: Accumulated depreciation and amortization . . . . . . . . . . . . . . . . . . . . . . . . . . . (235,886) (316,899)
Total . . . . . . . . . . . . . . . . . . . . . . . . . . . . . . . . . . . . . . . . . . . . . . . . . . . . . . . . . . $ 539,117 $ 442,408
Other accrued liabilities:Income taxes payable . . . . . . . . . . . . . . . . . . . . . . . . . . . . . . . . . . . . . . . . . . . . . . . . . $ 10,400 $ 3,702Accrued warranty . . . . . . . . . . . . . . . . . . . . . . . . . . . . . . . . . . . . . . . . . . . . . . . . . . . . 5,980 5,808Inventory purchase commitments . . . . . . . . . . . . . . . . . . . . . . . . . . . . . . . . . . . . . . . . 4,930 17,011Accrued sales programs . . . . . . . . . . . . . . . . . . . . . . . . . . . . . . . . . . . . . . . . . . . . . . . 26,806 13,377Accrued liabilities . . . . . . . . . . . . . . . . . . . . . . . . . . . . . . . . . . . . . . . . . . . . . . . . . . . . 53,616 53,878Other . . . . . . . . . . . . . . . . . . . . . . . . . . . . . . . . . . . . . . . . . . . . . . . . . . . . . . . . . . . . . . 6,578 11,487
Total . . . . . . . . . . . . . . . . . . . . . . . . . . . . . . . . . . . . . . . . . . . . . . . . . . . . . . . . . . $ 108,310 $ 105,263
(1) Depreciation expense was approximately $72.8 million, $59.9 million and $49.8 million for the years endedOctober 30, 2010, October 31, 2009 and October 25, 2008, respectively.
(2) Effective May 1, 2010, the Company prospectively changed the estimated useful life of its furniture from 4years to 7 years for furniture placed in service on or after that date. The Company will continue to use thestraight-line method to depreciate furniture. The change in useful life was adopted because the life of thenew furniture is estimated to be longer than previously purchased furniture. The impact to the Company’sresults of operations during the fiscal year ended October 30, 2010 was not material. Furniture placed inservice prior to May 1, 2010 will continue to be depreciated over 4 years using the straight-line method andhave a net book value of $3.0 million as of October 30, 2010. In addition, furniture and fixtures include thefollowing amounts under leases as of October 30, 2010 and October 31, 2009:
October 30,2010
October 31,2009
Cost, including taxes . . . . . . . . . . . . . . . . . . . . . . . . . . . . . . . . . . . . . . . . . . . . $10,632 $—Accumulated depreciation . . . . . . . . . . . . . . . . . . . . . . . . . . . . . . . . . . . . . . . . (615) —
Total . . . . . . . . . . . . . . . . . . . . . . . . . . . . . . . . . . . . . . . . . . . . . . . . . . . . $10,017 $—
85

BROCADE COMMUNICATIONS SYSTEMS, INC.
NOTES TO CONSOLIDATED FINANCIAL STATEMENTS—(Continued)
(3) In connection with the purchase of the property located in San Jose, California, the Company engaged athird party as development manager to manage the development and construction of improvements on theproperty. Included in “Land and building” as of October 30, 2010 and October 31, 2009 is $8.0 million thatthe Company has agreed to pay the developer on May 22, 2011 or earlier. Construction of the campus wascompleted in the third quarter of fiscal year 2010.
7. Investments
The following table summarizes the Company’s short-term investments (in thousands):
AmortizedCost
GrossUnrealized
Gains
GrossUnrealizedLosses
FairValue
October 30, 2010Corporate bonds . . . . . . . . . . . . . . . . . . . . . . . . . . . . . . . . . . . . . . . . . . $1,998 $— $— $1,998
Total . . . . . . . . . . . . . . . . . . . . . . . . . . . . . . . . . . . . . . . . . . . . . . . $1,998 $— $— $1,998
October 31, 2009Corporate bonds . . . . . . . . . . . . . . . . . . . . . . . . . . . . . . . . . . . . . . . . . . $4,678 $— $— $4,678
Total . . . . . . . . . . . . . . . . . . . . . . . . . . . . . . . . . . . . . . . . . . . . . . . $4,678 $— $— $4,678
As of October 30, 2010 and October 31, 2009, the Company had no unrealized holding gains/losses oninvestments. Net unrealized holding gains or losses on investments, if any, are included in accumulated othercomprehensive loss in the accompanying Consolidated Balance Sheets.
8. Fair Value Measurements
Fair value is the price that would be received from selling an asset or paid to transfer a liability in an orderlytransaction between market participants at the measurement date. In determining fair value for assets andliabilities required or permitted to be recorded at fair value, the Company considers the principal or mostadvantageous market in which it would transact and it considers assumptions that market participants would usewhen pricing the asset or liability. The Company applies fair value measurements for both financial andnonfinancial assets and liabilities. The Company has no nonfinancial assets and liabilities that are required to bemeasured at fair value on a recurring basis as of October 30, 2010.
In the first fiscal quarter of 2010, the Company adopted provisions of ASC 820 for the Company’snonfinancial assets and nonfinancial liabilities that are measured at fair value on a nonrecurring basis in periodssubsequent to initial recognition. ASC 820 specifies, on a prospective basis, the way in which fair valuemeasurements should be made for these assets and liabilities and additional disclosures related to themeasurements. There were no fair value measurements recorded for such assets and liabilities during fiscal year2010 since adoption.
The fair value of the Company’s financial instruments, including cash and cash equivalents, accountsreceivable, restricted cash, accounts payable and accrued liabilities, approximate cost because of their shortmaturities.
In the second fiscal quarter of 2010, the Company adopted the update to ASC 820-10, which requiresdisclosure of significant transfers in and out of Level 1 and Level 2 measurements and the reasons for thetransfers. There were no transfers of this nature during fiscal year ended October 30, 2010.
86

BROCADE COMMUNICATIONS SYSTEMS, INC.
NOTES TO CONSOLIDATED FINANCIAL STATEMENTS—(Continued)
The Company did not elect to measure any eligible financial instruments at fair value and report unrealizedgains and losses on items for which the fair value option has been elected in earnings at each subsequentreporting date.
Fair Value Hierarchy
The Company utilizes a fair value hierarchy that maximizes the use of observable inputs and minimizes theuse of unobservable inputs when measuring fair value. A financial instrument’s categorization within the fairvalue hierarchy is based upon the lowest level of input that is significant to the fair value measurement. There arethree levels of inputs that may be used to measure fair value:
Level 1
Observable inputs that reflect quoted prices in active markets for identical assets or liabilities. Brocade’sassets utilizing Level 1 inputs include money market funds.
Level 2
Inputs that reflect quoted prices for similar assets or liabilities in active markets, quoted prices for identicalassets or liabilities in less active markets, or model-derived valuations in which significant inputs are observableor can be derived principally from, or corroborated by, observable market data. Brocade’s assets and liabilitiesutilizing Level 2 inputs include corporate bonds and derivative instruments, respectively.
Level 3
Unobservable inputs that reflect the Company’s own assumptions incorporated in valuation techniques usedto determine fair value. These assumptions are required to be consistent with market participant assumptions thatare reasonably available. Brocade has no assets or liabilities utilizing Level 3 inputs.
Assets and liabilities measured at fair value on a recurring basis as of October 30, 2010 were as follows (inthousands):
Balance as ofOctober 30,
2010
Fair Value Measurements Using
Quoted Prices inActive MarketsFor IdenticalInstruments(Level 1)
Significant OtherObservable
Inputs(Level 2)
SignificantUnobservable
Inputs(Level 3)
Assets:Money market funds (1) . . . . . . . . . . . . . . . . . . . . . . $ 92,981 $92,981 $ — $—Corporate bonds . . . . . . . . . . . . . . . . . . . . . . . . . . . . 1,998 — 1,998 —Derivative assets . . . . . . . . . . . . . . . . . . . . . . . . . . . $ 6,450 $ — $6,450 $—
Total assets measured at fair value . . . . . . . . . . . . . $101,429 $92,981 $8,448 $—
(1) Money market funds are reported within “Cash and cash equivalents” on the Consolidated Balance Sheets.
87

BROCADE COMMUNICATIONS SYSTEMS, INC.
NOTES TO CONSOLIDATED FINANCIAL STATEMENTS—(Continued)
Assets and liabilities measured at fair value on a recurring basis as of October 31, 2009 were as follows (inthousands):
Balance as ofOctober 31,
2009
Fair Value Measurements Using
Quoted Prices inActive MarketsFor IdenticalInstruments(Level 1)
Significant OtherObservable
Inputs(Level 2)
SignificantUnobservable
Inputs(Level 3)
Assets:Money market funds (1) . . . . . . . . . . . . . . . . . . . . . . $104,204 $104,204 $ — $—Corporate bonds (2) . . . . . . . . . . . . . . . . . . . . . . . . . 4,678 — 4,678 —Derivative assets . . . . . . . . . . . . . . . . . . . . . . . . . . . $ 1,239 $ — $1,239 $—
Total assets measured at fair value . . . . . . . . . . . . . $110,121 $104,204 $5,917 $—
(1) Money market funds are reported within “Cash and cash equivalents” on the Consolidated Balance Sheets.(2) During fiscal year 2009, the Company transferred $4.7 million of corporate bonds from assets utilizing
Level 1 inputs to assets utilizing Level 2 inputs due to a decrease in quotable prices in an active market, aswell as a less active market for the bonds.
The Company uses a midpoint of the highest bid and lowest offering obtained from market makers to valueits corporate bonds. The Company uses observable market prices for comparable instruments to value itsderivative instruments.
9. Borrowings
Senior Secured Notes
On January 20, 2010, the Company issued $300.0 million aggregate principal amount of its 6.625% SeniorSecured Notes due 2018 at an issue price of 99.239% of the principal amount of the notes (the “2018 Notes”) and$300.0 million aggregate principal amount of its 6.875% Senior Secured Notes due 2020 at an issue price of99.114% of the principal amount of the notes (the “2020 Notes” and, together with the 2018 Notes, the “SeniorSecured Notes”), in a private placement to “qualified institutional buyers” in the United States defined inRule 144A under the Securities Act of 1933, as amended (the “Securities Act”), and outside the United Statespursuant to Regulation S under the Securities Act (the “Notes Offering”). The 2018 Notes mature on January 15,2018 and bear interest at a rate of 6.625% per annum, payable semi-annually on January 15 and July 15 of eachyear, commencing on July 15, 2010. The 2020 Notes mature on January 15, 2020 and bear interest at a rate of6.875% per annum, payable semi-annually on January 15 and July 15 of each year, commencing on July 15,2010. The Company’s obligations under the Senior Secured Notes are guaranteed by certain of the Company’sdomestic subsidiaries (the “Subsidiary Guarantors”). The obligations of the Company and the SubsidiaryGuarantors under the Senior Secured Notes and the related guarantees are secured by liens, subject to certainexceptions and permitted liens and subject to the terms of an intercreditor agreement, on all assets of theCompany and the Subsidiary Guarantors that secure any obligations under the Senior Secured Credit Facility, asdescribed below.
The Company used approximately $435.0 million of the net proceeds of the Notes Offering to prepay aportion of the outstanding term loan under the Senior Secured Credit Facility on January 20, 2010, and used theremaining net proceeds, together with cash on hand, to retire on February 16, 2010 the 2.25% subordinatedconvertible notes (“2.25% Notes”) originally issued by McDATA, a wholly owned subsidiary of Brocade.
88

BROCADE COMMUNICATIONS SYSTEMS, INC.
NOTES TO CONSOLIDATED FINANCIAL STATEMENTS—(Continued)
As of October 30, 2010, the liability associated with the 2018 Notes of $297.9 million, net of the debtdiscount of $2.1 million, and the liability associated with the 2020 Notes of $297.5 million, net of the debtdiscount of $2.5 million, are together reported as “Senior Secured Notes,” on the Consolidated Balance Sheets.
Debt issuance costs totaling $11.0 million associated with the Senior Secured Notes are classified entirely aslong-term and have been capitalized as deferred financing costs, with $0.7 million amortized as of October 30,2010. As of October 30, 2010, deferred financing costs were $10.3 million and are reported within “Other assets”on the Consolidated Balance Sheets. The deferred financing costs of the 2018 Notes and the 2020 Notes arebeing amortized using the effective interest method over the eight-year and ten-year term of the debt,respectively. No payments were made towards the principal of the Senior Secured Notes during the fiscal yearended October 30, 2010. As of October 30, 2010, the approximate fair value of the Company’s senior securednotes was $645.4 million, estimated based on broker trading prices.
The 2018 Notes were issued pursuant to an indenture, dated as of January 20, 2010 (the “2018 Indenture”),among the Company, the Subsidiary Guarantors and Wells Fargo Bank, National Association, as trustee. The2020 Notes were issued pursuant to an indenture, dated as of January 20, 2010 (the “2020 Indenture” and,together with the 2018 Indenture, the “Indentures”), among the Company, the Subsidiary Guarantors and WellsFargo Bank, National Association, as trustee.
On or after January 15, 2013, the Company may redeem all or a part of the 2018 Notes at the redemptionprices set forth in the 2018 Indenture, plus accrued and unpaid interest and special interest, if any, to theapplicable redemption date. In addition, at any time prior to January 15, 2013, the Company may, on one or morethan one occasion, redeem some or all of the 2018 Notes at any time at a redemption price equal to 100% of theprincipal amount of the 2018 Notes redeemed, plus a “make-whole” premium as of, and accrued and unpaidinterest and special interest, if any, to the applicable redemption date. On or after January 15, 2015, the Companymay redeem all or a part of the 2020 Notes at the redemption prices set forth in the 2020 Indenture, plus accruedand unpaid interest and special interest, if any, to the applicable redemption date. In addition, at any time prior toJanuary 15, 2015, the Company may, on one or more than one occasion, redeem some or all of the 2020 Notes atany time at a redemption price equal to 100% of the principal amount of the 2020 Notes redeemed, plus a “make-whole” premium as of, and accrued and unpaid interest and special interest, if any, to the applicable redemptiondate. At any time prior to January 15, 2013, the Company may also redeem up to 35% of the aggregate principalamount of the 2018 Notes and 2020 Notes, using the proceeds of certain qualified equity offerings, at theredemption prices set forth in the 2018 Indenture and the 2020 Indenture, respectively.
If the Company experiences specified change of control triggering events, it must offer to repurchase theSenior Secured Notes at a repurchase price equal to 101% of the principal amount of the Senior Secured Notesrepurchased, plus accrued and unpaid interest and special interest, if any, to the applicable repurchase date. If theCompany or its subsidiaries sell assets under certain specified circumstances, the Company must offer torepurchase the Senior Secured Notes at a repurchase price equal to 100% of the principal amount of the SeniorSecured Notes repurchased, plus accrued and unpaid interest and special interest, if any, to the applicablerepurchase date.
Each of the Indentures contains covenants that, among other things, restrict the ability of the Company andits restricted subsidiaries to:
• pay dividends, make investments or make other restricted payments;
• incur additional indebtedness;
• sell assets;
89

BROCADE COMMUNICATIONS SYSTEMS, INC.
NOTES TO CONSOLIDATED FINANCIAL STATEMENTS—(Continued)
• enter into transactions with affiliates;
• incur liens;
• permit consensual encumbrances or restrictions on the Company’s restricted subsidiaries’ ability to paydividends or make certain other payments to the Company;
• consolidate, merge, sell or otherwise dispose of all or substantially all of the Company’s or itsrestricted subsidiaries’ assets; and
• designate subsidiaries as unrestricted.
These covenants are subject to a number of other limitations and exceptions set forth in the Indentures. TheCompany was in compliance with all applicable covenants as of October 30, 2010.
Each of the Indentures provides for customary events of default, including, but not limited to, cross defaultsto specified other debt of the Company and its subsidiaries. In the case of an event of default arising fromspecified events of bankruptcy or insolvency, all outstanding Senior Secured Notes will become due and payableimmediately without further action or notice. If any other event of default under either indenture occurs or iscontinuing, the applicable trustee or holders of at least 25% in aggregate principal amount of the then outstanding2018 Notes or 2020 Notes, as applicable, may declare all of the 2018 Notes or 2020 Notes, respectively, to bedue and payable immediately.
In connection with the issuance of the Senior Secured Notes, the Company and the Subsidiary Guarantorsalso entered into registration rights agreements with the initial purchasers relating to each series of the SeniorSecured Notes. Under the terms of these registration rights agreements, with respect to each series of the SeniorSecured Notes, the Company and the Subsidiary Guarantors are required to use commercially reasonable effortsto file with the SEC a registration statement relating to an offer to exchange the applicable series of notes for anissue of SEC-registered notes (the “Exchange Notes”) with terms identical to the applicable series of the SeniorSecured Notes (except that the Exchange Notes will not be subject to restrictions on transfer or to any increase inannual interest rate) and maintain the effectiveness of such registration statement until 180 days after the closingof the applicable exchange offer. In addition, the Company and the Subsidiary Guarantors were required toconsummate each exchange offers within 60 days after the effective date of the registration statement and in theevent the Company and the Subsidiary Guarantors failed to consummate an exchange offer by January 20, 2011,additional interest up to 1.0% per annum would have been payable on the applicable series of Senior SecuredNotes. The Company and the Subsidiary Guarantors filed a registration statement on Form S-4 relating to such anoffer to exchange on June 18, 2010, the registration statement was declared effective by the SEC on August 24,2010, and both exchange offers were consummated on October 1, 2010.
Senior Secured Credit Facility
On October 7, 2008, the Company entered into a credit agreement with the following lenders, Bank ofAmerica, N.A., Morgan Stanley Senior Funding, Inc., Banc of America Securities LLC, HSBC Bank USANational Association and Keybank National Association. The credit agreement provides for (i) a five-year$1,100.0 million term loan facility and (ii) a five-year $125.0 million revolving credit facility, which includes a$25.0 million swing line loan subfacility and a $25.0 million letter of credit subfacility. On January 8, 2010, theCompany entered into an amendment and waiver to the credit agreement, among other things, (i) to increaseflexibility under certain financial and other covenants, (ii) to permit the Company to issue additional seniorindebtedness in aggregate principal amount outstanding at any time of up to $600.0 million, (iii) to permit theCompany to issue additional subordinated indebtedness in aggregate principal amount outstanding at any time of
90

BROCADE COMMUNICATIONS SYSTEMS, INC.
NOTES TO CONSOLIDATED FINANCIAL STATEMENTS—(Continued)
up to $600.0 million, and (iv) to permit the Company to sell its accounts receivable and lease receivables for fairmarket value with the aggregate amount paid for such receivables, net of collections, not at any time exceeding$125.0 million. On January 20, 2010, the Company closed its offering of its 2018 Notes and its 2020 Notes asdescribed above. The Company applied approximately $435.0 million of the proceeds of this offering to prepaythe term loan, whereupon the amendment and waiver to credit agreement became effective.
The net proceeds of the term loan facility were used to finance a portion of the Company’s acquisition ofFoundry. In addition to the term loan facility, during the year ended October 31, 2009, the Company drew $14.1million from the $125.0 million revolving credit facility to finance a small portion of the merger. The Companymay draw additional proceeds from the revolving credit facility in the future for ongoing working capital andother general corporate purposes. The term loan facility and revolving credit facility are referred to together asthe “Senior Secured Credit Facility.” On April 30, 2010, the Company fully paid off the principal of therevolving credit facility for an approximate total amount of $14.1 million.
Loans under the Senior Secured Credit Facility bear interest, at the Company’s option, at a rate equal toeither the London Interbank Offered Rate (“LIBOR rate”), plus an applicable margin equal to 4.0% per annum orthe prime lending rate, plus an applicable margin equal to 3.0% per annum. The applicable margin with respectto revolving loans is subject to adjustment based on the Company’s consolidated senior secured leverage ratio, asdefined in the credit agreement. The LIBOR rate floor is 3.0% per annum and the prime lending rate floor is4.0% per annum, in each case, for the life of the Senior Secured Credit Facility. For the fiscal year endedOctober 30, 2010, the weighted-average interest rate on the term loan was 7.0%.
The Company is permitted to make voluntary prepayments at any time (without payment of a premium,other than in the case of a repricing transaction in respect of the term loan facility), and is required to makemandatory prepayments on the term loan (without payment of a premium) with (i) net cash proceeds fromnon-ordinary course asset sales (subject to reinvestment rights and other exceptions), (ii) net cash proceeds fromissuances of debt (other than certain permitted debt), and (iii) casualty proceeds and condemnation awards(subject to reinvestment rights and other exceptions). The Company is required to pay quarterly installments onthe term loan equal to an aggregate annual amount of 5% of the original principal amount thereof in the first andsecond year, 10% in the third year, 20% in the fourth year and 60% in the fifth year, with any remaining balancepayable on the final maturity date of the term loan. Upon a repricing of the term loan (including through arefinancing) that results in the weighted-average yield or applicable rate of such term loan immediately after suchrepricing to be lower than such yield or rate immediately prior to such repricing, a 2.0% premium is payableduring the first year following the closing and a 1.0% premium is payable during the second year following theclosing.
Debt issuance costs totaling $31.6 million associated with financing the acquisition have been capitalized asdeferred financing costs, with $14.3 million amortized as of October 30, 2010. As of October 30, 2010 andOctober 31, 2009, deferred financing costs were $17.3 million and $21.4 million, respectively, and are reportedwithin “Other assets” on the Consolidated Balance Sheets. The deferred financing costs are being amortizedusing the effective interest method over the five-year term of the debt. During the twelve months endedOctober 30, 2010, the Company paid $583.0 million towards the principal of the term loan, $560.0 million ofwhich were voluntary prepayments. As of October 30, 2010, the approximate fair value of the Company’s seniorsecured credit facility was $354.5 million, estimated based on broker trading prices.
The obligations of the Company and its subsidiary guarantors under the Senior Secured Credit Facility andthe related guarantees there under are secured, subject to customary permitted liens and other agreed uponexceptions, by (i) a first priority pledge of all of the equity interests of each of the Company’s direct and indirect
91
BROCADE COMMUNICATIONS SYSTEMS, INC.
NOTES TO CONSOLIDATED FINANCIAL STATEMENTS—(Continued)
subsidiaries and (ii) a perfected first priority interest in and mortgages on all tangible and intangible assets of theCompany and each subsidiary guarantor, except, in the case of a foreign subsidiary, to the extent such pledgewould be prohibited by applicable law or would result in materially adverse tax consequences (limited, in thecase of a first-tier foreign subsidiary, to 65% of the voting stock and 100% of the non-voting stock of such first-tier foreign subsidiary). In addition, the term loan has not been registered with the SEC as of October 30, 2010.
The credit agreement contains customary representations and warranties and customary affirmative andnegative covenants applicable to the Company and its subsidiaries, including, among other things, restrictions onliens, indebtedness, investments, fundamental changes, dispositions, capital expenditures, prepayment of otherindebtedness, redemption or repurchase of subordinated indebtedness, share repurchases, dividends and otherdistributions. The credit agreement contains financial covenants that require the Company to maintain aminimum consolidated fixed charge coverage ratio, a maximum consolidated leverage ratio and a maximumconsolidated senior secured leverage ratio, each as defined in the credit agreement and described further below.The credit agreement also includes customary events of default, including cross-defaults on the Company’smaterial indebtedness and change of control. The Company was in compliance with all applicable covenants asof October 30, 2010 and October 31, 2009.
Covenant Compliance
Under the Senior Secured Credit Facility and the associated indentures, certain limitations, restrictions anddefaults could occur if the Company is not able to satisfy and remain in compliance with specified financialratios.
Consolidated Earnings Before Interest, Taxes, Depreciation and Amortization (“EBITDA”), as defined inthe credit agreement, is used to determine the Company’s compliance with certain covenants in the SeniorSecured Credit Facility. Consolidated EBITDA is defined as:
• Consolidated net income
Plus:
• Consolidated interest charges;
• Provision for federal, state, local and foreign income taxes;
• Depreciation and amortization expense;
• Fees, costs and expenses incurred on or prior to the closing date in connection with the acquisition andthe financing thereof;
• Any cash restructuring charges and integration costs in connection with the merger, in an aggregateamount not to exceed $75.0 million;
• Non-cash restructuring charges incurred in connection with the acquisition, all as approved by Banc ofAmerica Securities LLC and Morgan Stanley Senior Funding, Inc.;
• Other non-recurring expenses reducing consolidated net income which do not represent a cash item insuch period or future periods;
• Any non-cash stock-based compensation expense; and
• Legal fees associated with the indemnification obligations for the benefit of former officers anddirectors in connection with Brocade’s historical stock option litigation;
92

BROCADE COMMUNICATIONS SYSTEMS, INC.
NOTES TO CONSOLIDATED FINANCIAL STATEMENTS—(Continued)
Minus:
• Federal, state, local and foreign income tax credits; and
• All non-cash items increasing consolidated net income.
In addition, the Company must comply with the following financial covenants as noted below:
Consolidated Fixed Charge Coverage Ratio
Consolidated fixed charge coverage ratio means, at any date of determination, the ratio of(a) (i) consolidated EBITDA (excluding interest expense attributable to the campus sale-leaseback), plus(ii) rentals payable under leases of real property, less (iii) the aggregate amount of all capital expenditures to(b) consolidated fixed charges; provided that, for purposes of calculating the consolidated fixed charge coverageratio for any period ending prior to the first anniversary of the closing date, consolidated interest charges shall bean amount equal to actual consolidated interest charges from the closing date through the date of determinationmultiplied by a fraction the numerator of which is 365 and the denominator of which is the number of days fromthe closing date through the date of determination.
In accordance with the amendment and waiver to the credit agreement, the Company has agreed that it willnot permit the consolidated fixed charge coverage ratio as of the end of any fiscal quarter during any period setforth below to be less than the ratio set forth below opposite such period:
Four Fiscal Quarters Ending During Period:
Minimum ConsolidatedFixed ChargeCoverage Ratio
Closing date through October 31, 2009 . . . . . . . . . . . . . . . . . . . . . . . . 1.25:1.00November 1, 2009 through October 30, 2010 . . . . . . . . . . . . . . . . . . . 1.25:1.00October 31, 2010 through October 29, 2011 . . . . . . . . . . . . . . . . . . . . 1.50:1.00October 30, 2011 through October 27, 2012 . . . . . . . . . . . . . . . . . . . . 1.75:1.00October 28, 2012 and thereafter . . . . . . . . . . . . . . . . . . . . . . . . . . . . . . 1.75:1.00
Consolidated Leverage Ratio
Consolidated leverage ratio means, as of any date of determination, the ratio of (a) consolidated fundedindebtedness as of such date to (b) consolidated EBITDA for the measurement period ending on such date.
In accordance with the amendment and waiver to the credit agreement, the Company has agreed that it willnot permit the consolidated leverage ratio at any time during any period set forth below to be greater than theratio set forth below opposite such period:
Four Fiscal Quarters Ending During Period:Maximum Consolidated
Leverage Ratio
Closing date through October 31, 2009 . . . . . . . . . . . . . . . . . . . . . . . . 4.25:1.00November 1, 2009 through October 30, 2010 . . . . . . . . . . . . . . . . . . . 3.75:1.00October 31, 2010 through October 29, 2011 . . . . . . . . . . . . . . . . . . . . 3.00:1.00October 30, 2011 through October 27, 2012 . . . . . . . . . . . . . . . . . . . . 2.75:1.00October 28, 2012 and thereafter . . . . . . . . . . . . . . . . . . . . . . . . . . . . . . 2.75:1.00
93

BROCADE COMMUNICATIONS SYSTEMS, INC.
NOTES TO CONSOLIDATED FINANCIAL STATEMENTS—(Continued)
Consolidated Senior Secured Leverage Ratio
Consolidated senior secured leverage ratio means, as of any date of determination, the ratio of(a) consolidated funded indebtedness as of such date, minus, without duplication, all unsecured seniorsubordinated or subordinated indebtedness of Brocade or its subsidiaries on a consolidated basis as of such date(including the McDATA convertible subordinated debt prior to being retired on February 16, 2010), to(b) consolidated EBITDA for the measurement period ending on such date.
In accordance with the amendment and waiver to the credit agreement, the Company has agreed that it willnot permit the consolidated senior secured leverage ratio at any time during any period set forth below to begreater than the ratio set forth below opposite such period:
Four Fiscal Quarters Ending During Period:
Maximum ConsolidatedSenior SecuredLeverage Ratio
Closing date through October 31, 2009 . . . . . . . . . . . . . . . . . . . . . . . . 2.30:1.00November 1, 2009 through October 30, 2010 . . . . . . . . . . . . . . . . . . . 2.50:1.00October 31, 2010 through October 29, 2011 . . . . . . . . . . . . . . . . . . . . 2.50:1.00October 30, 2011 through October 27, 2012 . . . . . . . . . . . . . . . . . . . . 2.25:1.00October 28, 2012 and thereafter . . . . . . . . . . . . . . . . . . . . . . . . . . . . . . 2.00:1.00
Convertible Subordinated Debt
On January 29, 2007, effective upon the consummation of the merger with McDATA, the Company fullyand unconditionally guaranteed and became a co-obligor on the 2.25% Notes of McDATA. The 2.25% Noteswere convertible into McDATA’s Class A common stock at a conversion rate of 93.3986 shares per $1,000principal amount of notes (aggregate of approximately 16.1 million shares) at any time prior to February 15,2010, subject to adjustments. Pursuant to Brocade’s merger agreement with McDATA, at the effective time ofthe merger, each outstanding share of McDATA’s Class A common stock, $0.01 par value per share, wasconverted into the right to receive 0.75 of a share of Brocade’s common stock, $0.001 par value per share,together with cash in lieu of fractional shares. Concurrent with the issuance of the 2.25% Notes, McDATAentered into share option transactions using approximately $20.5 million of net proceeds. As part of these shareoption transactions, McDATA purchased options that cover approximately 12.1 million shares of common stock,at a strike price of $14.28. McDATA also sold options that cover approximately 12.7 million shares of commonstock, at a strike price of $20.11. The net cost of the share option transactions was recorded against additionalpaid-in capital. On February 16, 2010, the Company fully paid off the principal of the 2.25% Notes for a totalamount of $172.5 million.
In thousands
As ofOctober 30,
2010
As ofOctober 31,
2009
Outstanding gross principal . . . . . . . . . . . . . . . . . . . . . . . . . . . . . . . . . . . . . . . $— $172,500Net carrying amount (2) . . . . . . . . . . . . . . . . . . . . . . . . . . . . . . . . . . . . . . . . . $— $169,332Unamortized discount (1) (2) . . . . . . . . . . . . . . . . . . . . . . . . . . . . . . . . . . . . . $— $ 3,168Equity component carrying amount (2) . . . . . . . . . . . . . . . . . . . . . . . . . . . . . $— $ 29,188
(1) The remaining amortization period for the convertible subordinated debt was approximately 107 days as ofOctober 31, 2009.
(2) As adjusted due to changes to the accounting for convertible debt instruments. See Note 2, “Summary ofSignificant Accounting Policies,” of the Notes to Consolidated Financial Statements, for additionalinformation.
94

BROCADE COMMUNICATIONS SYSTEMS, INC.
NOTES TO CONSOLIDATED FINANCIAL STATEMENTS—(Continued)
The 2.25% Notes paid a fixed rate of interest semiannually. The Company capitalized a portion of theinterest associated with this debt during the periods presented. In addition, the effective interest rate for the2.25% Notes is 8.63% for the fiscal years ended October 31, 2009 and for fiscal year 2010 for the period throughFebruary 15, 2010 when the convertible subordinated debt was due. The amount of interest cost recognizedrelating to both the contractual interest coupon and amortization of the discount on the liability component of the2.25% Notes was as follows:
Fiscal Year Ended
In thousandsOctober 30,
2010October 31,
2009October 25,
2008
Interest expense . . . . . . . . . . . . . . . . . . . . . . . . . . . . . $4,305 $14,057 $13,224
10. Commitments and Contingencies
Operating Leases
The Company leases certain facilities and certain equipment under various operating agreements expiringthrough November 2020. In connection with its facilities lease agreements, the Company has signedunconditional, irrevocable letters of credit totaling $0.4 million as security for the leases.
Total rent expense was approximately $30.0 million in fiscal year 2010, $30.2 million in fiscal year 2009and $20.0 million in fiscal year 2008, net of releases in facilities lease loss reserve, as well as sublease income, of$12.5 million, $13.9 million and $9.6, respectively. Future minimum lease payments under all non-cancelableoperating leases as of October 30, 2010 total $60.8 million, net of contractual sublease income of $39.5 million.In addition to base rent, many of the facilities lease agreements require that the Company pay a proportionalshare of the respective facilities’ operating expenses.
Future minimum lease payments under all non-cancelable operating leases as of October 30, 2010,excluding the contractual sublease income stated above, are as follows (in thousands):
Fiscal YearOperatingLeases
2011 . . . . . . . . . . . . . . . . . . . . . . . . . . . . . . . . . . . . . . . . . . . . . . . . . . . . $ 28,0622012 . . . . . . . . . . . . . . . . . . . . . . . . . . . . . . . . . . . . . . . . . . . . . . . . . . . . 17,0982013 . . . . . . . . . . . . . . . . . . . . . . . . . . . . . . . . . . . . . . . . . . . . . . . . . . . . 13,6302014 . . . . . . . . . . . . . . . . . . . . . . . . . . . . . . . . . . . . . . . . . . . . . . . . . . . . 12,4522015 . . . . . . . . . . . . . . . . . . . . . . . . . . . . . . . . . . . . . . . . . . . . . . . . . . . . 12,044Thereafter . . . . . . . . . . . . . . . . . . . . . . . . . . . . . . . . . . . . . . . . . . . . . . . . 16,985
Total minimum lease payments . . . . . . . . . . . . . . . . . . . . . . . . . . . . . . . $100,271
95

BROCADE COMMUNICATIONS SYSTEMS, INC.
NOTES TO CONSOLIDATED FINANCIAL STATEMENTS—(Continued)
Capital Lease Obligations
The Company had capital lease obligations for certain furniture with a net present value of $8.5 million atOctober 30, 2010. Total payments under capital leases were approximately $1.4 million in fiscal year 2010 andthe Company will make payments totaling $9.7 million over the next five years, including $1.2 million forimputed interest expense. Future minimum lease payments under all non-cancelable capital leases as ofOctober 30, 2010 are as follows (in thousands):
Fiscal YearCapitalLeases
2011 . . . . . . . . . . . . . . . . . . . . . . . . . . . . . . . . . . . . . . . . . . . . . . . . . . . . . . $2,2212012 . . . . . . . . . . . . . . . . . . . . . . . . . . . . . . . . . . . . . . . . . . . . . . . . . . . . . . 2,2212013 . . . . . . . . . . . . . . . . . . . . . . . . . . . . . . . . . . . . . . . . . . . . . . . . . . . . . . 2,2212014 . . . . . . . . . . . . . . . . . . . . . . . . . . . . . . . . . . . . . . . . . . . . . . . . . . . . . . 2,2212015 . . . . . . . . . . . . . . . . . . . . . . . . . . . . . . . . . . . . . . . . . . . . . . . . . . . . . . 862
Total minimum lease payments . . . . . . . . . . . . . . . . . . . . . . . . . . . . . . . . . $9,746
Company Campus Contractual Obligations. On May 23, 2008, Brocade purchased property located in SanJose, California, which consisted of three unimproved building parcels that were entitled for approximately562,000 square feet of space in three buildings. The total purchase price for the property was $50.9 million. Inconnection with the purchase, Brocade also engaged a third party as development manager to manage thedevelopment and construction of improvements on the property. Brocade’s obligation for development andconstruction of three buildings and a parking garage on the purchased property was approximately $176.3 million(in addition to the purchase price for the property), payable in various installments through approximatelyJanuary 2011. Brocade’s obligation for tenant improvements for the campus was approximately $80.2 million, inaddition to the $8.0 million that the Company has agreed to pay the developer on May 22, 2011 or earlier.Brocade financed the purchase and the development through operating cash flows. In connection with thepurchase, Brocade also obtained a four-year option, exercisable at its sole discretion through May 22, 2012, topurchase a fourth unimproved approximate four acre parcel for a fixed price of approximately $26.0 million. Thecosts incurred to date in connection with the Company campus are approximately $305.0 million and theremaining capital expenditures are approximately $10.4 million as of October 30, 2010.
Product Warranties
The Company’s accrued liability for estimated future warranty costs is included in “Other accruedliabilities” in the accompanying Consolidated Balance Sheets. The following table summarizes the activityrelated to the Company’s accrued liability for estimated future warranty costs during the fiscal years endedOctober 30, 2010 and October 31, 2009 (in thousands):
Accrued Warranty
Twelve Months Ended
October 30,2010
October 31,2009
Beginning balance . . . . . . . . . . . . . . . . . . . . . . . . . . . . . . . . . . . . . . . . . . . . . . $ 5,808 $ 5,051Liabilities accrued for warranties issued during the period (1) . . . . . . . . . . . . 3,480 4,486Warranty claims paid and used during the period . . . . . . . . . . . . . . . . . . . . . . (1,705) (2,173)Changes in liability for pre-existing warranties during the period . . . . . . . . . (1,603) (1,556)
Ending balance . . . . . . . . . . . . . . . . . . . . . . . . . . . . . . . . . . . . . . . . . . . . . . . . $ 5,980 $ 5,808
96
BROCADE COMMUNICATIONS SYSTEMS, INC.
NOTES TO CONSOLIDATED FINANCIAL STATEMENTS—(Continued)
(1) Included in the $4.5 million in liabilities accrued for warranties issued during the year ended October 31,2009 is $1.9 million in warranty liabilities assumed as part of the Foundry acquisition.
In addition, the Company has standard indemnification clauses contained within its various customercontracts. As such, the Company indemnifies the parties to whom it sells its products with respect to theCompany’s product infringing upon any patents, trademarks, copyrights, or trade secrets, as well as againstbodily injury or damage to real or tangible personal property caused by a defective Company product. As ofOctober 30, 2010, there have been no known material events or circumstances that have resulted in a customercontract-related indemnification liability to the Company.
Manufacturing and Purchase Commitments
Brocade has manufacturing arrangements with CMs under which Brocade provides twelve-month productforecasts and places purchase orders in advance of the scheduled delivery of products to Brocade’s customers.The required lead time for placing orders with the CMs depends on the specific product. The CMs invoiceBrocade based on prices and payment terms mutually agreed upon and set forth in purchase orders it issues tothem. Although the purchase orders Brocade places with its CMs are cancelable, the terms of the agreementsrequire Brocade to purchase all inventory components not returnable, usable by, or sold to other customers of theCMs.
As of October 30, 2010, the Company’s aggregate commitment to the CMs for inventory components usedin the manufacture of Brocade products was $284.4 million, which the Company expects to utilize during futurenormal ongoing operations, net of a purchase commitments reserve of $4.9 million. The Company’s purchasecommitments reserve reflects the Company’s estimate of purchase commitments it does not expect to consume innormal ongoing operations within the next twelve months.
Income Taxes
The Company is subject to several ongoing audits. For additional discussion, see Note 15, “Income Taxes,”of the Notes to Consolidated Financial Statements. The Company believes it has adequate reserves for all opentax years.
Legal Proceedings
Initial Public Offering Litigation
On July 20, 2001, the first of a number of putative class actions for violations of the federal securities lawswas filed in the United States District Court for the Southern District of New York against Brocade, certain of itsofficers and directors, and certain of the underwriters for Brocade’s initial public offering (“IPO”) of securities.A consolidated amended class action captioned, In re Brocade Communications Systems, Inc. Initial PublicOffering Securities Litigation, No. 01 Civ. 6613, was filed on April 19, 2002. The complaint generally allegesthat various underwriters engaged in improper and undisclosed activities related to the allocation of shares inBrocade’s initial public offering and seeks unspecified damages for claims under the Exchange Act on behalf of apurported class of purchasers of common stock from May 24, 1999 to December 6, 2000. The lawsuit againstBrocade was coordinated for pretrial proceedings with a number of other pending litigations challengingunderwriter practices in over 300 cases as In re Initial Public Offering Securities Litigation, 21 MC 92 (SAS),including actions against McDATA Corporation, Inrange Technologies Corporation (“Inrange”) (which was firstacquired by Computer Network Technology Corporation (“CNT”) and subsequently acquired by McDATA aspart of the CNT acquisition), and Foundry (collectively, the “Brocade Entities”), and certain of each entity’srespective officers and directors, and initial public offering underwriters.
97

BROCADE COMMUNICATIONS SYSTEMS, INC.
NOTES TO CONSOLIDATED FINANCIAL STATEMENTS—(Continued)
The parties have reached a global settlement of the coordinated litigation, under which the insurers will paythe full amount of settlement share allocated to the Brocade Entities, and the Brocade Entities will bear nofinancial liability. On October 5, 2009, the Court granted final approval of the settlement. Certain objectors haveappealed the Court’s final order.
Intellectual Property Litigation
On June 21, 2005, Enterasys Networks, Inc. (“Enterasys”) filed a lawsuit against Foundry (and ExtremeNetworks, Inc.) in the United States District Court for the District of Massachusetts alleging that certain ofFoundry’s products infringe six of Enterasys’ patents and seeking injunctive relief, as well as unspecifieddamages. On August 28, 2007, the Court granted Foundry’s motion to stay the case based on petitions thatFoundry had filed with the United States Patent and Trademark Office (“USPTO”) in 2007 for reexamination offive of the six Enterasys patents. Two of the patents received final rejections during their respectivereexaminations, in which the USPTO held that the claims were invalid. Enterasys filed appeals of thoserejections with the USPTO’s Board of Patent Appeals and Interferences in 2009. The USPTO issuedreexamination certificates for the remaining three patents undergoing reexamination indicating that the patentswere valid over the references that Foundry had submitted. On August 7, 2009, Brocade filed a new petition withthe USPTO for reexamination of one of the patents that had received a reexamination certificate, but the USPTOupheld the patent as valid over the references that Brocade had submitted, and issued a reexamination certificateon July 6, 2010. On March 31, 2010, Brocade filed a new petition for reexamination of another of the patents thathad received a reexamination certificate, and on December 1, 2010, the USPTO issued an initial Office Actionrejecting the patent’s claims. Meanwhile, on May 21, 2010, the Court lifted the stay of the litigation, andEnterasys subsequently dropped from the litigation the two patents that are on appeal at the USPTO.Accordingly, four patents remain at issue in the litigation, of which one of the patents is currently undergoingreexamination in the USPTO. No trial date has been set.
On September 6, 2006, Chrimar Systems, Inc. (“Chrimar”) filed a lawsuit against Foundry (and D-LinkCorporation and PowerDsine, Ltd.) in the United States District Court for the Eastern District of Michiganalleging that certain of Foundry’s products infringe Chrimar’s U.S. Patent 5,406,260 and seeking injunctiverelief, as well as unspecified damages. Discovery has been completed. No trial date has been set.
On August 4, 2010, Brocade and Foundry Networks LLC (“Plaintiffs”) filed a lawsuit against A10Networks, Inc. (“A10”), A10’s founder and other individuals in the United States District Court for the NorthernDistrict of California. On October 29, 2010, Plaintiffs filed an amended complaint. In the amended complaint,Brocade alleged that A10 and the individual defendants have misappropriated Plaintiff’s trade secrets, infringedcopyrighted works, interfered with existing contracts between the Plaintiffs and their employees, breachedcontracts, breached their fiduciary duties and duties of loyalty, and that certain of A10’s products infringe ten ofBrocade’s patents. Brocade is seeking injunctive relief, as well as monetary damages. The above action replacesand supplements the previous action against A10 filed by Brocade on April 23, 2010 in the United States DistrictCourt for the District of Delaware, which was dismissed without prejudice. No trial date has been set.
On November 10, 2010, A10 filed a lawsuit against Brocade and a Brocade reseller in the Superior Court ofthe State of California, in the County of Santa Clara. A10 alleges that Brocade obtained unauthorized access toan A10 product. A10 seeks compensatory and punitive damages, and injunctive relief. At the outset of the case,A10 sought a temporary restraining order enjoining any further access to the A10 product by Brocade, and forreturn of the product to A10. On November 11, 2010, the Court denied A10’s motion for a temporary restrainingorder. On November 30, 2010, Brocade filed a motion to stay the case in view of Brocade’s Federal Courtlawsuit against A10. No trial date has been set.
98

BROCADE COMMUNICATIONS SYSTEMS, INC.
NOTES TO CONSOLIDATED FINANCIAL STATEMENTS—(Continued)
General
From time to time, the Company is subject to other legal proceedings and claims in the ordinary course ofbusiness, including claims of alleged infringement of trademarks, copyrights, patents and/or other intellectualproperty rights, and commercial contract disputes. Third parties assert patent infringement claims against theCompany from time to time in the form of letters, lawsuits and other forms of communication. In addition, fromtime to time, the Company receives notification from customers claiming that they are entitled to indemnificationor other obligations from the Company related to infringement claims made against them by third parties.Litigation, even if the Company is ultimately successful, can be costly and divert management’s attention awayfrom the day-to-day operations of the Company.
The Company records a liability when it is both probable that a liability has been incurred and the amount ofthe loss can be reasonably estimated. The Company reviews the need for any such liability on a quarterly basis.Except as may be noted above, the Company has not recorded any such material liabilities as of October 30, 2010other than with respect to one litigation matter relating to a commercial contract dispute.
11. Derivative Instruments and Hedging Activities
In the normal course of business, the Company is exposed to fluctuations in interest rates and the exchangerates associated with foreign currencies. The Company’s primary objective for holding derivative financialinstruments is to manage foreign currency exchange rate risk. The Company currently does not enter intoderivative instruments to manage credit risk. However, the Company manages its exposure to credit risk throughits investment policies. The Company generally enters into derivative transactions with high-credit qualitycounterparties and, by policy, limits the amount of credit exposure to any one counterparty based on its analysisof that counterparty’s relative credit standing. The amounts subject to credit risk related to derivative instrumentsare generally limited to the amounts, if any, by which a counterparty’s obligations exceed the Company’sobligations with that counterparty.
Foreign Currency Exchange Rate Risk
A majority of the Company’s revenue, expense and capital purchasing activities is transacted in U.S. dollars.However, the Company is exposed to foreign currency exchange rate risk inherent in conducting businessglobally in numerous currencies, of which the most significant to its operations for the fiscal year endedOctober 30, 2010 were the Chinese yuan, the euro, the Japanese yen, the British pound, the Singapore dollar andthe Swiss franc. The Company is primarily exposed to foreign currency fluctuations related to operating expensesdenominated in currencies other than the U.S. dollar. The Company has established a foreign currency riskmanagement program to protect against fluctuations in the volatility of future cash flows caused by changes inforeign currency exchange rates. This program reduces, but does not always entirely eliminate, the impact offoreign currency exchange rate movements. The Company’s foreign currency risk management program includesforeign currency derivatives with cash flow hedge accounting designation that utilizes foreign currency forwardcontracts to hedge exposures to the variability in the U.S. dollar equivalent of anticipated non-U.S. dollar-denominated cash flows. These instruments generally have a maturity of less than one year. For these derivatives,the Company reports the after-tax gain or loss from the effective portion of the hedge as a component ofaccumulated other comprehensive loss in stockholders’ equity and reclassifies it into earnings in the same periodin which the hedged transaction affects earnings as part of “Other income (loss), net” on the consolidatedstatements of operations.
The Company also may enter into other non-designated derivatives that consist primarily of forwardcontracts to minimize the risk associated with the foreign exchange effects of revaluing monetary assets andliabilities. Monetary assets and liabilities denominated in foreign currencies and any associated outstanding
99

BROCADE COMMUNICATIONS SYSTEMS, INC.
NOTES TO CONSOLIDATED FINANCIAL STATEMENTS—(Continued)
forward contracts are marked-to-market with realized and unrealized gains and losses included in “Other income(loss), net.” There were no forward contracts of this nature outstanding as of October 30, 2010.
For amounts not associated with foreign currency forward contracts, gains and losses from transactionsdenominated in foreign currencies are included in the Company’s net income (loss) as part of “Other income(loss), net,” in the accompanying Consolidated Statements of Operations. The Company recognized foreigncurrency transaction losses of $6.6 million for the fiscal year ended October 30, 2010 and foreign currencytransaction gains of $4.5 million and $4.6 million for the fiscal years ended October 31, 2009 and October 25,2008, respectively.
Volume of Derivative Activity
Total gross notional amounts, presented by currency, are as follows (in thousands):
In United States DollarsOctober 30,
2010October 31,
2009
Euro . . . . . . . . . . . . . . . . . . . . . . . . . . . . . . . . . . . . . . . . . . . . . . . . . . . . . . . . . . . . . . . . . . . $ 53,700 $ 61,790Japanese yen . . . . . . . . . . . . . . . . . . . . . . . . . . . . . . . . . . . . . . . . . . . . . . . . . . . . . . . . . . . . 14,306 11,523British pound . . . . . . . . . . . . . . . . . . . . . . . . . . . . . . . . . . . . . . . . . . . . . . . . . . . . . . . . . . . . 22,018 23,991Singapore dollar . . . . . . . . . . . . . . . . . . . . . . . . . . . . . . . . . . . . . . . . . . . . . . . . . . . . . . . . . 12,427 15,319Swiss franc . . . . . . . . . . . . . . . . . . . . . . . . . . . . . . . . . . . . . . . . . . . . . . . . . . . . . . . . . . . . . 9,554 7,385
Total . . . . . . . . . . . . . . . . . . . . . . . . . . . . . . . . . . . . . . . . . . . . . . . . . . . . . . . . . . . . . . . . . . $112,005 $120,008
The Company utilizes a rolling hedge strategy for the majority of its foreign currency forward contracts withcash flow hedge accounting designation that hedges exposures to the variability in the U.S. dollar equivalent ofanticipated non-U.S. dollar-denominated cash flows. All of the Company’s foreign currency forward contractsare single delivery, which are settled at maturity involving one cash payment exchange.
Net unrealized loss positions are recorded within “Other accrued liabilities”, and net unrealized gainpositions are recorded within “Prepaid and other current assets.” As of October 30, 2010, the Company had agross unrealized gain of $6.7 million included in “Prepaid and other current assets.” The amount of $6.7 millionrepresents effective hedges and is reported as a component of accumulated other comprehensive loss. Hedgeineffectiveness, which is reported in the Consolidated Statements of Operations, was not significant.
12. Equity Compensation Plans
In April 2009, the stockholders of Brocade approved the Company’s 2009 Stock Plan, 2009 Director Planand 2009 Employee Stock Purchase Plan (“2009 ESPP”), and such plans are now part of the Company’s equitycompensation plans. The Company’s 1999 Stock Plan, 1999 Director Option Plan and 1999 Employee StockPurchase Plan each expired in March 2009 by their terms.
2009 Stock Plan
The 2009 Stock Plan provides for the grant of stock options, restricted stock, restricted stock units, stockappreciation rights, performance units and performance shares, and other stock or cash awards to employees,directors and consultants. Per the terms of the 2009 Stock Plan, 48.0 million shares of the Company’s commonstock are reserved for issuance under the plan, plus the following:
• Any shares subject to stock options or similar awards granted under the Company’s 1999 Stock Plan,1999 Nonstatutory Stock Option Plan (“NSO Plan”) and 2001 McDATA Equity Incentive Plan thatexpire or otherwise terminate without having been exercised in full; and
100
BROCADE COMMUNICATIONS SYSTEMS, INC.
NOTES TO CONSOLIDATED FINANCIAL STATEMENTS—(Continued)
• Shares issued pursuant to awards granted under the Company’s 1999 Stock Plan, 1999 NSO Plan and2001 McDATA Equity Incentive Plan that are forfeited to or repurchased by the Company, with themaximum number of shares to be added to the 2009 Stock Plan pursuant to this clause equal to40,335,624 shares.
2009 Director Plan
The 2009 Director Plan provides for the grant of stock options and restricted stock units to non-employeedirectors of the Company. The Board of Directors has reserved 2.0 million shares of the Company’s commonstock for issuance under the 2009 Director Plan, plus any shares subject to stock options or similar awardsgranted under the Company’s 1999 Director Option Plan that expire or otherwise terminate without having beenexercised in full, and shares issued pursuant to awards granted under the Company’s 1999 Director Option Planthat are forfeited to or repurchased by the Company, with the maximum number of shares to be added to the 2009Director Plan pursuant to this clause equal to 870,000 shares.
2009 Employee Stock Purchase Plan
The 2009 ESPP permits eligible employees to purchase shares of the Company’s common stock throughpayroll deductions for up to 15% of qualified compensation during the offering period. The purchase price is85% of the lesser of the fair market value of the Company’s common stock on (i) the first trading day of theoffering period, or (ii) the last day of each six-month purchase period; provided, however, that the purchase pricefor subsequent offering periods may be determined by the administrator, subject to compliance with the terms ofthe 2009 ESPP. A total of 35.0 million shares of the Company’s common stock are reserved for issuance underthe 2009 ESPP. The 2009 ESPP is implemented through consecutive, overlapping offering periods of up toapproximately twenty-four months. The offering periods generally start with the first trading day on or afterJune 1 and December 1 each year and end on the last trading day in the periods ending twenty-four months later,unless the fair market value of the Company’s common stock on the last day of a purchase period is lower thanthe fair market value of the Company’s common stock on the first trading day of the offering period, in whichcase the offering period will end early, immediately after the purchase period, and a new offering period willcommence on or about such date. Each offering period will be divided into four purchase periods ofapproximately six months in length. Eligible employees may purchase no more than 3,750 shares of theCompany’s common stock during each six-month purchase period. As of October 30, 2010, 27.2 million shareswere available for issuance under the 2009 ESPP.
Equity Compensation Plans
The Company grants stock options, restricted stock awards and restricted stock units for shares of theCompany’s common stock and other types of equity compensation awards to its employees and directors underthe various equity compensation plans described above. In accordance with the terms of the 2009 Stock Plan andthe 2009 Director Plan, each award granted with an exercise price that is less than fair market value, whichincludes all grants of restricted stock awards, restricted stock units, performance shares and performance units,will count against the applicable plan’s share reserve as 1.56 shares for every one share subject to such award. Inaddition, the exercise price of stock options and stock appreciation rights granted under the 2009 Stock Plan mustbe at least equal to the fair market value of the Company’s common stock on the date of grant and the exerciseprice of incentive stock options granted to any participant who owns more than 10% of the total voting power ofall classes of the Company’s outstanding stock must be at least 110% of the fair market value of the Company’scommon stock on the date of grant.
The term of a stock option and a stock appreciation right may not exceed seven years, except that, withrespect to any participant who owns 10% of the voting power of all classes of the Company’s outstanding capital
101

BROCADE COMMUNICATIONS SYSTEMS, INC.
NOTES TO CONSOLIDATED FINANCIAL STATEMENTS—(Continued)
stock, the term of an incentive stock option may not exceed five years. The majority of the stock options,restricted stock awards and restricted stock units granted under the Company’s equity compensation plans vestover a period of four years. Certain options and awards granted under the 2009 Stock Plan vest over shorter orlonger periods.
At October 30, 2010, approximately 149.0 million shares were authorized for future issuance under theCompany’s equity compensation plans, which include stock options, shares to be issued pursuant to the 2009ESPP, restricted stock units and other awards, and shares of Brocade common stock that became issuable inconnection with the assumption or substitution of Foundry equity awards. A total of 48.4 million shares ofcommon stock were available for grant under the Company’s equity compensation plans as of October 30, 2010.At October 31, 2009, approximately 190.8 million shares were authorized for future issuance under theCompany’s equity compensation plans, which include stock options, shares issued pursuant to the 2009Employee Stock Purchase Plan, and restricted stock units and other awards. A total of 67.1 million shares ofcommon stock were available for grant under the Company’s equity compensation plans as of October 31, 2009.Awards that expire, or are canceled without delivery of shares, generally become available for issuance under theCompany’s equity compensation plans.
1999 Nonstatutory Stock Option Plan
In September 1999, the Board of Directors approved the Company’s 1999 NSO Plan. The 1999 NSO Planprovides for the grant of nonstatutory stock options to employees and consultants. A total of 51.4 million sharesof the Company’s common stock have been reserved for issuance under the 1999 NSO Plan. As of October 30,2010, the Company has reserved 18.8 million shares of authorized but unissued shares of common stock forfuture issuance upon exercise of options under the 1999 NSO Plan.
McDATA Equity Plans
On January 29, 2007, effective upon the consummation of the merger, Brocade assumed the McDATAequity plans. As of October 30, 2010, options to purchase approximately 2.8 million shares of converted commonstock, restricted stock and other equity awards remained outstanding under former McDATA equity plans.
Long-Term Incentive Plan
On July 30, 2007, the Board of Directors approved a long-term, performance-based equity incentive planunder the Company’s then applicable 1999 Stock Plan. On November 24, 2009, the Compensation Committee ofthe Board of Directors approved the issuance of approximately 2.0 million RSUs under the Company’s long-term, performance-based equity incentive plan. The fair value of the restricted stock units granted under theLong-Term Incentive Plan was estimated using a Monte Carlo simulation which required assumptions forexpected volatilities, correlation coefficients and risk-free interest rates. Expected volatilities were derived usinga method that calculates historical volatility over a period equal to the length of the measurement period for theLong-Term Incentive Plan and the companies included in the related index. Correlation coefficients were basedon the same data used to calculate historical volatilities and were used to model how our stock price moves inrelation to the companies included in the related index. The Company used a risk-free interest rates that is equalto the yield of a zero-coupon U.S. Treasury bill that is commensurate with each measurement period. As ofOctober 31, 2009, $17.7 million in compensation expense related to these awards had been recognized. Liability-classified awards are required to be remeasured to current fair value at each reporting date until settlement. Inaccordance with the applicable accounting standard, for the twelve months ended October 30, 2010, theCompany recorded a $3.5 million benefit related to these awards as a result of the decrease in Brocade’s closing
102
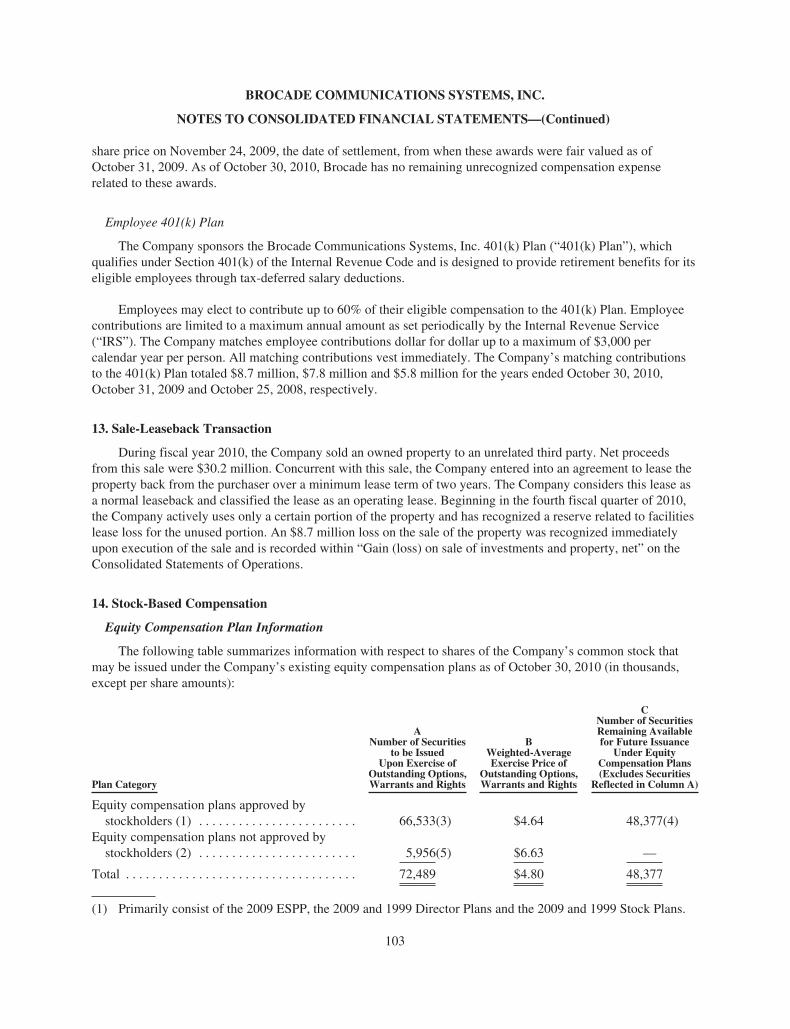
BROCADE COMMUNICATIONS SYSTEMS, INC.
NOTES TO CONSOLIDATED FINANCIAL STATEMENTS—(Continued)
share price on November 24, 2009, the date of settlement, from when these awards were fair valued as ofOctober 31, 2009. As of October 30, 2010, Brocade has no remaining unrecognized compensation expenserelated to these awards.
Employee 401(k) Plan
The Company sponsors the Brocade Communications Systems, Inc. 401(k) Plan (“401(k) Plan”), whichqualifies under Section 401(k) of the Internal Revenue Code and is designed to provide retirement benefits for itseligible employees through tax-deferred salary deductions.
Employees may elect to contribute up to 60% of their eligible compensation to the 401(k) Plan. Employeecontributions are limited to a maximum annual amount as set periodically by the Internal Revenue Service(“IRS”). The Company matches employee contributions dollar for dollar up to a maximum of $3,000 percalendar year per person. All matching contributions vest immediately. The Company’s matching contributionsto the 401(k) Plan totaled $8.7 million, $7.8 million and $5.8 million for the years ended October 30, 2010,October 31, 2009 and October 25, 2008, respectively.
13. Sale-Leaseback Transaction
During fiscal year 2010, the Company sold an owned property to an unrelated third party. Net proceedsfrom this sale were $30.2 million. Concurrent with this sale, the Company entered into an agreement to lease theproperty back from the purchaser over a minimum lease term of two years. The Company considers this lease asa normal leaseback and classified the lease as an operating lease. Beginning in the fourth fiscal quarter of 2010,the Company actively uses only a certain portion of the property and has recognized a reserve related to facilitieslease loss for the unused portion. An $8.7 million loss on the sale of the property was recognized immediatelyupon execution of the sale and is recorded within “Gain (loss) on sale of investments and property, net” on theConsolidated Statements of Operations.
14. Stock-Based Compensation
Equity Compensation Plan Information
The following table summarizes information with respect to shares of the Company’s common stock thatmay be issued under the Company’s existing equity compensation plans as of October 30, 2010 (in thousands,except per share amounts):
Plan Category
ANumber of Securities
to be IssuedUpon Exercise of
Outstanding Options,Warrants and Rights
BWeighted-AverageExercise Price of
Outstanding Options,Warrants and Rights
CNumber of SecuritiesRemaining Availablefor Future Issuance
Under EquityCompensation Plans(Excludes Securities
Reflected in Column A)
Equity compensation plans approved bystockholders (1) . . . . . . . . . . . . . . . . . . . . . . . . 66,533(3) $4.64 48,377(4)
Equity compensation plans not approved bystockholders (2) . . . . . . . . . . . . . . . . . . . . . . . . 5,956(5) $6.63 —
Total . . . . . . . . . . . . . . . . . . . . . . . . . . . . . . . . . . . 72,489 $4.80 48,377
(1) Primarily consist of the 2009 ESPP, the 2009 and 1999 Director Plans and the 2009 and 1999 Stock Plans.
103
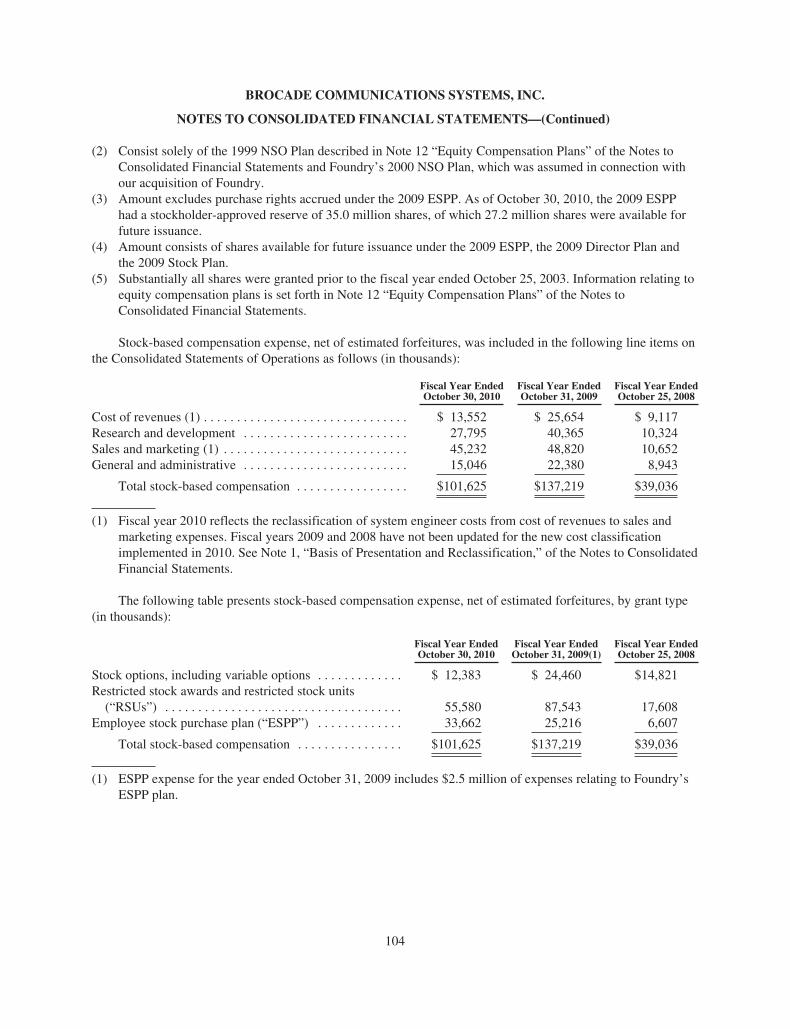
BROCADE COMMUNICATIONS SYSTEMS, INC.
NOTES TO CONSOLIDATED FINANCIAL STATEMENTS—(Continued)
(2) Consist solely of the 1999 NSO Plan described in Note 12 “Equity Compensation Plans” of the Notes toConsolidated Financial Statements and Foundry’s 2000 NSO Plan, which was assumed in connection withour acquisition of Foundry.
(3) Amount excludes purchase rights accrued under the 2009 ESPP. As of October 30, 2010, the 2009 ESPPhad a stockholder-approved reserve of 35.0 million shares, of which 27.2 million shares were available forfuture issuance.
(4) Amount consists of shares available for future issuance under the 2009 ESPP, the 2009 Director Plan andthe 2009 Stock Plan.
(5) Substantially all shares were granted prior to the fiscal year ended October 25, 2003. Information relating toequity compensation plans is set forth in Note 12 “Equity Compensation Plans” of the Notes toConsolidated Financial Statements.
Stock-based compensation expense, net of estimated forfeitures, was included in the following line items onthe Consolidated Statements of Operations as follows (in thousands):
Fiscal Year EndedOctober 30, 2010
Fiscal Year EndedOctober 31, 2009
Fiscal Year EndedOctober 25, 2008
Cost of revenues (1) . . . . . . . . . . . . . . . . . . . . . . . . . . . . . . . $ 13,552 $ 25,654 $ 9,117Research and development . . . . . . . . . . . . . . . . . . . . . . . . . 27,795 40,365 10,324Sales and marketing (1) . . . . . . . . . . . . . . . . . . . . . . . . . . . . 45,232 48,820 10,652General and administrative . . . . . . . . . . . . . . . . . . . . . . . . . 15,046 22,380 8,943
Total stock-based compensation . . . . . . . . . . . . . . . . . $101,625 $137,219 $39,036
(1) Fiscal year 2010 reflects the reclassification of system engineer costs from cost of revenues to sales andmarketing expenses. Fiscal years 2009 and 2008 have not been updated for the new cost classificationimplemented in 2010. See Note 1, “Basis of Presentation and Reclassification,” of the Notes to ConsolidatedFinancial Statements.
The following table presents stock-based compensation expense, net of estimated forfeitures, by grant type(in thousands):
Fiscal Year EndedOctober 30, 2010
Fiscal Year EndedOctober 31, 2009(1)
Fiscal Year EndedOctober 25, 2008
Stock options, including variable options . . . . . . . . . . . . . $ 12,383 $ 24,460 $14,821Restricted stock awards and restricted stock units(“RSUs”) . . . . . . . . . . . . . . . . . . . . . . . . . . . . . . . . . . . . 55,580 87,543 17,608
Employee stock purchase plan (“ESPP”) . . . . . . . . . . . . . 33,662 25,216 6,607
Total stock-based compensation . . . . . . . . . . . . . . . . $101,625 $137,219 $39,036
(1) ESPP expense for the year ended October 31, 2009 includes $2.5 million of expenses relating to Foundry’sESPP plan.
104

BROCADE COMMUNICATIONS SYSTEMS, INC.
NOTES TO CONSOLIDATED FINANCIAL STATEMENTS—(Continued)
The following table presents unrecognized compensation expense, net of estimated forfeitures, of theCompany’s equity compensation plans as of October 30, 2010, which is expected to be recognized over thefollowing weighted-average periods, (in thousands, except for weighted-average period):
UnrecognizedCompensation
Expense
Weighted-Average Period
(in years)
Stock options . . . . . . . . . . . . . . . . . . . . . . . . . . . . . $ 6,850 0.97RSUs . . . . . . . . . . . . . . . . . . . . . . . . . . . . . . . . . . . . $99,943 2.07ESPP . . . . . . . . . . . . . . . . . . . . . . . . . . . . . . . . . . . . $25,626 1.17
Stock Options
When the measurement date is certain, the fair value of each option granted during the respective period isestimated on the date of grant using the Black-Scholes valuation model and the assumptions noted in thefollowing table. The dividend yield reflects that Brocade has not paid any cash dividends since inception anddoes not anticipate paying cash dividends in the foreseeable future. The risk-free interest rate is based on theimplied yield on a U.S. Treasury zero-coupon issue with a remaining term equal to the expected term of theoption. The expected volatility is based on an equal weighted-average of implied volatilities from traded optionsof the Company’s common stock and historical volatility of the Company’s common stock. The expected term isbased on historical exercise behavior.
Fiscal Year Ended
Stock OptionsOctober 30,
2010October 31,
2009October 25,
2008
Expected dividend yield . . . . . . . . . . . . . . . . . . . . . . . . . . . . . . . . 0.0% 0.0% 0.0%Risk-free interest rate . . . . . . . . . . . . . . . . . . . . . . . . . . . . . . . . . . 0.3 - 2.0% 0.4 - 1.9% 1.5 - 4.1%Expected volatility . . . . . . . . . . . . . . . . . . . . . . . . . . . . . . . . . . . . . 49.3 - 53.3% 54.8 - 65.3% 44.2 - 57.0%Expected term (in years) . . . . . . . . . . . . . . . . . . . . . . . . . . . . . . . . 4.0 4.0 4.0
105
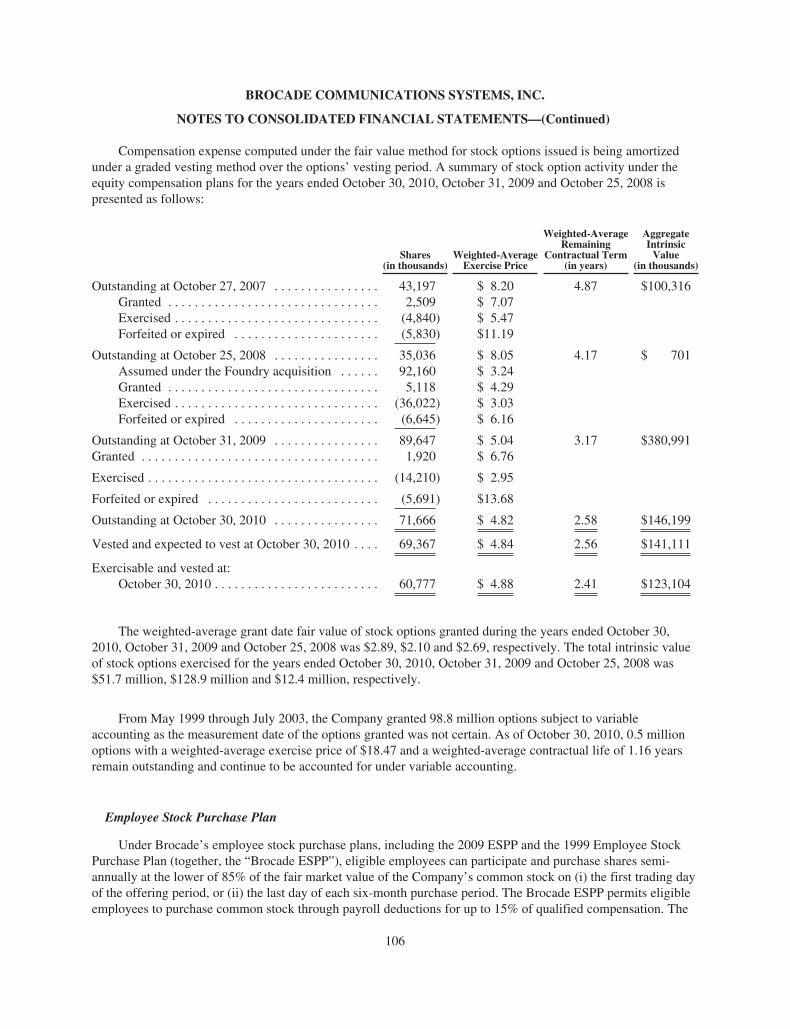
BROCADE COMMUNICATIONS SYSTEMS, INC.
NOTES TO CONSOLIDATED FINANCIAL STATEMENTS—(Continued)
Compensation expense computed under the fair value method for stock options issued is being amortizedunder a graded vesting method over the options’ vesting period. A summary of stock option activity under theequity compensation plans for the years ended October 30, 2010, October 31, 2009 and October 25, 2008 ispresented as follows:
Shares(in thousands)
Weighted-AverageExercise Price
Weighted-AverageRemaining
Contractual Term(in years)
AggregateIntrinsicValue
(in thousands)
Outstanding at October 27, 2007 . . . . . . . . . . . . . . . . 43,197 $ 8.20 4.87 $100,316Granted . . . . . . . . . . . . . . . . . . . . . . . . . . . . . . . . 2,509 $ 7.07Exercised . . . . . . . . . . . . . . . . . . . . . . . . . . . . . . . (4,840) $ 5.47Forfeited or expired . . . . . . . . . . . . . . . . . . . . . . (5,830) $11.19
Outstanding at October 25, 2008 . . . . . . . . . . . . . . . . 35,036 $ 8.05 4.17 $ 701Assumed under the Foundry acquisition . . . . . . 92,160 $ 3.24Granted . . . . . . . . . . . . . . . . . . . . . . . . . . . . . . . . 5,118 $ 4.29Exercised . . . . . . . . . . . . . . . . . . . . . . . . . . . . . . . (36,022) $ 3.03Forfeited or expired . . . . . . . . . . . . . . . . . . . . . . (6,645) $ 6.16
Outstanding at October 31, 2009 . . . . . . . . . . . . . . . . 89,647 $ 5.04 3.17 $380,991Granted . . . . . . . . . . . . . . . . . . . . . . . . . . . . . . . . . . . . 1,920 $ 6.76
Exercised . . . . . . . . . . . . . . . . . . . . . . . . . . . . . . . . . . . (14,210) $ 2.95
Forfeited or expired . . . . . . . . . . . . . . . . . . . . . . . . . . (5,691) $13.68
Outstanding at October 30, 2010 . . . . . . . . . . . . . . . . 71,666 $ 4.82 2.58 $146,199
Vested and expected to vest at October 30, 2010 . . . . 69,367 $ 4.84 2.56 $141,111
Exercisable and vested at:October 30, 2010 . . . . . . . . . . . . . . . . . . . . . . . . . 60,777 $ 4.88 2.41 $123,104
The weighted-average grant date fair value of stock options granted during the years ended October 30,2010, October 31, 2009 and October 25, 2008 was $2.89, $2.10 and $2.69, respectively. The total intrinsic valueof stock options exercised for the years ended October 30, 2010, October 31, 2009 and October 25, 2008 was$51.7 million, $128.9 million and $12.4 million, respectively.
From May 1999 through July 2003, the Company granted 98.8 million options subject to variableaccounting as the measurement date of the options granted was not certain. As of October 30, 2010, 0.5 millionoptions with a weighted-average exercise price of $18.47 and a weighted-average contractual life of 1.16 yearsremain outstanding and continue to be accounted for under variable accounting.
Employee Stock Purchase Plan
Under Brocade’s employee stock purchase plans, including the 2009 ESPP and the 1999 Employee StockPurchase Plan (together, the “Brocade ESPP”), eligible employees can participate and purchase shares semi-annually at the lower of 85% of the fair market value of the Company’s common stock on (i) the first trading dayof the offering period, or (ii) the last day of each six-month purchase period. The Brocade ESPP permits eligibleemployees to purchase common stock through payroll deductions for up to 15% of qualified compensation. The
106
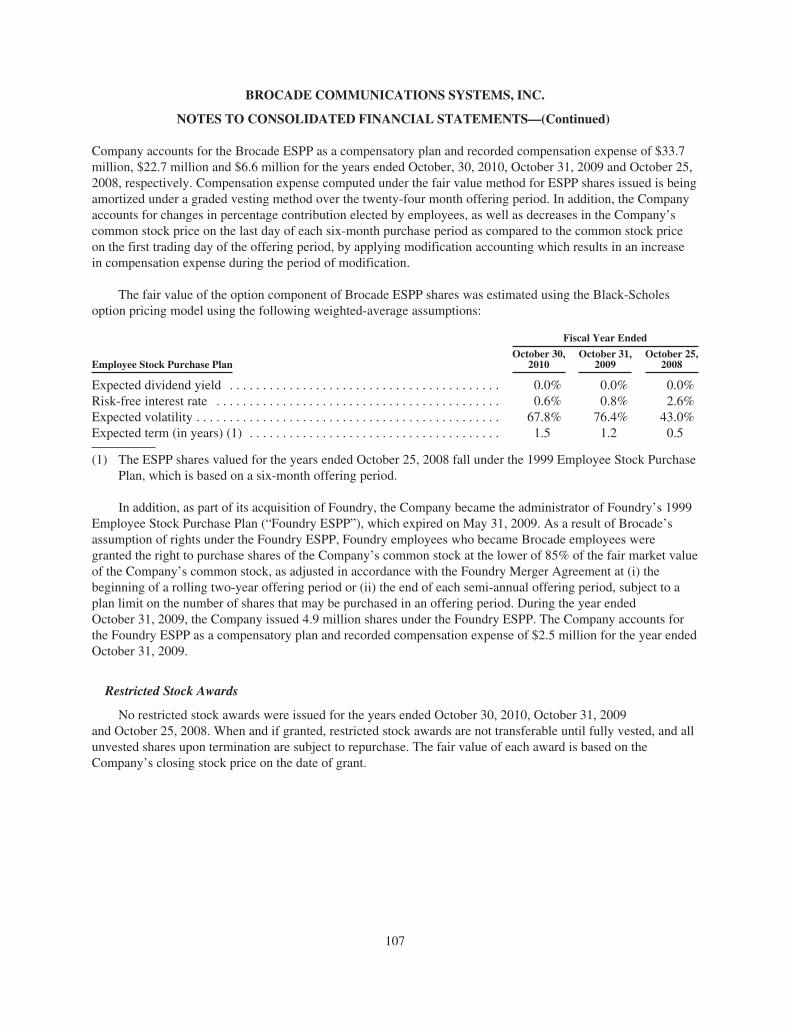
BROCADE COMMUNICATIONS SYSTEMS, INC.
NOTES TO CONSOLIDATED FINANCIAL STATEMENTS—(Continued)
Company accounts for the Brocade ESPP as a compensatory plan and recorded compensation expense of $33.7million, $22.7 million and $6.6 million for the years ended October, 30, 2010, October 31, 2009 and October 25,2008, respectively. Compensation expense computed under the fair value method for ESPP shares issued is beingamortized under a graded vesting method over the twenty-four month offering period. In addition, the Companyaccounts for changes in percentage contribution elected by employees, as well as decreases in the Company’scommon stock price on the last day of each six-month purchase period as compared to the common stock priceon the first trading day of the offering period, by applying modification accounting which results in an increasein compensation expense during the period of modification.
The fair value of the option component of Brocade ESPP shares was estimated using the Black-Scholesoption pricing model using the following weighted-average assumptions:
Fiscal Year Ended
Employee Stock Purchase PlanOctober 30,
2010October 31,
2009October 25,
2008
Expected dividend yield . . . . . . . . . . . . . . . . . . . . . . . . . . . . . . . . . . . . . . . . . 0.0% 0.0% 0.0%Risk-free interest rate . . . . . . . . . . . . . . . . . . . . . . . . . . . . . . . . . . . . . . . . . . . 0.6% 0.8% 2.6%Expected volatility . . . . . . . . . . . . . . . . . . . . . . . . . . . . . . . . . . . . . . . . . . . . . . 67.8% 76.4% 43.0%Expected term (in years) (1) . . . . . . . . . . . . . . . . . . . . . . . . . . . . . . . . . . . . . . 1.5 1.2 0.5
(1) The ESPP shares valued for the years ended October 25, 2008 fall under the 1999 Employee Stock PurchasePlan, which is based on a six-month offering period.
In addition, as part of its acquisition of Foundry, the Company became the administrator of Foundry’s 1999Employee Stock Purchase Plan (“Foundry ESPP”), which expired on May 31, 2009. As a result of Brocade’sassumption of rights under the Foundry ESPP, Foundry employees who became Brocade employees weregranted the right to purchase shares of the Company’s common stock at the lower of 85% of the fair market valueof the Company’s common stock, as adjusted in accordance with the Foundry Merger Agreement at (i) thebeginning of a rolling two-year offering period or (ii) the end of each semi-annual offering period, subject to aplan limit on the number of shares that may be purchased in an offering period. During the year endedOctober 31, 2009, the Company issued 4.9 million shares under the Foundry ESPP. The Company accounts forthe Foundry ESPP as a compensatory plan and recorded compensation expense of $2.5 million for the year endedOctober 31, 2009.
Restricted Stock Awards
No restricted stock awards were issued for the years ended October 30, 2010, October 31, 2009and October 25, 2008. When and if granted, restricted stock awards are not transferable until fully vested, and allunvested shares upon termination are subject to repurchase. The fair value of each award is based on theCompany’s closing stock price on the date of grant.
107

BROCADE COMMUNICATIONS SYSTEMS, INC.
NOTES TO CONSOLIDATED FINANCIAL STATEMENTS—(Continued)
A summary of the nonvested restricted stock awards for the years ended October 30, 2010, October 31,2009 and October 25, 2008 is presented as follows:
Shares(in thousands)
Weighted-AverageGrant Date Fair Value
Nonvested at October 27, 2007 . . . . . . . . . . . . . . . . . . . 2,130 $3.75Granted . . . . . . . . . . . . . . . . . . . . . . . . . . . . . . . . . — $ —Vested . . . . . . . . . . . . . . . . . . . . . . . . . . . . . . . . . . (2,087) $3.84Forfeited . . . . . . . . . . . . . . . . . . . . . . . . . . . . . . . . (29) $0.01
Nonvested at October 25, 2008 . . . . . . . . . . . . . . . . . . . 14 $0.01Granted . . . . . . . . . . . . . . . . . . . . . . . . . . . . . . . . . — $ —Vested . . . . . . . . . . . . . . . . . . . . . . . . . . . . . . . . . . (14) $0.01Forfeited . . . . . . . . . . . . . . . . . . . . . . . . . . . . . . . . — $ —
Nonvested at October 31, 2009 . . . . . . . . . . . . . . . . . . . — $ —
Granted . . . . . . . . . . . . . . . . . . . . . . . . . . . . . . . . . . . . . — $ —Vested . . . . . . . . . . . . . . . . . . . . . . . . . . . . . . . . . . . . . . — $ —Forfeited . . . . . . . . . . . . . . . . . . . . . . . . . . . . . . . . . . . . — $ —
Nonvested at October 30, 2010 . . . . . . . . . . . . . . . . . . . — $ —
Expected to vest at October 30, 2010 . . . . . . . . . . . . . . — $ —
Restricted Stock Units
For the years ended October 30, 2010, October 31, 2009 and October 25, 2008, Brocade issued 10.8 million,13.3 million and 6.3 million restricted stock units, respectively. Typically, vesting of restricted stock units occursover one to four years and is subject to the employee’s continuing service to Brocade.
A summary of the changes in restricted stock units outstanding under Brocade’s equity compensation plansduring the years ended October 30, 2010, October 31, 2009 and October 25, 2008 is presented as follows:
Shares(in thousands)
Weighted-AverageGrant Date Fair Value
Nonvested at October 27, 2007 . . . . . . . . . . . . . . . . . . . 2,719 $8.29Granted . . . . . . . . . . . . . . . . . . . . . . . . . . . . . . . . . 6,290 $7.69Vested . . . . . . . . . . . . . . . . . . . . . . . . . . . . . . . . . . (5) $6.35Forfeited . . . . . . . . . . . . . . . . . . . . . . . . . . . . . . . . (698) $7.95
Nonvested at October 25, 2008 . . . . . . . . . . . . . . . . . . . 8,306 $7.87Assumed under the Foundry acquisition . . . . . . . 26,050 $3.54Granted . . . . . . . . . . . . . . . . . . . . . . . . . . . . . . . . . 13,334 $6.90Vested . . . . . . . . . . . . . . . . . . . . . . . . . . . . . . . . . . (11,315) $7.20Forfeited . . . . . . . . . . . . . . . . . . . . . . . . . . . . . . . . (3,682) $6.92
Nonvested at October 31, 2009 . . . . . . . . . . . . . . . . . . . 32,693 $4.37Granted . . . . . . . . . . . . . . . . . . . . . . . . . . . . . . . . . . . . . 10,801 $5.84Vested . . . . . . . . . . . . . . . . . . . . . . . . . . . . . . . . . . . . . . (12,753) $5.26Forfeited . . . . . . . . . . . . . . . . . . . . . . . . . . . . . . . . . . . . (2,570) $6.74
Nonvested at October 30, 2010 . . . . . . . . . . . . . . . . . . . 28,171 $4.32
Vested and expected to vest at October 30, 2010 . . . . . 23,411 $4.32
108

BROCADE COMMUNICATIONS SYSTEMS, INC.
NOTES TO CONSOLIDATED FINANCIAL STATEMENTS—(Continued)
The aggregate intrinsic value of restricted stock units outstanding at October 30, 2010, October 31, 2009and October 25, 2008 was $178.9 million, $288.1 million and $25.7 million, respectively.
15. Income Taxes
The domestic and international components of income (loss) before provision for (benefit from) incometaxes for the years ended October 30, 2010, October 31, 2009 and October 25, 2008 are presented as follows (inthousands):
Fiscal Year Ended
October 30,2010
October 31,2009
October 25,2008
United States . . . . . . . . . . . . . . . . . . . . . . . . . . . . . . . . . . . . . . . . . . . . . . . . . . $ 42,229 $(137,449) $(54,262)International . . . . . . . . . . . . . . . . . . . . . . . . . . . . . . . . . . . . . . . . . . . . . . . . . . 67,951 63,424 77,003
Total . . . . . . . . . . . . . . . . . . . . . . . . . . . . . . . . . . . . . . . . . . . . . . . . . . . . $110,180 $ (74,025) $ 22,741
The income tax provision (benefit) for the years ended October 30, 2010, October 31, 2009 and October 25,2008 consisted of the following (in thousands):
Fiscal Year Ended
October 30,2010
October 31,2009
October 25,2008
U.S. federal taxes:Current . . . . . . . . . . . . . . . . . . . . . . . . . . . . . . . . . . . . . . . . . . . . . . . . . . $(30,768) $ 14,855 $ 47,006Deferred . . . . . . . . . . . . . . . . . . . . . . . . . . . . . . . . . . . . . . . . . . . . . . . . . 20,047 (12,621) (149,679)
Total U.S. federal taxes . . . . . . . . . . . . . . . . . . . . . . . . . . . . . . . . . . . . . . . . . . (10,721) 2,234 (102,673)
State taxes:Current . . . . . . . . . . . . . . . . . . . . . . . . . . . . . . . . . . . . . . . . . . . . . . . . . . 4,282 3,173 3,770Deferred . . . . . . . . . . . . . . . . . . . . . . . . . . . . . . . . . . . . . . . . . . . . . . . . . (10,320) (9,329) (54,915)
Total state taxes . . . . . . . . . . . . . . . . . . . . . . . . . . . . . . . . . . . . . . . . . . . . . . . . (6,038) (6,156) (51,145)
Non-U.S. taxes:Current . . . . . . . . . . . . . . . . . . . . . . . . . . . . . . . . . . . . . . . . . . . . . . . . . . 9,002 10,464 9,307Deferred . . . . . . . . . . . . . . . . . . . . . . . . . . . . . . . . . . . . . . . . . . . . . . . . . (915) 817 (855)
Total non-U.S. taxes . . . . . . . . . . . . . . . . . . . . . . . . . . . . . . . . . . . . . . . . . . . . 8,087 11,281 8,452
Charge in lieu of taxes resulting from initial recognition of acquired taxbenefits that are allocated to reduce goodwill related to the acquiredentity . . . . . . . . . . . . . . . . . . . . . . . . . . . . . . . . . . . . . . . . . . . . . . . . . . . . . . — — 715
Total . . . . . . . . . . . . . . . . . . . . . . . . . . . . . . . . . . . . . . . . . . . . . . . . . . . . $ (8,672) $ 7,359 $(144,651)
Total income tax provision (benefit) for each of the three years presented has been adjusted due to changesto the accounting for convertible debt instruments. See Note 2, “Summary of Significant Accounting Policies,” ofthe Notes to Consolidated Financial Statements, for additional information.
109
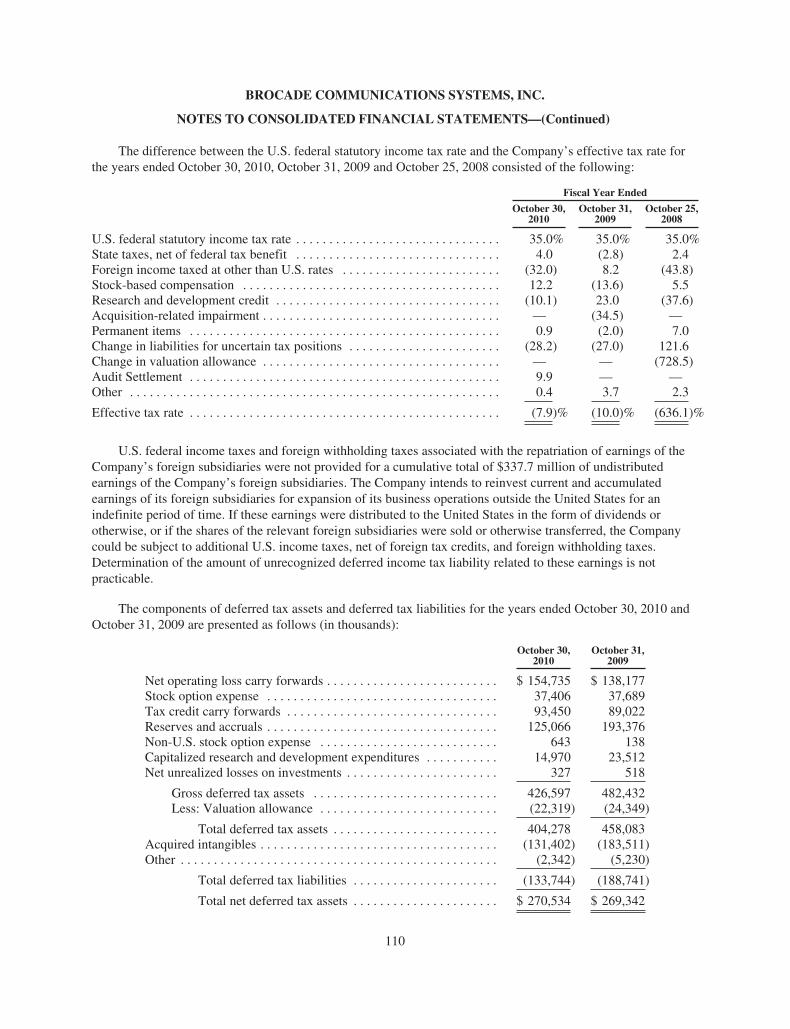
BROCADE COMMUNICATIONS SYSTEMS, INC.
NOTES TO CONSOLIDATED FINANCIAL STATEMENTS—(Continued)
The difference between the U.S. federal statutory income tax rate and the Company’s effective tax rate forthe years ended October 30, 2010, October 31, 2009 and October 25, 2008 consisted of the following:
Fiscal Year Ended
October 30,2010
October 31,2009
October 25,2008
U.S. federal statutory income tax rate . . . . . . . . . . . . . . . . . . . . . . . . . . . . . . . 35.0% 35.0% 35.0%State taxes, net of federal tax benefit . . . . . . . . . . . . . . . . . . . . . . . . . . . . . . . 4.0 (2.8) 2.4Foreign income taxed at other than U.S. rates . . . . . . . . . . . . . . . . . . . . . . . . (32.0) 8.2 (43.8)Stock-based compensation . . . . . . . . . . . . . . . . . . . . . . . . . . . . . . . . . . . . . . . 12.2 (13.6) 5.5Research and development credit . . . . . . . . . . . . . . . . . . . . . . . . . . . . . . . . . . (10.1) 23.0 (37.6)Acquisition-related impairment . . . . . . . . . . . . . . . . . . . . . . . . . . . . . . . . . . . . — (34.5) —Permanent items . . . . . . . . . . . . . . . . . . . . . . . . . . . . . . . . . . . . . . . . . . . . . . . 0.9 (2.0) 7.0Change in liabilities for uncertain tax positions . . . . . . . . . . . . . . . . . . . . . . . (28.2) (27.0) 121.6Change in valuation allowance . . . . . . . . . . . . . . . . . . . . . . . . . . . . . . . . . . . . — — (728.5)Audit Settlement . . . . . . . . . . . . . . . . . . . . . . . . . . . . . . . . . . . . . . . . . . . . . . . 9.9 — —Other . . . . . . . . . . . . . . . . . . . . . . . . . . . . . . . . . . . . . . . . . . . . . . . . . . . . . . . . 0.4 3.7 2.3
Effective tax rate . . . . . . . . . . . . . . . . . . . . . . . . . . . . . . . . . . . . . . . . . . . . . . . (7.9)% (10.0)% (636.1)%
U.S. federal income taxes and foreign withholding taxes associated with the repatriation of earnings of theCompany’s foreign subsidiaries were not provided for a cumulative total of $337.7 million of undistributedearnings of the Company’s foreign subsidiaries. The Company intends to reinvest current and accumulatedearnings of its foreign subsidiaries for expansion of its business operations outside the United States for anindefinite period of time. If these earnings were distributed to the United States in the form of dividends orotherwise, or if the shares of the relevant foreign subsidiaries were sold or otherwise transferred, the Companycould be subject to additional U.S. income taxes, net of foreign tax credits, and foreign withholding taxes.Determination of the amount of unrecognized deferred income tax liability related to these earnings is notpracticable.
The components of deferred tax assets and deferred tax liabilities for the years ended October 30, 2010 andOctober 31, 2009 are presented as follows (in thousands):
October 30,2010
October 31,2009
Net operating loss carry forwards . . . . . . . . . . . . . . . . . . . . . . . . . . $ 154,735 $ 138,177Stock option expense . . . . . . . . . . . . . . . . . . . . . . . . . . . . . . . . . . . 37,406 37,689Tax credit carry forwards . . . . . . . . . . . . . . . . . . . . . . . . . . . . . . . . 93,450 89,022Reserves and accruals . . . . . . . . . . . . . . . . . . . . . . . . . . . . . . . . . . . 125,066 193,376Non-U.S. stock option expense . . . . . . . . . . . . . . . . . . . . . . . . . . . 643 138Capitalized research and development expenditures . . . . . . . . . . . 14,970 23,512Net unrealized losses on investments . . . . . . . . . . . . . . . . . . . . . . . 327 518
Gross deferred tax assets . . . . . . . . . . . . . . . . . . . . . . . . . . . . 426,597 482,432Less: Valuation allowance . . . . . . . . . . . . . . . . . . . . . . . . . . . (22,319) (24,349)
Total deferred tax assets . . . . . . . . . . . . . . . . . . . . . . . . . 404,278 458,083Acquired intangibles . . . . . . . . . . . . . . . . . . . . . . . . . . . . . . . . . . . . (131,402) (183,511)Other . . . . . . . . . . . . . . . . . . . . . . . . . . . . . . . . . . . . . . . . . . . . . . . . (2,342) (5,230)
Total deferred tax liabilities . . . . . . . . . . . . . . . . . . . . . . (133,744) (188,741)
Total net deferred tax assets . . . . . . . . . . . . . . . . . . . . . . $ 270,534 $ 269,342
110

BROCADE COMMUNICATIONS SYSTEMS, INC.
NOTES TO CONSOLIDATED FINANCIAL STATEMENTS—(Continued)
The Company believes that sufficient positive evidence exists from historical operations and projections oftaxable income in future years to conclude that it was more likely than not that the Company would realize itsdeferred tax assets. Historical operations were impacted by discrete events that if excluded would show that theCompany has cumulative profits for the prior 12 quarters ending October 30, 2010. Accordingly, the Companyonly applies a valuation allowance on the deferred tax assets relating to capital loss carryforwards andinvestments loss carryforward due to limited carryforward periods and the character of such tax attributes. In theevent future income by jurisdiction is less than what is currently projected, the Company may be required toapply a valuation allowance to these deferred tax assets in jurisdictions for which realization is no longerdetermined to be more likely than not.
As of October 30, 2010, the Company had federal net operating loss carryforwards of $851.5 million,California state net operating loss carryforwards of $66.8 million and other significant states net operating losscarryforwards of approximately $152.2 million. Additionally, the Company had $97.3 million of federal taxcredits and $131.9 million of state tax credits. The federal net operating loss and other tax credit carryforwardsexpire on various dates between 2018 through 2030. The state net operating loss and credit carryforwards expireon various dates between 2010 through 2030. Under the current tax law, net operating loss and creditcarryforwards available to offset future income in any given year may be limited by statute or upon theoccurrence of certain events, including significant changes in ownership interests.
As a result of the McDATA and Foundry acquisitions, all the tax attributes from both companies are subjectto an annual limitation, but the Company expects to use all the tax attributes before expiration.
The Company applies a recognition threshold and measurement attribute for the financial statementrecognition and measurement of an income tax position taken or expected to be taken on a tax return.Recognition of a tax position is determined when it is more likely than not that a tax position will be sustainedupon examination, including resolution of any related appeals or litigation processes. A tax position that meetsthe more-likely-than-not recognition threshold is measured at the largest amount of benefit that is greater than50% likely of being realized upon ultimate settlement with a taxing authority.
A reconciliation of the beginning and ending amount of total gross unrecognized tax benefits, excludingaccrued net interest and penalties of $3.0 million, for the year ended October 30, 2010, is as follows (inthousands):
October 30,2010
October 31,2009
Unrecognized tax benefits, beginning balance . . . . . . . . . . . . . . . . $170,947 $118,259Gross increases for tax positions taken in prior periods . . . . . . . . . 2,666 43,106Gross decreases for tax positions taken in prior periods . . . . . . . . . (4,618) (1,229)Gross increases for tax positions taken in current period . . . . . . . . 7,805 18,416Changes due to settlements with taxing authorities . . . . . . . . . . . . (37,366) (919)Reductions resulting from lapses of statutes of limitations . . . . . . (2,622) (6,686)
Unrecognized tax benefits, ending balance . . . . . . . . . . . . . . . . . . . $136,812 $170,947
As of October 30, 2010, the Company had unrecognized tax benefits of $128.9 million, all of which, ifrecognized, would result in a reduction of the Company’s effective tax rate.
For the year ended October 30, 2010, the Company recorded income tax benefit of $8.7 million, primarily asa result of foreign taxes, offset by discrete benefits from the release of certain reserves mainly relating to the
111

BROCADE COMMUNICATIONS SYSTEMS, INC.
NOTES TO CONSOLIDATED FINANCIAL STATEMENTS—(Continued)
settlement of the Company’s fiscal year 2003 Internal Revenue Service (“IRS”) audit and relatedremeasurements of various uncertain tax positions, concession from the IRS on treatment of intercompany grossreceipts for the research and development credits, Franchise Tax Board (“FTB”) research and developmentcredits carried forward to fiscal year 2005, and statute expirations of tax years of foreign subsidiaries.
The timing of the resolution of income tax examinations, as well as the amounts and timing of relatedsettlements, is highly uncertain. The Company believes that before the end of fiscal year 2011, it is reasonablypossible that either certain audits will conclude or the statute of limitations relating to certain income taxexamination periods will expire, or both. Given the uncertainty as to settlement terms, the timing of paymentsand the impact of such settlements on other uncertain tax positions, the range of estimated potential decreases inunderlying uncertain tax positions is between $0 and $15 million.
The Company classifies interest and penalties related to unrecognized tax benefits as a component ofincome tax expense. During the year ended October 30, 2010, the Company expensed $0.9 million for netinterest and penalties related to income tax liabilities through income tax expense. The total net interest andpenalties accrued as of October 30, 2010 was $3.0 million. During the year ended October 31, 2009, theCompany expensed $0.7 million for net interest and penalties related to income tax liabilities through income taxexpense.
In June 2010, the Company executed a closing agreement for fiscal year 2003 with the IRS, resolving theissues related to Brocade’s transfer pricing arrangement. The Company’s fiscal years 2004 through 2008 are stillunder IRS examination. The IRS is contesting the Company’s transfer pricing for the cost sharing and buy-inarrangements with its foreign subsidiaries, and may make similar claims against the Company’s transfer pricingarrangements in future examinations. The calendar years 2006 and 2007 FTB audit of Foundry’s Californiaincome tax returns are ongoing. All of these audits are still ongoing and the Company believes its reserves areadequate to cover any potential assessments that may result from these examinations. Due to the availability ofnet operating losses and credits, the Company does not expect a significant tax liability from the settlement of theaudits.
Of the total tax benefits (detriments) resulting from the exercise of employee stock options and employeeparticipation in the Company’s equity compensation plans, the amounts recorded to stockholders’ equity wereapproximately $(2.2) million in fiscal year 2010, $(0.8) million in fiscal year 2009, and $18.6 million in fiscalyear 2008.
16. Segment Information
Operating segments are defined as components of an enterprise about which separate financial informationis available that is evaluated regularly by the Chief Operating Decision Maker (“CODM”), or decision-makinggroup, in deciding how to allocate resources and in assessing performance. Currently, the CODM is the ChiefExecutive Officer.
As a result of the Foundry acquisition during the first quarter of fiscal year 2009, Brocade reorganized intofour operating segments, of which two are individually reportable segments: Data Storage and Global Services;and two, Internet Protocol (“IP”) Layer 2-3 and IP Layer 4-7/ Application Delivery Products (“IP Layer4-7/ADP”), are combined into one reportable segment: Ethernet Products. The objective of this new organizationis to enable the Company to more effectively focus on growth opportunities, while being well-positioned to morerapidly scale and accommodate new business opportunities, including potential future acquisitions. These
112

BROCADE COMMUNICATIONS SYSTEMS, INC.
NOTES TO CONSOLIDATED FINANCIAL STATEMENTS—(Continued)
segments are organized principally by product category. The types of products and services from which eachreportable segment derives its revenues are as follows:
• Data Storage includes infrastructure products and solutions including directors, switches, routers,fabric-based software applications, distance/extension products, as well as management applicationsand utilities to centralize data management. Data Storage also includes the server portfolio, which iscomprised of host bus adapters (“HBAs”), converged network adapters, mezzanine cards, as well asswitch modules for bladed servers;
• Ethernet Products includes Open Systems Interconnection Reference Model (“OSI”) Layer 2-3switches and routers which enable efficient use of bandwidth-intensive network business applicationsand digital entertainment on both local area networks and wide area networks, OSI Layer 4–7 switcheswhich allow enterprises and service providers to build highly available network infrastructures thatefficiently direct the flow of traffic, and file area network products and associated managementsolutions; and
• Global Services include break/fix maintenance, extended warranty, installation, consulting, networkmanagement, and related software maintenance and support revenue.
Financial decisions and the allocation of resources are based on the information from the Company’sinternal management reporting system. At this point in time, the Company does not track all of its assets byoperating segments. The majority of the Company’s assets as of October 30, 2010, October 31, 2009and October 25, 2008 were attributable to its United States operations.
Summarized financial information by reportable segment for the years ended October 30, 2010, October 31,2009 and October 25, 2008, based on the internal management reporting system, is as follows (in thousands):
Data Storage Ethernet Products Global Services Total
Fiscal year ended October 30, 2010Net revenues . . . . . . . . . . . . . . . . . . . . . . . . . . . . . . . $1,243,836 $488,188 $362,339 $2,094,363Cost of revenues (1) . . . . . . . . . . . . . . . . . . . . . . . . . 394,506 288,980 176,547 860,033
Gross margin . . . . . . . . . . . . . . . . . . . . . . . . . . . . . . . $ 849,330 $199,208 $185,792 $1,234,330
Fiscal year ended October 31, 2009Net revenues . . . . . . . . . . . . . . . . . . . . . . . . . . . . . . . $1,191,077 $424,434 $337,415 $1,952,926Cost of revenues . . . . . . . . . . . . . . . . . . . . . . . . . . . . 467,496 271,858 180,072 919,426
Gross margin . . . . . . . . . . . . . . . . . . . . . . . . . . . . . . . $ 723,581 $152,576 $157,343 $1,033,500
Fiscal year ended October 25, 2008Net revenues . . . . . . . . . . . . . . . . . . . . . . . . . . . . . . . $1,224,156 $ 6,581 $236,200 $1,466,937Cost of revenues . . . . . . . . . . . . . . . . . . . . . . . . . . . . 449,045 10,805 146,715 606,565
Gross margin (loss) . . . . . . . . . . . . . . . . . . . . . . . . . . $ 775,111 $ (4,224) $ 89,485 $ 860,372
(1) Fiscal year 2010 reflects the reclassification of system engineer costs from cost of revenues to sales andmarketing expenses. See Note 1, “Basis of Presentation and Reclassification,” of the Notes to ConsolidatedFinancial Statements.
113

BROCADE COMMUNICATIONS SYSTEMS, INC.
NOTES TO CONSOLIDATED FINANCIAL STATEMENTS—(Continued)
Revenues are attributed to geographic areas based on where the Company’s products are shipped.Geographic information for the years ended October 30, 2010, October 31, 2009 and October 25, 2008 ispresented below (in thousands):
Fiscal Year Ended
October 30,2010
October 31,2009
October 25,2008
Net revenues:United States . . . . . . . . . . . . . . . . . . . . . . . . . . . . . . . . . . . . . . . . . . . . . . . $1,340,319 $1,268,551 $ 931,280International
Canada, Central and South America . . . . . . . . . . . . . . . . . . . . . . . . . 38,027 32,091 21,077Europe, the Middle East and Africa (1) . . . . . . . . . . . . . . . . . . . . . . 483,860 451,002 359,678Asia Pacific . . . . . . . . . . . . . . . . . . . . . . . . . . . . . . . . . . . . . . . . . . . . 173,243 141,511 116,925Japan . . . . . . . . . . . . . . . . . . . . . . . . . . . . . . . . . . . . . . . . . . . . . . . . . 58,914 59,771 37,977
Total international net revenues . . . . . . . . . . . . . . . . . . . . . . . . 754,044 684,375 535,657
Total net revenues . . . . . . . . . . . . . . . . . . . . . . . . . . . . . . . . . . . . . . . $2,094,363 $1,952,926 $1,466,937
(1) Includes net revenues of $254.4 million, $177.0 million and $85.1 million for the years ended October 30,2010, October 31, 2009 and October 25, 2008 respectively, relating to the Netherlands.
Fiscal Year Ended
October 30,2010
October 31,2009
October 25,2008
Property and equipment, net:United States . . . . . . . . . . . . . . . . . . . . . . . . . . . . . . . . . . . . . . . . . . . . . . . . . . $524,287 $427,010 $300,756International . . . . . . . . . . . . . . . . . . . . . . . . . . . . . . . . . . . . . . . . . . . . . . . . . . 14,830 15,398 12,623
Total Property and equipment, net . . . . . . . . . . . . . . . . . . . . . . . . . . . . . $539,117 $442,408 $313,379
17. Gain (Loss) on Sale of Investments and Property, net, and Loss on Impairment of PortfolioInvestments
The Company had an immaterial gain on sale of investments for the year ended October 30, 2010 andimmaterial loss on sale of investment for the year ended October 31, 2009. For the year ended October 25, 2008,the Company had $6.9 million in net loss on sale of investments primarily due to the sale of the Company’sequity investment in a publicly traded company. The Company also determined that the declines in the fair valuefor certain of its portfolio investments primarily associated with non-marketable investments were other-than-temporary due to the significant deterioration of the financial condition of the investees. As a result, for the yearended October 25, 2008, the Company recorded impairment charges of $8.8 million. The carrying value of theCompany’s equity investments in non-publicly traded companies at October 30, 2010, October 31, 2009and October 25, 2008 was $7.0 million, $6.8 million and $6.8 million, respectively.
During the year ended October 30, 2010, the Company recognized an $8.7 million loss on the sale ofproperty. See Note 13, “Sale-Leaseback Transaction,” of the Notes to Consolidated Financial Statements.
114

BROCADE COMMUNICATIONS SYSTEMS, INC.
NOTES TO CONSOLIDATED FINANCIAL STATEMENTS—(Continued)
18. Net Income (Loss) per Share
The following table presents the calculation of basic and diluted net income (loss) per share (in thousands,except per share amounts):
Fiscal Year Ended
October 30,2010
October 31,2009 (2) (3)
October 25,2008 (2)
Basic net income (loss) per shareNet income (loss) . . . . . . . . . . . . . . . . . . . . . . . . . . . . . . . . . . . . . . . . . . . . . . $118,852 $ (81,384) $167,392Weighted-average shares of common stock outstanding . . . . . . . . . . . . . . . . 446,996 398,948 375,520Less: Weighted-average shares of common stock subject to repurchase . . . . — — (217)
Weighted-average shares used in computing basic net income (loss) pershare . . . . . . . . . . . . . . . . . . . . . . . . . . . . . . . . . . . . . . . . . . . . . . . . . . . . . . . 446,996 398,948 375,303
Basic net income (loss) per share . . . . . . . . . . . . . . . . . . . . . . . . . . . . . . . . . . $ 0.27 $ (0.20) $ 0.45
Diluted net income (loss) per shareNet income (loss) . . . . . . . . . . . . . . . . . . . . . . . . . . . . . . . . . . . . . . . . . . . . . . $118,852 $ (81,384) $167,392Interest on convertible subordinated debt, net of income tax effect . . . . . . . . — — 2,297
Net income (loss), as adjusted . . . . . . . . . . . . . . . . . . . . . . . . . . . . . . . . . . . . . 118,852 (81,384) 169,689
Weighted-average shares used in computing basic net income (loss) pershare . . . . . . . . . . . . . . . . . . . . . . . . . . . . . . . . . . . . . . . . . . . . . . . . . . . . . . . 446,996 398,948 375,303
Dilutive potential common shares resulting from the potential conversion ofconvertible subordinated debt . . . . . . . . . . . . . . . . . . . . . . . . . . . . . . . . . . . — — 3,021
Dilutive potential common shares in the form of stock options . . . . . . . . . . . 22,083 — 5,001Dilutive potential common shares in the form of stock awards . . . . . . . . . . . 13,288 — 1,558Dilutive potential common shares in the form of ESPP shares . . . . . . . . . . . 374 — 758
Weighted-average shares used in computing diluted net income (loss) pershare . . . . . . . . . . . . . . . . . . . . . . . . . . . . . . . . . . . . . . . . . . . . . . . . . . . . . . . 482,741 398,948 385,641
Diluted net income (loss) per share . . . . . . . . . . . . . . . . . . . . . . . . . . . . . . . . . $ 0.25 $ (0.20) $ 0.44
Antidilutive potential common shares in the form of (1)Stock options . . . . . . . . . . . . . . . . . . . . . . . . . . . . . . . . . . . . . . . . . . . . . . . . . . 21,217 68,710 17,523Stock awards . . . . . . . . . . . . . . . . . . . . . . . . . . . . . . . . . . . . . . . . . . . . . . . . . . 700 17,035 1,225Antidilutive potential common shares resulting from the potentialconversion of (1)
Convertible subordinated debt . . . . . . . . . . . . . . . . . . . . . . . . . . . . . . . . . . . . 3,552 12,083 9,063
(1) These amounts are excluded from the computation of diluted net income (loss) per share.(2) Basic and diluted net income (loss) per share for fiscal years 2009 and 2008 presented have been adjusted
due to changes to the accounting for convertible debt instruments. See Note 2, “Summary of SignificantAccounting Policies,” of the Notes to Consolidated Financial Statements, for additional information.
(3) As the Company was in a net loss position for the year ended October 31, 2009, there was no dilutiveimpact of potential common shares associated with stock options and stock awards, by application of thetreasury stock method.
115

BROCADE COMMUNICATIONS SYSTEMS, INC.
NOTES TO CONSOLIDATED FINANCIAL STATEMENTS—(Continued)
19. Related Party and Other Transactions
During the normal course of business, the Company purchases certain equipment from vendors who are alsoits customers and with whom the Company has contractual arrangements. The equipment purchased by theCompany is primarily used for testing purposes in its development labs or otherwise consumed internally. TheCompany believes that all such transactions are on an arms-length basis and are subject to terms no morefavorable than those with unrelated parties.
20. Guarantor and Non-Guarantor Subsidiaries
On January 20, 2010, the Company issued in total $600.0 million aggregate principal amount of its SeniorSecured Notes. As discussed in Note 9, “Borrowings,” of the Notes to Consolidated Financial Statements, theCompany’s obligations under the Senior Secured Notes are guaranteed by certain of the Company’s domesticsubsidiaries. The Senior Secured Notes are not guaranteed by the Company’s Canadian or other foreignsubsidiaries. The following tables present consolidated financial statements for the parent company, theSubsidiary Guarantors and the foreign non-guarantor subsidiaries, respectively. The consolidated financialstatements for prior periods have been adjusted due to changes to the accounting for convertible debtinstruments. For additional discussion, see Note 2, “Summary of Significant Accounting Policies,” of the Notesto Consolidated Financial Statements.
The following is the consolidated balance sheet as of October 30, 2010 (in thousands):
BrocadeCommunicationsSystems, Inc.
SubsidiaryGuarantors
ForeignNon-
GuarantorSubsidiaries
ConsolidatingAdjustments Total
AssetsCurrent assets:
Cash and cash equivalents and short-terminvestments . . . . . . . . . . . . . . . . . . . . . . $ 23,455 $ 8,905 $303,622 $ — $ 335,982
Accounts receivable, net . . . . . . . . . . . . . . 220,381 1,698 107,818 (333) 329,564Inventories . . . . . . . . . . . . . . . . . . . . . . . . . 63,713 — 13,095 — 76,808Intercompany receivables . . . . . . . . . . . . . — 399,868 — (399,868) —Other current assets . . . . . . . . . . . . . . . . . . 118,154 875 9,999 3,069 132,097
Total current assets . . . . . . . . . . . . . . 425,703 411,346 434,534 (397,132) 874,451Property and equipment, net . . . . . . . . . . . . . . . 466,247 58,040 14,830 — 539,117Other non-current assets . . . . . . . . . . . . . . . . . . . 1,499,774 734,469 6,364 — 2,240,607
Total assets . . . . . . . . . . . . . . . . . . . . . $2,391,724 $1,203,855 $455,728 $(397,132) $3,654,175
Liabilities and Stockholders’ EquityCurrent liabilities:
Accounts payable . . . . . . . . . . . . . . . . . . . . $ 128,182 $ 389 $ 18,892 $ (333) $ 147,130Current portion of debt . . . . . . . . . . . . . . . . 30,540 — — — 30,540Intercompany payables . . . . . . . . . . . . . . . 412,555 — (12,687) (399,868) —Other current liabilities . . . . . . . . . . . . . . . 256,710 29,752 102,082 3,069 391,613
Total current liabilities . . . . . . . . . . . . 827,987 30,141 108,287 (397,132) 569,283Debt, net of current portion . . . . . . . . . . . . . . . . 899,273 — — — 899,273Other non-current liabilities . . . . . . . . . . . . . . . . 99,679 3,361 36,278 — 139,318
Total liabilities . . . . . . . . . . . . . . . . . . 1,826,939 33,502 144,565 (397,132) 1,607,874Total stockholders’ equity . . . . . . . . . . . . . . . . . 564,785 1,170,353 311,163 — 2,046,301
Total liabilities and stockholders’equity . . . . . . . . . . . . . . . . . . . . . . . $2,391,724 $1,203,855 $455,728 $(397,132) $3,654,175
116
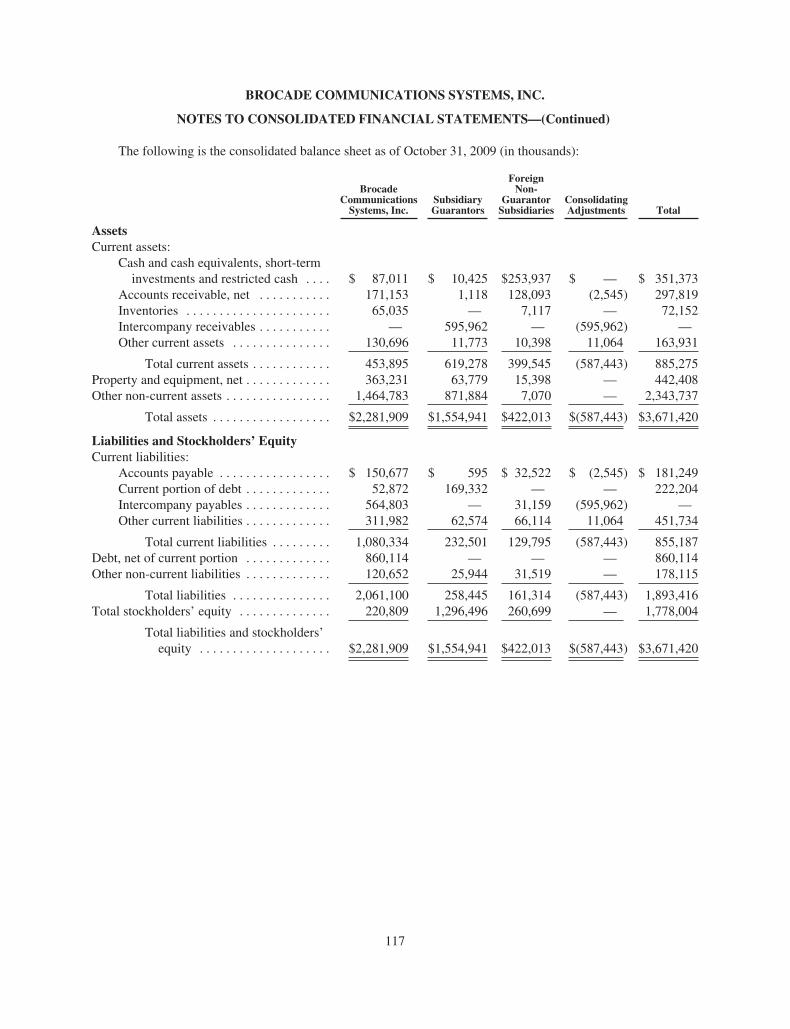
BROCADE COMMUNICATIONS SYSTEMS, INC.
NOTES TO CONSOLIDATED FINANCIAL STATEMENTS—(Continued)
The following is the consolidated balance sheet as of October 31, 2009 (in thousands):
BrocadeCommunicationsSystems, Inc.
SubsidiaryGuarantors
ForeignNon-
GuarantorSubsidiaries
ConsolidatingAdjustments Total
AssetsCurrent assets:
Cash and cash equivalents, short-terminvestments and restricted cash . . . . $ 87,011 $ 10,425 $253,937 $ — $ 351,373
Accounts receivable, net . . . . . . . . . . . 171,153 1,118 128,093 (2,545) 297,819Inventories . . . . . . . . . . . . . . . . . . . . . . 65,035 — 7,117 — 72,152Intercompany receivables . . . . . . . . . . . — 595,962 — (595,962) —Other current assets . . . . . . . . . . . . . . . 130,696 11,773 10,398 11,064 163,931
Total current assets . . . . . . . . . . . . 453,895 619,278 399,545 (587,443) 885,275Property and equipment, net . . . . . . . . . . . . . 363,231 63,779 15,398 — 442,408Other non-current assets . . . . . . . . . . . . . . . . 1,464,783 871,884 7,070 — 2,343,737
Total assets . . . . . . . . . . . . . . . . . . $2,281,909 $1,554,941 $422,013 $(587,443) $3,671,420
Liabilities and Stockholders’ EquityCurrent liabilities:
Accounts payable . . . . . . . . . . . . . . . . . $ 150,677 $ 595 $ 32,522 $ (2,545) $ 181,249Current portion of debt . . . . . . . . . . . . . 52,872 169,332 — — 222,204Intercompany payables . . . . . . . . . . . . . 564,803 — 31,159 (595,962) —Other current liabilities . . . . . . . . . . . . . 311,982 62,574 66,114 11,064 451,734
Total current liabilities . . . . . . . . . 1,080,334 232,501 129,795 (587,443) 855,187Debt, net of current portion . . . . . . . . . . . . . 860,114 — — — 860,114Other non-current liabilities . . . . . . . . . . . . . 120,652 25,944 31,519 — 178,115
Total liabilities . . . . . . . . . . . . . . . 2,061,100 258,445 161,314 (587,443) 1,893,416Total stockholders’ equity . . . . . . . . . . . . . . 220,809 1,296,496 260,699 — 1,778,004
Total liabilities and stockholders’equity . . . . . . . . . . . . . . . . . . . . $2,281,909 $1,554,941 $422,013 $(587,443) $3,671,420
117

BROCADE COMMUNICATIONS SYSTEMS, INC.
NOTES TO CONSOLIDATED FINANCIAL STATEMENTS—(Continued)
The following is the consolidated statement of operations for the fiscal year ended October 30, 2010(in thousands):
BrocadeCommunicationsSystems, Inc.
SubsidiaryGuarantors
ForeignNon-
GuarantorSubsidiaries
ConsolidatingAdjustments Total
Revenues . . . . . . . . . . . . . . . . . . . . . . . . . . $1,289,704 $ 50,731 $753,928 $ — $2,094,363Intercompany revenues . . . . . . . . . . . . . . . 102,178 13,954 25,464 (141,596) —
Total net revenues . . . . . . . . . . . . . . . 1,391,882 64,685 779,392 (141,596) 2,094,363Cost of revenues . . . . . . . . . . . . . . . . . . . . . 466,855 111,899 260,951 20,328 860,033Intercompany cost of revenues . . . . . . . . . 40,588 — 101,008 (141,596) —
Total cost of revenues . . . . . . . . . . . . 507,443 111,899 361,959 (121,268) 860,033
Gross margin (loss) . . . . . . . . . . . . . . . . . . 884,439 (47,214) 417,433 (20,328) 1,234,330Operating expenses . . . . . . . . . . . . . . . . . . 846,755 64,432 132,430 (20,328) 1,023,289Intercompany operating expenses . . . . . . . (167,746) (30,349) 198,095 — —
Total operating expenses . . . . . . . . . . 679,009 34,083 330,525 (20,328) 1,023,289
Income (loss) from operations . . . . . . . . . . 205,430 (81,297) 86,908 — 211,041Other income (expense) . . . . . . . . . . . . . . . (80,276) (1,628) (14,801) (4,156) (100,861)
Income (loss) before income tax provision(benefit) . . . . . . . . . . . . . . . . . . . . . . . . . 125,154 (82,925) 72,107 (4,156) 110,180
Income tax provision (benefit) . . . . . . . . . . (49,670) 32,911 8,087 — (8,672)
Net income . . . . . . . . . . . . . . . . . . . . . $ 174,824 $(115,836) $ 64,020 $ (4,156) $ 118,852
118
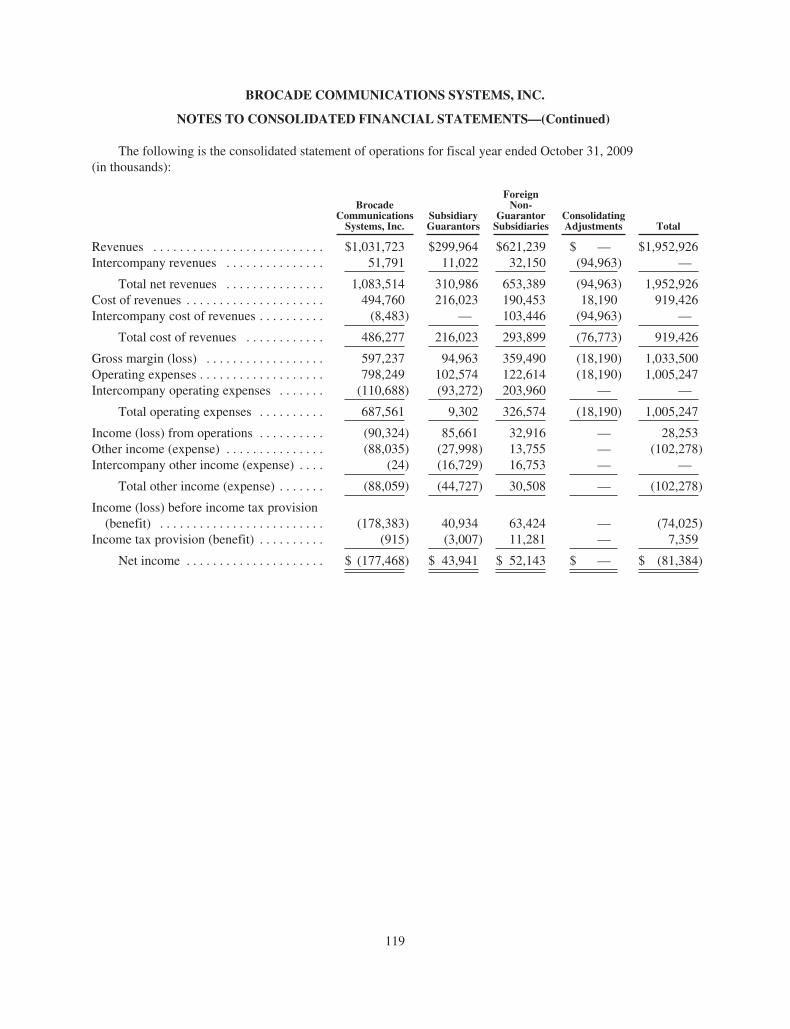
BROCADE COMMUNICATIONS SYSTEMS, INC.
NOTES TO CONSOLIDATED FINANCIAL STATEMENTS—(Continued)
The following is the consolidated statement of operations for fiscal year ended October 31, 2009(in thousands):
BrocadeCommunicationsSystems, Inc.
SubsidiaryGuarantors
ForeignNon-
GuarantorSubsidiaries
ConsolidatingAdjustments Total
Revenues . . . . . . . . . . . . . . . . . . . . . . . . . . $1,031,723 $299,964 $621,239 $ — $1,952,926Intercompany revenues . . . . . . . . . . . . . . . 51,791 11,022 32,150 (94,963) —
Total net revenues . . . . . . . . . . . . . . . 1,083,514 310,986 653,389 (94,963) 1,952,926Cost of revenues . . . . . . . . . . . . . . . . . . . . . 494,760 216,023 190,453 18,190 919,426Intercompany cost of revenues . . . . . . . . . . (8,483) — 103,446 (94,963) —
Total cost of revenues . . . . . . . . . . . . 486,277 216,023 293,899 (76,773) 919,426
Gross margin (loss) . . . . . . . . . . . . . . . . . . 597,237 94,963 359,490 (18,190) 1,033,500Operating expenses . . . . . . . . . . . . . . . . . . . 798,249 102,574 122,614 (18,190) 1,005,247Intercompany operating expenses . . . . . . . (110,688) (93,272) 203,960 — —
Total operating expenses . . . . . . . . . . 687,561 9,302 326,574 (18,190) 1,005,247
Income (loss) from operations . . . . . . . . . . (90,324) 85,661 32,916 — 28,253Other income (expense) . . . . . . . . . . . . . . . (88,035) (27,998) 13,755 — (102,278)Intercompany other income (expense) . . . . (24) (16,729) 16,753 — —
Total other income (expense) . . . . . . . (88,059) (44,727) 30,508 — (102,278)
Income (loss) before income tax provision(benefit) . . . . . . . . . . . . . . . . . . . . . . . . . (178,383) 40,934 63,424 — (74,025)
Income tax provision (benefit) . . . . . . . . . . (915) (3,007) 11,281 — 7,359
Net income . . . . . . . . . . . . . . . . . . . . . $ (177,468) $ 43,941 $ 52,143 $ — $ (81,384)
119

BROCADE COMMUNICATIONS SYSTEMS, INC.
NOTES TO CONSOLIDATED FINANCIAL STATEMENTS—(Continued)
The following is the consolidated statement of operations for fiscal year ended October 25, 2008(in thousands):
BrocadeCommunicationsSystems, Inc.
SubsidiaryGuarantors
ForeignNon-
GuarantorSubsidiaries
ConsolidatingAdjustments Total
Revenues . . . . . . . . . . . . . . . . . . . . . . . . . . $ 896,495 $ 34,784 $535,658 $ — $1,466,937Intercompany revenues . . . . . . . . . . . . . . . 15,108 — 15,423 (30,531) —
Total net revenues . . . . . . . . . . . . . . . 911,603 34,784 551,081 (30,531) 1,466,937Cost of revenues . . . . . . . . . . . . . . . . . . . . . 434,275 15,572 152,814 3,904 606,565Intercompany cost of revenues . . . . . . . . . . (45,157) — 75,688 (30,531) —
Total cost of revenues . . . . . . . . . . . . 389,118 15,572 228,502 (26,627) 606,565
Gross margin . . . . . . . . . . . . . . . . . . . . . . . 522,485 19,212 322,579 (3,904) 860,372Operating expenses . . . . . . . . . . . . . . . . . . . 698,388 34,992 102,148 (3,904) 831,624Intercompany operating expenses . . . . . . . (82,576) (81,511) 164,087 — —
Total operating expenses . . . . . . . . . . 615,812 (46,519) 266,235 (3,904) 831,624
Income (loss) from operations . . . . . . . . . . (93,327) 65,731 56,344 — 28,748Other income (expense) . . . . . . . . . . . . . . . (9,354) (16,788) 20,135 — (6,007)Intercompany other income (expense) . . . . 53,584 (54,108) 524 — —
Total other income (expense) . . . . . . . 44,230 (70,896) 20,659 — (6,007)
Income (loss) before income tax provision(benefit) . . . . . . . . . . . . . . . . . . . . . . . . . (49,097) (5,165) 77,003 — 22,741
Income tax provision (benefit) . . . . . . . . . . (131,769) (21,334) 8,452 — (144,651)
Net income (loss) . . . . . . . . . . . . . . . . $ 82,672 $ 16,169 $ 68,551 $ — $ 167,392
120
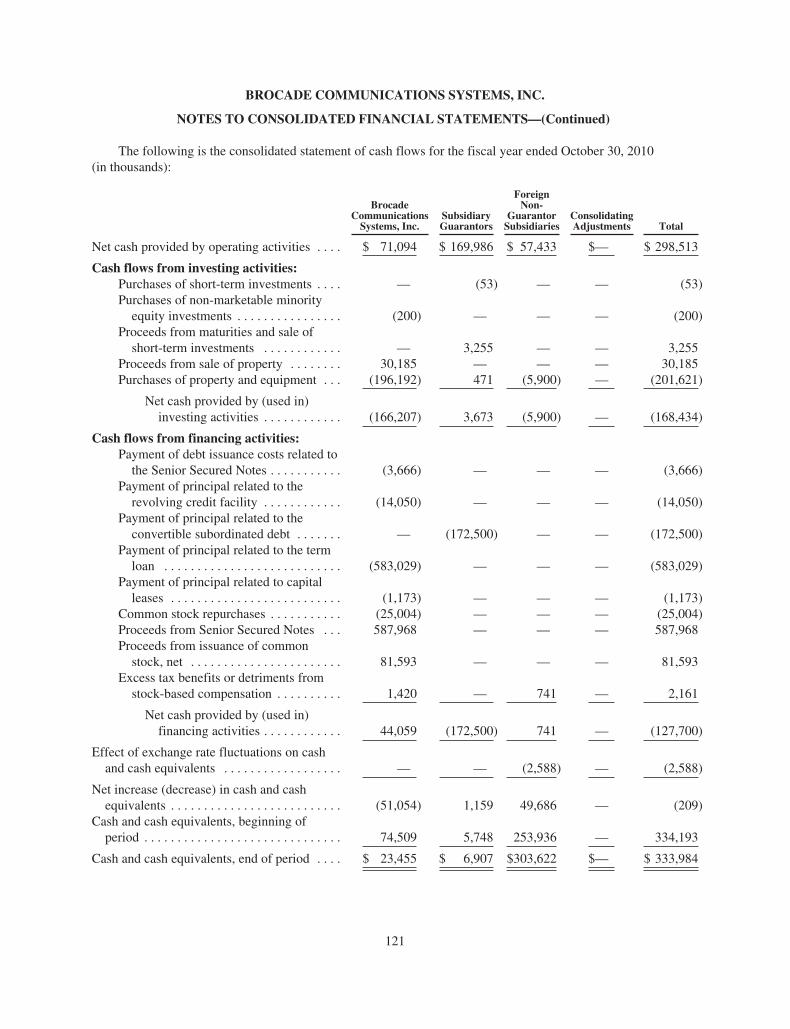
BROCADE COMMUNICATIONS SYSTEMS, INC.
NOTES TO CONSOLIDATED FINANCIAL STATEMENTS—(Continued)
The following is the consolidated statement of cash flows for the fiscal year ended October 30, 2010(in thousands):
BrocadeCommunicationsSystems, Inc.
SubsidiaryGuarantors
ForeignNon-
GuarantorSubsidiaries
ConsolidatingAdjustments Total
Net cash provided by operating activities . . . . $ 71,094 $ 169,986 $ 57,433 $— $ 298,513
Cash flows from investing activities:Purchases of short-term investments . . . . — (53) — — (53)Purchases of non-marketable minorityequity investments . . . . . . . . . . . . . . . . (200) — — — (200)
Proceeds from maturities and sale ofshort-term investments . . . . . . . . . . . . — 3,255 — — 3,255
Proceeds from sale of property . . . . . . . . 30,185 — — — 30,185Purchases of property and equipment . . . (196,192) 471 (5,900) — (201,621)
Net cash provided by (used in)investing activities . . . . . . . . . . . . (166,207) 3,673 (5,900) — (168,434)
Cash flows from financing activities:Payment of debt issuance costs related tothe Senior Secured Notes . . . . . . . . . . . (3,666) — — — (3,666)
Payment of principal related to therevolving credit facility . . . . . . . . . . . . (14,050) — — — (14,050)
Payment of principal related to theconvertible subordinated debt . . . . . . . — (172,500) — — (172,500)
Payment of principal related to the termloan . . . . . . . . . . . . . . . . . . . . . . . . . . . (583,029) — — — (583,029)
Payment of principal related to capitalleases . . . . . . . . . . . . . . . . . . . . . . . . . . (1,173) — — — (1,173)
Common stock repurchases . . . . . . . . . . . (25,004) — — — (25,004)Proceeds from Senior Secured Notes . . . 587,968 — — — 587,968Proceeds from issuance of commonstock, net . . . . . . . . . . . . . . . . . . . . . . . 81,593 — — — 81,593
Excess tax benefits or detriments fromstock-based compensation . . . . . . . . . . 1,420 — 741 — 2,161
Net cash provided by (used in)financing activities . . . . . . . . . . . . 44,059 (172,500) 741 — (127,700)
Effect of exchange rate fluctuations on cashand cash equivalents . . . . . . . . . . . . . . . . . . — — (2,588) — (2,588)
Net increase (decrease) in cash and cashequivalents . . . . . . . . . . . . . . . . . . . . . . . . . . (51,054) 1,159 49,686 — (209)
Cash and cash equivalents, beginning ofperiod . . . . . . . . . . . . . . . . . . . . . . . . . . . . . . 74,509 5,748 253,936 — 334,193
Cash and cash equivalents, end of period . . . . $ 23,455 $ 6,907 $303,622 $— $ 333,984
121

BROCADE COMMUNICATIONS SYSTEMS, INC.
NOTES TO CONSOLIDATED FINANCIAL STATEMENTS—(Continued)
The following is the consolidated statement of cash flows for the fiscal year ended October 31, 2009(in thousands):
BrocadeCommunicationsSystems, Inc.
SubsidiaryGuarantors
ForeignNon-
GuarantorSubsidiaries
ConsolidatingAdjustments Total
Net cash provided by (used in) operatingactivities . . . . . . . . . . . . . . . . . . . . . . . . . . $ 126,459 $ (465) $ (10,470) $— $ 115,524
Cash flows from investing activities:Purchases of short-term investments . . — (138) — — (138)Proceeds from maturities and sale ofshort-term investments . . . . . . . . . . . 101,083 149 54,754 — 155,986
Proceeds from maturities and sale oflong-term investments . . . . . . . . . . . . 18,115 — 12,058 — 30,173
Purchases of property andequipment . . . . . . . . . . . . . . . . . . . . . (153,186) (2,464) (7,120) — (162,770)
Decrease in restricted cash . . . . . . . . . . 1,075,079 — — — 1,075,079Net cash paid in connection withacquisitions . . . . . . . . . . . . . . . . . . . . (1,297,482) — — — (1,297,482)
Net cash provided by (used in)investing activities . . . . . . . . . . (256,391) (2,453) 59,692 — (199,152)
Cash flows from financing activities:Payment of senior underwriting feesrelated to the term loan . . . . . . . . . . . (30,525) — — — (30,525)
Payment of principal related to the termloan . . . . . . . . . . . . . . . . . . . . . . . . . . (166,022) — — — (166,022)
Proceeds from issuance of commonstock, net . . . . . . . . . . . . . . . . . . . . . . 145,655 — — — 145,655
Proceeds from revolving creditfacility . . . . . . . . . . . . . . . . . . . . . . . . 14,050 — — — 14,050
Excess tax benefits or detriments fromstock-based compensation . . . . . . . . (794) — — — (794)
Net cash used in financingactivities . . . . . . . . . . . . . . . . . . (37,636) — — — (37,636)
Effect of exchange rate fluctuations on cashand cash equivalents . . . . . . . . . . . . . . . . . — — 1,573 — 1,573
Net increase (decrease) in cash and cashequivalents . . . . . . . . . . . . . . . . . . . . . . . . (167,568) (2,918) 50,795 — (119,691)
Cash and cash equivalents, beginning ofperiod . . . . . . . . . . . . . . . . . . . . . . . . . . . . 242,078 8,666 203,140 — 453,884
Cash and cash equivalents, end of period . . . $ 74,510 $ 5,748 $253,935 $— $ 334,193
122

BROCADE COMMUNICATIONS SYSTEMS, INC.
NOTES TO CONSOLIDATED FINANCIAL STATEMENTS—(Continued)
The following is the consolidated statement of cash flows for the fiscal year ended October 25, 2008(in thousands):
BrocadeCommunicationsSystems, Inc.
SubsidiaryGuarantors
ForeignNon-
GuarantorSubsidiaries
ConsolidatingAdjustments Total
Net cash provided by operating activities . . . $ 358,043 $2,861 $ 77,591 $— $ 438,495
Cash flows from investing activities:Purchases of short-term investments . . (93,690) (146) (75,180) — (169,016)Purchases of long-term investments . . . (15,322) — (22,409) — (37,731)Purchases of marketable equitysecurities . . . . . . . . . . . . . . . . . . . . . . (248,431) — — — (248,431)
Purchases of non-marketable equityinvestments . . . . . . . . . . . . . . . . . . . . (1,436) — — — (1,436)
Proceeds from maturities and sale ofshort-term investments . . . . . . . . . . . 327,968 4,908 115,509 — 448,385
Proceeds from maturities and sale oflong-term investments . . . . . . . . . . . . 22,483 — — — 22,483
Proceeds from maturities and sale ofmarketable equity securities . . . . . . . 9,926 — — — 9,926
Purchases of property andequipment . . . . . . . . . . . . . . . . . . . . . (136,829) (65) (7,177) — (144,071)
Increase in restricted cash . . . . . . . . . . . (1,075,079) — — — (1,075,079)Cash paid in connection with pendingacquisition of Foundry Networks,Inc. . . . . . . . . . . . . . . . . . . . . . . . . . . . (1,000) — — — (1,000)
Net cash paid in connection withacquisitions . . . . . . . . . . . . . . . . . . . . (43,554) — — — (43,554)
Net cash provided by (used in)investing activities . . . . . . . . . . (1,254,964) 4,697 10,743 — (1,239,524)
Cash flows from financing activities:Common stock repurchases . . . . . . . . . (168,293) — — — (168,293)Proceeds from issuance of commonstock, net . . . . . . . . . . . . . . . . . . . . . . 42,418 — — — 42,418
Proceeds from term loan . . . . . . . . . . . . 1,054,425 — — — 1,054,425Excess tax benefits or detriments fromstock-based compensation . . . . . . . . 16,146 — — — 16,146
Net cash provided by financingactivities . . . . . . . . . . . . . . . . . . 944,696 — — — 944,696
Effect of exchange rate fluctuations on cashand cash equivalents . . . . . . . . . . . . . . . . . — — (5,538) — (5,538)
Net increase in cash and cash equivalents . . 47,775 7,558 82,796 — 138,129Cash and cash equivalents, beginning ofperiod . . . . . . . . . . . . . . . . . . . . . . . . . . . . 194,303 1,108 120,344 — 315,755
Cash and cash equivalents, end of period . . . $ 242,078 $8,666 $203,140 $— $ 453,884
123
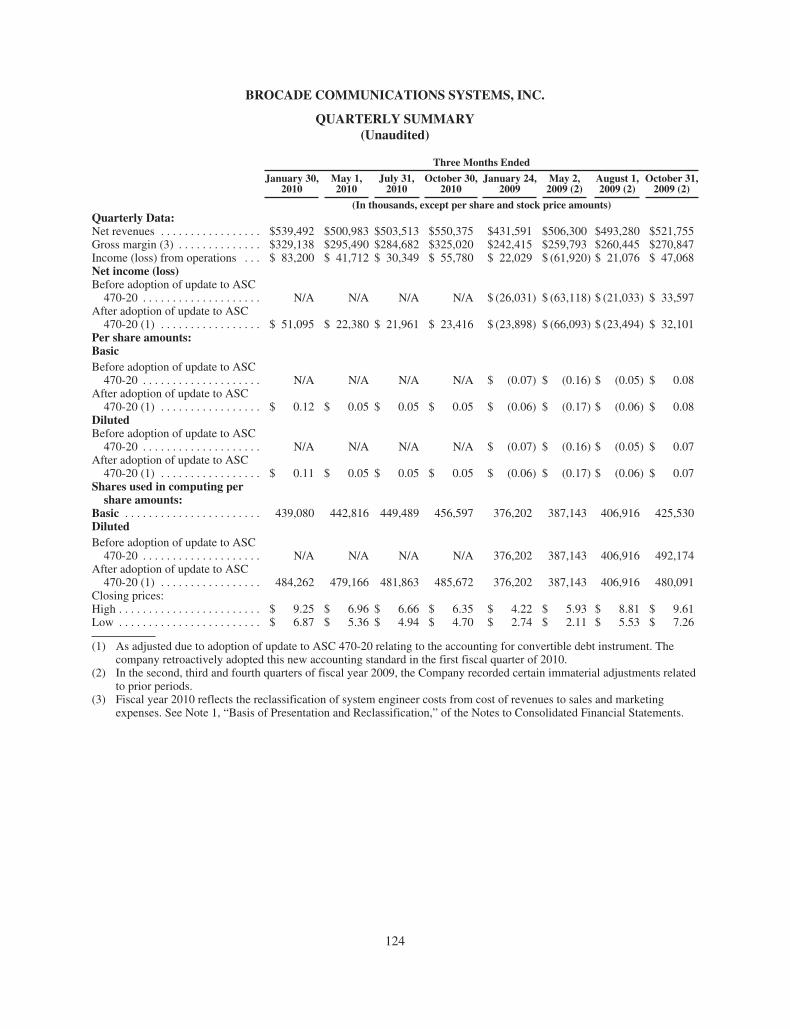
BROCADE COMMUNICATIONS SYSTEMS, INC.
QUARTERLY SUMMARY(Unaudited)
Three Months Ended
January 30,2010
May 1,2010
July 31,2010
October 30,2010
January 24,2009
May 2,2009 (2)
August 1,2009 (2)
October 31,2009 (2)
(In thousands, except per share and stock price amounts)Quarterly Data:Net revenues . . . . . . . . . . . . . . . . . $539,492 $500,983 $503,513 $550,375 $431,591 $506,300 $493,280 $521,755Gross margin (3) . . . . . . . . . . . . . . $329,138 $295,490 $284,682 $325,020 $242,415 $259,793 $260,445 $270,847Income (loss) from operations . . . $ 83,200 $ 41,712 $ 30,349 $ 55,780 $ 22,029 $ (61,920) $ 21,076 $ 47,068Net income (loss)Before adoption of update to ASC470-20 . . . . . . . . . . . . . . . . . . . . N/A N/A N/A N/A $ (26,031) $ (63,118) $ (21,033) $ 33,597
After adoption of update to ASC470-20 (1) . . . . . . . . . . . . . . . . . $ 51,095 $ 22,380 $ 21,961 $ 23,416 $ (23,898) $ (66,093) $ (23,494) $ 32,101
Per share amounts:BasicBefore adoption of update to ASC470-20 . . . . . . . . . . . . . . . . . . . . N/A N/A N/A N/A $ (0.07) $ (0.16) $ (0.05) $ 0.08
After adoption of update to ASC470-20 (1) . . . . . . . . . . . . . . . . . $ 0.12 $ 0.05 $ 0.05 $ 0.05 $ (0.06) $ (0.17) $ (0.06) $ 0.08
DilutedBefore adoption of update to ASC470-20 . . . . . . . . . . . . . . . . . . . . N/A N/A N/A N/A $ (0.07) $ (0.16) $ (0.05) $ 0.07
After adoption of update to ASC470-20 (1) . . . . . . . . . . . . . . . . . $ 0.11 $ 0.05 $ 0.05 $ 0.05 $ (0.06) $ (0.17) $ (0.06) $ 0.07
Shares used in computing pershare amounts:
Basic . . . . . . . . . . . . . . . . . . . . . . . 439,080 442,816 449,489 456,597 376,202 387,143 406,916 425,530DilutedBefore adoption of update to ASC470-20 . . . . . . . . . . . . . . . . . . . . N/A N/A N/A N/A 376,202 387,143 406,916 492,174
After adoption of update to ASC470-20 (1) . . . . . . . . . . . . . . . . . 484,262 479,166 481,863 485,672 376,202 387,143 406,916 480,091
Closing prices:High . . . . . . . . . . . . . . . . . . . . . . . . $ 9.25 $ 6.96 $ 6.66 $ 6.35 $ 4.22 $ 5.93 $ 8.81 $ 9.61Low . . . . . . . . . . . . . . . . . . . . . . . . $ 6.87 $ 5.36 $ 4.94 $ 4.70 $ 2.74 $ 2.11 $ 5.53 $ 7.26
(1) As adjusted due to adoption of update to ASC 470-20 relating to the accounting for convertible debt instrument. Thecompany retroactively adopted this new accounting standard in the first fiscal quarter of 2010.
(2) In the second, third and fourth quarters of fiscal year 2009, the Company recorded certain immaterial adjustments relatedto prior periods.
(3) Fiscal year 2010 reflects the reclassification of system engineer costs from cost of revenues to sales and marketingexpenses. See Note 1, “Basis of Presentation and Reclassification,” of the Notes to Consolidated Financial Statements.
124

Item 9. Changes in and Disagreements With Accountants on Accounting and Financial Disclosure
None.
Item 9A. Controls and Procedures
Evaluation of Disclosure Controls and Procedures
Under the supervision and with the participation of our management, including our Chief Executive Officerand Chief Financial Officer, we conducted an evaluation of the effectiveness of our disclosure controls andprocedures, as defined in Rules 13a-15(e) and 15d-15(e) under the Securities Exchange Act of 1934, as amended,as of the end of the period covered by this Annual Report on Form 10-K (the “Evaluation Date”).
The purpose of this evaluation is to determine if, as of the Evaluation Date, our disclosure controls andprocedures are effective such that the information required to be disclosed in our Securities and ExchangeCommission (“SEC”) reports (i) is recorded, processed, summarized and reported within the time periodsspecified in SEC rules and forms, and (ii) is accumulated and communicated to our management, including ourChief Executive Officer and Chief Financial Officer, as appropriate to allow timely decisions regarding requireddisclosure.
Based on this evaluation, our Chief Executive Officer and Chief Financial Officer concluded that, as of theEvaluation Date, our disclosure controls and procedures were effective.
Changes in Internal Control over Financial Reporting
There were no changes in our internal control over financial reporting that occurred during the quarter endedOctober 30, 2010 that have materially affected, or are reasonably likely to materially affect, our internal controlover financial reporting.
Management’s Report on Internal Control over Financial Reporting
The management of Brocade Communications Systems, Inc. is responsible for establishing and maintainingadequate internal control over financial reporting as defined in Rule 13a-15(f) or 15d-15(f) of the SecuritiesExchange Act of 1934. The Company’s internal control over financial reporting is a process designed by, orunder the supervision of, the Company’s principal executive and principal financial officers, and effected by theCompany’s Board of Directors, management and other personnel, to provide reasonable assurance regarding thereliability of financial reporting and the preparation of financial statements for external purposes in accordancewith generally accepted accounting principles and includes those policies and procedures that:
• pertain to the maintenance of records that in reasonable detail accurately and fairly reflect thetransactions and dispositions of the assets of the Company;
• provide reasonable assurance that transactions are recorded as necessary to permit preparation offinancial statements in accordance with generally accepted accounting principles, and that receipts andexpenditures of the Company are being made only in accordance with authorizations of managementand directors of the Company; and
• provide reasonable assurance regarding prevention or timely detection of unauthorized acquisition, useor disposition of the Company’s assets that could have a material effect on the financial statements.
Our management, including our Chief Executive Officer and Chief Financial Officer, does not expect thatour disclosure controls and procedures or internal control over financial reporting will prevent all errors and allfraud. A control system, no matter how well designed and implemented, can provide only reasonable, notabsolute, assurance that the control system’s objectives will be met. Further, the design of a control system must
125

reflect the fact that there are resource constraints and the benefits of controls must be considered relative to theircosts. Because of the inherent limitations in all control systems, no evaluation of controls can provide absoluteassurance that all control issues within a company are detected. The inherent limitations include the realities thatjudgments in decision-making can be faulty and that breakdowns can occur because of simple errors or mistakes.Controls can also be circumvented by the individual acts of some persons, by collusion of two or more people orby management override of the controls. Because of the inherent limitations in a cost-effective control system,misstatements due to error or fraud may occur and may not be detected.
Our management assessed the effectiveness of the Company’s internal control over financial reporting as ofOctober 30, 2010, utilizing the criteria set forth by the Committee of Sponsoring Organizations of the TreadwayCommission in Internal Control—Integrated Framework. Based on our management’s assessment, we believethat, as of October 30, 2010, our internal control over financial reporting was effective based on those criteria.The effectiveness of our internal control over financial reporting as of October 30, 2010 has been audited byKPMG LLP, Brocade’s independent registered public accounting firm, as stated in their report which is includedon page 127 of this Annual Report on Form 10-K.
126
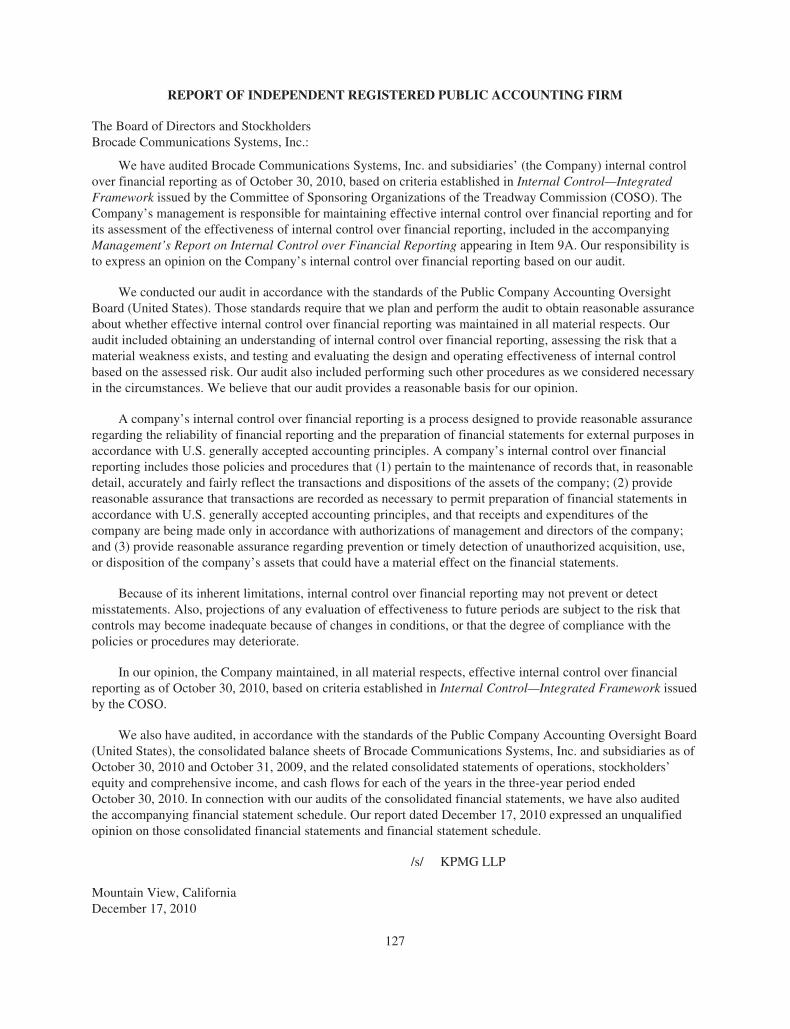
REPORT OF INDEPENDENT REGISTERED PUBLIC ACCOUNTING FIRM
The Board of Directors and StockholdersBrocade Communications Systems, Inc.:
We have audited Brocade Communications Systems, Inc. and subsidiaries’ (the Company) internal controlover financial reporting as of October 30, 2010, based on criteria established in Internal Control—IntegratedFramework issued by the Committee of Sponsoring Organizations of the Treadway Commission (COSO). TheCompany’s management is responsible for maintaining effective internal control over financial reporting and forits assessment of the effectiveness of internal control over financial reporting, included in the accompanyingManagement’s Report on Internal Control over Financial Reporting appearing in Item 9A. Our responsibility isto express an opinion on the Company’s internal control over financial reporting based on our audit.
We conducted our audit in accordance with the standards of the Public Company Accounting OversightBoard (United States). Those standards require that we plan and perform the audit to obtain reasonable assuranceabout whether effective internal control over financial reporting was maintained in all material respects. Ouraudit included obtaining an understanding of internal control over financial reporting, assessing the risk that amaterial weakness exists, and testing and evaluating the design and operating effectiveness of internal controlbased on the assessed risk. Our audit also included performing such other procedures as we considered necessaryin the circumstances. We believe that our audit provides a reasonable basis for our opinion.
A company’s internal control over financial reporting is a process designed to provide reasonable assuranceregarding the reliability of financial reporting and the preparation of financial statements for external purposes inaccordance with U.S. generally accepted accounting principles. A company’s internal control over financialreporting includes those policies and procedures that (1) pertain to the maintenance of records that, in reasonabledetail, accurately and fairly reflect the transactions and dispositions of the assets of the company; (2) providereasonable assurance that transactions are recorded as necessary to permit preparation of financial statements inaccordance with U.S. generally accepted accounting principles, and that receipts and expenditures of thecompany are being made only in accordance with authorizations of management and directors of the company;and (3) provide reasonable assurance regarding prevention or timely detection of unauthorized acquisition, use,or disposition of the company’s assets that could have a material effect on the financial statements.
Because of its inherent limitations, internal control over financial reporting may not prevent or detectmisstatements. Also, projections of any evaluation of effectiveness to future periods are subject to the risk thatcontrols may become inadequate because of changes in conditions, or that the degree of compliance with thepolicies or procedures may deteriorate.
In our opinion, the Company maintained, in all material respects, effective internal control over financialreporting as of October 30, 2010, based on criteria established in Internal Control—Integrated Framework issuedby the COSO.
We also have audited, in accordance with the standards of the Public Company Accounting Oversight Board(United States), the consolidated balance sheets of Brocade Communications Systems, Inc. and subsidiaries as ofOctober 30, 2010 and October 31, 2009, and the related consolidated statements of operations, stockholders’equity and comprehensive income, and cash flows for each of the years in the three-year period endedOctober 30, 2010. In connection with our audits of the consolidated financial statements, we have also auditedthe accompanying financial statement schedule. Our report dated December 17, 2010 expressed an unqualifiedopinion on those consolidated financial statements and financial statement schedule.
/s/ KPMG LLP
Mountain View, CaliforniaDecember 17, 2010
127

Item 9B. Other Information
None.
PART III
Certain information required by Part III is incorporated by reference from the Company’s definitive ProxyStatement to be filed with the Securities and Exchange Commission in connection with the solicitation of proxiesfor the Company’s 2011 Annual Meeting of Stockholders (the “Proxy Statement”).
Item 10. Directors, Executive Officers and Corporate Governance
The information required by this Item with respect to the Company’s directors is incorporated by referencefrom the Proxy Statement under the section entitled “Election of Directors.” The information required by thisItem with respect to the Company’s executive officers is incorporated by reference from the Proxy Statementunder the section entitled “Executive Officers” and “Board of Directors Meetings and Committees.” Theinformation required by this Item with respect to disclosure of any known late filing or failure by an insider tofile a report required by Section 16 of the Exchange Act is incorporated by reference from the Proxy Statementunder the section entitled “Section 16(a) Beneficial Ownership Reporting Compliance.” The informationregarding the Company’s corporate governance is incorporated by reference from the Proxy Statement.
The Board of Directors has adopted a Code of Ethics for Principal Executive and Senior Financial Officers(the “Code of Ethics”), which applies to the Company’s Chief Executive Officer, Chief Financial Officer and anyother principal financial officer, controller and any other principal accounting officer, and any other personperforming similar functions. The Code of Ethics is available on the Company’s Web site at www.brocade.comin the “Corporate Governance” section of its investor relations webpage. The Company will also provide a copyof the Code of Ethics upon request made by email to [email protected] or in writing to Brocade CommunicationsSystems, Inc., Attention: Investor Relations, 130 Holger Way, San Jose, California 95134. The Company willdisclose any amendment to the Code of Ethics or waiver of a provision of the Code of Ethics that applies to theCompany’s Chief Executive Officer, Chief Financial Officer and any other principal financial officer, controllerand any other principal accounting officer, and any other person performing similar functions, and relate tocertain elements of the Code of Ethics, including the name of the officer to whom the waiver was granted, on itsWeb site at www.brocade.com on its investor relations webpage.
Item 11. Executive Compensation
The information required by this Item is incorporated by reference from the Proxy Statement under thesection entitled “Executive Compensation and Other Matters.”
Item 12. Security Ownership of Certain Beneficial Owners and Management and Related StockholderMatters
The information required by this Item is incorporated by reference from the Proxy Statement under thesections entitled “Security Ownership of Certain Beneficial Owners and Management” and “Board of DirectorsMeetings and Committees.”
Item 13. Certain Relationships and Related Transactions, and Director Independence
The information required by this Item is incorporated by reference from the Proxy Statement under thesection entitled “Certain Relationships and Related Transactions.”
Item 14. Principal Accountant Fees and Services
The information required by this Item is incorporated by reference from the Proxy Statement under thesection entitled “Ratification of Selection of Independent Registered Public Accountants.”
128

PART IV
Item 15. Exhibits and Financial Statement Schedules
(a) The following documents are filed as a part of this Form 10-K:
1. Financial Statements:
The following financial statements of Brocade Communications Systems, Inc. are filed as a part of thisAnnual Report.
Page
Report of Independent Registered Public Accounting Firm . . . . . . . . . . . . . . . . . . . . . . . . . . . . . . . . . . . . . . 62Consolidated Statements of Operations . . . . . . . . . . . . . . . . . . . . . . . . . . . . . . . . . . . . . . . . . . . . . . . . . . . . . . 63Consolidated Balance Sheets . . . . . . . . . . . . . . . . . . . . . . . . . . . . . . . . . . . . . . . . . . . . . . . . . . . . . . . . . . . . . . 64Consolidated Statements of Stockholders’ Equity and Comprehensive Income . . . . . . . . . . . . . . . . . . . . . . . 65Consolidated Statements of Cash Flows . . . . . . . . . . . . . . . . . . . . . . . . . . . . . . . . . . . . . . . . . . . . . . . . . . . . . 66Notes to Consolidated Financial Statements . . . . . . . . . . . . . . . . . . . . . . . . . . . . . . . . . . . . . . . . . . . . . . . . . . 68Quarterly Summary (Unaudited) . . . . . . . . . . . . . . . . . . . . . . . . . . . . . . . . . . . . . . . . . . . . . . . . . . . . . . . . . . . 124Report of Independent Registered Public Accounting Firm . . . . . . . . . . . . . . . . . . . . . . . . . . . . . . . . . . . . . . 127
2. Financial Statement Schedules:
The following financial statement schedule of Brocade Communications Systems, Inc. for the years endedOctober 30, 2010, October 31, 2009 and October 25, 2008 is filed as part of this Annual Report and should beread in conjunction with the Consolidated Financial Statements of Brocade Communications Systems, Inc.
Schedule II — Valuation and Qualifying Accounts . . . . . . . . . . . . . . . . . . . . . . . . . . . . . . . . . . . . . . . . Page 141
All other schedules have been omitted as the required information is inapplicable or the information ispresented in the Consolidated Financial Statements and notes thereto under Item 8 in Part II of this Form 10-K.
3. Exhibits:
EXHIBIT INDEX
ExhibitNumber Description of Document
3.1 Amended and Restated Certificate of Incorporation (incorporated by reference to Exhibit 3.1 fromBrocade’s quarterly report on Form 10-Q for the quarter ended July 28, 2007)
3.2 Certificates of Correction and Corrected Amended and Restated Certificate of Incorporation effectiveas of June 1, 2009 (incorporated by reference to Exhibit 3.5 from Brocade’s quarterly report onForm 10-Q for the quarter ended May 2, 2009)
3.3 Certificate of Amendment to Amended and Restated Certificate of Incorporation effective as ofApril 13, 2010 (incorporated by reference to Exhibit 3.1 from Brocade’s Form 8-K filed on April 13,2010)
3.4 Amended and Restated Bylaws of the Registrant effective as of April 13, 2010 (incorporated byreference to Exhibit 3.2 from Brocade’s Form 8-K filed on April 13, 2010)
3.5 Certificate of Designation of Rights, Preferences and Privileges of Series A Participating PreferredStock of Brocade Communications Systems, Inc. (incorporated by reference to Exhibit 4.1 fromBrocade’s Registration Statement on Form 8-A filed on February 11, 2002)
129

ExhibitNumber Description of Document
3.6 Certificate of Elimination of Series A Participating Preferred Stock of Brocade (incorporated byreference to Exhibit 3.1 from Brocade’s Form 8-K filed on February 16, 2007)
4.1 Form of Registrant’s Common Stock certificate (incorporated by reference to Exhibit 4.1 fromBrocade’s Registration Statement on Form S-1 (Reg. No. 333-74711), as amended)
4.2 First Supplemental Indenture dated as of January 29, 2007 by and among McDATA Corporation,Brocade, and Wells Fargo Bank, National Association, as successor in interest to Wells Fargo BankMinnesota, National Association (incorporated by reference to Exhibit 4.2 from Brocade’sForm 10-Q for the quarter ended April 28, 2007)
4.3 Second Supplemental Indenture dated as of January 29, 2007 by and among McDATA Corporation,McDATA Services Corporation, a Minnesota corporation f/k/a Computer Network TechnologyCorporation, Brocade, and U.S. Bank National Association (incorporated by reference to Exhibit 4.3from Brocade’s Form 10-Q for the quarter ended April 28, 2007)
4.4 Indenture dated February 7, 2003 by and among McDATA Corporation and Wells Fargo BankMinnesota National Association (incorporated by reference to Exhibit 4.4 from Brocade’s Form 10-Qfor the quarter ended April 28, 2007)
4.5 Indenture dated February 20, 2002 by and among Computer Network Technology Corporation andU.S. Bank National Association (incorporated by reference to Exhibit 4.5 from Brocade’s Form 10-Qfor the quarter ended April 28, 2007)
4.6 Indenture, dated as of January 20, 2010, by and among Brocade, the Subsidiary Guarantors namedtherein and Wells Fargo Bank, National Association, as Trustee, governing the 2018 Notes(incorporated by reference to Exhibit 4.1 from Brocade’s Form 8-K filed on January 26, 2010)
4.7 Indenture, dated as of January 20, 2010, by and among Brocade, the Subsidiary Guarantors namedtherein and Wells Fargo Bank, National Association, as Trustee, governing the 2020 Notes(incorporated by reference to Exhibit 4.2 from Brocade’s Form 8-K filed on January 26, 2010)
10.1 Form of Indemnification Agreement entered into between Brocade and each of its directors andexecutive officers (incorporated by reference to Exhibit 10.1 from Brocade’s Registration Statementon Form S-1 (Reg. No. 333-74711), as amended)
10.2 Master Lease Agreement between Spieker Properties and Brocade dated December 17, 1999(incorporated by reference to Exhibit 10.25 from Brocade’s Annual Report on Form 10-K for thefiscal year ended October 31, 1999, as amended)
10.3 First Amendment to Lease between Spieker Properties and Brocade dated February 16, 2000(incorporated by reference to Exhibit 10.22 from Brocade’s Annual Report on Form 10-K for thefiscal year ended October 28, 2000)
10.4 Second Amendment to Lease between Spieker Properties and Brocade dated August 11, 2000(incorporated by reference to Exhibit 10.23 from Brocade’s Annual Report on Form 10-K for thefiscal year ended October 28, 2000)
10.5 Master Lease Agreement between Spieker Properties and Brocade dated July 26, 2000 (incorporatedby reference to Exhibit 10.27 from Brocade’s Annual Report on Form 10-K for the fiscal year endedOctober 28, 2000)
10.6† Goods Agreement between International Business Machines Corporation and Brocade datedApril 15, 1999 (incorporated by reference to Exhibit 10.24 from Brocade’s Annual Report onForm 10-K for the fiscal year ended October 27, 2001)
130

ExhibitNumber Description of Document
10.7 Amendment #1 to the Goods Agreement between International Business Machines Corporation andBrocade (incorporated by reference to Exhibit 10.25 from Brocade’s Annual Report on Form 10-Kfor the fiscal year ended October 27, 2001)
10.8† Statement of Work #1 between International Business Machines Corporation and Brocade(incorporated by reference to Exhibit 10.26 from Brocade’s Annual Report on Form 10-K for thefiscal year ended October 27, 2001)
10.9† Amendment #3 to Statement of Work #1 between International Business Machines Corporation andBrocade (incorporated by reference to Exhibit 10.27 from Brocade’s Annual Report on Form 10-Kfor the fiscal year ended October 27, 2001)
10.10† Amendment #4 to Statement of Work #1 between International Business Machines Corporation andBrocade (incorporated by reference to Exhibit 10.28 from Brocade’s Annual Report on Form 10-Kfor the fiscal year ended October 27, 2001)
10.11 Lease Agreement between MV Golden State San Jose, LLC and Brocade dated December 1, 2000(incorporated by reference to Exhibit 10.1 from Brocade’s Quarterly Report on Form 10-Q for thefiscal quarter ended January 27, 2001)
10.12† Amendment No. 5 to Statement of Work No. 1 between International Business MachinesCorporation and Brocade (incorporated by reference to Exhibit 10.2 from Brocade’s QuarterlyReport on Form 10-Q for the fiscal quarter ended April 27, 2002)
10.13† Amendment No. 6 to Statement of Work No. 1 between International Business MachinesCorporation and Brocade (incorporated by reference to Exhibit 10.3 from Brocade’s QuarterlyReport on Form 10-Q for the fiscal quarter ended April 27, 2002)
10.14† Amendment No. 7 to Statement of Work No. 1 between International Business MachinesCorporation and Brocade (incorporated by reference to Exhibit 10.37 from Brocade’s QuarterlyReport on Form 10-Q for the fiscal quarter ended July 27, 2002)
10.15† Amendment No. 8 to Statement of Work No. 1 between International Business MachinesCorporation and Brocade (incorporated by reference to Exhibit 10.36 from Brocade’s Form 10-Q forthe quarter ended January 25, 2003)
10.16† OEM Purchase Agreement between Brocade and Hewlett-Packard Company dated December 16,2002 (incorporated by reference to Exhibit 10.48 from Brocade’s Form 10-Q for the quarter endedJanuary 25, 2003)
10.17† Manufacturing and Purchase Agreement between Brocade and Hon Hai Precision Industry Co., Ltd.dated April 5, 2003 (HHPI Manufacturing and Purchase Agreement) (incorporated by reference toExhibit 10.49 from Brocade’s Quarterly Report on Form 10-Q for the fiscal quarter ended April 26,2003)
10.18 Amendment Number One to HHPI Manufacturing and Purchase Agreement between Brocade andHon Hai Precision Industry Co., Ltd. dated April 5, 2003 (incorporated by reference to Exhibit 10.50from Brocade’s Quarterly Report on Form 10-Q for the fiscal quarter ended April 26, 2003)
10.19† Manufacturing and Purchase Agreement between Brocade Communications Switzerland SarL andHon Hai Precision Industry Co., Ltd. dated May 1, 2003 (incorporated by reference to Exhibit 10.51from Brocade’s Quarterly Report on Form 10-Q for the fiscal quarter ended April 26, 2003)
10.20† Manufacturing and Purchase Agreement between Brocade and Solectron Corporation datedFebruary 21, 2003 (Solectron Manufacturing and Purchase Agreement) (incorporated by reference toExhibit 10.52 from Brocade’s Quarterly Report on Form 10-Q for the fiscal quarter ended April 26,2003)
131
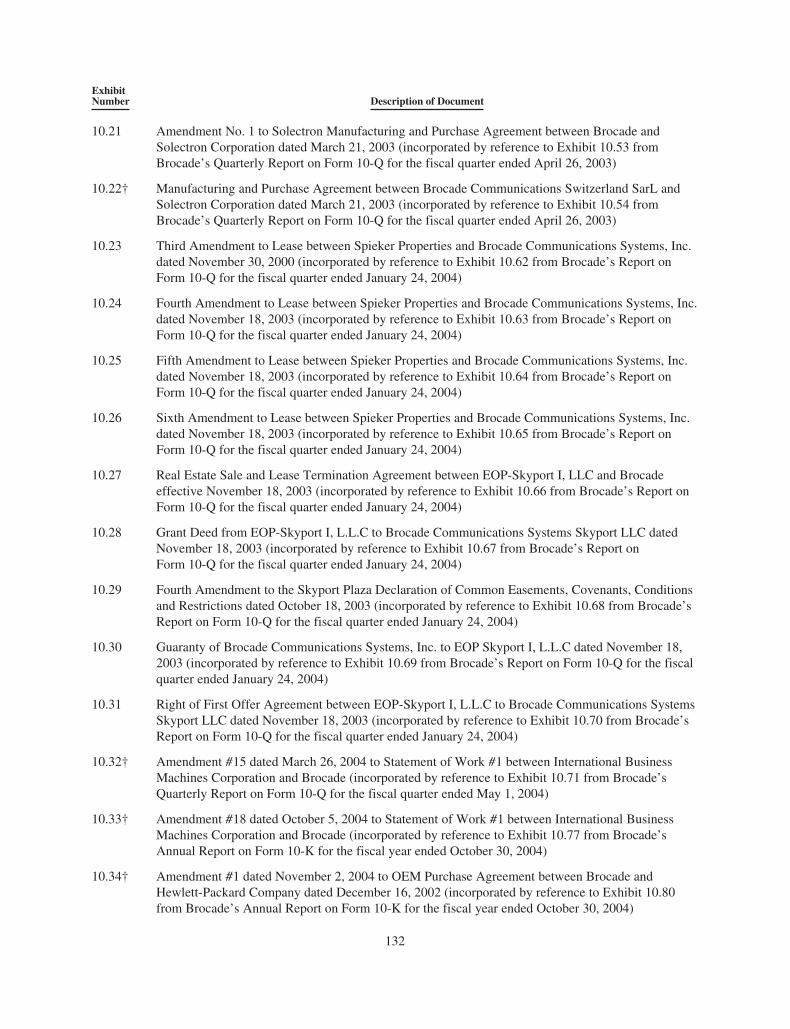
ExhibitNumber Description of Document
10.21 Amendment No. 1 to Solectron Manufacturing and Purchase Agreement between Brocade andSolectron Corporation dated March 21, 2003 (incorporated by reference to Exhibit 10.53 fromBrocade’s Quarterly Report on Form 10-Q for the fiscal quarter ended April 26, 2003)
10.22† Manufacturing and Purchase Agreement between Brocade Communications Switzerland SarL andSolectron Corporation dated March 21, 2003 (incorporated by reference to Exhibit 10.54 fromBrocade’s Quarterly Report on Form 10-Q for the fiscal quarter ended April 26, 2003)
10.23 Third Amendment to Lease between Spieker Properties and Brocade Communications Systems, Inc.dated November 30, 2000 (incorporated by reference to Exhibit 10.62 from Brocade’s Report onForm 10-Q for the fiscal quarter ended January 24, 2004)
10.24 Fourth Amendment to Lease between Spieker Properties and Brocade Communications Systems, Inc.dated November 18, 2003 (incorporated by reference to Exhibit 10.63 from Brocade’s Report onForm 10-Q for the fiscal quarter ended January 24, 2004)
10.25 Fifth Amendment to Lease between Spieker Properties and Brocade Communications Systems, Inc.dated November 18, 2003 (incorporated by reference to Exhibit 10.64 from Brocade’s Report onForm 10-Q for the fiscal quarter ended January 24, 2004)
10.26 Sixth Amendment to Lease between Spieker Properties and Brocade Communications Systems, Inc.dated November 18, 2003 (incorporated by reference to Exhibit 10.65 from Brocade’s Report onForm 10-Q for the fiscal quarter ended January 24, 2004)
10.27 Real Estate Sale and Lease Termination Agreement between EOP-Skyport I, LLC and Brocadeeffective November 18, 2003 (incorporated by reference to Exhibit 10.66 from Brocade’s Report onForm 10-Q for the fiscal quarter ended January 24, 2004)
10.28 Grant Deed from EOP-Skyport I, L.L.C to Brocade Communications Systems Skyport LLC datedNovember 18, 2003 (incorporated by reference to Exhibit 10.67 from Brocade’s Report onForm 10-Q for the fiscal quarter ended January 24, 2004)
10.29 Fourth Amendment to the Skyport Plaza Declaration of Common Easements, Covenants, Conditionsand Restrictions dated October 18, 2003 (incorporated by reference to Exhibit 10.68 from Brocade’sReport on Form 10-Q for the fiscal quarter ended January 24, 2004)
10.30 Guaranty of Brocade Communications Systems, Inc. to EOP Skyport I, L.L.C dated November 18,2003 (incorporated by reference to Exhibit 10.69 from Brocade’s Report on Form 10-Q for the fiscalquarter ended January 24, 2004)
10.31 Right of First Offer Agreement between EOP-Skyport I, L.L.C to Brocade Communications SystemsSkyport LLC dated November 18, 2003 (incorporated by reference to Exhibit 10.70 from Brocade’sReport on Form 10-Q for the fiscal quarter ended January 24, 2004)
10.32† Amendment #15 dated March 26, 2004 to Statement of Work #1 between International BusinessMachines Corporation and Brocade (incorporated by reference to Exhibit 10.71 from Brocade’sQuarterly Report on Form 10-Q for the fiscal quarter ended May 1, 2004)
10.33† Amendment #18 dated October 5, 2004 to Statement of Work #1 between International BusinessMachines Corporation and Brocade (incorporated by reference to Exhibit 10.77 from Brocade’sAnnual Report on Form 10-K for the fiscal year ended October 30, 2004)
10.34† Amendment #1 dated November 2, 2004 to OEM Purchase Agreement between Brocade andHewlett-Packard Company dated December 16, 2002 (incorporated by reference to Exhibit 10.80from Brocade’s Annual Report on Form 10-K for the fiscal year ended October 30, 2004)
132

ExhibitNumber Description of Document
10.35† Amendment #2 dated October 27, 2004 to OEM Purchase Agreement between Brocade and Hewlett-Packard Company dated December 16, 2002 (incorporated by reference to Exhibit 10.81 fromBrocade’s Annual Report on Form 10-K for the fiscal year ended October 30, 2004)
10.36* Employment Letter for Michael Klayko (incorporated by reference to Exhibit 10.85 from Brocade’sAnnual Report on Form 10-K for the fiscal year ended October 30, 2004)
10.37† Amendment #3 dated November 22, 2004 to OEM Purchase Agreement between Brocade andHewlett-Packard Company dated December 16, 2002 (incorporated by reference to Exhibit 10.89from Brocade’s quarterly report on Form 10-Q for the quarter ended January 29, 2005)
10.38* Senior Leadership Plan as amended and restated as of November 16, 2007 (incorporated by referenceto Exhibit 10.1 from Brocade’s current report on Form 8-K as filed on November 21, 2007)
10.39* Amended and Restated Employee Stock Purchase Plan and related forms of agreements(incorporated by reference to Exhibit 10.7 from Brocade’s quarterly report on Form 10-Q for thequarter ended July 30, 2005)
10.40* Amended and Restated 1999 Nonstatutory Stock Option Plan and related forms of agreements(incorporated by reference to Exhibit 10.8 from Brocade’s quarterly report on Form 10-Q for thequarter ended July 30, 2005)
10.41* Employment Letter for Ian Whiting dated May 1, 2005 (incorporated by reference to Exhibit 10.92from Brocade’s annual report on Form 10-K for the fiscal year ended October 29, 2005)
10.42† Amendment #6 to Statement of Work No. 3 between International Business Machines Corporationand Brocade dated September 13, 2005 (incorporated by reference to Exhibit 10.94 from Brocade’sannual report on Form 10-K for the fiscal year ended October 29, 2005)
10.43† Statement of Work No. 4 between International Business Machines Corporation and Brocade datedAugust 12, 2005 (incorporated by reference to Exhibit 10.95 from Brocade’s annual report onForm 10-K for the fiscal year ended October 29, 2005)
10.44 Tolling Agreement dated as of January 1, 2006 between Gregory L. Reyes and Brocade, DavidHouse, William Krause, Nicholas Moore, William O’Brien, Christopher Paisley, Larry Sonsini, SethNeiman, Neal Dempsey and Sanjay Vaswani (incorporated by reference to Exhibit 10.2 fromBrocade’s quarterly report on Form 10-Q for the quarter ended January 28, 2006)
10.45 Notice of partial termination of Tolling Agreement dated September 11, 2006 (incorporated byreference to Exhibit 10.80 from Brocade’s annual report on Form 10-K for the fiscal year endedOctober 27, 2007)
10.46† Amendment #23 dated December 15, 2005 to Statement of Work No. 1 between InternationalBusiness Machines Corporation and Brocade dated August 12, 2005 (incorporated by reference toExhibit 10.3 from Brocade’s quarterly report on Form 10-Q for the quarter ended January 28, 2006)
10.47† Amendment #4 dated January 20, 2006 to the OEM Purchase Agreement between Brocade andHewlett-Packard Company dated December 16, 2002 (incorporated by reference to Exhibit 10.1 fromBrocade’s quarterly report on Form 10-Q for the quarter ended April 29, 2006)
10.48† Amendment #4 dated March 30, 2006 to the Goods Agreement between International BusinessMachines Corporation and Brocade (incorporated by reference to Exhibit 10.4 from Brocade’squarterly report on Form 10-Q for the quarter ended April 29, 2006)
10.49† Amendment #1 to Statement of Work No. 4 between International Business Machines Corporationand Brocade effective May 31, 2006 (incorporated by reference to Exhibit 10.1 from Brocade’squarterly report on Form 10-Q for the quarter ended July 29, 2006)
133

ExhibitNumber Description of Document
10.50† Amendment #26 dated September 19, 2006 to Statement of Work No. 1 between InternationalBusiness Machines Corporation and Brocade dated August 12, 2005 (incorporated by reference toExhibit 10.103 from Brocade’s annual report on Form 10-K for the fiscal year ended October 28,2006)
10.51† Amendment #6 effective as of August 4, 2006 to OEM Purchase Agreement between Brocade andHewlett-Packard Company dated December 16, 2002 (incorporated by reference to Exhibit 10.105from Brocade’s annual report on Form 10-K for the fiscal year ended October 28, 2006)
10.52† Amendment #7 dated August 4, 2006 to OEM Purchase Agreement between Brocade and Hewlett-Packard Company dated December 16, 2002 (incorporated by reference to Exhibit 10.106 fromBrocade’s annual report on Form 10-K for the fiscal year ended October 28, 2006)
10.53 Guaranty by Brocade dated January 29, 2007 related to the Indenture dated February 7, 2003(incorporated by reference to Exhibit 10.1 from Brocade’s quarterly report on Form 10-Q for thequarter ended April 28, 2007)
10.54 Guaranty by Brocade dated January 29, 2007 related to the Indenture dated February 20, 2002(incorporated by reference to Exhibit 10.2 from Brocade’s quarterly report on Form 10-Q for thequarter ended April 28, 2007)
10.55* Amended and Restated Change of Control Retention Agreement between Brocade and MichaelKlayko effective May 11, 2007 (incorporated by reference to Exhibit 10.1 from Brocade’s quarterlyreport on Form 10-Q for the quarter ended July 28, 2007)
10.56* Form of Amended and Restated Change of Control Retention Agreement effective May 11, 2007between Brocade and each of Richard Deranleau, T.J. Grewal, Don Jaworski, Luc Moyen, TylerWall and Ian Whiting (incorporated by reference to Exhibit 10.2 from Brocade’s quarterly report onForm 10-Q for the quarter ended July 28, 2007)
10.57† Statement of Work #6 dated May 6, 2007 between International Business Machines Corporation andBrocade (incorporated by reference to Exhibit 10.5 from Brocade’s quarterly report on Form 10-Qfor the quarter ended July 28, 2007)
10.58† Amendment #5, dated April 20, 2007 to OEM Purchase Agreement between Hewlett-PackardCompany and Brocade (incorporated by reference to Exhibit 10.116 from Brocade’s annual report onForm 10-K for the fiscal year ended October 27, 2007)
10.59† Amendment #8, dated September 6, 2007 to OEM Purchase Agreement between Hewlett-PackardCompany and Brocade (incorporated by reference to Exhibit 10.117 from Brocade’s annual report onForm 10-K for the fiscal year ended October 27, 2007)
10.60† Statement of Work #7, dated October 1, 2007 to Goods Agreement between International BusinessMachines and Brocade (incorporated by reference to Exhibit 10.118 from Brocade’s annual report onForm 10-K for the fiscal year ended October 27, 2007)
10.61† Amendment Number 1 dated November 1, 2007 to SOW #6 of the Goods Agreement betweenInternational Business Machines Corporation and Brocade (incorporated by reference to Exhibit 10.1from Brocade’s quarterly report on Form 10-Q for the quarter ended January 26, 2008)
10.62† Ninth Amendment, dated November 5, 2007 to OEM Purchase Agreement dated December 16, 2002between Hewlett-Packard Company and Brocade (incorporated by reference to Exhibit 10.2 fromBrocade’s quarterly report on Form 10-Q for the quarter ended January 26, 2008)
10.63† Tenth Amendment, dated December 21, 2007 to OEM Purchase Agreement dated December 16,2002 between Hewlett-Packard Company and Brocade (incorporated by reference to Exhibit 10.4from Brocade’s quarterly report on Form 10-Q for the quarter ended January 26, 2008)
134

ExhibitNumber Description of Document
10.64† Amendment Number 31 dated December 30, 2007 to Statement of Work #1 to Goods Agreementbetween International Business Machines Corporation and Brocade (incorporated by reference toExhibit 10.5 from Brocade’s quarterly report on Form 10-Q for the quarter ended January 26, 2008)
10.65† Amendment Number 32 dated January 22, 2008 to Statement of Work #1 to Goods Agreementbetween International Business Machines Corporation and Brocade (incorporated by reference toExhibit 10.6 from Brocade’s quarterly report on Form 10-Q for the quarter ended January 26, 2008)
10.66* 1999 Director Plan as amended and restated April 10, 2008 and related forms of agreements, asamended (incorporated by reference to Exhibit 10.1 from Brocade’s quarterly report on Form 10-Qfor the quarter ended April 26, 2008)
10.67* 1999 Stock Plan as amended and restated November 27, 2006 and related forms of agreements, asamended (incorporated by reference to Exhibit 10.2 from Brocade’s quarterly report on Form 10-Qfor the quarter ended April 26, 2008)
10.68† OEM Purchase Agreement dated May 20, 2008 between EMC Corporation and Brocade(incorporated by reference to Exhibit 10.1 from Brocade’s quarterly report on Form 10-Q for thequarter ended July 26, 2008)
10.69† Amendment Number 11 dated April 28, 2008 to OEM Purchase Agreement between Hewlett-Packard Company and Brocade (incorporated by reference to Exhibit 10.2 from Brocade’s quarterlyreport on Form 10-Q for the quarter ended July 26, 2008)
10.70† Amendment Number 2 to Statement of Work #6, dated May 12, 2008 to OEM Purchase Agreementbetween IBM and Brocade (incorporated by reference to Exhibit 10.3 from Brocade’s quarterlyreport on Form 10-Q for the quarter ended July 26, 2008)
10.71† Purchase and Sale Agreement and Escrow Instruction dated April 24, 2008 between MFP/Hunter@First Office Partners, LLC and Brocade (incorporated by reference to Exhibit 10.5 fromBrocade’s quarterly report on Form 10-Q for the quarter ended July 26, 2008)
10.72† Development Services Agreement dated May 22, 2008 between MFP/Hunter@First DevelopmentPartners, LLC and Brocade (incorporated by reference to Exhibit 10.6 from Brocade’s quarterlyreport on Form 10-Q for the quarter ended July 26, 2008)
10.73 Voting Agreement dated as of July 21, 2008, between Bobby R. Johnson, Jr. and BrocadeCommunications Systems, Inc. (incorporated by reference to Exhibit 10.1 from Brocade’s Form 8-Kfiled on July 24, 2008)
10.74 Commitment letter dated as of July 21, 2008 with Bank of America, N.A., Banc of America BridgeLLC and Morgan Stanley Senior Funding, Inc. (incorporated by reference to Exhibit 99.1 fromBrocade’s Form 8-K filed on August 14, 2008)
10.75 Stock Purchase Plan and Agreement dated as of August 13, 2008 between Morgan Stanley & Co.Incorporated and Brocade Communications Systems, Inc. (incorporated by reference to Exhibit10.120 from Brocade’s annual report on Form 10-K filed on December 15, 2008)
10.76† Credit Agreement, dated as of October 7, 2008, among the lenders party thereto, Bank of America,N.A., as administrative agent, swing line lender and letter of credit issuer, Morgan Stanley SeniorFunding, Inc., as syndication agent, Banc of America Securities LLC and Morgan Stanley SeniorFunding, Inc., as joint lead arrangers and joint bookrunners, HSBC Bank USA National Associationand Keybank National Association, as co-documentation agents and Brocade CommunicationsSystems, Inc. (incorporated by reference to Exhibit 10.1 from Brocade’s Form 8-K filed onOctober 14, 2008)
135

ExhibitNumber Description of Document
10.77† Amendment Number 34 dated June 23, 2008 to Statement of Work #1 to Goods Agreement betweenInternational Business Machines Corporation and Brocade Communications Systems, Inc.(incorporated by reference to Exhibit 10.122 from Brocade’s annual report on Form 10-K filed onDecember 15, 2008)
10.78† Amendment Number 12 dated August 21, 2008 to Statement of Work #3 to Goods Agreementbetween International Business Machines Corporation and Brocade Communications Systems, Inc.(incorporated by reference to Exhibit 10.124 from Brocade’s annual report on Form 10-K filed onDecember 15, 2008)
10.79† Amendment Number 1 dated July 10, 2008 to Statement of Work #7 to Goods Agreement betweenInternational Business Machines Corporation and Brocade Communications Systems, Inc.(incorporated by reference to Exhibit 10.125 from Brocade’s annual report on Form 10-K filed onDecember 15, 2008)
10.80* Amended and Restated Senior Leadership Plan, dated December 19, 2008 (incorporated by referenceto Exhibit 10.1 from Brocade’s Form 8-K filed on December 23, 2008)
10.81† Amendment Number 1 dated January 9, 2009 to OEM Purchase and License Agreement betweenEMC Corporation and Brocade (incorporated by reference to Exhibit 10.2 from Brocade’s quarterlyreport on Form 10-Q filed on February 25, 2009)
10.82† Amendment Number 36 dated November 1, 2008 to Statement of Work Number 1 of the GoodsAgreement between IBM and Brocade (incorporated by reference to Exhibit 10.3 from Brocade’squarterly report on Form 10-Q filed on February 25, 2009)
10.83† Amendment Number 2 dated October 29, 2008 to Statement of Work Number 7 of the GoodsAgreement between IBM and Brocade (incorporated by reference to Exhibit 10.4 from Brocade’squarterly report on Form 10-Q filed on February 25, 2009)
10.84† Amendment Number 13 dated December 16, 2008 to Statement of Work Number 3 of the GoodsAgreement between IBM and Brocade (incorporated by reference to Exhibit 10.5 from Brocade’squarterly report on Form 10-Q filed on February 25, 2009)
10.85 Lease Agreement dated September 28, 1999, between Foundry Networks, Inc. and Legacy PartnersCommercial Inc., for offices located at 2100 Gold Street, San Jose, CA 95002 (incorporated byreference to Exhibit 10.6 from Brocade’s quarterly report on Form 10-Q filed on February 25, 2009)
10.86 Sublease Agreement dated March 25, 2005, between Foundry Networks, Inc. and Hyperion SolutionsCorporation, for offices located at 4980 Great America Parkway, Santa Clara, CA 95054(incorporated by reference to Exhibit 10.7 from Brocade’s quarterly report on Form 10-Q filed onFebruary 25, 2009)
10.87 First Amendment to Lease Agreement between Foundry Networks, Inc. and WIX/NSJ Real EstateLimited Partnership dated February 16, 2000 (incorporated by reference to Exhibit 10.8 fromBrocade’s quarterly report on Form 10-Q filed on February 25, 2009)
10.88 Second Amendment to Lease Agreement between Foundry Networks, Inc. and WIX/NSJ Real EstateLimited Partnership dated July 28, 2005 (incorporated by reference to Exhibit 10.9 from Brocade’squarterly report on Form 10-Q filed on February 25, 2009)
10.89 Third Amendment to Lease Amendment between Foundry Networks, Inc. and Bixby TechnologyCenter, LLC dated December 14, 2007 (incorporated by reference to Exhibit 10.10 from Brocade’squarterly report on Form 10-Q filed on February 25, 2009)
10.90† Amendment Number 12 dated March 11, 2009, with an effective date of February 28, 2008, to OEMPurchase Agreement between Hewlett-Packard Company and Brocade (incorporated by reference toExhibit 10.1 from Brocade’s quarterly report on Form 10-Q filed on June 4, 2009)
136

ExhibitNumber Description of Document
10.91† Amendment Number 13 dated March 14, 2009, with an effective date of March 6, 2009, to OEMPurchase Agreement between Hewlett-Packard Company and Brocade (incorporated by reference toExhibit 10.2 from Brocade’s quarterly report on Form 10-Q filed on June 4, 2009)
10.92† Amendment Number 14 dated March 14, 2009, with an effective date as of October 24, 2008, toOEM Purchase Agreement between Hewlett-Packard Company and Brocade (incorporated byreference to Exhibit 10.3 from Brocade’s quarterly report on Form 10-Q filed on June 4, 2009)
10.93† Statement of Work #8, dated April 1, 2009, to Goods Agreement between International BusinessMachines and Brocade (incorporated by reference to Exhibit 10.4 from Brocade’s quarterly reporton Form 10-Q filed on June 4, 2009)
10.94* 2009 Stock Plan and related forms of agreements (incorporated by reference to Exhibit 10.1 fromBrocade’s current report on Form 8-K filed on April 27, 2009)
10.95* 2009 Director Plan and related forms of agreements (incorporated by reference to Exhibit 10.6 fromBrocade’s quarterly report on Form 10-Q filed on June 4, 2009)
10.96* 2009 Employee Stock Purchase Plan (incorporated by reference to Exhibit 10.5 from Brocade’scurrent report on Form 8-K filed on April 27, 2009)
10.97† Amendment Number 15 dated May 11, 2009, with an effective date of February 1, 2009, to theProduct Purchase Agreement between Hewlett-Packard Company and Brocade (incorporated byreference to Exhibit 10.1 from Brocade’s quarterly report on Form 10-Q filed on August 31, 2009)
10.98† Amendment Number 37 dated June 22, 2009, with an effective date of June 19, 2008 [sic], toStatement of Work Number 1 of the Goods Agreement between IBM and Brocade (incorporated byreference to Exhibit 10.2 from Brocade’s quarterly report on Form 10-Q filed on August 31, 2009)
10.99† Amendment Number 14 dated June 10, 2009 to Statement of Work Number 3 of the GoodsAgreement between IBM and Brocade (incorporated by reference to Exhibit 10.3 from Brocade’squarterly report on Form 10-Q filed on August 31, 2009)
10.100† Amendment Number 15 dated June 23, 2009 to Statement of Work Number 3 of the GoodsAgreement between IBM and Brocade (incorporated by reference to Exhibit 10.4 from Brocade’squarterly report on Form 10-Q filed on August 31, 2009)
10.101† Amendment Number 3 dated June 8, 2009, with an effective date of June 5, 2009, to Statement ofWork Number 7 of the Goods Agreement between IBM and Brocade (incorporated by reference toExhibit 10.5 from Brocade’s quarterly report on Form 10-Q filed on August 31, 2009)
10.102 Amendment Number 5 dated August 3, 2009 to the Goods Agreement between IBM and Brocade(incorporated by reference to Exhibit 10.148 from Brocade’s quarterly report on Form 10-K filed onDecember 14, 2009)
10.103† Amendment Number 38 dated September 19, 2009 to Statement of Work Number 1 of the GoodsAgreement between IBM and Brocade (incorporated by reference to Exhibit 10.149 from Brocade’squarterly report on Form 10-K filed on December 14, 2009)
10.104† Amendment Number 16 dated September 10, 2009, with an effective date of September 18, 2009, toStatement of Work Number 3 of the Goods Agreement between IBM and Brocade (incorporated byreference to Exhibit 10.150 from Brocade’s quarterly report on Form 10-K filed on December 14,2009)
10.105† Amendment Number 17 dated October 30, 2009, with an effective date of October 28, 2009, toStatement of Work Number 3 of the Goods Agreement between IBM and Brocade (incorporated byreference to Exhibit 10.151 from Brocade’s quarterly report on Form 10-K filed on December 14,2009)
137

ExhibitNumber Description of Document
10.106 Amendment Number 4 dated September 22, 2009 to Statement of Work Number 7 of the GoodsAgreement between IBM and Brocade (incorporated by reference to Exhibit 10.152 from Brocade’squarterly report on Form 10-K filed on December 14, 2009)
10.107† Amendment Number 5 dated September 15, 2009 to Statement of Work Number 7 of the GoodsAgreement between IBM and Brocade (incorporated by reference to Exhibit 10.153 from Brocade’squarterly report on Form 10-K filed on December 14, 2009)
10.108† Amendment Number 1 dated October 3, 2009 to Statement of Work Number 8 of the GoodsAgreement between IBM and Brocade (incorporated by reference to Exhibit 10.154 from Brocade’squarterly report on Form 10-K filed on December 14, 2009)
10.109† Amendment Number 2 dated October 13, 2009 to Statement of Work Number 8 of the GoodsAgreement between IBM and Brocade (incorporated by reference to Exhibit 10.155 from Brocade’squarterly report on Form 10-K filed on December 14, 2009)
10.110† Amendment Number 3 dated October 1, 2009 to Statement of Work Number 8 of the GoodsAgreement between International Business Machines and Brocade (incorporated by reference toExhibit 10.156 from Brocade’s quarterly report on Form 10-K filed on December 14, 2009)
10.111* Executive Leadership Plan (formerly Senior Leadership Plan), as amended as of December 3, 2009(incorporated by reference to Exhibit 10.1 from Brocade’s current report on Form 8-K filed onDecember 9, 2009)
10.112* Form of Restricted Stock Unit Agreement (Market Stock Units) under the 2009 Stock Plan(incorporated by reference to Exhibit 10.2 from Brocade’s current report on Form 8-K filed onDecember 9, 2009)
10.113† Amendment Number 39 dated December 15, 2009, to Statement of Work Number 1 of the GoodsAgreement between IBM and Brocade (incorporated by reference to Exhibit 10.3 from Brocade’sForm 10-Q filed on March 2, 2010)
10.114 Amendment and Waiver No. 1 dated January 8, 2010, to the Credit Agreement, dated as ofOctober 7, 2008, by and among Brocade, the lenders party thereto, Bank of America, N.A., asadministrative agent, swing line lender and letter of credit issuer, Morgan Stanley Senior Funding,Inc., as syndication agent, Banc of America Securities LLC and Morgan Stanley Senior Funding,Inc., as joint lead arrangers and joint bookrunners, and HSBC Bank USA National Association andKeybank National Association, as co-documentation agents (incorporated by reference toExhibit 10.4 from Brocade’s Form 10-Q filed on March 2, 2010)
10.115 Purchase Agreement, dated January 13, 2010, between Brocade and J.P. Morgan Inc., asrepresentative of the several Initial Purchasers listed in Schedule 1 thereto (incorporated byreference to Exhibit 10.5 from Brocade’s Form 10-Q filed on March 2, 2010)
10.116 Security Agreement, dated as of January 20, 2010, by and among Brocade, the SubsidiaryGuarantors listed on the signature pages thereto and Wells Fargo Bank, National Association, ascollateral agent (incorporated by reference to Exhibit 10.1 from Brocade’s Form 8-K filed onJanuary 26, 2010)
10.117 Security Agreement, dated as of January 20, 2010, by and among Brocade, the SubsidiaryGuarantors listed on the signature pages thereto and Wells Fargo Bank, National Association, ascollateral agent (incorporated by reference to Exhibit 10.2 from Brocade’s Form 8-K filed onJanuary 26, 2010)
10.118 Registration Rights Agreement, dated as of January 20, 2010, by and among Brocade, theSubsidiary Guarantors listed on the signature pages thereto and the purchasers named therein(incorporated by reference to Exhibit 10.3 from Brocade’s Form 8-K filed on January 26, 2010)
138

ExhibitNumber Description of Document
10.119 Registration Rights Agreement, dated as of January 20, 2010, by and among Brocade, theSubsidiary Guarantors listed on the signature pages thereto and the purchasers named therein(incorporated by reference to Exhibit 10.4 from Brocade’s Form 8-K filed on January 26, 2010)
10.120 Real Estate Sale Agreement effective as of January 25, 2010 by and between BrocadeCommunications Systems Skyport LLC, a wholly-owned subsidiary of Brocade, and CA-Skyport III Limited Partnership (incorporated by reference to Exhibit 10.10 from Brocade’sForm 10-Q filed on March 2, 2010)
10.121 Lease Agreement dated as of January 28, 2010 by and between Brocade and CA-Skyport IIILimited Partnership (incorporated by reference to Exhibit 10.11 from Brocade’s Form 10-Q filedon March 2, 2010)
10.122† Amendment Number 2 dated February 2, 2010 to OEM Purchase and License Agreementbetween EMC Corporation and Brocade (incorporated by reference to Exhibit 10.12 fromBrocade’s Form 10-Q filed on March 2, 2010)
10.123† Amendment Number 3 dated April 13, 2010 to OEM Purchase and License Agreement betweenEMC Corporation and Brocade (incorporated by reference to Exhibit 10.2 from Brocade’sForm 10-Q filed on June 2, 2010)
10.124† Amendment Number 16 dated March 24, 2010, with an effective date as of June 8, 2009, to theProduct Purchase Agreement between Hewlett-Packard Company and Brocade (incorporated byreference to Exhibit 10.3 from Brocade’s Form 10-Q filed on June 2, 2010)
10.125† Amendment Number 40 dated April 13, 2010 to Statement of Work Number 1 of the GoodsAgreement between IBM and Brocade (incorporated by reference to Exhibit 10.4 from Brocade’sForm 10-Q filed on June 2, 2010)
10.126† Amendment Number 3 dated April 19, 2010, with an effective date of January 1, 2010, toStatement of Work Number 6 of the Goods Agreement between IBM and Brocade (incorporatedby reference to Exhibit 10.5 from Brocade’s Form 10-Q filed on June 2, 2010)
10.127† Amendment Number 6 dated April 13, 2010 to Statement of Work Number 7 of the GoodsAgreement between IBM and Brocade (incorporated by reference to Exhibit 10.6 from Brocade’sForm 10-Q filed on June 2, 2010)
10.128† Amendment Number 17 dated May 21, 2010 to the Product Purchase Agreement betweenHewlett-Packard Company and Brocade (incorporated by reference to Exhibit 10.1 fromBrocade’s Form 10-Q filed on September 2, 2010)
10.129† Amendment Number 4 dated May 18, 2010 to Statement of Work Number 8 of the GoodsAgreement between IBM and Brocade (incorporated by reference to Exhibit 10.2 from Brocade’sForm 10-Q filed on September 2, 2010)
10.130† Amendment Number 5 dated May 18, 2010, with an effective date of May 14, 2010, to Statementof Work Number 8 of the Goods Agreement between IBM and Brocade (incorporated byreference to Exhibit 10.3 from Brocade’s Form 10-Q filed on September 2, 2010)
10.131**/†† Amendment Number 19 dated August 4, 2010 to the Product Purchase Agreement betweenHewlett-Packard Company and Brocade
10.132** Amendment Number 6 dated October 22, 2009, with an effective date of October 29, 2010, to theGoods Agreement between IBM and Brocade
10.133**/†† Amendment Number 41 dated September 21, 2010 to Statement of Work Number 1 of the GoodsAgreement between IBM and Brocade
139

ExhibitNumber Description of Document
10.134**/†† Amendment Number 18 dated September 9, 2010 to Statement of Work Number 3 of theGoods Agreement between IBM and Brocade
12.1** Statement of Computation of Ratio of Earnings to Fixed Charges
21.1** Subsidiaries of the Registrant
23.1** Consent of Independent Registered Public Accounting Firm
24.1** Power of attorney (see signatures page)
31.1** Rule 13a-14(a)/15d-14(a) Certification by the Chief Executive Officer
31.2** Rule 13a-14(a)/15d-14(a) Certification by the Chief Financial Officer
32.1** Certification by the Chief Executive Officer and Chief Financial Officer pursuant to 18 U.S.C.Section 1350, as adopted pursuant to Section 906 of the Sarbanes-Oxley Act of 2002
101.INS*** XBRL Instance Document
101.SCH*** XBRL Taxonomy Extension Schema Document
101.CAL*** XBRL Taxonomy Extension Calculation Linkbase Document
101.DEF*** XBRL Taxonomy Extension Definition Linkbase Document
101.LAB*** XBRL Taxonomy Extension Label Linkbase Document
101.PRE*** XBRL Taxonomy Extension Presentation Linkbase Document
* Indicates management contract or compensatory plan or arrangement required to be filed as an exhibitpursuant to Item 15(b) of Form 10-K.
** Filed herewith.*** XBRL (eXtensible Business Reporting Language) information is furnished and not filed herewith, is not a
part of a registration statement or prospectus for purposes of sections 11 or 12 of the Securities Act of 1933,is deemed not filed for purposes of section 18 of the Securities Exchange Act of 1934, and otherwise is notsubject to liability under these sections.
† Confidential treatment granted as to certain portions, which portions were omitted and filed separately withthe Securities and Exchange Commission.
†† Confidential treatment requested as to certain portions, which portions were omitted and filed separatelywith the Securities and Exchange Commission.
(b) Exhibits
See Exhibit Index included in Item 15(a) of this Form 10-K.
(c) Financial Statement Schedules
140

SCHEDULE II
VALUATION AND QUALIFYING ACCOUNTS
Fiscal Years Ended October 30, 2010, October 31, 2009 and October 25, 2008
Description
Balance atBeginning of
Period
AdditionsCharged toRevenues Deductions*
Balance atEnd ofPeriod
(in thousands)
Allowance for doubtful accounts:2010 . . . . . . . . . . . . . . . . . . . . . . . . . . . . . . . . . . . . . . . . . . . . . . . $3,954 $ — $ (2,116) $1,8382009 . . . . . . . . . . . . . . . . . . . . . . . . . . . . . . . . . . . . . . . . . . . . . . . $ 675 $ 4,246 $ (967) $3,9542008 . . . . . . . . . . . . . . . . . . . . . . . . . . . . . . . . . . . . . . . . . . . . . . . $2,430 $ 361 $ (2,116) $ 675Sales allowances:2010 . . . . . . . . . . . . . . . . . . . . . . . . . . . . . . . . . . . . . . . . . . . . . . . $8,619 $11,811 $(15,547) $4,8832009 . . . . . . . . . . . . . . . . . . . . . . . . . . . . . . . . . . . . . . . . . . . . . . . $4,369 $17,183 $(12,933) $8,6192008 . . . . . . . . . . . . . . . . . . . . . . . . . . . . . . . . . . . . . . . . . . . . . . . $4,075 $ 6,253 $ (5,959) $4,369
* Deductions related to the allowance for doubtful accounts and sales allowances represent amounts written offagainst the allowance less recoveries.
141

SIGNATURES
Pursuant to the requirements of Section 13 or 15(d) of the Securities Exchange Act of 1934, the registranthas duly caused this report to be signed on its behalf by the undersigned, thereunto duly authorized.
Brocade Communications Systems, Inc.
December 16, 2010 By: /S/ MICHAEL KLAYKO
Michael Klayko
Chief Executive Officer
POWER OF ATTORNEY
KNOW ALL PERSONS BY THESE PRESENTS, that each person whose signature appears belowconstitutes and appoints Michael Klayko and Richard Deranleau, and each of them, his and her true and lawfulattorneys-in-fact, each with full power of substitution, for him and her in any and all capacities, to sign anyamendments to this report on Form 10-K and to file the same, with exhibits thereto and other documents inconnection therewith, with the Securities and Exchange Commission, hereby ratifying and confirming all thateach of said attorneys-in-fact, or their substitute or substitutes, may do or cause to be done by virtue hereof.
Pursuant to the requirements of the Securities Exchange Act of 1934, this report has been signed below bythe following persons on behalf of the registrant and in the capacities and on the dates indicated.
Signature Title Date
/S/ MICHAEL KLAYKO
Michael Klayko
Director and Chief Executive Officer(Principal Executive Officer)
December 15, 2010
/S/ RICHARD DERANLEAU
Richard Deranleau
Chief Financial Officer and VicePresident, Finance (Principal Financial
and Accounting Officer)
December 15, 2010
/S/ DAVID L. HOUSE
David L. House
Chairman of the Board of Directors December 16, 2010
/S/ JUDY BRUNER
Judy Bruner
Director December 14, 2010
/S/ RENATO DIPENTIMA
Renato DiPentima
Director December 16, 2010
/S/ ALAN EARHARTAlan Earhart
Director December 15, 2010
/S/ JOHN GERDELMAN
John Gerdelman
Director December 14, 2010
/S/ GLENN JONESGlenn Jones
Director December 14, 2010
/S/ L. WILLIAM KRAUSE
L. William Krause
Director December 13, 2010
/S/ SANJAY VASWANI
Sanjay Vaswani
Director December 13, 2010
142

[THIS PAGE INTENTIONALLY LEFT BLANK]

[THIS PAGE INTENTIONALLY LEFT BLANK]