Embed Size (px)
Citation preview
Broadband Study Report
Prepared for the
Washington Utilities and Transportation Commission
Prepared by:
CBG Communications, Inc.
Thomas Robinson Executive Vice President
Dick Nielsen
Senior Engineer
Constance Book, Ph.D. Researcher, Elon University
June 27, 2008
CBG Communications, Inc.
Report on the Broadband Study for the Washington Utilities and
Transportation Commission
Table of Contents EXECUTIVE SUMMARY ......................................................................................................... i Section A INTRODUCTION AND BACKGROUND .................................................................................2
Overview ................................................................................................................................2 Study Methodology.................................................................................................................4 Background on the Five Counties ............................................................................................7
Overview of Columbia County............................................................................................7 Overview of Ferry County...................................................................................................9 Overview of Grays Harbor County ....................................................................................11 Overview of Lewis County................................................................................................12 Overview of Stevens County .............................................................................................14
Section B REVIEW OF RESIDENTIAL COMMUNITY BROADBAND AVAILABILITY, ADOPTION AND USE.................................................................................................................................17
Project Overview Across The Five Counties..........................................................................17 Residential Community Broadband Survey Findings Across the Five Counties .....................18 Key Findings in Residential Survey Across All Five Counties...............................................37
DIGITAL DIVIDE ANALYSIS................................................................................................41 Section C REVIEW OF BUSINESS AND NON-PROFIT COMMUNITIES OF INTEREST ...................47
Introduction...........................................................................................................................47 ANALYSIS OF BROADBAND�S ECONOMIC IMPACT.......................................................65
Analysis of Economic Impact in Washington ........................................................................69 Section D REVIEW OF EDUCATIONAL COMMUNITIES OF INTEREST ...........................................85
Introduction and Overview ....................................................................................................85 Key Findings from the Educational Survey Across All Five Counties..................................101
CBG Communications, Inc.
Section E REVIEW OF LIBRARY COMMUNITIES OF INTEREST....................................................104
Introduction.........................................................................................................................104 Key Findings.......................................................................................................................104 District Profiles ...................................................................................................................105
THE TIMBERLAND REGIONAL LIBRARY................................................................105 NORTH CENTRAL REGIONAL LIBRARY .................................................................107 STEVENS COUNTY RURAL LIBRARY DISTRICT....................................................108 COLUMBIA COUNTY RURAL LIBRARY DISTRICT ................................................110
Section F REVIEW OF LOCAL GOVERNMENT AND TRIBAL NATIONS� BROADBAND NEEDS AND INTERESTS..................................................................................................................113 GOVERNMENT BROADBAND NETWORK SURVEY.......................................................113
Introduction.........................................................................................................................113 Findings ..............................................................................................................................113 Key Findings.......................................................................................................................116
TRIBAL NATION BROADBAND NETWORK SURVEY ....................................................118
Introduction.........................................................................................................................118 Key Findings.......................................................................................................................118 Tribal Nation Profiles..........................................................................................................119
THE QUINAULT INDIAN NATION .............................................................................119 THE CHEHALIS CONFEDERATED TRIBAL NATION ..............................................121 THE COLVILLE CONFEDERATED TRIBES...............................................................122
Section G BROADBAND PROVIDERS, TECHNOLOGIES, INFRASTRUCTURE, SERVICES AND COST......................................................................................................................................125 REVIEW AND ANALYSIS ...................................................................................................125
Introduction.........................................................................................................................125 County by County Infrastructure Review.............................................................................141
GAP AND FUTURE REQUIREMENTS ANALYSIS............................................................153 Section H COMPARATIVE ANALYSIS AND BEST PRACTICES ......................................................160
Broadband Initiatives in Other States...................................................................................160 Local Level .........................................................................................................................174 Federal Funding ..................................................................................................................174 International Broadband Initiatives......................................................................................176
CBG Communications, Inc.
Comparative Analysis Conclusion.......................................................................................182 Section I CONCLUSIONS AND RECOMMENDATIONS ...................................................................185 Section J PROJECT TEMPLATE ..........................................................................................................202 ATTACHMENTS (See Separate Document of Attachments to the Broadband Study)
CBG Communications, Inc.
i
EXECUTIVE SUMMARY
CBG Communications, Inc. (CBG) was selected by the Washington Utilities and Transportation
Commission (UTC) to conduct a Broadband Study to evaluate broadband availability, adoption,
and use in five Washington Counties � Columbia, Ferry, Grays Harbor, Lewis and Stevens (the
�five counties� or �subject counties�). The Broadband Study traces its roots to Section 149 of
the 2007-09 Omnibus Operating Budget. That budget proviso specifically directed the Utilities
and Transportation Commission:
to conduct a survey to identify factors preventing the widespread availability and use of
broadband technologies. The survey must collect and interpret reliable geographic,
demographic, cultural, and telecommunications technology information to identify
broadband disparities in the state. The commission shall consult appropriate stakeholders
in designing the survey.1
CBG was engaged by the UTC to assist it in meeting the Legislature�s directive by employing a
variety of survey and other research methodologies to identify factors affecting broadband
availability, deployment and consumer utilization disparities.
Broadband service (also known as high-speed Internet access) allows residential and business
consumers to access the Internet and Internet-related applications and services at significantly
higher speeds than those typically available through �dial-up� Internet access services. Until
recently, the Federal Communications Commission (FCC) defined broadband service as data
transmission speeds exceeding 200 kilobits per second (Kbps), in at least one direction:
downstream (from the Internet to a computer) or upstream (from a computer to the Internet). In
March of 2008, the FCC further defined broadband by distinguishing several classes of
broadband service. First generation broadband continues to be defined as 200 Kbps. From there,
the FCC has established seven additional tiers of broadband service with the highest tier
1 SHB 1128, Sec. 149(3).
CBG Communications, Inc.
ii
reflecting any broadband service offering having a transmission speed of 100 Mbps or more.
The United States Department of Agriculture - Rural Utilities Service� (RUS), which provides
federal loan assistance to telecommunications carriers deploying broadband services, requires
loan recipients to offer a minimum of 200 Kbps in each direction. The stakeholders that were
consulted during the design of the survey suggested that 1.5 Mbps downstream and upstream
was seen by many as constituting broadband service. Because of the limited availability of
broadband services in the five counties studied, CBG has reviewed and reports herein on various
levels of broadband service offerings and capabilities.
The Broadband Study was designed to achieve four key objectives:
• Identify broadband availability, including infrastructure and service offerings within
the five counties,
• Evaluate broadband adoption and use, including its importance and value to residents,
businesses, and other constituent groups,
• Identify various means to enhance broadband deployment and analyze their potential
for assisting economic development or enhancing quality of life, and
• Provide a research template that could potentially be used for follow-on research.
CBG employed a number of information gathering methodologies and related activities as part of
the Broadband Study in order to meet the project�s objectives. These methodologies and
activities included:
• Review of background information including, but not limited to, documents prepared
by broadband and technology work groups within the subject counties and prior
telecommunications, economic development, and broadband studies conducted within the
subject counties and other regions of Washington.
• A random, statistically valid survey of the residential community within each of the
five counties.
CBG Communications, Inc.
iii
• A sectorized, random telephone survey of business and nonprofit entities within each
of the five counties, augmented by an online survey disseminated through local chambers
of commerce.
• Online and written surveys of other organizations and communities of interest,
including local governments, tribal nations, library districts and educational institutions.
• In-depth interviews and focused discussions with key communities of interest
representatives within the five counties, as well as in-depth interviews with key staff and
elected officials representing statewide interests.
• A written broadband providers survey, supplemented by review of provider-generated
marketing materials, interviews with service provider representatives, and a 2,700 mile
ride-out and review of physical infrastructure within the five counties.
• Subsequent to the information gathering stage, CBG conducted a variety of analyses of
the underlying information to reliably interpret and make informed conclusions about
the data. This stage of the Broadband Study included:
o An economic impact analysis.
o A digital divide analysis.
o A comparative analysis, including an assessment of best practices.
o A broadband infrastructure and service analysis.
o A gap analysis.
o A future requirements analysis.
After three months, several thousand miles and more than 2000 interviews, CBG is pleased to
offer the following principal conclusions regarding factors affecting the deployment, availability
and use of broadband services in the five counties subject to the Broadband Study:
CBG Communications, Inc.
iv
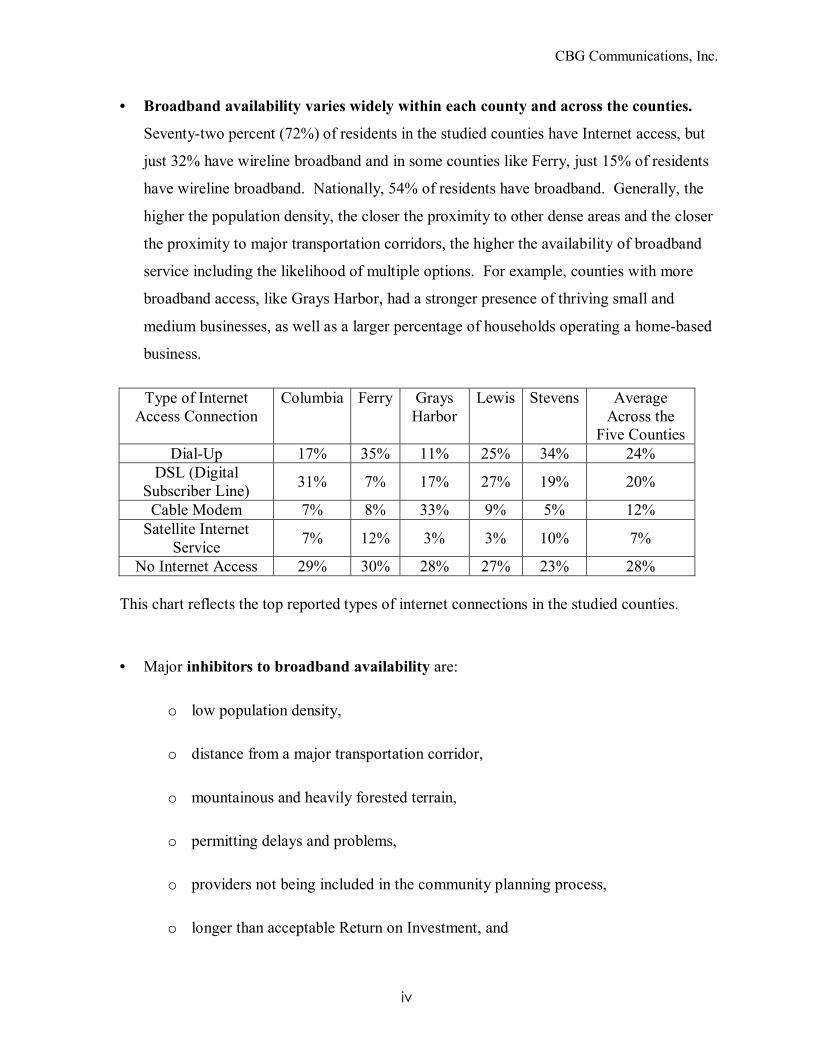
• Broadband availability varies widely within each county and across the counties.
Seventy-two percent (72%) of residents in the studied counties have Internet access, but
just 32% have wireline broadband and in some counties like Ferry, just 15% of residents
have wireline broadband. Nationally, 54% of residents have broadband. Generally, the
higher the population density, the closer the proximity to other dense areas and the closer
the proximity to major transportation corridors, the higher the availability of broadband
service including the likelihood of multiple options. For example, counties with more
broadband access, like Grays Harbor, had a stronger presence of thriving small and
medium businesses, as well as a larger percentage of households operating a home-based
business.
Type of Internet Access Connection
Columbia
Ferry
Grays Harbor
Lewis
Stevens
Average Across the
Five Counties Dial-Up 17% 35% 11% 25% 34% 24%
DSL (Digital Subscriber Line) 31% 7% 17% 27% 19% 20%
Cable Modem 7% 8% 33% 9% 5% 12% Satellite Internet
Service 7% 12% 3% 3% 10% 7%
No Internet Access 29% 30% 28% 27% 23% 28%
This chart reflects the top reported types of internet connections in the studied counties.
• Major inhibitors to broadband availability are:
o low population density,
o distance from a major transportation corridor,
o mountainous and heavily forested terrain,
o permitting delays and problems,
o providers not being included in the community planning process,
o longer than acceptable Return on Investment, and
CBG Communications, Inc.
v
o limitations of existing technology.
• Even if a high percentage of the population wanted to subscribe to broadband, in many
rural areas there is simply not sufficient demand (i.e., revenue potential) for the
service to justify the level of private investment needed for deployment. This
remains a hard reality without either technological changes that reduce costs substantially
or substantial subsidies from government or foundation sources, like the mechanisms
used historically to promote the universal availability of wireline telephone service.
• Generally, broadband adoption follows availability. Where broadband availability and
options are plentiful, consumer use of broadband service and the value of such use
expands significantly. The study suggests a couple of important exceptions to this
general conclusion. In rural areas served by broadband, subscription rates to high speed
internet services are generally lower than in urban pockets. Research suggests that this is
because the perceived value of high speed internet access is not always readily seen by
rural residents. There is clearly a segment of residential consumers that do not want or
require broadband service or access to the Internet, even if it is available. However, it is
equally evident that a certain percentage of residential consumers would embrace
broadband service but they would need enhanced access to computing devices and/or
training to really understand and take advantage of the opportunity offered by broadband.
• There are several key inhibitors to broadband adoption and use that coalesce around
the price/value relationship of broadband service access. These include:
o Service not available or not easily available.
o Relatively high cost of service.
o Lack of viable, multiple competing options.
• �It takes good, forward thinking people,� Grays Harbor Chamber Focus Group
participant.
CBG Communications, Inc.
vi
Overall, champions will be needed to pursue broader deployment and adoption. Study
participants frequently mentioned the powerful role individuals play in resolving gaps in
broadband. For example, the K-20 Network leadership was described as being able to get
the job done and demonstrate the value of furthering broadband to rural schools in the
State. Others mentioned one of the provider�s general managers and cited his willingness
to think outside of the box to expand broadband within his territory. The energy of
forward thinking people that can help create rationales and have a resolve to close the
broadband gap is essential to bringing more broadband options to the unserved and
underserved.
Once critical factors were identified concerning broadband availability, adoption, and use within
the five counties subject to the Broadband Study, CBG evaluated broadband infrastructure and
service deployment models and options. We did so in order to develop recommendations for
initiatives that could enhance the broadband service environment within the five counties studied
and, where possible, address similar circumstances statewide.
The following steps to promote expansion of broadband availability in the five counties
crystallize the gaps and the actions required to address them:
Gap Future Actions Lack of Broadband Initially work to determine the most effective methods to
enhance and expand backbone infrastructure.
Address Governmental Policies in Place Today that Inhibit Deployment
Work with the State, county and other local governments to address existing inhibitors to local deployment of broadband.
Lack of Backbone Infrastructure
Work with State agencies such as DOT, WSP and DIS and local agencies to fully identify all currently available infrastructure.
Work with State agencies such as DOT, WSP and DIS and local agencies to determine planned deployment of infrastructure in the near and long term.
CBG Communications, Inc.
vii
Gap Future Actions Work with State agencies such as DOT, WSP and DIS and local
agencies to determine how new deployment can be leveraged to add additional capacity for broadband deployment long term, including the closest points of connection to existing and potential new last mile infrastructure.
Meet with large and small providers to determine desire to participate in, for example, a �Backbone Deployment Cooperative�.
Determine how this Cooperative might help the State reduce its costs to deploy fiber optic infrastructure throughout the counties and therefore accelerate deployment.
Creation of Redundant Backbone
Determine what level of redundancy is needed to offer reliable service and to promote adoption of the backbone network by small and large providers.
Determine how cooperative efforts will minimize deployment costs of a backbone and therefore how redundancy can be built into the network at the lowest possible level.
Creation of Additional Last Mile Infrastructure
Determine the best methods of delivering last mile services based on the closest point of connection to an enhanced, expanded backbone.
The Broadband Study Report explores several deployment models and options to facilitate the
actions needed. All of these will ultimately require vigorous consideration of the difficult policy
decisions to be made by the Legislature concerning the best approach or mixture of approaches
that may be taken:
• Encourage the Private Sector to Build � The State is already involved in this type of
effort through an extensive backbone network that facilitates private investment in
facilities supporting governmental agency interconnection and the K-20 Network. The
State could expand its role as an anchor tenant by taking steps to expand the backbone
into at least one location in all counties. Establishing this objective affirmatively as a
matter of State policy could potentially spur investment by entities looking for
opportunities to provide not only backbone service, but to stimulate or expand broadband
CBG Communications, Inc.
viii
infrastructure in unserved or underserved areas that happen to be contiguous to or near
the backbone. Any expansion of the K-20 Network to accomplish this recommendation
would require a thorough review of the terms and conditions of existing federal funding
used (i.e., the federal e-rate program) in support of the network.
Providers could also be encouraged to build new broadband infrastructure through a
concept known as �ROI gap funding.� Such funding could be made available by
appropriate entities such as governmental, business, consortia, etc., subject to conditions.
This funding would enable providers to extend service within targeted counties and
municipalities, by supplementing the typical investment that they would make to provide
service, which in lower density areas is unlikely to generate an adequate return.
• Create a State Broadband Authority � Washington does not currently have a �one stop
shop� where collective thinking to address broadband needs is available. As a result,
study participants indicated that broadband stakeholders were not always aware of each
others� activities and therefore could not take advantage of synergies that might exist in
the deployment of infrastructure. Some type of authority could serve as a clearinghouse
for broadband initiatives. Stakeholders believed this type of centralized ability to
converse with other providers could go a long way in helping to address broadband needs
in the five counties. A broadband authority could, for example, identify potential
wholesale opportunities for certain public entities such as Public Utility Districts (PUDs),
appropriate local entities, or the State itself to provide services by leveraging private and
public resources that may be currently available and that potentially could be expanded
(i.e., State backbone, PUD fiber optic infrastructure, local government fiber, and wireless
infrastructure). Careful study of current restrictions and parameters surrounding
provision and use of public resources would need to be made to insure that current
positive attributes of the broadband marketplace are not lost or impaired in any effort to
expand broadband service availability. Additionally, it is important to note that, as is the
case for private providers, in rural areas there would need to be careful consideration of
the demand (i.e., revenue potential) for broadband services to justify the level of public
investment that may be required for deployment.
CBG Communications, Inc.
ix
• Create a Public/Private Partnership � Develop a truly viable public/private partnership
that may include a nonprofit element, but must include measurable parameters that will
benchmark and determine success of the partnership(s) over time.
All of these options, as well as details and findings from the various information gathering
activities CBG undertook for the Broadband Study Report, are discussed in the specific sections
that follow this Executive Summary. The Report is organized into 22 major sections and
attachments which speak to specific observations about broadband service within and across the
five counties subject to CBG�s research.

CBG Communications, Inc.
1
Section A Introduction and Background
CBG Communications, Inc.
2
INTRODUCTION AND BACKGROUND
�Internet is for everyone - but it won�t be until in every home, in every business, in every school,
in every library, in every hospital in every town and in every country on the Globe, the Internet
can be accessed without limitation, at any time and in every language.
Internet is for everyone - but it won�t be if it is too complex to be used easily by everyone. Let
us dedicate ourselves to the task of simplifying the Internet�s interfaces and to educating all that
are interested in its use.�2
Overview
CBG Communications, Inc. (CBG) was selected by the Washington Utilities and Transportation
Commission (UTC) to conduct a Broadband Study to evaluate broadband availability, adoption
and use in five Washington Counties � Columbia, Ferry, Grays Harbor, Lewis and Stevens (the
�five counties� or �subject counties�). The Broadband Study project traces its roots to Section
149 of the 2007-09 Omnibus Operating Budget. That budget proviso specifically directed the
Utilities and Transportation Commission:
to conduct a survey to identify factors preventing the widespread availability and
use of broadband technologies. The survey must collect and interpret reliable
geographic, demographic, cultural, and telecommunications technology
information to identify broadband disparities in the state. The commission shall
consult appropriate stakeholders in designing the survey.3
After consulting with principal stakeholders involved with the development of the Broadband
Study legislation, five counties were selected where it was commonly understood there were
service disparities, economic development challenges, and there were other diverse issues that
likely contribute to impaired broadband availability, adoption and use. Once the counties were
2 Memo to Network Working Group, The Internet Society, The Internet is for Everyone, Vint Cerf (commonly referred to as the �father of the Internet�), April 2002. 3 SHB 1128, Sec. 149(3).
CBG Communications, Inc.
3
chosen, the UTC established a number of objectives for the Broadband Study to achieve the
legislation�s goals. The UTC grouped the objectives into the following broad categories:
1) Broadband Availability � Identify currently available broadband infrastructure
within the counties and how extensively the infrastructure is deployed. Evaluate
residential and business accessibility to current infrastructure, technologies and services.
Identify the geographic areas of the counties that are currently served by one or more
retail broadband services. Identify broadband transmission speeds available to residents
and businesses within the counties.
2) Broadband Adoption and Use � Evaluate how broadband infrastructure and services
are used to create value for the counties� economy. Identify how available broadband
services create economic opportunities for organizations and residents. Identify how and
which organizations and residents benefit from available broadband technologies.
Evaluate the costs of broadband services available to residents and organizations
including low-priced and no-cost services.
3) Broadband Deployment Options � Evaluate and identify various broadband
deployment options that may enhance the quality of life of the counties� residents and
organizations. Identify best practices that could contribute to economic opportunity
through broadband deployment. Identify existing programs (i.e., infrastructure and
service development efforts such as Centralia�s BPL trial) operating in the county that
could potentially compliment broadband deployment efforts.
4) Research Template � Analyze how the Study could serve as a template for statewide
broadband research including how the Survey should be expanded, modified, and how
results should be measured.
CBG was engaged by the UTC to assist it in meeting the Legislature�s directive and the
objectives. We employed a variety of survey and other research methodologies to identify
CBG Communications, Inc.
4
factors affecting broadband availability, deployment and consumer adoption and utilization
disparities. These methodologies are described in more detail below.
Study Methodology
As part of the Broadband Study, CBG performed a variety of tasks including:
• Review of background information including, but not limited to, documents prepared by
broadband and technology work groups within the subject counties, prior
telecommunications, economic development and broadband studies conducted within the
subject counties and other regions in Washington and other similar materials.
• Consultation with a wide variety of communities of interest including government,
community, business, non-profit, educational, tribal representatives, and other interested
parties who received and responded to information about the Broadband Study Project
during initial contacts and interviews.
• A telephone survey of the residential community within each of the designated
Broadband Study counties. Specifically, a survey instrument designed to obtain
information about residential broadband availability, adoption and use was developed;
statistically valid sampling and telephone contact methodologies were applied; the
resulting data set was analyzed, correlated and cross-tabulated; and the results are
presented in Section B herein. Three hundred (300) individual residential telephone
interviews were completed within each county; a total of 1,500 across the five counties.
• Regarding the business and non-profit community, broadband availability, adoption and
use was determined from a variety of methodologies, including: a telephone survey of a
random sample of businesses by sector (100 businesses were surveyed in each of the
three largest counties [Grays Harbor, Lewis and Stevens], 50 businesses were surveyed in
each of the smaller counties [Columbia and Ferry], for a total of 400 completed telephone
surveys); an online survey disseminated through local chambers of commerce (101
completed responses were received from various entities throughout the five counties);
CBG Communications, Inc.
5
interviews of key members of prominent businesses and non-profit community
organizations; and participation in focus groups and focused discussions within each
county.
• For other organizational communities of interest (government, educational, libraries and
tribal), written and online surveys were disseminated and completed. Representatives of
many of these communities also participated in the focus groups.
• Eight focus groups and focused discussions were conducted towards the end of the
information gathering process (two in each of the largest counties, with one community-
wide focus group held in each of the two smaller counties). As further described herein,
the focus groups involved a wide variety of participants and were designed to encourage
in-depth discussions to explore and develop, in more granular fashion, findings related to
broadband availability, adoption and use as well as potential deployment options for the
future. Participants were encouraged to react to each of the topic areas and to interact
with each other regarding expressed opinions, perceptions, needs, interests and concerns.
• A broadband providers survey, seeking information from a variety of
telecommunications/broadband service providers, was performed. The information
received was supplemented by a variety of other information gathering activities,
including information received from service users during the other information gathering
efforts described above, as well as review of marketing materials and service provider
agreements such as cable franchises and interviews with service providers and resellers.
• Additionally, a comprehensive physical audit, including a 2,700 mile ride-out of service
provider distribution lines throughout the five counties, was conducted in order to
provide the level of information needed to obtain the most feasible review of current
broadband providers, infrastructure and services.
• Once the information was gathered, CBG conducted a variety of analyses of the
underlying information to reliably interpret and make informed conclusions about the
data. This included:
CBG Communications, Inc.
6
o An economic impact analysis.
o A digital divide analysis.
o A comparative analysis of best practices.
o A broadband infrastructure and service analysis.
o A gap analysis.
o A future requirements analysis.
• All of the foregoing information gathering, review and analysis efforts resulted in the
development of options for broadband service and infrastructure deployment models to
help guide the State as it makes decisions based on the information reported herein.
• A Project Template description is also included at the end of the Report that discusses
how the existing Broadband Study methodology could be applied to other areas in the
State, as well as enhancements that can be made to augment current data gathering
capabilities.
CBG�s Project Manager for the Broadband Study was Tom Robinson, Executive Vice President.
The CBG Project Team included Dick Nielsen, Senior Engineer, who supervised the broadband
provider information gathering effort and performed the physical plant ride-out. Dr. Constance
Book supervised information gathering from the residential, business and educational
communities and performed a wide range of statistical analyses on the information gathered.
Krystene Rivers, Research Associate, assisted all the team members in their various tasks.
CBG would like to thank the UTC for its invaluable assistance in working with us to help
facilitate expeditious, efficient and effective data gathering. Also, CBG wishes to thank the
many state, local, community, business and other representatives who provided assistance in
bringing together critical participants for interviews, focus groups and other information
gathering efforts.
CBG Communications, Inc.
7
Background on the Five Counties
It is important to understand the nature of the residential community, business and industry, the
educational community and other key demographics and characteristics of the five counties
included in the Broadband Study, before reviewing the data that pertains to them and the
interpretations and analysis that CBG presents in this Report. Accordingly, below are brief
descriptions of the five counties.
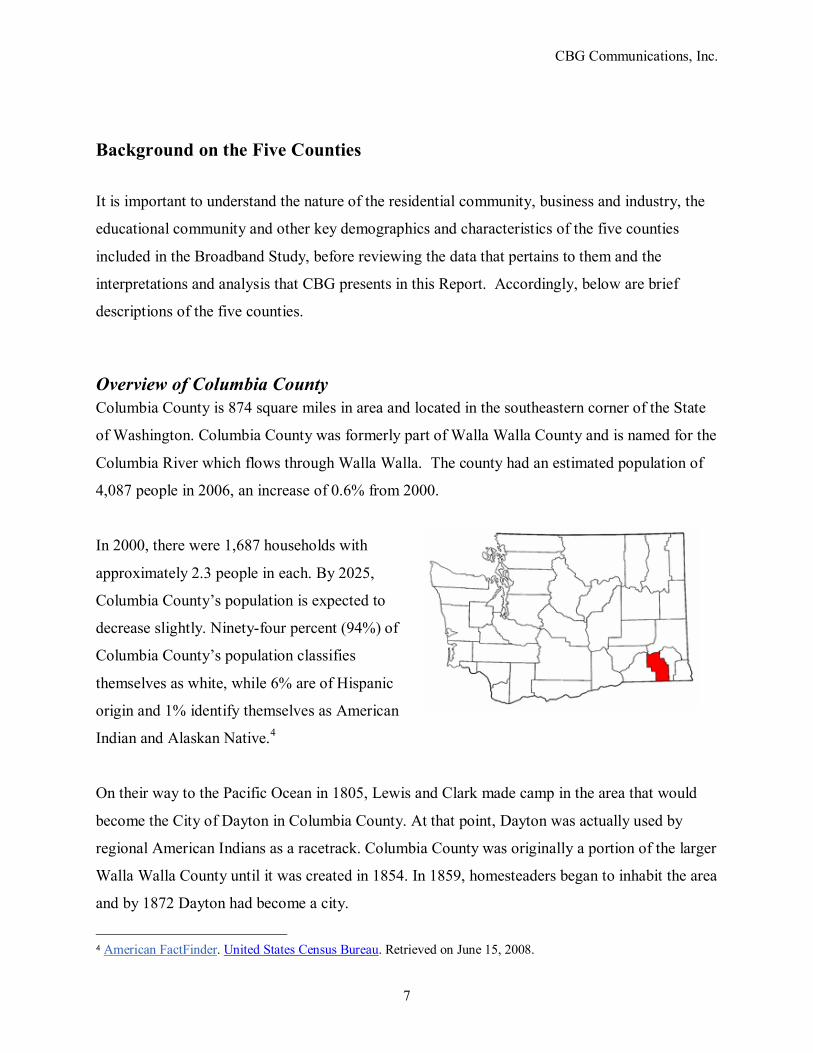
Overview of Columbia County Columbia County is 874 square miles in area and located in the southeastern corner of the State
of Washington. Columbia County was formerly part of Walla Walla County and is named for the
Columbia River which flows through Walla Walla. The county had an estimated population of
4,087 people in 2006, an increase of 0.6% from 2000.
In 2000, there were 1,687 households with
approximately 2.3 people in each. By 2025,
Columbia County�s population is expected to
decrease slightly. Ninety-four percent (94%) of
Columbia County�s population classifies
themselves as white, while 6% are of Hispanic
origin and 1% identify themselves as American
Indian and Alaskan Native.4
On their way to the Pacific Ocean in 1805, Lewis and Clark made camp in the area that would
become the City of Dayton in Columbia County. At that point, Dayton was actually used by
regional American Indians as a racetrack. Columbia County was originally a portion of the larger
Walla Walla County until it was created in 1854. In 1859, homesteaders began to inhabit the area
and by 1872 Dayton had become a city.
4 American FactFinder. United States Census Bureau. Retrieved on June 15, 2008.
CBG Communications, Inc.
8
Presently, Dayton remains the largest city in the county as well as the county seat. Dayton had a
population of 2,655 people in 2000, and accounts for over half of the county�s population. The
town of Starbuck is the second largest municipality in the county, but it has a much smaller
population compared to Dayton; 130 people in 2000.
The five industries that account for the majority of the wages paid to employees in Columbia
County are local government; construction; agriculture, forestry, fishing and hunting; the retail
trade; and wholesale trade.
The top five employers in Columbia County are Dayton�s general hospital, Ski Bluewood, the
county itself, Dayton�s public schools, and the Federal government.5 The unemployment rate in
Columbia County has varied somewhat over the last five years. At present, 6% of the county�s
1,500 person workforce is unemployed.6
Since 1975, Columbia County has been working with county residents to identify the needs of
the county and develop sustainable ways to address those needs. This has included, but is not
limited to, developing county land use plans, identifying valuable historic sites, and developing
appropriate zoning proposals.7
5 Ski Bluewood is a recreation-based company. 6 Palouse Economic Development Council. Retrieved June 15, 2008 from http://www.palouse.org/tables.htm#2. 7 Source: American Fact Finder, United States Census, retrieved April 21, 2008; http://www.ofm.wa.gov/localdata/colu.asp, retrieved April 21, 2008; http://www.choosewashington.com, retrieved April 21, 2008; http://www.co.columbia.or.us/lds/pdfs/compplan.pdf
CBG Communications, Inc.
9
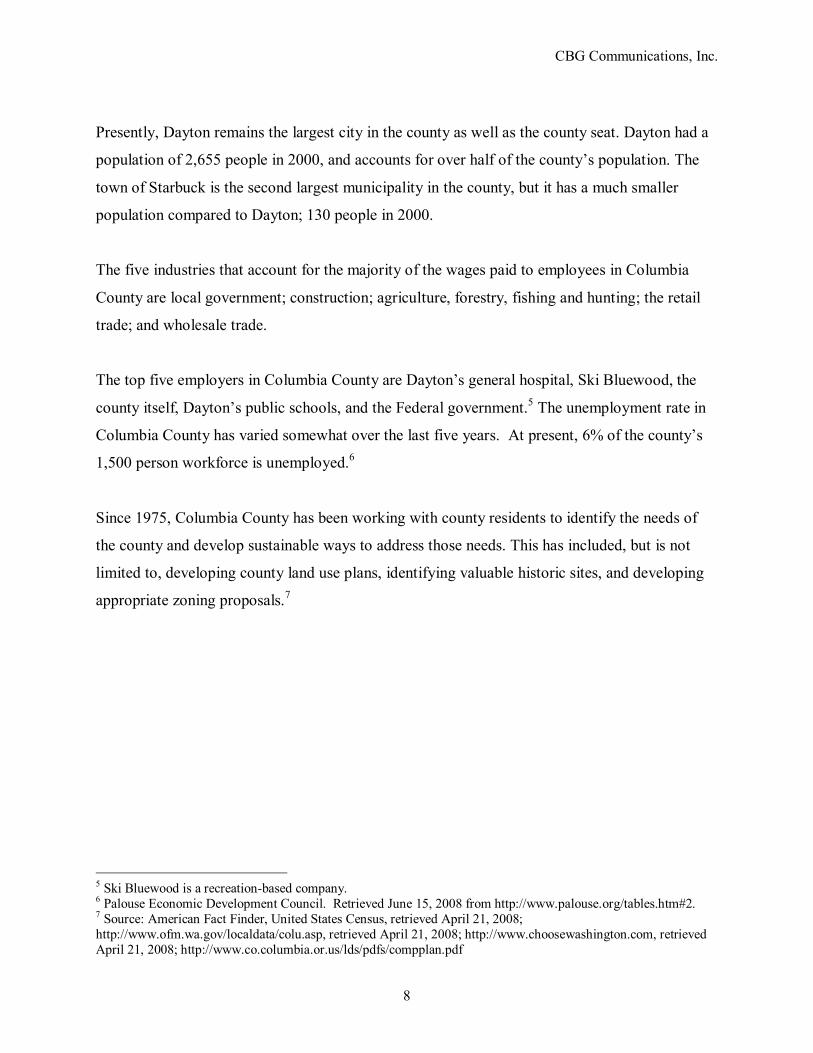
Overview of Ferry County Ferry County is 2,257 square miles in area and
located in the northeastern corner of the State
of Washington. Sometimes referred to as
�frontier� country, Ferry County is not known
as an easy destination to reach because of its
mountainous terrain and northern Canadian
border. Ferry County had a population of
7,559 people in 2007. In the 2000 census, it
had 2,823 households. Ferry County is expected to grow to 9,727 residents in 2025.
The land that is now called Ferry County was originally populated by American Indians who
were mostly of the Colville tribe. In 1825, the Hudson�s Bay Company built a trading post called
Fort Colville in present-day, neighboring Stevens County. Though the fort was in Stevens
County, it helped build up the population of Ferry County, which was officially created out of
Stevens County in 1899. Before the county became official, the Colville Reservation was
established in 1872. At present, the Colville Confederated Tribe owns part of southern Ferry
County.
Within Ferry County, the City of Republic formed out of a gold rush in 1896. Today, it is Ferry
County�s only incorporated city and the county seat. The City of Republic has a population of
985. Though it is the county�s only incorporated city, 13% of the residents of Ferry County live
in the city. This means the majority of the population is spread out in a more rural fashion
throughout the county.
The community of Inchelium is a designated place according to the U.S. Census. Inchelium had
a population of 389 residents, 153 households, in the 2000 census. In the 2000 census, 76% of
residents in Inchelium designated themselves as American Indian or Alaskan Native. Among all
of Ferry County�s 7,500 residents, the 2000 census found that 77% are white, 19% are American
Indian or Alaskan Native, and 3% are Hispanic. The significant number of American Indian and

CBG Communications, Inc.
10
Alaskan Natives in Ferry County can be attributed to the presence of the Colville Tribe both
historically and presently.
The five leading industries that account for the majority of the wages paid to employees in Ferry
County are local government, the Federal government, the retail trade industry, the agriculture,
forestry, fishing and hunting industry, and the construction industry. The top five employers in
Ferry County are Colville Confederated Tribes, Ferry County Memorial Hospital, Ferry County
Government, Columbia Cedar and Kinross Gold.
Colville Confederated Tribes is located on the Colville Reservation and has a handful of tribal
business ventures. Columbia Cedar is a lumber company, while Kinross Gold is a mining
company. Along with wood products, the other industry clusters present in Ferry County are
electronics and computers, aerospace, and agriculture and food products. As of 2007, the
unemployment rate in Ferry County had declined to 7% from 13% in 2003. Thus far in 2008,
unemployment has increased from 7% to 11%.
From an economic development perspective, Ferry County puts significant emphasis on the
county�s outdoor recreational resources as well as the local artistic talent and historic information
that its citizens possess.8
8 Sources: American Fact Finder. United States Census Bureau, retrieved on April 23, 2008. http://www.historylink.org/essays/output.cfm?file_id=7787, retrieved on April 23, 2008; http://www.ofm.wa.gov/databook/county/ferr.asp, retrieved on April 23, 2008 http://quickfacts.census.gov/qfd/states/53/53019.html, retrieved on April 23, 2008
CBG Communications, Inc.
11
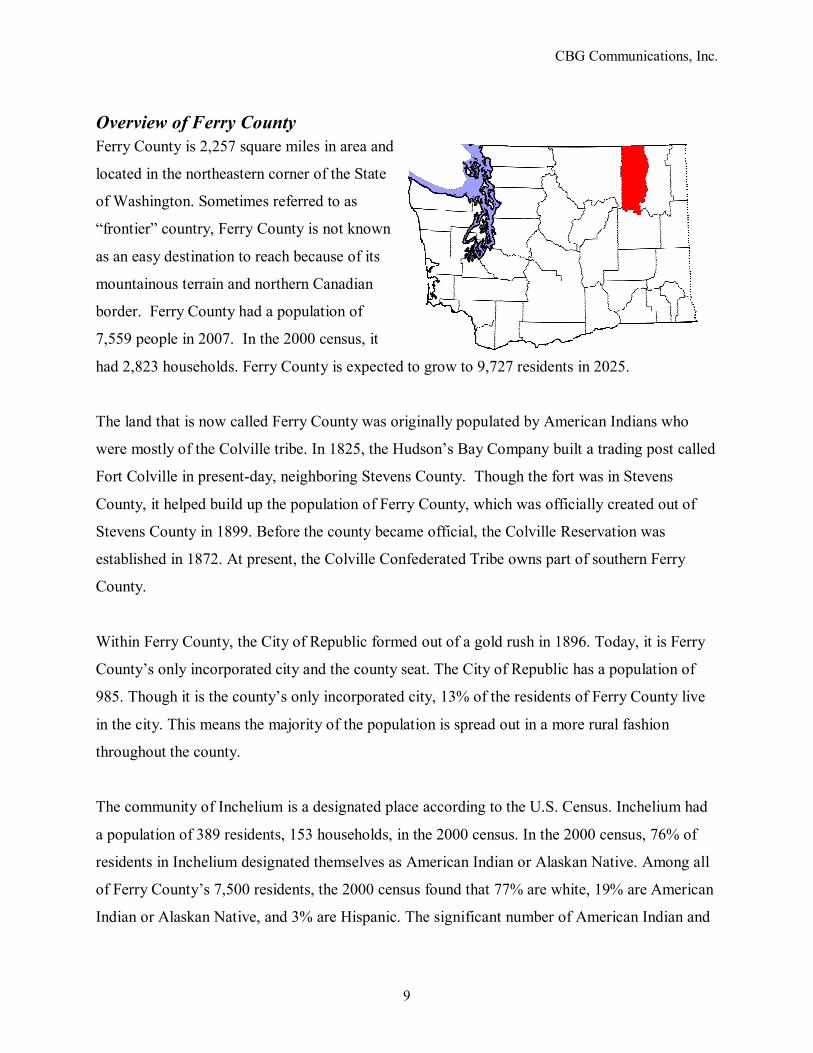
Overview of Grays Harbor County Grays Harbor County is located along the coast of the State of Washington. The county is 1,917
square miles in area and is the 15th largest of the 39 counties in Washington. Grays Harbor
County had a population of 70,800 people in the year 2007 which is expected to increase to
80,213 residents in the year 2025.
In 2006, 90% of Grays Harbor County�s
population classified themselves as white,
while 5% of the county�s residents
considered themselves American Indian or
Alaskan Native.
Present-day Grays Harbor County was first
occupied by American Indians from the
Quinault and Chehalis tribes as well as other tribes in the area. The American Indians dwelled in
stable villages, and battled Spanish explorers claiming their land in 1775. By 1864, the majority
of the tribes were required to make deals with the United States government for reservation land.
People first came to Grays Harbor County in large numbers to work at timber mills or in other
aspects of the lumber industry. In 1915, Grays Harbor County, named after Grays Harbor Bay,
was officially recognized. In 1920, industries that had once fueled the Grays Harbor economy
began to decline. In the 21st century, projects such as a new prison facility, the Quinault Tribe
Casino and Resort at Ocean Shores, Olympic National Park and other recreational attractions
have stimulated economic growth. The Chamber of Commerce reports that tourism constitutes
25% of the county�s economy.
The largest city in Grays Harbor County is the City of Aberdeen, which has a population of
16,450 residents. Hoquiam is the second largest city with 8,845 citizens. The Cities of Ocean
Shores, Montesano and Elma follow in size, with 4,705, 3,550, and 3,140 residents, respectively.
CBG Communications, Inc.
12
The six industries that account for the majority of the wages paid to employees in Grays Harbor
County are local government, the manufacturing industry, the retail trade industry, the
construction industry, the State government, and the agriculture, forestry, fishing and hunting
industry.
The top five manufacturing employers in Grays Harbor County are Westport Shipyard,
Weyerhauser, Simpson Door Plant, Grays Harbor Paper and Briggs Nursery. These companies
specialize in shipping management, forestry, doors, paper products and farming, respectively.
Other important employers include Stafford Creek Prison, with 530 employees, G.H.
Community Hospital, with 691 employees, and the Aberdeen School District, with 490
employees. Ocean Spray also operates a facility in Grays Harbor County with more than 130
employees.
From 2003 to 2007, the unemployment rate in Grays Harbor County decreased from 9% to 6%.
However, in 2008, the county�s rate increased once again to 8%. 9
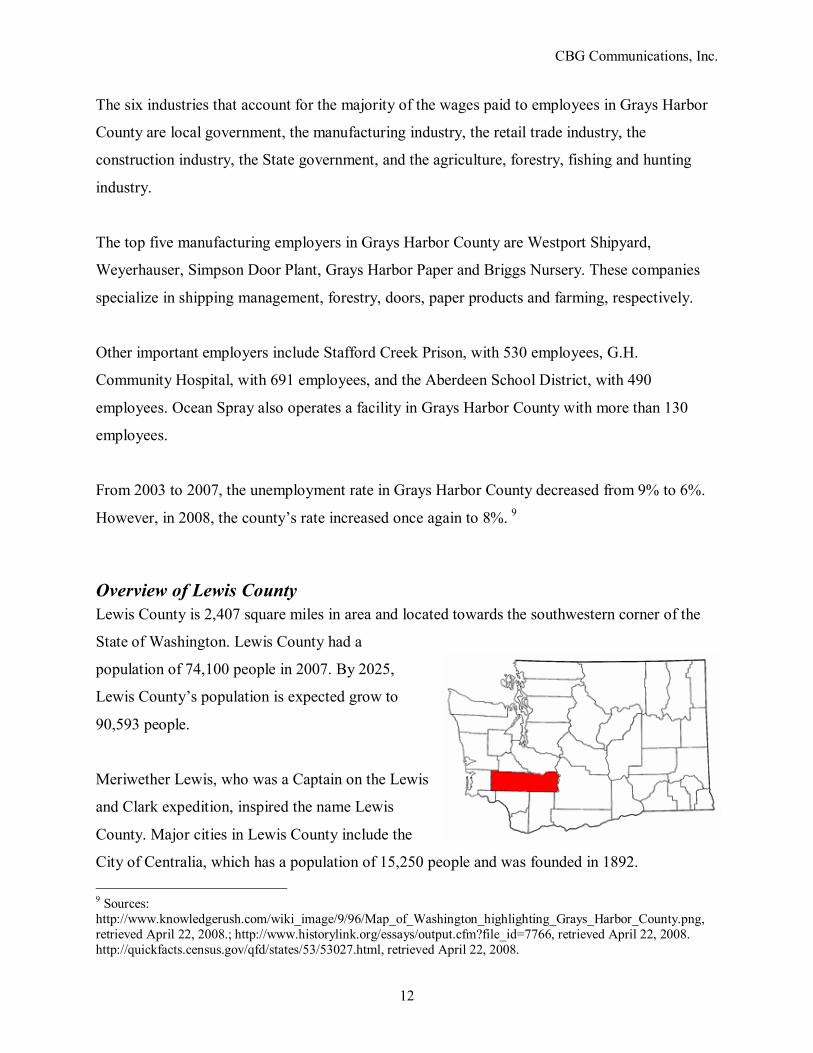
Overview of Lewis County Lewis County is 2,407 square miles in area and located towards the southwestern corner of the
State of Washington. Lewis County had a
population of 74,100 people in 2007. By 2025,
Lewis County�s population is expected grow to
90,593 people.
Meriwether Lewis, who was a Captain on the Lewis
and Clark expedition, inspired the name Lewis
County. Major cities in Lewis County include the
City of Centralia, which has a population of 15,250 people and was founded in 1892. 9 Sources: http://www.knowledgerush.com/wiki_image/9/96/Map_of_Washington_highlighting_Grays_Harbor_County.png, retrieved April 22, 2008.; http://www.historylink.org/essays/output.cfm?file_id=7766, retrieved April 22, 2008. http://quickfacts.census.gov/qfd/states/53/53027.html, retrieved April 22, 2008.
CBG Communications, Inc.
13
Chehalis is the next largest city with a population of 7,045 people and also has been the county
seat since 1872. The next largest cities are all similarly sized. These include Napavine, with a
population of 1,492, Winlock, which has a population of 1,370, and the City of Morton, with a
population of 1,140.
The three industries that account for the majority of the wages paid to employees in Lewis
County are local government, the manufacturing industry and the retail trade industry. However,
the State government, the transportation and warehousing industry, the construction industry and
the agriculture, forestry, fishing and hunting industry also play a significant role in Lewis
County�s economy.
The top five employers in Lewis County are Providence Centralia Hospital, with 800 employees,
Fred Meyer, with 400 employees, Wal-Mart, with 380 employees, Hampton Affiliates, with a
staff of 350 people, and Transalta, with 310 employees. The major industry clusters in Lewis
County are the electronics and computer industry as well as the wood products industry. Lewis
County�s unemployment rate declined from 9% in 2003 to 6% in 2007. Thus far in 2008, it has
increased to 9%.
Lewis County�s Economic Development Council is presently working on creating an
environment that is more inviting to new businesses while also providing an improved
foundation that existing businesses in the area need in order to thrive. By determining
appropriate ways to solve problems inherent in the county�s transportation and regulatory
systems, the Council has already assisted many local businesses.
In early December of 2007, Lewis County experienced one of the worst floods in its history. The
flood shut down some of the county�s businesses and water-logged farmland. The Coast Guard
CBG Communications, Inc.
14
and the American Red Cross responded to the floods and the area is still undergoing recovery
activities.10
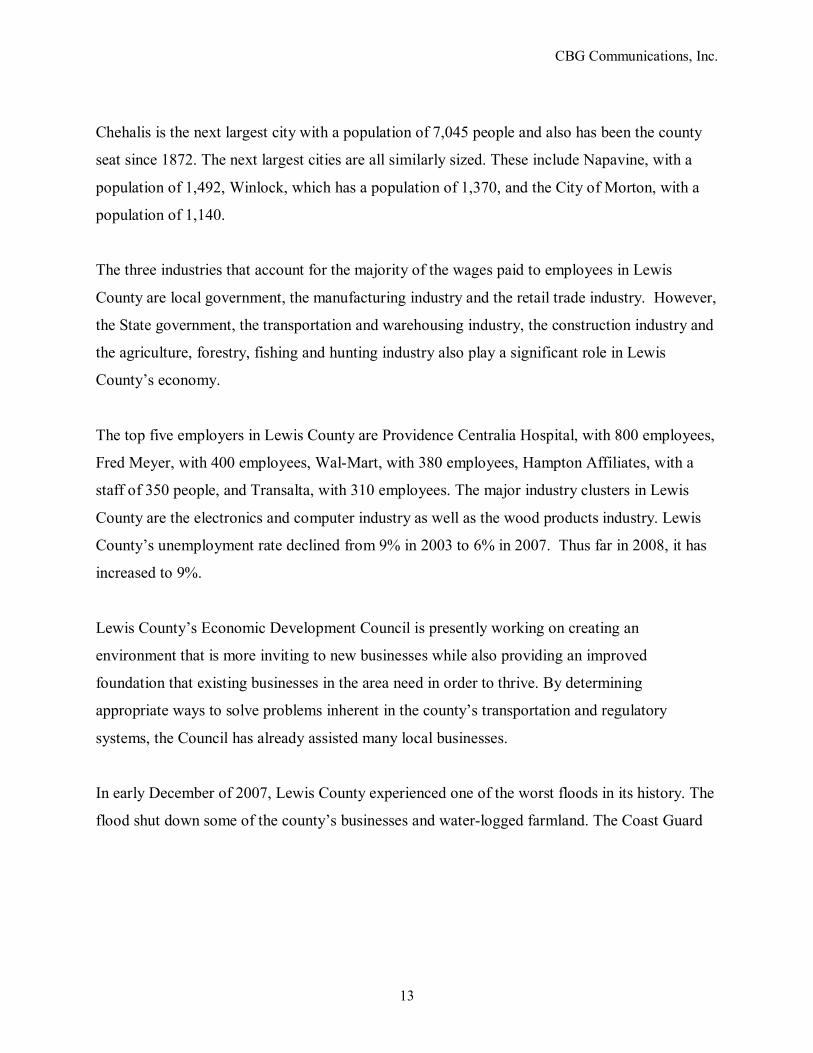
Overview of Stevens County Stevens County is located in the northeastern corner of the State of Washington. The County is
2,478 square miles in area and had a population of 43,000 people in 2007, approximately 17
people per square mile.
When compared to the populations of the 39
other counties in Washington, Stevens County
is presently ranked 23rd. In 2025, Stevens
County�s population is predicted to increase to
approximately 64,000 people.
In 1811, European settlers discovered the
heavily forested, mountainous land that would become the Fort Colville trading post in 1825.
Stevens County was not formally created until 1863 when it was named after Isaac I. Stevens,
who was the Washington Territory�s first Governor soon after its formation in March of 1853.
The largest city in Stevens County is Colville, which has a population of approximately 5,000
people and is the county�s seat. Other major, incorporated cities in Stevens County include
Chewelah, Kettle Falls, Marcus, Northport and Springdale. These Cities� populations range from
around 2500 residents to under 200. However, less than 10% of the county�s population resides
in these six cities.
10 Sources: http://www.wa.nrcs.usda.gov/news/flood.html, retrieved April 23, 2008. http://www.ofm.wa.gov/localdata/lewi.asp, retrieved April 23, 2008. http://www.epodunk.com/cgi-bin/genInfo.php?locIndex=23029, retrieved April 23, 2008. http://www.choosewashington.com/counties/Detail.asp?county_id=55, retrieved April 23, 2008. http://www.choosewashington.com/counties/Labor_Force.asp?county_id=55, retrieved April 23, 2008. http://www.chamberway.com/history/, retrieved April 23, 2008. http://www.askfactmaster.com/Image:Map_of_Washington_highlighting_Lewis_County.png, retrieved April 23, 2008.
CBG Communications, Inc.
15
The industries that account for the majority of the wages paid to employees in Stevens County
are the government, the manufacturing industry, healthcare and social assistance, construction,
and the agriculture, forestry, fishing and hunting industry. The top three industrial employers in
Stevens County are Boise Cascade, Aladdin Hearth Products and Vaagen Brothers Lumber. Two
of these companies produce lumber products while Aladdin Hearth Products produces wood and
pellet stoves. Major non-industrial employers are Colville National Forest, Colville School
District, Stevens County, Wal-Mart and Northeastern Washington Rural Resources. Stevens
County�s unemployment rate is 8% as of April, 2008.
Ninety percent (90%) of Stevens County�s population classifies themselves as white and 5%
identify as American Indian and Alaskan Native. There is a significant American Indian
influence in Stevens and the surrounding counties. The majority of the Spokane Indian
Reservation is located within the boundaries of Stevens County. Around 1,500 American Indians
of the Spokane Tribe and 600 other persons occupy 237.5 square miles that is federally
designated tribal land.
In the last few years, Stevens County has worked to establish regulations for the use of land that
would allow the government to better assist economic development in the community.11
11 Sources: http://www.choosewashington.com/counties/detail.asp?county_id=66, retrieved April 23, 2008. http://www.co.stevens.wa.us/Misc/about.htm, retrieved April 23, 2008. http://www.historylink.org/essays/output.cfm?file_id=7995, retrieved April 23, 2008. http://www.ofm.wa.gov/databook/county/stev.asp, retrieved April 23, 2008. http://quickfacts.census.gov/qfd/states/53/53065.html, retrieved April 23, 2008.
CBG Communications, Inc.
16
Section B Review of Residential
Community Broadband Availability, Adoption and Use
CBG Communications, Inc.
17
REVIEW OF RESIDENTIAL COMMUNITY BROADBAND
AVAILABILITY, ADOPTION AND USE
Project Overview Across The Five Counties
As part of a statewide initiative to address broadband availability and adoption, the Washington
Utilities and Transportation Commission (UTC) retained CBG Communications, Inc., to perform
a Broadband Study which included, in part, a broadband residential survey of five of the State�s
rural counties. Studied counties included Columbia, Ferry, Grays Harbor, Lewis and Stevens. A
survey instrument that explored residential computer and high-speed Internet access and usage
was developed. The survey was administered by telephone to 1500 randomly selected
households, 300 in each of the impacted counties, during April and May 2008.
The residential survey was designed in a collaborative effort between the Washington Utilities
and Transportation Commission and stakeholders in broadband initiatives. These included, but
were not limited to, representatives from state telecommunications organizations, such as the
Washington Association of Telecommunications Officers and Advisors, the Center to Bridge the
Digital Divide at Washington State University, and Stone Soup, a non-profit organization that
addresses creating rural, sustainable communities in the State of Washington.
Stakeholders provided consultation at formative stages and the end result was a survey
instrument that queried residents on topics related to their current computer ownership and
Internet usage, satisfaction with Internet service, the level and importance of high-speed Internet
access, specific Internet applications and activities and how important it is to establish more
robust broadband choices in their respective counties.
A telemarketing firm, Issues and Answers, Inc., headquartered in Virginia Beach, VA, was
secured to conduct all telephone interviews. The firm has over 40 years of combined experience
in social science research using telephone survey methodology. Calls were placed from four call
centers around the United States, during a variety of times of day, during weekdays and
CBG Communications, Inc.
18
weekends, to ensure that varying demographics and lifestyles were represented in the data
collected. Issues and Answers used trained interviewers and a call back procedure to protect the
reliability and validity of the data collected. Telephone numbers were selected using a random
selection technique from the base of area phone numbers associated with the studied counties.
The survey instrument was translated into Spanish and Spanish speaking interviewers were
available in the call room should such a household be reached during interviewing. Continuous
callbacks were made to numbers without answers and to numbers with answering machines or
voice mail so that these numbers were not removed from the pool of potential respondents.
This Section of the report provides an overview of the survey results for the five counties
collectively (a review of the results for each county individually can be found in Attachment 8 of
the Broadband Study Attachments document). When considering the margin of error of the
numbers reported, the sample size of the five counties provides an overall margin of error of
2.5%. This means that if the study was conducted a second time, using the same random digit
dialing procedures and universe of telephone numbers, one can anticipate observing the same
responses to the questions posed within a range of plus or minus 2.5 percentage points. For each
individual county, when considering that the sample size was 300, the margin of error for the
results observed in each county is plus or minus 5.5%.
Residential Community Broadband Survey Findings Across the Five Counties
DEMOGRAPHICS
Before launching into a discussion of the findings, it is appropriate to understand the
demographics of the responding sample. Comparative data as to how the responding sample
compares with the census in each community is available in the community specific sections,
found in Attachment 8 to this report.
Sample Description
The sample for this survey consisted of 1500 randomly selected residents from five counties
(Columbia, Ferry, Grays Harbor, Lewis and Stevens) in the State of Washington with 300
CBG Communications, Inc.
19
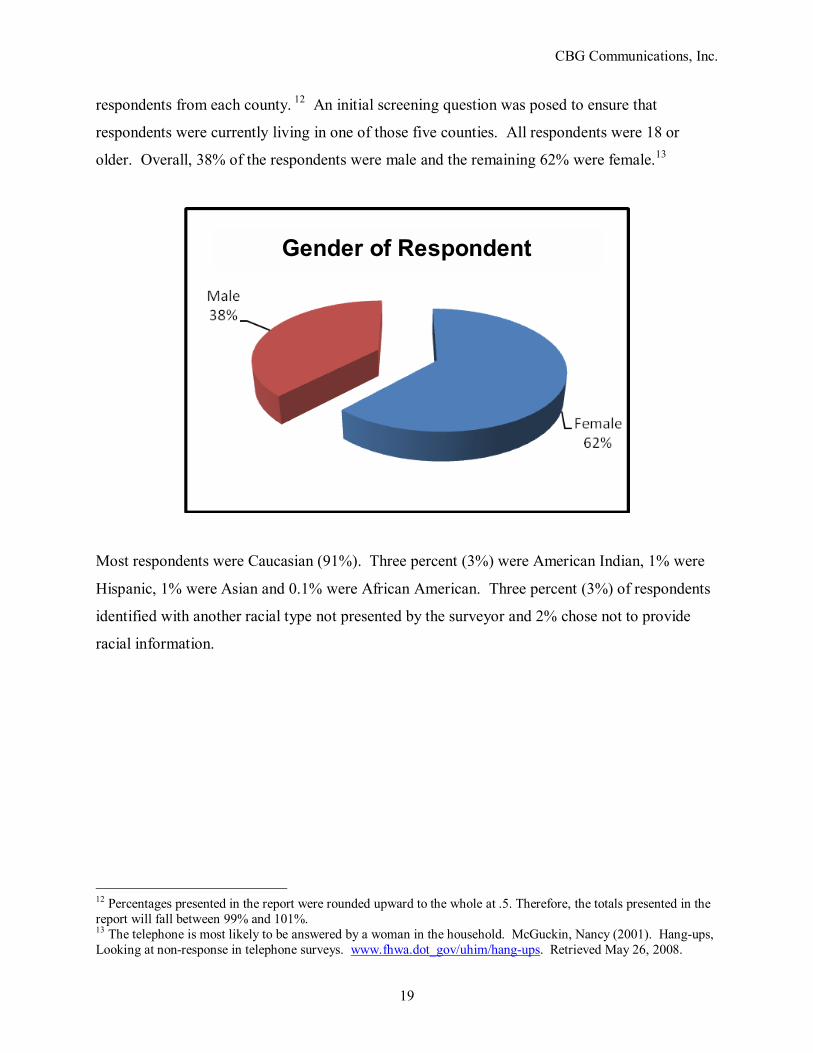
respondents from each county. 12 An initial screening question was posed to ensure that
respondents were currently living in one of those five counties. All respondents were 18 or
older. Overall, 38% of the respondents were male and the remaining 62% were female.13
Gender of Respondent
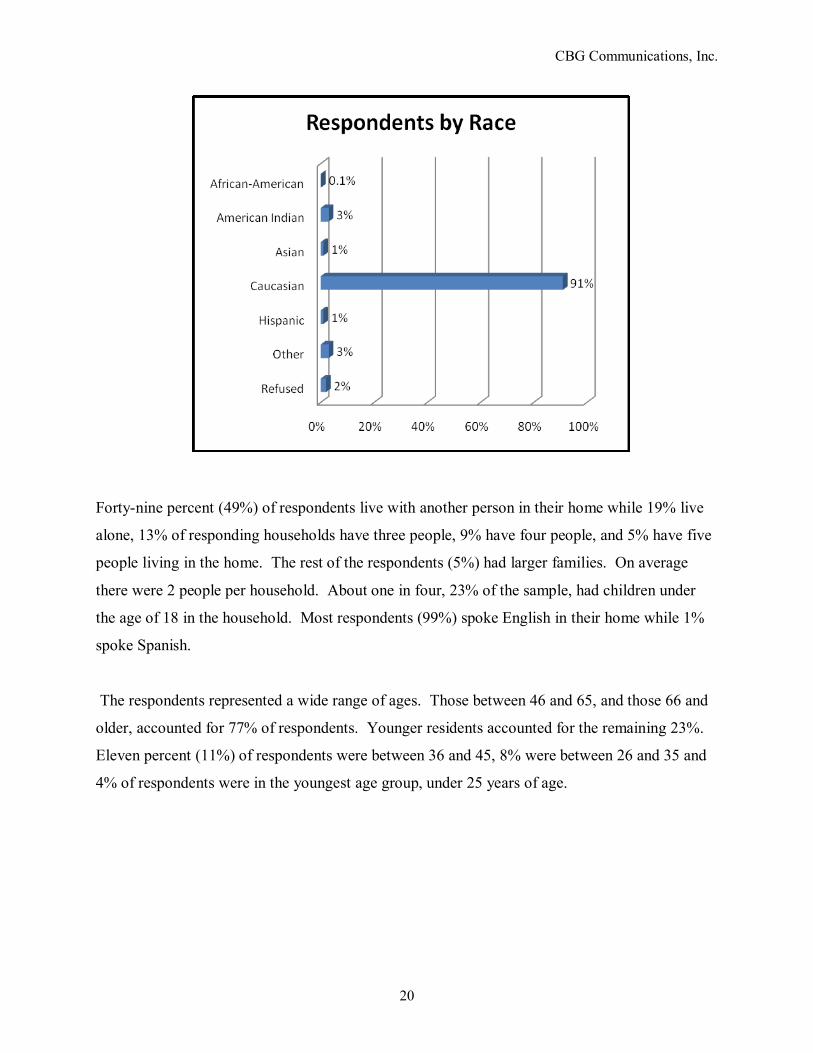
Most respondents were Caucasian (91%). Three percent (3%) were American Indian, 1% were
Hispanic, 1% were Asian and 0.1% were African American. Three percent (3%) of respondents
identified with another racial type not presented by the surveyor and 2% chose not to provide
racial information.
12 Percentages presented in the report were rounded upward to the whole at .5. Therefore, the totals presented in the report will fall between 99% and 101%. 13 The telephone is most likely to be answered by a woman in the household. McGuckin, Nancy (2001). Hang-ups, Looking at non-response in telephone surveys. www.fhwa.dot_gov/uhim/hang-ups. Retrieved May 26, 2008.
CBG Communications, Inc.
20
Forty-nine percent (49%) of respondents live with another person in their home while 19% live
alone, 13% of responding households have three people, 9% have four people, and 5% have five
people living in the home. The rest of the respondents (5%) had larger families. On average
there were 2 people per household. About one in four, 23% of the sample, had children under
the age of 18 in the household. Most respondents (99%) spoke English in their home while 1%
spoke Spanish.
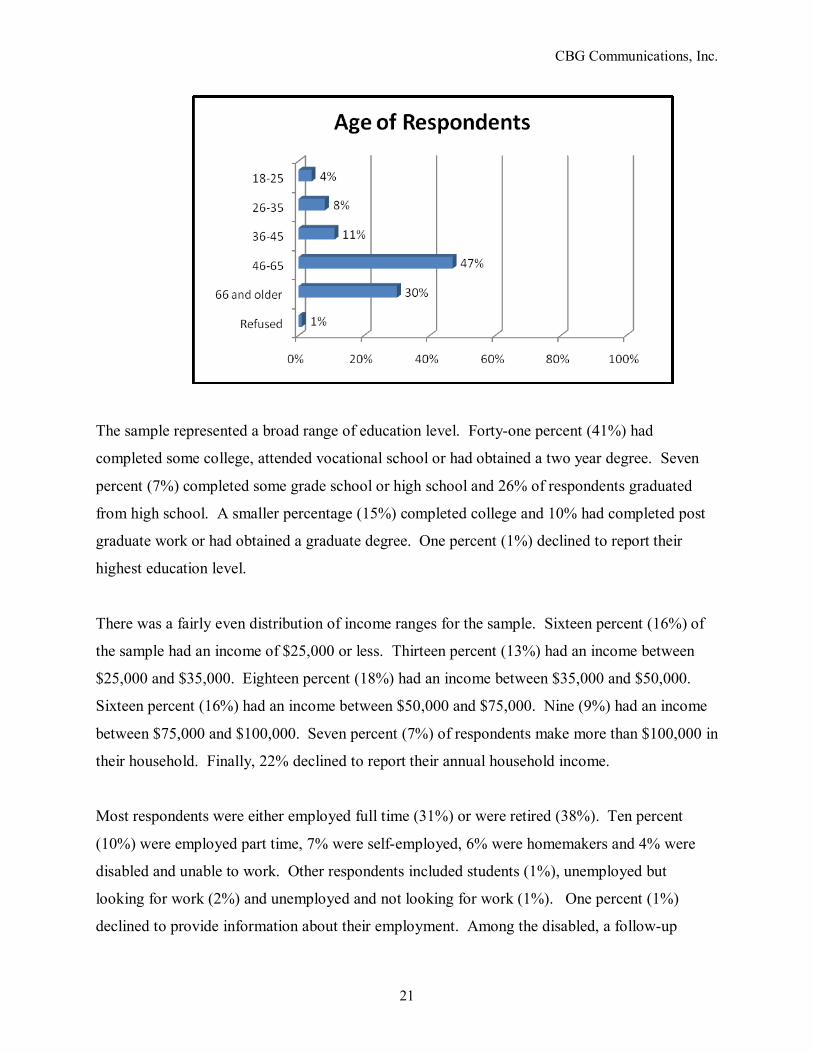
The respondents represented a wide range of ages. Those between 46 and 65, and those 66 and
older, accounted for 77% of respondents. Younger residents accounted for the remaining 23%.
Eleven percent (11%) of respondents were between 36 and 45, 8% were between 26 and 35 and
4% of respondents were in the youngest age group, under 25 years of age.
CBG Communications, Inc.
21
The sample represented a broad range of education level. Forty-one percent (41%) had
completed some college, attended vocational school or had obtained a two year degree. Seven
percent (7%) completed some grade school or high school and 26% of respondents graduated
from high school. A smaller percentage (15%) completed college and 10% had completed post
graduate work or had obtained a graduate degree. One percent (1%) declined to report their
highest education level.
There was a fairly even distribution of income ranges for the sample. Sixteen percent (16%) of
the sample had an income of $25,000 or less. Thirteen percent (13%) had an income between
$25,000 and $35,000. Eighteen percent (18%) had an income between $35,000 and $50,000.
Sixteen percent (16%) had an income between $50,000 and $75,000. Nine (9%) had an income
between $75,000 and $100,000. Seven percent (7%) of respondents make more than $100,000 in
their household. Finally, 22% declined to report their annual household income.
Most respondents were either employed full time (31%) or were retired (38%). Ten percent
(10%) were employed part time, 7% were self-employed, 6% were homemakers and 4% were
disabled and unable to work. Other respondents included students (1%), unemployed but
looking for work (2%) and unemployed and not looking for work (1%). One percent (1%)
declined to provide information about their employment. Among the disabled, a follow-up
CBG Communications, Inc.
22
question was posed, asking if their disability hampered their use of the Internet. One in three
respondents indicated that it did.
Of the respondents that were actively employed (N=753), 22% completed some of their work
from home while 78% described themselves as working only in the workplace. Of the 163
people that worked at home, 20% were telecommuters, 60% worked at a home-based business
and 20% performed �other� work from home. The top three responses for �other� work in the
home were: medical related work such as transcription or caretaking, operating a small home-
based business in addition to their normal work and agricultural-related work.
ACCESS TO COMPUTERS
One of the key objectives of the study was to determine the penetration of personal computers
and Internet use in the rural counties selected for study. Of the 1500 people surveyed, 80%
reported having a computer in their household. Most of the respondents had at least one
computer (59%), while 27% and 10% of the respondents owned two and three computers,
respectively. Of those who owned computers (N=1198), 40% had a laptop while the majority
(60%) owned a desktop computer.
Of the respondents that did not own a computer (N=302), the top three responses as to why they
did not own one were: (a) they didn�t want one (47%), (b) it was too expensive (17%), and (c)
they don�t know how to use it (16%).
Those without computers were asked how much they would be willing to pay for a new
computer. The majority (40%) indicated nothing. Of the remaining 60% willing to pay
something for a computer, the most common response, the mode, was $300.
CBG Communications, Inc.
23
ACCESS TO THE INTERNET
A significant number of survey respondents (72%) had some form of Internet access in their
home. On average, these individuals were paying $45 dollars per month for their Internet
service.
Of the respondents that did not have Internet access at home, the most common reasons were the
same as those for not having a computer. Thirty-three percent (33%) said that they didn�t want
it, 18% said that it was too expensive and 14% said that they didn�t know how to use it. When
asked how much they would be willing to pay for Internet service a month, the range was from
nothing, indicated by 25% of respondents, to $200 per month. The average reported amount was
$20 dollars per month.
INTERNET USE
When asked who uses the computer or the Internet in the household, the majority of respondents
(85%) first replied that they do. The second most common user was a spouse or partner (12%)
and the third most common was children (3%). Other responses mentioned by the respondents
indicated that grandchildren and other relatives also use the computer and the Internet.
The type of Internet connection that was most common among the respondents who reported
having the Internet (N=1081), was dial up (34%). Twenty-eight (28%) used Digital Subscriber
Line (DSL), 17% used a cable modem and 10% used satellite Internet service. Other forms of
Internet service mentioned were infrequent, but included fixed wireless broadband (3%), cell
phone air cards (.3%) and fiber to the home (.3%).
Those with Internet service were asked who their provider was. Respondents were most likely to
name their phone company, such as Qwest (N=187) or CenturyTel (N=107), as their Internet
provider. Other ISPs included Wild Blue (N=54) and Blue Mountain (N=30). Comcast
provided the majority of the cable modem service in the area under study (N=187).
CBG Communications, Inc.
24
The speed of the Internet connection was highly variable for the respondents. Most respondents
were unable to give a specific connection speed. Many just described their connection as �dial-
up�. Of those who knew their connection speed, most reported a speed of less than 100 Kbps
(23%). Nineteen percent who knew their connection speed had between 101 and 500 Kbps, 10%
had between 501 Kbps and 1 Mbps, 23% had between 1.1 and 5 Mbps, 18% had between 5.1 and
10 Mbps and 6% had greater than 10 Mbps.
Of those respondents who did not have high-speed Internet connections (N=478), the chief
reason for not selecting a faster Internet connection was because it was not available in their area
(50%). Twenty-two percent (22%) of respondents� first responses were that it costs too much
and 14% said that they did not need it.
To further explore how and where the Internet was used, respondents were asked about their
Internet use at home and away from home. At home, respondents reporting spending between no
time online (1%) to 10 hours a day online (2%). The mode, or the most frequent response, was
that they spent an hour online a day. The average time online was 2 hours and 20 minutes a day.
Respondents were asked whether they used the Internet in a place other than their own home. A
majority (65%) replied that they only used the Internet in their home while 35% (N=515) said
that they access the Internet at a place other than their home. Over the past thirty days,
respondents reported that the range of time spent online away from home, was from no time
(41%) to 168 hours (.1%). The most frequently reported amount of hours spent online in the last
30 days away from home among those that reported some activity was 10 hours. The average
time online away from home was 18 hours in the last 30 days or roughly 40 minutes a day.
One in four respondents indicated that they used the Internet at work (24%). If the respondent
indicated that they spent time online at work, a follow-up question was posed asking if they were
a computer professional. Two percent (2%) of all survey respondents indicated that they were
computer professionals.

CBG Communications, Inc.
25
The majority of the sample was not currently enrolled in school (95%). Of those that were, the
range of online time was between 15 minutes and three hours, with an hour a day online at
school indicated as the most frequent response.
Nine percent (9%) of respondents indicated using the Internet service available at the public
library. A majority of these (74%) were residents reporting not having an Internet connection.
This suggests that the library has become a key location for those without broadband access to
use the Internet.
Fifteen percent (15%) of respondents reported that they used the Internet at a friend or relative�s
house. This included, but did not represent predominantly those respondents that indicated they
did not have Internet service at home. Similarly, while 4% of the sample reported using the
Internet at retail locations, this did not consist mainly of those without Internet at home, but did
tend to be rural residents with laptop capabilities.
In the other �outside of the home usage� category, the top three places that respondents
mentioned were specific towns, Main Street or downtown areas with �hot spots�, and local
businesses, such as coffee shops.
The average number of e-mail accounts for respondents with Internet access in the five counties
surveyed was 2 email accounts. The range was from 0 (5%) to 50 (.5%), with the majority
indicating that they had one email account (45%) and one in three indicating that they had two
accounts (32%). Respondents that were employed or in school were more likely to report having
multiple e-mail accounts.
In describing their primary email account, most respondents used their e-mail for personal
reasons (71%), while 28% used it for work and 1% used it for school. Respondents most likely
used their second email account for work or school.

CBG Communications, Inc.
26
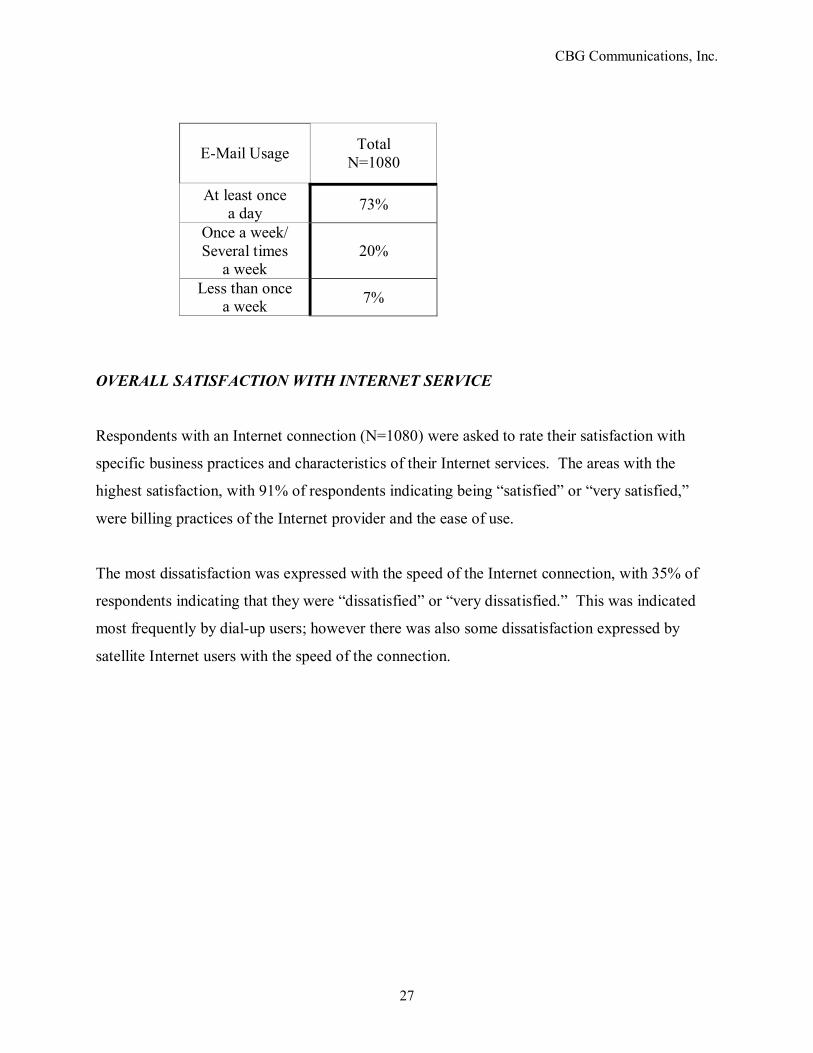
A large majority of the individuals with an Internet connection replied that they used their e-mail
account at least once a day (73%) or once or several times a week (20%). A smaller percentage
(7%) use their e-mail account less than once a week.
[Rest of page left intentionally blank]
CBG Communications, Inc.
27
E-Mail Usage Total N=1080
At least once a day 73%
Once a week/ Several times
a week 20%
Less than once a week 7%
OVERALL SATISFACTION WITH INTERNET SERVICE
Respondents with an Internet connection (N=1080) were asked to rate their satisfaction with
specific business practices and characteristics of their Internet services. The areas with the
highest satisfaction, with 91% of respondents indicating being �satisfied� or �very satisfied,�
were billing practices of the Internet provider and the ease of use.
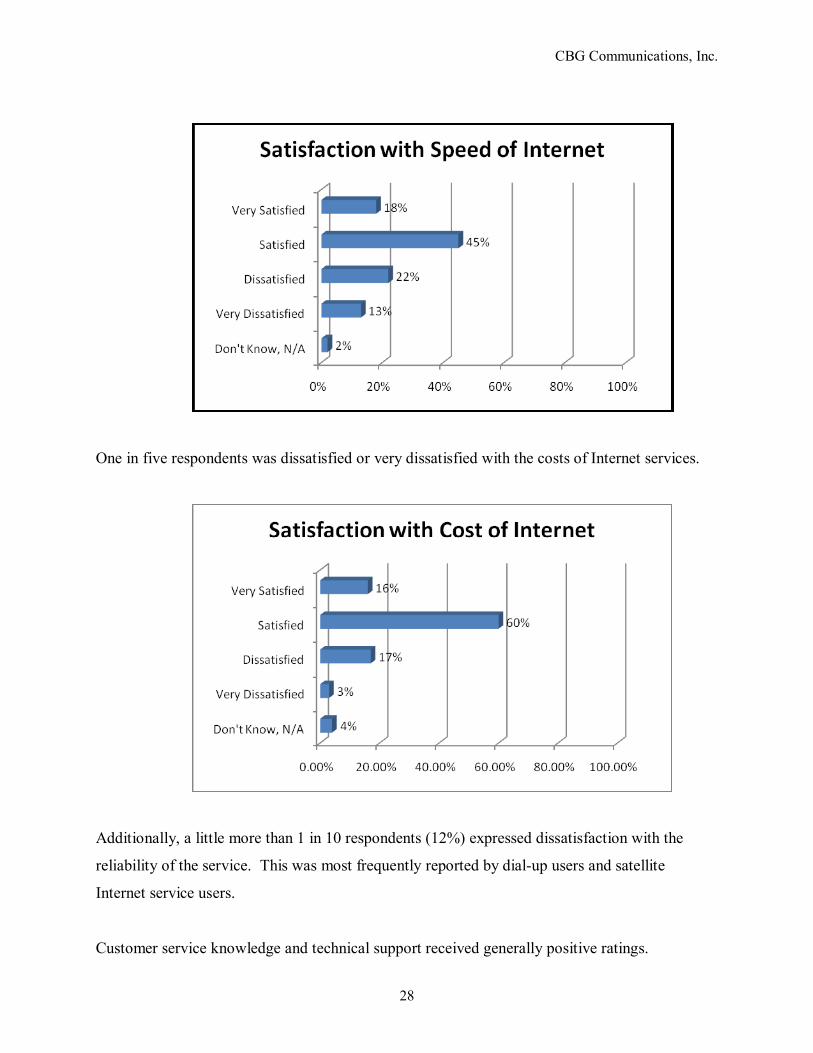
The most dissatisfaction was expressed with the speed of the Internet connection, with 35% of
respondents indicating that they were �dissatisfied� or �very dissatisfied.� This was indicated
most frequently by dial-up users; however there was also some dissatisfaction expressed by
satellite Internet users with the speed of the connection.
CBG Communications, Inc.
28
One in five respondents was dissatisfied or very dissatisfied with the costs of Internet services.
Additionally, a little more than 1 in 10 respondents (12%) expressed dissatisfaction with the
reliability of the service. This was most frequently reported by dial-up users and satellite
Internet service users.
Customer service knowledge and technical support received generally positive ratings.
CBG Communications, Inc.
29
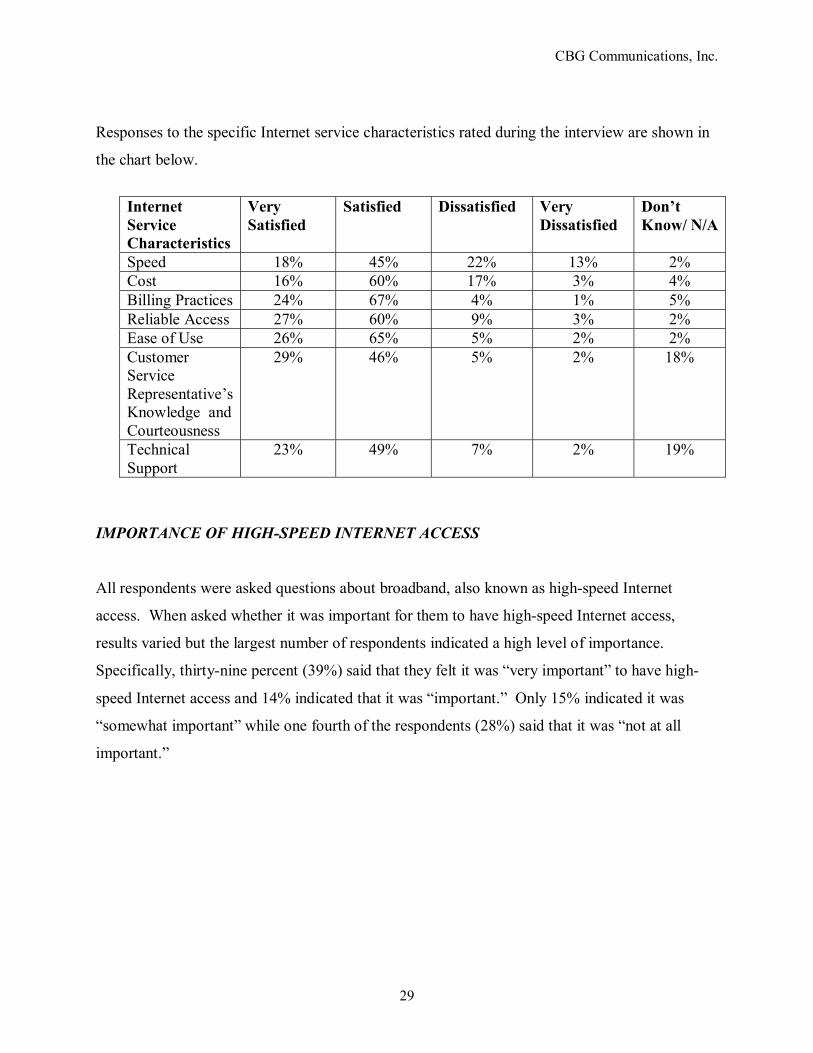
Responses to the specific Internet service characteristics rated during the interview are shown in
the chart below.
Internet Service Characteristics
Very Satisfied
Satisfied Dissatisfied Very Dissatisfied
Don�t Know/ N/A
Speed 18% 45% 22% 13% 2% Cost 16% 60% 17% 3% 4% Billing Practices 24% 67% 4% 1% 5% Reliable Access 27% 60% 9% 3% 2% Ease of Use 26% 65% 5% 2% 2% Customer Service Representative�s Knowledge and Courteousness
29% 46% 5% 2% 18%
Technical Support
23% 49% 7% 2% 19%
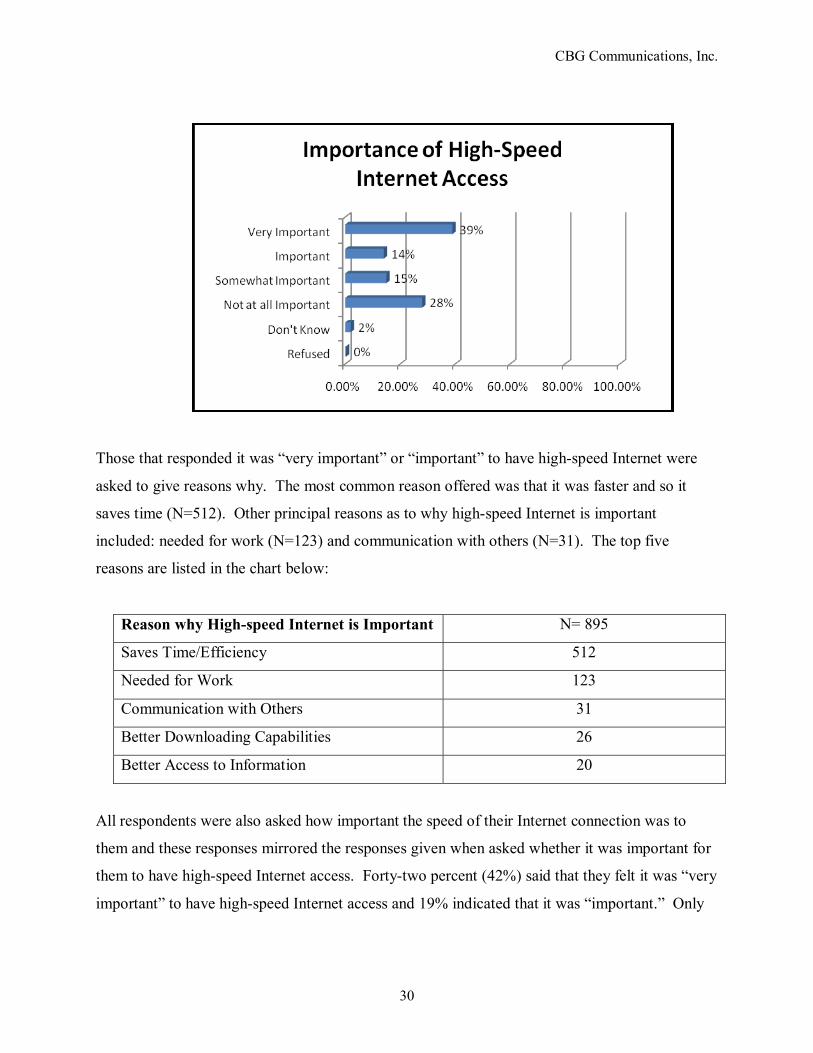
IMPORTANCE OF HIGH-SPEED INTERNET ACCESS
All respondents were asked questions about broadband, also known as high-speed Internet
access. When asked whether it was important for them to have high-speed Internet access,
results varied but the largest number of respondents indicated a high level of importance.
Specifically, thirty-nine percent (39%) said that they felt it was �very important� to have high-
speed Internet access and 14% indicated that it was �important.� Only 15% indicated it was
�somewhat important� while one fourth of the respondents (28%) said that it was �not at all
important.�
CBG Communications, Inc.
30
Those that responded it was �very important� or �important� to have high-speed Internet were
asked to give reasons why. The most common reason offered was that it was faster and so it
saves time (N=512). Other principal reasons as to why high-speed Internet is important
included: needed for work (N=123) and communication with others (N=31). The top five
reasons are listed in the chart below:
Reason why High-speed Internet is Important N= 895
Saves Time/Efficiency 512
Needed for Work 123
Communication with Others 31
Better Downloading Capabilities 26
Better Access to Information 20
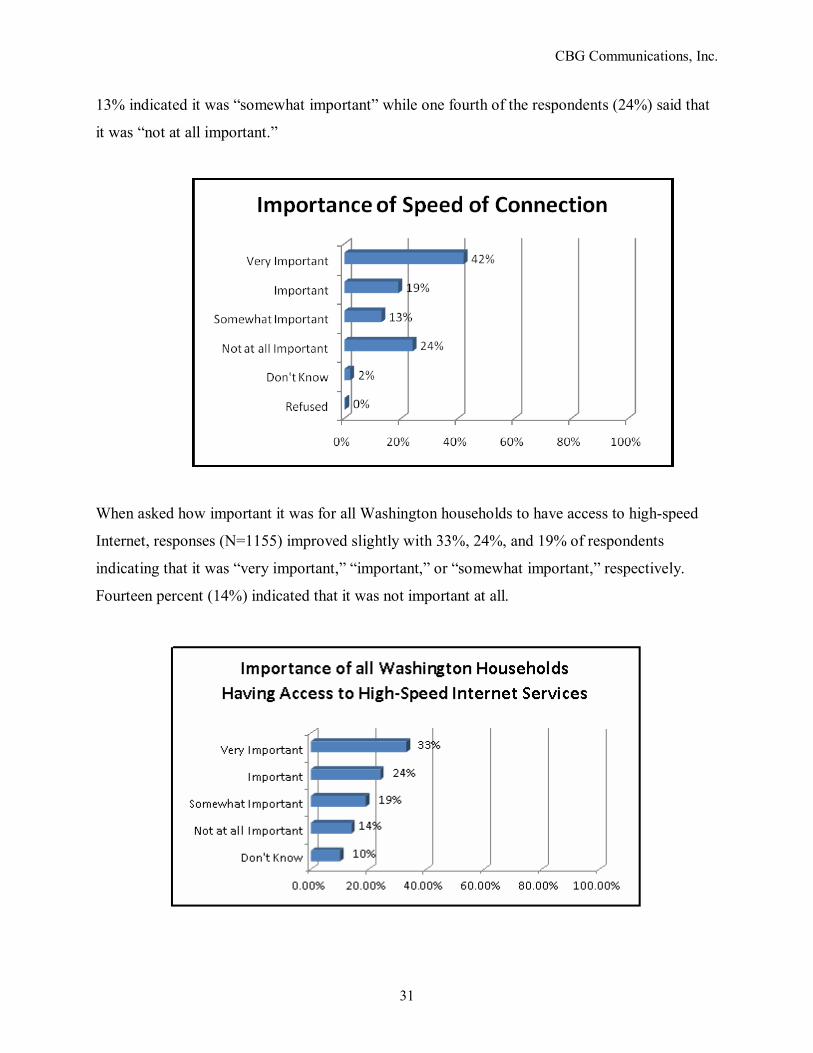
All respondents were also asked how important the speed of their Internet connection was to
them and these responses mirrored the responses given when asked whether it was important for
them to have high-speed Internet access. Forty-two percent (42%) said that they felt it was �very
important� to have high-speed Internet access and 19% indicated that it was �important.� Only
CBG Communications, Inc.
31
13% indicated it was �somewhat important� while one fourth of the respondents (24%) said that
it was �not at all important.�
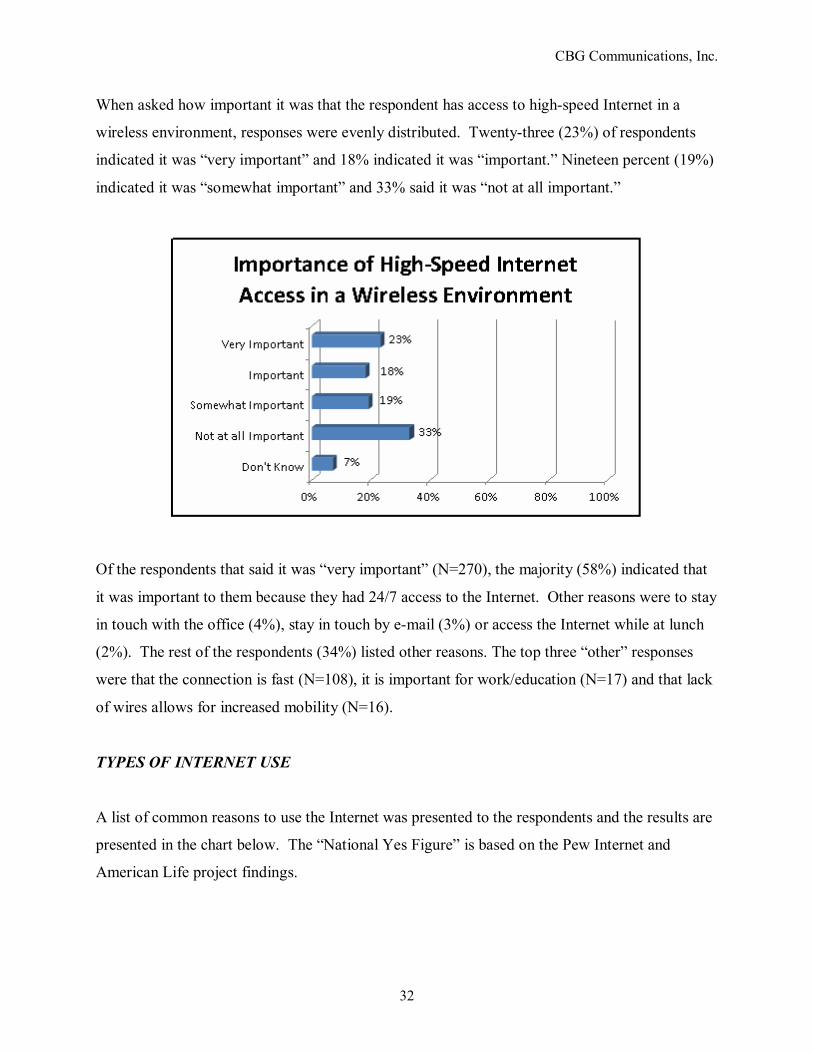
When asked how important it was for all Washington households to have access to high-speed
Internet, responses (N=1155) improved slightly with 33%, 24%, and 19% of respondents
indicating that it was �very important,� �important,� or �somewhat important,� respectively.
Fourteen percent (14%) indicated that it was not important at all.
CBG Communications, Inc.
32
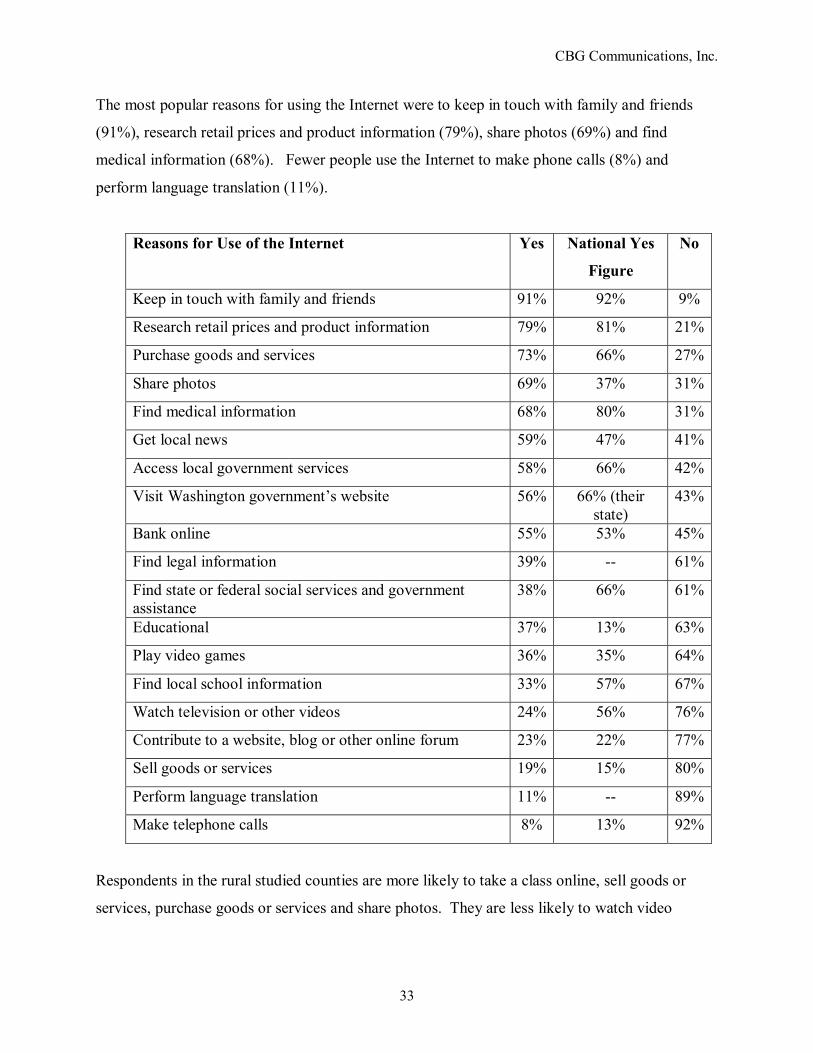
When asked how important it was that the respondent has access to high-speed Internet in a
wireless environment, responses were evenly distributed. Twenty-three (23%) of respondents
indicated it was �very important� and 18% indicated it was �important.� Nineteen percent (19%)
indicated it was �somewhat important� and 33% said it was �not at all important.�
Of the respondents that said it was �very important� (N=270), the majority (58%) indicated that
it was important to them because they had 24/7 access to the Internet. Other reasons were to stay
in touch with the office (4%), stay in touch by e-mail (3%) or access the Internet while at lunch
(2%). The rest of the respondents (34%) listed other reasons. The top three �other� responses
were that the connection is fast (N=108), it is important for work/education (N=17) and that lack
of wires allows for increased mobility (N=16).
TYPES OF INTERNET USE
A list of common reasons to use the Internet was presented to the respondents and the results are
presented in the chart below. The �National Yes Figure� is based on the Pew Internet and
American Life project findings.
CBG Communications, Inc.
33
The most popular reasons for using the Internet were to keep in touch with family and friends
(91%), research retail prices and product information (79%), share photos (69%) and find
medical information (68%). Fewer people use the Internet to make phone calls (8%) and
perform language translation (11%).
Reasons for Use of the Internet Yes National Yes
Figure
No
Keep in touch with family and friends 91% 92% 9%
Research retail prices and product information 79% 81% 21%
Purchase goods and services 73% 66% 27%
Share photos 69% 37% 31%
Find medical information 68% 80% 31%
Get local news 59% 47% 41%
Access local government services 58% 66% 42%
Visit Washington government�s website 56% 66% (their state)
43%
Bank online 55% 53% 45%
Find legal information 39% -- 61%
Find state or federal social services and government assistance
38% 66% 61%
Educational 37% 13% 63%
Play video games 36% 35% 64%
Find local school information 33% 57% 67%
Watch television or other videos 24% 56% 76%
Contribute to a website, blog or other online forum 23% 22% 77%
Sell goods or services 19% 15% 80%
Perform language translation 11% -- 89%
Make telephone calls 8% 13% 92%
Respondents in the rural studied counties are more likely to take a class online, sell goods or
services, purchase goods or services and share photos. They are less likely to watch video
CBG Communications, Inc.
34
online, look for government services online, find local school information and make a phone call
online.
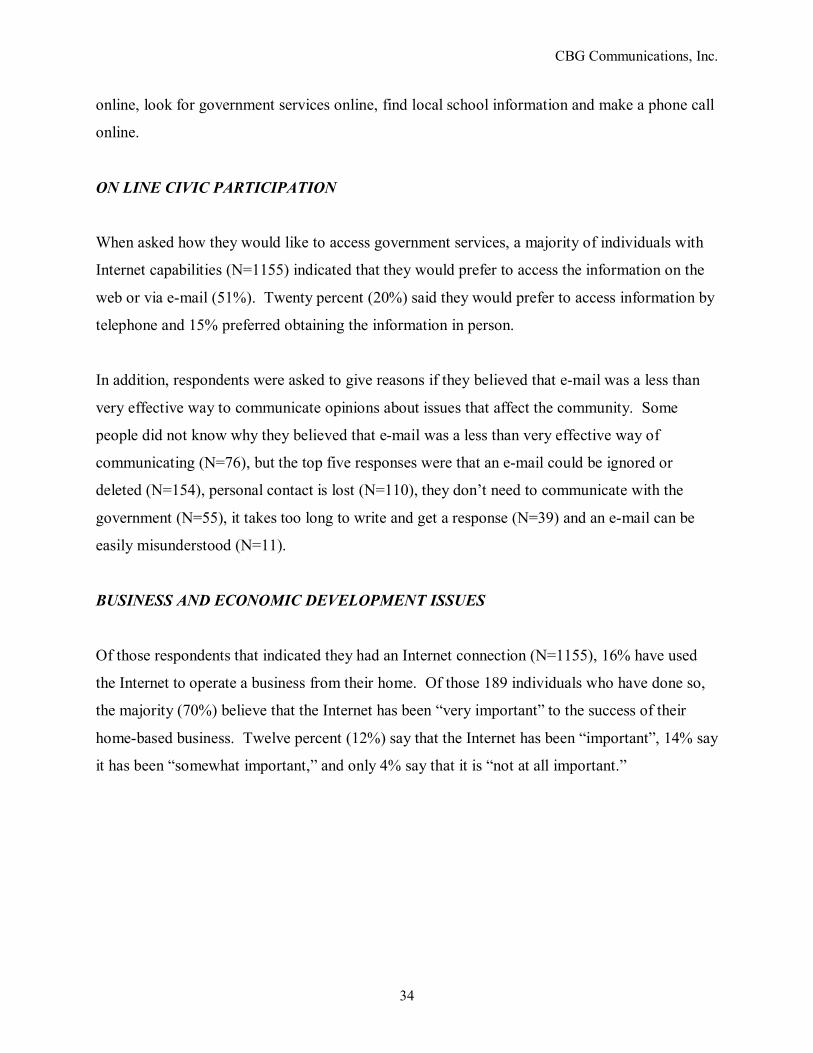
ON LINE CIVIC PARTICIPATION
When asked how they would like to access government services, a majority of individuals with
Internet capabilities (N=1155) indicated that they would prefer to access the information on the
web or via e-mail (51%). Twenty percent (20%) said they would prefer to access information by
telephone and 15% preferred obtaining the information in person.
In addition, respondents were asked to give reasons if they believed that e-mail was a less than
very effective way to communicate opinions about issues that affect the community. Some
people did not know why they believed that e-mail was a less than very effective way of
communicating (N=76), but the top five responses were that an e-mail could be ignored or
deleted (N=154), personal contact is lost (N=110), they don�t need to communicate with the
government (N=55), it takes too long to write and get a response (N=39) and an e-mail can be
easily misunderstood (N=11).
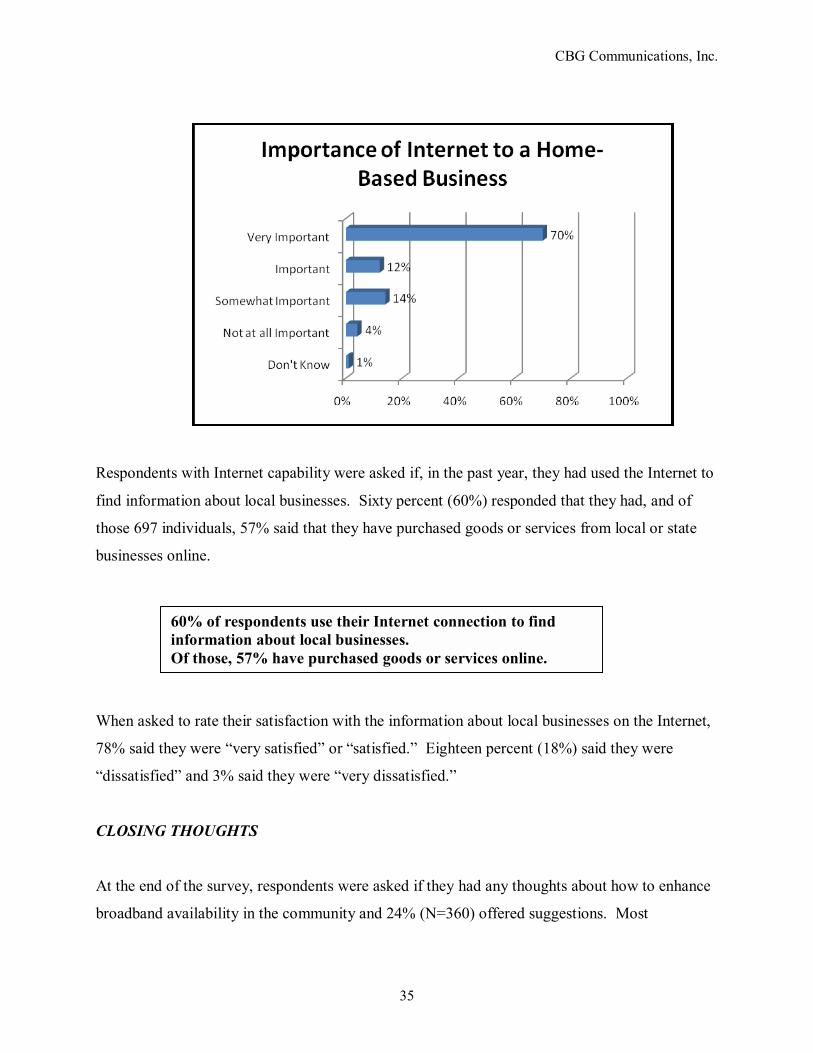
BUSINESS AND ECONOMIC DEVELOPMENT ISSUES
Of those respondents that indicated they had an Internet connection (N=1155), 16% have used
the Internet to operate a business from their home. Of those 189 individuals who have done so,
the majority (70%) believe that the Internet has been �very important� to the success of their
home-based business. Twelve percent (12%) say that the Internet has been �important�, 14% say
it has been �somewhat important,� and only 4% say that it is �not at all important.�
CBG Communications, Inc.
35
Respondents with Internet capability were asked if, in the past year, they had used the Internet to
find information about local businesses. Sixty percent (60%) responded that they had, and of
those 697 individuals, 57% said that they have purchased goods or services from local or state
businesses online.
When asked to rate their satisfaction with the information about local businesses on the Internet,
78% said they were �very satisfied� or �satisfied.� Eighteen percent (18%) said they were
�dissatisfied� and 3% said they were �very dissatisfied.�
CLOSING THOUGHTS
At the end of the survey, respondents were asked if they had any thoughts about how to enhance
broadband availability in the community and 24% (N=360) offered suggestions. Most
60% of respondents use their Internet connection to find information about local businesses. Of those, 57% have purchased goods or services online.
CBG Communications, Inc.
36
respondents said that it was important to get high-speed access to more rural areas by building
more towers and running cables to those areas (N=165).
Ninety-nine (N=99) people said that making it more affordable would help as well. Also, there
was a group of people who believed that increasing competition and decreasing the monopoly on
broadband service would also help.
When asked if they had anything additional to add about broadband that was not covered in the
survey, 14% of people added additional thoughts. Among those that did, the most common was
a reiteration of the perception that broadband opportunities need to be enhanced for rural areas
(N=40) with more service options and providers. Thirty-one respondents (N=31) said that they
wanted Internet services and computers to be �cheaper� and �more affordable.� Others said that
they would just really like to have broadband (N=25).
CBG Communications, Inc.
37
Key Findings in Residential Survey Across All Five Counties The key findings from the residential survey of broadband availability, adoption and usage in the
five counties of Columbia, Ferry, Grays Harbor, Lewis and Stevens are:
ACCESS TO COMPUTERS:
• Eighty percent (80%) of respondents report having a computer in the home. This
is consistent with estimates of PC penetration for the US by the Consumer
Electronics Association.14
• Twenty-seven percent (27%) of these homes have two computers. Ten percent
(10%) have three computers in the home.
• Forty percent (40%) of residents describe at least one of their computers as a
laptop.
• The primary reasons for not owning a computer are: don�t want one (47%), too
expensive (17%) and don�t know how to use it (16%).
• Sixty percent (60%) of non-PC owners are willing to buy a computer and most
commonly indicate a willingness to pay $300.
ACCESS TO THE INTERNET:
• Seventy-two percent (72%) of respondents have access to the Internet at home.
This is consistent with the United States� average subscription rate. Internet
access costs an average of $45 a month. The average cost is lower than the U.S.
14 PC ownership is tracked by the Consumer Electronics Association, www.ce.org.
CBG Communications, Inc.
38
average because of the significant reliance on dial-up. The average American
pays $53.06 per month for high-speed Internet access.15
• Of those with Internet access: 34% have dial-up, 28% have DSL, 17% have a
cable modem and 10% use a satellite Internet service. In other words, 32% of
total residents in the five studied counties have wireline broadband services. If
you add satellite Internet services to that number, broadband penetration grows to
39% of the five studied rural counties. These numbers are consistent with the
Pew Internet and American Life rural broadband study that noted nationwide
approximately 31% of rural Americans have broadband compared to 49% of
suburban Americans and 52% of urban Americans.16
• Those with Internet service, but without broadband, said the primary reason for
not having broadband was because it was not available in their area (50%); 22%
said that it cost too much; 14% said that they didn�t need it.
• Concerning those without Internet service: 33% said that they didn�t want it, 18%
said that it was too expensive and 14% said that they didn�t know how to use the
Internet.
• Those without Internet service but who are willing to pay to get it said they would
pay $20 a month to obtain Internet service.
• The top three residential service providers in the five counties are Qwest,
CenturyTel and Comcast.
QUALITY OF INTERNET SERVICE:
• One in three Internet users are dissatisfied or very dissatisfied with the speed of
their Internet connection (13% very dissatisfied and 22% dissatisfied).
15 Broadband penetration and costs are tracked by the Pew Internet and American Life Project. www.pewInternet.org. 16 These figures are provided by the Pew Internet and American Life Project, www.pewInternet.org.
CBG Communications, Inc.
39
• One in five Internet users is dissatisfied with the cost of Internet service (mostly
satellite and cable modem users).
• One in ten Internet users (mostly dial-up) expressed dissatisfaction with the
reliability of the service.
IMPORTANCE OF INTERNET ACCESS:
• The majority of respondents felt that access to high-speed Internet was important
or very important (53%). When describing its importance, most said that it was
important because it saved time and created efficiencies for work and for keeping
in contact with others.
• The speed of the Internet connection was described as very important or important
by 61% of residential respondents.
• Eighty-two percent (82%) of respondents felt that it was important or very
important for all Washington residents to have access to high-speed Internet.
• Forty-one percent (41%) of respondents thought access to the Internet in a
wireless environment was very important or important. When asked why, most
indicated such access was critical for work, the ability to stay in touch and check
e-mail and for mobility purposes
• Fifty-one percent (51%) of residential respondents indicated they would like to
access government services via the web or e-mail.
INTERNET USE:
• Average time online per day at home was two hours and 20 minutes.
• Sixty-five percent (65%) of respondents only use the Internet at home.
CBG Communications, Inc.
40
• Of the 35% of respondents that use the Internet away from home: 1 in 4 use it at
work; 5% use it at school; 9% go to the public library; 15% use it at a friend or
relative�s house; and 4% bring their laptop to a retail outlet or use a computer
there.
• The library is also a key location for those without Internet access at home to use
a broadband connection. Visiting the library to use the Internet was reported by
74% of those without home Internet service.
• Most residents with Internet access have on average two email accounts (73%),
that 3 in 4 check every day.
• The most popular Internet activities are checking e-mail, researching retail prices
and purchasing goods. Respondents in the five counties are more likely to make
purchases online than a national sample of Internet users and to sell goods online.
The residential Internet users surveyed are also more likely to take a class online
or seek other educational opportunities. They are less likely to use online video
or use the Internet to find federal and state social services and government
assistance.
ECONOMIC INDICATORS AMONG RURAL WASHINGTON RESPONDENTS:
• Sixteen percent (16%) of residents with Internet access indicated that they have
used that connection to operate a business from their home and, of those, 70%
described the Internet as �very important� to the success of their home-based
business.
• Sixty percent (60%) of respondents had used the Internet to access information
about local businesses and 57% of those said that they had purchased goods
online from a local or Washington business.
CBG Communications, Inc.
41
DIGITAL DIVIDE ANALYSIS
To better understand the broadband availability and adoption gap between urban/suburban and
rural, an advanced analysis of the data obtained was conducted on three key variables: not
owning a personal computer, not having Internet access at home and not having broadband
(high-speed Internet access) at home. Researchers have found that adoption of broadband in
rural areas is a paradox in that even when access is available, adoption has lagged behind other
urban areas. In fact, rural residents are more likely to say high-speed Internet access isn�t
available when it is.17 As a result of this paradox, the broadband gap concerning the five
counties studied is rooted in two fundamental digital divide issues: availability of broadband and
demographics of a rural population.
NOT OWNING A PC
Twenty percent (20%) of residents in the five counties studied did not own a personal computer.
That finding was tested against the other variables measured in the residential study and several
significant relationships were found across all of the counties. Those without personal
computers were more likely to be older, live alone and more likely to be retired. This finding is
consistent with national studies on rural broadband, such as the Pew Internet and American Life
Project�s study of rural broadband that found:
�Older individuals are more likely to live in rural areas, therefore they account for a larger portion of the population. In rural areas the population of older individuals is around 22% while in suburban and urban areas the population is about 16% and 14% respectively.� (p. ii)18
Those without computers were significantly less likely to have persons under the age of 18 living
in the home, significantly less likely to have a college degree, significantly more likely to be
disabled and significantly less likely to be white.
17 Robert LaRose, Jennifer L. Gregg, Sharon Strover and Serena Carpenter (2007). Closing the rural broadband gap: Promoting adoption of the Internet in rural America. Telecommunications Policy 31, pp. 359-373. 18 www.pewInternet.org, Report on Rural Broadband. Retrieved April 19, 2008.
CBG Communications, Inc.
42
By race, a reported lack of a computer in the household was significantly more likely to be found
in an American Indian home. Households that earn less than $35,000 a year are more likely not
to own a personal computer.
NO INTERNET ACCESS AT HOME
When considering the presence of Internet access at home, all of the counties reported a
comparable level of Internet access; 72% of county residents. Those without Internet access
were significantly more likely to be older. This finding is consistent with other studies that have
found age and income to be the key discriminating demographic variables related to the adoption
of Internet access at home. In general, senior citizens are less likely to use the Internet. Only
17% of rural seniors go online, making up about 6% of all rural users. 19
Respondents without Internet access were also significantly less likely to have children under the
age of 18 in the home and more likely to live alone. By education, the respondent without
Internet access at home was significantly less likely to have a college degree. The Pew study
found that individuals accessing the Internet in rural areas are more likely to have a college
degree. Individuals with a college education access the Internet in a similar manner as other
college graduates in suburban areas (p. 18-19).
The disabled were significantly less likely to have Internet access at home.
Those without Internet access at home are significantly more likely to use the Internet at the
public library or at a relative or friend�s house. This is consistent with other researchers who
find that a portion of rural Internet users depend on Internet connections at places other than
work or home. Rural users are more likely than urban and suburban users to go online from a
third location � some place other than home or work. The main reason for this is because such
people are more likely to lack an Internet connection and therefore need to access the Internet in
another location.
19 Robert LaRose, Jennifer L. Gregg, Sharon Strover and Serena Carpenter (2007). Closing the rural broadband gap: Promoting adoption of the Internet in rural America. Telecommunications Policy 31, pp. 359-373.
CBG Communications, Inc.
43
Not surprising, those without Internet access are significantly less likely to identify English as
the primary language spoken in the home. The Internet is still largely an English speaking-based
phenomenon and while the language issue is being debated, it is quite possible that those without
Internet access might not find much value in an Internet that does not cater to their native tongue.
Additionally, even though minority use of the Internet is increasing in urban and suburban areas,
the same cannot be said about rural areas.
The residents without Internet access in the five counties were also significant less likely to value
Internet access. This speaks to the other digital divide issue, one of a lack of awareness of the
benefits of Internet and broadband or, once broadband benefits are known, they don�t quickly
translate to improving their quality of life. The Pew rural broadband study also found that rural
individuals with fewer than three years of Internet experience have more �mixed feelings� about
the Internet and computers (p. 29). Researchers are promoting education about the personal
benefits of broadband as a means to educate current non-users to its potential.
The Pew study also found that many rural residents earn less than $30,000 per year. The
threshold for Internet use is at this point, which means individuals earning under this amount are
less likely to have Internet access than those with an income above $30,000. This accounts for
the fact that more people with lower incomes are less likely to have an Internet connection. (p.
20)
TYPE OF INTERNET CONNECTION
The type of Internet connection subscribed to varied significantly by county and this was directly
related to availability of services. Ferry and Stevens County were significantly more likely to
have dial-up Internet access users. Grays Harbor was significantly less likely to have dial-up
users with the majority of those with Internet access subscribing to cable modem services
provided by Comcast or Coast.
When considering broadband adoption by demographics, the cable modem users in the five
counties were significantly likely to be younger. Households with more than two persons were
CBG Communications, Inc.
44
more likely to have higher speed connectivity, whereas households without children were more
likely to have Dial-up access.
Respondents with higher levels of education are significantly more likely to use higher speed
connectivity and Dial-up users are more likely to use the Internet at the public library.
High-speed connections were more likely to be found in households where the Internet was used
at work and where the household income was greater than $50,000.
Dial-up, satellite Internet and DSL users were more likely to report that high-speed Internet
access is important for all Washington residents.
Households with higher speed connections were significantly more likely to say wireless Internet
services were important.
Households with higher speeds were significantly more likely to: visit government websites,
shop online, perform language translation, watch videos, search for school information, bank
online, share photos, get local news, take a class online, research online, play video games, find
medical information and keep in touch with family and friends. These are similar findings to the
Pew Internet and American Life study that found individuals in rural areas are less likely to bank
online, purchase products, or make travel reservations. Contrary to expectations, we found that
rural respondents in the five counties are more likely than the national average to purchase goods
online. It could be that the increased availability of common household goods online is
increasing online purchasing activity in rural areas.
Higher speed-connected residents are more likely to operate a home based business and report
telecommuting. This finding was also consistent with the Pew study.
Our analysis of computer ownership, Internet access and broadband adoption suggests a two
pronged effort to close the gap:
CBG Communications, Inc.
45
1. create more broadband resources in the area and then
2. address the demographic issues that result in non-adoption.
Researchers suggest that efforts to promote the personal benefits of broadband and advanced
Internet communication technology (ICT) literacy skills among potential Internet users in rural
areas is a sound place to start and to ultimately see results.

CBG Communications, Inc.
46
Section C Review of Business and Non-Profit Communities of Interest
CBG Communications, Inc.
47
REVIEW OF BUSINESS AND NON-PROFIT COMMUNITIES
OF INTEREST
Introduction
As part of a statewide initiative to address broadband availability and adoption, a business survey
was performed as part of the Broadband Study of five of the State�s rural counties. Studied
counties included Columbia, Ferry, Grays Harbor, Lewis and Stevens. Working in conjunction
with stakeholders at the UTC and others involved in community and economic development
initiatives, a business survey instrument that explored broadband access for businesses, as well
as adoption and usage, was developed. The survey was administered by telephone to 400
randomly selected businesses across the five counties during May 2008.
A contracted telemarketing firm, Issues and Answers, Inc., headquartered in Virginia Beach, VA
conducted telephone interviews. Issues and Answers has over 40 years of combined experience
in social science research using telephone survey methodology. Calls were placed from four call
centers around the United States, during a variety of times of the business day. Issues and
Answers used trained interviewers who asked to speak with the person at the business best able
to discuss high-speed Internet access and broadband issues. Business telephone numbers were
selected using a random selection technique from area phone numbers within the studied
counties. In all, 400 business surveys were completed.20 When considering the margin of error
of the number reported, a sample size of 400 provides the overall project with a margin of error
of plus or minus 5%.21 This means that if the study were conducted again, using the same
random selection procedures, one can anticipate that you would find the same responses to the
questions within plus or minus five percentage points.
20 A complete listing of the businesses surveyed, along with their addresses, contact information and websites, are contained in an electronic file with CBG. 21 The margin of error for any given County will be higher.
CBG Communications, Inc.
48
RESPONDING BUSINESSES
The responding businesses were randomly sampled across the five counties. Fifty (50)
businesses completed the study in Columbia County, 50 businesses in Ferry, 100 businesses in
Grays Harbor, 100 businesses in Lewis and 100 businesses in Stevens.
When asked how many employees were present in the business, responses ranged from 1 to 400
with the average being 8 employees and the most common response, one employee (N=98/25%).
The business person completing the survey was most likely to be owner of the company
(N=156). Other respondents were general managers (N=23), office managers (N=20) or
secretaries (N=16).
By gender, the respondent was most likely to be female (57%) versus male (43%).
Nineteen percent (19%) of the businesses operated a website and 9% indicated that they had
satellite offices or were a satellite office themselves.
Each of the businesses provided a name and a description of what their businesses did. The
complete information set is available electronically in a spreadsheet maintained by CBG. In this
section of the report, types of responding businesses have been collapsed into categories. The
following chart illustrates the type of responding businesses by sector represented. When
considering the group as a whole, all sectors of industry were represented in the study with retail
trade the most common, representing 18% of the sample. This was followed by forestry,
agriculture and fishing at 9% of the responding sample. These two primary categories are
reflective of economic data from the studied counties. Additionally, a good representation was
found of businesses from the real estate and construction sectors, as well as the non-profit and
medical communities.
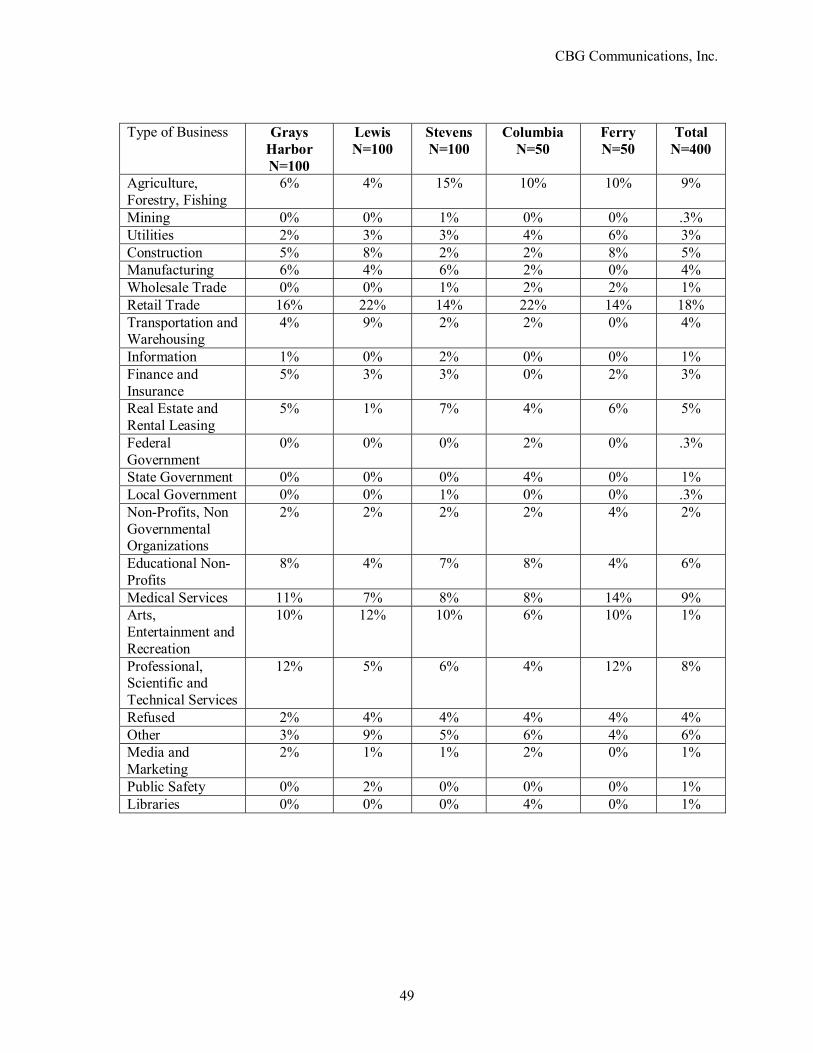
CBG Communications, Inc.
49
Type of Business Grays Harbor N=100
Lewis N=100
Stevens N=100
Columbia N=50
Ferry N=50
Total N=400
Agriculture, Forestry, Fishing
6% 4% 15% 10% 10% 9%
Mining 0% 0% 1% 0% 0% .3% Utilities 2% 3% 3% 4% 6% 3% Construction 5% 8% 2% 2% 8% 5% Manufacturing 6% 4% 6% 2% 0% 4% Wholesale Trade 0% 0% 1% 2% 2% 1% Retail Trade 16% 22% 14% 22% 14% 18% Transportation and Warehousing
4% 9% 2% 2% 0% 4%
Information 1% 0% 2% 0% 0% 1% Finance and Insurance
5% 3% 3% 0% 2% 3%
Real Estate and Rental Leasing
5% 1% 7% 4% 6% 5%
Federal Government
0% 0% 0% 2% 0% .3%
State Government 0% 0% 0% 4% 0% 1% Local Government 0% 0% 1% 0% 0% .3% Non-Profits, Non Governmental Organizations
2% 2% 2% 2% 4% 2%
Educational Non-Profits
8% 4% 7% 8% 4% 6%
Medical Services 11% 7% 8% 8% 14% 9% Arts, Entertainment and Recreation
10% 12% 10% 6% 10% 1%
Professional, Scientific and Technical Services
12% 5% 6% 4% 12% 8%
Refused 2% 4% 4% 4% 4% 4% Other 3% 9% 5% 6% 4% 6% Media and Marketing
2% 1% 1% 2% 0% 1%
Public Safety 0% 2% 0% 0% 0% 1% Libraries 0% 0% 0% 4% 0% 1%
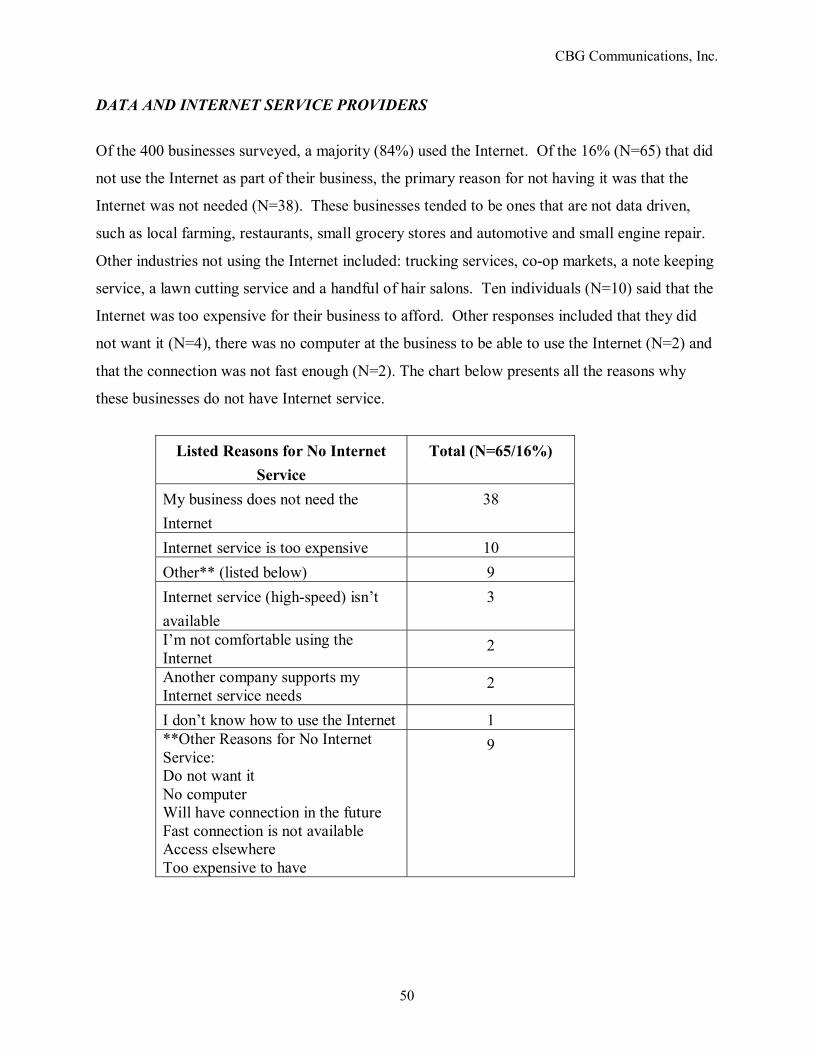
CBG Communications, Inc.
50
DATA AND INTERNET SERVICE PROVIDERS
Of the 400 businesses surveyed, a majority (84%) used the Internet. Of the 16% (N=65) that did
not use the Internet as part of their business, the primary reason for not having it was that the
Internet was not needed (N=38). These businesses tended to be ones that are not data driven,
such as local farming, restaurants, small grocery stores and automotive and small engine repair.
Other industries not using the Internet included: trucking services, co-op markets, a note keeping
service, a lawn cutting service and a handful of hair salons. Ten individuals (N=10) said that the
Internet was too expensive for their business to afford. Other responses included that they did
not want it (N=4), there was no computer at the business to be able to use the Internet (N=2) and
that the connection was not fast enough (N=2). The chart below presents all the reasons why
these businesses do not have Internet service.
Listed Reasons for No Internet
Service Total (N=65/16%)
My business does not need the Internet
38
Internet service is too expensive 10 Other** (listed below) 9 Internet service (high-speed) isn�t available
3
I�m not comfortable using the Internet
2
Another company supports my Internet service needs
2
I don�t know how to use the Internet 1 **Other Reasons for No Internet Service: Do not want it No computer Will have connection in the future Fast connection is not available Access elsewhere Too expensive to have
9
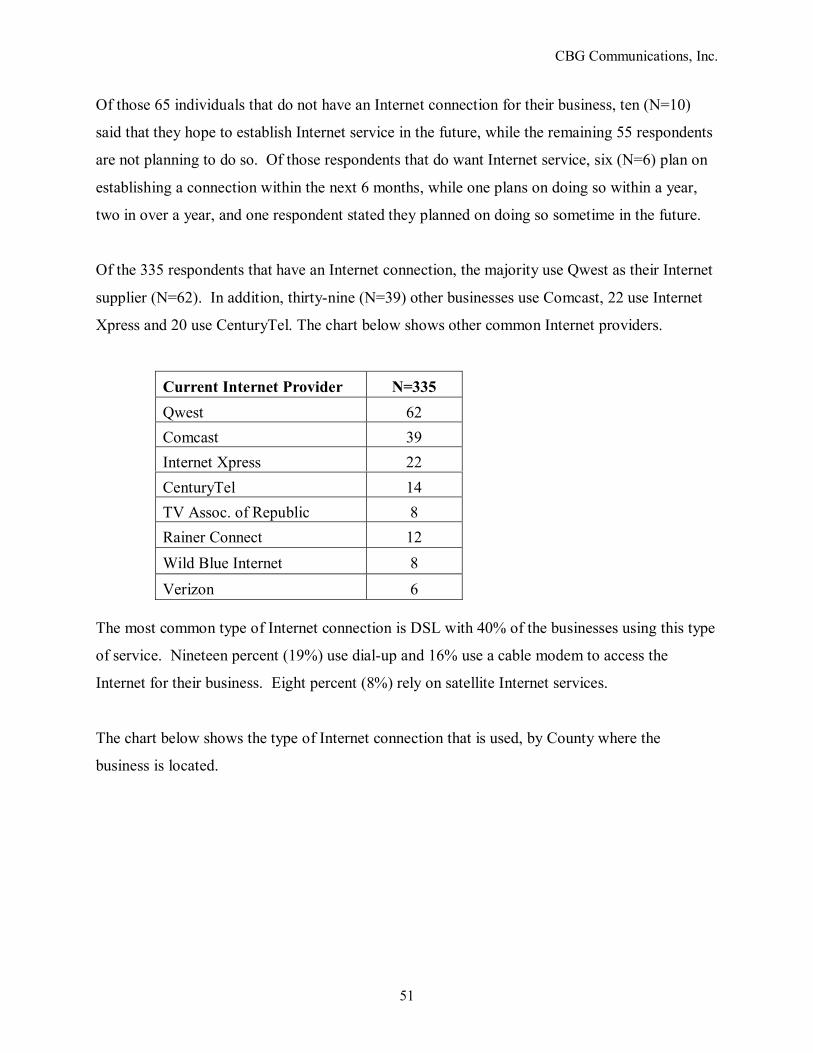
CBG Communications, Inc.
51
Of those 65 individuals that do not have an Internet connection for their business, ten (N=10)
said that they hope to establish Internet service in the future, while the remaining 55 respondents
are not planning to do so. Of those respondents that do want Internet service, six (N=6) plan on
establishing a connection within the next 6 months, while one plans on doing so within a year,
two in over a year, and one respondent stated they planned on doing so sometime in the future.
Of the 335 respondents that have an Internet connection, the majority use Qwest as their Internet
supplier (N=62). In addition, thirty-nine (N=39) other businesses use Comcast, 22 use Internet
Xpress and 20 use CenturyTel. The chart below shows other common Internet providers.
The most common type of Internet connection is DSL with 40% of the businesses using this type
of service. Nineteen percent (19%) use dial-up and 16% use a cable modem to access the
Internet for their business. Eight percent (8%) rely on satellite Internet services.
The chart below shows the type of Internet connection that is used, by County where the
business is located.
Current Internet Provider N=335 Qwest 62 Comcast 39 Internet Xpress 22 CenturyTel 14 TV Assoc. of Republic 8 Rainer Connect 12 Wild Blue Internet 8 Verizon 6
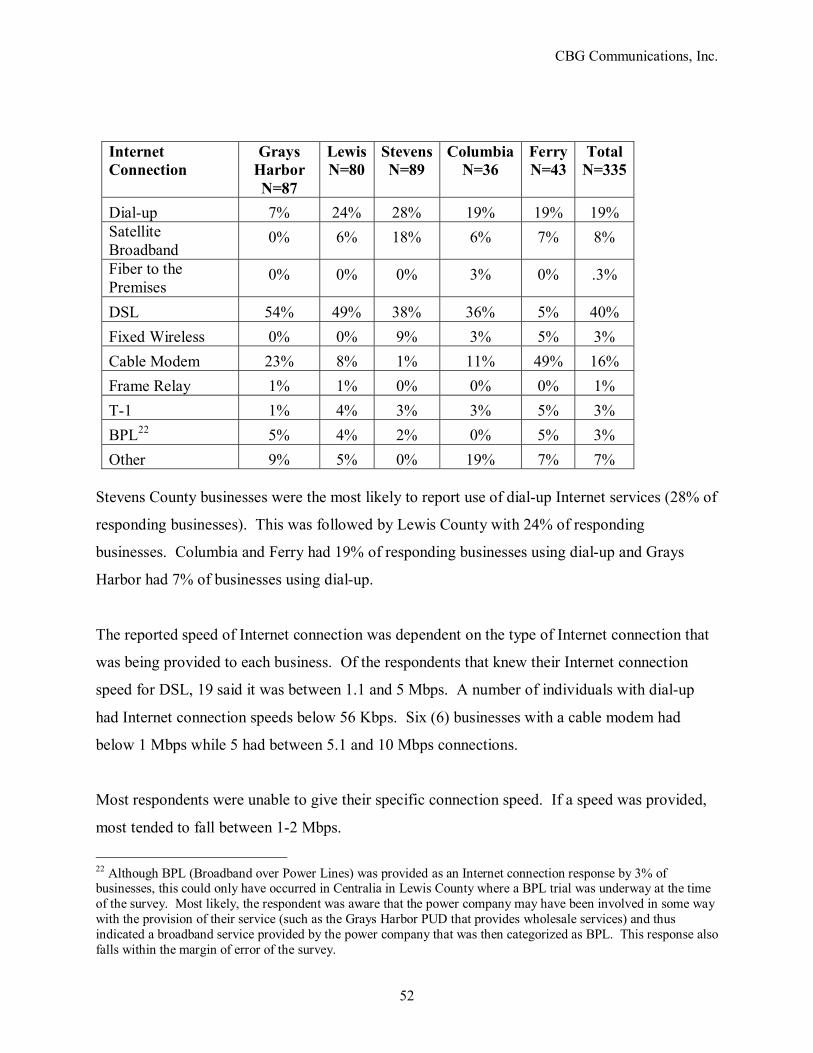
CBG Communications, Inc.
52
Internet Connection
Grays Harbor N=87
LewisN=80
StevensN=89
ColumbiaN=36
FerryN=43
Total N=335
Dial-up 7% 24% 28% 19% 19% 19% Satellite Broadband
0% 6% 18% 6% 7% 8%
Fiber to the Premises
0% 0% 0% 3% 0% .3%
DSL 54% 49% 38% 36% 5% 40% Fixed Wireless 0% 0% 9% 3% 5% 3% Cable Modem 23% 8% 1% 11% 49% 16% Frame Relay 1% 1% 0% 0% 0% 1% T-1 1% 4% 3% 3% 5% 3% BPL22 5% 4% 2% 0% 5% 3% Other 9% 5% 0% 19% 7% 7%
Stevens County businesses were the most likely to report use of dial-up Internet services (28% of
responding businesses). This was followed by Lewis County with 24% of responding
businesses. Columbia and Ferry had 19% of responding businesses using dial-up and Grays
Harbor had 7% of businesses using dial-up.
The reported speed of Internet connection was dependent on the type of Internet connection that
was being provided to each business. Of the respondents that knew their Internet connection
speed for DSL, 19 said it was between 1.1 and 5 Mbps. A number of individuals with dial-up
had Internet connection speeds below 56 Kbps. Six (6) businesses with a cable modem had
below 1 Mbps while 5 had between 5.1 and 10 Mbps connections.
Most respondents were unable to give their specific connection speed. If a speed was provided,
most tended to fall between 1-2 Mbps.
22 Although BPL (Broadband over Power Lines) was provided as an Internet connection response by 3% of businesses, this could only have occurred in Centralia in Lewis County where a BPL trial was underway at the time of the survey. Most likely, the respondent was aware that the power company may have been involved in some way with the provision of their service (such as the Grays Harbor PUD that provides wholesale services) and thus indicated a broadband service provided by the power company that was then categorized as BPL. This response also falls within the margin of error of the survey.
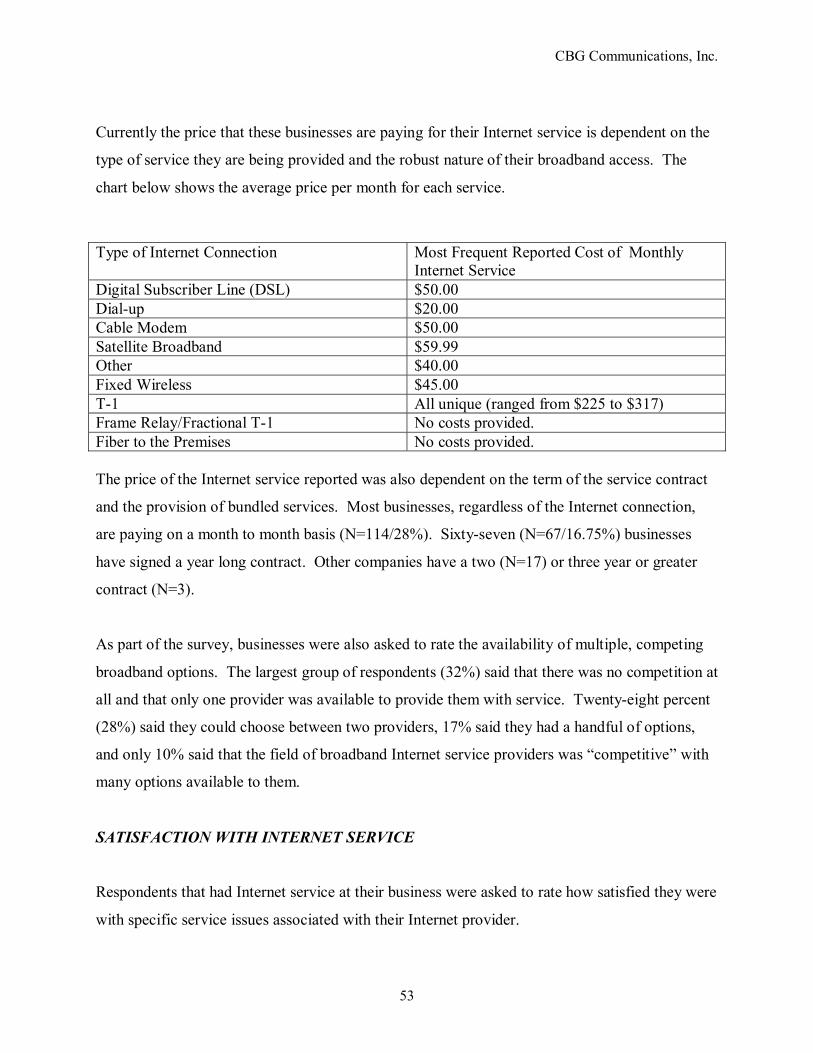
CBG Communications, Inc.
53
Currently the price that these businesses are paying for their Internet service is dependent on the
type of service they are being provided and the robust nature of their broadband access. The
chart below shows the average price per month for each service.
Type of Internet Connection Most Frequent Reported Cost of Monthly
Internet Service Digital Subscriber Line (DSL) $50.00 Dial-up $20.00 Cable Modem $50.00 Satellite Broadband $59.99 Other $40.00 Fixed Wireless $45.00 T-1 All unique (ranged from $225 to $317) Frame Relay/Fractional T-1 No costs provided. Fiber to the Premises No costs provided. The price of the Internet service reported was also dependent on the term of the service contract
and the provision of bundled services. Most businesses, regardless of the Internet connection,
are paying on a month to month basis (N=114/28%). Sixty-seven (N=67/16.75%) businesses
have signed a year long contract. Other companies have a two (N=17) or three year or greater
contract (N=3).
As part of the survey, businesses were also asked to rate the availability of multiple, competing
broadband options. The largest group of respondents (32%) said that there was no competition at
all and that only one provider was available to provide them with service. Twenty-eight percent
(28%) said they could choose between two providers, 17% said they had a handful of options,
and only 10% said that the field of broadband Internet service providers was �competitive� with
many options available to them.
SATISFACTION WITH INTERNET SERVICE
Respondents that had Internet service at their business were asked to rate how satisfied they were
with specific service issues associated with their Internet provider.
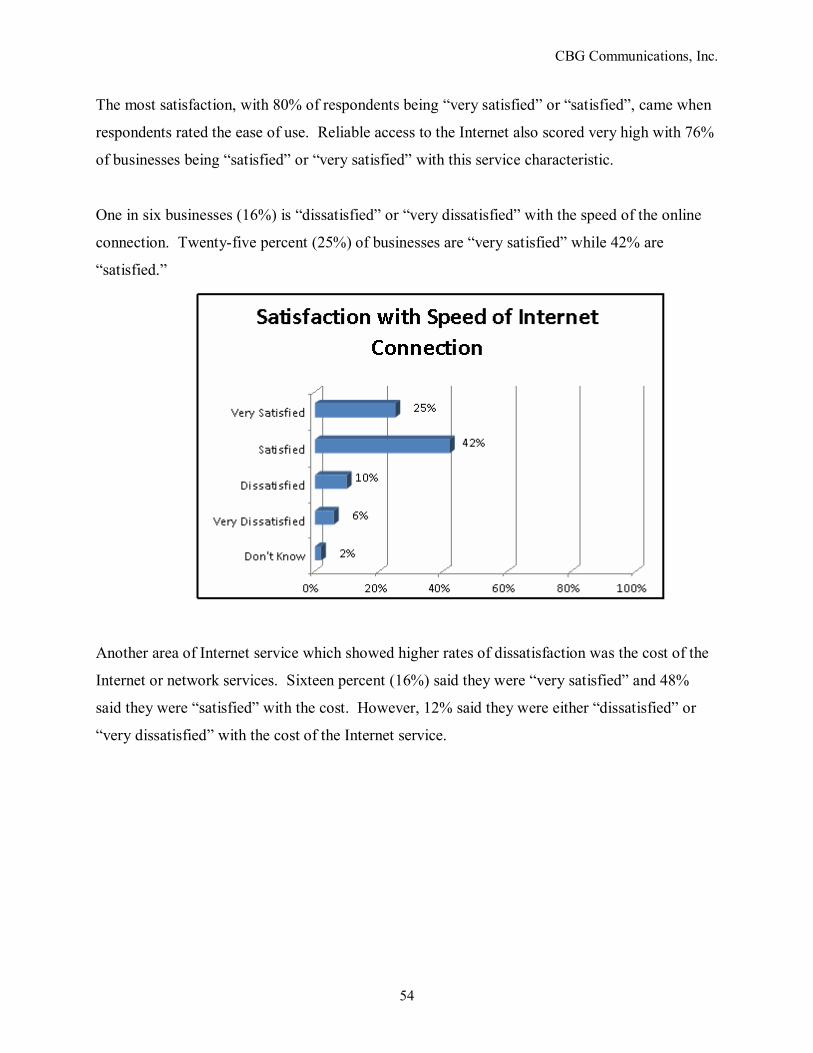
CBG Communications, Inc.
54
The most satisfaction, with 80% of respondents being �very satisfied� or �satisfied�, came when
respondents rated the ease of use. Reliable access to the Internet also scored very high with 76%
of businesses being �satisfied� or �very satisfied� with this service characteristic.
One in six businesses (16%) is �dissatisfied� or �very dissatisfied� with the speed of the online
connection. Twenty-five percent (25%) of businesses are �very satisfied� while 42% are
�satisfied.�
Another area of Internet service which showed higher rates of dissatisfaction was the cost of the
Internet or network services. Sixteen percent (16%) said they were �very satisfied� and 48%
said they were �satisfied� with the cost. However, 12% said they were either �dissatisfied� or
�very dissatisfied� with the cost of the Internet service.
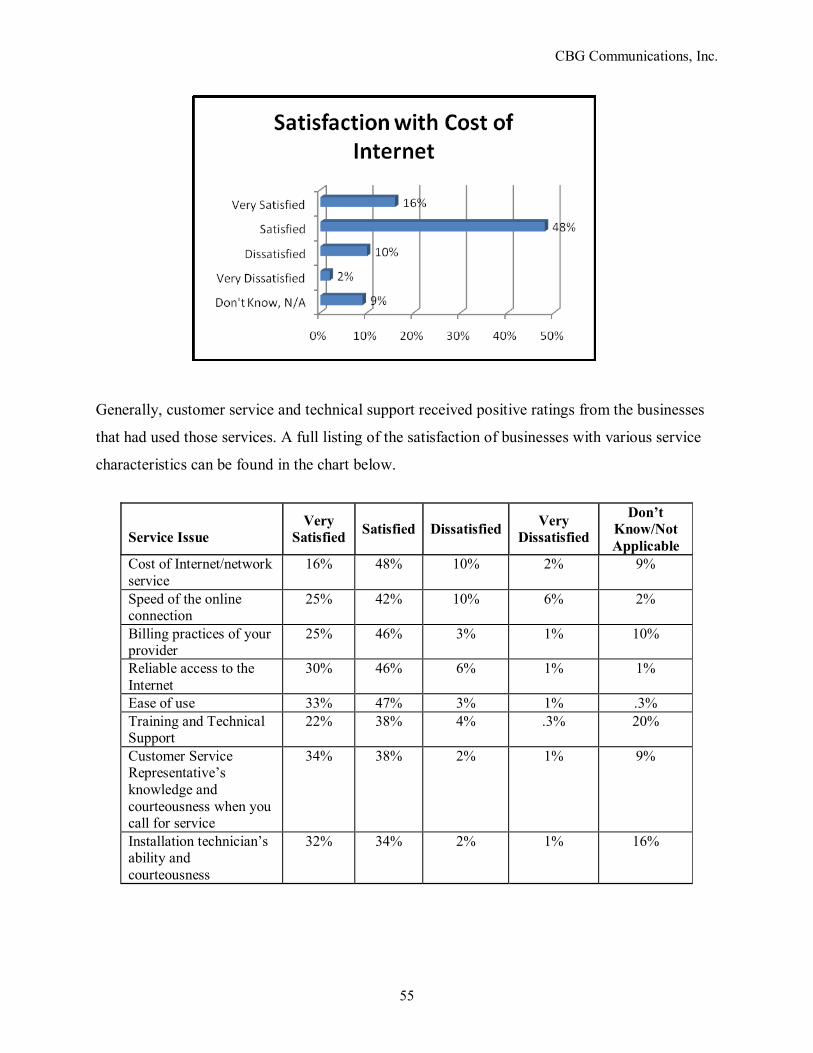
CBG Communications, Inc.
55
Generally, customer service and technical support received positive ratings from the businesses
that had used those services. A full listing of the satisfaction of businesses with various service
characteristics can be found in the chart below.
Service Issue
Very Satisfied Satisfied Dissatisfied Very
Dissatisfied
Don�t Know/Not Applicable
Cost of Internet/network service
16% 48% 10% 2% 9%
Speed of the online connection
25% 42% 10% 6% 2%
Billing practices of your provider
25% 46% 3% 1% 10%
Reliable access to the Internet
30% 46% 6% 1% 1%
Ease of use 33% 47% 3% 1% .3% Training and Technical Support
22% 38% 4% .3% 20%
Customer Service Representative�s knowledge and courteousness when you call for service
34% 38% 2% 1% 9%
Installation technician�s ability and courteousness
32% 34% 2% 1% 16%
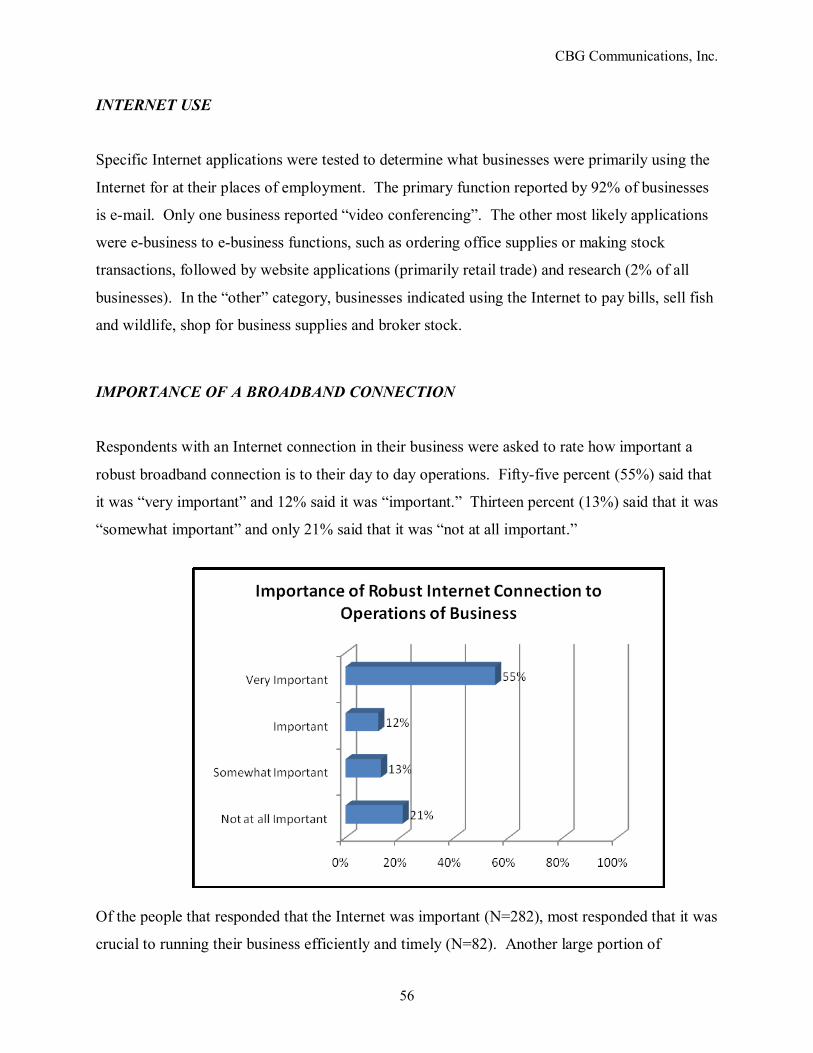
CBG Communications, Inc.
56
INTERNET USE
Specific Internet applications were tested to determine what businesses were primarily using the
Internet for at their places of employment. The primary function reported by 92% of businesses
is e-mail. Only one business reported �video conferencing�. The other most likely applications
were e-business to e-business functions, such as ordering office supplies or making stock
transactions, followed by website applications (primarily retail trade) and research (2% of all
businesses). In the �other� category, businesses indicated using the Internet to pay bills, sell fish
and wildlife, shop for business supplies and broker stock.
IMPORTANCE OF A BROADBAND CONNECTION
Respondents with an Internet connection in their business were asked to rate how important a
robust broadband connection is to their day to day operations. Fifty-five percent (55%) said that
it was �very important� and 12% said it was �important.� Thirteen percent (13%) said that it was
�somewhat important� and only 21% said that it was �not at all important.�
Of the people that responded that the Internet was important (N=282), most responded that it was
crucial to running their business efficiently and timely (N=82). Another large portion of
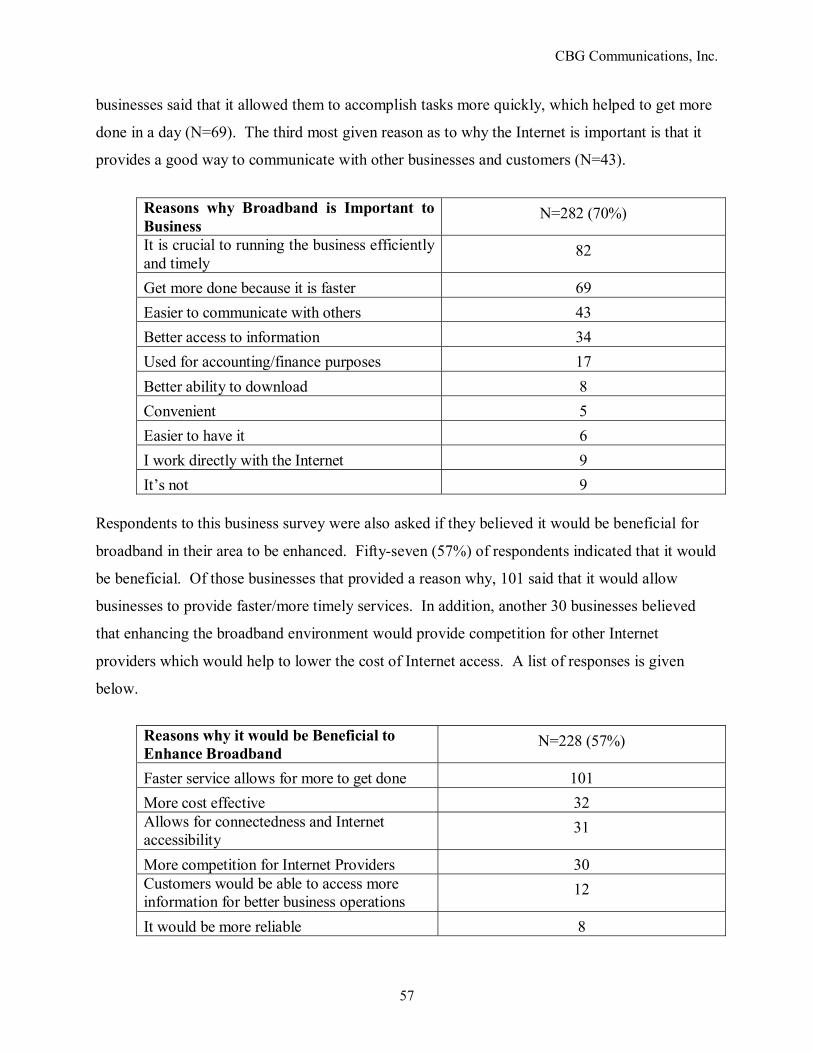
CBG Communications, Inc.
57
businesses said that it allowed them to accomplish tasks more quickly, which helped to get more
done in a day (N=69). The third most given reason as to why the Internet is important is that it
provides a good way to communicate with other businesses and customers (N=43).
Reasons why Broadband is Important to Business
N=282 (70%)
It is crucial to running the business efficiently and timely
82
Get more done because it is faster 69 Easier to communicate with others 43 Better access to information 34 Used for accounting/finance purposes 17 Better ability to download 8 Convenient 5 Easier to have it 6 I work directly with the Internet 9 It�s not 9
Respondents to this business survey were also asked if they believed it would be beneficial for
broadband in their area to be enhanced. Fifty-seven (57%) of respondents indicated that it would
be beneficial. Of those businesses that provided a reason why, 101 said that it would allow
businesses to provide faster/more timely services. In addition, another 30 businesses believed
that enhancing the broadband environment would provide competition for other Internet
providers which would help to lower the cost of Internet access. A list of responses is given
below.
Reasons why it would be Beneficial to Enhance Broadband
N=228 (57%)
Faster service allows for more to get done 101 More cost effective 32 Allows for connectedness and Internet accessibility
31
More competition for Internet Providers 30 Customers would be able to access more information for better business operations
12
It would be more reliable 8
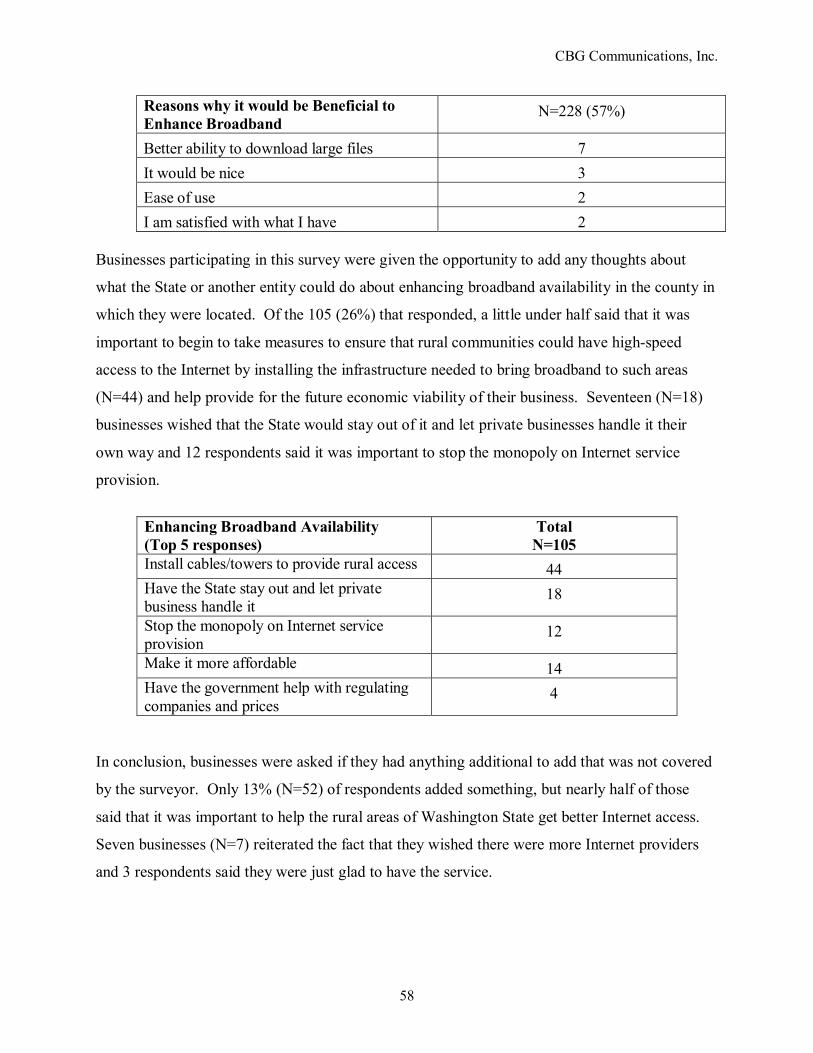
CBG Communications, Inc.
58
Reasons why it would be Beneficial to Enhance Broadband
N=228 (57%)
Better ability to download large files 7 It would be nice 3 Ease of use 2 I am satisfied with what I have 2
Businesses participating in this survey were given the opportunity to add any thoughts about
what the State or another entity could do about enhancing broadband availability in the county in
which they were located. Of the 105 (26%) that responded, a little under half said that it was
important to begin to take measures to ensure that rural communities could have high-speed
access to the Internet by installing the infrastructure needed to bring broadband to such areas
(N=44) and help provide for the future economic viability of their business. Seventeen (N=18)
businesses wished that the State would stay out of it and let private businesses handle it their
own way and 12 respondents said it was important to stop the monopoly on Internet service
provision.
Enhancing Broadband Availability (Top 5 responses)
Total N=105
Install cables/towers to provide rural access 44 Have the State stay out and let private business handle it
18
Stop the monopoly on Internet service provision
12
Make it more affordable 14 Have the government help with regulating companies and prices
4
In conclusion, businesses were asked if they had anything additional to add that was not covered
by the surveyor. Only 13% (N=52) of respondents added something, but nearly half of those
said that it was important to help the rural areas of Washington State get better Internet access.
Seven businesses (N=7) reiterated the fact that they wished there were more Internet providers
and 3 respondents said they were just glad to have the service.
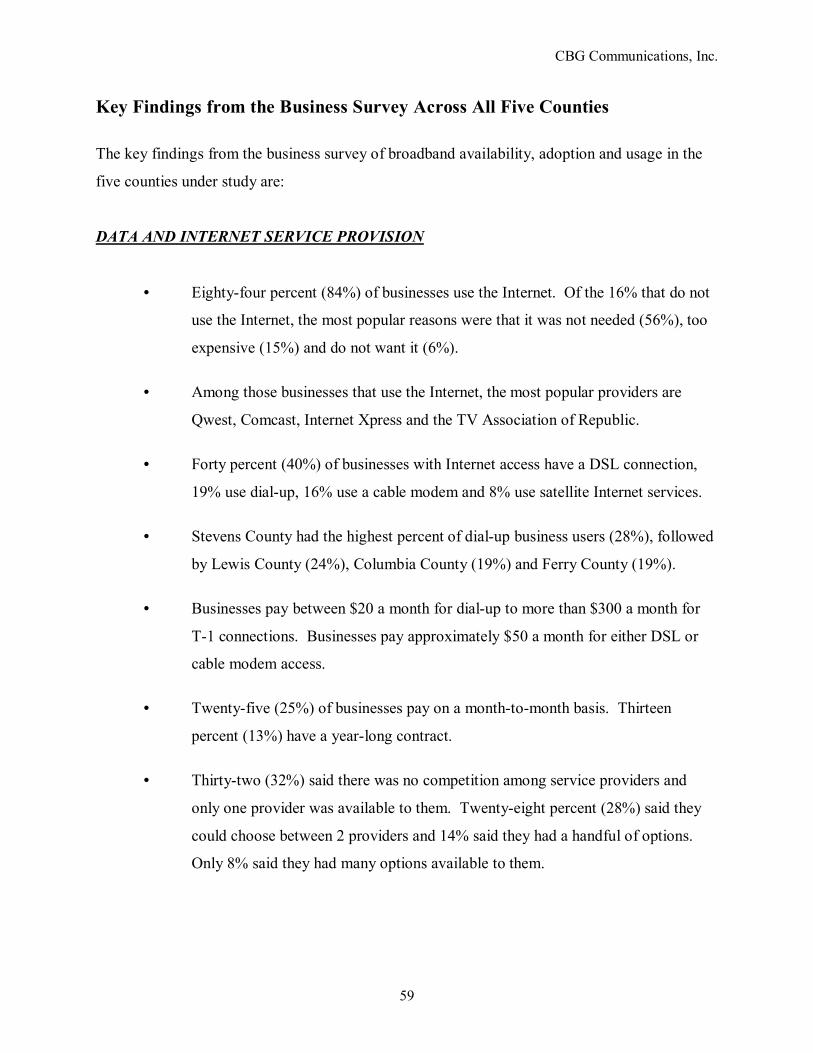
CBG Communications, Inc.
59
Key Findings from the Business Survey Across All Five Counties
The key findings from the business survey of broadband availability, adoption and usage in the
five counties under study are:
DATA AND INTERNET SERVICE PROVISION
• Eighty-four percent (84%) of businesses use the Internet. Of the 16% that do not
use the Internet, the most popular reasons were that it was not needed (56%), too
expensive (15%) and do not want it (6%).
• Among those businesses that use the Internet, the most popular providers are
Qwest, Comcast, Internet Xpress and the TV Association of Republic.
• Forty percent (40%) of businesses with Internet access have a DSL connection,
19% use dial-up, 16% use a cable modem and 8% use satellite Internet services.
• Stevens County had the highest percent of dial-up business users (28%), followed
by Lewis County (24%), Columbia County (19%) and Ferry County (19%).
• Businesses pay between $20 a month for dial-up to more than $300 a month for
T-1 connections. Businesses pay approximately $50 a month for either DSL or
cable modem access.
• Twenty-five (25%) of businesses pay on a month-to-month basis. Thirteen
percent (13%) have a year-long contract.
• Thirty-two (32%) said there was no competition among service providers and
only one provider was available to them. Twenty-eight percent (28%) said they
could choose between 2 providers and 14% said they had a handful of options.
Only 8% said they had many options available to them.
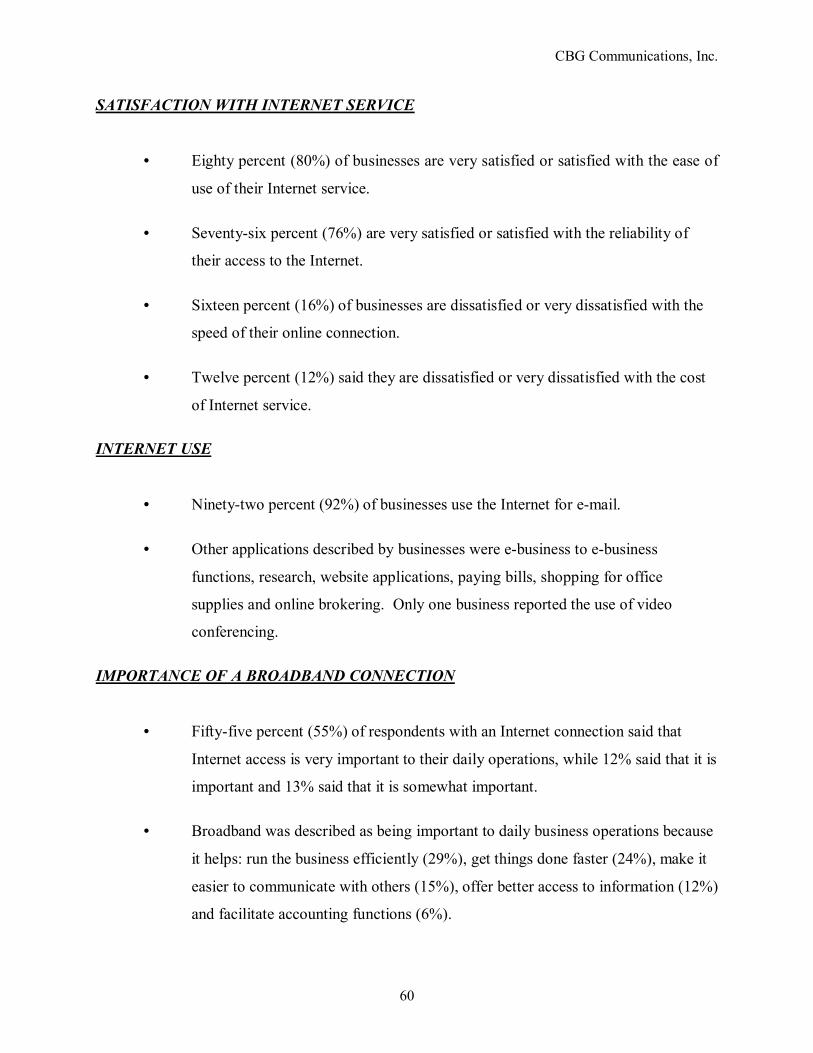
CBG Communications, Inc.
60
SATISFACTION WITH INTERNET SERVICE
• Eighty percent (80%) of businesses are very satisfied or satisfied with the ease of
use of their Internet service.
• Seventy-six percent (76%) are very satisfied or satisfied with the reliability of
their access to the Internet.
• Sixteen percent (16%) of businesses are dissatisfied or very dissatisfied with the
speed of their online connection.
• Twelve percent (12%) said they are dissatisfied or very dissatisfied with the cost
of Internet service.
INTERNET USE
• Ninety-two percent (92%) of businesses use the Internet for e-mail.
• Other applications described by businesses were e-business to e-business
functions, research, website applications, paying bills, shopping for office
supplies and online brokering. Only one business reported the use of video
conferencing.
IMPORTANCE OF A BROADBAND CONNECTION
• Fifty-five percent (55%) of respondents with an Internet connection said that
Internet access is very important to their daily operations, while 12% said that it is
important and 13% said that it is somewhat important.
• Broadband was described as being important to daily business operations because
it helps: run the business efficiently (29%), get things done faster (24%), make it
easier to communicate with others (15%), offer better access to information (12%)
and facilitate accounting functions (6%).
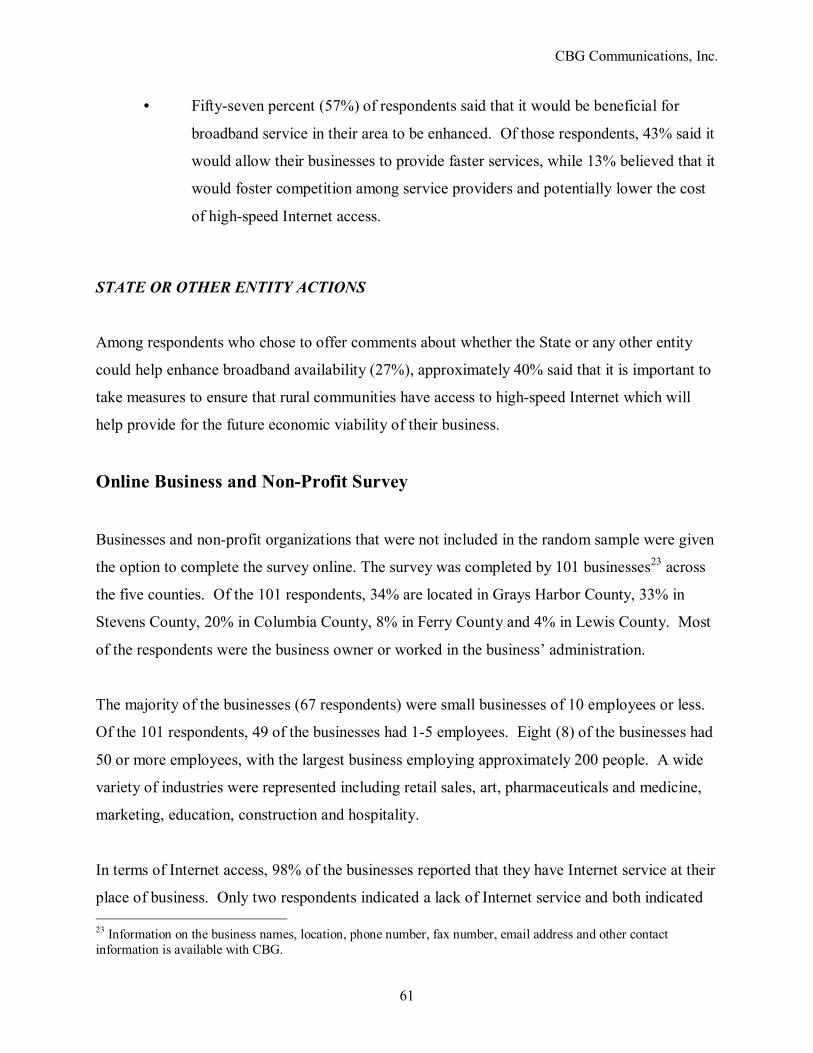
CBG Communications, Inc.
61
• Fifty-seven percent (57%) of respondents said that it would be beneficial for
broadband service in their area to be enhanced. Of those respondents, 43% said it
would allow their businesses to provide faster services, while 13% believed that it
would foster competition among service providers and potentially lower the cost
of high-speed Internet access.
STATE OR OTHER ENTITY ACTIONS
Among respondents who chose to offer comments about whether the State or any other entity
could help enhance broadband availability (27%), approximately 40% said that it is important to
take measures to ensure that rural communities have access to high-speed Internet which will
help provide for the future economic viability of their business.
Online Business and Non-Profit Survey
Businesses and non-profit organizations that were not included in the random sample were given
the option to complete the survey online. The survey was completed by 101 businesses23 across
the five counties. Of the 101 respondents, 34% are located in Grays Harbor County, 33% in
Stevens County, 20% in Columbia County, 8% in Ferry County and 4% in Lewis County. Most
of the respondents were the business owner or worked in the business� administration.
The majority of the businesses (67 respondents) were small businesses of 10 employees or less.
Of the 101 respondents, 49 of the businesses had 1-5 employees. Eight (8) of the businesses had
50 or more employees, with the largest business employing approximately 200 people. A wide
variety of industries were represented including retail sales, art, pharmaceuticals and medicine,
marketing, education, construction and hospitality.
In terms of Internet access, 98% of the businesses reported that they have Internet service at their
place of business. Only two respondents indicated a lack of Internet service and both indicated 23 Information on the business names, location, phone number, fax number, email address and other contact information is available with CBG.
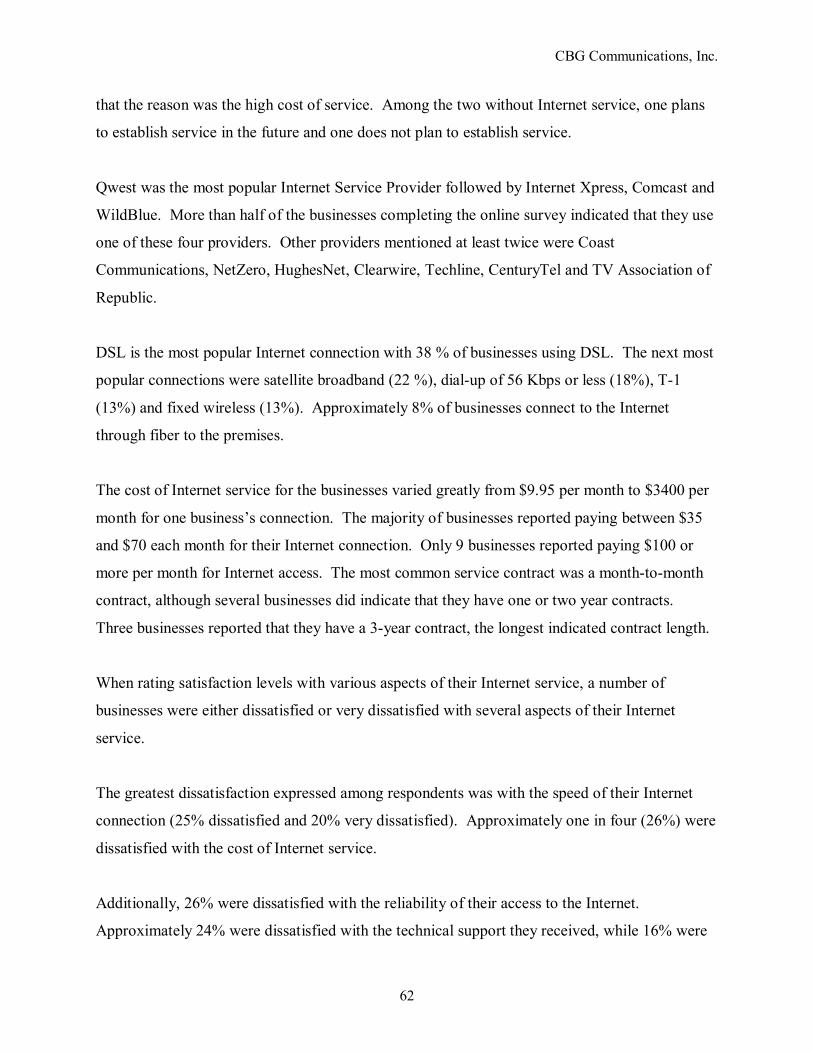
CBG Communications, Inc.
62
that the reason was the high cost of service. Among the two without Internet service, one plans
to establish service in the future and one does not plan to establish service.
Qwest was the most popular Internet Service Provider followed by Internet Xpress, Comcast and
WildBlue. More than half of the businesses completing the online survey indicated that they use
one of these four providers. Other providers mentioned at least twice were Coast
Communications, NetZero, HughesNet, Clearwire, Techline, CenturyTel and TV Association of
Republic.
DSL is the most popular Internet connection with 38 % of businesses using DSL. The next most
popular connections were satellite broadband (22 %), dial-up of 56 Kbps or less (18%), T-1
(13%) and fixed wireless (13%). Approximately 8% of businesses connect to the Internet
through fiber to the premises.
The cost of Internet service for the businesses varied greatly from $9.95 per month to $3400 per
month for one business�s connection. The majority of businesses reported paying between $35
and $70 each month for their Internet connection. Only 9 businesses reported paying $100 or
more per month for Internet access. The most common service contract was a month-to-month
contract, although several businesses did indicate that they have one or two year contracts.
Three businesses reported that they have a 3-year contract, the longest indicated contract length.
When rating satisfaction levels with various aspects of their Internet service, a number of
businesses were either dissatisfied or very dissatisfied with several aspects of their Internet
service.
The greatest dissatisfaction expressed among respondents was with the speed of their Internet
connection (25% dissatisfied and 20% very dissatisfied). Approximately one in four (26%) were
dissatisfied with the cost of Internet service.
Additionally, 26% were dissatisfied with the reliability of their access to the Internet.
Approximately 24% were dissatisfied with the technical support they received, while 16% were
CBG Communications, Inc.
63
dissatisfied with their provider�s customer service representatives� knowledge and courteousness
when they called for service. Approximately 58 % of businesses were satisfied with the ease of
use of their Internet service.
All of the respondents (100%) indicated that they had used e-mail within the last 30 days. Other
common applications that the businesses indicated using were banking (68%), website
applications (63%), research (57%), file-sharing (53%), business to business functions (53%), e-
business (43%) and online education (33%). A small percentage of businesses indicated using
their Internet connection for video conferencing (15%), Internet telephone (11%) and system
monitoring functions (10%).
Of the respondents with an Internet connection, 85% said that high-speed Internet access was
very important to the day-to-day operations of their business. The remaining 15% of responding
businesses indicated that a high-speed connection was important or somewhat important to their
day-to-day business operations. None of the respondents with an Internet connection indicated
that it was not at all important to their business operations.
The businesses indicated that a high-speed Internet connection was very important because they
use the Internet to communicate with customers, advertise, make shipping arrangements, bank
online, pay bills, order supplies, make travel reservations, conduct employee education and
training, conduct research, send files, maintain websites and sell merchandise.
A majority of the businesses (52%) indicated that when they sought broadband service at their
location they found the selection of providers not competitive at all with only one provider
option. Nearly 24% of businesses found the selection of providers to be only slightly
competitive with only two provider options. Only 13% of businesses felt that the market for
service providers was somewhat competitive or competitive, with a handful of options or many
options. Nearly 12% of businesses said that they found no broadband option available to suit the
needs of their business.
CBG Communications, Inc.
64
A large majority of the businesses (92%) felt that it would beneficial to their business if the
broadband environment in their area was enhanced. Only 8% felt that broadband enhancement
would not be beneficial to them.
Finally, the businesses were asked for any thoughts or comments about how the State or another
entity could help enhance broadband availability in their county and about the general state of
broadband service and availability for businesses. Some of the ideas for how the State could
help included providing tax incentives to the private sector willing to invest in infrastructure,
public funding for the installation of networks, grants for rural improvements and support for
wireless services provided by PUDs.
The general comments on broadband availability overwhelmingly indicated a desire for more
high-speed Internet options and greater access to new technologies and higher connection
speeds. Many of the respondents reiterated how essential the Internet is to their business
functions and indicated a desire for higher-speed connections. One business owner indicated that
there was no broadband access in his area and that the dial-up connection is so slow that it is
practically useless.
Another business manager, who lives only 3 miles from the center of town, waited nearly 4 years
for high-speed Internet service to be available in his area. Another business owner said he was
on a satellite service�s waiting list for over a year, and while waiting, had to use a dial-up
connection with a speed of only 14 Kbps.
Other businesses owners said people should be educated about the many uses of high-speed
Internet access. As people learn how it can benefit their business, interest in the service will
increase - possibly leading to more cooperation from the Internet Service Providers in terms of
investing in the infrastructure to make broadband available.
Other business owners indicated that high-speed Internet is necessary both for economic growth
and for the people in the rural areas of Washington to be a part of the information age along with
the rest of the country and the world.
CBG Communications, Inc.
65
ANALYSIS OF BROADBAND�S ECONOMIC IMPACT
Recent reports have found that broadband access does have an impact on the economy based on
several different measures of economic progress. One objective of this Study was to test these
results in a Washington context to the extent feasible.
One study, by Criterion Economics (2005) found that broadband, through changes to shopping,
commuting, home entertainment and health habits had the potential to contribute an extra $500
billion to the GDP by 2006.
The New Millennium Research Council estimated that more than 1 million jobs could be created
from the construction and use of a nationwide broadband network. Other studies have found that
a failure by the United States to improve the country�s broadband availability and adoption could
lead to a reduction in U.S. productivity growth.
Working off of the determinations made by these previous reports, researchers from MIT and
Carnegie Mellon studied broadband�s economic impact in terms of several economic factors.
The researchers found that broadband does enhance economic activity. However, the increase in
broadband availability can have both positive and negative economic impacts.
While broadband can stimulate overall economic activity, resulting in job growth, by increasing
worker productivity, it can also result in slower job growth because as the businesses become
more productive and efficient they might require less workers. However, the researchers found
that broadband did lead to economic development, but not always in terms of an increase in
wages. The researchers even pointed out that home access to broadband might make workers
more productive at their place of employment because they will spend less time fulfilling non-
work obligations such as paying bills, shopping, doctors� appointments, etc.
The areas in which broadband does have a relationship to positive economic growth are property
values and industry structure and mix. Between 1998 and 2002, communities in which
CBG Communications, Inc.
66
broadband was available by December 1999 experienced more growth in employment, number
of businesses overall and number of businesses in the IT sector. IT intensive industries are more
likely to demand and use broadband services. These businesses, which require broadband
access, expand operations in locations with broadband access. Areas with broadband availability
in December 1999 also saw higher market rates for rental housing.24
In terms of public policy, the authors argue that if broadband affects the base growth rate of the
local economy, then the sooner a community can get broadband access, the sooner the benefits of
broadband access can continue to compound into the future. The authors make a point that once
broadband is widely available throughout the country, economic growth will depend more on the
uses of broadband rather than its availability. The authors also pointed out that it is important for
policy makers to pay attention to both supply-side and demand-side issues because economic
development depends as much on adoption and use--as availability.25 If broadband access is
made available to businesses but they are not made aware of this and demand does not increase,
then the resulting positive economic impact will not be realized. The researchers pointed out that
if policy makers create a portfolio of broadband related policies that balance both supply-side
and demand-side issues (for example � training users) they are more likely to see positive
economic outcomes. If policy makers only focus on making broadband available but do not put
effort into educating citizens (on how to get broadband, why it will be useful to them and how to
use it), then they will not see the positive economic impact because broadband usage will not
have actually seen an increase alongside the increase in broadband availability.
In a study of broadband access in West Virginia, 93 percent of zip codes in the state had access
to high-speed service providers. However, there were still some rural communities where
broadband access was not available. Marshall University researchers studied the annual incomes
of workers in various West Virginia zip codes and found that workers in the Finance and Service
24 William Lehr, Carlos Osorio, Sharon Gillett, Marvin Sirbu, �Measuring Broadband�s Economic Impact,� Broadband Properties, December 2005. 25 Ibid.
CBG Communications, Inc.
67
sectors26 located in areas with high-speed broadband access earn between $1000 and $2000 more
per year than comparable workers located in areas without broadband access.
Researchers also found that many industries will not locate or expand in areas where broadband
is not available.27
One important finding of the West Virginia study was that broadband pricing was not always a
significant predictor of the decision to subscribe to broadband service. Residential broadband
users were relatively insensitive to price. Other important predictors of broadband usage were
household size, family incomes, and broadband access at work.28
The three sources of economic benefit from the development of broadband services were utility
for residential users (i.e. telecommuting, home based businesses), engaging external network
users, and increased firm productivity. Broadband provides utility to residential Internet users
because they are able to use more programs and applications such as online gaming, music and
video downloads and voice over Internet protocol. Furthermore, the utility of the network to
existing users increases as more users choose to participate in the same network. Finally,
broadband used by businesses may result in increases in productivity and therefore the quantity
of outputs. The researchers found that broadband access resulted in increased efficiency and
productivity in the Finance and Service sectors, but not for the economy as a whole.
One interesting finding is that most firms in the study chose their locations prior to the
development of broadband. When the researchers studied the firms of similar age they found
that for each firm located in an area with broadband access, productivity increased 14 � 17
percent compared to a firm in a non-broadband area but of a similar age. The researchers also
found that younger firms, who chose their locations after the development of broadband,
primarily chose to locate in areas with broadband access and are generally more productive.29
26 The financial service sector includes banking institutions, insurance companies, investment banks, brokering firms, financial advisors, etc. 27 Mark Burton and Michael Hicks, �The Residential and Commercial Benefits of Rural Broadband: Evidence from Central Appalachia,� Center for Business and Economic Research, Marshall University, July 2005. 28 Ibid. 29 Ibid.
CBG Communications, Inc.
68
The researchers also saw an increase in wages in areas with broadband access in West Virginia,
Pennsylvania and Ohio. In the financial sector in particular, workers in West Virginia in
broadband areas made almost 11.2 percent more than workers in non-broadband areas. The
researchers estimated that this would translate into $2,250 more per worker or $12.2 million in
statewide earnings if broadband were extended into areas that do not currently have access.30
The researchers felt that the relationship between broadband access and increasing wages was
most notable in the Finance and Service sectors because those sectors depend more than other
sectors on the speed of broadband Internet to perform duties essential to their business. The
researchers did make note that although it would likely have a positive economic impact to
develop broadband in underserved areas, it is important to remember that there would most
likely also be a positive economic impact achieved by improving service speeds and pricing in
areas that already have broadband access.31
COMMUNITY EXAMPLES
The USDA, through the Community Connect program, has awarded more than $10.3 million to
support 19 broadband projects across the United States in rural, economically challenged
communities of up to 20,000 inhabitants. In order to qualify, a community cannot currently have
access to high-speed Internet from a broadband provider. One recipient of a CommunityConnect
grant was Marcus, Washington. The town received $834,881 from the USDA to introduce
broadband service in the town and to provide the Marcus firefighters access to online training
videos and reports.
The town of Darbyville, Ohio received $603,200 to build a community center and computer lab
that will offer high-speed Internet access to universities and medical centers state wide. The
Navajo Mountain area in Utah is more than 100 miles away from the nearest hospital and
received $205,416 in grant funding to build a wireless network that will provide online public
safety notices, educational opportunities, and telemedicine services.32
30 Ibid. 31 Ibid. 32 National Telecommunications and Information Administration, �Networked Nation: Broadband in America 2007,� United States Department of Commerce, January 2008.
CBG Communications, Inc.
69
Analysis of Economic Impact in Washington
Some local agencies which feel they cannot rely on the private sector to provide advanced
telecommunications services are building FTTH (Fiber to the Home) networks within their
communities. This is the case in Grant County, Washington. The Public Utility District in the
county began by deploying a trial FTTH network serving 100 homes and 30 businesses in the
City of Ephrata, Washington. The PUD owns and operates the fiber network, but independent
telecommunications providers provide high-speed Internet access, voice and video over the fiber
network. Over the last three to five years, the PUD has extended the network to much of the rest
of the homes and businesses within the county. The PUD chose to build the FTTH network for
several reasons including the need to diversify their business and upgrade their current
communications infrastructure. One important aspect of the PUD�s strategy was to hire
telecommunications experts to join their development team. Financing for the project comes
from the District�s capital budget.33
The following is a specific discussion related to economic development in each of the five
counties and the relationship of broadband within the economic development focus.
COLUMBIA COUNTY
Columbia County is part of the Palouse Economic Development Council which represents four
counties. There are only two incorporated cities in the county, with Dayton being the largest.
The Dayton Chamber of Commerce serves Columbia County.
Connections to Internet access vary throughout the county. Some areas are served with DSL
while others are limited to dial-up access. Dayton has DSL, cable modem, wireless and satellite
high-speed Internet options. According to the Palouse Economic Development Council,
Columbia County continues to participate in the education and use of Internet based services.
33 Emy Tseng, �Competition in Fiber to the Home: A Technology and Policy Assessment,� Massachusetts Institute of Technology, September 2001.
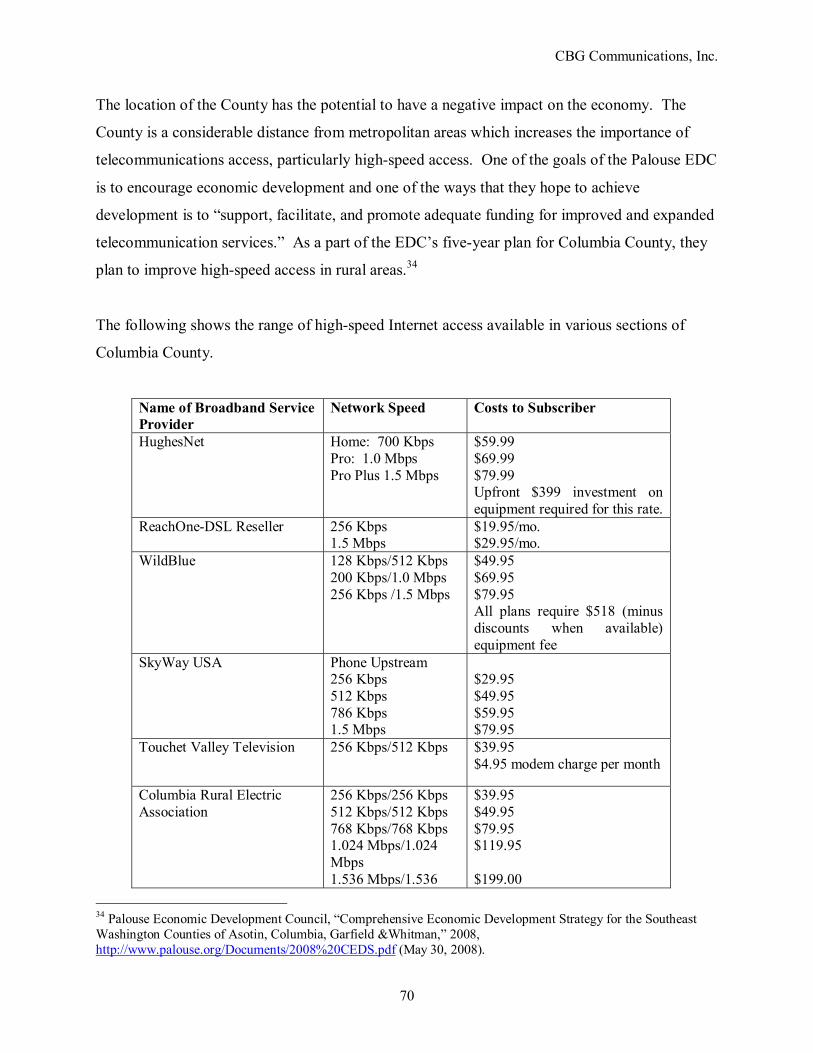
CBG Communications, Inc.
70
The location of the County has the potential to have a negative impact on the economy. The
County is a considerable distance from metropolitan areas which increases the importance of
telecommunications access, particularly high-speed access. One of the goals of the Palouse EDC
is to encourage economic development and one of the ways that they hope to achieve
development is to �support, facilitate, and promote adequate funding for improved and expanded
telecommunication services.� As a part of the EDC�s five-year plan for Columbia County, they
plan to improve high-speed access in rural areas.34
The following shows the range of high-speed Internet access available in various sections of
Columbia County.
Name of Broadband Service Provider
Network Speed Costs to Subscriber
HughesNet Home: 700 Kbps Pro: 1.0 Mbps Pro Plus 1.5 Mbps
$59.99 $69.99 $79.99 Upfront $399 investment on equipment required for this rate.
ReachOne-DSL Reseller 256 Kbps 1.5 Mbps
$19.95/mo. $29.95/mo.
WildBlue 128 Kbps/512 Kbps 200 Kbps/1.0 Mbps 256 Kbps /1.5 Mbps
$49.95 $69.95 $79.95 All plans require $518 (minus discounts when available) equipment fee
SkyWay USA Phone Upstream 256 Kbps 512 Kbps 786 Kbps 1.5 Mbps
$29.95 $49.95 $59.95 $79.95
Touchet Valley Television 256 Kbps/512 Kbps $39.95 $4.95 modem charge per month
Columbia Rural Electric Association
256 Kbps/256 Kbps 512 Kbps/512 Kbps 768 Kbps/768 Kbps 1.024 Mbps/1.024 Mbps 1.536 Mbps/1.536
$39.95 $49.95 $79.95 $119.95 $199.00
34 Palouse Economic Development Council, �Comprehensive Economic Development Strategy for the Southeast Washington Counties of Asotin, Columbia, Garfield &Whitman,� 2008, http://www.palouse.org/Documents/2008%20CEDS.pdf (May 30, 2008).
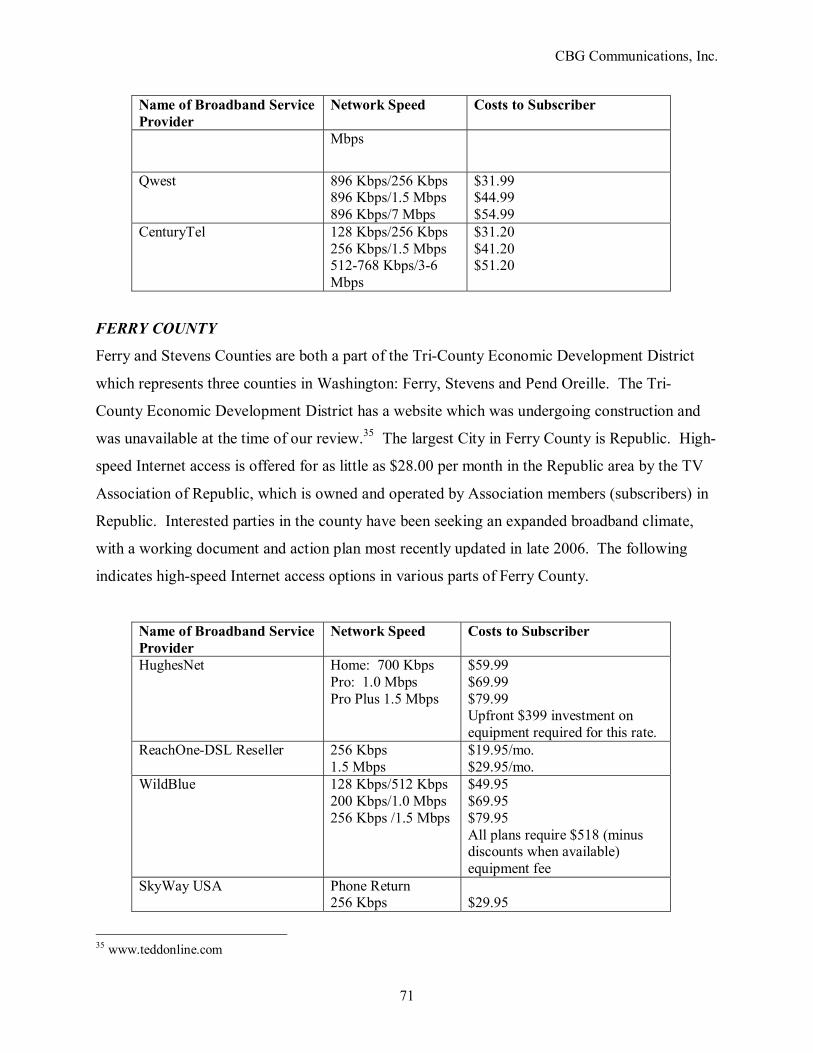
CBG Communications, Inc.
71
Name of Broadband Service Provider
Network Speed Costs to Subscriber
Mbps
Qwest 896 Kbps/256 Kbps 896 Kbps/1.5 Mbps 896 Kbps/7 Mbps
$31.99 $44.99 $54.99
CenturyTel 128 Kbps/256 Kbps 256 Kbps/1.5 Mbps 512-768 Kbps/3-6 Mbps
$31.20 $41.20 $51.20
FERRY COUNTY
Ferry and Stevens Counties are both a part of the Tri-County Economic Development District
which represents three counties in Washington: Ferry, Stevens and Pend Oreille. The Tri-
County Economic Development District has a website which was undergoing construction and
was unavailable at the time of our review.35 The largest City in Ferry County is Republic. High-
speed Internet access is offered for as little as $28.00 per month in the Republic area by the TV
Association of Republic, which is owned and operated by Association members (subscribers) in
Republic. Interested parties in the county have been seeking an expanded broadband climate,
with a working document and action plan most recently updated in late 2006. The following
indicates high-speed Internet access options in various parts of Ferry County.
Name of Broadband Service Provider
Network Speed Costs to Subscriber
HughesNet Home: 700 Kbps Pro: 1.0 Mbps Pro Plus 1.5 Mbps
$59.99 $69.99 $79.99 Upfront $399 investment on equipment required for this rate.
ReachOne-DSL Reseller 256 Kbps 1.5 Mbps
$19.95/mo. $29.95/mo.
WildBlue 128 Kbps/512 Kbps 200 Kbps/1.0 Mbps 256 Kbps /1.5 Mbps
$49.95 $69.95 $79.95 All plans require $518 (minus discounts when available) equipment fee
SkyWay USA Phone Return 256 Kbps
$29.95
35 www.teddonline.com
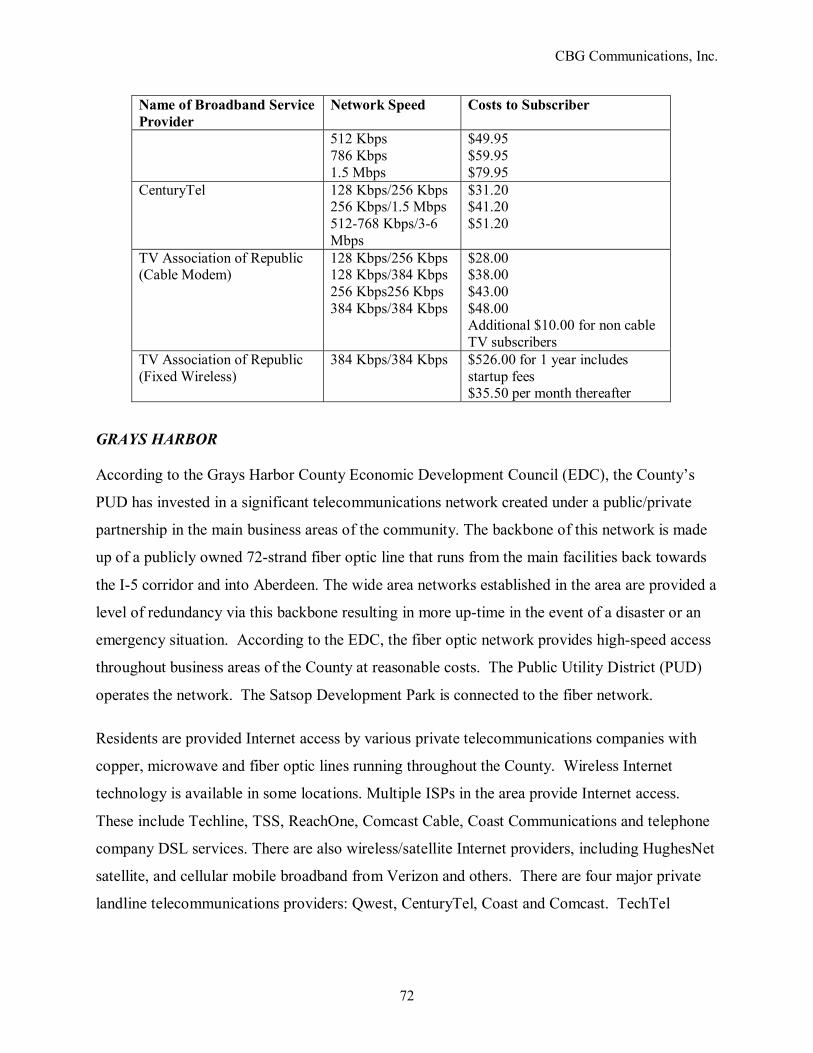
CBG Communications, Inc.
72
Name of Broadband Service Provider
Network Speed Costs to Subscriber
512 Kbps 786 Kbps 1.5 Mbps
$49.95 $59.95 $79.95
CenturyTel 128 Kbps/256 Kbps 256 Kbps/1.5 Mbps 512-768 Kbps/3-6 Mbps
$31.20 $41.20 $51.20
TV Association of Republic (Cable Modem)
128 Kbps/256 Kbps 128 Kbps/384 Kbps 256 Kbps256 Kbps 384 Kbps/384 Kbps
$28.00 $38.00 $43.00 $48.00 Additional $10.00 for non cable TV subscribers
TV Association of Republic (Fixed Wireless)
384 Kbps/384 Kbps $526.00 for 1 year includes startup fees $35.50 per month thereafter
GRAYS HARBOR
According to the Grays Harbor County Economic Development Council (EDC), the County�s
PUD has invested in a significant telecommunications network created under a public/private
partnership in the main business areas of the community. The backbone of this network is made
up of a publicly owned 72-strand fiber optic line that runs from the main facilities back towards
the I-5 corridor and into Aberdeen. The wide area networks established in the area are provided a
level of redundancy via this backbone resulting in more up-time in the event of a disaster or an
emergency situation. According to the EDC, the fiber optic network provides high-speed access
throughout business areas of the County at reasonable costs. The Public Utility District (PUD)
operates the network. The Satsop Development Park is connected to the fiber network.
Residents are provided Internet access by various private telecommunications companies with
copper, microwave and fiber optic lines running throughout the County. Wireless Internet
technology is available in some locations. Multiple ISPs in the area provide Internet access.
These include Techline, TSS, ReachOne, Comcast Cable, Coast Communications and telephone
company DSL services. There are also wireless/satellite Internet providers, including HughesNet
satellite, and cellular mobile broadband from Verizon and others. There are four major private
landline telecommunications providers: Qwest, CenturyTel, Coast and Comcast. TechTel
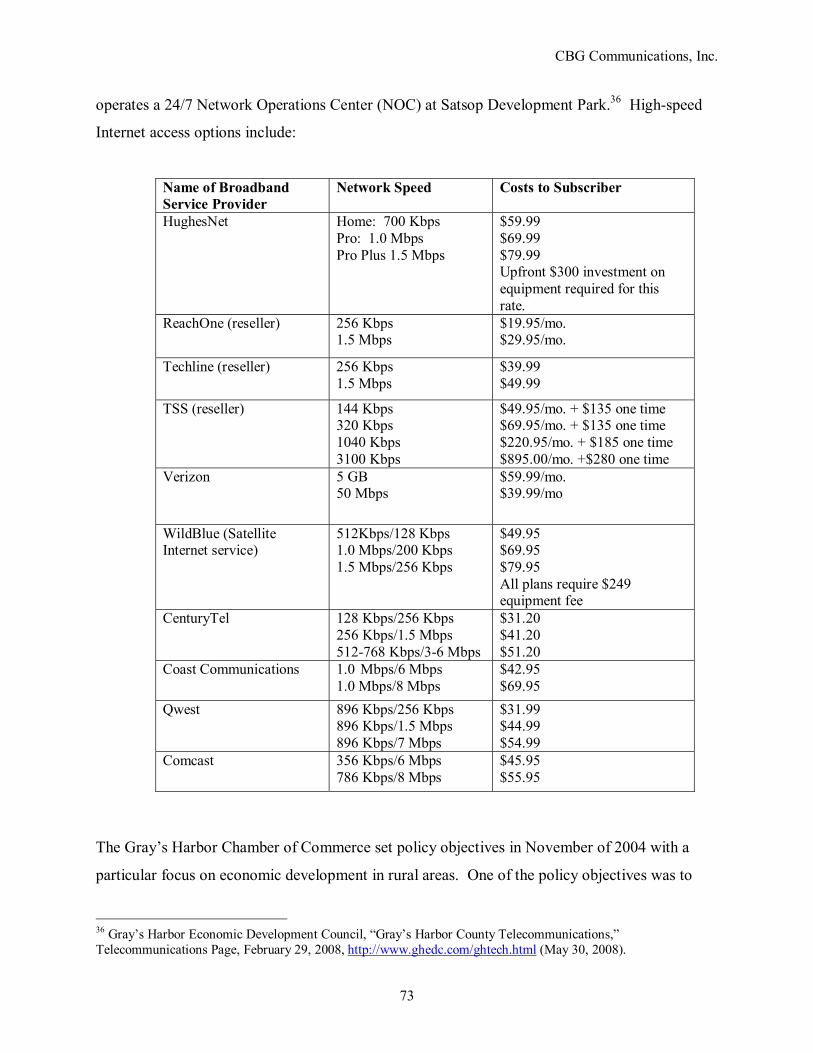
CBG Communications, Inc.
73
operates a 24/7 Network Operations Center (NOC) at Satsop Development Park.36 High-speed
Internet access options include:
Name of Broadband Service Provider
Network Speed Costs to Subscriber
HughesNet Home: 700 Kbps Pro: 1.0 Mbps Pro Plus 1.5 Mbps
$59.99 $69.99 $79.99 Upfront $300 investment on equipment required for this rate.
ReachOne (reseller) 256 Kbps 1.5 Mbps
$19.95/mo. $29.95/mo.
Techline (reseller) 256 Kbps 1.5 Mbps
$39.99 $49.99
TSS (reseller) 144 Kbps 320 Kbps 1040 Kbps 3100 Kbps
$49.95/mo. + $135 one time $69.95/mo. + $135 one time $220.95/mo. + $185 one time $895.00/mo. +$280 one time
Verizon 5 GB 50 Mbps
$59.99/mo. $39.99/mo
WildBlue (Satellite Internet service)
512Kbps/128 Kbps 1.0 Mbps/200 Kbps 1.5 Mbps/256 Kbps
$49.95 $69.95 $79.95 All plans require $249 equipment fee
CenturyTel 128 Kbps/256 Kbps 256 Kbps/1.5 Mbps 512-768 Kbps/3-6 Mbps
$31.20 $41.20 $51.20
Coast Communications 1.0 Mbps/6 Mbps 1.0 Mbps/8 Mbps
$42.95 $69.95
Qwest 896 Kbps/256 Kbps 896 Kbps/1.5 Mbps 896 Kbps/7 Mbps
$31.99 $44.99 $54.99
Comcast 356 Kbps/6 Mbps 786 Kbps/8 Mbps
$45.95 $55.95
The Gray�s Harbor Chamber of Commerce set policy objectives in November of 2004 with a
particular focus on economic development in rural areas. One of the policy objectives was to
36 Gray�s Harbor Economic Development Council, �Gray�s Harbor County Telecommunications,� Telecommunications Page, February 29, 2008, http://www.ghedc.com/ghtech.html (May 30, 2008).
CBG Communications, Inc.
74
build a strong economy for the County, especially rural areas. The Chamber outlined several
ways of achieving this goal; in particular, investment in public infrastructure and the Community
Economic Revitalization Board (CERB). The Chamber also emphasized allowing Public Utility
Districts to create a fiber optic network where it is currently unavailable from the private
sector.37
The Gray�s Harbor Economic Development Council conducted a telecommunications survey of
4000 County residents and businesses between April and July of 2002. 38 They found
�considerable disparity� in the County�s telecommunications infrastructure. The majority of
respondents believed that the County has �serious telecommunications infrastructure problems.�
They found that overall, 74% of respondents use the Internet, but only 15% of them had
connection speeds faster than 56 kbps dial-up. Approximately 54 percent of computer users
accessed computers at multiple locations, with home and work being the most prevalent. Of
Internet users, a majority indicated a desire for faster connections and 45 percent were willing to
pay more for faster connections or new services. A majority of users also said they support the
PUD bringing high-speed fiber optic networks directly to businesses and households.
In terms of particular communities in the County, the EDC found in 2002 that Aberdeen,
Cosmopolis and Hoquiam (where 40% of the County�s residents resided at the time) were
without affordable high-speed Internet access. Qwest Communications argued at the time that it
was economically unfeasible to provide high-speed access to these areas. Verizon provides
telephone service to the communities of Westport and Grayland, but also claimed that it was
economically unfeasible to provide these areas with high-speed Internet access. The
communities of Elma, McCleary and Montesano are provided affordable high-speed access
through CenturyTel Communications and Comcast. Ocean Shores has high-speed access
provided by Coast Communications. In the community of Hoquiam and throughout the eastern
part of the county, AT&T facilities exist, but AT&T does not provide broadband service because
37 Gray�s Harbor Chamber of Commerce, �Government Policy Objectives VII,� Government Policies Page, November 19, 2004, http://www.graysharbor.org/gov_policy.php (May 30, 2008). 38 http://www.ghedc.com/downloads/assessment.pdf.
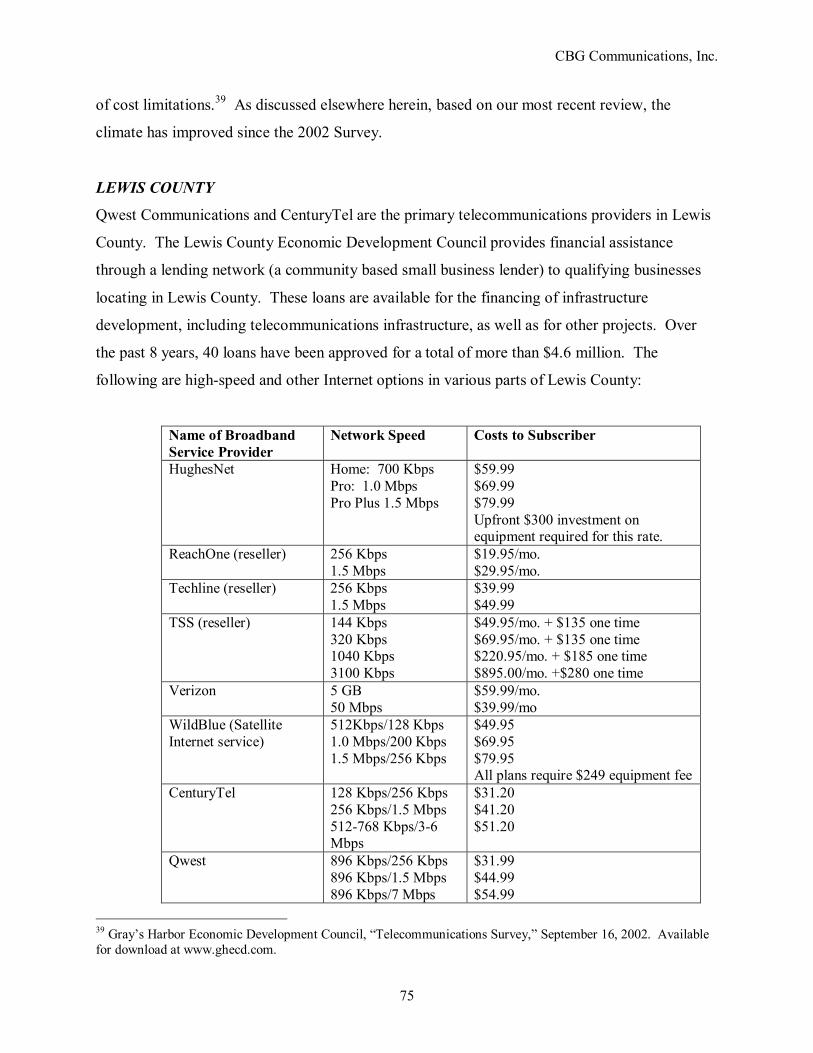
CBG Communications, Inc.
75
of cost limitations.39 As discussed elsewhere herein, based on our most recent review, the
climate has improved since the 2002 Survey.
LEWIS COUNTY
Qwest Communications and CenturyTel are the primary telecommunications providers in Lewis
County. The Lewis County Economic Development Council provides financial assistance
through a lending network (a community based small business lender) to qualifying businesses
locating in Lewis County. These loans are available for the financing of infrastructure
development, including telecommunications infrastructure, as well as for other projects. Over
the past 8 years, 40 loans have been approved for a total of more than $4.6 million. The
following are high-speed and other Internet options in various parts of Lewis County:
Name of Broadband Service Provider
Network Speed Costs to Subscriber
HughesNet Home: 700 Kbps Pro: 1.0 Mbps Pro Plus 1.5 Mbps
$59.99 $69.99 $79.99 Upfront $300 investment on equipment required for this rate.
ReachOne (reseller) 256 Kbps 1.5 Mbps
$19.95/mo. $29.95/mo.
Techline (reseller) 256 Kbps 1.5 Mbps
$39.99 $49.99
TSS (reseller) 144 Kbps 320 Kbps 1040 Kbps 3100 Kbps
$49.95/mo. + $135 one time $69.95/mo. + $135 one time $220.95/mo. + $185 one time $895.00/mo. +$280 one time
Verizon 5 GB 50 Mbps
$59.99/mo. $39.99/mo
WildBlue (Satellite Internet service)
512Kbps/128 Kbps 1.0 Mbps/200 Kbps 1.5 Mbps/256 Kbps
$49.95 $69.95 $79.95 All plans require $249 equipment fee
CenturyTel 128 Kbps/256 Kbps 256 Kbps/1.5 Mbps 512-768 Kbps/3-6 Mbps
$31.20 $41.20 $51.20
Qwest 896 Kbps/256 Kbps 896 Kbps/1.5 Mbps 896 Kbps/7 Mbps
$31.99 $44.99 $54.99
39 Gray�s Harbor Economic Development Council, �Telecommunications Survey,� September 16, 2002. Available for download at www.ghecd.com.
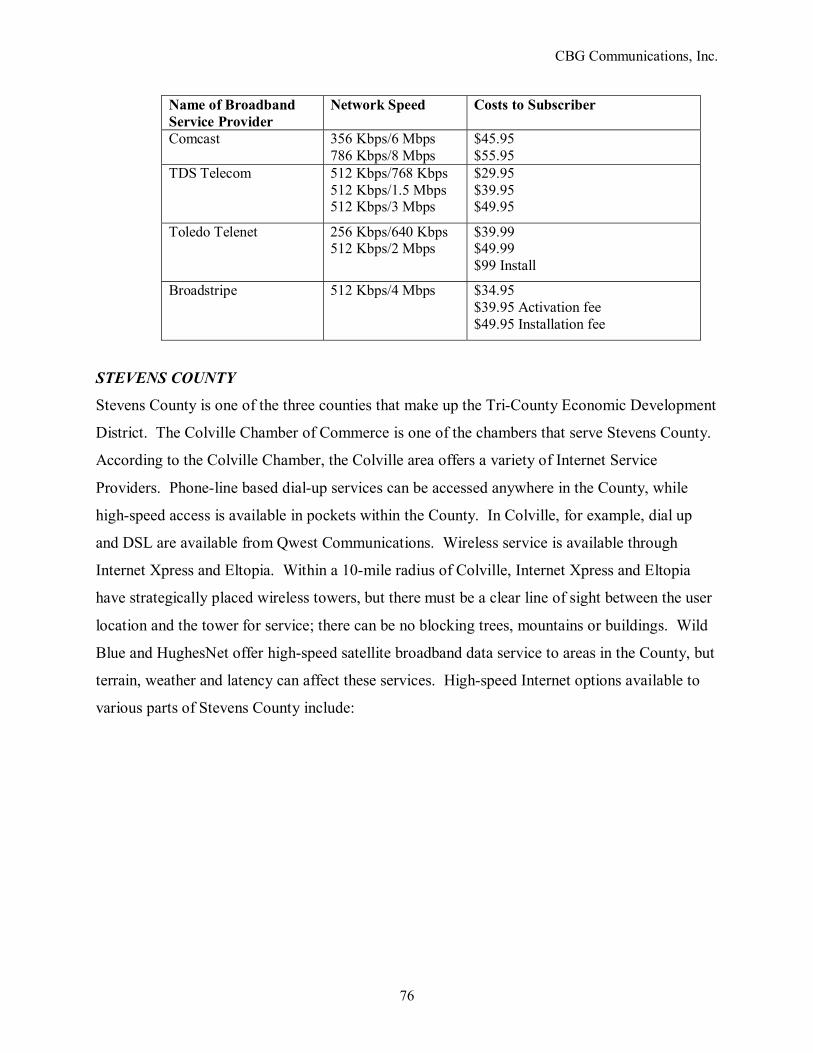
CBG Communications, Inc.
76
Name of Broadband Service Provider
Network Speed Costs to Subscriber
Comcast 356 Kbps/6 Mbps 786 Kbps/8 Mbps
$45.95 $55.95
TDS Telecom 512 Kbps/768 Kbps 512 Kbps/1.5 Mbps 512 Kbps/3 Mbps
$29.95 $39.95 $49.95
Toledo Telenet 256 Kbps/640 Kbps 512 Kbps/2 Mbps
$39.99 $49.99 $99 Install
Broadstripe 512 Kbps/4 Mbps $34.95 $39.95 Activation fee $49.95 Installation fee
STEVENS COUNTY
Stevens County is one of the three counties that make up the Tri-County Economic Development
District. The Colville Chamber of Commerce is one of the chambers that serve Stevens County.
According to the Colville Chamber, the Colville area offers a variety of Internet Service
Providers. Phone-line based dial-up services can be accessed anywhere in the County, while
high-speed access is available in pockets within the County. In Colville, for example, dial up
and DSL are available from Qwest Communications. Wireless service is available through
Internet Xpress and Eltopia. Within a 10-mile radius of Colville, Internet Xpress and Eltopia
have strategically placed wireless towers, but there must be a clear line of sight between the user
location and the tower for service; there can be no blocking trees, mountains or buildings. Wild
Blue and HughesNet offer high-speed satellite broadband data service to areas in the County, but
terrain, weather and latency can affect these services. High-speed Internet options available to
various parts of Stevens County include:
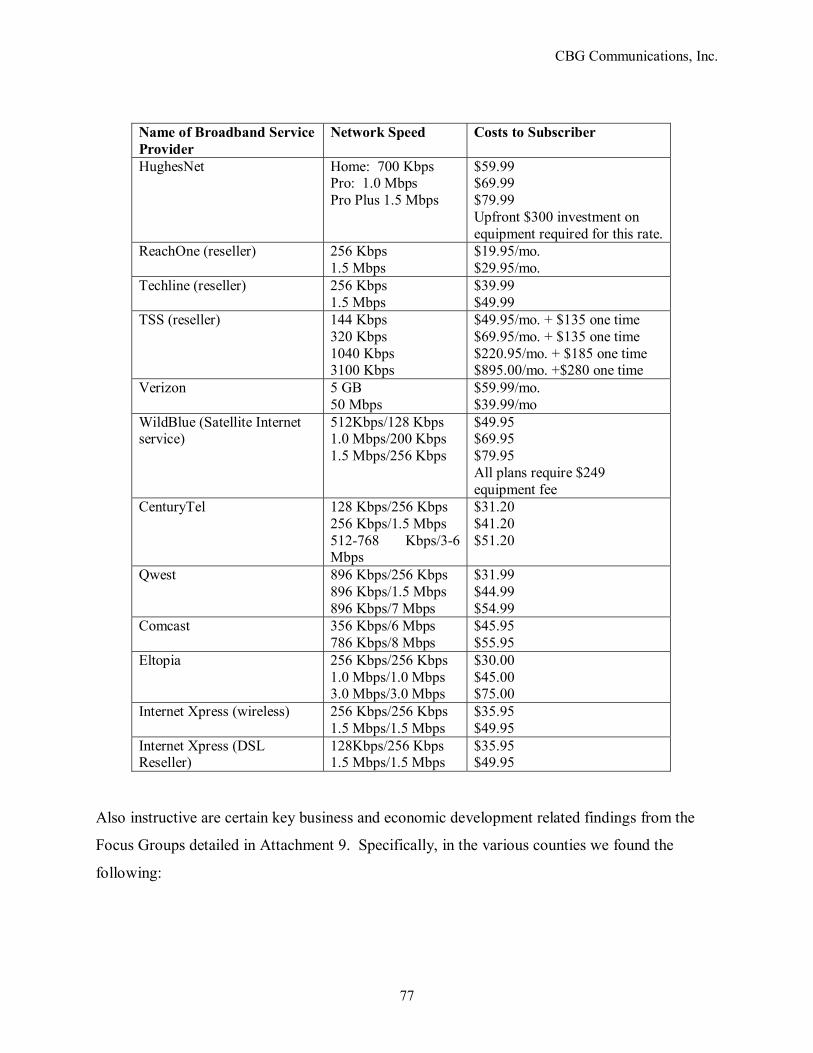
CBG Communications, Inc.
77
Name of Broadband Service Provider
Network Speed Costs to Subscriber
HughesNet Home: 700 Kbps Pro: 1.0 Mbps Pro Plus 1.5 Mbps
$59.99 $69.99 $79.99 Upfront $300 investment on equipment required for this rate.
ReachOne (reseller) 256 Kbps 1.5 Mbps
$19.95/mo. $29.95/mo.
Techline (reseller) 256 Kbps 1.5 Mbps
$39.99 $49.99
TSS (reseller) 144 Kbps 320 Kbps 1040 Kbps 3100 Kbps
$49.95/mo. + $135 one time $69.95/mo. + $135 one time $220.95/mo. + $185 one time $895.00/mo. +$280 one time
Verizon 5 GB 50 Mbps
$59.99/mo. $39.99/mo
WildBlue (Satellite Internet service)
512Kbps/128 Kbps 1.0 Mbps/200 Kbps 1.5 Mbps/256 Kbps
$49.95 $69.95 $79.95 All plans require $249 equipment fee
CenturyTel 128 Kbps/256 Kbps 256 Kbps/1.5 Mbps 512-768 Kbps/3-6 Mbps
$31.20 $41.20 $51.20
Qwest 896 Kbps/256 Kbps 896 Kbps/1.5 Mbps 896 Kbps/7 Mbps
$31.99 $44.99 $54.99
Comcast 356 Kbps/6 Mbps 786 Kbps/8 Mbps
$45.95 $55.95
Eltopia 256 Kbps/256 Kbps 1.0 Mbps/1.0 Mbps 3.0 Mbps/3.0 Mbps
$30.00 $45.00 $75.00
Internet Xpress (wireless) 256 Kbps/256 Kbps 1.5 Mbps/1.5 Mbps
$35.95 $49.95
Internet Xpress (DSL Reseller)
128Kbps/256 Kbps 1.5 Mbps/1.5 Mbps
$35.95 $49.95
Also instructive are certain key business and economic development related findings from the
Focus Groups detailed in Attachment 9. Specifically, in the various counties we found the
following:
CBG Communications, Inc.
78
STEVENS COUNTY
�Patchwork Quilt� of Services
Two focus groups were conducted in Stevens County and both had representatives from area
businesses. Business owners indicated that the County is served by a �patchwork quilt� of
service providers. Both hospitals (Mt. Carmel and St. Joseph�s) are connected through T-1 lines.
Some participants indicated that they were connected through satellite, provided by Hughes,
Wild Blue and Starband. A few Internet users in the County use dial-up or cellular �air cards�
which rely on an open line of sight to a cell tower.
Need High-speed for Various Applications
The members of the focus group indicated that the lack of redundancy and an overall lack of
good quality high-speed Internet are problems. This lack of high-speed Internet access hinders
the ability for many workers to telecommute. Mt. Carmel Hospital also indicated that they use
video conferencing, but anticipate that they will need a much higher connection speed and
degree of granularity in order to use video for some of the more advanced procedures.
The cited reasons that many areas do not have adequate bandwidth included high cost, locations
that have limited services and inconsistency of service provider from location to location.
Negative Economic Impact
Members of the focus group indicated that based on the wide range of demographics that
currently use high-speed Internet access at the public libraries, high-speed access would benefit
all sectors of the County. Also, the businesses indicated that they want to try to recruit college
graduates that are tech-savvy, but if these graduates are used to access to high-speed Internet,
they are likely to chose other locations if broadband is not available in the area. Mt. Carmel
Hospital also indicated that the lack of broadband had been an inhibitor in their recruiting efforts.
It was also mentioned that when major corporations look for locations for branches, the lack of
high-speed, cost-effective access to a home office could inhibit their desire to locate in Stevens
County.
CBG Communications, Inc.
79
Solutions
The group suggested that the government should have more involvement in building
infrastructure (similar to the building of highways) and should try to reduce the monopoly of
broadband service providers in the area. All agreed that grants (especially rural development
grants) would be useful. They also said that if the return on investment is a significant issue, the
State could get involved and try to shorten the return on investment for the providers so that
providing broadband to more areas would be feasible.
COLUMBIA COUNTY
Need Access to Information
Business members of the focus group indicated a strong desire to have more access to
information through the Internet. Several of the participants also indicated that the general
public needs to be educated about the benefits of broadband and what is available. Also,
broadband access could connect different parts of the County and the State. While the western
side is urban and the eastern side is rural, broadband has the capability to connect the two sides
of the State.
Economic Impact
Many entrepreneurs and businesses in the County have a need to connect with other people
around the world. For their businesses to be successful, they need broadband so that they can
share ideas, research and communicate. Furthermore, as the County plans for the future, they
must recognize that young people demand access to broadband and, without it, they may not
come to or stay in Columbia County. The focus group said that broadband must be available
everywhere because the economy today is international. Some believed that gas prices (and the
desire to telecommute) also contribute to the need for broadband access. Not having broadband
fully available in the County creates an economic barrier that other counties with broadband
access do not face. In the industry of healthcare in particular, hospitals and doctors are relying
more on telemedicine and access to this information is key, especially in rural areas.
CBG Communications, Inc.
80
FERRY COUNTY
Inconsistent Service and Pricing
Many participants indicated that Internet service is spotty. There is cable modem access in
Republic, but problematic technical issues have been frequent. There is currently no DSL access
in and around Republic. Verizon Wireless provides wireless broadband in Ferry via its cellular
network. AT&T Cellular broadband service is spotty while Sprint has limited to no service in
Ferry. Inconsistent pricing is also an issue as T-1s are costly with limited capacity. DS-3 is also
costly with constant price quote changes and inconsistent offerings from Verizon.
Slow Connections
Many Internet users indicated that they have very slow connections, with a Dial-up speed of 21.6
Kbps considered a typical connection. Some homes near Republic can get a 56 Kbps
connection. Some mentioned that when many people were on the cable network, it tended to
slow down the cable modem Internet service.
Inhibitors to Broadband Deployment
The main inhibitors to broadband deployment appear to be a problematic return on investment
and the cost of technology implementation and operation. Another inhibitor could be a lack of
interest in broadband by some citizens. Some people don�t know why broadband is relevant to
them or don�t want to put financial or personal information online and therefore have apathetic
attitudes towards broadband development.
Economic Impact
For economic growth, the County needs to have better access to broadband. Some uses for high-
speed connections include telemedicine, community services and education. It would be
beneficial for the economy if students could consistently take online classes and if citizens could
consistently see medical specialists through a videoconference. Some supported the idea that the
government should not create jobs, but needs to create the infrastructure needed for the private
sector to locate in the area and create jobs. Many entrepreneurs in the area need broadband to
conduct business.
CBG Communications, Inc.
81
GRAYS HARBOR
The Role of the PUD
Significant discussion centered around the Public Utility Districts (PUDs). The PUD in Grays
Harbor wholesales services to various entities and can provide Ethernet services from 10 Mbps
to 1 Gbps. There is a need for additional services from the PUD, particularly because they can
do things that other private companies can�t because they can absorb a longer ROI. However,
one of the main problems for the PUDs is trying to get the needed permits to expand broadband,
as they have to go through many agencies (the DOT, the DNR, the U.S. Fish and Wildlife
Department, etc.). The PUD currently has a number of different customers and uses both fiber
and wireless connections. The PUD most desires to engage in public/private partnerships. The
PUD has worked with CenturyTel to build portions of a fiber network and many think that more
public/private partnerships would be beneficial. However, it can be difficult to work with some
companies, such as Qwest, who want a �do not compete� clause regarding any shared
infrastructure. Participants believe that the key is really to provide an incentive to the private
sector. The group also felt that the State could be involved by making sure that providers,
particularly when it comes to public/private partnerships, are focused on cooperation and
collaboration in order to make broadband service available to everyone in the County.
Costly, Spotty Service
One common theme of the focus groups was that service is costly. Because some of the cost is
calculated based on mileage, some needed circuits can cost as much as $1500 a month. Even
though service is costly, businesses indicated that it is also quite inconsistent. Comcast provides
broadband wherever it provides cable, but does not provide broadband in areas that do not meet
its density criteria. CenturyTel is able to provide service because they receive Universal Service
Fund money. Qwest service is also spotty because they only provide DSL from certain COs and
where they have remotes off of their COs. In some areas, Verizon provides T-1s but will not
provide DSL, and these T-1s are expensive. Participants also indicated that topography is a
problem, especially when it comes to obtaining permits for traversing certain restricted areas.
CBG Communications, Inc.
82
Economic Impact
Many members of the focus group believed that greater access to broadband would have a
positive economic impact. The group felt that the State could be involved in helping the County
by focusing on economic development and helping develop broadband access to all areas of the
County so that businesses will locate in the County.
Economic Impact Analysis Conclusion
After review of all the factors related to the impact of the presence or lack of broadband
infrastructure and service availability, its adoption and use within the five studied counties, it is
evident that the lack of broadband inhibits economic development and the presence of broadband
supports economic development within the five counties. For example, to further understand
how broadband adoption impacted responding businesses in the five rural counties studied, a test
of significance was conducted and the following tested concepts were found to be significant
related to business broadband adoption: greater satisfaction with provider billing practices,
greater satisfaction with the installation technician, significantly greater number of Internet
applications in use at the place of business, less satisfaction with the number of choices among
broadband providers and more likely to have a larger number of employees.
Additionally, when analyzing Business Survey results in tandem with information gathered
during in-depth interviews and focused discussions, the lack of a truly reliable, competitive
broadband environment creates the following negative impacts:
• Movement of businesses away from low or no broadband areas to areas with a
better broadband environment.
• Higher operational costs.
• Difficulty in recruitment.
• Slower, more inefficient and inconsistent operations.
CBG Communications, Inc.
83
• Less provision of services to, and access of services by, citizens thus reducing
related quality of life components.
The presence of a competitive, reliable broadband environment has the inverse effect on
economic development, including:
• Movement of businesses into the area, as well as retention and expansion of
existing businesses.
• More efficient and consistent operations.
• Enhancement of related components of quality of life.

CBG Communications, Inc.
84
Section D Review of Educational
Communities of Interest
CBG Communications, Inc.
85
REVIEW OF EDUCATIONAL COMMUNITIES OF INTEREST
Introduction and Overview As part of this Study, educational organizations within the five counties were surveyed regarding
their broadband data networks. The survey was designed to measure broadband availability to
the schools, usage, needs and interests. To assist in this effort, key networking staff in the
educational community were interviewed and engaged to assist in identifying the right staff
person within the public school districts and area community colleges to respond to the survey.40
Washington�s K-20 Education Network, launched in 1996 with funds from the Washington State
Legislature, provides educational organizations across the state, in communities of all sizes and
in urban and rural areas, with dedicated, scalable telecommunications capacity. Educators and
students at more than 400 public education sites including community and technical colleges,
baccalaureate institutions, independent colleges, the public library system, K-12 school districts
and educational service districts are able to use K-20 Network technology to communicate with
one another. The network is built with a high-speed telecommunications backbone that connects
the various sites and breaks the traditional barriers of distance and cost.41 The K-20 Network is
active in all five studied counties and provides the major gateway in and out of the school
districts.
Within the school district itself, each is individually responsible for establishing an intra-school
district network that links the frequently multiple school district sites to each other and then to
the K-20 Network. These intra-district school connections are dependent on the existing
infrastructure available near the school district office. Educational organizations have used a
variety of means to engage local providers in supporting these elements of their network.
40 The Managing Partner of Network Communications International and K-20 Network Office Contract staff for the State of Washington assisted in identifying the regional K-20 Network coordinators that represented the impacted studied counties. These district level coordinators assisted in mapping the current network availability at each of the public schools and community colleges in the area. The Educational Technology Coordinator for the Office of State Public Instruction (OSPI), also assisted in sending a query to targeted instructional technology coordinators to complete the online survey that is detailed in this report. 41 Washington State Department of Information Services, �K-20 Education Network,� Enterprise Initiatives Page, 2008, http://www.dis.wa.gov/enterprise/k20network/ (May 28, 2008).
CBG Communications, Inc.
86
Contact was also established with the handful of private schools in the area and telephone
interviews were conducted. These schools are not eligible to partner with the K-20 Network and
described establishing high-speed Internet service with a variety of providers including DSL
from Qwest, commercial cable modem services and satellite Internet providers.
The following narrative details the responses of educational organizations regarding their
individual networks.
Responding educational entities included 82% of all public school districts operating in the five
studied counties. Additionally, data was collected from the community colleges in the area.
Several of these use the K-20 Network; however, others rely on their own established
infrastructure and are satellite organizations to larger institutions.42
Responding school districts included:
County School District 1. Columbia Dayton School District 2. Columbia Starbuck School District 3. Ferry Curlew School District 4. Ferry Inchelium School District 5. Ferry Keller School District 6. Ferry Orient School District 7. Ferry Republic School District 8. Grays Harbor Aberdeen School District 9. Grays Harbor Cosmopolis School District 10. Grays Harbor Hoquiam School District 11. Grays Harbor Lake Quinault School District 12. Grays Harbor McCleary School District 13. Grays Harbor Montesano School District 14. Grays Harbor North Beach School District 15. Grays Harbor Oakville School District 16. Grays Harbor Ocosta School District 17. Grays Harbor Satsop School District 18. Grays Harbor Taholah School District 19. Grays Harbor Wishkah Valley School District
42 Not all educational entities shown completed the on-line Survey. Information for several of the school districts and the universities and community colleges was provided via on-site interviews and discussions with Educational Service District personnel.
CBG Communications, Inc.
87
20. Lewis Boistfort School District 21. Lewis Centralia School District 22. Lewis Chehalis School District 23. Lewis Evaline School District 24. Lewis Morton School District 25. Lewis Mossyrock School District 26. Lewis Napavine School District 27. Lewis Onalaska School District 28. Lewis Pe Ell School District 29. Lewis White Pass School District 30. Lewis Winlock School District 31. Stevens Columbia River Christian Academy 32. Stevens Colville School District 33. Stevens Kettle Falls School District 34. Stevens Loon Lake School District 35. Stevens Northport School District 36. Stevens Onion Creek School District 37. Stevens Summit Valley School District 38. Stevens Wellpinit School District
Community Colleges, Telemedicine Sites and Regional Universities:
County School T1s Total T1 Capacity (Mbps)
Ferry Spokane Community College-Inchelium 2 3.0
Ferry Spokane Community College-Republic 3 4.5
Grays Harbor Grays Harbor College43 1 1.5
Grays Harbor Grays Harbor College-Elma 1 1.5
Grays Harbor Washington State University-Aberdeen 1 1.5
Grays Harbor UW-Grays Harbor Community Hospital 1 1.5
Grays Harbor UW-Mark Reed Hospital 1 1.5
Lewis Centralia College44 1 1.5
Lewis Centralia College-East County Center 2 3.0
Lewis UW-Morton General Hospital 1 1.5
Stevens Spokane Community College-Colville 4 6.0
Stevens Washington State University-Colville 1 1.5
43 Also has fast Ethernet capacity, 10 Mbps. 44 Also has fast Ethernet capacity, 10 Mbps.
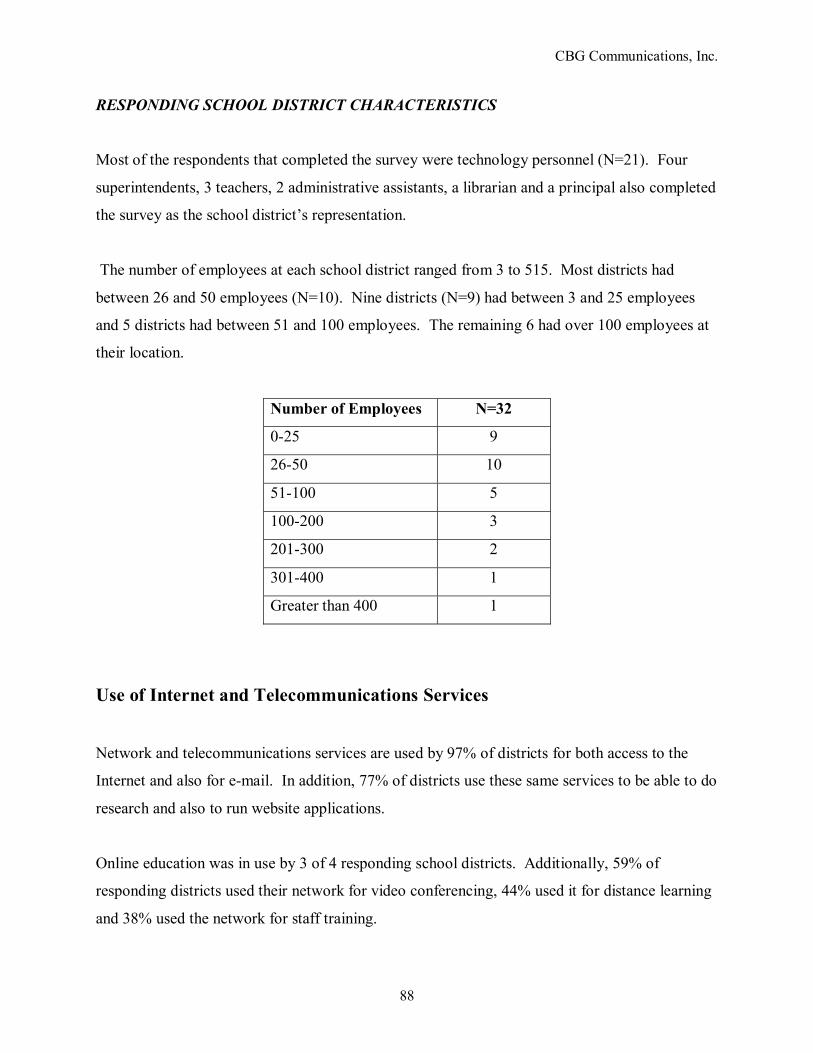
CBG Communications, Inc.
88
RESPONDING SCHOOL DISTRICT CHARACTERISTICS
Most of the respondents that completed the survey were technology personnel (N=21). Four
superintendents, 3 teachers, 2 administrative assistants, a librarian and a principal also completed
the survey as the school district�s representation.
The number of employees at each school district ranged from 3 to 515. Most districts had
between 26 and 50 employees (N=10). Nine districts (N=9) had between 3 and 25 employees
and 5 districts had between 51 and 100 employees. The remaining 6 had over 100 employees at
their location.
Number of Employees N=32
0-25 9
26-50 10
51-100 5
100-200 3
201-300 2
301-400 1
Greater than 400 1
Use of Internet and Telecommunications Services
Network and telecommunications services are used by 97% of districts for both access to the
Internet and also for e-mail. In addition, 77% of districts use these same services to be able to do
research and also to run website applications.
Online education was in use by 3 of 4 responding school districts. Additionally, 59% of
responding districts used their network for video conferencing, 44% used it for distance learning
and 38% used the network for staff training.
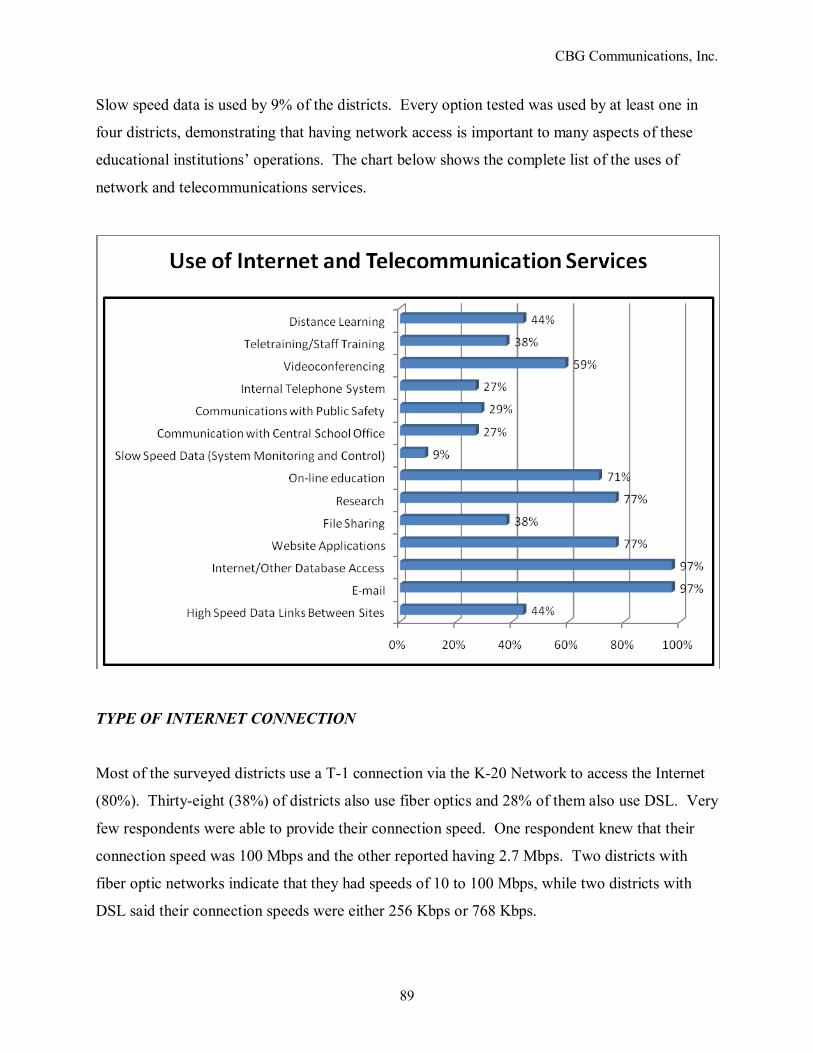
CBG Communications, Inc.
89
Slow speed data is used by 9% of the districts. Every option tested was used by at least one in
four districts, demonstrating that having network access is important to many aspects of these
educational institutions� operations. The chart below shows the complete list of the uses of
network and telecommunications services.
TYPE OF INTERNET CONNECTION
Most of the surveyed districts use a T-1 connection via the K-20 Network to access the Internet
(80%). Thirty-eight (38%) of districts also use fiber optics and 28% of them also use DSL. Very
few respondents were able to provide their connection speed. One respondent knew that their
connection speed was 100 Mbps and the other reported having 2.7 Mbps. Two districts with
fiber optic networks indicate that they had speeds of 10 to 100 Mbps, while two districts with
DSL said their connection speeds were either 256 Kbps or 768 Kbps.
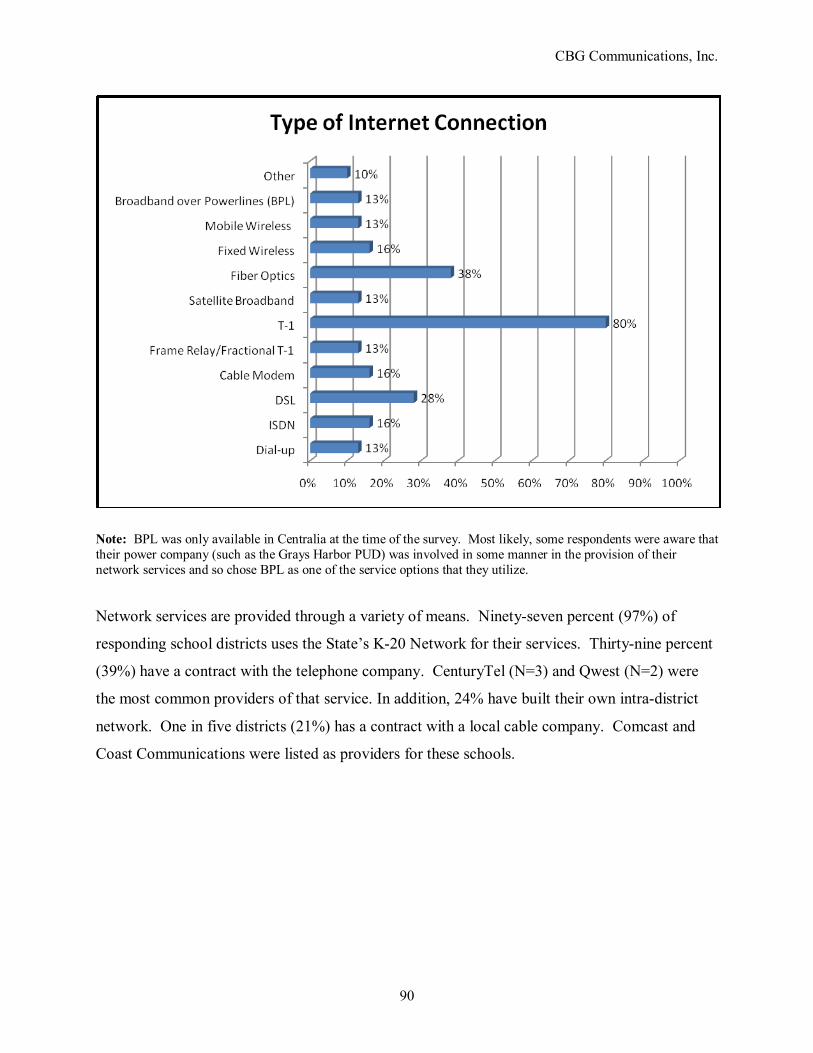
CBG Communications, Inc.
90
Note: BPL was only available in Centralia at the time of the survey. Most likely, some respondents were aware that their power company (such as the Grays Harbor PUD) was involved in some manner in the provision of their network services and so chose BPL as one of the service options that they utilize.
Network services are provided through a variety of means. Ninety-seven percent (97%) of
responding school districts uses the State�s K-20 Network for their services. Thirty-nine percent
(39%) have a contract with the telephone company. CenturyTel (N=3) and Qwest (N=2) were
the most common providers of that service. In addition, 24% have built their own intra-district
network. One in five districts (21%) has a contract with a local cable company. Comcast and
Coast Communications were listed as providers for these schools.

CBG Communications, Inc.
91
Network services cost between $2000 and $118,000 dollars annually. Most districts (N=8) pay
between $2000 and $2999 dollars per year for their Internet access. Three districts (N=-3) pay
between $3000-$3999 dollars and 3 pay more than $4000 dollars per year.
The term of these contracts is generally 1 year long (N=10). A couple of districts (N=2) have a
contract that lasts longer than three years and another group of respondents (N=11) were
unaware of the length of their contract.
Of the providers of network services in the area, 26 out of 30 districts indicated that the K-20
Network was their primary provider. Two districts have CenturyTel (N=2). Other service
providers include Techline (N=1)
Primary Network Provider N=30
K-20 Network 26
CenturyTel 2
Techline 1
Don�t Know 1
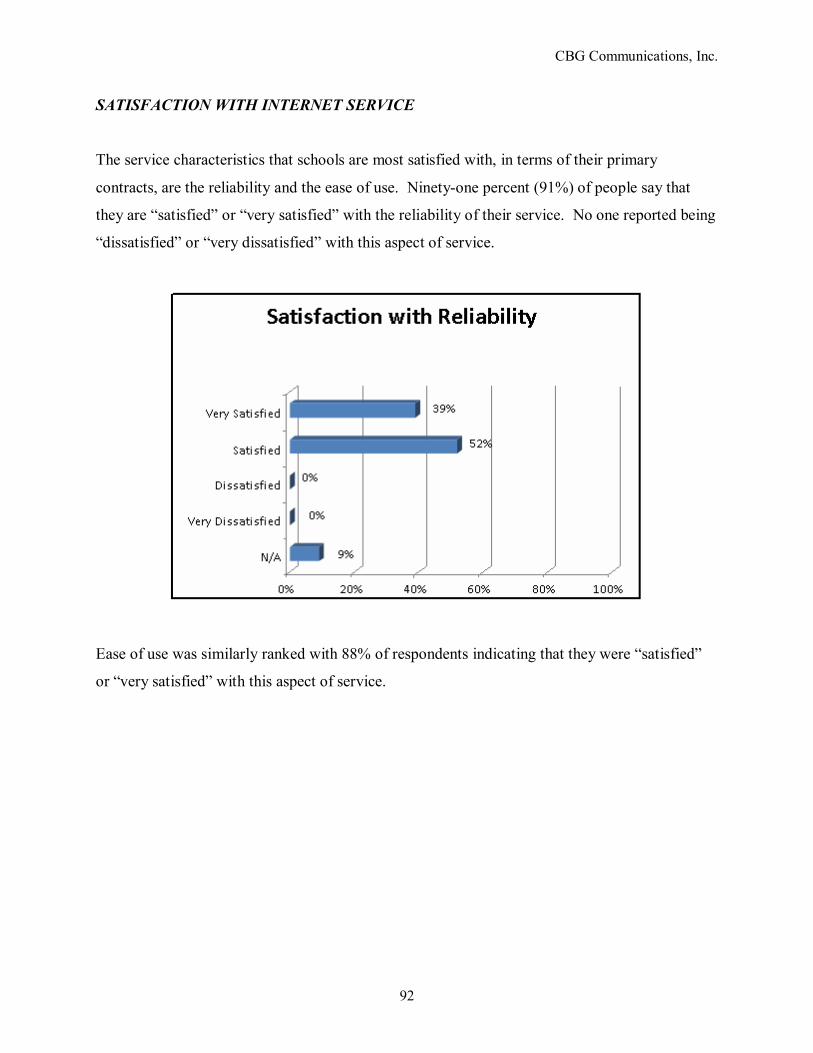
CBG Communications, Inc.
92
SATISFACTION WITH INTERNET SERVICE
The service characteristics that schools are most satisfied with, in terms of their primary
contracts, are the reliability and the ease of use. Ninety-one percent (91%) of people say that
they are �satisfied� or �very satisfied� with the reliability of their service. No one reported being
�dissatisfied� or �very dissatisfied� with this aspect of service.
Ease of use was similarly ranked with 88% of respondents indicating that they were �satisfied�
or �very satisfied� with this aspect of service.
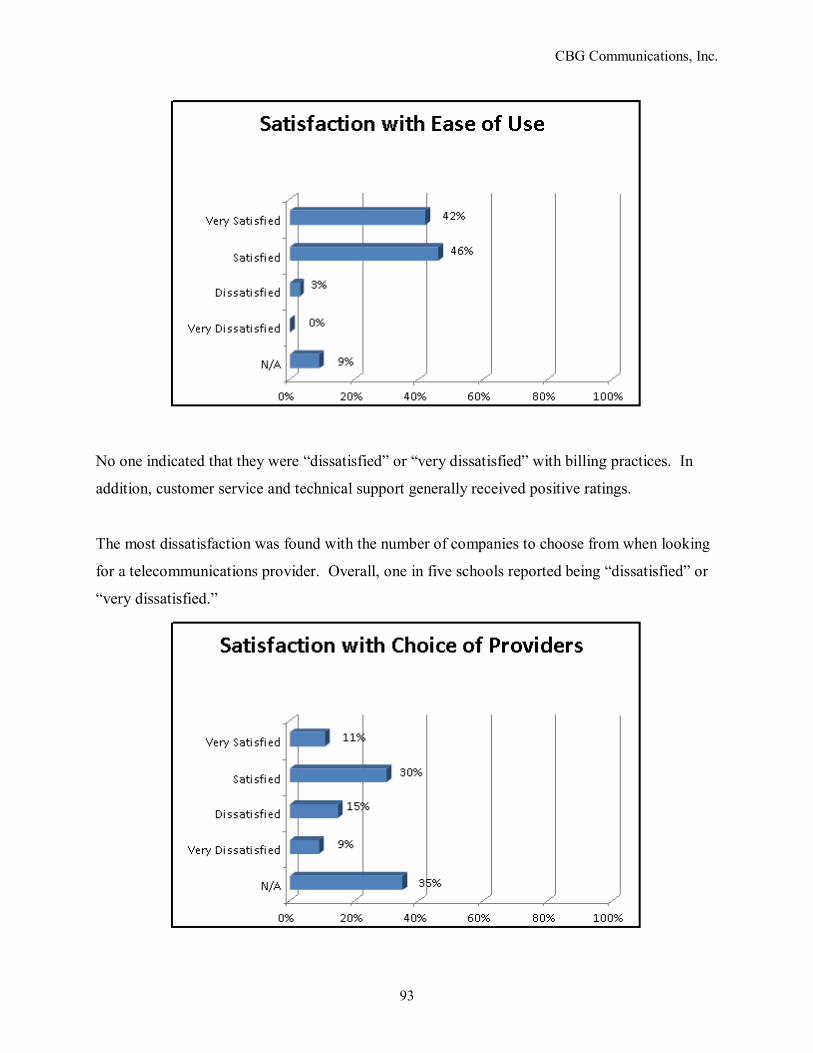
CBG Communications, Inc.
93
No one indicated that they were �dissatisfied� or �very dissatisfied� with billing practices. In
addition, customer service and technical support generally received positive ratings.
The most dissatisfaction was found with the number of companies to choose from when looking
for a telecommunications provider. Overall, one in five schools reported being �dissatisfied� or
�very dissatisfied.�
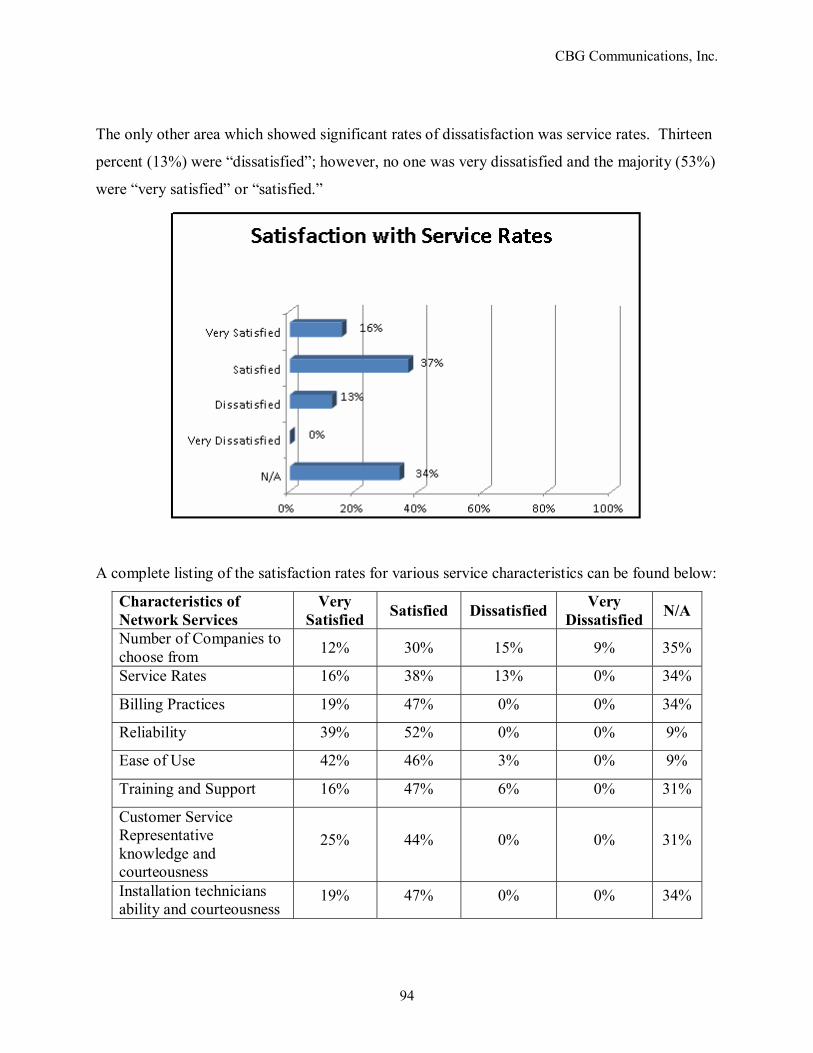
CBG Communications, Inc.
94
The only other area which showed significant rates of dissatisfaction was service rates. Thirteen
percent (13%) were �dissatisfied�; however, no one was very dissatisfied and the majority (53%)
were �very satisfied� or �satisfied.�
A complete listing of the satisfaction rates for various service characteristics can be found below:
Characteristics of Network Services
Very Satisfied Satisfied Dissatisfied Very
Dissatisfied N/A
Number of Companies to choose from 12% 30% 15% 9% 35%
Service Rates 16% 38% 13% 0% 34%
Billing Practices 19% 47% 0% 0% 34%
Reliability 39% 52% 0% 0% 9%
Ease of Use 42% 46% 3% 0% 9%
Training and Support 16% 47% 6% 0% 31%
Customer Service Representative knowledge and courteousness
25% 44% 0% 0% 31%
Installation technicians ability and courteousness
19% 47% 0% 0% 34%
CBG Communications, Inc.
95
K-20 NETWORK
Ninety-seven percent (97%) of the districts surveyed responded that they use the Washington
State K-20 Network. Most of them (N=23), when asked how they use it, mentioned that it
provided their access to the Internet. Other reasons that were mentioned included supporting
connectivity between schools (N=1), being able to access more information (N=1), and using E-
rate (N=1).
NETWORK CAPABILITIES
Respondents were also asked whether they thought that their current network(s) or services were
too slow or unable to meet their current or projected application demands. Fifty-two percent
(52%) indicated that the network was too slow, while the remaining respondents indicated that it
was sufficient.
The respondents that said the connection was too slow or insufficient all mentioned that full
motion video is one of the applications that needed higher speeds. Over half (54%) said that the
capacity for additional users needs to be increased, and 46% said that faster speed was important
to be able to transfer data between locations more quickly.
A smaller percentage of schools (15%) mentioned that Geographic Information Systems (GIS)
applications need higher speeds. Other applications listed include supporting the ability to
educate students online and to be able to have an interactive web curriculum.
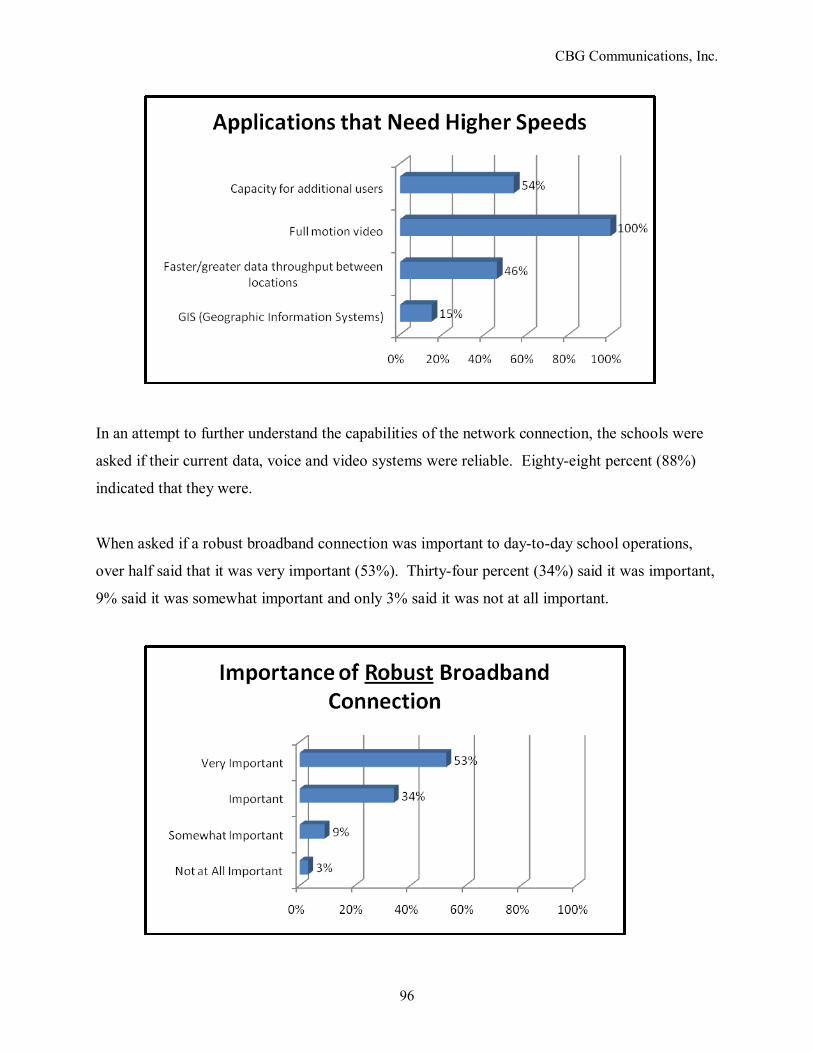
CBG Communications, Inc.
96
In an attempt to further understand the capabilities of the network connection, the schools were
asked if their current data, voice and video systems were reliable. Eighty-eight percent (88%)
indicated that they were.
When asked if a robust broadband connection was important to day-to-day school operations,
over half said that it was very important (53%). Thirty-four percent (34%) said it was important,
9% said it was somewhat important and only 3% said it was not at all important.
CBG Communications, Inc.
97
Of those that said it was important (N=23), 7 mentioned its importance for long distance
education programs. Six (N=6) wrote about how important it was for office and administration
work and 5 said it was important for access to necessary information. Other responses as to why
broadband is important included having a fast connection (N=2), being able to connect with
other places (N=2) and having the ability to have video conferences (N=1).
If broadband service was enhanced in their area, each district was asked what they would use
such enhanced service to accomplish. Half of the respondents (50%) said that enhanced
broadband would facilitate an internal telephone system and slow speed data applications.
Thirty-six percent (36%) said that they would use it for a faster link between educational sites.
Districts would also use enhanced broadband for Internet and other database access (6%),
research (8%) and file sharing (8%).
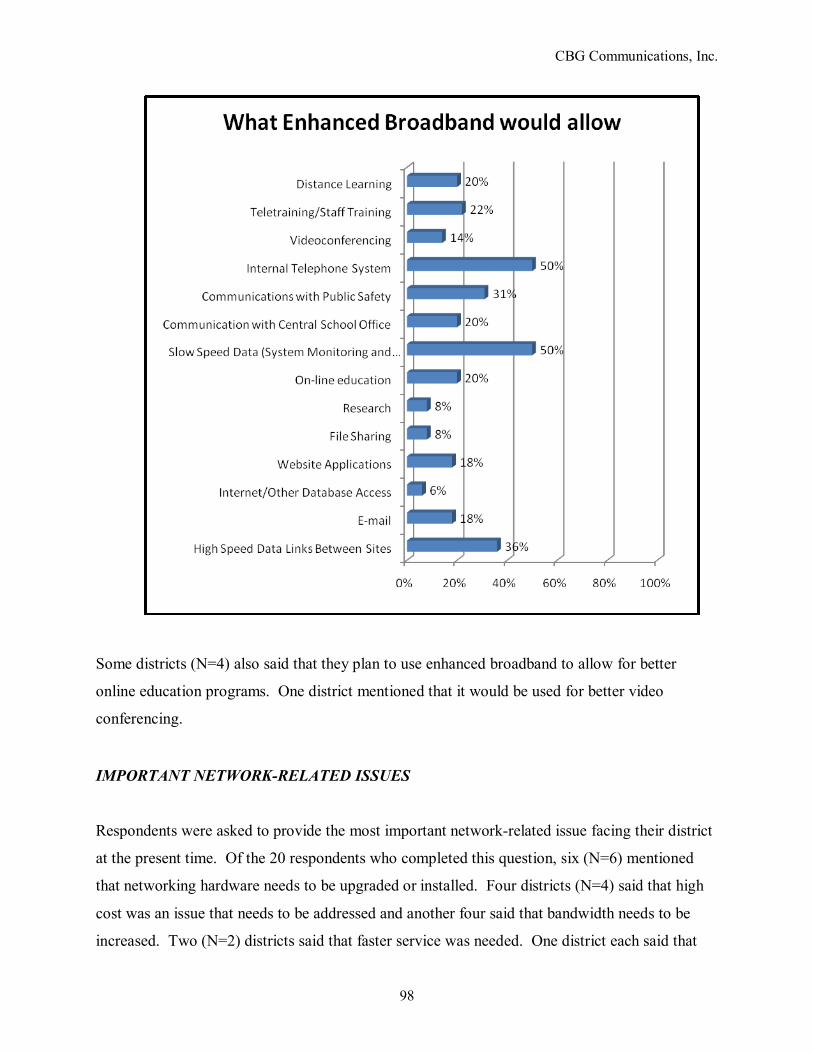
CBG Communications, Inc.
98
Some districts (N=4) also said that they plan to use enhanced broadband to allow for better
online education programs. One district mentioned that it would be used for better video
conferencing.
IMPORTANT NETWORK-RELATED ISSUES
Respondents were asked to provide the most important network-related issue facing their district
at the present time. Of the 20 respondents who completed this question, six (N=6) mentioned
that networking hardware needs to be upgraded or installed. Four districts (N=4) said that high
cost was an issue that needs to be addressed and another four said that bandwidth needs to be
increased. Two (N=2) districts said that faster service was needed. One district each said that
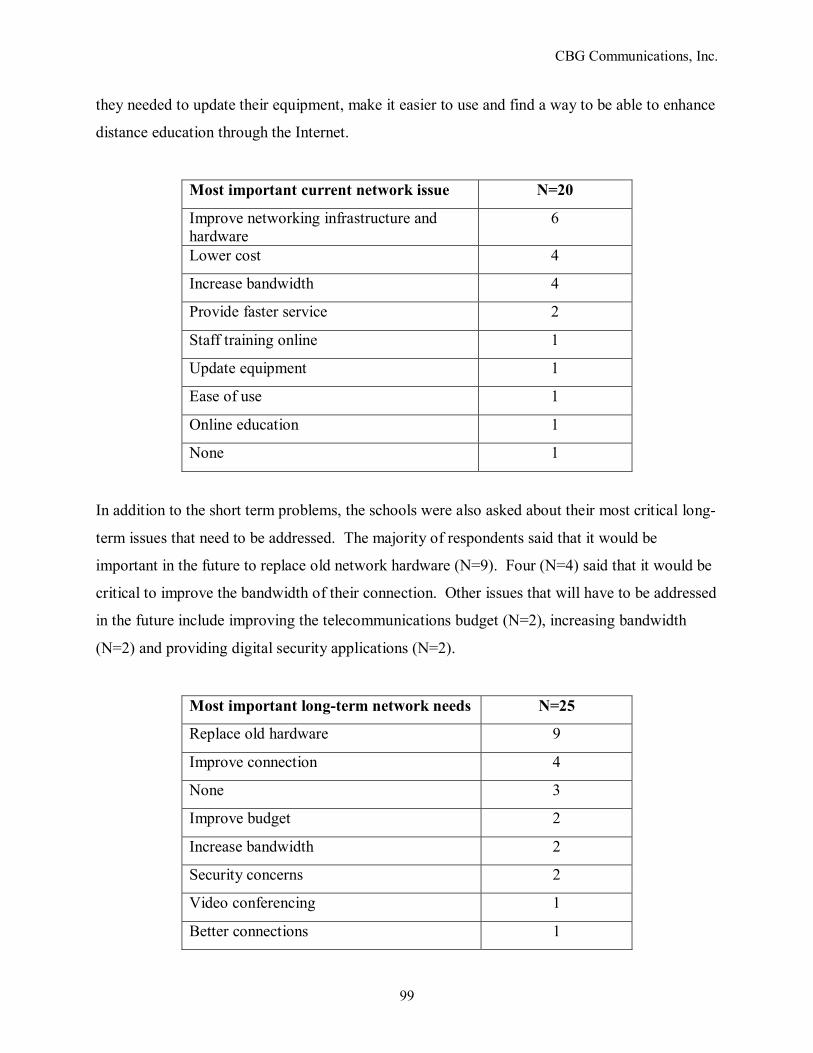
CBG Communications, Inc.
99
they needed to update their equipment, make it easier to use and find a way to be able to enhance
distance education through the Internet.
Most important current network issue N=20
Improve networking infrastructure and hardware
6
Lower cost 4
Increase bandwidth 4
Provide faster service 2
Staff training online 1
Update equipment 1
Ease of use 1
Online education 1
None 1
In addition to the short term problems, the schools were also asked about their most critical long-
term issues that need to be addressed. The majority of respondents said that it would be
important in the future to replace old network hardware (N=9). Four (N=4) said that it would be
critical to improve the bandwidth of their connection. Other issues that will have to be addressed
in the future include improving the telecommunications budget (N=2), increasing bandwidth
(N=2) and providing digital security applications (N=2).
Most important long-term network needs N=25
Replace old hardware 9
Improve connection 4
None 3
Improve budget 2
Increase bandwidth 2
Security concerns 2
Video conferencing 1
Better connections 1
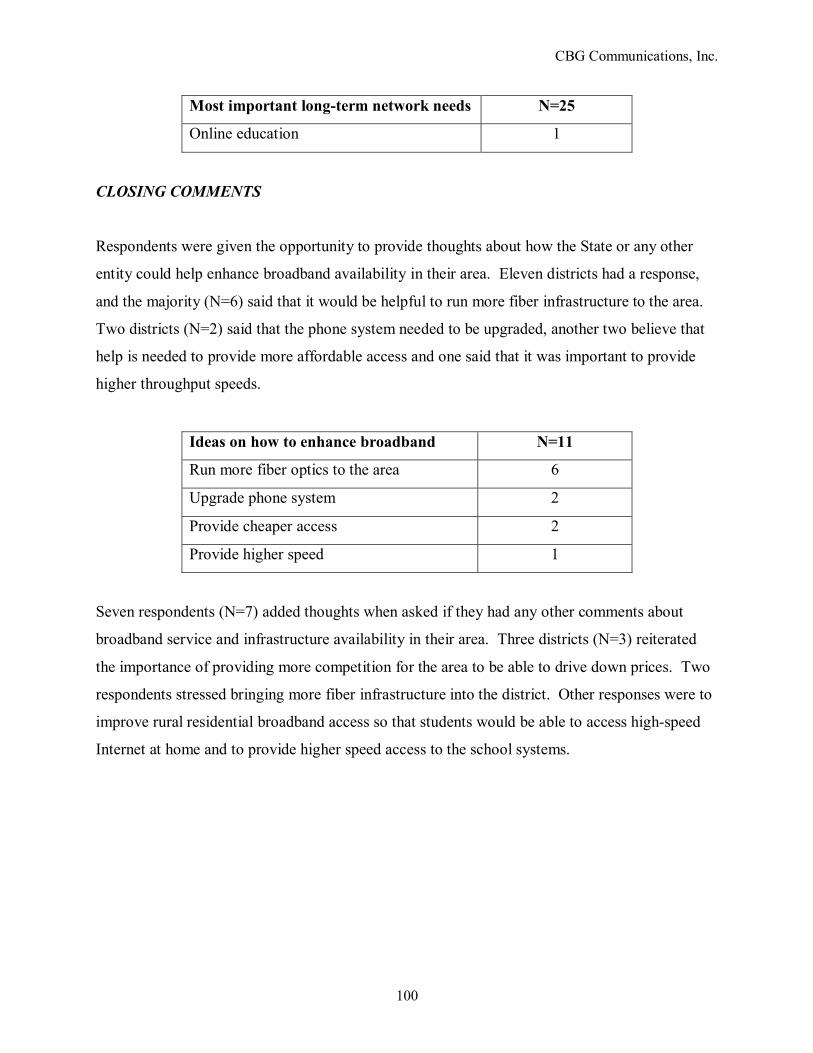
CBG Communications, Inc.
100
Most important long-term network needs N=25
Online education 1
CLOSING COMMENTS
Respondents were given the opportunity to provide thoughts about how the State or any other
entity could help enhance broadband availability in their area. Eleven districts had a response,
and the majority (N=6) said that it would be helpful to run more fiber infrastructure to the area.
Two districts (N=2) said that the phone system needed to be upgraded, another two believe that
help is needed to provide more affordable access and one said that it was important to provide
higher throughput speeds.
Ideas on how to enhance broadband N=11
Run more fiber optics to the area 6
Upgrade phone system 2
Provide cheaper access 2
Provide higher speed 1
Seven respondents (N=7) added thoughts when asked if they had any other comments about
broadband service and infrastructure availability in their area. Three districts (N=3) reiterated
the importance of providing more competition for the area to be able to drive down prices. Two
respondents stressed bringing more fiber infrastructure into the district. Other responses were to
improve rural residential broadband access so that students would be able to access high-speed
Internet at home and to provide higher speed access to the school systems.

CBG Communications, Inc.
101
Key Findings from the Educational Survey Across All Five Counties The following are key findings concerning broadband network availability and use among
educational organizations in the five studied counties:
• Washington�s K-20 Education Network is providing a valuable resource to schools
within the five rural counties. It was described by the majority of the districts as their
primary Internet connectivity point.
• Community colleges and affiliated regional sites for major universities in the State that
reside in the studied counties have established T-1 lines to provide between 1.5 and 6
Mbps of bandwidth capacity.
• The primary uses of school district networks are to access e-mail and the Internet.
• Seventy-seven percent (77%) of school districts use their network to conduct research
and 59% use their network connection for video applications. These are most often
associated with distance learning initiatives.
• Online education activities were reported by 3 of 4 school districts in the five counties.
• A majority of the schools supplement the K-20 Network with their own intra-district
networks. One in four have built their own network, 28% use DSL connections, 16% use
cable modem service, 13% use satellite broadband and 13% use dial-up.
• Schools pay from $2,000 to $118,000 annually for telecommunications services and
infrastructure support. Most of the districts� service contracts are for three or more years.
• A high level of satisfaction exists with the reliability of the K-20 Network.
• School technology officers expressed the most dissatisfaction concerning the number of
companies to choose from when looking for a telecommunications service provider. One
in four was dissatisfied.
CBG Communications, Inc.
102
• Several educational applications were described as needing greater bandwidth by more
than half of responding school districts. These applications included delivering web-
based interactive courses, full motion video, Geographic Information Systems and
capacity for additional network users.
• New applications desired, if more bandwidth were available, include internal telephone
systems, data monitoring and control circuits and public safety applications like
surveillance cameras.
• A robust broadband environment was described as very important or important by 87%
of all educational respondents.
• When describing the �most important� network issue currently facing educational
organizations, most described the need to upgrade their network to greater bandwidth
capacity and the need for new networking hardware. Several school districts also
indicated the need for additional funding to support broadband deployment efforts.
CBG Communications, Inc.
103
Section E Review of Library
Communities of Interest
CBG Communications, Inc.
104
REVIEW OF LIBRARY COMMUNITIES OF INTEREST
LIBRARY COMMUNITY BROADBAND SURVEY
Introduction
The four library districts that serve the five counties were surveyed to determine how the districts
currently use broadband network infrastructure and services and what impact broadband has on
the operations of the district within the respective counties. The survey also sought information
on the provision of certain library services enabled by their broadband connectivity, such as
public access to the Internet.
Key Findings
The following are the key findings from the survey across all four library districts related to
broadband availability for, and use by, the districts:
• All of the districts provide public access to the Internet, and the utilization of that
access is very high for all of the districts.
• The districts indicate that their current broadband service climate is either
somewhat competitive or not competitive at all.
• All of the districts indicate that their current networks or services are unable to
meet their current or projected application demands. Most need faster/greater
data throughput between locations. All of the districts indicate that a robust
broadband connection is very important to their day-to-day library operations.
• Three of the four districts indicate that it would be beneficial for their broadband
environment to be enhanced. Enhanced network infrastructure and services
would be used to expand existing capacity and add new services such as video
conferencing and downloadable books.
CBG Communications, Inc.
105
• The number of applications for telecommunications/broadband networks/services
varies with the nature of the library district, with the least rural having the most
applications.
• The above also correlates with the type and speed of broadband connections that
are available to the districts, with the least rural having 10/100 Mbps fiber optic
connections and the most rural having a 384 Kbps cable modem connection.
• The library districts indicate that they use the best connection available in the area
for the applications they utilize. For the Stevens County Rural Library District,
for example, this equates to everything from a dial-up line to a 6 Mbps cable
modem connection, depending on the area that the branch library is in.
District Profiles
Because of their importance in providing high-speed access to the Internet to those that do not
have such access at home, we have profiled each library district individually below:
THE TIMBERLAND REGIONAL LIBRARY
The Timberland Regional Library (TRL) serves Grays Harbor and Lewis Counties as well as
surrounding areas. Within the two counties it has branches in Aberdeen, Centralia, Chehalis,
Elma, Hoquiam, McCleary, Montesano, Oakville, Packwood, Randle, Salkum, Westport and
Winlock.
TRL uses broadband networks and services for nearly every application surveyed, except for
video conferencing and slow speed data. Specifically, it uses its networks� services for
everything from high-speed data links between sites, such as from branches to the central library
office, to Internet and other database access, online education, distance learning, teletraining,
voice communications and other applications.
CBG Communications, Inc.
106
TRL�s network is based on T-1s and 10 Mbps and 100 Mbps fiber optic connections. Qwest is
TRL�s primary network/service provider and the K-20 Network provides Internet access.
TRL indicates that it is satisfied with its service rates and the number of companies to choose
from when looking for a provider, and it is very satisfied with other characteristics of service,
such as reliability and ease of use.
Regarding public access to the Internet, TRL rates utilization of such access as very high, with
the libraries in Grays Harbor and Lewis County combining to account for over one-third of the
674,341 total public Internet sessions in 2007 across the five county library system.
TRL indicates that its current network or services are too slow to meet current or projected
application demands. Specifically, this assessment revolves around the need for higher speeds of
connection to provide greater throughput between locations and to enable the use of full motion
video.
TRL rates robust broadband connections for its day to day library operations as very important.
This level of importance stems in part from the fact that its public Internet access is used in
remote areas where there is no affordable high-speed access at home or no high-speed access
options at all. Additionally, TRL notes that as web applications increase, its bandwidth
requirements will require upgraded connections. It also notes that its network includes a
significant number of central systems which require reliable connectivity between the 27
libraries in the system and the TRL Administrative Services Center.
TRL believes that the current broadband marketplace for the district is only somewhat
competitive and that it would be beneficial for the broadband environment to be enhanced. TRL
notes that it would be significantly beneficial if the cost of broadband services were reduced.
Specifically, it will need to upgrade its network capacity, but additional T-1s or 10 Mbps
Ethernet connections needed are either too costly or Ethernet connections are not available in the
required locations.
CBG Communications, Inc.
107
If enhanced broadband network infrastructure and services were available to TRL, it would
continue to use and expand existing services and augment them with video conferencing and
system monitoring and control data communications.
NORTH CENTRAL REGIONAL LIBRARY
The North Central Regional Library (NCRL) serves Ferry, Chelan, Douglas, Grant and
Okanogan Counties and the incorporated cities and towns which are either annexed to, or
contracting for service from, the library district. The only NCRL branch in Ferry County is the
Republic Community Library (RCL).
The Republic Community Library uses its current broadband connection for e-mail, Internet and
other database access, research and communication with the NCRL Central Office in Wenatchee.
The broadband connection used is provided by the cable company in Republic (the TV
Association of Republic � TVAR). NCRL listed the speed of the cable modem service as
unknown, but the service rate paid ($50.50 per month) would be equivalent to a symmetrical 384
Kbps connection.
While RCL indicated that it is generally satisfied with its broadband service rates, billing and
ease of use and very satisfied with the customer service representatives� (CSRs) knowledge and
the installation technicians� ability, it indicated that it is very dissatisfied with the number of
companies to choose from when looking for a provider and dissatisfied with the reliability of its
broadband service. NCRL�s Republic Community Library is currently not connected to the K-20
Network.
The Republic Community Library provides public access to the Internet and rates its utilization
as very high. The Republic Library has three Internet terminals for access to the system.
NCRL indicates that current broadband services are too slow to meet current or projected
application demands; specifically faster/greater data throughput between locations (at a related
CBG Communications, Inc.
108
focus group, the library representative indicated that the Republic Community Library has the
slowest connection speed of all NCRL branches).
Regarding reliability, the Republic Community Library notes a significant number of dropped
connections which cause the staff to continually reboot the Horizon database used by the NCRL
libraries.
NCRL cites a robust broadband connection as very important to its day to day library operations,
especially related to the ability for the community to do research and to better enable the
circulation of library material.
The Republic Community Library notes that the broadband marketplace in Republic is not
competitive at all with only one provider option. Accordingly, RCL believes it would be
beneficial to enhance the broadband environment in Republic and in Ferry County overall.
Specifically, the library would use an enhanced network for higher speed data communications
than it currently can access or provide, e-mail, the Internet, file sharing, research and
communications with the central library office. In the longer term, it would look at facilitating
an internal telephone system as well as engaging in teletraining using higher speed connections.
NCRL notes that its most critical current and long-term network related issue is developing and
maintaining appropriate database connections between branches and the main library.
STEVENS COUNTY RURAL LIBRARY DISTRICT
The Stevens County Rural Library District (SCRLD) serves all of Stevens County with a main
location in Loon Lakes and partnerships with the Chewelah, Colville and Kettle Falls Public
Libraries. SCRLD indicates that it currently uses its telecommunications/broadband network
services for high-speed data links between sites, e-mail, Internet and other database access, web
site applications, research, online education, communication between branches and the central
library office, teletraining and distance learning.
CBG Communications, Inc.
109
SCRLD uses a variety of types of connections for its library network including a dial-up line at
its Onion Creek location, 768 Kbps DSL, a 6 Mbps cable modem connection, T-1s, satellite
broadband at 1.5 Mbps and a fixed wireless connection at 1.5 Mbps (at a related focus group, the
SCRLD Administrator indicated that it uses the best available broadband connection at each
library location). Similarly, SCRLD uses a variety of providers including Comcast, wireless
providers Eltopia, Internet Xpress and Wild Blue, and the Washington K-20 Network.
SCRLD lists its primary network/service provider as the Washington K-20 Network. It indicates
that it is very satisfied with all aspects of the services provided by the K-20 Network. SCRLD
notes that it receives its Internet service from the K-20 Network and that the Network helps
facilitate access to its web server and data server. It also notes that the Library of the Lakes and
the Colville Public Library are connected via point-to-point T-1s provided by Qwest.
SCRLD provides public access to the Internet and indicates that utilization by the public is very
high. The district provides both computers for the public to use as well as wireless hotspots that
patrons can access with their own laptops.
SCRLD notes that its current network/services are too slow to meet current or projected
application demands. Specifically, it needs higher speeds for faster/greater data throughput
between locations.
SCRLD indicates that it is very important to its day to day library operations to have a robust
broadband connection. Specifically, it states that the public has come to expect high-speed
connections and that its circulation service requires broadband in order to give timely services.
SCRLD notes that the broadband environment for the district in Stevens County is only
somewhat competitive with a handful of options.
SCRLD indicates that its most current network related issue is that the public wants streaming
media, which requires more bandwidth than it currently has available. Long-term, SCRLD notes
that it will continue to need �more bandwidth�.
CBG Communications, Inc.
110
COLUMBIA COUNTY RURAL LIBRARY DISTRICT
The Columbia County Rural Library District (CCRLD) has one facility, the Dayton Memorial
Library, that serves the City of Dayton and the surrounding area in Columbia County. CCRLD
uses its current broadband connection for Internet and other database access, website
applications, file sharing, research, online education, and teletraining. This connection is
provided by cable modem service with a transfer rate of 1 Mbps downstream and 512 Kbps
upstream. The cable company, Touchet Valley Television, provides the cable modem service
free of charge. CCRLD does not use the State�s K-20 Network.
CCRLD notes that it provides public access to the Internet and rates utilization as very high. It
provides four computers for accessing the Internet, plus a free Wi-Fi service for those with
laptops.
It notes that its current network or services are too slow to meet its current or projected
application demands and indicates that its most significant need is for more Internet computers
(which would, though, then place a higher demand on the current connection).
CCRLD also indicates that its current video, voice and data systems are not reliable. Specifically,
it indicates that it needs microphones and other equipment for staff to adequately participate in
online interactive seminars.
CCRLD indicates that it is very important to the library�s day to day operations to have a robust
broadband connection. Specifically, it notes that many in the Columbia community are low
income residents and have no other type of Internet service. The library also offers computer
classes and provides access to distance learning. CCRLD also believes that the broadband
connection is very important to the maintenance of the library�s website.
CCRLD notes that the broadband environment in Dayton is only somewhat competitive with a
handful of options. Accordingly, the library believes that it would be beneficial if the broadband
CBG Communications, Inc.
111
environment in Dayton was enhanced. Specifically, it indicates that if more people had access to
higher connection speeds at home, the library could consider the provision of services requiring
high bandwidth, such as downloadable books, video and other services. CCRLD notes that most
people only have dial-up connections and consequently use the library for high-speed Internet
access.
In the short-term, CCRLD would use an enhanced broadband network to enable greater use of
the same applications that it currently uses, as well as for system monitoring and control data
communications. In the long-term, it would add high-speed data links to facilitate connection to
future additional branches (which would require remote connections to a central server) and add
video conferencing (it notes that no one in Dayton has this service at this time and it would be
beneficial to work with the Community College in Walla Walla to provide college classes to
those in Dayton. CCRLD notes that its staff would also take advantage of this type of video
teletraining.).
CCRLD notes that its most important network related issue at this time is providing additional
computers for public use. In the long-term, it needs to access high-speed data links and establish
additional branches throughout Columbia County.
CCRLD noted that the state could work, similar to its facilitation of the K-20 Network, to have
phone companies and power companies provide fiber optic connectivity in rural locations such
as Columbia County. CCRLD noted that because of the topography, satellite and other wireless
systems often provide unreliable and inconsistent service in Columbia County.
CBG Communications, Inc.
112
Section F Review of Local Government
and Tribal Nations Communities of Interest
CBG Communications, Inc.
113
REVIEW OF LOCAL GOVERNMENT AND TRIBAL NATIONS�
BROADBAND NEEDS AND INTERESTS
GOVERNMENT BROADBAND NETWORK SURVEY
Introduction
In additional to the information received concerning the availability and use of broadband
networks and services to and by local governments through in-depth interviews and focused
discussion sessions, an extensive outreach effort was made to obtain formal survey responses
from all of the counties under study and the incorporated municipalities within their boundaries.
Specifically, this survey was focused on the broadband data network usage, needs and interests
of local governments. It was designed to gain a better understanding of each jurisdiction�s
utilization of infrastructure and services and how such utilization lends itself to the provision of
government services, including each local government�s perception of the impact that broadband
has on their operations.
In all, 32 local governments were requested to complete surveys. Of this number all five (5)
counties and 19 of their incorporated municipalities responded.
Detailed information from the government respondents can be found in Attachment 5, Local
Government Broadband Data Network Survey Mark-up. The key findings from this survey
effort are described below:
Findings
Typically, staff from the Information Services or IT Department, but also City Administrators,
elected officials such as Mayors, Planners, Financial staff and City Clerks, especially for the
smaller jurisdictions, responded to the survey for their respective local governments.
CBG Communications, Inc.
114
The responding local governments ranged in size from small cities with as little as one full-time
and one part-time employee to the larger counties with approximately 500 employees.
The number of locations varied from one (1) for the smaller towns (i.e., no satellite or field
offices) to multiple facilities in multiple locations for the larger counties.
One hundred percent (100%) of those responding to the survey question on network applications
use their networks and services for e-mail, with nearly 100% utilizing them for Internet and other
database access. From there, the next largest applications were research (65%), website
applications (57%) and online education and file sharing (both at 39%). The smallest use, at 9%,
was system monitoring and control data.
Regarding the type of network connections used, the largest number of responding local
governments (57%) used DSL connections and the next largest group (35%) utilized fiber optic
links. A variety of other services from cable modem to T-1s to mobile wireless services were
also used, including dial-up lines used by 26% of responding local governments. The smallest
number of respondents (9%) use ISDN.
The speeds of connection vary significantly from 28 Kbps for dial-up lines used by the Town of
Marcus to 1 Gbps connections over fiber optics used by three of the five counties (Stevens
County, Lewis County and Grays Harbor County).
The largest number of responding local governments primarily contract with various
telecommunications service providers (52% of respondents). Nineteen percent (19%) have their
own network (primarily counties) while 38% also contract with the cable company. Some local
governments, such as Lewis County, also use services provided by the PUD.
The amount paid for services varies significantly from $15 a month for dial-up connections used
by the City of Vader to $850 a month for a T-1 connection to Davenport for Stevens County.
CBG Communications, Inc.
115
A significant number of local governments have one and two year contracts for broadband
network services. When asked to designate their primary service provider, only 25% of
responding local governments indicated the local exchange carrier for their area. Most indicated
either alternate carriers or the cable company.
Local governments responding to the survey were generally satisfied with their primary contract-
provided networks/services. The biggest area of dissatisfaction was related to the number of
companies to choose from when looking for a provider.
Five (5) of the responding local governments indicated that they were connected to the IGN; all
of these five were the counties under study.
Twenty-one percent (21%) of responding local governments indicated that their services are too
slow or are unable to meet their current and projected application demands. Of these, the
majority, 67%, indicated that the applications that need higher speeds are faster/greater data
throughput between locations and capacity for additional users.
Approximately the same number (24%) indicated that their current networks and systems were
not reliable. When asked to provide supporting detail, Ferry County, for instance, indicated that
there is no redundancy for their voice or data lines, so when the network backbone is down, they
have no service. Stevens County indicated the same concern, citing that �most of our sites are
single point connections with no redundant paths available�. The majority of the responding
local governments (55%) said that a robust broadband connection is very important to their day-
to-day government operations, with an additional 15% indicating �important� and 25%
indicating �somewhat important�. When asked to describe why broadband connections were
important to them, local governments stated a variety of reasons, most centered around
facilitation of e-government functions, day-to-day operations, critical public safety data
communications and economic development.
No local government believed that their broadband service and infrastructure climate was
�competitive�. Twenty-six percent (26%) felt that it was somewhat competitive, 32 % felt that it
CBG Communications, Inc.
116
was only slightly competitive and the largest number of respondents (37%) indicated that the
climate was not competitive at all.
In line with this, the vast majority of local governments (83%) indicated that it would be
beneficial if the broadband environment in their area was enhanced. Respondents cited a range
of benefits, many related to higher speed connections, greater redundancy and reliability, more
service options and competitive costs, and bringing service to remote locations. If an enhanced
broadband network was developed in their jurisdiction, the most often cited need that would be
fulfilled was enhanced public safety communications, with high-speed data links, internal
telephone systems and video conferencing the next longer term needs that would be satisfied.
The most important network related issues facing local governments at this time included
problems with broadband coverage, lack of fiber connectivity, affordability issues, secure remote
connectivity, single points of failure, having only dial-up in smaller jurisdictions and a lack of
up-to-date technology. The most critical long-term network related needs echoed the short-term
needs, but also included other issues such as the need to enable mobility of system users and the
ability to work quickly and smoothly with other government agencies.
Regarding thoughts about how the State or any other entity could help enhance broadband
availability in their jurisdiction, local governments indicated that grants or some other form of
support funding would be helpful, as well as the provision of State resources to help meet the
data interactivity requirements placed on them by State offices and encouragement of more
providers to offer services within their area. Additionally, local governments indicated in final,
open-ended comments that having a greater variety of service providers and getting local
telecommunications companies to expand their current capabilities in rural areas were critical.
Key Findings The following are key findings among local governments in the five studied Washington
counties that responded to the survey, concerning broadband network availability and use:
CBG Communications, Inc.
117
• Eighty-three percent (83%) of local governments indicate that it would beneficial
if the broadband environment in their area was enhanced. Most would use an
enhanced broadband network for higher speed connections, greater redundancy
and reliability, bringing service to remote locations, enhancing public safety
communications and adding services such as video conferencing.
• Fifty-five percent (55%) of responding local governments said that a robust
broadband connection is very important to their day-to-day government
operations, with an additional 15% indicating that it is �important� and 25%
indicating �somewhat important�.
• The vast majority of local governments believe that their current broadband
service climate lacks competition, with the largest response (37%) indicating that
the climate is not competitive at all and an additional 32% indicating that it is
only slightly competitive.
• Twenty-one point one percent (21%) of responding local governments indicate
that their networks or services are unable to meet current or projected application
demands. The greatest needs are higher speed connections for faster/greater data
throughput between locations and capacity for additional users.
• Many types of network connections are used by local governments with the
highest amount being DSL connections (57%), and the next largest being fiber
optic lines (35%).
• The speed of connection varies significantly from 28 Kbps for dial-up lines to 1
Gbps for fiber optic connections (used by three of the five counties).
• The highest applications for telecommunications/broadband network/services are
e-mail (100%), Internet and other database access (96%) and research (65%).
CBG Communications, Inc.
118
TRIBAL NATION BROADBAND NETWORK SURVEY
Introduction
Four tribal nations that are within the geographic area of the five counties under study were
surveyed. This included the Quinault Indian Tribe in Grays Harbor County, the Chehalis
Confederated Tribes in Grays Harbor County, the Colville Confederated Tribes in Ferry County
and the Spokane Tribe in Stevens County.45
Key Findings
The following are key findings related to broadband network availability and use among Tribal
Nations surveyed within the geographic area of the five studied Washington counties:
• The responding Tribal Nations indicated that it would be beneficial if the
broadband environment in their area was enhanced. An enhanced broadband
network would be used to improve network stability, bring broadband throughout
the whole reservation, reduce cost through more competition and add additional
services such as video on demand.
• The importance of a robust broadband connection to the day-to-day operations of
the Tribal Nations varied from very important to important.
• Two of the Tribal Nations surveyed indicated that their networks and services
were too slow to meet current or projected application demands. Common
applications that need higher speeds include faster/greater data throughput
between locations and the use of GIS (Geographic Information Systems) data
transfer.
45 A number of communications (both telephone and e-mail) concerning the Broadband Study were initiated with the Spokane Indian Tribe (within the geographic area of Stevens County), including offers to meet in-person. At the time of the Report, the Spokane Indian Tribe had not yet responded to our requests for information.
CBG Communications, Inc.
119
• The responding Tribal Nations all have fiber optic backbones between their core
facilities. Other network connections included dial-up lines, mobile wireless,
fixed wireless, T-1s, satellite broadband, DSL, cable modem and other
connections. These have been chosen based on the best available connection for
the application to the Tribes� satellite or remote office locations.
• Responding Tribal Nations use their telecommunications/broadband
network/services for a variety of applications. The most common applications
were e-mail, Internet and other database access, file sharing, intergovernmental
functions, communications with public safety and internal telephone systems.
Tribal Nation Profiles
Because of their unique position as sovereign nations within the boundaries of the five counties
under study who also interact with state and local government agencies concerning network
applications and services, we have profiled each tribal nation individually below.
THE QUINAULT INDIAN NATION
A survey response was provided by the IT Manager of the Quinault Indian Nation. A follow-on
interview was also done to obtain additional information. The Quinault Indians have a variety of
satellite and field offices including Queets Village, the Tsa�Alal field office (Lake Quinault), the
Aberdeen TANF (Temporary Assistance for Needy Families) Office and offices at Salmon River
and Mercer Island. These offices are connected together or through the Internet by a variety of
services (listed below).
The Quinault Indians use their broadband networks and services for Internet and other database
access, e-mail, file sharing, research, intergovernmental functions, public safety
communications, their internal telephone system and a variety of video applications including
video conferencing, teletraining and distance learning.
CBG Communications, Inc.
120
As indicated above, they have a variety of broadband connections, including 1.5 Mbps DSL, T-
1s, 1.5 Mbps satellite service, 802.11 g wireless communications and 10/100 Mbps fiber optic
communications in a campus architecture in Taholah (they will be upgrading this fiber optic
network to a 1 Gbps backbone).
The Quinault Indians note that they are in the process of replacing DSL service with two bonded
T-1s for Internet access (3 Mbps in total connection speed) and installation of a point-to-point T-
1 (1.5 Mbps) from their central network in Taholah to Queets Village.
The Quinault Indians have deployed their own fiber optic connections. The other landline
connections are provided by CenturyTel. CenturyTel is also their ISP. Their contracted circuits
have a three year term, including the bonded T-1s at $850 per month and the point-to-point T-1
at $185 per month. DSL connections are approximately $50 each. Their satellite service is
provided by Starband.
The Quinault Indians indicate that they are largely dissatisfied with their current contracted
network services concerning service rates, reliability, ease of use, CSR knowledge and the
number of companies to choose from when they are looking for a provider. They are however
satisfied with the billing practices and the installation technician�s ability. Some of this
dissatisfaction comes from slow response time from their provider.
The Quinault Indians indicate that current networks and services are too slow to meet their
current and projected application demands. Specifically, they need higher speeds for
faster/greater throughput between locations and the transport of GIS information. It is also
important to them that these links be more secure than current connections, have greater stability
and also have some level of redundancy. Related to this, they indicate that they do have some
interruptions on their network.
CBG Communications, Inc.
121
The Quinault Indians indicate that it is important for them to have a robust broadband
connection, because many of their day-to-day and critical processes (both internal to the Tribe
and external communications) are greatly dependent upon their network and the Internet.
The Quinault Indians state that they are very interested in having more options for services,
indicating that their current broadband environment is not competitive at all with only one
provider option.
They indicate that it would be beneficial if the broadband environment in their area was
enhanced. They also indicate a number of different types of broadband-related needs in the
future, mostly centering on enhancement of existing applications. This includes for example,
building on their current use of video conferencing (which is used now for the University of
Washington Cancer Program and other training) and distance learning, which is used by many of
the Quinault Indians for working toward their advanced degrees.
Their most critical short-term and long-term network related issue is obtaining adequate
bandwidth that is stable at a reasonable cost. Additionally, the Quinault Indians would like to
have the Washington K-20 Network provide 10 Mbps or higher services to the Taholah School
so that the Tribal schools would have the same benefits as all of the other school districts in the
State.
THE CHEHALIS CONFEDERATED TRIBAL NATION
An interview was held with the IT Director for the Chehalis Confederated Tribal Nation on May
16, 2008 at the Tribal Headquarters near Oakville. At the time of this Report, the Chehalis Tribe
had not yet filed their written survey.
The Chehalis Confederated Tribal Nation indicated that there are a number of facilities at the
main Tribal Center campus location connected via a 10 Gigabit backbone ring. With this
capability, they are able to provide gigabit to the desk top. Facilities connected included the
Tribal Center, the Family Resources Center, Family Services, the Elder Center, Head Start, the
CBG Communications, Inc.
122
Youth Center and the Natural Resources location which also houses DNR. There are additional
T-1 connections to the Clinic and the core/public safety location.
Qwest is the provider of the T-1 services, but provides no DSL on the reservation. Comcast
provides broadband services to the Hotel and Casino through cable modem communications.
The company also provides cable modem connections on the reservation but not to all homes.
They are also connected to the Washington K-20 Network through multiple T-1s which enable
connections to the Indian Health Service (IHS) for medical video conferencing with consulting
physicians. The K-20 Network also enables connections from higher educational institutions to
Head Start and other Tribal educational programs including GED certification.
Their network connections are used for a variety of applications including voice over IP, Internet
access and other database access. The Chehalis Tribe also operates some wireless
communications for public safety and other connectivity purposes. They are considering broad
implementation of wireless broadband so that the whole Tribe is connected to broadband
communications, but must consider the cost/benefit relationship (approximately $600,000 in
funding will be needed to develop wireless broadband that would blanket the reservation).
The IT Director indicates that medical and educational issues will drive the need for higher
bandwidth over time, including the need for more advanced telemedicine applications as well as
video-on-demand and public safety emergency response applications. In that vein, redundant
circuits for all their backbone connections would be extremely beneficial. Overall, it is of prime
importance for their network to continually stay up and running.
THE COLVILLE CONFEDERATED TRIBES
The Colville Confederated Tribes are based in Nespelem but serve a large reservation area that
stretches through Ferry and Okanogan counties. The tribal nations survey was completed by the
Project Manager who works on telecommunications issues.
CBG Communications, Inc.
123
Their current network facilitates a host of applications including every one surveyed except for
video conferencing (essentially this means that the Tribe uses every application from high-speed
data and Internet access to an internal telephone system and distance learning). The Colville
Confederated Tribes use a variety of connections in order to enable their network operations,
including dial-up lines, T-1s, fiber optic links (operating at speeds of 100 Mbps to 1 Gbps), fixed
wireless at 11-54 Mbps and 256 Kbps mobile wireless (cellular aircard) data communications.
The Colville Confederated Tribes not only have their own network but also contract with Qwest.
They indicate that they are very satisfied with Qwest�s reliability, ease of use, CSR knowledge
and installation technicians� ability. The Colville Confederated Tribes also use the IGN.
They are concerned that their current network and services are too slow to meet their current and
projected application demands, including GIS, faster/greater data throughput between locations,
full motion video, capacity for additional users and Voice over IP communications.
They indicate that their current data, voice and video systems are reliable and that it is very
important for the Tribe to have a robust broadband connection for their day-to-day operations.
This includes medical, financial, legal and research and development applications.
The Colville Confederated Tribes note that their current broadband environment is somewhat
competitive with a handful of options and that it would be beneficial for their environment to be
enhanced. Specifically, they need higher speeds for enhanced services and more competitors to
foster better pricing. This would allow them to continue to enhance all of their current
applications as well as add video conferencing.
Their most critical short-term and long-term needs are having the best network availability,
reliability, security and speed available to them for their operations.
CBG Communications, Inc.
124
Section G Review of Broadband
Providers, Technologies, Infrastructure, Services and
Costs
CBG Communications, Inc.
125
BROADBAND PROVIDERS, TECHNOLOGIES,
INFRASTRUCTURE, SERVICES AND COST
REVIEW AND ANALYSIS
Introduction The ability of any provider to offer broadband services will be based on the technology used and
the infrastructure available to deploy that technology. We have profiled below the types of
technologies commonly used and the services available in each of the five counties. The current
level of infrastructure available to provide broadband services varies widely among the five
counties, but in all cases there are gaps apparent between infrastructure and services currently
needed and what is currently available.
CBG applied a variety of methods to achieve the goals of the study in determining where
broadband is currently available to residents and businesses in each of the five counties. In
practice we found that no single method produced adequate results.
Our first method of collecting data involved researching potential broadband providers in the
State who would be asked to participate in the Study based on their service areas. We then sent a
survey to each identified potential broadband provider in the State believed to provide service in
one or more of the counties. We developed the Broadband Provider Survey to gather
information related to: areas within each county currently served by the provider, wireless or
wireline technology infrastructure, levels of service or bandwidth provided and the
corresponding cost for each. CBG also asked the providers to provide maps showing in some
detail where they offer each service level. If the provider deemed this information as proprietary
or confidential, they were asked to suggest a procedure whereby the maps could be accessed or
viewed by CBG at the company�s location.
We further asked the providers to describe any planned deployment of broadband services in the
five counties within the next two or more years. The survey then asked what obstacles stand in
CBG Communications, Inc.
126
the way of further deployment of broadband services by the company. The results of these
surveys are summarized below and in the Attachments.
In order to supplement the surveys or gain information where surveys or survey sections were
not completed by providers, we conducted in-person and telephone interviews. In some cases we
received a call or e-mail stating that the company does not currently provide services in the five
counties included in this Study. In other cases, providers informed CBG that some or all of the
information is considered confidential or proprietary and therefore could not be provided in the
context of this public effort.46
After finding that many of the providers were not likely to define the nature and extent of
services provided within their service areas, we performed a drive out of the five counties to
determine approximate service areas for each provider. We drove out the main highways, routes
and roads within each of the counties as well as numerous city streets, secondary county roads
and other less traveled roads leading to less inhabited areas of the counties. This process helped
to fill in the information not released by many of the companies surveyed or interviewed.
Finally, we conducted focus groups and interviews throughout the Study area and gathered
additional information providing more insight into broadband availability to the residents of the
five counties. Notes and conclusions from these focus groups are detailed in Attachment 9 to
this Report.
DEFINITION OF BROADBAND
There are numerous technological methods for connecting to the Internet. Several common ones
are further discussed below with their respective bandwidths or speeds. Broadband is commonly
and broadly defined as high-speed connectivity to a network and therefore the Internet. In March
of 2008, the FCC further defined broadband by distinguishing several classes of broadband
service. First generation broadband continues to be defined as 200 Kbps. From there, the FCC
has defined seven tiers of broadband service up to the highest tier of 100 Mbps or more. The
United States Department of Agriculture - Rural Utilities Service (RUS), which provides federal 46 For sample responses, please see Attachment 7 to this report.
CBG Communications, Inc.
127
loan assistance to telecommunications carriers deploying broadband services, requires loan
recipients to offer a minimum of 200 Kbps both upstream and downstream.47 The stakeholders
that were consulted during the design of the survey suggested that 1.5 Mbps downstream and
upstream was seen by many as constituting broadband service. Because of varying definitions
and the limited availability of broadband services in the five counties studied, CBG has reviewed
and reports herein on various levels of broadband service offerings and capabilities.
TECHNOLOGIES AND SERVICES Dial-up
Although dial up connectivity to the Internet is not a broadband service, a significant number of
residents in the five counties are accessing the Internet via a dial-up service. Dial-up uses a
standard phone line going to a residence or business to connect the user�s computer via modem
to a specific Internet Service Provider (ISP). Dial up service is limited to 56 Kbps by the
technology behind the standard phone line - meaning that a larger document or file will take a
substantial amount of time to download or upload as compared with more contemporary
broadband facilities.
Although dial-up service is referred to as 56 Kbps, it will in many cases provide a real-world
service level significantly below that due to various factors. The most significant contributor to
lower real-world speeds is the age, size or gauge, condition and length of the phone cable
between the phone company�s Central Office (CO) and the customer�s computer. These
conditions also play a significant role in determining where DSL service is available as explained
below in the section on DSL. Speeds cited by respondents to the surveys varied widely, but dial-
up speeds ranging from 25 Kbps to 30 Kbps appear to be common in the areas we studied.
47 DEPARTMENT OF AGRICULTURE Rural Utilities Service, 7 CFR Part 1739, RIN 0572�AC09, Community Connect Broadband Grant Program: Broadband Transmission Service means providing an information-rate equivalent to at least 200 kilobits/second in the consumer�s connection to the network, both from the provider to the consumer (downstream) and from the consumer to the provider (upstream).

CBG Communications, Inc.
128
Dial-up service can be obtained through the local phone company or through other providers
such as AOL and EarthLink for around $21.95 per month or less for basic Internet access and e-
mail service.48
Consumer Satellite Service
Consumer level satellite Internet services do not meet the 1.5 Mbps threshold suggested by some
stakeholders for this study; however, this service is widely used in the five counties - primarily
when it is the only option faster than dial up. Satellite Internet providers, such as WildBlue and
Hughesnet, offer service levels, as listed on their websites and confirmed with their customer
service personnel, as high as 1.5 Mbps in the downstream direction. However, the upstream
speeds are significantly slower.49 Another prominent issue with satellite Internet is the signal
delay that is inherent in this technology. This phenomenon will not significantly affect many
data applications, but real time, two-way, services such as Voice over Internet Protocol (VoIP)
telephone service and interactive gaming will not work properly on this type of network. We
observed mixed reactions to satellite Internet service in this study - especially regarding its
reliability - but many respondents indicated that satellite is a useable option where other higher
speed connections are not available, and that it is preferable to dial-up.
During the driveout portion of the project, WildBlue appeared to be the most widely adopted
satellite Internet provider in the five counties. It offers services ranging from 512 Kbps to 1.5
Mbps downstream and up to 256 Kbps upstream speed. These service levels range from $49.95
to $79.95 per month with upfront equipment, shipping and installation costs of $518.00 for a
basic installation. Special offers, such as reduced equipment and installation costs, are
sometimes available. WildBlue also has maximum upload and download levels (total amount of
information that may be transported on the network by the users) that vary with each package. If
these levels are reached during any given month, the customer drops to dial-up speeds for the
remainder of the month.50
48 Qwest�s survey response states that dial-up is available throughout its service areas for $21.95 per month. CenturyTel�s survey response details dial-up service for $12.95 to $17.95 per month. 49 Research of HughesNet�s website on May 28, 2008: http://go.gethughesnet.com/speed.cfm, Discussion with WildBlue�s Customer Service on May 28, 2008: 1-866-769-0404 50 Discussion with WildBlue�s Customer Service on May 28, 2008: 1-866-769-0404
CBG Communications, Inc.
129
HughesNet offers satellite services with similar plans to WildBlue. These packages range in
speed from 700 Kbps to 1.5 Mbps forward and 128 Kbps to 200 Kbps upstream with speeds
dropping as much as 50% in both directions during peak periods. HughesNet charges $59.99 to
$79.99 per month for this service if the customer purchases the equipment for $399.00. As
shown on HughesNet�s website, if the customer does not purchase the equipment up front, the
service costs an additional $20.00 per month.51
Starband offers satellite-based Internet service with several options for residents electing to
receive their service. The first option is for upstream speeds of 128 Kbps and downstream
speeds of 1 Mbps with pricing for a 1 year subscription of $79.99 per month or, with a two year
commitment, $69.99 per month. Starband�s second level of service is 256 Kbps upstream and
1.5 Mbps forward for $109.99 per month with a one year commitment, or $99.00 per month with
a two year commitment. Both service levels require an equipment charge of $299.99.52
SkyWay USA is another provider of satellite service with similar downstream speeds to
WildBlue and HughesNet. SkyWay USA, however, uses a phone line for the upstream
connection and therefore has upstream speeds that may be less than 56 Kbps. SkyWay USA
offers service levels as high as 1.5 Mbps downstream, based on information found on its website,
costing $79.95 per month, with a lower service level of 256 Kbps costing $29.95 per month.
Both downstream levels are paired with a phone line for upstream traffic. Both plans require
activation and installation fees of about $200.53
Digital Subscriber Line
Digital Subscriber Line (DSL) is a broadband service designed to provide high-speed Internet
over traditional telephone lines to the subscriber�s home or business. Qwest, CenturyTel, Toledo
TeleNet, TDS (McDaniel Telephone Company) and Inland Telephone Company provide DSL
service in one or more of the five counties. DSL is typically provided as an �asymmetric�
service (more speed or transfer rate downstream and less upstream), with upstream speeds as
slow as 128 Kbps and downstream speeds as fast as 10 Mbps.
51 Research of HughesNet�s website on May 28, 2008: http://go.gethughesnet.com/speed.cfm 52 Research of Starband�s website on May 29, 2008: http://www.starband.com/services/ 53 Research of Skyway USA�s website on May 29, 2008: http://www.skywayusa.com/order.php
CBG Communications, Inc.
130
To deploy DSL service, providers feed signals over copper phone lines (twisted pair) starring out
of a CO (Central Office) to residents or businesses located near the CO. Providers also
commonly use fiber optic cables from the CO to a neighborhood or remote wire cabinet, or DSL
extender, where the service is then provided along the traditional copper telephone lines into the
home or business premises. In addition, DSL resellers can offer service utilizing the local phone
company�s lines with approximately the same speed and cost on a monthly basis.
A device within the central office called a Digital Subscriber Line Access Multiplexer (DSLAM)
communicates with a DSL modem at the customer�s location in order to provide the high-speed
Internet connection. The DSLAM is in turn connected to the Internet server.
DSL service cannot usually be provisioned beyond approximately 15,000 to 18,000 feet from the
central office (or a DSL extender) based on the size (gauge) and condition of the copper wires.
As with dial-up modem service, the further the customer is from the central office or extender
the lower the speed of connection that can be provisioned until a point is reached where DSL
service cannot be reliably provided.
Cable Modem Service
Cable modem service is offered in some of the counties by Comcast, Touchet Valley Television,
Coast Communications, TV Association of Republic and Broadstripe. Pursuant to Federal law,
counties and municipalities cannot require the provision of broadband or high-speed Internet
service as part of a cable franchise, because such a service is classified as an �Information
Service�.54 However, all the listed cable providers offer service levels ranging from 384 Kbps to
6 Mbps in the downstream direction and 384 Kbps to 2 Mbps in the upstream direction. Monthly
costs, excluding promotions, range from $34.95 to $94.95 per customer, plus tax, fees and other
54 FCC CS Docket No. 02-52
CBG Communications, Inc.
131
charges. Installation charges are as low as $34.95 for a self installation to around $100.00 for an
installation by the provider.55
To deploy cable modem service, providers commonly use a HFC (Hybrid Fiber Coaxial)
network. A HFC network is characterized by fiber from the nearest �head end� or hub to
neighborhood �nodes� that serve about 500 homes with coaxial cable. The system then employs
Cable Modem Termination System (CMTS) gear in the headend or hub which communicates
with the individual cable modems or routers in subscribers� homes. The CMTS also
communicates with its main server which is connected to the Internet. This provides the high-
speed Internet connection from the company to the home or business location.
Broadband Over Cellular
For a number of years, cellular telephone providers have also been providing broadband services
over their cellular networks using a variety of what are known as 3G (or �Third Generation�)
technologies. Verizon, for example uses a system called EVDO (Evolution Data Optimized)
while AT&T /Cingular uses a system called EDGE. Essentially, this broadband service can be
used in a fixed location, or as a mobile service. The current providers of mobile broadband data
services in the five counties include all the major cellular carriers: AT&T/Cingular,
Sprint/Nextel, Verizon, US Cellular, T-Mobile and others. One representative example of
services and pricing is for AT&T�s Data Connect Service. As shown on AT&T�s website, and
confirmed with AT&T customer service personnel, this service costs from $19.99 for a total
monthly throughput of 5 Mbits to $64.99 for unlimited access. In addition, an aircard (cellular
broadband modem) or USB adapter is needed to access the service at a cost of $49.99 to $99.00.
These plans require a two year commitment in order to receive this pricing.56
The ability to use the service is similar to the ability to use cellular voice service. It depends
upon the amount of cell coverage that is available in the counties, and the strength of signal. This
also affects the transfer rate that is provided (typically between 512 Kbps and 1.4 Mbps 55 Information gathered on-site from the Television Association of Republic and from the following websites on May 27, 2008: http://www.comcast.com/; http://www.broadstripe.com/broadstripe_pages/pricing_login.php; http://www.touchetvalleytv.com/pages.php?section=Internet 56 Discussion held May 26, 2008 with AT&T Consumer Sales: 1-888-333-6651
CBG Communications, Inc.
132
symmetrical). Similar to cable modem service, it is also a shared service, so the more users
trying to access the service from a single cell tower, the slower the transfer rate per user will be.
Finally, cellular carriers don�t always provide mobile data services where they provide cellular
telephone services. This leaves significant gaps in coverage, even in areas that appear to be
included in the provider�s broadband coverage area.
Fixed Wireless
Fixed wireless broadband services are also wireless services, but typically are provided in a
point-to-point configuration from a central tower location or through a series of towers (hops)
through a mesh network to a customer premise location. Sometimes these systems use
proprietary (non-standards-based) technology specifically designed to operate effectively at
certain frequencies and use certain modulation techniques designed to gain both line of sight and
nonline of sight transmission.
Providers offering service in the five counties include: Columbia Rural Electric Association,
Eltopia, EcliptixNet, Internet Xpress, Air Pipe, TV Association of Republic and others. These
providers typically offer service levels of 128 Kbps to 1.5 Mbps in the upstream direction and
256 Kbps to 3.0 Mbps in the downstream direction. Pricing varies significantly between the
providers and counties as shown in the County by County Review section below, but ranges
from $28.00 per month to $259.00 per month.57
Wi-Fi
Wi-Fi is a popular wireless broadband technology because so many laptop computers are built
with Wi-Fi components installed or it is very easy to get a �Wi-Fi card� that can be installed in
an external port of a laptop (USB-enabled transceivers are currently the most popular). Wi-Fi
�hot spots� or access points (APs) are typically available in locations such as airports, fast food
restaurants, coffee shops, bookstores, etc. There are very few Wi-Fi wireless broadband
locations available for public use in the counties, with as few as 3 in Columbia, including the
57 Information based on the Broadband Provider Survey response from Internet Xpress and on site interviews with Eltopia, Columbia Rural Electric Association and TV Association of Republic.

CBG Communications, Inc.
133
public library, to approximately 15 advertised hotspots and 7 Library locations in Lewis County
that offer service. Hotspots can be provided by both commercial organizations and public entities
such as libraries and government agencies.
Access points can be combined, often in a �Mesh� network architecture, where APs
communicate with not only the end user but between each other to provide maximum coverage
and efficiency in operation. These combinations are often called �hot zones�. There are
currently no known hot zones within the counties.
To further deploy hot spots or create hot zones would require the establishment of access points
in the counties (each access point, depending upon the technology used, topology, foliage
density, building heights and types, etc., can cover a radius from 300 to as much as 1500 feet).
Coverage also depends upon the height of the antenna. Additionally, each access point (or in the
case of a Mesh network, a gateway node) would need to have some type of backhaul connection
to the Internet (again, a landline connection or wireless connection), as well as power. Often
these devices are mounted on power and telephone poles, street lights, the sides of buildings, and
other structures at least 12 feet tall. Anywhere from 15 to 45 APs are needed per square mile,
depending upon the density of potential users as well as whether both indoor and outdoor
coverage is needed.
Broadband Over Power Lines
Broadband over Power Lines (BPL) is a technology that provides high-speed Internet access at
speeds roughly equivalent to DSL, through the power system infrastructure. The City of
Centralia deployed BPL as part of a pilot project but this pilot was being discontinued as this
study concluded. There are no other current providers of BPL service within the counties.
From one standpoint, the use of BPL would be an ideal technology for deployment in the
counties because power goes to every home, including those that only have dialup services
available now. However, BPL has been around for a number of years with very few initial and
ongoing installations. The technology had a lot of problems with successful implementation,
CBG Communications, Inc.
134
including interference with both broadcast television and ham radio operations (since the
technology uses unshielded power lines) and other problems.
Fiber Optics
Fiber optics is often thought of as the �holy grail� of broadband infrastructure, since it has near
limitless capacity to provide broadband services. Verizon, for example, is spending
approximately $23 billion to bring Fiber To The Premises (FTTP) services to about one-third of
its service area; initially the more dense suburban sections. Through its FIOS FTTP system,
Verizon can provision a great amount of video, voice and broadband data services, including
high-speed Internet access up to 50 Mbps, hundreds of analog, standard and high-definition
digital video channels, thousands of on-demand video services, including high-definition on-
demand, and voice services, while only using a portion of its capacity. The rural nature of
Verizon�s service area within Ferry County is not consistent with the build-out element of
Verizon�s FIOS business model, so Verizon will likely not bring FIOS FTTP service to Ferry
County. There are no known significant deployments of FTTP in the five counties studied,
outside of fiber to institutional premises.
There is, though, a certain amount of fiber infrastructure in the counties. For example, cable TV
companies have fiber to all of their HFC nodes, as described earlier. The phone companies have
fiber to their central office and remote locations. In addition, AT&T and others have fiber
running through some of the counties.
PROVIDERS
We contacted all the known providers thought to potentially provide service in the five counties
to ask if they would take part in the Study. We sent surveys to most of the companies contacted
and performed interviews with companies, especially when we received contact information late
in the data gathering process. Not all of the providers returned the surveys and some simply
stated that they could not provide significant information for confidentiality or proprietary
reasons. Others provided significant information but did not offer maps of their infrastructure to
show exactly where they provide service. Companies that filled out a survey or participated in
an interview, as well as their service level(s) and pricing information are:
CBG Communications, Inc.
135
Qwest Corporation
Qwest offers telephone service in portions of all five of the counties and also offers DSL in
Columbia County, Grays Harbor County, Lewis County and Stevens County. Qwest showed
which CO�s have DSL service available, but did not offer specific details of the extent to which
their services are available within those areas. As described above in the DSL section, DSL
service is very dependent on the distance from the company�s CO or remote DSLAM locations.
As part of our system drive out, we determined approximate service areas for Qwest�s DSL
service based on discussions with residents and businesses in each of the counties and have
included this information on the maps in Attachment 10.
All of Qwest�s DSL levels of service provide �up to� 896 Kbps upstream with downstream
speeds of 7 Mbps for $54.99 per month, 1.5 Mbps for $44.99 per month and 256 Kbps for
$31.99 per month. In addition, Qwest offers business class service with upstream speeds up to
896 Kbps and downstream speeds of 7 Mbps for $69.25, per month, 1.5 Mbps for $50.50 per
month and 256K for $38.00 per month.58
Qwest stated that broadband deployment is based on economic analyses that evaluate return on
investment. Taken into account are existing network design, capacity, population density and
competition. Qwest filed a Washington Rural Broadband Expansion Plan - (Docket UT-061625)
designating deployment of broadband services in Columbia County at its Waitsburg wire center,
in Lewis County at its Rochester and Winlock wire centers and in Stevens County at the Deer
Park, Northport and Springdale wire centers. Qwest did not provide specific information related
to which specific areas will be affected and therefore, especially in the wire centers located
outside of the five counties, it cannot be accurately determined what the final impact for each of
the counties� residents will be. However, the Plan states availability in Northport will go from
0% to 33%, Springdale will go from 0% to 32%, Waitsburg will go from 0% to 79%, Napavine
from 49% to 68%, Deerpark from 34% to 42% and Winlock from 58% to 66%. Construction
pursuant to the Plan was to begin in 2007 and be completed in 4 years.
58 Service levels and pricing information from Qwest�s Broadband Provider Survey Response found in Attachment 7.
CBG Communications, Inc.
136
Qwest stated in its response �Qwest is not providing any proprietary information in its responses
regarding its broadband deployment in Washington because there is currently no provision for
protection of such data.�
TDS Telecom
TDS Telecom provided a map of their current and proposed DSL coverage areas in Lewis
County. This information is approximated and included on the Lewis County maps attached.
TDS offers three levels of DSL service in their service area with all levels having upstream
speeds of 512 Kbps and downstream speeds of 3 Mbps for $49.95 per month, 1.5 Mbps for
$39.95 per month, and 768 Kbps for $29.95 per month. TDS also offers business class service
starting with T-1s (1.54 Mbps symmetrical) with pricing dependent on the distance of the
connection and the speeds desired. TDS, although stating their plans are not cast in stone, hopes
to increase its DSL coverage area from the current 67% to 83% of their service area within the
next two years.59
CenturyTel
CenturyTel offers DSL service within its service areas in all five counties. The areas where DSL
service is available are included on the maps attached. CenturyTel�s service levels vary per
county with speeds of 128 Kbps upstream and 256 Kbps downstream costing $31.20 per month
and 256 Kbps upstream and 1.5 Mbps downstream costing $41.20 per month offered in all five
counties. CenturyTel also offers additional service levels in some areas with upstream speeds of
between 512 Kbps to 786 Kbps and downstream speeds from 3 Mbps to 10 Mbps for $51.20 per
month. The available speeds are likely determined by the distance from CenturyTel�s DSLAM.
Toledo Telenet
We sent a survey to Toledo Telenet at the beginning of the data collection process of this Study.
Although we have not received a survey back from Toledo Telnet, we have held discussions with
representatives of the company and have ascertained that they offer DSL in their exchange area
59 Services, pricing and expansion information is from TDS� Broadband Provider Survey Response found in Attachment 7.
CBG Communications, Inc.
137
with service levels of 256 Kbps upstream and 640 Kbps downstream for $39.95 per month.
They also offer a service level of 512 Kbps upstream and 2 Mbps downstream for $49.99 per
month with a one time installation fee of $99.00 which includes the modem cost.
Eltopia
Eltopia is a fixed wireless Internet provider doing business in Stevens County. They offer
service in several pockets of Stevens County as depicted on the map in Attachment 10. Eltopia
offers symmetrical speeds of 256 Kbps for $30.00 per month, 1 Mbps for $45.00 per month and
3Mbps for $75.00 per month.
TV Association of Republic
The TV Association of Republic is offering two options for Internet service for residents of Ferry
County. The first is cable modem based service in the City of Republic and just outside of town.
This service provides speeds of 128 Kbps upstream and 256 Kbps downstream for $28.00 per
month, 128 Kbps upstream and 356 Kbps downstream for $38.00 per month, 256 Kbps upstream
and 256 Kbps downstream for $43.00.00 per month and 384 Kbps symmetrical for $48.00 per
month. These prices are for cable TV subscribers, with an additional $10.00 per month for none
cable TV subscribers. The TV Association of Republic also offers fixed wireless service to a
significant portion of the Northwest portion of Ferry County with service levels of 384 Kbps
symmetrical for a one year commitment and cost of $526.00 for 13 months and this includes
installation and the membership fee for the Association.
Comcast
Comcast was contacted early in the data gathering stages of the Study and mentioned that
confidential information could not be provided unless it was insured that the information could
be held confidential. Comcast did agree to complete the survey; however, at the time of
development of this Report we have not received the survey back from Comcast.
In lieu of information from Comcast, we determined approximate service areas during our drive
out of the counties as well as through discussions with residents and businesses. We also
researched available speeds and pricing on Comcast�s website for the areas where service is
CBG Communications, Inc.
138
available. We have included the service areas on the maps in Attachment 10. Comcast provides
cable modem service levels of 356 Kbps in the upstream direction with 6 Mbps downstream for
$45.95 per month and 786 Kbps upstream and 8 Mbps downstream for $55.95 per month. There
is also a charge for the modem either upfront or on a monthly basis. Comcast offers speeds up to
16 Mbps in other markets and has rolled out a business class service with upstream speeds of 5
Mbps and 50 Mbps downstream in the Twin Cities, Minnesota, but these service levels do not
appear to be available in the five counties at this time.
Rainier Connect
Rainier Connect was also contacted early in this study and was sent a survey to complete. After
some time, Rainier Connect sent an e-mail stating, �We do provide competitive, high-speed
broadband in Lewis County. For competitive reasons, we choose not to respond further.� We did
not find specifically identifiable Rainier Connect infrastructure during the drive out of the county
and therefore they are not included on the map in Attachment 10.
Internet Xpress
Internet Xpress offers fixed wireless service in Stevens County. It provides service at speeds of
768-1.5 Mbps synchronous for $75.00 to $225.00 per month. Its canopy wireless system offers
speeds of 256 Kbps to 1.5 Mbps synchronous for $35.95 to $49.95 per month. In addition,
Internet Xpress is a reseller of DSL service where Qwest and CenturyTel offer DSL service in
the county. This service has speeds of 128 Kbps to 865 Kbps in the upstream and 256 Kbps to 7
Mbps in the downstream direction. DSL service ranges in price from 35.95 to 49.95 per month
depending on the speed available to and chosen by the customer. Internet Xpress�s coverage
area for their wireless service is shown on the map in Attachment 10.
Charter Communications
Charter Communications was contacted early in the data gathering process and informed CBG
that they do provide cable TV to some areas within the study group of counties. Charter received
the survey; however, they only filled in contact information in their reply with no further
information or comments. Based on this lack of information, we researched Charter�s web site
and also spent time looking at their infrastructure during the drive out. From the information
CBG Communications, Inc.
139
gathered during the drive out as well as from web based research, it appears Charter is not
currently providing Internet service in any of the five counties.
Inland Telephone Company
Inland Telephone Company is providing DSL service from its Prescott exchange CO. This CO
is located in Walla Walla County and serves a very small area in Columbia County. Inland states
that it believes 100% of the Prescott exchange customers can be served by DSL; however, only
two percent of these customers reside in Columbia County. Inland also stated in its cover e-mail
that they �only have 5 subscribers in Columbia County�. We received the survey from Inland
later in the process and therefore have not included them on the maps. Inland Telephone
Company offers speeds of 128 Kbps upstream and 384 Kbps in the downstream direction from
its Prescott Exchange.
Broadstripe
Attempts were made to contact Broadstripe later in the data gathering process, but the company
hasn�t returned our calls as of the date of compilation of this Report. During the drive out of
Lewis County it was determined that Broadstripe offers Cable TV service in significant areas of
the Highway 12 corridor from just west of Morton to Silver Brook and also in the area around
Packwood. Broadstripe offers cable modem service around Packwood but we did not find a
resident who was aware of them offering cable modem service from Morton to Silver Brook.
However, it was observed that Broadstripe is significantly upgrading their network in this area
and will likely be offering cable modem service in the near future. Therefore they are included
on the Lewis County map in Attachment 10.
Where Broadstripe does offer cable modem service, they provide speeds of 4 Mbps downstream
for $39.95 per month when ordered without cable TV service and they also offer 512 Kbps for
$34.95 per month. There is a $5.00 Monthly rental fee for the cable modem and an activation
fee of $39.95 and install fee of $49.95.
CBG Communications, Inc.
140
Columbia Rural Electric Association
The Columbia Rural Electric Association (REA) provides wireless service in Columbia County
to the Dayton, Starbucks and surrounding areas utilizing a fixed wireless network. This network
is comprised of several antenna locations in Columbia and Walla Walla counties providing the
backbone for the network as well as the distribution for feeding signal to and from residents of
the two counties. Service levels are symmetrical and include 256 Kbps for $39.95 per month,
512 Kbps for $49.95 per month, 768 Kbps for $79.95 per month, 1,024 Kbps for $119.95 per
month and 1.536 Mbps for $259.95 per month. In addition, there is an installation charge of
$199.00. REA�s service areas are shown on the Columbia map in Attachment 10. REA plans to
expand its network as funding is available and sees the service provided as more filling the
unmet need of its energy customers for broadband than it does a for profit business venture.
Touchet Valley Television
Touchet Valley Television is offering cable modem service in the City of Dayton. The services
they offer include residential service with 256 Kbps upstream and 512 Kbps downstream for
$39.95 per month plus a $4.95 monthly fee for rental of the cable modem, or the modem can be
purchased for $49.95. If the resident is a customer of Touchet Valley Television�s cable TV
service, the monthly cost drops $5.00. Touchet Valley Television also offers two levels of
business class service. For upstream speeds of 512 Kbps and 1.024 Mbps downstream the
monthly cost is $54.95 for non cable TV customers and $5.00 less for Cable TV subscribers.
The highest tier of service is also a business class with 768 Kbps upstream and 1.536 Mbps
downstream for a monthly cost is $94.95 regardless of whether the customer has Cable TV
service or not.
CBG Communications, Inc.
141
County by County Infrastructure Review
Each of the counties has areas where broadband options currently exist and areas where there are
more than one provider competing to provide service to the residents and businesses in these
areas. However, there are significant portions of each of the counties that only have dialup and
satellite service available to them. In many of these cases, there are not even hotspots available
to residents for Internet access for over 100 miles and therefore broadband has no realistic
availability, let alone competition.
Each county�s population, number of households and square mileage has been compared to the
census recognized communities within the county to determine the percentages of residents and
geographical areas that cannot receive broadband today. It should be noted that in nearly all
cases we were not provided exact boundaries, and in most cases no boundaries, from the
broadband providers. That combined with the fact that provider�s technologies, in particular
wireless, do not follow city boundaries makes it difficult to provide exact percentages. However,
CBG believes that these numbers give a good representation of the current state of broadband
availability in each of the counties.
COLUMBIA COUNTY
Columbia County is a rural County consisting of 874 square miles with two Cities within its
boundaries comprising just under 2 total square miles. The population of Columbia County is
4,087 people. Of these people 69% live in Dayton and Starbuck, leaving 31.5% of the people
living outside of the two Cities. The County had 1687 households in 2000 with 1146 of these in
the two Cities. With 872 square miles making up Columbia County and 1.7 miles within the
City�s of Dayton and Starbuck this leaves 99.8% of Columbia County outside of City limits.
There are five providers of broadband services in Columbia County. These are CenturyTel,
REA, Qwest, Inland Telephone Company and Touchet Valley Television.
The City of Dayton has service provided by Qwest from its Dayton wire center offering speeds
of up to 896 Kbps in the upstream direction with 256 Kbps to 7 Mbps in the downstream
CBG Communications, Inc.
142
direction. These services range in price from $31.99 to $54.99 per month. Qwest also has DSL
service out of its Pomeroy wire center in Garfield County however with the wire center being in
excess of 6 miles from Columbia County point to point and more than 10 miles via roadways it is
highly unlikely the wire center offers DSL service to any residents in Columbia County.
Furthermore, during the drive out of Columbia County, no DSL services were found to be
offered in this area of the county. Qwest also has a wire center in Walla Walla County that feeds
parts of Columbia County. This wire center does not offer DSL today.
Columbia County is included in Qwest�s Washington Rural Broadband Service Expansion Plan
as detailed in the Provider subsection above, but it is not clearly defined what specific areas of
the county will ultimately be affected and therefore it is not possible to draw definite conclusions
on the outcome for the residents and business in the county.
CenturyTel is offering DSL service from its Starbucks location with service levels of 128 Kbps
upstream and 256 Kbps downstream for $31.20 per month. CenturyTel also provides a service
level of 256 Kbps upstream and 1.5 Mbps downstream for $41.20 per month. It appears this
service is offered within the City of Starbuck and within a few miles of the City.
Columbia Rural Electric Association offers fixed wireless service to the Dayton and Starbuck
areas of the county. The service levels offered are symmetrical and include: 256 Kbps for
$39.95 per month, 512 Kbps for $49.95 per month, 768 Kbps for $79.95 per month, 1,024 Kbps
for $119.95 per month and 1.536 Mbps for $259.95 per month. In addition, there is an
installation charge of $199.00.
Touchet Valley Television is offering cable modem services within the City of Dayton and are
providing residential service levels of 256 Kbps upstream and 512 Kbps downstream for $39.95
per month for non-cable TV subscribers with a $5.00 discount for residents signed up to receive
cable TV. Touchet Valley Television also offers two business classes of service including 512
Kbps upstream and 1024 Kbps downstream for $54.95 per month for non cable TV subscribers
and $49.95 per month for cable TV subscribers and 768 Kbps upstream and downstream of
1.536 Mbps for $94.95 per month regardless of whether or not a cable TV subscription is held by
CBG Communications, Inc.
143
the business. Both services also require a purchase of a cable modem or a monthly modem
charge of $4.95.
Inland Telephone Company is providing DSL service from its Prescott exchange CO located in
Walla Walla County. Of the residents served form this CO only 2% reside in Columbia County
and indeed Inland Telephone Company says they have 5 customers in Columbia County. As we
received Inland�s response late in the data gathering process, combined with the fact that no one
in Columbia County seemed to know that Inland Telephone Company serves this small area of
the county, we do not have them included on the maps in Attachment 10. Inland offers speeds of
128 Kbps upstream and 384 Kbps in the downstream direction from its Prescott (Walla Walla
County) Exchange for $49.95 per month.
COLUMBIA COUNTY CONCLUSION
Columbia County has relatively good broadband options within Dayton and Starbuck. However,
just outside of these towns, as shown on the attached Columbia County maps, there are no
providers or options for broadband by residents or businesses.
FERRY COUNTY
Ferry County was comprised of 7,559 people living in 2,823 household according to the 2000
Census and the county is comprised of 2,257 square miles of land. Republic and Inchelium are
the only communities included as Census recognized communities and combined they have 954
residents living in 411 households on 1.6 square miles of land. This equates to 13% of the
population, 14.5% of the households and .07% of the land area within these communities. There
are areas of the county that are outside of these �recognized communities� that would be
included as being able to get broadband services. Therefore we estimate that approximately 25%
of the residents in Ferry County could receive Broadband service if they desired it.
CenturyTel is offering DSL service along Lake Roosevelt from the Kettle Falls area to
Inchelium. During the drive out it was found that residents� ability to receive DSL service from
CenturyTel got spotty in the area between Kettle Falls and Inchelium and therefore this corridor
does not have 100% coverage.
CBG Communications, Inc.
144
CenturyTel is offering DSL services in this corridor at 128 Kbps upstream and 256 Kbps
downstream for $31.20 per month, 256 Kbps upstream and 1.5 Mbps downstream for $41.20 per
month, and in the Kettle Falls area between 512 Kbps and 786 Kbps upstream combined with
between 3 Mbps and 10 Mbps downstream for $51.20 per month.
The TV Association of Republic is offering two options for Internet service for residents of Ferry
County. The first is cable modem based service in and around the City of Republic. This service
provides speeds of 128 Kbps upstream and 256 Kbps downstream for $28.00 per month, 128
Kbps upstream and 356 Kbps downstream for $38.00 per month, 256 Kbps upstream and 256
Kbps downstream for $43.00.00 per month and 384 Kbps symmetrical for $48.00 per month.
For non cable TV subscribers there is an additional cost of $10.00 per month. They also offer
fixed wireless service to a large portion of the Northwest portion of Ferry County with service
levels of 384 Kbps symmetrical for a one year commitment and cost of $526.00 for 13 months
including installation and the membership fee for the Association. After the first year the
monthly charge is $35.50.
Qwest and Verizon both offer telephone service in the county and therefore dial-up; however,
neither of them offers DSL broadband services in Ferry County. Verizon in its response to the
Survey states that they offer T-1 service of 1.544 Mbps symmetrical in Ferry County. No rates
were given for this service as this depends on the characteristics of each customer�s order.
FERRY COUNTY CONCLUSION
Ferry County has a significant geographic area of the county that cannot obtain broadband
services today. The TV Association of Republic is filling some of this gap, and has plans to
expand their network as funding can be made available, by offering its fixed wireless service.
There are two hurdles that must be overcome to provide DSL service to at least a small area in an
exchange area. The first is the need for backhaul or backbone service to tie the area being served
back to the Internet. The second is the need for equipment at the CO to distribute DSL service
into an area. It seems that Verizon has conquered the most significant and therefore potentially
most costly of these issues by having the backbone in place. We base this on two findings. The
CBG Communications, Inc.
145
first is that we found Verizon owned fiber optic infrastructure entering Ferry County from
Okanogan County along Highway 20, it enters Republic and then goes north to Curlew. In
addition, in order for Verizon to offer T-1 service, they must have the equipment in place on this
fiber network to get back to the Internet. The second hurdle for offering DSL service is the need
for equipment at the CO or hub to deploy DSL onto the copper phone lines. It seems that
deployment of DSL at least to small areas in Republic and Curlew would be relatively
inexpensive for Verizon.
GRAYS HARBOR
Grays Harbor consists of 1917 square miles of land area. Of this, 122.5 miles (6.39%) are inside
of Census recognized cities and communities. The County also had a 2007 population of 70,800
and total households in 2000 of 26,808. The number of people living in Census recognized
communities in 2000 was 48,514 (72.2%) with 20,774 (77.49%) households in these areas. This
equates to 72.2% of the population living in 122.5 miles and these people are able to receive
broadband services from one or more providers. With areas just outside of recognized
communities being able to receive broadband services, we estimate that approximately 85% of
the land area is not served by Broadband and 25% of residents cannot receive broadband services
from any of the providers in the county.
Qwest is currently providing service in the Aberdeen area, with residential DSL services
including up to 896 Kbps in the upstream and 256 Kbps downstream for $31.99 per month, 1.5
Mbps for $44.99 per month, and 7 Mbps for $54.99 per month. Qwest also provides business
class services at the same levels for $38.00, $50.50 and $69.25 per month respectively.
Qwest�s Washington Rural Broadband Service Expansion Plan does not include any areas in
Grays Harbor.
CenturyTel is offering DSL service in areas along the Pacific coast between Pacific Beach and
Taholah as shown on the maps of Grays Harbor in Attachment 10. In addition, CenturyTel also
has DSL service areas in the Lake Quinault area as well as Humptulips and Ocosta areas of the
county. These are also shown on the maps.
CBG Communications, Inc.
146
CenturyTel is offering DSL services at 128 Kbps upstream and 256 Kbps downstream for $31.20
per month, 256 Kbps upstream and 1.5 Mbps downstream for $41.20 per month, and between
512 Kbps and 786 Kbps upstream and between 3 Mbps and 10 Mbps downstream for $51.20 per
month.
Coast Communications is offering cable TV based services in the area along the Pacific Coast
from around Pacific Beach down to and including Ocean Shores. Although we did not receive a
survey back from Coast, we did drive out the entire area and made the following findings. Coast
has cable modem service available in most of its coverage area and is upgrading areas of the
system that do not have the capability to offer broadband services. We came across two
gentlemen splicing in new equipment in one of the resort areas along the coast and this area will
then be able to offer cable modem service.
Coast has two service levels for its modem service up to 1 Mbps for upstream for both services
with 6 Mbps downstream costing $42.95 per month and 8 Mbps costing $69.95 per month.
Comcast offers cable modem service in significant portions of Grays Harbor from Hoquiam to
Elma along the Highway 12 corridor and from Westport to Aberdeen along Highway 105 as well
as in the Oakville area. Comcast provides cable modem service levels of 356 Kbps in the
upstream with 6 Mbps downstream for $45.95 per month and 786 Kbps upstream and 8 Mbps
downstream for $55.95 per month. There is also a charge for the modem either upfront or on a
monthly basis.
GRAYS HARBOR CONCLUSION
Grays Harbor and Lewis County have the most extreme examples of broadband have and have-
nots in the study group of five counties. Where there are significant population centers along
Highway 12 and the Pacific coast, broadband exists and in most areas there are at least two
options for broadband and therefore a level of competition. However as you move away from
these population centers into rural areas of the county, broadband competition disappears and
shortly thereafter broadband is not available at all.
CBG Communications, Inc.
147
LEWIS COUNTY
Lewis County has 2,407 square miles of land with 74,100 residents in 2000 and 26,306
households in the county in 2000. There are 10 communities that are recognized by the census.
In these 10 communities reside 29,718 people in 11,608 households covering 22 square miles of
land. This translates into 43% of the population of Lewis County residing on .91% of the land
area within the county. As the availability of broadband closely mirrors the population centers in
the county and reaches just beyond those areas, we estimate that about 10% of the geographic
area of the county is served by broadband. Furthermore, approximately 45% of the county�s
population has at least 1 broadband option available to them.
Providers include Qwest serving a few miles east and west of the I-5 corridor from the northern
border of the county to just north of the southern border. Lewis County is included in Qwest�s
Washington Rural Broadband Service Expansion Plan and outlines that Qwest will increase the
percentage of residents able to get DSL service out of there Rochester CO from 46% before the
deployment to 55% after the deployment of advanced services. In addition, the Winlock Wire
Center will be upgraded from its current capability to offer DSL service to 58% of the residents
to 66% being fed from this location.
The areas described above (before deployment) and shown on the Lewis County map in
Attachment 10, are offered DSL service by Qwest and are offered speeds of up to 896 Kbps in
the upstream direction with 256 Kbps to 7 Mbps in the downstream direction. These services
range in price from $31.99 to $54.99 per month.
CenturyTel is offering DSL service in the City of Pe Ell, and in areas along Wildwood Road to I-
5. In addition, CenturyTel has a DSLAM feeding Mineral as well as service along Highway 12
from west of Morton to Packwood. CenturyTel is offering DSL services at 128 Kbps upstream
and 256 Kbps downstream for $31.20 per month, 256 Kbps upstream and 1.5 Mbps downstream
for $41.20 per month in all of the areas of Lewis County. In addition, CenturyTel is offering
service levels between 512 Kbps and 786 Kbps upstream and between 3 Mbps and 10 Mbps
CBG Communications, Inc.
148
downstream for $51.20 per month in the Vader area as well as the area between Morton and
Packwood.
Comcast provides Cable modem service along the I-5 corridor from the northern border of the
county to the southern Border. Comcast is offering speeds of 356 Kbps in the upstream with 6
Mbps downstream for $45.95 per month and 786 Kbps upstream and 8 Mbps downstream for
$55.95 per month. There is also a charge for the modem either upfront or on a monthly basis.
TDS Telecom is offering DSL service throughout portions of its exchange area as shown on the
Lewis County map in Attachment 10. TDS Telecom hopes to extend its service area for DSL
from the current 67% of the three exchanges they have to as much as 83% or more within the
next two years. It should be noted that these plans could potentially change. Where TDS does
offer DSL service, upstream speed is 512 Kbps with options for downstream speeds of 3 Mbps
for $49.95 per month, 1.5 Mbps for $39.95 per month, and 768 Kbps for $29.95 per month. TDS
also offers business class service including T-1s (1.54 Mbps symmetrical) with pricing
dependent on the specific distance to the customer�s location as well as desired speeds.
Toledo Telenet offers DSL service in 100% of its Exchange area. This area is depicted on the
Lewis County maps in Attachment 10. Service levels offered by Toledo Telenet include 256
Kbps upstream and 640 Kbps downstream for $39.95 per month and 512 Kbps upstream and 2
Mbps downstream for $49.99 per month with a onetime installation fee of $99.00 which includes
the modem cost.
Broadstripe currently offers Cable TV service along the Highway 12 corridor from West of
Morton to Silver Brook and also in the area around Packwood. Broadstripe offers cable modem
service around Packwood but we did not find a resident who was aware of them offering cable
modem service from Morton to Silver Brook. However, it was observed that Broadstripe is
upgrading their network in this area and will likely be offering cable modem service in the near
future. Broadstripe�s known infrastructure is included on the Lewis County map in Attachment
10.
CBG Communications, Inc.
149
Where Broadstripe does offer cable modem service they provide speeds of 384 Kbps upstream
and 6 Mbps downstream for $39.95 per month when ordered without cable TV service and they
also offer 512 Kbps downstream for $34.95 per month. There is a $5.00 Monthly rental fee for
the cable modem and an activation fee of $39.95 and install fee of $49.95.
LEWIS COUNTY CONCLUSION
Lewis County, like Grays Harbor, has the most glaring gap between areas with broadband and
those without. Population centers tend to have at least two broadband options and the lower
density rural areas are not offered broadband at all. Some of the areas with density levels
somewhere in the middle of high and low density are likely provided with broadband because
providers need to pass these areas to serve the next high density pocket in the county. Examples
of this are along Highway 12 where areas have low enough densities where the major providers
would not likely consider serving them with broadband on a standalone basis. However, as long
as they are passing through with their backbone, in order to get to the next pocket of homes, they
could conceivably drop broadband off and pick up the potential customers along their path.
STEVENS COUNTY
Stevens is comprised of 2,478 square miles with a population of 43,000 people. Approximately
26% of the population resides in communities recognized by the census. With the availability of
fixed wireless being a contributor to residents outside of these areas being able to receive
broadband, we estimate approximately 35% of the population in Stevens County can receive
broadband from one or more providers.
Qwest is offering DSL service from its Loon Lake wire center. However, during the drive out,
the availability was found to be spotty where some residents on the northeastern side of Loon
Lake can receive DSL and others cannot. In addition, the south western side of the Lake cannot
receive DSL service as reported by residents. Qwest also delivers DSL service in the Colville
and Deer Park areas of the county. These areas are depicted on the map in Attachment 10.
Where DSL is available, Qwest offers speeds of up to 896 Kbps in the upstream direction on all
three service levels and 256 Kbps downstream for $31.99 per month, 1.5 Mbps downstream for
$44.99 per month and 7 Mbps downstream for $54.99 per month.
CBG Communications, Inc.
150
Stevens County is included in Qwest�s Washington Rural Broadband Service Expansion Plan. It
is not clearly defined what specific areas of the county will ultimately be affected but
enhancements are scheduled to occur in the Deer Park area, bringing availability up from 34%
currently to 42%, the Northport area will go from 0% availability to 33% and the Springdale area
will go from 0% availability of DSL to 32%. This expansion is not depicted on the maps as it is
not possible to determine the specific area affected with the information provided by Qwest.
CenturyTel is offering DSL service from its Chewelah, Hunters, Kettle Falls and Valley wire
centers. These areas are shown on the map in Attachment 10. CenturyTel offers DSL service
levels of 128 Kbps upstream and 256 Kbps downstream for $31.20 per month, 256 Kbps
upstream and 1.5 Mbps downstream for $41.20 per month in all areas served in Stevens County.
In addition, CenturyTel is offering service levels between 512 Kbps and 786 Kbps upstream and
between 3 Mbps and 10 Mbps downstream for $51.20 per month in the Chewelah and Kettle
Falls areas.
Comcast serves the Southeastern area of the county around Clayton with cable modem service
offering speeds of 356 Kbps in the upstream with 6 Mbps downstream for $45.95 and 786 Kbps
upstream and 8 Mbps downstream for $55.95 per month. There is also a charge for the modem
either upfront or on a monthly basis.
Eltopia is a point to point wireless company offering service in Stevens County. They provided
their approximate coverage areas during an on-site visit and these areas are incorporated onto the
maps in Attachment 10, CBG also discussed speeds and pricing during the visit. Eltopia offers
dialup service; however, they also offer wireless broadband services with symmetrical speeds of
256 Kbps for $30.00 per month, 1.0 Mbps for $45.00 per month and 3.0 Mbps for $75.00 per
month. Eltopia anticipates expanding their network as economic concerns and demand dictate.
Internet Xpress offers fixed wireless service in Stevens County. It provides service at speeds of
768 Kbps-1.5 Mbps synchronous for $75.00 to $225.00 per month. Its canopy wireless system
offers speeds of 256 Kbps to 1.5 Mbps synchronous for $35.95 to $49.95 per month. In addition,
CBG Communications, Inc.
151
Internet Xpress is a reseller of DSL service where Qwest and CenturyTel offer DSL service in
the county. This service has speeds of 128 Kbps to 865 Kbps in the upstream direction and 256
Kbps to 7 Mbps in the downstream direction. DSL service ranges in price from $35.95 to $49.95
per month depending on the speed available to and chosen by the customer. Internet Xpress�s
coverage area for their wireless service is shown on the map in Attachment 10.
Charter has cable TV systems in the county. However, from information gleaned during the
drive out of Stevens County, they are not providing cable modem services at this time.
STEVENS COUNTY CONCLUSION
Stevens County has areas of the county that are provided with broadband options such as in and
around Colville, Chewelah, Valley, Kettle Falls and the Loon Lake/Clayton area. Outside of
these areas broadband options deteriorate quickly. The fixed wireless providers in Stevens
County have minimized the areas of the county with no broadband availability, but there are
significant geographical areas and associated residents that have no options today.
Broadband Providers in Each County Columbia Ferry Grays Harbor Lewis Stevens Airpipe X Broadstripe X TV Association of Republic X CenturyTel X X X X X Coast Communications X Columbia Rural Electric Association X Comcast X X X Eltopia X Inland Telephone (small area not included on map) X Rainier Connect (location of infrastructure not provided � not shown on maps) X

CBG Communications, Inc.
152
Broadband Providers in Each County Touchet Cable TV X Toledo Telenet X TDS (McDaniel) X Qwest X X X X Verizon X X
CBG Communications, Inc.
153
GAP AND FUTURE REQUIREMENTS ANALYSIS
As part of their business model, companies use a density formula regarding households (or
homes) passed per plant mile to determine whether it is cost feasible for the company to provide
services and recoup its investment within a period of time consistent with typical industry and
company ROI (Return On Investment). Although each company is using a different formula,
CBG has seen Comcast and other cable TV providers decline to build out their network to areas
with less than 30 homes per linear mile of infrastructure needed. In order for these companies to
provide wireline services in other areas, they would need to extend their systems by adding
additional fiber optics, additional nodes or DSLAMs and additional coaxial or twisted pair
cables, either underground by trenching and placing conduit and cable or aerial by developing
additional pole attachments and pulling strand and cable.
Although each of the counties has unique characteristics related to broadband availability, they
also have similar issues.
Throughout the five counties one theme holds true. The large providers such as Qwest, Comcast,
CenturyTel and Verizon, as well as most of the mid to small-sized companies, provide service in
the main population centers of the counties where household density reaches the company�s
minimum threshold. These centers tend to be along major highways and areas such as the
Pacific coast. These providers do not leave these population centers unless a business case can
be made to deploy further. The irony is that these providers will not share information on the
location of their facilities because it is deemed to be confidential and another provider may
overbuild their area and compete. These companies are more than willing to compete with
several other companies in more densely populated areas, but will not move into areas with even
slightly lower than their minimum density requirements, even when there is no competition. It
seems that if information that the companies are holding confidential truly is confidential and
that it keeps competitors out of their service areas, they would build into areas they see as not
being able to support more than one or two providers, but capable of supporting one provider
with no competition.
CBG Communications, Inc.
154
Taking into account the differences in the number of, and size of, population centers in the five
counties and therefore the number of pockets of broadband availability, one significant
difference between the counties is that providers have moved into areas of the three least
populated counties of Columbia, Ferry and Stevens to offer service with fixed wireless networks.
These networks require lower subscriber numbers and thus lower financial return to provide an
ROI that can justify deployment. An example of this is in Columbia County where there is only
broadband availability close to and within Dayton and Starbuck from Qwest and Touchet Valley
Television. This leaves significant numbers of residents near Dayton, and to a lesser degree
Starbuck, with no available options except for dialup and satellite based access to the Internet.
REA saw this as a problem for its existing power customers and deployed a fixed wireless
system to fulfill a need in the community. Although REA intends to continue to rollout its
service to more areas within Columbia County, they must adhere to a business plan that will
dictate a slower rollout than they would prefer. REA has found that a business case can be made
for initial roll-out in areas just outside of a small city and eventually further into the rural areas of
the county.
As stated throughout the Report, the more rural an area is in the five counties the more likely it is
that broadband is not available to residents. There is certainly little or no competition in the most
rural parts of the counties. The result of the lack of competition is evident in the case of
Columbia and Garfield (the location where the Prescott exchange is fed from) Counties where
Inland Telephone is providing service at levels of 128 Kbps upstream and 384 Kbps downstream
for $49.95 per month. Although this level of service is slightly better than dialup, the cost is far
higher than people would be required to pay in more urban areas of the State for far faster
speeds. For instance, where Comcast offers service, in more urban areas where competition
exists, they offer 356 Kbps in the upstream with 6 Mbps downstream for $45.95 and 786 Kbps
upstream and 8 Mbps downstream for $55.95 per month. Some of this cost differential is likely
due to the higher cost of deploying a service on a per subscriber basis in a rural area. However,
some of this variance is likely related to the lack of competition as well.
Another contributor to the absence of broadband in rural areas is the lack of backbone
infrastructure or the inability of a company to use infrastructure that is in place. If a company is
CBG Communications, Inc.
155
considering whether to deploy broadband in an area where other larger providers have not
entered due to low density, one of their first concerns is whether they can obtain a backbone
connection to the Internet and if so, at what cost? In a very small deployment where relatively
low infrastructure development is needed and therefore the business case can be made to deploy,
the lack of an affordable backbone solution may derail deployment.
BACKBONE INFRASTRUCTURE
Overall there is a significant gap in the backbone infrastructure available in all of the five
counties. This gap is far more evident in the counties of Columbia, Ferry and Stevens. The
Counties of Grays Harbor and Lewis have significant backbone infrastructure along the highway
corridors and Pacific coast.
In order to promote expansion of broadband availability in the counties and ultimately other
similar areas of the State, this needs to be the first issue addressed. Without a sufficient network
backbone into a given area, building a distribution network to offer broadband will not be
successful. The old adage that a chain is as weak as its weakest link is very fitting regarding
broadband deployment. A provider can offer an extremely high-speed distribution network.
However, if the link to the Internet is slow, the network is far less effective. An example of this
is the TV Association of Republic in Ferry County where customers of both the cable modem
and the wireless service mentioned during focus group meetings that Internet access is very slow
during peak times of the day. The TV Association of Republic attributes this to a slow
backbone connection. They have recently moved from 2 T-1s for connection back to the Internet
to a 100 Mbps wireless connection. As this occurred at the end of the data gathering stage of this
project, we only have preliminary feedback on the success of the high-speed backbone
connection, but what we have received appears to be positive.
Having a sufficient, cost-effective backbone in place will likely allow the major providers to
expand into rural areas where there are population pockets that would meet their ROI, if not for
the large expense of reaching the area with backbone infrastructure. In addition, this will allow
fixed wireless providers to be able to reach farther out into rural areas, again by minimizing one
of their greatest expenses.
CBG Communications, Inc.
156
With hotspots being a stop gap measure for providing broadband to residents in rural areas, an
enhanced backbone connection to the Internet will make these hotspots much more effective as
well.
Redundant Backbone
As shown above, a significant backbone infrastructure is needed throughout the five counties to
provide the basis for providers to effectively move forward with additional broadband
deployment. Another key element of this backbone infrastructure is redundancy. This becomes
an issue on two fronts. First, there is a critical need to keep Internet access available to the
networks that are deployed in order to ensure residents, businesses, governmental, educational
and other users are provided a significantly higher level of network availability (up-time) for
deployed networks. Although closely related, the second reason for building redundancy into a
backbone is to offer a more appealing network to potential providers, as well as to increase the
geographic area covered by the backbone, therefore removing another barrier to further
deployment of broadband into areas that are underserved or not served today.
FUTURE ACTIONS TO ADDRESS THE GAPS
The major providers have deployed broadband in all of the areas with large enough population
densities to achieve their stipulated ROIs. They have picked the relatively �low hanging fruit�.
However, they are not likely to expand their networks significantly beyond their current
boundaries without considerable growth in population or methods to improve their ROI. These
methods will likely need to include having the backbone in place as mentioned above, as well as
making it easy for the providers to enter Rights-of-Way and having infrastructure in place that
can be readily accessed to minimize the capital needed to deploy.
Counties and cities within the counties need to take proactive measures, in advance of broadband
deployment, such as placing conduit into open trenches when road construction is done or when
the PUDs, Electric Co-ops, water and sewer utilities and providers are performing other work in
the right-of way. With construction of wireline being the most significant capital expenditure,
this may bring the ROI into line with a company�s standards.
CBG Communications, Inc.
157
Overall, the gaps in broadband availability have developed closely with the line between densely
populated areas of the counties and lower density areas. As shown throughout the Report, there
are three significant areas that should be addressed in a viable manner:
Affordable and reliable backbone infrastructure to low density areas of the counties must
be a high priority - This is the foundation that allows deployment of broadband networks in
both high density areas and low density areas. Backbone issues are not prevalent in high density
areas, because private industry can find a viable business model to implement the backbone.
Ease of entry into a geographic area - Everything feasible that can be done by the local,
County and State governments should be done concerning ease of entry. This includes
streamlining the process for potential providers to gain access to the Rights-of-Way as well as
sharing in the cost of deployment by cooperating with providers during planned construction
activities so they can deploy infrastructure in the most cost effective manner.
Facilitating access to government network facilities - This may include, for example, space on
a tower or it may include utilization of excess fiber or conduit that is currently in place for
placement of new fiber. Governmental entities can also be proactive by installing excess
capacity during the roll-out of infrastructure for internal purposes.
In an attempt to address areas that do not have viable broadband options today and begin to
address getting viable broadband into these areas, it will be important to consider holding
discussions with large and small providers that exist today as well as seek out potential providers
and discuss what areas they believe would benefit from a collaborative deployment of backbone
infrastructure. Topics of these discussions would be potentially how a �backbone partnership�
could serve the most areas in the quickest manner, as well as working to create a full redundant
backbone throughout the counties over time. Essentially, the above can be delineated in the
following way:
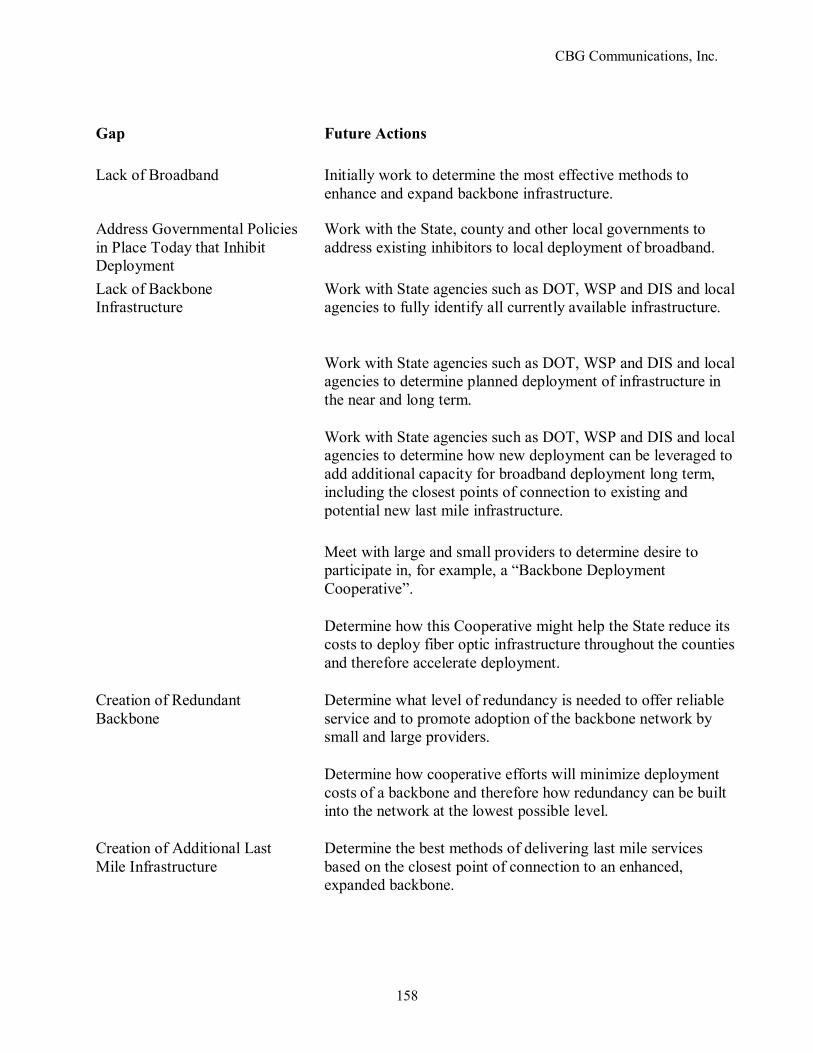
CBG Communications, Inc.
158
Gap Future Actions Lack of Broadband Initially work to determine the most effective methods to
enhance and expand backbone infrastructure.
Address Governmental Policies in Place Today that Inhibit Deployment
Work with the State, county and other local governments to address existing inhibitors to local deployment of broadband.
Lack of Backbone Infrastructure
Work with State agencies such as DOT, WSP and DIS and local agencies to fully identify all currently available infrastructure.
Work with State agencies such as DOT, WSP and DIS and local agencies to determine planned deployment of infrastructure in the near and long term.
Work with State agencies such as DOT, WSP and DIS and local agencies to determine how new deployment can be leveraged to add additional capacity for broadband deployment long term, including the closest points of connection to existing and potential new last mile infrastructure.
Meet with large and small providers to determine desire to participate in, for example, a �Backbone Deployment Cooperative�.
Determine how this Cooperative might help the State reduce its costs to deploy fiber optic infrastructure throughout the counties and therefore accelerate deployment.
Creation of Redundant Backbone
Determine what level of redundancy is needed to offer reliable service and to promote adoption of the backbone network by small and large providers.
Determine how cooperative efforts will minimize deployment costs of a backbone and therefore how redundancy can be built into the network at the lowest possible level.
Creation of Additional Last Mile Infrastructure
Determine the best methods of delivering last mile services based on the closest point of connection to an enhanced, expanded backbone.
CBG Communications, Inc.
159
Section H Comparative Analysis and Best
Practices
CBG Communications, Inc.
160
COMPARATIVE ANALYSIS AND BEST PRACTICES A comparison of broadband activity by and within the State with similar efforts around the
nation and world show that Washington has momentum and that broadband is expanding, but
that additional efforts will be needed to catch up and keep pace with other states and nations.
Specifically, when reviewing other activity and best practices, the following is found:
Broadband Initiatives in Other States
As access to reliable, affordable Internet service is becoming a key component of economic
development, many states have implemented statewide broadband initiatives to promote higher
levels of broadband access and adoption in rural areas previously underserved by Internet service
providers. Rural residents have long trailed residents of cities and suburbs in terms of both
Internet usage and broadband adoption. According to Horrigan and Smith (2007), 31 percent of
rural Americans have home broadband connections, compared with 49 percent of suburban
residents and 52 percent of urban residents.60 Recently, rural broadband has experienced growth,
which can partially be attributed to various statewide rural broadband initiatives. Between 2006
and 2007, high-speed Internet usage among rural adults grew by 24 percent, versus 18 percent
for urban residents and 7 percent for suburban residents. In other words, rural broadband is the
final mile, so to speak, in the United States� efforts to bring the assets of high-speed Internet
access fully to its citizens.
Horrigan and Smith (2007) found a significant, negative correlation between living in a rural
area and broadband usage. They point to the lack of infrastructure in rural areas as a contributing
factor in the slow growth in rural broadband adoption.61 In terms of access to broadband at home
or at work, only 38 percent of rural residents have access to broadband at their home or their
work, compared to 56 percent of suburban residents and 58 percent of urban residents.62
60 John B. Horrigan and Aaron Smith, �Home Broadband Adoption 2007,� Pew Internet & American Life Project, June 2007, http://www.pewInternet.org/pdfs/PIP_Broadband%202007.pdf (May 26, 2008). 61 Horrigan and Smith, �Home Broadband Adoption 2007,� p. 8. 62 Horrigan and Smith, �Home Broadband Adoption 2007,� p. 8.
CBG Communications, Inc.
161
Most statewide broadband initiatives aim to develop infrastructure in rural areas allowing for
broadband deployment. Some of the key components that states must consider when developing
broadband programs are: the policy goals of the broadband initiative, the funding sources, how
public right-of-way usage will be made available, infrastructure elements that need to be built or
enhanced, the geographic locations to be served, what provider will build and operate the system,
and who will financially contribute to the broadband initiative.63
The Center for Digital Government (CDG) found that states who have already adopted an active
broadband infrastructure initiative seem to take one of three general approaches. The CDG has
found that all three approaches can be successful, and all three have been implemented by
various states.
Encourage the Private Sector to Build
The first statewide approach aims to encourage the private sector to install high-capacity
infrastructure throughout the state with the creation of a statewide public network connecting all
levels of government, education and healthcare. States like Washington and Colorado have used
this approach to varying degrees and acted as aggregators of public demand for advanced
telecommunications infrastructure and anchor tenants that purchase enough statewide service to
create the demand required to convince service providers to invest the required resources to
deliver broadband access to all parts of the state.
Create a Broadband Authority in the State
The second approach is to create a broadband authority with powers and duties conferred either
through executive order or legislation. California is one state that has used this approach and
created a state Broadband Authority with the legal power to collect funding. The Authority then
makes grants or loans to commercial infrastructure providers or communities.
63 Center for Digital Government, �Arizona Broadband Initiative Framework: Analysis and Report,� Arizona Government Information Technology Agency Page, March 2007, http://www.azgita.gov/telecom/ciac/supplementary/CDG%20Az%20Broadband%20Initiative%20Framework%20Final.pdf (May 26, 2008)

CBG Communications, Inc.
162
Create a Public/Private Partnership
The third approach is to create a public/private partnership where private companies and
government entities work together to promote broadband availability. Kentucky and Utah are
two states that rely on a public/private partnership that coordinates infrastructure expansion
efforts that rely on both public and private funding.
One key aspect for the successful implementation of broadband initiatives at the state level is a
coordinated, analytic approach which seeks to evaluate and understand the extent of broadband
access and adoption. Kentucky is one state that has been particularly successful in mapping the
availability of broadband access and using maps to plan future broadband expansion projects.
KENTUCKY
The ConnectKentucky program is a public/private, non-profit, technology-based development
partnership that is funded through state, federal and private dollars. The goal of the
ConnectKentucky program is to leverage federal and private investment to blanket Kentucky
with high-speed Internet access. The program also aims to create a more useful online presence
for all Kentucky communities, to improve citizen services and promote economic development.
The program seeks to create an eCommunity Leadership Team in every county, where local
leaders assemble to develop and implement technology growth strategies.
The program has been successful in expanding broadband availability and connectivity by
creating a network of public/private partnerships that �relieve the short-term return on
investment pressure and instead create an environment where a long-term view of return of
investment is calculated.� Since part of the investment is coming from the public sector, the
return can be calculated to include economic development, distance learning and the
improvement of electronic government capabilities.
CBG Communications, Inc.
163
Kentucky closely and regularly updates its records of the number of households actually
connected to the Internet via broadband access. As of August 2007, 94 percent of Kentucky
households are able to subscribe to broadband, compared to only 60 percent in 2001.64
CALIFORNIA
California has a broadband initiative model based on state executive leadership. In October of
2006, the Governor of California issued Executive Order S-21-06 entitled �Twenty-First Century
Government Expanding Broadband Access and Usage in California.� The executive order
established a broadband task force to advise the government on how to promote broadband
access and usage and designated the Business, Transportation & Housing (BT&H) Agency as the
lead coordinator for implementing the state�s broadband policy and ensuring its efficiency.
The executive order called for BT&H to collect and analyze current data on broadband so the
state government could accurately map existing resources. The executive order called for fair
cost of rights-of-way access so that Internet service providers could afford to develop the
broadband network across the state. The order also called for streamlined, expedited rights-of-
way permitting procedures to accelerate broadband development.65 The state also determined
that they will switch to a cost-only fee basis for fiber optic installation, passing on to private
companies only the actual costs incurred for permits and other construction.
The California Teleconnect Fund (CTF) Program, established in 1996, has also helped to
increase broadband access throughout the state. The CTF program provides a 50 percent
discount on certain telecommunications services to qualifying schools, libraries, public hospitals
and health clinics and community based organizations.
COLORADO
The state of Colorado instituted the Multi-Use Network (MNT) Program in 1998. Colorado�s
MNT is a public/private partnership to build a high-speed fiber optic network across the state.
64 Tracie Rotermann, �ConnectKentucky Success Spurs Growth,� ConnectKentucky Press Release, August 9, 2007, http://www.connectkentucky.org/_documents/PressRelease_Legg_True_Final.pdf (May 28, 2008). 65 State of California, �California Teleconnect Fund,� California Public Utilities Commission Page, 2007, http://www.cpuc.ca.gov/PUC/Telco/Public+Programs/CTF/ (May 28, 2008).
CBG Communications, Inc.
164
Qwest Communications was the partner selected to build the MNT with the state serving as an
anchor tenant. The state agreed to aggregate its data communications circuits onto the MNT and
purchase a large portion of bandwidth if Qwest Communications would build a high-speed
digital network comprised of fiber optic infrastructure. It took three years to complete the
network, but with the basic system in place, it made it feasible for service providers to offer
service to more rural areas. As of 2007, 97 percent of all county seats in Colorado have at least
DSL service. Furthermore, Colorado officials report that the number of technology-dependent
jobs in rural areas has increased 6 percent.66
Colorado has also implemented the �Beanpole� project, managed by the Department of Local
Affairs, to address providing broadband access to the last of the rural areas. Beanpole funding is
provided for community level aggregation of network traffic, also known as community
incentive funding. The Department of Local Affairs and the Colorado Rural Development
Council manage the $4.6 million program. The money for the Beanpole project came from the
state legislature as outlined below.
Of the total budget for the Beanpole project, $3,176,000 came from the capital construction fund
that the community-based access grant program established. Of this amount, $2,800,000 was
deposited into the capital construction fund from the Colorado Advanced Technology Institute�s
share of the proceeds of Supernet, and $376,000 represents funds transferred to the capital
construction fund. A sum of $1,500,000 was made available to local governments for the
community-based access grant program coming from the local government severance tax fund.
In addition to other appropriations, $124,000 was appropriated to the Department of Local
Affairs.67
Priority for Beanpole funding was directed towards those communities that demonstrated a very
high likelihood of success in attracting private sector deployment of infrastructure and to
communities that were close to where the initial phase of the Multi-Use Network backbone
connection to an Aggregated Network Access Point (ANAP) was expected to occur.
66 Colorado Division of Information Technologies, �MNT 2005-2006 Annual Report,� October 2006, http://www.colorado.gov/dpa/doit/mnt/DoIT-MNTAnnualReport-FinalWeb06.pdf (May 28, 2008). 67 Colorado State Legislature, �House Bill 99-1102,� Colorado State Government Page, 1999, http://www.state.co.us/gov_dir/leg_dir/sess1999/hbills99/hb1102.htm (May 28, 2008)
CBG Communications, Inc.
165
Beanpole funding is allocated through a competitive grants system, with applicants applying for
grants in one of three categories: Basic Technical Assistance Planning Grant Funding; Advanced
Technical Assistance Planning Grant Funding; and Implementation Funding. Beanpole funding
is not provided for personnel costs.
MONTANA
The Montana Health Research and Education Foundation (MHREF), on behalf of the Montana
Health Association (MHA), applied to be a part of an FCC pilot program to develop a statewide
infrastructure to connect all hospitals, mental health centers and community health centers
through a secure, dedicated broadband healthcare network.68 This would enable multiple
applications, such as video conferencing, electronic health records and other data services to run
simultaneously.
On May 3, 2008, Blackfoot Telecommunications Group announced that it would launch a new
business package named BizBundles to fit the needs of rural business owners located in 22
Western Montana communities. BizBundles will provide these communities with up to 15 Mbps
of high-speed Internet access. Blackfoot indicates that it recognizes that access to quality high-
speed Internet will be critical for the future of businesses in rural Montana and thus has created
an enhanced fiber optic network to allow them to deliver bundled business services at an
affordable price and at speeds usually only offered in metropolitan areas.69
UTAH
In 2002, a group of 16 cities in Utah, 11 of which pledged financial backing, formed a
consortium to create the Utah Telecommunication Open Infrastructure Agency (UTOPIA),
which delivers high-speed Internet access through a fiber optic cable. UTOPIA is a non-profit
government agency that is considered an extension of the municipalities that created it. UTOPIA
is funded through municipal bonds issued by participating communities. UTOPIA pays back its
bonds by collecting a fee whenever a service provider signs up a homeowner for one of its
68 Federal Communications Commission, �Montana Healthcare Telecommunications Alliance Application,� Consumer & Governmental Affairs Bureau Page, May 4, 2007, http://www.fcc.gov/cgb/rural/rhcp_applications.html (May 27, 2008) 69 Kate Olney, �Blackfoot Delivers Unprecedented Broadband Speed to Rural Costumers,� Market Wire, May 5, 2008.
CBG Communications, Inc.
166
services. There are four service providers available on the network, and at a minimum, UTOPIA
delivers 100 Mbps of bandwidth to every connected home and 1 Gbps of Bandwidth to every
business. The network was designed in a way that future upgrades to higher speeds should be a
relatively inexpensive process.
UTOPIA was designed to meet the following principles: UTOPIA is a wholesale network open
to unlimited potential service providers. The network is made up of secure and scalable
infrastructure delivering carrier-class reliability. The network is capable of integration with
hardware from multiple vendors. UTOPIA can deliver dedicated bandwidth at speeds of 100
Mbps or greater to every address.70
UTOPIA has run into a number of problems along the way, but is still pushing forward with
building the fiber optic network. A number of municipalities have abandoned UTOPIA amid
financial difficulties, only leading to further financial woes for the utility.71 Faced with serious
financial problems, UTOPIA asked member cities to approve a $181 million refinance. The
Agency�s leadership argues that �the UTOPIA plan ran into unforeseen challenges, including a
faulty loan from the federal government through the Rural Utility Service.�72
Other UTOPIA shortcomings have included a lack of telecommunications experts working on
the project and a failure to communicate with elected officials. As the refinance was debated,
many UTOPIA opponents called for the Agency to sell. These opponents claimed that UTOPIA
is trying, unsuccessfully, to compete with private network providers. UTOPIA leadership
claimed that the network is not trying to compete with major companies such as Qwest and
Comcast, but rather to provide an infrastructure that allows those major companies to provide
their services.73 UTOPIA proponents have called UTOPIA a necessity and compared the open
70 UTOPIA, �Architecture,� Utopia Connecting Communities Page, 2006, http://www.utopianet.org/what/agency/network.html (May 26, 2008) 71 Christopher Rhoads, �Cities Start Own Efforts to Speed Up Broadband,� The Wall Street Journal, May 19, 2008, Business Section. 72 Rebecca Palmer, �10 of 11 cities OK $181 million UTOPIA Refinance,� Deseret Morning News, May 6, 2008, News Section. 73 James Davis and Rebecca Palmer, �Payson Again Rejects Plan to Refinance UTOPIA,� Deseret Morning News, May 13, 2008.
CBG Communications, Inc.
167
infrastructure to a highway or interstate, something that everyone uses but the government pays
to build.74
Of the 11 member cities who pledged to financially support UTOPIA, all but one voted for the
$181 million refinancing plan. In May of 2008, the Town of Payson, Utah voted 4-1 against the
UTOPIA refinancing plan. With support from 10 of the 11 municipalities, UTOPIA plans to go
ahead with the refinancing plan. UTOPIA expects that it will be able to continue building fiber
optic rings in member cities and that increased customer sign-ups will provide the capital needed
for further construction. However, UTOPIA has declined to answer questions about how build-
out will occur and about connection fees.75
OREGON
In 2001, Oregon�s Senate Bill 765, created the Oregon Telecommunications Coordinating
Council (ORTCC) to bring high-speed, digital telecommunications to all of Oregon. The
ORTCC is �responsible for enhancing the coordination of local, regional and state
telecommunication plans to accelerate the development of advanced telecommunication services
to the entire state of Oregon.�76
According to the ORTCC, �Oregon has a telecommunications infrastructure extending
throughout the state that is world class. Fiber optic backbone networks and extensive broadband
access provide excellent network reliability and connectivity throughout the state.�77 One way
that Oregon promotes the development of broadband access across the state is by offering a tax
credit for capital asset investment, including the installation of broadband infrastructure, by firms
engaged in electronic commerce if they are located in approved or designated areas.78 However,
the ORTCC admits that Oregon must recognize that infrastructure is always a work in progress
74 Rebecca Palmer, �10 of 11 cities OK $181 million UTOPIA Refinance.� 75 Rebecca Palmer, �10 of 11 cities OK $181 million UTOPIA Refinance.� 76 Oregon Telecommunications Coordinating Council, �Senate Bill 765,� ORTCC Creation Law Page, July 29, 2005, http://www.ortcc.org/lawpage.html (May 27, 3008) 77 ORTCC, �From Silicon Forest to Internet Forest: A Vision for the Oregon Economy,� ORTCC Reports Page, January 22, 2007, http://www.ortcc.org/PDF/InternetForest1-22-07.pdf (May 26, 2008). 78 Erin Lee, �State Efforts to Expand Broadband Access,� National Governors Association Center for Best Practices Page, May 20, 2008, http://www.nga.org/Files/pdf/0805BROADBANDACCESS.PDF (May 26, 2008)

CBG Communications, Inc.
168
and that Oregon needs to work to further support broadband access for commerce, education,
healthcare and personal use.
However, a recent article in the Portland Business Journal contends that Oregon has not pursued
the types of aggressive statewide initiatives implemented by some of its neighbor states, but only
has some smaller projects underway. One project is the Oregon Health Network, an effort to link
all of Oregon�s health care facilities through high-speed broadband. The project has received $20
million in funding from the Federal Communications Commission as part of an initiative to
improve rural healthcare across the United States.79
Some rural communities in Oregon are building their own advanced networks. Two small cities
in Oregon, Monmouth and Independence, have created a joint, non-profit fiber optic network to
serve their communities with high-speed broadband. The network delivers competitively priced
Internet service, telephone and video services.80
The Oregon Telecommunications Coordinating Council is proposing that the state create a
public/private partnership to develop several new Internet traffic �nodes� in Oregon that would
have the dual effect of routing international Internet traffic through the state and making
intrastate Internet traffic faster and more efficient. Currently, Oregon has two primary Internet
routing nodes: one at the University of Oregon and one in downtown Portland. If Oregon
established more nodes, some of the Internet traffic could be routed into the state, creating more
business opportunities. 81
IDAHO
In 2006, the Idaho state legislature appropriated $5 million for extending broadband access to
rural communities. The program offered grants for up to 50 percent of the costs of projects with
a cap of $1 million for any specific project. In June 2006, $4.9 million in grant funds were made
available to four Idaho companies, yielding a total public/private investment of $9.8 million to
finance 79 projects to bring broadband access to 50,000 potential new subscribers.82
79 Aliza Earnshaw, �Organizing Oregon�s broadband assets,� Portland Business Journal, November 30. 2007, Industry section. 80 Aliza Earnshaw, �Organizing Oregon�s broadband assets.� 81 Aliza Earnshaw, �Organizing Oregon�s broadband assets.� 82 Center for Digital Government, �Arizona Broadband Initiative Framework.�
CBG Communications, Inc.
169
The IDANET project, Idaho�s broadband digital telecommunications initiative, is the state�s
attempt to leverage its buying power. �By aggregating existing dollars spent by state agencies
and higher education -- and serving as an anchor tenant -- the state hopes to encourage
telecommunications carriers to deploy broadband telecommunications services in Idaho to not
only serve state government but also serve the public at large.�83 All IDANET contracts have an
initial term of five years with two 2-year options to renew after the initial term. The contracts
provide statewide access to telecommunications services and can be used by State agencies,
higher education, K-12, local government and other public entities.84
NORTH CAROLINA
The North Carolina General Assembly created the e-NC Authority on August 14, 2003 when
Governor Michael Easley signed House Bill 1194, calling for the e-NC Authority to continue the
work of the Rural Internet Access Authority. The e-NC Authority is dedicated to �increasing
prosperity for North Carolina citizens and businesses by creating jobs through technology-based
economic development, which requires a broadband Internet platform for success.�85 The
initiative is a public/private partnership between the North Carolina Rural Economic
Development Center, the legislature and state government, the telecommunications industry,
non-profit organizations and individuals.
The goals of e-NC include: providing high-speed Internet at competitive prices to all North
Carolinians, to increase the number of Internet subscribers in North Carolina, to establish
telecenters in the state�s most economically distressed areas and to develop Internet applications
that improve government services, particularly education and healthcare. 86 The e-NC Authority
also tracks the telecommunications infrastructure and the availability of high-speed Internet
services in all 100 North Carolina counties. This allows the Authority to advocate for
83 IDANET, �About IDANET,� Connecting Idaho Today and Tomorrow Page, 2002, https://www2.state.id.us/idanet/about.htm (May 27, 2008). 84 IDANET, �What is the status of IDANET,� Connecting Idaho Today and Tomorrow Page, 2002, http://www2.state.id.us/idanet/faqs.htm (May 27, 2008). 85 North Carolina e-NC Authority, �What is e-NC?� 2004, http://www.e-nc.org/Webpage.asp?page=10 (May 28, 2008). 86 North Carolina e-NC Authority, �What is e-NC?�
CBG Communications, Inc.
170
telecommunications expansion in underserved counties. The organization�s efforts are
technology-neutral and do not advocate for any specific vendor or type of connectivity.87
The e-NC authority primarily serves the state�s 85 rural counties (a county with a population
density of 250 people per square mile or less). Only 15 North Carolina counties are not
classified as rural. The Authority also serves �distressed urban communities,� which are
communities where more than 10 percent of children enrolled in public school meet the
requirements for the USDA Food Stamp Program, or where 10 percent of the citizens meet the
U.S. Department of Health and Human Services requirements for Temporary Assistance for
Needy Families, or where 25 percent of the children in the public school district meet the
requirements for a federal government-sponsored free lunch.88
The e-NC Authority has funded several initiatives in North Carolina including digital literacy
training, e-communities implementation, e-communities planning, Leg-UP (the Local e-
Government Utilization Project), public access initiatives and telecenter initiatives. Twenty-
seven sites have received e-NC grants for digital literacy training which have been used for
Spanish language portals. Fifty-three sites have received $5,000 grants for support of public
access sites, and 64 rural counties have received $12,000 of public access grants. Ten
communities have received e-NC funding for local telecenters.89
As a part of a public/private partnership, the e-NC Authority awarded an incentive grant of $1.21
million to Embarq Corporation on January 18, 2008 to fund the expansion of high-speed Internet
services in 4 rural counties: Gates, Green, Jones and Warren counties. These four counties are
considered critically underserved areas as less than 50 percent of households in each of the
counties have access to high-speed Internet. These funds were available to qualified service
providers through a structured and competitive Request for Proposals process. The grant was
made available through an allocation from the 2007 North Carolina General Assembly and the
87 North Carolina e-NC Authority, �What is e-NC?� 88 North Carolina e-NC Authority, �Population Served?� 2004, http://www.e-nc.org/Webpage.asp?page=10 (May 28, 2008). 89 North Carolina e-NC Authority, �Grants Funded?� 2004, http://www.e-nc.org/Grantsfunded.asp (May 28, 2008).
CBG Communications, Inc.
171
award will be matched by Embarq. The e-NC authority requires that these grants be matched
dollar-for-dollar by the corporation awarded the grant.90
As of January 18, 2008, approximately 83 percent of North Carolina households had the ability
to access a high-speed Internet connection, according to e-NC. Approximately 20 counties
remained critically underserved (less than 70 percent of households having the ability to access a
high-speed Internet connection) as of January 2008.91
In November 2007, several North Carolina projects were selected to participate in the FCC�s
Rural Health Care Pilot Program and receive federal funding. These projects include the North
Carolina Telehealth Network, the Western Carolina University Broadband Network, the
Albemarle Network Telemedicine Initiative and the University Health System of Eastern
Carolina.
The North Carolina Telehealth Network is a regional network that will connect approximately 16
health care facilities in 11 counties with patients in their homes and at work to provide home
monitoring, personal health records and prescription drug use compliance information. The
maximum support from the FCC for this project will be $6,023,985.92
Western Carolina University will receive up to $3,596,290 to use in collaboration with the
Eastern Band of Cherokee Indians to create a broadband network that will connect the University
health care system to health care facilities serving residents on the Cherokee reservation and in
outlying areas. More than 200 facilities will be connected to the network at speeds between 10
Mbps and 100 Mbps.93
90 e-NC, �State Grants Extend High-Speed Internet to Four Rural Counties,� e-NC Press Release, January 18, 2008, http://www.e-nc.org/pdf/2008-01-25_incentive_grant.pdf (May 28, 2008). 91 e-NC, �State Grants Extend High-Speed Internet to Four Rural Counties,� e-NC Press Release, January 18, 2008, http://www.e-nc.org/pdf/2008-01-25_incentive_grant.pdf (May 28, 2008). 92 Universal Service Administrative Company, �Rural Health Care Pilot Program,� Selected Participants Page, January 10, 2008, http://www.usac.org/rhc-pilot-program/tools/selected-participants.aspx (May 28, 2008). 93 Universal Service Administrative Company, �Rural Health Care Pilot Program.�
CBG Communications, Inc.
172
Under the Albemarle Network Telemedicine Initiative, which can receive up to $1,583,076,
approximately 65 health care facilities will have access to a broadband network enabling
computerized physician orders.94
With FCC support of up to $960,939, the University Health System of Eastern Carolina will add
approximately 16 rural health care facilities to their existing fiber network. This expanded
network will serve a rural population which suffers from higher rates of chronic disease than the
state average.95
WASHINGTON
The State of Washington has built a �Network of Networks� to support public sector
telecommunications statewide. According to the Center for Digital Government, �Nearly all of
the data transport in state government is combined onto the state Department of Information
Services� (DIS) managed Wide Area Network (WAN) infrastructure.� This allows DIS to
�competitively acquire large amounts of bandwidth from private sector providers, thereby
driving down costs for telecommunications goods and services while boosting available speed
and capacity.� This Next Generation Network (NGN) is a high-speed, high-capacity
telecommunications infrastructure that has an established access point in all 39 Washington
counties.96
Washington�s K-20 Education Network, launched in 1996 with funds from the State Legislature,
provides educational sectors across the state, in communities of all sizes and in urban and rural
areas, with dedicated, scalable telecommunications capacity. Educators and students at more
than 400 public education sites including community and technical colleges, baccalaureate
institutions, independent colleges, the public library system, K-12 school districts and
educational service districts are able to use the K-20 Network technology to communicate with
94 Universal Service Administrative Company, �Rural Health Care Pilot Program.� 95 Universal Service Administrative Company, �Rural Health Care Pilot Program.� 96 Washington State Department of Information Services, �K-20 Education Network Background,� Enterprise Initiatives Page, 2008, http://www.dis.wa.gov/enterprise/k20network/K20_Briefing_111506.pdf (May 28, 2008).
CBG Communications, Inc.
173
one another. The network is built with a high-speed telecommunications backbone that connects
the various sites and breaks the traditional barriers of distance and cost.97
Part of the hoped success of Washington�s program is that by aggregating public service and
education demand, the Department of Information Services presents this need to the private
sector as a single package. Telecommunication providers know the requirements and have
specific capacity needs clearly defined for each location in the state.98 Service providers can
then submit cost quotes for sections of the network or for the entire network and DIS selects
providers for each of the segments and creates a virtual, single, statewide network.
Although Washington is making efforts to bring broadband to more rural areas, as Jerry
Cornfield, a writer for the Daily Herald observed, �there are still large chunks of the state and of
the population without DSL, cable, fiber optic, wireless or satellite service because it�s either not
available or not affordable.�99
On March 28, 2008, Governor Christine Gregoire signed Engrossed Second Substitute Bill 6438
into law, to go into effect on June 12, 2008.100 The law requires the development of a strategy to
deploy high-speed Internet access across the state, especially to underserved areas. The strategy
will be a public/private collaboration between the government and private companies and
individuals involved in local community development and planning. The bill also created the
Community Technology Opportunity Program to provide access to broadband technologies and
broadband training to low-income, disabled and underserved residents. 101
97 Washington State Department of Information Services, �K-20 Education Network,� Enterprise Initiatives Page, 2008, http://www.dis.wa.gov/enterprise/k20network/ (May 28, 2008). 98 Washington State Department of Information Services, �K-20 Education Network,� Enterprise Initiatives Page, 2008, http://www.dis.wa.gov/enterprise/k20network/ (May 28, 2008). 99 Jerry Cornfield, �State hopes to increase access to high-speed Internet,� The Daily Herald, May 19, 2008, Local News Section. 100 Washington State Legislature, �SB 6438,� Bill Information Page, April 1, 2008, http://apps.leg.wa.gov/billinfo/summary.aspx?bill=6438&year=2007 (May 28, 2008). 101 Washington State Legislature, �SB 6438,�
CBG Communications, Inc.
174
TechNet conducted research in 2003 and developed a State Broadband Index ranking system
which ranks states based on state laws, regulations and policies that can significantly impact
broadband deployment based on three categories: policies that encourage broadband deployment,
supply-side policies and demand-side policies. TechNet analyzed the policies of each state and
assigned a numerical value for each policy. Washington was ranked 6th in the overall state
broadband index.102
Local Level
Regarding efforts at the local level, besides those profiled in other sections of this Report
concerning Springdale, Marcus and Northport in Stevens County, Centralia and Chehalis in
Lewis County, FTTP system development in Grant County and Pend Oreille�s FTTP planning
effort, there are a number of other projects, pilots and plans underway at the local level
throughout the State, including FTTP systems in Chelan County and FTTP planning in Seattle,
wireless broadband provision in Douglas County and Spokane, broadband system planning in
various areas of King and Pierce Counties, broadband system development in Forks, WA and
other initiatives. This shows a high level of activity at the local level in Washington as well as
the State�s current statewide initiatives.
Federal Funding
States seeking to implement broadband initiatives to give rural areas access to high-speed
Internet can look to the Federal Communications Commission (FCC) as one possible source of
funding. The FCC�s Schools and Libraries Universal Service Program (commonly known as �e-
rate�) provides financial support for initiatives aimed to provide broadband services to schools
and libraries. The �e-rate� program, established as part of the Telecommunications Act of 1996,
102 Kathryn Keller, �TechNet Releases New State-by-State Ranking of Broadband Policies,� TechNet In the News Page, July 17, 2003, http://www.technet.org/news/release/?postId=6296&pageTitle=TechNet+Releases+New+State-by-State+Ranking+of+Broadband+Policies+-+Texas+Ranks+4th (May 27, 2008).
CBG Communications, Inc.
175
provides affordable telecommunications services for all eligible schools and libraries,
particularly those in rural and economically disadvantaged areas. According to the FCC, �The
level of discount is based on a school�s or library�s level of economic disadvantage and its
location. Facilities in rural areas receive higher discounts in certain instances than their urban
counterparts.�103
The Rural Health Care Support Program provides financial support for broadband deployment to
rural health care providers, both public and non-profit. The program is intended to ensure that
rural health care providers pay no more for Internet access in the duty of providing health care
services than urban health care providers. According to the FCC, �The program will pay for 25%
of the cost of Internet access, and up to $180 a month in toll charge credits if toll-free service to
an Internet service provider isn�t available.�104
The FCC announced the Rural Health Care Pilot Program on November 19, 2007. The FCC
selected 69 participants from 42 states and 3 U.S. territories to receive funding for up to 85
percent of the costs associated with the construction of a state or regional broadband network and
the advanced telecommunications and information services provided over that network,
connecting to Internet 2 or National LambdaRail (NLR), and connecting to the public Internet.
The Universal Service Administrative Company (USAC) administers the program under the
oversight of the FCC. The Commission planned for approximately $417 million to be spent over
a three year period on the pilot program.105
The U.S. Department of Agriculture (USDA) provides low-interest loans that may be used to
build new telecommunications networks in rural areas or to modernize existing networks. The
USDA�s Rural Development Broadband Program provides loans and loan guarantees �to fund
103 FCC, �Support for Broadband Services in Schools and Libraries,� Funding for Rural Broadband Services Page, January 31, 2008, http://wireless.fcc.gov/outreach/index.htm?job=funding (May 27, 2008). 104 FCC, �Assistance for Rural Telemedicine Services,� Funding for Rural Broadband Services Page, January 31, 2008, http://wireless.fcc.gov/outreach/index.htm?job=funding (May 27, 2008). 105 FCC, �Rural Health Care Pilot Program,� Consumer & Government Affairs Bureau Page, March 28, 2008, http://www.fcc.gov/cgb/rural/rhcp.html#faq1 (May 28, 2008).
CBG Communications, Inc.
176
the cost of construction, improvement, or acquisition of facilities and equipment for the
provision of broadband service in eligible rural communities.� 106
International Broadband Initiatives
In April 2007, when the Organization for Economic Cooperation and Development (OECD)
released its Broadband Statistics Report for 2006, it was clear that the United States was falling
behind many leading European and Asian countries in terms of broadband deployment and
adoption. When the OECD first collected this data in 2001, the United States ranked 4th. The
United States now ranks 15th among the 30 OECD nations according to the organization�s
semiannual survey of broadband subscriptions. The U.S. does have the largest total number of
broadband subscribers in the OECD�s ranking at 58.1 million.
The report also showed that the total number of broadband subscribers in the OECD increased 26
percent from December 2005 (157 million subscribers) to December 2006 (197 million
subscribers). The report also highlighted the continued advance of European countries in
achieving high broadband penetration rates. In December 2006, Denmark and the Netherlands
became the first two countries in the OECD to surpass 30 subscribers per 100 inhabitants. Fiber-
to-the-home (FTTH) and fiber-to-the-building (FTTB) connections also increased as several
countries have continued upgrading to fiber optic networks. Korea and Japan each have more
than 6 fiber based broadband subscribers per 100 inhabitants. Japan leads the OECD rankings in
FTTH with 7.9 million FTTH subscribers in December 2006. FTTH subscribers in Japan alone
outnumber total broadband subscribers in 23 of the 30 OECD countries.
106 FCC, �Broadband Funding,� Broadband Opportunities for Rural America Page, January 31, 2008, http://wireless.fcc.gov/outreach/index.htm?job=broadband_home (May 27, 2008).
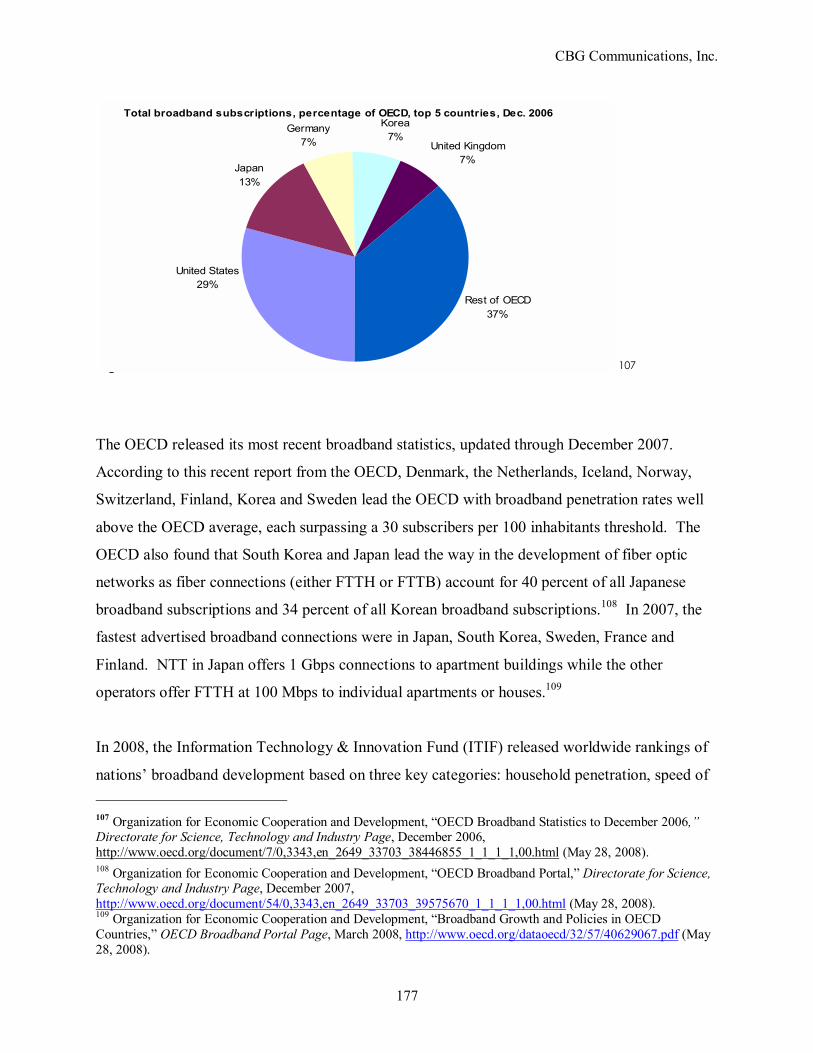
CBG Communications, Inc.
177
Japan13%
Germany7%
Rest of OECD37%
United States29%
Korea7%
United Kingdom7%
Total broadband subscriptions, percentage of OECD, top 5 countries, Dec. 2006
S107
The OECD released its most recent broadband statistics, updated through December 2007.
According to this recent report from the OECD, Denmark, the Netherlands, Iceland, Norway,
Switzerland, Finland, Korea and Sweden lead the OECD with broadband penetration rates well
above the OECD average, each surpassing a 30 subscribers per 100 inhabitants threshold. The
OECD also found that South Korea and Japan lead the way in the development of fiber optic
networks as fiber connections (either FTTH or FTTB) account for 40 percent of all Japanese
broadband subscriptions and 34 percent of all Korean broadband subscriptions.108 In 2007, the
fastest advertised broadband connections were in Japan, South Korea, Sweden, France and
Finland. NTT in Japan offers 1 Gbps connections to apartment buildings while the other
operators offer FTTH at 100 Mbps to individual apartments or houses.109
In 2008, the Information Technology & Innovation Fund (ITIF) released worldwide rankings of
nations� broadband development based on three key categories: household penetration, speed of 107 Organization for Economic Cooperation and Development, �OECD Broadband Statistics to December 2006,� Directorate for Science, Technology and Industry Page, December 2006, http://www.oecd.org/document/7/0,3343,en_2649_33703_38446855_1_1_1_1,00.html (May 28, 2008). 108 Organization for Economic Cooperation and Development, �OECD Broadband Portal,� Directorate for Science, Technology and Industry Page, December 2007, http://www.oecd.org/document/54/0,3343,en_2649_33703_39575670_1_1_1_1,00.html (May 28, 2008). 109 Organization for Economic Cooperation and Development, �Broadband Growth and Policies in OECD Countries,� OECD Broadband Portal Page, March 2008, http://www.oecd.org/dataoecd/32/57/40629067.pdf (May 28, 2008).
CBG Communications, Inc.
178
average download and price. South Korea was ranked first with household penetration at 93
percent, average download speeds of 49.5 Mbps and average cost at $.037 per Mbps. The top
five countries (in order) were: South Korea, Japan, Finland, the Netherlands and France.
Although Japan came in second, it had a very close composite score to South Korea. South
Korea has higher penetration rates, but Japan has higher download speeds and a lower cost of
access. The United States ranked 15th, with household penetration of 57 percent, average
download speed of 4.9 Mbps and average cost of $2.83 per Mbps.110
[Rest of page left intentionally blank]
110 The Information Technology & Innovation Foundation, �2008 ITIF Broadband Rankings,� Policy Issues Page, May 2008, http://www.itif.org/index.php?id=143 (May 28, 2008).
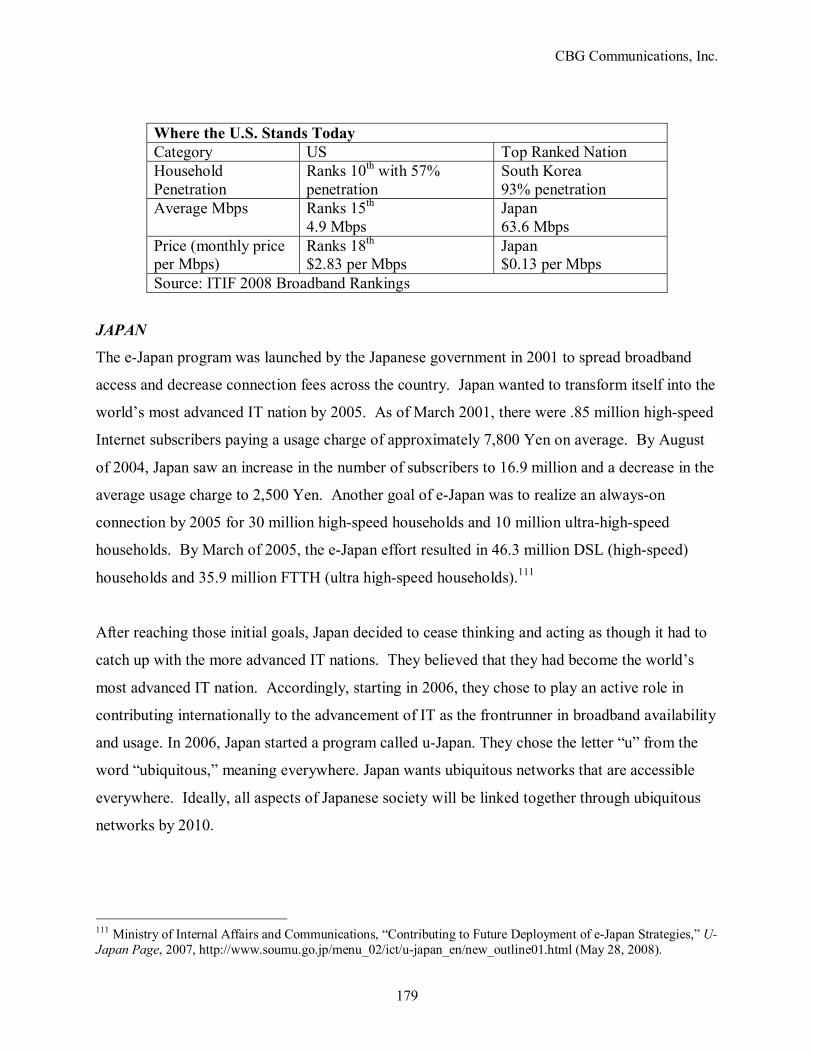
CBG Communications, Inc.
179
Where the U.S. Stands Today Category US Top Ranked Nation Household Penetration
Ranks 10th with 57% penetration
South Korea 93% penetration
Average Mbps Ranks 15th 4.9 Mbps
Japan 63.6 Mbps
Price (monthly price per Mbps)
Ranks 18th $2.83 per Mbps
Japan $0.13 per Mbps
Source: ITIF 2008 Broadband Rankings
JAPAN
The e-Japan program was launched by the Japanese government in 2001 to spread broadband
access and decrease connection fees across the country. Japan wanted to transform itself into the
world�s most advanced IT nation by 2005. As of March 2001, there were .85 million high-speed
Internet subscribers paying a usage charge of approximately 7,800 Yen on average. By August
of 2004, Japan saw an increase in the number of subscribers to 16.9 million and a decrease in the
average usage charge to 2,500 Yen. Another goal of e-Japan was to realize an always-on
connection by 2005 for 30 million high-speed households and 10 million ultra-high-speed
households. By March of 2005, the e-Japan effort resulted in 46.3 million DSL (high-speed)
households and 35.9 million FTTH (ultra high-speed households).111
After reaching those initial goals, Japan decided to cease thinking and acting as though it had to
catch up with the more advanced IT nations. They believed that they had become the world�s
most advanced IT nation. Accordingly, starting in 2006, they chose to play an active role in
contributing internationally to the advancement of IT as the frontrunner in broadband availability
and usage. In 2006, Japan started a program called u-Japan. They chose the letter �u� from the
word �ubiquitous,� meaning everywhere. Japan wants ubiquitous networks that are accessible
everywhere. Ideally, all aspects of Japanese society will be linked together through ubiquitous
networks by 2010.
111 Ministry of Internal Affairs and Communications, �Contributing to Future Deployment of e-Japan Strategies,� U-Japan Page, 2007, http://www.soumu.go.jp/menu_02/ict/u-japan_en/new_outline01.html (May 28, 2008).
CBG Communications, Inc.
180
There are three main goals of u-Japan. The first is for Information Communications Technology
(ICT) to permeate all aspects of Japanese people�s daily lives at the grassroots level. This will be
achieved through the development of a ubiquitous network integrating both fixed and wireless
networks into a �seamless access environment.� The second goal is for ICT to foster
development of solutions to social issues. This will be achieved by mastering advanced uses of
ICT so that it can be applied to various fields. The third goal is for u-Japan to create a network
where anyone can use ICT with assurance of their privacy and security. This will be done by
upgrading the enabling environment.
The end goal of u-Japan is for the network to be not only ubiquitous, but also universal, user
oriented and unique. Ideally, this network will connect everyone and everything. Everyone,
including the elderly and disabled will have the ability to use ICT with ease. Japan hopes to
foster a huge increase in communication that transcends generation, distance and language.
Japan aims for Internet commerce to shift from provider-oriented to user-oriented. Finally Japan
hopes that ICT will transform society �from one of uniformity and standardization to one that is
creative and vigorous, and which strives to achieve more creative business approaches and
services, as well as a new social system and values.�112
As of 2008, according to the ITIF, Japan ranked second in the world in terms of the most
developed broadband network. The ITIF found that Japan had a household penetration rate of 55
percent with an average speed of 63.6 Mbps. The average monthly cost (in US $) per Mbps was
$0.13.113
SOUTH KOREA
In 1995, the South Korean government invested $1.5 billion in advancing their country�s
broadband development. They invested this money in a nationwide high-capacity broadband
network over which any service provider could offer its services. The government also offered
112 Ministry of Internal Affairs and Communications, �The u-Japan Concept,� u-Japan Page, 2007, http://www.soumu.go.jp/menu_02/ict/u-japan_en/new_outline03.html (May 28, 2008). 113 The Information Technology & Innovation Foundation, �2008 ITIF Broadband Rankings,� Policy Issues Page, May 2008, http://www.itif.org/index.php?id=143 (May 28, 2008).
CBG Communications, Inc.
181
subsidies so that 45 million Koreans could purchase inexpensive computers.114 Then, in 2003,
the South Korean government and telecommunications industry embarked on a mission to
upgrade the country�s national broadband network. The goal of the project was to bring the top
speed of South Korea�s core broadband infrastructure to 100 Mbps by 2010. The South Korean
government set aside 990.5 billion won for the project and expected the private sector to provide
financial backing for the rest of the upgrades. The country also aimed to link South Korea�s
wireless networks to create a universal system that features e-health and education initiatives.115
By 2006, 90 percent of South Koreans had broadband connections of 3 Mbps at home and
similarly high connections on the road. The market for broadband service became increasingly
competitive, leading to a drop in the cost to the consumer. As of 2006, broadband service cost
the average consumer less than $20 per month. There are also more than 20,000 Internet cafes in
South Korea where you can rent a computer with a high-speed connection for approximately $1
an hour.116
As indicated earlier, in 2008, the ITIF released a report which ranked South Korea�s broadband
network as the most developed in the world. The ITIF took into account the penetration rate of
broadband, the average speed of the network and the cost of access. According to the ITIF, the
penetration rate in South Korea was 93 percent with an average speed of 49.5 Mbps and an
average cost of $0.37 per Mbps.117
FINLAND
Finland has one of the highest broadband penetration rates in Europe. DSL provides a
significant amount of broadband delivery in the country, but there is also an extensive FTTH
network as well as wireless broadband and a limited broadband over power line presence.118 In
2008, the ITIF ranked Finland third in its broadband development rankings. Finland has an
114 Chris Taylor, �The Future is in South Korea,� Business 2.0, June 14, 2006. 115 BBC, �Korea Plans Ultra Fast Broadband,� BBC Online, November 20, 2003, Online edition. 116 Chris Taylor, �The Future is in South Korea,� Business 2.0, June 14, 2006. 117 The Information Technology & Innovation Foundation, �2008 ITIF Broadband Rankings.� 118 Paul Budde Communication Research, �Finland � Broadband Market,� Reports Page, March 11, 2008, http://www.budde.com.au/buddereports/1598/Finland_-_Broadband_Market_-_Overview_Statistics__Forecasts.aspx (May 28, 2008).
CBG Communications, Inc.
182
average household penetration rate of 61 percent with an average download speed of 21.7 Mbps.
The average cost of access in Finland is $0.42 per Mbps.119
Comparative Analysis Conclusion
After analysis of all of the foregoing, including evaluation of data from other localities, states
and nations, we believe the following comparisons can be made concerning the five counties
under study and other similarly-situated areas, as well as non-similar areas, including
consideration of the funding support, incentive-based programs, public/private partnerships and
regulatory measures that have been applied in each situation:
• The broadband availability and adoption rates in the five counties studied are consistent
with the availability and adoption rates, on average, in similarly-situated, rural areas
around the United States.
• However, availability and adoption rates are behind similar areas in other states where
proactive measures to advance the broadband climate are farther along, depending on
when those efforts were started and how they have been developed.
• There were active broadband development efforts in each of the counties under study.
Successful efforts to date have received necessary funding. Efforts that have been
stymied to date have not received necessary funding, or face regulatory and other hurdles
that would need to be addressed (more information on these can be found in the next to
last Section of this Report).
• There is a disparity between the availability of multiple, competing broadband options
between the five counties under study and more populous areas (such as Seattle and King
County). This disparity is not uncommon when compared to the disparity in other
urban/suburban versus rural areas around the United States, and other countries, except
those profiled herein that have taken aggressive efforts (and provided the associated
funding) to upgrade their broadband infrastructure and advance adoption of broadband
119 The Information Technology & Innovation Foundation, �2008 ITIF Broadband Rankings.�
CBG Communications, Inc.
183
services (such as Japan, which finds high rates of availability both in its cities and rural
sections based on the e-Japan and u-Japan initiatives).
• Public involvement (such as by PUDs, local governments, Economic Development
authorities and others) has led to advancements in broadband infrastructure and services
in the five counties. This is consistent with the results of public involvement in many
jurisdictions throughout the country.
• Public/private partnerships, and their efforts to bring expansions in broadband service,
have seen a wide range of success and failure around the country. Within the five
counties studied, there have been a few public/private partnerships (such as the activities
of the Grays Harbor PUD) that have been successful. It will be important to build on
these efforts going forward, and not duplicate the failures experienced in other
jurisdictions around the country (most often based on either a flawed technology concept
[typically resulting in higher cost to fix the initial system design] or a flawed business
plan [typically resulting in lower revenues and a longer ROI than anticipated]).
• Regulatory measures such as right-of-way management and zoning provisions have
enabled infrastructure to be placed which has resulted in a lower cost of broadband
infrastructure development in other areas around the country (such as the placement of
excess conduit during road construction and other activities or the involvement of
telecommunications providers in community infrastructure development projects such as
downtown redevelopment which enabled the provision of telecommunications
infrastructure while other construction is going on, thus lessening the cost of
construction). These types of provisions do not appear to be largely in place in the five
counties studied. A concerted effort to pursue and develop these types of regulatory and
cooperative initiatives would be beneficial, based on the benefits achieved in other
jurisdictions.
Overall, as we have indicated in other Sections, there is momentum within the five counties that
could be accelerated by proactive steps at the local, State and/or national level.

CBG Communications, Inc.
184
Section I Conclusions and
Recommendations
CBG Communications, Inc.
185
CONCLUSIONS AND RECOMMENDATIONS After review and analysis of all the information gathered during the Broadband Study and as
reported herein, CBG presents the following observations that are evident from the accumulated
evidence regarding broadband availability, adoption and use in the State of Washington.
Additionally, at the end of this section, we have provided narrative regarding potential options
the State may consider for broadband infrastructure development and deployment, should there
be a desire by policymakers, particularly the Washington Legislature, to take affirmative steps to
promote expanded availability and use of broadband services.
The Level of Broadband Availability
The level of broadband availability varies widely within and across each of the five counties
covered by the Broadband Study. For example, the highest level of broadband services noted in
the surveys were 1 Gigabit Ethernet service (10 Mbps or 100 Mbps services were more
prevalent) which are generally provisioned over direct fiber optic connections. Such connections
were generally found in or near the largest municipalities in the larger, more densely populated
counties. In the smaller counties with notably lower population densities, the higher speed
broadband connections were available only in limited fashion, such as along a provider�s
backbone connection, or they were simply not available.120
Not unexpectedly, even within the larger counties, data and information gleaned from the
surveys indicate that as you leave or move away from densely populated communities and away
from major transportation corridors, the level of broadband availability (or coverage area) and
service (or speed) options dwindle rapidly. As an example, within most of the limits of the City
120 The �larger counties� are defined as those with larger populations relative to their land mass. Grays Harbor (1,917 square miles, 70,800 people) and Lewis County (2,407 square miles, 74,100 people) fall into this category. The �smaller counties� are defined as those with smaller populations relative to their land mass. Columbia (874 square miles, 4,087 people) and Ferry County (2,257 square miles, 7,500 people) fall into this category. Interestingly, Stevens County (2,478 square miles, 43,000 people) with a large land mass, but far less population than Grays Harbor and Lewis County, showed attributes of both a small and large county depending on the factor under review.
CBG Communications, Inc.
186
of Centralia in Lewis County (which parallels the I-5 corridor) a number of broadband service
options are available generally to local businesses, institutions, and households. These options
include DSL service, wireless broadband services, cable modem services and dedicated high-
speed institutional and business broadband connections using dedicated fiber optic facilities. As
a result of having sufficient high-speed Internet access options, Centralia broadband subscribers
are more likely to engage in Internet activities that avail themselves of reliable and robust
connections, such as online banking and watching videos on the Web. Residents in Centralia
with multiple broadband options are also more satisfied with the cost, speed and reliability of
their Internet service than dial-up users in Centralia and residents in other areas with less options.
In contrast, move either east or west along Route 12, (i.e., away from the I-5 corridor) and the
options available to consumers rapidly diminish. As opposed to the full range of service options
available in the densest portion of Centralia, consumers in outlying areas are limited to dial-up
access and may or may not be able to access satellite broadband 121 between certain pockets of
population density. Additionally, availability of DSL or cable modem services (not always both)
is spotty, at best, within or between population pockets depending on the size and density of a
particular area. Consumers accessing the Internet in these areas exhibit less robust utilization of
the Internet and lower satisfaction levels.
The density/broadband availability relationship can be thought of in the following way: the
higher the population density, the closer the proximity to other dense areas (so extension of
services can be more easily achieved) � and - the more significant the transportation corridor and
the closer to that transportation corridor a consumer may be, the higher the likelihood that
broadband service will be available and the greater the options.
The highest levels of broadband availability in the five counties studied are the most densely
populated portions of the I-5 corridor in Lewis County (especially Centralia/Chehalis), the more
121 It is important to note that, in many locations where dial-up service is available and chosen by consumers, satellite broadband could be available, but, for a variety of factors, has not been selected due to concerns about latency, slow upload speeds (although 512 Kbps is quoted), weather-related outages and restrictive �fair use� policies. These factors, plus the higher cost of satellite broadband and reception problems where proper look angles cannot be achieved, is inhibiting its adoption for dial-up users. Additionally, T-1s may also be an option as opposed to dial-up, but the cost of accessing this type of service for household, home-based business or telecommuter use, as noted in the Report, is prohibitive at as much as $400-$800 a month (as opposed to 10% or less of that amount for a high speed DSL or cable modem connection).
CBG Communications, Inc.
187
densely populated portions of the US 12 corridor in Grays Harbor (especially from Montesano
west), the southeastern portion of Stevens County along the 395 corridor just north of Spokane,
as well as the more densely populated pockets along the Route 395/20 corridor in Stevens
County. It should be noted that in both Grays Harbor and Stevens Counties, the availability of
reliable broadband service is impaired by a lack of a failsafe, redundant backbone (evidenced by
a couple of crippling outages in the recent past).
In keeping with the density/broadband availability relationship described above, it should not be
surprising that the lowest level of broadband availability observed in the Study was in Ferry
County. Even in the more densely populated sections of this County and those areas that parallel
major transportation routes, broadband service options, as noted in sections B, C, and G of this
Report, are appreciably limited.
It should be noted that local governmental or public agency involvement at an integral level may
influence or enhance broadband availability. CBG notes for example, that the PUD in Grays
Harbor has been very active in extending and providing fiber-based infrastructure and in
pursuing collaborative wholesale service relationships with unaffiliated providers, system
integrators and alternate carriers to further the broadband environment in Grays Harbor. For
example, the PUD worked with one provider to share the cost of fiber backbone construction.
Based on this cooperative effort, both entities were able to access twice the amount of fiber
infrastructure than they would have otherwise. On a wholesale basis, the PUD has also worked
successfully with unaffiliated retail service providers to use PUD fiber infrastructure to provide
broadband services to formerly unserved or underserved areas, as well as provide another
competitive option.
Inhibitors to Broadband Availability
Survey results, coupled with input received from focus groups and existing service providers,
provide a reasonable assessment of the major inhibitors to broadband availability in the five
counties studied. These inhibitors are many and, for the most part, reflect inversely those factors
that contribute or enhance prospects for availability. They are:
CBG Communications, Inc.
188
Low Population Density � Most providers indicate that the number of potential customers and
anticipated take rates, the cost of building and extending infrastructure, and the resulting Returns
on Investment (ROIs) that provision of broadband services may bring, simply do not pencil out
in low density areas, particularly in an environment where investor-owned utilities are under
significant pressure to shorten the ROI timeframes and increase returns.
CenturyTel, which serves numerous rural exchanges throughout a number of states including
Washington, noted in its response to the Broadband Providers Survey that:
�[t]he single biggest obstacle that works against deployment of
broadband services to the last remaining unserved areas is the
lack of a viable business case. Without some form of universal
service assistance, customer density is often too low and cost
per customer too high to provide broadband service at a more
equitable price that will cover cost.�
Distance from a Major Transportation Corridor � Major transportation corridors tend to
drive the placement of and investment in broadband infrastructure because of the relatively
higher number of fixed users that surround population centers that have already located and
expanded along those corridors (for a variety of reasons), as well as mobile users that traverse
those corridors,. Such investments include, but are not limited to, placement of cell towers that
wireless carriers can utilize to deliver broadband over cellular service. Additionally, these same
or other towers can be effectively leveraged under the right conditions for fixed wireless
services. As an example, Eltopia, a wireless broadband provider in Stevens County, states that it
would utilize existing cellular towers based on the towers� prime locations in municipalities and
along major corridors in Stevens and other counties. However, Eltopia has not to-date entered
into lease arrangements with cellular tower owners because it has found the lease fees to be
prohibitive. Instead, Eltopia leases space on towers owned by other entities including ISPs and
cooperatives such as the Big Bend Electric Cooperative in Ritzville, Washington.
CBG Communications, Inc.
189
Also in these corridors, critical backbone infrastructure is placed to provide continuity between
various distribution points and to support long haul communications between major metropolitan
areas. Finally, major transportation corridors are often routed through less topographically
challenged areas, which enables easier construction along and near road and rail rights-of-way.
Move away from the major transportation corridors and the incentive for infrastructure
investment decreases, so the services do not deploy as fast or in as concentrated a manner as
along a major transportation corridor; a direct result of lower ROIs, lower density, and higher
construction costs.
Terrain � On a cost per location served, wireless broadband communications can be an effective
means of bringing broadband to individuals in lower density areas. However, many of the areas
that we studied have challenging environments (such as dense forest and mountainous terrain)
and other topographical issues which present difficult problems for wireless technological
solutions. For example, many of the technologies that are capable of providing wireless
broadband are most effective on a line of sight (LOS) basis and, as such, are not always
conducive to offering service in mountainous areas. Additionally, fiber optic backhaul
connections from master towers is often preferred for wireless systems, but fiber (as well as the
electrical power infrastructure needed to support transmission equipment) may be difficult and
costly to bring to such tower locations.
Permitting � Service providers and those involved in network design indicated that they had
considerable difficulty obtaining permits for network development in some cases and this
certainly slowed, if not completely barred, broadband development in certain areas, especially
those areas that are environmentally sensitive. For example, river crossings that require approval
from the U.S. Fish and Wildlife Service, construction through State forest land that requires
approval from DNR, and similar permissions and approvals can take a lengthy amount of time as
well as be costly to implement once approved. Railroad crossings were another permitting issue
cited as creating time lags (90 days or more to acquire permits) and a high cost ($4,000-$5,000 to
acquire a crossing permit).
CBG Communications, Inc.
190
Planning � Examples were given where the cost of broadband system development could have
been reduced if providers had been included earlier in local government and other planning
processes (e.g., when roads are widened, reconstruction and repaving is done, or utility trenches
are opened). Earlier participation would have enhanced infrastructure deployment by reducing
both time and cost. In areas where the ROIs may already be marginal, to nonexistent, such
delays can impede broadband availability significantly.
Lengthy ROI � As indicated above and considering the other deployment factors, in many cases
ROIs may be lengthened beyond that considered acceptable by broadband service providers. In
addition to CenturyTel, other large providers expressed similar positions. For example, Verizon
Northwest, Inc., indicated in its Broadband Survey response that �[i]n general, obstacles to
deployment may include high capital and operating costs compared to likely revenue.�
Essentially, even if a high percentage of the population wanted to subscribe to broadband,
in many rural areas there is simply not sufficient demand (i.e., revenue potential) for the service
to justify the level of private investment needed for deployment. This remains a hard reality
without either technological changes that reduce costs substantially or substantial subsidies from
government or foundation sources, like the mechanisms used historically to promote the
universal availability of wireline telephone service. Potential means to address lower ROIs are
discussed in Section H of this Report.
Capabilities of Existing Technologies � Participants in the Study noted that the characteristics,
capabilities and limitations of existing broadband technologies were an inhibitor to availability
and that perhaps the employment of new technologies such as WiMAX may help to overcome
some of these limitations. For example, WiMAX technology is generally viewed as superior to
other wireless infrastructure in addressing line of sight issues, capacity problems, and the need
for ever-higher mobile broadband capacities.
Participants noted however, that just like other new technologies, because of the huge investment
required to develop new networks, it was likely that WiMAX will be provisioned in the densest
sections of Washington State initially and would simply provide more broadband service options
CBG Communications, Inc.
191
to those consumers that already have a number of options.122 Accordingly, WiMAX likely does
not pose a wholly effective solution for rural areas for quite some time.
Broadband Adoption and Use
As stated throughout the Broadband Study, adoption of broadband services by consumers
generally follows availability. The more that broadband is available, and with a greater variety
of service options, the higher the level of adoption by consumers and use for more diverse
applications. This proved true for observed results in all communities of interest. For example,
36% of households in Lewis County, where broadband is more widely available than some of the
other counties studied, purchase some form of broadband service. This was especially true along
the I-5 corridor where there appear to be multiple providers and varied service options.
Conversely, in Ferry County, where there are fewer service options and providers, only 15% of
its households obtain some form of broadband service.
Also, where broadband availability and options are plentiful, the uses of broadband and the value
of those uses expand significantly. For example, our survey results indicated there is a 23% gap
in the use of video over the Internet between broadband consumers and low-speed Internet
service users. As reported herein, this trend holds for a variety of other applications such as
taking a class online or banking online. Those with broadband in the five counties studied are
also more likely to buy a product online.
122 A consortium of Sprint, Clearwire, Comcast, Time Warner, Brighthouse Networks, Google and Intel is spending $14.5 billion on a nationwide roll-out, for example.
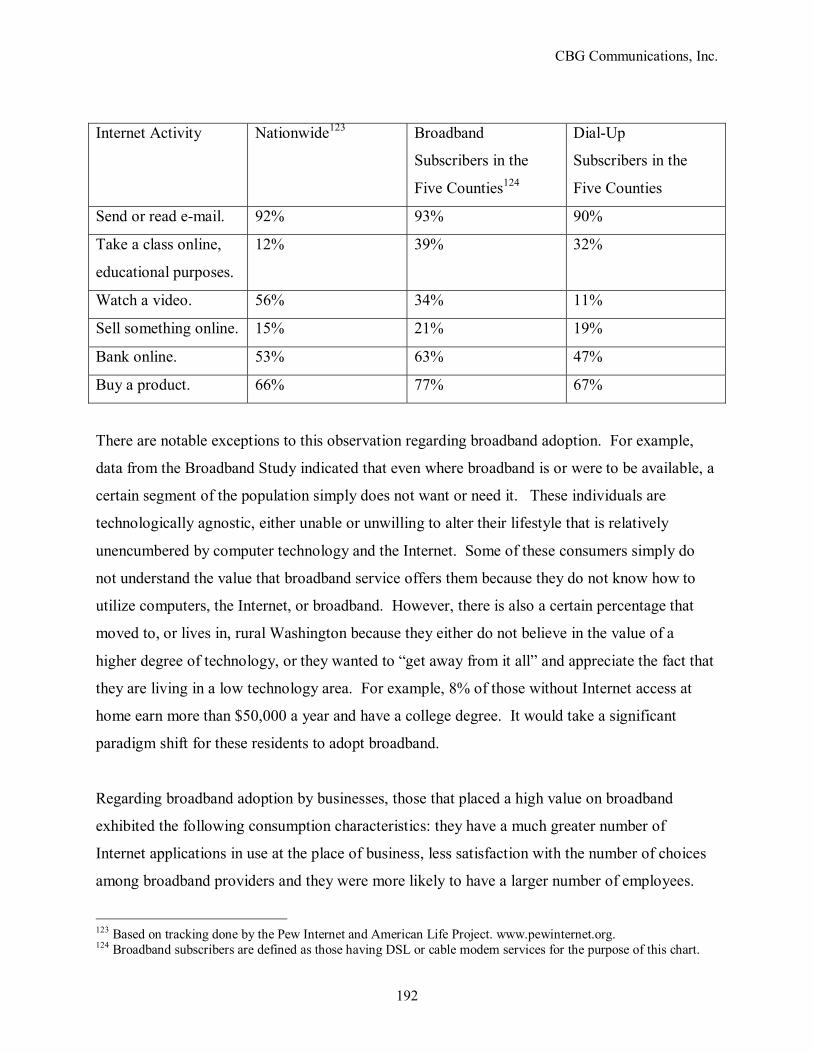
CBG Communications, Inc.
192
Internet Activity Nationwide123 Broadband
Subscribers in the
Five Counties124
Dial-Up
Subscribers in the
Five Counties
Send or read e-mail. 92% 93% 90%
Take a class online,
educational purposes.
12% 39% 32%
Watch a video. 56% 34% 11%
Sell something online. 15% 21% 19%
Bank online. 53% 63% 47%
Buy a product. 66% 77% 67%
There are notable exceptions to this observation regarding broadband adoption. For example,
data from the Broadband Study indicated that even where broadband is or were to be available, a
certain segment of the population simply does not want or need it. These individuals are
technologically agnostic, either unable or unwilling to alter their lifestyle that is relatively
unencumbered by computer technology and the Internet. Some of these consumers simply do
not understand the value that broadband service offers them because they do not know how to
utilize computers, the Internet, or broadband. However, there is also a certain percentage that
moved to, or lives in, rural Washington because they either do not believe in the value of a
higher degree of technology, or they wanted to �get away from it all� and appreciate the fact that
they are living in a low technology area. For example, 8% of those without Internet access at
home earn more than $50,000 a year and have a college degree. It would take a significant
paradigm shift for these residents to adopt broadband.
Regarding broadband adoption by businesses, those that placed a high value on broadband
exhibited the following consumption characteristics: they have a much greater number of
Internet applications in use at the place of business, less satisfaction with the number of choices
among broadband providers and they were more likely to have a larger number of employees.
123 Based on tracking done by the Pew Internet and American Life Project. www.pewinternet.org. 124 Broadband subscribers are defined as those having DSL or cable modem services for the purpose of this chart.
CBG Communications, Inc.
193
Additionally, when analyzing our Business Survey results in tandem with information gathered
during in-depth interviews and focused discussions, CBG found that the lack of a truly reliable,
competitive broadband environment creates the following negative economic impacts:
• Movement of businesses away from low or no broadband areas to areas with a
better broadband environment.
• Higher operational costs.
• Difficulty in recruitment.
• Slower, more inefficient and inconsistent operations.
• Less provision of services to, and access of services by, citizens thus reducing
related quality of life components.
Inhibitors to Broadband Adoption and Use
Generally, several key inhibitors to broadband adoption and use (i.e., uncertainty as to the
benefits of broadband, lack of reliable broadband service and cost of service) are interwoven and
coalesce around the price/value relationship concerning service access. For instance, residents in
rural areas may be able to receive satellite broadband, but the cost can be significantly higher
than dial-up service, likely the only alternative to satellite broadband service in their area.
Nevertheless, consumers may choose to adopt such offerings, but they tend to experience more
significant service problems such as latency, service outages and the service-barring effects of
certain �fair use� policies that may be applied. Some rural consumers choose to �un-adopt� and
go back to dial-up because the value of satellite service has diminished relative to the cost. Some
remain on satellite broadband service, albeit frustrated and greatly dissatisfied with the quality of
service. When other service options are available, evidence suggests that many will migrate to
those options. Similarly, evidence suggests, when there are multiple options, that the price and
types of services are broad-based enough that value is established for users at very high levels.
CBG Communications, Inc.
194
Two additional inhibitors to broadband adoption and use are computer/access device availability
and computer/technology literacy and training. Just as it will be significantly challenging to
bring new and better broadband access options to areas of the five counties where service is
unavailable or lacking, so too will it be challenging to find easy answers to address these two
adoption inhibitors. Sometimes lack of computer/access device capability is a choice based on
personal reasons and preferences. Sometimes, though, it�s based on cost and also on the ability
to gain access to necessary training. CBG found that community colleges, libraries and
Economic Development authorities were actively engaged in programs and outreach to increase
computer understanding and utilization which then leads to Internet use, understanding and
value. It is clear, however, that a number of consumers have either ignored or avoided these
programs for a variety of reasons.
The cost of service issue is very real for those with low or moderate incomes and taking service
forces such consumers to have to make hard choices regarding other necessary household
expenses such as transportation. This is true even though prices for computers, Internet and
broadband access services have generally fallen over the past decade.
In summary, to increase broadband adoption and use to the levels seen in other countries,
Washington policymakers may consider four major initiatives:
• Increasing the number and type of broadband availability options to ensure
affordable, reliable access,
• Augmenting existing computer/technology literacy efforts,
• Determining ways to increase affordable access to computers (including
potentially more public access computers), and
• Looking at whether the paradigm could be changed for those that truly don�t want
or don�t need broadband.

CBG Communications, Inc.
195
Broadband Service And Infrastructure Development And Deployment
There appears to be a pervasive perception by some participants in the Study that the more rural,
eastern part of the State has become a �second class� citizen when it comes to the provision of
broadband services and the State�s efforts to enhance broadband services. Even in western
Washington, as the location becomes more rural, a similar perception of �second class�
broadband status becomes more and more evident. One participant in a Lewis County focus
group, for example, noted that Lewis County was an �eastern Washington county on the western
side of the State�. Accordingly, the challenges are many and varied to addressing and
overcoming the perception of there being a �second class� status for rural areas and the reality of
reduced broadband options.
An additional challenge is finding an effective way to engage the broadband service provider
community to share critical information. CBG found that providers are very reluctant to provide
existing infrastructure information - or even service deployment information - based on their
characterization of such information as proprietary and confidential. Without fail, they contend
that the release of such information would compromise their ability to compete effectively in the
marketplace. We believe their view does have some validity where there are multiple
competitors, but it doesn�t ring quite as true where, literally, there are no viable competitive
options at this time. Since such providers are the major distributors of broadband services and
have firsthand knowledge of where there are gaps in coverage, the State may not be able to
completely develop detailed and targeted investment incentives or service deployment options
for particular areas without access to the information they possess. This dynamic must be
addressed straightforwardly and effectively, while dealing with their confidentiality concerns, if
efforts to change broadband deployment and use are to grow.
Providers also noted from time to time that broadband is an �information service� regulated
ostensibly at the Federal level and that this limits the State�s role in pursuing provision of such
services. Clearly though, an occurrence such as Qwest�s current operation under an Alternative
CBG Communications, Inc.
196
Form of Regulation (AFOR) with the UTC has resulted in commitments to augment or enhance
broadband service in its territory. The AFOR commitment includes certain exchanges in
Qwest�s service areas that are in the five counties covered by the Broadband Study (Northport,
Springdale, Napavine and Winlock). Even after completion of its obligations, though, these
exchanges will not have full DSL service, which again leads to the need for further deployment
efforts. Additionally, lengthy ROI, specified by several providers as an inhibitor to deployment
suggests that the State needs to look at and address funding options that can somehow facilitate
longer, but acceptable, ROIs if possible. As explained below, this could involve more active
participation by PUDs or involvement of the State or other entities in providing �ROI Gap
Funding.�
Broadband Deployment Models
As described earlier in this report, states and localities around the nation including Washington
and local entities within the State, are currently taking three (3) approaches to state involvement
in enhancing the broadband service and infrastructure environment. These include:
• Encouraging the Private Sector to Build
• Creating a Broadband Authority in the State
• Creating a Public/Private Partnership
After review of all of the information gathered, we believe that it will be important to pursue
elements of each one of these models to best be involved in a successful pursuit of an enhanced
broadband environment. Specifically, regarding the above three (3) approaches, the State could:
• Encourage the Private Sector to Build � As noted previously herein, the State has
already developed a statewide backbone to provide services to State and local
government agencies, greater public access to the Internet and educational services
through the K-20 Network.
CBG Communications, Inc.
197
As a result of the State�s efforts, private providers were able to expand their infrastructure
in order to create the backbone and build distribution off of the backbone. There is a
potential to expand this effort in two ways. First, the State could do something similar to
what Colorado has done, put Network Operations Center (NOC) or Hub locations in each
of the State�s 39 counties, or at least in the areas where additional fiber backbone and
Hub infrastructure is needed. These facilities could be extended at least to the county
seats in each location where, understandably, it is most needed. This would bring high-
capacity infrastructure to central locations in each of the counties which could be
leveraged to encourage further development. It would also mean that, since it would
constitute an expansion of the existing redundant backbone, each county would now have
a greater level of redundancy which our Report indicates is not available in a number of
locations presently.
Beyond this, new backbone facilities could be utilized to provision a higher level of
services for resellers, alternate access carriers and others that may then distribute services
from the Hub or locations along the backbone. Similar to the PUDs, this would put the
State potentially in the role of a wholesaler, so it would have to look at all the
ramifications of such a move including any possible effect on existing federal funding
used (i.e., the federal e-rate program) in support of the K-20 Network.
Another way of encouraging private investment would be to provide �ROI Gap
Funding�. Essentially, the cost to bring service to an underserved or unserved area would
be developed. This amount would then be compared to the minimum ROI typically
acceptable to a provider who could enter the market and establish service. Then, the
difference in cost would be provided by some entity (it could be the State, a local
government, a consortium of local governments, an economic development group, a
business consortium, a PUD or other entity, for example) to the provider over an
established period of time that balances an acceptable return versus the provision of a
required level of service.
CBG Communications, Inc.
198
This required level of service should incorporate a number of measurements critical to
ensure an appropriate return on the investment of the entity providing the Gap Funding,
including:
o Timeframe for development of services to an entire target area, including phased
implementation
o Creative means to bring broadband services to the area as an interim measure
while more long term plans are developed
o Engagement in adoption encouragement and support activity
o Nature of the services provided, including range and scalability
o Ability of the system to enable competitive offerings
o Expansion requirements over time to keep pace with technology
o Self-sustainability at a given point that would serve as an end-point for support
funding
• Create a State Broadband Authority � Washington does not currently have a �one stop
shop� where collective thinking to address broadband needs is available. As a result,
study participants indicated that broadband stakeholders were not always aware of each
others� activities and therefore could not take advantage of synergies that might exist in
the deployment of infrastructure. Some type of authority could serve as a clearinghouse
for broadband initiatives. Stakeholders believed this type of centralized ability to
converse with other providers could go a long way in helping to address broadband needs
in the five counties. A broadband authority could, for example, identify potential
wholesale opportunities for certain public entities such as Public Utility Districts (PUDs),
appropriate local entities, or the State itself to provide services by leveraging private and
public resources that may be currently available and that potentially could be
expanded(i.e., State backbone, PUD fiber optic infrastructure, local government fiber and
wireless infrastructure). For example, Stevens County with appropriate funding, could
utilize existing and new County assets to provide a high-capacity wireless backbone for
the provision of redundancy and other services. The PUD in Grays Harbor already brings
power to remote locations and potentially could provide broadband services to those
CBG Communications, Inc.
199
locations, based on the longer return on investment that they can absorb as a public
utility, but would need to know that they were guaranteed the return on investment
because no other provider was going to provide that service. Careful study of current
restrictions and parameters surrounding provision and use of these resources would need
to be made to insure that current positive attributes of the broadband marketplace are not
lost or impaired in any effort to expand broadband service availability. Additionally, as
is the case for private providers, in rural areas there would need to be careful
consideration of the demand (i.e., revenue potential) for broadband services to justify the
level of public investment that may be required for deployment.
• Create a Public/Private Partnership � We understand that there has been interest at the
State level to look at developing a public/private partnership, such as the Connect
Kentucky project which includes a non-profit element to oversee and plan efforts to
develop ubiquitous high-speed Internet access. This approach may have some merit and
should be pursued, but again there would need to be some set parameters that the
partnership would need to achieve (timeframe, baseline service level, efforts to pursue
adoptions once affordable availability has been established, etc.) in order to ensure that
success could be achieved.
Also, it will be important to look at the experience of other public/private partnerships
that have not succeeded to avoid the problems that derailed those efforts (flawed business
plans, technical problems, a too broad or too narrow focus, lack of pertinent political or
constituent support, problematic organizational structures, etc.). Specific examples to
study would include such cases as the various municipal wireless broadband projects that
included EarthLink as a partner, where the level of investment escalated well beyond
projections, while the payback elongated beyond an acceptable business case.
Based on the information gathered herein, one underlying theme is that the State should not
create artificial barriers to the provision of services where it would be helpful to households and
businesses and thus positively impact the State�s economic development and overall quality of
life. This most likely means that any solution chosen should not necessarily detract from other

CBG Communications, Inc.
200
possible solutions. Rather, similar to how multiple broadband options in several locations
studied have provided higher levels of satisfaction and use, multiple deployment options working
in tandem may ultimately achieve the best outcome for the State.
Clearly there are broadband disparities within the five counties studied, reflecting significant
gaps in both availability and adoption that are having a negative impact on those counties�
economies and the quality of life for their citizens. Our study indicates that proactively
addressing and reversing the situation, so that broadband availability and adoption rates increase
will have the inverse effect � a positive economic impact and enhancement in the quality of life.
State policymakers should review the approaches we have recommended and determine the most
effective way to proceed.
We applaud the State�s proactive efforts to study broadband disparities and move to determine
ways to address them. We believe that such proactive efforts will help the State keep pace with
other states that have improved their broadband environment and nations that exhibit high levels
of broadband availability and adoption. In turn, this will allow Washington to compete more
effectively in both the national and global economies.
CBG wishes to thank the UTC for the opportunity to work on these critical issues by performing
this Broadband Study. We especially wish to thank Will Saunders and others at the UTC and
other state and local agencies for their invaluable assistance in achieving a successful project
outcome.

CBG Communications, Inc.
201
Section J Project Template
CBG Communications, Inc.
202
PROJECT TEMPLATE The experience of performing the Broadband Study Project shows that the methodologies used
and the activities employed were successful in obtaining the information needed to meet the
objectives of the State within the five counties. Accordingly, with some refinements and
enhancements, we believe the methodology that has been employed could be used as a template
for other similar survey projects throughout the State or even on a statewide basis. (Clearly,
additional time would need to be factored in if more than a five-county area was to be studied or
an area where there are more dense sections and, therefore, more communities of interest
representatives may be involved in the information gathering efforts.)
The Study methodology compares favorably with the methodologies used concerning both the
type and depth of information gathered in other similar research projects around Washington
State and throughout the country. For example, CBG Communications has applied the same
methodology successfully to establish detailed information about broadband needs, interests,
usage, applications and availability in the Pierce County, Washington communities represented
by the Rainier Communications Commission, as well as nine (9) Valley Cities in southern King
and northern Pierce Counties, Marin County, California and other jurisdictions around the
country.
Looking at studies performed by other entities, the methodology and depth of level of
information is consistent with that, for example, gathered by the City of Seattle as part of its
2004 Information Technology Residential Survey. Additionally, the data gathering techniques
regarding business and economic development findings and service provider infrastructure and
service information and related data were consistent with some of those used by Washington
State University�s Center to Bridge the Digital Divide in its extensive information gathering and
Report on the Olympic Coast Region Economic Development Project (October 2004).
When comparing and contrasting the goals and objectives of the different studies and looking at
some of the key methodologies and data fields incorporated within their information gathering
CBG Communications, Inc.
203
methodologies, we recommend that the following be included in a project template that would be
viable for other Broadband Study projects throughout the State. This would include:
• Telephone Survey for the Residential Community � Key Data Fields
o Level of access to the Internet.
o Availability and adoption of high-speed access to the Internet.
o Level of importance of having access to high-speed Internet.
o Applications used over the Internet (use a set of questions or applications
that is easily compared to the applications developed by the Pew Internet
and American Life Study. This allows comparisons to national data [as
discussed in an earlier section in this Report]).
o If not a high-speed Internet, why not?
o If not a computer user, why not?
o Demographic information to determine if findings are across all
demographic groups or specific to certain sectors.
A similar set of data fields should be utilized for business broadband survey use, with
modifications made related to business operations versus household activities including:
• The level of importance of the Internet and then use of high-speed Internet as
opposed to low-speed Internet, for day-to-day business operations
• Key business applications used over the Internet and then a comparison of high-
speed Internet applications versus low-speed applications
• What type of business they are (so that Internet and high-speed Internet use can be
compared for different business sectors to determine whether similar needs run
across sectors or are specific only to certain sectors)
CBG Communications, Inc.
204
• Would an enhanced broadband environment benefit their business?
Supplementing telephone surveys with online/written surveys was found to be very important in
the case of businesses, since those that took the survey online indicated a higher degree of online
use and thus a higher degree of need for both the Internet and high-speed Internet. Online
business survey data can then be compared with the telephone survey data to look at whether key
business sectors are differentiated concerning the need for high-speed Internet access.
A great depth of information can also be obtained using online/written surveys for institutional
users (educational organizations, governments, libraries, tribal nations, etc.) in order to determine
the impact that varying degrees of network infrastructure and services have on their day-to-day
operations and their ability, in turn, to meet the needs of those that they serve (citizens, residents,
clients, patrons, students, etc.).
Finally, supplementing the survey data with in-depth interviews and focus groups allows the
ability to test interpretations of the data in a �drill-down� format with diverse interests, as well as
determine the highest priority issues, based on the consensus of such diverse interests.
In summary, the above methodologies and data fields taken from those used for this Broadband
Study would be the key components of a template that would be viable for Broadband Study
projects throughout the State.
The refinements and enhancements to the current template center around the changes that will
continue to occur in the broadband infrastructure, service and technology deployment
environment, as well as changes in the broadband adoption and use patterns of key demographic
groups. For example, if WiMAX technology and development of related services in the
marketplace expand more rapidly than anticipated, or into less dense areas faster than
anticipated, then an increased focus on either public or private provision of that service, and its
potential use by the various communities of interest, may need to have a larger role in the study.
Similarly, if use of landline telephones by certain demographic groups continues to diminish, this
will require some changes in telephone survey methodology to ensure that such users are
accurately represented within the samples. (Telephone survey firms, for example, are looking at
CBG Communications, Inc.
205
a number of possibilities, including working to match exchanges known to correspond to cell
phone use with geographic areas within the scope of the study, and then augmenting the survey
questions, when cell phone users are reached, with an initial question focus that determines
whether the respondent is using their cell phone in place of a landline. A large group of these
cell phone numbers would be developed within the study area and then randomly selected based
on penetration numbers available for landline use versus cell phone at home use in those
areas.)125
Also, it would be extremely helpful to be able to require, rather than request, a greater level of
information related to infrastructure and services from service providers, or have some
mechanism under State law to hold that information confidential, so that it could be analyzed and
reported on within the Conclusions, even if specific data is not reported within the Findings.
Essentially then, the methodology employed in this Study could be used in large measure as a
template for any similar future study, because it comprehensively covered all the various
communities of interest. This is important, since no one methodology would give a complete
picture of the broadband environment at this particular point. Then, at the time the study was
performed, adjustments would be made to any of the individual information gathering efforts
based on particular elements which may need more in-depth pursuit (for example, if greater
focus needed to be placed on educational use of broadband, rather than weighting its focus
evenly with the other constituent groups and applications).
125 Telephone studies rely on landline-only residents for surveying. With the growth of cell phone usage and ultimately, cell phone only households, survey researchers are sensitive to potential bias in the sample. The empirical data concerning the potential for such bias is just beginning to be collected in the United States. For example, researchers have found that landline only household respondents are significantly more likely to be over 50 than those in cell phone only households. Additionally, among the largest differences noted, those in landline-only households were less likely to be men, less likely to be single and less likely to be a racial/ethnic minority. The same study also found that respondents in cell phone only households were more likely to be aged 18 to 34 years, single or never married, Hispanic, a student, and out of work. Those in cell phone only households were less likely to be married, a college degree recipient, non-Hispanic white, or retired. Link MW, Battaglia MP, Frankel MR, et al., �Reaching the U.S. cell phone generation: comparison of cell phone survey results with an ongoing landline telephone survey.� Public Opinion Quarterly 2007;71:814�39.