Embed Size (px)
DESCRIPTION
broadband infrastructure and economic growth
Citation preview

Electronic copy available at: http://ssrn.com/abstract=2166167
Broadband Infrastructure and Economic Growth
A Panel Data Analysis of OECD Countries
Syed Muhammad Atif
James Endres
James Macdonald
ABSTRACT Broadband infrastructure facilitates the generation and distribution of decentralised
information and ideas in a knowledge economy comprising of markets that rely on
information as an input. This paper analyses the effect of broadband penetration on
output per capita by estimating a static fixed effects model and a basic linear dynamic
model using an annual panel of 31 OECD countries over a period from 1998 to 2010.
The results suggest that broadband penetration has had a positive impact on economic
growth, and a 10 percent increase in the growth of broadband penetration will raise
economic growth per employee by approximately 0.035 percentage points. The
conclusion adds further weight to calls for Governments to adopt policies that
accelerate broadband penetration and promote investment in broadband
infrastructure.
* The authors are candidates of Master of Economics degree at University of Sydney, Australia. This paper has been prepared and presented as a part of the assessment of their course for Panel Data Econometrics

Electronic copy available at: http://ssrn.com/abstract=2166167
(Atif, Endres, Macdonald) Broadband Infrastructure and Economic Growth
Page 1
1 Introduction
High-speed internet access via broadband infrastructure has developed rapidly in the last
decade and is increasingly viewed as essential infrastructure for a globally competitive
economy (OECD (2008)). Broadband infrastructure facilitates the generation and distribution
of decentralised information and ideas in a knowledge economy comprising of markets that
rely on information as an input (Czernich et.al (2011)). Accordingly endogenous growth
theory suggests that broadband infrastructure should accelerate economic growth by
facilitating the development and adoption of innovation processes.
This paper seeks to analyses the effect of broadband penetration on output per capita by
estimating both a static fixed effects model as well as a basic linear dynamic model using an
annual panel of 31 countries over a period from 1998 to 2010. Consistent with endogenous
growth theory we expect that both estimators will indicate a strong causal relationship
between broadband penetration and economic growth.
The remainder of this paper is organised as follows. Section 2 briefly summarises the existing
literature dealing with the relationship between broadband and economic growth. Section 3
introduces the empirical framework and the derivation of both the fixed effects and the linear
dynamic models. Section 4 presents the data and some summary statistics. Section 5 presents
and compares the empirical results of the estimation methods. Section 6 concludes and
proposes some policy implications from the study
2 Literature on Broadband and Economic Growth
Economic growth is driven by many factors, including product, process and organisational
innovations based on technological change and the generation and distribution of ideas and
information. Technological change results from small incremental improvements over time.
However, a few technological improvements fundamentally change how and where economic
activity is organised. These are often referred to as general-purpose technologies (GPTs) and
are commonly thought to include the printing press, steam engines, combustion engines and
electricity (Majumdar (2009), OECD (2008), Czernich et.al (2011)).
According to the Organisation for Economic Cooperation and Development (OECD (2008))
broadband is a GPT that when combined with other information communication technologies
(ICTs) can fundamentally change how and where economic activity is organised. This
change is effected through several channels. Direct impacts arise from investments in the

(Atif, Endres, Macdonald) Broadband Infrastructure and Economic Growth
Page 2
infrastructure itself and associated ICTs. Indirect impacts come from all aspects of economic
activity affected by broadband and which drive economic growth (Collins et.al. (2007)).
Several studies have examined how firm level productivity is impacted by broadband (See
Holt and Jamison (2009) for an extensive review of this literature). A key theme of this
literature is that broadband enables the emergence of new business models, processes and
innovation. This in turn reduces costs, increases productivity and improves firm efficiency.
A study by The Allen Consulting Group (2002) reports findings from a survey of Australian
businesses on the cost savings derived from using broadband Internet. The survey results
indicate that businesses experienced cost savings of around 6.3 per cent from the use of
broadband internet compared to 1.5 per cent from the use of dial up internet. The study
claims that the reported average cost savings would result in an overall productivity gain of
around 0.32 per cent for Australian businesses. These findings are consistent with a more
recent survey by the Australian Industry Group (2008) reported that over 93 per cent of the
firms surveyed indicated that broadband had a positive impact on their productivity and
efficiency.
A 2011 study by Grimes, Ren and Stevens (2011) uses a panel of 6060 New Zealand firms to
determine the impact that differing types of internet access have on firm productivity. The
data sourced from two surveys conducted by Statistics New Zealand allows the authors to
control for a range of firm characteristics including those factors that may determine a firm’s
choice of internet access. Two estimation approaches are used: propensity score matching
(PSM) and an instrumental variables (IV) estimator. Results from PSM indicate that
productivity rises by 6.9 to 9.7 percent as a result of broadband connectivity. These effects
are consistent across different types of firms with no significant differences across an urban
versus rural split or across high versus low knowledge industries. The IV estimation results
indicate even higher productivity impacts from broadband adoption. Specifically, that
broadband adoption increases firm productivity by between 21 and 25 percent. Although the
IV estimation results are significantly higher than those obtained from PSM the authors
favour the PSM estimates because they lack of specific knowledge about the correct
functional specification in relation to a firm’s labour productivity relative to its sector and
therefore have low confidence in the IV estimation results.
In addition to those studies that look at the impact of broadband on firm level productivity,
there is a growing body of literature that examines the association between broadband and

(Atif, Endres, Macdonald) Broadband Infrastructure and Economic Growth
Page 3
macroeconomic level indicators such as economic growth and employment. Czernich et.al
(2011) uses an instrumental variable model to estimate the effect of broadband infrastructure
on economic growth in a panel of 25 OECD countries. The authors conclude that the
introduction and diffusion of broadband had an important impact on GDP growth in those
countries included in the panel. After a country had introduced broadband per capita GDP
was on average 2.7 and 3.9 per cent higher than before its introduction, controlling for
country and year fixed effects. In terms of subsequent impacts the authors found that a 10
percent point increase in broadband penetration raised annual per-capita growth by between
0.9 and 1.5 percentage points.
A study by Lehr et.al (2006) analysed the impacts of broadband penetration on employment
growth, wages, rents, business growth and industry structure at the community (zipcode),
industry and state levels. The results indicate that the broadband take-up enhances economic
activity with significant effects on job growth and business growth, particularly for larger
business and business in IT intensive sectors. The study found that broadband take-up had no
significant impact on wages but that there was a significant association between broadband
take-up and residential property values.
Using data from 120 developed and developing countries Qiang and Rossotto (2009) employ
the Barro cross-sectional endogenous growth model to analyse the impact that broadband has
had on long-term economic growth rates over the period 1980 to 2006. The results from this
empirical analysis suggest a robust and noticeable growth dividend from broadband access in
developed countries. Specifically, all else being equal, a 10 per cent increase in broadband
penetration in a developed country would yield a 1.21 percent increase in economic growth.
For developing countries it was found that, all else being equal, a 10 percent increase in
broadband penetration would yield an increase in economic growth of 1.38 percent.
A study by Koutroupis (2009) employs a macroeconomic production function with a
microeconomic model for broadband investment to estimate how investment in broadband
infrastructure impacted economic growth in 22 OECD countries over the period 2002-2007.
The results suggest that there is a strong causal link between broadband and economic
growth. The findings also suggest that there are increasing returns to investments in
broadband infrastructure and that countries with broadband penetration rates of more than 30
per cent enjoy higher returns from broadband investments relative to those countries with
lower broadband penetration rates

(Atif, Endres, Macdonald) Broadband Infrastructure and Economic Growth
Page 4
Finally a widely cited econometric study by Crandall, Lehr and Litan (2007) estimates the
effects of broadband penetration on economic output and employment, in aggregate and by
industry sector for 48 States of the United States over the period 2003-2005. The study finds
that non-farm employment in several industries is positively associated with broadband use.
More specifically, for every one per cent increase in broadband penetration in a State,
employment is increased by 0.2 to 0.3 per cent per year. At a more disaggregated level the
study finds that employment in both manufacturing and service industries (especially finance,
education and health care) is positively related to broadband penetration. The study also
concludes that State output of goods and services is also positively associated with broadband
use.
3 Methodology
The basic framework of methodology is to estimate parameters based on panel data for
defined variables for all 31member countries under of the OECD using a static (Fixed Effects
Estimator) and a dynamic model (Basic Linear Dynamic Model).
Starting with the basic macroeconomic model, where output is the function of capital stock in
the economy and per unit effective labor (Romer (2006))
𝑌𝑖𝑡 = 𝐹(𝐾𝑖𝑡 , 𝐴𝐿𝑖𝑡) (1)
where 𝑌𝑖𝑡 , 𝐾𝑖𝑡and 𝐴𝐿𝑖𝑡 are the output, capital and effective labor of country i at time t.
The Cobb-Douglas formation of the above functional form is given as:
𝑌𝑖𝑡 = 𝐾𝑖𝑡𝛼(𝐴𝐿𝑖𝑡)1−𝛼 (2)
The log-form of model in equation (2) is given as:
𝑙𝑛𝑌𝑖𝑡 = 𝛼. 𝑙𝑛𝐾𝑖𝑡 + 1 − 𝛼 . 𝑙𝑛𝐴𝑖𝑡 + (1 − 𝛼). 𝑙𝑛𝐿𝑖𝑡 + 𝑢𝑖𝑡 (3)
where 𝐴𝑖𝑡 is the technological state of a country i at time t. Furthermore, the stochastic error
term 𝑢𝑖𝑡 is defined as:
𝑢𝑖𝑡 = 𝛾𝑖 + 𝜀𝑖𝑡 (4)
where 𝛾𝑖 is the country-specific time-invariant effect and 𝜀𝑖𝑡 is the non-stochastic error term
with zero mean and constant variance. Therefore, based on (3), and (4), we can rewrite (3) as:
𝑙𝑛𝑌𝑖𝑡 = 𝛼. 𝑙𝑛𝐾𝑖𝑡 + 1 − 𝛼 . 𝑙𝑛𝐴𝑖𝑡 + (1 − 𝛼). 𝑙𝑛𝐿𝑖𝑡 + 𝛾𝑖 + 𝜀𝑖𝑡 (5)
The technology term A can be divided into non-communications technology and
communications technology, which can then be divided into broadband and telephony
technology:
𝑙𝑛𝐴𝑖𝑡 = 𝑙𝑛𝐹𝑖𝑡 + 𝑙𝑛𝜃𝑖𝑡+. 𝑙𝑛𝐵𝑖𝑡 (6)

(Atif, Endres, Macdonald) Broadband Infrastructure and Economic Growth
Page 5
where 𝐵𝑖𝑡 is the penetration of broadband technology in country i at time t, T represents non-
communication technology and 𝜃𝑖𝑡 represents fixed-line technology other than broadband.
This leaves us with:
𝑙𝑛𝑌𝑖𝑡 = 𝛼. 𝑙𝑛𝐾𝑖𝑡 + 1 − 𝛼 . (𝑙𝑛𝐹𝑖𝑡 + 𝑙𝑛𝜃𝑖𝑡 + 𝑙𝑛𝐵𝑖𝑡) + (1 − 𝛼). 𝑙𝑛𝐿𝑖𝑡 + 𝛾𝑖 + 𝜀𝑖𝑡 (7).
Given (7) and assuming 𝑦𝑖𝑡 = 𝑙𝑛𝑌𝑖𝑡 , 𝑘𝑖𝑡 = 𝑙𝑛𝐾𝑖𝑡 , 𝑙𝑖𝑡 = 𝑙𝑛𝐿𝑖𝑡 , 𝑓 = 𝑙𝑛𝐹, 𝜃 = 𝑙𝑛𝜃 𝑎𝑛𝑑 𝑏 = 𝑙𝑛𝐵
and 𝛽 = 1 − 𝛼, and the final output model for our problem is given as:
𝒚𝒊𝒕 = 𝜷. 𝒇𝒊𝒕 + 𝜷. 𝜽𝒊𝒕 + 𝜷. 𝒃𝒊𝒕 + 𝜶. 𝒌𝒊𝒕 + 𝜷. 𝒍𝒊𝒕 + 𝜸𝒊 + 𝜺𝒊𝒕 (8)
where y is given by GDP per worker, l is controlled for by measuring y in terms of labour, k
is given by gross capital formation, 𝜃1 is broadband subscribers per 100, 𝜃0 is fixed-telephone
subscriptions, and the proxy for f is given by proportion of the labour force with tertiary
education.
3.1 Fixed Effects Model:
The Fixed Effects model for the output function given in equation (8), is derived by time
demeaning the variables, and subtracting them from the original model. The final model for
Fixed Effects Estimators is given in (10):
𝒚𝒊𝒕 − 𝒚 𝒊 = 𝜷. (𝒇𝒊𝒕 − 𝒇 𝒊) + 𝜷. (𝜽𝒊𝒕 − 𝜽 𝒊) + 𝜷. (𝒃𝒊𝒕 − 𝒃 𝒊) + 𝜶. 𝒌𝒊𝒕 − 𝒌 𝒊 + 𝜷. 𝒍𝒊𝒕−𝒍 𝒊 + (𝜺𝒊𝒕 − 𝜺 𝒊) (9)
where the country-specific time-invariant effect (𝛾𝑖) has been eliminated from the model, to
increase the precision and consistency of the model.
3.2 Basic Linear Dynamic Model:
The fundamental assumption of a dynamic model is that a regressor impacts the regressand
with a lapse of time. Therefore, apart from the functional regressors, the dynamic model also
includes lagged value of the regressand as the regressor in the model.
Accordingly, the Basic Linear Dynamic model for output function given in equation (8), is
given by equation (11):
𝒚𝒊𝒕 = 𝝀𝒚𝒊𝒕−𝟏 + 𝜷. 𝒇𝒊𝒕 + 𝜷. 𝜽𝒊𝒕 + 𝜷. 𝒃𝒊𝒕 + 𝜶. 𝒌𝒊𝒕 + 𝜷. 𝒍𝒊𝒕 + 𝜸𝒊 + 𝜺𝒊𝒕 (10)
By estimating the models in (9) and (10), we can examine the impact of broadband penetration on
GDP (Yit) for the panel of countries under consideration, and later on compare the results for both
static and dynamic models of panel data analysis.

(Atif, Endres, Macdonald) Broadband Infrastructure and Economic Growth
Page 6
4 Data
Broadband penetration is measured as the total number of broadband subscribers per 100
inhabitants and is sourced from the OECD Communication Outlook 2011 (OECD (2011)). A
broadband connection is defined as a fixed communications service providing connection to
the internet at speeds above 256 kilobits per second (kbps). This definition typically captures
broadband connections provided using digital subscriber line (DSL), cable modem, fibre and
some fixed wireless (such as satellite and WIMAX) technologies but excludes mobile
broadband technologies (such a 3G).
Other data sourced from the OECD includes:
Total fixed telephone subscriptions per 100 inhabitants. This is used as a proxy for
the availability of broadband infrastructure1.
Tertiary education attainment as a proportion of the population aged 25 to 64. This is
used to control for different productivity levels between workforces.
The remaining data is sourced from the World Bank Development Indicators (2012). This
data includes gross capital formation as a percentage of GDP. Gross capital formation
consists of outlays on additions to the fixed assets2 of the economy plus net changes in the
level of inventories. Importantly, this measure includes both public and private sector outlays
on capital assets, which is appropriate given that in many OECD member counties
Government accounts for a significant share of outlays on fixed assets and public
infrastructure.
The dependent variable is real GDP expressed in 1990 purchasing power parity (PPP) and
normalised by persons employed. This controls for various demographics difference among
countries.
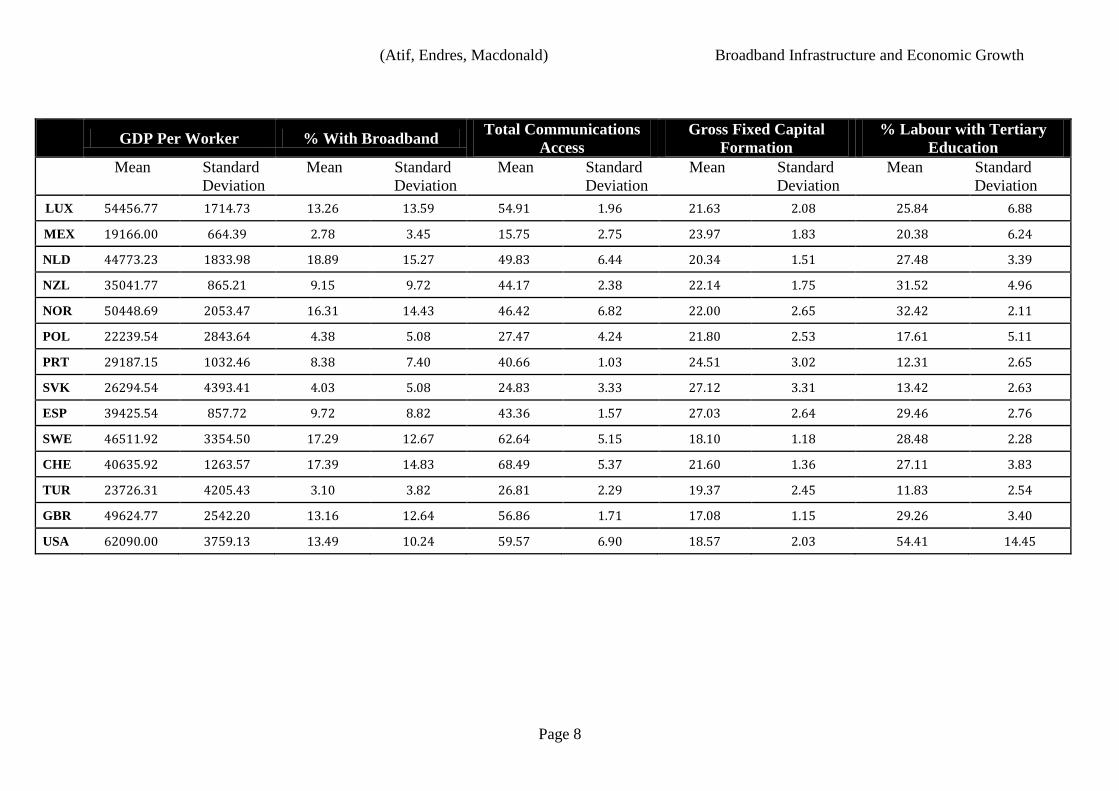
Table 1 gives descriptive statistics for the countries in our sample:
1 To date the provision of fixed broadband services has been largely dependant on the availability of legacy
copper telephony and cable TV networks. 2 Fixed assets include land improvements (fences, ditches, drains, and so on); plant, machinery, and equipment
purchases; and the construction of roads, railways, and the like, including schools, offices, hospitals, private
residential dwellings, and commercial and industrial buildings.

(Atif, Endres, Macdonald) Broadband Infrastructure and Economic Growth
Page 7
GDP Per Worker % With Broadband
Total Communications
Access
Gross Fixed Capital
Formation
% Labour with Tertiary
Education
Mean Standard
Deviation
Mean Standard
Deviation
Mean Standard
Deviation
Mean Standard
Deviation
Mean Standard
Deviation
AUS 48018.31 1625.17 10.92 10.56 48.60 4.74 26.64 1.87 31.45 3.20
AUT 45674.54 1920.33 11.39 8.81 45.21 4.39 23.07 1.20 16.77 2.77
BEL 53351.54 1778.41 15.05 11.48 46.72 2.23 21.31 1.44 34.48 2.61
CAN 47829.46 1349.13 17.04 10.77 60.54 6.48 21.14 1.45 43.19 3.21
CZE 21602.00 2665.39 7.19 8.38 30.80 5.67 26.68 2.37 13.48 2.01
DNK 45367.46 1637.69 19.31 15.52 61.81 8.72 20.56 1.80 28.78 2.96
EST 36610.00 6973.95 11.42 10.42 35.41 1.78 30.11 6.24 32.25 2.28
FIN 47664.77 2996.51 15.15 12.73 42.85 11.70 20.42 1.39 32.98 2.50
FRA 52943.23 1826.00 13.11 12.51 56.51 0.71 19.68 1.24 27.09 2.99
DEU 42012.69 1296.29 12.72 12.21 62.14 3.91 19.06 1.94 24.11 1.23
GRC 32858.23 2622.89 5.13 7.33 51.75 4.24 23.19 2.97 22.41 3.04
HUN 19362.46 2255.38 7.04 7.73 33.42 2.65 23.95 2.95 18.99 2.65
ISL 41851.62 3611.87 17.87 13.96 64.66 3.04 22.79 6.11 23.98 3.72
IRL 52732.31 4037.40 8.13 9.41 48.64 2.60 22.44 4.77 30.06 5.29
ITA 46171.69 836.63 9.16 8.55 43.09 4.80 20.82 0.83 13.82 2.26
JPN 42214.23 2377.01 13.72 10.54 44.32 5.96 23.48 1.76 37.92 3.44
KOR 37322.54 4520.85 22.70 12.03 52.90 3.54 29.10 1.67 30.76 5.89
(Atif, Endres, Macdonald) Broadband Infrastructure and Economic Growth
Page 8
GDP Per Worker % With Broadband
Total Communications
Access
Gross Fixed Capital
Formation
% Labour with Tertiary
Education
Mean Standard
Deviation
Mean Standard
Deviation
Mean Standard
Deviation
Mean Standard
Deviation
Mean Standard
Deviation
LUX 54456.77 1714.73 13.26 13.59 54.91 1.96 21.63 2.08 25.84 6.88
MEX 19166.00 664.39 2.78 3.45 15.75 2.75 23.97 1.83 20.38 6.24
NLD 44773.23 1833.98 18.89 15.27 49.83 6.44 20.34 1.51 27.48 3.39
NZL 35041.77 865.21 9.15 9.72 44.17 2.38 22.14 1.75 31.52 4.96
NOR 50448.69 2053.47 16.31 14.43 46.42 6.82 22.00 2.65 32.42 2.11
POL 22239.54 2843.64 4.38 5.08 27.47 4.24 21.80 2.53 17.61 5.11
PRT 29187.15 1032.46 8.38 7.40 40.66 1.03 24.51 3.02 12.31 2.65
SVK 26294.54 4393.41 4.03 5.08 24.83 3.33 27.12 3.31 13.42 2.63
ESP 39425.54 857.72 9.72 8.82 43.36 1.57 27.03 2.64 29.46 2.76
SWE 46511.92 3354.50 17.29 12.67 62.64 5.15 18.10 1.18 28.48 2.28
CHE 40635.92 1263.57 17.39 14.83 68.49 5.37 21.60 1.36 27.11 3.83
TUR 23726.31 4205.43 3.10 3.82 26.81 2.29 19.37 2.45 11.83 2.54
GBR 49624.77 2542.20 13.16 12.64 56.86 1.71 17.08 1.15 29.26 3.40
USA 62090.00 3759.13 13.49 10.24 59.57 6.90 18.57 2.03 54.41 14.45

(Atif, Endres, Macdonald) Broadband Infrastructure and Economic Growth
Page 9
5 Results and Analysis
Based on the methodology devised in previous section, the results were estimated
using computer package STATA (Statistics/Data Analysis) Version 11.0. Following
sections discuss all relevant results and their significance for the study.
5.1 Stationarity of Series
The Levin-Lin-Chu test for stationarity of panel data series, assuming null hypothesis
of unit root in the series, exhibits that natural-log form of variables GDP per person
employed (lgdp), gross capital formation (lgfc) and broadband internet subscribers
(lbb) are stationary at level, however the labor force with tertiary education and total
fixed telephone subscriptions per 100 inhabitants (ltca) are non-stationary at level.
The results for Levin-Lin-Chu test are explained in table-2
‘tledu’ and ‘tltca’ in column-VII and –VIII of the above table are stationary
counterparts of ledu and ltca respectively, de-trended by using moving average
technique of data smoothing. Levin-Lin-Chu test shows that both these series
stationary at level, with 1 percent level of significance.
5.2 Estimation
The data contains observations for a panel of 31 OECD countries across four cross
sections for each country (N=31, K=4), spanning over a time period of 1998 to 2010
inclusive (T=13, i.e. T<N). The fact that T<N, waives off the possibility of using
static modelling techniques such as Random Coefficients, Linear Restrictions,
Seemingly Unrelated Regression, and Mean Group Estimator, hence the possible
techniques under static models comprise of Random Effects and Fixed Effects
estimators.
However, we have tried to estimate the coefficients using various estimation
techniques and the best technique has been selected through rational argumentation
relevant to properties of different models. Table-3 shows estimation results based on
techniques such as Pooled Ordinary Least Square (P-OLS), Fixed Effects (FE) model,
Random Effects (RE) model, Random Coefficients Model, Basic Linear Dynamic

(Atif, Endres, Macdonald) Broadband Infrastructure and Economic Growth
Page 10
model with one lag, and the Dynamic model with two-periods lagged instrumental
variable as the explanatory variable.
Table-4 shows results for different hypothesis tests performed to examine the
significance of time-invariant country-specific effect across each cross section, and in
relation to other explanatory variables.
The null hypothesis of identical country-specific effects (i.e. 𝛼1 = 𝛼2 … = 𝛼𝑁) under
the F-test introduced for FE model is rejected at 1 percent level of significance,
meaning thereby that individual specific effects are not the same across different
countries for the given set of data. The conclusion from this is that Pooled OLS is less
efficient than the FE estimator.
Likewise, the null hypothesis of homogeneous country-specific effects (i. e 𝜎𝛼 = 0)
under the Breusch-Pagan test introduced for RE model, is also rejected at 1% level of
significance, and hence the country-specific effect is heterogeneous over different
countries. However, the Breusch-Pagan test 'can suffer from serious size distortion
when N/T is not small" (Halunga et al., 2011). Thus the small T of our sample may
invalidate the results of the Breusch-Pagan test.
The final test used was the Hausman test for effectiveness of RE model, with null
hypothesis of no correlation between country-specific effects (i.e. Cov(𝛼𝑖 𝑋𝐾𝑖𝑡 = 0)
is rejected at 1 percent level of significance (Table-4). Hence, individual effects are
uncorrelated with explanatory variables, meaning the RE model is not the best-fit
static model based on the data, and that FE is preferred over RE.
Moving from static to dynamic modelling, Table-3 gives the estimates of basic linear
dynamic model, first by using one-period lagged GDP per person employed, and
secondly by using two-period lagged variable as an explanatory variable. However,
the results for estimated dynamic models demonstrate an insignificant second-period
lagged explanatory variable at 5 percent level of significance, further suggesting that
one-period lag is appropriate model under the Akaike Information Criteria.
Hence, based on the above inferences, the fixed effects estimator is considered as the
primary static estimator, and single-period lagged variable as the dynamic estimator
for the study under consideration.

(Atif, Endres, Macdonald) Broadband Infrastructure and Economic Growth
Page 11
Table-2
yit Bit kit elit=ledu eTit=ltca lit Tit=tltca
Test Statistic -5.8302 -5.2034 -2.4022 -0.6198 4.6205 -10.8029 -6.6802
p-value 0.0000 0.0000 0.0081 0.2677 1.000 0.0000 0.0000
Conclusion* Reject H0 Reject H0 Reject H0 Accept H0 Accept H0 Reject H0 Reject H0
Remarks Stationary Stationary Stationary Non-
stationary Non-
stationary Stationary Stationary
* assuming 5 percent level of significance
Table-3
Pooled OLS FE RE
Random Coefficients
Dynamic (1-lag)
Dynamic (2-lag)
bit
0.0238 (.0047) *
(0.0000) ^
0.0153 (.0018) (0.0000)
0.0145 (.0018) (0.0000)
0.0109 (.0036) (0.003)
0.0035 (.0009) (0.0000)
0.0053 (.0013) (0.0000)
kit
-0.1561 (.0558) (0.0050)
0.0724 (.0235) (0.0020)
0.7571 (.0243) (0.0020)
0.1329 (.0246) (0.0000)
0.0035 (.0096) (0.0000)
0.0661 (.0102) (0.000)
lit
0.2985 (.0312) (0.0000)
0.2124 (.0391) (0.0000)
0.2857 (.0363) (0.0000)
0.3601 (.1293) (0.005)
0.063 (.0236) (0.008)
0.0548 (.0238) (0.021)
Tit
0.4809 (.0339) (0.0000)
-0.0379 (.0375)
(0.3120)+
0.0524 (.0351)
(0.1360)+
-0.0111 (.108)
(0.918)+
0.0271 (.021)
(0.196)+
0.0415 (.0209) (0.047)
* Standard error ^ p-value + insignificant at 5% level of significance
Table-4
Test Null Hypothesis Test Statistic Computed
Value p-value Conclusion
* Remarks
F-Test for FE 𝛼1 = 𝛼2 … = 𝛼𝑁 𝐹 =
𝑅𝑆𝑆𝑅 − 𝑅𝑆𝑆𝑈 /(𝑁 − 1)
𝑅𝑆𝑆𝑈/(𝑁𝑇 − 𝑁 − 𝐾)
= ~ 𝐹 𝑁 − 1 , 𝑁𝑇 − 𝑁 − 𝐾
152.47 0.000 Reject H0 No country-
specific effect
Breusch Pagan
Test for RE 𝜎𝛼 = 0 𝐿 =
𝑁𝑇
2(𝑇 − 1) (𝑇. 𝑒𝑂𝐿𝑆 ,𝑖)
2𝑖
𝑒𝑂𝐿𝑆 ,𝑖𝑡2
𝑡𝑖
− 1
2
~ 1418.16 0.000 Reject H0 No country-
specific effect
Hausman Test
for RE Cov(𝛼𝑖 𝑋𝐾𝑖𝑡 = 0 𝐻 =
(𝛽 𝐹𝐸 − 𝛽 𝑅𝐸)2
(𝛽 𝐹𝐸) − 𝑣𝑎𝑟(𝛽 𝑅𝐸)~ 24.63 0.001 Reject H0 FE is preferred
over RE
* assuming 5 percent level of significance

(Atif, Endres, Macdonald) Broadband Infrastructure and Economic Growth
Page 12
The Fixed Effects estimator exhibits a positive and significant correlation between
growth rate of broadband and the GDP per person employed, i.e. given a 10 percent
increase in the growth of broadband internet subscribers (per 100 inhabitants), on
average, the growth rate in GDP per person employed grows by 0.15 percent, holding
all else constant. Likewise, it shows a positive relationship between growth rate of
gross capital formation, labor force with tertiary education and total fixed telephone
subscriptions per 100 inhabitants. However, the coefficient for tltca is insignificant at
5 percent level of significance, which reduces the precision of this variable as an
effective explanatory variable.
Similarly, the Basic Linear Dynamic model with single period lagged variable also
illustrates a significant positive relationship between growth in broadband penetration
and GDP per person employed. According to the coefficient of lbb, given a 10 percent
increase in broadband internet subscribers per 100 inhabitants, the growth rate in GDP
on average increases by 0.035 percent, holding all else constant. Other variables have
a similar effect on growth rate of GDP as the fixed effects model, and tltca is again
insignificant under dynamic model.
The fact that total fixed telephone subscriptions per 100 inhabitants (being used as a
proxy for availability of broadband infrastructure) is insignificant in both static and
dynamic models, may suggest it is not a good proxy for broadband infrastructure. The
intuition for this is clear, as not all phone subscribers want a broadband connection,
and there may be a large portion who never opt for broadband. However, we are not
prepared to say that availability of telephone line cannot mark the ceiling of available
broadband connections.
6 Conclusions
In this paper, we analysed the effects of broadband penetration on economic growth
over a 13 year period. Based on annual data for a panel of OECD countries, and using
both a static and dynamic estimation approach, we find that broadband penetration
has had a positive impact on economic growth. Our empirical results suggest that a 10
percent increase in the growth of broadband penetration will raise economic growth
per employee by approximately 0.035 percentage points.

(Atif, Endres, Macdonald) Broadband Infrastructure and Economic Growth
Page 13
These findings are robust to numerous tests and the inclusion of relevant control
variables. The results of Hausman test and the significance of the lagged dependant
variable in the linear dynamic model provides confidence that our approach isolated
the causal effect of broadband penetration on economic growth.
Our findings are consistent with a growing body of literature, which identifies
broadband a general purpose technology that is fundamentally changing how and
where economic activity is organised. Our finding also adds further weight to calls for
Governments to adopt policies that accelerate broadband penetration and promote
investment in broadband infrastructure.
We conclude by discussing two important limitations of our study. First, our measure
of broadband includes fixed broadband connections only and excludes broadband
connectivity provided by mobile wireless networks. From a policy perspective this is
an important limitation as wireless mobile networks have a lower cost to deploy
relative to fixed networks. Furthermore, several studies (see Ovum (2005) and
Kathuria et.al (2009)) indicate that that there is a mobility dividend associated with
wireless mobile broadband services which may further impact economic growth.
Second, while our study shows that over the last 13 years there has been a positive
association between increases in broadband penetration and economic growth, our
study is unable to say anything about the extent to which this association will
continue or whether higher levels of broadband penetration will result in a long-term
competitive advantage for an economy. Consideration of these letter issues are
important when deciding what policy settings are appropriate to encourage increases
in broadband penetration and investment in broadband infrastructure.

(Atif, Endres, Macdonald) Broadband Infrastructure and Economic Growth
Page 14
References
Allen Consulting Group (2002). “Built for Business II: Beyond Basic Connectivity,
The Internet and Australian Business”. Sydney
Australian Industry Group (2008). “National CEO Survey ─ High Speed to
Broadband: Measuring industry demand for a world class service”. Australia
Collins P, Day D, Williams C (2007). “The economic effects of broadband: An
Australian perspective”. Research Statistics and Technology Branch, Department of
Communications, Information Technology and the Arts, Canberra.
Crandall. R., Lehr. W. and Litan. R., 2007, “The Effects of Broadband Deployment
on Output and Employment, A Cross-sectional Analysis of U.S. Data”. Issues in
Economic Policy, (6), The Brookings Institute, Washington D.C.
Czernich N, Falck O, Kretschmer T, Woessmann L (2011). "Broadband Infrastructure
and Economic Growth”. The Economic Journal 121(May): 505-532.
Grimes A, Ren C, Stevens P (2011). “The need for speed: impacts of internet
connectivity on firm productivity”. Motu Economic and Public Policy Research.
Lehr W, Osorio C, Gillet S, Sirbu M, (2006). “Measuring broadband's economic
impacts”. Presented at the 33rd research confderence on communications, information
and internet policy (TPRC). Arlington Virginia September 23-25, 2005.
Andreea Halunga, Chris D. Orme, Takashi Yamagata, (2011). "A Heteroskedasticity
Robust Breusch-Pagan Test for Contemporaneous Correlation in Dynamic Panel Data
Models." University of Manchester Economics Discussion Paper Series 2011,
Working Paper No. EDP-1118
Holt Lynne W. and Jamison Mark A (2009). “Broadband and Contributions to
Economic Growth: Lessons from the U.S. Experience.” Telecommunications Policy,
Vol. 33, No. 10-11, pp. 575-581.
Kathuria R, Uppal M, and Mamta (2009). “An Econometric analysis of the impact of
mobile”, Vodafone Public Policy Series, Number 9, January 2009, United Kingdom.
Majumdar, S. K., Carare O, and Chang H, (2010). “Broadband Adoption and Firm
Productivity: Evaluating the Benefits of General Purpose Technology”. Industrial and
Corporate Change, Vol. 19, Issue 3, pp. 641-674, 2010.
OECD (2008). “Broadband and the Economy, Ministerial Background Report”
DSTI/ICCP/IE(2007)3/FINAL, Paris Pp.5-6
OECD (2011). “Communications Outlook 2011”. Paris.
OECD (2009). “Tertiary level educational attainment for age group 25-64”. Paris
OVUM (2005). “The Impact of the US Wireless Telecom Industry on the US
Economy: A study for CTIA-The Wireless Association”. Boston.
Romer, P. M. (1990). “Endogenous technological change.” Journal of Political
Economy vol 98, pp71-102.
Qiang & Rossotto (2009). “Economic Impacts of Broadband”, in The World Bank
(2009). Information and Communications for Development 2009: Extending Reach
and Increasing Impact. Washington, DC: The World Bank.
The World Bank (2012). “World Development Indicators”. Washington DC.