Embed Size (px)
Citation preview

BROADBAND INFRACO
SOC LIMITED
CORPORATE PLAN AND
ANNUAL PERFORMANCE
PLAN
2017/18
Portfolio Committee
M. Ngcobo
Chairperson of the Board
of Directors
Slide 1

Linking Outcomes and Goals/Objectives
MTSF Outcomes/ DTPS Goals
An efficient, competitive and responsive
economic infrastructure networkOutcome 6
BI Strategic Goals & Objectives
Decent employment through inclusive
economic growthOutcome 4
Skilled and capable workforce to support an
inclusive growth pathOutcome 5
9 point Plan
Slide 2
Nr. 7. Unlocking SMME;
cooperatives; townships
and rural enterprises.
Nr. 8 Reform of the
SOC, broadband roll out
infrastructure
SG 1: Resilient Network
SO 1: Develop an integrated packet transport
network that encompasses growth/expansion and
technology evolution
SG 3: Economic and Social Transformation
SO 3: Drive Socio-Economic Transformation
SG 2: Financial Sustainability
SO 2: Ensure long term business sustainability
SG 5: Sound Human Capital Practices
SO 5: Build high performance organisation
SG 4: Pursue Operational Excellence
SO 4: Integrated Strategy Execution
SG 6: Corporate Governance
SO 6: Effective Corporate Governance
SO 4.2 Create a high performing organisation
to enable achievement of the Department's
mandate
SO 1.1 Coordinate the Broadband connectivity
to achieve 100% population coverage by 2020DTPS
DTPS SO 4.1: Improve performance of SOC’s
through proactive and stringent oversight
DTPSSO 2.2 Promote transformation of the ICT
Sector through the development of ICT
SMME Support Strategy
DTPS

What does each axis represent?
Customers
Revenue
Cost of Sales
Growth of the customer base from 23 to 27 from
April 2016 to March 2017
The Company has grown its customer base from 23
to 27 in the current cycle. It has acquired up-sell
opportunities from existing customers and also sold
capacity to new customers.
Management continued optimisation initiatives from
the previous period to reduce the cost of sales
through re-negotiations of maintenance contracts
and fibre lease agreements, optimisation of routes,
building of new networks instead of leasing
expensive routes amongst others.
Performance at a glance: Revenue and CoS (p2-5)
Customers, Revenue and Cost of Sales
Province POPFibre
(Km)
Eastern Cape 19 1829
Free State 17 1482
Kwazulu Natal 21 2363
Limpopo 11 890
Mpumalanga 15 1527
North West 9 949
Northern Cape 27 2529
Gauteng 17 1461
Western Cape 20 1889
Totals 156 14919
Slide 3
11
14
18
23
27
32
0
5
10
15
20
25
30
35
R 0
R 100,000
R 200,000
R 300,000
R 400,000
R 500,000
R 600,000
2013
2014
2015
2016
2017
2018
Customers Revenue Cost of Sales
943 1 097
1 514
1 853
2 876
-
500
1 000
1 500
2 000
2 500
3 000
2012/13 2013/14 2014/15 2015/16 2016/17
STM 1 Equivalents

Performance at a glance: Procurement Spend
Slide 4
49
13
58
12
133
11 14
59
17
101
-
20
40
60
80
100
120
140
Quarter 1 Quarter 2 Quarter 3 Quarter 4 Total
Mill
ion
s
Annual Procument Spend
2015/16
2016/17
133
151
72
32
08
101 110
35
22
0 0 -
20
40
60
80
100
120
140
160
BBBEE Spend BBBEE Multiplier BOE BWO PWD BYO
Mill
ion
s
Annual B-BBEE Spend
2015/16
2016/17

Key Market Trends
Market Outlook (p18-20)
Mobile Traffic
• IP traffic is expected to grow at a
compound annual growth rate of 23%
from 2015 to 2020.
• Mobile data traffic in South Africa is
expected to grow at a compound
annual growth rate of 55% between
2015 and 2020;
• Mobile operators complemented the
infrastructure roll out investments with
tariff hikes ranging from 3% to 40%.
Fixedline Access
• The market is evolving at a fast pace
as those providing end user services
are deploying technologies to meet the
demand for services.
FTTX
• A wave of FTTH and FTTB continues
to sweep the local telecoms market;
• Reseller models have been developed
with various operators and ISP’s
selling the bandwidth on behalf of the
FTTH providers (e.g. VOX, MWEB,
Cell C, and Link Africa)
Regional and
International
Connectivity
The key operators in South Africa share
capacity in the international submarine
cables making it a very competitive
market. Notably, Telkom, Vodacom,
Neotel and MTN are shareholders in both
WACS and EASSy.
Market Consolidation
The deals that have gone through during
this period include:
• The acquisition on BCX by Telkom in
the previous period has now resulted
in the merger of Telkom Business and
BCX into one entity;
• Approved Mweb Connect (Business
ISP) acquisition by Internet Solutions
(ISP);
• Acquisition of Neotel by Liquid and
Royal Bafokeng Holdings;
• MTN Dis-investment in Afrihost
(ISP);
• Approved Dynamic IT (IT provider)
acquisition by Vox Telecoms (ISP);
• Approved Wireless Business
Solutions (wireless operator)
acquisition by Multisource (integrated
operator); and
• Blue Label Telecommunication
acquisition of Cell C.
Slide 5

Strategy: Enterprise Operating Model(p26)
Slide 6
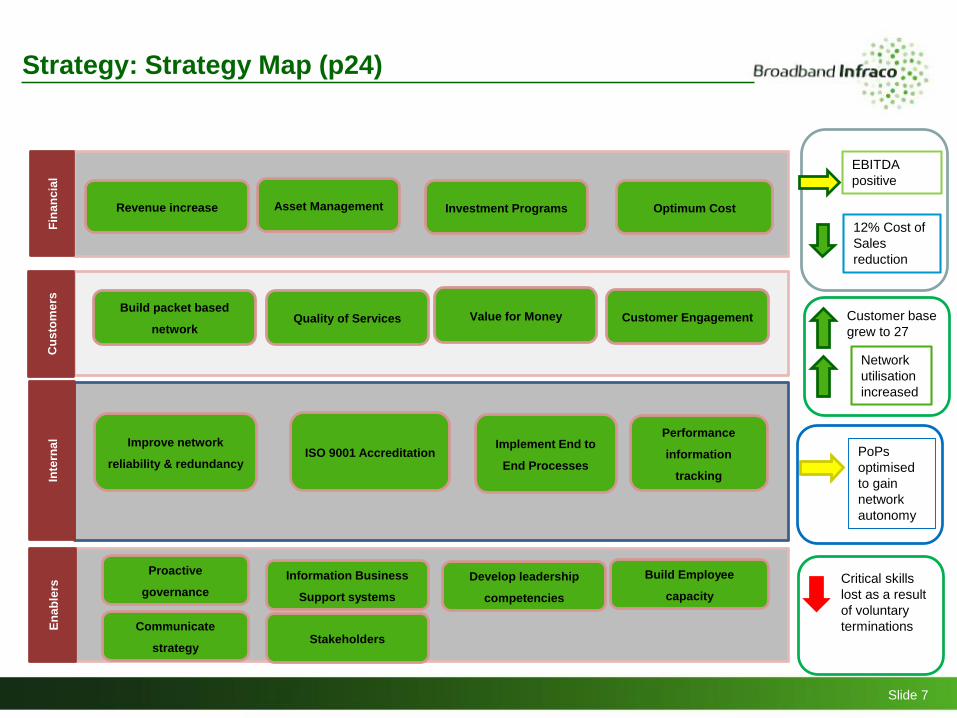
Strategy: Strategy Map (p24)
Slide 7
Customer Engagement
Build Employee
capacity
Performance
information
tracking
Improve network
reliability & redundancy
Investment ProgramsRevenue increase
Fin
an
cia
l C
us
tom
ers
Value for Money
ISO 9001 AccreditationImplement End to
End Processes
Inte
rna
l
Build packet based
network
Asset Management Optimum Cost
Proactive
governance
Information Business
Support systems
Develop leadership
competencies
Communicate
strategy
En
ab
lers
Quality of Services
Stakeholders
12% Cost of
Sales
reduction
Customer base
grew to 27
EBITDA
positive
PoPs
optimised
to gain
network
autonomy
Critical skills
lost as a result
of voluntary
terminations
Network
utilisation
increased

Alignment to Executive Authority Objectives (p9 -10)
Slide 8
Strategic Goal Objectives Key Performance
Areas
2017/18 Targets DTPS Objectives Outcome
No
SG1 Resilient
Network
SO 1.1 Develop an
integrated packet
transport network that
encompasses
growth/expansion and
technology evolution
Network Planning Migration from SDH
to packet based
network
SO 1.1 Coordinate
broadband
connectivity to
achieve 100%
population coverage
by 2020
6
Network Build Deployment of
DWDM core
symmetrical network
Network performance
management
7.5 hours to Restore
Core Network Faults
Network performance
rebates paid as
percentage of gross
revenue
SG 2 Broadband
Infraco will
endeavour to be
financially
sustainable by 2018
SO 2.1 Ensure long-term
business Sustainability
Financial
Management
R89.2 million
Revenue Growth
S0 4.1 improve
performance of
SOCs through
proactive and
stringent oversight
R116.0 mil Increase
amount of EBITDA
annually
Debtors’ collection of
45 days per contract

Alignment to Executive Authority Objectives (p9 -10)
Slide 9
Strategic Goal Objectives Key Performance
Areas
2017/18 Targets DTPS Objectives Outcome
No
SG 3 Economic and
Social
Transformation
SO 3.1 Drive Socio-
Economic transformation
Increase participation
of HDI’s in the ICT
sector
70% spend of BBBEE
discretionary budget
SO 2.2 Promote
transformation of the
ICT Sector through
the development of
ICT SMME support
strategy.
4
40% spend on BOE
10% spend on
Women of 40% on
BOE
Corporate Social
Investment
Cyber Security
installation at
Seshigo High School
Facilitate Enterprise
Development
3 X small BEE
companies trained in
OHSAS18001
SG4 Operational
Excellence
SO 4.1 Integrated
Strategy Execution
Systems
Management
Monitored
operationally
SO 4.2 Create a
high performing
organisation to
enable achievement
of the Department’s
mandate
Process Management
Quality Management

Alignment to Executive Authority Objectives (p9 -10)
Slide 10
Strategic Goal Objectives Key Performance
Areas
2017/18 Targets DTPS Objectives Outcome
No
SG 5 Sound Human
Capital Practices
SO 5.1 Build high
performance
organisation
Skills and capability
development
1% of the wage bill
spend on training by
end of year
SO 4.2 Create a
high performing
organisation to
enable achievement
of the Department’s
mandate
5
70% Technical
Interns Qualified for
P1 and P2
SG6 Proactive
Corporate
Governance
SO 6.1 Effective
Corporate Governance
Effective oversight of
the Board and Sub-
Committees
Monitored
operationallySO 4.1 Improve
performance of
SOC’s through
proactive and
stringent oversight
Efficient legal
services and
Telecoms Regulatory
compliance to
safeguard the
interests of the
Company
SO2.1 Develop and
Implement the
Policy and
legislation aimed at
improving access
and affordability of
ICT’s

Annual Performance Plan 2016/2017 (p43-44)
Slide 11
Strategic Goals Strategic Objective KPA KPI Baseline 2017/18 Target Q1 Targets Q2 Targets Q3 Targets Q4 Targets
SG 1: Resilient
Network
SO 1: Develop an
integrated packet
transport network
that encompasses
growth/expansion,
technology evolution
Network
performance
management
Network
performance
rebates paid as
percentage of
gross revenue
0.10% ≤0.2% of gross
revenue
≤0.2% of
quarterly gross
revenue
≤0.2% of
quarterly gross
revenue
≤0.2% of
quarterly gross
revenue
≤0.2% of
quarterly gross
revenue
Actual Time to
Restore Core
Network Faults
8hrs 7.5hrs 7.5hrs 7.5hrs 7.5hrs 7.5hrs
Average
Percentage
service availability
per month
New 98% 98% 98% 98% 98%
SG 2: Financial
Sustainability
SO 2: Ensure long-
term business
Sustainability
Financial Increase Revenue
by R89.2 million
(48.8
million)
R89.2
million
R22.1
million
R23.5
million
R23.5
million
R21.7
million
Current Ratio 93% 115% 178% 159% 131% 115%
Increase amount
of EBITDA
annually
R33.8
million
R116 million R23.9 million R29.8 million R31.1 million R31.2 million
Number of days
per outstanding
customer invoice
45 days 45 days 45 days 45 days 45 days 45 days
SG 3: Economic
and Social
Transformation
SO 3: Drive Socio-
Economic
Transformation
Safety, health
and
environment
Number of small
BEE companies
trained on OSHA
3 SMMEs 3 SMMEs Identify the
SMMEs to be
trained
Train 1 X SMME Train 1 X SMME Train 1 X SMME

Annual Performance Plan 2016/2017 (p43-44)
Slide 12
Strategic Goals Strategic Objective KPA KPI Baseline 2017/18 Target Q1 Targets Q2 Targets Q3 Targets Q4 Targets
SG 3: Economic
and Social
Transformation
SO 3: Drive Socio-
Economic
Transformation
Procurement Allocation of
BBBEE budget
discretionary
spend
112% 70% 10% spend of
BBBEE
20% spend of
BBBEE
20% spend of
BBBEE
20% spend of
BBBEE
Percentage
increase on
black owned
entities spend
39.55% 40% spend of
BBBEE
5% spend of
BBBEE
10% spend of
BBBEE
15% spend of
BBBEE
10% spend of
BBBEE
Percentage
spend of Black
Women
Owned entities
15.24% 10% spend of
40% spend on
BOE
2% spend of
40% on BOE
3% spend of
40% on BOE
4% spend of
40% on BOE
1% spend of
40% on BOE
Corporate
Social
Responsibility
Cyber Security
installed at
High schools
ZERO Seshigo High
School
Computer
laboratory
secured
Develop a
cyber-security
Strategy &
Implementati
on Plan
Identify
partners to
install cyber
security
Train
teachers and
students on
cyber security
Secure
computer lab
& Tablets
SG 5: Sound
Human Capital
Management
Practices
SO 5: Build high
performance
organisation
Human
Resources
Capacity
Building
Training spend
as percentage
of payroll
1.55% 1% of the
wage bill
spend on
Targeted
training and
development
by end of year
Compile
Workplace
Skills Plan
and Annual
training report
Training
spent at 0.5
of payroll
Training
spent at .25
of payroll
Training
spent at 0.25
of payroll
% of Technical
Intern qualified
for P1 and P2
ZERO 70% of
Technical
Interns
completed P1
and P2
Review of
first 6 months
and
submission of
reports and
PoEs
Report to
MICT SETA
and formal
development
Development
and on the
job training
continues
Preparation
for final
reviews and
2nd leg

Capex – Critical Maintenance & Refurbishment
Slide 13
Critical Capital Investments:
• Equipment only bought
on a just in time for
critical replacement only
• To deliver on the
Broadband Infraco
Mandate
• Technology Evolution
• Software Upgrades
Maintenance
• Critical Route Adlash
Refurbishment
• Most of the projects here
are for revenue
protection and
refurbishment of the
network
• IP Rollout is customer
required and will
increase revenue
Project Category Capex Category Project Name Region
Estimated
Project
Cost
Refurbishment
Essential upgrades and
refurbishments
SPOF rectification at Eskom Park
(Witbank) to Rayton, Strengthening-
Transmission Mpumalanga 9,672
Refurbishment
Essential upgrades and
refurbishments
LAINSBURG - refurbishment of SKA
line Western Cape 6,000
Software Upgrade
and Maintenance
Essential upgrades and
refurbishments
Essential upgrade of Network
Management System National 2,308
Software Upgrade
and Maintenance
Essential upgrades and
refurbishments Essential upgrade of of DCN National 2,363
Refurbishment
Essential upgrades and
refurbishments ASON Implementation National 10,000
Technology
Evolution Generation of Revenue Roll out of IP Core Phase 3 National 38,730
Service Cards Operational Capex Service Engineering Cards All 5,231
Head Office Operational Capex NOC Video Walls and Controllers Gauteng 5,000
Head Office Operational Capex IT Phase 2 Gauteng 1,000
All Operational Capex Capitalization of salaries National 2,880
Essential Protection of Revenue Replace Adlash Helios-Juno, TFR Northern Cape 25,464
Refurbishment Protection of Revenue BLOUPUTTS - Radio solution Northern Cape 3,500
Refurbishment Protection of Revenue ROUTE 7 REDUNDANT LINKS Western Cape 10,000
Access network Protection of Revenue
Megawatt Park to Minerva to
NZASM Gauteng 1,884
Customer Protection of Revenue
Adlash: Replace Pembroke-
Poseidon Refurbishment-Fibre
Cable North West 3,500
R127,532

Financial Performance (p50)
Slide 14
Mar-16 Mar-17 Mar-18 Mar-19 Mar-20 Mar-21 Mar-22
Year end Year end Year end Year end Year end Year end Year end
Prev Year Forecast Budget Budget Budget Budget Budget
R'000 R'000 R'000 R'000 R'000 R'000 R'000
Continuing operations
Total revenue 451,648 402,802 492,046 567,727 592,085 634,145 688,783
Year on Year Growth -10.8% 22.2% 15.4% 4.3% 7.1% 8.6%
Cost of Sales excluding depreciation 259,573 215,772 191,647 205,062 219,416 234,775 251,210
Cost of Sales 380,799 358,757 332,756 344,481 340,904 340,501 343,101
Year on Year Growth -16.9% -11.2% 7.0% 7.0% 7.0% 7.0%
Gross Profit 70,849 44,045 159,290 223,246 251,181 293,644 345,683
Gross Profit 15.7% 10.9% 32.4% 39.3% 42.4% 46.3% 50.2%
Other income 4,379 - - - - - -
Operating expenses 175,280 166,249 197,289 207,982 220,276 233,363 247,295
Results from operating activities (100,052) (122,204) (37,999) 15,264 30,905 60,281 98,387
Finance income 8,808 5,664 205 - - - -
Finance charges and fair value movements (150) (969) (11,571) (13,235) (10,733) (7,951) (6,723)
Interest and facility fee (3) (1,011) (11,571) (13,235) (10,733) (7,951) (6,723)
Foreign exchange and fair value gains/(losses) (147) 42 - - - - -
Profit/(loss) before taxation (91,394) (117,509) (49,365) 2,029 20,172 52,330 91,664
Taxation - - - - - - -
Profit/(loss) for the year (91,394) (117,509) (49,365) 2,029 20,172 52,330 91,664
EBITDA 29,992 33,723 116,002 167,574 165,283 178,897 203,169
Employee Cost as % Revenue 24.2% 25.6% 23.7% 21.9% 22.4% 22.4% 22.1%

Financial Position (p53)
Slide 15
Previous year Year end Year end Year end Year end Year end Year end
Actual - Audited Forecast Budget Budget Budget Budget Budget
31-Mar-16 31-Mar-17 31-Mar-18 31-Mar-19 31-Mar-20 31-Mar-21 31-Mar-22
Actual Actual Budget Budget Budget Budget Budget
R'000 R'000 R'000 R'000 R'000 R'000 R'000
AssetsNon-current assets 1,366,919 1,307,030 1,279,422 1,128,853 996,359 879,938 777,518
Property, plant and equipment 1,354,471 1,295,721 1,269,252 1,119,822 988,467 873,185 771,904
Deferred Expenses 12,448 11,309 10,170 9,031 7,892 6,753 5,614Current assets 191,392 90,385 84,388 161,511 238,342 330,845 449,472
Inventories 0 0 0 0 0 0 0
Cash and cash equivalents 141,625 31,768 4,349 92,287 160,583 250,967 365,261
Short term portion of deferred expense 1,139 1,139 1,139 1,139 1,139 1,139 1,139
Trade and other receivables 48,629 57,478 78,900 68,085 76,620 78,740 83,072
Total assets 1,558,311 1,397,415 1,363,810 1,290,364 1,234,702 1,210,784 1,226,990
Equity and liabilities
Equity attributable to owners of the parent 872,266 754,756 705,391 707,420 727,592 779,921 871,585
Share capital 0 0 0 0 0 0 0
Shareholders' loan - DTPS 1,351,130 1,351,130 1,351,130 1,351,130 1,351,130 1,351,130 1,351,130
Shareholders' loan - IDC 478,400 478,400 478,400 478,400 478,400 478,400 478,400
Retained earnings (957,264) (1,074,774) (1,124,139) (1,122,110) (1,101,938) (1,049,609) (957,945)
Non-current liabilities 504,087 483,300 512,056 425,618 336,735 247,748 158,207
Interest-bearing debt 0 33,527 125,719 102,717 77,269 51,718 25,613
Deferred revenue 504,087 449,773 386,337 322,901 259,465 196,029 132,593
Current liabilities 181,958 159,359 146,363 157,326 170,376 183,115 197,198
Trade and other payables 109,049 93,337 78,748 89,319 100,903 113,566 127,379
Current portion of deferred revenue 70,529 63,589 63,589 63,589 63,589 63,589 63,589
South Africa Revenue Services - PAYE and VAT 2,380 2,433 4,026 4,418 5,884 5,960 6,230
Total liabilities 686,045 642,659 658,419 582,944 507,111 430,862 355,405
Total equity and liabilities 1,558,311 1,397,415 1,363,810 1,290,364 1,234,702 1,210,784 1,226,990

• Medium debt represents 50% of
outstanding balance budgeted – R62 mil
• Asset finance and Vendor each represent
25% - about R32 mil each
• The balance of asset finance is higher than
the funds raised in the budget as R35 mil
asset finance was raised in the current
year
25%
25%
50%
Balances at 31 March 2018
Vendor Financing Asset Financing Medium Term Debt Financing
Funding (p 56)
Slide 16
32%
5%63%
New Funds Raised
Vendor Financing Asset Financing Medium Term Debt Financing
• All funds raised is net of 10% deposit paid to
reduce financing costs
• Total funds to be raised in 2018 is R110 mil
• New Vendor Financing of R35 mil budgeted
for IP Core phase 3 roll out
• R5 mil Asset Finance for NOC
• R70 mil from Medium Term Debt Finance to
supplement funding generated from
operations required for customer and
refurbishment projects

Broadband Infraco was licensed in the last quarter of 2009
49% growth human resources within the maintenance, sales and marketing environment for the 2010/2011 year
2011/2012 insourcing of the Network Operations Centre and integrating it into one environment to service all customers
January 2012 marked the end of Rights of Use Agreement and instilling HR discipline in the organisation
Refocus on acquisition of critical skills required for the growth of the organisation as well as optimisation of performance management
Productivity analysis and HR Optimisation
The split between core and support as at 31st March 2016 is as follows: Core = 72%, Support = 28%
Headcount Overview: (SO 5.1)
Slide 17
Headcount Movement vs Customer Growth Employment Equity Demographics (Inclusive of Interns)
Job Levels 2012 2012/13 2013/14 2014/15 2015/16 2016/17
Executives 6 9 7 7 8 6
Senior Management
19 13 18 23 1814
Professional Specialist & Middle Management
41 39 32 36 48
41
Supervisory & Junior Management
77 68 92 91 73
66
Support 14 15 21 19 8 9
Sub Total (Permanent)
157 144 170 176 155 136
Interns 11 2 11 10 1 17
GRAND TOTAL 168 146 181 186 156 153
0
5
10
15
20
25
30
0
50
100
150
200
250
Actual Headcount Approved Headcount Customers

Details of Performance Areas (p27-28,34-36)
Objective KPA
SO 1.1: Develop an integrated
packet based transport
network that encompasses
growth/expansion and
technology evolution
Product Development NOC added as a service with full pricing and associated metrics
Network PlanningUpgrade 13 network nodes of the network to MTera version
Complete the M-Tera project for 11 network nodes and increase
network core capacity by 50%
Build Network Deployment of DWDM core symmetrical network
Operate Network Network performance rebates paid as percentage of gross revenue
Maintenance of Network 7.5 hours to Restore Core Network Faults
SO 2.1: Ensure long term
business sustainability
Revenue Increase Revenue by R89.2 million
Funding
Improve current ratio to 115%
Collect outstanding debt within 45 days
Increase EBITDA to R116 million
SO 3.1: To drive socio-
economic transformation
Procurement
80% Allocation of BBBEE discretionary budget spend
45% increase on black owned entities spend
20% spend of Women Owned entities
Safety, Health and
Environment
3 small BEE companies trained on OSHA
Corporate Social
Responsibility
Cyber security installed at Seshigo High School
Slide 18
Strategic Objective 4.1 Integrated Strategy Execution. This objective is internally focused. The Key Performance Areas include:
Quality management, Process Improvement, Information and Systems Management as well as Performance Monitoring and Evaluation.

Sound Human Capital Management(p29, p39-40)
Objective KPA
SO 5.1: Build a
high performance
organisation
Aligned HR Capacity Building and
Optimization
Fill critical positions to rebuild 90% capacity in core functional areas
for sustainability and growth
Introduce Incentives for assistance to source successful candidates
after probation
Review remuneration structure and benchmark variable pay
components
Strategic Acquisition of critical scarce
skills
Train 10% of management on Competency based interviewing
technique
70% P1 and P2 interns to complete to obtain their qualifications by
Integrated HRD strategies for
organisation development
Implement performance management process for 2 financial years
(24 months) by July 2017
Minimum 1% of the salary bill for spend for training expenditure
Line and organised labour empowerment on HR management
fundamentals
Effective talent retention strategies
Implement non cash components of Recognition & Reward
programme
Prioritise Sales incentive schemes
Slide 19
SO 6.1 Effective Corporate Governance. Broadband Infraco promotes good governance by ensuring compliance to all legislative
requirements and effective internal control systems and risk management. Key Performance Areas include: Company secretariat, Legal
and Regulatory, Compliance, internal controls and risk management.

Governance
Slide 20
R151 176
R3 925R345
R6 535
R118R0
R40 000
R80 000
R120 000
R160 000
2011 2012 2013 2014 2015 2016 2017
Am
ou
nt
in T
ho
usan
ds
Financial Years
Incurred and Identified in the Current Year
R0 R0
The new SCM Policy
implemented
Total amount
condoned since
2011
R160 269

External Audit Findings 2015/16
Slide 21
Department Finding Category Total number of
findings
Status February 2017
Resolved In Progress
Finance
Going Concern
1 1
Revenue
1 1
Performance Information Compliance
5 5
Shareholder Compliance
1 1
Total
8 5 3
Percentage
100% 63% 37%

Strategic Risks 2017/18 (Annex B)
Strategic Risks Preventative Action/ Mitigation
1
Likelihood not to
continue as a going
concern
1. a. Continue with the sales drive.
b. Negotiate long tenure revenue
contracts.
2. a. Renegotiation of key supplier contracts.
b. Rigorous cash management.
3. Continue to apply for funding from external
parties.
2
Regulatory
constraints
impeding
organisational
agility.
1. Optimise demand planning in
procurement.
2. Engaging Shareholder on borrowing
limits.
3. Continue to provide inputs on how to
integrate government ICT infrastructure.
3 Margin Pressure 1. Embed and continue to optimise pricing
strategy
2. Renegotiation of key suppliers contracts
4
The impact of Non
ICT SOC's on the
cost to
communicate
1. Continue to engage non ICT SOC's
2. Engage the regulators to ensure that
non ICT SOCs are governed by the
regulations
5
Lack of awareness
for new imperatives
in privacy and
security of
information
1. Engage cyber security experts to conduct
cyber security awareness
throughout the Company.
2. Use Mimecast to inform cyber security
alerts.
3. Knowledge transfer from co-sourced
partners.
Slide 22
Strategic Risks Preventative Action/ Mitigation
6 Difficulty to raise
Funds
1. Extended credit terms with major
suppliers (Rated and international
suppliers).
2. Continue to apply for funding from
external parties.
3. Implement technology update.
7 Damage to the
reputation of
Broadband Infraco
1. Reinforce the current communication
strategy.
2. Harmonize the external communication
with the Shareholders.
3. Continuous engagement with journalist.
8 Limitations in
resolving
fulfilment value
chain
1. Cross functional processes integration.
9 Market
consolidation
resulting in a
changed market
structure
1. Actively monitor ICT environment.
2. CTO to actively pursue CTO- CTO
engagements.
10 Difficulty to retain
and attract the
required skills
while appropriately
managing the cost
to revenue ratio
1. Roll out of Internship programme to
include both core and non-core units.
2. Intensify employee engagement
strategy.
3. Pilot retention strategy.

Thank You
Slide 23