Embed Size (px)
Citation preview
Hildebrando Rodrigues Macedo,
Broadband Economic Impact in Brazil: Broadband Economic Impact in Brazil: a Simultaneous Equations Analysisa Simultaneous Equations Analysis
Broadband Economic Impact in Brazil: a
Simultaneous Equations AnalysisHildebrando R. Macedo and Alexandre X. Y. Carvalho 5th ACORN-REDECOM Conference Lima,Peru, May 19-20th, 2010 1
Hildebrando Rodrigues Macedo,
Anatel, Anatel, BrazilBrazil
Alexandre Xavier Ywata de Carvalho, PhD
IPEA, IPEA, BrazilBrazil
19 November 201119 November 2011

AgendaAgenda
•• Introduction , Motivation and Introduction , Motivation and ObjectivesObjectivesObjectivesObjectives
•• ReferencesReferences•• Methodology: ModelMethodology: Model•• Results and AnalysisResults and Analysis•• Conclusion and CommentsConclusion and Comments
Broadband Economic Impact in Brazil: a
Simultaneous Equations AnalysisHildebrando R. Macedo and Alexandre X. Y. Carvalho 5th ACORN-REDECOM Conference Lima,Peru, May 19-20th, 2010 2
•• Conclusion and CommentsConclusion and Comments

•• Main Objective: Main Objective: Evaluate the broadband Evaluate the broadband economic impact in Brazil using official economic impact in Brazil using official statistics data from statistics data from AnatelAnatel (the Brazilian (the Brazilian
Main Objective and Results Main Objective and Results
statistics data from statistics data from AnatelAnatel (the Brazilian (the Brazilian telecom regulatory agency)telecom regulatory agency)••Main result:Main result:••11p.p.p.p. (percentage point) (percentage point) increase in increase in
broadband penetration related to GDP broadband penetration related to GDP
Broadband Economic Impact in Brazil: a
Simultaneous Equations AnalysisHildebrando R. Macedo and Alexandre X. Y. Carvalho 5th ACORN-REDECOM Conference Lima,Peru, May 19-20th, 2010 3
broadband penetration related to GDP broadband penetration related to GDP growth between growth between 0.038 to 0.18p.p.0.038 to 0.18p.p., and , and GDP per capita growth between GDP per capita growth between 0.196 0.196 to 0.362p.p.to 0.362p.p...
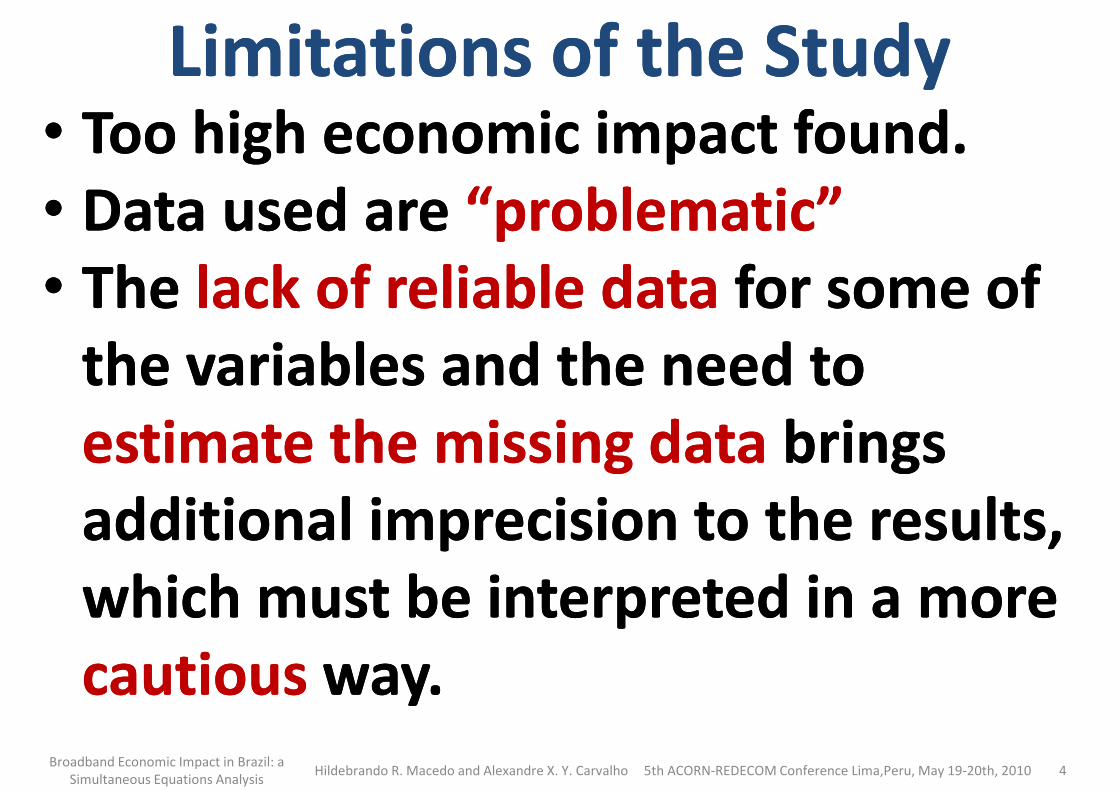
•• Too high economic impact found.Too high economic impact found.•• Data used are Data used are “problematic”“problematic”•• The The lack of reliable data lack of reliable data for some of for some of
Limitations of the StudyLimitations of the Study
•• The The lack of reliable data lack of reliable data for some of for some of the variables and the need to the variables and the need to estimate the missing dataestimate the missing data brings brings additional imprecision to the results, additional imprecision to the results,
Broadband Economic Impact in Brazil: a
Simultaneous Equations AnalysisHildebrando R. Macedo and Alexandre X. Y. Carvalho 5th ACORN-REDECOM Conference Lima,Peru, May 19-20th, 2010 4
additional imprecision to the results, additional imprecision to the results, which must be interpreted in a more which must be interpreted in a more cautiouscautious way.way.

Broadband Price EstimationBroadband Price Estimation•• Model based on results Model based on results of of CETICCETIC survey on survey on maximum declared maximum declared priceprice
for for internet adoptioninternet adoption. . Broadband price-demand sensitivity - 2008
70
80
Per
centa
ge
of hom
es w
her
e use
rs w
ere
willing to
Demand curve x Price estimated by regression
Demand x Price (survey data)
30
40
50
60
Per
centa
ge
of hom
es w
her
e use
rs w
ere
willing to
Subsc
ribe
the
inte
rnet
acc
ess se
rvic
e (%
)
Demand x Price (survey data)
y = 90.62617.e--0.018205.x
R2 = 0.992638
Broadband Economic Impact in Brazil: a
Simultaneous Equations AnalysisHildebrando R. Macedo and Alexandre X. Y. Carvalho 5th ACORN-REDECOM Conference Lima,Peru, May 19-20th, 2010 5
0
10
20
0 50 100 150 200 250 300 Maximum declared value declared by user (home) willing to subscribe
to the internet access service (R$).
Per
centa
ge
of hom
es w
her
e use
rs w
ere
willing to
Subsc
ribe
the
inte
rnet

238513.00
14.80
14
16
2500
3000
Num
ber o
f B
roadband A
ccess
es
Num
ber o
f B
roadband P
rovid
ers
Evolution of the Number of Broadband Accesses
and Providers
Number of Broadband Providers
Broadband in Brazil: OverviewBroadband in Brazil: Overview
562
815
1208
1802
2385
4.39
5.92
8.71
11.40
13.00
4
6
8
10
12
1000
1500
2000
2500
Num
ber o
f B
roadband A
ccess
es
(Millions)
Num
ber o
f B
roadband P
rovid
ers
Number of Broadband Providers
Number of Broadband Accesses
Broadband Economic Impact in Brazil: a
Simultaneous Equations AnalysisHildebrando R. Macedo and Alexandre X. Y. Carvalho 5th ACORN-REDECOM Conference Lima,Peru, May 19-20th, 2010 6
66 195298
414
562
0.12 0.36 0.590.97
3.16
4.39
0
2
4
0
500
2000 2001 2002 2003 2004 2005 2006 2007 2008 2009 2010
Num
ber o
f B
roadband A
ccess
es
Num
ber o
f B
roadband P
rovid
ers
YearSource: (ANATEL-SICI).

Broadband Penetration Worldwide(2008)Broadband Penetration Worldwide(2008)
CountryCountryBroadband Penetration Broadband Penetration
(number(number of accesses of accesses per 100 inhabitantsper 100 inhabitants))
RegionRegion
Broadband Penetration Broadband Penetration in the Region (numberin the Region (numberof accesses per 100 of accesses per 100
inhabitantsinhabitants))ArgentinaArgentina 7.97.9
BrazilBrazil 5.915.91 Latin Latin AmericaAmerica
5.55.5BrazilBrazil 5.915.91
ChileChile 8.48.4ColombiaColombia 4.24.2
Mexico Mexico 7.17.1CanadaCanada 29.029.0 NorthNorth
AmericaAmerica27.827.8USAUSA 26.726.7
SpainSpain 20.820.8FranceFrance 28.028.0
Broadband Economic Impact in Brazil: a
Simultaneous Equations AnalysisHildebrando R. Macedo and Alexandre X. Y. Carvalho 5th ACORN-REDECOM Conference Lima,Peru, May 19-20th, 2010 7
EuropeEurope 24.824.8FranceFrance 28.028.0
PortugalPortugal 16.016.0United KingdomUnited Kingdom 28.528.5
AustraliaAustralia 25.425.4Asia and Asia and OceaniaOceania
14.014.0South KoreaSouth Korea 32.032.0MalaysiaMalaysia 4.64.6
South AfricaSouth Africa 0.80.8AfricaAfrica 1.61.6MoroccoMorocco 1.51.5
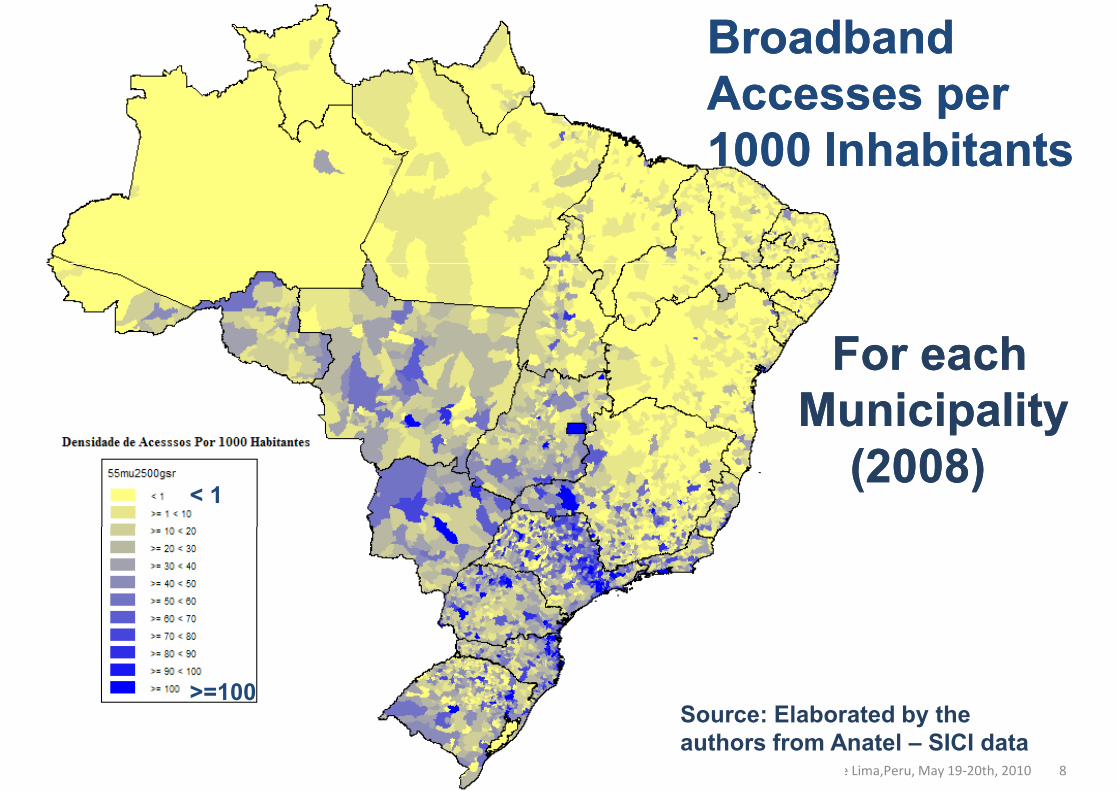
Broadband Broadband
Accesses per Accesses per
1000 Inhabitants 1000 Inhabitants
For each For each
Municipality Municipality
((2008)2008)< 1
Broadband Economic Impact in Brazil: a
Simultaneous Equations AnalysisHildebrando R. Macedo and Alexandre X. Y. Carvalho 5th ACORN-REDECOM Conference Lima,Peru, May 19-20th, 2010 8
Source: Elaborated by the
authors from Anatel – SICI data
>=100

Backhaul Backhaul
Infrastructure Infrastructure
(2007) (2007)
Backhaul to Backhaul to
be Deployedbe Deployed
Broadband Economic Impact in Brazil: a
Simultaneous Equations AnalysisHildebrando R. Macedo and Alexandre X. Y. Carvalho 5th ACORN-REDECOM Conference Lima,Peru, May 19-20th, 2010 9
Existing BackhaulExisting Backhaul
Source: PNBL – Plano Nacional de Banda Larga (National
Broadband Plan, p. 40)
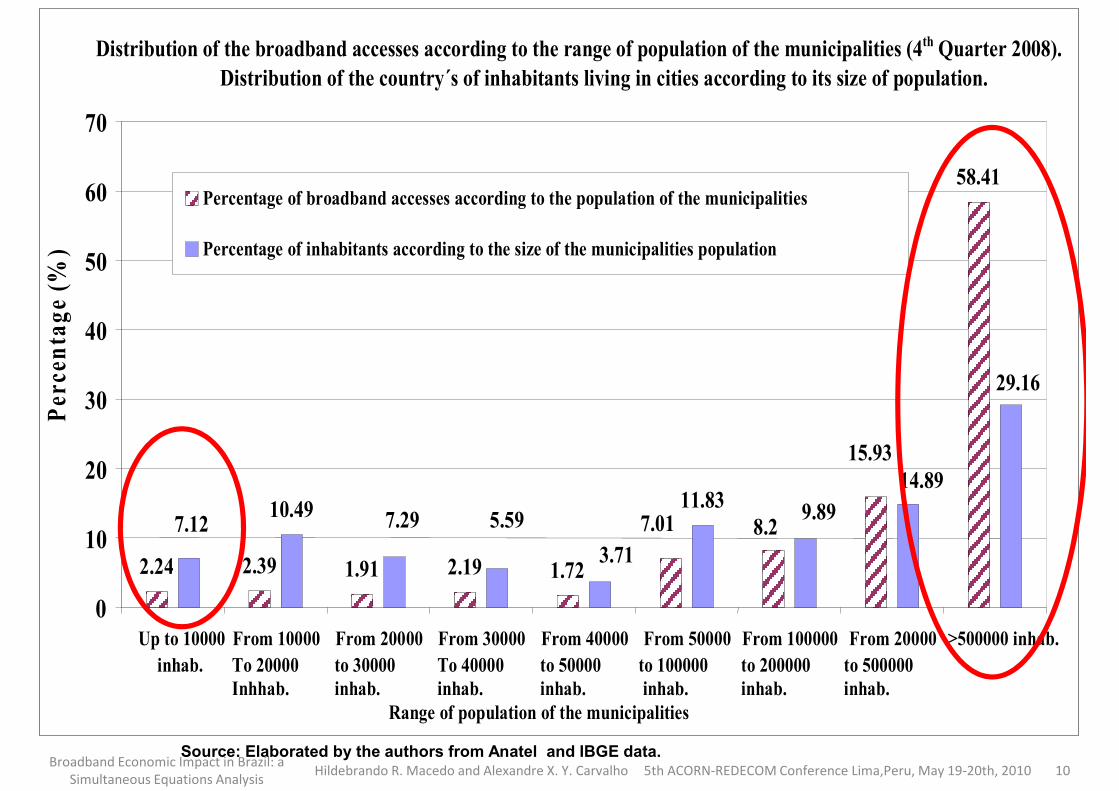
58.41
50
60
70
Per
cen
tage
(%)
Percentage of broadband accesses according to the population of the municipalities
Percentage of inhabitants according to the size of the municipalities population
Distribution of the broadband accesses according to the range of population of the municipalities (4th Quarter 2008).
Distribution of the country´s of inhabitants living in cities according to its size of population.
10.49 11.837.01 8.2
15.93
7.12 7.29 5.59 9.89 14.89
29.16
10
20
30
40
50
Per
cen
tage
(%)
(%)
Broadband Economic Impact in Brazil: a
Simultaneous Equations AnalysisHildebrando R. Macedo and Alexandre X. Y. Carvalho 5th ACORN-REDECOM Conference Lima,Peru, May 19-20th, 2010 10
2.24 2.39 1.91 2.19 1.72
7.01 8.2 7.12 7.29 5.59
3.71
0
10
Up to 10000
inhab.
From 10000
To 20000
Inhhab.
From 20000
to 30000
inhab.
From 30000
To 40000
inhab.
From 40000
to 50000
inhab.
From 50000
to 100000
inhab.
From 100000
to 200000
inhab.
From 20000
to 500000
inhab.
>500000 inhab.
Range of population of the municipalities
Source: Elaborated by the authors from Anatel and IBGE data.
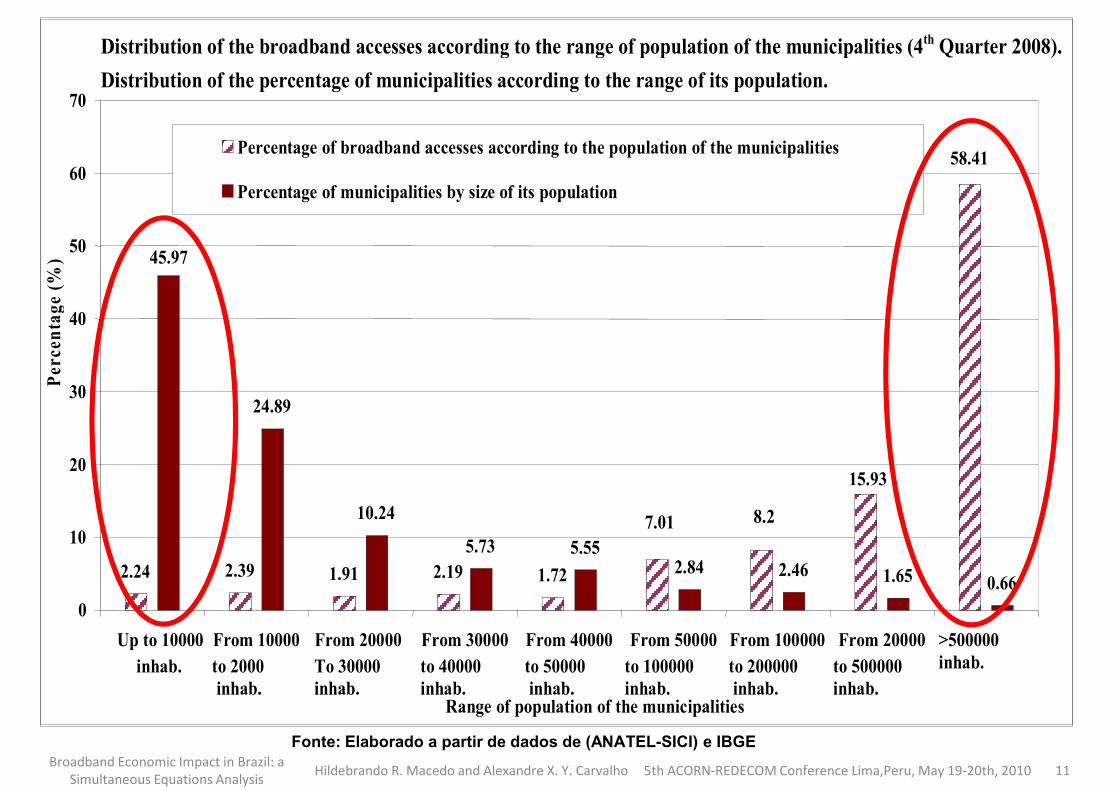
58.41
45.97 50
60
70
Perc
enta
ge
(%)
Percentage of broadband accesses according to the population of the municipalities
Percentage of municipalities by size of its population
Distribution of the broadband accesses according to the range of population of the municipalities (4th Quarter 2008).
Distribution of the percentage of municipalities according to the range of its population.
24.89
10.24 15.93
8.27.01
45.97
10
20
30
40
Perc
enta
ge
(%)
(%)
Broadband Economic Impact in Brazil: a
Simultaneous Equations AnalysisHildebrando R. Macedo and Alexandre X. Y. Carvalho 5th ACORN-REDECOM Conference Lima,Peru, May 19-20th, 2010 11
2.24 2.39 1.91 2.19 1.72
5.73 5.552.84 2.46 1.65 0.66
7.01
0
10
Up to 10000
inhab.
From 10000 to 2000
inhab.
From 20000
To 30000
inhab.
From 30000
to 40000
inhab.
From 40000
to 50000
inhab.
From 50000
to 100000
inhab.
From 100000
to 200000
inhab.
From 20000
to 500000
inhab.
>500000
inhab.
Range of population of the municipalities
Fonte: Elaborado a partir de dados de (ANATEL-SICI) e IBGE

••KoutroumpisKoutroumpis (2009)(2009)••Broadband economic impact on Broadband economic impact on 22 22
OECD countries OECD countries from 2002 to 2007.from 2002 to 2007.••Used Used supplysupply and and demanddemand
simultaneous equations simultaneous equations system system
Main Reference Main Reference
simultaneous equations simultaneous equations system system with endogenous variables to with endogenous variables to capture acapture a simultaneous effectsimultaneous effect::•• Investments in telecom Investments in telecom lead to lead to
economic growth , economic growth , at the same at the same time time economic growth economic growth demands demands
Broadband Economic Impact in Brazil: a
Simultaneous Equations AnalysisHildebrando R. Macedo and Alexandre X. Y. Carvalho 5th ACORN-REDECOM Conference Lima,Peru, May 19-20th, 2010 12
time time economic growth economic growth demands demands telecom investment. telecom investment. ••Result: approx. Result: approx. 0,025p.p0,025p.p. de . de GDPGDP
increaseincrease for each for each 1p.p. 1p.p. broadband broadband penetration increasepenetration increase (p. 478)(p. 478)
•• KOUTROUMPISKOUTROUMPIS, , PantelisPantelis, , ““The Economic Impact of The Economic Impact of Broadband on Growth: A Broadband on Growth: A Simultaneous ApproachSimultaneous Approach”, ”, Telecommunications Policy Telecommunications Policy , num. , num.
33, pp.47133, pp.471––485, Elsevier, Oct.485, Elsevier, Oct. 20092009

(Koutroumpis,2009) (Koutroumpis,2009) Reference ModelReference Model•• Uses Uses 44 simultaneous equations: simultaneous equations: •• Aggregated Production Function Aggregated Production Function –– GDP.GDP.lnln((GDPGDPtt) = ) = ββββββββP0P0 + + ββββββββP1P1.ln(K.ln(K t t )+)+ββββββββP2P2.ln(LF.ln(LF tt) + ) + ββββββββP3P3.ln(.ln(PENPENtt) + ) + εεεεεεεεPPtt P0P0 P1P1 t t P2P2 tt P3P3 tt PP
•• Demand for Broadband Infrastructure.Demand for Broadband Infrastructure.lnln((PENPENtt)=)=ββββββββDD00 ++ββββββββDD11.ln(GDP.ln(GDP__PERPER__CAPITACAPITA t t ) + ) + ββββββββDD22.(.(BBBB__PRICEPRICEtt) )
+ + ββββββββDD33.(.(EDUEDUtt) +) +ββββββββD4D4.(.(URBURBtt) + ) + ββββββββD5D5.(.(R&DR&Dtt) + ) + εεεεεεεεDD
•• Supply of Broadband Infrastructure.Supply of Broadband Infrastructure.lnln((BBIBBI ) =) =ββββββββ ++ββββββββ .ln(BB.ln(BB PRICEPRICE ) + ) + ββββββββ .ln(.ln(REGULATIONREGULATION ) + ) +
Broadband Economic Impact in Brazil: a
Simultaneous Equations AnalysisHildebrando R. Macedo and Alexandre X. Y. Carvalho 5th ACORN-REDECOM Conference Lima,Peru, May 19-20th, 2010 13
lnln((BBIBBItt) =) =ββββββββOO00 ++ββββββββOO11.ln(BB.ln(BB__PRICEPRICE t t ) + ) + ββββββββOO33.ln(.ln(REGULATIONREGULATIONtt) + ) +
+ + ββββββββOO22.ln(COMPETITION.ln(COMPETITION__TECHTECH tt) + + ) + + εεεεεεεεOO
•• Broadband Infrastructure Production FunctionBroadband Infrastructure Production Function
( )0 1
1
ln lntPBL PBL t PBL
t
PENBBI
PENβ β ε
−
= + ⋅ +
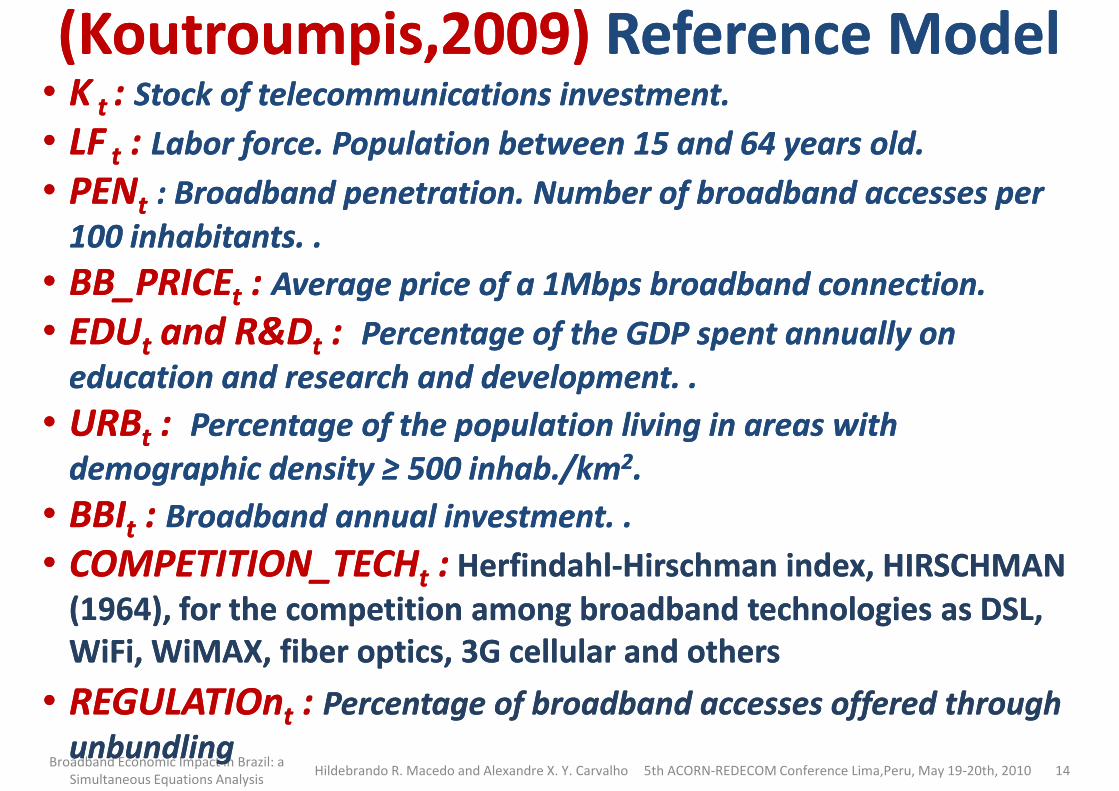
(Koutroumpis,2009) (Koutroumpis,2009) Reference ModelReference Model•• KK t t : : Stock of telecommunications investment.Stock of telecommunications investment.
•• LFLF tt : : Labor force. Population between 15 and 64 years old. Labor force. Population between 15 and 64 years old.
•• PENPENtt : Broadband penetration. Number of broadband accesses per : Broadband penetration. Number of broadband accesses per
100 inhabitants. .100 inhabitants. .
•• BB_PRICEBB_PRICE : : Average price of a 1Mbps broadband connection. Average price of a 1Mbps broadband connection. •• BB_PRICEBB_PRICEtt : : Average price of a 1Mbps broadband connection. Average price of a 1Mbps broadband connection.
•• EDUEDUtt and and R&DR&Dtt : : Percentage of the GDP spent annually on Percentage of the GDP spent annually on
education and research and development. .education and research and development. .
•• URBURBtt : : Percentage of the population living in areas with Percentage of the population living in areas with
demographic density ≥ 500 demographic density ≥ 500 inhabinhab./km./km22..
•• BBIBBItt : : Broadband annual investment. .Broadband annual investment. .
Broadband Economic Impact in Brazil: a
Simultaneous Equations AnalysisHildebrando R. Macedo and Alexandre X. Y. Carvalho 5th ACORN-REDECOM Conference Lima,Peru, May 19-20th, 2010 14
•• BBIBBItt : : Broadband annual investment. .Broadband annual investment. .
•• COMPETITION_TECHCOMPETITION_TECHtt :: HerfindahlHerfindahl--Hirschman index, HIRSCHMAN Hirschman index, HIRSCHMAN (1964), for the competition among broadband technologies as DSL, (1964), for the competition among broadband technologies as DSL, WiFiWiFi, , WiMAXWiMAX, fiber optics, 3G cellular and others, fiber optics, 3G cellular and others
•• REGULATIOnREGULATIOntt : : Percentage of broadband accesses offered through Percentage of broadband accesses offered through
unbundlingunbundling

Models Used in the Present StudyModels Used in the Present Study••Used Used 6 models 6 models ((33 for the for the GDP GDP and and 33 for for
the the GDP per CapitaGDP per Capita))•• Model Model 11//22:: GDP/GDP/GDP per CapitaGDP per Capita:: Without price variable.Without price variable.Model Model 11//22:: GDP/GDP/GDP per CapitaGDP per Capita:: Without price variable.Without price variable.
•• Model Model 33//44 : : GDP/GDP/GDP per CapitaGDP per Capita: : With price variable. With price variable. •• Model Model 55//66 :: GDP/GDP/GDP per CapitaGDP per Capita: : With price variable With price variable
but but without without the variables regarding the variables regarding demographic demographic densitydensity and and educationeducation level because lack of expected level because lack of expected results:results:
Broadband Economic Impact in Brazil: a
Simultaneous Equations AnalysisHildebrando R. Macedo and Alexandre X. Y. Carvalho 5th ACORN-REDECOM Conference Lima,Peru, May 19-20th, 2010 15
results:results:•• Possible cause: pricePossible cause: price has bigger impact compared to has bigger impact compared to
other variables other variables (price elasticity in Brazil from (price elasticity in Brazil from --1 1 toto--3,36, Ávila (2008)), 3,36, Ávila (2008)), reducing the importance of reducing the importance of educationeducation and and demographic densitydemographic density in the model.in the model.

Model EquationsModel Equations•• Aggregated Production Function Aggregated Production Function –– GDP:GDP:
•• lnln((GDPGDPtt) = ) = ββββββββP0P0 + + ββββββββP1P1.ln(.ln(INVEST_BBINVEST_BBtt) + ) +
ββββββββP2P2.ln(POP_15_YR_8_YR_EDU.ln(POP_15_YR_8_YR_EDUtt) + ) + ββββββββP3P3.ln(DENS_BB.ln(DENS_BB tt) + ) + εεεεεεεεPP
•• lnln((GDP_PER_CAPTAGDP_PER_CAPTAtt) = ) = ββββββββP0P0 + + ββββββββP1P1.ln(.ln(INVEST_BBINVEST_BBtt) ) •• lnln((GDP_PER_CAPTAGDP_PER_CAPTAtt) = ) = ββββββββP0P0 + + ββββββββP1P1.ln(.ln(INVEST_BBINVEST_BBtt) )
++ββββββββP2P2.ln(POP_15_YR_8_YR_EDU.ln(POP_15_YR_8_YR_EDU tt) + ) + ββββββββP3P3.ln(DENS_BB.ln(DENS_BB tt) + ) + εεεεεεεεPP
•• Demand for Broadband Infrastructure:Demand for Broadband Infrastructure:
lnln(DENS(DENS__BBBB tt) = ) = ββββββββD0D0 ++ββββββββD1D1.ln(.ln(GDPGDP__PERPER__CAPTACAPTAtt) + ) + ββββββββD4D4.ln(.ln(PRICEPRICEtt) )
+ + ββββββββD2D2.(.(PERCENT_EDUPERCENT_EDUtt) + ) + ββββββββD3D3.ln(POP_50K.ln(POP_50K tt) + ) + εεεεεεεεDD
•• Supply of Broadband Infrastructure: Supply of Broadband Infrastructure:
Broadband Economic Impact in Brazil: a
Simultaneous Equations AnalysisHildebrando R. Macedo and Alexandre X. Y. Carvalho 5th ACORN-REDECOM Conference Lima,Peru, May 19-20th, 2010 16
•• Supply of Broadband Infrastructure: Supply of Broadband Infrastructure:
lnln((INVEST_BBINVEST_BBtt) = ) = ββββββββO0O0 + + ββββββββO1O1.ln(.ln(REV_BBREV_BBtt) + ) + ββββββββO2O2.ln(.ln(PRICEPRICEtt)+ )+ εεεεεεεεOO
•• Broadband Infrastructure Production Function:Broadband Infrastructure Production Function:
PBLPBLPBL
t
t BBINVESTBBDENS
BBDENSεββ +⋅+=
−
)_ln(_
_ln 10
1

VariablesVariables•• GDPGDPtt , , GDP_PER_CAPTAGDP_PER_CAPTAtt: : GDP and GDP per GDP and GDP per captacapta
per State from per State from 2000 to 20082000 to 2008. . Source IBGESource IBGE. . Obs. : Obs. : 2008 data estimated.2008 data estimated.
•• INVEST_BBINVEST_BB and and REV_BBREV_BB : : Broadband annual Broadband annual •• INVEST_BBINVEST_BBtt and and REV_BBREV_BBtt : : Broadband annual Broadband annual investments and Gross annual operational revenue investments and Gross annual operational revenue (2000 to 2008) (2000 to 2008) of the broadband providers. Data of the broadband providers. Data aggregated for the whole country. aggregated for the whole country. Source: ANATEL.Source: ANATEL.
•• POP_15_YR_8_YR_EDUt POP_15_YR_8_YR_EDUt , , PERCENT_EDUPERCENT_EDU : :
Broadband Economic Impact in Brazil: a
Simultaneous Equations AnalysisHildebrando R. Macedo and Alexandre X. Y. Carvalho 5th ACORN-REDECOM Conference Lima,Peru, May 19-20th, 2010 17
•• POP_15_YR_8_YR_EDUt POP_15_YR_8_YR_EDUt tt , , PERCENT_EDUPERCENT_EDUtt : :
population and percentage of the State population population and percentage of the State population
at least 15 years old and with 8 years or more of at least 15 years old and with 8 years or more of
complete education. complete education. Source: IBGE PNADSource: IBGE PNAD. .

Variables (cont.)Variables (cont.)•• POP_50KPOP_50K tt: : Share of the State population living in Share of the State population living in
cities with at least 50.000 inhabitants. cities with at least 50.000 inhabitants. Proxy for Proxy for
population concentration, replacing the variable used by population concentration, replacing the variable used by
KoutroumpisKoutroumpis (2009) of the share of the population living (2009) of the share of the population living KoutroumpisKoutroumpis (2009) of the share of the population living (2009) of the share of the population living
in areas where density ≥ 500 in areas where density ≥ 500 inhabinhab./ km./ km22. . Source: IBGE.Source: IBGE.
•• PRICEPRICEtt: : EstimatedEstimated average price charged for the average price charged for the
broadband access. broadband access. Source: Estimated from Source: Estimated from CETIC.BR CETIC.BR anualanual surveys from 2005 to 2008.surveys from 2005 to 2008.
Broadband Economic Impact in Brazil: a
Simultaneous Equations AnalysisHildebrando R. Macedo and Alexandre X. Y. Carvalho 5th ACORN-REDECOM Conference Lima,Peru, May 19-20th, 2010 18
•• DENS_BBDENS_BBtt : : Broadband density. Number of Broadband density. Number of accesses per 1000 inhabitants, for each State, accesses per 1000 inhabitants, for each State, between 2000 and 2008. between 2000 and 2008. Source Source AnatelAnatel (SICI). (SICI). Obs.: data from 2000 to 2006 estimated.Obs.: data from 2000 to 2006 estimated.

150
200
Bro
adband P
enet
ration p
er S
tate
(2000 to
20008) (bro
adband a
cces
ses per
1000 in
hab.)
Broadband Penetration X GDP Per Capita
Broadband Penetration X GDP Per Capita (other States)
Brazilian Capital District
Trend Line
Variables: Variables: GDP per Capita X Broadband PenetrationGDP per Capita X Broadband Penetration
y = 0,0029x - 10,796
R2 = 0,594
50
100
150
Bro
adband P
enet
ration p
er S
tate
(2000 to
20008) (bro
adband a
cces
ses per
1000 in
hab.)
Trend Line
Broadband Economic Impact in Brazil: a
Simultaneous Equations AnalysisHildebrando R. Macedo and Alexandre X. Y. Carvalho 5th ACORN-REDECOM Conference Lima,Peru, May 19-20th, 2010 19
-50
0
R$ 0 R$ 10,000 R$ 20,000 R$ 30,000 R$ 40,000 R$ 50,000
Bro
adband P
enet
ration p
er S
tate
(2000 to
20008) (bro
adband a
cces
ses per
1000 in
hab.)
GDP Per Capita per State UF (2000 to 2008) (R$)
160
180
200
Bro
adband P
enet
ration p
er S
tate
(2000 to
20008) (b
roadband a
cces
ses per
1000 in
hab.)
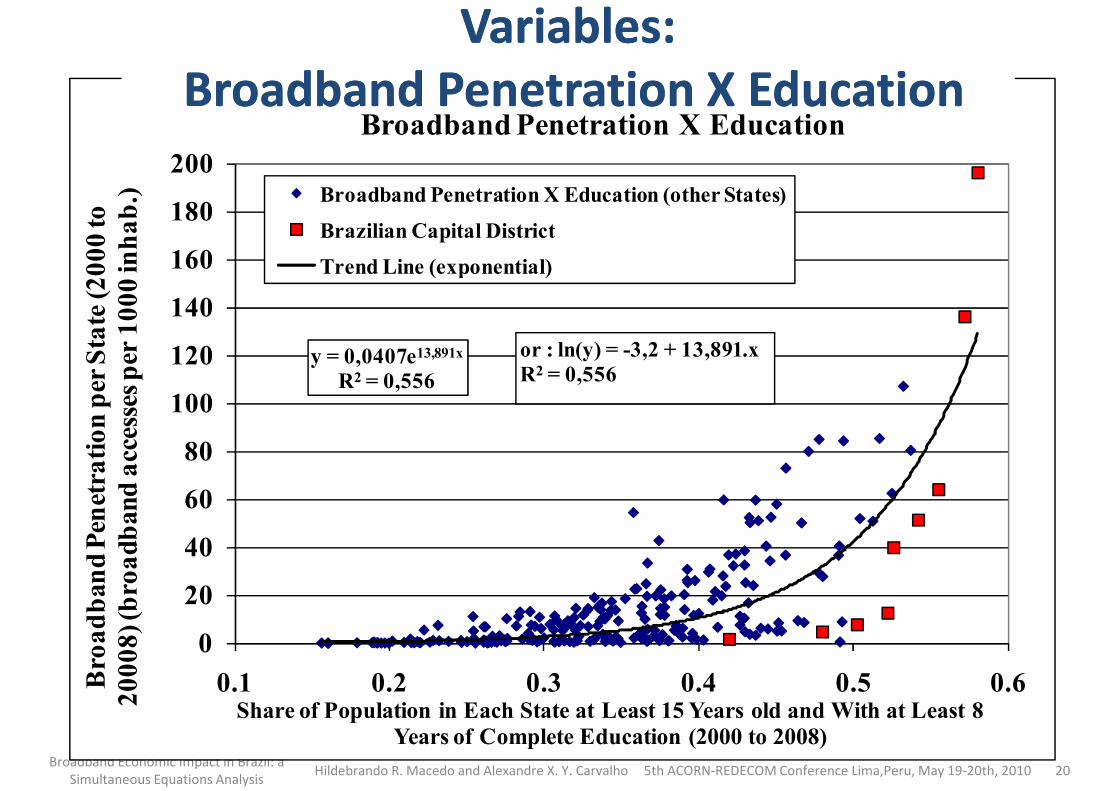
Broadband Penetration X Education
Broadband Penetration X Education (other States)
Brazilian Capital District
Trend Line (exponential)
Variables: Variables: Broadband Penetration X Education Broadband Penetration X Education
y = 0,0407e13,891x
R2 = 0,556
60
80
100
120
140
160
Bro
adband P
enet
ration p
er S
tate
(2000 to
20008) (b
roadband a
cces
ses per
1000 in
hab.)
Trend Line (exponential)
or : ln(y) = -3,2 + 13,891.x
R2 = 0,556
Broadband Economic Impact in Brazil: a
Simultaneous Equations AnalysisHildebrando R. Macedo and Alexandre X. Y. Carvalho 5th ACORN-REDECOM Conference Lima,Peru, May 19-20th, 2010 20
0
20
40
0.1 0.2 0.3 0.4 0.5 0.6Bro
adband P
enet
ration p
er S
tate
(2000 to
20008) (b
roadband a
cces
ses per
1000 in
hab.)
Share of Population in Each State at Least 15 Years old and With at Least 8
Years of Complete Education (2000 to 2008)

5
6
ln(B
roadband P
enet
ration p
er S
tate
) (2
000 to
20008) (b
roadband a
cces
ses per
1000 in
hab.)
ln(Broadband Penetration) X Education
ln(Broadband Penetration) X Education (other States)
Brazilian Capital District
Trend Line (linear)
Variables: Variables: lnln(Broadband Penetration) X Education (Broadband Penetration) X Education
y = 13.891x - 3.2006
R² = 0.5558
0
1
2
3
4
ln(B
roadband P
enet
ration p
er S
tate
) (2
000 to
20008) (b
roadband a
cces
ses per
1000 in
hab.)
Broadband Economic Impact in Brazil: a
Simultaneous Equations AnalysisHildebrando R. Macedo and Alexandre X. Y. Carvalho 5th ACORN-REDECOM Conference Lima,Peru, May 19-20th, 2010 21
-3
-2
-10.1 0.2 0.3 0.4 0.5 0.6
ln(B
roadband P
enet
ration p
er S
tate
) (2
000 to
20008) (b
roadband a
cces
ses per
1000 in
hab.)
Natural Logarithm of the Share of Population in Each State at Least 15 Years
old and With at Least 8 Years of Complete Education (2000 to 2008)
R$ 35,000
R$ 40,000
R$ 45,000
GD
P P
er C
apita p
er S
tate
(2000 to 2
008) (R
$)
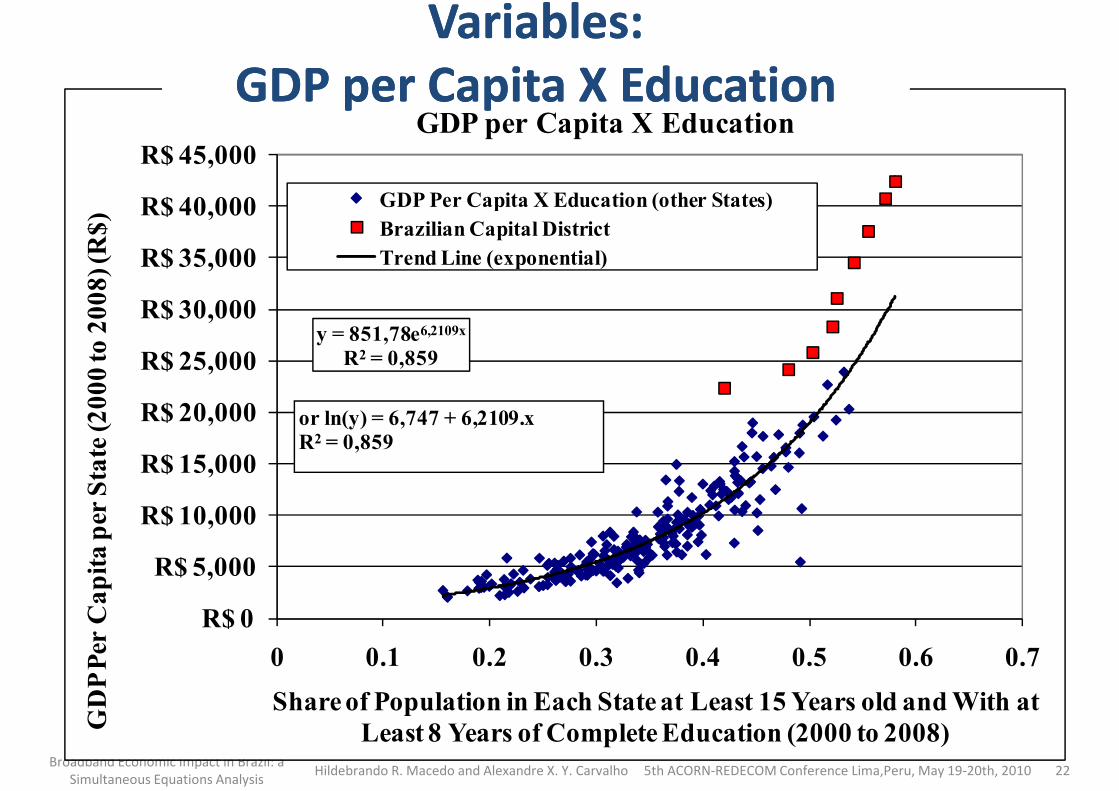
GDP per Capita X Education
GDP Per Capita X Education (other States)
Brazilian Capital District
Trend Line (exponential)
Variables: Variables: GDP per Capita X EducationGDP per Capita X Education
y = 851,78e6,2109x
R2 = 0,859
R$ 10,000
R$ 15,000
R$ 20,000
R$ 25,000
R$ 30,000
R$ 35,000
GD
P P
er C
apita p
er S
tate
(2000 to 2
008) (R
$)
Trend Line (exponential)
or ln(y) = 6,747 + 6,2109.x
R2 = 0,859
Broadband Economic Impact in Brazil: a
Simultaneous Equations AnalysisHildebrando R. Macedo and Alexandre X. Y. Carvalho 5th ACORN-REDECOM Conference Lima,Peru, May 19-20th, 2010 22
R$ 0
R$ 5,000
R$ 10,000
0 0.1 0.2 0.3 0.4 0.5 0.6 0.7
GD
P P
er C
apita p
er S
tate
(2000 to 2
008) (R
$)
Share of Population in Each State at Least 15 Years old and With at
Least 8 Years of Complete Education (2000 to 2008)
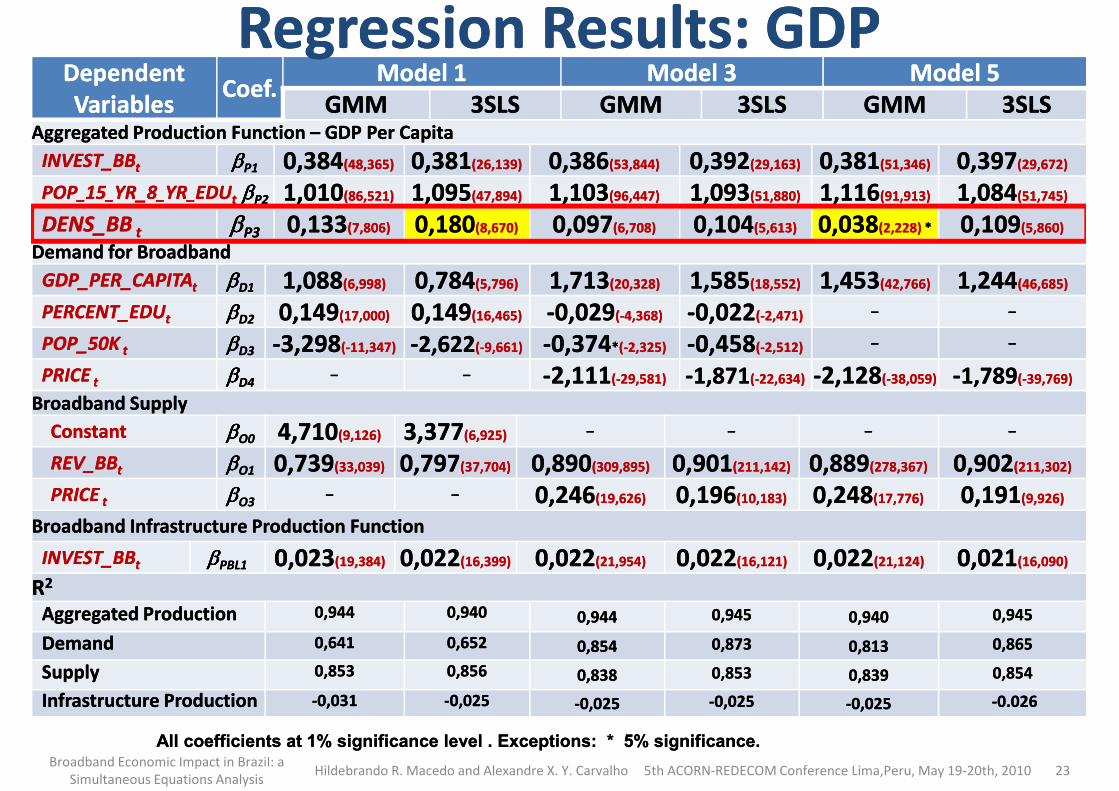
Dependent Dependent VariablesVariables
Coef.Coef.ModelModel 11 ModelModel 33 ModelModel 55
GMMGMM 3SLS3SLS GMMGMM 3SLS3SLS GMMGMM 3SLS3SLSAggregated Production Function Aggregated Production Function –– GDP Per CapitaGDP Per Capita
INVEST_BBINVEST_BBtt ββββββββP1P1 0,3840,384(48,365)(48,365) 0,3810,381(26,139)(26,139) 0,3860,386(53,844)(53,844) 0,3920,392(29,163)(29,163) 0,3810,381(51,346)(51,346) 0,3970,397(29,672)(29,672)
POPPOP__1515__YR_8YR_8__YRYR__EDUEDUt t ββββββββP2P2 1,0101,010(86,521)(86,521) 1,0951,095(47,894)(47,894) 1,1031,103(96,447)(96,447) 1,0931,093(51,880)(51,880) 1,1161,116(91,913)(91,913) 1,0841,084(51,745)(51,745)
DENS_BBDENS_BB tt ββββββββP3P3 0,1330,133(7,806)(7,806) 0,1800,180(8,670)(8,670) 0,0970,097(6,708)(6,708) 0,1040,104(5,613)(5,613) 0,0380,038(2,228) (2,228) ** 0,1090,109(5,860)(5,860)
Demand for Broadband Demand for Broadband
1,0881,088 0,7840,784 1,7131,713 1,5851,585 1,4531,453 1,2441,244
Regression Results: GDPRegression Results: GDP
Demand for Broadband Demand for Broadband
GDP_PER_CAPITAGDP_PER_CAPITAtt ββββββββD1D1 1,0881,088(6,998)(6,998) 0,7840,784(5,796)(5,796) 1,7131,713(20,328)(20,328) 1,5851,585(18,552)(18,552) 1,4531,453(42,766)(42,766) 1,2441,244(46,685)(46,685)
PERCENT_EDUPERCENT_EDUtt ββββββββD2D2 0,1490,149(17,000)(17,000) 0,1490,149(16,465)(16,465) --0,0290,029((--4,368)4,368) --0,0220,022((--2,471)2,471) –– ––
POP_50KPOP_50K tt ββββββββD3D3 --3,2983,298((--11,347)11,347) --2,6222,622((--9,661)9,661) --0,3740,374**((--2,325)2,325) --0,4580,458((--2,512)2,512) –– ––
PRICEPRICE tt ββββββββD4D4–– –– --2,1112,111((--29,581)29,581) --1,8711,871((--22,634)22,634) --2,1282,128((--38,059)38,059) --1,7891,789((--39,769)39,769)
Broadband SupplyBroadband Supply
ConstantConstant ββββββββO0O0 4,7104,710(9,126)(9,126) 3,3773,377(6,925)(6,925) –– –– –– ––
REV_BBREV_BBtt ββββββββO1O1 0,7390,739(33,039)(33,039) 0,7970,797(37,704)(37,704) 0,8900,890(309,895)(309,895) 0,9010,901(211,142)(211,142) 0,8890,889(278,367)(278,367) 0,9020,902(211,302)(211,302)
PRICEPRICE tt ββββββββO3O3–– –– 0,2460,246(19,626)(19,626) 0,1960,196(10,183)(10,183) 0,2480,248(17,776)(17,776) 0,1910,191(9,926)(9,926)
Broadband Infrastructure Production Function Broadband Infrastructure Production Function
Broadband Economic Impact in Brazil: a
Simultaneous Equations AnalysisHildebrando R. Macedo and Alexandre X. Y. Carvalho 5th ACORN-REDECOM Conference Lima,Peru, May 19-20th, 2010 23
Broadband Infrastructure Production Function Broadband Infrastructure Production Function
INVEST_BBINVEST_BBtt ββββββββPBL1PBL1 0,0230,023(19,384)(19,384) 0,0220,022(16,399)(16,399) 0,0220,022(21,954)(21,954) 0,0220,022(16,121)(16,121) 0,0220,022(21,124)(21,124) 0,0210,021(16,090)(16,090)
RR22
Aggregated Production Aggregated Production 0,9440,944 0,9400,940 0,9440,944 0,9450,945 0,9400,940 0,9450,945
DemandDemand 0,6410,641 0,6520,652 0,8540,854 0,8730,873 0,8130,813 0,8650,865
SupplySupply 0,8530,853 0,8560,856 0,8380,838 0,8530,853 0,8390,839 0,8540,854
Infrastructure Production Infrastructure Production --0,0310,031 --0,0250,025 --0,0250,025 --0,0250,025 --0,0250,025 --0.026 0.026
All coefficients at 1% significance level . Exceptions: * 5% significance.All coefficients at 1% significance level . Exceptions: * 5% significance.
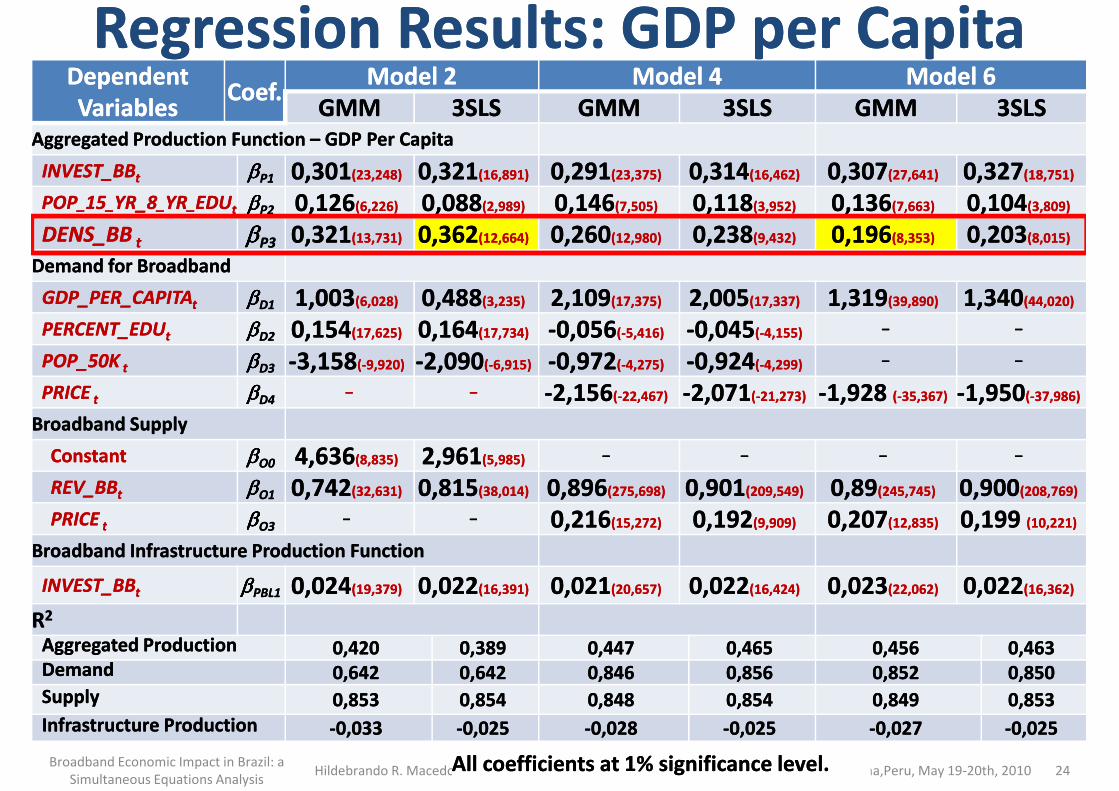
Dependent Dependent VariablesVariables
Coef.Coef.Model 2Model 2 ModelModel 44 ModelModel 66
GMMGMM 3SLS3SLS GMMGMM 3SLS3SLS GMMGMM 3SLS3SLSAggregated Production Function Aggregated Production Function –– GDP Per CapitaGDP Per Capita
INVEST_BBINVEST_BBtt ββββββββP1P1 0,3010,301(23,248)(23,248) 0,3210,321(16,891)(16,891) 0,2910,291(23,375)(23,375) 0,3140,314(16,462)(16,462) 0,3070,307(27,641)(27,641) 0,3270,327(18,751)(18,751)
POPPOP__1515__YR_8YR_8__YRYR__EDUEDUtt ββββββββP2P2 0,1260,126(6,226)(6,226) 0,0880,088(2,989)(2,989) 0,1460,146(7,505)(7,505) 0,1180,118(3,952)(3,952) 0,1360,136(7,663)(7,663) 0,1040,104(3,809)(3,809)
DENS_BBDENS_BB tt ββββββββP3P3 0,3210,321(13,731)(13,731) 0,3620,362(12,664)(12,664) 0,2600,260(12,980)(12,980) 0,2380,238(9,432)(9,432) 0,1960,196(8,353)(8,353) 0,2030,203(8,015)(8,015)
Demand for Broadband Demand for Broadband
Regression Results: GDP per CapitaRegression Results: GDP per Capita
Demand for Broadband Demand for Broadband
GDP_PER_CAPITAGDP_PER_CAPITAtt ββββββββD1D1 1,0031,003(6,028)(6,028) 0,4880,488(3,235)(3,235) 2,1092,109(17,375)(17,375) 2,0052,005(17,337)(17,337) 1,3191,319(39,890)(39,890) 1,3401,340(44,020)(44,020)
PERCENT_EDUPERCENT_EDUtt ββββββββD2D2 0,1540,154(17,625)(17,625) 0,1640,164(17,734)(17,734) --0,0560,056((--5,416)5,416) --0,0450,045((--4,155)4,155) –– ––
POP_50KPOP_50K tt ββββββββD3D3 --3,1583,158((--9,920)9,920) --2,0902,090((--6,915)6,915) --0,9720,972((--4,275)4,275) --0,9240,924((--4,299)4,299) –– ––
PRICEPRICE tt ββββββββD4D4–– –– --2,1562,156((--22,467)22,467) --2,0712,071((--21,273)21,273) --1,928 1,928 ((--35,367)35,367) --1,9501,950((--37,986)37,986)
Broadband SupplyBroadband Supply
ConstantConstant ββββββββO0O0 4,6364,636(8,835)(8,835) 2,9612,961(5,985)(5,985) –– –– –– ––
REV_BBREV_BBtt ββββββββO1O1 0,7420,742(32,631)(32,631) 0,8150,815(38,014)(38,014) 0,8960,896(275,698)(275,698) 0,9010,901(209,549)(209,549) 0,890,89(245,745)(245,745) 0,9000,900(208,769)(208,769)
PRICEPRICE tt ββββββββO3O3–– –– 0,2160,216(15,272)(15,272) 0,1920,192(9,909)(9,909) 0,2070,207(12,835)(12,835) 0,1990,199 (10,221)(10,221)
Broadband Economic Impact in Brazil: a
Simultaneous Equations AnalysisHildebrando R. Macedo and Alexandre X. Y. Carvalho 5th ACORN-REDECOM Conference Lima,Peru, May 19-20th, 2010 24
PRICEPRICE tt ββββββββO3O3–– –– 0,2160,216(15,272)(15,272) 0,1920,192(9,909)(9,909) 0,2070,207(12,835)(12,835) 0,1990,199 (10,221)(10,221)
Broadband Infrastructure Production Function Broadband Infrastructure Production Function
INVEST_BBINVEST_BBtt ββββββββPBL1PBL1 0,0240,024(19,379)(19,379) 0,0220,022(16,391)(16,391) 0,0210,021(20,657)(20,657) 0,0220,022(16,424)(16,424) 0,0230,023(22,062)(22,062) 0,0220,022(16,362)(16,362)
RR22
Aggregated Production Aggregated Production 0,4200,420 0,3890,389 0,4470,447 0,4650,465 0,4560,456 0,4630,463DemandDemand 0,6420,642 0,6420,642 0,8460,846 0,8560,856 0,8520,852 0,8500,850SupplySupply 0,8530,853 0,8540,854 0,8480,848 0,8540,854 0,8490,849 0,8530,853Infrastructure Production Infrastructure Production --0,0330,033 --0,0250,025 --0,0280,028 --0,0250,025 --0,0270,027 --0,0250,025
All coefficients at 1% significance level. All coefficients at 1% significance level.
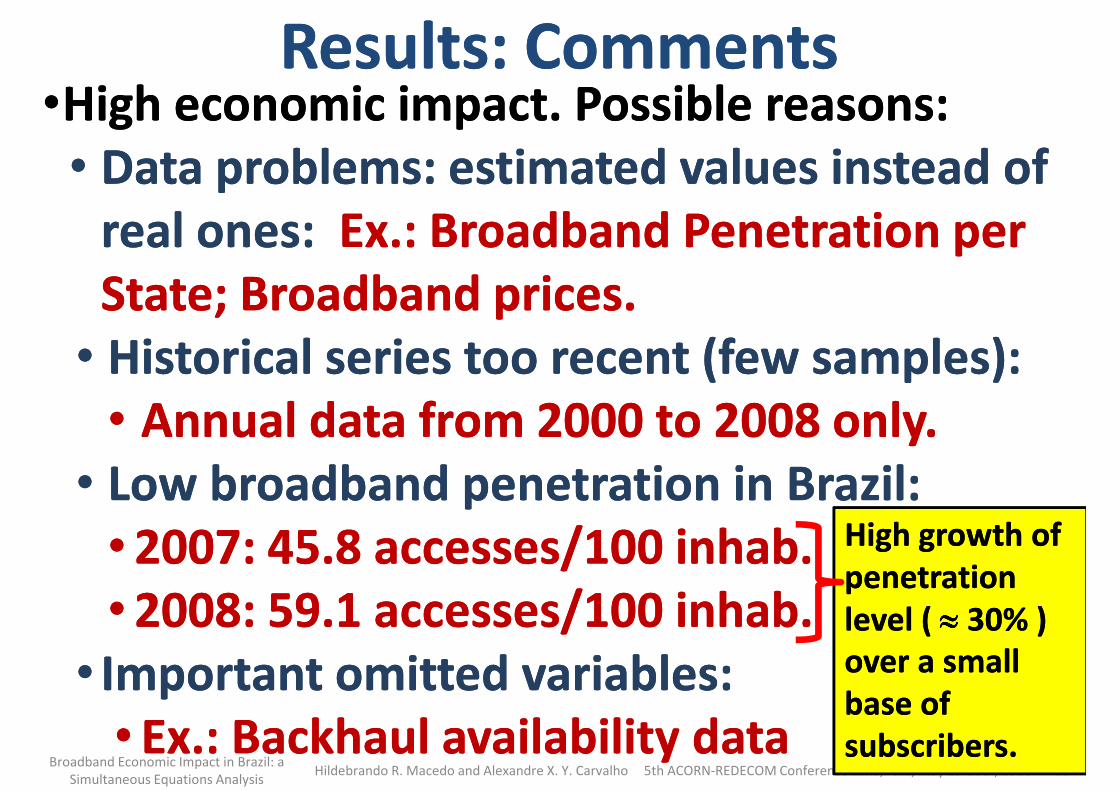
Results: CommentsResults: Comments••High economic impact. Possible reasons:High economic impact. Possible reasons:•• Data problems: estimated values instead of Data problems: estimated values instead of
real ones: real ones: Ex.: Broadband Penetration per Ex.: Broadband Penetration per State; Broadband prices.State; Broadband prices.State; Broadband prices.State; Broadband prices.•• Historical series too recent (few samples): Historical series too recent (few samples): •• Annual data from 2000 to 2008 only.Annual data from 2000 to 2008 only.•• Low broadband penetration in Brazil: Low broadband penetration in Brazil: •• 2007: 45.8 accesses/100 2007: 45.8 accesses/100 inhabinhab. . High growth of High growth of
Broadband Economic Impact in Brazil: a
Simultaneous Equations AnalysisHildebrando R. Macedo and Alexandre X. Y. Carvalho 5th ACORN-REDECOM Conference Lima,Peru, May 19-20th, 2010 25
•• 2007: 45.8 accesses/100 2007: 45.8 accesses/100 inhabinhab. . •• 2008: 59.1 accesses/100 2008: 59.1 accesses/100 inhabinhab. . •• Important omitted variables: Important omitted variables: •• Ex.: Backhaul availability dataEx.: Backhaul availability data
High growth of High growth of penetration penetration level ( level ( ≈≈≈≈≈≈≈≈ 30% ) 30% ) over a small over a small base of base of subscribers.subscribers.

Thank You!Thank You!Thank You!Thank You!HildebrandoHildebrando R. R. MacedoMacedo -- ANATELANATEL
[email protected]@anatel.gov.br
Broadband Economic Impact in Brazil: a
Simultaneous Equations AnalysisHildebrando R. Macedo and Alexandre X. Y. Carvalho 5th ACORN-REDECOM Conference Lima,Peru, May 19-20th, 2010 26
AlexandreAlexandre X.YwataX.Ywata de de CarvalhoCarvalho -- [email protected]@ipea.gov.br

Additional Additional Additional Additional SlidesSlides
Broadband Economic Impact in Brazil: a
Simultaneous Equations AnalysisHildebrando R. Macedo and Alexandre X. Y. Carvalho 5th ACORN-REDECOM Conference Lima,Peru, May 19-20th, 2010 27
SlidesSlides
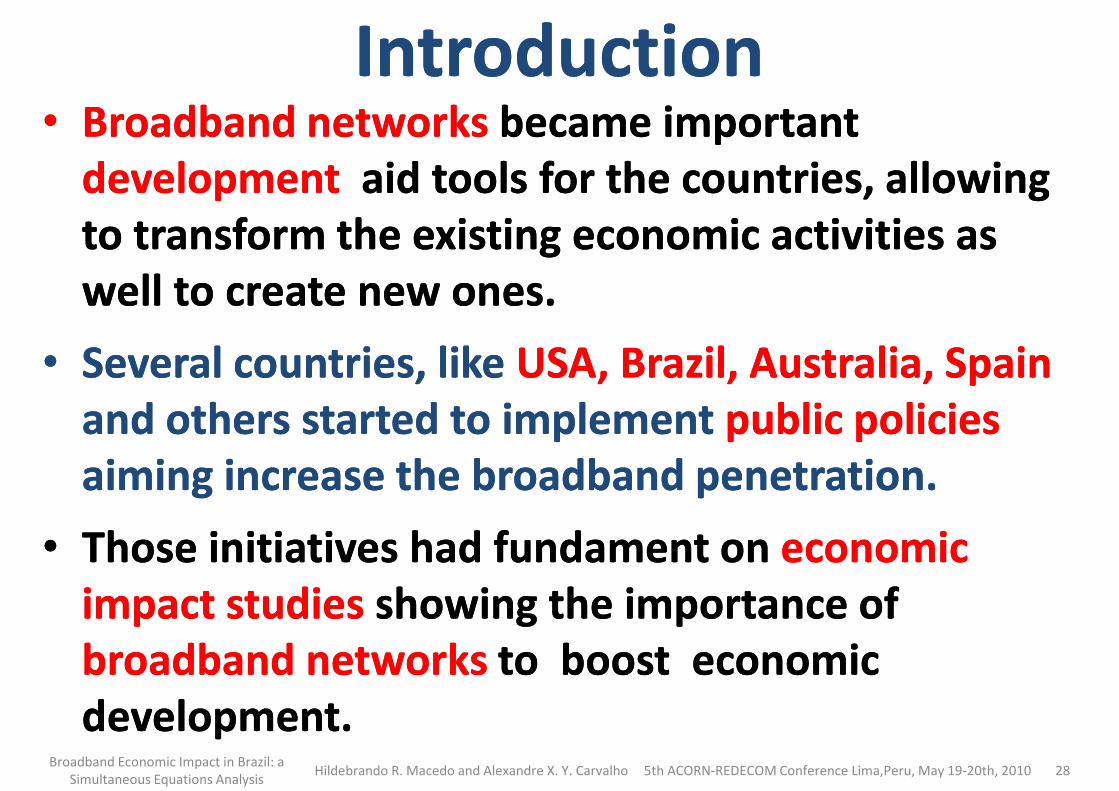
IntroductionIntroduction•• Broadband networks Broadband networks became important became important
developmentdevelopment aid tools for the countries, allowing aid tools for the countries, allowing to transform the existing economic activities as to transform the existing economic activities as well to create new ones.well to create new ones.well to create new ones.well to create new ones.
•• Several countries, like Several countries, like USA, Brazil, Australia, Spain USA, Brazil, Australia, Spain and others started to implement and others started to implement public policies public policies aiming increase the broadband penetration.aiming increase the broadband penetration.
•• Those initiatives had fundament on Those initiatives had fundament on economic economic
Broadband Economic Impact in Brazil: a
Simultaneous Equations AnalysisHildebrando R. Macedo and Alexandre X. Y. Carvalho 5th ACORN-REDECOM Conference Lima,Peru, May 19-20th, 2010 28
•• Those initiatives had fundament on Those initiatives had fundament on economic economic impact studiesimpact studies showing the importance of showing the importance of broadband networks broadband networks to boost economic to boost economic development. development.
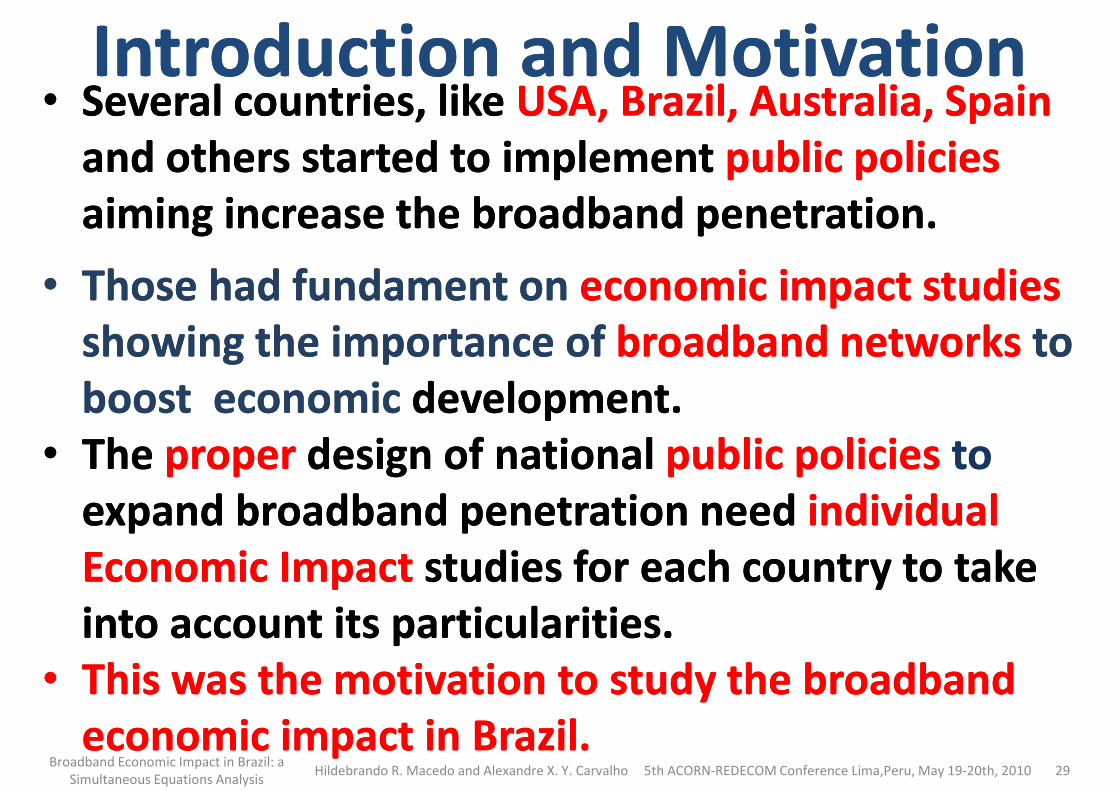
Introduction and MotivationIntroduction and Motivation•• Several countries, like Several countries, like USA, Brazil, Australia, Spain USA, Brazil, Australia, Spain
and others started to implement and others started to implement public policies public policies aiming increase the broadband penetration.aiming increase the broadband penetration.
•• Those had fundament on Those had fundament on economic impact studieseconomic impact studies•• Those had fundament on Those had fundament on economic impact studieseconomic impact studiesshowing the importance of showing the importance of broadband networks broadband networks to to boost economic boost economic development. development.
•• The The properproper design of national design of national public policies public policies to to expand broadband penetration need expand broadband penetration need individualindividual
Broadband Economic Impact in Brazil: a
Simultaneous Equations AnalysisHildebrando R. Macedo and Alexandre X. Y. Carvalho 5th ACORN-REDECOM Conference Lima,Peru, May 19-20th, 2010 29
expand broadband penetration need expand broadband penetration need individualindividualEconomic Impact Economic Impact studies for each country to take studies for each country to take into account its particularities.into account its particularities.
•• This was the motivation to study the broadband This was the motivation to study the broadband economic impact in Brazil.economic impact in Brazil.
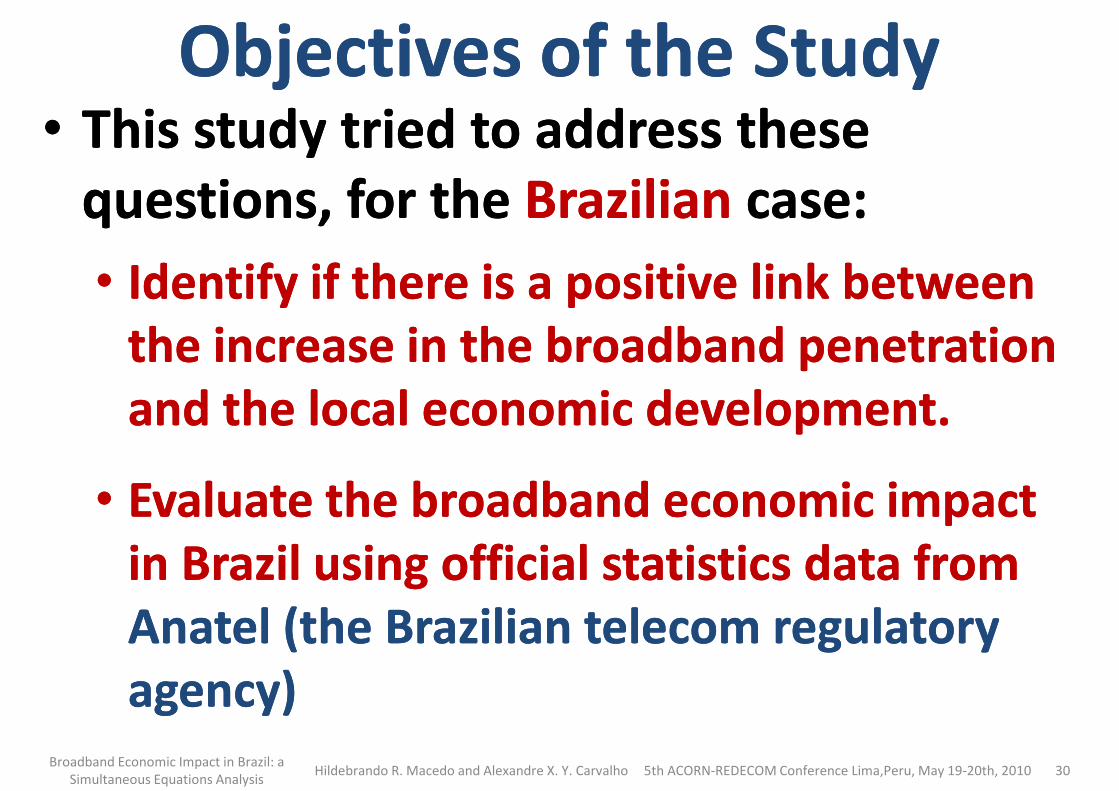
•• This study tried to address these This study tried to address these questions, for the questions, for the BrazilianBrazilian case:case:
•• Identify if there is a positive link between Identify if there is a positive link between
Objectives of the StudyObjectives of the Study
•• Identify if there is a positive link between Identify if there is a positive link between the increase in the broadband penetration the increase in the broadband penetration and the local economic development. and the local economic development.
•• Evaluate the broadband economic impact Evaluate the broadband economic impact
Broadband Economic Impact in Brazil: a
Simultaneous Equations AnalysisHildebrando R. Macedo and Alexandre X. Y. Carvalho 5th ACORN-REDECOM Conference Lima,Peru, May 19-20th, 2010 30
•• Evaluate the broadband economic impact Evaluate the broadband economic impact in Brazil using official statistics data from in Brazil using official statistics data from AnatelAnatel (the Brazilian telecom regulatory (the Brazilian telecom regulatory agency)agency)

ReferencesReferences•• World Bank study World Bank study ((QiangQiang
and others, 2009, and others, 2009, p. 35 to 50) *p. 35 to 50) *
Increase of Increase of 1,381,38 p.p. on the p.p. on the •• Increase of Increase of 1,381,38 p.p. on the p.p. on the GDP per capita growth rateGDP per capita growth ratefor each for each 1010 p.p. increase in p.p. increase in the broadband penetration the broadband penetration for developing countries for developing countries
Broadband Economic Impact in Brazil: a
Simultaneous Equations AnalysisHildebrando R. Macedo and Alexandre X. Y. Carvalho 5th ACORN-REDECOM Conference Lima,Peru, May 19-20th, 2010 31
for developing countries for developing countries (p. 45) .(p. 45) .
•• * * QIANGQIANG, Christine , Christine ZhenZhen--WeiWei; ; ROSSOTTOROSSOTTO, Carlo M. e , Carlo M. e KIMURA,KIMURA, KaoruKaoru, “, “EconomicEconomic
ImpactsImpacts ofof BroadbandBroadband”, em ”, em ICAD2009 ICAD2009 -- InformationInformation andand Communications for Communications for
DevelopmentDevelopment, Capítulo 3 : , Capítulo 3 : ExtendingExtending ReachReach andand IncreasingIncreasing ImpactImpact, pp. 35 a 50, , pp. 35 a 50, TheTheWorld World BankBank, Washington,DC, , Washington,DC, 20092009

ReferencesReferences
•• Crandall and others (2007) Crandall and others (2007)
Broadband Economic Impact in Brazil: a
Simultaneous Equations AnalysisHildebrando R. Macedo and Alexandre X. Y. Carvalho 5th ACORN-REDECOM Conference Lima,Peru, May 19-20th, 2010 32
Crandall and others (2007) Crandall and others (2007)
•• Increase between Increase between 0,2 to 0,30,2 to 0,3 p.p. in the p.p. in the employment level for each employment level for each 11 p.p. increase in p.p. increase in the broadband penetration the broadband penetration (p. 2)(p. 2)

ReferencesReferences•• KoutskyKoutsky and Ford and Ford (2005) (2005) •• KOUTSKYKOUTSKY , , ThomasThomas MM. e . e FORD ,FORD ,GeorgeGeorge SS., "., "Broadband and Broadband and
Economic Development: A Municipal Case Study from FloridaEconomic Development: A Municipal Case Study from Florida" , " , Review of Urban & Regional Development StudiesReview of Urban & Regional Development Studies, Vol. 17, No. 3, , Vol. 17, No. 3, pp. 219pp. 219--229, 2005, 229, 2005, Journal of the Applied Regional Science Journal of the Applied Regional Science pp. 219pp. 219--229, 2005, 229, 2005, Journal of the Applied Regional Science Journal of the Applied Regional Science CConferenceonference
•• Approximately Approximately 100% 100% increase in the increase in the economic economic activity activity of of Lake County, Florida (USA)Lake County, Florida (USA) after after public investment in the deployment of public investment in the deployment of extensive fiber optics network.extensive fiber optics network.
•• This when compared to similar localities that This when compared to similar localities that
Broadband Economic Impact in Brazil: a
Simultaneous Equations AnalysisHildebrando R. Macedo and Alexandre X. Y. Carvalho 5th ACORN-REDECOM Conference Lima,Peru, May 19-20th, 2010 33
•• This when compared to similar localities that This when compared to similar localities that had not had not such investment. such investment.
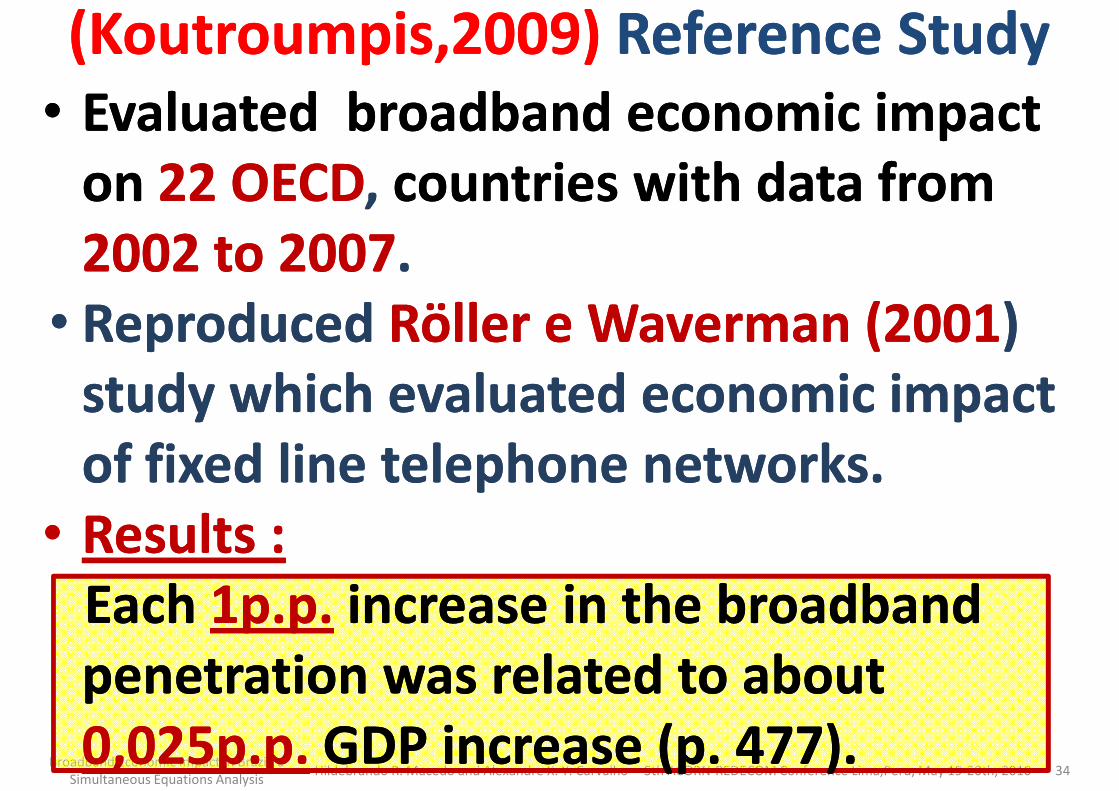
•• Evaluated broadband economic impact Evaluated broadband economic impact on on 22 OECD22 OECD, , countries with data from countries with data from 2002 to 20072002 to 2007. .
(Koutroumpis,2009) (Koutroumpis,2009) Reference StudyReference Study
2002 to 20072002 to 2007. . •• Reproduced Reproduced RöllerRöller e e WavermanWaverman (2001(2001) )
study which evaluated economic impact study which evaluated economic impact of fixed line telephone networks.of fixed line telephone networks.
•• Results :Results :
Broadband Economic Impact in Brazil: a
Simultaneous Equations AnalysisHildebrando R. Macedo and Alexandre X. Y. Carvalho 5th ACORN-REDECOM Conference Lima,Peru, May 19-20th, 2010 34
•• Results :Results :Each Each 1p.p.1p.p. increase in the broadband increase in the broadband penetration was related to about penetration was related to about 0,025p.p.0,025p.p. GDP increase (p. 477). GDP increase (p. 477).
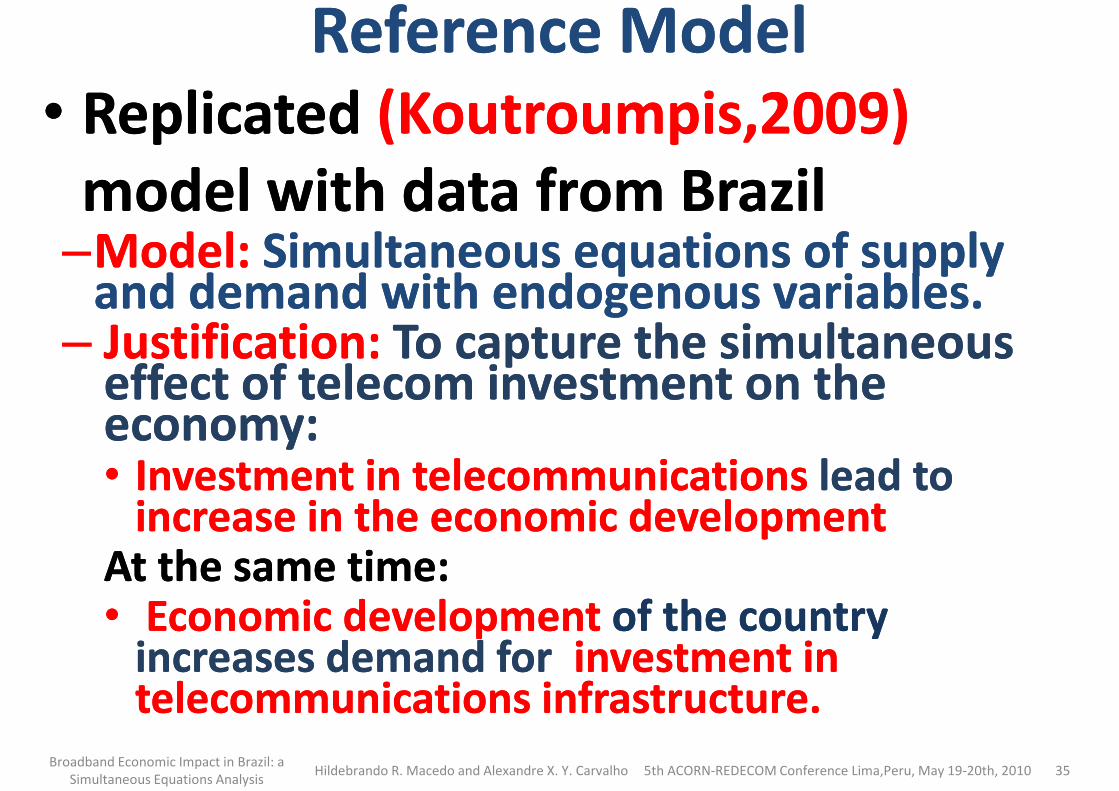
Reference ModelReference Model•• ReplicatedReplicated (Koutroumpis,2009) (Koutroumpis,2009)
modelmodel with data from Brazilwith data from Brazil––Model: Model: Simultaneous equations of supply Simultaneous equations of supply
and demand with endogenous variables. and demand with endogenous variables. ––Model: Model: Simultaneous equations of supply Simultaneous equations of supply
and demand with endogenous variables. and demand with endogenous variables. –– Justification: Justification: To capture the simultaneous To capture the simultaneous
effect of telecom investment on the effect of telecom investment on the economy:economy:•• Investment in telecommunications Investment in telecommunications lead to lead to
increase in the economic developmentincrease in the economic development
Broadband Economic Impact in Brazil: a
Simultaneous Equations AnalysisHildebrando R. Macedo and Alexandre X. Y. Carvalho 5th ACORN-REDECOM Conference Lima,Peru, May 19-20th, 2010 35
increase in the economic developmentincrease in the economic developmentAt the same time:At the same time:•• Economic development Economic development of the country of the country
increases demand for increases demand for investment in investment in telecommunications infrastructure. telecommunications infrastructure.

60.0
70.0
80.0M
arket Shares (%
)
Broadband Market Shares per Access Speeds
Broadband Accesses per SpeedBroadband Accesses per Speed
2000 2001 2002 2003 2004 2005 2006 2007 2008 2009 20100.0
10.0
20.0
30.0
40.0
50.0
Market Shares (%
)
Broadband Economic Impact in Brazil: a
Simultaneous Equations AnalysisHildebrando R. Macedo and Alexandre X. Y. Carvalho 5th ACORN-REDECOM Conference Lima,Peru, May 19-20th, 2010 36
2000 2001 2002 2003 2004 2005 2006 2007 2008 2009 2010
0 a 64Kbps 75.8 33.3 30.6 34.6 26.9 20.1 19.5 12.6 11.6 11.8 10.4
64K a 512Kbps 15.4 62.5 66.1 61.7 45.0 52.6 51.0 59.9 37.1 28.6 21.1
512K a 2Mbps 5.8 3.1 2.6 3.2 27.0 26.5 27.6 25.5 42.3 44.9 49.6
2M a 34Mbps 2.1 0.8 0.5 0.4 0.9 0.6 1.7 1.6 8.3 14.0 18.6
> 34Mbps 0.9 0.4 0.3 0.2 0.2 0.2 0.2 0.3 0.7 0.7 0.3
TOTAL (%) 100 100 100 100 100 100 100 100 100 100 100
0.0
YearSource: (ANATEL-SICI).
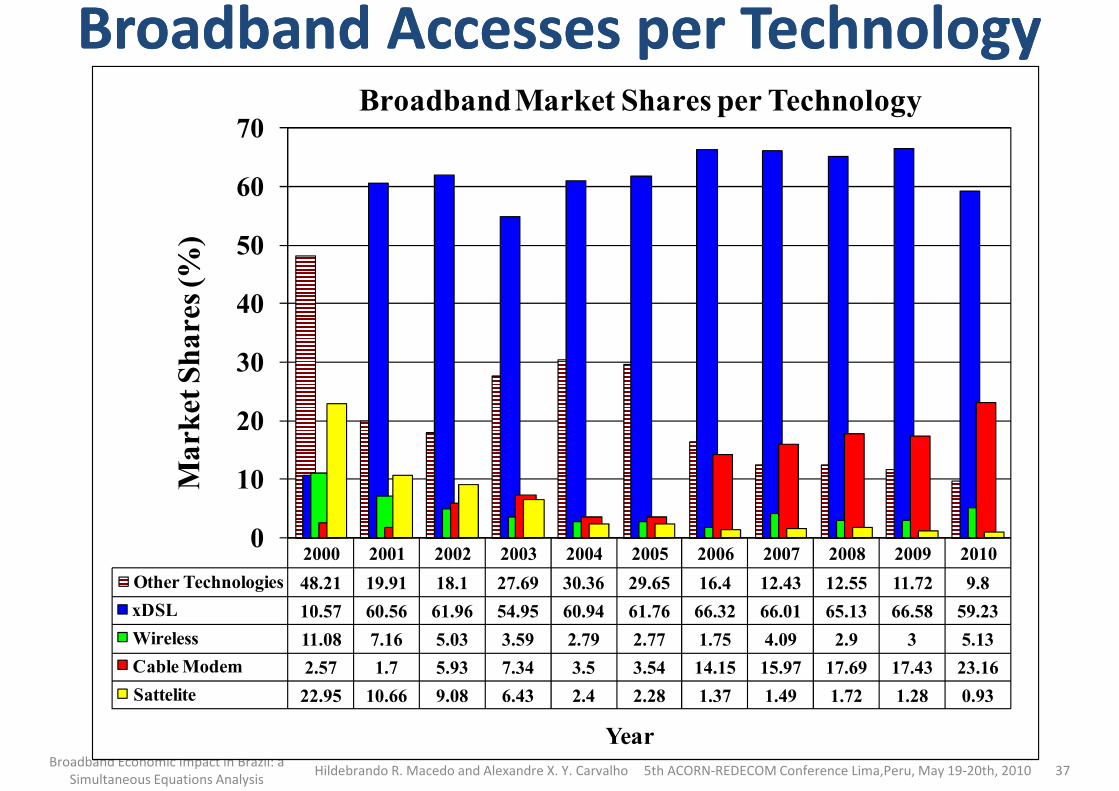
Broadband Accesses per TechnologyBroadband Accesses per Technology
50
60
70
Mark
et S
hare
s (%
)
Broadband Market Shares per Technology
0
10
20
30
40
Mark
et S
hare
s (%
)
Broadband Economic Impact in Brazil: a
Simultaneous Equations AnalysisHildebrando R. Macedo and Alexandre X. Y. Carvalho 5th ACORN-REDECOM Conference Lima,Peru, May 19-20th, 2010 37
2000 2001 2002 2003 2004 2005 2006 2007 2008 2009 2010
Other Technologies 48.21 19.91 18.1 27.69 30.36 29.65 16.4 12.43 12.55 11.72 9.8
xDSL 10.57 60.56 61.96 54.95 60.94 61.76 66.32 66.01 65.13 66.58 59.23
Wireless 11.08 7.16 5.03 3.59 2.79 2.77 1.75 4.09 2.9 3 5.13
Cable Modem 2.57 1.7 5.93 7.34 3.5 3.54 14.15 15.97 17.69 17.43 23.16
Sattelite 22.95 10.66 9.08 6.43 2.4 2.28 1.37 1.49 1.72 1.28 0.93
0
Year

Estimated Data UsedEstimated Data Used
•• Some Important Data had to be Some Important Data had to be Estimated: Estimated: Estimated: Estimated: ––Broadband penetration Broadband penetration
disaggregated by State from 2000 disaggregated by State from 2000 to 2006.to 2006.––GDP per State in 2008GDP per State in 2008
Broadband Economic Impact in Brazil: a
Simultaneous Equations AnalysisHildebrando R. Macedo and Alexandre X. Y. Carvalho 5th ACORN-REDECOM Conference Lima,Peru, May 19-20th, 2010 38
––GDP per State in 2008GDP per State in 2008––Broadband PricesBroadband Prices

Data Estimation: Broadband Penetration Data Estimation: Broadband Penetration per State from 2000 to 2006per State from 2000 to 2006
SSharehare of each of each one of the one of the 27 27
AApprpproximation:oximation:
Share Share of each of each SSharehare of each of each one of the one of the 27 27 Brazilian StatesBrazilian Stateson the total on the total internet accessesinternet accesses
≈≈≈≈≈≈≈≈Share Share of each of each one of the one of the 27 27 Brazilian States Brazilian States on the total on the total broadband broadband
Broadband Economic Impact in Brazil: a
Simultaneous Equations AnalysisHildebrando R. Macedo and Alexandre X. Y. Carvalho 5th ACORN-REDECOM Conference Lima,Peru, May 19-20th, 2010 39
internet accessesinternet accesses(broadband or (broadband or not) not) in thein the country country
broadband broadband accesses accesses in the in the country.country.
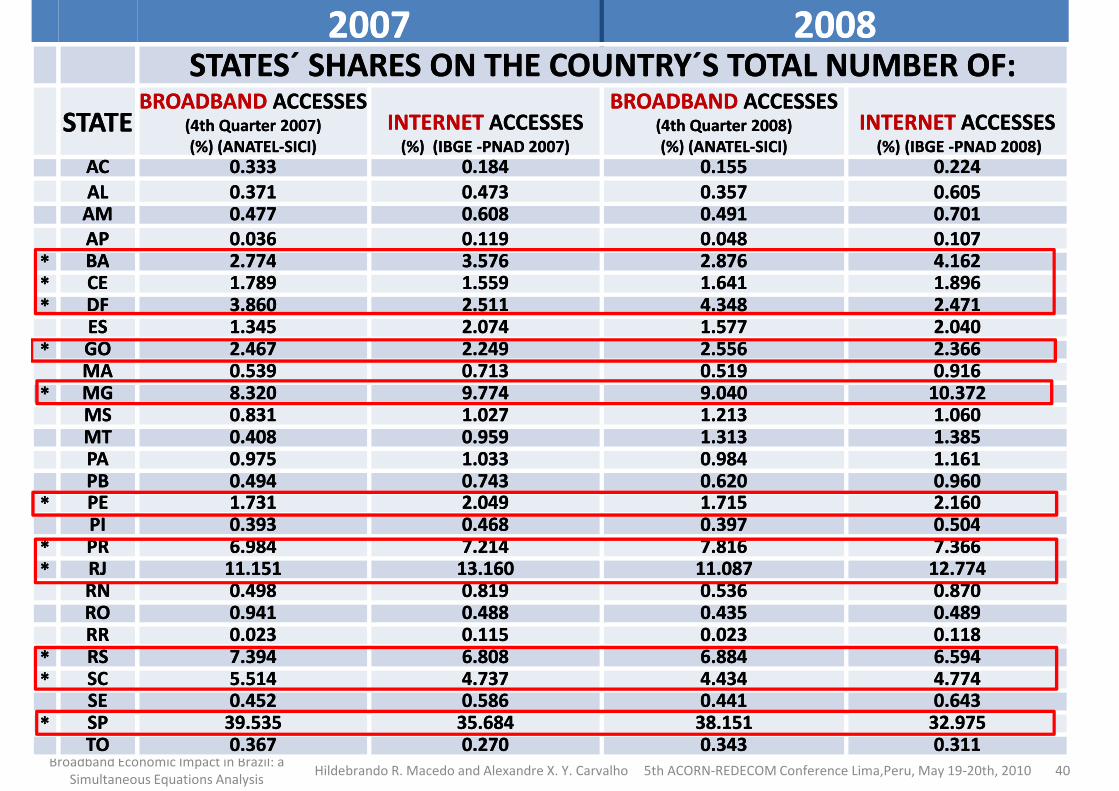
20072007 20082008STATESSTATES´́ SHARES ON THE COUNTRYSHARES ON THE COUNTRY´́SS TOTAL TOTAL NUMBER OF:NUMBER OF:
STATESTATEBROADBANDBROADBAND ACCESSESACCESSES
(4th Quarter(4th Quarter 2007) 2007) (%) (ANATEL(%) (ANATEL--SICI)SICI)
INTERNETINTERNET ACCESSESACCESSES(%) (IBGE (%) (IBGE --PNAD 2007)PNAD 2007)
BROADBANDBROADBAND ACCESSESACCESSES(4th Quarter(4th Quarter 2008) 2008) (%) (ANATEL(%) (ANATEL--SICI)SICI)
INTERNETINTERNET ACCESSESACCESSES(%) (IBGE (%) (IBGE --PNAD 2008)PNAD 2008)
ACAC 0.3330.333 0.1840.184 0.1550.155 0.2240.224ALAL 0.3710.371 0.4730.473 0.3570.357 0.6050.605
AMAM 0.4770.477 0.6080.608 0.4910.491 0.7010.701APAP 0.0360.036 0.1190.119 0.0480.048 0.1070.107
** BABA 2.7742.774 3.5763.576 2.8762.876 4.1624.162** BABA 2.7742.774 3.5763.576 2.8762.876 4.1624.162** CECE 1.7891.789 1.5591.559 1.6411.641 1.8961.896** DFDF 3.8603.860 2.5112.511 4.3484.348 2.4712.471
ESES 1.3451.345 2.0742.074 1.5771.577 2.0402.040** GOGO 2.4672.467 2.2492.249 2.5562.556 2.3662.366
MAMA 0.5390.539 0.7130.713 0.5190.519 0.9160.916** MGMG 8.3208.320 9.7749.774 9.0409.040 10.37210.372
MSMS 0.8310.831 1.0271.027 1.2131.213 1.0601.060MTMT 0.4080.408 0.9590.959 1.3131.313 1.3851.385PAPA 0.9750.975 1.0331.033 0.9840.984 1.1611.161PBPB 0.4940.494 0.7430.743 0.6200.620 0.9600.960
** PEPE 1.7311.731 2.0492.049 1.7151.715 2.1602.160PIPI 0.3930.393 0.4680.468 0.3970.397 0.5040.504
Broadband Economic Impact in Brazil: a
Simultaneous Equations AnalysisHildebrando R. Macedo and Alexandre X. Y. Carvalho 5th ACORN-REDECOM Conference Lima,Peru, May 19-20th, 2010 40
PIPI 0.3930.393 0.4680.468 0.3970.397 0.5040.504** PRPR 6.9846.984 7.2147.214 7.8167.816 7.3667.366** RJRJ 11.15111.151 13.16013.160 11.08711.087 12.77412.774
RNRN 0.4980.498 0.8190.819 0.5360.536 0.8700.870RORO 0.9410.941 0.4880.488 0.4350.435 0.4890.489RRRR 0.0230.023 0.1150.115 0.0230.023 0.1180.118
** RSRS 7.3947.394 6.8086.808 6.8846.884 6.5946.594** SCSC 5.5145.514 4.7374.737 4.4344.434 4.7744.774
SESE 0.4520.452 0.5860.586 0.4410.441 0.6430.643** SPSP 39.53539.535 35.68435.684 38.15138.151 32.97532.975
TOTO 0.3670.367 0.2700.270 0.3430.343 0.3110.311

20072007 20082008AA BB CC DD
STATESTATE
STATESSTATES´́ SHARES ON SHARES ON THE COUNTRYTHE COUNTRY´́S S
TOTAL TOTAL BROADBANDBROADBANDACCESSES (%)ACCESSES (%)
STATESSTATES´́ SHARES ON SHARES ON THE COUNTRYTHE COUNTRY´́S S TOTAL TOTAL INTERNETINTERNET
ACCESSES (%)ACCESSES (%)
STATESSTATES´́ SHARES ON SHARES ON THE COUNTRYTHE COUNTRY´́S S
TOTAL TOTAL BROADBANDBROADBANDACCESSES (%)ACCESSES (%)
STATESSTATES´́ SHARES ON SHARES ON THE COUNTRYTHE COUNTRY´́S S TOTAL TOTAL INTERNETINTERNET
ACCESSES (%)ACCESSES (%)
BABA 2.7742.774 3.5763.576 2.8762.876 4.1624.162** BABA 2.7742.774 3.5763.576 2.8762.876 4.1624.162** CECE 1.7891.789 1.5591.559 1.6411.641 1.8961.896** DFDF 3.8603.860 2.5112.511 4.3484.348 2.4712.471** GOGO 2.4672.467 2.2492.249 2.5562.556 2.3662.366** MGMG 8.3208.320 9.7749.774 9.0409.040 10.37210.372** PEPE 1.7311.731 2.0492.049 1.7151.715 2.1602.160** PRPR 6.9846.984 7.2147.214 7.8167.816 7.3667.366
Broadband Economic Impact in Brazil: a
Simultaneous Equations AnalysisHildebrando R. Macedo and Alexandre X. Y. Carvalho 5th ACORN-REDECOM Conference Lima,Peru, May 19-20th, 2010 41
** PRPR 6.9846.984 7.2147.214 7.8167.816 7.3667.366** RJRJ 11.15111.151 13.16013.160 11.08711.087 12.77412.774** RSRS 7.3947.394 6.8086.808 6.8846.884 6.5946.594** SCSC 5.5145.514 4.7374.737 4.4344.434 4.7744.774** SPSP 39.53539.535 35.68435.684 38.15138.151 32.97532.975

Estimation ResultsEstimation Results
•• StatesStates´́ Shares of Shares of BroadbandBroadband AccessesAccessesXXXX
•• StatesStates´́ Shares of Shares of InternetInternet AccessesAccesses
•• 2007: R2007: R22 = 0,86= 0,86
Broadband Economic Impact in Brazil: a
Simultaneous Equations AnalysisHildebrando R. Macedo and Alexandre X. Y. Carvalho 5th ACORN-REDECOM Conference Lima,Peru, May 19-20th, 2010 42
•• 2008: R2008: R22 = 0,79= 0,79
2628303234363840
Part
icip
ati
on (
%)
Share of each State on the country total broadband accesses
Share of each State on the country total homes with internet
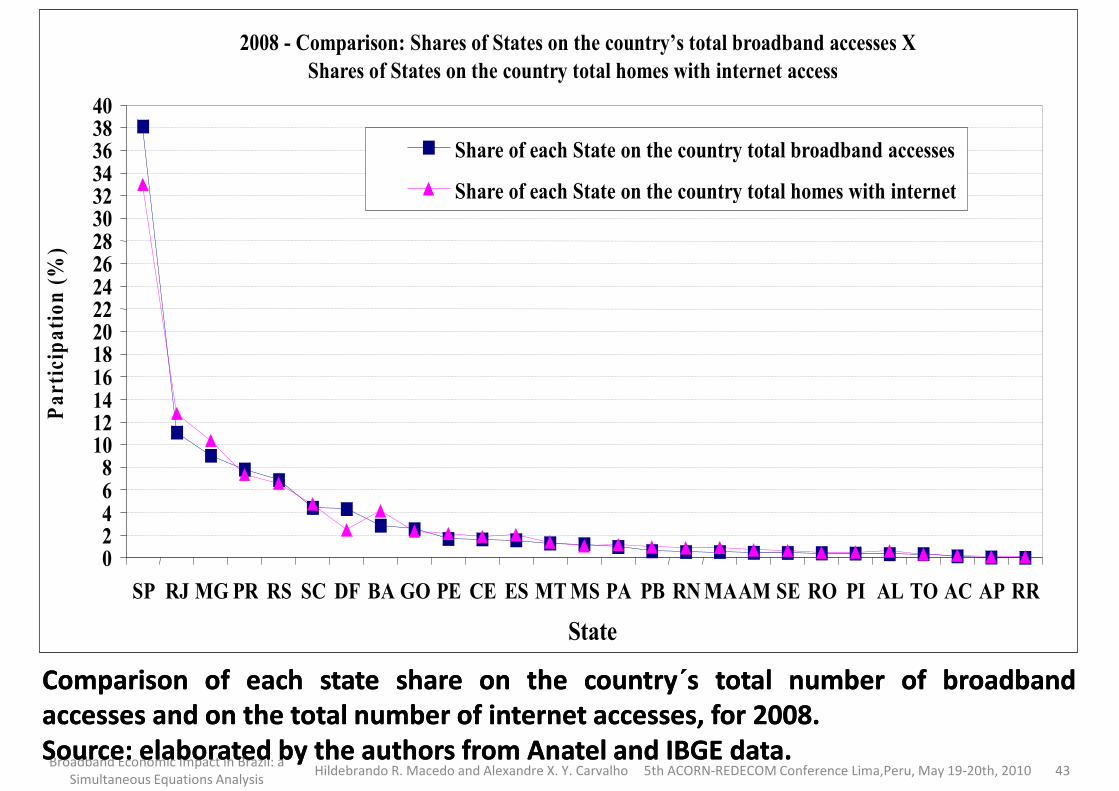
2008 - Comparison: Shares of States on the country’s total broadband accesses X
Shares of States on the country total homes with internet access
2468
101214161820222426
Part
icip
ati
on (
%)
Broadband Economic Impact in Brazil: a
Simultaneous Equations AnalysisHildebrando R. Macedo and Alexandre X. Y. Carvalho 5th ACORN-REDECOM Conference Lima,Peru, May 19-20th, 2010 43
ComparisonComparison ofof eacheach statestate shareshare onon thethe countrycountry´́ss totaltotal numbernumber ofof broadbandbroadbandaccessesaccesses andand onon thethe totaltotal numbernumber ofof internetinternet accesses,accesses, forfor 20082008..SourceSource:: elaboratedelaborated byby thethe authorsauthors fromfrom AnatelAnatel andand IBGEIBGE datadata..
02
SP RJ MG PR RS SC DF BA GO PE CE ES MT MS PA PB RN MA AM SE RO PI AL TO AC AP RR State

242628303234363840
Part
icip
ati
on (
%)
Share of each State on the country total broadband accesses
Share of each State on the country total homes with internet
2007 - Comparison: Shares of States on the country total broadband accesses X
Shares of States on the country total homes with internet access
2468
1012141618202224
Part
icip
ati
on (
%)
(%)
Broadband Economic Impact in Brazil: a
Simultaneous Equations AnalysisHildebrando R. Macedo and Alexandre X. Y. Carvalho 5th ACORN-REDECOM Conference Lima,Peru, May 19-20th, 2010 44
ComparisonComparison ofof eacheach statestate shareshare onon thethe countrycountry´́ss totaltotal numbernumber ofof broadbandbroadbandaccessesaccesses andand onon thethe totaltotal numbernumber ofof internetinternet accesses,accesses, forfor 20072007..SourceSource:: elaboratedelaborated byby thethe authorsauthors fromfrom AnatelAnatel andand IBGEIBGE datadata..
02
SP RJ MG PR RS SC DF BA GO PE CE ES MT MS PA PB RN MA AM SE RO PI AL TO AC AP RR
State

2008 GDP States2008 GDP States´́ EstimatesEstimates
•• Only Only nationalnational 2008 GDP available but not 2008 GDP available but not GDP per State. GDP per State.
•• To estimate the GDP per To estimate the GDP per StateState of of 20082008: : •• To estimate the GDP per To estimate the GDP per StateState of of 20082008: : –– It was assumed that each It was assumed that each StateState would retain would retain
the same national GDP share of the same national GDP share of 20072007. . ––Hypothesis reinforced when compared data Hypothesis reinforced when compared data
of of 20062006 and and 20072007 for the participation of for the participation of
Broadband Economic Impact in Brazil: a
Simultaneous Equations AnalysisHildebrando R. Macedo and Alexandre X. Y. Carvalho 5th ACORN-REDECOM Conference Lima,Peru, May 19-20th, 2010 45
of of 20062006 and and 20072007 for the participation of for the participation of each State in the national GDP (each State in the national GDP (similar to similar to the first decimal casethe first decimal case) )
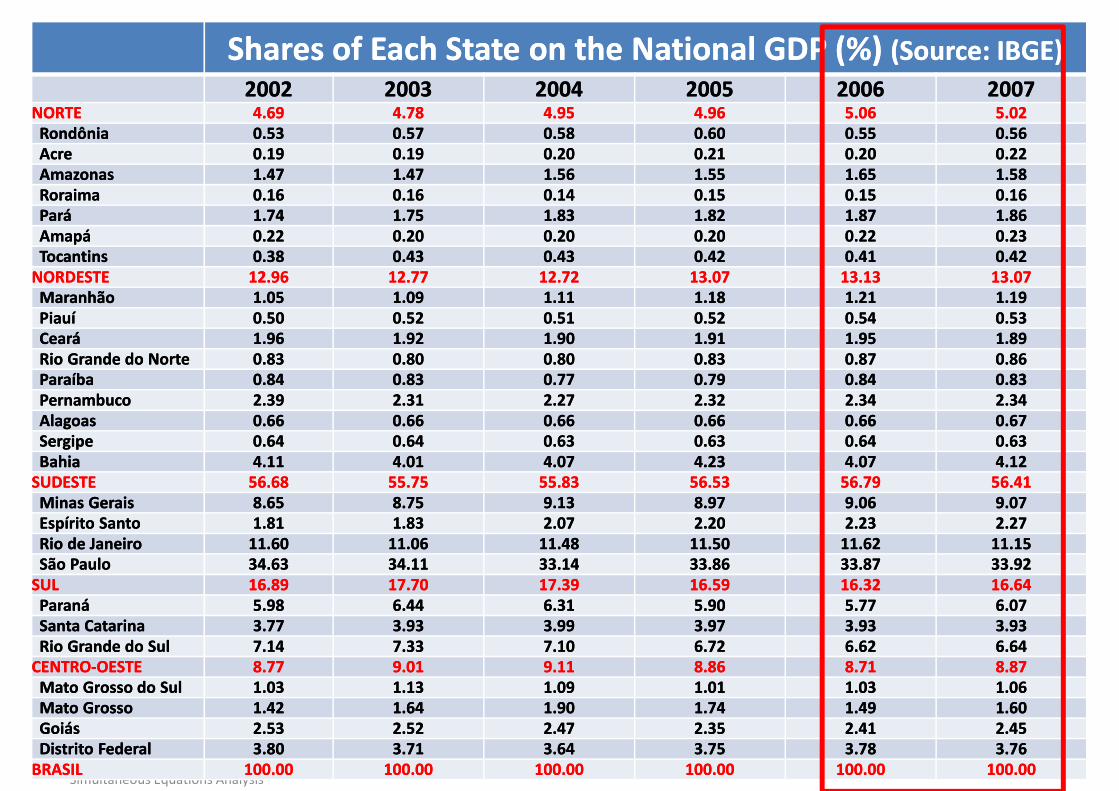
Shares of Each State on the National GDP (%) Shares of Each State on the National GDP (%) (Source: IBGE)(Source: IBGE)20022002 20032003 20042004 20052005 20062006 20072007
NORTENORTE 4.694.69 4.784.78 4.954.95 4.964.96 5.065.06 5.025.02RondôniaRondônia 0.530.53 0.570.57 0.580.58 0.600.60 0.550.55 0.560.56AcreAcre 0.190.19 0.190.19 0.200.20 0.210.21 0.200.20 0.220.22AmazonasAmazonas 1.471.47 1.471.47 1.561.56 1.551.55 1.651.65 1.581.58RoraimaRoraima 0.160.16 0.160.16 0.140.14 0.150.15 0.150.15 0.160.16ParáPará 1.741.74 1.751.75 1.831.83 1.821.82 1.871.87 1.861.86AmapáAmapá 0.220.22 0.200.20 0.200.20 0.200.20 0.220.22 0.230.23TocantinsTocantins 0.380.38 0.430.43 0.430.43 0.420.42 0.410.41 0.420.42TocantinsTocantins 0.380.38 0.430.43 0.430.43 0.420.42 0.410.41 0.420.42
NORDESTENORDESTE 12.9612.96 12.7712.77 12.7212.72 13.0713.07 13.1313.13 13.0713.07MaranhãoMaranhão 1.051.05 1.091.09 1.111.11 1.181.18 1.211.21 1.191.19PiauíPiauí 0.500.50 0.520.52 0.510.51 0.520.52 0.540.54 0.530.53CearáCeará 1.961.96 1.921.92 1.901.90 1.911.91 1.951.95 1.891.89Rio Grande do NorteRio Grande do Norte 0.830.83 0.800.80 0.800.80 0.830.83 0.870.87 0.860.86ParaíbaParaíba 0.840.84 0.830.83 0.770.77 0.790.79 0.840.84 0.830.83PernambucoPernambuco 2.392.39 2.312.31 2.272.27 2.322.32 2.342.34 2.342.34AlagoasAlagoas 0.660.66 0.660.66 0.660.66 0.660.66 0.660.66 0.670.67SergipeSergipe 0.640.64 0.640.64 0.630.63 0.630.63 0.640.64 0.630.63BahiaBahia 4.114.11 4.014.01 4.074.07 4.234.23 4.074.07 4.124.12
SUDESTESUDESTE 56.6856.68 55.7555.75 55.8355.83 56.5356.53 56.7956.79 56.4156.41Minas GeraisMinas Gerais 8.658.65 8.758.75 9.139.13 8.978.97 9.069.06 9.079.07Espírito SantoEspírito Santo 1.811.81 1.831.83 2.072.07 2.202.20 2.232.23 2.272.27
Broadband Economic Impact in Brazil: a
Simultaneous Equations AnalysisHildebrando R. Macedo and Alexandre X. Y. Carvalho 5th ACORN-REDECOM Conference Lima,Peru, May 19-20th, 2010 46
Espírito SantoEspírito Santo 1.811.81 1.831.83 2.072.07 2.202.20 2.232.23 2.272.27Rio de JaneiroRio de Janeiro 11.6011.60 11.0611.06 11.4811.48 11.5011.50 11.6211.62 11.1511.15São PauloSão Paulo 34.6334.63 34.1134.11 33.1433.14 33.8633.86 33.8733.87 33.9233.92
SULSUL 16.8916.89 17.7017.70 17.3917.39 16.5916.59 16.3216.32 16.6416.64ParanáParaná 5.985.98 6.446.44 6.316.31 5.905.90 5.775.77 6.076.07Santa CatarinaSanta Catarina 3.773.77 3.933.93 3.993.99 3.973.97 3.933.93 3.933.93Rio Grande do SulRio Grande do Sul 7.147.14 7.337.33 7.107.10 6.726.72 6.626.62 6.646.64
CENTROCENTRO--OESTEOESTE 8.778.77 9.019.01 9.119.11 8.868.86 8.718.71 8.878.87Mato Grosso do SulMato Grosso do Sul 1.031.03 1.131.13 1.091.09 1.011.01 1.031.03 1.061.06Mato GrossoMato Grosso 1.421.42 1.641.64 1.901.90 1.741.74 1.491.49 1.601.60GoiásGoiás 2.532.53 2.522.52 2.472.47 2.352.35 2.412.41 2.452.45Distrito FederalDistrito Federal 3.803.80 3.713.71 3.643.64 3.753.75 3.783.78 3.763.76
BRASILBRASIL 100.00100.00 100.00100.00 100.00100.00 100.00100.00 100.00100.00 100.00100.00

Broadband Price EstimationBroadband Price Estimation•• No No reliablereliable, , disaggregateddisaggregated with with historical historical
series series data available in Brazil data available in Brazil
•• The The few data few data available were scattered from available were scattered from •• The The few data few data available were scattered from available were scattered from several sources, mainly from several sources, mainly from sporadicsporadicsurveyssurveys performed by telecom equipment performed by telecom equipment manufacturers, consultant companies or manufacturers, consultant companies or other organizations.other organizations.
Broadband Economic Impact in Brazil: a
Simultaneous Equations AnalysisHildebrando R. Macedo and Alexandre X. Y. Carvalho 5th ACORN-REDECOM Conference Lima,Peru, May 19-20th, 2010 47
•• For academic purposes is desirable to count For academic purposes is desirable to count on official and more reliable data. on official and more reliable data.
•• AnatelAnatel started to collect prices data in 2011 started to collect prices data in 2011 only only
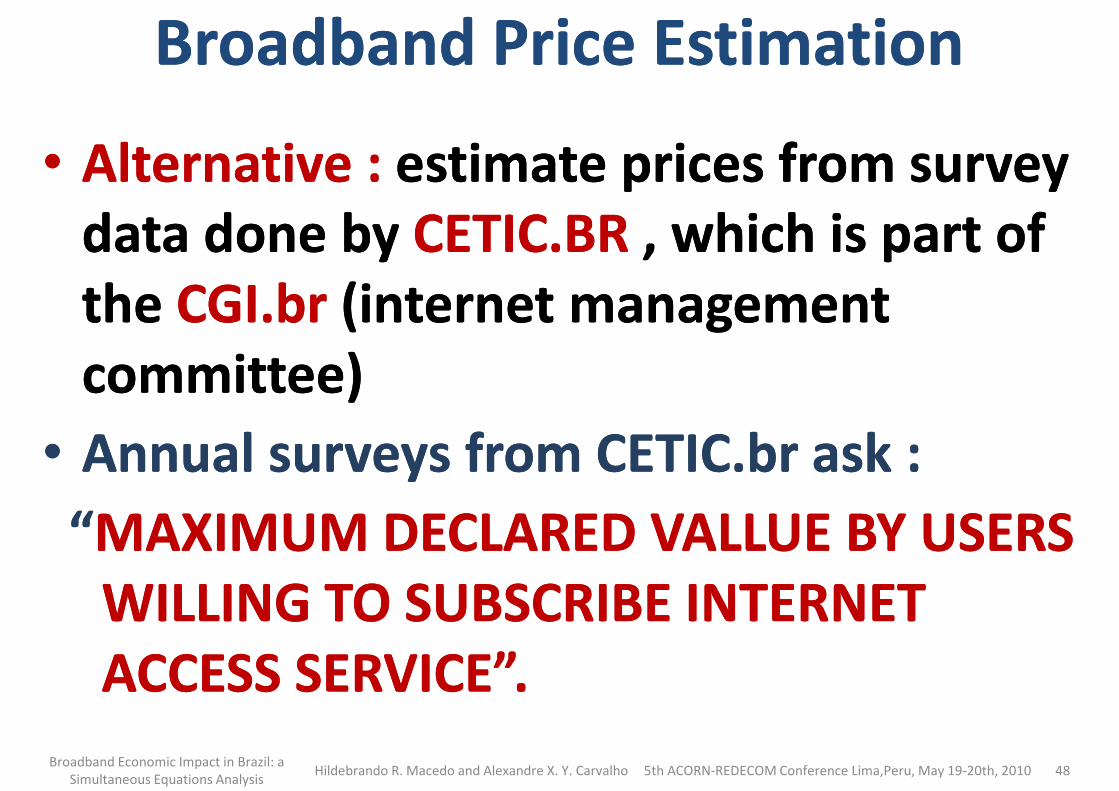
•• Alternative : Alternative : estimate prices from survey estimate prices from survey data done by data done by CETIC.BRCETIC.BR , which is part of , which is part of
Broadband Price EstimationBroadband Price Estimation
data done by data done by CETIC.BRCETIC.BR , which is part of , which is part of the the CGI.br CGI.br (internet management (internet management committee)committee)
•• Annual surveys from CETIC.br ask :Annual surveys from CETIC.br ask :
““MAXIMUM DECLARED VALLUE BY USERS MAXIMUM DECLARED VALLUE BY USERS
Broadband Economic Impact in Brazil: a
Simultaneous Equations AnalysisHildebrando R. Macedo and Alexandre X. Y. Carvalho 5th ACORN-REDECOM Conference Lima,Peru, May 19-20th, 2010 48
““MAXIMUM DECLARED VALLUE BY USERS MAXIMUM DECLARED VALLUE BY USERS WILLING TO SUBSCRIBE INTERNET WILLING TO SUBSCRIBE INTERNET ACCESS SERVICE”.ACCESS SERVICE”.
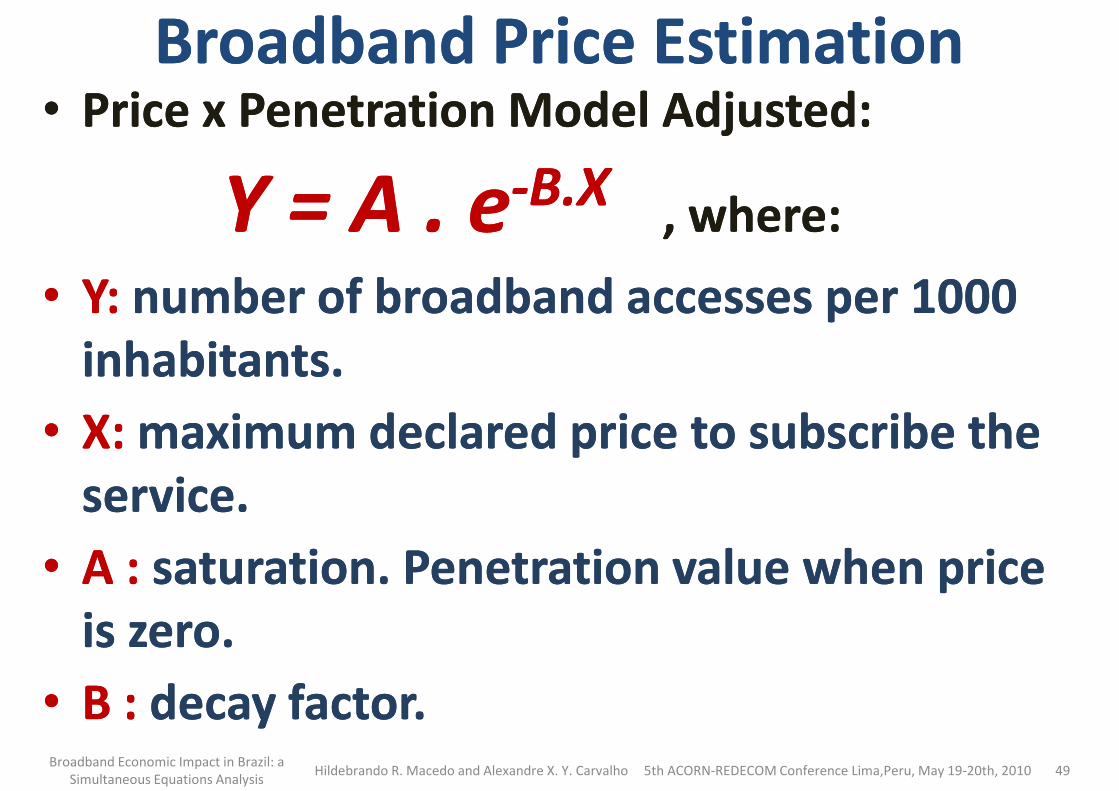
Broadband Price EstimationBroadband Price Estimation•• Price x Penetration Model Adjusted: Price x Penetration Model Adjusted:
Y = A . eY = A . e--B.X B.X , where:, where:
Y: Y: number of broadband accesses per 1000 number of broadband accesses per 1000 •• Y: Y: number of broadband accesses per 1000 number of broadband accesses per 1000 inhabitants.inhabitants.
•• X: X: maximum declared price to subscribe the maximum declared price to subscribe the service.service.
Broadband Economic Impact in Brazil: a
Simultaneous Equations AnalysisHildebrando R. Macedo and Alexandre X. Y. Carvalho 5th ACORN-REDECOM Conference Lima,Peru, May 19-20th, 2010 49
•• A :A : saturation. Penetration value when price saturation. Penetration value when price is zero.is zero.
•• B :B : decay factor.decay factor.

Broadband Price EstimationBroadband Price Estimation
•• Approximation of the broadband price Approximation of the broadband price as a function of penetration :as a function of penetration :
( )ln YA
XB
= −
Broadband Economic Impact in Brazil: a
Simultaneous Equations AnalysisHildebrando R. Macedo and Alexandre X. Y. Carvalho 5th ACORN-REDECOM Conference Lima,Peru, May 19-20th, 2010 50
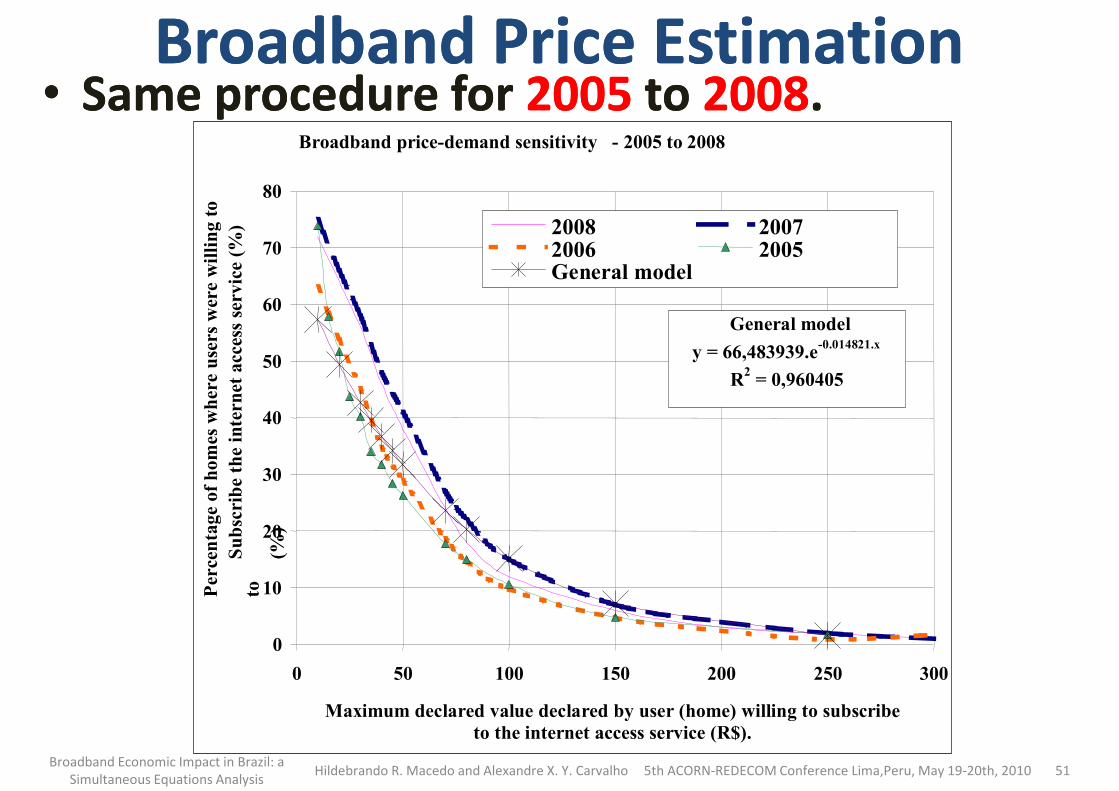
Broadband Price EstimationBroadband Price Estimation•• Same procedure for Same procedure for 20052005 to to 20082008..
Broadband price-demand sensitivity - 2005 to 2008
70
80 Per
centa
ge
of hom
es w
her
e use
rs w
ere
willing to
cces
s se
rvic
e (%
) 2008 20072006 2005General model
20
30
40
50
60
Per
centa
ge
of hom
es w
her
e use
rs w
ere
willing to
Subsc
ribe
the
inte
rnet
acc
ess se
rvic
e
General model
General model
y = 66,483939.e-0.014821.x
R2 = 0,960405
Broadband Economic Impact in Brazil: a
Simultaneous Equations AnalysisHildebrando R. Macedo and Alexandre X. Y. Carvalho 5th ACORN-REDECOM Conference Lima,Peru, May 19-20th, 2010 51
0
10
20
0 50 100 150 200 250 300
Maximum declared value declared by user (home) willing to subscribe
to the internet access service (R$).
Per
centa
ge
of hom
es w
her
e use
rs w
ere
willing to
to
Subsc
ribe
the
inte
rnet
(%)

Broadband Price EstimationBroadband Price Estimation
•• For For 2000 to 2004 2000 to 2004 used used 2005 2005 curve due lack of curve due lack of survey data for these years.survey data for these years.
•• The curves show a trend of being shifted as The curves show a trend of being shifted as •• The curves show a trend of being shifted as The curves show a trend of being shifted as the times goes by and broadband prices the times goes by and broadband prices decrease.decrease.
•• Despite its limitations, it allowed to have a Despite its limitations, it allowed to have a glimpse of the effect of the broadband price glimpse of the effect of the broadband price
Broadband Economic Impact in Brazil: a
Simultaneous Equations AnalysisHildebrando R. Macedo and Alexandre X. Y. Carvalho 5th ACORN-REDECOM Conference Lima,Peru, May 19-20th, 2010 52
glimpse of the effect of the broadband price glimpse of the effect of the broadband price on the demand for the service.on the demand for the service.
•• Other studies used the same approach Other studies used the same approach ((CoutinhoCoutinho, Acorn, Acorn--RedecomRedecom 20102010).).
Models UsedModels Used•• Analysis without broadband prices: Analysis without broadband prices: initial initial
analysis because lack of analysis because lack of reliablereliable broadband broadband price data.price data.
•• Analysis with estimated broadband prices:Analysis with estimated broadband prices:because the because the impactimpact of price in the demand / of price in the demand / supply of the service, it was necessary to find supply of the service, it was necessary to find a way to estimate approximated prices using a way to estimate approximated prices using
Broadband Economic Impact in Brazil: a
Simultaneous Equations AnalysisHildebrando R. Macedo and Alexandre X. Y. Carvalho 5th ACORN-REDECOM Conference Lima,Peru, May 19-20th, 2010 53
a way to estimate approximated prices using a way to estimate approximated prices using survey data from survey data from CETIC (CGI).CETIC (CGI).
•• Prices estimated from maximum declared Prices estimated from maximum declared values of users willing to subscribe internet values of users willing to subscribe internet access service. access service.

Models UsedModels Used•• Analysis without Analysis without educationeducation and and demographicdemographic
density variables: density variables: •• Excluded variables in the third type of model Excluded variables in the third type of model
because did not present the expected results:because did not present the expected results:because did not present the expected results:because did not present the expected results:•• When including When including priceprice, both , both education education and and
demographic density demographic density had negative impact on had negative impact on broadband density.broadband density.
•• Possible cause: Possible cause: priceprice has bigger impact when has bigger impact when compared to other variables compared to other variables (price elasticity in (price elasticity in
Broadband Economic Impact in Brazil: a
Simultaneous Equations AnalysisHildebrando R. Macedo and Alexandre X. Y. Carvalho 5th ACORN-REDECOM Conference Lima,Peru, May 19-20th, 2010 54
compared to other variables compared to other variables (price elasticity in (price elasticity in Brazil from Brazil from --1 1 toto --3,363,36, , Ávila (2008)Ávila (2008))), reducing the , reducing the importance of importance of educationeducation and and demographic densitydemographic densityin the model.in the model.

Simultaneous Equations Model: Simultaneous Equations Model: Main Results Main Results
•• Each Each 1 p.p. 1 p.p. increase in the increase in the broadband penetration is related to broadband penetration is related to broadband penetration is related to broadband penetration is related to a a GDP growth GDP growth in Brazil between in Brazil between 0.0380.038 to to 0,180,18 p.p. p.p.
•• EachEach1 p.p. 1 p.p. increase in the broadband increase in the broadband
Broadband Economic Impact in Brazil: a
Simultaneous Equations AnalysisHildebrando R. Macedo and Alexandre X. Y. Carvalho 5th ACORN-REDECOM Conference Lima,Peru, May 19-20th, 2010 55
•• EachEach1 p.p. 1 p.p. increase in the broadband increase in the broadband penetration is related to a penetration is related to a GDP per GDP per Capita growth Capita growth in Brazil between in Brazil between 0.1960.196 to to 0,3620,362 p.p.p.p.
Simultaneous Equations Model: Simultaneous Equations Model: Main Results Main Results
•• However it was not possible to establish However it was not possible to establish causality relation between increase of causality relation between increase of causality relation between increase of causality relation between increase of the Broadband Penetration and the Broadband Penetration and economic growth.economic growth.
•• For that it would be necessary other For that it would be necessary other approach using long term relationship approach using long term relationship
Broadband Economic Impact in Brazil: a
Simultaneous Equations AnalysisHildebrando R. Macedo and Alexandre X. Y. Carvalho 5th ACORN-REDECOM Conference Lima,Peru, May 19-20th, 2010 56
approach using long term relationship approach using long term relationship (long term time series and (long term time series and Granger Granger causality testcausality test))

Comparison with Other StudiesComparison with Other StudiesValues of Regression CoefficientsValues of Regression Coefficients
Earlier StudiesEarlier Studies This StudyThis Study
Dependent Dependent Variable Variable
Explaining Explaining VariablesVariables
World Bank World Bank ((QiangQiang et. al, et. al, 2009, p. 44)2009, p. 44)
Koutroumpis (2009, Koutroumpis (2009, p.478)p.478)
Simultaneous Equations Simultaneous Equations
Simultaneous Simultaneous Equations Equations
2009, p. 44)2009, p. 44) Simultaneous Equations Simultaneous Equations
GDPGDP BroadbandBroadbandPenetration Penetration (number of (number of
accesses accesses per per
0,012, 0,012, 0.023, 0.023,
0.025 and 0.025 and 0.2040.204
0.038, 0.038, 0.097,0.097,0.109 , 0.104, 0.109 , 0.104,
0.133 and 0.133 and 0.1800.180
0.1380.138
Broadband Economic Impact in Brazil: a
Simultaneous Equations AnalysisHildebrando R. Macedo and Alexandre X. Y. Carvalho 5th ACORN-REDECOM Conference Lima,Peru, May 19-20th, 2010 57
per per inhabitants)inhabitants)GDP per GDP per
CapitaCapita
0.1380.138(developing(developing
countriescountries))
0.121 0.121 (developed(developedcountriescountries))
0.196 , 0.196 , 0.203 ,0.203 ,0.238, 0.260,0.238, 0.260,
0.3210.321 and and 0.3620.362

Results: CommentsResults: Comments•• Other possible reasons:Other possible reasons:•• Differences in in the historical moment when Differences in in the historical moment when
broadband networks became available:broadband networks became available:•• Developed countries: Developed countries: arrived when they already had arrived when they already had •• Developed countries: Developed countries: arrived when they already had arrived when they already had
a good telecom infrastructure with well developed a good telecom infrastructure with well developed fixed line and mobile phone networks:fixed line and mobile phone networks:•• So broadband economic impact was diluted So broadband economic impact was diluted as just one as just one
more development increase factor, because those more development increase factor, because those countries already had reached high development levels. countries already had reached high development levels.
•• Developing countries:Developing countries: broadband networks became broadband networks became
Broadband Economic Impact in Brazil: a
Simultaneous Equations AnalysisHildebrando R. Macedo and Alexandre X. Y. Carvalho 5th ACORN-REDECOM Conference Lima,Peru, May 19-20th, 2010 58
•• Developing countries:Developing countries: broadband networks became broadband networks became an important instrument to boost development an important instrument to boost development (“catch up” effect):(“catch up” effect):•• Helping develop education areas and others.Helping develop education areas and others.

Key Message Key Message ••Despite all limitations of this study:Despite all limitations of this study:–– It was a It was a first attempt first attempt to make this kind of study to make this kind of study
for for BrazilBrazil. Expectation that it would . Expectation that it would “open the “open the gates” gates” to further and to further and more precise more precise studies, studies, gates” gates” to further and to further and more precise more precise studies, studies, overcoming the limitations overcoming the limitations and errors of this one.and errors of this one.
–– It is important that It is important that each country make an effort each country make an effort to develop its own broadband impact evaluation to develop its own broadband impact evaluation studiesstudies, instead of using estimations made for , instead of using estimations made for
Broadband Economic Impact in Brazil: a
Simultaneous Equations AnalysisHildebrando R. Macedo and Alexandre X. Y. Carvalho 5th ACORN-REDECOM Conference Lima,Peru, May 19-20th, 2010 59
studiesstudies, instead of using estimations made for , instead of using estimations made for other countries with different realities. other countries with different realities. –– You have to know your own reality in order to You have to know your own reality in order to
develop adequate solutions for the problems that develop adequate solutions for the problems that need to be addressed.need to be addressed.

Regression Results: CommentsRegression Results: Comments•• It may occur RIt may occur R22 < 0 in models without a constant < 0 in models without a constant
(intercept) and which are unable to explain properly the (intercept) and which are unable to explain properly the dependent variable.dependent variable.
� 2( )n
y y−∑
•• : sample value : sample value ii of explaining variable of explaining variable yy..•• : estimated values by the regression model.: estimated values by the regression model.
� 2
2 1
2
1
( )
1 1
( )
i i
i
n
i
i
y ySSR
RSST
y y
=
=
−= − = −
−
∑
∑
�iy
iy
Broadband Economic Impact in Brazil: a
Simultaneous Equations AnalysisHildebrando R. Macedo and Alexandre X. Y. Carvalho 5th ACORN-REDECOM Conference Lima,Peru, May 19-20th, 2010 60
•• : estimated values by the regression model.: estimated values by the regression model.•• : average of sample values.: average of sample values.
�iy
y
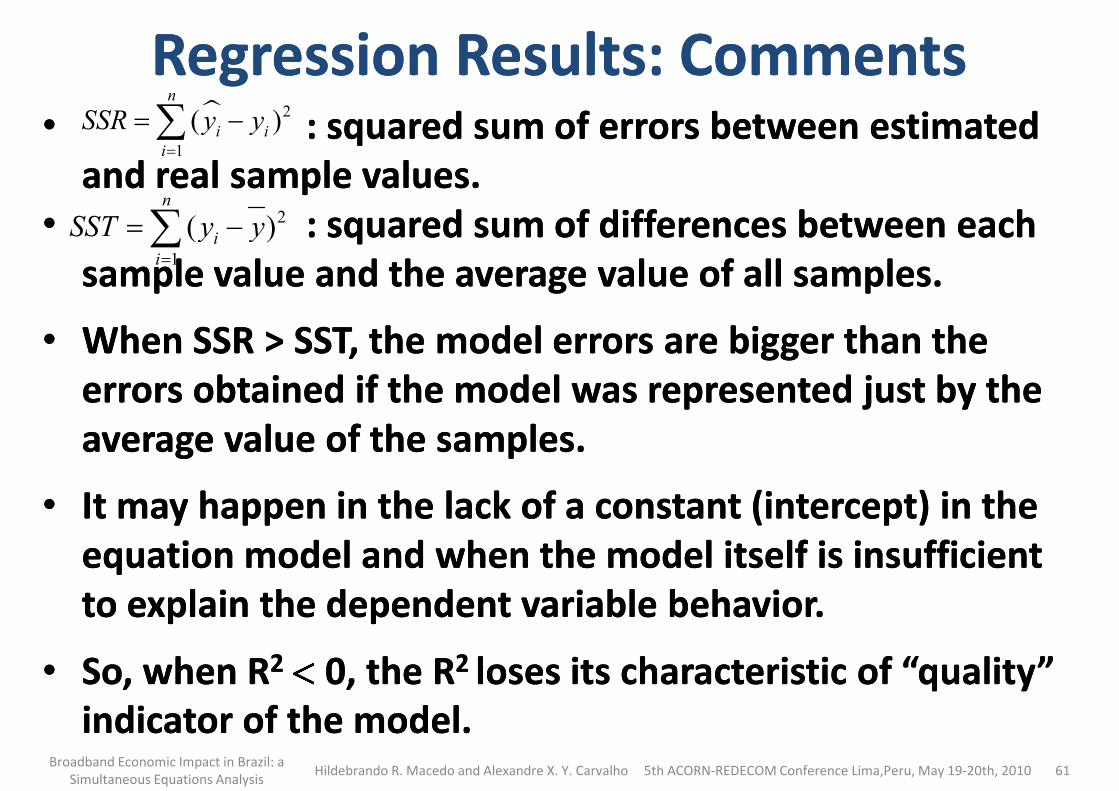
Regression Results: CommentsRegression Results: Comments•• : squared sum of errors between estimated : squared sum of errors between estimated
and real sample values. and real sample values. •• : squared sum of differences between each : squared sum of differences between each
sample value and the average value of all samples. sample value and the average value of all samples.
� 2
1
( )n
i i
i
SSR y y=
= −∑
2
1
( )n
i
i
SST y y=
= −∑sample value and the average value of all samples. sample value and the average value of all samples.
•• When SSR > SST, the model errors are bigger than the When SSR > SST, the model errors are bigger than the errors obtained if the model was represented just by the errors obtained if the model was represented just by the average value of the samples. average value of the samples.
•• It may happen in the lack of a constant (intercept) in the It may happen in the lack of a constant (intercept) in the
1i=
Broadband Economic Impact in Brazil: a
Simultaneous Equations AnalysisHildebrando R. Macedo and Alexandre X. Y. Carvalho 5th ACORN-REDECOM Conference Lima,Peru, May 19-20th, 2010 61
It may happen in the lack of a constant (intercept) in the It may happen in the lack of a constant (intercept) in the equation model and when the model itself is insufficient equation model and when the model itself is insufficient to explain the dependent variable behavior. to explain the dependent variable behavior.
•• So, when RSo, when R22 <<<<<<<< 0, the 0, the RR2 2 loses its characteristic of “quality” loses its characteristic of “quality” indicator of the model. indicator of the model.

0 .0
0 .5
1 .0
1 .5
2 .0
LO G (D E NS _ B _ L A RG _ U F /D E NS _ B _ L A RG _U F (-1 ) )
2
3
4
5
D E NS _ B _ L A RG _U F /D E NS _ B _ L A RG _U F (- 1 )
Broadband Infrastructure Production Function Broadband Infrastructure Production Function
( ) PBLtPBLPBL
t
t BBINVESTBBDENS
BBDENSεββ +⋅+=
−
_ln_
_ln 10
1
••Difficulty to Difficulty to match the model match the model
2 2 .0
2 2 .4
2 2 .8
2 3 .2
2 3 .6
LO G (IN V _ S E RV _ F IX )
2 2 .8
2 3 .0
2 3 .2
2 3 .4
2 3 .6
2 3 .8
2 4 .0
L OG (IN V _ TO T _ TE L E C OM )
-1 .0
-0 .5
0 .0
2 0 0 0 2 00 1 2 0 0 2 2 0 0 3 2 0 0 4 2 0 0 5 2 0 0 6 2 0 0 7 2 0 0 80
1
2 0 0 0 2 0 0 1 2 0 0 2 2 0 0 3 2 0 0 4 2 0 0 5 2 0 0 6 2 0 0 7 2 00 8
match the model match the model with real data.with real data.
••Lack of intercept.Lack of intercept.
Broadband Economic Impact in Brazil: a
Simultaneous Equations AnalysisHildebrando R. Macedo and Alexandre X. Y. Carvalho 5th ACORN-REDECOM Conference Lima,Peru, May 19-20th, 2010 62
2 2 .0
2 0 0 0 2 0 0 1 2 0 0 2 2 0 0 3 2 0 0 4 2 0 0 5 2 0 0 6 2 0 0 7 2 0 0 8
2 2 .8
2 0 0 0 2 0 0 1 2 00 2 2 0 0 3 2 0 0 4 2 0 0 5 2 0 0 6 2 0 0 7 2 0 0 8
2 1 .2
2 1 .4
2 1 .6
2 1 .8
2 2 .0
2 2 .2
2 2 .4
2 2 .6
2 0 0 0 2 0 0 1 2 0 0 2 2 0 0 3 2 0 0 4 2 0 0 5 2 0 0 6 2 0 0 7 2 0 0 8
LO G (IN V E S T_ S C M )••That lead toThat lead toRR22 < 0< 0