Embed Size (px)
Citation preview

Broad-scale researchon jellyfish
Jennifer E. Purcell
Shannon Point Marine CenterWestern Washington UniversityUSA

Jellyfish usually aresampled at small scales

Large-scale problems with jellyfish require large-scale methods, which
require approximationSeaWIFS Chl a
My objective here is to recommend sampling methods for jellyfish research on large- scales

Fisheries & Aquaculture•Brodeur et al. (2008) Prog Oceanogr 77: 103-111•Uye (2008) Plankton & Benthos Res 3 (Suppl): 125-131•Doyle et al. (2008) J Plankton Res 30: 963-968
This session•15:50 Brodeur et al.

Brodeur et al. (2008) Prog Oceanogr 77: 103-111
Fisheries surveys•356 stations•1975-present
Year1975 1980 1985 1990 1995 2000 2005
Bio
mas
s In
dex
(thou
sand
mt)
0
50
100
150
200
250
300
350
Entire survey areaSE Middle ShelfNW Middle Shelf
156 W162 168 174 180 54
56
58
60
62
64 N
SE Middle Shelf
NW Middle Shelf
Pribilof
Islands
Bristol
Bay
Photo by K. Raskoff
Bering Sea

(http://www.ananova.com/)
Bloom years of the giant jellyfish,Nemopilema nomurai
(maximum bell diameter 2 m and wet weight >200 kg)
2000
1920 1958 199520062005
19501900
2003 20072009
2002

Nemopilema nomurai medusae entrapped in set-nets along Japanese coast
October, 2005Data archived by Japan Fisheries Information Service Center (JAFIC)
Uye (2008) Plankton & Benthos Res 3 (Suppl): 125-131
500~100~50010~1001~10
Medusae/set-net/d

Pelagia noctiluca kills salmon in aquaculture pens in Ireland and Scotland
2007 Pelagia killed salmon in pens
•>500,000 stranded on 1 beach•Recorded ~25 of 100 years
Doyle et al. (2008) J Plankton Res 30: 963-968

Fisheries survey summary
Problems• Sampling is not
designed for jellyfish
• Requires cooperation (extra cost and effort)
Advantages• Logistics provided• Semi-quantitative• Large temporal
and spatial scales

Aerial surveys•Purcell et al. (2000) Mar Ecol Prog Ser 195: 145-158•Houghton et al. (2006) Mar Ecol Prog Ser 314: 159-170•Crawford et al. (in press) Mar Biol
This session•16:05 Fujii et al.

Aggregations of Aurelia labiata in Alaska
1995 1996 1997
94 493 28
1998 = 770
Purcell et al. (2000) Mar Ecol Prog Ser 195: 145-158Aerial surveys

152m
250m50m 50m250m
Houghton et al. (2006)Mar Ecol Prog Ser314: 159-170
Aerial surveys
Irish Sea
152m
250m50m 50m250m
Houghton et al. (2006)Mar Ecol Prog Ser314: 159-170
Aerial surveys
Irish Sea

5 min
mid-point
land land
land
(b)
(a)
mid-point
5 mins @ 100 knots (15.4 km)
Aerial surveys

Rhizostoma octopus
Quantitative data
Chrysaora hysoscellaCyanea capillata
Qualitative data
Ireland
Wales
51
55
52
53
54
Lati
tude
(o N
)-9 -8 -7 -6 -5 -4 -3 -2 -8 -7 -6 -5 -4 -3 -2-9
Ireland
Wales
England England
Aerial surveys

Aerial survey summary
Problems• Only at surface• Should be
calibrated against net tows
Advantages• Inexpensive• Large spatial scale
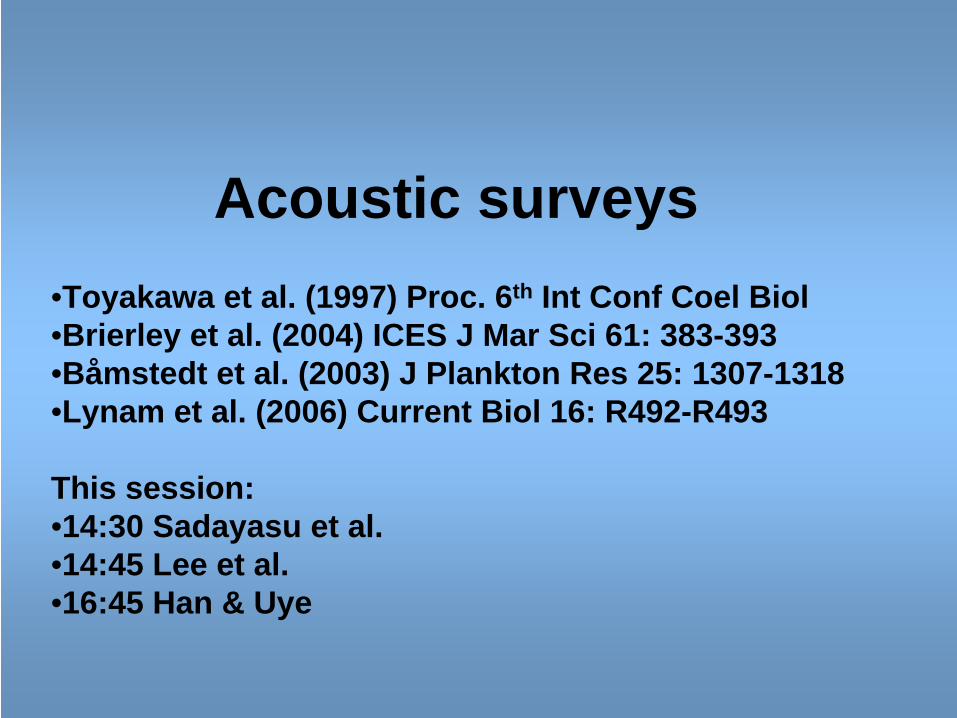
Acoustic surveys•Toyakawa et al. (1997) Proc. 6th Int Conf Coel Biol•Brierley et al. (2004) ICES J Mar Sci 61: 383-393•Båmstedt et al. (2003) J Plankton Res 25: 1307-1318•Lynam et al. (2006) Current Biol 16: R492-R493
This session:•14:30 Sadayasu et al.•14:45 Lee et al.•16:45 Han & Uye

Acoustic Båmstedt et al. (2003) J Plank Res 25:1307-1318
Quantitative with Individual targets
Net, small
Net, large
Sonar ROV

Fishing reduced anchovy and sardines competitors for zooplankton in Namibian Benguela Current
Jellyfish overtake fish in a heavily fished ecosystem
Fish catchLynam et al. (2006) Current Biol 16: R492-R493


Acoustic survey summary
Problems• Requires ships• Should be
calibrated against net tows
Advantages• Quantitative for
large jellyfish• Used for fish

UW camera surveys•Graham et al. (2003) Mar Ecol Prog Ser 254: 129-140•Båmstedt et al. (2003) J Plankton Res 25: 1307-1318
This session•15:15 Ishii et al.

Towed UW PhotographyGraham et al. (2003) Mar Ecol Prog Ser 254: 129-140
Densities of jelliesTemp, sal, DO, ChlDepth

Spatial and depth distributions relative to physical factorsGraham et al. (2003)
Salinity Density
Temperature Current vel.
Pelagia Orientation
Distance (m)
Chl
Pela
gia

Comparison of jellyfish densities by video and trawl
Graham et al. (2003) Mar Ecol Prog Ser 254: 129-140

UW camera survey summary
Problems• Requires ships• Should be
calibrated against net tows
Advantages• Quantitative

Ships of opportunity surveysFerries•Sparks et al. (2001) Hydrobiologia 451: 275-286•Doyle et al. (2007) Hydrobiologia 579: 29-39
CPR (Continuous Plankton Recorder)•Attrill et al. (2007) Limnol Oceanogr 52: 480-485•Gibbons & Richardson (2009) Hydrobiologia 616: 51-65•Baxter et al. (submitted)
This session:15:15 Ikeda et al.

Doyle et al. (2007) Hydrobiologia579: 29-39
Ships of Opportunity
•Categories of abundance in 5-min intervals•Accounted for wind and glare
Force 1
Force 1
Force 4
Force 2
Force 3 Force 4
Distance (m) Distance (m)

Jellyfish per 1000m2
Results of ferry surveys
Chrysaora hysoscella
Doyle et al. (2007) Hydrobiologia 579: 29-39
Transect routes

Gibbons & Richardson (2009) Hydrobiologia 616: 51-65Ships of Opportunity CPR nematocysts
CPR survey area in North AtlanticKinds of
cnidariansunknown
•CPR survey in North Pacific (Batten et al.)•CPR survey in South Pacific (Richardson)

Cruise and CPR survey coincided in N AtlanticPelagia noctiluca nematocysts identified on CPR samples Baxter et al. (submitted)Molecular analyses in progress

Ships of Opportunity survey summary
Problems• Only at surface• Should be calibrated
against net tows• Requires cooperation• CPR not quantitative
for jellyfish
Advantages• Logistics provided• Large temporal and
spatial scales, frequent

Shore-based surveys• Bernard et al. (1988) Ann Inst Oceangr Paris 64: 115-125• Cargo & King (1990) Estuaries 13: 486-491• Doyle et al. (2007) Hydrobiologia 579: 29-39• Fuentes et al. NW Mediterranean coast of Spain
• This session• 16:05 Fujii et al.

Jellyfish
blooms
on
the
Spanish Mediterranean
Coast
Verónica
Fuentes, Dacha Atienza, Josep‐Maria Gili, Uxue
Tilves, Alejandro Olariaga
and William Silvert
Medusa project ICM-ACA

Rhizostoma pulmo
Aequorea forskaleaCotylorhiza tuberculata
Pelagia noctiluca
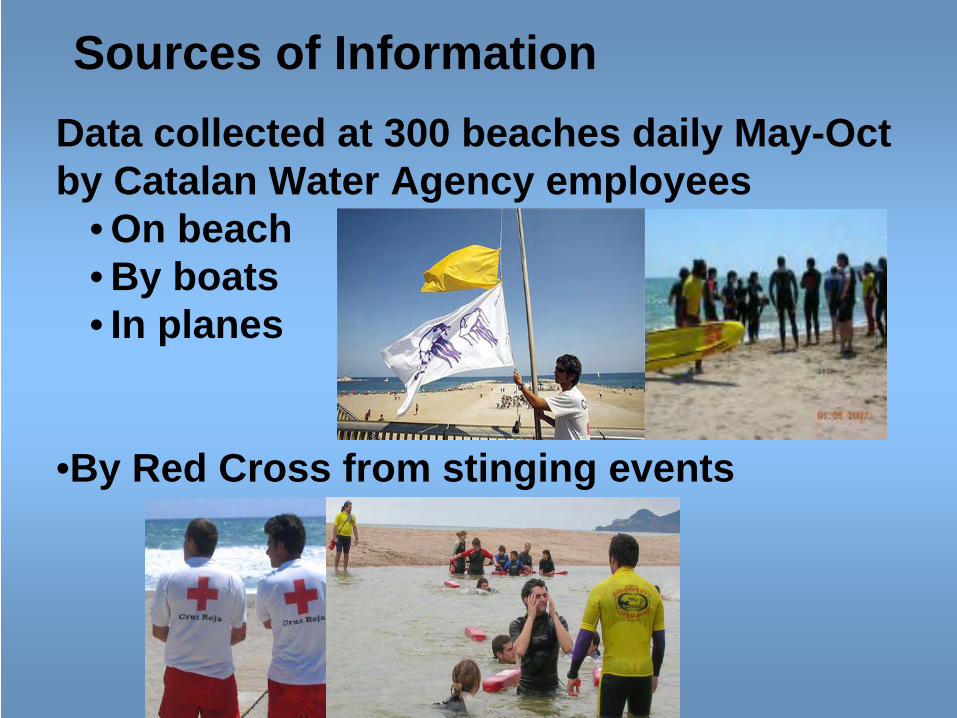
Data collected at 300 beaches daily May-Octby Catalan Water Agency employees
• On beach• By boats• In planes
•By Red Cross from stinging events
Sources of Information

Data collectionIDENTIFICATION GUIDE

Data collection
To be completedwhen jellyfish are
observed
None Few
Many
By species
Abundance categories

MUNICIPIS
####
####
####
####
####
####
####
####
####
####
####
####
####
####
####
####
####
####
####
####
####
####
####
####
####
####
####
####
####
####
####
####
1-Ju
n-09
2-Ju
n-09
3-Ju
n-09
4-Ju
n-09
5-Ju
n-09
6-Ju
n-09
7-Ju
n-09
8-Ju
n-09
9-Ju
n-09
10-J
un-0
9
11-J
un-0
9
12-J
un-0
9
13-J
un-0
9
14-J
un-0
9
15-J
un-0
9
16-J
un-0
9
17-J
un-0
9
18-J
un-0
9
Observations per day Nº 0 6 0 0 45 51 0 30 14 0 33 0 62 46 38 8 0 33 9 19 19 45 3 0 25 4 14 20 24 8 0 5 13 18 23
PORTBOUCOLERA 1 1LLANÇA 1 1 1PORT DE LA SELVA, EL 2 2 1 1 1 1 1 1 1CADAQUESROSES 1 2 1 1 1 1 1 1 1 1 1 1 1CASTELLO D'EMPURIES 1 2 1 1 1 1 2SANT PERE PESCADOR 1 1ESCALA, L' 2TORROELLA DE MONTGRI 2 2 1 2 1 2 1PALS 1 1 1SEGUR 1 2 1 3 1 3 3 1 1 1 1 1PALAFRUGELL 2 2 1 3 2 1 2 1 1 1 1 3 3 1 1MONT-RAS 1PALAMOS 3 1 1 1 1 1 1 1 1 3 1CALONGE 2 2 1 1 1 1 1 1 1 1 1 1 1CASTELL-PLATJA D'ARO 1 1SANT FELIU DE GUÍXOLS 2 1 1SANTA CRISTINA D'AROTOSSA DE MAR 1 1 1 1LLORET DE MAR 1 1 2 1 1 1BLANES 1 1MALGRAT DE MAR 2 3 1 1 1 1 2SANTA SUSANNA 2 1 1PINEDA DE MAR 2 1 1 1 1 2 3CALELLA 2 1 1 1 1 1SANT POL DE MAR 1 1 1 1 2 3CANET DE MAR 1 1ARENYS DE MAR 1CALDES D'ESTRACSANT VICENÇ DE MONTALTST ANDREU LLAVANERES 1MATARO 1CABRERA DE MARVILASSAR DE MAR 1 1PREMIA DE MAR 2 1MASNOU, EL 2 2MONTGAT 2 1 2BADALONA 3 1SANT ADRIA DEL BESOS 1BARCELONA 2 2 1 1PRAT DE LLOBREGAT, EL 1 1VILADECANS 1 1 1 1GAVA 1 1 1 1 1 1 1CASTELLDEFELS 1 1 1 1 1SITGES 1 1 1 1 3VILANOVA I LA GELTRÚ 1 1 1 1 1 1 1CUBELLES 1 1 1 1CUNIT 2 1CALAFELL 1 1 3 3 2 1 1 1 1 2VENDRELL, EL 1 1 3 2 1 1 1 2RODA DE BARA 1 2 2 1 1 1CREIXELL 1 1 3 1 1TORRE DE MBARRA 2 1 1 3 1 1 1 1ALTAFULLA 1 2TARRAGONA 2 1 1 1 1 2 1 1 1VILA-SECA 1 1 1 1 1 1SALOU 1 2 1 1 1 1 1 1 1 1 1CAMBRILS 2 1 1 1 1MONT-ROIG DEL CAMP 1 1 1 1 1VAND.I L'HOSP. L'INFANT 3 1 1 1AMETLLA DE MAR, L' 3 3 1 2 1 2 2 2 1 1 1 2 1 1 1PERELLO, EL 1 2AMPOLLA, L' 1DELTEBRE 1 1 1 1 1 1

Interannual variabilityData from 2000 to present
Observations adjusted by the total number of Inspections
From surveys get patterns of relative abundance, distribution, correlated with environmental data

Shore-based survey summary
Problems• Not quantitative• Should be
calibrated against net tows
• Requires cooperation
Advantages• Low cost• Large areas• Frequent, long
term

Predictive modeling relies on data from previous methods• Goy et al. (1989) Deep-Sea Res 36: 269-279• Cargo & King (1990) Estuaries 13: 486-491• Decker et al. (2007) Mar Ecol Prog Ser 329: 99-113• Brodeur et al. (2008) Prog Oceanogr 77: 103-111• Gibbons & Richardson (2009) Hydrobiologia 616: 51-65
• This session• 17:00 Okuno et al.

Ships of Opportunity (CPR) and modeling
Gibbons & Richardson (2009) Hydrobiologia 616: 51-65
Jellyfish in North Atlantic•Observed in CPR•Predicted by multiple regression with SST and zooplankton as predictors

Large-scale methods summary• General problems
– May not be quantitative – May rely on non-scientific partners– Useful only for large species
But there are now recognized approximately:• 190 species of scyphomedusae (Arai 1997)• 20 species of cubomedusae (Mianzan & Cornelius1999)• 840 species of hydromedusae (Boullion & Boero 2000)• 200 species of siphonophores (Pugh 1999)• 150 species of ctenophores (Mianzan 1999)
• General advantages– Not time-consuming– Inexpensive or partners provide logistics– Long duration of records

Recommendations• For non-quantitative patterns of spatial
and temporal abundance, these large- scale methods can be used to monitor jellyfish populations
• For ecological effects we also need to:– Calibrate large-scale methods against
quantitative methods– Determine numbers and biomass– Estimate trophic importance

Large-scale methods to estimate trophic effects
• Respiration rates of scyphomedusae scale 1:1 with mass and can be used to estimate metabolic demands– Purcell (2009) Hydrobiologia 616: 623-650 – Purcell et al. (in revision)

Log10 medusa mass (g C)
-4 -3 -2 -1 0 1 2
Log 10
resp
iratio
n ra
te (m
l O2 m
edus
a-1 d
-1)
-2
0
2
4AureliaCyaneaChrysaoraPelagiaPhacellophoraNemopilemaCatostylusStomolophusMastigiasCassiopeaLinuchePeriphyllafrom Purcell (2009)Rhizostoma
Respiration rates of scyphomedusae and trophic needs can be calculated from mean
size
Purcell (2009) Hydrobiologia 616: 623-650; Purcell et al. (in revision)

Respiration:1000 mg C d-1
Feeding pressure of Nemopilema nomurai population on mesozooplankton
Mean size:3 kg WW = 18 g C
Abundance: 2.5 medusae 1000 m-3
Mesozooplankton biomass: 10 mg C m-3
25% of zooplankton biomass consumed d-1
Modified from Uye (2008) Plankton & Benthos Res 3 (Suppl): 125-131

Large-scale method for trophic effects
Electron-transport system (ETS) method permits in situ estimation of respiration demand
Owens & King (1975) Mar Biol 30: 27-36 Båmstedt (2000) J Exp Mar Biol Ecol 251: 239-263

With combinations of methods we will get the most
information about jellyfish populations
Thank you!