Embed Size (px)
Citation preview
Philosophical MagazineVol. 88, Nos. 28–29, 1–11 October 2008, 3245–3263
Brittle fracture during folding of rocks: A finite element study
P. Jagera, S.M. Schmalholzb, D.W. Schmidc and E. Kuhld*
aDepartment of Mechanical Engineering, University of Kaiserslautern, Kaiserslautern, Germany;bGeological Institute, ETH Zurich, Zurich, Switzerland; cPhysics of Geological Processes,
University of Oslo, Oslo, Norway; dDepartment of Mechanical Engineering, Stanford University,Stanford, USA
(Received 31 December 2007; final version received 26 June 2008)
The goal of the present work is the development of a novel computationalanalysis tool to elaborate folding-induced fracture of geological structures.Discrete failure of brittle rocks is characterised by three sets of governingequations: the bulk problem, the interface problem and the crack problem.The former two sets which define the deformation field are highly nonlinear andstrongly coupled. They are solved iteratively within a Hansbo-type finite elementsetting. The latter set defines the crack kinematics. It is linear and solved ina single post-processing step. To elaborate the features of the computationalalgorithm, we define a unique benchmark problem of a single, geometricallynonlinear plate, which is subjected to layer-parallel in-plane compressioncombined with different levels of superposed in-plane shear. The resultingfolding, or buckling, induces brittle failure in the tensile regime. By systematicallyincreasing the shear strain at constant compression, we develop crack deviationangle versus shear-to-compression ratio tables. We determine the correspondingdamage zones, analyse the folding modes and elaborate the force versusamplification diagrams. The proposed two-field folding-induced fracture algo-rithm can ultimately be applied to interpret natural folded rocks and understandtheir evolution, structural development and histology.
Keywords: geophysics; rock mechanics; fracture; folding; finite element method
1. Fold-fracture relationships in rocks
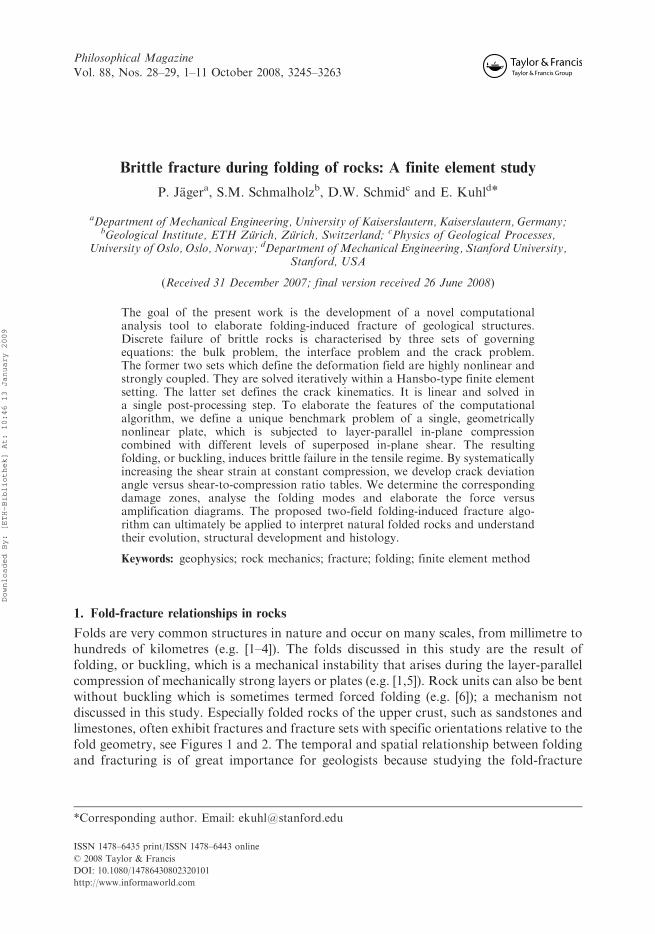
Folds are very common structures in nature and occur on many scales, from millimetre tohundreds of kilometres (e.g. [1–4]). The folds discussed in this study are the result offolding, or buckling, which is a mechanical instability that arises during the layer-parallelcompression of mechanically strong layers or plates (e.g. [1,5]). Rock units can also be bentwithout buckling which is sometimes termed forced folding (e.g. [6]); a mechanism notdiscussed in this study. Especially folded rocks of the upper crust, such as sandstones andlimestones, often exhibit fractures and fracture sets with specific orientations relative to thefold geometry, see Figures 1 and 2. The temporal and spatial relationship between foldingand fracturing is of great importance for geologists because studying the fold-fracture
*Corresponding author. Email: [email protected]
ISSN 1478–6435 print/ISSN 1478–6443 online
� 2008 Taylor & Francis
DOI: 10.1080/14786430802320101
http://www.informaworld.com
Downloaded By: [ETH-Bibliothek] At: 10:46 13 January 2009
relationships improves the understanding of their formation mechanism and allowspredicting fracture orientations and fracture densities in natural folded rocks (e.g. [2,6–9]).These predictions are particularly important for industrial applications such as ground-water and hydrocarbon flow because fractures control the permeability of rock units(e.g. [7,10]).
Usually, there are several fracture sets with different orientations around folded uppercrustal rocks and it is often difficult to determine which fracture sets are related to thefolding and which are not (e.g. [2]). Therefore, a main question for field geologists studyingfold-fracture relationships is to determine if the fractures in the folded rocks have formedbefore, during or after folding. Fractures that formed before folding are not related to thecharacteristic stress field caused by folding but may have introduced some anisotropy inthe folded rocks (e.g. [7,10]). Fractures that formed after folding during, for example, theuplift and exhumation of the folded rocks may have orientations completely unrelated tothe stress field during folding. However, fractures that formed during folding are expected
Figure 1. Left: Folded sandstone layer embedded in shale, south-west Portugal. Wedge-shapeddilational fractures filled with quartz are visible at the outer part of the fold hinge. Right: Contourplot of stress during simulation of faulting and fracturing.
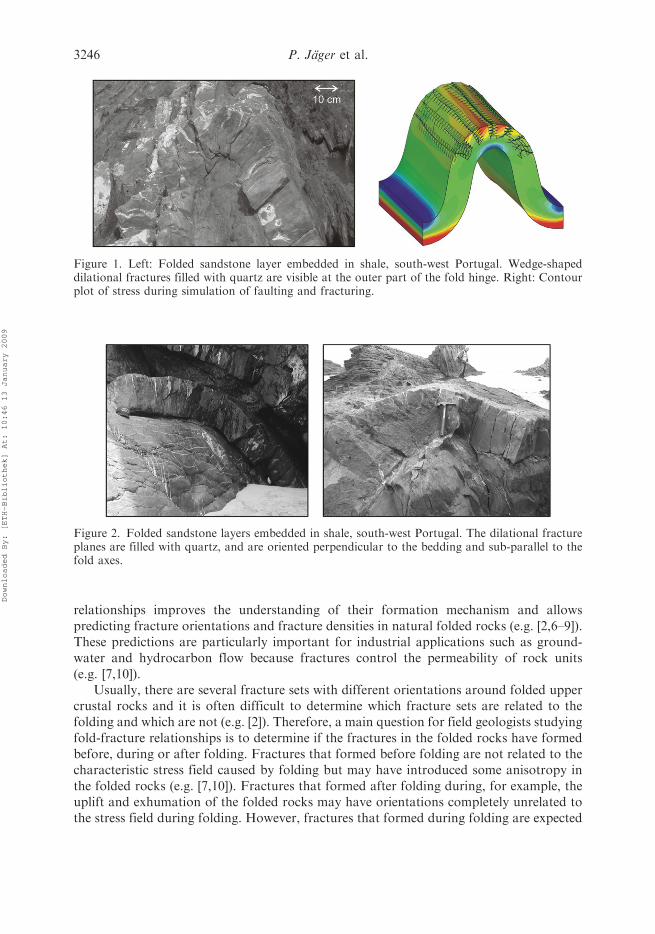
Figure 2. Folded sandstone layers embedded in shale, south-west Portugal. The dilational fractureplanes are filled with quartz, and are oriented perpendicular to the bedding and sub-parallel to thefold axes.
3246 P. Jager et al.
Downloaded By: [ETH-Bibliothek] At: 10:46 13 January 2009
to show orientations that are related to the stress field caused by folding. The fractureorientations that form during folding can be predicted for simple folding scenarios(e.g. [2,11]). For example, the two most common dilational fracture sets related to foldingare expected to be both perpendicular to the bedding but either parallel or orthogonal tothe fold axes (e.g. [2]; see Figure 2). Folding controls not only the orientation of syn-folding fractures but also the type of these fractures (e.g. [2,11]). There are twofundamental types of fractures: dilational fractures (also termed extension fractures orjoints) and shear fractures (also termed faults, e.g. [12]). Both fracture types can begenerated during folding.
In this study, the development of fractures during folding of an elastic plate isnumerically simulated in three dimensions. Since no previous numerical studies exist forthis problem, a relatively simple model setup is chosen here: (i) the folded plate is free andnot embedded in a mechanically weaker medium, (ii) the rheology is purely elastic, (iii) theplate is initially homogeneous and isotropic and no initial fractures exist, and (iv) onlydilational fractures are considered using the Rankine criterion.
Although the fold-fracture relationship is important for geologists, there are nonumerical models that satisfactorily simulate simultaneous fractures during folding ofelastic rocks. One reason presumably is that while folding of an elastic plate is relativelyeasy to model numerically, fracturing is not. The discontinuous nature of the fractureprocess typically prohibits the application of classical continuum mechanics concepts andstandard finite element based solution techniques. Provided the location of the failuresurface is a priori known, interface elements can be introduced locally and fracture cantake place at predefined locations between the elements. Arbitrary geological failure zones,however, should not be restricted to inter-element boundaries. They should be able to runright through the elements. Accordingly, discontinuous finite element shape functions haveto be introduced. The underlying concept, the celebrated extended finite element method,has only been developed within the last decade (see [13–15]). Within this article, we applya technique that is somewhat similar to the extended finite element method. As such, it canbe understood as a re-parameterization of the extended finite element method in the sensethat it uses only displacement degrees of freedom. This technique was initially developedfor elastic fracture at small deformations (see [16,17]) and recently extended to largedeformations in a fully three-dimensional setting (see [18–20]). Roughly speaking, weintroduce a discontinuity surface and double the degrees of freedom in every element thatis identified to fail. The displacement field is then interpolated independently of both sidesof this discontinuity.
The method itself is extremely elegant and straightforward to implement. Whensimulating three-dimensional failure, however, an additional level of complexity arises forboth the classical extended finite element method and the method chosen herein: thegeometric representation of a smooth three-dimensional failure surface is extremelycumbersome from a computational point of view. Different strategies have been suggestedto solve this problem with either local or non-local crack tracking algorithms (e.g. [21,22]).Here, we suggest a fully global crack tracking algorithm based on the introduction ofadditional global degrees of freedom that ensure the smoothness of the newly generatedfailure surface (see [18,23]).
The main aims of this study are (i) to present a numerical algorithm that can simulatethe simultaneous processes of fracturing and folding in a self-consistent way, (ii) toquantify the temporal evolution of dilational fractures during folding, (iii) to quantify the
Philosophical Magazine 3247
Downloaded By: [ETH-Bibliothek] At: 10:46 13 January 2009
spatial orientation of fractures during folding, (iv) to quantify the impact of layer-parallel
shearing, or rather wrenching, on the temporal and spatial formation of fractures, (v) to
quantify the impact of fractures on the fold amplification, and (vi) to present a first
numerical study for folding controlled fracturing which can be elaborated for more
sophisticated practical geological applications in the future. Accordingly, the paper is
organised as follows: Section 2 summarises the three sets of governing equations for
fracture in folding rocks. In Section 3, we then briefly illustrate the finite element based
numerical algorithm embedded in a staggered solution for the potentially discontinuous
deformation field and the scalar-valued crack isosurfaces. We then define a unique
benchmark problem of a single-layered folding plate and study the six above-mentioned
aspects in Section 4. The paper concludes with a final discussion in Section 5.
2. Continuum mechanics equations for fracture in folding rocks
The folding algorithm we will describe in this section is essentially governed by three sets of
equations: the elastic bulk problem, the cohesive interface problem and the crack tracking
problem. The elastic bulk problem and the crack tracking problem are valid in the entire
domain B, whereas the cohesive interface problem is valid only on the discontinuity �.
Since the extension to multiple discontinuities is straightforward, we restrict the
description to one single discontinuity in the sequel. First, we will briefly summarise the
corresponding continuous field equations for each of the three problems. Next, we derive
their discrete counterpart and illustrate a numerical method to solve them within a finite
element framework.
2.1. The bulk problem
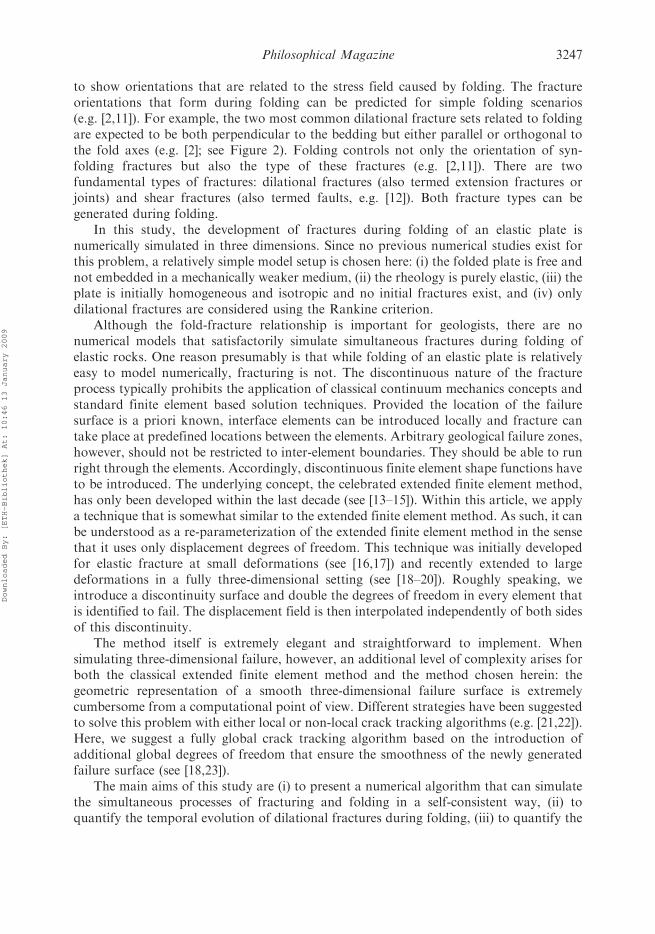
Let us first characterise the elastic bulk behaviour in the body B, which we assume to be
crossed by a discontinuity �. On each side of this discontinuity, i.e. on Bþ and B�, we
introduce an independent set of deformation maps w which maps particles from their
original position X in the reference configuration B to their current position x in the
deformed configuration S, as illustrated in Figure 3.
uðX Þ :¼uþðX Þ
u�ðX Þ
�F ¼
Fþ ¼ rXuþ 8X 2 Bþ
F� ¼ rXu� 8X 2 B�
�ð1Þ
Accordingly, we can introduce independent deformation gradients Fþ and F� and corres-
ponding Jacobians Jþ¼ det(Fþ) and J�¼ det(F�) on either side of the discontinuity.
Figure 3. Elastic bulk problem. Independent mappings wþ and w� on both sides Bþ and B� of thediscontinuity � inherently introduce a jump [u] in the deformation field.
3248 P. Jager et al.
Downloaded By: [ETH-Bibliothek] At: 10:46 13 January 2009
In the absence of body forces and inertia terms, the equilibrium equation reduces to the
vanishing divergence of the Piola stress P, which can be stated independently in both
subdomains Bþ and B�:
Div ðPÞ ¼ 0 8X 2 Bþ [ B�: ð2Þ
On the external boundary @B, which can be subdivided into disjoint parts @B¼ @Bu[ @Btwith @Bu\ @Bt¼ ø, either Dirichlet boundary conditions u¼ u P or Neumann boundary
conditions, P �N¼T P can be prescribed in terms of given displacements up or given surface
tractions T P. We assume a compressible elastic constitutive behaviour of neo-Hookean
type inside the bulk. Accordingly, the Cauchy stress p can be expressed in terms of the
Lame parameters � and �. The Cauchy stress p can be related to the Piola stress P through
Nanson’s formula. In general, these stresses can take different values on both sides of the
discontinuity Bþ and B�:
P ¼ Jr � F�t r ¼ 1J ½� ln ðJ ÞI� �Iþ �F � F
t� 8X 2 Bþ [ B�: ð3Þ
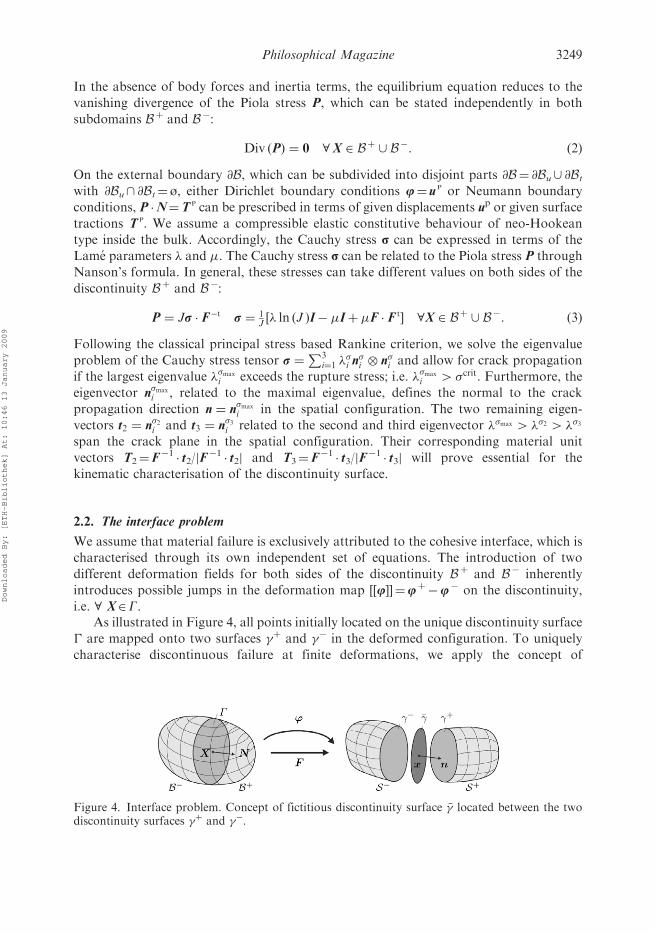
Following the classical principal stress based Rankine criterion, we solve the eigenvalue
problem of the Cauchy stress tensor r ¼P3
i¼1 ��i n�i � n�i and allow for crack propagation
if the largest eigenvalue ��max
i exceeds the rupture stress; i.e. ��max
i 4 �crit. Furthermore, the
eigenvector n�max
i , related to the maximal eigenvalue, defines the normal to the crack
propagation direction n ¼ n�max
i in the spatial configuration. The two remaining eigen-
vectors t2 ¼ n�2i and t3 ¼ n�3i related to the second and third eigenvector ��max 4 ��2 4 ��3
span the crack plane in the spatial configuration. Their corresponding material unit
vectors T2¼F�1 � t2/jF�1� t2j and T3¼F�1 � t3/jF
�1� t3j will prove essential for the
kinematic characterisation of the discontinuity surface.
2.2. The interface problem
We assume that material failure is exclusively attributed to the cohesive interface, which is
characterised through its own independent set of equations. The introduction of two
different deformation fields for both sides of the discontinuity Bþ and B� inherently
introduces possible jumps in the deformation map [[u]]¼uþ�u� on the discontinuity,
i.e. 8 X2G.As illustrated in Figure 4, all points initially located on the unique discontinuity surface
� are mapped onto two surfaces �þ and �� in the deformed configuration. To uniquely
characterise discontinuous failure at finite deformations, we apply the concept of
Figure 4. Interface problem. Concept of fictitious discontinuity surface �� located between the twodiscontinuity surfaces �þ and ��.
Philosophical Magazine 3249
Downloaded By: [ETH-Bibliothek] At: 10:46 13 January 2009
a fictitious discontinuity �u, which is assumed to be located between the two discontinuity
surfaces �þ and �� in the deformed configuration:
�u :¼ 12 ½u
þ þ u�� �F ¼ 12½Fþ þ F�� 8X 2 G: ð4Þ
Again, the corresponding deformation gradient �F and its Jacobian �J ¼ det ð �F Þ follow
straightforwardly. The normal vector �n to the fictitious discontinuity can then be expressed
through the classical Nanson formula as �n ¼ �J �F�t �N. On the internal boundary � (i.e.
along the fictitious discontinuity) the equilibrium condition,
Pþ �N ¼ P� �N ¼ �T 8X 2 G, ð5Þ
states that tractions �T acting on the discontinuity have to be equal in direction and
magnitude, however, taking the opposite sign, compare Figure 4. Similar to the Cauchy
stresses p in the bulk, the Cauchy tractions �t on the fictitious discontinuity can be related
to the tractions �T on the undeformed domain through Nanson’s formula in terms of the
area elements da and dA. This presented approach is designated for arbitrary cohesive
traction separation laws. For the sake of simplicity, we account for instantaneous brittle
failure without any further cohesive resistance. However, to avoid penetration of the crack
surfaces during the faulting process, we use the following linear traction separation
relation:
�T ¼da
dA�t �t ¼ �
E int
h el½½’n�� �n: ð6Þ
Here, E int represents the interface stiffness, hel is the characteristic element size, and � is
a dimensionless parameter that takes the interpretation of a penetration penalty. In detail,
we set �¼ 0 in case of interface tension (i.e. for ½½un�� ¼ ½½u�� � �n � 0) when the normal
projection of the deformation jump is non-negative. In the case of interface compression
(i.e. for ½½un�� ¼ ½½u�� � �n5 0) however, we penalise penetration by choosing �4 0.
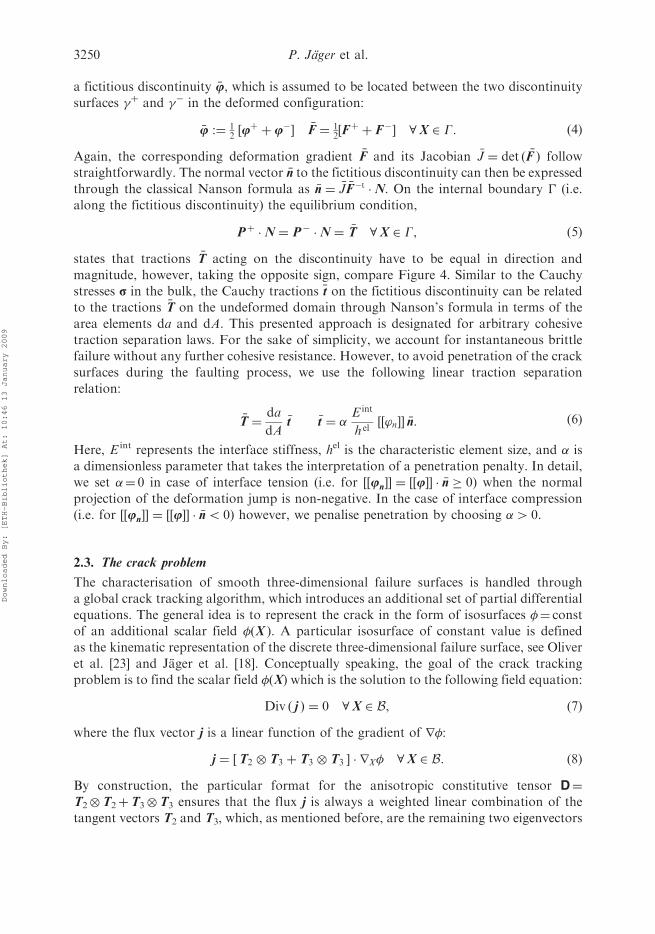
2.3. The crack problem
The characterisation of smooth three-dimensional failure surfaces is handled through
a global crack tracking algorithm, which introduces an additional set of partial differential
equations. The general idea is to represent the crack in the form of isosurfaces �¼ const
of an additional scalar field �(X ). A particular isosurface of constant value is defined
as the kinematic representation of the discrete three-dimensional failure surface, see Oliver
et al. [23] and Jager et al. [18]. Conceptually speaking, the goal of the crack tracking
problem is to find the scalar field �(X) which is the solution to the following field equation:
Div ð j Þ ¼ 0 8X 2 B, ð7Þ
where the flux vector j is a linear function of the gradient of r�:
j ¼ ½T2 � T3 þ T3 � T3 � � rX� 8X 2 B: ð8Þ
By construction, the particular format for the anisotropic constitutive tensor D¼T2�T2þT3�T3 ensures that the flux j is always a weighted linear combination of the
tangent vectors T2 and T3, which, as mentioned before, are the remaining two eigenvectors
3250 P. Jager et al.
Downloaded By: [ETH-Bibliothek] At: 10:46 13 January 2009
of the Rankine criterion in the reference configuration. Since the anisotropy tensor D isrank deficient, we apply slight perturbations " as D¼T2�T2þT3�T3þ "I to ensure thatthe overall system is solvable. The problem of finding isosurfaces �¼ const is obviouslya classical boundary value problem in terms of the field �(X ) characterised through ananisotropic Laplace equation. On the boundary @B, which can be subdivided into disjointparts @B¼ @B�[ @Bj with @B�\ @Bj¼ø, either Dirichlet boundary conditions /¼/p orNeumann boundary conditions j �N¼ j p can be prescribed.
The successful representation of cracks crucially relies on the identification ofa particular isosurface �¼ const as discrete failure surface. In general, there are twodifferent strategies to identify a failure surface. For the first approach, an isosurface ofa predefined constant level value �¼�p is defined as failure surface. This description isvery well suited for problems with one or two cracks. In this case, homogeneous Dirichletboundary conditions are applied to the nodes of the crack initialisation elements.Alternatively, for the second approach, the location of crack initialisation is predefined.Corresponding boundary conditions are specified on the geometry. At crack initiation;i.e. when the Rankine criterion is violated, the current value �¼�crit of the isosurface atthe predefined location is used to characterise the failure surface. This approach isadvantageous in the case of multiple cracks.
3. Computational algorithm for fracture in folding rocks
Next, we illustrate how to solve the governing Equations (2), (5) and (7) within a nonlinearfinite element setting. By their very nature, the elastic bulk problem and the cohesiveinterface problem are strongly coupled. Both, however, are only weakly coupled to thecrack tracking problem.
Accordingly, we chose to solve the bulk and interface equilibrium simultaneously andonly then solve the crack kinematics in a post-processing step. The corresponding weakforms follow from a multiplication with the test functions �u, [[�u]] and �/, integrationover the domain of interest B and its discontinuity �, and inclusion of the Neumannboundary conditions P �N¼T p and j �N¼ j p:Z
Bþ[B��F : PdVþ
ZG½½�u�� � �TdA ¼
Z@Bt
�u � Tp dA
ZB
rX�� � j dV ¼
Z@Bj
�� j p dA:
ð9Þ
For the finite element formulation, it proves convenient to distinguish between standardcontinuous elements and discontinuous elements which are crossed by the discontinuitysurface. For the continuous elements, we apply a standard interpolation of the testfunctions �u, the deformation field u, and their gradients �F and F. For the discontinuouselements, we apply an independent interpolation of the deformation field uþ and u� andits gradient Fþ and F� on the individual sides of the discontinuity Bþ and B�.Conceptually speaking, both deformation fields uþ and u� are interpolated indepen-dently over the element. To this end, we essentially double the degrees of freedom of theentire element. The interpolated fields are then set to zero on one side of the discontinuity,while they take their usual values on the other side. For the crack tracking problem,
Philosophical Magazine 3251
Downloaded By: [ETH-Bibliothek] At: 10:46 13 January 2009
we apply a standard linear interpolation of the test and trial functions �� and � and their
gradients r�� and r�:
�u ¼Xi
�uiNi �F ¼
Xi
�ui �rXNi u ¼
Xj
ujNj F ¼
Xj
uj �rXNj
½½�u�� ¼X
�i
�u�i�N
�i � �F ¼X
�i
�u�i �rX�N
�i ½½u�� ¼X
�j
u�j�N
�j �F ¼X
�j
u�j �rX�N
�j
�� ¼Xi
��iNi rX�� ¼
Xi
��i �rXNi / ¼
Xj
�jNj rX� ¼
Xj
�j �rXNj:
ð10Þ
Here, Ni and Nj are the standard shape functions for tetrahedral elements and i and j are
the four tetrahedral nodes. To unify the notation, we have introduced the sets �N�i and �N
�j
which consist of the element shape functions N evaluated on � multiplied by the corres-
ponding algebraic sign. The overbars indicate the discontinuous elements, for which we
have doubled the degrees of freedom such that �i and �j are the doubled four, i.e. eight,
tetrahedral nodes. Accordingly, rX �N denotes the gradient of the shape functions N
evaluated on the discontinuity �, weighted by the factor 1/2. With the help of the above
introduced discretisations, the weak forms (9) can be cast into the following discrete
residual statements:
R’I ¼ A
nel
e¼1
ZBe[B
þ,�d
rXNi � PdV�
Z@Bte
N i T pdAþ
Z�G
�Ni �Tð½½u��Þ d �A¼:0
R�I ¼ Anel
e¼1
ZBe
rXNi � jdV�
Z@Bje
N i j pdA¼:0:
ð11Þ
Herein, the operator Anele¼1 denotes the assembly of all element contributions including the
continuous and the discontinuous ones. The first residual R’I is nonlinear in the unknown
deformation field u(X ), whereas the second residual R�I is linear in the unknown field �(X).The nonlinear set of Equation (11)1 is solved numerically based on an incremental iterative
Newton-Raphson scheme with the incremental stiffness matrix K’IJ ¼ @RI
’ = @uJ.
The system matrix of the linear set of Equation (11)2 follows accordingly, as
K�IJ ¼ @RI� = @�J:
K’IJ ¼ A
nel
e¼1
ZBe[B
þ,�d
rXNi � ½@FP� � rXN
j dVþ
Z�G
�Ni½@ �F�T� � rX �Nj þ �Ni½@½½’�� �T� �Nj d �A
K�IJ ¼ Anel
e¼1
ZBe
rXNi � ½ @r� j � � rXN
j dV:
ð12Þ
The solution renders the incremental update of the deformation field duJ ¼Pnnp
I¼1 K’�1IJ R’
I
and the crack tracking field �J ¼Pnnp
I¼1 K��1IJ R�I for all nnp nodes. Recall that due to the
chosen discretisation scheme, the number of global node points nnp, which consists of the
standard nodes and the duplicated node points for the discontinuous elements increases
progressively during ongoing crack propagation. The terms in brackets, i.e. the fourth,
third and second order tensors [@FP], ½@ �F�T�, ½@½½’�� �T� and [@r� j] depend on the choice
3252 P. Jager et al.
Downloaded By: [ETH-Bibliothek] At: 10:46 13 January 2009
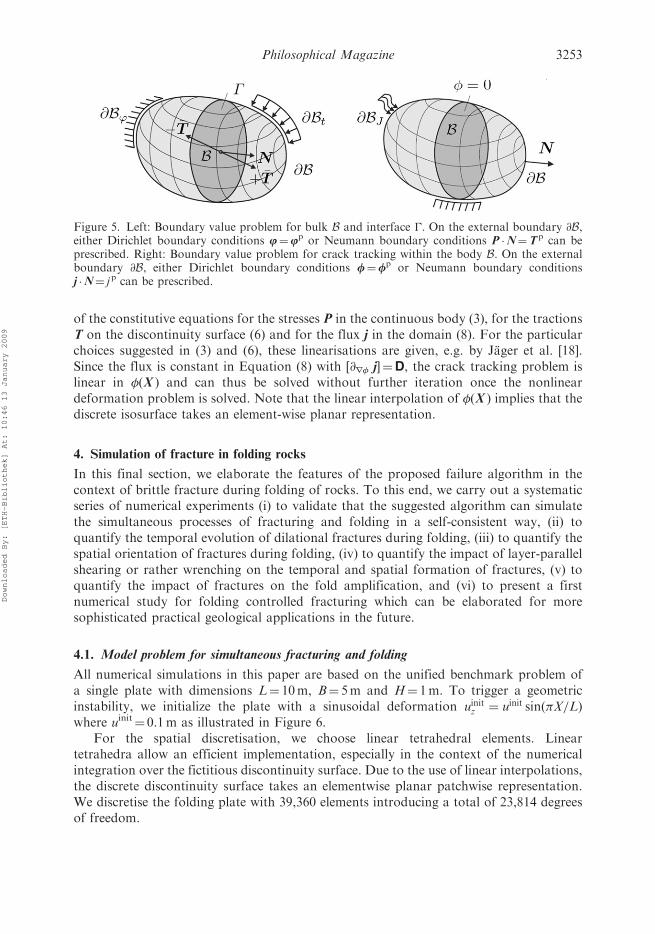
of the constitutive equations for the stresses P in the continuous body (3), for the tractionsT on the discontinuity surface (6) and for the flux j in the domain (8). For the particularchoices suggested in (3) and (6), these linearisations are given, e.g. by Jager et al. [18].Since the flux is constant in Equation (8) with [@r� j]¼D, the crack tracking problem islinear in �(X ) and can thus be solved without further iteration once the nonlineardeformation problem is solved. Note that the linear interpolation of �(X ) implies that thediscrete isosurface takes an element-wise planar representation.
4. Simulation of fracture in folding rocks
In this final section, we elaborate the features of the proposed failure algorithm in thecontext of brittle fracture during folding of rocks. To this end, we carry out a systematicseries of numerical experiments (i) to validate that the suggested algorithm can simulatethe simultaneous processes of fracturing and folding in a self-consistent way, (ii) toquantify the temporal evolution of dilational fractures during folding, (iii) to quantify thespatial orientation of fractures during folding, (iv) to quantify the impact of layer-parallelshearing or rather wrenching on the temporal and spatial formation of fractures, (v) toquantify the impact of fractures on the fold amplification, and (vi) to present a firstnumerical study for folding controlled fracturing which can be elaborated for moresophisticated practical geological applications in the future.
4.1. Model problem for simultaneous fracturing and folding
All numerical simulations in this paper are based on the unified benchmark problem ofa single plate with dimensions L¼ 10m, B¼ 5m and H¼ 1m. To trigger a geometricinstability, we initialize the plate with a sinusoidal deformation uinitz ¼ uinit sinðX=LÞwhere uinit¼ 0.1m as illustrated in Figure 6.
For the spatial discretisation, we choose linear tetrahedral elements. Lineartetrahedra allow an efficient implementation, especially in the context of the numericalintegration over the fictitious discontinuity surface. Due to the use of linear interpolations,the discrete discontinuity surface takes an elementwise planar patchwise representation.We discretise the folding plate with 39,360 elements introducing a total of 23,814 degreesof freedom.
Figure 5. Left: Boundary value problem for bulk B and interface �. On the external boundary @B,either Dirichlet boundary conditions u¼up or Neumann boundary conditions P �N¼T p can beprescribed. Right: Boundary value problem for crack tracking within the body B. On the externalboundary @B, either Dirichlet boundary conditions /¼/p or Neumann boundary conditionsj �N¼ j p can be prescribed.
Philosophical Magazine 3253
Downloaded By: [ETH-Bibliothek] At: 10:46 13 January 2009
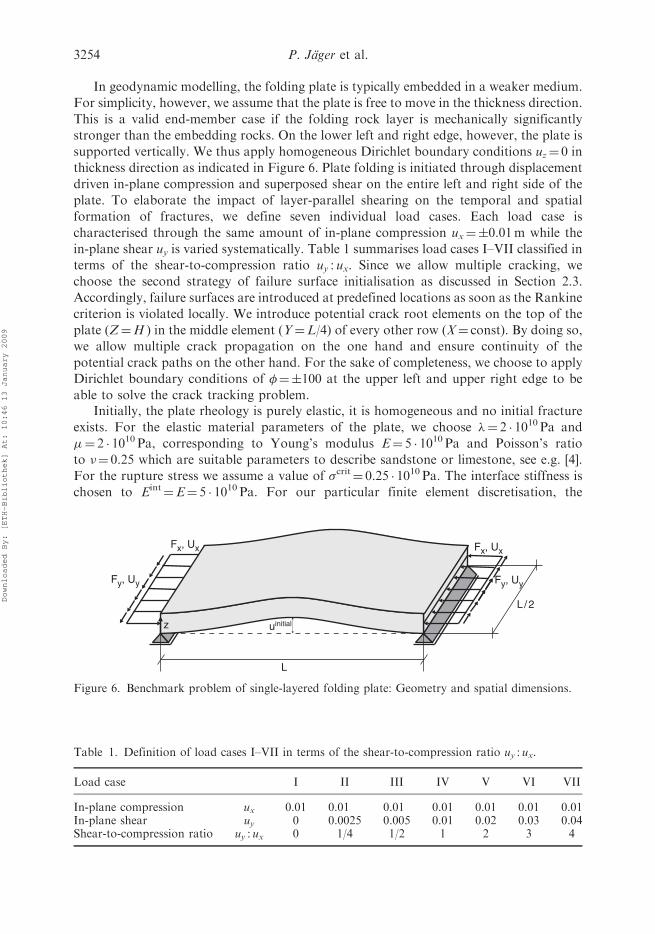
In geodynamic modelling, the folding plate is typically embedded in a weaker medium.
For simplicity, however, we assume that the plate is free to move in the thickness direction.
This is a valid end-member case if the folding rock layer is mechanically significantly
stronger than the embedding rocks. On the lower left and right edge, however, the plate is
supported vertically. We thus apply homogeneous Dirichlet boundary conditions uz¼ 0 in
thickness direction as indicated in Figure 6. Plate folding is initiated through displacement
driven in-plane compression and superposed shear on the entire left and right side of the
plate. To elaborate the impact of layer-parallel shearing on the temporal and spatial
formation of fractures, we define seven individual load cases. Each load case is
characterised through the same amount of in-plane compression ux¼�0.01m while the
in-plane shear uy is varied systematically. Table 1 summarises load cases I–VII classified in
terms of the shear-to-compression ratio uy : ux. Since we allow multiple cracking, we
choose the second strategy of failure surface initialisation as discussed in Section 2.3.
Accordingly, failure surfaces are introduced at predefined locations as soon as the Rankine
criterion is violated locally. We introduce potential crack root elements on the top of the
plate (Z¼H ) in the middle element (Y¼L/4) of every other row (X¼ const). By doing so,
we allow multiple crack propagation on the one hand and ensure continuity of the
potential crack paths on the other hand. For the sake of completeness, we choose to apply
Dirichlet boundary conditions of �¼�100 at the upper left and upper right edge to be
able to solve the crack tracking problem.Initially, the plate rheology is purely elastic, it is homogeneous and no initial fracture
exists. For the elastic material parameters of the plate, we choose �¼ 2 � 1010 Pa and
�¼ 2 � 1010 Pa, corresponding to Young’s modulus E¼ 5 � 1010 Pa and Poisson’s ratio
to ¼ 0.25 which are suitable parameters to describe sandstone or limestone, see e.g. [4].
For the rupture stress we assume a value of �crit¼ 0.25 � 1010 Pa. The interface stiffness is
chosen to Eint¼E¼ 5 � 1010 Pa. For our particular finite element discretisation, the
uinitial
Fx, Ux Fx, Ux
Fy, UyFy, Uy
z
L
L /2
Figure 6. Benchmark problem of single-layered folding plate: Geometry and spatial dimensions.
Table 1. Definition of load cases I–VII in terms of the shear-to-compression ratio uy : ux.
Load case I II III IV V VI VII
In-plane compression ux 0.01 0.01 0.01 0.01 0.01 0.01 0.01In-plane shear uy 0 0.0025 0.005 0.01 0.02 0.03 0.04Shear-to-compression ratio uy : ux 0 1/4 1/2 1 2 3 4
3254 P. Jager et al.
Downloaded By: [ETH-Bibliothek] At: 10:46 13 January 2009
characteristic element length is hel¼ 0.1m and the penalty parameter � has been chosen to
�¼ 0.005, such that � = hel ¼ 0:05ð1=mÞ. This particular choice of the penalty parameter �had been found reasonable during various different case studies.
4.2. Temporal evolution of dilational fractures during folding
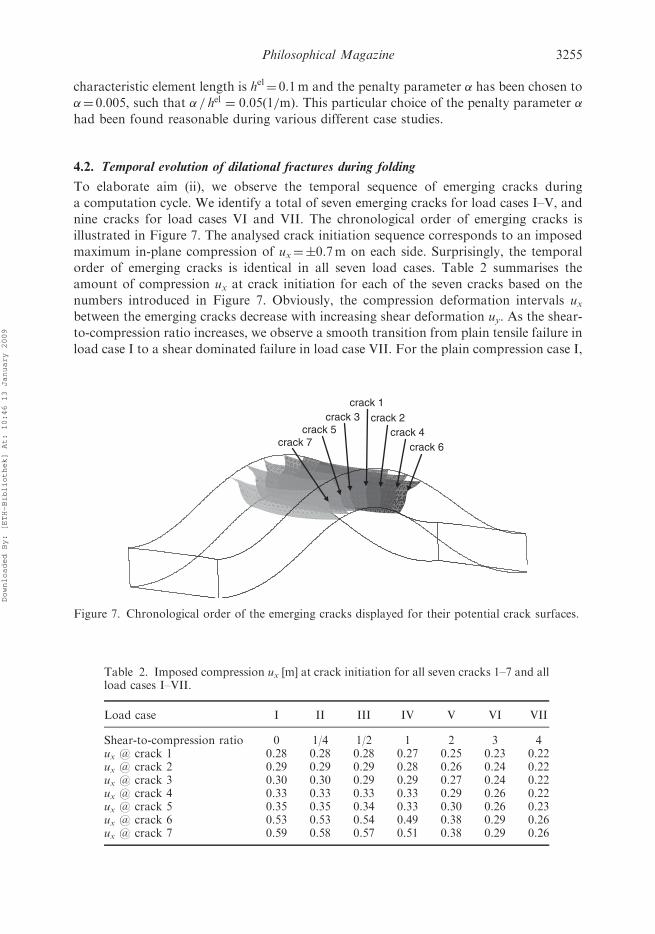
To elaborate aim (ii), we observe the temporal sequence of emerging cracks during
a computation cycle. We identify a total of seven emerging cracks for load cases I–V, and
nine cracks for load cases VI and VII. The chronological order of emerging cracks is
illustrated in Figure 7. The analysed crack initiation sequence corresponds to an imposed
maximum in-plane compression of ux¼�0.7m on each side. Surprisingly, the temporal
order of emerging cracks is identical in all seven load cases. Table 2 summarises the
amount of compression ux at crack initiation for each of the seven cracks based on the
numbers introduced in Figure 7. Obviously, the compression deformation intervals uxbetween the emerging cracks decrease with increasing shear deformation uy. As the shear-
to-compression ratio increases, we observe a smooth transition from plain tensile failure in
load case I to a shear dominated failure in load case VII. For the plain compression case I,
crack 1crack 2crack 3
crack 5crack 7
crack 4crack 6
Figure 7. Chronological order of the emerging cracks displayed for their potential crack surfaces.
Table 2. Imposed compression ux [m] at crack initiation for all seven cracks 1–7 and allload cases I–VII.
Load case I II III IV V VI VII
Shear-to-compression ratio 0 1/4 1/2 1 2 3 4ux @ crack 1 0.28 0.28 0.28 0.27 0.25 0.23 0.22ux @ crack 2 0.29 0.29 0.29 0.28 0.26 0.24 0.22ux @ crack 3 0.30 0.30 0.29 0.29 0.27 0.24 0.22ux @ crack 4 0.33 0.33 0.33 0.33 0.29 0.26 0.22ux @ crack 5 0.35 0.35 0.34 0.33 0.30 0.26 0.23ux @ crack 6 0.53 0.53 0.54 0.49 0.38 0.29 0.26ux @ crack 7 0.59 0.58 0.57 0.51 0.38 0.29 0.26
Philosophical Magazine 3255
Downloaded By: [ETH-Bibliothek] At: 10:46 13 January 2009
we observe the first crack initiation in the tensile zone right in the middle of the upper plate
surface, see crack number 1 in Figure 7. After this crack initiation, the stress state ispartially relaxed and the maximum tensile stress gradually moves from the centre to the
left and to the right. Next, a set of cracks, numbered 2 and 3 in Figure 7, is initiated left
and right to the first crack. Theoretically, these two cracks should emerge simultaneouslybecause of the symmetric geometry of the problem setup. Due to our particular structured
triangular discretisation, however, the mesh is biased such that crack 2 on the right isinitiated slightly before crack 3 on the left. Crack sets 4 and 5 and then sets 6 and 7 evolve
in a similar way. If now, shear is applied in addition to compression, the load incrementbetween the onset of cracking decreases remarkably. In the extreme case VII with
a shear-to-compression ratio of uy : ux¼ 4, all seven cracks emerge almost simultaneously.This example nicely illustrates the remarkable influence of the shear-to-compression ratio,
or rather of the stress state in the plate, on the dominant failure mechanism and thus onthe chronological evolution of failure surfaces.
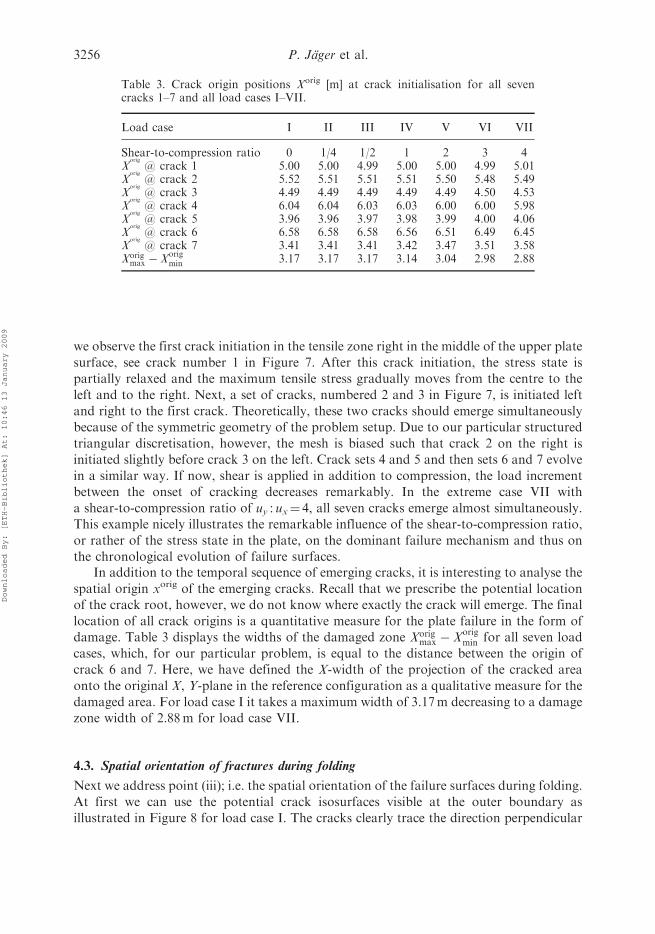
In addition to the temporal sequence of emerging cracks, it is interesting to analyse the
spatial origin xorig of the emerging cracks. Recall that we prescribe the potential locationof the crack root, however, we do not know where exactly the crack will emerge. The final
location of all crack origins is a quantitative measure for the plate failure in the form ofdamage. Table 3 displays the widths of the damaged zone Xorig
max � Xorigmin for all seven load
cases, which, for our particular problem, is equal to the distance between the origin ofcrack 6 and 7. Here, we have defined the X-width of the projection of the cracked area
onto the original X, Y-plane in the reference configuration as a qualitative measure for the
damaged area. For load case I it takes a maximum width of 3.17m decreasing to a damagezone width of 2.88m for load case VII.
4.3. Spatial orientation of fractures during folding
Next we address point (iii); i.e. the spatial orientation of the failure surfaces during folding.
At first we can use the potential crack isosurfaces visible at the outer boundary asillustrated in Figure 8 for load case I. The cracks clearly trace the direction perpendicular
Table 3. Crack origin positions Xorig [m] at crack initialisation for all sevencracks 1–7 and all load cases I–VII.
Load case I II III IV V VI VII
Shear-to-compression ratio 0 1/4 1/2 1 2 3 4X
orig
@ crack 1 5.00 5.00 4.99 5.00 5.00 4.99 5.01X
orig
@ crack 2 5.52 5.51 5.51 5.51 5.50 5.48 5.49X
orig
@ crack 3 4.49 4.49 4.49 4.49 4.49 4.50 4.53X
orig
@ crack 4 6.04 6.04 6.03 6.03 6.00 6.00 5.98X
orig
@ crack 5 3.96 3.96 3.97 3.98 3.99 4.00 4.06X
orig
@ crack 6 6.58 6.58 6.58 6.56 6.51 6.49 6.45X
orig
@ crack 7 3.41 3.41 3.41 3.42 3.47 3.51 3.58Xorig
max � Xorigmin 3.17 3.17 3.17 3.14 3.04 2.98 2.88
3256 P. Jager et al.
Downloaded By: [ETH-Bibliothek] At: 10:46 13 January 2009
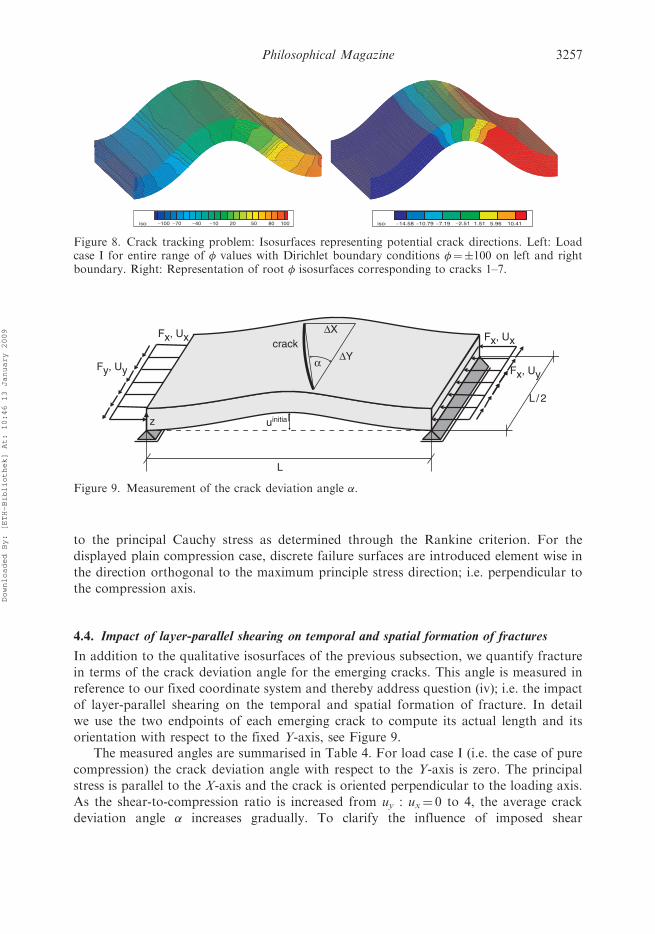
to the principal Cauchy stress as determined through the Rankine criterion. For the
displayed plain compression case, discrete failure surfaces are introduced element wise in
the direction orthogonal to the maximum principle stress direction; i.e. perpendicular to
the compression axis.
4.4. Impact of layer-parallel shearing on temporal and spatial formation of fractures
In addition to the qualitative isosurfaces of the previous subsection, we quantify fracture
in terms of the crack deviation angle for the emerging cracks. This angle is measured in
reference to our fixed coordinate system and thereby address question (iv); i.e. the impact
of layer-parallel shearing on the temporal and spatial formation of fracture. In detail
we use the two endpoints of each emerging crack to compute its actual length and its
orientation with respect to the fixed Y-axis, see Figure 9.The measured angles are summarised in Table 4. For load case I (i.e. the case of pure
compression) the crack deviation angle with respect to the Y-axis is zero. The principal
stress is parallel to the X-axis and the crack is oriented perpendicular to the loading axis.
As the shear-to-compression ratio is increased from uy : ux¼ 0 to 4, the average crack
deviation angle � increases gradually. To clarify the influence of imposed shear
uinitialz
L
L /2
ΔX
ΔY
crack
Fy, Uy
Fx, Ux Fx, Ux
Fx, Uyα
Figure 9. Measurement of the crack deviation angle �.
iso: −100 −70 −40 −10 20 50 80 iso: −14.58 −10.79 −7.19 −2.51 1.51 5.96 10.41100
Figure 8. Crack tracking problem: Isosurfaces representing potential crack directions. Left: Loadcase I for entire range of � values with Dirichlet boundary conditions �¼�100 on left and rightboundary. Right: Representation of root � isosurfaces corresponding to cracks 1–7.
Philosophical Magazine 3257
Downloaded By: [ETH-Bibliothek] At: 10:46 13 January 2009
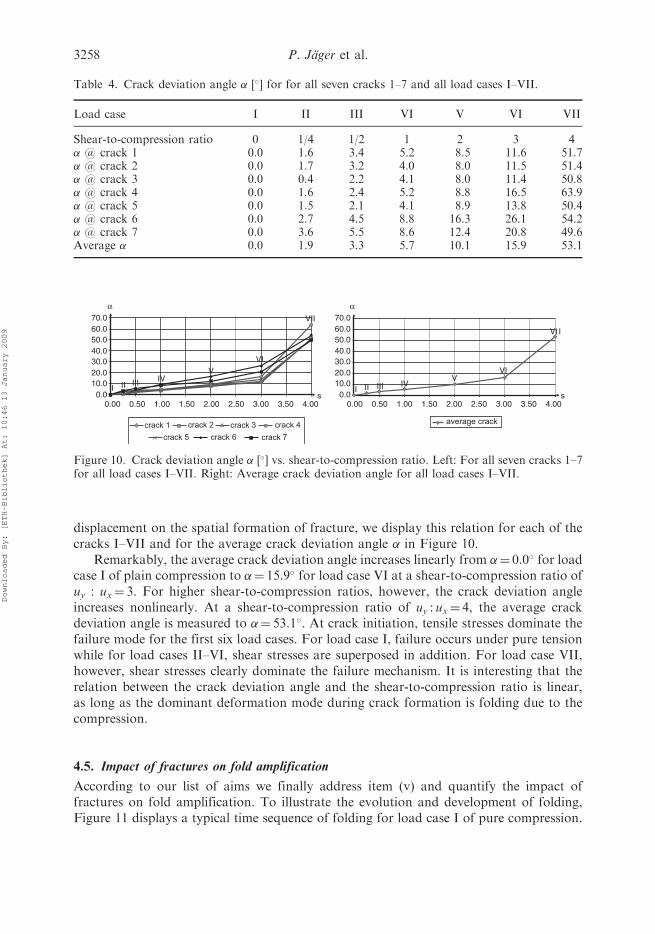
displacement on the spatial formation of fracture, we display this relation for each of thecracks I–VII and for the average crack deviation angle � in Figure 10.
Remarkably, the average crack deviation angle increases linearly from �¼ 0.0� for loadcase I of plain compression to �¼ 15.9� for load case VI at a shear-to-compression ratio ofuy : ux¼ 3. For higher shear-to-compression ratios, however, the crack deviation angleincreases nonlinearly. At a shear-to-compression ratio of uy : ux¼ 4, the average crackdeviation angle is measured to �¼ 53.1�. At crack initiation, tensile stresses dominate thefailure mode for the first six load cases. For load case I, failure occurs under pure tensionwhile for load cases II–VI, shear stresses are superposed in addition. For load case VII,however, shear stresses clearly dominate the failure mechanism. It is interesting that therelation between the crack deviation angle and the shear-to-compression ratio is linear,as long as the dominant deformation mode during crack formation is folding due to thecompression.
4.5. Impact of fractures on fold amplification
According to our list of aims we finally address item (v) and quantify the impact offractures on fold amplification. To illustrate the evolution and development of folding,Figure 11 displays a typical time sequence of folding for load case I of pure compression.
Table 4. Crack deviation angle � [�] for for all seven cracks 1–7 and all load cases I–VII.
Load case I II III VI V VI VII
Shear-to-compression ratio 0 1/4 1/2 1 2 3 4� @ crack 1 0.0 1.6 3.4 5.2 8.5 11.6 51.7� @ crack 2 0.0 1.7 3.2 4.0 8.0 11.5 51.4� @ crack 3 0.0 0.4 2.2 4.1 8.0 11.4 50.8� @ crack 4 0.0 1.6 2.4 5.2 8.8 16.5 63.9� @ crack 5 0.0 1.5 2.1 4.1 8.9 13.8 50.4� @ crack 6 0.0 2.7 4.5 8.8 16.3 26.1 54.2� @ crack 7 0.0 3.6 5.5 8.6 12.4 20.8 49.6Average � 0.0 1.9 3.3 5.7 10.1 15.9 53.1
0.010.020.030.040.050.060.070.0
0.010.020.030.040.050.060.070.0
0.00
crack 1 crack 2 crack 3 crack 4
crack 5 crack 6 crack 7
0.50 1.00 1.50 2.00 2.50 3.00 3.50 4.00 0.00 0.50 1.00 1.50 2.00 2.50 3.00 3.50 4.00
I
VI
IIIVIII
V
VII
sI II III IV
VVI
VI I
s
average crack
α α
Figure 10. Crack deviation angle � [�] vs. shear-to-compression ratio. Left: For all seven cracks 1–7for all load cases I–VII. Right: Average crack deviation angle for all load cases I–VII.
3258 P. Jager et al.
Downloaded By: [ETH-Bibliothek] At: 10:46 13 January 2009
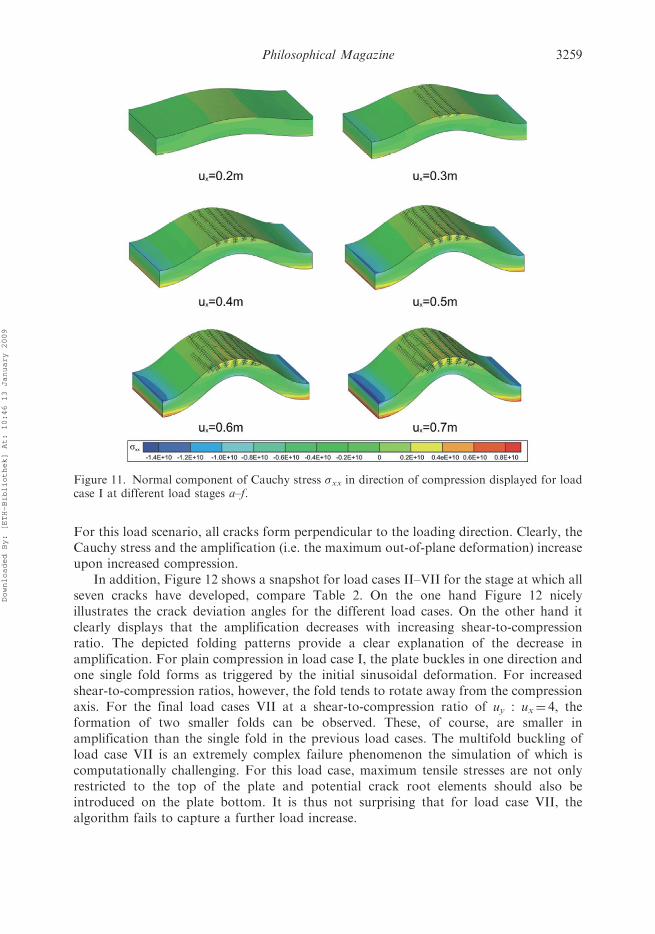
For this load scenario, all cracks form perpendicular to the loading direction. Clearly, theCauchy stress and the amplification (i.e. the maximum out-of-plane deformation) increaseupon increased compression.
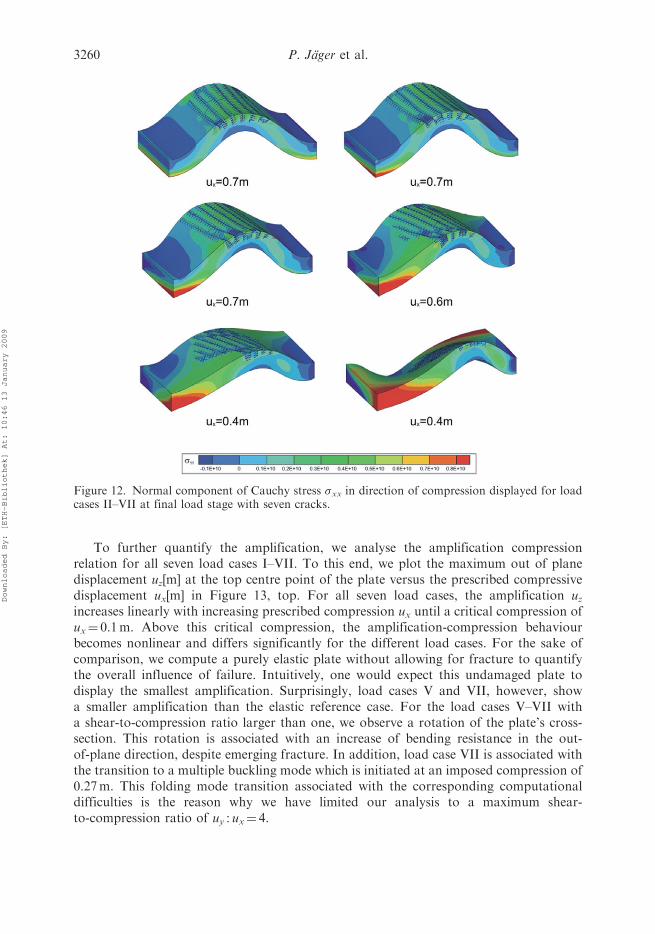
In addition, Figure 12 shows a snapshot for load cases II–VII for the stage at which allseven cracks have developed, compare Table 2. On the one hand Figure 12 nicelyillustrates the crack deviation angles for the different load cases. On the other hand itclearly displays that the amplification decreases with increasing shear-to-compressionratio. The depicted folding patterns provide a clear explanation of the decrease inamplification. For plain compression in load case I, the plate buckles in one direction andone single fold forms as triggered by the initial sinusoidal deformation. For increasedshear-to-compression ratios, however, the fold tends to rotate away from the compressionaxis. For the final load cases VII at a shear-to-compression ratio of uy : ux¼ 4, theformation of two smaller folds can be observed. These, of course, are smaller inamplification than the single fold in the previous load cases. The multifold buckling ofload case VII is an extremely complex failure phenomenon the simulation of which iscomputationally challenging. For this load case, maximum tensile stresses are not onlyrestricted to the top of the plate and potential crack root elements should also beintroduced on the plate bottom. It is thus not surprising that for load case VII, thealgorithm fails to capture a further load increase.
Figure 11. Normal component of Cauchy stress �xx in direction of compression displayed for loadcase I at different load stages a–f.
Philosophical Magazine 3259
Downloaded By: [ETH-Bibliothek] At: 10:46 13 January 2009
To further quantify the amplification, we analyse the amplification compressionrelation for all seven load cases I–VII. To this end, we plot the maximum out of planedisplacement uz[m] at the top centre point of the plate versus the prescribed compressivedisplacement ux[m] in Figure 13, top. For all seven load cases, the amplification uzincreases linearly with increasing prescribed compression ux until a critical compression ofux¼ 0.1m. Above this critical compression, the amplification-compression behaviourbecomes nonlinear and differs significantly for the different load cases. For the sake ofcomparison, we compute a purely elastic plate without allowing for fracture to quantifythe overall influence of failure. Intuitively, one would expect this undamaged plate todisplay the smallest amplification. Surprisingly, load cases V and VII, however, showa smaller amplification than the elastic reference case. For the load cases V–VII witha shear-to-compression ratio larger than one, we observe a rotation of the plate’s cross-section. This rotation is associated with an increase of bending resistance in the out-of-plane direction, despite emerging fracture. In addition, load case VII is associated withthe transition to a multiple buckling mode which is initiated at an imposed compression of0.27m. This folding mode transition associated with the corresponding computationaldifficulties is the reason why we have limited our analysis to a maximum shear-to-compression ratio of uy : ux¼ 4.
Figure 12. Normal component of Cauchy stress �xx in direction of compression displayed for loadcases II–VII at final load stage with seven cracks.
3260 P. Jager et al.
Downloaded By: [ETH-Bibliothek] At: 10:46 13 January 2009
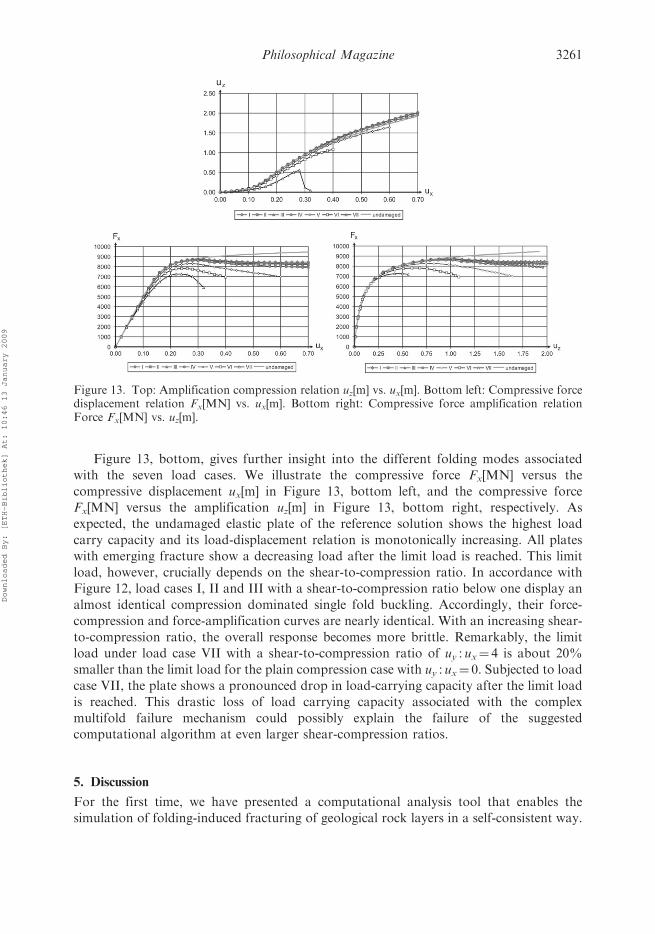
Figure 13, bottom, gives further insight into the different folding modes associated
with the seven load cases. We illustrate the compressive force Fx[MN] versus the
compressive displacement ux[m] in Figure 13, bottom left, and the compressive forceFx[MN] versus the amplification uz[m] in Figure 13, bottom right, respectively. As
expected, the undamaged elastic plate of the reference solution shows the highest load
carry capacity and its load-displacement relation is monotonically increasing. All plates
with emerging fracture show a decreasing load after the limit load is reached. This limit
load, however, crucially depends on the shear-to-compression ratio. In accordance withFigure 12, load cases I, II and III with a shear-to-compression ratio below one display an
almost identical compression dominated single fold buckling. Accordingly, their force-
compression and force-amplification curves are nearly identical. With an increasing shear-
to-compression ratio, the overall response becomes more brittle. Remarkably, the limitload under load case VII with a shear-to-compression ratio of uy : ux¼ 4 is about 20%
smaller than the limit load for the plain compression case with uy : ux¼ 0. Subjected to load
case VII, the plate shows a pronounced drop in load-carrying capacity after the limit load
is reached. This drastic loss of load carrying capacity associated with the complex
multifold failure mechanism could possibly explain the failure of the suggestedcomputational algorithm at even larger shear-compression ratios.
5. Discussion
For the first time, we have presented a computational analysis tool that enables thesimulation of folding-induced fracturing of geological rock layers in a self-consistent way.
Figure 13. Top: Amplification compression relation uz[m] vs. ux[m]. Bottom left: Compressive forcedisplacement relation Fx[MN] vs. ux[m]. Bottom right: Compressive force amplification relationForce Fx[MN] vs. uz[m].
Philosophical Magazine 3261
Downloaded By: [ETH-Bibliothek] At: 10:46 13 January 2009
This tool is based on a novel staggered two-field finite element analysis in terms of thepotentially discontinuous deformation field and the scalar-valued crack isosurface. Toelaborate the features of the suggested algorithm, we have defined a unique three-dimensional model problem of plate folding (or plate buckling). With this model setup, weanalyse brittle tensile failure governed by the traditional principle stress based Rankinecriterion. In contrast to classical model problems for quasi-brittle materials such asconcrete or rock, loading is not applied in the form of tension or bending. Here, we applya pure displacement driven layer-parallel compression and superpose a gradually varyingamount of in-plane shear to systematically study the influence of the stress state on thefailure mode. For our particular model problem, brittle failure in the tensile regime of theplate is a mere result of folding or rather buckling, a geometric instability that requiresa kinematically exact characterisation of large deformations.
The two most common fracture sets related to folding are both perpendicular to thebedding but either parallel or orthogonal to the fold axes (e.g. [2]). Since both of thesefractures open orthogonally to the least principle stress direction, they cannot formsimultaneously. In this study, only fractures with an orientation sub-parallel to the foldaxes developed. Branching and intersecting cracks are not considered within the presentframework. For the present finite element based fracture algorithm, the failure mode isprimarily controlled by the principle stress based Rankine failure criterion, the choice ofboundary conditions and the magnitude of the failure stress.
In the present study, the elastic plate is free to buckle and not embedded ina mechanically weaker medium. An embedding medium changes the stress magnitude anddistribution within the folding layer and may therefore influence the mode of fracturing.However, most probably, the first order results provided by this study will not changedramatically due to an embedding medium.
A component of layer-parallel shearing, or wrenching, results in a systematic variationof the fracture orientation. The results show that above a certain shear-to-compressionratio, shear fractures originate first and not dilational fractures. This shear dominantregime is governed by multiple folding and high crack deviation angles. Below the criticalshear-to-compression ratio, however, the crack deviation angle varies linearly with theshear-to-compression ratio. Within this linear regime, the crack deviation angle (i.e. thedeviation in orientation of dilational fractures from the fold axis) may be used in the fieldto estimate the action and magnitude of wrenching during folding. The fracturing duringfolding changes the effective mechanical properties of the plate, in particular the platebecomes weaker at the outer hinge area and the flexural rigidity becomes smaller at thefold hinge. This weakening would cause an increased amplification for layer-parallelshortening under a constant compressional force.
In this paper, we suggest a nonlinear coupled finite element based algorithm tosimulate brittle fracture in folding rocks. An alternative method to study simultaneousfolding and fracturing is the discrete element method (e.g. [24]) for which the folding rockis assumed to consist of multiple particles ab-initio. To simulate discrete element basedfolding and fracturing with an acceptable numerical resolution, however, requiresa significantly higher computational effort than using finite elements. Another drawbackof discrete element methods is that most established failure criteria based on laboratoryrock deformation experiments such as the Rankine criterion are expressed in terms ofstress tensor components. These are difficult to define within the discrete element method.Accordingly, the suggested finite element algorithm is believed to provide a stable, robust,
3262 P. Jager et al.
Downloaded By: [ETH-Bibliothek] At: 10:46 13 January 2009
efficient and powerful analysis tool to study the complex failure phenomena in brittlefracture and folding. The proposed framework can be used to generate individual tablesof crack deviation angles versus shear-to-compression ratios for various types of rocks.These tables can potentially be applied in the field to improve the understanding of theevolution and structural development of complex failure patterns in natural rocks. Sincethese fractures severely influence the permeability of geological structures, this under-standing is of crucial importance for industrial applications such as groundwater andhydrocarbon flow.
References
[1] M.A. Biot, GSA Bulletin 72 (1961) p.1595.[2] N.J. Price and J.W. Cosgrove, Analysis of Geological Structures, Cambridge University Press,
Cambridge, 1990.
[3] S.M. Schmalholz, Y.Y. Podladchikov and J.-P. Burg, J. Geophys. Res. 107 (B1), 2005,doi:10.1029/2001JB000355 (2002).
[4] D.L. Turcotte and G. Schubert, Geodynamcis, John Wiley, New York, 1982.
[5] D.O. Brush and B.O. Almroth, Buckling of Bars, Plates and Shells, McGraw-Hill, New York,1975.
[6] J.W. Cosgrove and M.S. Ameen, in Forced Folds and Fractures, J.W. Cosgrove and
M.S. Ameen eds., Geological Society Special Publication No. 169, London, 2000, p.7.[7] S. Bergbauer and D.D. Pollard, GSA Bulletin 116 (2004) p.294.[8] H. Cloos and Z. Deutsch, Geol. Ges. 100 (1948) p.290.[9] P.L. Hancock, J. Struct. Geol. 7 (1985) p.437.
[10] H. McQuillan, AAPG Bulletin 57 (1973) p.2367.[11] N.J. Price, Fault and Joint Development in Brittle and Semi-Brittle Rock, Pergamon Press,
Oxford, 1966.
[12] D.T. Griggs and J. Handin, in Rock Deformation, D.T. Griggs and J. Handin eds., GeologicalSociety of America Memoir 79, Boulder, 1960, p.347.
[13] T. Belytschko, M. Moes, S. Usui et al., Int. J. Numer. Meth. Eng. 50 (2001) p.993.
[14] J. Dolbow, N. Moes and T. Belytschko, Finite Elements in Analysis and Design 36 (2000) p.235.[15] G.N. Wells and L.J. Sluys, Int. J. Numer. Meth. Eng. 50 (2001) p.2667.[16] A. Hansbo and P. Hansbo, Comput. Methods Appl. Mech. Eng. 193 (2004) p.3532.
[17] J. Mergheim, E. Kuhl and P. Steinmann, Int. J. Numer. Meth. Eng. 63 (2005) p.276.[18] P. Jager, P. Steinmann and E. Kuhl, Int. J. Numer. Meth. Eng., doi:10.1002/nme.2353.[19] P. Jager, P. Steinmann and E. Kuhl, Comput. Mech. 42 (2008) p.395.[20] J. Mergheim, E. Kuhl and P. Steinmann, Commun. Numer. Meth. Eng. 23 (2007) p.97.
[21] P.M.A. Areias and T. Belytschko, Int. J. Numer. Meth. Eng. 63 (2005) p.760.[22] T.C. Gasser and G.A. Holzapfel, Comput. Methods Appl. Mech. Eng. 195 (2006) p.5198.[23] J. Oliver, A.E. Huespe, E. Samaniego et al., Int. J. Numer. Anal. Meth. Geomech. 28 (2004)
p.609.[24] S. Hardy and E. Finch, Basin Res. 17 (2005) p.507.
Philosophical Magazine 3263
Downloaded By: [ETH-Bibliothek] At: 10:46 13 January 2009