Embed Size (px)
Citation preview
Bringing Scientific Workflow to the Masses via Pegasus and HUBzero
Michael McLennan, Steven Clark HUBzero Platform for Scientific Collaboration
Purdue University West Lafayette, IN, USA
[email protected], [email protected]
Ewa Deelman, Mats Rynge, Karan Vahi Information Sciences Institute
University of Southern California Marina del Rey, CA, USA
[email protected], [email protected], [email protected]
Frank McKenna University of California, Berkeley
Berkeley, CA, USA [email protected]
Derrick Kearney, Carol Song Purdue University
West Lafayette, IN, USA [email protected], [email protected]
Abstract— Scientific workflow managers are powerful tools for handling large computational tasks. Domain scientists find it difficult to create new workflows, so many tasks that could benefit from workflow automation are often avoided or done by hand. Two technologies have come together to bring the benefits of workflow to the masses. The Pegasus Workflow Management System can manage workflows comprised of millions of tasks, all the while recording data about the execution and intermediate results so that the provenance of the final result is clear. The HUBzero platform for scientific collaboration provides a venue for building and delivering tools to researchers and educators. With the press of a button, these tools can launch Pegasus workflows on national computing infrastructures and bring results back for plotting and visualization. As a result, the combination of Pegasus and HUBzero is bringing high-throughput computing to a much wider audience.
Keywords—computation; workflow; collaboratories; user interfaces; automation
I. INTRODUCTION Computation has brought about a revolution in science. As
software was created to analyze large amounts of data, researchers found they could gather even more data, which necessitated even more software and more computing power. Today, many analysis tasks require not just a single program or computer, but dozens of different programs running across thousands of computational nodes. Handling any one of those tasks requires a complex orchestration of moving data to appropriate nodes, finding or staging the executables, starting jobs, handling data flow dependencies, and overcoming job failures.
Over the past decade, several frameworks have been created to support the execution of such large computational tasks. The Pegasus Workflow Management System (Pegasus WMS) [1] and its workflow engine, the directed acyclic graph
manager (DAGMan) within HTCondor [2], were built to manage thousands of jobs in a high-throughput computing environment. Taverna [3] graphically connects bioinformatics web services together into a coherent flow. Kepler [4] also provides graphical user interfaces for workflow composition and supports different workflow execution models. The SHIWA simulation platform uses the WS-PGRADE/gUSE technology to provide workflow interoperability across a number of systems [5]. Recently, Galaxy [6] is also gaining popularity in the bioinformatics domain, particularly because it tailors its environment to their community.
Once a particular workflow has been established, it is relatively easy for others to execute it. However, creating new workflows has proven to be an enormous challenge—especially for domain scientists with very little background in computer science. Creating a workflow is a lot like writing a program that calls standard library functions. The author not only must have a deep understanding of the science but also must understand the interface for each component of the workflow, including the data files required and the output files produced. The output of one component may need format conversions or additional processing before it can be used by another component. The author must know what programs are available to perform conversions, or in some cases, the author must write little conversion programs (often called “shims”) to complete the workflow. Components of the workflow may have limitations or may fail when given certain combinations of input parameters. The author must understand that too, and work around such issues.
Several projects have tried to simplify the creation of workflows by building drag-and-drop editors. Taverna [3], Kepler [4], Galaxy [6], and GridNexus [7] all allow users to drag blocks onto a canvas and connect inputs and outputs together in a flow. But while these applications simplify the task of expressing a workflow, they do not solve the inherent
This work was supported by the US National Science Foundation through grants CBET-0941302, CMMI-0927178, OCI-1148515, and OCI-0943705.
problems of understanding components, building shims, or working around limitations. The Taverna project has taken one step further and created a web site at MyExperiment.org for publishing and sharing workflows [8].
Our approach takes workflow yet another step further by delivering live simulation tools embodying workflows to the masses via a web browser. These tools are powered by Pegasus WMS running on Open Science Grid [9], DiaGrid [10], and XSEDE resources [11]. The tools are created by the few skilled users within a community, but wrapped in graphical user interfaces with integrated plotting and visualization, and delivered to the masses via the HUBzero software platform. There are now more than 40 hubs covering a wide range of scientific disciplines, including nanotechnology, earthquake mitigation, manufacturing, healthcare, pharmaceuticals, volcanoes, and climate change. There is also a hub for the HUBzero community at http://hubzero.org, which includes a list of known hubs. All together, these hubs have served more than 850,000 visitors from 172 countries worldwide—not over all time, but during the calendar year 2012 alone. Pegasus and HUBzero act as a conduit for these users, giving them fingertip access to national Grid computing infrastructures.
II. THE PEGASUS WORKFLOW MANAGEMENT SYSTEM The Pegasus Workflow Management System (or Pegasus)
manages the execution of scientific workflows on desktops, private clusters, campus clusters, grids, and academic and commercial clouds. It automatically locates the necessary input data and computational resources needed for workflow execution; thus, it allows scientists to specify their workflows at a high-level of abstraction (devoid of resource information) and then maps/plans this description onto the available execution resources. Next, Pegasus reliably executes this plan. As a result, Pegasus workflows are easy to compose and are portable across heterogeneous cyberinfrastructure.
Pegasus is capable of executing workflows on a single resource or across resources. Even a single workflow description can be distributed and executed across the cyberinfrastructure. Pegasus has been used to run workflows ranging from just a few computational tasks up to millions. When errors occur, Pegasus tries to recover when possible by retrying tasks, by retrying the entire workflow, by providing workflow-level checkpointing, by re-mapping portions of the workflow, by trying alternative data sources for staging data, and, when all else fails, by providing a rescue workflow containing a description of only the work that remains to be done [1]. Thus, it tries what it can to shield the user from errors and intermittent issues with the computing resources. It cleans up storage as the workflow is executed so that data-intensive workflows have enough space to execute on storage-constrained resources [12]. Pegasus keeps track of what has been done (provenance) including the locations of data used and produced, and which software was used with which parameters [13],[14].
In order to support the abstract workflow specifications, which let scientists concentrate on their science rather than on the operational aspects of the cyberinfrastructure, mapping technologies are needed to automatically interpret and map user-defined workflows onto the available resources. The
workflow mapping process involves finding the appropriate software, data, and computational resources required for workflow execution. The mapping process can also involve restructuring the workflow to optimize performance and adding transformations for data management and provenance information generation. DAGMan, Pegasus’s workflow engine, relies on the resources (compute, storage and network) defined in the executable workflow to perform the necessary actions. Individual workflow tasks are managed by a task scheduler (Condor), which supervises their execution on local and remote resources.
III. HUBS FOR SCIENTIFIC COMMUNITIES
A. Building a Community on nanoHUB.org In 2002, the US National Science Foundation created the
Network for Computational Nanotechnology (NCN), a collection of universities engaged in simulation and modeling for the nanotechnology community [15]. NCN established a web presence at nanoHUB.org and offered an array of simulation and modeling tools, along with seminars, tutorials, courses, and other supporting materials. Over the years, nanoHUB.org evolved into a software platform supporting collaboration in private group areas, discussion forums, ratings and reviews, and most importantly, deployment of new simulation tools via its unique middleware. In 2007, the underlying software for nanoHUB.org was spun off as a separate project, the HUBzero® Platform for Scientific Collaboration [16]. Since then, it has been used to create similar hubs for many other scientific areas—all supported by the same underlying middleware and content management system.
nanoHUB grew from 10 tools and 1,000 users in 2002 to more than 260 tools and 250,000 users today [17]. User contributions were key to that growth. Each new tool, seminar, or tutorial brought new users to the site, some of whom contributed their own new content. This virtuous cycle was fueled by an open content management system that enabled users to upload and deploy their own content according to their own schedule, with minimal intervention from the nanoHUB team.
Uploading and publishing a single document or PowerPoint presentation is one thing; uploading and deploying a simulation tool is quite another. Tools have hundreds of individual source code files; they must be compiled and tested within the hub environment; and all of this must be done by untrusted users with minimal intervention. The HUBzero infrastructure was designed to support this activity. Researchers upload their code into private project areas with a Subversion [18] repository for source code control; they compile, test, and modify their code within a secure execution container managed by OpenVZ [19] running on a cloud of execution hosts; and they approve tools for deployment via a Web-based content management system. All of this enables their code to be separated from the system and from other users, and yet deployed in a secure and scalable manner.
End users find a tool on a hub and press a button to launch it. The tool is launched in a Linux/X11 environment within a secure container on the “cloud of execution hosts,” and the
graphical output from the session is piped through the Web to the user’s browser via VNC [20]. The result is a live, interactive simulation tool running in a secure environment, capable of running workflows on national computing infrastructure, and accessible to any user via a Web browser without any special software installation.
There are many other gateway frameworks, including the Distributed Application Runtime Environment [21], Open Grid Computing Environments [22], and WS-PGRADE/gUSE [5], but none provide direct access to interactive tools and scientific visualization. This is a distinct advantage of the HUBzero platform.
There are many different users that work together within each hub community, and their interactions are mediated by the HUBzero platform. A hub owner creates a new hub and engages others in the community to seed the site with initial content. Users browse the site and take advantage of interesting content, perhaps by watching a seminar or running a simulation tool. Users also contribute their own content to the site, including new workflows and simulation tools. Hub administrators help to compile and stage new simulation tools and ultimately approve all content before it is released.
B. NEES.org and OpenSees Laboratory Other hubs leverage the same HUBzero infrastructure to
support different toolsets for their own community. In 2009,
the NSF George E. Brown Network for Earthquake Engineering Simulation (NEES) moved operations to Purdue and created a hub for the civil engineering community. Today, NEES.org offers more than 65 simulation and data analysis tools used to understand the damage caused by earthquakes and improve building design. One of these tools leverages an open source code, the Open System for Earthquake Engineering Simulation (OpenSees) [23], to provide a collection of utilities for structural and geotechnical engineers.
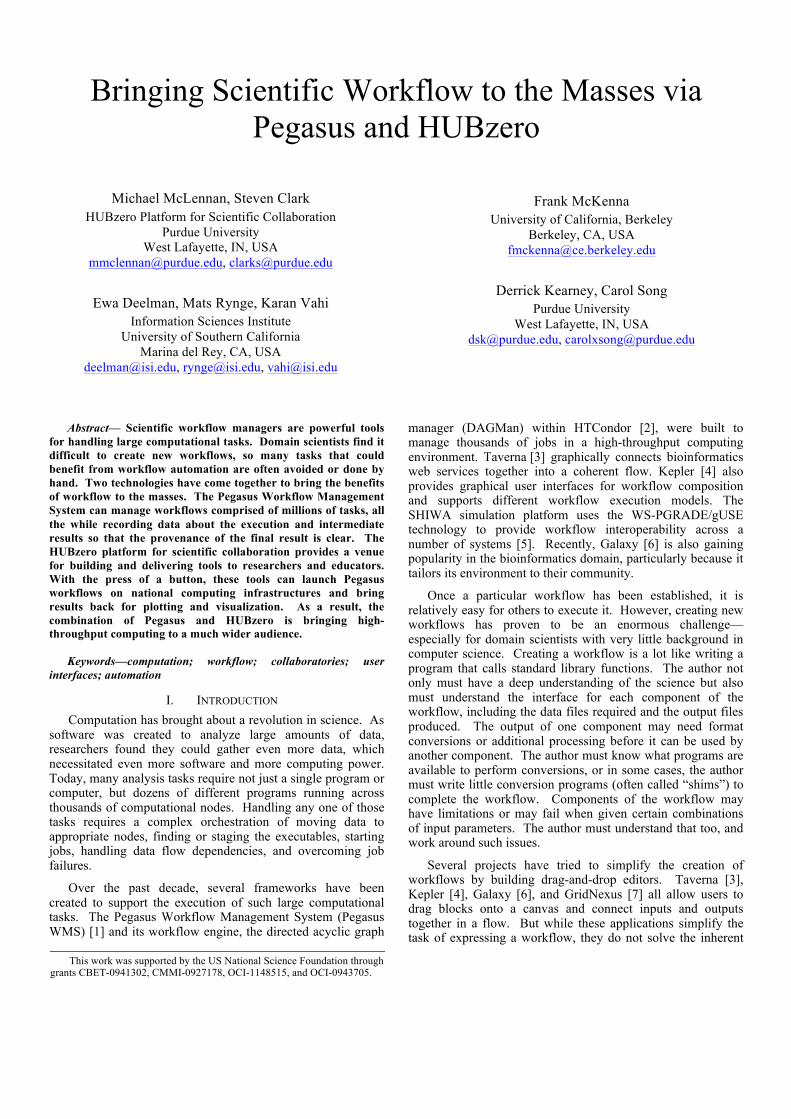
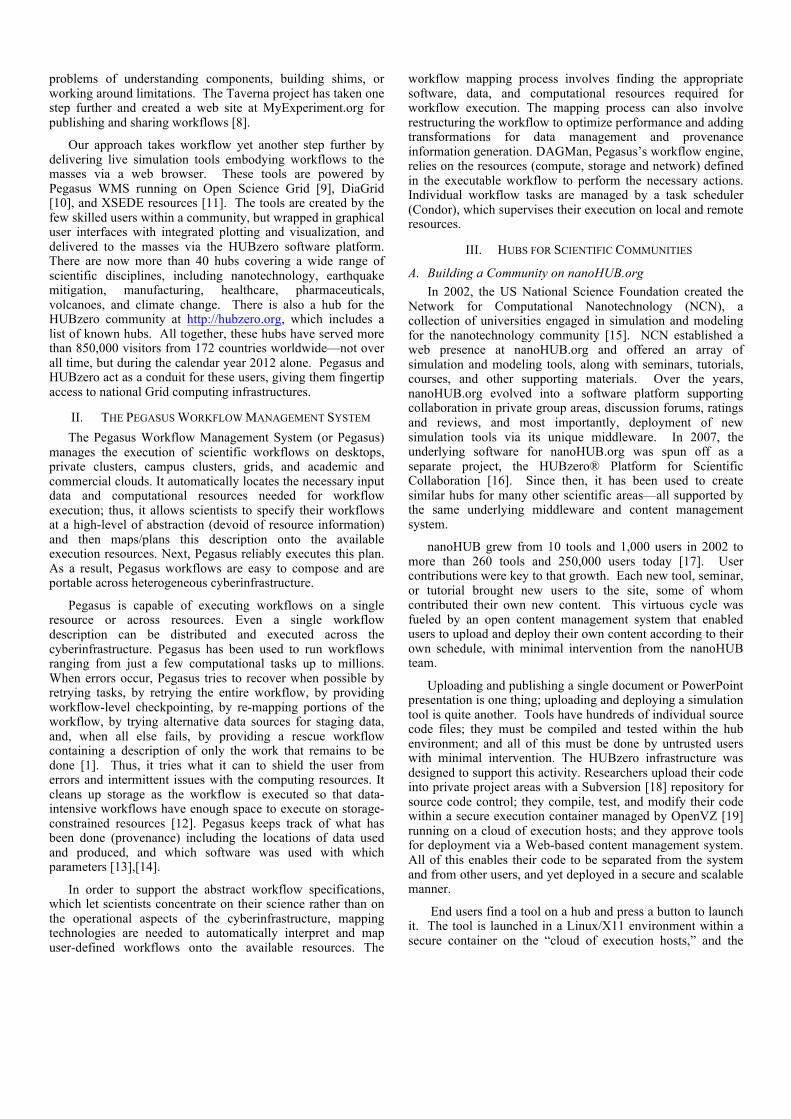
One of the utilities within this OpenSees Laboratory tool [24] is the Moment Frame Earthquake Reliability Analysis. This tool is intended to demonstrate to engineers the importance of uncertainty in their models and the need to use probabilistic methods when determining important response measures. The tool prompts the user for the material properties including probability distributions, building layout, and then a list of earthquake ground motion records. On submission, the tool automatically builds and executes a Pegasus workflow. The workflow manages several hundred to tens of thousands of separate OpenSees jobs on the Open Science Grid (OSG), which together perform a reliability analysis of the building frame under seismic loads, as shown in Fig. 1. The resulting plots will show the variation in roof displacement, interstory drift, and base shear given the uncertainty in the materials for each of the earthquake motions specified. A single dot in red for each earthquake shows the engineer what would happen if
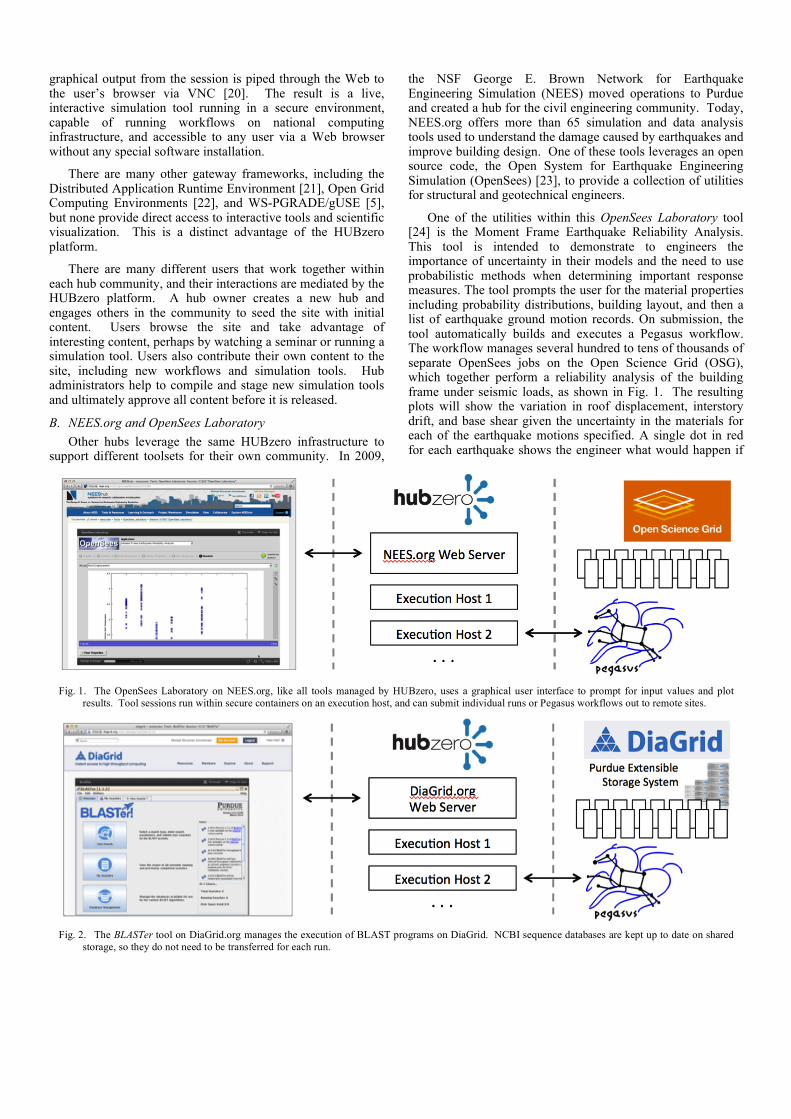
Fig. 2. The BLASTer tool on DiaGrid.org manages the execution of BLAST programs on DiaGrid. NCBI sequence databases are kept up to date on shared
storage, so they do not need to be transferred for each run.
Fig. 1. The OpenSees Laboratory on NEES.org, like all tools managed by HUBzero, uses a graphical user interface to prompt for input values and plot
results. Tool sessions run within secure containers on an execution host, and can submit individual runs or Pegasus workflows out to remote sites.
only the mean value had been used for the material properties for that earthquake. The advantage of using Pegasus and the OSG for such a workflow is that Pegasus recognizes that most of the computation can be performed in parallel and the OSG permits concurrent job submission and execution. As a consequence, the resulting time spent obtaining these results can be a few minutes and hours instead of many hours, weeks and even months that would be required if the results were obtained from a series of sequential analyses.
To date, OpenSees Laboratory has served 950 simulation users from the US, China, Canada, Italy, Japan, and other countries all over the world. About a third of these users are coming from academic institutions. All of them are driving OpenSees through a graphical user interface, perhaps without even knowing if and when they are launching complex workflows.
C. DiaGrid.org and BLASTer, SubmitR DiaGrid is a high-throughput computing resource utilizing
the Condor system, with more than 50,000 cores from machines at Purdue University and 9 other campuses. Since its inception in 2005, DiaGrid has handled more than 90,000,000 simulation jobs.
In 2011, Purdue established a hub at DiaGrid.org to provide more widespread access to the underlying DiaGrid execution pool. DiaGrid.org offers a tool called BLASTer [25], which can be used to run BLAST (Basic Local Alignment Search Tool) [26], a bioinformatics tool for analyzing DNA sequence data. Users upload a query file containing one or more nucleotide sequences and search against standard databases from the National Center for Biotechnology Information (NCBI), or against their own custom databases. The run for a single sequence may take anywhere from 10 seconds to 30 minutes. But many researchers bundle thousands of searches into a single request. Performed linearly, such a search might take several days or weeks of computation. BLASTer automatically divides the query file into chunks and creates a Pegasus workflow to distribute the search over hundreds of DiaGrid nodes, so the end-to-end execution time can be shortened from weeks to a matter of hours. Shared storage allows the NCBI standard databases, updated regularly, to be available to all users without requiring file transfer, as shown in Fig. 2, thereby further reducing the time to results.
DiaGrid.org offers a similar tool for statistical analysis scripts written in the R programming language [27]. It is quite common for researchers to run a particular script over a wide range of input parameters to explore the parameter space or to perform a sensitivity analysis. The SubmitR tool [28] takes a script, data files, and a specification of parameter values, and automatically builds and executes the Pegasus workflow to run a large number of R jobs in parallel on DiaGrid. Again, this appeals to the domain scientist who is quite familiar with R, but knows nothing about workflows, Condor, or DiaGrid.
IV. CREATING SCIENTIFIC WORKFLOWS
A. Job Submission via “submit” The integration of Pegasus and HUBzero certainly makes it
easier for end users to launch workflows, but also makes it easier for tool developers to build and test new workflows. Each hub comes with one tool called a Workspace, which is a full-featured Linux desktop accessible via the Web. Tool developers use this to upload, compile, and test their code before deploying a tool. Experienced researchers also use this to get past the constraints of a graphical interface—to edit files, write simple scripts, and dispatch computational jobs.
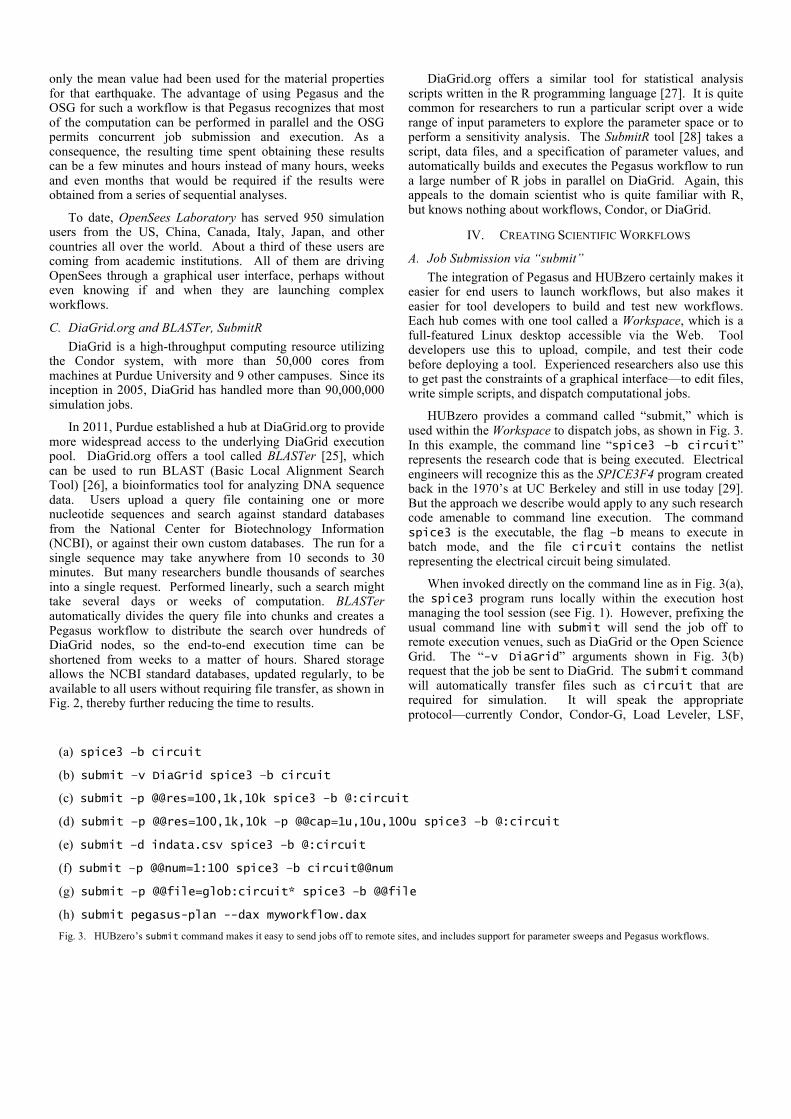
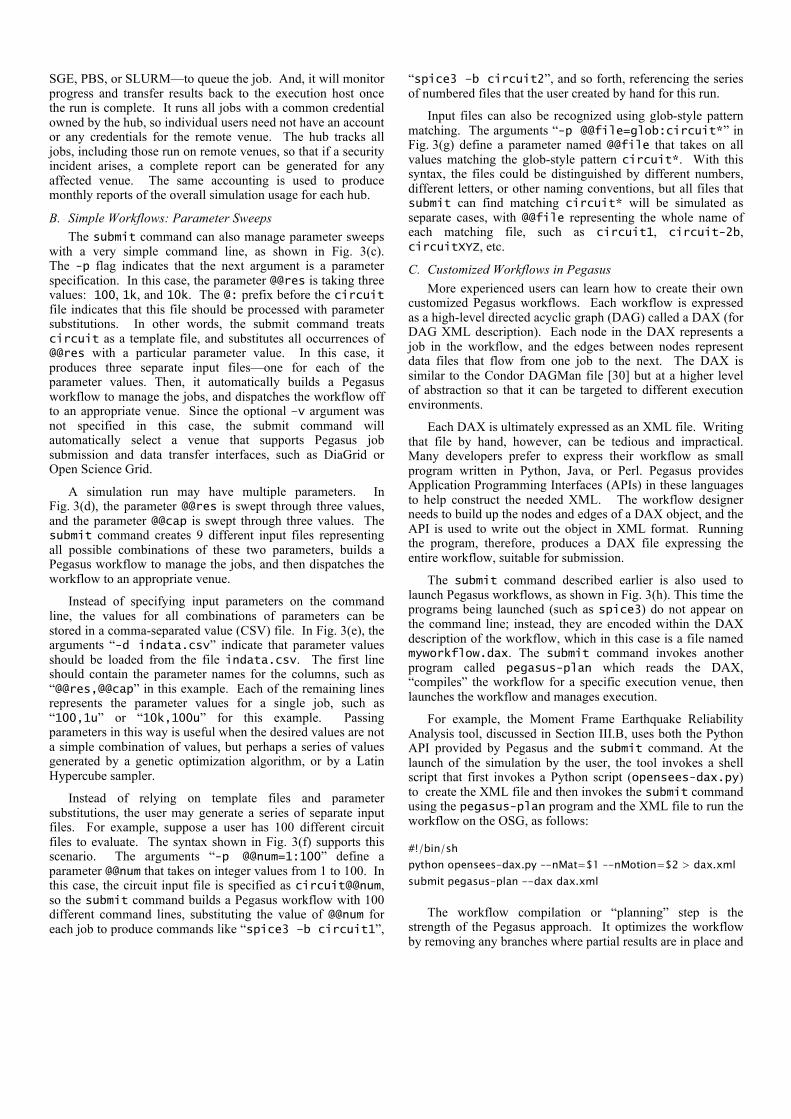
HUBzero provides a command called “submit,” which is used within the Workspace to dispatch jobs, as shown in Fig. 3. In this example, the command line “spice3 –b circuit” represents the research code that is being executed. Electrical engineers will recognize this as the SPICE3F4 program created back in the 1970’s at UC Berkeley and still in use today [29]. But the approach we describe would apply to any such research code amenable to command line execution. The command spice3 is the executable, the flag –b means to execute in batch mode, and the file circuit contains the netlist representing the electrical circuit being simulated.
When invoked directly on the command line as in Fig. 3(a), the spice3 program runs locally within the execution host managing the tool session (see Fig. 1). However, prefixing the usual command line with submit will send the job off to remote execution venues, such as DiaGrid or the Open Science Grid. The “-v DiaGrid” arguments shown in Fig. 3(b) request that the job be sent to DiaGrid. The submit command will automatically transfer files such as circuit that are required for simulation. It will speak the appropriate protocol—currently Condor, Condor-G, Load Leveler, LSF,
(a) spice3 –b circuit
(b) submit –v DiaGrid spice3 –b circuit
(c) submit –p @@res=100,1k,10k spice3 –b @:circuit
(d) submit –p @@res=100,1k,10k –p @@cap=1u,10u,100u spice3 –b @:circuit
(e) submit –d indata.csv spice3 –b @:circuit
(f) submit –p @@num=1:100 spice3 –b circuit@@num
(g) submit –p @@file=glob:circuit* spice3 –b @@file
(h) submit pegasus-plan --dax myworkflow.dax Fig. 3. HUBzero’s submit command makes it easy to send jobs off to remote sites, and includes support for parameter sweeps and Pegasus workflows.
SGE, PBS, or SLURM—to queue the job. And, it will monitor progress and transfer results back to the execution host once the run is complete. It runs all jobs with a common credential owned by the hub, so individual users need not have an account or any credentials for the remote venue. The hub tracks all jobs, including those run on remote venues, so that if a security incident arises, a complete report can be generated for any affected venue. The same accounting is used to produce monthly reports of the overall simulation usage for each hub.
B. Simple Workflows: Parameter Sweeps The submit command can also manage parameter sweeps
with a very simple command line, as shown in Fig. 3(c). The -p flag indicates that the next argument is a parameter specification. In this case, the parameter @@res is taking three values: 100, 1k, and 10k. The @: prefix before the circuit file indicates that this file should be processed with parameter substitutions. In other words, the submit command treats circuit as a template file, and substitutes all occurrences of @@res with a particular parameter value. In this case, it produces three separate input files—one for each of the parameter values. Then, it automatically builds a Pegasus workflow to manage the jobs, and dispatches the workflow off to an appropriate venue. Since the optional –v argument was not specified in this case, the submit command will automatically select a venue that supports Pegasus job submission and data transfer interfaces, such as DiaGrid or Open Science Grid.
A simulation run may have multiple parameters. In Fig. 3(d), the parameter @@res is swept through three values, and the parameter @@cap is swept through three values. The submit command creates 9 different input files representing all possible combinations of these two parameters, builds a Pegasus workflow to manage the jobs, and then dispatches the workflow to an appropriate venue.
Instead of specifying input parameters on the command line, the values for all combinations of parameters can be stored in a comma-separated value (CSV) file. In Fig. 3(e), the arguments “-d indata.csv” indicate that parameter values should be loaded from the file indata.csv. The first line should contain the parameter names for the columns, such as “@@res,@@cap” in this example. Each of the remaining lines represents the parameter values for a single job, such as “100,1u” or “10k,100u” for this example. Passing parameters in this way is useful when the desired values are not a simple combination of values, but perhaps a series of values generated by a genetic optimization algorithm, or by a Latin Hypercube sampler.
Instead of relying on template files and parameter substitutions, the user may generate a series of separate input files. For example, suppose a user has 100 different circuit files to evaluate. The syntax shown in Fig. 3(f) supports this scenario. The arguments “-p @@num=1:100” define a parameter @@num that takes on integer values from 1 to 100. In this case, the circuit input file is specified as circuit@@num, so the submit command builds a Pegasus workflow with 100 different command lines, substituting the value of @@num for each job to produce commands like “spice3 –b circuit1”,
“spice3 –b circuit2”, and so forth, referencing the series of numbered files that the user created by hand for this run.
Input files can also be recognized using glob-style pattern matching. The arguments “-p @@file=glob:circuit*” in Fig. 3(g) define a parameter named @@file that takes on all values matching the glob-style pattern circuit*. With this syntax, the files could be distinguished by different numbers, different letters, or other naming conventions, but all files that submit can find matching circuit* will be simulated as separate cases, with @@file representing the whole name of each matching file, such as circuit1, circuit-2b, circuitXYZ, etc.
C. Customized Workflows in Pegasus More experienced users can learn how to create their own
customized Pegasus workflows. Each workflow is expressed as a high-level directed acyclic graph (DAG) called a DAX (for DAG XML description). Each node in the DAX represents a job in the workflow, and the edges between nodes represent data files that flow from one job to the next. The DAX is similar to the Condor DAGMan file [30] but at a higher level of abstraction so that it can be targeted to different execution environments.
Each DAX is ultimately expressed as an XML file. Writing that file by hand, however, can be tedious and impractical. Many developers prefer to express their workflow as small program written in Python, Java, or Perl. Pegasus provides Application Programming Interfaces (APIs) in these languages to help construct the needed XML. The workflow designer needs to build up the nodes and edges of a DAX object, and the API is used to write out the object in XML format. Running the program, therefore, produces a DAX file expressing the entire workflow, suitable for submission.
The submit command described earlier is also used to launch Pegasus workflows, as shown in Fig. 3(h). This time the programs being launched (such as spice3) do not appear on the command line; instead, they are encoded within the DAX description of the workflow, which in this case is a file named myworkflow.dax. The submit command invokes another program called pegasus-plan which reads the DAX, “compiles” the workflow for a specific execution venue, then launches the workflow and manages execution.
For example, the Moment Frame Earthquake Reliability Analysis tool, discussed in Section III.B, uses both the Python API provided by Pegasus and the submit command. At the launch of the simulation by the user, the tool invokes a shell script that first invokes a Python script (opensees-dax.py) to create the XML file and then invokes the submit command using the pegasus-plan program and the XML file to run the workflow on the OSG, as follows:
The workflow compilation or “planning” step is the
strength of the Pegasus approach. It optimizes the workflow by removing any branches where partial results are in place and
#!/bin/sh python opensees-dax.py –-nMat=$1 –-nMotion=$2 > dax.xml submit pegasus-plan --dax dax.xml
where dependencies are already satisfied. It also augments the workflow, adding tasks to stage data files in/out of remote resources, and to clean up unnecessary results after execution. And, it can partition the workflow and cluster short-running jobs together, so that they run more efficiently on a single compute node. It does all of this at a high-level, freeing the user from having to request or identify specific resources. During execution, Pegasus dispatches jobs, monitors progress, and automatically retries failing jobs so that sporadic failures do not derail the entire workflow. If a workflow does fail (for example, if the venue goes down, or if a particular job triggers a bug in the code), it can be corrected and restarted by the user. Pegasus will recognize partial results and pick up where it left off to complete the workflow.
V. BUILDING AND DEPLOYING APPLICATIONS
A. Graphical User Interfaces and the Rappture Toolkit Researchers can build their own graphical user interfaces
on top of the basic submit capability, so that other (perhaps less experienced) users can access a simplified interface and launch powerful workflows for targeted applications, as described earlier in Section III. Such tools can be created using MATLAB®, Java, Qt, GTK+, wxWidgets, or any other toolkit that runs under Linux/X11. For example, the interfaces for BLASTer and SubmitR were both created using Java and Python, respectively.
HUBzero’s Rappture toolkit provides an easy way to create such graphical interfaces. Rappture comes pre-installed within the Workspace tool and includes an interactive “builder” application for new tools. Researchers specify the inputs and outputs for each new tool by dragging objects from a palette of available controls and by dropping them into an interface specification tree. Each object is given a label, description, a default value, and other attributes, such as units of measure for numeric values. The builder provides a preview of the resulting interface and generates errors and warnings if any elements are missing or incomplete. The builder saves each interface in an XML description file, and it can also generate a skeleton for the main program of the tool in a variety of programming languages, including C/C++, Fortran, MATLAB, Octave, Java, Python, Perl, R, Ruby, and Tcl/Tk. The researcher modifies the body of the skeleton code to include the core of the tool, then runs the rappture command to produce the graphical interface.
However a graphical interface is created, it acts as an intermediary for the user, gathering input values, launching simulation runs, and plotting results. Remote jobs and workflow submissions are handled via something like the C language system() function, which forks and executes a separate shell process to handle a command line string with the submit command shown earlier in Fig. 3. Scripting languages are particularly well suited for this task, so it is quite common to build an interface tool in Python, for example, which calls submit to dispatch a complex workflow built from a series of C/C++ and Fortran programs.
B. Tool Publication Process HUBzero includes a powerful content management system
for uploading and deploying many different types of content,
including seminars, tutorials, teaching materials, and most importantly, computational tools. Any researcher within a particular hub community can click on the Upload link, fill out a form describing their new tool, and get immediate access to a private project area complete with a Subversion source code repository and a wiki area for project notes. The researcher can launch the Workspace tool, check out the latest source code, and compile and test within the workspace environment. The researcher can build Pegasus workflows and test them right at the command line by typing the command shown earlier in Fig. 3(h). Once that part is working, the researcher can create a graphical interface using Rappture or any other toolkit, and embed the same submit command within the code of their new tool.
Once the tool is working properly, the researcher can visit the page representing their tool contribution and click a link saying, “My code is committed, working, and ready to be installed.” This signals the hub administrators to check out the latest code, compile it, and install it in the official /apps directory under a subdirectory with the tool name and its revision number from the source code control system.
Once a tool is installed, the researcher receives a message to begin testing. Clicking a Launch Tool button brings up a preview of the final tool, exactly as other users of the hub would see it. Once the tool has been verified, the researcher can click a link saying, “My tool is working properly. I approve it.”
That prompts the hub administrators to take one last look, to verify that the tool is indeed functional and has an adequate description page, and then move the tool to the “published” state, where it becomes available to other users according to the restrictions set by the tool authors. A tool can be open to the world, or protected by export control, or accessible only by a certain group of users. If a tool is published as Open Source, an archive of the source code is presented for download alongside the Launch Tool button, and the terms of the Open Source license are clearly displayed on the tool page. All tools have a unique Digital Object Identifier (DOI), so they can be cited within academic publications.
C. Ongoing Tool Support The publication of a tool is not the end of the story. Other
users may encounter a bug in the tool and file a support ticket on the hub. Any ticket filed on a live tool session page is automatically routed to the tool authors and becomes their responsibility to fix. The authors receive email about the ticket, and they can see it listed on the My Tickets module within their My Account dashboard page. They can update the ticket to communicate with the user, check out the code within a Workspace, commit a fix, and close the ticket. When the code is ready for another release, the authors click a link saying, “I've made changes Please install the latest code for testing and approval.” This takes the tool back to the “updated” state, causing hub administrators to stage the latest version, letting the tool authors test and approve the latest version, leading to an updated tool publication.
Each tool also has its own question/answer forum for community discussion. Another user might not understand the
physics within the tool and post a question. One of the tool authors, or perhaps another user, might follow up with an answer. Researchers can have threaded discussions within the question/answer area, and they earn points for participation. The points can be redeemed for merchandise on some hubs, traded for other favors, or used as bragging rights.
End users may like a tool, but may have requests for improvement, such as support for extra model parameters or material types. They can post such ideas on the wish list for each tool. Other users can vote the ideas up or down. The tool authors can evaluate each wish on a scale of importance and effort, so that wishes can be sorted in order of priority. Ideas that are deemed important and low effort bubble up to the top of the list, while those that are unimportant and high effort sink to the bottom. When any wish is granted, the original user is notified and the tool author may earn points for fulfilling the request.
VI. INTEGRATION CHALLENGES During the integration work, we encountered some
challenges including data management, feedback and workflow progress in the user interface, and also providing workflow metrics from Pegasus to the HUBzero framework.
When the integration effort started, the most recent Pegasus release was version 3. The data management in that version was still based on a model of high-performance computing (HPC) systems, with assumptions such as a shared parallel filesystem being mounted on the compute nodes used for the workflow. Under this data management model, when a workflow was submitted, a particular compute resource had to be chosen, the data had to be transferred in to the shared filesystem, and after the jobs were run, the output data had to be staged out. These steps were handled by Pegasus, but the fact that a resource had to be chosen up-front meant that either the hub or the end user would have to select a resource to run on. In the case of high throughput workloads, for which it does not matter where the jobs run, selecting a resource was not a very user-friendly solution, since at any given moment, a particular resource might be heavily loaded or broken, while other venues might be working fine. This particular integration problem went away with the release of Pegasus 4.0. Two new data management approaches were added to support workloads that could either use Condor IO for file transfers, or a shared staging storage element (such a GridFTP or S3 server) for storing intermediate data products. Workflows could then span multiple compute resources. Today, most of the hub workflows are using a simple site catalog describing either DiaGrid or Open Science Grid as the target compute resource, and no jobs are bound to particular resources of those grids. The result of a simpler site catalog, a catalog, which describes the various available resources and the services they provide, and the improved data management in Pegasus 4.0, is that the researcher or workflow developer can more easily hand off workflows to the underlying infrastructure and worry less about where the jobs will be running.
Another integration challenge was how to provide better feedback to the user about the execution of the workflow. The interface to Pegasus is mostly command line tools, and even though there are tools like pegasus-status (which provides
a progress report), the question was how to provide the information back through the tool to the end user. In particular, we ran into a problem where planning a workflow was taking a long time—on the order of 30 minutes! During this time, there was no feedback to the user that the system was actually doing anything. We are still working on a solution to provide better output from the pegasus-plan operation, but once the workflow is planned and is running, the hub regularly runs pegasus-status and provides feedback to the user. Once the workflow has finished, the pegasus-statistics and pegasus-analyzer commands are run automatically to provide the user with summary statistics, and if something failed, a report on what failed. Improving these integration points is an ongoing effort for the HUBzero and Pegasus developers.
Some integration issues required just simple code changes. One example is how a report generated by the pegasus-statistics tool was modified to better match the data needed inside HUBzero. The changes included adding a few columns to the job/host breakdown, and providing the data in comma-separated value (CSV) format so that the HUBzero framework could easily import the data at the end of a workflow run.
VII. CONCLUSION The integration of Pegasus into the HUBzero framework
has brought the power of automated workflows to many more users. Expert users can launch a Workspace within a hub and gain immediate access to Pegasus and computational resources—without having to install or setup the Pegasus software, without having to apply for Grid credentials, and without having to learn complex Grid protocols. A simple submit command dispatches any single job or complex workflow off to remote facilities for execution. Expert users can experiment with such commands, use them in research activities, and wrap them into graphical user interfaces that are deployed as new tools for the community.
Without knowing a thing about workflows or high-throughput computing, others in the community can access such tools, enter their own input parameters, and launch a complex workflow with the press of a button. If the users have questions, they can post them for the tool authors and the rest of the community. They can post ideas about improving the tool, and submit bug reports when a tool fails or produces incorrect results. All of these capabilities are provided not just for one community or one site, but for 40+ sites built on the HUBzero platform. This improvement is bringing workflow automation and high-throughput computing to thousands of users around the world who will benefit from it without ever realizing the complexity.
REFERENCES [1] E. Deelman, G. Singh, M-H Su, J. Blythe, Y. Gil, C. Kesselman, G.
Mehta, K. Vahi, G.B. Berriman, J. Good, A. Laity, J.C. Jacob, D.S. Katz, Pegasus: a Framework for Mapping Complex Scientific Workflows onto Distributed Systems, Scientific Programming Journal, Vol 13(3), pages 219-237, (2005).
[2] D. Thain, T. Tannenbaum, M. Livny, "Distributed Computing in Practice: The Condor Experience" Concurrency and Computation:
Practice and Experience, Vol. 17, No. 2-4, pages 323-356, February-April, 2005.
[3] T. Oinn, M. Greenwood, M. Addis, et al., Taverna: lessons in creating a workflow environment for the life sciences. Concurrency Computat.: Pract. Exper., 18: 1067–1100 (2006). doi: 10.1002/cpe.993
[4] B. Ludäscher, I. Altintas, C. Berkley, et al., Scientific workflow management and the Kepler system. Concurrency Computat.: Pract. Exper., 18: 1039–1065, (2006). doi: 10.1002/cpe.994
[5] P. Kacsuk, Z. Farkas, M. Kozlovszky, G. Hermann, A. Balasko, K. Karoczkai, Istvan Marton, WS-PGRADE/gUSE Generic DCI Gateway Framework for a Large Variety of User Communities, J Grid Computing 10:601–630 (2012). DOI 10.1007/s10723-012-9240-5
[6] J. Goecks, A. Nekrutenko, J. Taylor, T.G. Team, Galaxy: a comprehensive approach for supporting accessible, reproducible, and transparent computational research in the life sciences. Genome Biol, 11(8), R86, (2010).
[7] J.L. Brown, C.S. Ferner, T.C. Hudson, et al., GridNexus: A Grid Services Scientific Workflow System, International Journal of Computer Information Science (IJCIS), Vol 6, No 2; June 20, 2005: 72-82.
[8] C.A. Goble, D.C. De Roure, myExperiment: social networking for workflow-using e-scientists. In Proceedings of the 2nd workshop on Workflows in support of large-scale science (WORKS '07). ACM, New York, NY, USA (2007). DOI=10.1145/1273360.1273361
[9] R. Pordes, et al., The open science grid, J. Phys.: Conf. Ser. 78, 012057 (2007).
[10] Purdue University, DiaGrid, http://diagrid.org, accessed March 14, 2013. [11] Extreme Science and Engineering Discovery Environment (XSEDE),
http://www.xsede.org, accessed March 14, 2013. [12] G. Singh, K. Vahi, A. Ramakrishnan, G. Mehta, E. Deelman, H. Zhao,
R. Sakellariou, K. Blackburn, D. Brown, S. Fairhurst, D. Meyers, G.B. Berriman. Optimizing Workflow Data Footprint, Special issue of the Scientific Programming Journal dedicated to Dynamic Computational Workflows: Discovery, Optimisation and Scheduling, 2007.
[13] S. Miles, E. Deelman, P. Groth, K. Vahi, G. Mehta, L. Moreau, Connecting Scientific Data to Scientific Experiments with Provenance, Third IEEE International Conference on e-Science and Grid Computing (e-Science 2007) 10-13 December 2007 in Bangalore, India
[14] S. Miles, P. Groth, E. Deelman, K. Vahi, G. Mehta, L. Moreau, Provenance: The Bridge Between Experiments and Data, Computing in Science & Engineering Volume:10 Issue:3 May-June 2008 Page(s):38-46.
[15] G. Klimeck, M. McLennan, S.P. Brophy, G.B. Adams III, M.S. Lundstrom, nanoHUB.org: Advancing Education and Research in
Nanotechnology, Computing in Science and Engineering, 10(5), pp. 17-23, September/October, 2008.
[16] M. McLennan, R. Kennell, HUBzero: A Platform for Dissemination and Collaboration in Computational Science and Engineering, Computing in Science and Engineering, 12(2), pp. 48-52, March/April, 2010.
[17] Statistics reported online at http://nanohub.org/usage, accessed March 14, 2013.
[18] Apache Project, Subversion, http://subversion.apache.org, accessed March 14, 2013.
[19] OpenVZ Linux Containers, http://openvz.org, accessed March 14, 2013. [20] T. Richardson, Q. Stafford-Fraser, K.R. Wood, A. Hopper, Virtual
network computing, Internet Computing, IEEE , vol.2, no.1, pp.33,38, Jan/Feb 1998, doi: 10.1109/4236.656066
[21] S. Maddineni, J. Kim, Y. El-Khamra, S. Jha, Distributed Application Runtime Environment (DARE): A Standards-based Middleware Framework for Science-Gateways, J Grid Computing, 10:647–664 (2012). DOI 10.1007/s10723-012-9244-1
[22] M. Pierce, S. Marru, R. Singh, A. Kulshrestha, K. Muthuraman, Open Grid computing environments: advanced gateway support activities, Proceedings of the 2010 TeraGrid Conference, TG ’10, pp. 16:1–16:9. ACM, New York (2010)
[23] F. McKenna, G.L. Fenves, M.H. Scott, OpenSees: Open system for earthquake engineering simulation. Pacific Earthquake Engineering Center, University of California, Berkeley, CA., http://opensees. berkeley. edu (2006).
[24] F. McKenna, C. McGann, P. Arduino; J.A. Harmon (2012), "OpenSees Laboratory," https://nees.org/resources/openseeslab, accessed March 14, 2013.
[25] C. Thompson, B. Raub, BLASTer, http://diagrid.org/resources/blastgui, accessed March 14, 2013.
[26] S. Altschul, W. Gish, W. Miller, E. Myers, D. Lipman, Basic local alignment search tool, Journal of Molecular Biology, 215 (3): 403–410, October 1990. doi:10.1016/S0022-2836(05)80360-2.
[27] R. Ihaka, R. Gentleman, R: A language for data analysis and graphics, Journal of Computational and Graphical Statistics, Vol. 5, Iss. 3, 1996.
[28] R. Campbell, SubmitR, https://diagrid.org/resources/submitr, accessed March 14, 2013.
[29] L.W. Nagel, D.O. Pederson, SPICE: Simulation program with integrated circuit emphasis. Electronics Research Laboratory, College of Engineering, University of California, 1973.
[30] J. Frey, T. Tannenbaum, I. Foster, M. Livny, S. Tuecke, "Condor-G: A Computation Management Agent for Multi-Institutional Grids.," Cluster Computing, vol. 5, pp. 237-246, 2002.