Embed Size (px)
Citation preview

Bringing more to the table
2006 Annual Report

PG. 14
global reach
PG. 14
bold flavors
PG. 15
Hormel Foodsaway from home
PG. 16
committed to making a difference
PG. 17 selected financial data
PG. 18 management’s discussion & analysis
PG. 38 report of management
PG. 39 report of public accounting firm
PG. 41 financial statements
PG. 45 financial notes
PG. 59 corporate officers
PG. 60 shareholder information
PG. 61 board of directors
Table of Contents
PG. 2
letter to shareholders
PG. 6
innovation driving growth
PG. 8
flavor and convenience
PG. 10
shelf-stable convenience
PG. 12
mainstreamingturkey
Financial Highlights
(In Thousands, Except Per Share Amounts) 2006 2005* % change
Net Sales $5,745,481 $5,413,997 6.1%
Net Earnings 286,139 254,603 12.4
Percent of Sales 4.98% 4.70%
Earnings Per Share
Basic $ 2.08 $ 1.84 13.0%
Diluted 2.05 1.82 12.6
Dividends to Shareholders 77,252 71,648 7.8
Per Share of Common Stock 0.56 0.52 7.7
Average Common Shares Outstanding
Basic 137,845 138,040 (0.1)
Diluted 139,561 139,577 0.0
Capital Additions $ 141,516 $ 107,094 32.1
Depreciation and Amortization 121,101 115,189 5.1
Working Capital 556,657 482,066 15.5
Shareholders’ Investment 1,802,912 1,598,730 12.8
*Restated for retrospective application of FIFO inventory valuation
Segment Operating Profit 2006(thousands)
28% Grocery Products $137,580
28% Refrigerated Foods $133,212
27% Jennie-O Turkey Store $128,734
10% Specialty Foods $ 48,579
7% All Other $ 33,222
Segment Sales 2006(thousands)
15% Grocery Products $ 846,494
51% Refrigerated Foods $2,958,365
19% Jennie-O Turkey Store $1,105,456
11% Specialty Foods $ 624,586
4% All Other $ 210,580

Hormel Foods Corporation was
founded in 1891 in Austin, Minn.
The company is a multinational
manufacturer and marketer of
consumer-branded food and
meat products, many of which
are among the best known and
trusted in the food industry. The
company leverages its extensive
expertise, innovation and high
competencies in pork and turkey
processing and marketing to
bring quality, value-added brands
to the global marketplace.
Grocery Products The Grocery Products segment
consists primarily of the processing, marketing and sale of shelf-stable food
products sold predominantly in the retail market. The SPAM family of products,
Hormel chili, shelf-stable microwave items and our ethnic items represent about
70 percent of the sales within this segment. Hormel Foods has eight brands in
this segment with the No.1 market share position.
PERCENT OF OPERATING PROFIT 2006 28%PERCENT OF SALES 2006 15%
Jennie-O Turkey Store The Jennie-O Turkey
Store segment consists primarily of the live production, processing, marketing
and sales of turkey products for retail, deli, foodservice and export customers.
Producing over 1,500 turkey items, Jennie-O Turkey Store’s strategy is to create
an everyday turkey eating occasion. Value-added sales were up 9 percent in 2006.
PERCENT OF OPERATING PROFIT 2006 27%PERCENT OF SALES 2006 19%

Refrigerated Foods The Refrigerated
Foods segment includes the Meat Products and Foodservice business
units. This segment consists primarily of the processing, marketing and
sale of fresh, pre-cooked and pre-flavored pork products for retail and
foodservice customers. This segment continues to make great progress
converting commodity items into higher margin value added products.
PERCENT OF OPERATING PROFIT 2006 28%PERCENT OF SALES 2006 51%
All Other The All Other segment includes
the Dan’s Prize and Hormel Foods International operating
segments. Dan’s Prize produces, markets and sells cooked
beef products through the foodservice channel and Hormel
Foods International sells company products internationally.
Hormel Foods International is focusing its growth in Asia.
Both businesses made strong contributions to the 48 percent
operating profit increase.
PERCENT OF OPERATING PROFIT 2006 7%PERCENT OF SALES 2006 4%
Specialty Foods The Specialty
Foods segment includes the Diamond Crystal Brands,
Century Foods International and Hormel Specialty Products
operating segments. This segment consists of the packag-
ing and sale of various sugar and sugar substitute products,
salt and pepper products, dessert mixes, gelatin products
and private label canned meats to retail and foodservice
customers. This segment also includes the processing,
marketing and sale of nutritional food products and
supplements to hospitals and nursing homes. All three
operating segments were significant contributors to the
78 percent increase in operating profit for the year.
PERCENT OF OPERATING PROFIT 2006 10%PERCENT OF SALES 2006 11%
Meat Products
Foodservice

Bringing more to the table For 115 years, we’ve made
our name with products that bring quality and taste to consumers’
eating experience. We have a long and proud tradition of bringing
more to the table for our employees, our consumers and our
investors. Our founder, George A. Hormel, coined the phrase,
“originate, don’t imitate.” His son, Jay C. Hormel, took that to heart,
bringing innovation to new products; a tradition we continue today.
At Hormel Foods, innovation is about meeting our consumers’ needs;
it’s about knowing what’s going to set us apart, what’s going to move
our products off the shelves and onto consumers’ tables.
$850million in sales from new productsintroduced since fiscal year 2000
Sales growth up
6%Cash flow back
to shareholders
Dividends of
$77million
$37million
in shares
repurchased
Valley Fresh, Inc., acquisition
positioned Hormel Foods
No.1in canned chicken category
EPS up13%3rd consecutive year of double-digit growth
brands in the No.1 or No. 2market shareposition
34year of
dividend
increases40thdividend
increase
in fiscal
year 20068%

2 Hormel Foods Corporation
Jeffrey M. Ettinger
Chairman of the Board,President and Chief Executive Officer
I am very pleased to report that 2006 was
another strong year for Hormel Foods.
With net sales increasing by 6 percent
and earnings per share up 13 percent,
we achieved our company-wide goal
of 5 percent top-line and 10 percent
bottom-line growth. While some of our
peers struggled to achieve results in an
environment of volatile protein markets,
our balanced model and value-added
branded products allowed us to deliver
superior growth.
We believe our unique balance of protein
and packaged food products is providing
the right mix to deliver both growth and
stability. Over the last 25 years, Hormel
Foods has only reported two down years
of earnings per share results and our
earnings per share have grown at a 10
percent compounded annual growth rate.
A big part of this success is our strategy
to develop and market branded
products that are both great tasting and
convenient. Today’s consumers want
products that are quick and easy to
make, without sacrificing taste. Our
products deliver these attributes. We
strive to be a leader in the categories
where we compete and we want
consumers to think of us first when
they think of meal solutions.
Innovation
Developing successful new products
is critical for our continued growth.
We have challenged ourselves to reach
$1 billion worth of product sales by the
end of 2009 from products that have
been introduced since 2000. I am
pleased to report we are ahead of
schedule, with $850 million of product
sales in 2006 from items introduced in
Dear fellow shareholders:
0
1
2
3
4
5
0605040302
Net Sales(billions $) CAGR 10.1%
$5.7
0
50
100
150
200
250
0605*04*03*02*
Net Earnings(millions $) CAGR 10.9%
$286.1
0.00
0.35
0.70
1.05
1.40
1.75
0605*04*03*02*
Net Earning Per Share(dollars) CAGR 11.0%
$2.05
.00
.10
.20
.30
.40
.50
0605040302
Annual Dividend(dollars) CAGR 9.5%
$0.56
*Restated for retrospective application of FIFO inventory valuation

3Bringing More to the Table
this decade. We have formalized our
new product development process
with a new product development team.
Our “rookie of the year” in 2006 was our
Natural Choice line of lunchmeat and
deli items. These items are preservative-
free and a perfect fit for the growing
demand for natural products.
Acquisitions
We acquired Valley Fresh, Inc. in 2006
to further strengthen our portfolio within
our Grocery Products business segment.
Valley Fresh has the leading market
share in the canned ready-to-eat chicken
category. We also announced a merger
agreement with Provena Foods, a pep-
peroni manufacturing company. Provena
will supply additional capacity allowing
us to grow our pepperoni business and
will provide us with a strategic West
Coast production facility. We continue
to look for acquisitions that strategically
fit our organization.
Cash Flow Back to
Shareholders
In addition to making acquisitions and
reinvesting in our business through
capital expenditures and marketing
spending, we returned a portion of the
cash flow to our shareholders through
dividends and a share repurchase
program. In 2006, we increased the
dividend for the 40th consecutive year,
a tribute to the strength and consistency
of our business model. Dividend
payments totaled $77 million for 2006.
Through our share repurchase program,
we purchased $37 million of stock
during the past fiscal year.
2006 Operating Performance
Our business has achieved remarkable
balance between our three largest seg-
ments: Grocery Products, Refrigerated
Foods and Jennie-O Turkey Store. In fis-
cal 2006, each contributed either 27 or
28 percent of our operating profit. Our
two smaller segments, Specialty Foods
and All Other, registered a spectacular
year in terms of growth in segment
profit, further diversifying our results.
Grocery Products
The microwave meals category was the
clear standout in our Grocery Products
segment in 2006, with sales up double-
digits for the fourth year in a row.
Additional capacity was added in March
to keep up with demand and we are
under construction to further increase
capacity in 2007. We also enjoyed strong
sales growth in our Hormel bacon bits
line of products in 2006. The results in
some of our canned meats franchises
(particularly Dinty Moore stew and
Stagg chili) were below expectations,
so we are escalating efforts to restore
momentum to these products.
Refrigerated Foods
Within our retail Meat Products group,
Hormel refrigerated entrees and Hormel
pepperoni were strong contributors
to both the top and bottom line. The
launch of our Hormel Natural Choice
line of products also boosted sales. Our
Foodservice business unit reported con-
tinued strong growth, led by products
with bold flavors such as our Austin
Blues barbeque and café h ethnic line
of products. Creating differentiated
products, such as Old Smokehouse
Applewood smoked bacon, has proven
successful as well. The Farmer John
business, purchased in 2005, did not
perform as well as expected in 2006.
Over time, we will take advantage
of the strength of the Farmer John
brand in the western United States to
convert more sales from commodity
items to a greater percentage of value-
added products.
Jennie-O Turkey Store
Although our results were below 2005
levels, Jennie-O Turkey Store still
registered excellent operating margins
in 2006. This segment was buoyed by
outstanding growth of value-added
products (+9 percent). Our strategy to
create convenience items, such as
Jennie-O Turkey Store rotisserie turkey
and flavored sliced lunchmeat, provides
consumers with an opportunity to enjoy
turkey year-round. As we look forward
to 2007, we expect corn and soymeal
markets to be higher than 2006, which
will increase the cost of production for
raising our turkeys.
Specialty Foods
In last year’s Chairman’s letter, we
identified that the realignment of our
Specialty Foods segment and the addi-
tion of Mark-Lynn Foods would be a
benefit in 2006. I am pleased to report
We believe our unique balance of protein and
packaged food products is providing the right mix
to deliver both growth and stability.

4 Hormel Foods Corporation
the results exceeded our expectations,
reporting 20 percent top-line and 78
percent operating profit growth. This
made Specialty Foods the largest con-
tributor to our total company’s growth
in segment earnings in 2006. All three
businesses, Diamond Crystal, Specialty
Products and Century Foods, reported
significant improvement within the seg-
ment. We continue to be optimistic about
the long-term growth of this segment and
the balance it provides to our portfolio.
All Other
Fiscal 2006 was a great year for our
All Other segment as well. Dan’s Prize
had another excellent year, further
expanding upon their position as a
top-tier supplier in the cooked beef
category. Hormel Foods International
reported very strong results, driven by
improved exports of the SPAM family
of products, Stagg chili and fresh pork
items. I was also pleased to see our
China operations continued to improve
their results. As we look to expand our
international presence, we believe Asia has
the best opportunities for Hormel Foods.
Senior Management/
Director Changes
I would like to recognize the important
contributions made by Michael J.
McCoy, executive vice president and
chief financial officer, who retires on
Dec. 31, 2006. Mike emphasized the
importance of controlling capital, kept
the company at the forefront of changes
in the area of corporate governance
and led the company in its most active
acquisition period in the history of the
company. We wish Mike and his wife,
Marge, a wonderful retirement.
We are fortunate to have great man-
agement depth and were pleased to
announce a number of promotions as
a result of Mike’s retirement. Jody H.
Feragen succeeds Mike as senior vice
president and chief financial officer,
effective Jan. 1, 2007. Jody was
promoted from her position as vice
president finance and treasurer. In
addition, Ronald W. Fielding was
promoted to executive vice president,
Grocery Products. Ron will continue his
responsibilities leading the Grocery
Products segment and will assume
additional responsibilities in company
acquisitions. Roland G. Gentzler, previ-
ously assistant controller and director
of Refrigerated Foods accounting,
succeeds Jody as vice president finance
and treasurer, effective Jan. 1, 2007.
Russell C. Potter, director of Grocery
Products production, was named vice
president, Grocery Products operations,
responsible for processing plant and
co-packer operations.
Joining the Board this year are Elsa
A. Murano, Ph.D., vice chancellor and
dean of agriculture at Texas A&M
University; Robert C. Nakasone,
previously chief executive officer of
Toys “R” Us and current chief executive
officer of NAK Enterprises, LLC; and
Dr. Hugh C. Smith, professor of medicine
at the Mayo Clinic College of Medicine
and consultant in the cardiovascular
division at Mayo Clinic.
Outlook
The long-term prospects for Hormel
Foods are promising. We will continue to
execute the strategies of growing our
branded/value-added business through
innovation and being a leader in the cat-
egories in which we compete. We have
the financial strength to grow organically
and through acquisitions, and we plan
to do both. Although 2007 looks likely to
be burdened with higher grain costs, we
expect another good year. Long-term,
we continue to maintain our growth tar-
gets of 5 percent top-line and 10
percent bottom-line.
I want to thank our more than 18,000
employees world-wide for their unyield-
ing commitment to product quality and
food safety, and I applaud them for their
continued spirit of innovation that is
keeping us at the forefront in so many
aspects of our business.
I also want to extend my personal thanks
to Joel Johnson as he concludes an
incredibly successful run with Hormel
Foods. Under his leadership, our sales
more than doubled, our earnings tripled,
and our stock increased in value nearly
four-fold. His mentorship of me and
many others here at Hormel Foods
has positioned us to build on our com-
pany’s long tradition of success.
Jeffrey M. Ettinger
Chairman of the Board,
President and Chief Executive Officer
The long-term prospects for Hormel Foods
are promising.
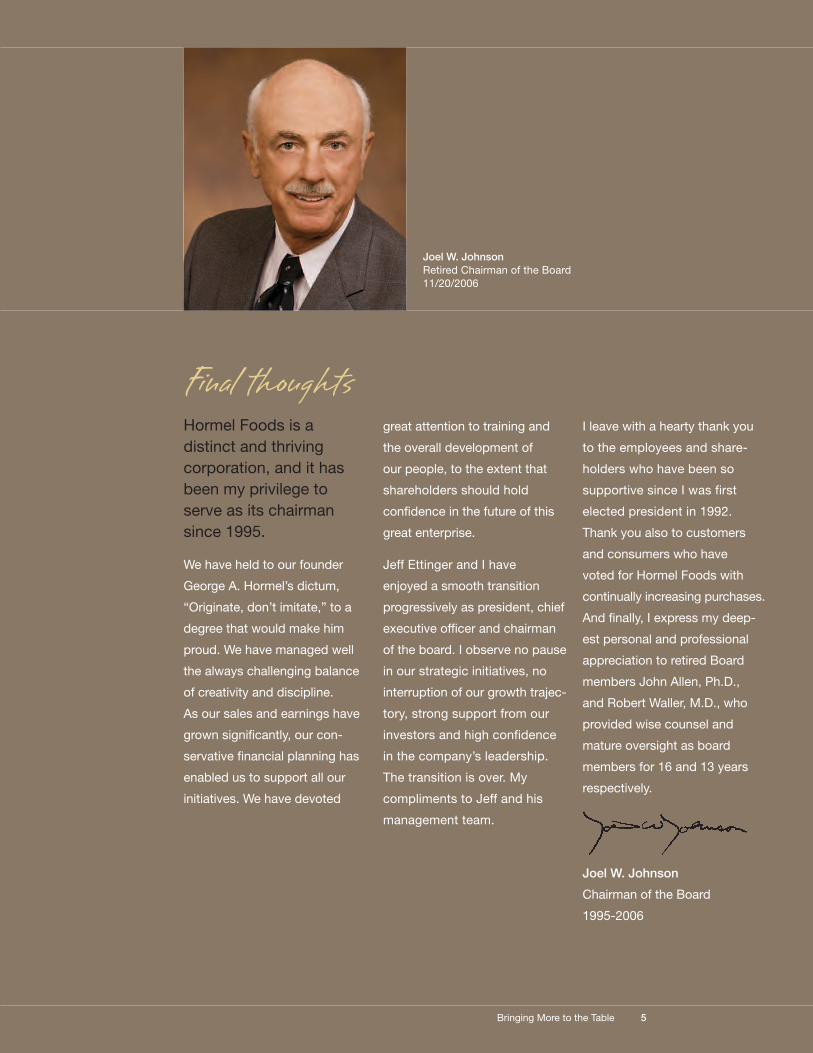
Joel W. Johnson
Retired Chairman of the Board11/20/2006
Hormel Foods is a
distinct and thriving
corporation, and it has
been my privilege to
serve as its chairman
since 1995.
We have held to our founder
George A. Hormel’s dictum,
“Originate, don’t imitate,” to a
degree that would make him
proud. We have managed well
the always challenging balance
of creativity and discipline.
As our sales and earnings have
grown significantly, our con-
servative financial planning has
enabled us to support all our
initiatives. We have devoted
great attention to training and
the overall development of
our people, to the extent that
shareholders should hold
confidence in the future of this
great enterprise.
Jeff Ettinger and I have
enjoyed a smooth transition
progressively as president, chief
executive officer and chairman
of the board. I observe no pause
in our strategic initiatives, no
interruption of our growth trajec-
tory, strong support from our
investors and high confidence
in the company’s leadership.
The transition is over. My
compliments to Jeff and his
management team.
I leave with a hearty thank you
to the employees and share-
holders who have been so
supportive since I was first
elected president in 1992.
Thank you also to customers
and consumers who have
voted for Hormel Foods with
continually increasing purchases.
And finally, I express my deep-
est personal and professional
appreciation to retired Board
members John Allen, Ph.D.,
and Robert Waller, M.D., who
provided wise counsel and
mature oversight as board
members for 16 and 13 years
respectively.
Joel W. Johnson
Chairman of the Board
1995-2006
Final thoughts
5Bringing More to the Table

6 Hormel Foods Corporation
Hormel Foods has built a portfolio of products to meet consumers’ ever-changing demands
With a growing focus on health and
wellness from consumers, Hormel
Foods made the strategic decision
to roll out a new, innovative product
line this past year.
Hormel Natural Choice products
are made with all natural ingredients,
no preservatives and no artificial
colors or flavors yielding a great tasting
product. Appealing to a range of
consumers, the Hormel Natural Choice
product line offers nutritious and flavor-
ful products, such as deli sandwich
meats, turkey breasts and hams.
Hormel Natural Choice deli sandwich
meats are low in fat, offering consumers
a great-tasting, convenient, nutritious
sandwich meat that they can easily
find in their grocer’s lunchmeat section.
Using our TrueTaste technology,
Hormel Natural Choice pre-sliced deli
sandwich meats maintain their great
taste and stay fresh longer.

Award-winning innovation
Consumers have embraced Hormel
Natural Choice deli sandwich meats.
Launched in March 2006, Hormel
Natural Choice has reached 73 percent
distribution, according to ACNielsen
data ending Oct. 21, 2006. Hormel
Natural Choice has been honored with
five awards from industry publications
for its innovation in deli sandwich meat.
7Bringing More to the Table

8 Hormel Foods Corporation
Innovative packaging, sophisticated flavors and value-added options that are pre-cooked
In today’s busy household, providing a
quick, convenient meal that is packed
full of flavor is essential. Lloyd’s
barbeque is a trusted brand for quality,
flavorful barbeque products.
The bold flavors available in Lloyd’s
tubs offer versatility to everyday
consumers. Whether placed on a bun,
in a wrap or a sub sandwich, the slow-
cooked, shredded meat in Lloyd’s tubs
please every member of the family.

9Bringing More to the Table
Relevant to consumers
Products such as Hormel refrigerated
entrees offer consumers convenient
choices that are fully cooked and sea-
soned. Made from quality cuts of meat,
Hormel refrigerated entrees offer
traditional, savory home-style entrees
ready in only four minutes.
Hormel refrigerated entrees lead the
traditional refrigerated entree segment
with 87 percent distribution, according
to ACNielsen data ending Oct. 21,
2006, and a 41 percent market share.

10 Hormel Foods Corporation
Today’s consumers’ food agenda is focused onsingle-serve, shelf-stable mealsThe greater number of single-person
households has placed a growing
importance on offering variety in
single-serve meals.
Hormel microwave meals were the
first to market in the single-serve shelf-
stable category. These products align
with today’s consumer food agenda –
convenient, portable, good value
and health conscious.
Available in 17 varieties, the strong
brand name and heritage Hormel
Foods has in the protein business
has helped Hormel microwave meals
enjoy double-digit growth every year
for the last four years.
In addition to the popular options pic-
tured, four new varieties were launched
this year. These new microwave items
were significant contributors to the
billion dollar challenge.

11Bringing More to the Table
No prep, no mess
Families get busier by the minute
between work, school, voice lessons
and soccer practice, leaving little time
for a sit-down meal every night. By
offering a meal in seconds, with no
preparation and no mess to clean up,
Hormel Foods offers these busy con-
sumers the ultimate convenient meal.
Hormel microwave cups are a perfect
solution for a quick meal or snack. The
Kid’s Kitchen line is great for kids as a
tasty source of protein. With no prep
and no mess, these meals are ready
in 90 seconds. Adults can also enjoy
them as a delicious meal or snack at
work, at home or on the go, satisfying
hunger in today’s fast-paced world.

12 Hormel Foods Corporation
Delicious, ready-to-eat convenience
Jennie-O Turkey Store bone-in
rotisserie breast provides consumers
all white-meat, freshly roasted turkey
in their grocer’s deli section. Appealing
to the trend of more home-cooked,
quick-scratch meals, the Jennie-O
Turkey Store bone-in rotisserie breast
experienced double-digit (34 percent)
volume growth.
For the health-conscious consumer,
Jennie-O Turkey Store offers lean
ground turkey for their cooking needs.

13Bringing More to the Table
Any time of day, any meal occasion, any style of cooking
Meals made with premium Jennie-O
Turkey Store pre-sliced turkey breast
deliver on quality and taste.
Packaged in reusable containers,
this growing line of products meets
the time-starved consumers’ need
for convenience.

14 Hormel Foods Corporation
Adding bolder flavor to your menuOffering a variety of sauces, side
dishes and salsas, Hormel Foods has
a broad portfolio of ethnic products.
Representing the unique flavors of
Asian, Indian, Mediterranean and
Hispanic, Hormel Foods caters to
consumers looking for bold additions
to their palate.
Our breadth of Hispanic products
includes both authentic and more
mainstream offerings. Our Herdez line
offers more than 42 authentic Mexican
food products in the United States.
Herdez salsa is the No. 1 brand of
imported salsa consumed in the
United States today. For the consumer
looking for more mainstream Hispanic
products, Chi-Chi’s salsa is a flavorful
alternative. Appealing to busy families,
Chi-Chi’s tubs offer quick, tasty options
for tacos and burritos.
A balanced portfolio of products, markets and partners
Our International segment is an
important and growing part of the
Hormel Foods portfolio, with growth
coming from a successful combination
of exports and joint ventures located
around the world.
International export sales were up,
driven by sales of the SPAM family
of products, particularly the newly
introduced Stinky French Garlic
variety. Our China operations
continued to report strong top and
bottom line improvement, with food-
service sales leading the way.

15Bringing More to the Table
Continuing to outgrow the foodservice industry
Relationships with our employees,
customers, consumers and investors
are one of Hormel Foods key differen-
tiators and strengths. Our Foodservice
Division’s continued success shows
the importance Hormel Foods places
on fostering and growing these
relationships.
Hormel Foods’ Foodservice division
continued its success with pizza
toppings and other value-added items.
Old Smokehouse Applewood smoked
bacon, café h ethnic products, such
as osso bucco, and Austin Blues BBQ
all experienced double-digit growth.

16 Hormel Foods Corporation
Our consumers’ well-being is a
top priority and always has been.
Through innovative technology and
strict adherence to proven procedures,
Hormel Foods has established itself
as a trusted source in the industry and
a leader in food safety.
Hormel Foods employs 18,100 employ-
ees in multiple locations world-wide.
Our employees have access to out-
standing equipment, training and day-
to-day safety support in our facilities.
This dedicated effort has paid off with
exceptional safety records across our
company and an added benefit of
increased productivity.
Our care and concern extends to
the animals we use for production.
We are leaders in ensuring we raise,
transport and process our animals in
a humane manner with minimal stress.
Furthermore, some of the handling
procedures we created have been
adopted by national trade organizations,
and we were pioneers in the use of
anesthetizing techniques on animals
prior to processing.
For decades, more than a century
in some cases, we have operated in
many of our communities. We consider
ourselves more than a local employer –
we consider ourselves a good neighbor.
We founded The Hormel Foundation
in 1941 to serve the residents of the
small town where we began and the
surrounding area, Mower County, Minn.
We are addressing the hunger crisis
through a national protein partnership
with America’s Second Harvest, the
nation’s largest charitable hunger-relief
organization. In addition, through the
Hormel Foods Charitable Trust, we
have donated millions of dollars in cash
and product to various organizations
and projects that support education,
further the fight against hunger and
contribute to our local communities.
Hormel Foods’ legacy and future
are linked to our natural resources.
We take pride in our stewardship and
responsible use of our soil, air and
water by implementing programs to
protect these resources where we
operate both for today and the future.
We strive to limit packaging waste, use
energy-efficient lighting in our plants
and execute a waste management
system to ensure we minimize our
impact on the environment as we
conduct our day-to-day operations.
Integrity is more than a word at Hormel
Foods – it is the measure of how our
organization operates from top to
bottom. Long before scandals shook
corporate America, Hormel Foods had
governance policies and procedures
in place to ensure we operate in an
ethical manner. The high level of inde-
pendence of our Board of Directors
plays an active role in safeguarding
our commitment to shareholders.
Most of all, our business practices
are built on a heritage of trust. Trust
that we will act honorably with all
stakeholders, trust that our financial
reporting is accurate, trust that we
will deliver a wholesome product, trust
that we will honor our commitments.
More about our commitment to the
community can be found in our 2006
Citizenship Overview, which can be
found at www.hormel.com.
Bringing more to the table –a trusted partner, a solid long-term investment, a provider of jobs, a stable and rewarding career
Committed to Making a Difference

17Bringing More to the Table
Restated* Restated* Restated* Restated*
(In Thousands, Except Per Share Amounts) 2006 2005 2004 2003 2002
Operations
Net Sales $5,745,481 $5,413,997 $4,779,875 $4,200,328 $3,910,314 Net Earnings 286,139 254,603 233,550 186,403 188,981
% of net sales 4.98% 4.70% 4.89% 4.44% 4.83%EBIT (1) 450,709 425,939 380,377 311,413 317,701
% of net sales 7.84% 7.87% 7.96% 7.41% 8.12%EBITDA (2) 571,810 541,128 475,122 399,433 400,939
% of net sales 9.95% 9.99% 9.94% 9.51% 10.25%Return on Invested Capital (3) 13.91% 13.60% 13.43% 11.88% 13.12%
Financial Position
Total Assets $3,060,306 $2,846,560 $2,562,793 $2,424,076 $2,253,542 Long-term Debt
Less Current Maturities 350,054 350,430 361,510 395,273 409,648 Shareholders’ Investment 1,802,912 1,598,730 1,422,258 1,273,858 1,135,755
Selected Cash Flow Data
Depreciation and Amortization 121,101 115,189 94,745 88,020 83,238 Capital Expenditures 141,516 107,094 80,363 67,104 64,465 Acquisitions of Businesses 78,925 366,496 21,452 240,970 476 Share Repurchase 36,978 22,977 37,525 6,119 10,762 Dividends Paid 75,840 69,371 61,343 57,092 53,437
Common Stock
Basic Shares 137,845 138,040 138,596 138,440 138,706 Diluted Shares 139,561 139,577 140,179 139,710 140,292 Earnings per Share – Basic 2.08 1.84 1.69 1.35 1.36 Earnings per Share – Diluted 2.05 1.82 1.67 1.33 1.35 Dividends per Share 0.56 0.52 0.45 0.42 0.39 Shareholders’ Investment Per Share 13.10 11.60 10.32 9.19 8.21
*Restated for retrospective application of FIFO inventory valuation(1)Net earnings before income taxes plus interest expense, less interest and investment income(2)Net earnings before income taxes plus interest expense, depreciation and amortization, less interest and investment income(3)After-tax EBIT divided by total debt plus total shareholders’ investment
Selected Financial Data

18 Hormel Foods Corporation
Fiscal 2006: Fiscal 2006 was another record year for Hormel
Foods, with net sales, tonnage volume, and profits exceeding
the prior year. The company was able to deliver on its growth
objectives to grow top-line sales by five percent and bottom-
line net earnings by ten percent. The Specialty Foods and All
Other segments ended fiscal 2005 with strong results, and
that momentum carried into fiscal 2006, with these units
showing the largest operating profit increases over the prior
year. Due to higher input costs, the Jennie-O Turkey Store
segment reported decreased operating profits compared to a
record prior year, but still reported excellent growth on value-
added product lines. All the business units were negatively
impacted by higher fuel and energy costs for fiscal 2006.
The company’s balanced product portfolio was again evident in
fiscal 2006, as top-line growth was reported in all five segments.
Excluding the incremental impact of acquisitions, all segments
still reported favorable sales results compared to fiscal 2005,
demonstrating the company’s ability to grow core product cat-
egories with new value-added offerings and successful new
product initiatives. The return received from the company’s
ongoing investment in research and development was evident
during fiscal 2006, as $852,573 or 14.8 percent of net sales
were attributable to products introduced since fiscal 2000.
During fiscal 2006, the company completed the acquisition
of Valley Fresh and continued to gain efficiencies from the
integration of the four businesses acquired in fiscal 2005. The
Farmer John business did not perform as well as we had hoped
in 2006. We continue to emphasize converting its product
mix to value-added items and to leverage its strong brand
recognition on the West coast.
Fiscal 2007 Outlook: Overall, the company is well positioned
going into the next year. Through organic growth, innovation,
and strategic acquisitions, the company has built a well bal-
anced product portfolio that buffers the effects of fluctuations
in the protein cycle. The company will continue to focus on
new product development, building brand awareness, and
the expansion of value-added product lines during fiscal 2007.
Additional marketing to support the company’s branded
products is expected, which should continue to enhance the
results for these product lines.
The most significant risk to fiscal 2007 results is the potential
impact of higher grain prices. The largest impact of these
higher prices will be on the Jennie-O Turkey Store segment.
The company intends to pursue pricing strategies which will
pass a portion of these additional costs on to customers. Our
value-added product initiatives should also help alleviate some
of the cost increases. The higher grain prices will not have as
significant an impact on our pork input costs, as most of our
hog contracts have been converted to market-based formulas.
The company also announced two acquisitions that were
completed subsequent to the end of the fiscal year, which will
further expand the company’s portfolio and expand production
capacity in fiscal 2007. The company intends to continue
providing shareholder value through acquisition opportunities
that are accretive to the overall business and complement
current product offerings.
Hormel Foods’ discussion and analysis of its financial condi-
tion and results of operations are based upon the company’s
consolidated financial statements, which have been prepared
in accordance with U.S. generally accepted accounting princi-
ples. The preparation of these financial statements requires
the company to make estimates and judgments that affect the
reported amounts of assets, liabilities, revenues and expenses,
and related disclosure of contingent assets and liabilities.
The company evaluates, on an on-going basis, its estimates
for reasonableness as changes occur in its business environ-
ment. The company bases its estimates on experience, the
use of independent third-party specialists, and various other
assumptions that are believed to be reasonable under the
circumstances, the results of which form the basis for making
judgments about the carrying values of assets and liabilities
that are not readily apparent from other sources. Actual results
may differ from these estimates under different assumptions
or conditions.
Critical accounting policies are defined as those that are
reflective of significant judgments, estimates, and uncertain-
ties, and potentially result in materially different results under
different assumptions and conditions. Hormel Foods believes
the following are its critical accounting policies:
Inventory Valuation: The company values its pork inventories
at the lower of cost or USDA market prices (primal values).
When the carcasses are disassembled and transferred from
primal processing to various manufacturing departments, the
primal values, as adjusted by the company for product specifi-
cations and further processing, become the basis for calculating
inventory values. Turkey raw materials are represented by
the deboned meat quantities. The company values these raw
materials using a concept referred to as the “meat cost pool.”
The meat cost pool is determined by combining the cost to
grow turkeys with processing costs, less any net sales revenue
from by-products created from the processing and not used
in producing company products. The company has developed
a series of ratios using historical data and current market
conditions (which themselves involve estimates and judgment
determinations by the company) to allocate the meat cost pool
to each meat component. In addition, substantially all invento-
riable expenses, meat, packaging, and supplies are valued by
the first-in, first-out method.
Critical Accounting Policies
Executive Overview
Management’s Discussion and Analysis of Financial Condition and Results of Operations (In Thousands of Dollars, Except Per Share Amounts)

19Bringing More to the Table
The company changed its accounting method for certain
inventory items from last-in, first-out (LIFO) to first in, first out
(FIFO) effective with the first quarter of fiscal 2006. All prior year
information has been restated for the retrospective application
of this change in accounting principle. See additional discussion
in Note A of the Notes to Consolidated Financial Statements.
Goodwill and Other Intangibles: The company’s identifiable
intangible assets are amortized over their useful life, unless the
useful life is determined to be indefinite. The useful life of an
identifiable intangible asset is based on an analysis of several
factors including: contractual, regulatory, or legal obligations,
demand, competition, and industry trends. Goodwill and
indefinite-lived intangible assets are not amortized, but are
tested at least annually for impairment.
The goodwill impairment test is a two-step process performed
at the reporting unit level. The company’s current reporting
units represent operating segments (aggregations of business
units that have similar economic characteristics and share the
same production facilities, raw materials, and labor force).
First, the fair value of each reporting unit is compared with the
carrying amount of the reporting unit, including goodwill. The
estimated fair value of each reporting unit is determined on the
basis of estimated discounted cash flow. If the carrying value
exceeds the fair value of the reporting unit, then a second step
must be completed in order to determine the amount of good-
will impairment that should be recorded. In the second step,
the implied fair value of the reporting unit’s goodwill is deter-
mined by allocating the reporting unit’s fair value to all of its
assets and liabilities other than goodwill in a manner similar to
a purchase price allocation. The resulting implied fair value of
the goodwill that results from the application of this second
step is then compared to the carrying amount of the goodwill
and an impairment charge is recorded for the difference.
Annual impairment testing for indefinite-lived intangible assets
compares the fair value and carrying value of the intangible. The
fair value of indefinite-lived intangible assets is determined on
the basis of estimated discounted cash flows. If the carrying
value exceeds fair value, the indefinite-lived intangible asset is
considered impaired and an impairment charge is recorded for
the difference. Intangible assets that are subject to amortization
are evaluated for impairment using a process similar to that
used to evaluate elements of long-lived assets.
The assumptions used in the estimate of fair value are
consistent with historical performance and the estimates and
assumptions used in determining future profit plans for each
reporting unit. The company reviews product growth patterns,
market share information, industry trends, changes in distri-
bution channels, and economic indicators in determining the
estimates and assumptions used to develop cash flow and
profit plan assumptions.
Accrued Promotional Expenses: Accrued promotional
expenses are unpaid liabilities for customer promotional
programs in process or completed as of the end of the fiscal
year. There are two components to these liabilities: promotional
contractual accruals and voluntary performance accruals.
Promotional contractual accruals are based on agreements
with customers for defined performance. The liability relating
to these agreements is based on a review of the outstanding
contracts on which performance has taken place, but for
which the promotional payments relating to such contracts
remain unpaid as of the end of the fiscal year. Voluntary perfor-
mance accruals are funded through customer purchases and
are based on historical promotional expenditure rates by
product line. Significant estimates used to determine these
liabilities include the level of customer performance and the
historical promotional expenditure rate versus contracted rates.
Employee Benefit Plans: The company incurs expenses
relating to employee benefits such as noncontributory defined
benefit pension plans and postretirement health care benefits.
In accounting for these employment costs, management
must make a variety of assumptions and estimates including
mortality rates, discount rates, overall company compensation
increases, expected return on plan assets, and health care
cost trend rates. The company considers historical data as
well as current facts and circumstances when determining
these estimates. The company uses third-party specialists to
assist management in the determination of these estimates
and the calculation of certain employee benefit expenses.
Income Taxes: The company accounts for income taxes in
accordance with Statement of Financial Accounting Standard
No. 109, “Accounting for Income Taxes.” The company com-
putes its provision for income taxes based on the statutory
tax rates and tax planning opportunities available to it in the
various jurisdictions in which it operates. Significant judgment
is required in evaluating the company’s tax positions and
determining its annual tax provision. While the company
considers all of its tax positions fully supportable, the company
is occasionally challenged by various tax authorities regarding
the amount of taxes due. In evaluating the exposure associated
with various existing tax positions, the company establishes
reserves when it becomes likely that a tax position may be
challenged by tax authorities and that the company may not
fully sustain that tax position. The company adjusts these
reserves as facts and circumstances change. The company
believes that its reserves reflect the probable outcome of
known tax exposures. To the extent the company was to
favorably resolve matters for which accruals have been estab-
lished or be required to pay amounts in excess of its reserves,
the company’s effective tax rate would be impacted in the
year of resolution.

Overview
The company is a processor of branded and unbranded food
products for retail, foodservice, and fresh product customers.
The company operates in the following five segments:
Segment Business Conducted
This segment consists primarily of the
processing, marketing, and sale of shelf-stable
food products sold predominantly in the retail
market. This segment also includes the results of Valley Fresh,
Inc. (Valley Fresh) acquired in the second quarter of fiscal
2006, and Arriba Foods, Inc. (Mexican Accent), acquired in
the second quarter of fiscal 2005.
This segment includes the Meat Products and
Foodservice business units. This segment
consists primarily of the processing, marketing,
and sale of branded and unbranded pork products for retail,
foodservice, and fresh product customers. This segment also
includes the Precept Foods, LLC operation, which offers fresh,
case-ready, branded pork and beef products to its retail
customers. Precept Foods, LLC is a 51 percent owned joint
venture between Hormel Foods Corporation and Cargill Meat
Solutions Corporation (formerly Excel Corporation), a wholly
owned subsidiary of Cargill, Incorporated. Clougherty Packing
Company (Farmer John), which was acquired in December
2004, is included as an operating segment within Refrigerated
Foods, and the Meat Products business unit includes the
results of operations for Lloyd’s Barbeque Company (Lloyd’s),
which was acquired in April 2005.
This segment consists primarily of the
processing, marketing, and sale of branded
and unbranded turkey products for retail,
foodservice, and fresh product customers.
This segment includes the Diamond Crystal
Brands (DCB), Century Foods International
(CFI), and Hormel Specialty Products (HSP)
operating segments. This segment consists of the packaging
and sale of various sugar and sugar substitute products, salt
and pepper products, dessert mixes, gelatin products, and
private label canned meats to retail and foodservice customers.
This segment also includes the processing, marketing, and
sale of nutritional food products and supplements to hospitals,
nursing homes, and other marketers of nutritional products.
Diamond Crystal Brands includes the results of operations
for Hormel HealthLabs (HHL) and Mark-Lynn Foods Inc.
(Mark-Lynn), which was acquired in March 2005.
This segment includes the Dan’s Prize and
Hormel Foods International (HFI) operating
segments. These businesses produce, market,
and sell beef products and manufacture, market, and sell
company products internationally. This segment also includes
various miscellaneous corporate sales. Previously, this segment
also included Vista International Packaging, a manufacturer of
food packaging (i.e., casings for dry sausage), which was sold
in June 2004.
Fiscal Years 2006 and 2005:
Consolidated Results
Net Earnings: Net earnings for the fourth quarter of fiscal
2006 were $90,004, an increase of 9.5 percent compared to
earnings of $82,230 for the same period last year. Diluted
earnings per share were $.64 compared to $.59 for the same
period last year. Net earnings for the year increased 12.4
percent to $286,139 from $254,603 in fiscal 2005. Diluted
earnings per share for the same period increased to $2.05
from $1.82 in the prior year.
Fiscal 2006 pretax earnings include an $11,261 charge ($0.05
after-tax per diluted share) for expenses relating to non-qualified
plan settlements due to executive retirements, a $9,200 charge
($0.04 after-tax per diluted share) for stock option expense
recorded under SFAS 123(R), primarily due to retirements and
expensing of new option grants to retirement-eligible individuals,
and a $6,218 benefit ($0.03 after-tax per diluted share) from
a litigation settlement. Net earnings also benefited from a
reduced effective tax rate resulting from $8,238 ($0.06 after-tax
per diluted share) of discrete tax benefits recognized during
fiscal 2006, including the tax benefits related to a Medicare
subsidy, and the settlement of various state and federal tax
audits. On a combined basis, these items resulted in no
impact on diluted earnings per share.
Sales: Net sales for the fourth quarter increased to $1,557,309
from $1,477,908 in 2005, an increase of 5.4 percent. Net sales
for the twelve months of fiscal 2006 increased 6.1 percent to
$5,745,481 compared to $5,413,997 last year. Tonnage volume
for the fourth quarter increased 5.3 percent to 1.17 billion lbs.
from 1.11 billion lbs. last year. Tonnage volume for the year
increased 5.8 percent to 4.34 billion lbs. from 4.10 billion lbs.
in the prior year.
Net sales and tonnage volume comparisons were positively
impacted by the 2006 acquisition of Valley Fresh, which con-
tributed $13,577 of net sales and 9.2 million lbs. of tonnage
volume to the fourth quarter results, and $29,223 of net sales
and 19.6 million lbs. of tonnage volume to the total fiscal 2006
All Other
Specialty
Foods
Jennie-O
Turkey Store
Refrigerated
Foods
Grocery
Products
Results of Operations
20 Hormel Foods Corporation

21Bringing More to the Table
results. Fiscal 2006 comparisons for the full year were also
impacted by the 2005 acquisitions of Farmer John, Mexican
Accent, Mark-Lynn, and Lloyd’s. Excluding the incremental
impact of all acquisitions, net sales and tonnage volume
showed increases of 2.8 percent and 2.0 percent, respectively,
compared to fiscal 2005.
Gross Profit: Gross profits were $376,562 and $1,383,190 for
the quarter and year, respectively, compared to $368,161 and
$1,284,448 last year. As a percent of net sales, gross profit
decreased to 24.2 percent for the fourth quarter compared to
24.9 percent in 2005, and increased to 24.1 percent for the
year compared to 23.7 percent in 2005. Compared to an out-
standing fourth quarter in fiscal 2005, the Jennie-O Turkey
Store reported the largest decrease in margin percentage for
the quarter. Higher input costs were a significant factor as
value-added sales demand exceeded the available supply of
breast meat, resulting in the need to purchase breast meat
while the market was very high. The Specialty Foods segment
offset a portion of these decreases with significant margin
increases for both the fourth quarter and fiscal year, driven by
favorable changes in product mix and production efficiencies
achieved in 2006. The All Other segment also contributed to
margin increases for the year, while the Grocery Products and
Refrigerated Foods segments maintained margins consistent
with fiscal 2005 levels. Margins for the full year also reflect
a $6,218 gain on litigation recognized in the third quarter of
fiscal 2006.
The company expects hog prices in 2007 to approximate
fiscal 2006 levels. The outlook for grain shows significantly
higher prices entering the upcoming year. Margins will likely
be pressured by this price increase, primarily in the Jennie-O
Turkey Store segment. The company intends to pursue pricing
strategies which will pass a portion of these additional costs
on to customers, and expects that additional growth on key
value-added product lines should also offset the incremental
expense in fiscal 2007.
Selling and Delivery: Selling and delivery expenses for
the fourth quarter and year were $187,257 and $754,143,
respectively, compared to $180,732 and $691,792 last year.
The company experienced significantly higher shipping and
handling costs throughout fiscal 2006, increasing $48,049 for
the twelve months compared to fiscal 2005. This increase
reflects increased tonnage volume, the impact of acquisitions
made in both fiscal 2006 and fiscal 2005, and substantially
higher freight and warehousing costs. As a percent of net
sales, selling and delivery expenses decreased to 12.0 percent
for the fourth quarter compared to 12.2 percent in 2005, and
increased to 13.1 percent for the year compared to 12.8
percent in 2005. Reduced marketing expenses contributed to
the percentage decrease for the quarter. Approximately $3,900
is also reflected in selling and delivery expense for fiscal 2006
related to settlements on non-qualified plans resulting from
executive retirements. As a percent of sales, the company
expects selling and delivery expenses to approximate 13.4
percent in fiscal 2007, with increased media and marketing
support behind the Hormel brand planned for 2007.
Administrative and General: Administrative and general
expenses were $44,829 and $182,891 for the quarter and year,
respectively, compared to $48,567 and $172,242 last year. As a
percent of net sales, administrative and general expenses for the
fourth quarter and year were 2.9 and 3.2 percent, respectively,
compared to 3.3 and 3.2 percent, respectively, for the quarter
and year in fiscal 2005. The decrease in the fourth quarter pri-
marily reflects retirement related benefits for executive officers
of approximately $6,000 that were recognized in the fourth
quarter of fiscal 2005. Intangible asset amortization related to
recent acquisitions increased $1,383 and $2,326 for the fourth
quarter and year, respectively, compared to fiscal 2005. Certain
expenses in fiscal 2006 also contributed to the increase for the
year. In the first quarter, the company recognized $9,200 of
stock option expense recorded under SFAS 123(R), primarily
due to executive retirements and expensing of new option
grants to retirement-eligible individuals. Approximately $5,800
has also been recognized in fiscal 2006 for expenses related
to settlements on non-qualified plans resulting from executive
retirements. Offsetting these items was a $2,286 gain on the
sale of a company airplane during the third quarter. The com-
pany expects administrative and general expenses, as a per-
cent of sales, to approximate 2.8 percent in fiscal 2007.
Research and development expenses for the fourth quarter
increased to $4,688 from $4,226 in the comparable quarter of
2005, and for the fiscal year increased to $18,631 from $17,585
in 2005. As new product development and the expansion of
value-added product lines continue to be priorities for the
company, research and development expenses are again
expected to increase during fiscal 2007.
Equity in Earnings of Affiliates: Equity in earnings of affiliates
was $843 and $4,553 for the quarter and year, respectively,
compared to $699 and $5,525 last year. The company’s
40 percent owned Philippine joint venture, Purefoods-Hormel
Company, reported lower results throughout fiscal 2006 (down
$242 and $1,360 for the fourth quarter and fiscal year, respec-
tively). Decreases were also experienced by the company’s
50 percent owned joint venture, Herdez Corporation, (down $152
and $446 for the fourth quarter and fiscal year, respectively.)
Minority interests in the company’s consolidated investments
are also reflected in these figures. In the third quarter of fiscal

22 Hormel Foods Corporation
2005, the company recorded a minority interest gain of $461
related to its ownership in the Beijing Hormel Foods Corporation.
Excluding this gain, minority interests represented reduced
losses of $463 and $1,204 for the fourth quarter and fiscal
year, respectively, compared to 2005.
Subsequent to the end of fiscal 2006, the company completed
a new joint venture agreement with San Miguel Corporation for
a hog production and processing business in Vietnam. The
company has a preliminary investment in this joint venture of
$20,483, and the 49 percent equity ownership will be reported
in the Hormel Foods International operating segment. Due to
this new agreement, as well as planned improvements on
existing joint ventures, the company expects equity in earnings
of affiliates to increase in fiscal 2007.
In conformity with U.S. generally accepted accounting
principles, the company accounts for its majority-owned
operations under the consolidation method. Investments in
which the company owns a minority interest are accounted
for under the equity or cost method. These investments,
along with receivables from other affiliates, are included in
the balance sheet line item “Investments in and receivables
from affiliates.” The composition of this line item at October 29,
2006, was as follows:
Country Investments/Receivables
United States $24,929
Philippines 46,650
Mexico 5,105
Total $76,684
Income Taxes: The company’s effective tax rate for the fourth
quarter and year was 36.2 and 33.5 percent, respectively, in
fiscal 2006 compared to 38.1 and 37.4 percent, respectively,
for the quarter and year in fiscal 2005. The decrease in the
rates compared to fiscal 2005 primarily represents the benefits
from a domestic manufacturing activities tax deduction that
was effective for the company beginning in fiscal 2006. The
company also recognized $8,238 of discrete tax benefits in
fiscal 2006, including a first quarter discrete item recorded
for a tax benefit related to a Medicare subsidy, and benefits
related to the settlement of various state and federal tax audits
throughout fiscal 2006. The company expects the effective tax
rate in fiscal 2007 to approximate 35.3 to 35.8 percent.
Segment Results
Net sales and operating profits for each of the company’s segments are set forth below. The company is an integrated enterprise,
characterized by substantial intersegment cooperation, cost allocations, and sharing of assets. We do not represent that these
segments, if operated independently, would report the operating profit and other financial information shown below. (Additional
segment financial information can be found in Note K of the Notes to Consolidated Financial Statements.)
Fourth Quarter Ended Year Ended
Restated* Restated*
October 29, 2006 October 30, 2005 % Change October 29, 2006 October 30, 2005 % Change
Net Sales
Grocery Products $ 242,037 $ 232,801 4.0 $ 846,494 $ 799,291 5.9
Refrigerated Foods 770,560 739,466 4.2 2,958,365 2,801,632 5.6
Jennie-O Turkey Store 316,049 311,293 1.5 1,105,456 1,088,324 1.6
Specialty Foods 169,825 144,350 17.6 624,586 518,673 20.4
All Other 58,838 49,998 17.7 210,580 206,077 2.2
Total $1,557,309 $1,477,908 5.4 $5,745,481 $5,413,997 6.1
Segment Operating Profit
Grocery Products $ 46,671 $ 45,524 2.5 $ 137,580 $ 132,047 4.2
Refrigerated Foods 39,058 38,766 0.8 133,212 129,831 2.6
Jennie-O Turkey Store 36,700 41,549 (11.7) 128,734 136,071 (5.4)
Specialty Foods 15,045 8,303 81.2 48,579 27,310 77.9
All Other 11,683 8,658 34.9 33,222 22,384 48.4
Total segment operating profit 149,157 142,800 4.5 481,327 447,643 7.5
Net interest and investment income (4,207) (6,799) 38.1 (20,166) (19,213) (5.0)
General corporate expense (3,838) (3,239) (18.5) (30,618) (21,704) (41.1)
Earnings before income taxes $ 141,112 $ 132,762 6.3 $ 430,543 $ 406,726 5.9
*Retrospective application of FIFO inventory valuation (see Note A of the Notes to Consolidated Financial Statements)

23Bringing More to the Table
Grocery Products: Grocery Products net sales increased 4.0
percent for the quarter and 5.9 percent for the year compared
to fiscal 2005. Sales tonnage volume increased 1.0 percent for
the quarter and 6.1 percent for the year compared to year ago
results. Segment profit for Grocery Products increased 2.5
percent for the quarter and 4.2 percent for the year compared
to fiscal 2005. Raw material costs were mixed for most of the
year, with favorable conditions in pork raw materials used in
the SPAM family of products and bacon bits being offset by
higher costs for imported beef used in Stagg chili, Dinty Moore
beef stew, and hash products. The outlook for raw material
costs in the first quarter of fiscal 2007 is similar to costs at the
end of fiscal year 2006.
Full year comparisons are impacted by the acquisitions of
Mexican Accent in 2005 and Valley Fresh in the second quarter
of fiscal 2006, and fourth quarter comparisons are impacted
by the Valley Fresh acquisition. These acquisitions contributed
an incremental $10,952 and $31,984 to net sales, and 5,734,000
lbs. and 27,719,000 lbs. to tonnage volume for the quarter and
year, respectively. Excluding these acquisitions, net sales for
the segment decreased 0.7 percent and increased 1.9 percent
for the quarter and year, respectively, while tonnage volume
decreased 3.0 percent and increased 0.3 percent for the quarter
and year, respectively. Both of these acquisitions have been
fully integrated into the company’s direct sales force.
Segment results compared to the prior year fourth quarter
were driven by the continued success of the company’s
microwave line of products and the addition of Valley Fresh.
These products continue to receive strong consumer accep-
tance due to their convenience and the variety of products
offered. Tonnage volume on the microwave product line
increased 2,847,000 lbs. or 16.1 percent compared to the
fourth quarter of fiscal 2005. Other product lines in the
segment faced difficult comparisons to the fourth quarter of
fiscal 2005 due to strong sales as a result of the active hurri-
cane season. Declines in major product lines include the
SPAM family of products (down 512,000 lbs. or 2.5 percent),
Dinty Moore canned stew (down 3,175,000 lbs. or 18.4
percent), and Hormel chili (down 780,000 lbs. or 2.4 percent).
The company continually works to improve product formula-
tions and market penetration for existing product lines. In the
fourth quarter of fiscal 2006, the company reformulated the
recipe for bacon bits and pieces to result in a product with
more of a “homestyle” texture and appearance. Consumer
research has shown a favorable response to the change thus
far. The segment is also in the process of repositioning the
Stagg line of chili products to focus on the western half of the
United States. This is consistent with the product line’s posi-
tioning prior to a national roll-out approximately two years
ago, and Hormel chili will be more aggressively marketed in
areas where Stagg will no longer compete.
Refrigerated Foods: Net sales by the Refrigerated Foods
segment were up 4.2 percent for the quarter and 5.6 percent
for the twelve months compared to fiscal 2005. Sales tonnage
increased 5.2 percent for the quarter and 7.0 percent for the
fiscal year as compared to 2005. Net sales and tonnage
volume comparisons for the twelve months were positively
impacted by the fiscal 2005 acquisitions of Farmer John and
Lloyd’s. Excluding the incremental impact of these acqui-
sitions, net sales and tonnage volume increased 1.3 percent
and 2.7 percent respectively, compared to the prior year.
Segment profit for Refrigerated Foods increased 0.8 percent
in the fourth quarter, and 2.6 percent for the twelve months,
compared to fiscal 2005. Key primal markets returned to more
normal levels during the fourth quarter, with the exception
of hams which stayed at higher than expected levels. Belly
markets declined following the unexpected spike experienced
during the third quarter. The improved market conditions
resulted in improved margins across several key value-added
product categories. Segment profit for the quarter was impacted
by a $4,045 write-down on the company’s Houston, Texas
plant. The plant has been closed and will be sold, as its geo-
graphic location was not an efficient fit within the company’s
manufacturing system. For the fiscal year, operating profits also
reflect a $3,109 gain on litigation recognized in the third quarter.
Hog costs for the fourth quarter were comparable to the
prior year, but have decreased 8.4 percent for the full fiscal
year. The company expects markets to continue to decrease
slightly in the fiscal 2007 first quarter, to levels comparable
to the first quarter of fiscal 2006, while supply is expected
to increase approximately 1.5 percent in the upcoming year.
The current outlook also shows significantly higher grain costs
going into fiscal 2007. Although this will increase hog produc-
tion costs at Farmer John, the impact on other business units
in Refrigerated Foods is expected to be minimal as most hog
contracts have been converted to market-based formulas.
The company’s hog processing for the fourth quarter increased
4.2 percent to 2,380,000 hogs from 2,285,000 hogs for the
comparable period last year. For the fiscal year, hog processing
increased 6.7 percent to 9,160,000 hogs from 8,583,000 hogs in
fiscal 2005. Excluding Farmer John, hog processing increased
4.0 percent in fiscal 2006, compared to the prior year.

24 Hormel Foods Corporation
The Meat Products business unit reported strong fourth quarter
and fiscal year tonnage volume and operating profit results.
Fourth quarter increases over the prior year included Hormel
17 oz. refrigerated entrees (up 465,000 lbs. or 8.3 percent),
retail sliced pepperoni (up 629,000 lbs. or 17.9 percent), and
Hormel Always Tender flavored meats (up 848,000 lbs. or 13.7
percent). In the deli category, key product lines posting growth
over the prior year fourth quarter included Hormel party trays
(up 771,000 lbs. or 46.1 percent), and DiLusso Deli Company
products (up 329,000 lbs. or 32.8 percent). The national rollout
of Hormel Natural Choice pre-sliced deli sandwich meats has
also been very successful in fiscal 2006, resulting in an addi-
tional 2,120,000 lbs. for the fourth quarter and 5,910,000 lbs.
for the twelve months.
The Foodservice business unit reported a slight decrease in
tonnage for the fourth quarter, representing decreases in shelf-
stable products due to the timing of hurricane relief business
that shipped in the fiscal 2005 fourth quarter. Despite this
decrease for the quarter, tonnage for the fiscal year was up 3.8
percent and operating profits were up 20.6 percent compared
to fiscal 2005, driven by improved market conditions and
value-added growth. Key product lines posting double-digit
growth in the fourth quarter included BBQ/café h (up 482,000
lbs. or 12.8 percent), pizza toppings (up 931,000 lbs. or 10.2
percent), and premium pork (up 463,000 lbs. or 10.4 percent).
This business unit ended the year with a record tonnage week,
and that momentum is expected to continue into fiscal 2007.
The Precept Foods, LLC joint venture delivered a strong fourth
quarter, driven by the continued rollout of products to additional
locations for existing customers. Tonnage for case-ready beef
and pork products increased 3,264,000 lbs. or 58.4 percent
for the fourth quarter, and 13,260,000 lbs. or 66.4 percent for
the year compared to the fiscal 2005 comparable periods.
The company continues to pursue efficiencies from the 2005
acquisition of Farmer John. Although market conditions and
product mix issues negatively impacted operating profits in
fiscal 2006, new strategies are being implemented to enhance
Farmer John’s profitability in fiscal 2007. These include more
aggressive pricing strategies, expanded media campaigns,
and continued conversion to a more value-added product mix.
Two new acquisitions recently announced by the company will
also expand the Refrigerated Foods segment in fiscal 2007.
The acquisition of Provena Foods, which is expected to close
in December, 2006, adds capacity to grow the company’s dry
sausage business, and the acquisition of Saag’s Products, Inc.
enhances the company’s value-added product portfolio
with premium quality gourmet sausages and specialty smoked
meats. Farmer John will be a strategic raw material supplier
to both locations because of their geographic proximity
in California.
Jennie-O Turkey Store: Jennie-O Turkey Store (JOTS) net
sales for the quarter and year increased 1.5 and 1.6 percent,
respectively, compared to fiscal 2005 periods. Tonnage
volume remained flat for the fourth quarter and decreased
3.3 percent for the year compared to prior year results.
However, the segment continued to improve its value-added
versus commodity product mix. Over 60.0 percent of volume
was attributed to value-added products in fiscal 2006, which
exceeded a half billion lbs. for the first time.
Segment profit for JOTS decreased 11.7 percent for the fourth
quarter and 5.4 percent for the year compared to a record fiscal
2005. The decline in segment profitability for both the quarter
and year was due primarily to decreased commodity meat
volumes and higher meat input costs compared to the prior
year. In 2005, the company was able to capitalize on one-time
opportunities to procure additional turkeys which resulted in
increased harvest volume and higher commodity meat sales.
The opportunity to acquire additional turkeys was not available
in the current year. In addition, the company experienced flock
livability issues throughout fiscal 2006, which further reduced
meat availability. Strong demand for value-added products
also caused the company to acquire breast meat on the out-
side market at a cost higher than internal production costs,
which decreased gross margins. To compensate for this, the
segment increased the harvest of company-owned birds by
bringing them to market at a younger age than normal, which
caused unfavorable breast meat yields due to the reduction in
the age of harvested birds.
Segment profits did benefit from the continued emphasis on
value-added sales growth, which mitigated a portion of the
input cost increases. For the fourth quarter and year, each of
the segment’s value-added businesses surpassed prior year
revenue and tonnage levels. The Foodservice division led the
segment in growth in the fourth quarter with net sales up 16.3
percent and tonnage up 13.7 percent, through the marketing
of products such as Jennie-O Turkey Store turkey burgers (up
624,000 lbs. or 89.3 percent). The Deli division also reported
strong growth for the quarter as revenue increased 7.3 percent
and tonnage increased 6.4 percent. Gains were reported on
Jennie-O Turkey Store rotisserie turkey breast (up 857,000 lbs.
or 25.0 percent), Jennie-O Turkey Store Homestyle products
(up 814,000 lbs. or 23.9 percent), and Jennie-O Turkey Store
Premium Roasts (up 551,000 lbs. or 45.1 percent). The com-
pany’s retail division experienced continued success with
Jennie-O Turkey Store branded fresh whole birds (up 1,618,000
lbs. or 63.0 percent) and Jennie-O Turkey Store Oven Ready
turkeys (up 284,000 lbs. or 17.3 percent). During fiscal 2006,
the company also launched Jennie-O Turkey Store tub luncheon
meats, which continue to gain distribution and contributed
531,000 lbs. of volume to the fourth quarter of fiscal 2006.
For the fiscal year, operating profits also benefited from a
$3,109 gain on litigation recognized in the third quarter.

25Bringing More to the Table
Feed costs for both the fourth quarter and full year were
below fiscal 2005 levels. However, grain costs are expected to
be significantly higher in fiscal 2007, which could decrease
segment profitability. Some concern also exists in the industry
about high egg sets and poult placements and the impact they
could have on commodity meat and whole bird pricing in the
upcoming year. To combat raw material and market pressures,
the segment will pursue aggressive pricing strategies and
continue its focus on developing new value-added products
during fiscal 2007.
Specialty Foods: Specialty Foods net sales increased 17.6
percent for the fourth quarter and 20.4 percent for the twelve
months compared to fiscal 2005. Sales tonnage increased
15.3 and 17.3 percent for the quarter and twelve months,
respectively, compared to last year. Net sales and tonnage
volume comparisons for the twelve months were positively
impacted by the fiscal 2005 acquisition of Mark-Lynn.
Excluding the incremental impact of this acquisition, net sales
and tonnage volume increased 15.3 percent and 10.5 percent
respectively, compared to the prior year.
Specialty Foods segment profit increased 81.2 percent and
77.9 percent, for the quarter and fiscal year, respectively,
compared to fiscal 2005. All three operating segments within
the segment reported outstanding results for both the fourth
quarter and fiscal year, driven by adjustments to the product
portfolio and efficiencies added to the manufacturing process
throughout fiscal 2006. This segment continues to provide
diversification and balance within the company, which helps
buffer the effects of the protein cycle in other segments. The
company expects to further grow this segment in fiscal 2007,
but profits are expected to be more in line with the company’s
long-term growth guidance, rather than at the record levels
experienced in 2006.
HSP net sales and operating profit for the fourth quarter
of fiscal 2006 increased 9.7 and 51.9 percent, respectively,
compared to the prior year. Results were driven by gains in the
canned meat category, including increased sales for contract
packaging business (up approximately 122.0 percent com-
pared to fiscal 2005), and canned broth and chicken. Improved
margins were also noted on frozen ingredients, compared to
the fiscal 2005 fourth quarter.
DCB net sales and operating profit for the fourth quarter
of fiscal 2006 increased 11.4 and 41.3 percent, respectively,
compared to the prior year. Core products (including sugar
packets, sugar substitutes, canisters, and shakers) continued
to show strong growth during the fourth quarter. Sugar
substitute sales drove the increases for the quarter, with sales
up 33.7 percent compared to the fiscal 2005 fourth quarter,
as new customers were secured. Although sugar substitutes
continue to outperform other key product groups, growth is
expected to moderate in fiscal 2007 due to the maturing nature
of brands within the category. Gains were also noted on liquid
portions, blended products, and HHL dysphasia and malnutri-
tion products during the quarter.
CFI experienced the largest gains for the fourth quarter, with
net sales and operating profits up 71.6 and 531.1 percent,
respectively, compared to the prior year. Additional customers
secured during the year resulted in record production levels
for ready-to-drink products during the fourth quarter, and
production improvements completed in the third quarter have
enabled the company to accommodate that volume. Increased
sales of nutritional blends and jars also benefited the fourth
quarter and fiscal year.
All Other: All Other net sales increased 17.7 percent for the
fourth quarter and 2.2 percent for the year compared to the
comparable fiscal 2005 periods. Segment profit increased
34.9 and 48.4 percent for the quarter and year, respectively,
compared to last year. Both operating segments, HFI and
Dan’s Prize, contributed to the improved results.
HFI net sales increased 17.6 percent in the fourth quarter and
3.2 percent for the twelve months of fiscal 2006, reflecting a
planned reduction in picnic sales in the first half of 2006.
Operating profit increased 22.4 percent and 70.9 percent for
the quarter and year, respectively, compared to fiscal 2005.
Export sales drove both the top and bottom line results,
representing notable fourth quarter volume gains on pork
exports (up 1,317,000 lbs. or 10.4 percent), the SPAM family
of products (up 651,000 lbs. or 13.5 percent), and Stagg chili
(up 227,000 lbs. or 12.6 percent) compared to fiscal 2005.
Twelve month comparisons are impacted by the reduction in
the financial reporting lag on HFI’s joint ventures and wholly
owned Australian subsidiary to one month. These entities
were previously reported on a two to three month lag, and the
adjustment increased all operating measures for the first
quarter of fiscal 2005. On a comparable year-to-year basis,
total export sales increased 2.9 percent compared to the prior
fiscal year.
Improved results from HFI’s China joint ventures also enhanced
operating profits in fiscal 2006. Lower raw material costs and
growth across all product categories contributed to the posi-
tive results. Although, overall China continues to be in a loss
position, operating profits improved $600 and $2,135 for the
fourth quarter and year, respectively, compared to fiscal 2005.

26 Hormel Foods Corporation
Dan’s Prize, Inc., the company’s wholly owned marketer and
seller of beef products, finished the fiscal year with strong
fourth quarter net sales and tonnage volume results (up 21.2
and 18.3 percent, respectively), but total fiscal 2006 net sales
and tonnage were flat compared to fiscal 2005. Operating
profits increased 53.1 and 29.9 percent for the fourth quarter
and fiscal year, respectively, due to strong fourth quarter sales
of cooked beef items, continued pricing discipline, overhead
cost controls, and lower raw material costs compared to the
prior year.
Unallocated Income and Expenses: The company does not
allocate investment income, interest expense, and interest
income to its segments when measuring performance. The
company also retains various other income and unallocated
expenses at corporate. These items are included in the
segment table for the purpose of reconciling segment results
to earnings before income taxes.
Net interest and investment income for the fourth quarter and
year was a net expense of $4,207 and $20,166, respectively,
compared to a net expense of $6,799 and $19,213 for the
comparable periods of fiscal 2005. Returns on investments
held in the company’s rabbi trust for supplemental executive
retirement plans and deferred income plans increased $530
compared to the prior year fourth quarter, but decreased
$2,326 for the full fiscal year. Additionally, the fourth quarter of
fiscal 2005 included $2,065 of write-downs of the company’s
investments. Interest expense of $25,636 for fiscal 2006
decreased from the prior year by $2,108, resulting from pay-
ments on long-term debt and lower short-term debt balances
during 2006 due to fewer acquisitions as compared to fiscal
2005. The only material debt balance remaining at the end of
fiscal 2006 relates to the company’s $350,000 senior notes
which mature in 2011. The company expects interest expense
to approximate $24,000 for fiscal 2007.
General corporate expense for the fourth quarter and year
was $3,838 and $30,618, respectively, compared to $3,239
and $21,704 for the prior year quarter and twelve months.
Fiscal 2006 results include $9,200 of stock option expense
recorded in the first quarter under SFAS 123(R), primarily due
to executive retirements and expensing of new option grants
to retirement-eligible individuals, and approximately $4,800
for expenses related to settlements on non-qualified plans
resulting from executive retirements. Expense related to
inventory valuation adjustments also increased $3,431 and
$6,686 for the fourth quarter and year, respectively. Offsetting
these items was a $6,000 charge for retirement related expenses
for executive officers recognized in the fourth quarter of fiscal
2005, and a $2,286 gain recorded on the sale of a company
airplane in the third quarter of fiscal 2006.
Fiscal Years 2005 and 2004:
The company’s accounting cycle resulted in a 13-week fourth
quarter and a 52-week year in fiscal 2005, compared with a
14-week fourth quarter and 53-week year in fiscal 2004. As
the company accounts for its operations on a weekly basis,
the additional week in fiscal 2004 was fully loaded with
expenses, including salaries and depreciation, and did not
provide a disproportionate amount of operating profit on a
comparable basis.
Consolidated Results
Net Earnings: Net earnings for the fourth quarter of fiscal
2005 were $82,230, an increase of 16.3 percent compared to
earnings of $70,720 for the same period in fiscal 2004. Diluted
earnings per share were $.59 compared to $.51 for the same
period in fiscal 2004. Net earnings for the year increased 9.0
percent to $254,603 from $233,550 in fiscal 2004. Diluted
earnings per share for the same period increased to $1.82
from $1.67 in the prior year.
Fiscal 2004 net earnings included an $11,470 after-tax gain
($0.08 per share) on the sale of Vista International Packaging,
Inc., a $3,963 after-tax gain ($0.03 per share) on the sale of
the company’s investment in Campofrio Alimentacion, S.A.
and a $2,672 ($0.02 per share) after-tax charge for early retire-
ment packages related to the company’s sales reorganization.
Sales: Net sales for the fourth quarter increased to $1,477,908
from $1,345,216 in 2004, an increase of 9.9 percent. Net sales
for the twelve months of fiscal 2005 increased 13.3 percent to
$5,413,997 compared to $4,779,875 in 2004. Tonnage volume
for the fourth quarter increased 12.2 percent to 1.1 billion lbs.
from 990 million lbs. in 2004. Tonnage volume for the year
increased 13.5 percent to 4.1 billion lbs. from 3.6 billion lbs.
in 2004.
Net sales and tonnage volume comparisons were positively
impacted by the 2005 acquisitions of Farmer John, Mexican
Accent, Mark-Lynn, and Lloyd’s. On a combined basis, these
acquisitions contributed $155,534 in net sales to the fourth
quarter results for fiscal 2005. Excluding these acquisitions,
both net sales and tonnage volume decreased 1.7 percent in
the fourth quarter compared to 2004. For the full 2005 fiscal
year, the acquisitions contributed a combined $488,715 in
net sales, representing 10.2 percentage points and 12.5
percentage points of the net sales and tonnage volume
increases, respectively.
Growth in key product lines, continued demand for value-
added product offerings, and successful new product
initiatives enhanced sales results throughout fiscal 2005.
Excluding the impact of acquisitions, all segments still
reported favorable sales results compared to fiscal 2004.

27Bringing More to the Table
Strong sales by Hormel Foods International, up 5.7 percent and
17.6 percent for the fourth quarter and fiscal year, respectively,
also offset the impact of divesting the Vista business during the
third quarter of fiscal 2004.
Gross Profit: Gross profits were $368,161 and $1,284,448
for the quarter and year, respectively, compared to $320,292
and $1,124,038 in 2004. As a percent of net sales, gross profit
increased to 24.9 and 23.7 percent for the fourth quarter and
year, respectively, compared to 23.8 and 23.5 percent for
the comparable periods in 2004. The Jennie-O Turkey Store
segment drove the increase for both the fourth quarter and
year, due to higher turkey meat markets, lower feed costs,
production efficiencies, and growth in value-added products.
Changes in the product mix, primarily due to the Farmer John
acquisition, negatively impacted margins compared to fiscal
2004. However, this impact was offset by significant decreases
in raw material costs during the fourth quarter, which resulted
in improved margins in the Grocery Products, Refrigerated
Foods, and All Other segments.
Selling and Delivery: Selling and delivery expenses for the
fourth quarter and year were $180,732 and $691,792, respec-
tively, compared to $166,196 and $621,694 in 2004. These
increases were primarily due to higher shipping and handling
expenses throughout fiscal 2005, representing increased ton-
nage volume, significantly higher fuel related charges, and
acquisitions. As a percent of net sales, selling and delivery
expenses decreased to 12.2 percent for the fourth quarter
compared to 12.4 percent in 2004, and decreased to 12.8 per-
cent for the year compared to 13.0 percent in 2004. Newly
acquired businesses with lower selling and delivery expense
ratios contributed to the decrease in fiscal 2005, and price
increases offset increases in selling expenses throughout the
fiscal year. A pre-tax charge of $4,194 was also recognized in
the second quarter of fiscal 2004 for early retirement packages
related to a reorganization of the company’s sales force.
Administrative and General: Administrative and general
expenses were $48,567 and $172,242 for the quarter and year,
respectively, compared to $38,779 and $146,488 in 2004. As
a percent of net sales, administrative and general expenses
for the fourth quarter and year were 3.3 and 3.2 percent,
respectively, compared to 2.9 and 3.1 percent, respectively,
for the quarter and year in fiscal 2004. Fiscal 2004 expenses
were decreased by reductions in post-retirement benefits of
$1,504 and $3,903 for the fourth quarter and year, respec-
tively, related to the Medicare Prescription Drug, Improvement
and Modernization Act of 2003. Items impacting fiscal 2005
included stock option expense increases over 2004 of $446
and $1,733 for the fourth quarter and year, respectively, and
retirement related benefits for executive officers of approximately
$6,000 recognized during the fourth quarter. Administrative
expenses related to acquisitions also contributed to the
increase for fiscal 2005, including intangible asset amortization
which increased $500 and $2,345 for the fourth quarter and
year, respectively, compared to fiscal 2004. These expenses
were partially offset by a reduction in bad debt expenses of
approximately $1,400 and $2,500 for the fourth quarter and
fiscal year of 2005, respectively.
Research and development expenses for the fourth quarter
decreased slightly to $4,226 from $4,434 in the comparable
quarter of 2004, and for the fiscal year increased to $17,585
from $15,944 in 2004. The decrease for the fourth quarter was
primarily due to the timing of new product introductions that
occurred late in fiscal 2004, and the year-over-year increase
was distributed across various segments.
Equity in Earnings of Affiliates: Equity in earnings of affiliates
was $699 and $5,525 for the quarter and year, respectively,
compared to $1,282 and $6,458 in 2004. This earnings line
reflected decreases from the company’s 50 percent owned
joint venture, Herdez Corporation, (down $207 and $476 for the
fourth quarter and fiscal year) and the company’s 40 percent
owned Philippine joint venture, Purefoods-Hormel Company
(down $208 and $201 for the fourth quarter and fiscal year).
These decreases were offset by favorable performance by the
company’s 49 percent owned joint venture, Carapelli USA,
LLC (up $103 and $427 for the fourth quarter and fiscal year)
and the company’s 50 percent owned joint venture, Hormel
Alimentos (up $177 and $140 for the fourth quarter and fiscal
year). Minority interests in the company’s consolidated invest-
ments are also reflected in these figures. In the third quarter of
fiscal 2005, the company recorded a minority interest gain of
$461 related to its ownership in the Beijing Hormel Foods
Corporation. Excluding this gain, minority interests represented
a decrease in income of $1,307 compared to fiscal 2004.
In conformity with U.S. generally accepted accounting principles,
the company accounts for its majority-owned operations under
the consolidation method. Investments in which the company
owns a minority interest are accounted for under the equity or
cost method. These investments, along with receivables from
other affiliates, are included in the balance sheet line item
“Investments in and receivables from affiliates.” The composi-
tion of this line item at October 30, 2005, was as follows:
Country Investments/Receivables
United States $22,863
Philippines 39,884
Mexico 5,280
Total $68,027
Income Taxes: The company’s effective tax rate for the fourth
quarter and year was 38.1 and 37.4 percent, respectively, in
fiscal 2005 compared to 36.5 percent for the quarter and year
in fiscal 2004. The increase in the effective rates for fiscal 2005
was the result of higher foreign taxes, the impact of updated
state tax rates on deferred tax balances, and the relationship
of permanent tax differences to income for the year.

28 Hormel Foods Corporation
Segment Results
Net sales and operating profits for each of the company’s segments are set forth below. The company is an integrated enterprise,
characterized by substantial intersegment cooperation, cost allocations, and sharing of assets. Therefore, we do not represent
that these segments, if operated independently, would report the operating profit and other financial information shown below.
(Additional segment financial information can be found in Note K of the Notes to Consolidated Financial Statements.)
Fourth Quarter Ended Year Ended
Restated* Restated* Restated* Restated*
October 30, 2005 October 30, 2004 % Change October 30, 2005 October 30, 2004 % Change
Net Sales
Grocery Products $ 232,801 $ 222,583 4.6 $ 799,291 $ 758,256 5.4
Refrigerated Foods 739,466 646,715 14.3 2,801,632 2,300,399 21.8
Jennie-O Turkey Store 311,293 317,323 (1.9) 1,088,324 1,052,682 3.4
Specialty Foods 144,350 116,946 23.4 518,673 467,581 10.9
All Other 49,998 41,649 20.0 206,077 200,957 2.5
Total $1,477,908 $1,345,216 9.9 $5,413,997 $4,779,875 13.3
Segment Operating Profit
Grocery Products $ 45,524 $ 43,950 3.6 $ 132,047 $ 128,838 2.5
Refrigerated Foods 38,766 38,713 0.1 129,831 141,361 (8.2)
Jennie-O Turkey Store 41,549 31,499 31.9 136,071 80,437 69.2
Specialty Foods 8,303 5,683 46.1 27,310 25,674 6.4
All Other 8,658 3,802 127.7 22,384 23,278 (3.8)
Total segment operating profit 142,800 123,647 15.5 447,643 399,588 12.0
Net interest and investment income (6,799) (5,198) (30.8) (19,213) (12,779) (50.3)
General corporate expense (3,239) (7,048) 54.0 (21,704) (19,211) (13.0)
Earnings before income taxes $ 132,762 $ 111,401 19.2 $ 406,726 $ 367,598 10.6
*Retrospective application of FIFO inventory valuation (see Note A of the Notes to Consolidated Financial Statements)
Grocery Products: Grocery Products net sales increased 4.6
percent for the quarter and 5.4 percent for the year compared
to fiscal 2004. Sales tonnage volume increased 3.1 percent
for the quarter and 0.7 percent for the year compared to fiscal
2004. Segment profit for Grocery Products increased 3.6
percent for the quarter and 2.5 percent for the year compared
to fiscal 2004. Raw material costs were below prior year and
expected levels during the fourth quarter, which resulted in
improved profit margins led by gains on the SPAM family of
products and Hormel flavored bacon bits. Segment profits for
the year were negatively impacted by significantly higher fuel
surcharges over fiscal 2004.
At the beginning of the fiscal 2005 third quarter, the company’s
sales force incorporated Mexican Accent’s products into its
portfolio of ethnic products. The acquisition has been accretive
to the Grocery Products segment, and the company continues
to pursue synergies with its other Hispanic product lines. The
acquisition contributed $6,665 and $20,008 to net sales, and
6,814,000 lbs. and 13,994,000 lbs. to sales tonnage for the
quarter and year, respectively. Excluding Mexican Accent, net
sales for the segment increased 1.6 percent and 2.8 percent for
the quarter and year, respectively, while sales tonnage declined
1.8 percent and 2.3 percent for the quarter and year, respectively.
Key product categories also contributed to tonnage volume and
profit increases in the Grocery Products segment compared to
the fiscal 2004 fourth quarter. Notable gains were experienced
in the microwave category (up 3,133,600 lbs. or 21.6 percent),
driven by the success of the Hormel microwave tray line, and
the SPAM family of products (up 268,000 lbs. or 1.3 percent).
These gains were offset primarily by declines in Stagg chili
(down 2,308,000 lbs. or 23.4 percent), as fiscal 2004 reflected
pipeline inventory gains when Stagg was introduced nationally.
Key categories also showing growth for the year included
the microwave category (up 7,700,000 lbs. or 15.1 percent),
Hormel chili (up 753,000 lbs. or 0.7 percent), and the SPAM
family of products (up 723,000 lbs. or 1.1 percent). Although
Dinty Moore canned products showed an overall decline for
fiscal 2005 (down 7,568,000 lbs. or 12.8 percent), improvements
were seen in the second half of fiscal 2005 as the company
explored options for improving sales in this category.
Efforts in the Grocery Products segment continued to be
focused on growth initiatives implemented during fiscal 2004.
The company continued to expand sales in the chili category.
While total chili shipments for the year were flat compared to
fiscal 2004, commitments were good for the 2005 winter chili
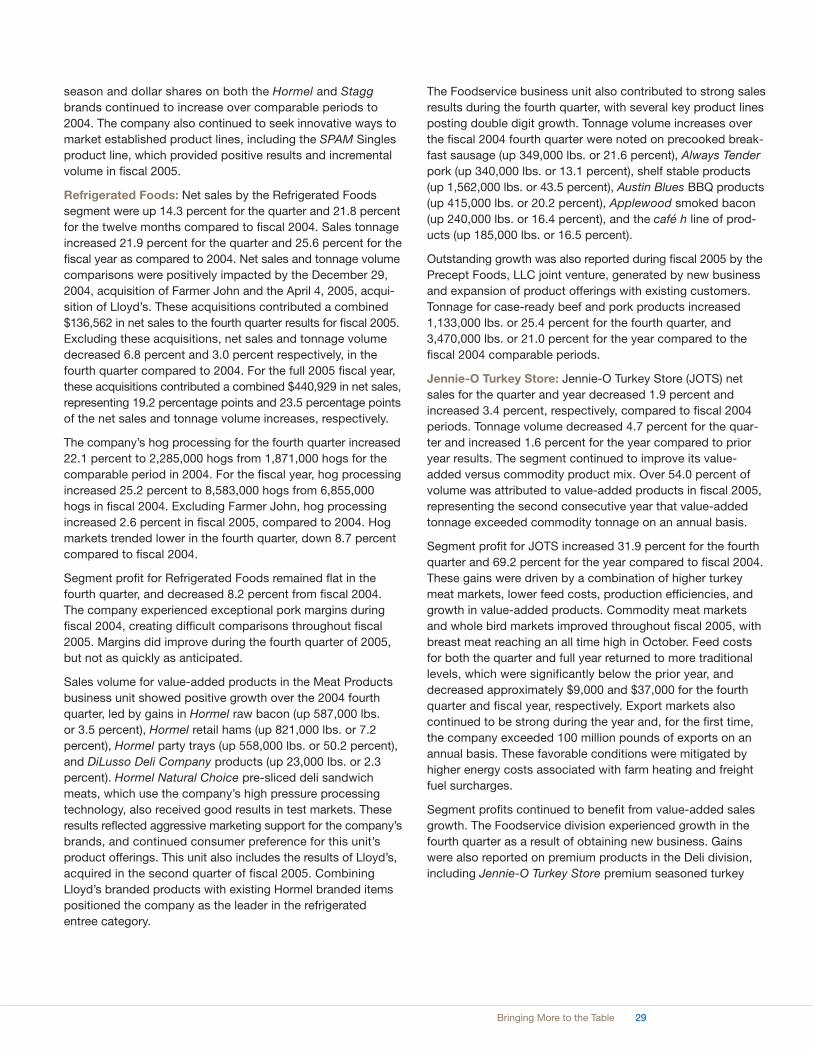
29Bringing More to the Table
season and dollar shares on both the Hormel and Stagg
brands continued to increase over comparable periods to
2004. The company also continued to seek innovative ways to
market established product lines, including the SPAM Singles
product line, which provided positive results and incremental
volume in fiscal 2005.
Refrigerated Foods: Net sales by the Refrigerated Foods
segment were up 14.3 percent for the quarter and 21.8 percent
for the twelve months compared to fiscal 2004. Sales tonnage
increased 21.9 percent for the quarter and 25.6 percent for the
fiscal year as compared to 2004. Net sales and tonnage volume
comparisons were positively impacted by the December 29,
2004, acquisition of Farmer John and the April 4, 2005, acqui-
sition of Lloyd’s. These acquisitions contributed a combined
$136,562 in net sales to the fourth quarter results for fiscal 2005.
Excluding these acquisitions, net sales and tonnage volume
decreased 6.8 percent and 3.0 percent respectively, in the
fourth quarter compared to 2004. For the full 2005 fiscal year,
these acquisitions contributed a combined $440,929 in net sales,
representing 19.2 percentage points and 23.5 percentage points
of the net sales and tonnage volume increases, respectively.
The company’s hog processing for the fourth quarter increased
22.1 percent to 2,285,000 hogs from 1,871,000 hogs for the
comparable period in 2004. For the fiscal year, hog processing
increased 25.2 percent to 8,583,000 hogs from 6,855,000
hogs in fiscal 2004. Excluding Farmer John, hog processing
increased 2.6 percent in fiscal 2005, compared to 2004. Hog
markets trended lower in the fourth quarter, down 8.7 percent
compared to fiscal 2004.
Segment profit for Refrigerated Foods remained flat in the
fourth quarter, and decreased 8.2 percent from fiscal 2004.
The company experienced exceptional pork margins during
fiscal 2004, creating difficult comparisons throughout fiscal
2005. Margins did improve during the fourth quarter of 2005,
but not as quickly as anticipated.
Sales volume for value-added products in the Meat Products
business unit showed positive growth over the 2004 fourth
quarter, led by gains in Hormel raw bacon (up 587,000 lbs.
or 3.5 percent), Hormel retail hams (up 821,000 lbs. or 7.2
percent), Hormel party trays (up 558,000 lbs. or 50.2 percent),
and DiLusso Deli Company products (up 23,000 lbs. or 2.3
percent). Hormel Natural Choice pre-sliced deli sandwich
meats, which use the company’s high pressure processing
technology, also received good results in test markets. These
results reflected aggressive marketing support for the company’s
brands, and continued consumer preference for this unit’s
product offerings. This unit also includes the results of Lloyd’s,
acquired in the second quarter of fiscal 2005. Combining
Lloyd’s branded products with existing Hormel branded items
positioned the company as the leader in the refrigerated
entree category.
The Foodservice business unit also contributed to strong sales
results during the fourth quarter, with several key product lines
posting double digit growth. Tonnage volume increases over
the fiscal 2004 fourth quarter were noted on precooked break-
fast sausage (up 349,000 lbs. or 21.6 percent), Always Tender
pork (up 340,000 lbs. or 13.1 percent), shelf stable products
(up 1,562,000 lbs. or 43.5 percent), Austin Blues BBQ products
(up 415,000 lbs. or 20.2 percent), Applewood smoked bacon
(up 240,000 lbs. or 16.4 percent), and the café h line of prod-
ucts (up 185,000 lbs. or 16.5 percent).
Outstanding growth was also reported during fiscal 2005 by the
Precept Foods, LLC joint venture, generated by new business
and expansion of product offerings with existing customers.
Tonnage for case-ready beef and pork products increased
1,133,000 lbs. or 25.4 percent for the fourth quarter, and
3,470,000 lbs. or 21.0 percent for the year compared to the
fiscal 2004 comparable periods.
Jennie-O Turkey Store: Jennie-O Turkey Store (JOTS) net
sales for the quarter and year decreased 1.9 percent and
increased 3.4 percent, respectively, compared to fiscal 2004
periods. Tonnage volume decreased 4.7 percent for the quar-
ter and increased 1.6 percent for the year compared to prior
year results. The segment continued to improve its value-
added versus commodity product mix. Over 54.0 percent of
volume was attributed to value-added products in fiscal 2005,
representing the second consecutive year that value-added
tonnage exceeded commodity tonnage on an annual basis.
Segment profit for JOTS increased 31.9 percent for the fourth
quarter and 69.2 percent for the year compared to fiscal 2004.
These gains were driven by a combination of higher turkey
meat markets, lower feed costs, production efficiencies, and
growth in value-added products. Commodity meat markets
and whole bird markets improved throughout fiscal 2005, with
breast meat reaching an all time high in October. Feed costs
for both the quarter and full year returned to more traditional
levels, which were significantly below the prior year, and
decreased approximately $9,000 and $37,000 for the fourth
quarter and fiscal year, respectively. Export markets also
continued to be strong during the year and, for the first time,
the company exceeded 100 million pounds of exports on an
annual basis. These favorable conditions were mitigated by
higher energy costs associated with farm heating and freight
fuel surcharges.
Segment profits continued to benefit from value-added sales
growth. The Foodservice division experienced growth in the
fourth quarter as a result of obtaining new business. Gains
were also reported on premium products in the Deli division,
including Jennie-O Turkey Store premium seasoned turkey

30 Hormel Foods Corporation
breast (up 227,000 lbs. or 6.3 percent), the Jennie-O Turkey
Store Grand Champion line (up 144,000 lbs. or 13.3 percent),
and Jennie-O Turkey Store rotisserie turkey breast (up
805,000 lbs. or 30.7 percent).
In 2004, JOTS introduced Jennie-O Turkey Store Oven Ready
Turkey, a product that goes directly from freezer to oven.
During 2005, the product line was expanded to include a bone
in and boneless turkey breast. This product line continues to
be well received by retailers and consumers. The company
continually evaluates the performance of its new products,
and fiscal 2005 included net sales of approximately $123,700
attributable to products introduced since 2000.
Specialty Foods: Specialty Foods net sales increased 23.4
percent for the fourth quarter and 10.9 percent for the twelve
months compared to fiscal 2004. Sales tonnage increased
18.5 and 6.5 percent for the quarter and twelve months,
respectively, compared to 2004. Segment profit increased
46.1 percent and 6.4 percent, for the quarter and fiscal year,
respectively, compared to fiscal 2004. The acquisition of
Mark-Lynn Foods improved the fiscal 2005 results, contribut-
ing 10.5 percentage points and 5.9 percentage points of the
net sales increase for the fourth quarter and year, respectively.
Continued strength from core product sales at Diamond
Crystal Brands (DCB), contract manufacturing at Hormel
Specialty Products (HSP), and new production at Century
Foods International (CFI) also drove the sales increase for the
fourth quarter.
HSP net sales increased 25.1 percent for the fourth quarter
and 6.3 percent for the year compared to the same periods
in 2004. Higher net sales in the fourth quarter were attributed
to increased contract manufacturing of canned meats, along
with increases in the meat ingredients and refinery categories.
Margin percentages declined during fiscal 2005 due to
changes in product mix, higher dairy markets, and aggressive
cheese pricing. Freight and warehouse expense increases due
to higher fuel related costs also had a negative impact on
operating profits for the year.
DCB’s core product gross sales (including sugar packets, sugar
substitutes, canisters, and shakers) increased 12.7 percent
and 16.2 percent over the 2004 fourth quarter and fiscal year,
respectively. Sales of the HHL dysphasia and malnutrition
products ended the quarter down 5.1 percent. Defending
private label conversions and gaining operator compliance
helped offset lost contract sales in the nutritional category.
Mark-Lynn was successfully integrated into DCB as a fifth
processing facility during 2005, and expanded the company’s
market share in foodservice packets. This acquisition con-
tributed $12,307 and $27,778 to net sales for the fourth quarter
and fiscal year, respectively.
CFI sales increased 26.9 percent in the fourth quarter, but
decreased 3.5 percent for the year, compared to fiscal 2004
results. CFI faced a challenging year with volume declines
throughout the first three quarters due to the loss of a govern-
ment contract and lower nutritional sales. Customer and
product mix changes at CFI also negatively impacted the
segment earlier in the year. Significant improvements in the
fourth quarter were the result of the company’s efforts to
broaden its customer base.
All Other: All Other net sales increased 20.0 percent for the
fourth quarter and 2.5 percent for the year compared to the
comparable fiscal 2004 periods. Segment profit increased
127.7 percent and decreased 3.8 percent for the quarter and
year, respectively, compared to 2004. Comparisons for the fis-
cal year were impacted by the divestiture of Vista International
Packaging, Inc. (Vista) during the third quarter of fiscal 2004.
Hormel Foods International (HFI) experienced strong interna-
tional demand for commodity pork items throughout fiscal
2005, with export tonnage increasing to 88,036,000 lbs. or up
9.9 percent over fiscal 2004. Volume gains were also seen
on the SPAM family of products (up to 18,148,000 lbs. or up
2.4 percent) and Stagg chili (up to 6,234,000 lbs. or up 10.6
percent) compared to the prior year. These sales, combined
with improved results from the company’s China operations,
resulted in significant margin increases for the fourth quarter
and fiscal year. In the first quarter of fiscal 2005, HFI reduced
the financial reporting lag on its joint ventures and wholly
owned Australian subsidiary to one month (from a previous
two to three month lag). This adjustment increased tonnage
(up 4,546,000 lbs.), net sales (up $5,412), and segment profits
(up $453) for fiscal 2005. During the third quarter of fiscal 2005,
HFI also recorded a minority interest gain of $461 related to its
ownership in the Beijing Hormel Foods Corporation.
Dan’s Prize, Inc., the company’s wholly owned marketer and
seller of beef products, experienced tonnage decreases in
both the fourth quarter and fiscal year compared to 2004.
However, the fourth quarter results showed increased operat-
ing profits, resulting from margin growth due to favorable mar-
ket conditions and customer mix.
During the second quarter of fiscal 2004, the company com-
pleted the sale of its investment in Campofrio Alimentacion, S.A.
The $6,222 pre-tax gain recorded on the sale was excluded
from All Other operating profits, and included in “Net interest
and investment income.” The company also finalized the sale
of the Vista business during the third quarter of fiscal 2004.
The $18,063 pre-tax gain recorded on the sale was excluded
from All Other operating profits, and included in “General
corporate expense.”
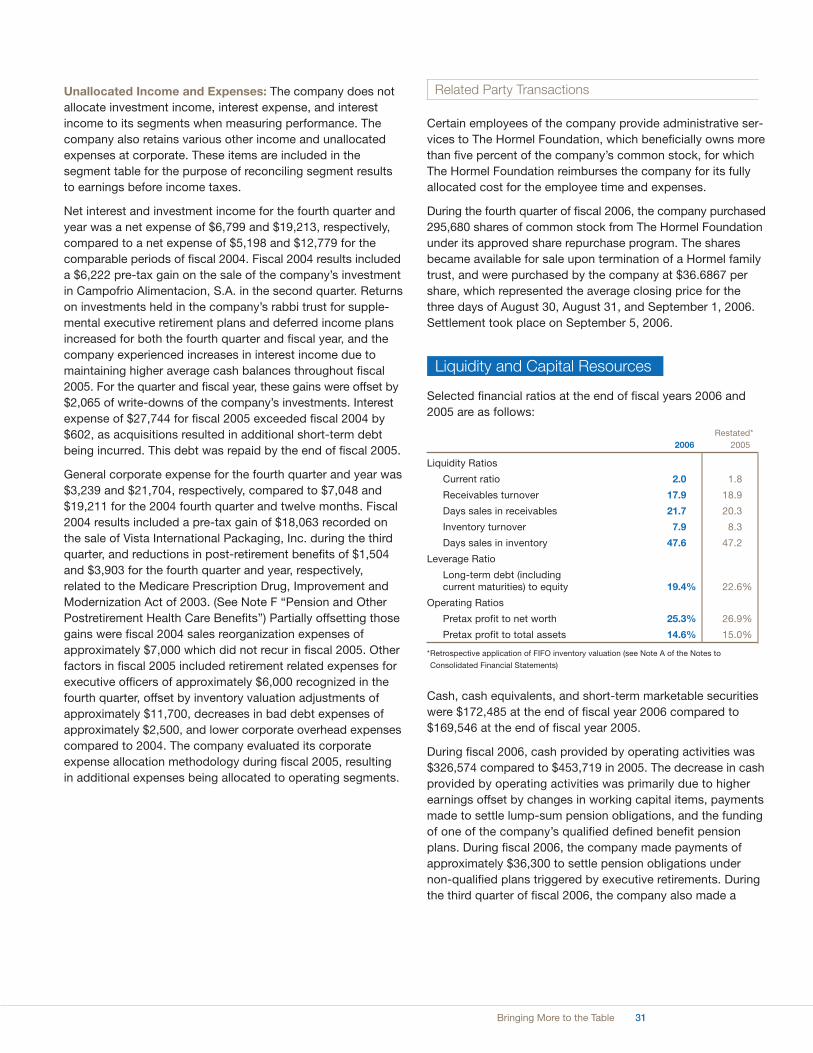
Unallocated Income and Expenses: The company does not
allocate investment income, interest expense, and interest
income to its segments when measuring performance. The
company also retains various other income and unallocated
expenses at corporate. These items are included in the
segment table for the purpose of reconciling segment results
to earnings before income taxes.
Net interest and investment income for the fourth quarter and
year was a net expense of $6,799 and $19,213, respectively,
compared to a net expense of $5,198 and $12,779 for the
comparable periods of fiscal 2004. Fiscal 2004 results included
a $6,222 pre-tax gain on the sale of the company’s investment
in Campofrio Alimentacion, S.A. in the second quarter. Returns
on investments held in the company’s rabbi trust for supple-
mental executive retirement plans and deferred income plans
increased for both the fourth quarter and fiscal year, and the
company experienced increases in interest income due to
maintaining higher average cash balances throughout fiscal
2005. For the quarter and fiscal year, these gains were offset by
$2,065 of write-downs of the company’s investments. Interest
expense of $27,744 for fiscal 2005 exceeded fiscal 2004 by
$602, as acquisitions resulted in additional short-term debt
being incurred. This debt was repaid by the end of fiscal 2005.
General corporate expense for the fourth quarter and year was
$3,239 and $21,704, respectively, compared to $7,048 and
$19,211 for the 2004 fourth quarter and twelve months. Fiscal
2004 results included a pre-tax gain of $18,063 recorded on
the sale of Vista International Packaging, Inc. during the third
quarter, and reductions in post-retirement benefits of $1,504
and $3,903 for the fourth quarter and year, respectively,
related to the Medicare Prescription Drug, Improvement and
Modernization Act of 2003. (See Note F “Pension and Other
Postretirement Health Care Benefits”) Partially offsetting those
gains were fiscal 2004 sales reorganization expenses of
approximately $7,000 which did not recur in fiscal 2005. Other
factors in fiscal 2005 included retirement related expenses for
executive officers of approximately $6,000 recognized in the
fourth quarter, offset by inventory valuation adjustments of
approximately $11,700, decreases in bad debt expenses of
approximately $2,500, and lower corporate overhead expenses
compared to 2004. The company evaluated its corporate
expense allocation methodology during fiscal 2005, resulting
in additional expenses being allocated to operating segments.
Related Party Transactions
Certain employees of the company provide administrative ser-
vices to The Hormel Foundation, which beneficially owns more
than five percent of the company’s common stock, for which
The Hormel Foundation reimburses the company for its fully
allocated cost for the employee time and expenses.
During the fourth quarter of fiscal 2006, the company purchased
295,680 shares of common stock from The Hormel Foundation
under its approved share repurchase program. The shares
became available for sale upon termination of a Hormel family
trust, and were purchased by the company at $36.6867 per
share, which represented the average closing price for the
three days of August 30, August 31, and September 1, 2006.
Settlement took place on September 5, 2006.
Selected financial ratios at the end of fiscal years 2006 and
2005 are as follows:
Restated*
2006 2005
Liquidity Ratios
Current ratio 2.0 1.8
Receivables turnover 17.9 18.9
Days sales in receivables 21.7 20.3
Inventory turnover 7.9 8.3
Days sales in inventory 47.6 47.2
Leverage Ratio
Long-term debt (including current maturities) to equity 19.4% 22.6%
Operating Ratios
Pretax profit to net worth 25.3% 26.9%
Pretax profit to total assets 14.6% 15.0%
*Retrospective application of FIFO inventory valuation (see Note A of the Notes to
Consolidated Financial Statements)
Cash, cash equivalents, and short-term marketable securities
were $172,485 at the end of fiscal year 2006 compared to
$169,546 at the end of fiscal year 2005.
During fiscal 2006, cash provided by operating activities was
$326,574 compared to $453,719 in 2005. The decrease in cash
provided by operating activities was primarily due to higher
earnings offset by changes in working capital items, payments
made to settle lump-sum pension obligations, and the funding
of one of the company’s qualified defined benefit pension
plans. During fiscal 2006, the company made payments of
approximately $36,300 to settle pension obligations under
non-qualified plans triggered by executive retirements. During
the third quarter of fiscal 2006, the company also made a
Liquidity and Capital Resources
31Bringing More to the Table

32 Hormel Foods Corporation
discretionary contribution of $17,650 to its salaried defined
benefit pension plan. Changes in working capital included
higher levels of accounts receivable and a smaller benefit from
accounts payable and accrued expenses than in the prior year.
Cash flow from operating activities provides the company
with its principal source of liquidity. The company does not
anticipate a significant risk to cash flow from this source in
the foreseeable future because the company operates in a
relatively stable industry and has strong products across
several product lines.
Cash used in investing activities was $170,524 in fiscal year
2006, compared to $404,437 in fiscal year 2005. The decrease
was due primarily to acquisitions of businesses/intangibles
made during fiscal 2005. Acquisitions made during fiscal 2005,
along with the purchase price including related costs, were
Farmer John ($208,219), Mexican Accent ($47,996), Mark-Lynn
($43,153), and Lloyd’s ($50,463). During fiscal 2005, the com-
pany also purchased the Chi-Chi’s trademark rights related to
chips and tortillas for $14,490. The only significant acquisition
made in fiscal 2006 was the purchase of Valley Fresh, Inc. for
$80,362 in cash.
Expenditures on fixed assets in fiscal 2006 were $141,516
compared to $107,094 in the prior year. Significant projects
during 2006 included additional precooked bacon and
microwave tray lines at the company’s Rochelle, Illinois facility
and plant renovations at the Fremont, Nebraska plant. For
fiscal 2007, the company expects capital expenditures will be
approximately $145,000, which exceeds estimated deprecia-
tion expense. The increase is primarily due to planned invest-
ments in additional value-added production capacity to meet
consumer demand, and planned expansions at the company’s
hog production facilities.
Cash used in financing activities was $114,611 in fiscal 2006
compared to $98,117 in fiscal 2005. The increase in cash used
in financing activities was due mainly to increased dividend
payments and higher share repurchase than in the prior year.
During fiscal 2006, the company borrowed $70,000 utilizing
existing short-term lines of credit to finance working capital
needs during the year. The outstanding short-term debt was
repaid by the end of the fourth quarter, and the company did
not incur any additional long-term debt during 2006. Similarly,
the company does not expect to take on any significant addi-
tional long-term debt in fiscal 2007.
The company paid $75,840 in dividends to shareholders in
fiscal 2006 compared to $69,371 in fiscal 2005. The dividend
rate was 56 cents per share in 2006, which reflects a 7.7%
increase over the fiscal 2005 amount. The company has paid
dividends for 313 consecutive quarters and expects to continue
doing so in the future. The annual dividend for fiscal 2007 will
increase to 60 cents per share, representing the company’s
41st consecutive annual dividend increase.
Repurchases of common stock were $36,978 in fiscal 2006,
compared to $22,977 in the prior year. During the year, the
company repurchased 1,058,067 shares of its common stock
at an average price per share of $34.95 under the repurchase
plan approved by the company’s Board of Directors in October
2002. This amount includes the repurchase of 295,680 shares
from The Hormel Foundation during the fourth quarter at the
average of the closing market prices for the three days of
August 30, August 31, and September 1, 2006. These transac-
tions result in a total of 3.4 million shares having been repur-
chased through October 29, 2006, under this 10 million share
repurchase authorization.
Total debt outstanding at the end of fiscal 2006 was $350,420
compared to $361,505 at the end of the prior year. The com-
pany’s debt balance primarily represents $350,000 of senior
unsecured notes maturing in 2011. The company is required,
by certain covenants in its debt agreements, to maintain speci-
fied levels of financial ratios and balance sheet position. At the
end of fiscal 2006, the company was in compliance with all of
these debt covenants.

33Bringing More to the Table
In addition to the commitments set forth in the above table, at
October 29, 2006, the company had $40,654 in standby letters
of credit issued on behalf of the company. The standby letters
of credit are primarily related to the company’s self-insured
workers’ compensation programs.
The company believes its financial resources, including a
five-year revolving credit facility for $200,000 and anticipated
funds from operations will be adequate to meet all current
commitments.
Off-Balance Sheet Arrangements
The company currently provides a revocable standby letter of
credit for $1,940 to guarantee obligations that may arise under
workers compensation claims of an affiliated party. This poten-
tial obligation is not reflected on the company’s consolidated
statements of financial position.
This report contains “forward-looking” information within the
meaning of the federal securities laws. The “forward-looking”
information may include statements concerning the com-
pany’s outlook for the future as well as other statements of
beliefs, future plans, strategies, or anticipated events and
similar expressions concerning matters that are not historical
facts. “Forward-looking” statements are subject to risks and
uncertainties that could cause actual results to differ materially
from those expressed in, or implied by, the statements.
Factors that may affect the operating results of the company
are discussed below.
The Private Securities Litigation Reform Act of 1995 (the
Reform Act) provides a “safe harbor” for forward-looking
statements to encourage companies to provide prospective
Forward-Looking Statements
Contractual Obligations and Commercial Commitments
The following table outlines the company’s future contractual financial obligations as of October 29, 2006 (for additional informa-
tion regarding these obligations, see Note E “Long-term Debt and Other Borrowing Arrangements” and Note H “Commitments
and Contingencies”):
Payments Due by Periods
Contractual Obligations Total Less than 1 year 1-3 years 3-5 years After 5 years
Purchase obligations:
Hog and turkey commitments (1) $4,926,731 $746,216 $1,208,349 $ 789,004 $2,183,162
Grain commitments (1) 57,175 44,318 12,857 – –
Turkey grow-out contracts (2) 77,731 10,030 14,113 10,480 43,108
Other (3) 66,974 63,426 3,548 – –
Long-term debt 350,420 366 54 350,000 –
Interest payments on long-term debt 104,352 23,195 46,376 34,781 –
Capital expenditures (4) 86,256 86,256 – – –
Leases 33,149 10,360 11,115 5,788 5,886
Other long-term liabilities (5) 70,069 8,876 16,907 14,865 29,421
Total Contractual Cash Obligations $5,772,857 $993,043 $1,313,319 $1,204,918 $2,261,577
(1) In the normal course of business, the company commits to purchase fixed quantities of livestock and grain from producers to ensure a steady supply of production inputs. Certain of these
contracts are based on market prices at the time of delivery, for which the company has estimated the purchase commitment using current market prices as of October 29, 2006. The company
also utilizes various hedging programs to manage the price risk associated with these commitments. As of October 29, 2006, these hedging programs result in a net increase of $12,723 in
future cash payments associated with the purchase commitments in fiscal 2006, which is not reflected in the table above.
(2) The company also utilizes grow-out contracts with independent farmers to raise turkeys for the company. Under these contracts, the livestock, feed, and other supplies are owned by the
company. The farmers provide the required labor and facilities that they either own or sublease from the company, and receive a fee per pound when the turkeys are delivered. As of October 29,
2006, the company had approximately 95 active contracts ranging from two to twenty-five years in duration. The grow-out activity is assumed to continue through the term of these active
contracts, and amounts in the table represent the company’s obligation based on turkeys expected to be delivered from these farmers.
(3) Amounts presented for other purchase obligations represent all known open purchase orders and all known contracts exceeding $1,000, related to the procurement of materials, supplies, and
various services. The company primarily purchases goods and services on an as-needed basis. Therefore, the amounts in the table represent only a portion of expected future cash expenditures.
(4) Amounts presented for capital expenditures represent only the company’s current commitments to complete construction in progress at various locations. The company estimates total capital
expenditures for fiscal year 2007 to be $145,000.
(5) Other long-term liabilities primarily represent payments under the company’s deferred compensation plans and minimum payments required under supply agreements related to the sale of Vista
International Packaging, Inc. Minority interest related to the Precept Foods operation is not included in the table above. Also excluded are payments under the company’s defined benefit pension
and other postretirement benefit plans. (See estimated benefit payments for the next ten fiscal years in Note F “Pension and Other Postretirement Health Care Benefits”)
34 Hormel Foods Corporation
information. The company is filing this cautionary statement in
connection with the Reform Act. When used in the company’s
Annual Report to Stockholders, in filings by the company with
the Securities and Exchange Commission (the Commission),
in the company’s press releases and in oral statements made
by the company’s representatives, the words or phrases
“should result,” “believe,” “intend,” “plan,” “are expected to,”
“targeted,” “will continue,” “will approximate,” “is anticipated,”
“estimate,” “project,” or similar expressions are intended to
identify forward-looking statements within the meaning of the
Reform Act. Such statements are subject to certain risks and
uncertainties that could cause actual results to differ materially
from historical earnings and those anticipated or projected.
In connection with the “safe harbor” provisions of the Reform
Act, the company is identifying risk factors that could affect
financial performance and cause the company’s actual results
to differ materially from opinions or statements expressed with
respect to future periods. The following discussion of risk fac-
tors contains certain cautionary statements regarding the
company’s business, which should be considered by investors
and others. The following risk factors should be considered in
conjunction with any discussions of operations or results by
the company or its representatives, including any forward-
looking discussion, as well as comments contained in press
releases, presentations to securities analysts or investors, or
other communications by the company.
In making these statements, the company is not undertaking,
and specifically declines to undertake, any obligation to
address or update each or any factor in future filings or com-
munications regarding the company’s business or results, and
is not undertaking to address how any of these factors may
have caused changes to discussions or information contained
in previous filings or communications. Though the company
has attempted to list comprehensively these important caution-
ary risk factors, the company wishes to caution investors and
others that other factors may in the future prove to be important
in affecting the company’s business or results of operations.
The company cautions readers not to place undue reliance on
forward-looking statements, which represent current views as
of the date made. Forward-looking statements are inherently
at risk to any changes in the national and worldwide economic
environment, which could include, among other things, eco-
nomic conditions, political developments, currency exchange
rates, interest and inflation rates, accounting standards, taxes,
and laws and regulations affecting the company and its markets.
Risk Factors
Fluctuations in commodity prices of pork, poultry, and feed
ingredients could harm the company’s earnings. The com-
pany’s results of operations and financial condition are largely
dependent upon the cost and supply of pork, poultry, and feed
grain as well as the selling prices for many of our products,
which are determined by constantly changing market forces of
supply and demand over which we have limited or no control.
The live pork industry has recently evolved to very large, verti-
cally integrated, year-round confinement operations operating
under long-term supply agreements. This has resulted in fewer
hogs being available on the cash spot market. The decrease in
the supply of live hogs on the cash spot market could severely
diminish the utilization of slaughter facilities and increase the
cost of the raw materials they produce. The company uses
long-term supply contracts to ensure a stable supply of raw
materials while minimizing extreme fluctuations in costs over
the long-term. This may result, in the short term, in costs for
live hogs that are higher than the cash spot market depending
on the relationship of the cash spot market to contract prices,
and these higher costs could adversely affect our short-term
financial results.
Jennie-O Turkey Store contracts with turkey growers to
supplement the turkeys it raises to meet its raw material
requirements for whole birds and processed turkey products.
Jennie-O Turkey Store results are affected by the cost and
supply of feed grains, which fluctuate due to climate conditions,
production forecasts, and supply and demand conditions at
local, regional, national, and worldwide levels. The company
attempts to manage some of its short-term exposure to fluc-
tuations in feed prices by purchasing futures contracts.
Outbreaks of disease among livestock and poultry flocks
could harm the company’s revenues and operating margins.
The company is subject to risks associated with the outbreak
of disease in pork and beef livestock, and poultry flocks,
including Bovine Spongiform Encephalopathy (BSE), pneumo-
virus, and Avian Influenza. The outbreak of disease could
adversely affect the company’s supply of raw materials,
increase the cost of production, and reduce operating margins.
Additionally, the outbreak of disease may hinder the company’s
ability to market and sell products both domestically and inter-
nationally. The company has developed business continuity
plans for various disease scenarios and will continue to update
these plans as necessary.

35Bringing More to the Table
Market demand for the company’s products may fluctuate
due to competition from other producers. The company
faces competition from producers of other meats and protein
sources, especially beef, chicken, and fish. The bases on
which the company competes include:
• price;
• product quality;
• brand identification;
• breadth of product line; and
• customer service.
Demand for the company’s products is also affected by com-
petitors’ promotional spending and the effectiveness of the
company’s advertising and marketing programs. The company
may be unable to compete successfully on any or all of these
bases in the future.
The company’s operations are subject to the general risks
of the food industry. The food products manufacturing indus-
try is subject to the risks posed by:
• food spoilage or food contamination;
• evolving consumer preferences and nutritional and
health-related concerns;
• federal, state, and local food processing controls;
• consumer product liability claims;
• product tampering; and
•the possible unavailability and/or expense of liability
insurance.
If one or more of these risks were to materialize, the company’s
revenues could decrease, costs of doing business could
increase, and the company’s operating results could be
adversely affected.
Deterioration of economic conditions could harm the com-
pany’s business. The company’s business may be adversely
affected by changes in national or global economic conditions,
including inflation, interest rates, availability of capital markets,
consumer spending rates, energy availability and costs
(including fuel surcharges), and the effects of governmental
initiatives to manage economic conditions. If a high pathogenic
H5N1 strain of Avian Influenza developed in the United States,
it may negatively impact the national economy and/or the
demand for poultry products, and the company’s financial
results could suffer. The company has developed contingency
plans to address infectious disease scenarios and the potential
impact on its operations, and will continue to update these
plans as necessary.
The company’s operations are subject to the general risks
associated with acquisitions. The company has made sev-
eral acquisitions in recent years and regularly reviews opportu-
nities for strategic growth through acquisitions. The success
of these recent acquisitions and any future acquisitions by the
company will depend substantially on its ability to integrate
the acquired operations successfully with existing operations.
If the company is unable to integrate new operations success-
fully, financial results and business reputation could suffer.
Additional risks associated with acquisitions are the diversion
of management’s attention from other business concerns, the
potential loss of key employees and customers of the acquired
companies, the possible assumption of unknown liabilities,
potential disputes with the sellers, and the inherent risks in
entering markets or lines of business in which the company
has limited or no prior experience. In addition, acquisitions
outside the U.S. may present unique challenges and increase
the company’s exposure to the risks associated with foreign
operations.
The company’s operations are subject to the general risks
of litigation. The company is involved on an ongoing basis
in litigation arising in the ordinary course of business. Trends
in litigation may include class actions involving consumers,
shareholders, or injured persons, and claims relating to labor,
employment, or environmental matters. Litigation trends and
the outcome of litigation cannot be predicted with certainty
and adverse litigation trends and outcomes could adversely
affect the company’s financial results.
Government regulation, present and future, exposes the
company to potential sanctions and compliance costs
that could adversely affect the company’s business. The
company’s operations are subject to extensive regulation by
the U.S. Department of Agriculture, the U.S. Food and Drug
Administration, and other state and local authorities that over-
see food safety standards and the processing, packaging,
storage, distribution, advertising, and labeling of the company’s
products. The company’s manufacturing facilities and products
are subject to constant inspection by federal, state, and local
authorities. Claims or enforcement proceedings could be
brought against the company in the future. Additionally, the
company is subject to new or modified laws, regulations, and
accounting standards. The company’s failure or inability to
comply with such requirements could subject the company to
civil remedies, including fines, injunctions, recalls, or seizures,
as well as potential criminal sanctions.
The company is subject to stringent environmental regula-
tion and potentially subject to environmental litigation,
proceedings, and investigations. The company’s past and
present business operations and ownership and operation of
real property are subject to extensive and increasingly stringent
federal, state, and local environmental laws and regulations
pertaining to the discharge of materials into the environment,
and the handling and disposition of wastes (including solid
and hazardous wastes) or otherwise relating to protection of

36 Hormel Foods Corporation
the environment. Compliance with these laws and regulations,
and the ability to comply with any modifications to these laws
and regulations, is material to the company’s business. New
matters or sites may be identified in the future that will require
additional investigation, assessment, or expenditures. In addi-
tion, some of the company’s facilities have been in operation
for many years and, over time, the company and other prior
operators of these facilities may have generated and disposed
of wastes that now may be considered hazardous. Future dis-
covery of contamination of property underlying or in the vicinity
of the company’s present or former properties or manufacturing
facilities and/or waste disposal sites could require the company
to incur additional expenses. The occurrence of any of these
events, the implementation of new laws and regulations, or
stricter interpretation of existing laws or regulations, could
adversely affect the company’s financial results.
The company’s foreign operations pose additional risks to
the company’s business. The company operates its business
and markets its products internationally. The company’s foreign
operations are subject to the risks described above, as well as
risks related to fluctuations in currency values, foreign currency
exchange controls, compliance with foreign laws, and other
economic or political uncertainties. International sales are sub-
ject to risks related to general economic conditions, imposition
of tariffs, quotas, trade barriers and other restrictions, enforce-
ment of remedies in foreign jurisdictions and compliance with
applicable foreign laws, and other economic and political
uncertainties. All of these risks could result in increased costs
or decreased revenues, which could adversely affect the com-
pany’s financial results.
Deterioration of labor relations or increases in labor costs
could harm the company’s business. The company has
approximately 18,100 employees, of which approximately
6,100 are represented by labor unions, principally the United
Food and Commercial Workers’ Union. A significant increase
in labor costs or a deterioration of labor relations at any of
the company’s facilities that results in work slowdowns or
stoppages could harm the company’s financial results. Union
contracts at the company’s plants in Algona, Iowa; Austin,
Minnesota; Beloit, Wisconsin; Fremont, Nebraska; and Tucker,
Georgia will expire in September, 2007. These contracts cover
a combined total of 3,157 employees. Negotiations have not
yet been initiated at any of these locations.
Hog Markets. The company’s earnings are affected by fluc-
tuations in the live hog market. To minimize the impact on
earnings, and to ensure a steady supply of quality hogs, the
company has entered into contracts with producers for the
purchase of hogs at formula-based prices over periods of up
to 15 years. Contract formulas are based on hog production
costs, hog futures, hog primal values, or industry reported
hog markets. Purchased hogs under contract accounted for
81 percent and 69 percent of the total hogs purchased by
the company in fiscal years 2006 and 2005, respectively.
The company has been actively converting to market-based
formulas in order to better match input costs with customer
pricing. Therefore, a hypothetical 10 percent change in the
cash market would have had an immaterial effect on the com-
pany’s results of operations.
Certain procurement contracts allow for future hog deliveries
(firm commitments) to be forward priced. The company gen-
erally hedges these firm commitments by entering into hog
futures contracts. These futures contracts are designated and
accounted for as fair value hedges. The change in the market
value of such futures contracts has historically been, and is
expected to continue to be, highly effective at offsetting
changes in price movements of the hedged item. Changes in
the fair value of the futures contracts, along with the gain or
loss on the firm commitment, are marked-to-market through
earnings and are recorded on the statement of financial posi-
tion as a current asset and liability, respectively. The fair value
of the company’s open futures contracts as of October 29,
2006, was $(5,473).
The company measures its market risk exposure on its hog
futures contracts using a sensitivity analysis, which considers
a hypothetical 10 percent change in market prices. A 10 per-
cent increase in market prices would have negatively impacted
the fair value of the company’s October 29, 2006, open con-
tracts by $6,734, which in turn would lower the company’s
future cost of purchased hogs by a similar amount.
Turkey Markets. The company raises or contracts for live
turkeys. Production costs in raising turkeys are subject primar-
ily to fluctuations in feed grain prices, and to a lesser extent,
fuel costs. To reduce the company’s exposure to changes in
grain prices, the company utilizes a hedge program to offset
the fluctuation in the company’s future direct grain purchases.
Quantitative and Qualitative DisclosureAbout Market Risks

37Bringing More to the Table
This program utilizes corn and soybean meal futures, and
these contracts are accounted for under cash flow hedge
accounting. The open contracts are reported at their fair value
of $2,467, before tax, on the statement of financial position as
of October 29, 2006.
The company measures its market risk exposure on its grain
futures contracts using a sensitivity analysis, which considers
a hypothetical 10 percent change in the market prices for
grain. A 10 percent decrease in the market price for grain
would have negatively impacted the fair value of the company’s
October 29, 2006, open grain contracts by $1,603, which in
turn would lower the company’s future cost on purchased
grain by a similar amount.
Natural Gas. Production costs at the company’s plants and
feed mills are also subject to fluctuations in fuel costs. To
reduce the company’s exposure to changes in natural gas
prices, the company utilizes a hedge program to offset the
fluctuation in the company’s future natural gas purchases. This
program utilizes natural gas swaps, and these contracts are
accounted for under cash flow hedge accounting. The open
contracts are reported at their fair value of $(4,256), before tax,
on the statement of financial position as of October 29, 2006.
The company measures its market risk exposure on its natural
gas contracts using a sensitivity analysis, which considers a
hypothetical 10 percent change in the market prices for natu-
ral gas. A 10 percent decrease in the market price for natural
gas would have negatively impacted the fair value of the
company’s October 29, 2006, open natural gas contracts by
$4,381, which in turn would lower the company’s future cost
on natural gas purchases by a similar amount.
Long-Term Debt. A principal market risk affecting the company
is the exposure to changes in interest rates on the company’s
fixed-rate, long-term debt. As of October 29, 2006, fixed-rate
debt totaled $350,420 at rates ranging from 6.625 to 8.21 per-
cent. Market risk for fixed-rate, long-term debt is estimated as
the potential increase in fair value, resulting from a hypothetical
10 percent decrease in interest rates, and amounts to approxi-
mately $8,433. The fair values of the company’s long-term debt
were estimated using discounted future cash flows based on
the company’s incremental borrowing rates for similar types of
borrowing arrangements.
International. The fair values of certain company assets are
subject to fluctuations in foreign currencies. The majority of
these assets were eliminated in the second quarter of fiscal
2004 when the company sold its remaining equity interest in
the Spanish food company Campofrio Alimentacion, S.A. The
company’s remaining net asset position in foreign currencies
as of October 29, 2006, was $83,643, with most of the expo-
sure existing in Philippine pesos and Chinese yuan. Changes
in currency exchange rates impact the fair values of company
assets either currently through the consolidated statement of
operations, as currency gains/losses, or by affecting other
comprehensive income/loss.
The company measures its foreign currency exchange risk
by using a 10 percent sensitivity analysis on the company’s
primary foreign net asset position, the Philippine peso, as of
October 29, 2006. A 10 percent strengthening in the value of
the peso relative to the U.S. dollar would result in other com-
prehensive income of $4,665 pre-tax. A 10 percent weakening
in the value of the peso relative to the U.S. dollar would result
in other comprehensive loss of the same amount.

38 Hormel Foods Corporation
Management’s Responsibility for
Financial Statements
The accompanying financial statements were prepared by the
management of Hormel Foods Corporation which is respon-
sible for their integrity and objectivity. These statements have
been prepared in accordance with U. S. generally accepted
accounting principles appropriate in the circumstances and,
as such, include amounts that are based on our best
estimates and judgments.
Hormel Foods Corporation has developed a system of internal
controls described to assure that the records reflect the trans-
actions of the company and that the established policies and
procedures are adhered to. This system is augmented by well-
communicated written policies and procedures, a strong pro-
gram of internal audit, and well-qualified personnel.
These financial statements have been audited by Ernst &
Young LLP, an independent registered public accounting firm,
and their report is included herein. The audit was conducted in
accordance with the Public Company Accounting Oversight
Board (United States) and includes a review of the company’s
accounting and financial controls and tests of transactions.
The Audit Committee of the Board of Directors, composed
solely of outside directors, meets periodically with the
independent auditors, management, and the internal auditors
to assure that each is carrying out its responsibilities. Both
Ernst & Young LLP and our internal auditors have full and free
access to the Audit Committee, with or without the presence
of management, to discuss the results of their audit work and
their opinions on the adequacy of internal controls and the
quality of financial reporting.
Management’s Report on Internal Control
Over Financial Reporting
Management of Hormel Foods Corporation is responsible
for establishing and maintaining adequate internal control
over financial reporting for the company, as such term is
defined in Exchange Act Rules 13a – 15(f). The company’s
internal control system is designed to provide reasonable
assurance regarding the reliability of financial reporting and
the preparation of financial statements for external purposes
in accordance with generally accepted accounting standards.
Under the supervision, and with the participation of manage-
ment, including the chief executive officer and chief financial
officer, we conducted an evaluation of the effectiveness of
our internal control over financial reporting based on the
framework in Internal Control – Integrated Framework issued
by the Committee of Sponsoring Organizations of the
Treadway Commission.
Based on our evaluation under the framework in Internal
Control – Integrated Framework, we concluded that our inter-
nal control over financial reporting was effective as of October
29, 2006. Our management’s assessment of effectiveness of
our internal control over financial reporting as of October 29,
2006 has been audited by Ernst & Young LLP, an independent
registered public accounting firm, as stated in their report
which is included herein.
Jeffrey M. Ettinger Michael J. McCoy
Chairman of the Board, President Executive Vice President
and Chief Executive Officer and Chief Financial Officer
Report of Management

39Bringing More to the Table
To the Board of Directors and Shareholders
Hormel Foods Corporation
Austin, Minnesota
We have audited management’s assessment, included in the
section of the accompanying Report of Management entitled
Management’s Report on Internal Control over Financial
Reporting, that Hormel Foods Corporation maintained effec-
tive internal control over financial reporting as of October 29,
2006, based on criteria established in Internal Control –
Integrated Framework issued by the Committee of Sponsoring
Organizations of the Treadway Commission (the COSO criteria).
Hormel Foods Corporation’s management is responsible for
maintaining effective internal control over financial reporting
and for its assessment of the effectiveness of internal control
over financial reporting. Our responsibility is to express an
opinion on management’s assessment and an opinion on the
effectiveness of the company’s internal control over financial
reporting based on our audit.
We conducted our audit in accordance with the standards of the
Public Company Accounting Oversight Board (United States).
Those standards require that we plan and perform the audit to
obtain reasonable assurance about whether effective internal
control over financial reporting was maintained in all material
respects. Our audit included obtaining an understanding of
internal control over financial reporting, evaluating manage-
ment’s assessment, testing and evaluating the design and
operating effectiveness of internal control, and performing such
other procedures as we considered necessary in the circum-
stances. We believe that our audit provides a reasonable basis
for our opinion.
A company’s internal control over financial reporting is a
process designed to provide reasonable assurance regarding
the reliability of financial reporting and the preparation of
financial statements for external purposes in accordance with
generally accepted accounting principles. A company’s inter-
nal control over financial reporting includes those policies and
procedures that (1) pertain to the maintenance of records that,
in reasonable detail, accurately and fairly reflect the transactions
and dispositions of the assets of the company; (2) provide
reasonable assurance that transactions are recorded as
necessary to permit preparation of financial statements in
accordance with generally accepted accounting principles,
and that receipts and expenditures of the company are being
made only in accordance with authorizations of management
and directors of the company; and (3) provide reasonable
assurance regarding prevention or timely detection of unauth-
orized acquisition, use, or disposition of the company’s assets
that could have a material effect on the financial statements.
Because of its inherent limitations, internal control over finan-
cial reporting may not prevent or detect misstatements. Also,
projections of any evaluation of effectiveness to future periods
are subject to the risk that controls may become inadequate
because of changes in conditions, or that the degree of com-
pliance with the policies or procedures may deteriorate.
In our opinion, management’s assessment that Hormel Foods
Corporation maintained effective internal control over financial
reporting as of October 29, 2006, is fairly stated, in all material
respects, based on the COSO criteria. Also, in our opinion,
Hormel Foods Corporation maintained, in all material respects,
effective internal control over financial reporting as of October
29, 2006, based on the COSO criteria.
We also have audited, in accordance with the standards of
the Public Company Accounting Oversight Board (United
States), the consolidated statements of financial position of
Hormel Foods Corporation as of October 29, 2006, and
October 30, 2005, and the related consolidated statements
of operations, changes in shareholders’ investment, and cash
flows for each of the three fiscal years in the period ended
October 29, 2006, and our report dated December 14, 2006,
expressed an unqualified opinion thereon.
Minneapolis, Minnesota
December 14, 2006
Report of Independent Registered Public Accounting Firm

40 Hormel Foods Corporation
To the Board of Directors and Shareholders
Hormel Foods Corporation
Austin, Minnesota
We have audited the accompanying consolidated statements
of financial position of Hormel Foods Corporation as of
October 29, 2006, and October 30, 2005, and the related con-
solidated statements of operations, changes in shareholders’
investment, and cash flows for each of three fiscal years in the
period ended October 29, 2006. These financial statements
are the responsibility of the company’s management. Our
responsibility is to express an opinion on these financial state-
ments based on our audits.
We conducted our audits in accordance with the standards of
the Public Company Accounting Oversight Board (United
States). Those standards require that we plan and perform the
audit to obtain reasonable assurance about whether the finan-
cial statements are free of material misstatement. An audit
includes examining, on a test basis, evidence supporting the
amounts and disclosures in the financial statements. An audit
also includes assessing the accounting principles used and
significant estimates made by management, as well as evalu-
ating the overall financial statement presentation. We believe
that our audits provide a reasonable basis for our opinion.
In our opinion, the financial statements referred to above present
fairly, in all material respects, the consolidated financial posi-
tion of Hormel Foods Corporation at October 29, 2006, and
October 30, 2005, and the consolidated results of its operations
and its cash flows for each of the three fiscal years in the period
ended October 29, 2006, in conformity with U.S. generally
accepted accounting principles.
We also have audited, in accordance with the standards of the
Public Company Accounting Oversight Board (United States),
the effectiveness of Hormel Foods Corporation’s internal con-
trol over financial reporting as of October 29, 2006, based on
criteria established in Internal Control-Integrated Framework
issued by the Committee of Sponsoring Organizations of the
Treadway Commission and our report dated December 14,
2006, expressed an unqualified opinion thereon.
Minneapolis, Minnesota
December 14, 2006
Report of Independent Registered Public Accounting Firm

41Bringing More to the Table
Consolidated Statements of Financial Position
(In Thousands, Except Share Amounts) October 29, 2006 October 30, 2005*
Assets
Current AssetsCash and cash equivalents $ 172,485 $ 131,046Short-term marketable securities 0 38,500Accounts receivable (net of allowance for doubtful accounts
of 3,922 at October 29, 2006 and 5,518 at October 30, 2005) 341,916 301,001Inventories 570,932 534,572Deferred income taxes 48,535 39,428Prepaid expenses and other current assets 7,803 20,691
Total Current Assets 1,141,671 1,065,238
Deferred Income Taxes 7,387 1,253
Goodwill 550,706 502,107
Other Intangibles 147,975 139,579
Net Pension Assets 66,097 30,676
Investments In And Receivables From Affiliates 76,684 68,027
Other Assets 158,976 162,004
Property, Plant and EquipmentLand 46,854 49,281Buildings 562,949 548,044Equipment 1,110,315 1,059,328Construction in progress 123,608 66,326
1,843,726 1,722,979
Less allowance for depreciation (932,916) (845,303)
910,810 877,676
Total Assets $3,060,306 $2,846,560
Liabilities and Shareholders’ Investment
Current LiabilitiesAccounts payable $ 271,358 $ 255,144Accrued expenses 27,103 26,270Accrued workers compensation 27,895 27,619Accrued marketing expenses 68,503 68,640Employee compensation 107,332 114,518Taxes, other than federal income taxes 7,784 11,993Dividends payable 19,361 17,950Federal income taxes 55,312 49,963Current maturities of long-term debt 366 11,075
Total Current Liabilities 585,014 583,172
Long-Term Debt – less current maturities 350,054 350,430
Accumulated Postretirement Benefit Obligation 271,240 263,663
Other Long-Term Liabilities 51,086 50,565
Shareholders’ InvestmentPreferred stock, par value $.01 a share – authorized 80,000,000 shares; issued – noneCommon stock, nonvoting, par value $.01 a share –
authorized 200,000,000 shares; issued – noneCommon stock, par value $.0586 a share – authorized 400,000,000 shares;
issued 137,639,954 shares October 29, 2006, issued 137,843,090 shares October 30, 2005 8,066 8,078 Additional paid-in capital 2,507 3,260Accumulated other comprehensive loss (17,996) (24,923)Retained earnings 1,821,202 1,612,315
1,813,779 1,598,730Treasury stock; 300,000 shares October 29, 2006 (10,867) 0
Total Shareholders’ Investment 1,802,912 1,598,730
Total Liabilities and Shareholders’ Investment $3,060,306 $2,846,560
See notes to consolidated financial statements. *Retrospective application of FIFO inventory valuation.

42 Hormel Foods Corporation
Fiscal Year Ended
(In Thousands, Except Per Share Amounts) October 29, 2006 October 30, 2005* October 30, 2004*
Net sales $5,745,481 $5,413,997 $4,779,875Cost of products sold 4,362,291 4,129,549 3,655,837
Gross Profit 1,383,190 1,284,448 1,124,038
Expenses:Selling and delivery 754,143 691,792 621,694Administrative and general 182,891 172,242 146,488Gain on sale of business 0 0 (18,063)
Total Expenses and Gain on Sale of Business 937,034 864,034 750,119
Equity in earnings of affiliates 4,553 5,525 6,458
Operating Income 450,709 425,939 380,377
Other income and expense:Interest and investment income 5,470 8,531 14,363 Interest expense (25,636) (27,744) (27,142)
Earnings Before Income Taxes 430,543 406,726 367,598
Provision for income taxes 144,404 152,123 134,048
Net Earnings $ 286,139 $ 254,603 $ 233,550
Net Earnings Per Share:Basic $ 2.08 $ 1.84 $ 1.69
Diluted $ 2.05 $ 1.82 $ 1.67
Weighted Average Shares Outstanding:Basic 137,845 138,040 138,596
Diluted 139,561 139,577 140,179
See notes to consolidated financial statements. *Retrospective application of FIFO inventory valuation.
Consolidated Statements of Operations

43Bringing More to the Table
Consolidated Statements of Changes in Shareholders’ Investment
Accumulated
Additional Other Total
Common Stock Treasury Stock Paid-in Retained Comprehensive Shareholders’
(In Thousands, Except Per Share Amounts) Shares Amount Shares Amount Capital Earnings Income (Loss) Investment
Balance at October 25, 2003 138,596 $8,122 0 $ 0 $ 4,073 $1,286,807 $(25,144) $1,273,858
Comprehensive income
Net earnings* 233,550 233,550
Foreign currency translation 8,776 8,776
Unrealized loss on available-for-sale securities (4,927) (4,927)
Deferred hedging, net ofreclassification adjustment (110) (110)
Adjustment in minimum pension liability (2,129) (2,129)
Comprehensive income 235,160
Purchases of common stock (1,379) (37,525) (37,525)
Stock option expense 4,201 4,201
Exercise of stock options 321 18 337 8,645 322 8,985
Shares retired (1,042) (61) 1,042 28,880 (8,596) (20,223) 0
Cash dividends – $.45 per share (62,421) (62,421)
Balance at October 30, 2004 137,875 $8,079 0 $ 0 $ 0 $1,437,713 $(23,534) $1,422,258
Comprehensive income
Net earnings* 254,603 254,603
Foreign currency translation 217 217
Unrealized gain on available-for-sale securities 0
Deferred hedging, net of reclassification adjustment 6,806 6,806
Adjustment in minimum pension liability (8,412) (8,412)
Comprehensive income 253,214
Purchases of common stock (773) (22,977) (22,977)
Stock option expense 7,159 7,159
Exercise of stock options 688 41 53 1,534 9,149 10,724
Shares retired (720) (42) 720 21,443 (13,048) (8,353) 0
Cash dividends – $.52 per share (71,648) (71,648)
Balance at October 30, 2005 137,843 $8,078 0 $ 0 $ 3,260 $1,612,315 $(24,923) $1,598,730
Comprehensive income
Net earnings 286,139 286,139
Foreign currency translation 4,058 4,058
Unrealized gain on available-for-sale securities 381 381
Deferred hedging, net of reclassification adjustment (5,781) (5,781)
Adjustment in minimum pension liability 8,269 8,269
Comprehensive income 293,066
Purchases of common stock (1,058) (36,978) (36,978)
Stock option expense 17,766 17,766
Exercise of stock options/nonvested shares 492 29 63 2,069 5,482 7,580
Shares retired (695) (41) 695 24,042 (24,001) 0
Cash dividends – $.56 per share (77,252) (77,252)
Balance at October 29, 2006 137,640 $8,066 (300) $(10,867) $ 2,507 $1,821,202 $(17,996) $1,802,912
See notes to consolidated financial statements. *Retrospective application of FIFO inventory valuation

44 Hormel Foods Corporation
Consolidated Statements of Cash Flows
Fiscal Year Ended
(In Thousands) October 29, 2006 October 30, 2005* October 30, 2004*
Operating Activities
Net earnings $ 286,139 $ 254,603 $ 233,550Adjustments to reconcile to net cash provided by operating activities:
Depreciation 109,360 105,774 87,675Amortization of intangibles 11,741 9,415 7,070Equity in earnings of affiliates (4,083) (5,797) (5,884)Provision for deferred income taxes (26,736) (24,333) (10,494)(Gain) loss on property/equipment sales and plant facilities (686) 149 (432)Gain on sales of business and investment 0 0 (24,285)
Changes in operating assets and liabilities, net of acquisitions:(Increase) decrease in accounts receivable (37,986) 6,463 14,803 Increase in inventories, prepaid expenses, and other current assets (21,722) (15,180) (31,997)(Increase) decrease in net pension assets (22,406) 23,478 (5,733)Increase in accounts payable and accrued expenses 14,899 93,078 22,644
Other 18,054 6,069 4,557
Net Cash Provided by Operating Activities 326,574 453,719 291,474
Investing Activities
Sale of available-for-sale securities 174,960 188,800 86,470Purchase of available-for-sale securities (136,460) (118,300) (195,600)Acquisitions of businesses/intangibles (78,925) (366,496) (21,452)Purchases of property/equipment (141,516) (107,094) (80,363)Proceeds from sales of property/equipment 8,689 2,938 2,903 Proceeds from sales of business and investment 0 0 126,774Decrease (increase) in investments, equity in affiliates, and other assets 1,917 (5,060) (3,680)Dividends from affiliates 811 775 0
Net Cash Used in Investing Activities (170,524) (404,437) (84,948)
Financing Activities
Proceeds from short-term debt 70,000 115,000 0 Principal payments on short-term debt (70,000) (115,000) 0 Principal payments on long-term debt (11,085) (15,765) (32,298)Dividends paid on common stock (75,840) (69,371) (61,343)Share repurchase (36,978) (22,977) (37,525)Other 9,292 9,996 6,545
Net Cash Used in Financing Activities (114,611) (98,117) (124,621)
Increase (Decrease) in Cash and Cash Equivalents 41,439 (48,835) 81,905 Cash and cash equivalents at beginning of year 131,046 179,881 97,976
Cash and Cash Equivalents at End of Year $ 172,485 $ 131,046 $ 179,881
See notes to consolidated financial statements. *Retrospective application of FIFO inventory valuation.

45Bringing More to the Table
Notes to Consolidated Financial Statements October 29, 2006
Summary of Significant Accounting Policies
Principles of Consolidation: The consolidated financial
statements include the accounts of Hormel Foods Corporation
and all of its majority-owned subsidiaries after elimination of
intercompany accounts, transactions, and profits.
Reclassifications: Certain reclassifications of previously
reported amounts have been made to conform to the current
year presentation and to conform with recent accounting
pronouncements and guidance. The reclassifications had no
impact on net earnings as previously reported.
Use of Estimates: The preparation of financial statements in
conformity with U.S. generally accepted accounting principles
requires management to make estimates and assumptions
that affect the amounts reported in the financial statements
and accompanying notes. Actual results could differ from
those estimates.
Fiscal Year: The company’s fiscal year ends on the last
Sunday in October. Fiscal years 2006 and 2005 consisted of
52 weeks, and fiscal year 2004 consisted of 53 weeks.
Change in Accounting Principle: In the first quarter of fiscal
2006, the company changed its method of accounting for
the materials portion of turkey products and substantially
all inventoriable expenses, packages, and supplies (in total
approximately 23.0 percent of total gross inventory at the end
of fiscal 2005) that had previously been accounted for utilizing
the Last-In First-Out (LIFO) method to the First-In First-Out
(FIFO) method. As a result, all inventories are now stated at
the lower of cost, determined on a FIFO basis, or market. The
change is preferable because it provides a more meaningful
presentation of the company’s financial position as it values
inventory in a manner which more closely approximates cur-
rent cost; it provides a consistent and uniform costing method
across the company’s operations; FIFO inventory values better
represent the underlying commercial substance of selling the
oldest products first; it is the prevalent method used by other
entities within the company’s industry; and it enhances the
comparability of the financial statements with those of our
industry peers. As required by U.S. generally accepted
accounting principles, the change has been reflected in the
consolidated statements of financial position, consolidated
statements of operations, and consolidated statements of cash
flows through retrospective application of the FIFO method.
Inventories as of the beginning of fiscal 2005 were increased
by the LIFO reserve ($36.7 million), the net current deferred tax
assets were decreased ($7.9 million), current tax liabilities
were increased ($5.8 million), and shareholders’ investment
was increased by the after-tax effect ($23.0 million). Previously
reported net earnings for fiscal years 2005 and 2004 were
increased by $1.1 million and $1.9 million, respectively.
Cash and Cash Equivalents and Short-term Marketable
Securities: The company considers all investments with an
original maturity of three months or less on their acquisition
date to be cash equivalents. The company classifies investments
with an original maturity of more than three months on their
acquisition date as short-term marketable securities. Short-
term marketable securities consist primarily of auction rate
securities. The company’s auction rate securities generally
have long-term stated maturities of 20 to 30 years, but have
characteristics of short-term investments due to a rate-setting
mechanism and the ability to liquidate them through a Dutch
auction process that occurs on pre-determined intervals of
less than 90 days. The company classifies its auction rate
securities as available-for-sale investments and has not
recorded any unrealized gains or losses associated with the
investments in 2006 or 2005.
Inventories: Inventories are stated at the lower of cost,
determined on a FIFO basis, or market. As described above,
the company changed its method of accounting for certain
inventory components from the LIFO method to the FIFO
method at the beginning of fiscal year 2006.
Property, Plant and Equipment: Property, plant and equipment
are stated at cost. The company generally uses the straight-
line method in computing depreciation. The annual provisions
for depreciation have been computed principally using the
following ranges of asset lives: buildings 20 to 40 years,
machinery and equipment 5 to 10 years.
Software development and implementation costs are expensed
until the company has determined that the software will result in
probable future economic benefits, and management has com-
mitted to funding the project. Thereafter, all qualified external
implementation costs, and purchased software costs are capi-
talized and amortized using the straight-line method over the
remaining estimated useful lives, not exceeding five years.
Goodwill and Intangibles: Goodwill and other intangibles
are originally recorded at their estimated fair values at date
of acquisition, and are allocated to reporting units that will
receive the related sales and income. The company’s current
reporting units represent operating segments (aggregations
of business units that have similar economic characteristics
and share the same production facilities, raw materials, and
labor force). Goodwill and indefinite-lived intangibles are
tested annually for impairment, or more frequently if impairment
indicators arise. Definite-lived intangibles are amortized over
their estimated useful lives and are evaluated for impairment
annually, or more frequently if impairment indicators are pre-
sent, using a process similar to that used to test long-lived
assets for impairment.
Impairment of Long-lived Assets: The company reviews
long-lived assets and definite-lived intangibles for impairment
annually or more frequently when events or changes in
circumstances indicate that the carrying amount of an asset
Note A

46 Hormel Foods Corporation
may not be recoverable. If impairment indicators are present
and the estimated future undiscounted cash flows are less
than the carrying value of the assets and any related goodwill,
the carrying value is reduced to the estimated fair value.
In the fourth quarter of fiscal year 2006, the company recorded
a write-down of $4.0 million related to the closing of its plant
in Houston, Texas, to record the facility at estimated fair
market value. The plant was closed during fiscal 2006 to bet-
ter achieve efficiencies in the company’s manufacturing and
distribution network.
Foreign Currency Translation: Assets and liabilities denomi-
nated in foreign currency are translated at the current exchange
rate as of the statements of financial position date, and income
statement amounts are translated at the average monthly
exchange rate. Translation adjustments resulting from fluctua-
tions in exchange rates are recorded as a component of accu-
mulated other comprehensive loss in shareholders’ investment.
When calculating foreign currency translation, the company
deemed its foreign investments to be permanent in nature and
has not provided for taxes on currency translation adjustments
arising from converting the investment in a foreign currency to
U.S. dollars.
Available-for-Sale Securities: The fair value of investments
classified as available-for-sale is included in other assets on
the consolidated statements of financial position. Unrealized
gains and losses are recorded to other comprehensive income/
(loss) and reclassified to earnings when the investment is sold.
Accumulated Other Comprehensive Loss: The components of accumulated other comprehensive loss are as follows:
Unrealized Accumulated
Foreign Minimum Gain (Loss) on Deferred Other
Currency Pension Available-for- Gain (Loss) – Comprehensive
(In Thousands) Translation Liability Sale Securities Hedging Loss
Balance at October 25, 2003 $(13,999) $(13,694) $ 4,927 $ (2,378) $(25,144)
Unrecognized gains (losses) 8,776 (4,131) (4,927) (6,260) (6,542)
Reclassification into net earnings 6,035 6,035
Tax effect 2,002 115 2,117
Net of tax amount 8,776 (2,129) (4,927) (110) 1,610
Balance at October 30, 2004 $ (5,223) $(15,823) $ 0 $ (2,488) $(23,534)
Unrecognized gains (losses) 217 (12,882) 10,433 (2,232)
Reclassification into net earnings 492 492
Tax effect 4,470 (4,119) 351
Net of tax amount 217 (8,412) 6,806 (1,389)
Balance at October 30, 2005 $ (5,006) $(24,235) $ 0 $ 4,318 $(24,923)
Unrecognized gains (losses) 4,058 13,015 611 (9,078) 8,606
Reclassification into net earnings (219) (219)
Tax effect (4,746) (230) 3,516 (1,460)
Net of tax amount 4,058 8,269 381 (5,781) 6,927
Balance at October 29, 2006 $ (948) $(15,966) $ 381 $ (1,463) $(17,996)
Derivatives and Hedging Activity: The company uses com-
modity and currency positions to manage its exposure to price
fluctuations in those markets. The contracts are recorded at
fair value on the consolidated statements of financial position
within prepaid expenses and other current assets, or other
current liabilities. Additional information on hedging activities
is presented in Note J.
Equity Method Investments: The company has a number of
investments in joint ventures where its voting interests are in
excess of 20 percent but not greater than 50 percent. The com-
pany accounts for such investments under the equity method of
accounting, and its underlying share of each investee’s equity is
reported in the consolidated statements of financial position as
part of investments in and receivables from affiliates. The only
significant equity method investment is a 40 percent ownership
interest in a Philippines joint venture, Purefoods-Hormel
Company, which has a book value of $46.7 million at October
29, 2006, and $39.9 million at October 30, 2005. This invest-
ment is included in the All Other segment for purposes of
measuring segment assets and profits.
On November 20, 2006, subsequent to the end of fiscal year
2006, the company completed a joint venture agreement with
San Miguel Corporation for a hog production and processing
business in Vietnam, for a preliminary investment of $20.5 mil-
lion. The joint venture will strengthen the company’s presence
in Asia, and the company’s 49 percent equity ownership will be
reported in the Hormel Foods International operating segment.

47Bringing More to the Table
The company regularly monitors and evaluates the fair value
of our equity investments. If events and circumstances indicate
that a decline in the fair value of these assets has occurred
and is other than temporary, the company will record a charge
in “equity in earnings of affiliates” in the consolidated state-
ments of operations. The company’s equity investments do
not have a readily determinable fair value as none of them are
publicly traded. The fair values of the company’s private equity
investments are determined by discounting the estimated future
cash flows of each entity. These cash flow estimates include
assumptions on growth rates and future currency exchange
rates. The company did not record an impairment charge on
any of its equity investments in fiscal years 2006, 2005, or 2004.
Revenue Recognition: The company recognizes sales when
title passes upon delivery of its products to customers net of
applicable provisions for discounts, returns, and allowances.
Products are delivered upon receipt of customer purchase
orders with acceptable terms, including price and collectibility
that is reasonably assured.
The company offers various sales incentives to customers
and consumers. Incentives that are offered off-invoice include
prompt pay allowances, spoilage allowances, and temporary
price reductions. These incentives are recognized as reduction
of revenue at the time title passes. Coupons are used as
an incentive for consumers to purchase various products.
The coupons reduce revenues at the time they are offered.
Promotional contracts and voluntary promotions are performed
by customers to promote the company’s products to the
consumers. These incentives reduce revenues at the time
of performance through direct payments and accrued promo-
tional funds. Accrued promotional funds are unpaid liabilities
for promotional contracts and voluntary promotions in process
or completed at the end of a quarter or fiscal year. Promotional
contract accruals are based on a review of the unpaid out-
standing contracts on which performance has taken place.
Voluntary performance accruals are based on the historical
spend rates by product lines. Estimates used to determine the
revenue reduction include the level of customer performance
and the historical spend rate versus contracted rates.
Advertising Expenses: Advertising costs are expensed when
incurred. Advertising expenses include all media advertising
but exclude the costs associated with samples and market
research. Advertising costs for fiscal years 2006, 2005, and
2004 were $93.7 million, $87.3 million, and $78.2 million,
respectively.
Shipping and Handling Costs: Shipping and handling costs
are recorded as selling and delivery expenses. Shipping and
handling costs for fiscal years 2006, 2005, and 2004 were
$409.5 million, $361.4 million, and $305.8 million, respectively.
Research and Development Expenses: Research and devel-
opment costs are expensed as incurred and are included in
administrative and general expenses. Research and development
expenses incurred for fiscal years 2006, 2005, and 2004 were
$18.6 million, $17.6 million, and $15.9 million, respectively.
Income Taxes: The company records income taxes in accor-
dance with the liability method of accounting. Deferred taxes
are recognized for the estimated taxes ultimately payable or
recoverable based on enacted tax law. Changes in enacted
tax rates are reflected in the tax provision as they occur.
Employee Stock Options: In the fourth quarter of fiscal 2003,
the company adopted the fair value method of accounting for
stock-based compensation in accordance with Statement of
Financial Accounting Standards (SFAS) No. 123, “Accounting
for Stock-Based Compensation” and SFAS No. 148, “Accounting
for Stock-Based Compensation – Transition and Disclosure”
and elected to use the prospective method to recognize stock-
based compensation expense. In the first quarter of fiscal year
2006, the company adopted the provisions of SFAS No. 123
(revised 2004) and began expensing stock-based compensa-
tion using the modified prospective method. At that time, the
company recognized $9.2 million ($6.1 million after tax, or
$.04 per share) of stock-based compensation expense primarily
due to executive retirements and the expensing of new options
grants to retirement-eligible individuals.
For options subject to graded vesting, the company recognizes
stock-based compensation expense ratably over the shorter
of the vesting period or requisite service period. Stock-based
compensation expense for grants made to retirement-eligible
employees is recognized on the date of grant.
Pro forma amounts if the company had used the fair value
method in accounting for all employee stock options are
as follows:
Year Ended
Restated* Restated*
October 30, October 30,
(In Thousands) 2005 2004
Net earnings, as reported $254,603 $233,550
Add: Stock-based compensation expense included in reported net earnings, net of related tax effects 4,391 2,568
Deduct: Total stock-based compensation expense determined under fair value method for all awards, net of related tax effects (5,752) (4,821)
Pro forma net earnings $253,242 $231,297
Earnings per share:Basic – as reported $ 1.84 $ 1.69Basic – pro forma $ 1.83 $ 1.67
Diluted – as reported $ 1.82 $ 1.67Diluted – pro forma $ 1.81 $ 1.65
*Retrospective application of FIFO inventory valuation.
Share Repurchases: On October 2, 2002, the company
announced that its Board of Directors had authorized the
company to repurchase up to 10,000,000 shares of common
stock with no expiration date. The company repurchased
1.1 million shares of its common stock at an average price

48 Hormel Foods Corporation
per share of $34.95 under this repurchase plan during fiscal
2006. This amount includes 295,680 shares from the Hormel
Foundation during the fourth quarter, purchased at the average
of the closing market prices for the three days of August 30,
August 31, and September 1, 2006. In total, 3.4 million shares
have been repurchased through October 29, 2006, under the
current share repurchase authorization.
Earnings Per Share: Basic earnings per share are computed
using the weighted-average common shares outstanding.
Diluted earnings per share are computed using the weighted-
average common shares outstanding after adjusting for poten-
tial common shares from stock options. For all years presented,
the reported net earnings were used when computing basic
and diluted earnings per share. A reconciliation of the shares
used in the computation is as follows:
(In Thousands) 2006 2005 2004
Basic weighted-average shares outstanding 137,845 138,040 138,596
Dilutive potential common shares 1,716 1,537 1,583
Diluted weighted-average shares outstanding 139,561 139,577 140,179
Accounting Changes and Recent Accounting
Pronouncements: In September 2006, the Financial Accounting
Standards Board (FASB) issued SFAS No. 158, “Employers’
Accounting for Defined Benefit Pension and Other Postretirement
Plans – an amendment of FASB Statements No. 87, 88, 106,
and 132(R).” The pronouncement requires the funded status
of a plan, measured as the difference between the fair value
of plan assets and the benefit obligation, be recognized on a
plan sponsor’s statement of financial position. It also requires
gains or losses that arise during the plan year to be recognized
as a component of other comprehensive income to the extent
they are not recognized in net periodic benefit cost during
the year. The pronouncement also requires plan sponsors to
measure defined benefit plan assets and obligations as of the
date of the plan sponsor’s fiscal year-end statement of finan-
cial position. The pronouncement is effective for fiscal years
ending after December 15, 2006. The company will adopt the
statement in fiscal year 2007 and is currently assessing the
impact of adopting this accounting standard.
In June 2006, the FASB issued Interpretation No. 48, “Accounting
for Uncertainty in Income Taxes,” an interpretation of FASB
Statement No. 109 (FIN 48). FIN 48 prescribes a recognition
threshold and measurement attribute for the financial statement
recognition and measurement of a tax position taken or expected
to be taken in a tax return. FIN 48 also provides guidance on
derecognition, classification, interest and penalties, accounting
in interim periods, disclosure, and transition. FIN 48 is effective
for fiscal years beginning after December 15, 2006, and there-
fore the company expects to adopt FIN 48 at the beginning of
fiscal 2008. The company has not yet determined the impact
of this accounting standard.
In May 2005, the FASB issued SFAS No. 154, “Accounting
Changes and Error Corrections – a replacement of Accounting
Principles Board (APB) Opinion No. 20 and FASB Statement
No. 3.” The pronouncement requires that all voluntary changes
in accounting principle be reported by retrospectively applying
the principle to all prior periods that are presented in the
financial statements. The statement is effective for fiscal
years beginning after December 15, 2005, with early adoption
permitted for changes made after issuance of the statement.
During the first quarter of fiscal 2006, the company early
adopted the provisions of SFAS No. 154 and reported a change
in accounting principle for certain inventory items through the
required retrospective application. See discussion of the
impact on the company’s financial statements above under
“Change in Accounting Principle.”
In December 2004, the FASB issued SFAS No. 123(R), “Share-
Based Payment,” which amends SFAS No. 123, “Accounting
for Stock-Based Compensation,” and supercedes APB Opinion
No. 25, “Accounting for Stock Issued to Employees.” The
statement requires that entities measure the cost of employee
services received in exchange for an award of equity instruments
based on the grant date fair value of the award, as calculated
using an accepted valuation model. In addition, the statement
rescinds the use of the prospective transition model for expens-
ing employee stock options and accelerates expensing of new
option grants for retirement-eligible individuals. The impact of
adopting this statement is discussed above under “Employee
Stock Options.”
In November 2004, the FASB issued SFAS No. 151, “Inventory
Costs – an amendment of Accounting Research Bulletin (ARB)
No. 43, Chapter 4.” The statement requires that idle facility
expense, excessive spoilage, double freight, and rehandling
costs be recognized as a current-period charge to earnings.
Previous guidance mandated that these costs be charged to
earnings on a current basis only under certain circumstances.
The company adopted the provisions of this statement at the
beginning of fiscal year 2006, and adoption did not have a
material impact on the company’s results of operations or
financial position.
Acquisitions and Divestitures
On March 31, 2006, the company acquired Valley Fresh, Inc.
(Valley Fresh) for the preliminary purchase price of $80.4 mil-
lion in cash, including related costs. Valley Fresh has the lead-
ing market share in the canned ready-to-eat chicken category
and distributes more than 50 convenient precooked chicken
products on a national basis, primarily under the Valley Fresh
brand. Valley Fresh was a privately held company and employs
approximately 265 employees at its 90,000-square-foot manu-
facturing facility in Turlock, California. Valley Fresh products
are expected to further strengthen the portfolio within the
company’s Grocery Products segment.
Note B

49Bringing More to the Table
On September 6, 2006, the company announced that it entered
into a definitive merger agreement, pursuant to which the
company will acquire Provena Foods Inc. (Provena). Provena
is a publicly traded company based in Chino, California, and
provides pepperoni and pasta to pizza makers and packaged
food manufacturers. The proposed acquisition has been
approved by the board of directors of each company and is
subject to customary closing conditions, including the
approval of the Provena shareholders. Shareholders holding
approximately 46 percent of the outstanding shares of Provena
common stock, as of September 6, 2006, had agreed to vote
their shares in favor of the merger agreement and against any
competing proposal. Assuming shareholder approval, the
transaction is expected to close by the end of calendar year
2006 with an estimated value of $16.8 million.
On November 10, 2006, subsequent to the end of fiscal year
2006, the company acquired the assets of Saag’s Products, Inc.
(Saag’s) for a preliminary purchase price of $12.0 million cash,
plus the assumption of certain obligations. Saag’s is based in
San Leandro, California, and is a leading processor and mar-
keter of branded, premium quality gourmet sausages and spe-
cialty smoked meats. The acquisition provides opportunities to
expand the company’s production capacity, and to enhance
the product portfolio within the Refrigerated Foods segment.
On December 29, 2004, the company purchased all of the out-
standing stock of Clougherty Packing Company (Clougherty)
for $208.2 million in cash, including related costs. Clougherty
was a privately held Southern California pork processor and is
the maker of the Farmer John brand of pork products popular
throughout the Southwestern United States. The acquisition
strengthens the company’s presence in that geographic area
and complements many of the company’s existing product
families. Clougherty was reorganized into Clougherty Packing,
LLC (d/b/a Farmer John) after acquisition. Farmer John’s oper-
ating results are reported in the Refrigerated Foods segment.
Allocation of the final purchase price, including related costs,
is presented in the table below.
(In Thousands)
Current assets $ 66,260
Goodwill 7,628
Other intangibles 21,400
Other assets 50
Property, plant, and equipment 139,585
Current liabilities (26,704)
Purchase price (including related costs) $208,219
On January 31, 2005, the company acquired Arriba Foods,
Inc. (a/k/a Mexican Accent) for $48.0 million in cash, including
related costs. Based in New Berlin, Wisconsin, Mexican Accent
manufactures and distributes a wide variety of premium
Mexican flour tortillas, corn tortillas, salsas, seasonings, and
tortilla chips for retail markets and the foodservice industry.
These products are marketed under the Manny’s, Gringo Pete’s,
and Mexican Accent brands, and strengthen the company’s
presence in the ethnic products category. Mexican Accent’s
operating results are reported in the Grocery Products segment.
On March 30, 2005, the company acquired privately held
Mark-Lynn Foods Inc. (Mark-Lynn) of Bremen, Georgia, for
$43.2 million in cash, including related costs. Mark-Lynn
manufactures and distributes a wide array of food products
including salt and pepper packets, ketchup, mustard, sauces
and salad dressings, creamers, sugar packets, jellies, desserts,
and drink mixes. Mark-Lynn is managed by the Diamond
Crystal Brands business unit and enhances the company’s
foodservice focus within the Specialty Foods segment.
On April 4, 2005, the company completed the acquisition of
Lloyd’s Barbeque Company (Lloyd’s) for $50.5 million in cash,
including related costs. Lloyd’s has manufacturing operations
in St. Paul, Minnesota, and offers a full range of barbeque
products including original shredded pork, chicken and beef
tubs, honey hickory shredded pork and chicken, barbeque
pork spareribs, beef backribs, and pork babyback ribs, all
under the Lloyd’s brand name. Lloyd’s products complement
the company’s existing offerings within the Refrigerated Foods
segment, and is expected to enhance market share, particu-
larly in the retail refrigerated entrée category.
Effective June 30, 2004, the company completed the sale of
Vista International Packaging, Inc., the company’s food pack-
aging subsidiary. The company recorded an $18.1 million
pre-tax gain ($11.5 million after tax, or $.08 per share) in the
third quarter of fiscal 2004 related to the sale.
On October 18, 2004, the company purchased the assets
of Concept Foods, Inc. (Concept) for $17.1 million in cash.
Concept, located in Alma, Kansas, was renamed Alma Foods
upon acquisition. Alma Foods manufactures a wide variety
of fully cooked entrees.
Operating results for each completed acquisition above
are included in the company’s consolidated statements of
operations from the date of acquisition. Pro forma results
of operations are not presented, as no acquisitions in 2006,
2005, or 2004 were considered material, individually or in
the aggregate, to the consolidated company.
Inventories
Principal components of inventories are:
Restated*
October 29, October 30,
(In Thousands) 2006 2005
Finished products $308,509 $284,341
Raw materials and work-in-process 153,189 147,968
Materials and supplies 109,234 102,263
Total $570,932 $534,572
*Retrospective application of FIFO inventory valuation (see Note A).
Note C

50 Hormel Foods Corporation
Goodwill and Intangible Assets
The changes in the carrying amount of goodwill for the fiscal years ended October 29, 2006, and October 30, 2005, are presented
in the table below. The amounts presented for goodwill acquired in fiscal year 2005 reflect the acquisitions of Farmer John,
Mexican Accent, Mark-Lynn, and Lloyd’s. The purchase adjustments in fiscal year 2005 also relate to the purchase accounting
for those acquisitions. Goodwill acquired in fiscal 2006 reflects the acquisition of Valley Fresh. The purchase adjustments in fiscal
year 2006 relate to the purchase accounting for Valley Fresh, including an allocation to intangible assets based on appraisals, and
to a lesser extent, finalizing the purchase accounting for the fiscal 2005 acquisitions.
Grocery Refrigerated Jennie-O Specialty
(In Thousands) Products Foods Turkey Store Foods Other Total
Balance as of October 30, 2004 $ 40,564 $ 5,224 $203,214 $166,374 $2,352 $417,728
Goodwill acquired 35,598 41,753 0 26,372 0 103,723
Purchase adjustments 3,259 (21,097) 0 (1,506) 0 (19,344)
Balance as of October 30, 2005 79,421 25,880 203,214 191,240 2,352 502,107
Goodwill acquired 61,334 76 0 0 61,410
Purchase adjustments (16,388) 0 0 3,577 0 (12,811)
Balance as of October 29, 2006 $124,367 $ 25,956 $203,214 $194,817 $2,352 $550,706
The gross carrying amount and accumulated amortization for definite-lived intangible assets are presented in the table below.
The increase in fiscal year 2006 primarily represents intangible assets acquired from Valley Fresh.
October 29, 2006 October 30, 2005
Gross Weighted Gross Weighted
Carrying Accumulated Average Life Carrying Accumulated Average Life
(In Thousands) Amount Amortization (in Years) Amount Amortization (in Years)
Formulas & recipes $20,875 (9,574) 8.1 $20,075 (6,402) 8.4
Non-compete covenants 19,310 (11,103) 4.9 15,320 (7,532) 4.8
Proprietary software & technology 17,040 (3,831) 9.2 10,920 (2,106) 10.4
Customer lists/relationships 11,300 (3,093) 11.0 12,260 (2,004) 11.2
Distribution network 3,700 (1,303) 10.0 3,700 (933) 10.0
Purchase & supply agreements 2,460 (2,096) 3.1 3,090 (1,914) 2.9
Other intangibles 7,992 (2,845) 6.7 3,352 (1,972) 4.8
Total $82,677 (33,845) 7.8 $68,717 (22,863) 8.1
Note D
Amortization expense for the fiscal years ended October 29,
2006, October 30, 2005, and October 30, 2004, was $11.7
million, $9.4 million, and $7.1 million, respectively.
Estimated annual amortization expense (in thousands) for the
five fiscal years after October 29, 2006, is as follows:
2007 $11,074
2008 8,146
2009 6,485
2010 5,704
2011 4,853
The carrying amounts for indefinite-lived intangible assets are
as follows. The increase in fiscal year 2006 primarily represents
trademarks acquired from Valley Fresh.
October 29, October 30,
(In Thousands) 2006 2005
Unamortized Intangible Assets:
Brand/tradename/trademarks $91,159 $85,741
Other intangibles 7,984 7,984
Total $99,143 $93,725
During the fourth quarter of fiscal 2006, the company completed
the required annual impairment tests of indefinite-lived intangi-
ble assets and goodwill with no material impairment indicated.
Useful lives of intangible assets were also reviewed during this
process, with no material adjustments required.
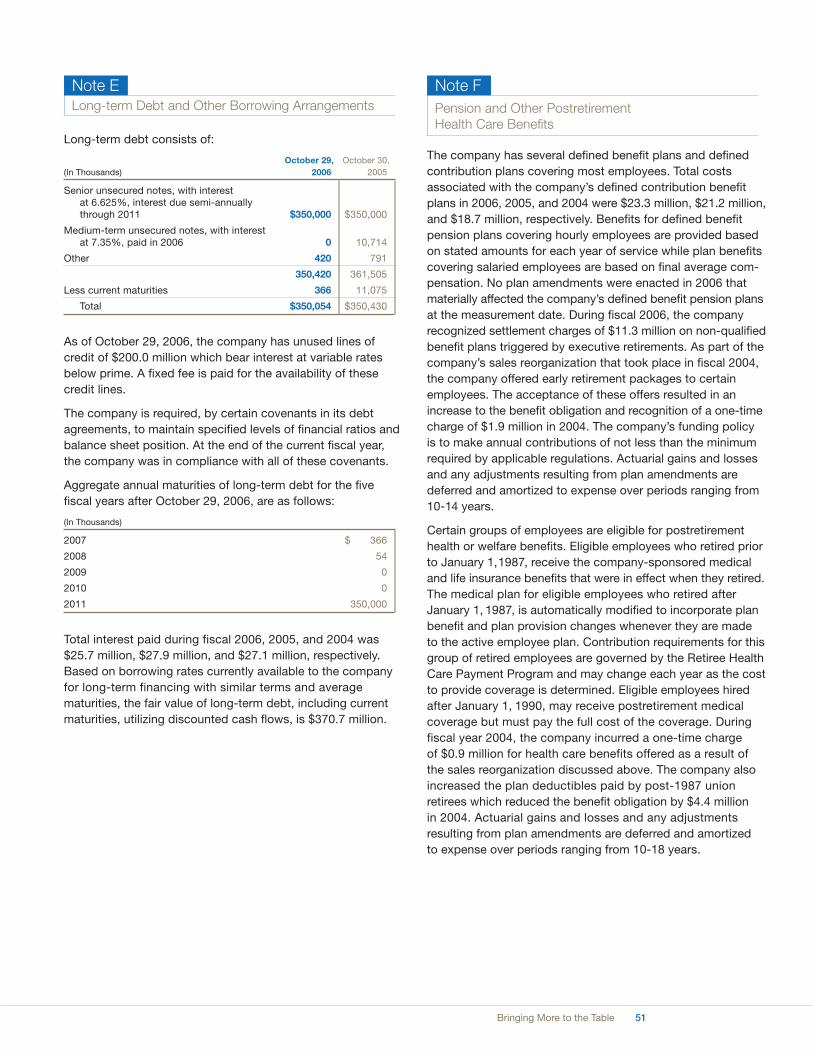
51Bringing More to the Table
Long-term Debt and Other Borrowing Arrangements
Long-term debt consists of:
October 29, October 30,
(In Thousands) 2006 2005
Senior unsecured notes, with interestat 6.625%, interest due semi-annually through 2011 $350,000 $350,000
Medium-term unsecured notes, with interest at 7.35%, paid in 2006 0 10,714
Other 420 791
350,420 361,505
Less current maturities 366 11,075
Total $350,054 $350,430
As of October 29, 2006, the company has unused lines of
credit of $200.0 million which bear interest at variable rates
below prime. A fixed fee is paid for the availability of these
credit lines.
The company is required, by certain covenants in its debt
agreements, to maintain specified levels of financial ratios and
balance sheet position. At the end of the current fiscal year,
the company was in compliance with all of these covenants.
Aggregate annual maturities of long-term debt for the five
fiscal years after October 29, 2006, are as follows:
(In Thousands)
2007 $ 366
2008 54
2009 0
2010 0
2011 350,000
Total interest paid during fiscal 2006, 2005, and 2004 was
$25.7 million, $27.9 million, and $27.1 million, respectively.
Based on borrowing rates currently available to the company
for long-term financing with similar terms and average
maturities, the fair value of long-term debt, including current
maturities, utilizing discounted cash flows, is $370.7 million.
Pension and Other Postretirement Health Care Benefits
The company has several defined benefit plans and defined
contribution plans covering most employees. Total costs
associated with the company’s defined contribution benefit
plans in 2006, 2005, and 2004 were $23.3 million, $21.2 million,
and $18.7 million, respectively. Benefits for defined benefit
pension plans covering hourly employees are provided based
on stated amounts for each year of service while plan benefits
covering salaried employees are based on final average com-
pensation. No plan amendments were enacted in 2006 that
materially affected the company’s defined benefit pension plans
at the measurement date. During fiscal 2006, the company
recognized settlement charges of $11.3 million on non-qualified
benefit plans triggered by executive retirements. As part of the
company’s sales reorganization that took place in fiscal 2004,
the company offered early retirement packages to certain
employees. The acceptance of these offers resulted in an
increase to the benefit obligation and recognition of a one-time
charge of $1.9 million in 2004. The company’s funding policy
is to make annual contributions of not less than the minimum
required by applicable regulations. Actuarial gains and losses
and any adjustments resulting from plan amendments are
deferred and amortized to expense over periods ranging from
10-14 years.
Certain groups of employees are eligible for postretirement
health or welfare benefits. Eligible employees who retired prior
to January 1,1987, receive the company-sponsored medical
and life insurance benefits that were in effect when they retired.
The medical plan for eligible employees who retired after
January 1, 1987, is automatically modified to incorporate plan
benefit and plan provision changes whenever they are made
to the active employee plan. Contribution requirements for this
group of retired employees are governed by the Retiree Health
Care Payment Program and may change each year as the cost
to provide coverage is determined. Eligible employees hired
after January 1, 1990, may receive postretirement medical
coverage but must pay the full cost of the coverage. During
fiscal year 2004, the company incurred a one-time charge
of $0.9 million for health care benefits offered as a result of
the sales reorganization discussed above. The company also
increased the plan deductibles paid by post-1987 union
retirees which reduced the benefit obligation by $4.4 million
in 2004. Actuarial gains and losses and any adjustments
resulting from plan amendments are deferred and amortized
to expense over periods ranging from 10-18 years.
Note FNote E
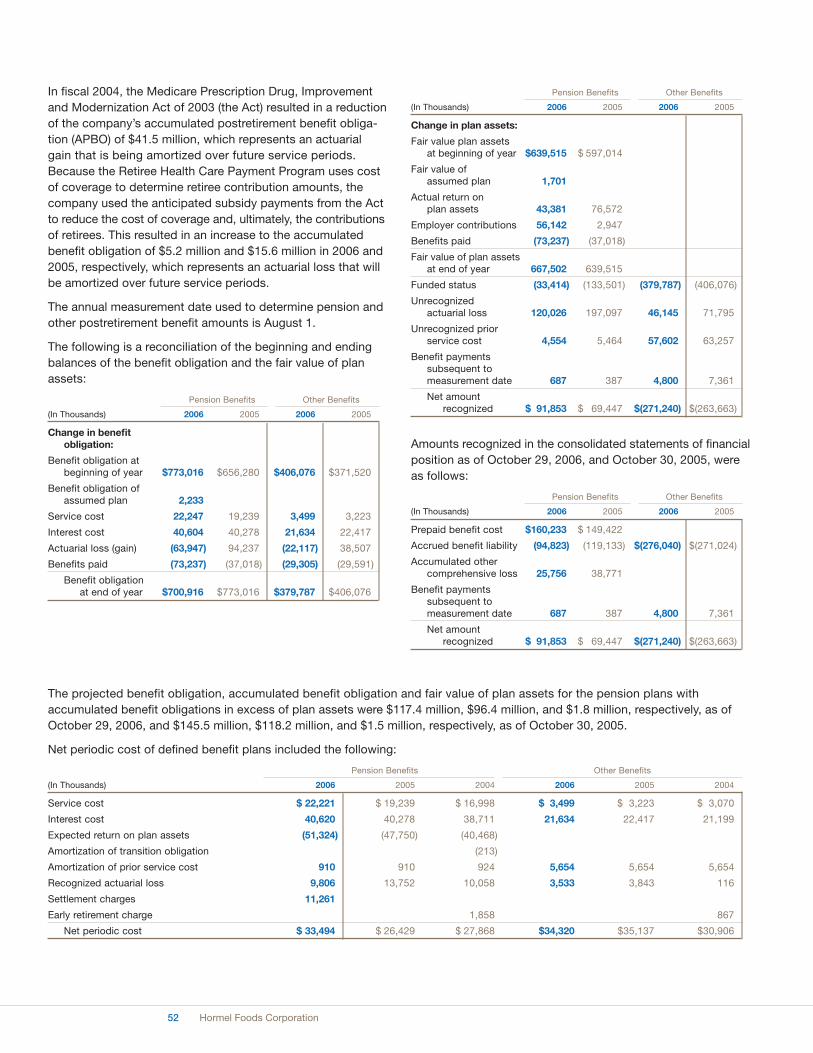
52 Hormel Foods Corporation
In fiscal 2004, the Medicare Prescription Drug, Improvement
and Modernization Act of 2003 (the Act) resulted in a reduction
of the company’s accumulated postretirement benefit obliga-
tion (APBO) of $41.5 million, which represents an actuarial
gain that is being amortized over future service periods.
Because the Retiree Health Care Payment Program uses cost
of coverage to determine retiree contribution amounts, the
company used the anticipated subsidy payments from the Act
to reduce the cost of coverage and, ultimately, the contributions
of retirees. This resulted in an increase to the accumulated
benefit obligation of $5.2 million and $15.6 million in 2006 and
2005, respectively, which represents an actuarial loss that will
be amortized over future service periods.
The annual measurement date used to determine pension and
other postretirement benefit amounts is August 1.
The following is a reconciliation of the beginning and ending
balances of the benefit obligation and the fair value of plan
assets:
Pension Benefits Other Benefits
(In Thousands) 2006 2005 2006 2005
Change in benefit obligation:
Benefit obligation at beginning of year $773,016 $656,280 $406,076 $371,520
Benefit obligation of assumed plan 2,233
Service cost 22,247 19,239 3,499 3,223
Interest cost 40,604 40,278 21,634 22,417
Actuarial loss (gain) (63,947) 94,237 (22,117) 38,507
Benefits paid (73,237) (37,018) (29,305) (29,591)
Benefit obligation at end of year $700,916 $773,016 $379,787 $406,076
Pension Benefits Other Benefits
(In Thousands) 2006 2005 2006 2005
Change in plan assets:
Fair value plan assets at beginning of year $639,515 $ 597,014
Fair value of assumed plan 1,701
Actual return on plan assets 43,381 76,572
Employer contributions 56,142 2,947
Benefits paid (73,237) (37,018)
Fair value of plan assetsat end of year 667,502 639,515
Funded status (33,414) (133,501) (379,787) (406,076)
Unrecognized actuarial loss 120,026 197,097 46,145 71,795
Unrecognized prior service cost 4,554 5,464 57,602 63,257
Benefit payments subsequent to measurement date 687 387 4,800 7,361
Net amount recognized $ 91,853 $ 69,447 $(271,240) $(263,663)
Amounts recognized in the consolidated statements of financial
position as of October 29, 2006, and October 30, 2005, were
as follows:
Pension Benefits Other Benefits
(In Thousands) 2006 2005 2006 2005
Prepaid benefit cost $160,233 $ 149,422
Accrued benefit liability (94,823) (119,133) $(276,040) $(271,024)
Accumulated other comprehensive loss 25,756 38,771
Benefit payments subsequent to measurement date 687 387 4,800 7,361
Net amount recognized $ 91,853 $ 69,447 $(271,240) $(263,663)
The projected benefit obligation, accumulated benefit obligation and fair value of plan assets for the pension plans with
accumulated benefit obligations in excess of plan assets were $117.4 million, $96.4 million, and $1.8 million, respectively, as of
October 29, 2006, and $145.5 million, $118.2 million, and $1.5 million, respectively, as of October 30, 2005.
Net periodic cost of defined benefit plans included the following:
Pension Benefits Other Benefits
(In Thousands) 2006 2005 2004 2006 2005 2004
Service cost $ 22,221 $ 19,239 $ 16,998 $ 3,499 $ 3,223 $ 3,070
Interest cost 40,620 40,278 38,711 21,634 22,417 21,199
Expected return on plan assets (51,324) (47,750) (40,468)
Amortization of transition obligation (213)
Amortization of prior service cost 910 910 924 5,654 5,654 5,654
Recognized actuarial loss 9,806 13,752 10,058 3,533 3,843 116
Settlement charges 11,261
Early retirement charge 1,858 867
Net periodic cost $ 33,494 $ 26,429 $ 27,868 $34,320 $35,137 $30,906

53Bringing More to the Table
Assumptions used to determine benefit obligations are
as follows:
2006 2005
Discount rate 6.33% 5.50%
Rate of future compensation increase 5.00% 5.00%
Assumptions used to determine net periodic benefit costs are
as follows:
2006 2005 2004
Discount rate 5.50% 6.25% 6.50%
Rate of future compensation increase 5.00% 5.00% 5.00%
Expected long-term return on plan assets 8.25% 8.25% 7.90%
The expected long-term rate of return on plan assets is
developed in consultation with outside advisors. A range is
determined based on the composition of the asset portfolio,
historical long-term rates of return, and estimates of future
performance.
For measurement purposes, an 8% annual rate of increase
in the per capita cost of covered health care benefits was
assumed for 2007. The rate is assumed to decrease by 1%
per year to 5% for 2010, and remain at that level thereafter.
Assumed health care cost trend rates have a significant
impact on the amounts reported for the health care plan.
A one-percentage-point change in assumed health care cost
trend rates would have the following effects:
1-Percentage-Point
(In Thousands) Increase Decrease
Effect on total of service and interest cost components $ 2,926 $ (2,023)
Effect on the postretirement benefit obligation 29,542 (25,959)
The actual and target weighted-average asset allocations for
the company’s pension plan assets as of the plan measurement
date are as follows:
2006 2005
Target Target
Asset Category Actual Range Actual Range
Equity Securities 69.6% 60-80% 69.7% 65-75%
Fixed Income 29.9% 25-35% 30.1% 25-35%
Other 0.5% 0% 0.2% 0%
Target allocations are established in consultation with outside
advisors through the use of asset-liability modeling to attempt
to match the duration of the plan assets with the duration of
the company’s projected benefit liability. The asset allocation
strategy attempts to minimize the long-term cost of pension
benefits, reduce the volatility of pension expense, and achieve
a healthy funded status for the plans.
As of the 2006 measurement date, plan assets included
2.1 million shares of common stock of the company having
a market value of $77.6 million or 12% of total plan assets.
Dividends paid during the year on shares held by the plan
were $1.1 million. In 2005, plan assets included 2.3 million
shares of common stock of the company having a market
value of $72.2 million or 11% of total plan assets.
The company made a discretionary contribution of $17.7 million
to the company’s defined benefit plans in 2006. The company
also made contributions and benefit payments of $36.3 million
to settle lump sum obligations under non-qualified pension plans
triggered by executive retirements during fiscal 2006. The
company does not have any current plans to make additional
discretionary contributions to fund the pension plans, but will
continue to assess the funded status throughout fiscal 2007.
The company expects to make contributions of $32.4 million
during 2007 that represent benefit payments for unfunded plans.
Benefits expected to be paid over the next ten fiscal years are
as follows:
Pension Other
(In Thousands) Benefits Benefits
2007 $ 38,290 $ 27,842
2008 37,866 28,174
2009 42,611 28,835
2010 41,113 28,277
2011 40,078 28,105
2012 and later 218,724 131,287
Income Taxes
The components of the provision for income taxes are
as follows:
Restated* Restated*
(In Thousands) 2006 2005 2004
Current:
U.S. Federal $151,484 $159,331 $130,389
State 18,487 14,019 13,273
Foreign 1,169 3,106 880
Total current 171,140 176,456 144,542
Deferred:
U.S. Federal (24,521) (25,688) (8,377)
State (2,215) 1,355 (2,117)
Total deferred (26,736) (24,333) (10,494)
Total provision for income taxes $144,404 $152,123 $134,048
*Retrospective application of FIFO inventory valuation (See Note A).
Note G
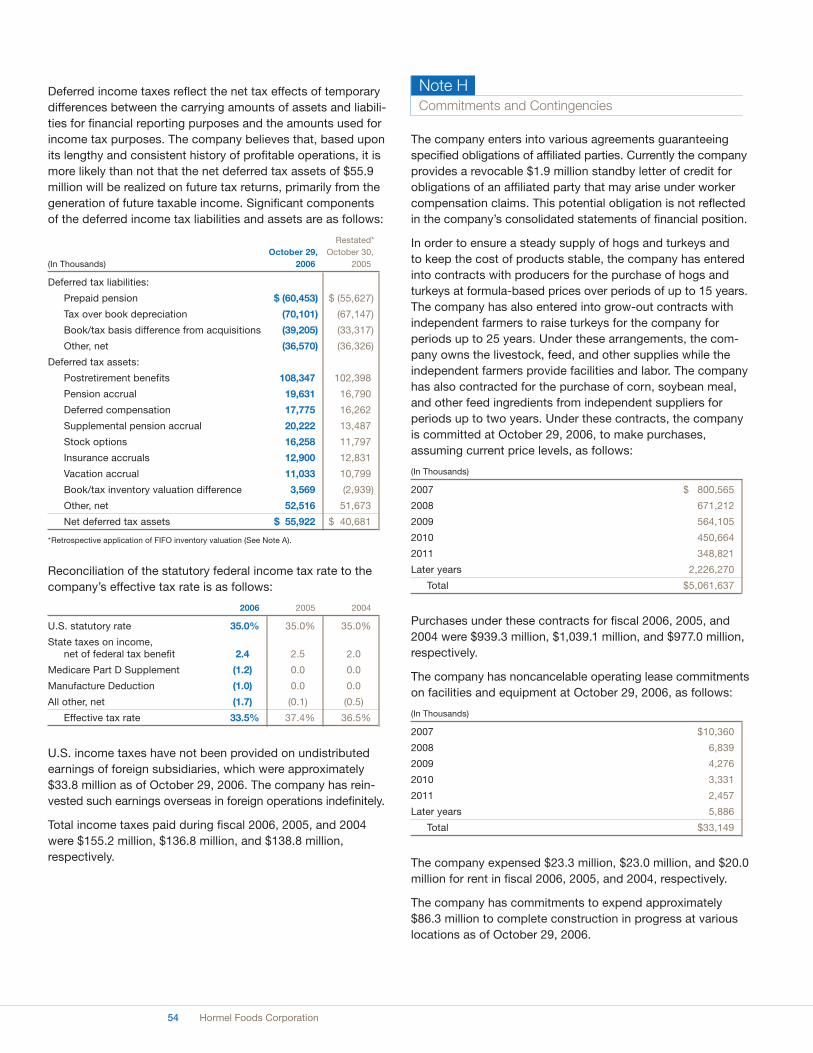
54 Hormel Foods Corporation
Deferred income taxes reflect the net tax effects of temporary
differences between the carrying amounts of assets and liabili-
ties for financial reporting purposes and the amounts used for
income tax purposes. The company believes that, based upon
its lengthy and consistent history of profitable operations, it is
more likely than not that the net deferred tax assets of $55.9
million will be realized on future tax returns, primarily from the
generation of future taxable income. Significant components
of the deferred income tax liabilities and assets are as follows:
Restated*
October 29, October 30,
(In Thousands) 2006 2005
Deferred tax liabilities:
Prepaid pension $ (60,453) $ (55,627)
Tax over book depreciation (70,101) (67,147)
Book/tax basis difference from acquisitions (39,205) (33,317)
Other, net (36,570) (36,326)
Deferred tax assets:
Postretirement benefits 108,347 102,398
Pension accrual 19,631 16,790
Deferred compensation 17,775 16,262
Supplemental pension accrual 20,222 13,487
Stock options 16,258 11,797
Insurance accruals 12,900 12,831
Vacation accrual 11,033 10,799
Book/tax inventory valuation difference 3,569 (2,939)
Other, net 52,516 51,673
Net deferred tax assets $ 55,922 $ 40,681
*Retrospective application of FIFO inventory valuation (See Note A).
Reconciliation of the statutory federal income tax rate to the
company’s effective tax rate is as follows:
2006 2005 2004
U.S. statutory rate 35.0% 35.0% 35.0%
State taxes on income, net of federal tax benefit 2.4 2.5 2.0
Medicare Part D Supplement (1.2) 0.0 0.0
Manufacture Deduction (1.0) 0.0 0.0
All other, net (1.7) (0.1) (0.5)
Effective tax rate 33.5% 37.4% 36.5%
U.S. income taxes have not been provided on undistributed
earnings of foreign subsidiaries, which were approximately
$33.8 million as of October 29, 2006. The company has rein-
vested such earnings overseas in foreign operations indefinitely.
Total income taxes paid during fiscal 2006, 2005, and 2004
were $155.2 million, $136.8 million, and $138.8 million,
respectively.
Commitments and Contingencies
The company enters into various agreements guaranteeing
specified obligations of affiliated parties. Currently the company
provides a revocable $1.9 million standby letter of credit for
obligations of an affiliated party that may arise under worker
compensation claims. This potential obligation is not reflected
in the company’s consolidated statements of financial position.
In order to ensure a steady supply of hogs and turkeys and
to keep the cost of products stable, the company has entered
into contracts with producers for the purchase of hogs and
turkeys at formula-based prices over periods of up to 15 years.
The company has also entered into grow-out contracts with
independent farmers to raise turkeys for the company for
periods up to 25 years. Under these arrangements, the com-
pany owns the livestock, feed, and other supplies while the
independent farmers provide facilities and labor. The company
has also contracted for the purchase of corn, soybean meal,
and other feed ingredients from independent suppliers for
periods up to two years. Under these contracts, the company
is committed at October 29, 2006, to make purchases,
assuming current price levels, as follows:
(In Thousands)
2007 $ 800,565
2008 671,212
2009 564,105
2010 450,664
2011 348,821
Later years 2,226,270
Total $5,061,637
Purchases under these contracts for fiscal 2006, 2005, and
2004 were $939.3 million, $1,039.1 million, and $977.0 million,
respectively.
The company has noncancelable operating lease commitments
on facilities and equipment at October 29, 2006, as follows:
(In Thousands)
2007 $10,360
2008 6,839
2009 4,276
2010 3,331
2011 2,457
Later years 5,886
Total $33,149
The company expensed $23.3 million, $23.0 million, and $20.0
million for rent in fiscal 2006, 2005, and 2004, respectively.
The company has commitments to expend approximately
$86.3 million to complete construction in progress at various
locations as of October 29, 2006.
Note H
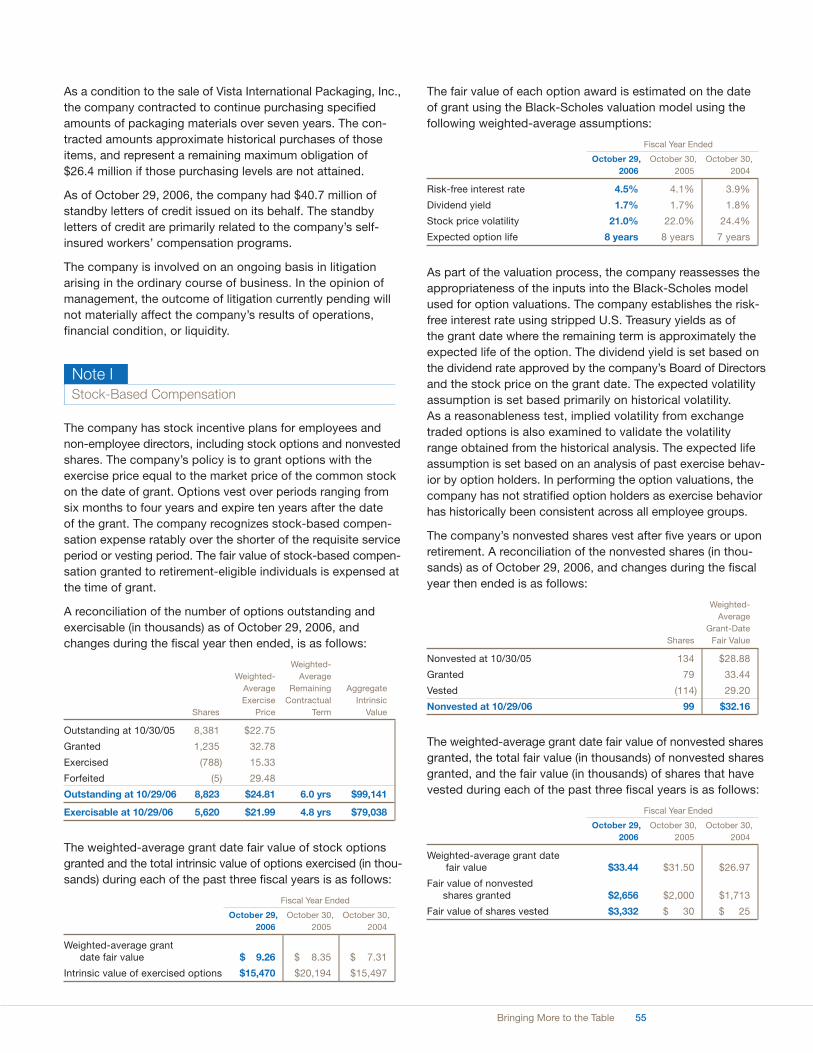
55Bringing More to the Table
As a condition to the sale of Vista International Packaging, Inc.,
the company contracted to continue purchasing specified
amounts of packaging materials over seven years. The con-
tracted amounts approximate historical purchases of those
items, and represent a remaining maximum obligation of
$26.4 million if those purchasing levels are not attained.
As of October 29, 2006, the company had $40.7 million of
standby letters of credit issued on its behalf. The standby
letters of credit are primarily related to the company’s self-
insured workers’ compensation programs.
The company is involved on an ongoing basis in litigation
arising in the ordinary course of business. In the opinion of
management, the outcome of litigation currently pending will
not materially affect the company’s results of operations,
financial condition, or liquidity.
Stock-Based Compensation
The company has stock incentive plans for employees and
non-employee directors, including stock options and nonvested
shares. The company’s policy is to grant options with the
exercise price equal to the market price of the common stock
on the date of grant. Options vest over periods ranging from
six months to four years and expire ten years after the date
of the grant. The company recognizes stock-based compen-
sation expense ratably over the shorter of the requisite service
period or vesting period. The fair value of stock-based compen-
sation granted to retirement-eligible individuals is expensed at
the time of grant.
A reconciliation of the number of options outstanding and
exercisable (in thousands) as of October 29, 2006, and
changes during the fiscal year then ended, is as follows:
Weighted-
Weighted- Average
Average Remaining Aggregate
Exercise Contractual Intrinsic
Shares Price Term Value
Outstanding at 10/30/05 8,381 $22.75
Granted 1,235 32.78
Exercised (788) 15.33
Forfeited (5) 29.48
Outstanding at 10/29/06 8,823 $24.81 6.0 yrs $99,141
Exercisable at 10/29/06 5,620 $21.99 4.8 yrs $79,038
The weighted-average grant date fair value of stock options
granted and the total intrinsic value of options exercised (in thou-
sands) during each of the past three fiscal years is as follows:
Fiscal Year Ended
October 29, October 30, October 30,
2006 2005 2004
Weighted-average grant date fair value $ 9.26 $ 8.35 $ 7.31
Intrinsic value of exercised options $15,470 $20,194 $15,497
The fair value of each option award is estimated on the date
of grant using the Black-Scholes valuation model using the
following weighted-average assumptions:
Fiscal Year Ended
October 29, October 30, October 30,
2006 2005 2004
Risk-free interest rate 4.5% 4.1% 3.9%
Dividend yield 1.7% 1.7% 1.8%
Stock price volatility 21.0% 22.0% 24.4%
Expected option life 8 years 8 years 7 years
As part of the valuation process, the company reassesses the
appropriateness of the inputs into the Black-Scholes model
used for option valuations. The company establishes the risk-
free interest rate using stripped U.S. Treasury yields as of
the grant date where the remaining term is approximately the
expected life of the option. The dividend yield is set based on
the dividend rate approved by the company’s Board of Directors
and the stock price on the grant date. The expected volatility
assumption is set based primarily on historical volatility.
As a reasonableness test, implied volatility from exchange
traded options is also examined to validate the volatility
range obtained from the historical analysis. The expected life
assumption is set based on an analysis of past exercise behav-
ior by option holders. In performing the option valuations, the
company has not stratified option holders as exercise behavior
has historically been consistent across all employee groups.
The company’s nonvested shares vest after five years or upon
retirement. A reconciliation of the nonvested shares (in thou-
sands) as of October 29, 2006, and changes during the fiscal
year then ended is as follows:
Weighted-
Average
Grant-Date
Shares Fair Value
Nonvested at 10/30/05 134 $28.88
Granted 79 33.44
Vested (114) 29.20
Nonvested at 10/29/06 99 $32.16
The weighted-average grant date fair value of nonvested shares
granted, the total fair value (in thousands) of nonvested shares
granted, and the fair value (in thousands) of shares that have
vested during each of the past three fiscal years is as follows:
Fiscal Year Ended
October 29, October 30, October 30,
2006 2005 2004
Weighted-average grant datefair value $33.44 $31.50 $26.97
Fair value of nonvested shares granted $2,656 $2,000 $1,713
Fair value of shares vested $3,332 $ 30 $ 25
Note I
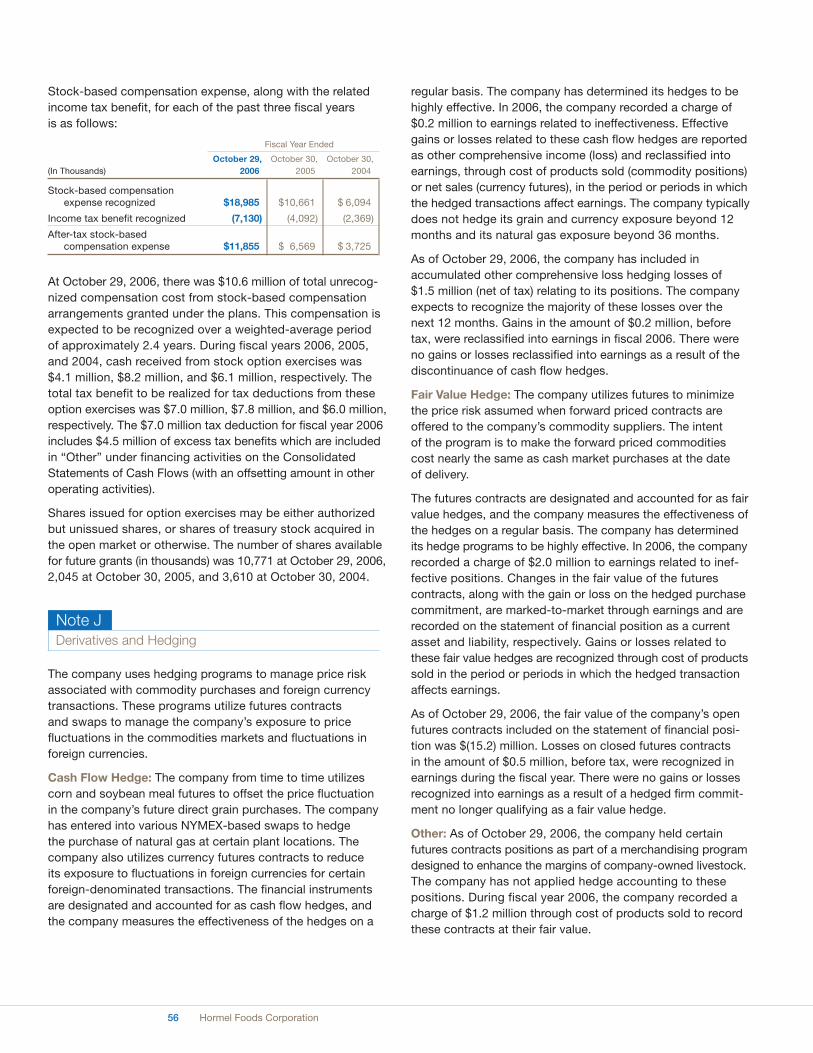
56 Hormel Foods Corporation
Stock-based compensation expense, along with the related
income tax benefit, for each of the past three fiscal years
is as follows:
Fiscal Year Ended
October 29, October 30, October 30,
(In Thousands) 2006 2005 2004
Stock-based compensation expense recognized $18,985 $10,661 $ 6,094
Income tax benefit recognized (7,130) (4,092) (2,369)
After-tax stock-based compensation expense $11,855 $ 6,569 $ 3,725
At October 29, 2006, there was $10.6 million of total unrecog-
nized compensation cost from stock-based compensation
arrangements granted under the plans. This compensation is
expected to be recognized over a weighted-average period
of approximately 2.4 years. During fiscal years 2006, 2005,
and 2004, cash received from stock option exercises was
$4.1 million, $8.2 million, and $6.1 million, respectively. The
total tax benefit to be realized for tax deductions from these
option exercises was $7.0 million, $7.8 million, and $6.0 million,
respectively. The $7.0 million tax deduction for fiscal year 2006
includes $4.5 million of excess tax benefits which are included
in “Other” under financing activities on the Consolidated
Statements of Cash Flows (with an offsetting amount in other
operating activities).
Shares issued for option exercises may be either authorized
but unissued shares, or shares of treasury stock acquired in
the open market or otherwise. The number of shares available
for future grants (in thousands) was 10,771 at October 29, 2006,
2,045 at October 30, 2005, and 3,610 at October 30, 2004.
Derivatives and Hedging
The company uses hedging programs to manage price risk
associated with commodity purchases and foreign currency
transactions. These programs utilize futures contracts
and swaps to manage the company’s exposure to price
fluctuations in the commodities markets and fluctuations in
foreign currencies.
Cash Flow Hedge: The company from time to time utilizes
corn and soybean meal futures to offset the price fluctuation
in the company’s future direct grain purchases. The company
has entered into various NYMEX-based swaps to hedge
the purchase of natural gas at certain plant locations. The
company also utilizes currency futures contracts to reduce
its exposure to fluctuations in foreign currencies for certain
foreign-denominated transactions. The financial instruments
are designated and accounted for as cash flow hedges, and
the company measures the effectiveness of the hedges on a
regular basis. The company has determined its hedges to be
highly effective. In 2006, the company recorded a charge of
$0.2 million to earnings related to ineffectiveness. Effective
gains or losses related to these cash flow hedges are reported
as other comprehensive income (loss) and reclassified into
earnings, through cost of products sold (commodity positions)
or net sales (currency futures), in the period or periods in which
the hedged transactions affect earnings. The company typically
does not hedge its grain and currency exposure beyond 12
months and its natural gas exposure beyond 36 months.
As of October 29, 2006, the company has included in
accumulated other comprehensive loss hedging losses of
$1.5 million (net of tax) relating to its positions. The company
expects to recognize the majority of these losses over the
next 12 months. Gains in the amount of $0.2 million, before
tax, were reclassified into earnings in fiscal 2006. There were
no gains or losses reclassified into earnings as a result of the
discontinuance of cash flow hedges.
Fair Value Hedge: The company utilizes futures to minimize
the price risk assumed when forward priced contracts are
offered to the company’s commodity suppliers. The intent
of the program is to make the forward priced commodities
cost nearly the same as cash market purchases at the date
of delivery.
The futures contracts are designated and accounted for as fair
value hedges, and the company measures the effectiveness of
the hedges on a regular basis. The company has determined
its hedge programs to be highly effective. In 2006, the company
recorded a charge of $2.0 million to earnings related to inef-
fective positions. Changes in the fair value of the futures
contracts, along with the gain or loss on the hedged purchase
commitment, are marked-to-market through earnings and are
recorded on the statement of financial position as a current
asset and liability, respectively. Gains or losses related to
these fair value hedges are recognized through cost of products
sold in the period or periods in which the hedged transaction
affects earnings.
As of October 29, 2006, the fair value of the company’s open
futures contracts included on the statement of financial posi-
tion was $(15.2) million. Losses on closed futures contracts
in the amount of $0.5 million, before tax, were recognized in
earnings during the fiscal year. There were no gains or losses
recognized into earnings as a result of a hedged firm commit-
ment no longer qualifying as a fair value hedge.
Other: As of October 29, 2006, the company held certain
futures contracts positions as part of a merchandising program
designed to enhance the margins of company-owned livestock.
The company has not applied hedge accounting to these
positions. During fiscal year 2006, the company recorded a
charge of $1.2 million through cost of products sold to record
these contracts at their fair value.
Note J

57Bringing More to the Table
Segment Operating Results
The company develops, processes, and distributes a wide
array of food products in a variety of markets. Under the
criteria set forth by the accounting standard SFAS No. 131,
“Disclosures about Segments of an Enterprise and Related
Information,” the company reports its results in the following
five segments: Grocery Products, Refrigerated Foods,
Jennie-O Turkey Store, Specialty Foods, and All Other.
The Grocery Products segment consists primarily of the pro-
cessing, marketing, and sale of shelf-stable food products
sold predominately in the retail market. This segment also
includes the results of Valley Fresh, acquired in the second
quarter of fiscal 2006, and Mexican Accent, acquired in the
second quarter of fiscal 2005.
The Refrigerated Foods segment includes the Meat Products
and Foodservice business units. This segment consists
primarily of the processing, marketing, and sale of branded
and unbranded pork products for retail, foodservice, and fresh
product customers. This segment also includes the Precept
Foods, LLC operation, which offers fresh, case-ready, branded
pork and beef products to its retail customers. Precept Foods,
LLC is a 51 percent owned joint venture between Hormel Foods
Corporation and Cargill Meat Solutions Corporation (formerly
Excel Corporation), a wholly owned subsidiary of Cargill,
Incorporated. Farmer John, which was acquired in December
2004, is included as an operating segment within Refrigerated
Foods, and the Meat Products business unit includes the results
of operations for Lloyd’s, which was acquired in April 2005.
The Jennie-O Turkey Store segment consists primarily of the
processing, marketing, and sale of branded and unbranded
turkey products for retail, foodservice, and fresh product
customers.
The Specialty Foods segment includes the Diamond Crystal
Brands, Century Foods International, and Hormel Specialty
Products operating segments. This segment consists of the
packaging and sale of various sugar and sugar substitute
products, salt and pepper products, dessert mixes, gelatin
products, and private label canned meats to retail and food-
service customers. This segment also includes the process-
ing, marketing, and sale of nutritional food products and
supplements to hospitals, nursing homes, and other marketers
of nutritional products. Diamond Crystal Brands includes the
results of operations for Hormel HealthLabs and Mark-Lynn,
which was acquired in March 2005.
The All Other segment includes the Dan’s Prize and Hormel
Foods International operating segments. These businesses
produce, market, and sell beef products and manufacture,
market, and sell company products internationally. This seg-
ment also includes various miscellaneous corporate sales.
Previously, this segment also included Vista International
Packaging, a manufacturer of food packaging (i.e., casings
for dry sausage), which was sold in June 2004.
Intersegment sales are recorded at prices that approximate
cost and are eliminated in the consolidated statements of
operations. Equity in earnings of affiliates is included in segment
profit; however, the company does not allocate investment
income, interest expense, and interest income to its segments
when measuring performance. The company also retains vari-
ous other income and unallocated expenses at corporate.
These items are included below as “Net interest and investment
income” and “General corporate expense” when reconciling to
earnings before income taxes.
Sales and operating profits for each of the company’s business
segments and reconciliation to earnings before income taxes
are set forth below. The company is an integrated enterprise,
characterized by substantial intersegment cooperation, cost
allocations, and sharing of assets. Therefore, we do not repre-
sent that these segments, if operated independently, would
report the operating profit and other financial information
shown below.
Restated* Restated*
(In Thousands) 2006 2005 2004
Sales to Unaffiliated Customers
Grocery Products $ 846,494 $ 799,291 $ 758,256
Refrigerated Foods 2,958,365 2,801,632 2,300,399
Jennie-O Turkey Store 1,105,456 1,088,324 1,052,682
Specialty Foods 624,586 518,673 467,581
All Other 210,580 206,077 200,957
Total $5,745,481 $5,413,997 $4,779,875
Intersegment Sales
Grocery Products $ – $ – $ 10
Refrigerated Foods 7,348 8,305 10,122
Jennie-O Turkey Store 79,622 69,710 69,468
Specialty Foods 219 139 58
All Other 80,034 83,264 92,551
Total 167,223 161,418 172,209
Intersegment elimination (167,223) (161,418) (172,209)
Total $ – $ – $ –
Net Sales
Grocery Products $ 846,494 $ 799,291 $ 758,266
Refrigerated Foods 2,965,713 2,809,937 2,310,521
Jennie-O Turkey Store 1,185,078 1,158,034 1,122,150
Specialty Foods 624,805 518,812 467,639
All Other 290,614 289,341 293,508
Intersegment elimination (167,223) (161,418) (172,209)
Total $5,745,481 $5,413,997 $4,779,875
*Retrospective application of FIFO inventory valuation (see Note A).
Note K
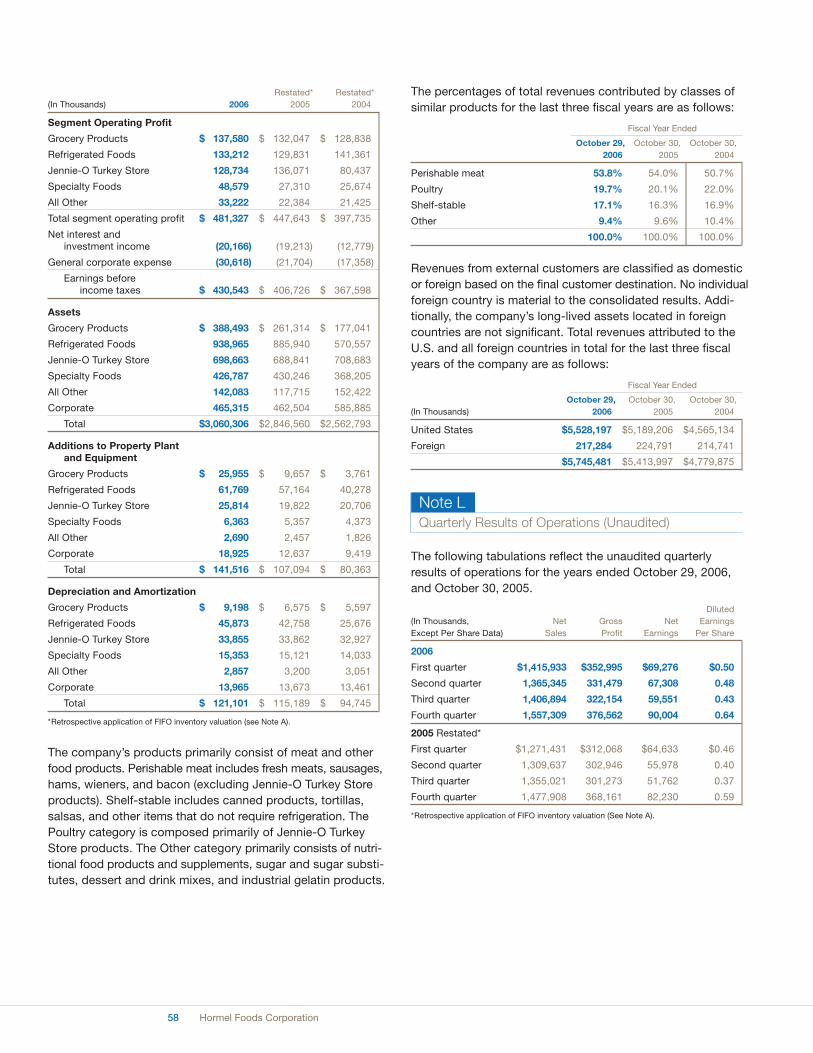
58 Hormel Foods Corporation
Restated* Restated*
(In Thousands) 2006 2005 2004
Segment Operating Profit
Grocery Products $ 137,580 $ 132,047 $ 128,838
Refrigerated Foods 133,212 129,831 141,361
Jennie-O Turkey Store 128,734 136,071 80,437
Specialty Foods 48,579 27,310 25,674
All Other 33,222 22,384 21,425
Total segment operating profit $ 481,327 $ 447,643 $ 397,735
Net interest and investment income (20,166) (19,213) (12,779)
General corporate expense (30,618) (21,704) (17,358)
Earnings before income taxes $ 430,543 $ 406,726 $ 367,598
Assets
Grocery Products $ 388,493 $ 261,314 $ 177,041
Refrigerated Foods 938,965 885,940 570,557
Jennie-O Turkey Store 698,663 688,841 708,683
Specialty Foods 426,787 430,246 368,205
All Other 142,083 117,715 152,422
Corporate 465,315 462,504 585,885
Total $3,060,306 $2,846,560 $2,562,793
Additions to Property Plant and Equipment
Grocery Products $ 25,955 $ 9,657 $ 3,761
Refrigerated Foods 61,769 57,164 40,278
Jennie-O Turkey Store 25,814 19,822 20,706
Specialty Foods 6,363 5,357 4,373
All Other 2,690 2,457 1,826
Corporate 18,925 12,637 9,419
Total $ 141,516 $ 107,094 $ 80,363
Depreciation and Amortization
Grocery Products $ 9,198 $ 6,575 $ 5,597
Refrigerated Foods 45,873 42,758 25,676
Jennie-O Turkey Store 33,855 33,862 32,927
Specialty Foods 15,353 15,121 14,033
All Other 2,857 3,200 3,051
Corporate 13,965 13,673 13,461
Total $ 121,101 $ 115,189 $ 94,745
*Retrospective application of FIFO inventory valuation (see Note A).
The company’s products primarily consist of meat and other
food products. Perishable meat includes fresh meats, sausages,
hams, wieners, and bacon (excluding Jennie-O Turkey Store
products). Shelf-stable includes canned products, tortillas,
salsas, and other items that do not require refrigeration. The
Poultry category is composed primarily of Jennie-O Turkey
Store products. The Other category primarily consists of nutri-
tional food products and supplements, sugar and sugar substi-
tutes, dessert and drink mixes, and industrial gelatin products.
The percentages of total revenues contributed by classes of
similar products for the last three fiscal years are as follows:
Fiscal Year Ended
October 29, October 30, October 30,
2006 2005 2004
Perishable meat 53.8% 54.0% 50.7%
Poultry 19.7% 20.1% 22.0%
Shelf-stable 17.1% 16.3% 16.9%
Other 9.4% 9.6% 10.4%
100.0% 100.0% 100.0%
Revenues from external customers are classified as domestic
or foreign based on the final customer destination. No individual
foreign country is material to the consolidated results. Addi-
tionally, the company’s long-lived assets located in foreign
countries are not significant. Total revenues attributed to the
U.S. and all foreign countries in total for the last three fiscal
years of the company are as follows:
Fiscal Year Ended
October 29, October 30, October 30,
(In Thousands) 2006 2005 2004
United States $5,528,197 $5,189,206 $4,565,134
Foreign 217,284 224,791 214,741
$5,745,481 $5,413,997 $4,779,875
Quarterly Results of Operations (Unaudited)
The following tabulations reflect the unaudited quarterly
results of operations for the years ended October 29, 2006,
and October 30, 2005.
Diluted
(In Thousands, Net Gross Net Earnings
Except Per Share Data) Sales Profit Earnings Per Share
2006
First quarter $1,415,933 $352,995 $69,276 $0.50
Second quarter 1,365,345 331,479 67,308 0.48
Third quarter 1,406,894 322,154 59,551 0.43
Fourth quarter 1,557,309 376,562 90,004 0.64
2005 Restated*
First quarter $1,271,431 $312,068 $64,633 $0.46
Second quarter 1,309,637 302,946 55,978 0.40
Third quarter 1,355,021 301,273 51,762 0.37
Fourth quarter 1,477,908 368,161 82,230 0.59
*Retrospective application of FIFO inventory valuation (See Note A).
Note L

59Bringing More to the Table
David P. Juhlke
Vice President
Phillip L. Minerich, Ph.D.
Vice President
Kurt F. Mueller
Vice President
Larry J. Pfeil
Vice President
Russell C. Potter
Vice President
Douglas R. Reetz
Vice President
Bruce R. Schweitzer
Vice President
James N. Sheehan
Vice President and Controller
James M. Splinter
Vice President
Joseph C. Swedberg
Vice President
Robert A. Tegt
Vice President
Brian D. Johnson
Assistant Secretary
Kevin C. Jones
Assistant Secretary
Jeffrey M. Ettinger*
Chairman of the Board,
President and Chief Executive Officer
(elected Chairman of the Board
effective 11/21/2006)
Michael J. McCoy*
Executive Vice President
and Chief Financial Officer
(retires effective 12/31/2006 as
Executive Vice President and
Chief Financial Officer)
Gary J. Ray*
Executive Vice President
Steven G. Binder
Group Vice President
Richard A. Bross
Group Vice President / President,
Hormel Foods International
Ronald W. Fielding
Group Vice President
(effective 1/1/2007 advancing
to Executive Vice President)
Michael D. Tolbert
Group Vice President / President,
Jennie-O Turkey Store, Inc.
Larry L. Vorpahl
Group Vice President
William F. Snyder
Senior Vice President
Jody H. Feragen
Vice President of Finance
and Treasurer
(effective 1/1/2007 advancing
to Senior Vice President and Chief Financial Officer)
James W. Cavanaugh
Senior Vice President, General Counsel
and Corporate Secretary
D. Scott Aakre
Vice President
Julie H. Craven
Vice President
Thomas R. Day
Vice President
Bryan D. Farnsworth
Vice President
Roland G. Gentzler
Assistant Controller
(effective 1/1/2007 advancing
to Vice President of Finance and Treasurer)
Dennis B. Goettsch
Vice President
Daniel A. Hartzog
Vice President
Corporate Officers
*Director

60 Hormel Foods Corporation
Shareholder Information
Independent Auditors
Ernst & Young LLP
220 South Sixth Street, Ste 1400
Minneapolis, MN 55402-4509
Stock Listing
Hormel Foods Corporation’s
common stock is traded on
the New York Stock Exchange
under the symbol HRL. The
CUSIP number is 440452100. There are
approximately 11,600 record shareholders
and over 23,350 shareholders whose shares
are held in street name by brokerage firms
and financial institutions.
The annual certification of the company’s
compliance with corporate governance list-
ing standards required by Section 303A.12(a)
of the New York Stock Exchange (NYSE)
Listed Company Manual was submitted to
the NYSE on February 27, 2006. The com-
pany filed with the Securities and Exchange
Commission (SEC), as Exhibits 31.1, 31.2
and 31.3 to its Form 10-K filed on January
13, 2006, the Sarbanes-Oxley Act Section
302 certification regarding the quality of the
company’s public disclosure.
Common Stock Data
The high and low prices of the company’s
common stock and the dividends per share
declared for each fiscal quarter of 2006 and
2005, respectively, are shown below:
2006 High Low Dividend
First Quarter 35.43 31.46 .1400
Second Quarter 36.09 32.59 .1400
Third Quarter 38.34 33.15 .1400
Fourth Quarter 38.41 35.16 .1400
2005 High Low Dividend
First Quarter 32.11 27.43 .1300
Second Quarter 32.65 29.18 .1300
Third Quarter 33.10 29.16 .1300
Fourth Quarter 33.00 30.06 .1300
Transfer Agent and Registrar
Wells Fargo Bank, N.A.
161 North Concord Exchange
P.O. Box 64854
South St. Paul, MN 55164-0854
www.shareowneronline.com
For the convenience of shareholders, a toll-
free number (1-877-536-3559) can be used
whenever questions arise regarding changes
in registered ownership, lost or stolen certifi-
cates, address changes, or other matters
pertaining to the transfer of stock or share-
holder records. When requesting information,
shareholders must provide their tax identifi-
cation number, the name(s) in which their
stock is registered, and their record address.
Since December of 2004, the company
has participated in the Direct Registration
Profile Modification System (DRPMS).
Transfers or issuances of shares are now
issued in book-entry form, unless you specif-
ically request a stock certificate. A statement
will be delivered to you reflecting any trans-
actions processed in your account.
The transfer agent makes shareholder
account data available to shareholders of
record via the Internet. This service allows
shareholders to view various account
details, such as certificate information,
dividend payment history, and/or dividend
reinvestment plan records, over a secure
Internet connection with the required
entry of a tax identification number and
a PIN number. Information is available 24
hours per day, seven days a week. If you
are interested, you may use the Web site
www.shareowneronline.com and access
“FIRST TIME VISITOR” to arrange for a
PIN setup.
Household Sorting
If you hold stock in more than one account,
duplicate mailings of financial information
may result. You can help eliminate the added
expense by requesting only one copy be
sent. Please supply the transfer agent with
the names in which all accounts are registered
and the name of the account for which you
wish to receive mailings. This will not in
any way affect dividend check mailings.
We cannot household sort between record
accounts and brokerage accounts.
Dividend Reinvestment Plan
Hormel Foods Corporation’s Dividend
Reinvestment Plan, available to record share-
holders, allows for full dividend reinvestment
and voluntary cash purchases with brokerage
commissions or other service fees paid by
the company. Automatic debit for cash con-
tribution is also available. This is a convenient
method to have money automatically
withdrawn each month from a checking
or savings account and invested in your
Dividend Reinvestment Plan account. To
enroll in the plan or obtain additional infor-
mation, contact Wells Fargo Bank, N.A.,
using the address or telephone number
provided with its listing in this section as
company transfer agent and registrar.
Enrollment in the plan is also available on
the Internet at www.shareowneronline.com.
An optional direct dividend deposit
service offers shareholders a convenient
method of having quarterly dividend
payments electronically deposited into their
personal checking or savings account. The
dividend payment is made in the account
each payment date, providing shareholders
with immediate use of their money. For
information about the service and how to
participate, contact Wells Fargo Bank, N.A.,
transfer agent. You may also activate
this feature on the Internet at
www.shareowneronline.com.
Dividends
The declaration of dividends and all dates
related to the declaration of dividends are
subject to the judgment and discretion of
the Board of Directors of Hormel Foods
Corporation. Quarterly dividends are typically
paid on the 15th of February, May, August,
and November. Postal delays may cause
receipt dates to vary.
Reports and Publications
Copies of the company’s Form 10-K
(annual report) and Form10-Q (quarterly
report) to the Securities and Exchange
Commission (SEC), proxy statement, all
news releases, and other corporate literature
are available free upon request by calling
(507) 437-5345 or by accessing the informa-
tion on the Internet at www.hormel.com.
The company’s Annual Report to Shareholders
is mailed approximately one month before
the Annual Meeting.
Annual Meeting
The Annual Meeting of Shareholders will
be held Tuesday, January 30, 2007, in the
Richard L. Knowlton Auditorium at Austin
(Minn.) High School. The meeting will
convene at 8:00 p.m.
Questions about Hormel Foods
Shareholder Inquiries
(507) 437-5944
Analyst/Investor Inquiries
(507) 437-5007
Media Inquiries
(507) 437-5345
Consumer Response
Inquiries regarding products of Hormel
Foods Corporation should be addressed:
Consumer Response
Hormel Foods Corporation
1 Hormel Place
Austin, MN 55912-3680
or call 1-800-523-4635
Trademarks
References in italic within this report represent
valuable trademarks owned or licensed by
Hormel Foods, LCC or its subsidiaries.

Board of Directors
John R. Block
Former U.S. Secretary of Agriculture
Senior Legislative Advisor,
Olsson, Frank and Weeda, P.C.
Director since October 1997
Jeffrey M. Ettinger
Chairman of the Board,
President and Chief Executive Officer
(elected Chairman of the Board effective 11/21/2006)
Director since May 2004
E. Peter Gillette, Jr.
Senior Advisor to U.S. Trust Company
Retired President, Piper Trust Company
Director since July 1996
Luella G. Goldberg
Trustee, University of Minnesota Foundation
Member, Board of Overseers,
University of Minnesota
Carlson School of Management
Trustee and Chair Emerita, Wellesley College
Past Board Chair,
University of Minnesota Foundation
Director since September 1993
Susan I. Marvin
President, Marvin Windows and Doors
Trustee, University of Minnesota Foundation
Director since July 2002
Michael J. McCoy
Executive Vice President
and Chief Financial Officer
(retires effective 12/31/2006 as
Executive Vice President and Chief Financial Officer)
Director since May 2000
John L. Morrison
Managing Director, Goldner Hawn
Johnson & Morrison Incorporated
Chairman, Callanish Capital Partners
Director since November 2003
Elsa A. Murano, Ph.D.
Texas A&M University Vice Chancellor
and Dean of Agriculture
Professor, Department of Animal Science
Director since September 2006
Robert C. Nakasone
Chief Executive Officer,
NAK Enterprises, LLC
Director since September 2006
Dakota A. Pippins
President and Chief Executive Officer,
Pippins Strategies, LLC
Director since January 2001
Gary J. Ray
Executive Vice President
Director since November 1990
Hugh C. Smith, M.D.
Professor of Medicine,
Mayo Clinic College of Medicine
Consultant in the Cardiovascular Division
at Mayo Clinic
Director since September 2006
John G. Turner
Chairman, Hillcrest Capital Partners
Director since March 2000
John R. Block Jeffrey M. Ettinger E. Peter Gillette, Jr. Luella G. Goldberg
Dakota A. Pippins Gary J. Ray Hugh C. Smith, M.D. John G. Turner
Susan I. Marvin Michael J. McCoy John L. Morrison Elsa A. Murano, Ph.D. Robert C. Nakasone

www.hormel.com
Hormel Foods Corporation
1 Hormel Place
Austin, Minnesota
55912-3680
®
™