Embed Size (px)
Citation preview
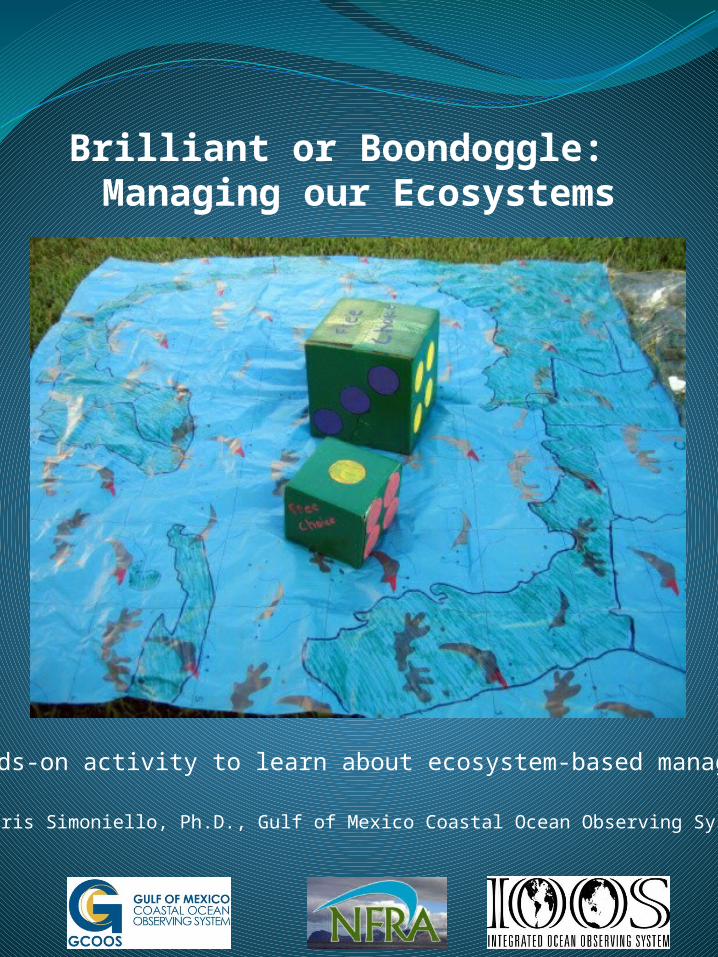
Brilliant or Boondoggle: Managing our Ecosystems
A hands-on activity to learn about ecosystem-based management
By Chris Simoniello, Ph.D., Gulf of Mexico Coastal Ocean Observing System
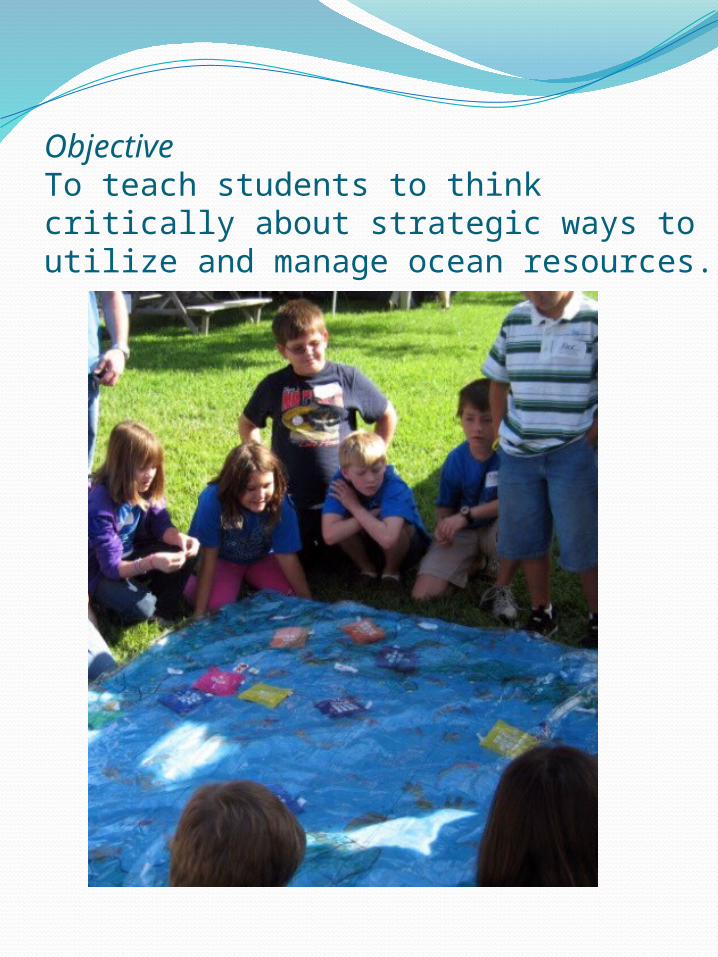
ObjectiveTo teach students to think critically about strategic ways to utilize and manage ocean resources.

Supplies
Two shower curtains or other material to draw your maps (at least one shower curtain should be a clear liner because it will overlay the first map)
Permanent-ink markers (others will smear)
Bean bags with numbers (ideally one per student) or other numbered objects to place in the grid boxes on the map (e.g. lids for storage food containers work)
Straight edge to draw a grid (lat/long lines) on the map
Binder clips-approximately 10
Index cards or paper (5-10 cards)
Two cardboard boxes (the same or different size), painted to look like dice (read full instructions before painting!)

Getting Started: Prepare the playing ‘board’
DRAW IDENTICAL MAPS On each of your shower curtains, draw identical
maps. The example shown (see slide 1) is for the Gulf of Mexico.
CREATE A GRID Add vertical and horizontal lines to create an 8x8
grid on each map. When you overlay the map drawn on the clear shower curtain, it should line up exactly with the other map.
NUMBER the GRID Number the top row across 1-8 on each map
(write numbers in the lower right hand side of each box). Repeat for the first column-numbering 1-8 down the grid. (This will look like a BINGO game board with only the first row and first column of each map numbered).
Set aside the ‘bottom map’ or game board-it is ready.

Make your map relevant to your students
ADD DETAIL Add as much detail as you can to the map on the clear
shower curtain. The more local detail you provide, the more meaningful it will be to players.
I started by using information from the Gulf of Mexico Coastal Ocean Observing System data portal (www.gcoos.org).
For Example:
Buoy locations, oil and gas industry sites, and PORTS siteshttp://gcoos.tamu.edu/gom.html
Bathymetric features: http://gcoos.tamu.edu/products/section/bathymetry.html
Indicate where reefs and other marine protected areas are located:
http://mpa.gov/pdf/helpfulresources/horizon_spill_mpas_june.2010.pdf
Use your knowledge of the local system to identify other areas of interest (e.g. popular fishing and diving areas; for the Gulf of Mexico, the large Dead Zone; Harmful Algal Bloom problem areas).

Example of assets in the Gulf of Mexico RegionSee http://www.gcoos.org
http://mpa.gov/pdf/helpfulresources/horizon_spill_mpas_june.2010.pdf

Prepare the dice
NUMBERING THE DICEThe numbers on the dice relate to your grid
size. For example, for my 8x8 grid, the numbers on my dice were one through four with two ‘free choice’ options on each die. So, if a student rolled two ‘fours’ the highest grid number was ‘eight’.
NOTE: Your can use a smaller grid size
Using a grid size larger than 6x6 means that the students must roll the dice two times-once for a horizontal coordinate and once for their vertical coordinate. For grid sizes 6x6 or smaller, only one roll of both dice is needed if the numbers go from one through six with no ‘free choice’ option. If using this option, be sure to indicate which represents the horizontal position and which represents the vertical position (e.g. use two different sized boxes or different colored dice).

Overlay the clear, detailed map on the other map so the grids line up. Use the binder clips to secure the top map to the bottom map along the top edge only.
Flip the clear, detailed map over so that it is under the top map (like a flip chart page) and cannot be seen.
Give each student a numbered bean bag or other numbered object. Indicate the ‘job’ the number represents. These should be written on the index cards and posted for easy reference. I used the following:
1-4 Commercial Fishermen5-8 Fisheries Scientist9-12 Physical Oceanographer13-16 Oil and Gas Tycoon
It enhances the activity if you choose disciplines for which you have real data. During the game, where they place their beanbag indicates where they are sampling.

Playing the Game
Start by asking the students if they know what they are seeing on the map (the one with little detail)
Ask if they know what latitude and longitude are and if they know how to graph (by 4th grade, they should).
Start a dialogue by asking what an ecosystem is-it’s interesting to go around and let each participant contribute.
Talk about how we’ve traditionally managed resources, e.g. one species at a time, with little communication between disciplines.
Let each student take a turn rolling the dice and placing their beanbag in the appropriate ‘box’ on the grid. Be sure to indicate that the first roll is to determine the horizontal coordinate (longitude) and the second is to determine the vertical coordinate (latitude). If there are too many kids, one can roll and one can place the beanbag. Let them know that the beanbag position represents their sampling location.

When all the students have taken a turn, talk about the beanbag dispersal pattern. I’ve played with hundreds of kids and there is usually very little overlap. Even when the kids have ‘free choice’ options, they usually opt for an empty grid space. Ask them why.
Leaving everything in place, carefully flip the clear shower curtain with the detailed map over the ‘game board.’ Ask them what they see on this map that wasn’t on the ‘game board.’
The options for discussion are endless, but should focus on the value of cross-discipline communication and coordination. For example, if I’m a fisheries scientist, wouldn’t it be helpful if I worked with the physical oceanographers to learn about larval dispersal patterns and transport mechanisms. Current sampling strategies are such that ‘front-end’ planning and coordination among disciplines is the exception rather than the rule. Talk about how interconnected things are and how you can’t successfully manage a species if you don’t understand its entire life history, including habitat stressors, and social and economic pressures.
Ask what they would do differently if they could communicate with each other and conduct their sampling in a coordinated way.