Embed Size (px)
Citation preview
v
TABLE OF CONTENTS
CHAPTER 1: Introduction . . . . . . . . . . . . . . . . . . . . . . . . . . . . . . . . . . . . . . . . . . . . . . . . . . . . . . . . . . . . . . . . . . 1
CHAPTER 2: General Administration Procedures for the CIBS II Standardized . . . . . . . . . . . . . . . . . . . . . . . . . . 12
CHAPTER 3: Specific Administration Procedures for the CIBS II Standardized . . . . . . . . . . . . . . . . . . . . . . . . . . 24
CHAPTER 4: Interpreting the CIBS II Standardized . . . . . . . . . . . . . . . . . . . . . . . . . . . . . . . . . . . . . . . . . . . . . . . . . . 34
CHAPTER 5: Using the CIBS II in Teaching and Monitoring Progress . . . . . . . . . . . . . . . . . . . . . . . . . . . . . . . . 44
CHAPTER 6: Standardization of the CIBS II . . . . . . . . . . . . . . . . . . . . . . . . . . . . . . . . . . . . . . . . . . . . . . . . . . . . . . . 49
CHAPTER 7: Test Score Reliability of the CIBS II . . . . . . . . . . . . . . . . . . . . . . . . . . . . . . . . . . . . . . . . . . . . . . . . . . . 58
CHAPTER 8: Evidence of Test Validation of the CIBS II . . . . . . . . . . . . . . . . . . . . . . . . . . . . . . . . . . . . . . . . . . . . . 67
APPENDIX A: First-Grade Through Sixth-Grade Form A Equivalents of Form B Raw Scores . . . . . . . . . . . . . . 88
INTRoDuCTIoN To APPENDICEs B–F: Using SEMs and Deriving Confidence Intervals . . . . . . . . . . . . . . . 91
APPENDIX B: Readiness Assessments: Converting Raw Scores to Scaled Scores . . . . . . . . . . . . . . . . . . . . . . . . . 92
APPENDIX C: Readiness Assessments: Converting Scaled Scores to Quotients . . . . . . . . . . . . . . . . . . . . . . . . . . 96
APPENDIX D: First-Grade Through Sixth-Grade Assessments: Converting Raw Scores to Scaled Scores . . . . . . . . . . . . . . . . . . . . . . . . . . . . . . . . . . . . . . . . . . . . . . . . . . . . . . . . . . . . . . . 98
APPENDIX E: First-Grade Through Sixth-Grade Assessments: Converting Scaled/Raw Scores to Quotients . . . . . . . . . . . . . . . . . . . . . . . . . . . . . . . . . . . . . . . . . . . . . . . . . . . . . . . . . . . . . . . . . 111
APPENDIX F: Converting Quotients to Percentiles (for all assessments) . . . . . . . . . . . . . . . . . . . . . . . . . . . . . . 139
APPENDIX G: Converting Raw Scores to Grade Equivalents (for all assessments) . . . . . . . . . . . . . . . . . . . . . . 140
APPENDIX H: Converting Grade Equivalents to Age Equivalents (for all assessments) . . . . . . . . . . . . . . . . . . 149
CIBS II STANDARDIZED sCoRING sHEETs
Record of CIBS II Standardized scores: Readiness Assessments . . . . . . . . . . . . . . . . . . . . . . . . . . . . . . . . . . . 150
Record of CIBS II Standardized scores: Readiness (Supplemental) Assessments . . . . . . . . . . . . . . . . . . . . . . . 151
Record of CIBS II Standardized scores: First-Grade Through Sixth-Grade Assessments . . . . . . . . . . . . . . . . . . 152
BRIGANCE CIBS II Standardization and Validation Manual • Curriculum Associates LLC • www.CurriculumAssociates.com • 800-225-0248
1
CHAPTER 1: Introduction
The original version of the Comprehensive Inventory of Basic Skills (CIBS) was exclusively a criterion-referenced assessment of academic/pre-academic skills—meaning that a student’s performance was compared to mastery of various tasks (e.g., ability to name all letters of the alphabet and not just a sample). As a consequence, the CIBS has been tremendously useful in curricular planning, and determining prerequisites—also known as the readiness skills essential to school success. Such information is critical for the development of Individualized Education Programs (IEPs) and for monitoring progress toward goals and objectives.
When the Comprehensive Inventory of Basic Skills–Revised (CIBS–R) was published, more than a decade ago, it was studied for its psychometric properties. Psychometric support offers teachers and examiners an evidence-based method for comparing a student’s mastery of various skills to those of other students around the country. This enables us to know when a student is lagging behind same-age peers; how to flag areas of substantial delay, and determine which student needs special services and, in what academic areas help is needed.
The population of the U.S. is changing rapidly. These changes mean that the definition of average, below average, and above average needs a careful re-appraisal, at least every 10 years. The Comprehensive Inventory of Basic Skills II (CIBS II) is an update of the CIBS–R and its revisions also embrace what we have learned during the last decade about teaching, instruction, and prerequisite skills. For example, research shows that we need to actively promote phonemic awareness in younger students. As a result, several new assessments were added to the CIBS II, particularly in the Readiness section.
See page 5 for a list of important differences between the CIBS–R and the CIBS II.
BRIGANCE CIBS II Standardization and Validation Manual • Curriculum Associates LLC • www.CurriculumAssociates.com • 800-225-0248
58
CHAPTER 7: Test Score Reliability of the CIBS II
Previous score reliability of the CIBS–R
The CIBS–R Readiness and First-Grade Through Sixth-Grade assessments had high score reliability estimates. Specifically, the CIBS–R scores were found to have: (a) high degree of inter-rater and test-retest reliability (> 0.80), (b) high alternative forms reliability (> 0.70), and (c) high internal consistency (average > 0.85). Standard error of measurement was reported as well for these scores to assist the user obtaining the range of scores where the student’s ability lies. See the CIBS–R Standardization and Validation Manual (Glascoe 1999). The following section documents that the CIBS II adheres to the same high standards that were documented in the CIBS–R.
internal consistency score reliability
For the 2010 study, Cronbach’s alpha coefficients (Cronbach & Meehl 1955) were estimated for the scaled scores and composite scores. With a higher level of a reliability coefficient, one can have greater confidence in the consistency of the scores. Because the CIBS II is criterion-referenced and oriented toward the measurement of complete sets of skills, the coefficients may appear lower compared to other tests for which the acceptable range is .80 and above (Nunnally & Bernstein 1994). However, other measures sometimes eliminate items that lack discriminating power because items that do not discriminate among high-scoring and low-scoring individuals can lower reliability estimates. On the CIBS II, assessments measure complete skills. Thus, items were not removed on the basis of difficulty or discrimination level. Even so, the majority of standardized assessments in the CIBS II approach or exceed expected levels of internal consistency. Tables 7-1 and 7-2 list the internal consistency coefficients in column R.
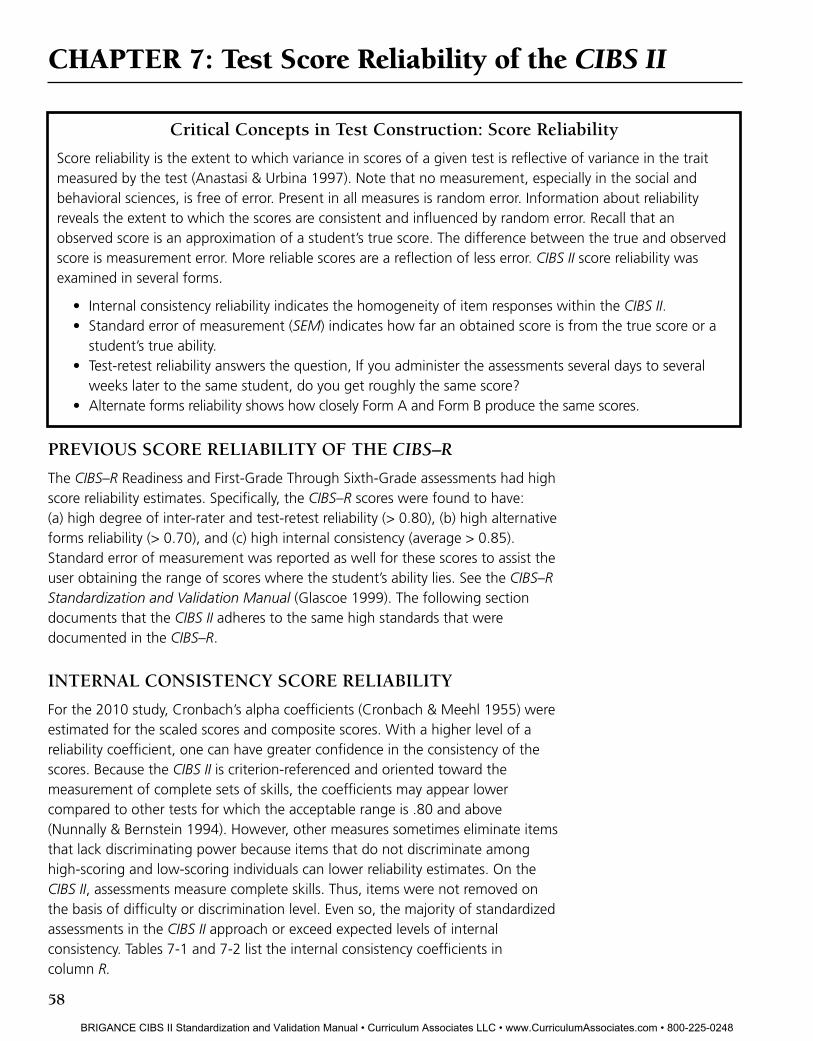
critical concepts in test construction: score reliability
Score reliability is the extent to which variance in scores of a given test is reflective of variance in the trait measured by the test (Anastasi & Urbina 1997). Note that no measurement, especially in the social and behavioral sciences, is free of error. Present in all measures is random error. Information about reliability reveals the extent to which the scores are consistent and influenced by random error. Recall that an observed score is an approximation of a student’s true score. The difference between the true and observed score is measurement error. More reliable scores are a reflection of less error. CIBS II score reliability was examined in several forms.
• Internal consistency reliability indicates the homogeneity of item responses within the CIBS II.• Standard error of measurement (SEM) indicates how far an obtained score is from the true score or a
student’s true ability.• Test-retest reliability answers the question, If you administer the assessments several days to several
weeks later to the same student, do you get roughly the same score?• Alternate forms reliability shows how closely Form A and Form B produce the same scores.
BRIGANCE CIBS II Standardization and Validation Manual • Curriculum Associates LLC • www.CurriculumAssociates.com • 800-225-0248
59
standard errors of MeasureMent
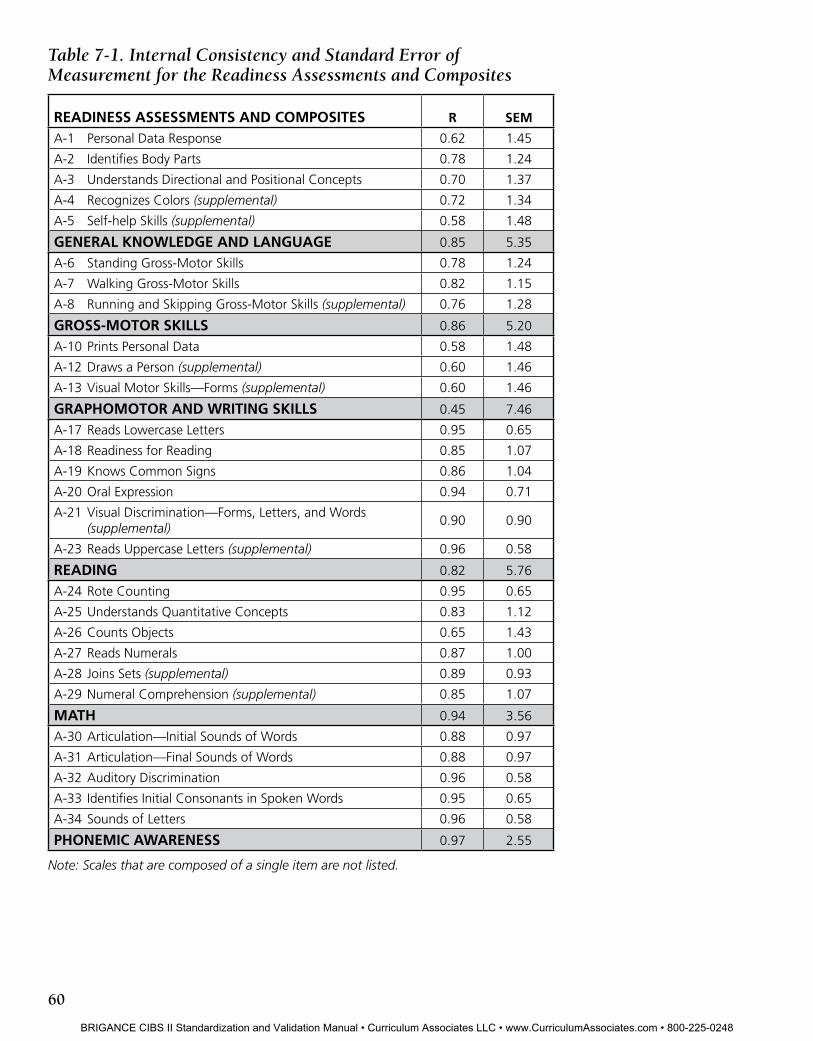
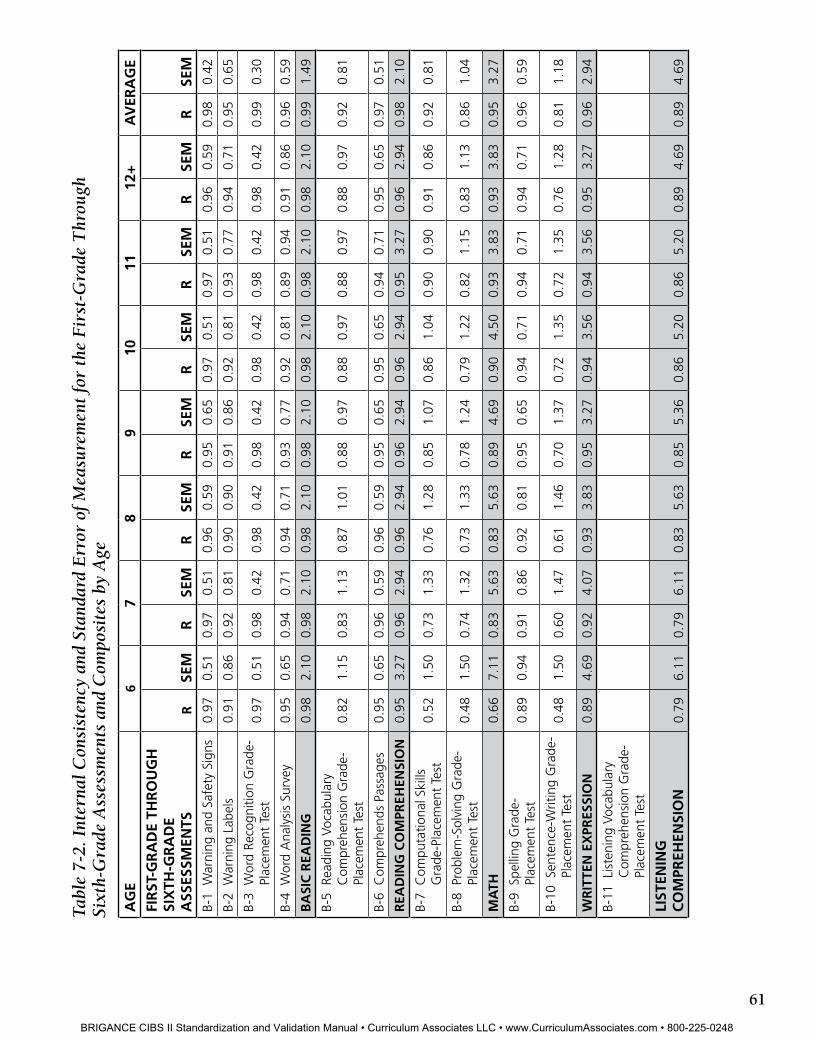
Tables 7-1 and 7-2 display the standard errors of measurement (SEM) alongside the internal consistency reliability estimates. A student’s score on any achievement test is only an estimate of the student’s true ability on that set of skills. There will be a margin of error associated with the obtained score. The obtained score is not considered to be an exact indicator of ability.
The SEM can be used to provide a confidence band or interval (CI) around the obtained score that accounts for measurement error. The CI provides a method of expressing the precision of the test score and reminds the user that there is error in the obtained score. The SEM will be smaller the higher the reliability estimate becomes. The tables provide the standard error of the measurement that can be used to estimate a student’s true score when an obtained score is held constant (Harvill 1991). A common question to be answered with this information is, If a seven-year-old student received a score of 105 on the Basic Reading section, how likely is it that the true score is above 105? This can best be answered by estimating the student’s true score based on the obtained score and building the CI around that estimate. The true score is estimated by [X— 1 (rxx1)(X 2 X
—)]
[X—
1 (rxx1)(X 2 X—
)] where X is the obtained score, X—
is the mean score from the assessment, and rxx1 is the reliability coefficient. The SEM is then added and subtracted to obtain the confidence interval. Continuing the example, a score of 105 for the Basic Reading composite would have an estimated true score of 104.9. The resulting 95% CI around this score would be 100.7 to 109.1. That is, there is a 95 percent likelihood that the student’s true score on the Basic Reading section is between 100.7 and 109.1.
BRIGANCE CIBS II Standardization and Validation Manual • Curriculum Associates LLC • www.CurriculumAssociates.com • 800-225-0248
60
Table 7-1. Internal Consistency and Standard Error of Measurement for the Readiness Assessments and Composites
Readiness assessments and Composites R sem
A-1 Personal Data Response 0.62 1.45
A-2 Identifies Body Parts 0.78 1.24
A-3 Understands Directional and Positional Concepts 0.70 1.37
A-4 Recognizes Colors (supplemental) 0.72 1.34
A-5 Self-help Skills (supplemental) 0.58 1.48
GeneRaL KnoWLedGe and LanGUaGe 0.85 5.35
A-6 Standing Gross-Motor Skills 0.78 1.24
A-7 Walking Gross-Motor Skills 0.82 1.15
A-8 Running and Skipping Gross-Motor Skills (supplemental) 0.76 1.28
GRoss-motoR sKiLLs 0.86 5.20
A-10 Prints Personal Data 0.58 1.48
A-12 Draws a Person (supplemental) 0.60 1.46
A-13 Visual Motor Skills—Forms (supplemental) 0.60 1.46
GRapHomotoR and WRitinG sKiLLs 0.45 7.46
A-17 Reads Lowercase Letters 0.95 0.65
A-18 Readiness for Reading 0.85 1.07
A-19 Knows Common Signs 0.86 1.04
A-20 Oral Expression 0.94 0.71
A-21 Visual Discrimination—Forms, Letters, and Words (supplemental)
0.90 0.90
A-23 Reads Uppercase Letters (supplemental) 0.96 0.58
ReadinG 0.82 5.76
A-24 Rote Counting 0.95 0.65
A-25 Understands Quantitative Concepts 0.83 1.12
A-26 Counts Objects 0.65 1.43
A-27 Reads Numerals 0.87 1.00
A-28 Joins Sets (supplemental) 0.89 0.93
A-29 Numeral Comprehension (supplemental) 0.85 1.07
matH 0.94 3.56
A-30 Articulation—Initial Sounds of Words 0.88 0.97
A-31 Articulation—Final Sounds of Words 0.88 0.97
A-32 Auditory Discrimination 0.96 0.58
A-33 Identifies Initial Consonants in Spoken Words 0.95 0.65
A-34 Sounds of Letters 0.96 0.58
pHonemiC aWaReness 0.97 2.55
Note: Scales that are composed of a single item are not listed.
BRIGANCE CIBS II Standardization and Validation Manual • Curriculum Associates LLC • www.CurriculumAssociates.com • 800-225-0248
61
Tabl
e 7-
2. I
nter
nal C
onsi
sten
cy a
nd S
tand
ard
Err
or o
f M
easu
rem
ent
for
the
Fir
st-G
rade
Thr
ough
Si
xth-
Gra
de A
sses
smen
ts a
nd C
ompo
site
s by
Age
aG
e6
78
910
1112
+a
veR
aG
eFi
Rst
-GR
ad
e tH
Ro
UG
H
six
tH-G
Ra
de
ass
essm
ents
Rse
mR
sem
Rse
mR
sem
Rse
mR
sem
Rse
mR
sem
B-1
War
ning
and
Saf
ety
Sign
s0.
970.
510.
970.
510.
960.
590.
950.
650.
970.
510.
970.
510.
960.
590.
980.
42
B-2
War
ning
Lab
els
0.91
0.86
0.92
0.81
0.90
0.90
0.91
0.86
0.92
0.81
0.93
0.77
0.94
0.71
0.95
0.65
B-3
Wor
d Re
cogn
ition
Gra
de-
Plac
emen
t Te
st0.
970.
510.
980.
420.
980.
420.
980.
420.
980.
420.
980.
420.
980.
420.
990.
30
B-4
Wor
d A
naly
sis
Surv
ey0.
950.
650.
940.
710.
940.
710.
930.
770.
920.
810.
890.
940.
910.
860.
960.
59
Ba
siC
Rea
din
G0.
982.
100.
982.
100.
982.
100.
982.
100.
982.
100.
982.
100.
982.
100.
991.
49
B-5
Rea
ding
Voc
abul
ary
Com
preh
ensi
on G
rade
-Pl
acem
ent
Test
0.82
1.15
0.83
1.13
0.87
1.01
0.88
0.97
0.88
0.97
0.88
0.97
0.88
0.97
0.92
0.81
B-6
Com
preh
ends
Pas
sage
s0.
950.
650.
960.
590.
960.
590.
950.
650.
950.
650.
940.
710.
950.
650.
970.
51
Rea
din
G C
om
pReH
ensi
on
0.95
3.27
0.96
2.94
0.96
2.94
0.96
2.94
0.96
2.94
0.95
3.27
0.96
2.94
0.98
2.10
B-7
Com
puta
tiona
l Ski
lls
Gra
de-P
lace
men
t Te
st0.
521.
500.
731.
330.
761.
280.
851.
070.
861.
040.
900.
900.
910.
860.
920.
81
B-8
Pro
blem
-Sol
ving
Gra
de-
Plac
emen
t Te
st0.
481.
500.
741.
320.
731.
330.
781.
240.
791.
220.
821.
150.
831.
130.
861.
04
ma
tH0.
667.
110.
835.
630.
835.
630.
894.
690.
904.
500.
933.
830.
933.
830.
953.
27
B-9
Spe
lling
Gra
de-
Plac
emen
t Te
st0.
890.
940.
910.
860.
920.
810.
950.
650.
940.
710.
940.
710.
940.
710.
960.
59
B-10
Sen
tenc
e-W
ritin
g G
rade
-Pl
acem
ent
Test
0.48
1.50
0.60
1.47
0.61
1.46
0.70
1.37
0.72
1.35
0.72
1.35
0.76
1.28
0.81
1.18
WR
itte
n e
xpR
essi
on
0.89
4.69
0.92
4.07
0.93
3.83
0.95
3.27
0.94
3.56
0.94
3.56
0.95
3.27
0.96
2.94
B-11
Lis
teni
ng V
ocab
ular
y C
ompr
ehen
sion
Gra
de-
Plac
emen
t Te
st
List
enin
G
Co
mpR
eHen
sio
n0.
796.
110.
796.
110.
835.
630.
855.
360.
865.
200.
865.
200.
894.
690.
894.
69
BRIGANCE CIBS II Standardization and Validation Manual • Curriculum Associates LLC • www.CurriculumAssociates.com • 800-225-0248
62
test-retest score reliability
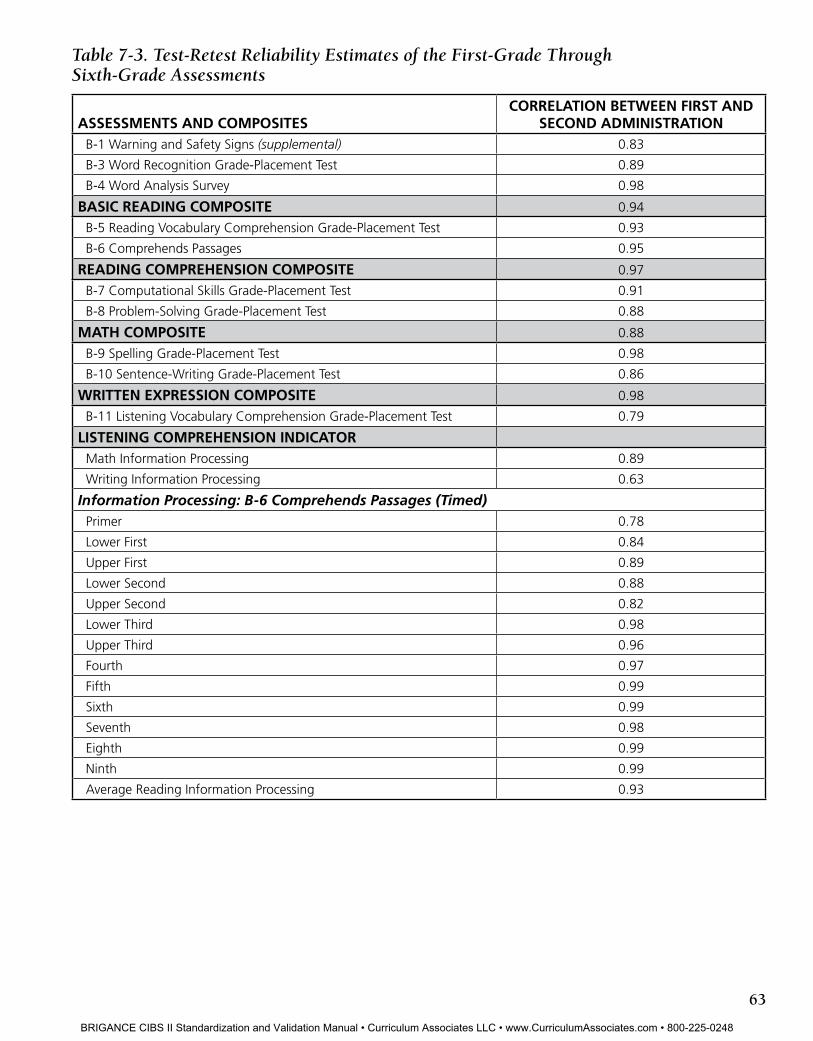
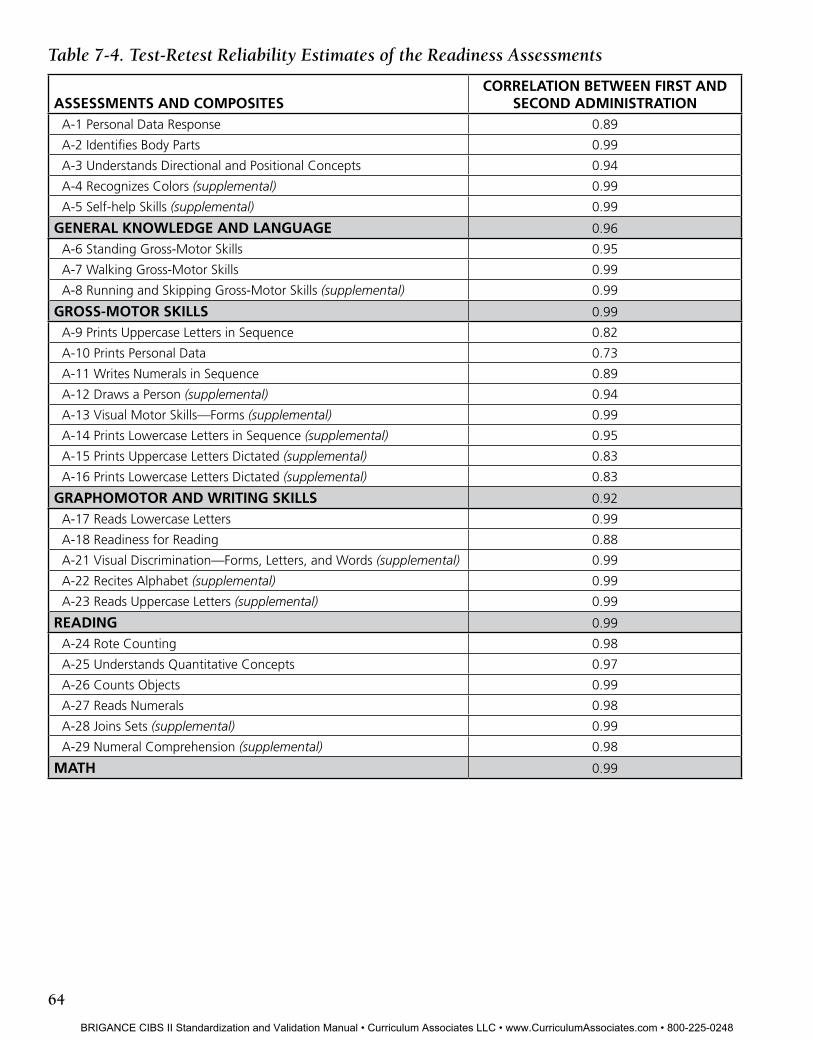
A method for investigating the stability of an instrument is to examine test-retest score reliability. This requires giving the instrument to examinees on two occasions. For many achievement tests, the interval between testing sessions is quite limited to minimize changes in the examinee. However, a sufficient amount of time needs to elapse in order to control for the effects of practice or memory. Tests should produce roughly the same scores even if students are tested several days to several weeks apart. Such test-retest reliability is usually expressed as a correlation (ideally, .80 or higher) between the two test sessions. There is, even with the best tests, some variability across domains. As the CIBS II was not altered in a sufficient manner to require stability to be examined again, previous results for standardization work with the instrument are presented. Forty-one students in kindergarten through sixth grade were tested and retested two weeks later by an educational diagnostician. The correlations between like assessments are shown in Tables 7-3 and 7-4. These are uniformly high and illustrate that the CIBS II produces very similar results when retesting occurs over a short interval of time. Further tests of stability are encouraged with both measures on a more diverse set of examinees.
BRIGANCE CIBS II Standardization and Validation Manual • Curriculum Associates LLC • www.CurriculumAssociates.com • 800-225-0248
63
Table 7-3. Test-Retest Reliability Estimates of the First-Grade Through Sixth-Grade Assessments
assessments and CompositesCoRReLation BetWeen FiRst and
seCond administRationB-1 Warning and Safety Signs (supplemental) 0.83
B-3 Word Recognition Grade-Placement Test 0.89
B-4 Word Analysis Survey 0.98
BasiC ReadinG Composite 0.94
B-5 Reading Vocabulary Comprehension Grade-Placement Test 0.93
B-6 Comprehends Passages 0.95
ReadinG CompReHension Composite 0.97
B-7 Computational Skills Grade-Placement Test 0.91
B-8 Problem-Solving Grade-Placement Test 0.88
matH Composite 0.88
B-9 Spelling Grade-Placement Test 0.98
B-10 Sentence-Writing Grade-Placement Test 0.86
WRitten expRession Composite 0.98
B-11 Listening Vocabulary Comprehension Grade-Placement Test 0.79
ListeninG CompReHension indiCatoRMath Information Processing 0.89
Writing Information Processing 0.63
Information Processing: B-6 Comprehends Passages (Timed)Primer 0.78
Lower First 0.84
Upper First 0.89
Lower Second 0.88
Upper Second 0.82
Lower Third 0.98
Upper Third 0.96
Fourth 0.97
Fifth 0.99
Sixth 0.99
Seventh 0.98
Eighth 0.99
Ninth 0.99
Average Reading Information Processing 0.93
BRIGANCE CIBS II Standardization and Validation Manual • Curriculum Associates LLC • www.CurriculumAssociates.com • 800-225-0248
64
Table 7-4. Test-Retest Reliability Estimates of the Readiness Assessments
assessments and Composites CoRReLation BetWeen FiRst and
seCond administRationA-1 Personal Data Response 0.89
A-2 Identifies Body Parts 0.99
A-3 Understands Directional and Positional Concepts 0.94
A-4 Recognizes Colors (supplemental) 0.99
A-5 Self-help Skills (supplemental) 0.99
GeneRaL KnoWLedGe and LanGUaGe 0.96
A-6 Standing Gross-Motor Skills 0.95
A-7 Walking Gross-Motor Skills 0.99
A-8 Running and Skipping Gross-Motor Skills (supplemental) 0.99
GRoss-motoR sKiLLs 0.99
A-9 Prints Uppercase Letters in Sequence 0.82
A-10 Prints Personal Data 0.73
A-11 Writes Numerals in Sequence 0.89
A-12 Draws a Person (supplemental) 0.94
A-13 Visual Motor Skills—Forms (supplemental) 0.99
A-14 Prints Lowercase Letters in Sequence (supplemental) 0.95
A-15 Prints Uppercase Letters Dictated (supplemental) 0.83
A-16 Prints Lowercase Letters Dictated (supplemental) 0.83
GRapHomotoR and WRitinG sKiLLs 0.92
A-17 Reads Lowercase Letters 0.99
A-18 Readiness for Reading 0.88
A-21 Visual Discrimination—Forms, Letters, and Words (supplemental) 0.99
A-22 Recites Alphabet (supplemental) 0.99
A-23 Reads Uppercase Letters (supplemental) 0.99
ReadinG 0.99
A-24 Rote Counting 0.98
A-25 Understands Quantitative Concepts 0.97
A-26 Counts Objects 0.99
A-27 Reads Numerals 0.98
A-28 Joins Sets (supplemental) 0.99
A-29 Numeral Comprehension (supplemental) 0.98
matH 0.99
BRIGANCE CIBS II Standardization and Validation Manual • Curriculum Associates LLC • www.CurriculumAssociates.com • 800-225-0248
65
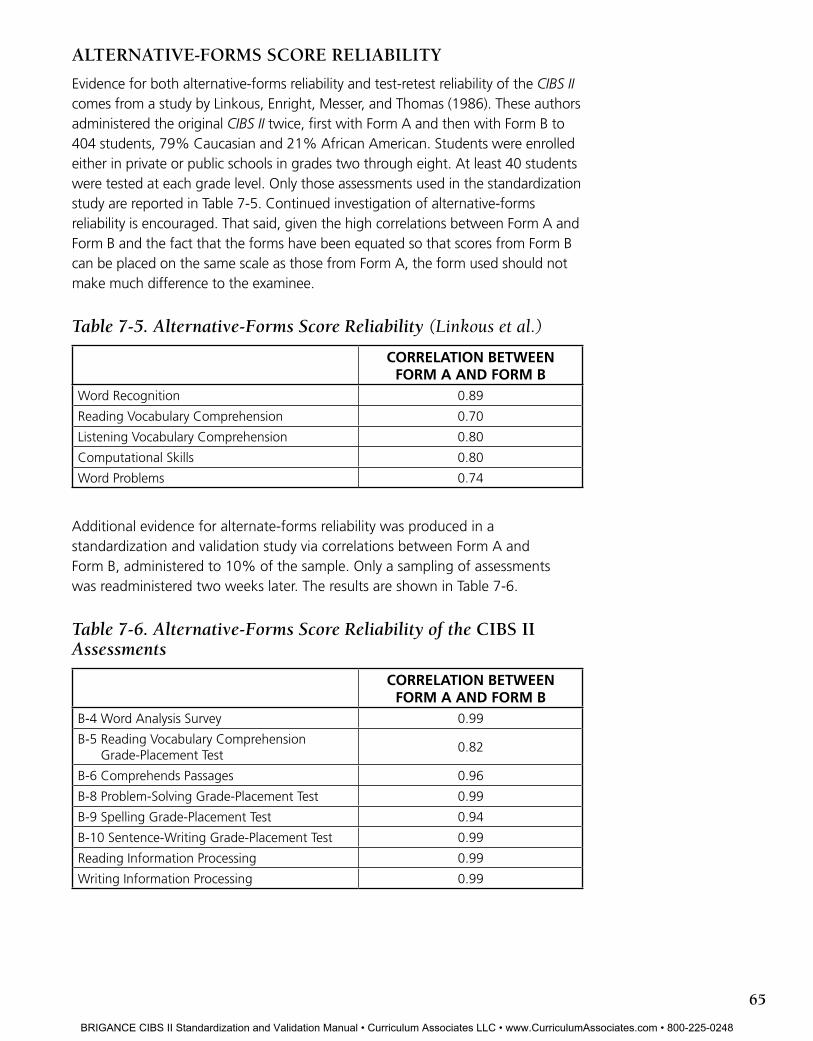
alternative-forMs score reliability
Evidence for both alternative-forms reliability and test-retest reliability of the CIBS II comes from a study by Linkous, Enright, Messer, and Thomas (1986). These authors administered the original CIBS II twice, first with Form A and then with Form B to 404 students, 79% Caucasian and 21% African American. Students were enrolled either in private or public schools in grades two through eight. At least 40 students were tested at each grade level. Only those assessments used in the standardization study are reported in Table 7-5. Continued investigation of alternative-forms reliability is encouraged. That said, given the high correlations between Form A and Form B and the fact that the forms have been equated so that scores from Form B can be placed on the same scale as those from Form A, the form used should not make much difference to the examinee.
Table 7-5. Alternative-Forms Score Reliability (Linkous et al.)
CoRReLation BetWeen
FoRm a and FoRm B Word Recognition 0.89
Reading Vocabulary Comprehension 0.70
Listening Vocabulary Comprehension 0.80
Computational Skills 0.80
Word Problems 0.74
Additional evidence for alternate-forms reliability was produced in a standardization and validation study via correlations between Form A and Form B, administered to 10% of the sample. Only a sampling of assessments was readministered two weeks later. The results are shown in Table 7-6.
Table 7-6. Alternative-Forms Score Reliability of the cibs ii Assessments
CoRReLation BetWeen
FoRm a and FoRm B B-4 Word Analysis Survey 0.99
B-5 Reading Vocabulary Comprehension Grade-Placement Test
0.82
B-6 Comprehends Passages 0.96
B-8 Problem-Solving Grade-Placement Test 0.99
B-9 Spelling Grade-Placement Test 0.94
B-10 Sentence-Writing Grade-Placement Test 0.99
Reading Information Processing 0.99
Writing Information Processing 0.99
BRIGANCE CIBS II Standardization and Validation Manual • Curriculum Associates LLC • www.CurriculumAssociates.com • 800-225-0248
66
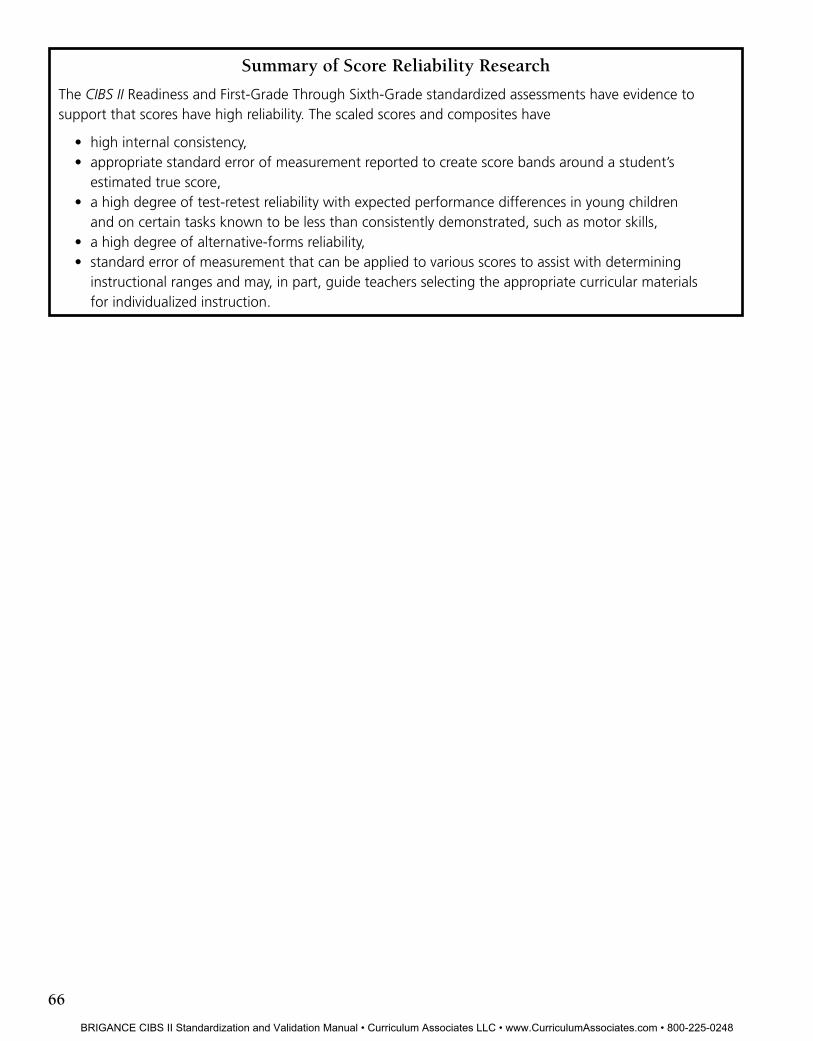
summary of score reliability research
The CIBS II Readiness and First-Grade Through Sixth-Grade standardized assessments have evidence to support that scores have high reliability. The scaled scores and composites have
• high internal consistency,• appropriate standard error of measurement reported to create score bands around a student’s
estimated true score,• a high degree of test-retest reliability with expected performance differences in young children
and on certain tasks known to be less than consistently demonstrated, such as motor skills,• a high degree of alternative-forms reliability, • standard error of measurement that can be applied to various scores to assist with determining
instructional ranges and may, in part, guide teachers selecting the appropriate curricular materials for individualized instruction.
BRIGANCE CIBS II Standardization and Validation Manual • Curriculum Associates LLC • www.CurriculumAssociates.com • 800-225-0248
67
CHAPTER 8: Evidence of Test Validation of the CIBS II
critical concePts in test construction: test validation
Test validation is the most essential and fundamental aspect of test construction (AERA et al. 1999). To establish interpretability, a test score’s construct validity—the degree to which test scores indicate the amount of an unobservable trait an examinee has (Anastasi & Urbina 1997)—for a specified purpose (Messick 1989) must be established. Note that the meaning of validity is under constant debate (e.g., Cizek, Rosenberg, & Koons 2008). Ultimately, test-score validity refers to the degree to which decisions based on test scores, and the inferences on which the decisions are based, are justified by supporting evidence (Linn 2005). Many forms of evidence, including, but not limited to, mapping of skills to test items and expert reviews of items, the relationship between test scores and scores on other established tests that purport to measure the same construct, and the correlation between test scores and levels of future performance, contribute to a body of evidence to support the construct validity of test scores for a given purpose (Messick 1989). For example, Standards (AERA et al. 1999) lists five common sources of evidence: (a) test content, (b) response processes, (c) internal structure, (d) relations to other variables, and (e) consequences of testing.
Current notions favor a more unified view of validity, where the above sources of evidence are presented as opposed to multiple types of validity. This implies that validation is an ongoing process rather than a single study. That said, the several sources of validation evidence provided in this manual are labeled using the traditional terms with which most practitioners will be familiar, as well as with newer labels. This language is changing slowly (e.g., Cizek et al. 2008) to reflect current validity theory. Given that validation is an ongoing process, continued validation research is encouraged with the CIBS II.
There are many types or sources of test validation:
• Content validity (test content) answers the question, Do CIBS II items sample readiness and academic skills considered to be important by developmental researchers and educators?
• Construct validity (e.g., internal structure) answers the question, To what extent do CIBS II assessment scores indicate a student’s standing on the measured trait?
• Concurrent validity, also called criterion-related validity, describes the relationship of a test to other measures and answers the question, Does the CIBS II relate (correlate) with comparable and related measures (such as other tests of achievement, and tests of intelligence and language)?
• Measurement invariance via differential item functioning anwers the question, Do students with broad but similar characteristics have the same chance of responding correctly to CIBS II items regardless of group membership (e.g., male, female)?
(continued)
BRIGANCE CIBS II Standardization and Validation Manual • Curriculum Associates LLC • www.CurriculumAssociates.com • 800-225-0248
68
Previous test validation evidence of the CIBS–R
The previous version of the CIBS, the CIBS–R, had good score validity evidence. Specifically, the CIBS–R scores were found to have: (a) high relationships with the relevant assessment composites, (b) high correlations with group achievement tests such as the Iowa Test of Basic Skills, and California Achievement Test, (c) high correlations with individually administered diagnostic achievement tests including the Woodcock-Johnson Psychoeducational Battery: Tests of Achievement, the Wide Range Achievement Test, the Peabody Individual Achievement Test, and intelligence measures (e.g., the Wechsler Intelligence Scale for Children®—Third Edition), (d) was a good predictor of academic performance, and (e) could differentiate between various students in various categories where differences would be expected. The following section documents that the CIBS II adheres to the same high standards that were documented in the CIBS–R Standardization and Validation Manual and provides even more substantial evidence to support the scores’ uses and interpretations. The accumulation of such evidence gives confidence in the CIBS II and its predecessors. See Appendix B in the CIBS II Standardized for references.
validity evidence based on test content (content validity)
There is abundant support for the content validity or test content of the CIBS II and for its applicability in educational settings. The construction of the CIBS II assessments was based on the author’s extensive reading of developmental, educational, and readiness literature and on collaboration with hundreds of other educators across the U.S. who assisted in item development and selection. The assessments were written to reflect the grade-level content that appears in textbooks used in elementary schools (Connelly 1985; Brigance 1998). The CIBS was purported to be useful “as a scope and sequence, and [educators] may consider or choose specific objectives from it” (Connelly 1985, p. 4). Other studies of the original CIBS include a mention of “field testing and the jury system” being used to establish the content validity of the instrument (Linkous, Enright, Messer, & Thomas 1986; p. 6). The process of item selection and content is described in greater detail in the CIBS II.
• Predictive validity describes the relationship of a measure to performance in the future and answers the question, Does the test given at the beginning of the school year predict future performance, such as at the end of the school year?)
• Discriminant validity views the ability of a measure to illustrate unique performance patterns for discrete conditions or characteristics. This information helps answer questions about whether children with learning disabilities, for example, versus those with intellectual disabilities or mental health problems, tend to perform differently. The value of such studies is that distinct performance patterns can help teachers, examiners, and parents, in identifying unique challenges that some children face.
• Criterion-related validity focuses largely on the ability of screening tests to quickly identify children who may or may not need further testing.
BRIGANCE CIBS II Standardization and Validation Manual • Curriculum Associates LLC • www.CurriculumAssociates.com • 800-225-0248
69
validation of the CIBS II
internal structure evidence via confirmatory factor analysis
Validity studies for achievement tests typically do not seek to support the factorial structures of the tests (e.g., Cizek, Rosenberg, & Koons 2008; Connolly 1998; Daub & Colarusso 1996; Erford & Dutton 2005). Even though achievement-test results are commonly used to make high-stakes decisions, “there is surprisingly little published evidence that supports the structure of such instruments and the validity of their intended use and interpretation” (Stevens & Zvoch 2007, p. 977). Internal-structure evidence was gathered through examining the factor structure with confirmatory factor analysis (CFA), a theory-driven analysis requiring a priori specification of the relationship of indicators to underlying traits.
LISREL 8.80 (Jöreskog & Sörbom 2006) with maximum likelihood (ML) estimation was employed to analyze the covariance matrices of scores. The individual assessment scores did not show dramatic departures from normal distributions; however, univariate normality of variables is a necessary but not sufficient condition for multivariate normality (MVN). PRELIS 2.8, a data preprocessing program for LISREL, was used to assess the MVN of the assessment scores. The relative multivariate kurtosis of the scores was < 1.5. Bentler (1998) recommends that MVN can be assumed when this index is below 3.0. Based on this evidence of MVN, LISREL 8.80 with ML estimation was used to estimate the models in this analysis.
For both sets of assessments, evaluation of model fit in the CFA work was evaluated using a combination of fit indices, following the recommendations of Hu and Bentler (1999) and Brown (2006). The χ
2 statistic is sensitive to even small
differences, causing the model to be spuriously rejected (Brown 2006). However, χ2
statistics are useful in comparing nested models, so they are reported. The standardized root mean square residual index (SRMR), the comparative fit index (CFI) (Bentler 1990), and the Tucker-Lewis index (TLI/NNFI) (Tucker & Lewis 1973) were employed. Models were judged as having acceptable fit only if all the selected fit statistics fell within acceptable range. In particular, RMSEA was given careful consideration since it gives preference to more parsimonious models (i.e., more degrees of freedom). In sum, then, the collection of fit indices used to judge model fit in this study were: SRMR < .08, RMSEA < .06, CFI > .95, and TLI > .95 (Hu & Bentler 1999). Parameter estimates also were used in judging models. Parameter admissibility, significance, and interpretability helped guide model choice.
confirmatory factor analysis for the first-Grade through sixth-Grade assessments
As the sample was large with this group, a model cross-validation strategy was employed. Records were randomly assigned to two subgroups of 706 and 705 participants. No effort was made to match the subgroups on any variable in order to more closely approximate independent random samples. CIBS II data for each group was employed to examine several plausible confirmatory factor models, including one implied by the test-maker. The best-fitting model was cross-validated. Details for this analysis can be found in Breidenbach (2009) and Breidenbach & French (2009).
BRIGANCE CIBS II Standardization and Validation Manual • Curriculum Associates LLC • www.CurriculumAssociates.com • 800-225-0248
70
Four models were tested to rule out alternative models. Model 1, the single-factor model, represents an extreme of parsimony and may be considered less plausible than a multifactor model. Model 2 represents the five-factor structure implied by the composite score structure of the standardized assessments in the CIBS II. The listening vocabulary assessment is the only indicator on the Listening Comprehension factor. In factor analysis, a factor accounts for common variance among a set of indicators. Therefore, the Listening Comprehension factor is treated as a pseudofactor (Brown 2006). In practice, this distinction has little impact on estimation of the model. However, with a single indicator linked to a factor, it is not possible to estimate the measurement error (Brown 2006). Fixing measurement error of the indicator to a set value resolves this problem. A reasonable estimate for error variance comes from using a reliability index and the variance of the indicator (Kline 2005). This resulted in setting the value at 0.545. Model 3 adds a second-order factor to Model 2 to account for the interfactor correlations. Model 3 is more parsimonious in comparison to Model 2, as it reduces the number of estimated parameters. Model 4 is a three-factor model based on the assumption that the four reading-related assessments measure one Reading factor and that the Listening Vocabulary assessment could be linked to the Written Expression factor since the assessment dealt with word meanings without accounting explicitly for reading (i.e., the test was administered verbally).
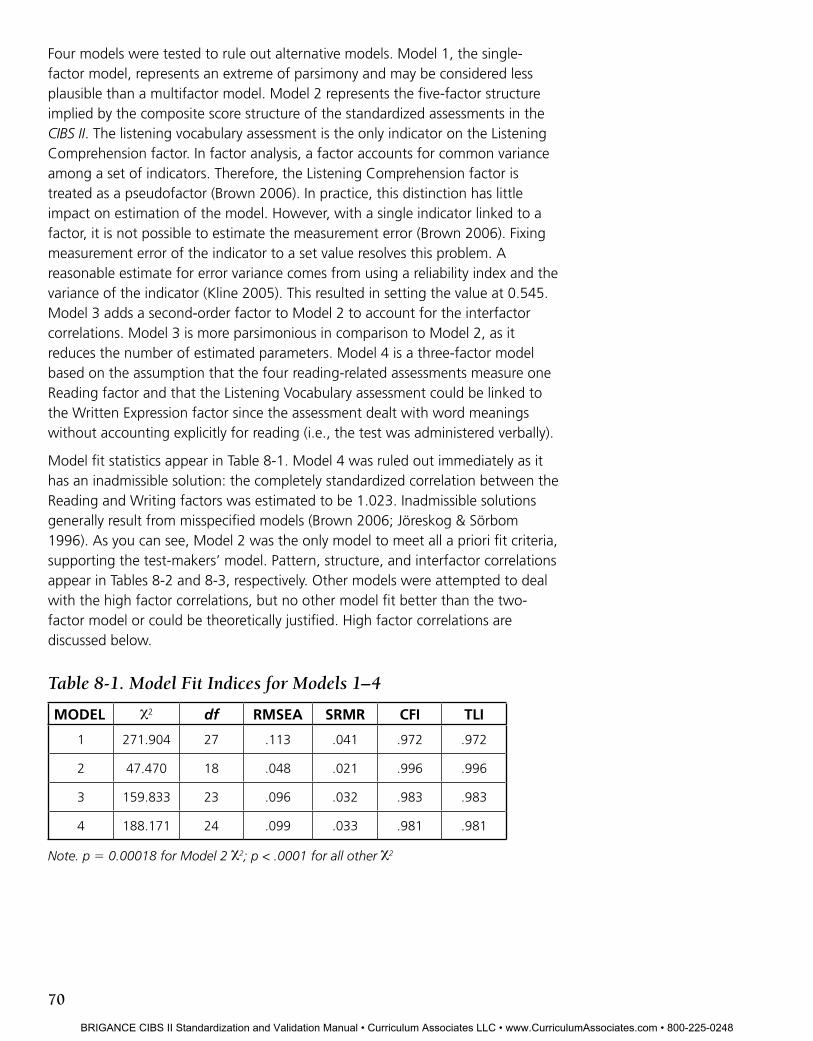
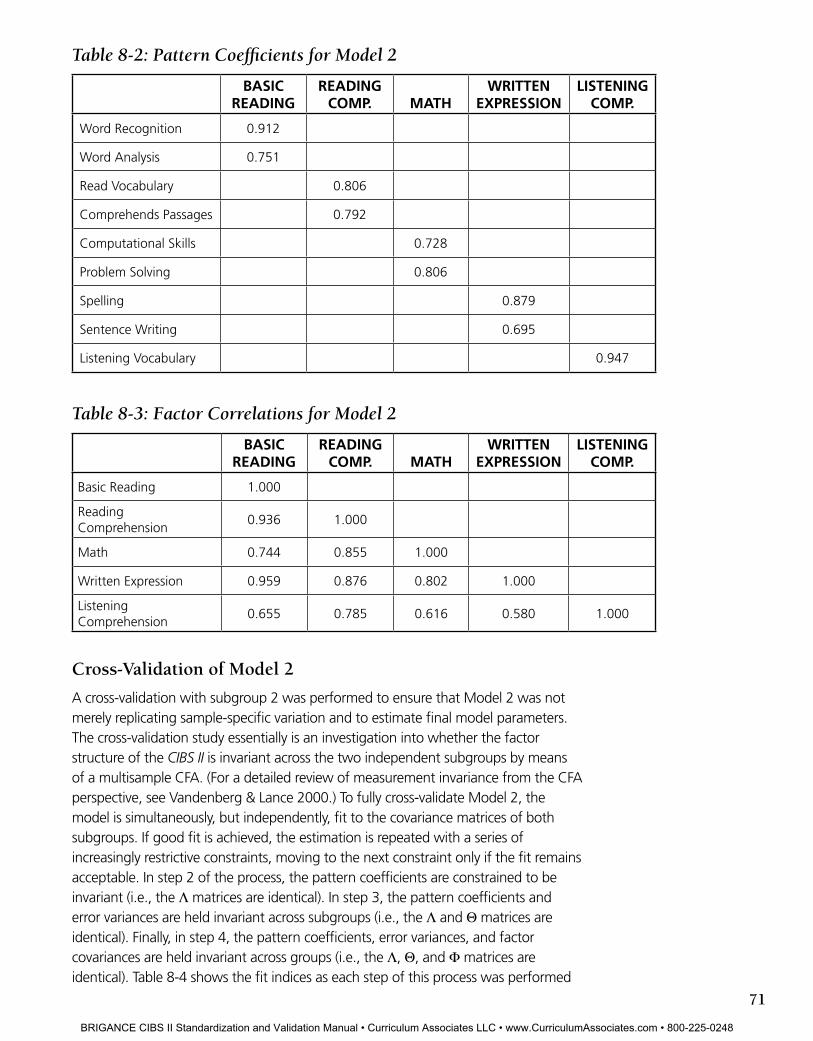
Model fit statistics appear in Table 8-1. Model 4 was ruled out immediately as it has an inadmissible solution: the completely standardized correlation between the Reading and Writing factors was estimated to be 1.023. Inadmissible solutions generally result from misspecified models (Brown 2006; Jöreskog & Sörbom 1996). As you can see, Model 2 was the only model to meet all a priori fit criteria, supporting the test-makers’ model. Pattern, structure, and interfactor correlations appear in Tables 8-2 and 8-3, respectively. Other models were attempted to deal with the high factor correlations, but no other model fit better than the two-factor model or could be theoretically justified. High factor correlations are discussed below.
Table 8-1. Model Fit Indices for Models 1–4
modeL χ2 df Rmsea sRmR CFi tLi
1 271.904 27 .113 .041 .972 .972
2 47.470 18 .048 .021 .996 .996
3 159.833 23 .096 .032 .983 .983
4 188.171 24 .099 .033 .981 .981
Note. p 5 0.00018 for Model 2 χ2; p < .0001 for all other χ2
BRIGANCE CIBS II Standardization and Validation Manual • Curriculum Associates LLC • www.CurriculumAssociates.com • 800-225-0248
71
Table 8-2: Pattern Coefficients for Model 2
BasiC ReadinG
ReadinGComp. matH
WRitten expRession
ListeninG Comp.
Word Recognition 0.912
Word Analysis 0.751
Read Vocabulary 0.806
Comprehends Passages 0.792
Computational Skills 0.728
Problem Solving 0.806
Spelling 0.879
Sentence Writing 0.695
Listening Vocabulary 0.947
Table 8-3: Factor Correlations for Model 2
BasiC ReadinG
ReadinGComp. matH
WRitten expRession
ListeninG Comp.
Basic Reading 1.000
Reading Comprehension
0.936 1.000
Math 0.744 0.855 1.000
Written Expression 0.959 0.876 0.802 1.000
Listening Comprehension
0.655 0.785 0.616 0.580 1.000
cross-validation of Model 2
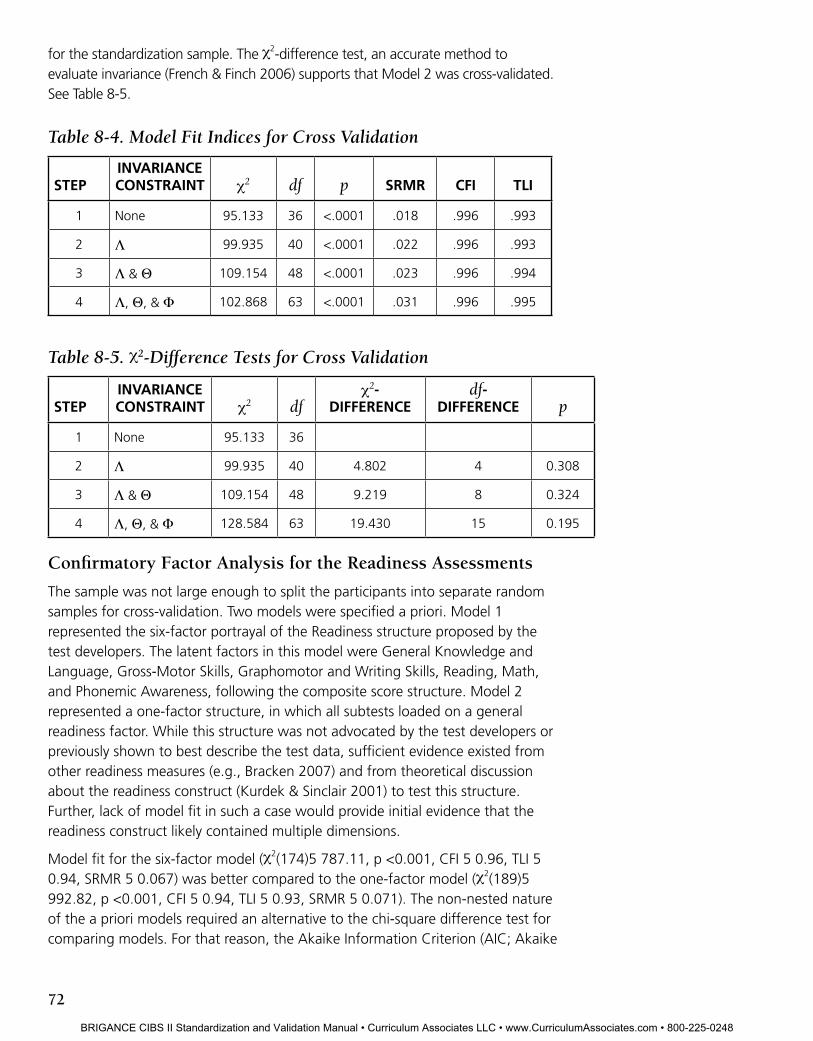
A cross-validation with subgroup 2 was performed to ensure that Model 2 was not merely replicating sample-specific variation and to estimate final model parameters. The cross-validation study essentially is an investigation into whether the factor structure of the CIBS II is invariant across the two independent subgroups by means of a multisample CFA. (For a detailed review of measurement invariance from the CFA perspective, see Vandenberg & Lance 2000.) To fully cross-validate Model 2, the model is simultaneously, but independently, fit to the covariance matrices of both subgroups. If good fit is achieved, the estimation is repeated with a series of increasingly restrictive constraints, moving to the next constraint only if the fit remains acceptable. In step 2 of the process, the pattern coefficients are constrained to be invariant (i.e., the Λ matrices are identical). In step 3, the pattern coefficients and error variances are held invariant across subgroups (i.e., the Λ and Θ matrices are identical). Finally, in step 4, the pattern coefficients, error variances, and factor covariances are held invariant across groups (i.e., the Λ, Θ, and Φ matrices are identical). Table 8-4 shows the fit indices as each step of this process was performed
BRIGANCE CIBS II Standardization and Validation Manual • Curriculum Associates LLC • www.CurriculumAssociates.com • 800-225-0248
72
for the standardization sample. The χ2-difference test, an accurate method to evaluate invariance (French & Finch 2006) supports that Model 2 was cross-validated. See Table 8-5.
Table 8-4. Model Fit Indices for Cross Validation
stepinvaRianCe ConstRaint χ2 df p sRmR CFi tLi
1 None 95.133 36 <.0001 .018 .996 .993
2 Λ 99.935 40 <.0001 .022 .996 .993
3 Λ & Θ 109.154 48 <.0001 .023 .996 .994
4 Λ, Θ, & Φ 102.868 63 <.0001 .031 .996 .995
Table 8-5. χ2-Difference Tests for Cross Validation
stepinvaRianCe ConstRaint χ2 df
χ2-diFFeRenCe
df- diFFeRenCe p
1 None 95.133 36
2 Λ 99.935 40 4.802 4 0.308
3 Λ & Θ 109.154 48 9.219 8 0.324
4 Λ, Θ, & Φ 128.584 63 19.430 15 0.195
confirmatory factor analysis for the readiness assessments
The sample was not large enough to split the participants into separate random samples for cross-validation. Two models were specified a priori. Model 1 represented the six-factor portrayal of the Readiness structure proposed by the test developers. The latent factors in this model were General Knowledge and Language, Gross-Motor Skills, Graphomotor and Writing Skills, Reading, Math, and Phonemic Awareness, following the composite score structure. Model 2 represented a one-factor structure, in which all subtests loaded on a general readiness factor. While this structure was not advocated by the test developers or previously shown to best describe the test data, sufficient evidence existed from other readiness measures (e.g., Bracken 2007) and from theoretical discussion about the readiness construct (Kurdek & Sinclair 2001) to test this structure. Further, lack of model fit in such a case would provide initial evidence that the readiness construct likely contained multiple dimensions.
Model fit for the six-factor model (χ2(174)5 787.11, p <0.001, CFI 5 0.96, TLI 5 0.94, SRMR 5 0.067) was better compared to the one-factor model (χ2(189)5 992.82, p <0.001, CFI 5 0.94, TLI 5 0.93, SRMR 5 0.071). The non-nested nature of the a priori models required an alternative to the chi-square difference test for comparing models. For that reason, the Akaike Information Criterion (AIC; Akaike
BRIGANCE CIBS II Standardization and Validation Manual • Curriculum Associates LLC • www.CurriculumAssociates.com • 800-225-0248
73
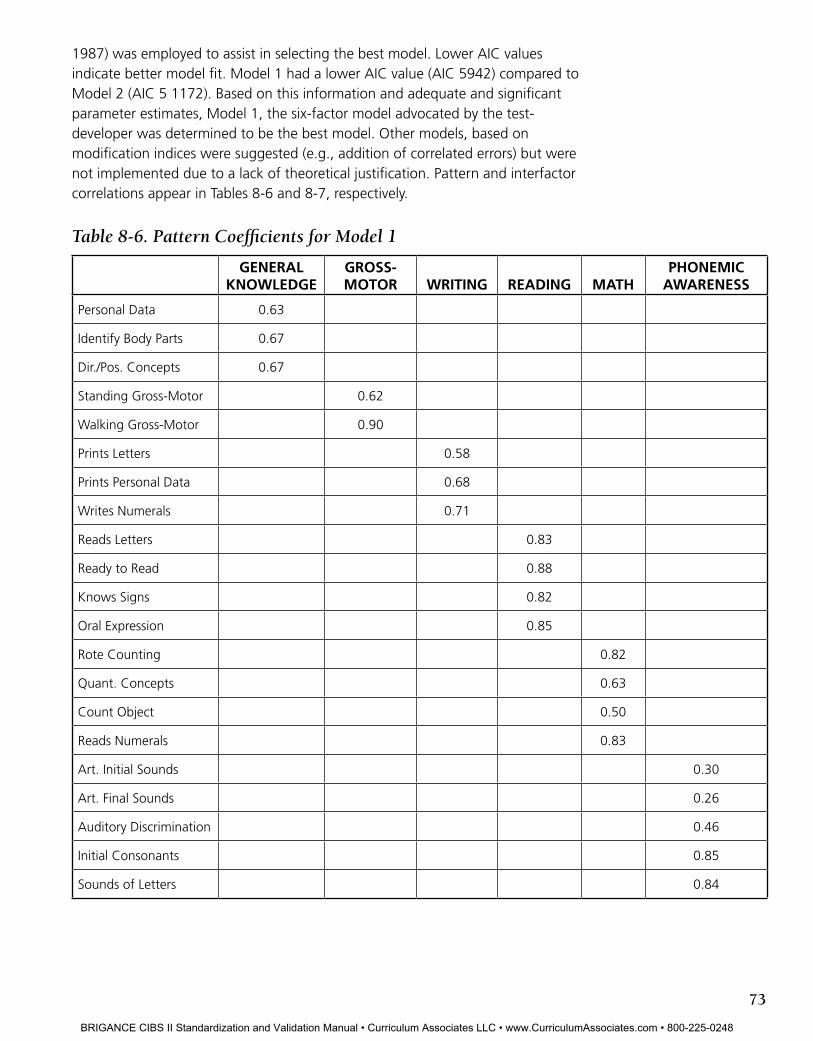
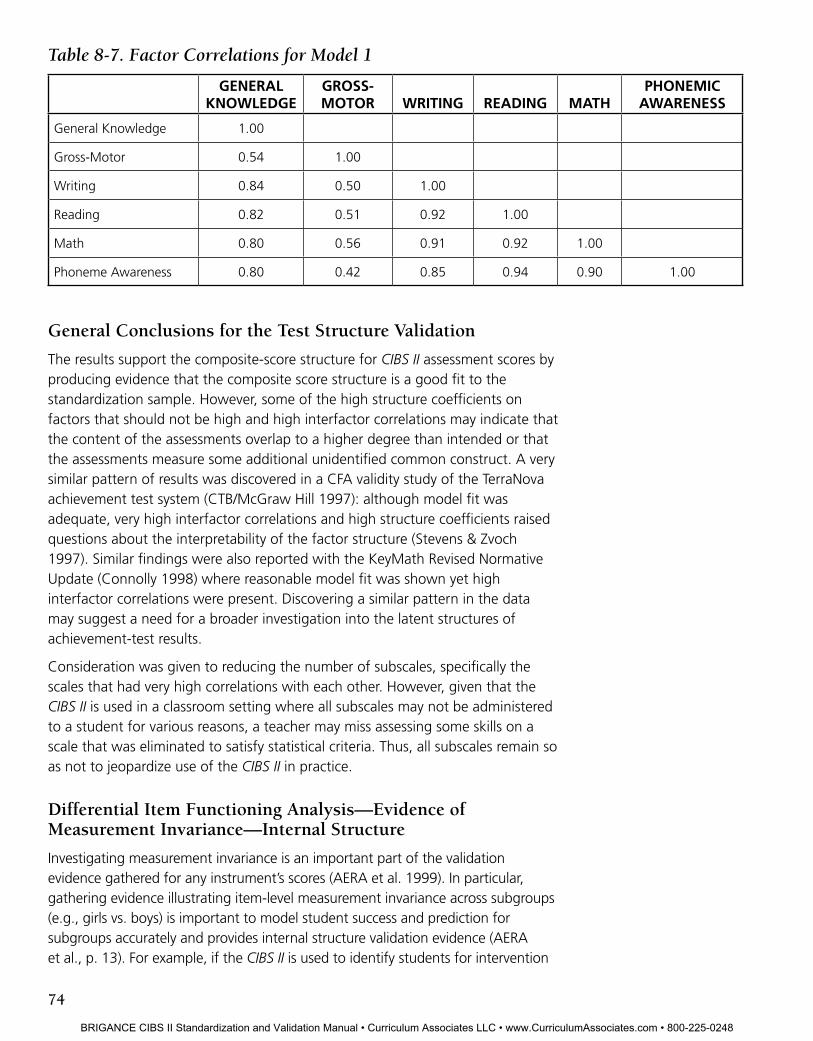
1987) was employed to assist in selecting the best model. Lower AIC values indicate better model fit. Model 1 had a lower AIC value (AIC 5942) compared to Model 2 (AIC 5 1172). Based on this information and adequate and significant parameter estimates, Model 1, the six-factor model advocated by the test-developer was determined to be the best model. Other models, based on modification indices were suggested (e.g., addition of correlated errors) but were not implemented due to a lack of theoretical justification. Pattern and interfactor correlations appear in Tables 8-6 and 8-7, respectively.
Table 8-6. Pattern Coefficients for Model 1
GeneRaL KnoWLedGe
GRoss-motoR WRitinG ReadinG matH
pHonemiC aWaReness
Personal Data 0.63
Identify Body Parts 0.67
Dir./Pos. Concepts 0.67
Standing Gross-Motor 0.62
Walking Gross-Motor 0.90
Prints Letters 0.58
Prints Personal Data 0.68
Writes Numerals 0.71
Reads Letters 0.83
Ready to Read 0.88
Knows Signs 0.82
Oral Expression 0.85
Rote Counting 0.82
Quant. Concepts 0.63
Count Object 0.50
Reads Numerals 0.83
Art. Initial Sounds 0.30
Art. Final Sounds 0.26
Auditory Discrimination 0.46
Initial Consonants 0.85
Sounds of Letters 0.84
BRIGANCE CIBS II Standardization and Validation Manual • Curriculum Associates LLC • www.CurriculumAssociates.com • 800-225-0248
74
Table 8-7. Factor Correlations for Model 1
GeneRaL KnoWLedGe
GRoss-motoR WRitinG ReadinG matH
pHonemiC aWaReness
General Knowledge 1.00
Gross-Motor 0.54 1.00
Writing 0.84 0.50 1.00
Reading 0.82 0.51 0.92 1.00
Math 0.80 0.56 0.91 0.92 1.00
Phoneme Awareness 0.80 0.42 0.85 0.94 0.90 1.00
General conclusions for the test structure validation
The results support the composite-score structure for CIBS II assessment scores by producing evidence that the composite score structure is a good fit to the standardization sample. However, some of the high structure coefficients on factors that should not be high and high interfactor correlations may indicate that the content of the assessments overlap to a higher degree than intended or that the assessments measure some additional unidentified common construct. A very similar pattern of results was discovered in a CFA validity study of the TerraNova achievement test system (CTB/McGraw Hill 1997): although model fit was adequate, very high interfactor correlations and high structure coefficients raised questions about the interpretability of the factor structure (Stevens & Zvoch 1997). Similar findings were also reported with the KeyMath Revised Normative Update (Connolly 1998) where reasonable model fit was shown yet high interfactor correlations were present. Discovering a similar pattern in the data may suggest a need for a broader investigation into the latent structures of achievement-test results.
Consideration was given to reducing the number of subscales, specifically the scales that had very high correlations with each other. However, given that the CIBS II is used in a classroom setting where all subscales may not be administered to a student for various reasons, a teacher may miss assessing some skills on a scale that was eliminated to satisfy statistical criteria. Thus, all subscales remain so as not to jeopardize use of the CIBS II in practice.
differential item functioning analysis—evidence of Measurement invariance—internal structure
Investigating measurement invariance is an important part of the validation evidence gathered for any instrument’s scores (AERA et al. 1999). In particular, gathering evidence illustrating item-level measurement invariance across subgroups (e.g., girls vs. boys) is important to model student success and prediction for subgroups accurately and provides internal structure validation evidence (AERA et al., p. 13). For example, if the CIBS II is used to identify students for intervention
BRIGANCE CIBS II Standardization and Validation Manual • Curriculum Associates LLC • www.CurriculumAssociates.com • 800-225-0248
75
or to predict student success effectively, evidence is needed to support that a lack of measurement invariance across groups is not influencing prediction. Without such evidence, it is difficult, if not impossible, to determine if group score differences could be a result of a lack of measurement invariance (e.g., differential item functioning [DIF]) or a true group difference on the construct (AERA et al.; Cole, Maxwell, Avery, & Salas 1993; Hancock 1997). DIF is present when individuals from different groups, but with identical ability, have different probabilities of responding correctly to an item scored correct or incorrect.
Logistic regression (LR), which has been shown to be an effective method for DIF detection (e.g., Narayanan & Swaminathan 1996; Swaminathan & Rogers 1990) was employed. The examination of items for DIF with LR is a process of comparing three models for each item and testing the improvement of fit for these models as terms are eliminated. To classify an item as exhibiting DIF, the chi-square difference test was used to compare models as variables were entered into the model. Variables were entered in the order suggested by Zumbo (1999): (a) total score (the conditioning variable); (b) gender (the grouping variable); and (c) the interaction term. Additionally, an ordinal R2 value associated with each step was used as the effect size measure. The sequential nature of this DIF process allows the researcher to compare models at step 2 vs. step 1 to assess uniform DIF and at step 3 vs. step 2 to assess nonuniform DIF. As suggested by Zumbo (1999), the criteria of a significant 2-df χ2
difference test between models employing Bonferroni adjustment for multiple comparisons and R2
difference ≥ 0.130 were used to identify DIF items. Iterative purification of ability processes were employed following recommendations (French & Maller 2007). Analyses were conducted within each subscale for the Readiness and the First-Grade Through Sixth-Grade Form A and Form B assessments. DIF was examined for gender and for race/ethnicity categories. Due to limited sample sizes within each race/ethnicity category, the groups of white compared to non-white were employed. These two sets of DIF analyses across forms resulted in examining over 54 assessments on hundreds of items. Across all assessments, no items were identified as DIF items that met both criteria.
correlations of subscales with composites
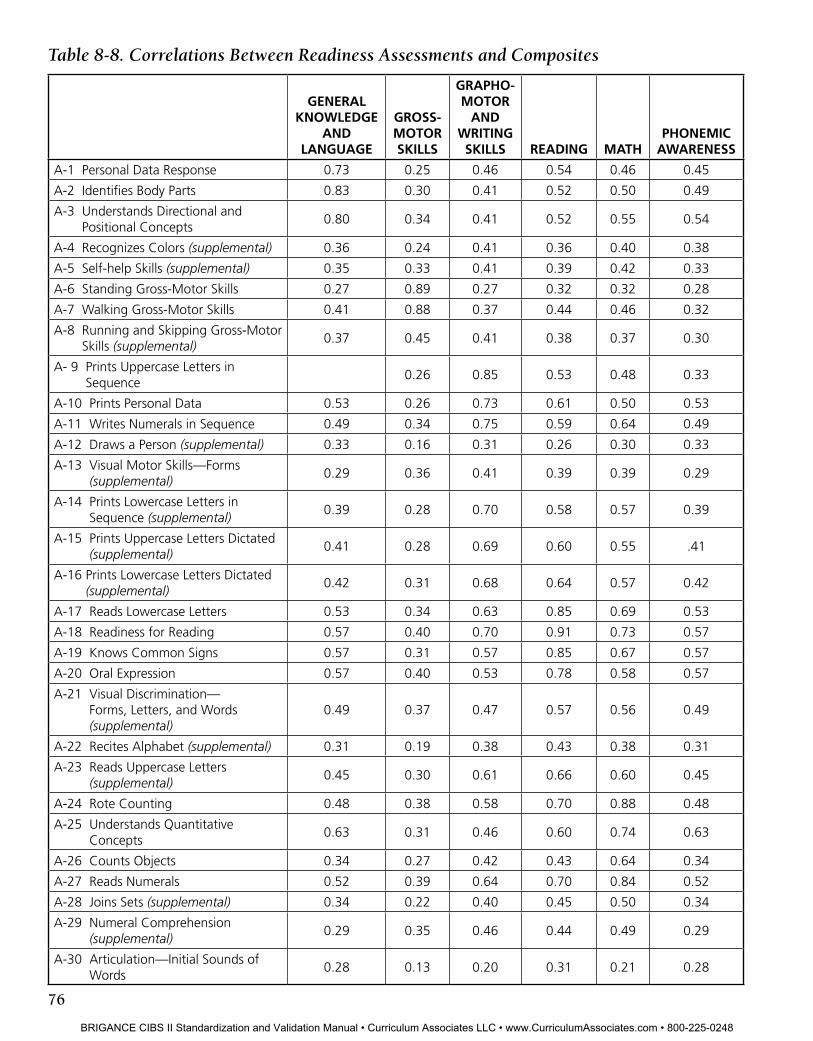
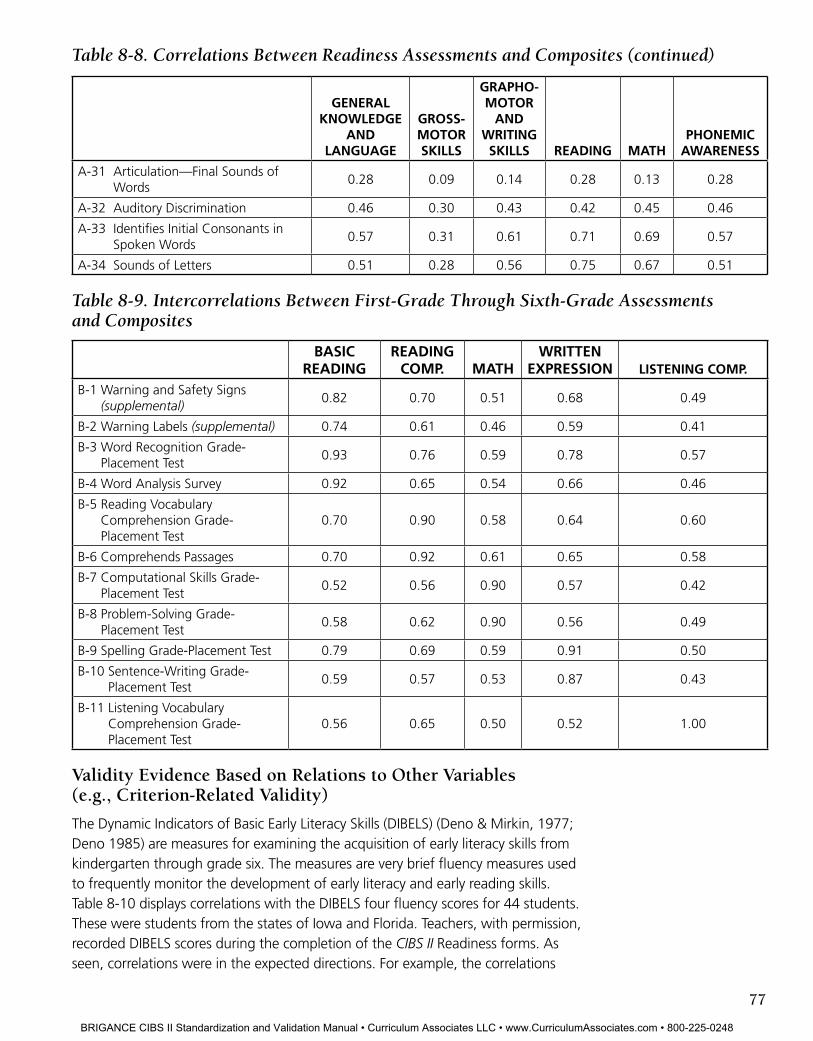
Another aspect of construct validity is the extent to which assessments relate to the composites. Tables 8-8 and 8-9 illustrate the strong and close relationship between assessments and composites. For some of the shortest scales on which children tended to score high (e.g., Standing Gross-Motor Skills), the correlations appear weak but are, in fact, attenuated by limited variability in scores. Nevertheless, all assessments that make up a composite had a statistically significant association. In an illustration of discriminant validity, correlations are generally weaker with subscales and non-corresponding composites compared to subscales and their corresponding composites. This is supported by the confirmatory factor analyses results that modeled these relationships accounting for error.
BRIGANCE CIBS II Standardization and Validation Manual • Curriculum Associates LLC • www.CurriculumAssociates.com • 800-225-0248
76
Table 8-8. Correlations Between Readiness Assessments and Composites
GeneRaL KnoWLedGe
and LanGUaGe
GRoss-motoR sKiLLs
GRapHo-motoR
and WRitinG sKiLLs ReadinG matH
pHonemiC aWaReness
A-1 Personal Data Response 0.73 0.25 0.46 0.54 0.46 0.45
A-2 Identifies Body Parts 0.83 0.30 0.41 0.52 0.50 0.49
A-3 Understands Directional and Positional Concepts
0.80 0.34 0.41 0.52 0.55 0.54
A-4 Recognizes Colors (supplemental) 0.36 0.24 0.41 0.36 0.40 0.38
A-5 Self-help Skills (supplemental) 0.35 0.33 0.41 0.39 0.42 0.33
A-6 Standing Gross-Motor Skills 0.27 0.89 0.27 0.32 0.32 0.28
A-7 Walking Gross-Motor Skills 0.41 0.88 0.37 0.44 0.46 0.32
A-8 Running and Skipping Gross-Motor Skills (supplemental)
0.37 0.45 0.41 0.38 0.37 0.30
A- 9 Prints Uppercase Letters in Sequence
0.26 0.85 0.53 0.48 0.33
A-10 Prints Personal Data 0.53 0.26 0.73 0.61 0.50 0.53
A-11 Writes Numerals in Sequence 0.49 0.34 0.75 0.59 0.64 0.49
A-12 Draws a Person (supplemental) 0.33 0.16 0.31 0.26 0.30 0.33
A-13 Visual Motor Skills—Forms (supplemental)
0.29 0.36 0.41 0.39 0.39 0.29
A-14 Prints Lowercase Letters in Sequence (supplemental)
0.39 0.28 0.70 0.58 0.57 0.39
A-15 Prints Uppercase Letters Dictated (supplemental)
0.41 0.28 0.69 0.60 0.55 .41
A-16 Prints Lowercase Letters Dictated (supplemental)
0.42 0.31 0.68 0.64 0.57 0.42
A-17 Reads Lowercase Letters 0.53 0.34 0.63 0.85 0.69 0.53
A-18 Readiness for Reading 0.57 0.40 0.70 0.91 0.73 0.57
A-19 Knows Common Signs 0.57 0.31 0.57 0.85 0.67 0.57
A-20 Oral Expression 0.57 0.40 0.53 0.78 0.58 0.57
A-21 Visual Discrimination—Forms, Letters, and Words (supplemental)
0.49 0.37 0.47 0.57 0.56 0.49
A-22 Recites Alphabet (supplemental) 0.31 0.19 0.38 0.43 0.38 0.31
A-23 Reads Uppercase Letters (supplemental)
0.45 0.30 0.61 0.66 0.60 0.45
A-24 Rote Counting 0.48 0.38 0.58 0.70 0.88 0.48
A-25 Understands Quantitative Concepts
0.63 0.31 0.46 0.60 0.74 0.63
A-26 Counts Objects 0.34 0.27 0.42 0.43 0.64 0.34
A-27 Reads Numerals 0.52 0.39 0.64 0.70 0.84 0.52
A-28 Joins Sets (supplemental) 0.34 0.22 0.40 0.45 0.50 0.34
A-29 Numeral Comprehension (supplemental)
0.29 0.35 0.46 0.44 0.49 0.29
A-30 Articulation—Initial Sounds of Words
0.28 0.13 0.20 0.31 0.21 0.28
BRIGANCE CIBS II Standardization and Validation Manual • Curriculum Associates LLC • www.CurriculumAssociates.com • 800-225-0248
77
GeneRaL KnoWLedGe
and LanGUaGe
GRoss-motoR sKiLLs
GRapHo-motoR
and WRitinG sKiLLs ReadinG matH
pHonemiC aWaReness
A-31 Articulation—Final Sounds of Words
0.28 0.09 0.14 0.28 0.13 0.28
A-32 Auditory Discrimination 0.46 0.30 0.43 0.42 0.45 0.46
A-33 Identifies Initial Consonants in Spoken Words
0.57 0.31 0.61 0.71 0.69 0.57
A-34 Sounds of Letters 0.51 0.28 0.56 0.75 0.67 0.51
Table 8-9. Intercorrelations Between First-Grade Through Sixth-Grade Assessments and Composites
BasiC
ReadinGReadinG
Comp. matHWRitten
expRession ListeninG Comp.
B-1 Warning and Safety Signs (supplemental)
0.82 0.70 0.51 0.68 0.49
B-2 Warning Labels (supplemental) 0.74 0.61 0.46 0.59 0.41
B-3 Word Recognition Grade-Placement Test
0.93 0.76 0.59 0.78 0.57
B-4 Word Analysis Survey 0.92 0.65 0.54 0.66 0.46
B-5 Reading Vocabulary Comprehension Grade-Placement Test
0.70 0.90 0.58 0.64 0.60
B-6 Comprehends Passages 0.70 0.92 0.61 0.65 0.58
B-7 Computational Skills Grade-Placement Test
0.52 0.56 0.90 0.57 0.42
B-8 Problem-Solving Grade-Placement Test
0.58 0.62 0.90 0.56 0.49
B-9 Spelling Grade-Placement Test 0.79 0.69 0.59 0.91 0.50
B-10 Sentence-Writing Grade-Placement Test
0.59 0.57 0.53 0.87 0.43
B-11 Listening Vocabulary Comprehension Grade-Placement Test
0.56 0.65 0.50 0.52 1.00
validity evidence based on relations to other variables (e.g., criterion-related validity)
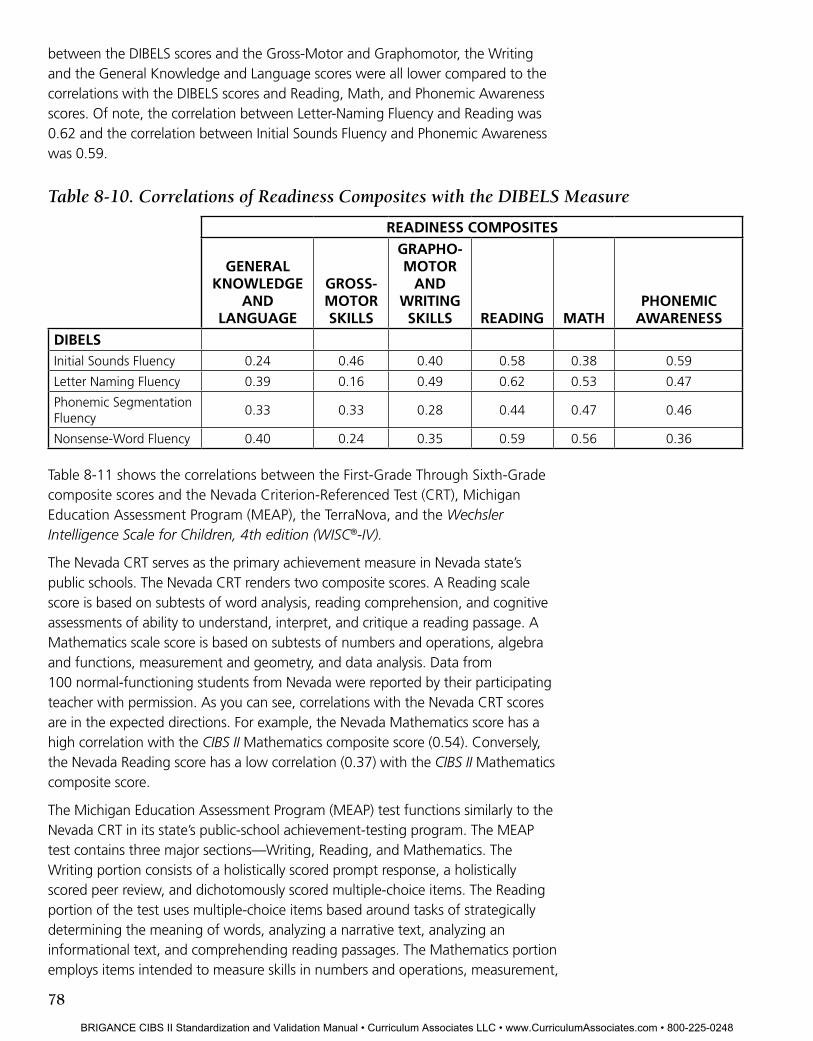
The Dynamic Indicators of Basic Early Literacy Skills (DIBELS) (Deno & Mirkin, 1977; Deno 1985) are measures for examining the acquisition of early literacy skills from kindergarten through grade six. The measures are very brief fluency measures used to frequently monitor the development of early literacy and early reading skills. Table 8-10 displays correlations with the DIBELS four fluency scores for 44 students. These were students from the states of Iowa and Florida. Teachers, with permission, recorded DIBELS scores during the completion of the CIBS II Readiness forms. As seen, correlations were in the expected directions. For example, the correlations
Table 8-8. Correlations Between Readiness Assessments and Composites (continued)
BRIGANCE CIBS II Standardization and Validation Manual • Curriculum Associates LLC • www.CurriculumAssociates.com • 800-225-0248
78
between the DIBELS scores and the Gross-Motor and Graphomotor, the Writing and the General Knowledge and Language scores were all lower compared to the correlations with the DIBELS scores and Reading, Math, and Phonemic Awareness scores. Of note, the correlation between Letter-Naming Fluency and Reading was 0.62 and the correlation between Initial Sounds Fluency and Phonemic Awareness was 0.59.
Table 8-10. Correlations of Readiness Composites with the DIBELS Measure
Readiness Composites
GeneRaL KnoWLedGe
and LanGUaGe
GRoss-motoR sKiLLs
GRapHo-motoR
and WRitinG sKiLLs ReadinG matH
pHonemiC aWaReness
diBeLs Initial Sounds Fluency 0.24 0.46 0.40 0.58 0.38 0.59
Letter Naming Fluency 0.39 0.16 0.49 0.62 0.53 0.47
Phonemic Segmentation Fluency
0.33 0.33 0.28 0.44 0.47 0.46
Nonsense-Word Fluency 0.40 0.24 0.35 0.59 0.56 0.36
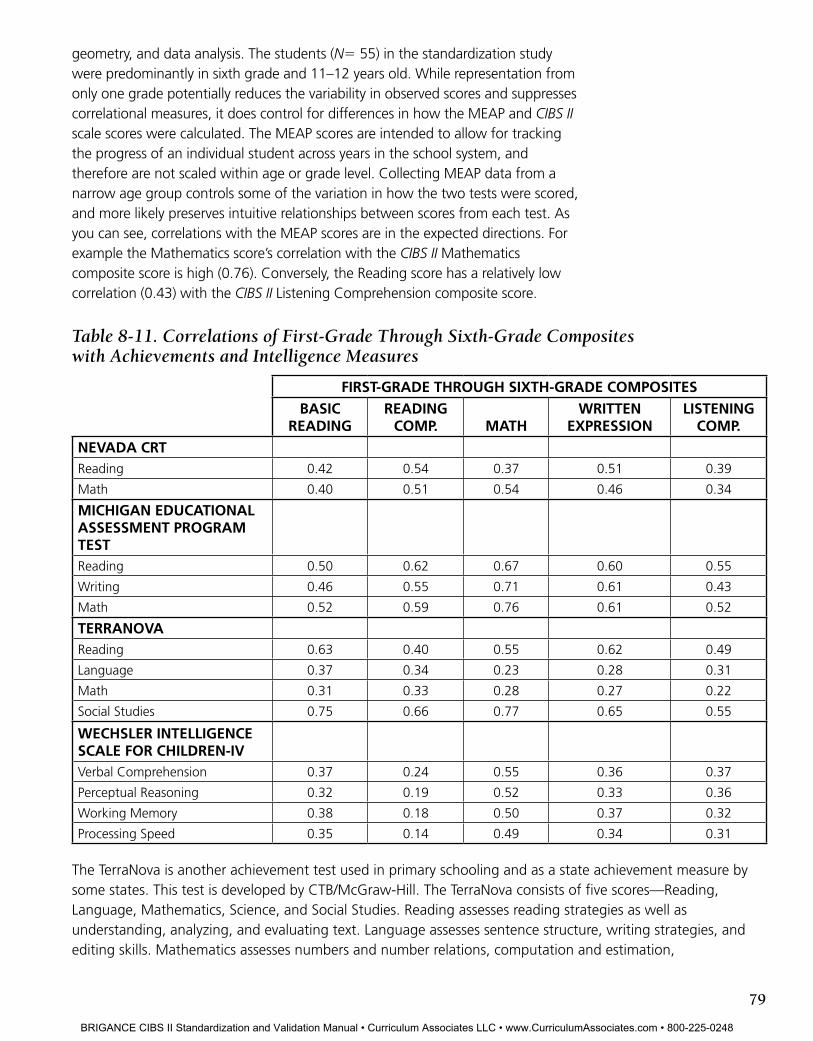
Table 8-11 shows the correlations between the First-Grade Through Sixth-Grade composite scores and the Nevada Criterion-Referenced Test (CRT), Michigan Education Assessment Program (MEAP), the TerraNova, and the Wechsler Intelligence Scale for Children, 4th edition (WISC®-IV).
The Nevada CRT serves as the primary achievement measure in Nevada state’s public schools. The Nevada CRT renders two composite scores. A Reading scale score is based on subtests of word analysis, reading comprehension, and cognitive assessments of ability to understand, interpret, and critique a reading passage. A Mathematics scale score is based on subtests of numbers and operations, algebra and functions, measurement and geometry, and data analysis. Data from 100 normal-functioning students from Nevada were reported by their participating teacher with permission. As you can see, correlations with the Nevada CRT scores are in the expected directions. For example, the Nevada Mathematics score has a high correlation with the CIBS II Mathematics composite score (0.54). Conversely, the Nevada Reading score has a low correlation (0.37) with the CIBS II Mathematics composite score.
The Michigan Education Assessment Program (MEAP) test functions similarly to the Nevada CRT in its state’s public-school achievement-testing program. The MEAP test contains three major sections—Writing, Reading, and Mathematics. The Writing portion consists of a holistically scored prompt response, a holistically scored peer review, and dichotomously scored multiple-choice items. The Reading portion of the test uses multiple-choice items based around tasks of strategically determining the meaning of words, analyzing a narrative text, analyzing an informational text, and comprehending reading passages. The Mathematics portion employs items intended to measure skills in numbers and operations, measurement,
BRIGANCE CIBS II Standardization and Validation Manual • Curriculum Associates LLC • www.CurriculumAssociates.com • 800-225-0248
79
geometry, and data analysis. The students (N5 55) in the standardization study were predominantly in sixth grade and 11–12 years old. While representation from only one grade potentially reduces the variability in observed scores and suppresses correlational measures, it does control for differences in how the MEAP and CIBS II scale scores were calculated. The MEAP scores are intended to allow for tracking the progress of an individual student across years in the school system, and therefore are not scaled within age or grade level. Collecting MEAP data from a narrow age group controls some of the variation in how the two tests were scored, and more likely preserves intuitive relationships between scores from each test. As you can see, correlations with the MEAP scores are in the expected directions. For example the Mathematics score’s correlation with the CIBS II Mathematics composite score is high (0.76). Conversely, the Reading score has a relatively low correlation (0.43) with the CIBS II Listening Comprehension composite score.
Table 8-11. Correlations of First-Grade Through Sixth-Grade Composites with Achievements and Intelligence Measures
FiRst-GRade tHRoUGH sixtH-GRade Composites
BasiC
ReadinGReadinG
Comp. matHWRitten
expRessionListeninG
Comp.nevada CRtReading 0.42 0.54 0.37 0.51 0.39
Math 0.40 0.51 0.54 0.46 0.34
miCHiGan edUCationaL assessment pRoGRam testReading 0.50 0.62 0.67 0.60 0.55
Writing 0.46 0.55 0.71 0.61 0.43
Math 0.52 0.59 0.76 0.61 0.52
teRRanovaReading 0.63 0.40 0.55 0.62 0.49
Language 0.37 0.34 0.23 0.28 0.31
Math 0.31 0.33 0.28 0.27 0.22
Social Studies 0.75 0.66 0.77 0.65 0.55
WeCHsLeR inteLLiGenCe sCaLe FoR CHiLdRen-ivVerbal Comprehension 0.37 0.24 0.55 0.36 0.37
Perceptual Reasoning 0.32 0.19 0.52 0.33 0.36
Working Memory 0.38 0.18 0.50 0.37 0.32
Processing Speed 0.35 0.14 0.49 0.34 0.31
The TerraNova is another achievement test used in primary schooling and as a state achievement measure by some states. This test is developed by CTB/McGraw-Hill. The TerraNova consists of five scores—Reading, Language, Mathematics, Science, and Social Studies. Reading assesses reading strategies as well as understanding, analyzing, and evaluating text. Language assesses sentence structure, writing strategies, and editing skills. Mathematics assesses numbers and number relations, computation and estimation,
BRIGANCE CIBS II Standardization and Validation Manual • Curriculum Associates LLC • www.CurriculumAssociates.com • 800-225-0248
80
measurement, geometry and spatial sense, and data analysis. Subtests of scientific inquiry, physical science, life science, and earth and space science comprise the Science scores. Social Studies assesses geographic perspectives, history and culture, civics and government, and economic perspectives. In the CIBS II standardization study the TerraNova norm-referenced scores (N 5 52) were used in order to maintain congruence with the CIBS II scores. Teachers reported these scores with permission when completing the CIBS II with their students. The Basic Reading and Written Expression scores had a strong relationship with the TerraNova Reading scores (0.63 and 0.62, respectively). Social Studies scores had strong relationships with all CIBS II composites (rs range from 0.55–0.77) possibly representing the general skills required to respond to social studies type items. Math relationships across assessments were somewhat low (e.g., 0.28) and may be due to content differences in the assessments.
The Wechsler Intelligence Scale for Children® (now in its 4th edition), is part of a long-standing battery of individually-administered intelligence tests, targeting different age groups. The intelligence tests remain popular having provided impetus for thousands of publications (Anastasi & Urbina 1997). Four index scores are produced by the WISC®-IV—verbal comprehension, perceptual reasoning, working memory, and processing speed. The WISC-IV composite structure mirrored the results of an exploratory factor analysis using the standardization sample and test-retest reliabilities, for all of the composite indices were above 0.79 with most exceeding 0.90 (Maller 2005). Data for the CIBS II standardization study were collected from normal-functioning students (N 5 104) in Indiana in individual testing sessions by a licensed clinical psychologist. The order of assessments administered was counter-balanced across students. Resulting correlations were in expected directions and magnitude.
All correlations reveal expected relationships between the external measures and assessments on the CIBS II, providing supporting evidence of test validation through correlations with other variables. Validation is an ongoing process, thus validation research should continue for the CIBS II.
BRIGANCE CIBS II Standardization and Validation Manual • Curriculum Associates LLC • www.CurriculumAssociates.com • 800-225-0248
81
evidence of test validation via contrasting Group differences
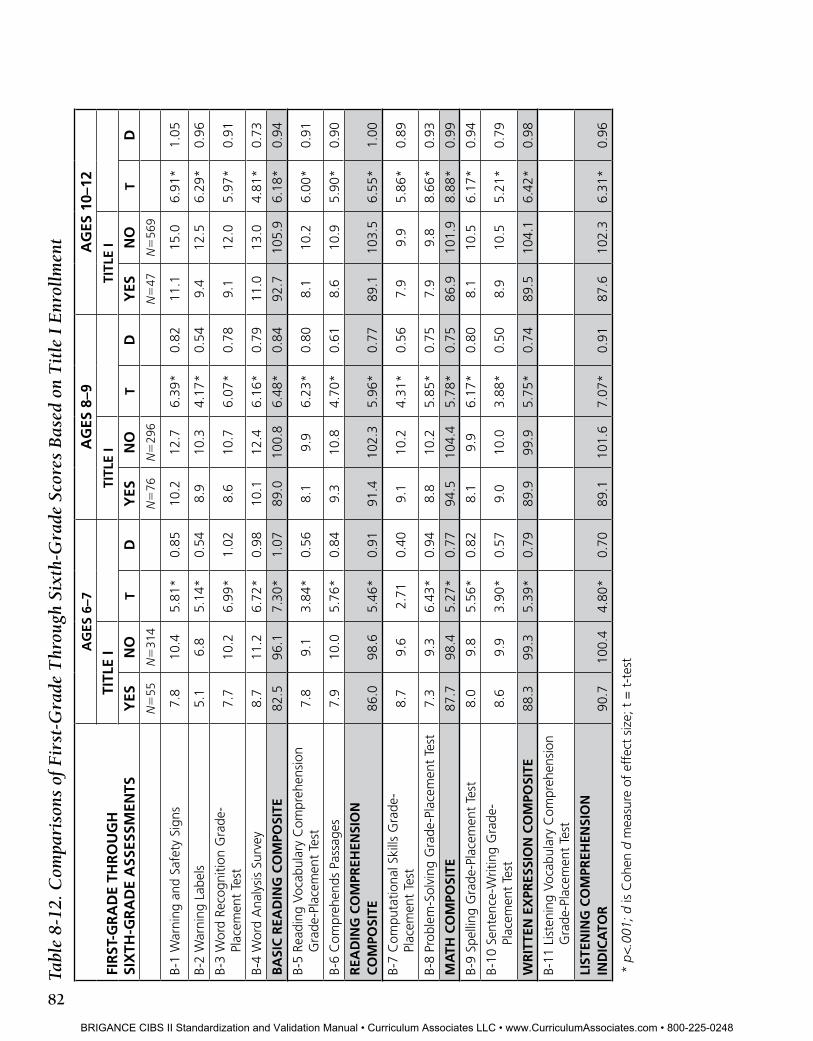
The standardization study included assessing students from various groups where differences in CIBS II scores would be expected based on known group differences. If measuring the intended constructs, assessments should have the ability to identify strengths or weaknesses in development, academics, etc. Typically, unique patterns of performance on assessments are expected for students with and without learning problems. As shown in the analysis reported in Table 8-12, the CIBS II performance of students participating in Title I Reading and Math (Ns 5 55, 76, 47 across age) were compared to the CIBS II performance of students who were not enrolled in Title I (Ns 5 314, 296, 569 across age) via t-tests, controlling for alpha slippage. For all age levels and CIBS II assessments, students enrolled in Title I were behind those not enrolled. For most ages and CIBS II assessments, these differences also were statistically significant. Furthermore, all effects sizes (Cohen’s d) for associated differences were moderate to large.
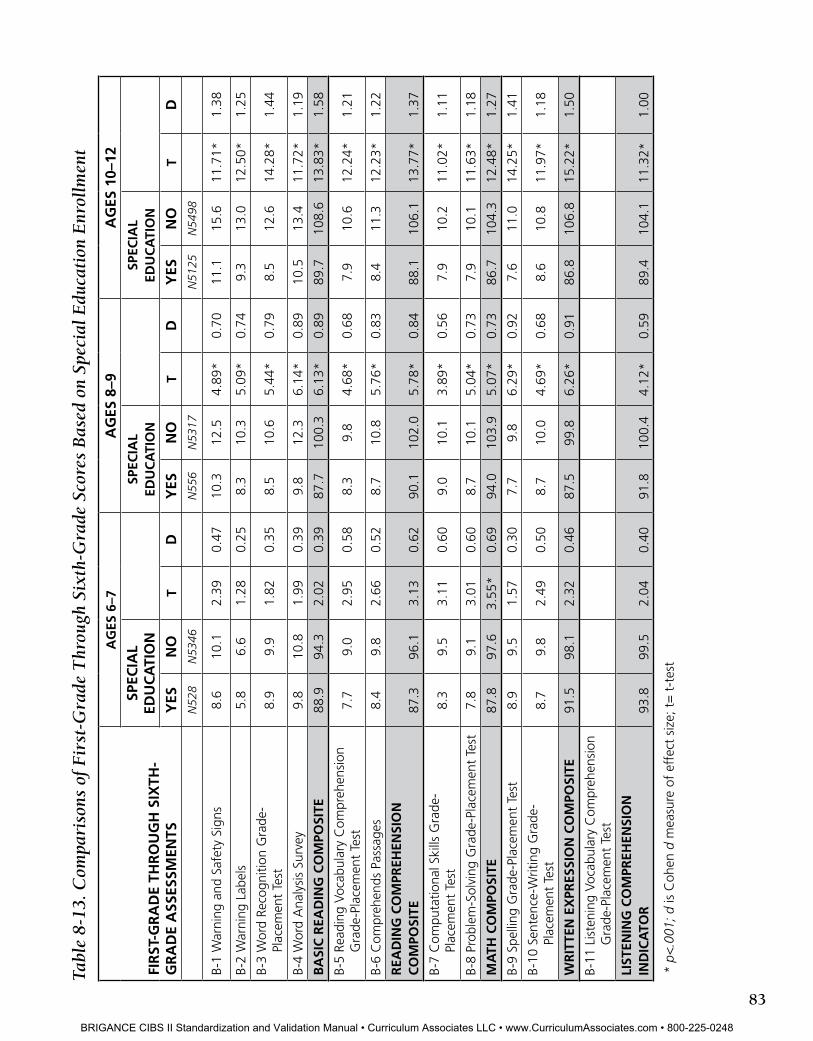
Table 8-13 compares students who were grouped according to whether or not they participated in special education services. As shown in the table, the CIBS II performance of students participating in special education services (Ns 5 28, 56, 125 across age) were compared to the CIBS II performance of students who did not receive special education services (Ns 5 314, 296, 569 across age) via t-tests, controlling for alpha slippage. Because of the diversity of this group (i.e., language impaired, learning delayed in various areas, developmentally delayed), the differences in performance are somewhat less striking statistically in terms of significance, although there is a consistent trend toward lower performance in the special education group. Even more revealing of this trend is the fact that the effect sizes (Cohen’s d) were moderate to large. In fact, with the oldest group, there was often a one standard deviation or greater difference between the groups.
BRIGANCE CIBS II Standardization and Validation Manual • Curriculum Associates LLC • www.CurriculumAssociates.com • 800-225-0248
82
Tabl
e 8-
12. C
ompa
riso
ns o
f F
irst
-Gra
de T
hrou
gh S
ixth
-Gra
de S
core
s B
ased
on
Tit
le I
Enr
ollm
ent
FiR
st-G
Ra
de
tHR
oU
GH
si
xtH
-GR
ad
e a
sses
smen
ts
aG
es 6
–7a
Ges
8–9
aG
es 1
0–12
titL
e i
titL
e i
titL
e i
Yes
no
td
Yes
no
td
Yes
no
td
N
555
N5
314
N5
76N
529
6
N
547
N5
569
B-1
War
ning
and
Saf
ety
Sign
s7.
810
.45.
81*
0.85
10.2
12.7
6.39
*0.
8211
.115
.06.
91*
1.05
B-2
War
ning
Lab
els
5.1
6.8
5.14
*0.
548.
910
.34.
17*
0.54
9.4
12.5
6.29
*0.
96
B-3
Wor
d Re
cogn
ition
Gra
de-
Plac
emen
t Te
st7.
710
.26.
99*
1.02
8.6
10.7
6.07
*0.
789.
112
.05.
97*
0.91
B-4
Wor
d A
naly
sis
Surv
ey8.
711
.26.
72*
0.98
10.1
12.4
6.16
*0.
7911
.013
.04.
81*
0.73
Ba
siC
Rea
din
G C
om
posi
te82
.596
.17.
30*
1.07
89.0
100.
86.
48*
0.84
92.7
105.
96.
18*
0.94
B-5
Read
ing
Voca
bula
ry C
ompr
ehen
sion
G
rade
-Pla
cem
ent
Test
7.8
9.1
3.84
*0.
568.
19.
96.
23*
0.80
8.1
10.2
6.00
*0.
91
B-6
Com
preh
ends
Pas
sage
s7.
910
.05.
76*
0.84
9.3
10.8
4.70
*0.
618.
610
.95.
90*
0.90
Rea
din
G C
om
pReH
ensi
on
C
om
posi
te86
.098
.65.
46*
0.91
91.4
102.
35.
96*
0.77
89.1
103.
56.
55*
1.00
B-7
Com
puta
tiona
l Ski
lls G
rade
- Pl
acem
ent
Test
8.7
9.6
2.71
0.40
9.1
10.2
4.31
*0.
567.
99.
95.
86*
0.89
B-8
Prob
lem
-Sol
ving
Gra
de-P
lace
men
t Te
st7.
39.
36.
43*
0.94
8.8
10.2
5.85
*0.
757.
99.
88.
66*
0.93
ma
tH C
om
posi
te87
.798
.45.
27*
0.77
94.5
104.
45.
78*
0.75
86.9
101.
98.
88*
0.99
B-9
Spel
ling
Gra
de-P
lace
men
t Te
st8.
09.
85.
56*
0.82
8.1
9.9
6.17
*0.
808.
110
.56.
17*
0.94
B-10
Sen
tenc
e-W
ritin
g G
rade
- Pl
acem
ent
Test
8.6
9.9
3.90
*0.
579.
010
.03.
88*
0.50
8.9
10.5
5.21
*0.
79
WR
itte
n e
xpR
essi
on
Co
mpo
site
88.3
99.3
5.39
*0.
7989
.999
.95.
75*
0.74
89.5
104.
16.
42*
0.98
B-11
Lis
teni
ng V
ocab
ular
y C
ompr
ehen
sion
G
rade
-Pla
cem
ent
Test
List
enin
G C
om
pReH
ensi
on
in
diC
ato
R90
.710
0.4
4.80
*0.
7089
.110
1.6
7.07
*0.
9187
.610
2.3
6.31
*0.
96
* p<
.001
; d is
Coh
en d
mea
sure
of
effe
ct s
ize;
t =
t-t
est
BRIGANCE CIBS II Standardization and Validation Manual • Curriculum Associates LLC • www.CurriculumAssociates.com • 800-225-0248
83
Tabl
e 8-
13. C
ompa
riso
ns o
f F
irst
-Gra
de T
hrou
gh S
ixth
-Gra
de S
core
s B
ased
on
Spec
ial E
duca
tion
Enr
ollm
ent
FiR
st-G
Ra
de
tHR
oU
GH
six
tH-
GR
ad
e a
sses
smen
ts
aG
es 6
–7a
Ges
8–9
aG
es 1
0–12
speC
iaL
edU
Ca
tio
n
sp
eCia
L ed
UC
ati
on
speC
iaL
edU
Ca
tio
n
Y
esn
ot
dY
esn
ot
dY
esn
ot
d
N52
8N
5346
N55
6N
5317
N51
25N
5498
B-1
War
ning
and
Saf
ety
Sign
s8.
610
.12.
390.
4710
.312
.54.
89*
0.70
11.1
15.6
11.7
1*1.
38
B-2
War
ning
Lab
els
5.8
6.6
1.28
0.25
8.3
10.3
5.09
*0.
749.
313
.012
.50*
1.25
B-3
Wor
d Re
cogn
ition
Gra
de-
Plac
emen
t Te
st8.
99.
91.
820.
358.
510
.65.
44*
0.79
8.5
12.6
14.2
8*1.
44
B-4
Wor
d A
naly
sis
Surv
ey9.
810
.81.
990.
399.
812
.36.
14*
0.89
10.5
13.4
11.7
2*1.
19
Ba
siC
Rea
din
G C
om
posi
te88
.994
.32.
020.
3987
.710
0.3
6.13
*0.
8989
.710
8.6
13.8
3*1.
58
B-5
Read
ing
Voca
bula
ry C
ompr
ehen
sion
G
rade
-Pla
cem
ent
Test
7.7
9.0
2.95
0.58
8.3
9.8
4.68
*0.
687.
910
.612
.24*
1.21
B-6
Com
preh
ends
Pas
sage
s8.
49.
82.
660.
528.
710
.85.
76*
0.83
8.4
11.3
12.2
3*1.
22
Rea
din
G C
om
pReH
ensi
on
C
om
posi
te87
.396
.13.
130.
6290
.110
2.0
5.78
*0.
8488
.110
6.1
13.7
7*1.
37
B-7
Com
puta
tiona
l Ski
lls G
rade
- Pl
acem
ent
Test
8.3
9.5
3.11
0.60
9.0
10.1
3.89
*0.
567.
910
.211
.02*
1.11
B-8
Prob
lem
-Sol
ving
Gra
de-P
lace
men
t Te
st7.
89.
13.
010.
608.
710
.15.
04*
0.73
7.9
10.1
11.6
3*1.
18
ma
tH C
om
posi
te87
.897
.63.
55*
0.69
94.0
103.
95.
07*
0.73
86.7
104.
312
.48*
1.27
B-9
Spel
ling
Gra
de-P
lace
men
t Te
st8.
99.
51.
570.
307.
79.
86.
29*
0.92
7.6
11.0
14.2
5*1.
41
B-10
Sen
tenc
e-W
ritin
g G
rade
- Pl
acem
ent
Test
8.7
9.8
2.49
0.50
8.7
10.0
4.69
*0.
688.
610
.811
.97*
1.18
WR
itte
n e
xpR
essi
on
Co
mpo
site
91.5
98.1
2.32
0.46
87.5
99.8
6.26
*0.
9186
.810
6.8
15.2
2*1.
50
B-11
Lis
teni
ng V
ocab
ular
y C
ompr
ehen
sion
G
rade
-Pla
cem
ent
Test
List
enin
G C
om
pReH
ensi
on
in
diC
ato
R93
.899
.52.
040.
4091
.810
0.4
4.12
*0.
5989
.410
4.1
11.3
2*1.
00
* p<
.001
; d is
Coh
en d
mea
sure
of
effe
ct s
ize;
t=
t-t
est
BRIGANCE CIBS II Standardization and Validation Manual • Curriculum Associates LLC • www.CurriculumAssociates.com • 800-225-0248
84
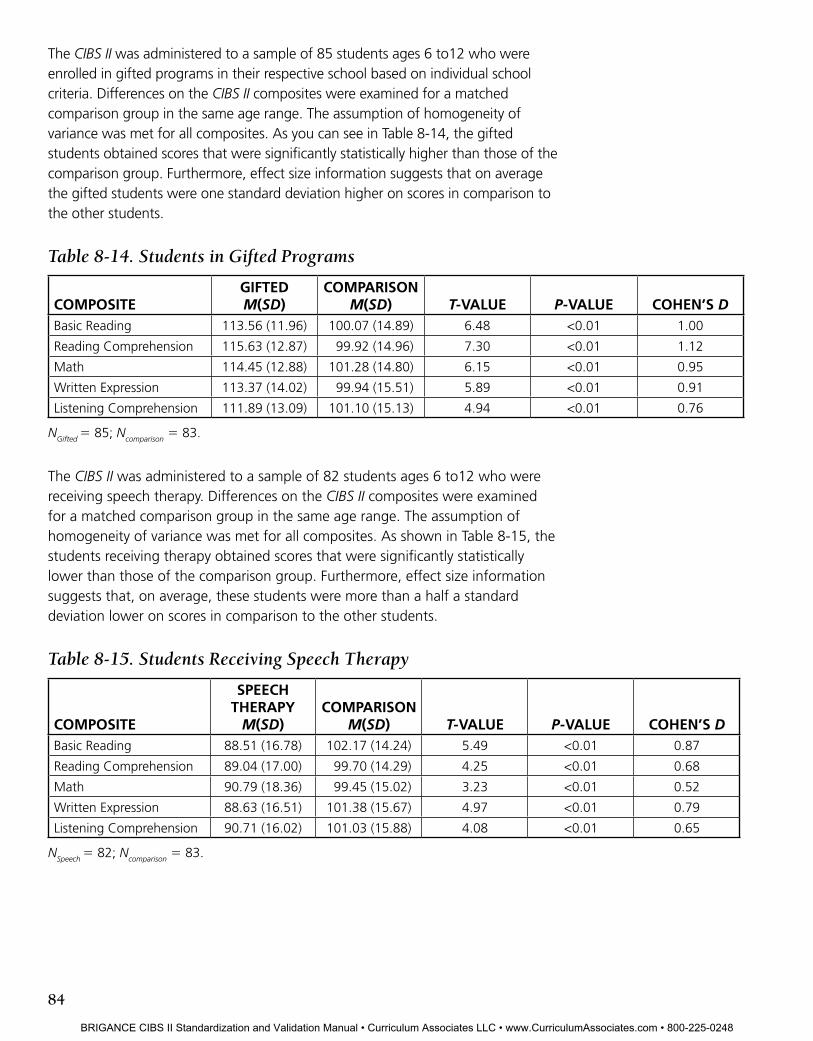
The CIBS II was administered to a sample of 85 students ages 6 to12 who were enrolled in gifted programs in their respective school based on individual school criteria. Differences on the CIBS II composites were examined for a matched comparison group in the same age range. The assumption of homogeneity of variance was met for all composites. As you can see in Table 8-14, the gifted students obtained scores that were significantly statistically higher than those of the comparison group. Furthermore, effect size information suggests that on average the gifted students were one standard deviation higher on scores in comparison to the other students.
Table 8-14. Students in Gifted Programs
Composite GiFtedM(SD)
CompaRisonM(SD) T-vaLUe P-vaLUe CoHen’s D
Basic Reading 113.56 (11.96) 100.07 (14.89) 6.48 <0.01 1.00
Reading Comprehension 115.63 (12.87) 99.92 (14.96) 7.30 <0.01 1.12
Math 114.45 (12.88) 101.28 (14.80) 6.15 <0.01 0.95
Written Expression 113.37 (14.02) 99.94 (15.51) 5.89 <0.01 0.91
Listening Comprehension 111.89 (13.09) 101.10 (15.13) 4.94 <0.01 0.76
NGifted 5 85; Ncomparison 5 83.
The CIBS II was administered to a sample of 82 students ages 6 to12 who were receiving speech therapy. Differences on the CIBS II composites were examined for a matched comparison group in the same age range. The assumption of homogeneity of variance was met for all composites. As shown in Table 8-15, the students receiving therapy obtained scores that were significantly statistically lower than those of the comparison group. Furthermore, effect size information suggests that, on average, these students were more than a half a standard deviation lower on scores in comparison to the other students.
Table 8-15. Students Receiving Speech Therapy
Composite
speeCH tHeRapY
M(SD)CompaRison
M(SD) T-vaLUe P-vaLUe CoHen’s DBasic Reading 88.51 (16.78) 102.17 (14.24) 5.49 <0.01 0.87
Reading Comprehension 89.04 (17.00) 99.70 (14.29) 4.25 <0.01 0.68
Math 90.79 (18.36) 99.45 (15.02) 3.23 <0.01 0.52
Written Expression 88.63 (16.51) 101.38 (15.67) 4.97 <0.01 0.79
Listening Comprehension 90.71 (16.02) 101.03 (15.88) 4.08 <0.01 0.65
NSpeech 5 82; Ncomparison 5 83.
BRIGANCE CIBS II Standardization and Validation Manual • Curriculum Associates LLC • www.CurriculumAssociates.com • 800-225-0248
85
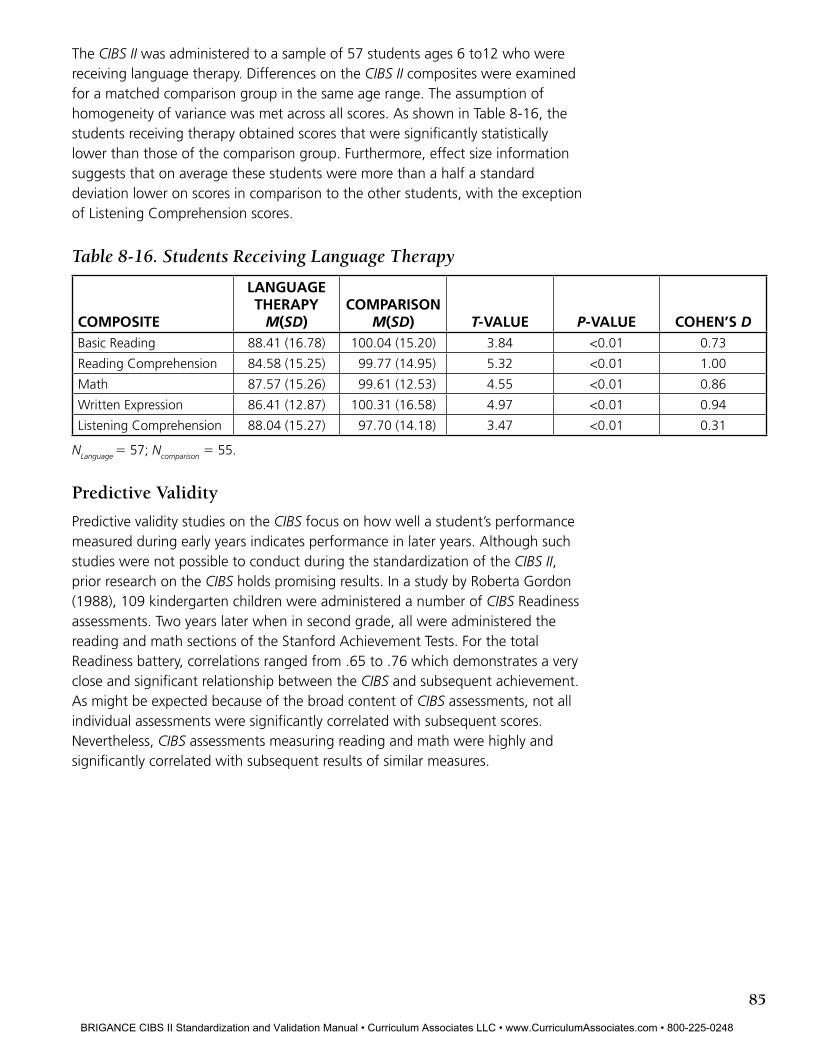
The CIBS II was administered to a sample of 57 students ages 6 to12 who were receiving language therapy. Differences on the CIBS II composites were examined for a matched comparison group in the same age range. The assumption of homogeneity of variance was met across all scores. As shown in Table 8-16, the students receiving therapy obtained scores that were significantly statistically lower than those of the comparison group. Furthermore, effect size information suggests that on average these students were more than a half a standard deviation lower on scores in comparison to the other students, with the exception of Listening Comprehension scores.
Table 8-16. Students Receiving Language Therapy
Composite
LanGUaGe tHeRapY
M(SD)CompaRison
M(SD) T-vaLUe P-vaLUe CoHen’s DBasic Reading 88.41 (16.78) 100.04 (15.20) 3.84 <0.01 0.73
Reading Comprehension 84.58 (15.25) 99.77 (14.95) 5.32 <0.01 1.00
Math 87.57 (15.26) 99.61 (12.53) 4.55 <0.01 0.86
Written Expression 86.41 (12.87) 100.31 (16.58) 4.97 <0.01 0.94
Listening Comprehension 88.04 (15.27) 97.70 (14.18) 3.47 <0.01 0.31
NLanguage 5 57; Ncomparison 5 55.
Predictive validity
Predictive validity studies on the CIBS focus on how well a student’s performance measured during early years indicates performance in later years. Although such studies were not possible to conduct during the standardization of the CIBS II, prior research on the CIBS holds promising results. In a study by Roberta Gordon (1988), 109 kindergarten children were administered a number of CIBS Readiness assessments. Two years later when in second grade, all were administered the reading and math sections of the Stanford Achievement Tests. For the total Readiness battery, correlations ranged from .65 to .76 which demonstrates a very close and significant relationship between the CIBS and subsequent achievement. As might be expected because of the broad content of CIBS assessments, not all individual assessments were significantly correlated with subsequent scores. Nevertheless, CIBS assessments measuring reading and math were highly and significantly correlated with subsequent results of similar measures.
BRIGANCE CIBS II Standardization and Validation Manual • Curriculum Associates LLC • www.CurriculumAssociates.com • 800-225-0248
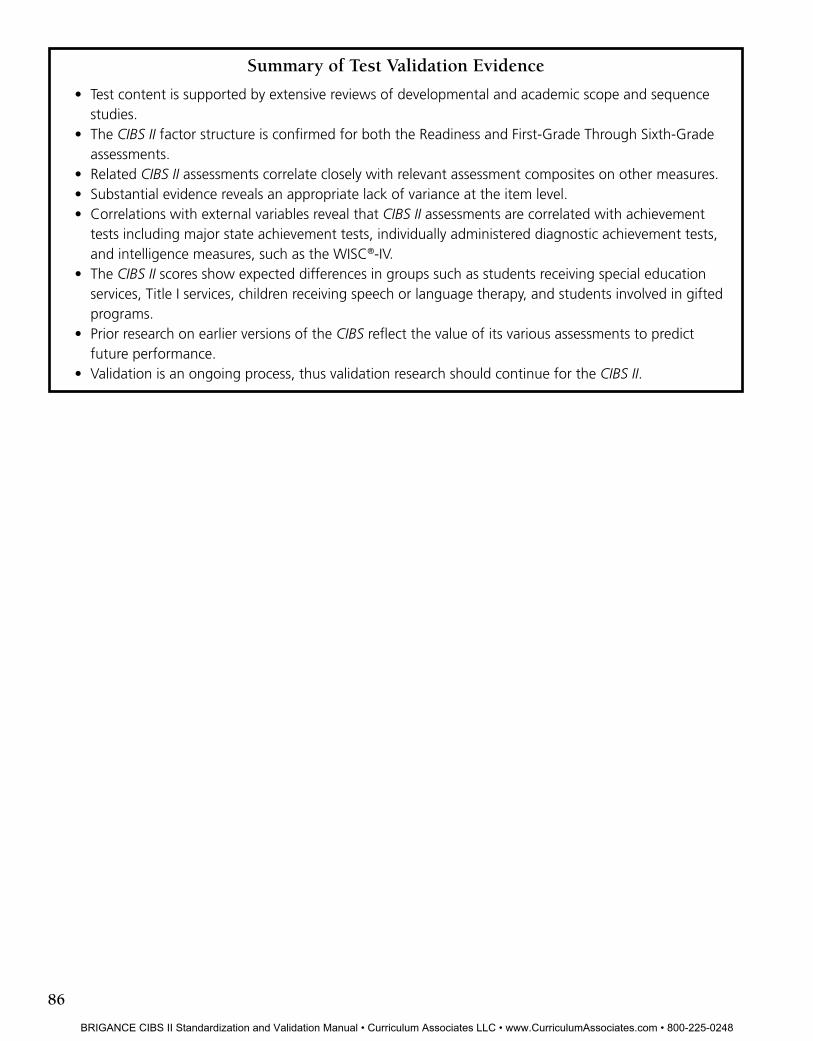
86
summary of test validation evidence
• Test content is supported by extensive reviews of developmental and academic scope and sequence studies.
• The CIBS II factor structure is confirmed for both the Readiness and First-Grade Through Sixth-Grade assessments.
• Related CIBS II assessments correlate closely with relevant assessment composites on other measures. • Substantial evidence reveals an appropriate lack of variance at the item level.• Correlations with external variables reveal that CIBS II assessments are correlated with achievement
tests including major state achievement tests, individually administered diagnostic achievement tests, and intelligence measures, such as the WISC®-IV.
• The CIBS II scores show expected differences in groups such as students receiving special education services, Title I services, children receiving speech or language therapy, and students involved in gifted programs.
• Prior research on earlier versions of the CIBS reflect the value of its various assessments to predict future performance.
• Validation is an ongoing process, thus validation research should continue for the CIBS II.
BRIGANCE CIBS II Standardization and Validation Manual • Curriculum Associates LLC • www.CurriculumAssociates.com • 800-225-0248