Embed Size (px)
Citation preview
savills.co.kr/research 01
BriefingSeoul office sector Q1 2013
Savills World Research Korea
In Q1 the Seoul office building vacancy rate rose by 1.6 percentage points (ppts) from the previous quarter, to 9.7% with the completion of State Gwanghwamun in the CBD and Asterium Seoul in Dongjadong District 4.
Major tenants taking up space in Q1 include Ssangyong Cement and its affiliates, which relocated due to remodelling of their company building, and NHN and Woori Card, which both opened offices for their newly created organisations.
“In Q1/2013, net absorption for Seoul prime office buildings was positive at 28,000 sq m, indicating an increase in demand. However, the vacancy rate also rose to 9.7% with the release of two new buildings. The case of sale and lease back has shown in Q1/2013. There is a possibility that the prime office cap rate will slide further from the current level if the benchmark interest rate and interest rates of real estate secured loans continue to fall.”
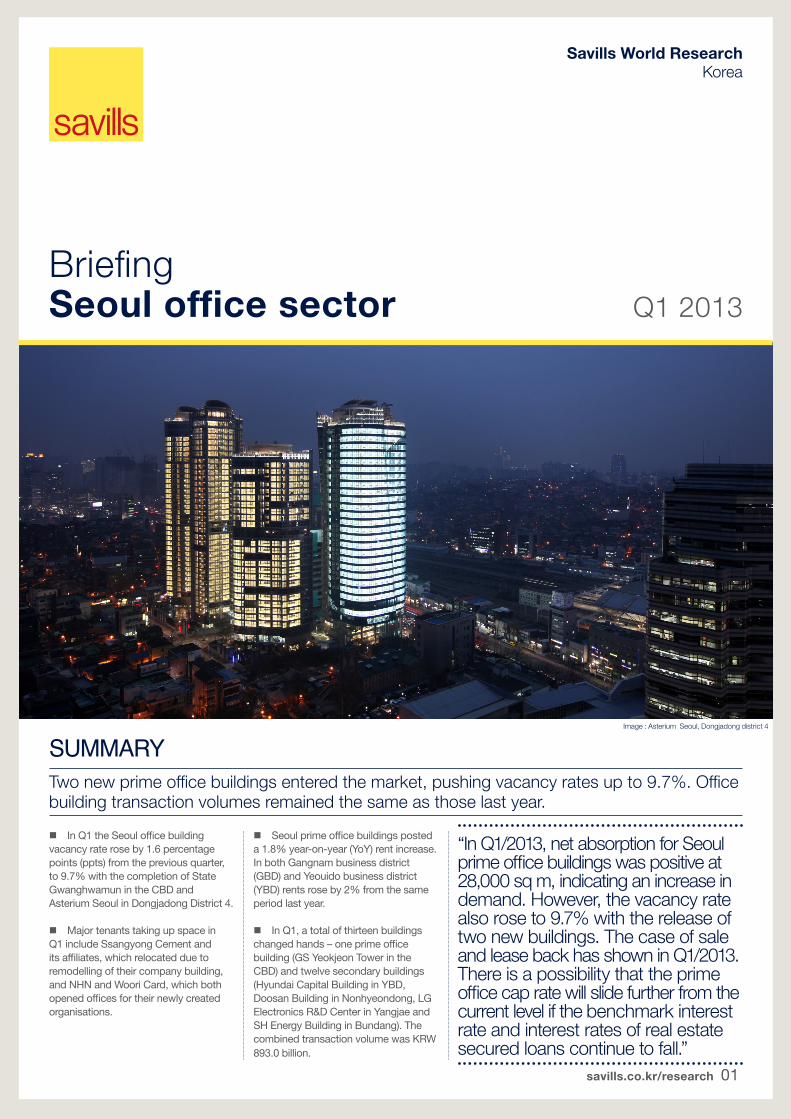
Image : Asterium Seoul, Dongjadong district 4
Seoul prime office buildings posted a 1.8% year-on-year (YoY) rent increase. In both Gangnam business district (GBD) and Yeouido business district (YBD) rents rose by 2% from the same period last year.
In Q1, a total of thirteen buildings changed hands – one prime office building (GS Yeokjeon Tower in the CBD) and twelve secondary buildings (Hyundai Capital Building in YBD, Doosan Building in Nonhyeondong, LG Electronics R&D Center in Yangjae and SH Energy Building in Bundang). The combined transaction volume was KRW 893.0 billion.
SUMMARYTwo new prime office buildings entered the market, pushing vacancy rates up to 9.7%. Office building transaction volumes remained the same as those last year.

Briefing | Seoul office sector Q1 2013
savills.co.kr/research 02
TABLE 1
Monthly rent and vacancy rates by district, Q1/2013
Source: Savills Korea
District
Average rent(KRW per
3.3058 sq m, GLA based)
Average rent(KRW per
3.3058 sq m, NLA based)
YoY increase (%)
Vacancy rate (%)
CBD 94,600 166,700 1.6 15.1
GBD 83,900 163,900 2.0 2.6
YBD 73,700 153,900 2.1 9.5
Overall Seoul average 87,300 163,500 1.8 9.7
SupplyIn Q1/2013, State Gwanghwamun and Asterium Seoul (Dongjadong District 4) were completed. As of March, the two buildings are being marketed to tenants. At the Asterium Seoul, for which a transaction is being negotiated, there is the possibility that Dongbu Corporation will lease back a portion of the office space.
In 2012, approximately 278,000 sq m of prime office space was provided (The K Twin Towers, Two IFC and Three IFC), while a total of six new buildings, with a combined GFA of 429,000 sq m, are expected in 2013.
In 2013, 61% of the 429,000 sq m will be located in the CBD. However, if Three IFC launches lease marketing, YBD will account for 56% of new prime office supply in 2013, as FKI Tower, also
TABLE 3
Forecast supply, Q2/2013-Q4/2013
Source: Savills Korea
District Building name Planned completion GFA (sq m) Floors Major tenants
CBD Sunhwadong N Tower Q2/2013 51,377 B8/F–27/F N/A
CBD Doryeom District Zone 24 Q3/2013 38,952 B7/F–22/F Pre-leases signed for
most of the office area
YBD FKI Tower Q3/2013 168,682 B6/F–50/F5%-10% of office area
to be used by FKI’s affiliates
CBD Yonhap Media Center Q4/2013 46,962 B4/F–17/F 70% to be used by
Yonhap News
Total 305,973 sq m
TABLE 2
Office building supply, Q1/2013
District Building name Completion date GFA (sq m) Floors
CBD State Gwanghwamun Jan 2013 40,991 B6/F–23/F
CBD Asterium Seoul Jan 2013 81,852 B9/F–30/F
Others – Jamsil Korea Veterans Jamsil Tower Mar 2013 99,141 B9/F–30/F
Others – YangjaeLG Electronics Gangnam R&D
CenterMar 2013 39,401 B6/F–19/F
Total 261,385 sq m
Source: Savills Korea
in YBD, is slated for completion at the end of 2013.
The office building planned in Doryeom District Zone 24 in the CBD, which is expected to be completed in Q3, has pre-leased most of its office area. Meanwhile, approximately 70% of Yonhap
Media Center, whose completion is scheduled for Q4, will be for self use and the remaining 30% will be leased out.
The completion of FKI Tower in YBD is slated for Q3/2013, and FKI and related companies will lease 5% to 10% of the office space.
GBD, which saw no new supply in 2012, also has no new office supply planned for 2013. Although there have been no new prime office buildings completed in major office districts in Q1, the LG Electronics Gangnam R&D Center (Daewoo Dogok Building) was completed near Yangjae station in March. LG Electronics will use the building for its own office purposes after acquisition. In addition, the Korean Veterans Association Tower will be completed in 2013 and the Samsung SDS office building in 2014. The two buildings are located in Jamsil near GBD and both have a GFA of 99,000 sq m. Samsung SDS will gradually relocate to its new office building in Jamsil in the two years after completion.
Demand and vacancy rateThe Korean economy, employment rate and office market will be affected by the ongoing European financial crisis, and the length of time it will take for the advanced economies to recover.

Q1 2013
savills.co.kr/research 03
Briefing | Seoul office sector
Year 2010 2011 2012 2013F 2014F
Period 1H 2H 1H 2H 1H 2H 1H 2H 1H 2H
Economic growth rate
(%)
8.1 4.7 3.9 3.5 2.6 1.5 1.8 3.3 N/A N/A
6.3 3.7 2.0 2.6 3.8
TABLE 4
Economic growth rate, 2010-2014F
Source: Savills Korea, Bank of Korea (BOK)
In 2013, Korean exports are projected to expand by 4.1% YoY, in anticipation of an increase in demand following the economic recovery of the US and China, together with the growth of emerging economies. In February 2013, the number of employees in the financial and insurance sectors, which is closely related to office demand, decline to 835,000, representing a 0.3% drop from the previous year.
With the net absorption positive at 28,000 sq m for Seoul prime office buildings, all the three major office districts enjoyed increased demand in Q1/2013.
The CBD recorded 11,500 sq m of net absorption, mainly thanks to demand from newly established corporate organisations.
In GBD, 11,200 sq m was absorbed even though the vacancy rate was below 3%.
In YBD, the net absorption reached 5,300 sq m as the newly completed Two IFC filled its vacant space and tenants from other districts moved to the area.
Even though the overall Q1 net absorption was positive, the vacancy rate of Seoul prime office buildings rose by 1.6% to 9.7% from the previous quarter. GBD and YBD posted a decline in their vacancy rates from the previous quarter, with companies creating new organisations and tenants relocating from other districts, but the large supply of new office space in the CBD pushed up the overall vacancy rate in the Seoul office market.
The CBD vacancy rate rose by 3.7 ppts from the previous quarter to 15.1%, as a result of the supply of new office space from State Gwanghwamun and Asterium Seoul, which were put on the market in Q1.
Ssangyong Cement and its affiliates relocated from Ssangyong Building in Jeodong, Junggu due
GRAPH 1
Trend in the number of employees in the financial and insurance sectors, Mar 2004-Mar 2013
Source: Savills Korea
GRAPH 2
Net absorption, Q1/2008–Q1/2013
Source: Savills Korea
680
700
720
740
760
780
800
820
840
860
880
Mar-04 Mar-05 Mar-06 Mar-07 Mar-08 Mar-09 Mar-10 Mar-11 Mar-12 Mar-13
No.
em
plo
yed
('00
0)
-200
-150
-100
-50
-
50
100
150
200
250
300
Q1 Q2 Q3 Q4 Q1 Q2 Q3 Q4 Q1 Q2 Q3 Q4 Q1 Q2 Q3 Q4 Q1 Q2 Q3 Q4 Q1
2008 2009 2010 2011 2012 2013
sq m
('00
0)
CBD GBD YBD

Q1 2013
savills.co.kr/research 04
Briefing | Seoul office sector
to remodelling, to Pine Avenue in the CBD to fill 15,000 sq m in the building. Woori Card leased 8,300 sq m in The K Twin Towers, after spun off from Woori Bank. As Daelim leased in KCCI and Kyobo Life Insurance expanded its office in Kyobo Building, 14,800 sq m of vacancy was absorbed. Meanwhile, Renault Samsung Motors vacated approximately 5,000 sq m in HSBC Building as the automobile company moved to RSM Tower, its own company building constructed in Gasan Digital Complex. The Bank of New York Mellon Corporation added vacancy to Youngpoong Building when it relocated to One IFC in YBD.
GBD, which posted a vacancy rate in the low 3% range in the previous quarter, the lowest of all major office districts, also saw its vacancy rate drop by 0.5 of a ppt to 2.6% in Q1/2013. This is attributable to companies establishing new organisations and tenants relocating from secondary to prime office buildings.
NHN Camp Mobile and NHN Business Platform filled 7,400 sq m of vacant space when they leased in Nara Bank Building and Capital Tower respectively. Glass Tower had 7,500 sq m of vacancy by Samsung Life Insurance, which relocated from Union Steel Building. Golfzon vacated 4,000 sq m in Haesung 2 Building as it acquired and relocated to Shinil Engineering’s office building in Cheongdamdong. Posri moved to Posri Building, a secondary building, creating vacancy in Golden Tower.
In YBD, the vacancy rate was 9.5%, a level similar to that of the previous quarter.
One IFC achieved a 98% occupancy rate as Citrix moved in from ASEM Tower in GBD. Meanwhile, Two IFC has filled 15% of its office area by attracting Korean Medical Center, which used to lease in the Federation
GRAPH 3
Seoul prime office building vacancy rates, Q1/2002–Q1/2013
Source: Savills Korea
GRAPH 4
Vacancy absorption, Q1/2013
Source: Savills Korea
GRAPH 5
Prime office building vacancy rates, Q2/2012–Q1/2013
Source: Savills Korea
0%
2%
4%
6%
8%
10%
12%
14%
16%
18%
20%
Q1
Q2
Q3
Q4
Q1
Q2
Q3
Q4
Q1
Q2
Q3
Q4
Q1
Q2
Q3
Q4
Q1
Q2
Q3
Q4
Q1
Q2
Q3
Q4
Q1
Q2
Q3
Q4
Q1
Q2
Q3
Q4
Q1
Q2
Q3
Q4
Q1
Q2
Q3
Q4
Q1
Q2
Q3
Q4
Q1
2002 2003 2004 2005 2006 2007 2008 2009 2010 2011 2012 2013
CBD GBD YBD
New organisation30%
Prime to prime5%
Secondary to Prime37%
Expansion28%
-0.1
6E-16
0.1
0.2
0.3
0.4
0.5
0.6
0.7
0 Less than 5% 5~10% 10~15% Over 15%
Sur
veye
d b
uild
ings
Q2/2012 Q3/2012 Q4/2012 Q1/2013
Q1 2013
savills.co.kr/research 05
Briefing | Seoul office sector
Source: Savills Korea
TABLE 5
Major tenant relocations, Q1/2013
Previous building Current building
Tenant District Building name Leased area(sq m) District Building name Leased area
(sq m)
Ssangyong Cement and its
affiliatesCBD
Ssangyong Cement Building
N/A CBD Pine Avenue 15,000
Woori Card Newly established organisation CBD The K Twin Towers 8,300
Samsung Life Insurance GBD Union Steel 5,700 GBD Glass Tower 7,500
Citrix GBD ASEM Tower N/A YBD One IFC 2,600
The Korea Fair Trade Mediation
AgencyGBD Shinyoung
Building N/A CBD KCCI 2,200
NHNCamp Mobile Newly established organisation GBD Nara Bank
Building 4,600
NHNBusiness Platform
Newly established organisation GBD Capital Tower 2,800
Korean Medical Center YBD
Korea Trade Union
BuildingN/A YBD Two IFC 5,900
of Korean Trade Union Building, and a domestic consulting firm. However, financial and insurance companies added vacancy to the market as they either closed down their offices or reduced office space following corporate restructuring exercises.
In Q1, relocations from secondary to prime buildings accounted for the largest proportion of take-up cases (37%). New organisations and office expansions reprsented 30% and 28% of overall net absorption respectively.
Outlook for Q2In Q2, Sunhwadong N Tower (51,377 sq m) is expected to be released to the market in the CBD. However, considering tenant relocations from secondary to newly constructed prime buildings, such as the Pyeongchang Olympic Organizing Committee (relocating to Center 1) and Wilson Parking Korea (relocating to the K Twin Towers), and office demand from existing tenants with the need to expand offices, there will be no significant increase in the vacancy rate.
The completion of the Korean Veterans Association Tower(99,141 sq m) and the relocation of Samsung SDS are expected to lead to a vacancy rate increase in GBD and the overall Seoul area. However, given that Samsung SDS’s relocation is to be executed gradually over two years, and the lack of new office supply and strong demand in the area, GBD is not likely to sustain a prolonged high vacancy rate
Rents In Q1/2013, the face rent increased 0.8% from the previous quarter and 1.8% from a year earlier, as rental rates were raised by only a few buildings and by small amounts.
While the consumer price index (CPI) in Q1 is estimated to be in Source: Savills Korea
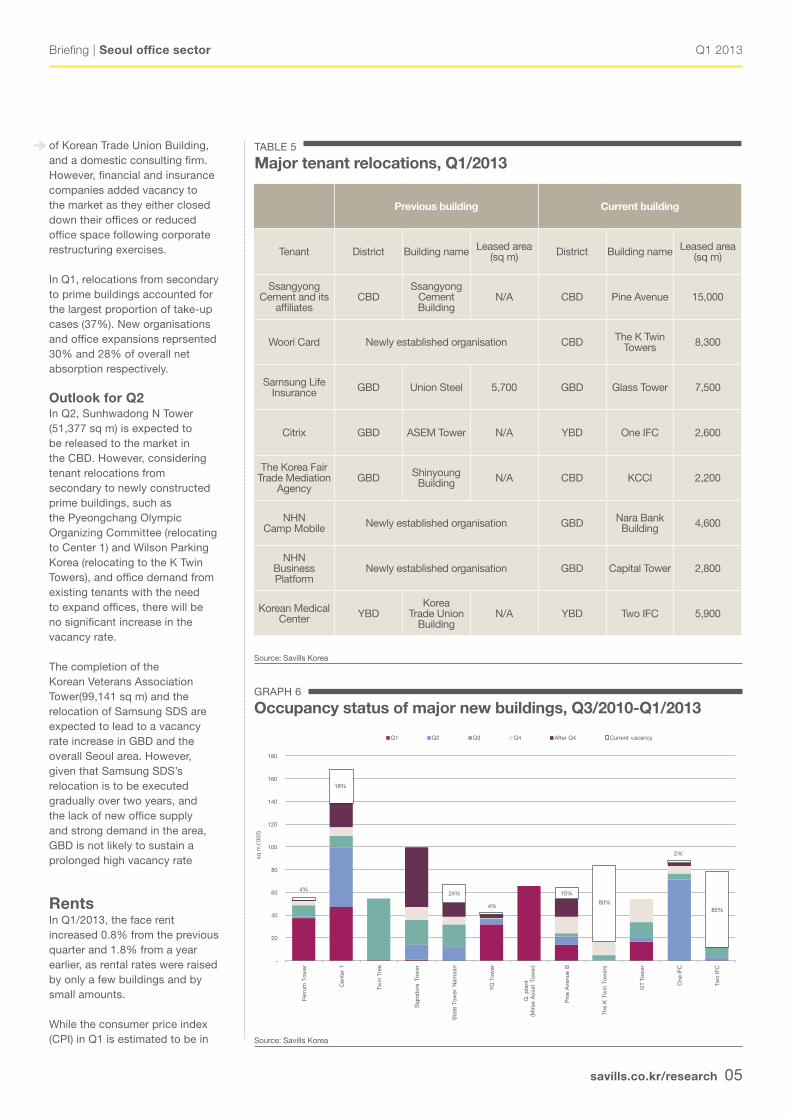
GRAPH 6
Occupancy status of major new buildings, Q3/2010-Q1/2013
4%
18%
24%
4%
15%
80%
2%
85%
-
20
40
60
80
100
120
140
160
180
Ferr
um T
ower
Cen
ter
1
Twin
Tre
e
Sig
natu
re T
ower
Sta
te T
ower
Nam
san
YG
Tow
er
G. p
lant
(Mira
e A
sset
Tow
er)
Pin
e A
venu
e B
The
K T
win
Tow
ers
GT
Tow
er
One
IFC
Two
IFC
sq m
('00
0)
Q1 Q2 Q3 Q4 After Q4 Current vacancy
Q1 2013
savills.co.kr/research 06
Briefing | Seoul office sector
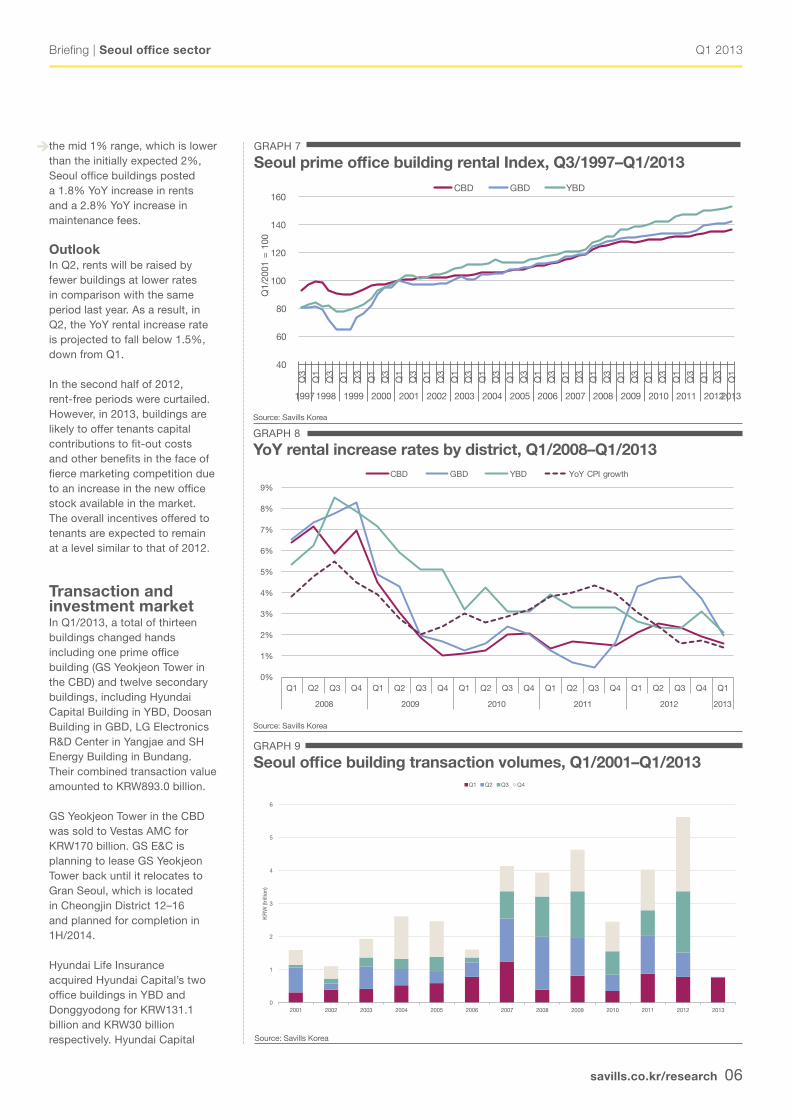
GRAPH 7
Seoul prime office building rental Index, Q3/1997–Q1/2013
Source: Savills Korea
the mid 1% range, which is lower than the initially expected 2%, Seoul office buildings posted a 1.8% YoY increase in rents and a 2.8% YoY increase in maintenance fees.
OutlookIn Q2, rents will be raised by fewer buildings at lower rates in comparison with the same period last year. As a result, in Q2, the YoY rental increase rate is projected to fall below 1.5%, down from Q1.
In the second half of 2012, rent-free periods were curtailed. However, in 2013, buildings are likely to offer tenants capital contributions to fit-out costs and other benefits in the face of fierce marketing competition due to an increase in the new office stock available in the market. The overall incentives offered to tenants are expected to remain at a level similar to that of 2012.
Transaction and investment marketIn Q1/2013, a total of thirteen buildings changed hands including one prime office building (GS Yeokjeon Tower in the CBD) and twelve secondary buildings, including Hyundai Capital Building in YBD, Doosan Building in GBD, LG Electronics R&D Center in Yangjae and SH Energy Building in Bundang. Their combined transaction value amounted to KRW893.0 billion.
GS Yeokjeon Tower in the CBD was sold to Vestas AMC for KRW170 billion. GS E&C is planning to lease GS Yeokjeon Tower back until it relocates to Gran Seoul, which is located in Cheongjin District 12–16 and planned for completion in 1H/2014.
Hyundai Life Insurance acquired Hyundai Capital’s two office buildings in YBD and Donggyodong for KRW131.1 billion and KRW30 billion respectively. Hyundai Capital
Source: Savills Korea
GRAPH 8
YoY rental increase rates by district, Q1/2008–Q1/2013
40
60
80
100
120
140
160
Q3
Q1
Q3
Q1
Q3
Q1
Q3
Q1
Q3
Q1
Q3
Q1
Q3
Q1
Q3
Q1
Q3
Q1
Q3
Q1
Q3
Q1
Q3
Q1
Q3
Q1
Q3
Q1
Q3
Q1
Q3
Q1
19971998 1999 2000 2001 2002 2003 2004 2005 2006 2007 2008 2009 2010 2011 20122013
Q1/
2001
= 1
00
CBD GBD YBD
GRAPH 9
Seoul office building transaction volumes, Q1/2001–Q1/2013
Source: Savills Korea
0
1
2
3
4
5
6
2001 2002 2003 2004 2005 2006 2007 2008 2009 2010 2011 2012 2013
KR
W (t
rillio
n)
Q1 Q2 Q3 Q4
0%
1%
2%
3%
4%
5%
6%
7%
8%
9%
Q1 Q2 Q3 Q4 Q1 Q2 Q3 Q4 Q1 Q2 Q3 Q4 Q1 Q2 Q3 Q4 Q1 Q2 Q3 Q4 Q1
2008 2009 2010 2011 2012 2013
CBD GBD YBD YoY CPI growth
Q1 2013
savills.co.kr/research 07
Briefing | Seoul office sector
Source: Savills Korea
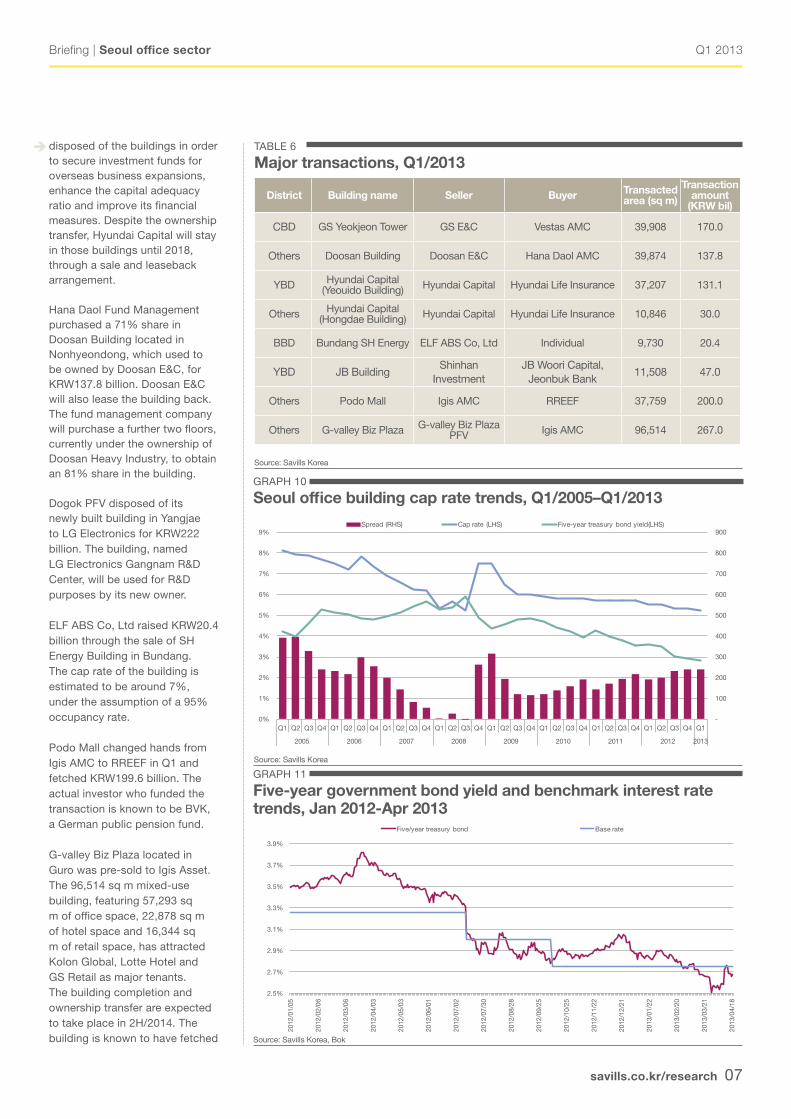
GRAPH 10
Seoul office building cap rate trends, Q1/2005–Q1/2013
GRAPH 11
Five-year government bond yield and benchmark interest rate trends, Jan 2012-Apr 2013
Source: Savills Korea, Bok
disposed of the buildings in order to secure investment funds for overseas business expansions, enhance the capital adequacy ratio and improve its financial measures. Despite the ownership transfer, Hyundai Capital will stay in those buildings until 2018, through a sale and leaseback arrangement.
Hana Daol Fund Management purchased a 71% share in Doosan Building located in Nonhyeondong, which used to be owned by Doosan E&C, for KRW137.8 billion. Doosan E&C will also lease the building back. The fund management company will purchase a further two floors, currently under the ownership of Doosan Heavy Industry, to obtain an 81% share in the building.
Dogok PFV disposed of its newly built building in Yangjae to LG Electronics for KRW222 billion. The building, named LG Electronics Gangnam R&D Center, will be used for R&D purposes by its new owner.
ELF ABS Co, Ltd raised KRW20.4 billion through the sale of SH Energy Building in Bundang. The cap rate of the building is estimated to be around 7%, under the assumption of a 95% occupancy rate.
Podo Mall changed hands from Igis AMC to RREEF in Q1 and fetched KRW199.6 billion. The actual investor who funded the transaction is known to be BVK, a German public pension fund.
G-valley Biz Plaza located in Guro was pre-sold to Igis Asset. The 96,514 sq m mixed-use building, featuring 57,293 sq m of office space, 22,878 sq m of hotel space and 16,344 sq m of retail space, has attracted Kolon Global, Lotte Hotel and GS Retail as major tenants. The building completion and ownership transfer are expected to take place in 2H/2014. The building is known to have fetched
Source: Savills Korea
TABLE 6
Major transactions, Q1/2013
District Building name Seller Buyer Transacted area (sq m)
Transaction amount
(KRW bil)
CBD GS Yeokjeon Tower GS E&C Vestas AMC 39,908 170.0
Others Doosan Building Doosan E&C Hana Daol AMC 39,874 137.8
YBD Hyundai Capital (Yeouido Building) Hyundai Capital Hyundai Life Insurance 37,207 131.1
Others Hyundai Capital (Hongdae Building) Hyundai Capital Hyundai Life Insurance 10,846 30.0
BBD Bundang SH Energy ELF ABS Co, Ltd Individual 9,730 20.4
YBD JB BuildingShinhan
InvestmentJB Woori Capital,
Jeonbuk Bank11,508 47.0
Others Podo Mall Igis AMC RREEF 37,759 200.0
Others G-valley Biz Plaza G-valley Biz Plaza PFV Igis AMC 96,514 267.0
-
100
200
300
400
500
600
700
800
900
0%
1%
2%
3%
4%
5%
6%
7%
8%
9%
Q1 Q2 Q3 Q4 Q1 Q2 Q3 Q4 Q1 Q2 Q3 Q4 Q1 Q2 Q3 Q4 Q1 Q2 Q3 Q4 Q1 Q2 Q3 Q4 Q1 Q2 Q3 Q4 Q1 Q2 Q3 Q4 Q1
2005 2006 2007 2008 2009 2010 2011 2012 2013
Spread (RHS) Cap rate (LHS) Five-year treasury bond yield(LHS)
2.5%
2.7%
2.9%
3.1%
3.3%
3.5%
3.7%
3.9%
2012
/01/
05
2012
/02/
06
2012
/03/
06
2012
/04/
03
2012
/05/
03
2012
/06/
01
2012
/07/
02
2012
/07/
30
2012
/08/
28
2012
/09/
25
2012
/10/
25
2012
/11/
22
2012
/12/
21
2013
/01/
22
2013
/02/
20
2013
/03/
21
2013
/04/
18
Five/year treasury bond Base rate
Q1 2013
savills.co.kr/research 08
Briefing | Seoul office sector
JoAnn HongDirectorKorea+82 2 2124 [email protected]
Savills Korea
Please contact us for further information
Savills plcSavills is a leading global real estate service provider listed on the London Stock Exchange. The company established in 1855, has a rich heritage with unrivalled growth. It is a company that leads rather than follows, and now has over 500 offices and associates throughout the Americas, Europe, Asia Pacific, Africa and the Middle East.
This report is for general informative purposes only. It may not be published, reproduced or quoted in part or in whole, nor may it be used as a basis for any contract, prospectus, agreement or other document without prior consent. Whilst every effort has been made to ensure its accuracy, Savills accepts no liability whatsoever for any direct or consequential loss arising from its use. The content is strictly copyright and reproduction of the whole or part of it in any form is prohibited without written permission from Savills Research.
Savills Research
Simon SmithSenior DirectorAsia Pacific+852 2842 [email protected]
Grace KoDirector, CRESLeasing Services+82 2 2124 [email protected]
Seunghan LeeDirector, Leasing &Marketing, Development Sales+82 2 2124 [email protected]
Sue LeeDirectorTenant Rep.+82 2 2124 [email protected]
Crystal LeeDirectorInvestment Advisory+82 2 2124 [email protected]
Youngtaek KimVice PresidentKorea+82 2 2124 [email protected]
Christian F. Mancini Chief Executive OfficerNorth East Asia+82 2 2124 [email protected]
approximately KRW267 billion.
For 2012, the prime office building cap rate is estimated to be in the low to mid-5% range and secondary buildings in the 6% to 8% range.
BoK lowered the benchmark interest rate by 0.25 of a ppt to 2.75% on 11 October 2012 and there is a high possibility of an additional interest rate cut. The five-year government bond yield dropped to 2.7%, which is lower than the benchmark interest rate as of March 2013, widening the spread with the cap rate to 250 basis points. As such, it is likely that the cap rate will further decline. In 2013, continuing the trend from 2012, for stabilised investment-grade office buildings it is forecast that demand will outpace supply. As such, there are good prospects
for active transactions for properties other than non-core office buildings, with investors taking a greater interest in secondary buildings, hotel developments, retail facilities and the pre-purchase of development projects.
The cap rate of prime office buildings is projected to fall to the low 5% range in 2013, but small- and medium-sized buildings will see their cap rates remain between 6% and 8%.
Interest rates of loans secured by real estate also continued to decline over 2012. For prime office buildings, the rate is estimated at the low 4% level and there is talk of a further decrease. The downward trend of interest rates is likely to lead to lower cap rates, pushing up transaction prices of office buildings.
Q1 2013
savills.co.kr/research 09
Briefing | Seoul office sector
Appendix Overview of the Seoul office market and Savills Korea office survey
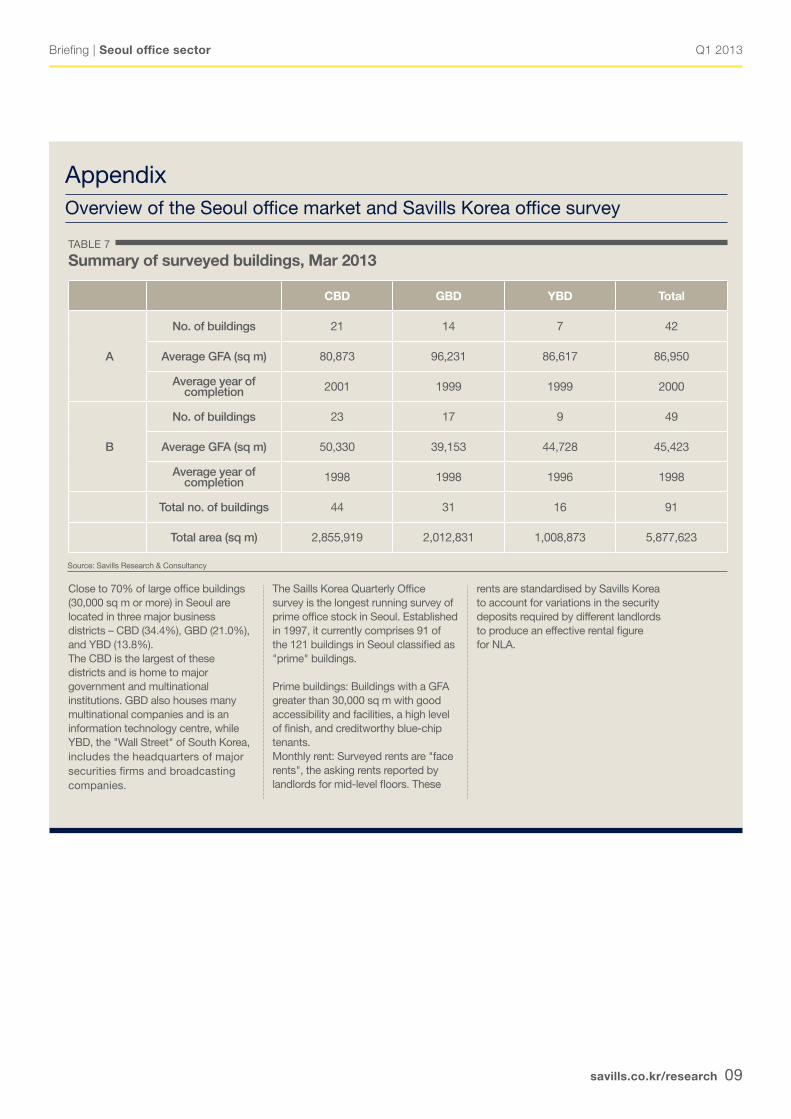
Close to 70% of large office buildings (30,000 sq m or more) in Seoul are located in three major business districts – CBD (34.4%), GBD (21.0%), and YBD (13.8%). The CBD is the largest of these districts and is home to major government and multinational institutions. GBD also houses many multinational companies and is an information technology centre, while YBD, the "Wall Street" of South Korea, includes the headquarters of major securities firms and broadcasting companies.
TABLE 7
Summary of surveyed buildings, Mar 2013
Source: Savills Research & Consultancy
The Saills Korea Quarterly Office survey is the longest running survey of prime office stock in Seoul. Established in 1997, it currently comprises 91 of the 121 buildings in Seoul classified as "prime" buildings.
Prime buildings: Buildings with a GFA greater than 30,000 sq m with good accessibility and facilities, a high level of finish, and creditworthy blue-chip tenants.Monthly rent: Surveyed rents are "face rents", the asking rents reported by landlords for mid-level floors. These
CBD GBD YBD Total
A
No. of buildings 21 14 7 42
Average GFA (sq m) 80,873 96,231 86,617 86,950
Average year of completion 2001 1999 1999 2000
B
No. of buildings 23 17 9 49
Average GFA (sq m) 50,330 39,153 44,728 45,423
Average year of completion 1998 1998 1996 1998
Total no. of buildings 44 31 16 91
Total area (sq m) 2,855,919 2,012,831 1,008,873 5,877,623
rents are standardised by Savills Korea to account for variations in the security deposits required by different landlords to produce an effective rental figure for NLA.