Embed Size (px)
Citation preview
Brief anesthesia, but not voluntary locomotion, significantly alters corticaltemperature
Michael J. Shirey,1* Jared B. Smith,1* D’Anne E. Kudlik,2 Bing-Xing Huo,1 Stephanie E. Greene,1
and Patrick J. Drew1,3
1Center for Neural Engineering, Department of Engineering Science and Mechanics, Pennsylvania State University,University Park, Pennsylvania; 2Center for Neural Engineering, Bioengineering Graduate Program, Pennsylvania StateUniversity, University Park, Pennsylvania; and 3Department of Neurosurgery, Pennsylvania State University, University Park,Pennsylvania
Submitted 16 January 2015; accepted in final form 11 May 2015
Shirey MJ, Smith JB, Kudlik DE, Huo B, Greene SE, Drew PJ.Brief anesthesia, but not voluntary locomotion, significantly alterscortical temperature. J Neurophysiol 114: 000–000, 2015. First pub-lished May 13, 2015; doi:10.1152/jn.00046.2015.—Changes in braintemperature can alter electrical properties of neurons and causechanges in behavior. However, it is not well understood how behav-iors, like locomotion, or experimental manipulations, like anesthesia,alter brain temperature. We implanted thermocouples in sensorimotorcortex of mice to understand how cortical temperature was affected bylocomotion, as well as by brief and prolonged anesthesia. Voluntarylocomotion induced small (!0.1°C) but reliable increases in corticaltemperature that could be described using a linear convolution model.In contrast, brief (90-s) exposure to isoflurane anesthesia depressedcortical temperature by !2°C, which lasted for up to 30 min after thecessation of anesthesia. Cortical temperature decreases were notaccompanied by a concomitant decrease in the !-band local fieldpotential power, multiunit firing rate, or locomotion behavior, whichall returned to baseline within a few minutes after the cessation ofanesthesia. In anesthetized animals where core body temperature waskept constant, cortical temperature was still "1°C lower than in theawake animal. Thermocouples implanted in the subcortex showedsimilar temperature changes under anesthesia, suggesting these re-sponses occur throughout the brain. Two-photon microscopy of indi-vidual blood vessel dynamics following brief isoflurane exposurerevealed a large increase in vessel diameter that ceased before thebrain temperature significantly decreased, indicating cerebral heat losswas not due to increased cerebral blood vessel dilation. These datashould be considered in experimental designs recording in anesthe-tized preparations, computational models relating temperature andneural activity, and awake-behaving methods that require brief anes-thesia before experimental procedures.
neocortex; temperature; isoflurane
NEURAL EXCITABILITY, RELEASE probability, and ion channel ki-netics are drastically affected by temperature (Hodgkin andKatz 1949; Volgushev et al. 2000a, 2000b, and 2004; Hedrickand Waters 2012; Kalmbach and Waters 2012). Temperatureaffects neural dynamics and oscillations (Reig et al. 2010;Rinberg et al. 2013; Soofi et al. 2014). In homeothermicanimals, fluctuations in temperature are buffered, but braintemperature can still fluctuate by several degrees (Delgado andHanai 1966). Experimenter-induced and spontaneous braintemperature changes contribute to behavioral variability (Long
and Fee 2008; Aronov and Fee 2012; Nybo 2012). Increases inneural activity lead to increases in local brain temperature(Yablonskiy et al. 2000; Baker et al. 1973; Trübel et al. 2006),partially due to changes in core body temperature that accom-pany behavior (De Castro 1980; Wanner et al. 2013). However,temperature increases in the brain precede and exceed those inthe core (Kiyatkin et al. 2002), indicating a neural origin to thisheating. Blood exiting the brain is of higher temperature thanblood entering the brain, indicating the inflow of blood coolsthe brain (Delgado and Hanai 1966; Hayward and Baker 1968;Kiyatkin et al. 2002). If the heat generated by neural activity isnot dissipated, it will increase neural excitability, potentiallyleading to runaway excitation (Holtzman et al. 1981; Dubé etal. 2007). A variety of behaviors (as reviewed in Kiyatkin2007), as well as both noxious and arousing stimuli, have beenobserved to increase brain temperature across many species(Aronov and Fee 2012; Kiyatkin et al. 2002; Delgado andHanai 1966; Baker et al. 1973), including forced locomotion(Caputa et al. 1983). Despite the potential role that neurallygenerated heat might play in modulating excitability, it is notwell understood how voluntary locomotion impacts brain tem-perature.
Experimental setups where mice are head-fixed on a spher-ical treadmill are widely used (Dombeck et al. 2007; Huo et al.2014 and 2015). Neural responses to sensory stimuli aretypically heightened during locomotion (Niell and Stryker2010; Polack et al. 2013; Lee et al. 2014). While these studieshave shown that locomotion affects neural activity across thecortex, the potential role of cortical temperature changes due tolocomotion modulating neural excitability has not been inves-tigated. An additional methodological concern with awakerecordings in mice is the need to anesthetize the animal toperform procedures to prepare it for imaging or electrophysi-ology (Drew et al. 2011; Gao and Drew 2014; Niell andStryker 2010; Keller et al. 2012; Polack et al. 2013; Lee et al.2014). General anesthesia diminishes neural activity and de-creases both brain and body temperature (Kiyatkin and Brown2005; Hayton et al. 1999; Hayward and Baker 1968; Zhu et al.2009), but knowing the dynamics of the temperature recoverywill inform the design of experiments utilizing anesthesia.
In the present study, we measured temperature changes insensorimotor cortex of awake, behaving mice with chronicallyimplanted thermocouples. We have previously shown thatvolitional locomotion drives large increases in cerebral bloodvolume and neural activity in forelimb/hind limb sensorimotor
* M. J. Shirey and J. B. Smith contributed equally to this work.Address for reprint requests and other correspondence: J. B. Smith Center
for Neural Engineering, Dept. of Engineering Science and Mechanics, Penn-sylvania State Univ., Univ. Park, PA (e-mail: [email protected]).
J Neurophysiol 114: 000–000, 2015.First published May 13, 2015; doi:10.1152/jn.00046.2015.
10022-3077/15 Copyright © 2015 the American Physiological Societywww.jn.org
AQ: 1
AQ: au
AQ:2
tapraid4/z9k-neurop/z9k-neurop/z9k01215/z9k3143d15z xppws S#1 5/29/15 11:29 MS: JN-00046-2015 Ini: 08/dmp/ss
cortex (Huo et al. 2014 and 2015). Here, we found thatlocomotion drove small (!0.1°C) but reliable increases incortical temperature. Surprisingly, brief bouts (!90 s) of iso-flurane anesthesia drove large (!2°C) and prolonged (30-min)decreases in cortical temperature, despite recovery of a con-scious state within a few minutes, as characterized by thereturn of volitional locomotion and recovery of neural activityto baseline. Even when body temperature was held constant,cortical temperature decreased during anesthesia. Anesthesia-induced decreases in temperature were also found in thesubcortex, suggesting the cooling effects of anesthesia affectthe entire brain. In vivo two-photon imaging of cortical arte-riole diameters showed that these vessels only dilated briefly inresponse to isoflurane anesthesia, suggesting vasodilation wasnot the primary cause of heat loss. These results suggest that,under normal physiological conditions, cerebral temperature iswell regulated but can be profoundly decreased by even shortdurations of anesthesia.
METHODS
All care and experimental manipulation of animals adhered toInstitutional Animal Care and Use Committee of Pennsylvania StateUniversity regulations. Thirteen male and four female C57BL/6J mice(3–11 mo old at surgery, 29.9 $ 4.3 g; Jackson Laboratory), whosethermocouples (n # 11) or stereotrodes (n # 6) were localized to
cortex, as confirmed histologically, were used in the final analysis. Anadditional four mice (3 male, 1 female, 3 mo old at surgery, 26.3 $3.7 g; Jackson Laboratory) had thermocouples implanted into thesubcortex. An additional three mice (2 male, 1 female, 5–7 mo old atsurgery, 29.8 $ 4.7 g; Jackson Laboratory) were implanted withpolished and reinforced thinned-skull (PoRTS) windows over thesomatosensory cortex (Drew et al. 2010). Mice were maintained on a12:12-h light-dark cycle (lights on at 0700) in isolated cages.
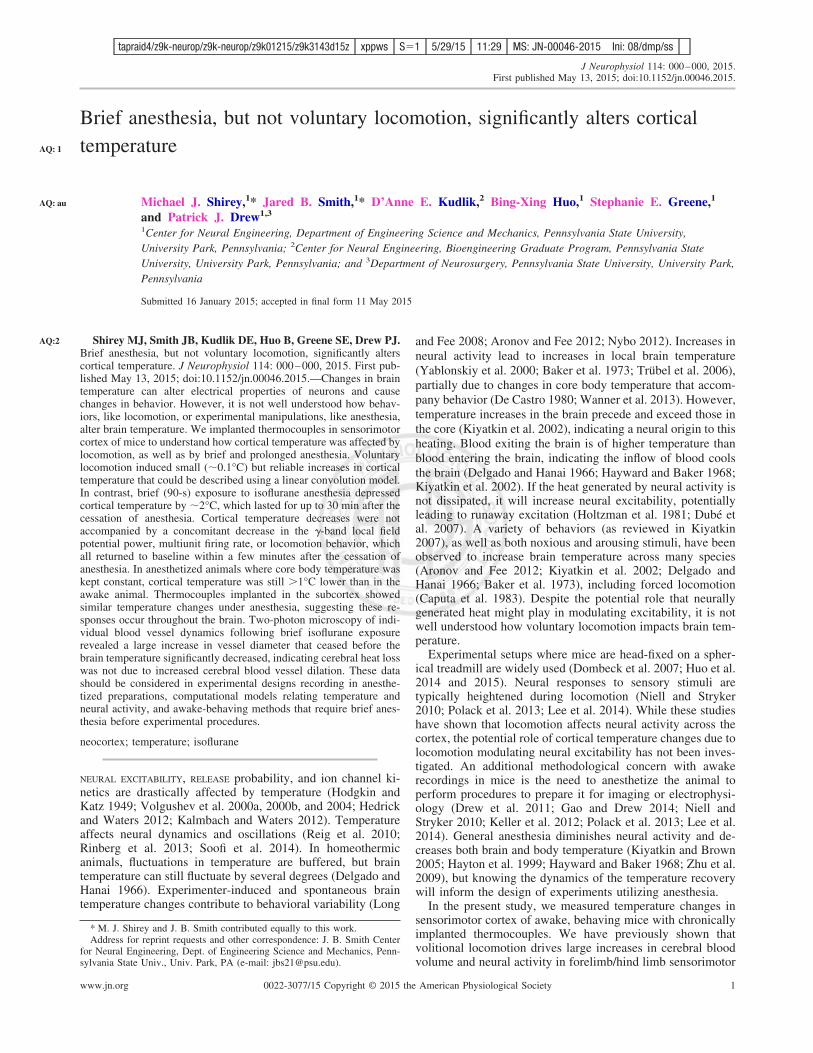
Surgery. For thermocouple implants in cortex (n # 11), a smallcraniotomy and duratomy were performed over the forelimb/hindlimb sensorimotor cortex in the left hemisphere. The thermocouple(see Fig. 1A) was inserted !750 "m deep, at a 30° angle relative tothe brain surface (Fig. 1C). For mice implanted with thermocouples inthe subcortex (n # 4), the thermocouple was inserted 6 mm deep at a25° angle relative to the brain surface. The thermocouple was held inplace with cyanoacrylic cement (catalog no. 32002; Vibra-Tite) anddental acrylic (catalog no. 1530; Lang Dental Manufacturing).
Five of the mice with thermocouples were also implanted withelectrocorticography (ECoG) electrodes in the contralateral hemi-sphere. Stainless steel self-tapping screws (no. 000/3/32 in.; J.I.Morris, Southbridge, MA) were implanted in the frontal and parietalcortex and connected to stainless steel wires (no. 7936000; A-MSystems) using colloidal silver (Pelco Colloidal Silver Liquid) forelectrical contact between the wire and the screws. Cyanoacryliccement was used to secure and insulate the screws and wire with theoutput secured over the head bar with dental acrylic.
In a separate group of mice (n # 6), tungsten stereotrodes wereimplanted into the infragranular layers (!0.8–1.0 mm below the
Fig. 1. Measuring cortical temperature with chronically implanted thermocouples. A: example of a thermocouple modified for chronic implantation. B: graphshowing linear relationship between output voltage of the transducer at known temperatures in a water bath. Black dots represent means, red lines are SDs inthe output voltage. C: Nissl-stained sagittal section showing the location of the thermocouple (red arrows) from a representative animal. D: schematic of thespherical treadmill used to record changes in cortical temperature, with a rotary encoder on the axle for measuring locomotion. E: locations of the thermocouplesfrom all animals implanted in cortex. D, dorsal; C, caudal; L, lateral; Ctx, cortex; Hp, hippocampus; lv, lateral ventricle; NS, neostriatum; Th, thalamus; M1,primary motor cortex; S1, primary somatosensory cortex. Scale bars: 1 mm in A and C; 5 mm for inset in A.
2 CORTICAL HEATING AND COOLING BY LOCOMOTION AND ANESTHESIA
J Neurophysiol • doi:10.1152/jn.00046.2015 • www.jn.org
COLOR
F1
tapraid4/z9k-neurop/z9k-neurop/z9k01215/z9k3143d15z xppws S#1 5/29/15 11:29 MS: JN-00046-2015 Ini: 08/dmp/ss
cortical surface) of the forelimb/hind limb sensorimotor cortex (1.5–1.8 mm lateral and 0–0.5 mm rostral relative to bregma) in the lefthemisphere to record local field potentials (LFP) and multiunit activ-ity (MUA). Stereotrodes (impedance of 100 k%) were constructed bythreading two Teflon-coated tungsten microwires (no. 795500; A-MSystems) through a piece of polyimide tubing (no. 822200; A-MSystems). A small craniotomy was made over the chosen location, andthe electrodes were fixed in place with cyanoacrylic cement and dentalacrylic.
An additional group of mice (n # 3) had PoRTS windows installedin the right parietal bone over sensorimotor cortex to allow imaging ofindividual blood vessels before and after exposure to isoflurane (Drewet al. 2010; Shih et al. 2012a,b). One no. 000 3/32-in. self-tappingscrew was positioned in each the left parietal and right frontal bones.The window region was thinned to a 10- to 15-"m thickness in theright parietal bone and polished using a 3F grit (Covington Engineer-ing, Redlands, CA) slurry for 10 min. Cyanoacrylic was used to attacha no. 0 cover glass over the thinned and polished cranium and furthersealed around the edges with dental acrylic.
In all animals, a custom-machined titanium head bar was cementedto the skull, caudal to lambda, for head fixation (Fig. 1D). Tempera-ture, imaging, and electrophysiological measurements started 2–3days after recovery from surgery. Mice were habituated to the spher-ical treadmill for one or two sessions to allow them to acclimate to therecording environment and be handled by investigators.
Histology. After experiments had concluded, mice were deeplyanesthetized and transcardially perfused with heparinized saline, fol-lowed by 4% paraformaldehyde. The brain was removed and sunk in4% paraformaldehyde with 30% sucrose. To verify the depth andlocation of the thermocouple in sensorimotor cortex, the left hemi-sphere was sectioned sagittally and stained for Nissl (Smith andAlloway 2013). Data were excluded if an implanted probe was not inthe gray matter of cortex, or if extensive tissue damage was present.To determine stereotrode location and depth the left cortical hemi-sphere was flattened, sectioned tangentially, and stained for thepresence of cytochrome oxidase (Drew and Feldman 2009). Thelocation of the electrode was verified relative to the body map in layerIV of primary somatosensory cortex.
Data acquisition. Mice were head fixed on a spherical treadmill(Gao and Drew 2014; Huo et al. 2014, 2015) covered with nonabra-sive, antislip tape (Fig. 1D). A US Digital (E7PD-720-118) opticalrotary encoder on the axle of the treadmill was used to measurelocomotion. The velocity signal from the rotary encoder was low passfiltered at 10 Hz (Butterworth) and binarized as previously described(Huo et al. 2014) categorizing the mouse’s behavior in 1-s bins as“running” or “not running.” We use the term running colloquially, andno information about the mouse’s gait should be inferred from thisterm. Temperature data, ball velocity, and electrophysiological re-cordings (see below) were acquired using custom written LabViewsoftware (32-bit Windows XP; National Instruments). Recordingswere performed in an enclosed experimental chamber with a mea-sured temperature of !25°C (model INFCT-012B-1.2; Newport Elec-tronics, Santa Ana, CA).
Temperature measurements. Temperature measurements weretaken using 40-gauge K-type thermocouples (5TC-TT-K-40-36;Omega Engineering) modified for chronic implantation (Fig. 1A) withthe positive lead connected to the noninverting input terminal of alow-drift amplifier (Linear Technology LTC1050CS8) and the nega-tive lead connected to a cold junction compensator (Linear Technol-ogy LT1025ACN8) (Aronov and Fee 2012). The width of the exposedthermocouple tip was !150 "m. The transducer signal was low-passfiltered (20 Hz) in hardware (Brownlee 440). The relationship ofcircuit output voltage to temperature (0.0405 V/°C) was determinedby placing a thermocouple in an insulated beaker of water at a rangeof known temperatures (Fig. 1B).
Temperature changes during locomotion. Trials measuring corticaltemperature changes during locomotion were 2 h in duration. Tem-
perature data were acquired at 250 Hz, digitally band-pass filteredbetween 0.003 and 0.25 Hz (Butterworth), downsampled to 1 Hz, andtruncated by 15 min from the start and the end to remove boundaryeffects from filtering.
Cross-covariance. For calculating cross-covariance, the binarized-locomotion and cortical temperature were normalized such that theirautocorrelations were unity at zero time lag. The 95% confidenceinterval was determined by calculating the cross-covariance of shuf-fled locomotion and temperature measurements.
Linear convolution model. Given the strong correlation betweenlocomotion and cortical temperature (Fig. 2, A and B), we treated thetemperature responses to locomotion events as a linear, time-invariantsystem. We quantified this relationship using a linear convolutionmodel, similar to our previously described model for hemodynamicresponses to locomotion (Huo et al. 2015). Briefly, the animal’svelocity was binarized into locomotion events. The impulse response(or kernel) characterized the change of cortical temperature (in °C) inresponse to a single locomotion event (with a 1-s temporal resolution),and was numerically solved assuming a linear relationship betweenthe behavior (running or not running) and the cortical temperature.The average kernel was filtered with a Savitzky-Golay filter (4th-degree polynomial, frame size of 25 s). The goodness-of-fit wasquantified as Pearson’s correlation coefficient between the measuredcortical temperature change and the estimated data from convolvingthe locomotion events and the impulse response. To evaluate therepeatability of cortical temperature changes based on locomotion,within each animal, we predicted the temperature change for one trialby convolving the locomotion events with the impulse responsecalculated from the averaged kernel from all other trials from the sameanimal.
Cortical temperature and core temperature measurements underanesthesia with body warming. In the five mice with thermocouplesand ECoG implants, measurements of cortical temperature and coretemperature were taken at varying levels of isoflurane anesthesia. Allmeasurements were done in the afternoon (1300–1700) in a 25°Cenvironment. Temperature measurements taken with a rectal temper-ature probe (placed !5 cm up the descending colon, juxtaposed to theliver, which should truly measure core temperature), the thermocoupleused for cortical temperature measurements, and a thermocouplemeter/controller measuring room air (INFCT012B; Newport Electron-ics) were all validated to be within a tenth of a degree Celsius of eachother before the experimental procedure began. Initially, a corticaltemperature measurement was taken while the mouse was awake.Next, the mouse was anesthetized with 5% isoflurane to allow inser-tion of a rectal temperature probe, and body temperature was activelymaintained at 36.8°C using a homeothermic monitor, warming blan-ket, and rectal thermometer (Harvard Apparatus). A period of !10min at 1% isoflurane followed to stabilize body temperature (at36.8°C), cortical temperature, and a lightly anesthetized ECoG state(Friedberg et al. 1999). After cortical and core temperatures wererecorded, isoflurane levels were increased in 1% increments andallowed to stabilize for 1 min before recording cortical and coretemperatures.
Anesthesia trial and control trial procedures. To measure changesin cortical temperature due to brief isoflurane anesthesia, mice werehead-fixed on the spherical treadmill as before. After a 15-minbaseline measurement period, a mixture of 5% isoflurane (E-Z Anes-thesia) in air (anesthesia trials) or air alone (control trials) wasadministered at 1 l/min for 90 s via a nose cone positioned over thesnout. The nose cone was promptly removed after the air/isofluraneexposure ended. Recording continued for another 55 min. Anesthesiaand control trials were performed on separate days. All temperaturemeasurements for anesthesia and control trials were digitally low-passfiltered at 0.01 Hz (Butterworth), downsampled to 1 Hz, and baselinesubtracted. Temperature data were averaged into 5-min bins to test forstatistical significance.
3CORTICAL HEATING AND COOLING BY LOCOMOTION AND ANESTHESIA
J Neurophysiol • doi:10.1152/jn.00046.2015 • www.jn.org
F2
tapraid4/z9k-neurop/z9k-neurop/z9k01215/z9k3143d15z xppws S#1 5/29/15 11:29 MS: JN-00046-2015 Ini: 08/dmp/ss
ECoG measurements. ECoG signals were acquired at 1 kHz. TheECoG signal was differentially amplified (DAM80; WPI) and band-pass filtered (0.1–300 Hz) in hardware (Brownlee 440). At least onecontrol trial and one anesthesia trial of simultaneous ECoG andtemperature measurements were taken in each of the five mice. TheECoG data were digitally bandpass filtered between 0.01 and 300 Hz(Butterworth). Spectrograms were computed with a frequency reso-lution of 2 Hz and temporal resolution of 5 s using the Chronuxtoolbox (Mitra and Bokil 2008). For behavioral ECoG data, a multi-taper power spectrum was calculated for each second of ECoG data.For each trial, an average power spectrum for running and not runningbehaviors was calculated. A !-band (40–100 Hz) power ratio tobaseline (P!/P!0) was then found for each behavior by dividing theaverage power spectrum in each respective time period (P!) by thebaseline power spectrum (P!0) and then averaging over the !-band.Line noise was not present in ECoG recordings, likely due to the lowimpedance of the electrodes.
LFP recordings. LFP recordings were acquired at 30 kHz, differ-entially amplified (DAM80; WPI), and bandpass filtered (0.1–10 kHz)in hardware (Brownlee 440). MUA was acquired by further bandpassfiltering in hardware between 300 Hz and 5 kHz (Brownlee 440). LFPrecordings were conducted in six mice, with each mouse having onecontrol trial and one anesthesia trial. The LFP data were digitallybandpass filtered between 0.1 and 300 Hz (Butterworth) and down-sampled to 300 Hz. Power in the 55- to 65-Hz range was excluded toremove the effects of line noise. For visualization, multitaper powerspectrograms of the LFP data were calculated with a frequencyresolution of 2 Hz and temporal resolution of 5 s using the sameprocedure as the ECoG spectrogram. The !-band power ratio tobaseline (P!/P!0) (Huo et al. 2014) was calculated in the samemanner as ECoG data.
Multiunit firing rate. The MUA discharges were obtained frommean subtracted data using a threshold of three standard deviations.These MUA spikes were binned into 1-s bins, and firing rates forperiods of running and not running were calculated using the bina-rized locomotion data. The mean firing rates for running and notrunning were then found for baseline and various periods of time (30-sand 5-min periods). The firing rate was normalized by the preanes-thesia firing rate.
Two-photon microscopy. A two-photon microscope, consisting of aMaiTai HP laser (Spectra-Physics, Santa Clara, CA), a MoveableObjective Microscope (Sutter Instruments, Novato, CA), and a &20,0.95 aperture water immersion objective (Olympus, Center Valley,PA), was used for single-vessel imaging in animals with installedPoRTS windows (n # 3). The system was controlled by MPScopesoftware (Nguyen et al. 2006). Before imaging, the mouse was brieflyanesthetized with 5% isoflurane in oxygen, and 0.05 ml FITC-dextran(5% wt/vol, FD70S; Sigma) in saline was injected retro-orbitally(Shih et al. 2012a). The mouse was then placed on a free-movingspherical treadmill and allowed to locomote voluntarily, and the headbar was secured to a stable fixture to prevent skull movement duringimage collection. A recovery period of at least 60 min passed betweenanesthesia for FITC-dextran injections and data collection. Locomo-tion data were collected using a US Digital (E5-720-118) opticalrotary encoder.
Diameter measurements. The effects of isoflurane on individualpenetrating arterioles were assessed using diameter measurementsfrom movies collected using two-photon microscopy. Two experi-ments were performed on separate days for each vessel: anesthesiatrials (5% isoflurane in air at 1 l/min) and control (air at 1 l/min). Foranesthesia and control trials, a 3-min baseline movie was collectedimmediately before isoflurane or air exposure. Isoflurane (or air) was
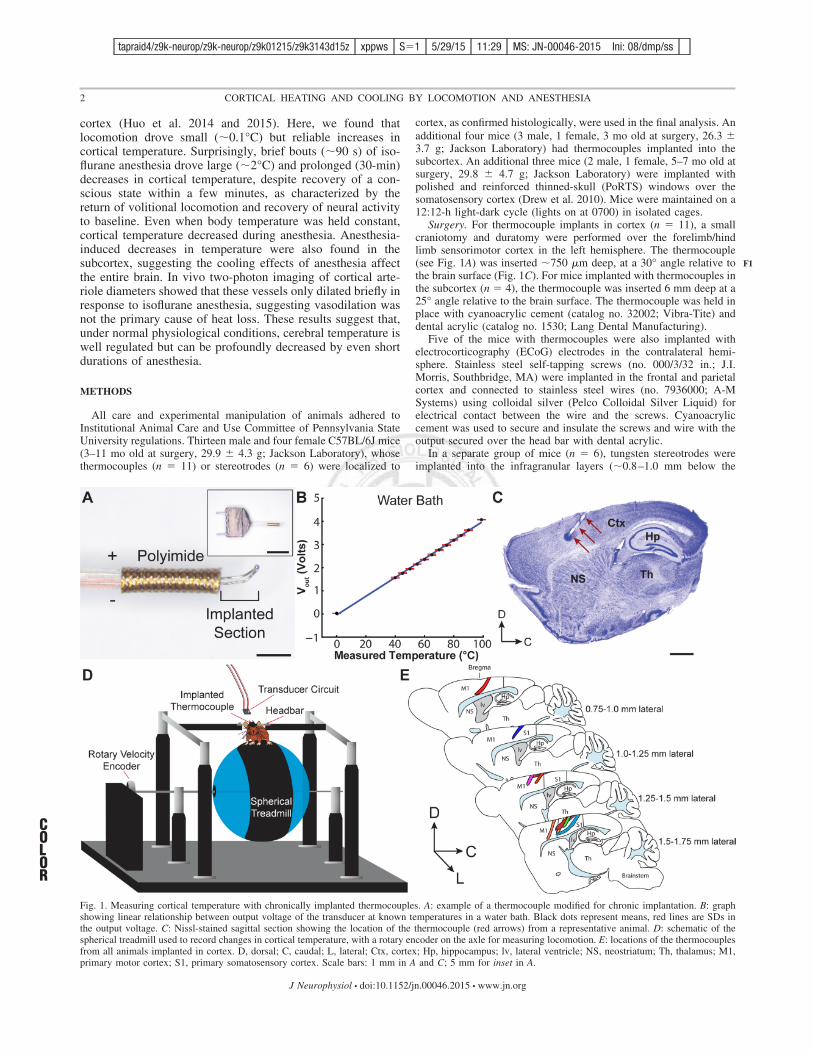
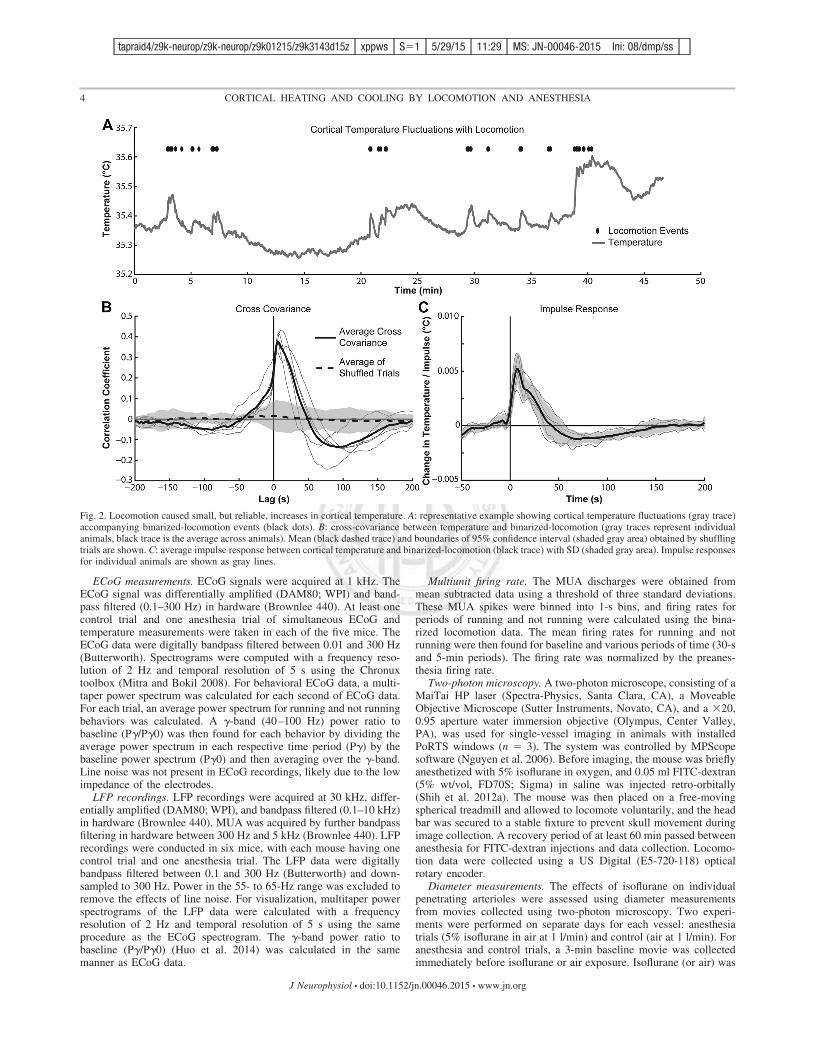
Fig. 2. Locomotion caused small, but reliable, increases in cortical temperature. A: representative example showing cortical temperature fluctuations (gray trace)accompanying binarized-locomotion events (black dots). B: cross-covariance between temperature and binarized-locomotion (gray traces represent individualanimals, black trace is the average across animals). Mean (black dashed trace) and boundaries of 95% confidence interval (shaded gray area) obtained by shufflingtrials are shown. C: average impulse response between cortical temperature and binarized-locomotion (black trace) with SD (shaded gray area). Impulse responsesfor individual animals are shown as gray lines.
4 CORTICAL HEATING AND COOLING BY LOCOMOTION AND ANESTHESIA
J Neurophysiol • doi:10.1152/jn.00046.2015 • www.jn.org
tapraid4/z9k-neurop/z9k-neurop/z9k01215/z9k3143d15z xppws S#1 5/29/15 11:29 MS: JN-00046-2015 Ini: 08/dmp/ss
then administered for 90 s, and imaging resumed immediately there-after. Movies of vessel diameters were collected for approximately 3min, with 5-min intervals between the collection periods for 60 minafter the isoflurane (or air) was applied. Vessel diameters werequantified using the full-width at half-maximum method (Drew et al.2011).
Analyses and statistical tests. All analyses were performed inMatlab (Mathworks) and Origin8 (Origin Lab). Independent 2-tailedt-tests and Student’s t-tests were used (t value, P value), and aBonferroni correction was used to correct for multiple comparisons.Two-way ANOVA [F value(df between, df group), P value], and apaired two-tailed t-test with Bonferroni correction [t(df) value, Pvalue] were used to compare brain temperature and core body tem-perature. Power analyses were performed using G*Power (version3.1, Faul et al. 2007).
RESULTS
We recorded temperature in the sensorimotor cortex of miceduring voluntary locomotion (n # 5), following brief anesthe-sia without body warming (n # 7) and sustained anesthesiawith body warming (n # 5). A summary of the locations ofthermocouple implants is shown in Fig. 1E. In five of the miceused for the anesthesia experiments, ECoG activity in thecontralateral hemisphere was recorded. A second group ofmice (n # 6) was implanted with stereotrodes in the infra-granular layers of sensorimotor cortex to measure LFP andMUA in response to brief isoflurane anesthesia. A third groupof mice (n # 4) was implanted with thermocouples in thesubcortex, and temperatures were recorded during brief anes-thesia without body warming and sustained anesthesia withbody warming. A fourth group of mice (n # 3) was implantedwith polished and reinforced thinned-skull windows (Drew etal. 2010), allowing measurement of individual blood vesseldiameters in response to brief isoflurane anesthesia.
Cortical temperature increases were correlated withlocomotion. To determine the effects of locomotion on corticaltemperature, we recorded cortical temperature with implantedthermocouples and locomotion behavior via a rotary encoderon the axle of the spherical treadmill. The overall mean corticaltemperature across all animals for trials where they wereallowed to voluntarily locomote was 35.1 $ 0.54°C (0000-0600: 35.4 $ 0.49°C, n # 2; 0600–1200: 34.6 $ 1.1°C, n #2; 1200–1800: 35.2 $ 0.47°C, n # 5; 1800–2400: 35.5 $0.21°C, n # 2). This cortical temperature was cooler than
reported core temperatures (!36.9°C) in mice (Green et al.1966), consistent with previous measures in rats showingcortical temperature being lower than core temperature (Bind-man et al. 1963; Barone et al. 1997).
In response to bouts of volitional locomotion, we observedsmall, but consistent, increases in cortical temperature(!0.1°C), as shown in Fig. 2. These small changes in corticaltemperature due to voluntary locomotion agree with anecdotalobservations of locomotion in felines (Delgado and Hanai1966) and somatosensory stimulation in rodents (Trübel et al.2006). The representative temperature trace in Fig. 2A showssmall increases in cortical temperature with locomotion events.During longer bouts, the cortical temperature increased moresubstantially, by as much as 0.2°C (Fig. 2A). The cross-covariance between binary locomotion events and temperaturechanges revealed a peak, corresponding to a temperature in-crease that lagged locomotion by about 6 s (Fig. 2B), and thatsignificantly exceeded the 95% confidence interval of thecross-covariance obtained from shuffled data.
We calculated the impulse response function (kernel) be-tween binary locomotion events and cortical temperaturechanges, assuming a linear, time-invariant system. This calcu-lation revealed that cortical temperature has a biphasic re-sponse to 1-s locomotion impulses (Fig. 2C). The impulseresponse increases sharply after the initiation of locomotionand peaks 7 s later, similar to the cross-covariance results.Following the peak, cortical temperature steadily decreases andovershoots the baseline before returning to zero (Fig. 2C).Kernels were similar across all mice.
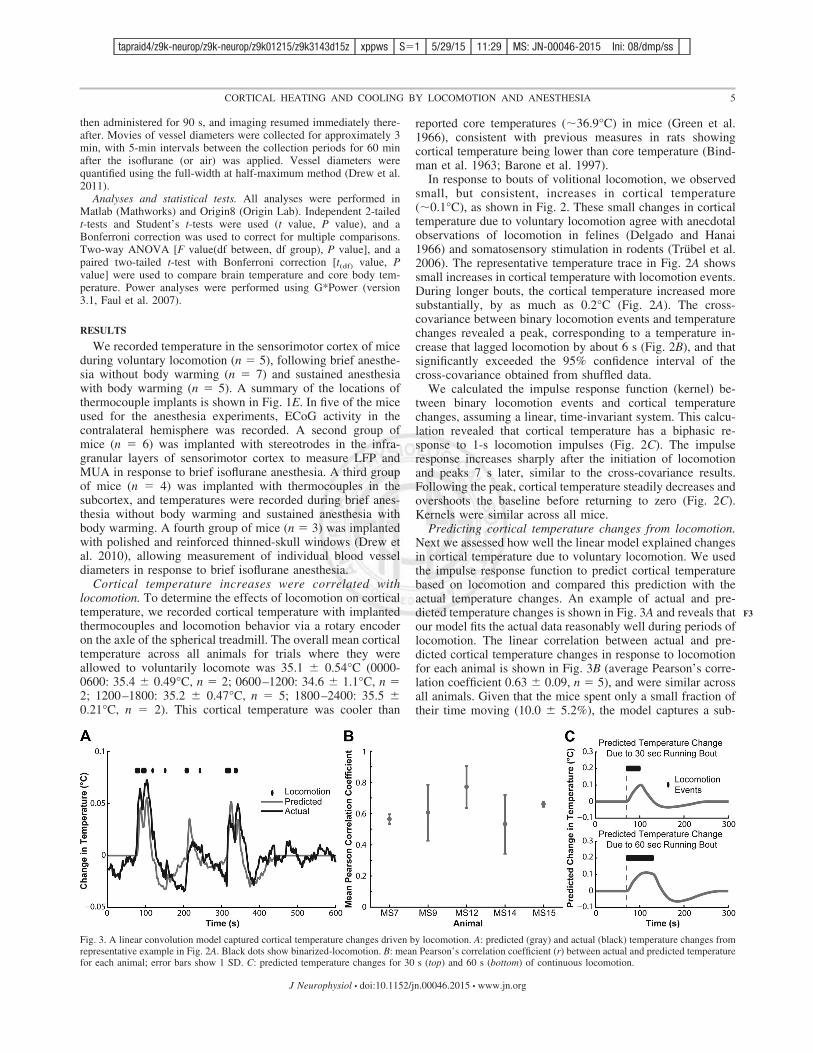
Predicting cortical temperature changes from locomotion.Next we assessed how well the linear model explained changesin cortical temperature due to voluntary locomotion. We usedthe impulse response function to predict cortical temperaturebased on locomotion and compared this prediction with theactual temperature changes. An example of actual and pre-dicted temperature changes is shown in Fig. 3A and reveals thatour model fits the actual data reasonably well during periods oflocomotion. The linear correlation between actual and pre-dicted cortical temperature changes in response to locomotionfor each animal is shown in Fig. 3B (average Pearson’s corre-lation coefficient 0.63 $ 0.09, n # 5), and were similar acrossall animals. Given that the mice spent only a small fraction oftheir time moving (10.0 $ 5.2%), the model captures a sub-
Fig. 3. A linear convolution model captured cortical temperature changes driven by locomotion. A: predicted (gray) and actual (black) temperature changes fromrepresentative example in Fig. 2A. Black dots show binarized-locomotion. B: mean Pearson’s correlation coefficient (r) between actual and predicted temperaturefor each animal; error bars show 1 SD. C: predicted temperature changes for 30 s (top) and 60 s (bottom) of continuous locomotion.
5CORTICAL HEATING AND COOLING BY LOCOMOTION AND ANESTHESIA
J Neurophysiol • doi:10.1152/jn.00046.2015 • www.jn.org
F3
tapraid4/z9k-neurop/z9k-neurop/z9k01215/z9k3143d15z xppws S#1 5/29/15 11:29 MS: JN-00046-2015 Ini: 08/dmp/ss
stantial fraction of the variability in cortical temperature. Usingthe mean kernel across animals, we estimated temperaturechanges from sustained locomotion bouts to determine if theymight be large enough to affect neural excitability. The pre-dicted temperature change in response to 30 s of continuouslocomotion was calculated using the average impulse responseacross all animals (Fig. 3C). The predicted maximum temper-ature increase was 0.10°C, reaching the peak immediately afterlocomotion ended. Predicted temperature changes for a con-tinuous 60-s bout of locomotion (Fig. 3C, bottom) showed amaximum increase of 0.11°C occurring 44 s after initiation ofrunning (Fig. 3C), comparable in magnitude to the predictedtemperature peak for 30 s of continuous locomotion. Thesetemperature changes were similar to those observed in our data(Fig. 2A) but would be unlikely to affect neural excitability dueto their small magnitude.
Isoflurane anesthesia caused decreases in brain temperaturedespite stable body temperature. Our next experiments aimedto determine the effects of sustained isoflurane anesthesia oncortical and core temperature. Previous work has suggestedthat isoflurane anesthesia substantially decreases brain temper-ature relative to the core (Kalmbach and Waters 2012). How-ever, these studies were done in animals with a cranial window,whereas our preparation was insulated. Another previous studyfound that brain temperature could be depressed even when thebody is heated with a warming blanket (Kiyatkin and Brown2005), but this study used pentabarbitol, which is not com-monly used in mice. We wanted to see if decoupling betweenbrain and core temperature takes place under isoflurane anes-thesia when the implanted thermocouple is well-insulated. Tounderstand the relationship between cortical temperature andcore temperature during anesthesia, we simultaneously re-corded cortical temperature and rectal temperature at varyingconcentrations of isoflurane anesthesia (Fig. 4A) while main-taining core temperature with a homeothermic warming blan-ket. These experiments were done in a subset of mice that hadboth thermocouples and ECoG electrode implants (n # 5) and
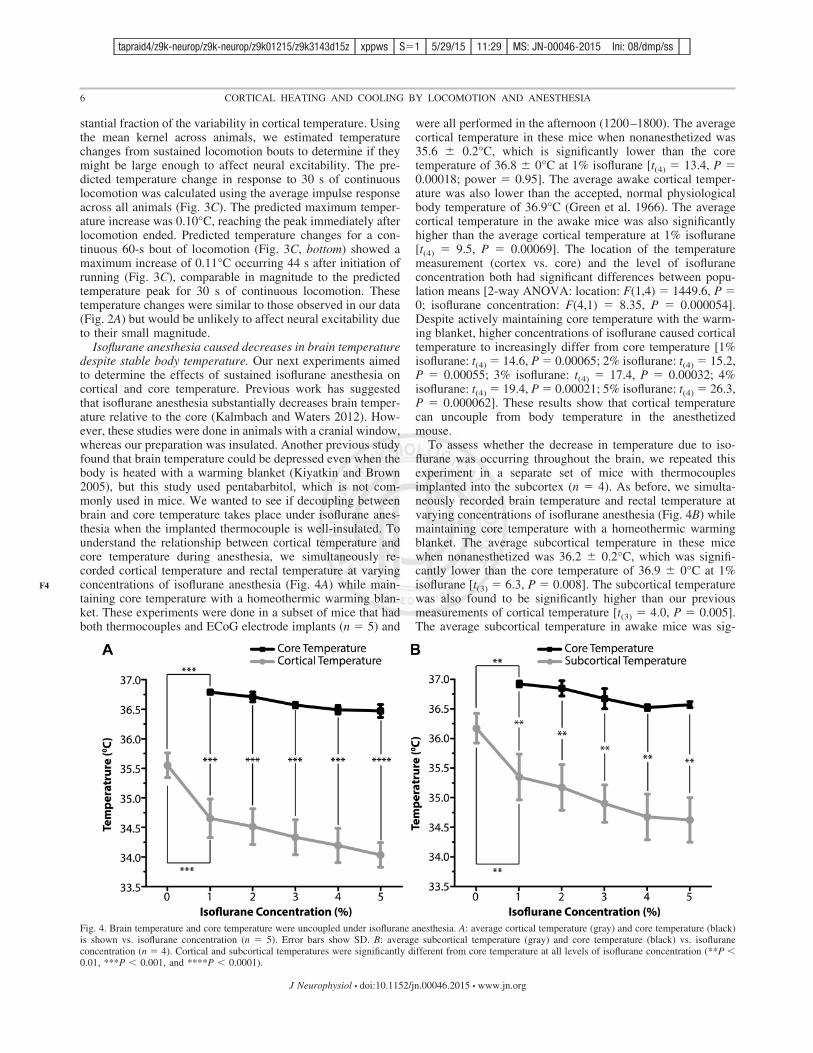
were all performed in the afternoon (1200–1800). The averagecortical temperature in these mice when nonanesthetized was35.6 $ 0.2°C, which is significantly lower than the coretemperature of 36.8 $ 0°C at 1% isoflurane [t(4) # 13.4, P #0.00018; power # 0.95]. The average awake cortical temper-ature was also lower than the accepted, normal physiologicalbody temperature of 36.9°C (Green et al. 1966). The averagecortical temperature in the awake mice was also significantlyhigher than the average cortical temperature at 1% isoflurane[t(4) # 9.5, P # 0.00069]. The location of the temperaturemeasurement (cortex vs. core) and the level of isofluraneconcentration both had significant differences between popu-lation means [2-way ANOVA: location: F(1,4) # 1449.6, P #0; isoflurane concentration: F(4,1) # 8.35, P # 0.000054].Despite actively maintaining core temperature with the warm-ing blanket, higher concentrations of isoflurane caused corticaltemperature to increasingly differ from core temperature [1%isoflurane: t(4) # 14.6, P # 0.00065; 2% isoflurane: t(4) # 15.2,P # 0.00055; 3% isoflurane: t(4) # 17.4, P # 0.00032; 4%isoflurane: t(4) # 19.4, P # 0.00021; 5% isoflurane: t(4) # 26.3,P # 0.000062]. These results show that cortical temperaturecan uncouple from body temperature in the anesthetizedmouse.
To assess whether the decrease in temperature due to iso-flurane was occurring throughout the brain, we repeated thisexperiment in a separate set of mice with thermocouplesimplanted into the subcortex (n # 4). As before, we simulta-neously recorded brain temperature and rectal temperature atvarying concentrations of isoflurane anesthesia (Fig. 4B) whilemaintaining core temperature with a homeothermic warmingblanket. The average subcortical temperature in these micewhen nonanesthetized was 36.2 $ 0.2°C, which was signifi-cantly lower than the core temperature of 36.9 $ 0°C at 1%isoflurane [t(3) # 6.3, P # 0.008]. The subcortical temperaturewas also found to be significantly higher than our previousmeasurements of cortical temperature [t(3) # 4.0, P # 0.005].The average subcortical temperature in awake mice was sig-
Fig. 4. Brain temperature and core temperature were uncoupled under isoflurane anesthesia. A: average cortical temperature (gray) and core temperature (black)is shown vs. isoflurane concentration (n # 5). Error bars show SD. B: average subcortical temperature (gray) and core temperature (black) vs. isofluraneconcentration (n # 4). Cortical and subcortical temperatures were significantly different from core temperature at all levels of isoflurane concentration (**P '0.01, ***P ' 0.001, and ****P ' 0.0001).
6 CORTICAL HEATING AND COOLING BY LOCOMOTION AND ANESTHESIA
J Neurophysiol • doi:10.1152/jn.00046.2015 • www.jn.org
F4
tapraid4/z9k-neurop/z9k-neurop/z9k01215/z9k3143d15z xppws S#1 5/29/15 11:29 MS: JN-00046-2015 Ini: 08/dmp/ss
nificantly higher than the average cortical temperature at 1%isoflurane [t(3) # 6.6, P # 0.0007]. The location of thetemperature measurement (subcortex vs. core) and the level ofisoflurane concentration both had significant differences be-tween population means [2-way ANOVA: location: F(1,4) #418.6, P # 0; isoflurane concentration: F(4,1) # 6.3, P #0.0008]. Despite actively maintaining core temperature withthe warming blanket, higher concentrations of isofluranecaused subcortical temperature to increasingly differ from coretemperature [1% isoflurane: t(3) # 9.0, P # 0.0015; 2%isoflurane: t(3) # 9.8, P # 0.01; 3% isoflurane: t(3) # 13.5, P #0.0045; 4% isoflurane: t(3) # 10.5, P # 0.001; 5% isoflurane:t(3) # 11.1, P # 0.001]. These results show that cortical andsubcortical temperatures were significantly lower than in theawake animal, irrespective of core temperature.
Long duration decrease in cortical temperature followingbrief isoflurane anesthesia. Next, we tested whether briefexposure to isoflurane (5% in air, 90 s) through a nose conesignificantly altered cortical temperature. This duration ofanesthesia was long enough to cause loss of consciousness,indicated by lack of muscle tone and loss of withdrawalreflexes. An anesthetic regimen of this duration (or longer) isfrequently employed for brief procedures such as retro-orbitalinjections, craniotomies, and other preparations necessary forphysiological measurements in awake animals. We observed alarge decrease in cortical temperature (!2°C) after anesthesia
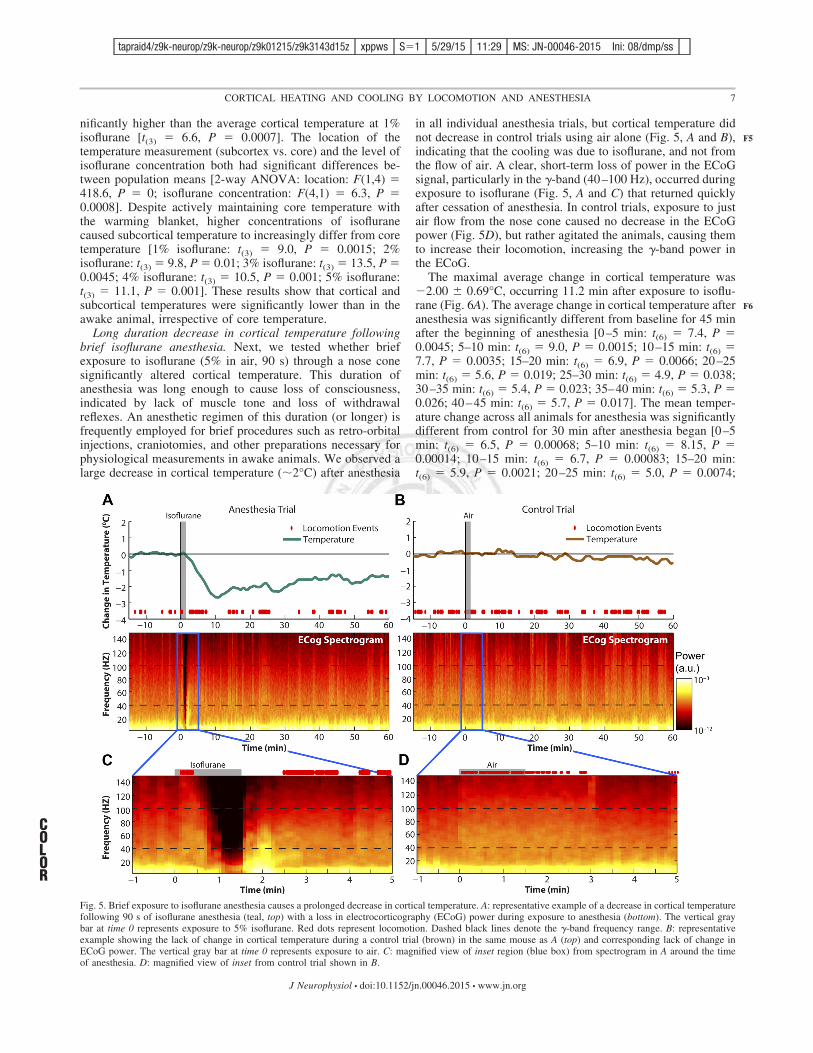
in all individual anesthesia trials, but cortical temperature didnot decrease in control trials using air alone (Fig. 5, A and B),indicating that the cooling was due to isoflurane, and not fromthe flow of air. A clear, short-term loss of power in the ECoGsignal, particularly in the !-band (40–100 Hz), occurred duringexposure to isoflurane (Fig. 5, A and C) that returned quicklyafter cessation of anesthesia. In control trials, exposure to justair flow from the nose cone caused no decrease in the ECoGpower (Fig. 5D), but rather agitated the animals, causing themto increase their locomotion, increasing the !-band power inthe ECoG.
The maximal average change in cortical temperature was(2.00 $ 0.69°C, occurring 11.2 min after exposure to isoflu-rane (Fig. 6A). The average change in cortical temperature afteranesthesia was significantly different from baseline for 45 minafter the beginning of anesthesia [0–5 min: t(6) # 7.4, P #0.0045; 5–10 min: t(6) # 9.0, P # 0.0015; 10–15 min: t(6) #7.7, P # 0.0035; 15–20 min: t(6) # 6.9, P # 0.0066; 20–25min: t(6) # 5.6, P # 0.019; 25–30 min: t(6) # 4.9, P # 0.038;30–35 min: t(6) # 5.4, P # 0.023; 35–40 min: t(6) # 5.3, P #0.026; 40–45 min: t(6) # 5.7, P # 0.017]. The mean temper-ature change across all animals for anesthesia was significantlydifferent from control for 30 min after anesthesia began [0–5min: t(6) # 6.5, P # 0.00068; 5–10 min: t(6) # 8.15, P #0.00014; 10–15 min: t(6) # 6.7, P # 0.00083; 15–20 min:t(6) # 5.9, P # 0.0021; 20–25 min: t(6) # 5.0, P # 0.0074;
Fig. 5. Brief exposure to isoflurane anesthesia causes a prolonged decrease in cortical temperature. A: representative example of a decrease in cortical temperaturefollowing 90 s of isoflurane anesthesia (teal, top) with a loss in electrocorticography (ECoG) power during exposure to anesthesia (bottom). The vertical graybar at time 0 represents exposure to 5% isoflurane. Red dots represent locomotion. Dashed black lines denote the !-band frequency range. B: representativeexample showing the lack of change in cortical temperature during a control trial (brown) in the same mouse as A (top) and corresponding lack of change inECoG power. The vertical gray bar at time 0 represents exposure to air. C: magnified view of inset region (blue box) from spectrogram in A around the timeof anesthesia. D: magnified view of inset from control trial shown in B.
7CORTICAL HEATING AND COOLING BY LOCOMOTION AND ANESTHESIA
J Neurophysiol • doi:10.1152/jn.00046.2015 • www.jn.org
COLOR
F5
F6
tapraid4/z9k-neurop/z9k-neurop/z9k01215/z9k3143d15z xppws S#1 5/29/15 11:29 MS: JN-00046-2015 Ini: 08/dmp/ss
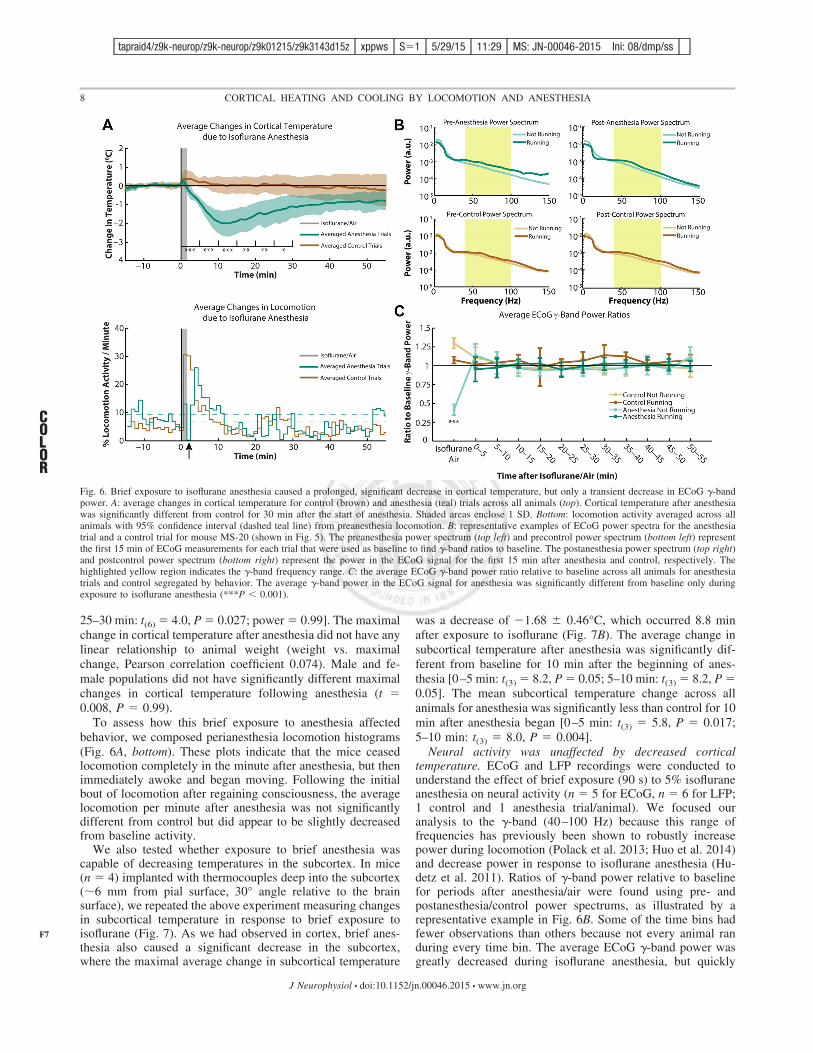
25–30 min: t(6) # 4.0, P # 0.027; power # 0.99]. The maximalchange in cortical temperature after anesthesia did not have anylinear relationship to animal weight (weight vs. maximalchange, Pearson correlation coefficient 0.074). Male and fe-male populations did not have significantly different maximalchanges in cortical temperature following anesthesia (t #0.008, P # 0.99).
To assess how this brief exposure to anesthesia affectedbehavior, we composed perianesthesia locomotion histograms(Fig. 6A, bottom). These plots indicate that the mice ceasedlocomotion completely in the minute after anesthesia, but thenimmediately awoke and began moving. Following the initialbout of locomotion after regaining consciousness, the averagelocomotion per minute after anesthesia was not significantlydifferent from control but did appear to be slightly decreasedfrom baseline activity.
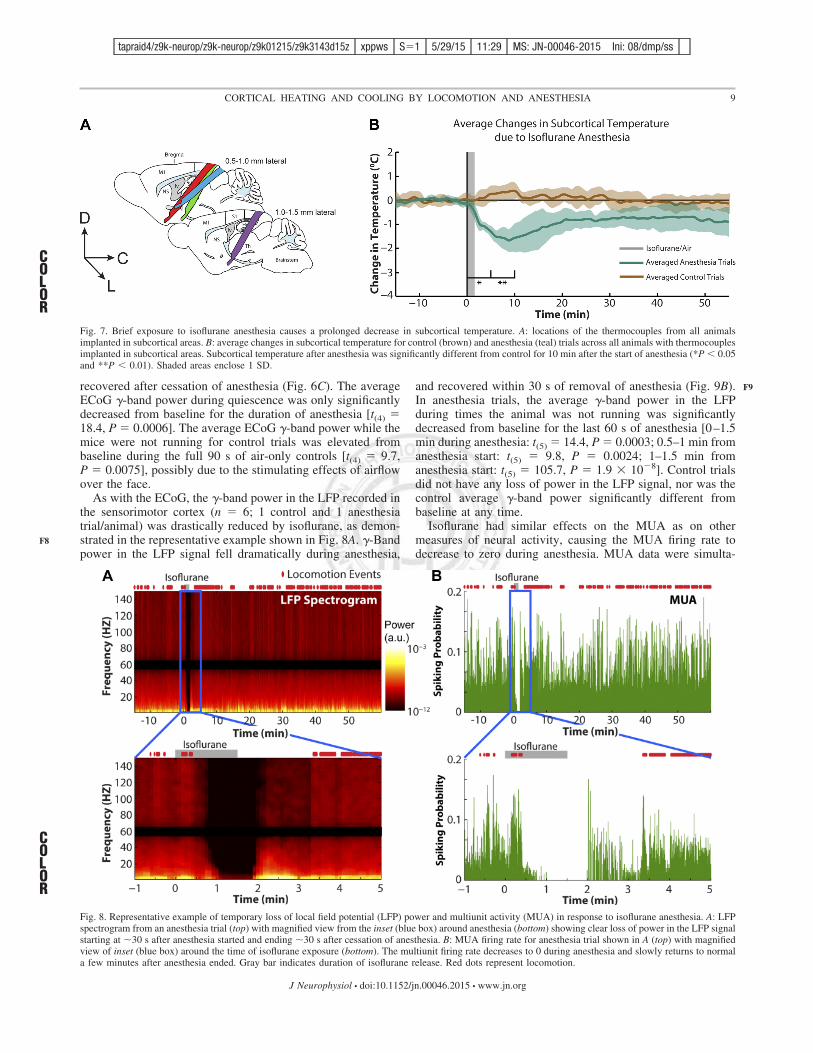
We also tested whether exposure to brief anesthesia wascapable of decreasing temperatures in the subcortex. In mice(n # 4) implanted with thermocouples deep into the subcortex(!6 mm from pial surface, 30° angle relative to the brainsurface), we repeated the above experiment measuring changesin subcortical temperature in response to brief exposure toisoflurane (Fig. 7). As we had observed in cortex, brief anes-thesia also caused a significant decrease in the subcortex,where the maximal average change in subcortical temperature
was a decrease of (1.68 $ 0.46°C, which occurred 8.8 minafter exposure to isoflurane (Fig. 7B). The average change insubcortical temperature after anesthesia was significantly dif-ferent from baseline for 10 min after the beginning of anes-thesia [0–5 min: t(3) # 8.2, P # 0.05; 5–10 min: t(3) # 8.2, P #0.05]. The mean subcortical temperature change across allanimals for anesthesia was significantly less than control for 10min after anesthesia began [0–5 min: t(3) # 5.8, P # 0.017;5–10 min: t(3) # 8.0, P # 0.004].
Neural activity was unaffected by decreased corticaltemperature. ECoG and LFP recordings were conducted tounderstand the effect of brief exposure (90 s) to 5% isofluraneanesthesia on neural activity (n # 5 for ECoG, n # 6 for LFP;1 control and 1 anesthesia trial/animal). We focused ouranalysis to the !-band (40–100 Hz) because this range offrequencies has previously been shown to robustly increasepower during locomotion (Polack et al. 2013; Huo et al. 2014)and decrease power in response to isoflurane anesthesia (Hu-detz et al. 2011). Ratios of !-band power relative to baselinefor periods after anesthesia/air were found using pre- andpostanesthesia/control power spectrums, as illustrated by arepresentative example in Fig. 6B. Some of the time bins hadfewer observations than others because not every animal randuring every time bin. The average ECoG !-band power wasgreatly decreased during isoflurane anesthesia, but quickly
Fig. 6. Brief exposure to isoflurane anesthesia caused a prolonged, significant decrease in cortical temperature, but only a transient decrease in ECoG !-bandpower. A: average changes in cortical temperature for control (brown) and anesthesia (teal) trials across all animals (top). Cortical temperature after anesthesiawas significantly different from control for 30 min after the start of anesthesia. Shaded areas enclose 1 SD. Bottom: locomotion activity averaged across allanimals with 95% confidence interval (dashed teal line) from preanesthesia locomotion. B: representative examples of ECoG power spectra for the anesthesiatrial and a control trial for mouse MS-20 (shown in Fig. 5). The preanesthesia power spectrum (top left) and precontrol power spectrum (bottom left) representthe first 15 min of ECoG measurements for each trial that were used as baseline to find !-band ratios to baseline. The postanesthesia power spectrum (top right)and postcontrol power spectrum (bottom right) represent the power in the ECoG signal for the first 15 min after anesthesia and control, respectively. Thehighlighted yellow region indicates the !-band frequency range. C: the average ECoG !-band power ratio relative to baseline across all animals for anesthesiatrials and control segregated by behavior. The average !-band power in the ECoG signal for anesthesia was significantly different from baseline only duringexposure to isoflurane anesthesia (***P ' 0.001).
8 CORTICAL HEATING AND COOLING BY LOCOMOTION AND ANESTHESIA
J Neurophysiol • doi:10.1152/jn.00046.2015 • www.jn.org
F7
COLOR
tapraid4/z9k-neurop/z9k-neurop/z9k01215/z9k3143d15z xppws S#1 5/29/15 11:29 MS: JN-00046-2015 Ini: 08/dmp/ss
recovered after cessation of anesthesia (Fig. 6C). The averageECoG !-band power during quiescence was only significantlydecreased from baseline for the duration of anesthesia [t(4) #18.4, P # 0.0006]. The average ECoG !-band power while themice were not running for control trials was elevated frombaseline during the full 90 s of air-only controls [t(4) # 9.7,P # 0.0075], possibly due to the stimulating effects of airflowover the face.
As with the ECoG, the !-band power in the LFP recorded inthe sensorimotor cortex (n # 6; 1 control and 1 anesthesiatrial/animal) was drastically reduced by isoflurane, as demon-strated in the representative example shown in Fig. 8A. !-Bandpower in the LFP signal fell dramatically during anesthesia,
and recovered within 30 s of removal of anesthesia (Fig. 9B).In anesthesia trials, the average !-band power in the LFPduring times the animal was not running was significantlydecreased from baseline for the last 60 s of anesthesia [0–1.5min during anesthesia: t(5) # 14.4, P # 0.0003; 0.5–1 min fromanesthesia start: t(5) # 9.8, P # 0.0024; 1–1.5 min fromanesthesia start: t(5) # 105.7, P # 1.9 & 10(8]. Control trialsdid not have any loss of power in the LFP signal, nor was thecontrol average !-band power significantly different frombaseline at any time.
Isoflurane had similar effects on the MUA as on othermeasures of neural activity, causing the MUA firing rate todecrease to zero during anesthesia. MUA data were simulta-
Fig. 7. Brief exposure to isoflurane anesthesia causes a prolonged decrease in subcortical temperature. A: locations of the thermocouples from all animalsimplanted in subcortical areas. B: average changes in subcortical temperature for control (brown) and anesthesia (teal) trials across all animals with thermocouplesimplanted in subcortical areas. Subcortical temperature after anesthesia was significantly different from control for 10 min after the start of anesthesia (*P ' 0.05and **P ' 0.01). Shaded areas enclose 1 SD.
Fig. 8. Representative example of temporary loss of local field potential (LFP) power and multiunit activity (MUA) in response to isoflurane anesthesia. A: LFPspectrogram from an anesthesia trial (top) with magnified view from the inset (blue box) around anesthesia (bottom) showing clear loss of power in the LFP signalstarting at !30 s after anesthesia started and ending !30 s after cessation of anesthesia. B: MUA firing rate for anesthesia trial shown in A (top) with magnifiedview of inset (blue box) around the time of isoflurane exposure (bottom). The multiunit firing rate decreases to 0 during anesthesia and slowly returns to normala few minutes after anesthesia ended. Gray bar indicates duration of isoflurane release. Red dots represent locomotion.
9CORTICAL HEATING AND COOLING BY LOCOMOTION AND ANESTHESIA
J Neurophysiol • doi:10.1152/jn.00046.2015 • www.jn.org
F8
COLOR
COLOR
F9
tapraid4/z9k-neurop/z9k-neurop/z9k01215/z9k3143d15z xppws S#1 5/29/15 11:29 MS: JN-00046-2015 Ini: 08/dmp/ss
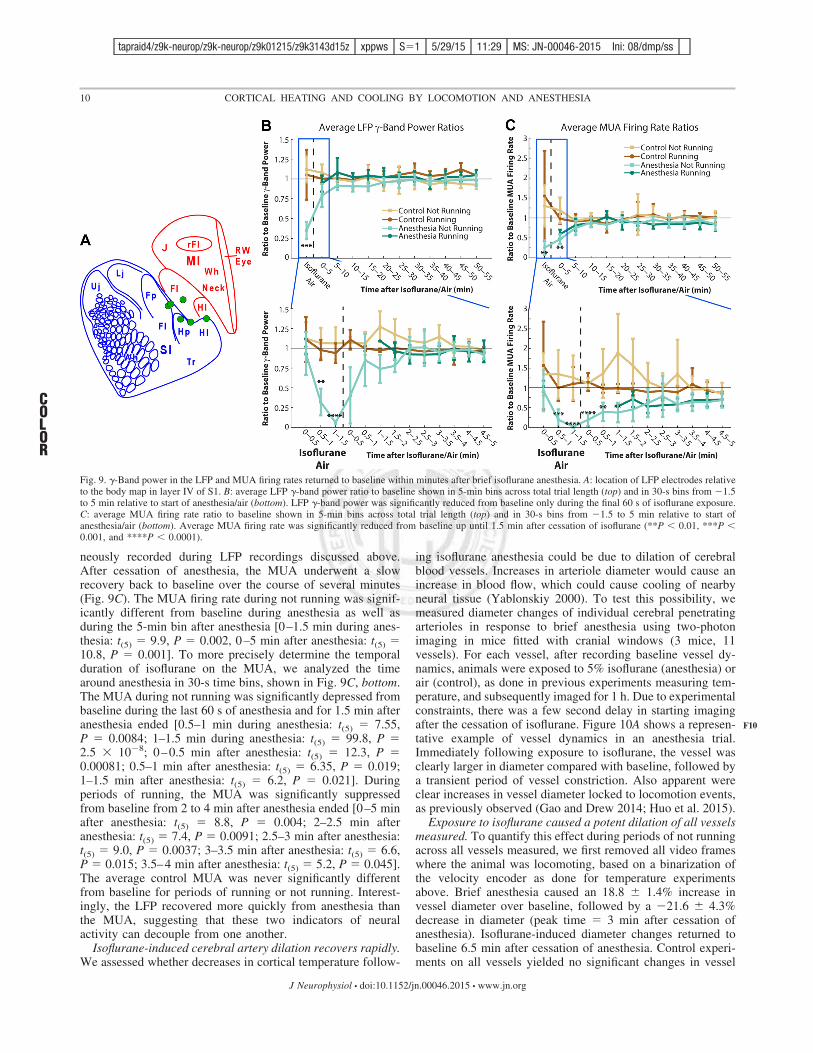
neously recorded during LFP recordings discussed above.After cessation of anesthesia, the MUA underwent a slowrecovery back to baseline over the course of several minutes(Fig. 9C). The MUA firing rate during not running was signif-icantly different from baseline during anesthesia as well asduring the 5-min bin after anesthesia [0–1.5 min during anes-thesia: t(5) # 9.9, P # 0.002, 0–5 min after anesthesia: t(5) #10.8, P # 0.001]. To more precisely determine the temporalduration of isoflurane on the MUA, we analyzed the timearound anesthesia in 30-s time bins, shown in Fig. 9C, bottom.The MUA during not running was significantly depressed frombaseline during the last 60 s of anesthesia and for 1.5 min afteranesthesia ended [0.5–1 min during anesthesia: t(5) # 7.55,P # 0.0084; 1–1.5 min during anesthesia: t(5) # 99.8, P #2.5 & 10(8; 0–0.5 min after anesthesia: t(5) # 12.3, P #0.00081; 0.5–1 min after anesthesia: t(5) # 6.35, P # 0.019;1–1.5 min after anesthesia: t(5) # 6.2, P # 0.021]. Duringperiods of running, the MUA was significantly suppressedfrom baseline from 2 to 4 min after anesthesia ended [0–5 minafter anesthesia: t(5) # 8.8, P # 0.004; 2–2.5 min afteranesthesia: t(5) # 7.4, P # 0.0091; 2.5–3 min after anesthesia:t(5) # 9.0, P # 0.0037; 3–3.5 min after anesthesia: t(5) # 6.6,P # 0.015; 3.5–4 min after anesthesia: t(5) # 5.2, P # 0.045].The average control MUA was never significantly differentfrom baseline for periods of running or not running. Interest-ingly, the LFP recovered more quickly from anesthesia thanthe MUA, suggesting that these two indicators of neuralactivity can decouple from one another.
Isoflurane-induced cerebral artery dilation recovers rapidly.We assessed whether decreases in cortical temperature follow-
ing isoflurane anesthesia could be due to dilation of cerebralblood vessels. Increases in arteriole diameter would cause anincrease in blood flow, which could cause cooling of nearbyneural tissue (Yablonskiy 2000). To test this possibility, wemeasured diameter changes of individual cerebral penetratingarterioles in response to brief anesthesia using two-photonimaging in mice fitted with cranial windows (3 mice, 11vessels). For each vessel, after recording baseline vessel dy-namics, animals were exposed to 5% isoflurane (anesthesia) orair (control), as done in previous experiments measuring tem-perature, and subsequently imaged for 1 h. Due to experimentalconstraints, there was a few second delay in starting imagingafter the cessation of isoflurane. Figure 10A shows a represen-tative example of vessel dynamics in an anesthesia trial.Immediately following exposure to isoflurane, the vessel wasclearly larger in diameter compared with baseline, followed bya transient period of vessel constriction. Also apparent wereclear increases in vessel diameter locked to locomotion events,as previously observed (Gao and Drew 2014; Huo et al. 2015).
Exposure to isoflurane caused a potent dilation of all vesselsmeasured. To quantify this effect during periods of not runningacross all vessels measured, we first removed all video frameswhere the animal was locomoting, based on a binarization ofthe velocity encoder as done for temperature experimentsabove. Brief anesthesia caused an 18.8 $ 1.4% increase invessel diameter over baseline, followed by a (21.6 $ 4.3%decrease in diameter (peak time # 3 min after cessation ofanesthesia). Isoflurane-induced diameter changes returned tobaseline 6.5 min after cessation of anesthesia. Control experi-ments on all vessels yielded no significant changes in vessel
Fig. 9. !-Band power in the LFP and MUA firing rates returned to baseline within minutes after brief isoflurane anesthesia. A: location of LFP electrodes relativeto the body map in layer IV of S1. B: average LFP !-band power ratio to baseline shown in 5-min bins across total trial length (top) and in 30-s bins from (1.5to 5 min relative to start of anesthesia/air (bottom). LFP !-band power was significantly reduced from baseline only during the final 60 s of isoflurane exposure.C: average MUA firing rate ratio to baseline shown in 5-min bins across total trial length (top) and in 30-s bins from (1.5 to 5 min relative to start ofanesthesia/air (bottom). Average MUA firing rate was significantly reduced from baseline up until 1.5 min after cessation of isoflurane (**P ' 0.01, ***P '0.001, and ****P ' 0.0001).
10 CORTICAL HEATING AND COOLING BY LOCOMOTION AND ANESTHESIA
J Neurophysiol • doi:10.1152/jn.00046.2015 • www.jn.org
COLOR
F10
tapraid4/z9k-neurop/z9k-neurop/z9k01215/z9k3143d15z xppws S#1 5/29/15 11:29 MS: JN-00046-2015 Ini: 08/dmp/ss
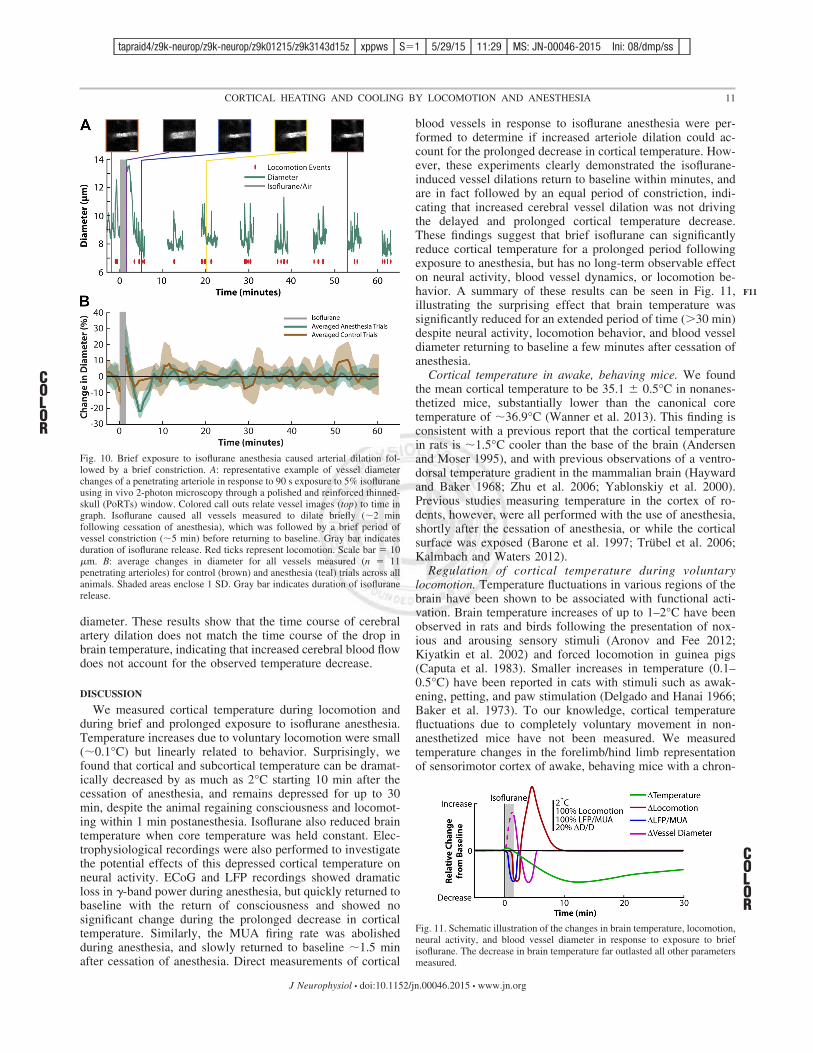
diameter. These results show that the time course of cerebralartery dilation does not match the time course of the drop inbrain temperature, indicating that increased cerebral blood flowdoes not account for the observed temperature decrease.
DISCUSSION
We measured cortical temperature during locomotion andduring brief and prolonged exposure to isoflurane anesthesia.Temperature increases due to voluntary locomotion were small(!0.1°C) but linearly related to behavior. Surprisingly, wefound that cortical and subcortical temperature can be dramat-ically decreased by as much as 2°C starting 10 min after thecessation of anesthesia, and remains depressed for up to 30min, despite the animal regaining consciousness and locomot-ing within 1 min postanesthesia. Isoflurane also reduced braintemperature when core temperature was held constant. Elec-trophysiological recordings were also performed to investigatethe potential effects of this depressed cortical temperature onneural activity. ECoG and LFP recordings showed dramaticloss in !-band power during anesthesia, but quickly returned tobaseline with the return of consciousness and showed nosignificant change during the prolonged decrease in corticaltemperature. Similarly, the MUA firing rate was abolishedduring anesthesia, and slowly returned to baseline !1.5 minafter cessation of anesthesia. Direct measurements of cortical
blood vessels in response to isoflurane anesthesia were per-formed to determine if increased arteriole dilation could ac-count for the prolonged decrease in cortical temperature. How-ever, these experiments clearly demonstrated the isoflurane-induced vessel dilations return to baseline within minutes, andare in fact followed by an equal period of constriction, indi-cating that increased cerebral vessel dilation was not drivingthe delayed and prolonged cortical temperature decrease.These findings suggest that brief isoflurane can significantlyreduce cortical temperature for a prolonged period followingexposure to anesthesia, but has no long-term observable effecton neural activity, blood vessel dynamics, or locomotion be-havior. A summary of these results can be seen in Fig. 11,illustrating the surprising effect that brain temperature wassignificantly reduced for an extended period of time ("30 min)despite neural activity, locomotion behavior, and blood vesseldiameter returning to baseline a few minutes after cessation ofanesthesia.
Cortical temperature in awake, behaving mice. We foundthe mean cortical temperature to be 35.1 $ 0.5°C in nonanes-thetized mice, substantially lower than the canonical coretemperature of !36.9°C (Wanner et al. 2013). This finding isconsistent with a previous report that the cortical temperaturein rats is !1.5°C cooler than the base of the brain (Andersenand Moser 1995), and with previous observations of a ventro-dorsal temperature gradient in the mammalian brain (Haywardand Baker 1968; Zhu et al. 2006; Yablonskiy et al. 2000).Previous studies measuring temperature in the cortex of ro-dents, however, were all performed with the use of anesthesia,shortly after the cessation of anesthesia, or while the corticalsurface was exposed (Barone et al. 1997; Trübel et al. 2006;Kalmbach and Waters 2012).
Regulation of cortical temperature during voluntarylocomotion. Temperature fluctuations in various regions of thebrain have been shown to be associated with functional acti-vation. Brain temperature increases of up to 1–2°C have beenobserved in rats and birds following the presentation of nox-ious and arousing sensory stimuli (Aronov and Fee 2012;Kiyatkin et al. 2002) and forced locomotion in guinea pigs(Caputa et al. 1983). Smaller increases in temperature (0.1–0.5°C) have been reported in cats with stimuli such as awak-ening, petting, and paw stimulation (Delgado and Hanai 1966;Baker et al. 1973). To our knowledge, cortical temperaturefluctuations due to completely voluntary movement in non-anesthetized mice have not been measured. We measuredtemperature changes in the forelimb/hind limb representationof sensorimotor cortex of awake, behaving mice with a chron-
Fig. 10. Brief exposure to isoflurane anesthesia caused arterial dilation fol-lowed by a brief constriction. A: representative example of vessel diameterchanges of a penetrating arteriole in response to 90 s exposure to 5% isofluraneusing in vivo 2-photon microscopy through a polished and reinforced thinned-skull (PoRTs) window. Colored call outs relate vessel images (top) to time ingraph. Isoflurane caused all vessels measured to dilate briefly (!2 minfollowing cessation of anesthesia), which was followed by a brief period ofvessel constriction (!5 min) before returning to baseline. Gray bar indicatesduration of isoflurane release. Red ticks represent locomotion. Scale bar # 10"m. B: average changes in diameter for all vessels measured (n # 11penetrating arterioles) for control (brown) and anesthesia (teal) trials across allanimals. Shaded areas enclose 1 SD. Gray bar indicates duration of isofluranerelease.
Fig. 11. Schematic illustration of the changes in brain temperature, locomotion,neural activity, and blood vessel diameter in response to exposure to briefisoflurane. The decrease in brain temperature far outlasted all other parametersmeasured.
11CORTICAL HEATING AND COOLING BY LOCOMOTION AND ANESTHESIA
J Neurophysiol • doi:10.1152/jn.00046.2015 • www.jn.org
COLOR
F11
COLOR
tapraid4/z9k-neurop/z9k-neurop/z9k01215/z9k3143d15z xppws S#1 5/29/15 11:29 MS: JN-00046-2015 Ini: 08/dmp/ss
ically implanted thermocouple and found that locomotiondrove small (!0.1°C) but reliable increases in corticaltemperature.
Small temperature increases following locomotion werelikely due to multiple factors. Locomotion raises the coretemperature (de Castro 1980; Wanner et al. 2013). Addition-ally, heat from increased metabolic activity in the local corticalneurons during locomotion (Huo et al. 2014) is likely tocontribute substantially to brain temperature changes (Yablon-skiy et al. 2000; Kiyatkin et al. 2002; Trübel et al. 2006). Thecross-covariance plot and linear response models (Fig. 2, B andC) show that increases in cortical temperature slightly precedelocomotion onset, indicating that increased neural activitylikely drives increases in cortical temperature. The linearmodel was very effective at capturing the measured changes incortical temperature, evidence that cortical temperature wastightly controlled. The biphasic response of temperature tolocomotion specified by the impulse response is reminiscent ofa negative feedback system, where the heat generated by neuralactivity is dissipated by the increased blood flow to the region(Zhu et al. 2006 2009; Yablonskiy et al. 2000), as is known tohappen in sensorimotor cortex during voluntary locomotion(Huo et al. 2014, 2015). Specifically, local increases in neuralactivity during locomotion cause cerebral blood vessels todilate (see Fig. 10A; Huo et al. 2015), and the increased bloodflow could help dissipate neurally generated heat. The smallamplitude of locomotion-induced temperature fluctuations pre-dicted by the model and seen here is unlikely to have anysignificant effect on neural excitability.
Long-duration cooling associated with brief isofluraneanesthesia. Although temperature changes in response to lo-comotion were small, we found that brief exposure to isoflu-rane caused a long-duration depression in cortical and subcor-tical temperature. Previous studies have shown that pentobar-bital sodium dramatically decreases brain and bodytemperature in rats by 3.5–4.5°C, with temperature returning tobaseline 1 h after regaining consciousness (Kiyatkin andBrown 2005). We found that even brief exposure to isofluraneanesthesia until loss of responsiveness caused a significantdecrease (!2°C) in mouse brain temperature for up to 30 min.These temperature decreases continued long after locomotionand neural activity had returned to normal. This result indicatesthat the decrease in cortical temperature we observed due tobrief isoflurane anesthesia is likely not due to a decrease in heatproduction from metabolic processes associated with neuralactivity (Maekawa et al. 1986; Alkire et al. 1997). It is likelythat brief exposure to isoflurane decreases the body tempera-ture for the same time period, thus causing the cortical tem-perature to drop, likely due to a “toxic insult” response toisoflurane (Gordon et al. 1988).
Our experiments maintaining body temperature with a ho-meostatic warming blanket during prolonged anesthesia alsoshowed a significant decrease in cortical and subcortical tem-perature caused by isoflurane (Fig. 4), suggesting that othermechanisms beyond core temperature changes may be respon-sible in this preparation. One mechanism that could be respon-sible for the decrease in brain temperature in these prolongedanesthetic exposures was the decrease in metabolic activityaccompanying the decreased neural activity (Maekawa et al.1986; Alkire et al. 1997). In addition to suppressing homeo-thermic regulation and lowering neuronal activity, isoflurane is
a potent vasodilator (Iida et al. 1998; Masamoto and Kanno2012; Mrozek et al. 2012). Another possible explanation forthe dramatic decreases in cortical temperature we observed isexcessive heat loss through the nasal breathing, which has beenshown to effectively decrease brain temperature in other spe-cies, including humans (Einer-Jensen et al. 2000, 2002). Heatloss through nasal breathing could be augmented by the in-creased surface area of blood vessels both centrally and pe-ripherally in the nasal mucosa, caused by the vasodilatoryeffects of isoflurane (Hayward and Baker 1968; Baker et al.1973; Cabanac and Caputa 1979; Caputa et al. 1983; Blumbergand Moltz 1988;). More recently, investigators have implicatedthe extensive surface area interaction of the cerebrospinal fluidwith the cortical surface as a potential thermal mediator toexplain the much reduced temperature of the cortex comparedwith deeper brain structures at rest (Wang et al. 2014). How-ever, this explanation is speculative.
In summary, the mechanisms causing cortical temperaturedecrease in each of these experiments are likely different. Inthe brief anesthesia experiments, the toxic insult of isofluranelikely drives down core temperature and thus brain temperaturedespite an almost immediate return of neural generated heatand the return of vasodilation back to baseline. In the pro-longed anesthesia experiments where body heat is maintainedwith a warming blanket, vasodilation (in the brain, nasalpassages, and skin) and decreased neural activity are likely thekey players cooling the brain.
Decoupling of brain temperature and neural activity. Braintemperature has traditionally been viewed to play a role infundamental biochemical processes underlying neural activity;however, our results demonstrate decoupling of electrophysi-ological measurements and brain temperature in the postanes-thetic state. The temperature decreases following brief isoflu-rane that we observed have been shown in other preparations toalter excitability (Andersen and Moser 1995), and are compa-rable to temperature changes used to slow motor behaviors(Long and Fee 2008). Multiple studies show that large tem-perature changes of !10°C cause significant changes in spik-ing pattern and transmitter release probability in cortical slices(Volgushev et al. 2004; Hedrick and Waters 2012). Otherstudies have shown that smaller decreases in temperature ofjust a few degrees Celsius affect spiking activity, LFP fluctu-ations in up-down states, and neural excitability (Volgushev etal. 2000a; Reig et al. 2010). Surprisingly, we found that aprolonged 2°C decrease in cortical temperature did not signif-icantly affect !-band power, MUA firing rate, or the amount oflocomotion. While other neural properties may have beenaltered, the unaffected !-band power and MUA suggest thatmuch larger temperature deviations from baseline are neededto significantly affect ECoG, LFP, and MUA measurements inmice. The resilience of neuronal activity to temperature fluc-tuations has been seen in both the crab pyloric central patterngenerator, which can maintain rhythmicity of firing despitewide changes in temperature (Rinberg et al. 2013; Soofi et al.2014), and in the lack of learning impairments in hypothermicrodents (Moser et al. 1993; Moser and Andersen 1994; Ander-sen and Moser 1995). Thus, our data suggest that electricalactivity can be robust despite alterations in underlying meta-bolic and biochemical processes. In summary, while our mea-sures of neural activity were not significantly altered by thedecrease in cortical temperature, other significant biochemical
12 CORTICAL HEATING AND COOLING BY LOCOMOTION AND ANESTHESIA
J Neurophysiol • doi:10.1152/jn.00046.2015 • www.jn.org
tapraid4/z9k-neurop/z9k-neurop/z9k01215/z9k3143d15z xppws S#1 5/29/15 11:29 MS: JN-00046-2015 Ini: 08/dmp/ss
changes may be present and suggest that experimenters becautious in interpreting data from within 30 min after exposureto isoflurane. Furthermore, in light of the inability for bodywarming to warm cortex to its normal, awake temperature,investigators should use caution when interpreting relation-ships between neural activity and temperature in anesthetizeddata. Finally, these data have bearing on what the correct,physiologically relevant temperature should be for in vitrophysiological recordings of cortical neurons to mimic theawake, in vivo animal.
Technical considerations. Although great lengths were takento insulate the craniotomy and thermocouple with dentalacrylic (an excellent thermal insulator), the possibility stillremains that our cortical measurements were artificially lowerthan in an unperturbed cortex due to heat shunting from thethermocouple. This shift, however, would not affect the rela-tive temperature changes measured in response to locomotionor anesthesia. The amount of heat shunting in our preparationwas likely minimal, supported by the fact that our recordedtemperatures match predictions of awake mouse cortex tem-perature (Kalmbach and Waters 2012).
ACKNOWLEDGMENTS
We thank A. Winder for discussions on data analysis and J. Wittenbach fordiscussions on the interpretation of temperature and neural activity.
GRANTS
This work was supported by a Scholar Award from the McKnight Endow-ment Fund for Neuroscience, an award from the American Heart Association(12SDG9130022), National Institute of Neurological and CommunicativeDisorders and Stroke Grants NS-078168 and NS-079737 to P. J. Drew, andARRA funds through NIH Grant NS-070701.
DISCLOSURES
No conflicts of interest, financial or otherwise, are declared by the authors.
AUTHOR CONTRIBUTIONS
Author contributions: M.J.S., J.B.S., D.E.K., and P.J.D. conception anddesign of research; M.J.S., J.B.S., D.E.K., and S.E.G. performed experiments;M.J.S., J.B.S., D.E.K., and B.-X.H. analyzed data; M.J.S., J.B.S., D.E.K.,B.-X.H., and P.J.D. interpreted results of experiments; M.J.S., J.B.S., andD.E.K. prepared figures; M.J.S. and J.B.S. drafted manuscript; M.J.S., J.B.S.,D.E.K., B.-X.H., S.E.G., and P.J.D. edited and revised manuscript; M.J.S.,J.B.S., D.E.K., B.-X.H., S.E.G., and P.J.D. approved final version of manu-script.
REFERENCES
Alkire MT, Haier RJ, Shah NK, Anderson CT. Positron emission tomog-raphy study of regional cerebral metabolism in humans during isofluraneanesthesia. Anesthesiology 86: 549–557, 1997.
Andersen P, Moser EI. Brain temperature and hippocampal function. Hip-pocampus 5: 491–498, 1995.
Aronov D, Fee MS. Natural changes in brain temperature underlie variationsin song tempo during a mating behavior. PLoS One 7: e47856, 2012.
Baker MA, Frye FM, Millet VE. Origin of temperature changes evoked in thebrain by sensory stimulation. Exp Neurol 38: 502–519, 1973.
Barone FC, Feuerstein GZ, White RF. Brain cooling during transient focalischemia provides complete neuroprotection. Neurosci Biobehav Rev 21:31–44, 1997.
Bindman LJ, Lippold OC, Redfearn JW. Comparison of the effects onelectrocortical activity of general body cooling of the surface of the brain.Electroencephalogr Clin Neurophysiol 15: 238–45, 1963.
Blumberg MS, Moltz H. How the nose cools the brain during copulation inthe male rat. Physiol Behav 43: 173–176, 1988.
Cabanac M, Caputa M. Natural selective cooling of the human brain:evidence of its occurrence and magnitude. J Physiol 286: 255–264, 1979.
Caputa M, Ka˛dziela W, Nare˛bski J. Cerebral temperature regulation inresting and running guinea-pigs (Cavia porcellus). J Therm Biol 8: 265–272,1983.
De Castro JM. Core temperature relationships with spontaneous behavior inthe rat. Physiol Behav 25: 69–75, 1980.
Delgado JM, Hanai T. Intracerebral temperatures in free-moving cats. Am JPhysiol 211: 755–769, 1966.
Dombeck DA, Khabbaz AN, Collman F, Adelman TL, Tank DW. Imaginglarge-scale neural activity with cellular resolution in awake, mobile mice.Neuron 56: 43–57, 2007.
Drew PJ, Feldman DE. Intrinsic signal imaging of deprivation-inducedcontraction of whisker representations in rat somatosensory cortex. CerebCortex 19: 331–348, 2009.
Drew PJ, Shih AY, Driscoll JD, Knutsen PM, Blinder P, Davalos D,Akassoglou K, Tsai PS, Kleinfeld D. Chronic optical access through apolished and reinforced thinned skull. Nat Methods 7: 981–984, 2010.
Drew PJ, Shih AY, Kleinfeld D. Fluctuating and sensory-induced vasody-namics in rodent cortex extend arteriole capacity. Proc Natl Acad Sci USA108: 8473–8478, 2011.
Dubé CM, Brewster AL, Richichi C, Zha Q, Baram TZ. Fever, febrileseizures and epilepsy. Trends Neurosci 30: 490–496, 2007.
Einer-Jensen N, Khorooshi MH, Petersen MB, Svendsen P. Rapid braincooling in intubated pigs through nasal flushing with oxygen: prevention ofbrain hyperthermia. Acta Vet Scand 42: 459–464, 2001.
Einer-Jensen N, Khorooshi MH. Cooling of the brain through oxygenflushing of the nasal cavities in intubated rats: an alternative model fortreatment of brain injury. Exp Brain Res 130: 244–247, 2000.
Faul F, Erdfelder E, Lang AG, Buchner A. G*Power 3: a flexible statisticalpower analysis program for the social, behavioral, and biomedical sciences.Behav Res Methods 39: 175–191, 2007.
Friedberg MH, Lee SM, Ebner FF. Modulation of receptive field propertiesof thalamic somatosensory neurons by the depth of anesthesia. J Neuro-physiol 81: 2243–2252, 1999.
Gao YR, Drew PJ. Determination of vessel cross-sectional area by thresh-olding in Radon space. J Cereb Blood Flow Metab 34: 1180–1187, 2014.
Gordon CJ, Mohler FS, Watkinson WP, Rezvani AH. Temperature regu-lation in laboratory mammals following acute toxic insult. Toxicology 53:161–178, 1988.
Green EL, Coleman DL, Kaliss N, Dagg CP, Russel ES, Fuller JL, StaatsJ, Green MC, Fahey EU. Biology of the Laboratory Mouse (2nd ed.). NewYork, NY: Dover, 1966.
Harvey CD, Collman F, Dombeck DA, Tank DW. Intracellular dynamics ofhippocampal place cells during virtual navigation. Nature 461: 941–946,2009.
Hayton SM, Kriss A, Muller DP. Comparison of the effects of four anaes-thetic agents on somatosensory evoked potentials in the rat. Lab Anim 33:243–251, 1999.
Hayward JN, Baker MA. Role of cerebral arterial blood in the regulation ofbrain temperature in the monkey. Am J Physiol 215: 389–403, 1968.
Hedrick T, Waters J. Effect of temperature on spiking patterns of neocorticallayer 2/3 and layer 6 pyramidal neurons (Abstract). Front Neural Circuits 6:28, 2012.
Hodgkin AL, Katz B. The effect of temperature on the electrical activity ofthe giant axon of the squid. J Physiol 109: 240–249, 1949.
Holtzman D, Obana K, Olson J. Hyperthermia-induced seizures in the ratpup: a model for febrile convulsions in children. Science 213: 1034–1036,1981.
Hudetz AG, Vizuete JA, Pillay S. Differential effects of isoflurane onhigh-frequency and low-frequency ! osscillations in the cerebral cortex andhippocampus in freely moving rats. Anesthesiology 114: 588–595, 2011.
Huo B, Smith JB, Drew PJ. Neurovascular coupling and decoupling in thecortex during voluntary locomotion. J Neurosci 34: 10975–10981, 2014.
Huo BX, Gao YR, Drew PJ. Quantitative separation of arterial and venouscerebral blood volume increases during voluntary locomotion. Neuroimage105: 369–379, 2015.
Iida H, Ohata H, Iida M, Watanabe Y, Dohi S. Isoflurane and sevofluraneinduce vasodilation of cerebral vessels via ATP-sensitive K) channelactivation. Anesthesiology 89: 954–960, 1998.
Kalmbach AS, Waters J. Brain surface temperature under a craniotomy. JNeurophysiol 108: 3138–3146, 2012.
Keller GB, Bonhoeffer T, Hübener M. Sensorimotor mismatch signals inprimary visual cortex of the behaving mouse. Neuron 74: 809–815, 2012.
13CORTICAL HEATING AND COOLING BY LOCOMOTION AND ANESTHESIA
J Neurophysiol • doi:10.1152/jn.00046.2015 • www.jn.org
tapraid4/z9k-neurop/z9k-neurop/z9k01215/z9k3143d15z xppws S#1 5/29/15 11:29 MS: JN-00046-2015 Ini: 08/dmp/ss
Kiyatkin EA, Brown PL. Brain and body temperature homeostasis duringsodium pentobarbital anesthesia with and without body warming in rats.Physiol Behav 84: 563–570, 2005.
Kiyatkin EA. Brain temperature fluctuations during physiological and path-ological conditions. Eur J Appl Physiol 101: 3–17, 2007.
Kiyatkin EA, Brown PL, Wise RA. Brain temperature fluctuation: a reflec-tion of functional neural activation. Eur J Neurosci 16: 164–168, 2002.
Lee AM, Hoy JL, Bonci A, Wilbrecht L, Stryker MP, Niell CM. Identifi-cation of a brainstem circuit regulating visual cortical state in parallel withlocomotion. Neuron 83: 455–466, 2014.
Long MA, Fee MS. Using temperature to analyse temporal dynamics in thesongbird motor pathway. Nature 456: 189–194, 2008.
Maekawa T, Tommasino C, Shapiro HM, Keifer-Goodman J, Kohlen-berger RW. Local cerebral blood flow and glucose utilization duringisoflurane anesthesia in the rat. Anesthesiology 65: 144–151, 1986.
Masamoto K, Kanno I. Anesthesia and the quantitative evaluation of neuro-vascular coupling. J Cereb Blood Flow Metab 32: 1233–1247, 2012.
Mitra P, Bokil H. Observed Brain Dynamics. New York, NY: Oxford UnivPress, 2008.
Moser EI, Andersen P. Conserved spatial learning in cooled rats in spite ofslowing of dentate field potentials. J Neurosci 14: 4458–4466, 1994.
Moser EI, Mathiesen I, Andersen P. Association between brain temperatureand dentate field potentials in exploring and swimming rats. Science 259:1324–1326, 1993.
Mrozek S, Vardon F, Geeraerts T. Brain temperature: physiology andpathophysiology after brain injury (Abstract). Anesthesiol Res Pract 2012:989487, 2012.
Niell CM, Stryker MP. Modulation of visual responses by behavioral state inmouse visual cortex. Neuron 65: 472–479, 2010.
Nguyen QT, Tsai PS, Kleinfeld D. MPScope: a versatile software suite formultiphoton microscopy. J Neurosci Methods 156: 351–359, 2006.
Nybo L. Brain temperature and exercise performance. Exp Physiol 97: 333–339, 2012.
Polack P, Friedman J, Golshani P. Cellular mechanisms of brain state-dependent gain modulation in visual cortex. Nat Neurosci 16: 1331–1339,2013.
Reig R, Mattia M, Compte A, Belmonte C, Sanchez-Vives MV. Tempera-ture modulation of slow and fast cortical rhythms. J Neurophysiol 103:1253–1261, 2010.
Rinberg A, Taylor AL, Marder E. The effects of temperature on the stabilityof a neuronal oscillator. PLoS Comput Biol 9: e1002857, 2013.
Shih AY, Driscoll JD, Drew PJ, Nishimura N, Schaffer CB, Kleinfeld D.Two-photon microscopy as a tool to study blood flow and neurovascularcoupling in the rodent brain. J of Cereb Blood Flow Metab 32: 1277–1309,2012a.
Shih AY, Mateo C, Drew PJ, Tsai PS, Kleinfeld D. A polished andreinforced thinned-skull window for long-term imaging of the mouse brain(Abstract). J Vis Exp 61: 3742, 2012b.
Smith JB, Alloway KD. Rat whisker motor cortex is subdivided into sensory-input and motor-output areas (Abstract). Front Neural Circuits 7: 4, 2013.
Soofi W, Goeritz ML, Kispersky TJ, Prinz AA, Marder E, Stein W. Phasemaintenance in a rhythmic motor pattern during temperature changes invivo. J Neurophysiol 111: 2603–2613, 2014.
Trübel HKF, Sacolick LI, Hyder F. Regional temperature changes in thebrain during somatosensory stimulation. J Cereb Blood Flow Metab 26:68–78, 2006.
Volgushev M, Kudryashov I, Chistiakova M, Mukovski M, Niesmann J,Eysel UT. Probability of transmitter release at neocortical synapses atdifferent temperatures. J Neurophysiol 92: 212–220, 2004.
Volgushev M, Vidyasagar TR, Chistiakova M, Eysel UT. Synaptic trans-mission in the neocortex during reversible cooling. Neuroscience 98: 9–22,2000a.
Volgushev M, Vidyasagar TR, Chistiakova M, Yousef T, Eysel UT.Membrane properties and spike generation in rat visual cortical cells duringreversible cooling. J Physiol 522: 59–76, 2000b.
Wang H, Wang B, Normoyle KP, Jackson K, Spitler K, Sharrock MF,Miller CM, Best C, Llano D, Du R. Brain temperature and its fundamentalproperties: a review for clinical neuroscientists (Abstract). Front Neurosci 8:307, 2014.
Wanner SP, Costa KA, Soares ADN, Cardoso VN, Coimbra CC. Physicalexercise-induced changes in the core body temperature of mice depend moreon ambient temperature than on exercise protocol or intensity. Int J Biome-teorol 58: 1077–1085, 2013.
Yablonskiy DA, Ackerman JJ, Raichle ME. Coupling between changes inhuman brain temperature and oxidative metabolism during prolonged visualstimulation. Proc Natl Acad Sci USA 97: 7603–7608, 2000.
Zhu M, Ackerman JJH, Sukstanskii AL, Yablonskiy DA. How the bodycontrols brain temperature: the temperature shielding effect of cerebralblood flow. J Appl Physiol 101: 1481–1488, 2006.
Zhu M, Ackerman JJH, Yablonskiy DA. Body and brain temperaturecoupling: the critical role of cerebral blood flow. J Comp Physiol B 179:701–710, 2009.
14 CORTICAL HEATING AND COOLING BY LOCOMOTION AND ANESTHESIA
J Neurophysiol • doi:10.1152/jn.00046.2015 • www.jn.org
tapraid4/z9k-neurop/z9k-neurop/z9k01215/z9k3143d15z xppws S#1 5/29/15 11:29 MS: JN-00046-2015 Ini: 08/dmp/ss
JOBNAME: AUTHOR QUERIES PAGE: 1 SESS: 1 OUTPUT: Fri May 29 07:29:19 2015/tapraid4/z9k-neurop/z9k-neurop/z9k01215/z9k3143d15z
AQau—Please confirm the given-names and surnames are identified properly by the colors.! Given-Name, ! Surname
AQ1— AU: Please only make corrections that are essential to correct data errors. Requests forcosmetic and other nonessential changes to figures and text at this final proof stage will not beaccommodated. Please do not undo what may have been edited to conform to APS journalstyle (use of hyphens, quotation marks, italics for certain phrases, non-use of italics for Latinphrases and for emphasis, etc.).
AQ2— AU: Please note that the author list in the abstract line represents the form in which thesenames will appear in many online databases, such as the NCBI/NIH/NLM Pubmed database.Check this carefully, be sure there are no misrepresentations. Please make a note on the proof,if any corrections are needed.
AUTHOR QUERIES
AUTHOR PLEASE ANSWER ALL QUERIES 1


![Locomotion [2014]](https://img.pdfslide.us/doc/110x75/5564e3eed8b42ad3488b4e94/locomotion-2014.jpg)