Embed Size (px)
Citation preview
Appendix ABridge Deck Section Images
127
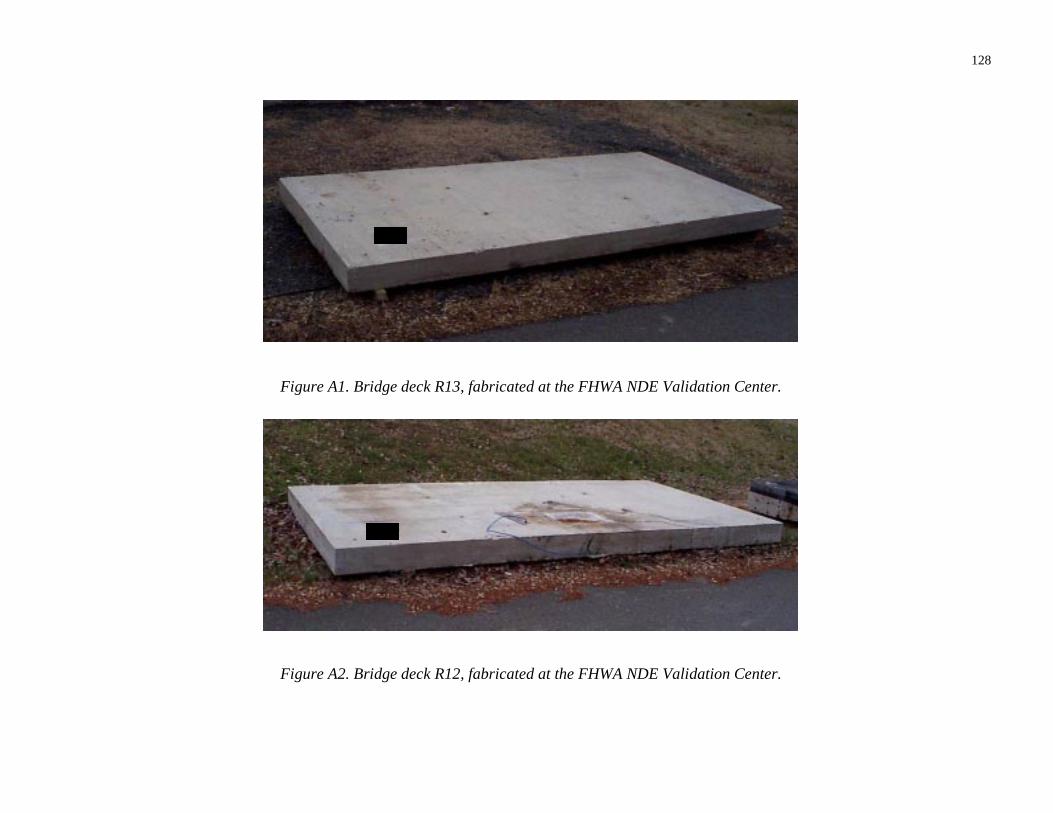
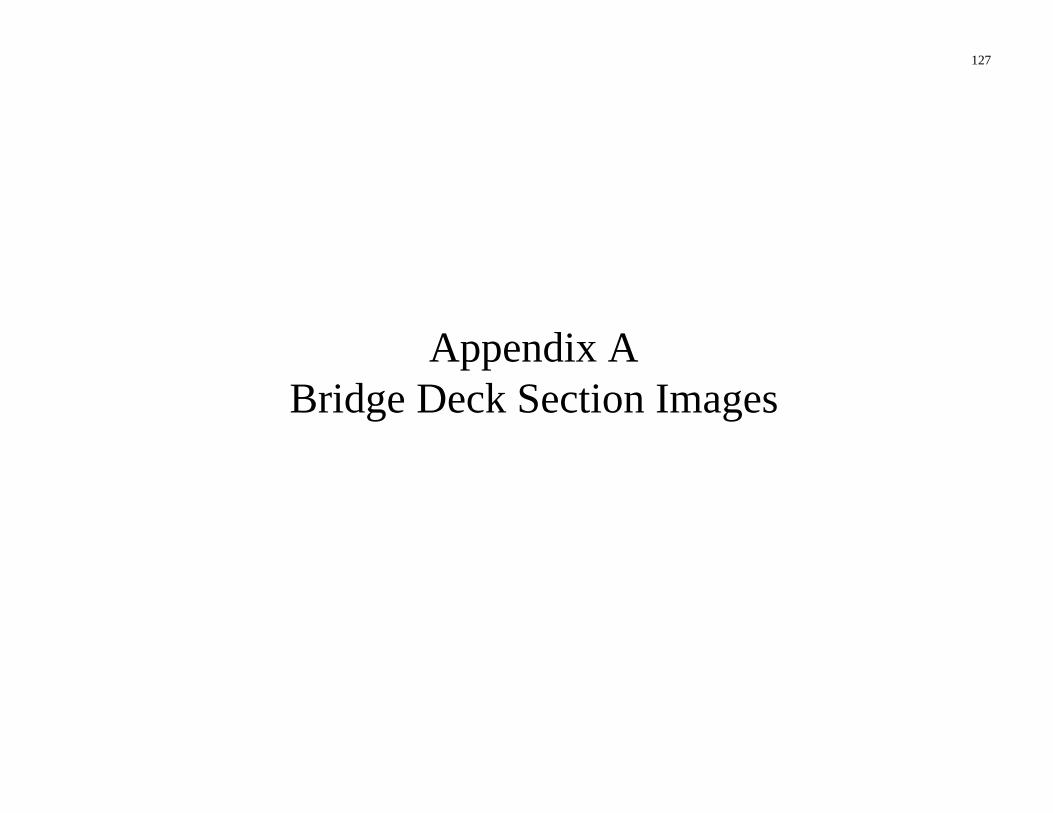
Figure A1. Bridge deck R13, fabricated at the FHWA NDE Validation Center.
Figure A2. Bridge deck R12, fabricated at the FHWA NDE Validation Center.
128
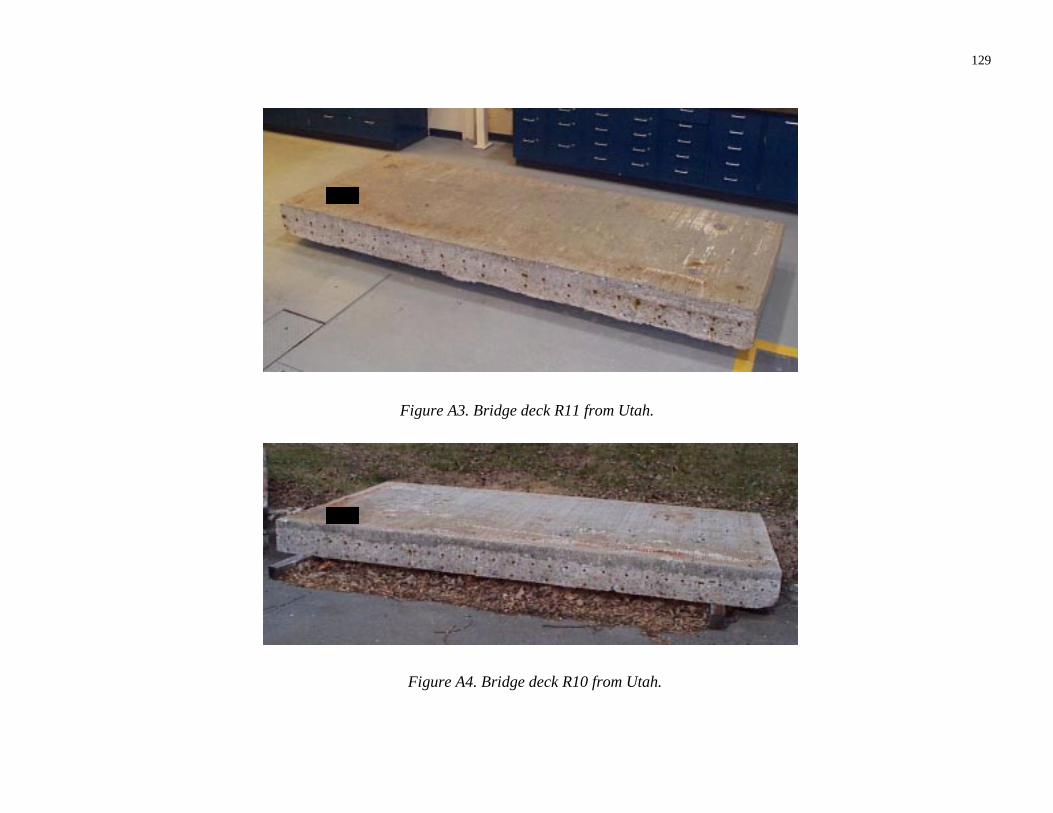
Figure A3. Bridge deck R11 from Utah.
Figure A4. Bridge deck R10 from Utah.
129
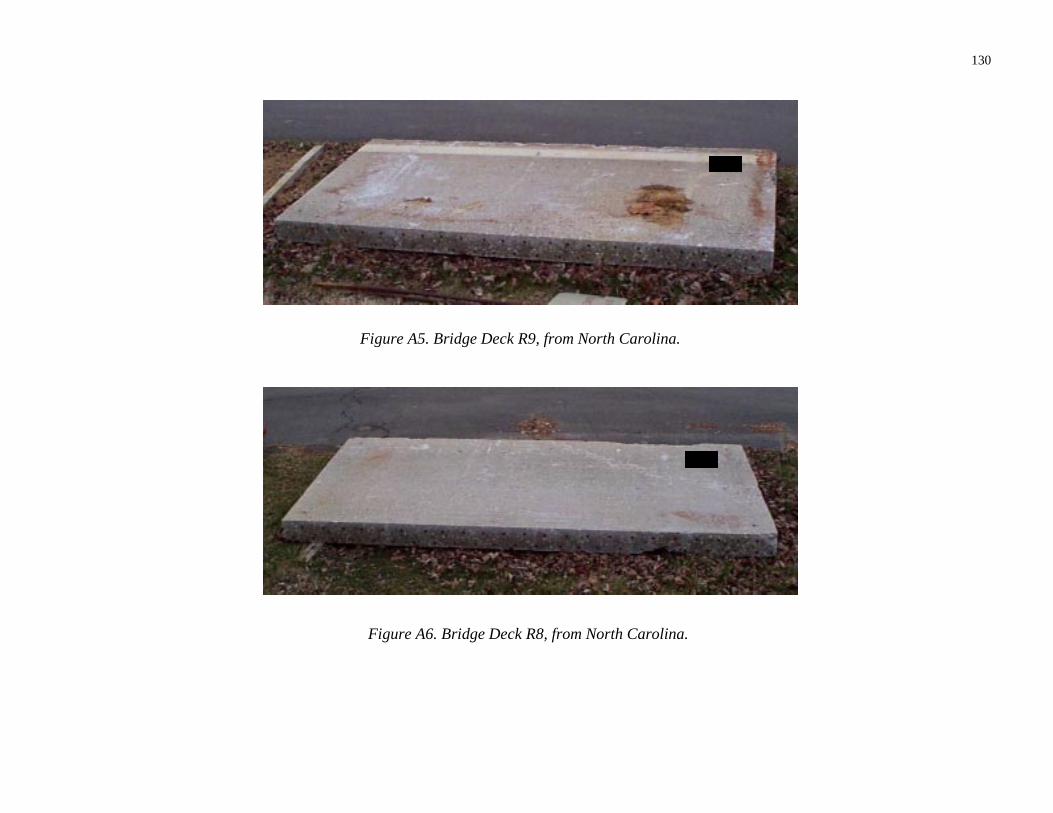
Figure A5. Bridge Deck R9, from North Carolina.
Figure A6. Bridge Deck R8, from North Carolina.
130

Figure A7. Bridge deck R7, from North Carolina.
Figure A8. Bridge deck R6, from Washington, DC.
131
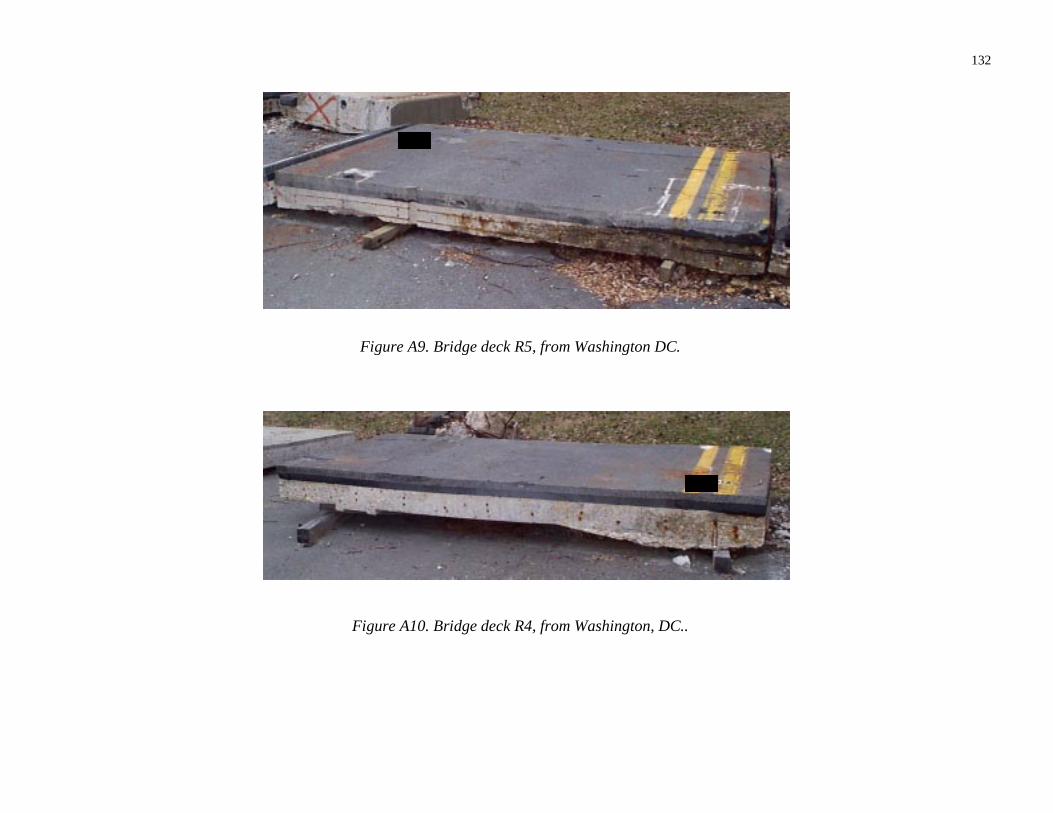
Figure A9. Bridge deck R5, from Washington DC.
Figure A10. Bridge deck R4, from Washington, DC..
132
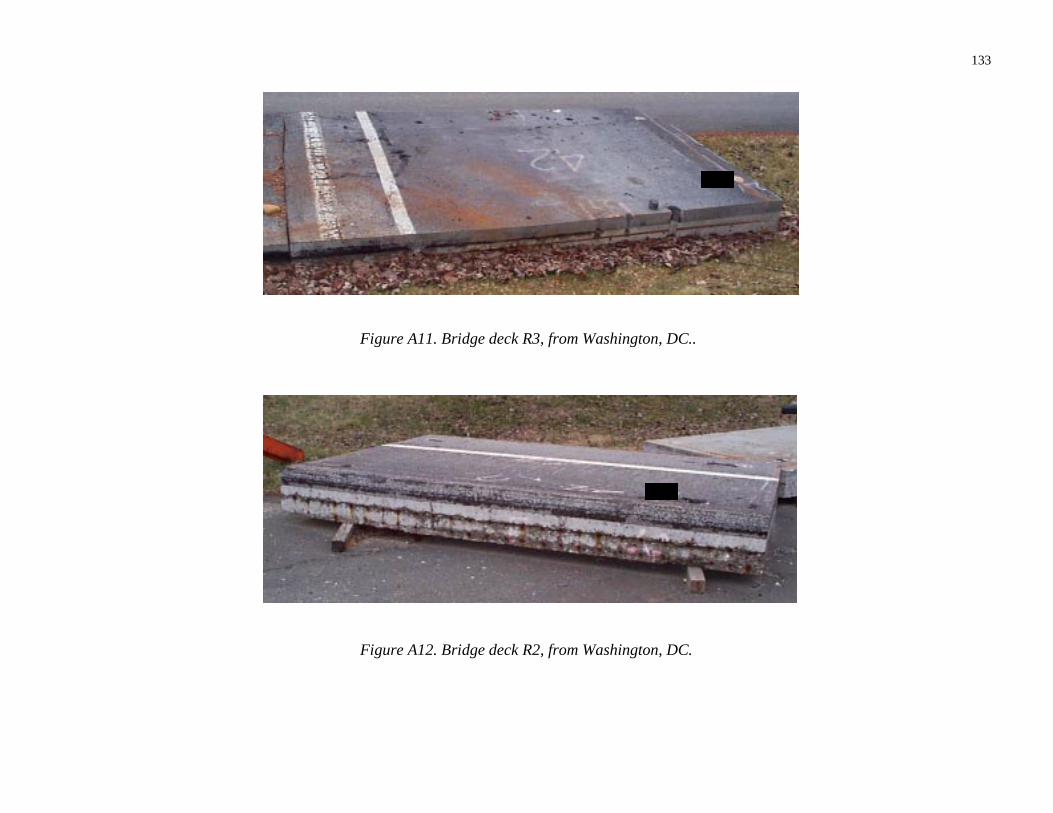
Figure A11. Bridge deck R3, from Washington, DC..
Figure A12. Bridge deck R2, from Washington, DC.
133
Appendix BChain Drag Test Results
134
C1
Grinder MarksCarriage Bolts
Bridge Deck Label
Key:
Shallow Response
Deep Response
15 46 76 107 137 168 198 229 259 290 320 351
15
46
76
107
137
168W
idth
(cm
)
Length (cm)
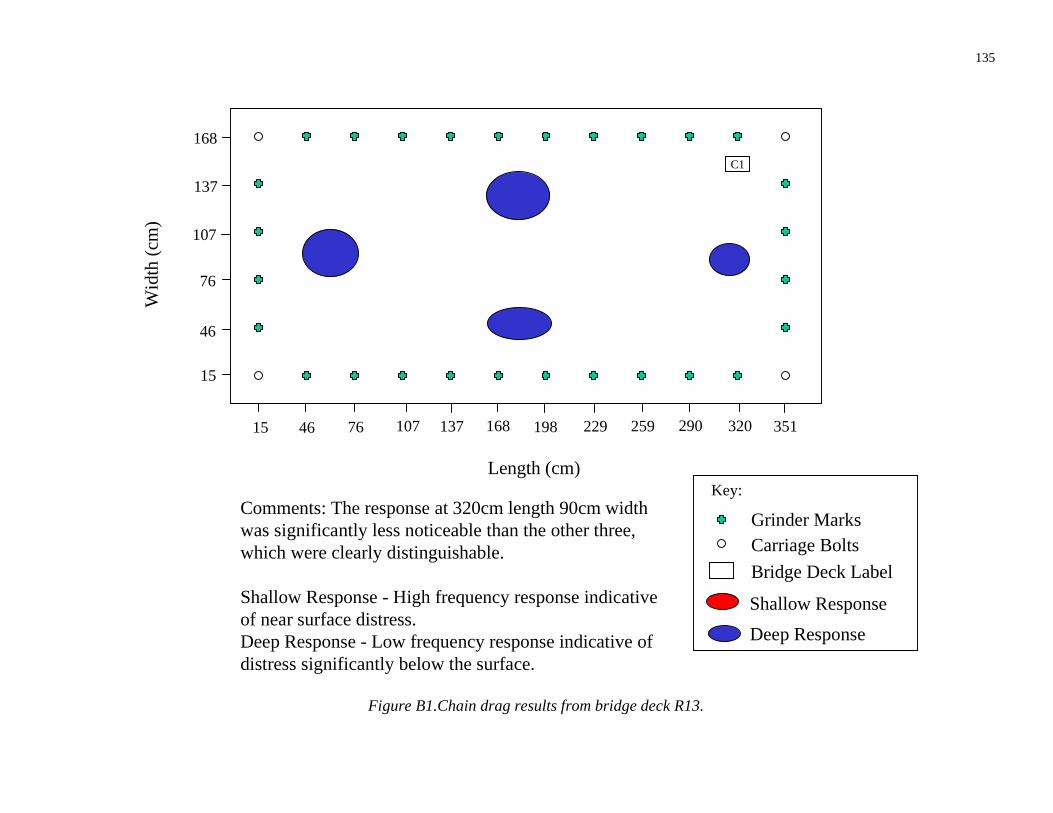
Comments: The response at 320cm length 90cm widthwas significantly less noticeable than the other three,which were clearly distinguishable.
Shallow Response - High frequency response indicativeof near surface distress.Deep Response - Low frequency response indicative ofdistress significantly below the surface.
Figure B1.Chain drag results from bridge deck R13.
135
C2
15 46 76 107 137 168 198 229 259 290 320 351
15
46
76
107
137
168
Wid
th(c
m)
Length (cm)
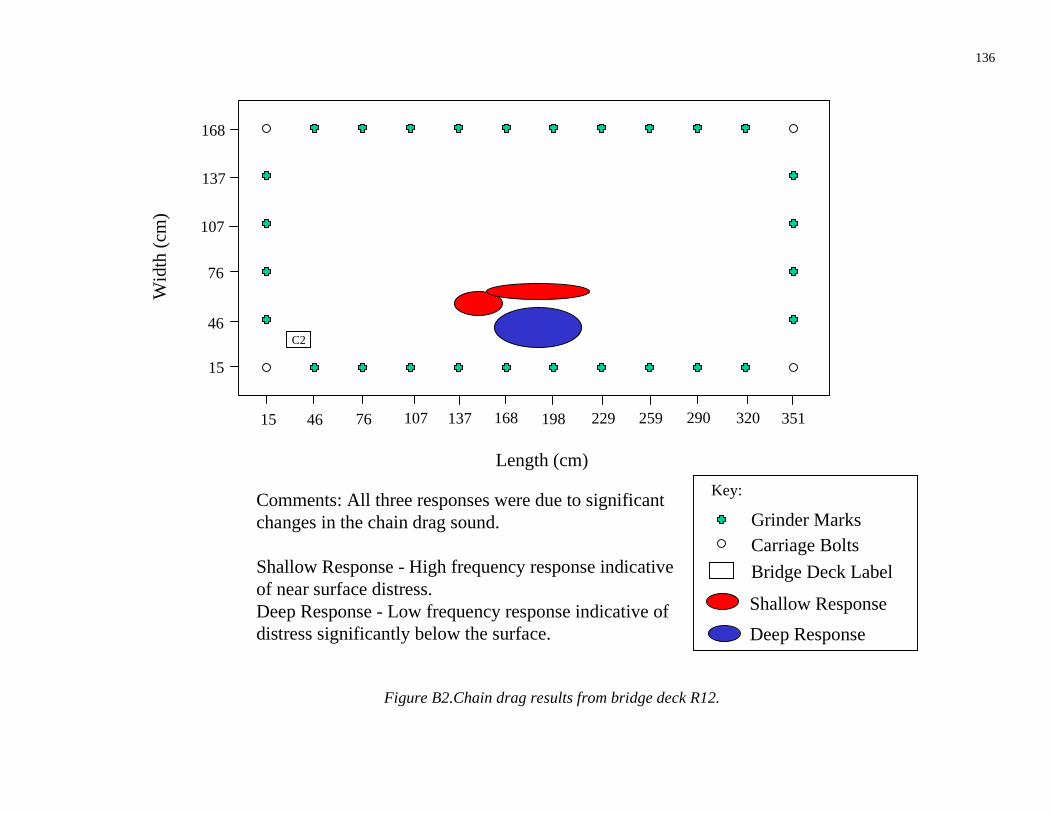
Comments: All three responses were due to significantchanges in the chain drag sound.
Shallow Response - High frequency response indicativeof near surface distress.Deep Response - Low frequency response indicative ofdistress significantly below the surface.
Figure B2.Chain drag results from bridge deck R12.
Grinder MarksCarriage Bolts
Bridge Deck Label
Key:
Shallow Response
Deep Response
136
C3
5 36 66 97 137 168 198 229 259 290 320 351
5
36
66
97
127W
idth
(cm
)
Length (cm)
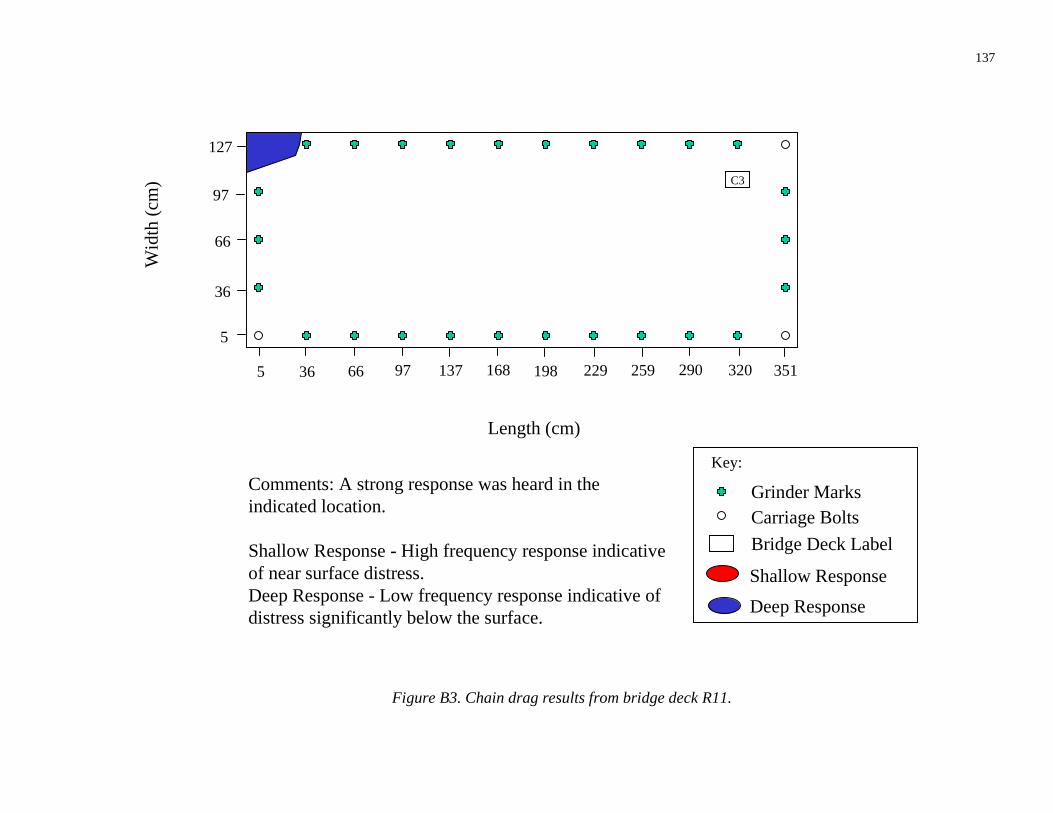
Comments: A strong response was heard in theindicated location.
Shallow Response - High frequency response indicativeof near surface distress.Deep Response - Low frequency response indicative ofdistress significantly below the surface.
Figure B3. Chain drag results from bridge deck R11.
Grinder MarksCarriage Bolts
Bridge Deck Label
Key:
Shallow Response
Deep Response
137
C4
15 46 76 107 137 168 198 229 259 290 320 351
15
46
76
107
137
168
Wid
th(c
m)
Length (cm)
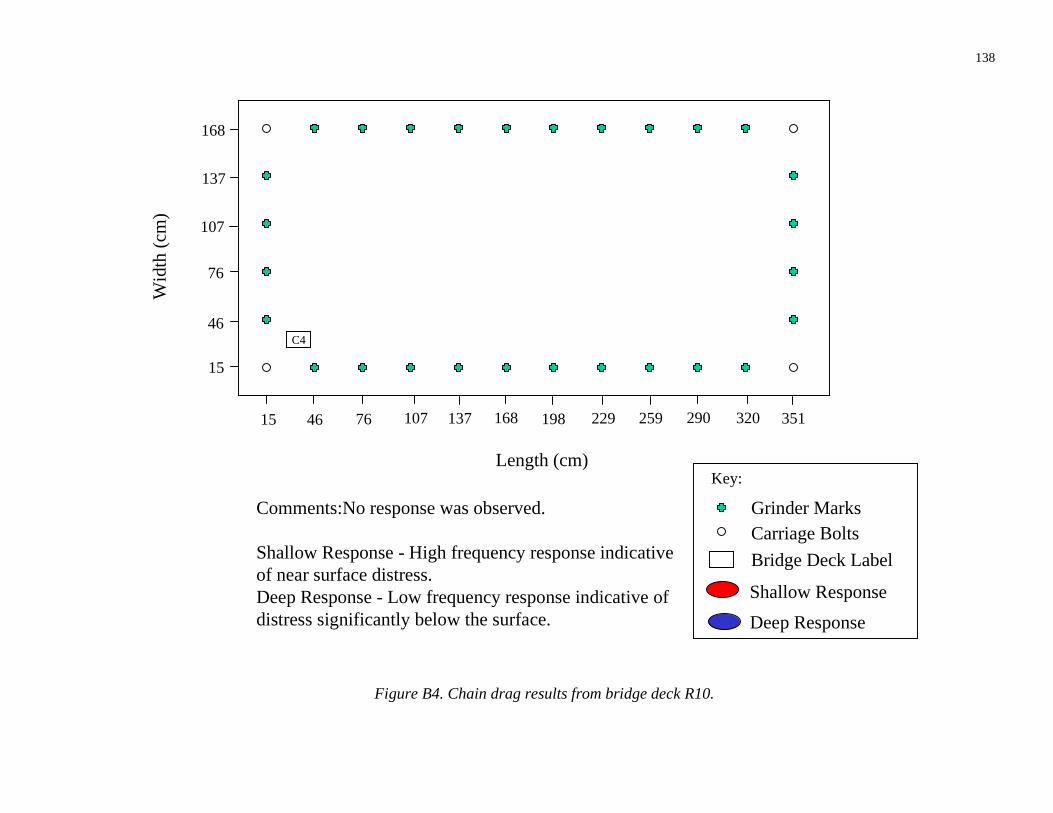
Comments:No response was observed.
Shallow Response - High frequency response indicativeof near surface distress.Deep Response - Low frequency response indicative ofdistress significantly below the surface.
Grinder MarksCarriage Bolts
Bridge Deck Label
Key:
Shallow Response
Deep Response
Figure B4. Chain drag results from bridge deck R10.
138
C5
15 46 76 107 137 168 198 229 259 290 320 351
15
46
76
107
137
168W
idth
(cm
)
Length (cm)
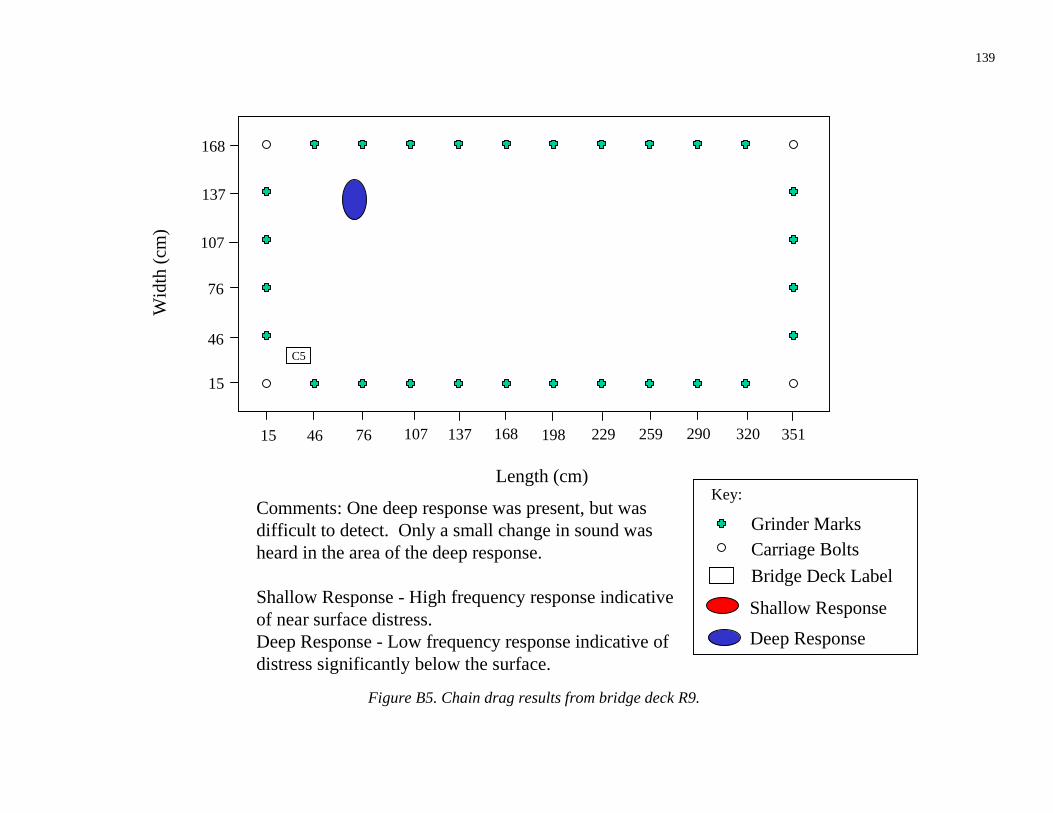
Comments: One deep response was present, but wasdifficult to detect. Only a small change in sound washeard in the area of the deep response.
Shallow Response - High frequency response indicativeof near surface distress.Deep Response - Low frequency response indicative ofdistress significantly below the surface.
Grinder MarksCarriage Bolts
Bridge Deck Label
Key:
Shallow Response
Deep Response
Figure B5. Chain drag results from bridge deck R9.
139

C6
15 46 76 107 137 168 198 229 259 290 320 351
15
46
76
107
137
168W
idth
(cm
)
Length (cm)
Comments:No responses were observed.
Shallow Response - High frequency response indicativeof near surface distress.Deep Response - Low frequency response indicative ofdistress significantly below the surface.
Grinder MarksCarriage Bolts
Bridge Deck Label
Key:
Shallow Response
Deep Response
Figure B6. Chain drag results from bridge deck R8.
140
C7
15 46 76 107 137 168 198 229 259 290 320 351
15
46
76
107
137
168W
idth
(cm
)
Length (cm)
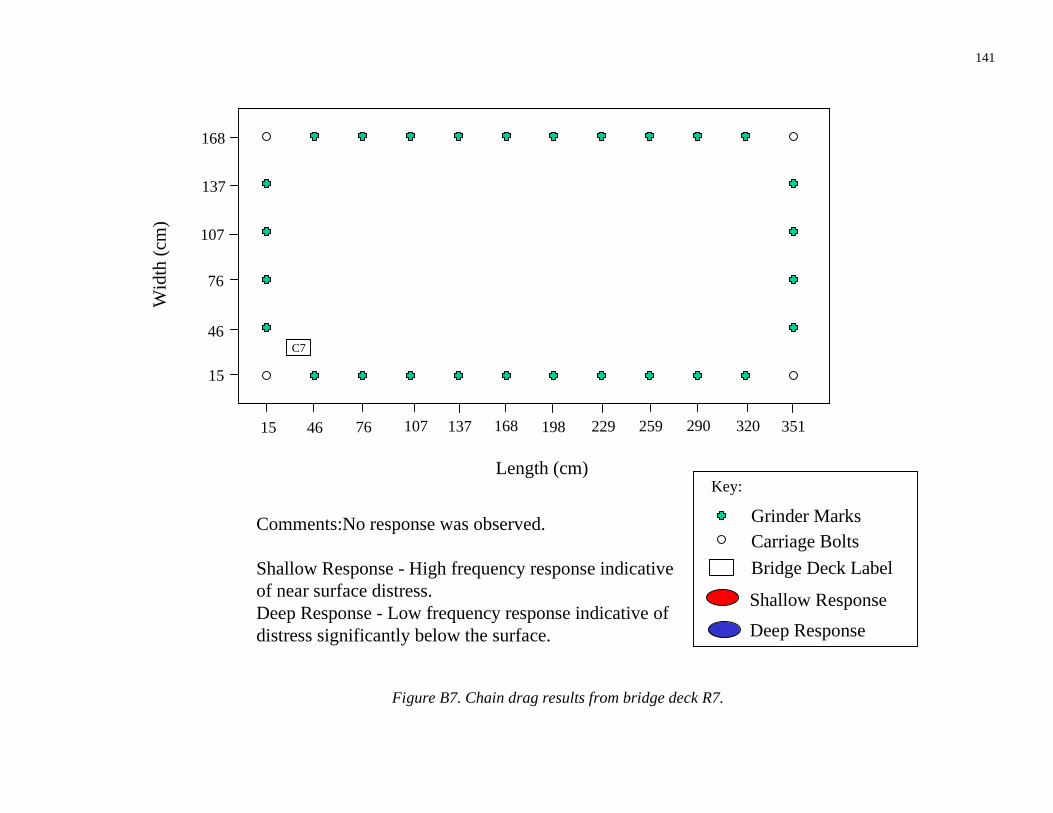
Comments:No response was observed.
Shallow Response - High frequency response indicativeof near surface distress.Deep Response - Low frequency response indicative ofdistress significantly below the surface.
Grinder MarksCarriage Bolts
Bridge Deck Label
Key:
Shallow Response
Deep Response
Figure B7. Chain drag results from bridge deck R7.
141
142
Appendix CFHWA Concrete Bridge Deck Sections
143
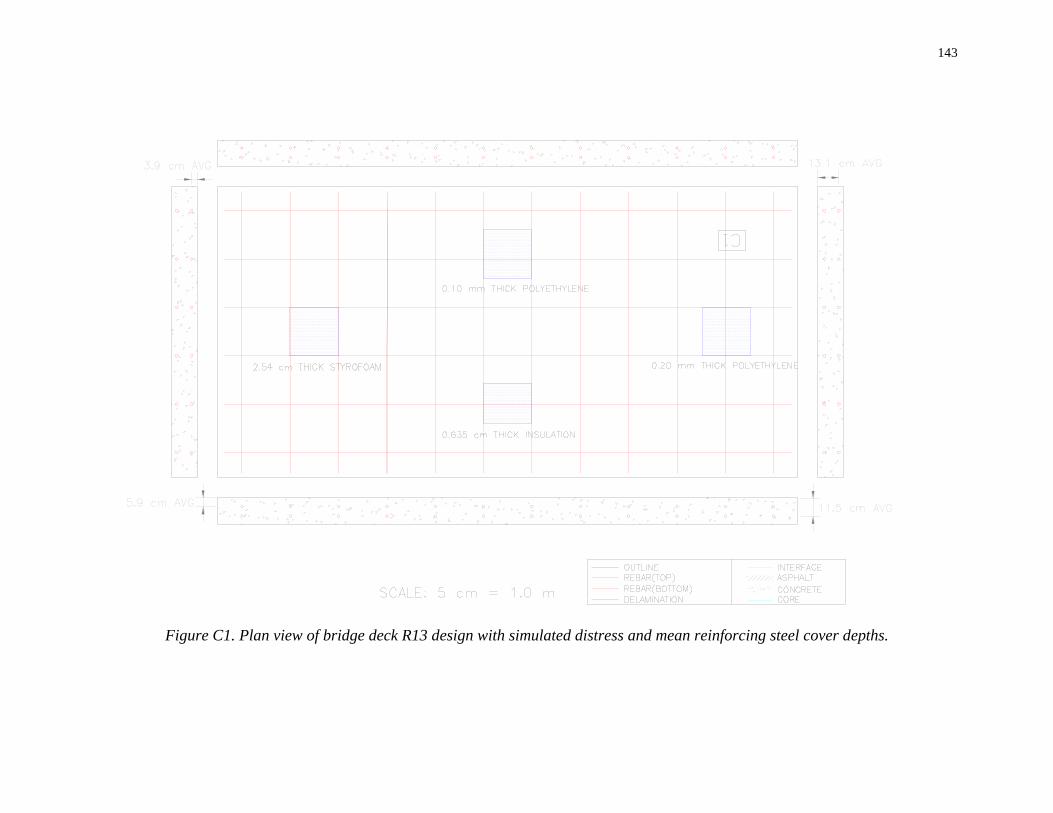
Figure C1. Plan view of bridge deck R13 design with simulated distress and mean reinforcing steel cover depths.
144
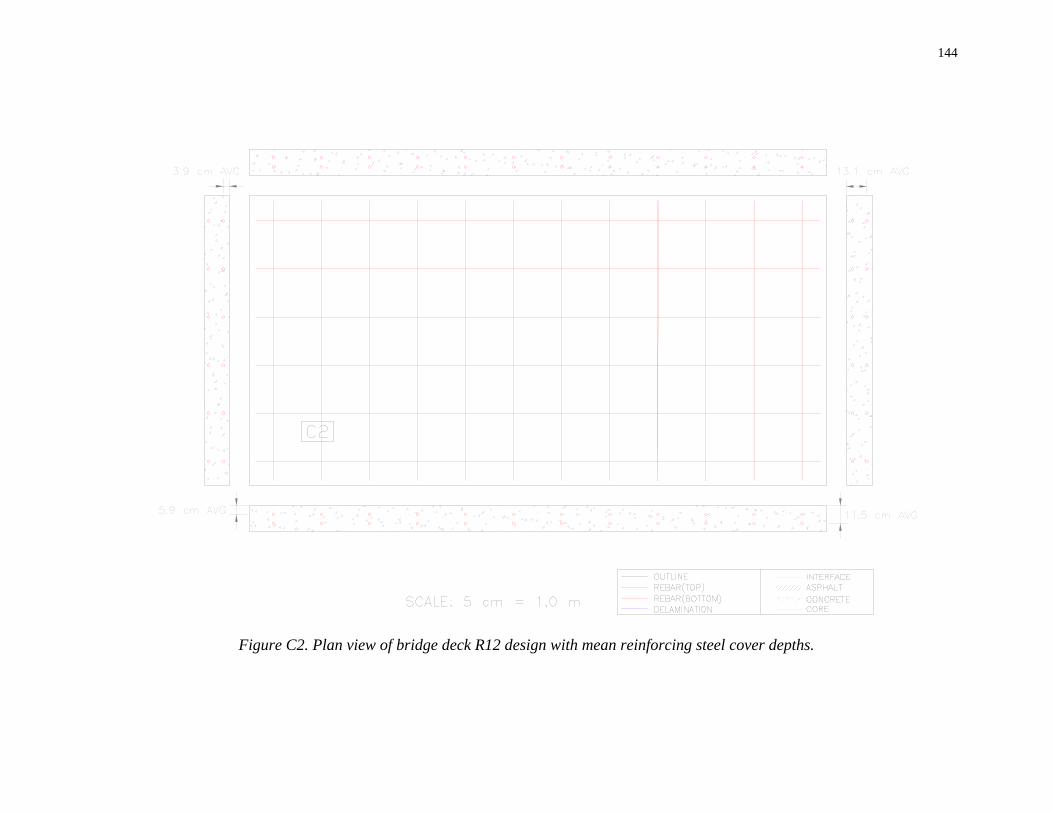
Figure C2. Plan view of bridge deck R12 design with mean reinforcing steel cover depths.
145
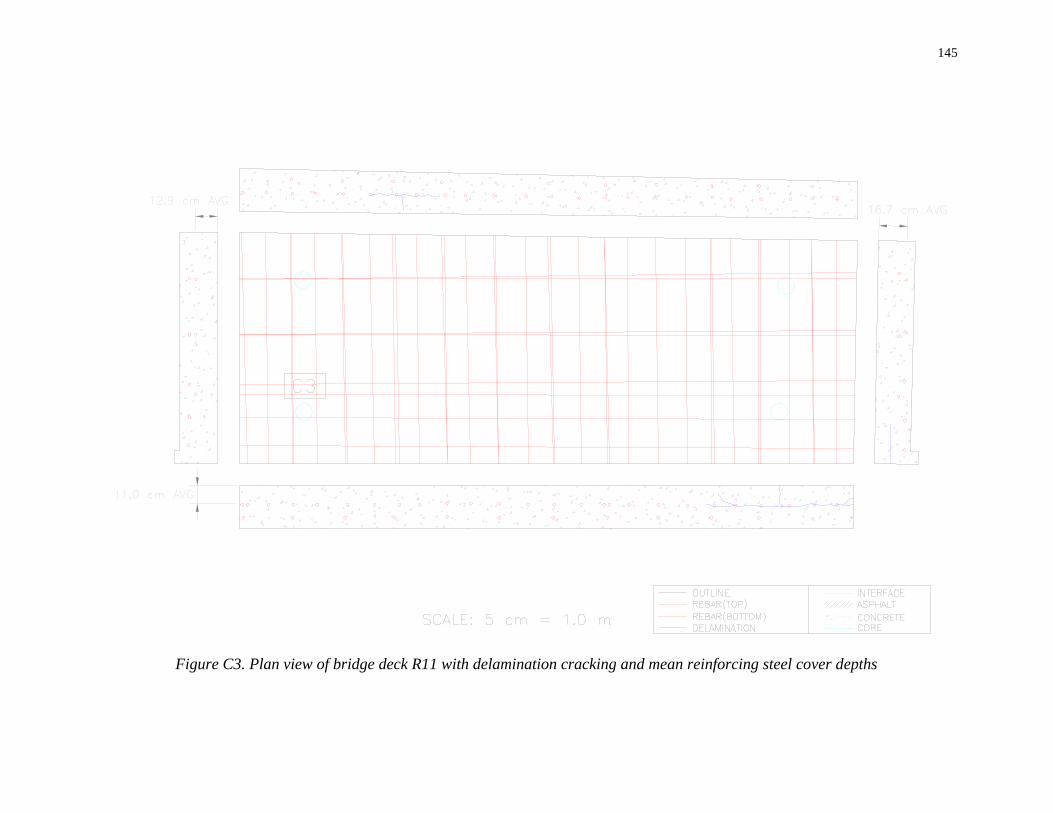
Figure C3. Plan view of bridge deck R11 with delamination cracking and mean reinforcing steel cover depths
146
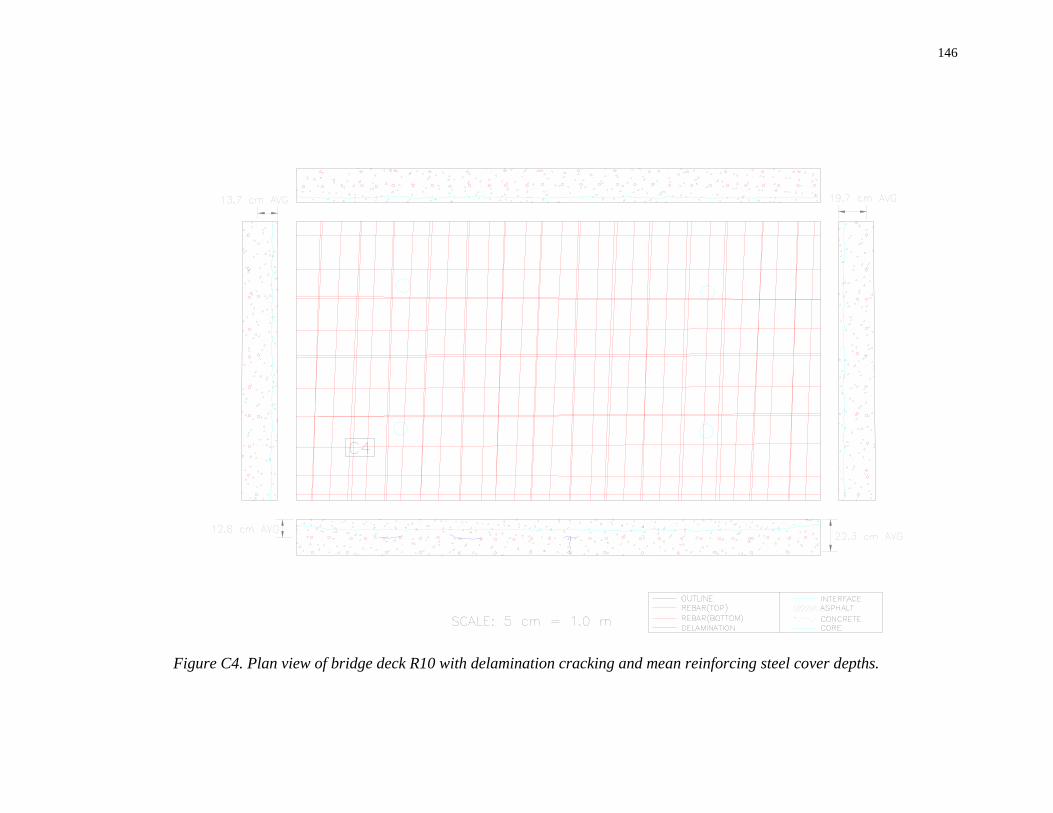
Figure C4. Plan view of bridge deck R10 with delamination cracking and mean reinforcing steel cover depths.
147
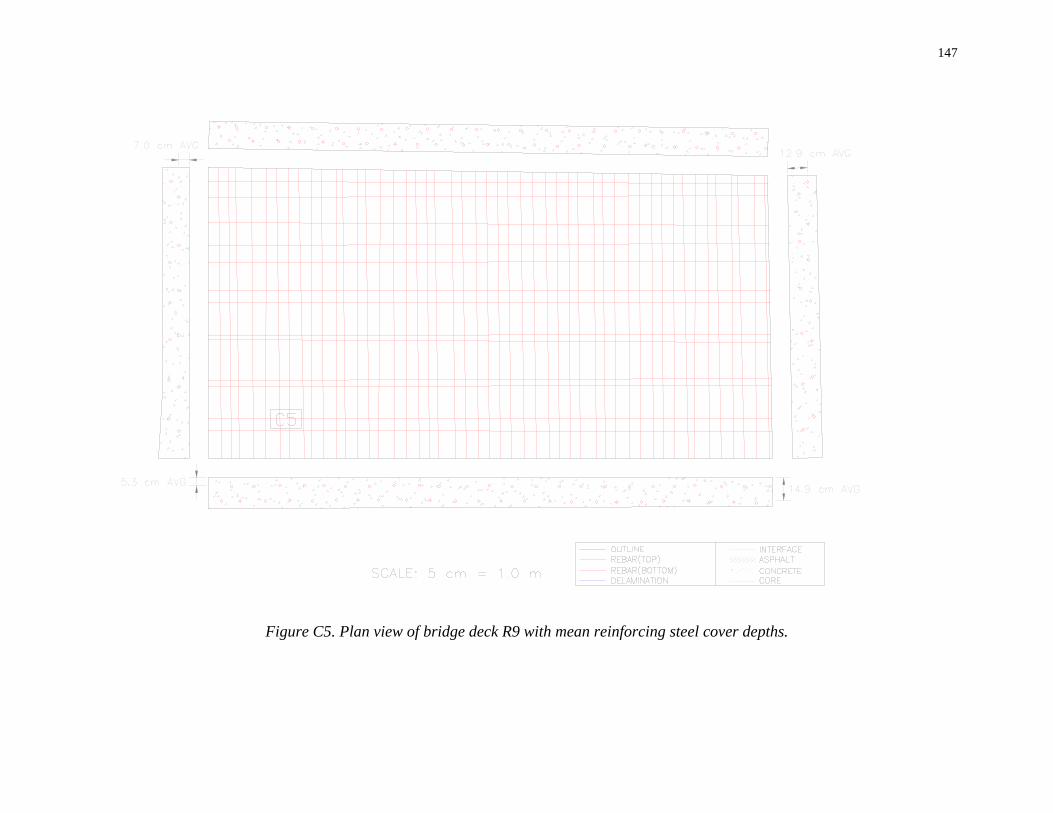
Figure C5. Plan view of bridge deck R9 with mean reinforcing steel cover depths.
148
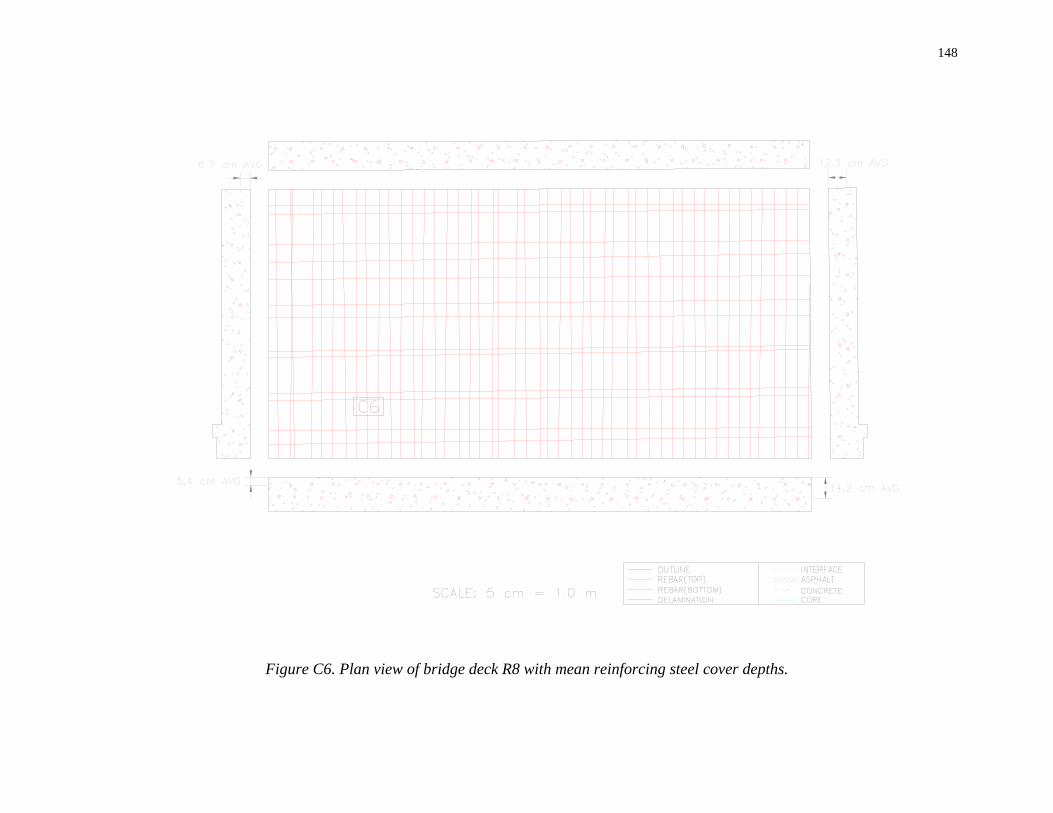
Figure C6. Plan view of bridge deck R8 with mean reinforcing steel cover depths.
149
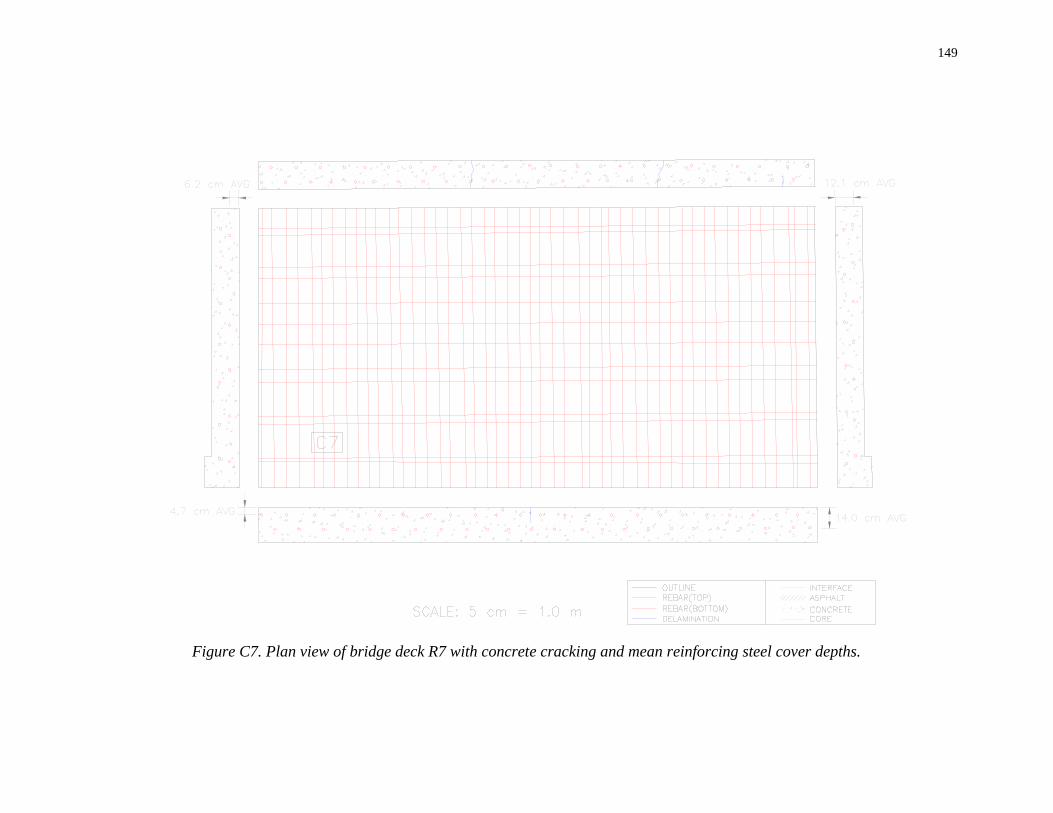
Figure C7. Plan view of bridge deck R7 with concrete cracking and mean reinforcing steel cover depths.
150
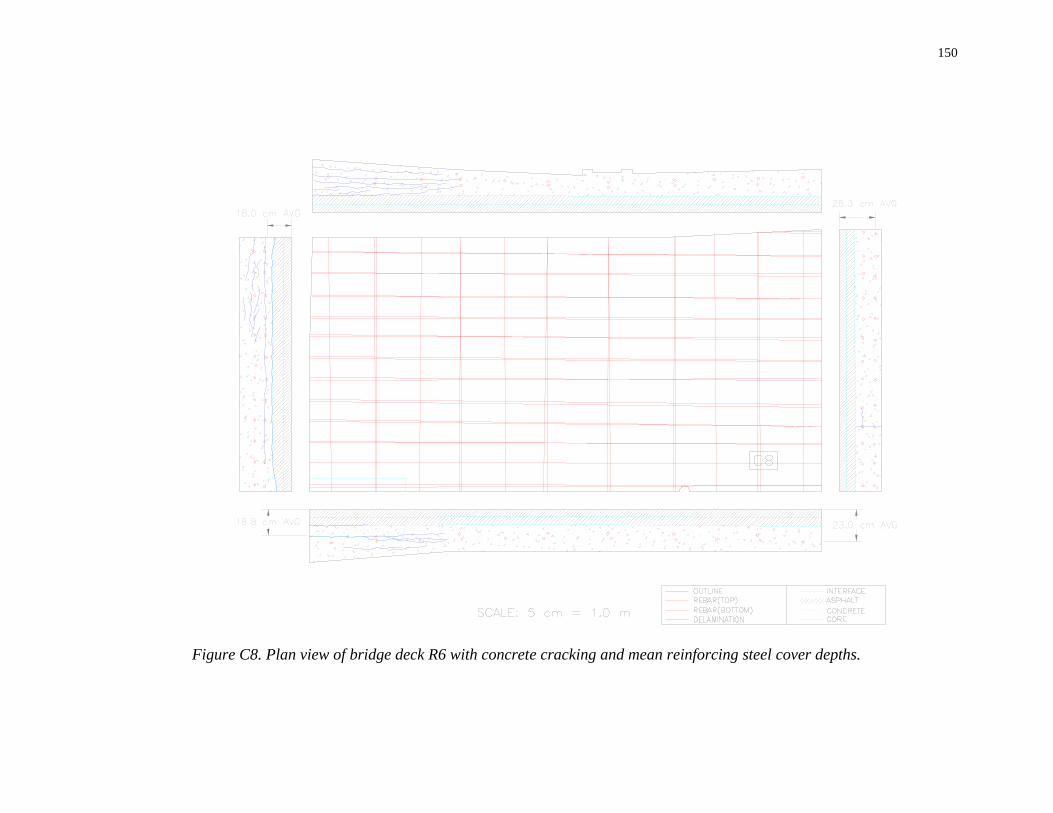
Figure C8. Plan view of bridge deck R6 with concrete cracking and mean reinforcing steel cover depths.
151
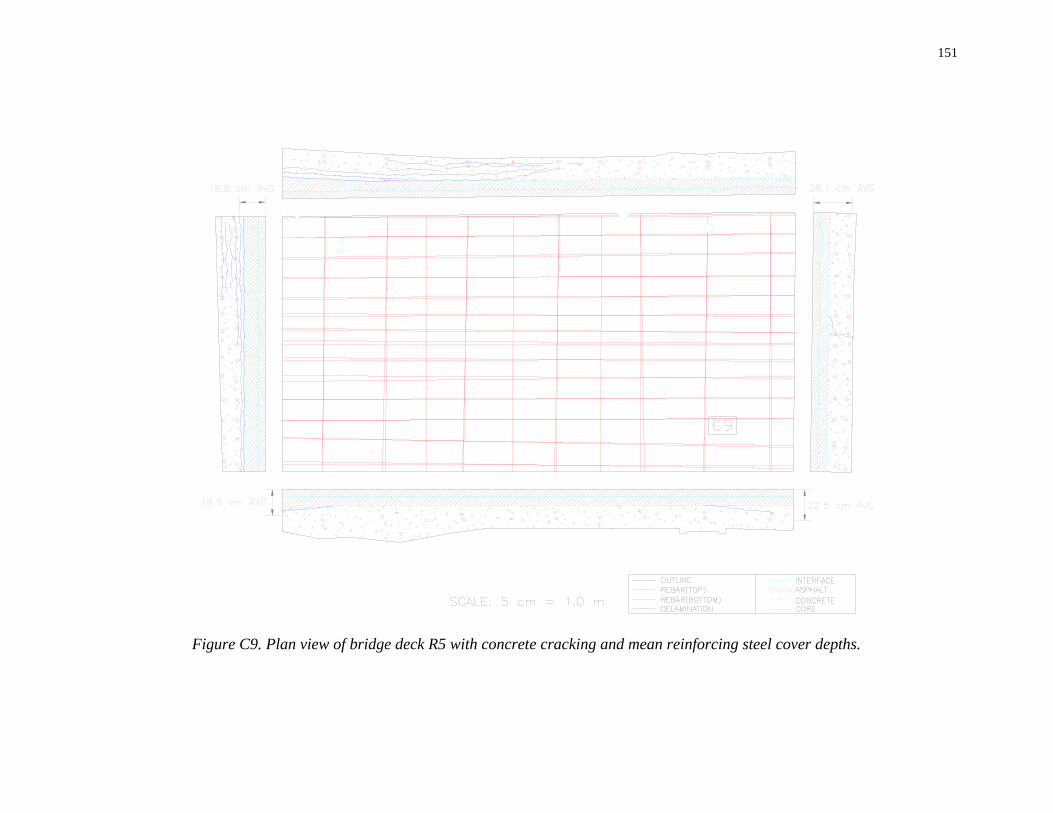
Figure C9. Plan view of bridge deck R5 with concrete cracking and mean reinforcing steel cover depths.
152
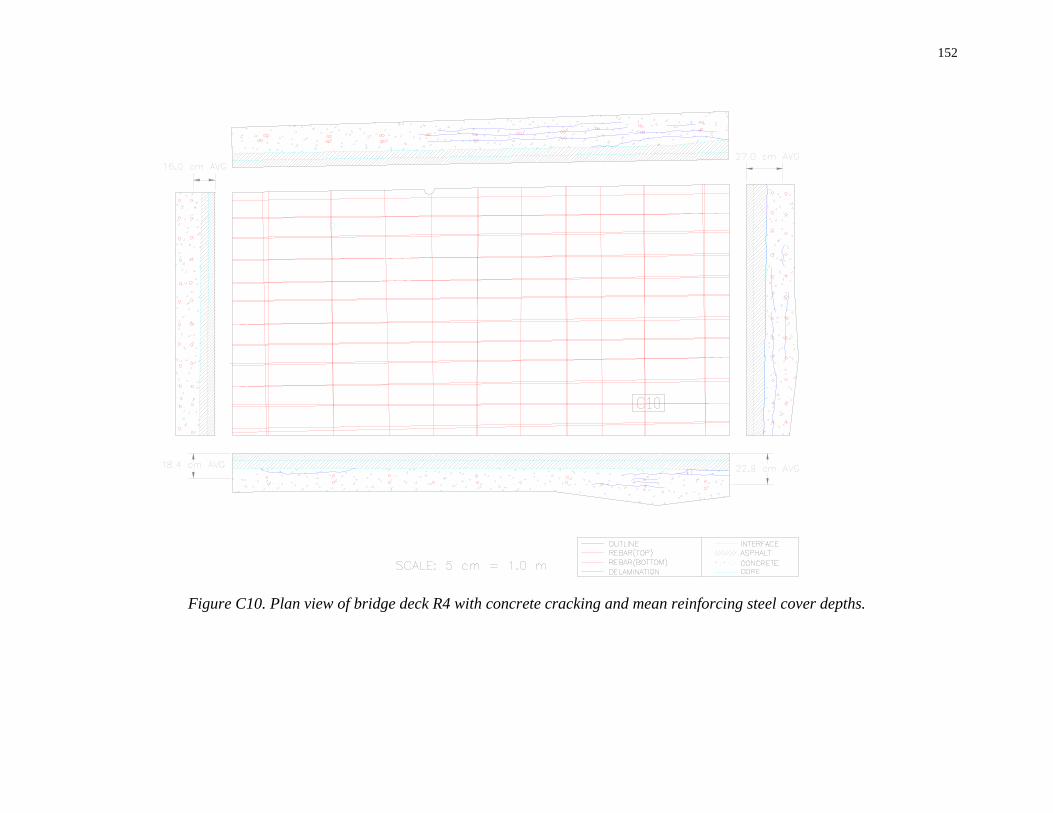
Figure C10. Plan view of bridge deck R4 with concrete cracking and mean reinforcing steel cover depths.
153
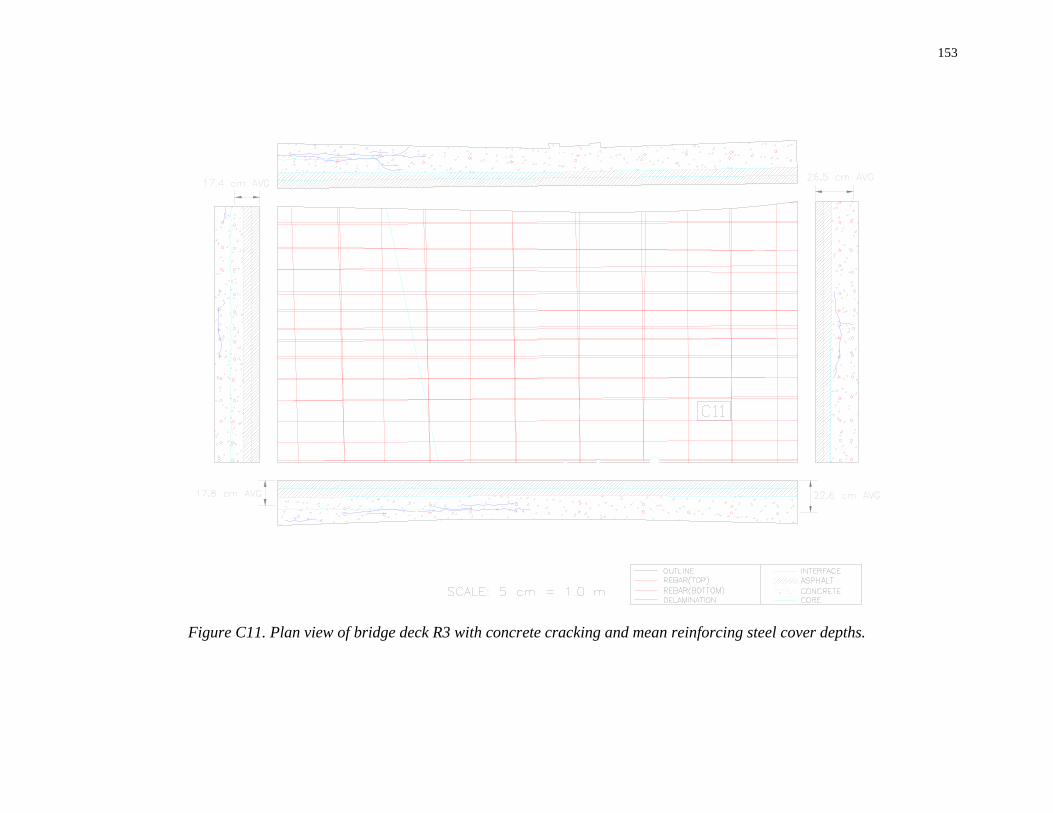
Figure C11. Plan view of bridge deck R3 with concrete cracking and mean reinforcing steel cover depths.
154
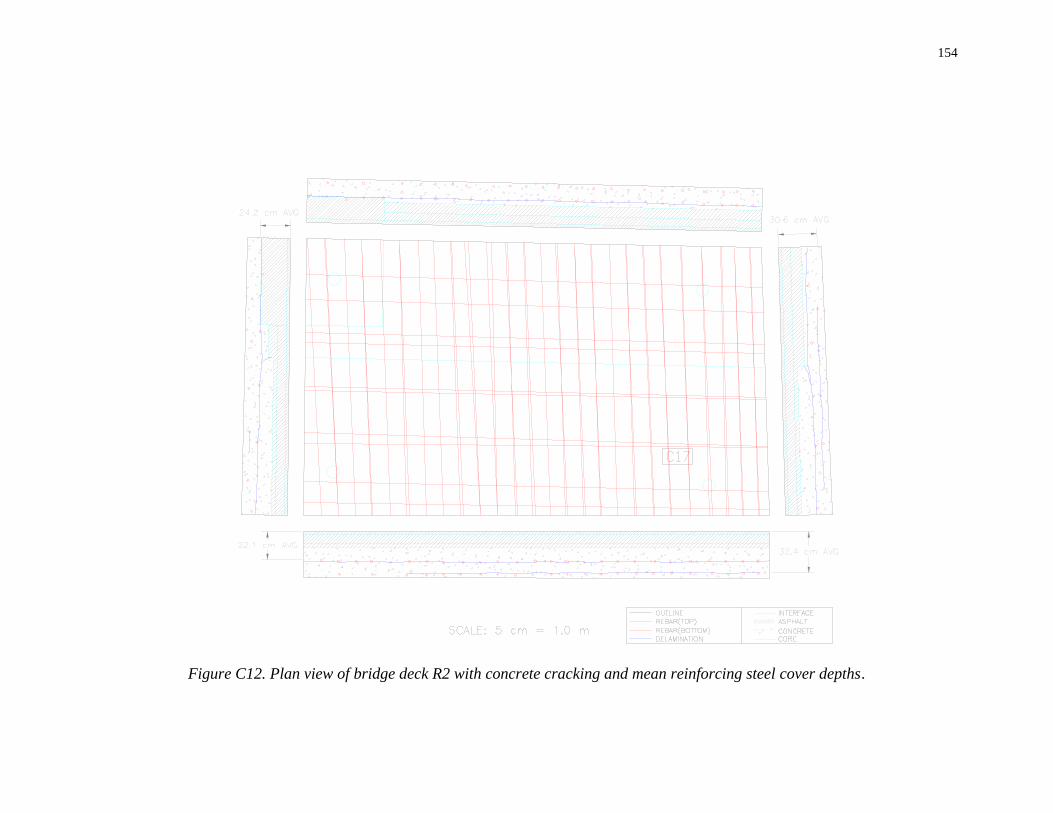
Figure C12. Plan view of bridge deck R2 with concrete cracking and mean reinforcing steel cover depths.
155
Appendix DError Calculations
156
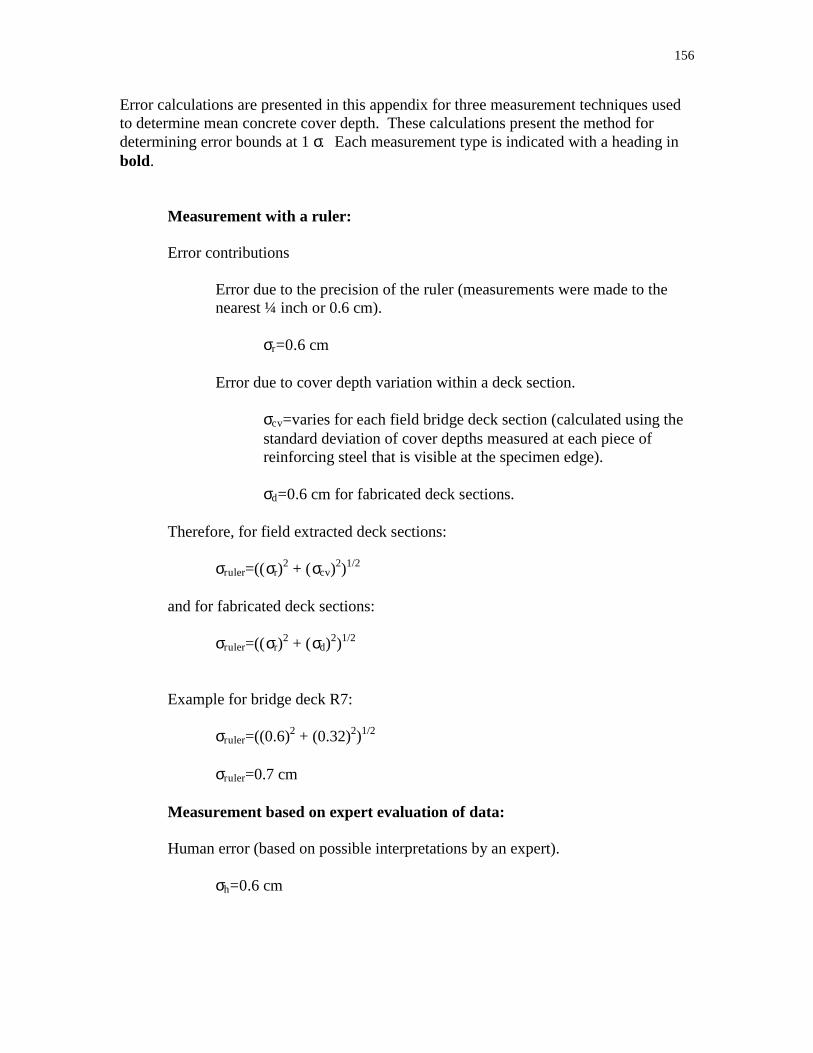
Error calculations are presented in this appendix for three measurement techniques usedto determine mean concrete cover depth. These calculations present the method fordetermining error bounds at 1σ. Each measurement type is indicated with a heading inbold.
Measurement with a ruler:
Error contributions
Error due to the precision of the ruler (measurements were made to thenearest ¼ inch or 0.6 cm).
σr=0.6 cm
Error due to cover depth variation within a deck section.
σcv=varies for each field bridge deck section (calculated using thestandard deviation of cover depths measured at each piece ofreinforcing steel that is visible at the specimen edge).
σd=0.6 cm for fabricated deck sections.
Therefore, for field extracted deck sections:
σruler=((σr)2 + (σcv)
2)1/2
and for fabricated deck sections:
σruler=((σr)2 + (σd)2)1/2
Example for bridge deck R7:
σruler=((0.6)2 + (0.32)2)1/2
σruler=0.7 cm
Measurement based on expert evaluation of data:
Human error (based on possible interpretations by an expert).
σh=0.6 cm
157
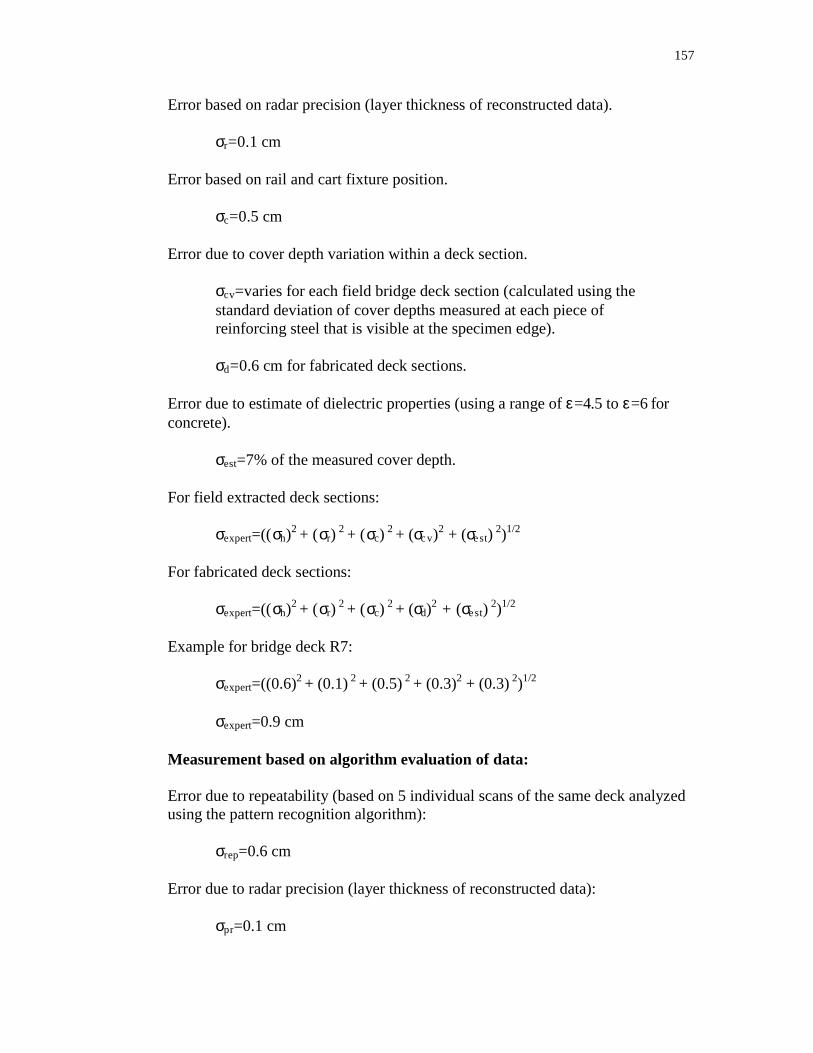
Error based on radar precision (layer thickness of reconstructed data).
σr=0.1 cm
Error based on rail and cart fixture position.
σc=0.5 cm
Error due to cover depth variation within a deck section.
σcv=varies for each field bridge deck section (calculated using thestandard deviation of cover depths measured at each piece ofreinforcing steel that is visible at the specimen edge).
σd=0.6 cm for fabricated deck sections.
Error due to estimate of dielectric properties (using a range ofε=4.5 toε=6 forconcrete).
σest=7% of the measured cover depth.
For field extracted deck sections:
σexpert=((σh)2 + (σr)2 + (σc)
2 + (σc v)2 + (σest)
2)1/2
For fabricated deck sections:
σexpert=((σh)2 + (σr)2 + (σc)
2 + (σd)2 + (σest)
2)1/2
Example for bridge deck R7:
σexpert=((0.6)2 + (0.1)2 + (0.5)2 + (0.3)2 + (0.3)2)1/2
σexpert=0.9 cm
Measurement based on algorithm evaluation of data:
Error due to repeatability (based on 5 individual scans of the same deck analyzedusing the pattern recognition algorithm):
σrep=0.6 cm
Error due to radar precision (layer thickness of reconstructed data):
σpr=0.1 cm
158
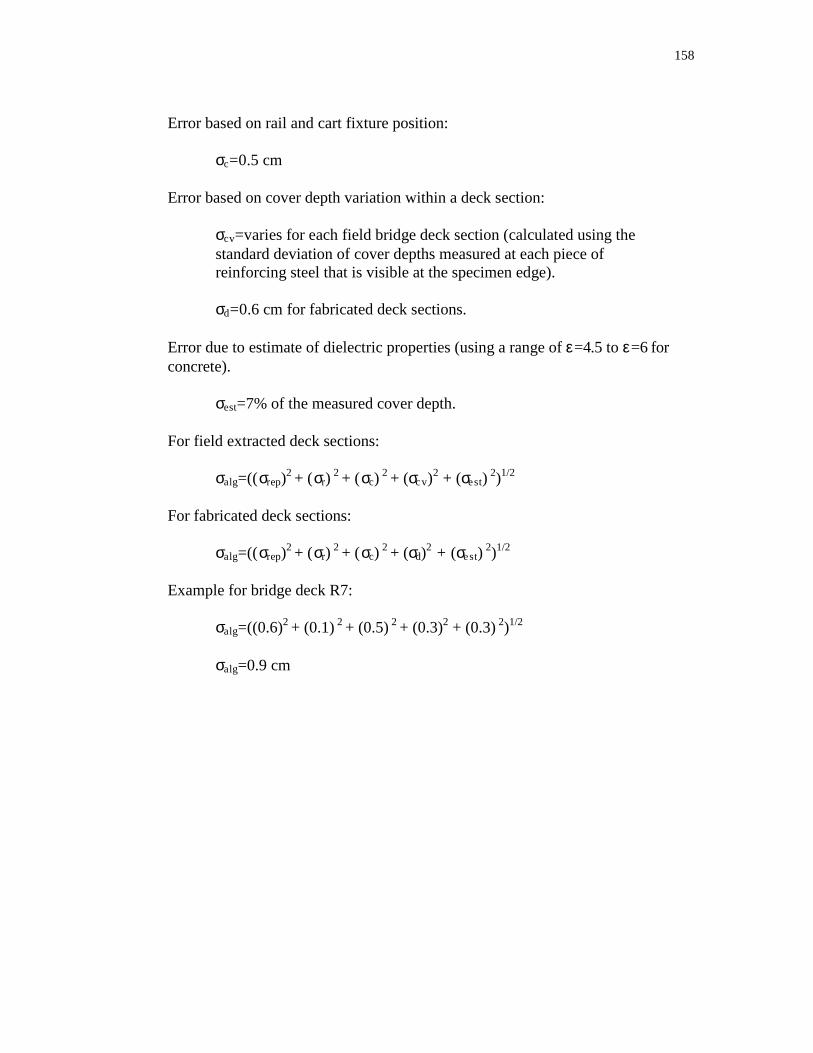
Error based on rail and cart fixture position:
σc=0.5 cm
Error based on cover depth variation within a deck section:
σcv=varies for each field bridge deck section (calculated using thestandard deviation of cover depths measured at each piece ofreinforcing steel that is visible at the specimen edge).
σd=0.6 cm for fabricated deck sections.
Error due to estimate of dielectric properties (using a range ofε=4.5 toε=6 forconcrete).
σest=7% of the measured cover depth.
For field extracted deck sections:
σalg=((σrep)2 + (σr)
2 + (σc)2 + (σcv)
2 + (σest)2)1/2
For fabricated deck sections:
σalg=((σrep)2 + (σr)
2 + (σc)2 + (σd)
2 + (σest)2)1/2
Example for bridge deck R7:
σalg=((0.6)2 + (0.1)2 + (0.5)2 + (0.3)2 + (0.3)2)1/2
σalg=0.9 cm
159
Appendix EConcrete Mix Designs for Fabricated
Deck Sections
160
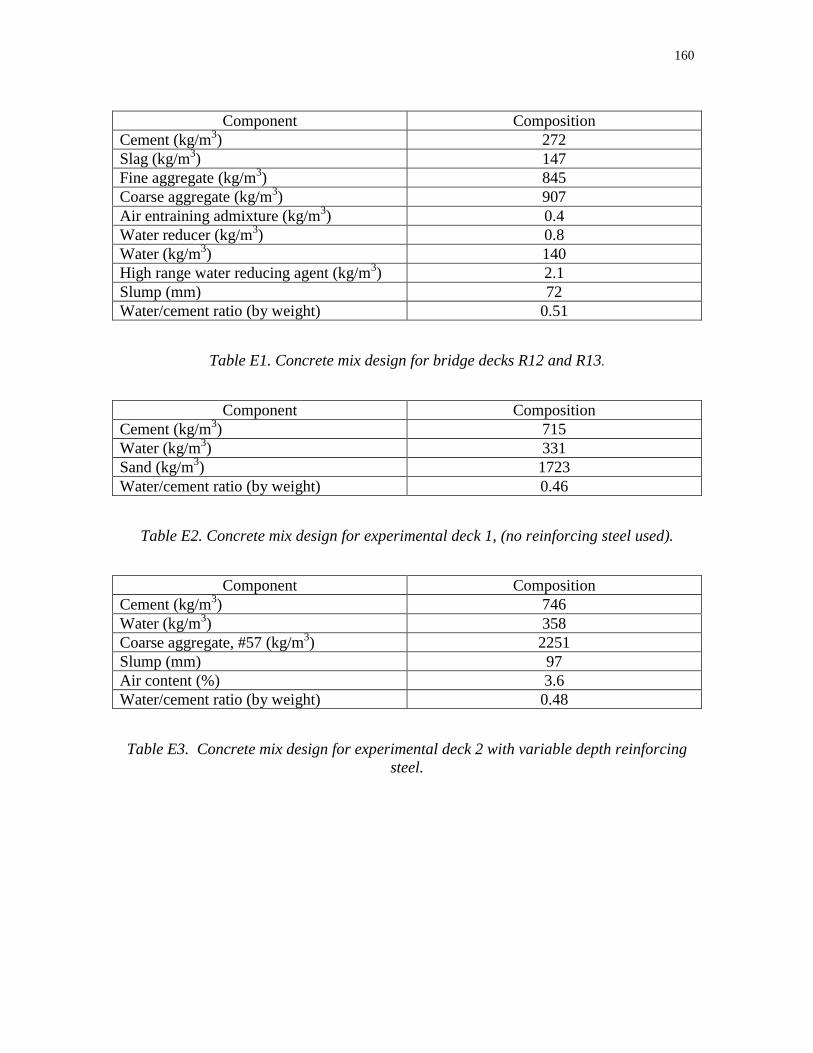
Component CompositionCement (kg/m3) 272Slag (kg/m3) 147Fine aggregate (kg/m3) 845Coarse aggregate (kg/m3) 907Air entraining admixture (kg/m3) 0.4Water reducer (kg/m3) 0.8Water (kg/m3) 140High range water reducing agent (kg/m3) 2.1Slump (mm) 72Water/cement ratio (by weight) 0.51
Table E1. Concrete mix design for bridge decks R12 and R13.
Component CompositionCement (kg/m3) 715Water (kg/m3) 331Sand (kg/m3) 1723Water/cement ratio (by weight) 0.46
Table E2. Concrete mix design for experimental deck 1, (no reinforcing steel used).
Component CompositionCement (kg/m3) 746Water (kg/m3) 358Coarse aggregate, #57 (kg/m3) 2251Slump (mm) 97Air content (%) 3.6Water/cement ratio (by weight) 0.48
Table E3. Concrete mix design for experimental deck 2 with variable depth reinforcingsteel.