Embed Size (px)
Citation preview
Bridge Beams and Pier Caps With Self-Consolidating Concrete at Nimmo Parkway
http://www.virginiadot.org/vtrc/main/online_reports/pdf/16-r11.pdf CELIK OZYILDIRIM, Ph.D., P.E. Principal Research Scientist GAIL M. MORUZA, E.I.T. Graduate Research Assistant
Final Report VTRC 16-R11
Standard Title Page - Report on Federally Funded Project
1. Report No.: 2. Government Accession No.: 3. Recipient’s Catalog No.:
FHWA/VTRC 16-R11
4. Title and Subtitle: 5. Report Date:
February 2016
Bridge Beams and Pier Caps With Self-Consolidating Concrete at Nimmo Parkway
6. Performing Organization Code:
7. Author(s):
Celik Ozyildirim, Ph.D., P.E., and Gail Moruza, E.I.T.
8. Performing Organization Report No.:
VTRC 16-R11
9. Performing Organization and Address:
Virginia Transportation Research Council
530 Edgemont Road
Charlottesville, VA 22903
10. Work Unit No. (TRAIS):
11. Contract or Grant No.:
91013
12. Sponsoring Agencies’ Name and Address: 13. Type of Report and Period Covered:
Virginia Department of Transportation
1401 E. Broad Street
Richmond, VA 23219
Federal Highway Administration
400 North 8th Street, Room 750
Richmond, VA 23219-4825
Final
14. Sponsoring Agency Code:
15. Supplementary Notes:
16. Abstract:
Self-consolidating concrete (SCC) has a very high level of workability as it easily fills formwork under the influence of its
own mass without any additional consolidation energy. SCC can be placed in narrow and congested areas, fit the geometry of the
element, and provide smooth surfaces. The purpose of this study was to investigate innovative, cost-effective, and aesthetically
pleasing SCC mixtures for use in bridge beams and pier caps.
The Virginia Department of Transportation used SCC in two bridges located south of Virginia Beach on the same project
and in close proximity to each other. The bridges carry Nimmo Parkway traffic over Hunt Club Tributary and West Neck Creek.
The bridge over West Neck Creek has 18 spans, and the bridge over Hunt Club Tributary has 2 spans. Precast SCC was used in
the 220 beams on the two bridges, and cast-in-place SCC was used in three pier caps on one of the bridges. SCC mixtures were
prepared at a prestressed concrete plant for the beams and a ready mixed concrete plant for cast-in-place applications. Cast-in-
place SCC was delivered to the site by ready mixed concrete trucks.
SCC for the bridge beams had high flow rates and attained high strength and low permeability. The surface of the beams
had minimal blemishes. The cast-in-place SCC also had high strength and low permeability. In one of the four loads used in the
first pier cap, marginal stability and lower but satisfactory strength were obtained. On the second and third day of the
placements, SCC of uniform quality was obtained.
Thus, compared to conventional mixtures, SCC is expected to have greater material-related costs because of changes in
ingredients, particularly the addition of more and higher dosages of chemical admixtures. However, the ease of placement, speed
of construction, and reduced labor requirements are expected to result in overall cost savings in structures with SCC. Further, the
lack of problems with consolidation is expected to lead to improved surface appearance, strength, and durability; an increased
service life; and lower life cycle costs.
The study recommends that SCC be an option for precast and cast-in-place applications, and the Virginia Department of
Transportation will include this option in its new 2016 Road and Bridge Specifications.
17 Key Words: 18. Distribution Statement:
Concrete, self-consolidating concrete, beams, pier caps,
strength, permeability, shrinkage, freeze/thaw
No restrictions. This document is available to the public
through NTIS, Springfield, VA 22161.
19. Security Classif. (of this report): 20. Security Classif. (of this page): 21. No. of Pages: 22. Price:
Unclassified Unclassified 25
Form DOT F 1700.7 (8-72) Reproduction of completed page authorized
FINAL REPORT
BRIDGE BEAMS AND PIER CAPS WITH SELF-CONSOLIDATING CONCRETE
AT NIMMO PARKWAY
Celik Ozyildirim, Ph.D., P.E.
Principal Research Scientist
Gail M. Moruza, E.I.T.
Graduate Research Assistant
In Cooperation with the U.S. Department of Transportation
Federal Highway Administration
Virginia Transportation Research Council
(A partnership of the Virginia Department of Transportation
and the University of Virginia since 1948)
Charlottesville, Virginia
February 2016
VTRC 16-R11
ii
DISCLAIMER
The contents of this report reflect the views of the authors, who are responsible for the
facts and the accuracy of the data presented herein. The contents do not necessarily reflect the
official views or policies of the Virginia Department of Transportation, the Commonwealth
Transportation Board, or the Federal Highway Administration. This report does not constitute a
standard, specification, or regulation. Any inclusion of manufacturer names, trade names, or
trademarks is for identification purposes only and is not to be considered an endorsement.
Copyright 2016 by the Commonwealth of Virginia.
All rights reserved.
iii
ABSTRACT
Self-consolidating concrete (SCC) has a very high level of workability as it easily fills
formwork under the influence of its own mass without any additional consolidation energy. SCC
can be placed in narrow and congested areas, fit the geometry of the element, and provide
smooth surfaces. The purpose of this study was to investigate innovative, cost-effective, and
aesthetically pleasing SCC mixtures for use in bridge beams and pier caps.
The Virginia Department of Transportation used SCC in two bridges located south of
Virginia Beach on the same project and in close proximity to each other. The bridges carry
Nimmo Parkway traffic over Hunt Club Tributary and West Neck Creek. The bridge over West
Neck Creek has 18 spans, and the bridge over Hunt Club Tributary has 2 spans. Precast SCC
was used in the 220 beams on the two bridges, and cast-in-place SCC was used in three pier caps
on one of the bridges. SCC mixtures were prepared at a prestressed concrete plant for the beams
and a ready mixed concrete plant for cast-in-place applications. Cast-in-place SCC was
delivered to the site by ready mixed concrete trucks.
SCC for the bridge beams had high flow rates and attained high strength and low
permeability. The surface of the beams had minimal blemishes. The cast-in-place SCC also had
high strength and low permeability. In one of the four loads used in the first pier cap, marginal
stability and lower but satisfactory strength were obtained. On the second and third day of the
placements, SCC of uniform quality was obtained.
Thus, compared to conventional mixtures, SCC is expected to have greater material-
related costs because of changes in ingredients, particularly the addition of more and higher
dosages of chemical admixtures. However, the ease of placement, speed of construction, and
reduced labor requirements are expected to result in overall cost savings in structures with SCC.
Further, the lack of problems with consolidation is expected to lead to improved surface
appearance, strength, and durability; an increased service life; and lower life cycle costs.
The study recommends that SCC be an option for precast and cast-in-place applications,
and the Virginia Department of Transportation will include this option in its new 2016 Road and
Bridge Specifications.
FINAL REPORT
BRIDGE BEAMS AND PIER CAPS WITH SELF-CONSOLIDATING CONCRETE
AT NIMMO PARKWAY
Celik Ozyildirim, Ph.D., P.E.
Principal Research Scientist
Gail M. Moruza, E.I.T.
Graduate Research Assistant
INTRODUCTION
Consolidation of concrete is a critical process in the construction of elements. Regular
concretes are affected by improper consolidation, ending with large voids that reduce service life.
These large voids adversely affect strength and permeability, leading to frequent maintenance
needs mainly because of corrosion problems in reinforced structures. In addition, delays in
construction because of the handling of concretes with stiff consistencies and safety-related
issues because of consolidation equipment and procedures increase the cost of construction. The
use of self-consolidating concrete (SCC) as an alternative to regular concretes allows for faster
placement, which leads to improved jobsite productivity.
SCC has very high workability. High workability is expected to reduce surface
imperfections such as bugholes. These imperfections are generally aesthetically objectionable
and require corrective measures such as rubbing in paste or mortar. SCC easily fills the
congested spaces between reinforcement (both mild reinforcement and prestressing steel) and
formwork under the influence of its own mass and without any additional consolidation energy
(American Concrete Institute, 2007). The elimination of large air voids is essential for the
longevity of precast units. Consolidation efforts would be needed to eliminate large air voids in
conventional concrete. However, easily flowing SCC minimizes large air voids and permits
convenient and rapid concrete placement.
SCC has been used in Japan and Europe advantageously since the 1990s (Okamura and
Ouchi, 1999). Some of the benefits of using SCC are the following:
reduced labor
increased construction speed
improved durability characteristics
ease of placement in heavily reinforced and congested areas common in beams with
strands and shear reinforcement
2
consolidation without vibration and without segregation
reduced noise level at manufacturing plants and construction sites.
Some concerns about SCC include the following:
the degree of uniformity
the potential for segregation
increased shrinkage
the questionable quality of the air-void system (Ozyildirim, 2004)
the quality of the bond between strands and concrete.
However, the bond strength of SCC to reinforcing steel at 28 days has been shown to be greater
(16% to 40%) than that of a mixture with normal workability (Sonebi and Bartos, 1999).
Producers are seeing the advantages of SCC, and many are using SCC in precast and cast-in-
place applications.
The Virginia Department of Transportation (VDOT) used normal weight SCC in the
beams of the bridge on Route 33 over the Pamunkey River (Ozyildirim, 2008). In the casting of
the beams, uniformity was an issue. Variation in consistency led to marginal stability in some
beams and the need for limited consolidation in others. Prior to using SCC in the actual structure,
the precast plant that produced the actual bridge beams cast two test beams These two test
beams were evaluated at the Federal Highway Administration’s Turner-Fairbank Highway
Research Center Structures Laboratory (Ozyildirim, 2008; Ozyildirim and Davis, 2007). The
test beams exhibited small amounts of bleeding (Ozyildirim, 2005). Bleeding is indicative of
segregation. During the evaluation, pieces of concrete from the test beams revealed some
segregation where coarse aggregates had settled to the bottom. However, the test beams
performed at least as well as would be expected for normally consolidated concrete beams
(Ozyildirim and Davis, 2007). These positive results from the test beam evaluations justified the
use of SCC in the beams placed in the actual structure.
VDOT also used SCC in the lightweight high performance concrete bulb-T beams of the
bridge on Route 17 over Route 15/29 in Fauquier County, Virginia (Ozyildirim, 2014). The
bridge has two spans, each 128 ft long. Eight beams were cast at a prestressed concrete plant and
had high workability and strength and low permeability.
VDOT used cast-in-place SCC in the limited applications of a slab, median barrier, and
column in early 2000 (Ozyildirim, 2005). In the slab, some of the concrete did not have a high
flow rate, resulting in difficulty in placement and finishing. In the median barrier, some of the
concrete was lost through formwork gaps. Later, cast-in place SCC was used satisfactorily in
drilled shafts (Ozyildirim and Sharp, 2012) and in a study for the repair of bridge substructures
as an alternative to shotcrete.
3
PROBLEM STATEMENT
Difficulty in consolidation leading to improper consolidation adversely affects the
strength and permeability of concretes. SCC does not require consolidation; however, during
construction, slump loss can occur that would require consolidation. SCC has a high flow rate
that must be maintained during construction. Otherwise, mechanical vibration would be required.
SCC mixtures do not tolerate a high water–cementitious materials ratio (w/cm), as stability
(resistance to segregation) becomes an issue. A low w/cm also leads to concretes with high
strength and durability. Since SCC is very sensitive to water content, in some cases, high
variability in consistency has been an issue and has led to marginal stability.
PURPOSE AND SCOPE
The purpose of this study was to investigate innovative, cost-effective, and aesthetically
pleasing SCC mixtures for use in bridge beams and pier caps. SCC mixtures were prepared at a
prestressed concrete plant for the beams and a ready mixed concrete plant for cast-in-place
applications.
For this study, VDOT used SCC in two bridges located south of Virginia Beach on the
same project and in close proximity to each other. The bridges carry Nimmo Parkway traffic
over Hunt Club Tributary and West Neck Creek. The bridge over West Neck Creek has 18 spans,
and the bridge over Hunt Club Tributary has 2 spans.
METHODS
The 220 beams of the two bridges and three pier caps of one bridge structure had SCC.
The specified minimum 28-day compressive strength for beams was 8,000 psi with a release
strength of 6,000 psi and a maximum permeability of 1500 coulombs. The pier cap minimum
compressive strength was 3,000 psi and the maximum permeability was 2500 coulombs.
The beams, which all had SCC, were transported and erected at the jobsite. No. 68
aggregate with a nominal maximum size (NMS) of ¾ in was used in the beams. In the
laboratory, the fresh and hardened concrete properties of the SCC for the beams were determined.
After the completion of the beams, the plant shifted to using No. 8 aggregates with an NMS of
3/8 in. The shift was for facilitating the production and placement of the SCC. In the laboratory,
another mixture with the smaller size No. 8 aggregate was made to compare with the mixture
with larger size aggregate. The cast-in-place concrete for pier caps was batched at the ready
mixed concrete plant and transported to the jobsite in trucks. SCC was used on only three of the
pier caps for the westbound lane of the long bridge over West Neck Creek. To gain experience,
three pier caps were thought to be sufficient.
4
Overview of Bridges
Bridge Over West Neck Creek
The bridge consists of 18 spans with 11 bulb-T beams in each span including the
eastbound and westbound lanes. The beams are 53-in bulb-T beams. The total length of the
beam line is approximately 17,611 ft. The total width of the bridge is 104.8 ft including two 11-
in rails on both sides.
Eastbound Lane Beams and Spans
The eastbound lane of the parkway over West Neck Creek has 5 bulb-T beams per span
over 18 spans, resulting in a total of 90 bulb-T beams per lane. The length of the first span is
88.8 ft, and the length of the others is 89.0 ft.
Westbound Lane Beams and Spans
The westbound lane of the parkway over West Neck Creek has 18 spans with 6 bulb-T
beams per span, resulting in a total of 108 bulb-T beams per lane. The length of the first span is
88.8 ft, and the length of the other spans is 89.0 ft.
Bridge Over Hunt Club Tributary
The bridge is 120 ft in length and has two 60-ft spans. There are 11 bulb-T beams at each
span including the eastbound and westbound lanes. The total number of beams is 22. The
beams are 37-in bulb-T beams. The total length of the beam lines is approximately 1,320 ft. The
total width of the bridge is 105.8 ft including two 11-in rails on both sides.
Eastbound Lane Beams and Spans
The eastbound lane of the bridge over Hunt Club Tributary has two spans with 5 bulb-T
beams per span, resulting in a total of 10 bulb-T beams.
Westbound Lane Beams and Spans
The westbound lane of the bridge over Hunt Club Tributary has two spans with 6 bulb-T
beams per span, resulting in a total of 12 bulb-T beams.
Mixture Proportions
Laboratory Concretes
Laboratory concretes were prepared with two aggregate sizes: No. 68 and No. 8. The
cementitious content was a mixture of Type III portland cement and Class F fly ash. The No. 68
coarse aggregate had a specific gravity of 2.66. The No. 8 aggregate had a specific gravity of
5
2.63. The fine aggregate was natural sand with a specific gravity of 2.64 and a fineness modulus
of 2.71. Air entraining admixtures, retarding admixtures, and high-range water-reducing
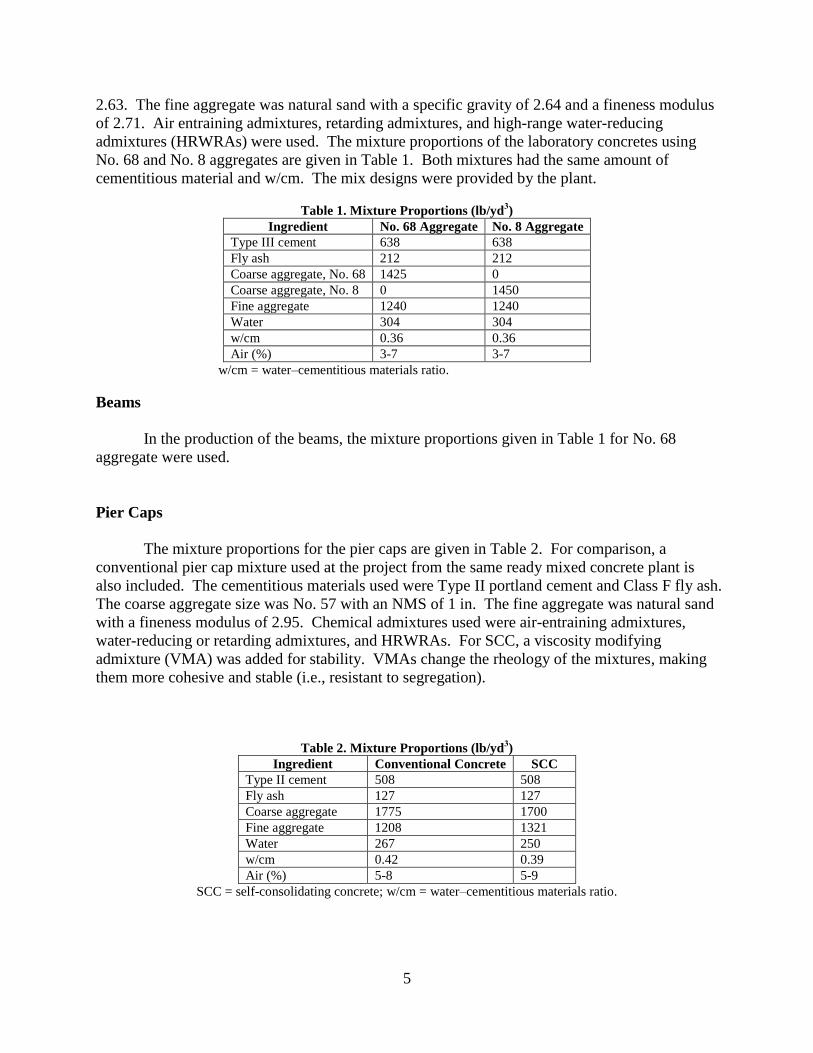
admixtures (HRWRAs) were used. The mixture proportions of the laboratory concretes using
No. 68 and No. 8 aggregates are given in Table 1. Both mixtures had the same amount of
cementitious material and w/cm. The mix designs were provided by the plant.
Table 1. Mixture Proportions (lb/yd3)
Ingredient No. 68 Aggregate No. 8 Aggregate
Type III cement 638 638
Fly ash 212 212
Coarse aggregate, No. 68 1425 0
Coarse aggregate, No. 8 0 1450
Fine aggregate 1240 1240
Water 304 304
w/cm 0.36 0.36
Air (%) 3-7 3-7
w/cm = water–cementitious materials ratio.
Beams
In the production of the beams, the mixture proportions given in Table 1 for No. 68
aggregate were used.
Pier Caps
The mixture proportions for the pier caps are given in Table 2. For comparison, a
conventional pier cap mixture used at the project from the same ready mixed concrete plant is
also included. The cementitious materials used were Type II portland cement and Class F fly ash.
The coarse aggregate size was No. 57 with an NMS of 1 in. The fine aggregate was natural sand
with a fineness modulus of 2.95. Chemical admixtures used were air-entraining admixtures,
water-reducing or retarding admixtures, and HRWRAs. For SCC, a viscosity modifying
admixture (VMA) was added for stability. VMAs change the rheology of the mixtures, making
them more cohesive and stable (i.e., resistant to segregation).
Table 2. Mixture Proportions (lb/yd
3)
Ingredient Conventional Concrete SCC
Type II cement 508 508
Fly ash 127 127
Coarse aggregate 1775 1700
Fine aggregate 1208 1321
Water 267 250
w/cm 0.42 0.39
Air (%) 5-8 5-9
SCC = self-consolidating concrete; w/cm = water–cementitious materials ratio.
6
The conventional and SCC mixtures had the same amount of cementitious materials.
However, the SCC mixture had increased amounts of fine aggregate and decreased amounts of
coarse aggregate. This change allowed for improved workability and stability. In both mixtures,
No. 57 stone with an NMS of 1 in was used. The coarse aggregate did not have a good particle
shape. As expected in a SCC mixture, increased amounts of HRWRA were used. On the first
day of placement, a retarding admixture was also used to delay the time of set. On the second
day of placement, the retarding admixture was replaced with a water-reducing admixture and a
small dosage of accelerator to reduce the time of set.
Concrete Testing
Laboratory Concretes
The laboratory concretes were steam cured in a manner similar to that for the concretes at
the plant. The curing temperature was raised 20°F per hour after the initial set but was then held
at 155°F for 7 hours. The following fresh concrete properties were tested for each mixture:
slump flow and slump flow time to reach 20 in: ASTM C1611-09 (ASTM, 2009a)
air content: ASTM C231-10 (ASTM, 2010a)
density: ASTM C138-13 (ASTM, 2013).
In the hardened state, compressive strength, elastic modulus, length change for drying
shrinkage, and permeability were determined. The tests for the hardened state concrete
properties and the specimen sizes are summarized in Table 3. For permeability, two sets were
prepared and subjected to different curing procedures and then tested at 28 days. After the initial
steam curing, one set was kept in the moist room until testing. The second set was subjected to
the accelerated curing, which involved standard moisture curing at room temperature up to 1
week and then 3 weeks in a 100 °F water bath. The accelerated curing is a standard curing
procedure used by VDOT. However, when steam curing is used, accelerated curing may not be
necessary. This would depend on the duration and the temperature level during the steam curing.
Concrete for Beams
The SCC for the beams was tested in the fresh and hardened states. Fresh concrete
samples were tested for slump flow, slump flow with J-Ring in accordance with ASTM C1621-
09 (ASTM, 2009b), air content, and density. In the hardened state, compressive strength and
permeability were tested.
7
Concrete for Pier Caps
The SCC for the pier caps was tested in the fresh and hardened states. Fresh concrete
samples were tested for slump flow, slump flow with J-Ring, air content, and density. In the
hardened state, the tests shown in Table 3 were conducted. The resistance to cycles of freezing
and thawing was determined in accordance with ASTM C666 (ASTM, 2008a), Procedure A,
except that the specimens were air dried at least 1 week before the test and the test water
contained 2% NaCl.
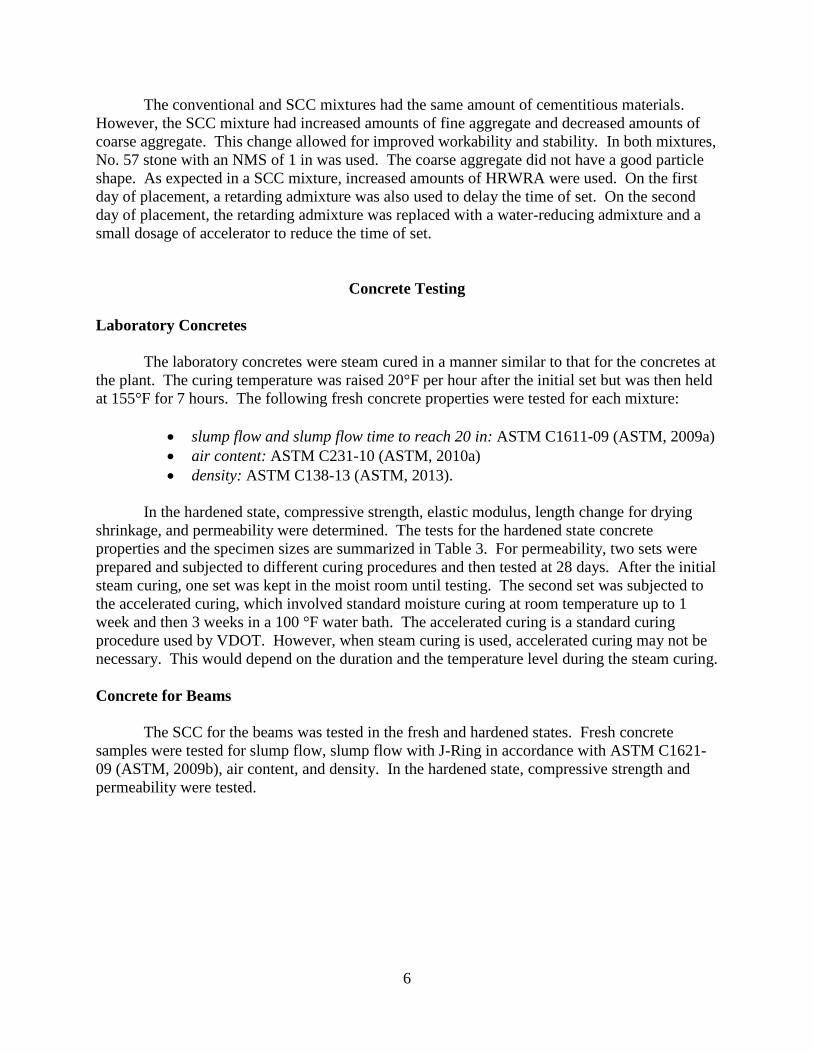
Table 3. Test and Specimen Sizes for Hardened Concrete
Test Specification Specimen Size, in
Compressive strength ASTM C39-12 (ASTM, 2012a) 4 x 8
Elastic modulus ASTM C469-10 (ASTM, 2010b) 4 x 8
Splitting tensile strength ASTM C496-11 (ASTM, 2011) 4 x 8
Permeability ASTM C1202-12 (ASTM, 2012b) 2 x 4
Drying shrinkage ASTM C157-08 (ASTM, 2008b) 3 x 3 x 11.3
Freeze-thaw durability ASTM C666-08 (ASTM, 2008a) 3 x 4 x 16
Placement
Beams
Beams for both bridges were cast at the same prestressed concrete plant between June 25
and September 27, 2012. They were steam cured and stored at the plant until delivery to the
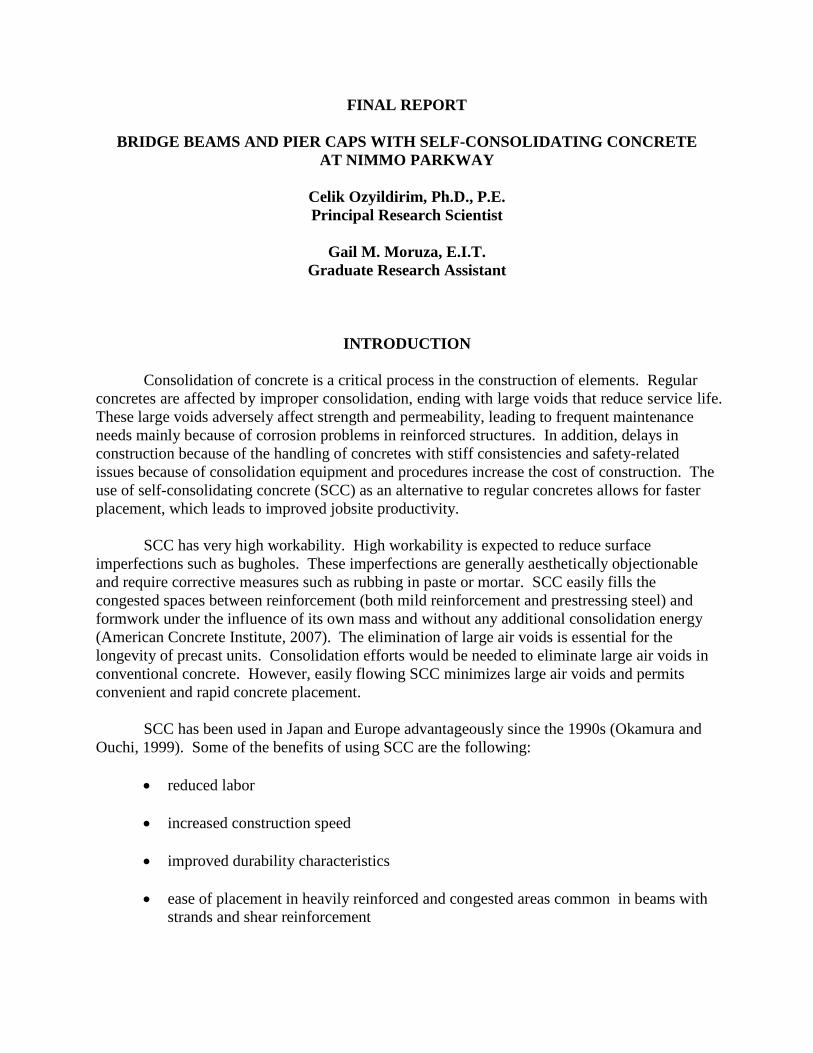
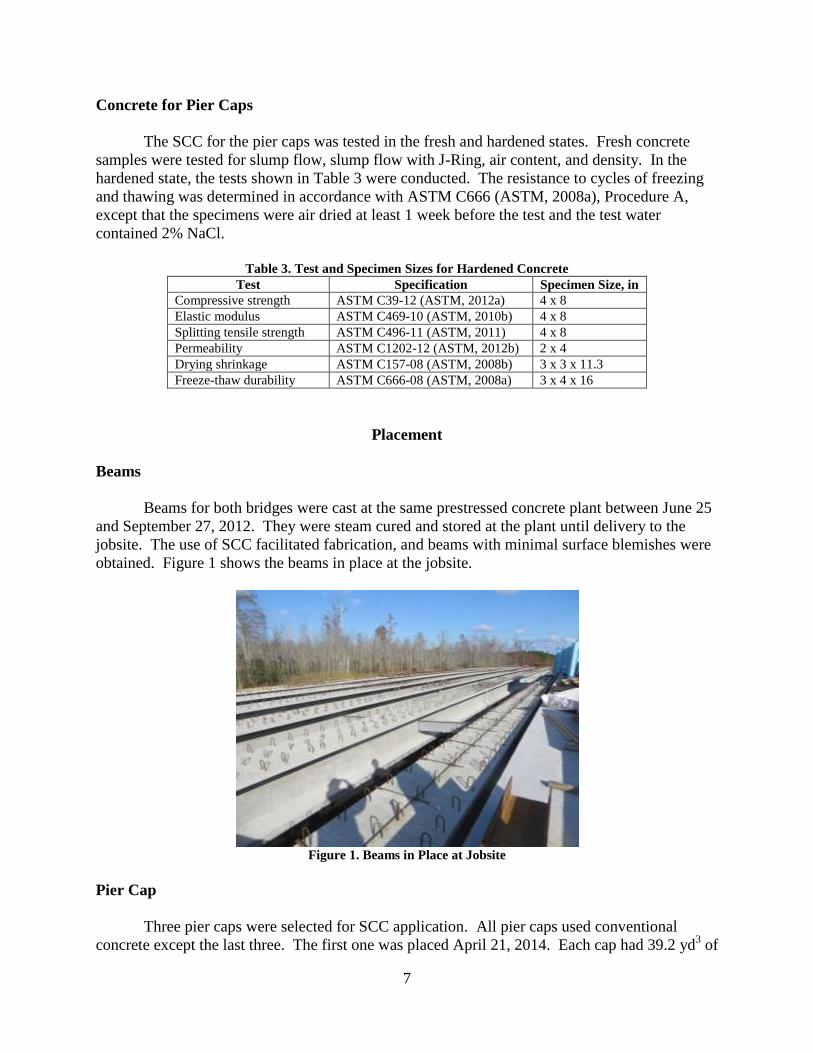
jobsite. The use of SCC facilitated fabrication, and beams with minimal surface blemishes were
obtained. Figure 1 shows the beams in place at the jobsite.
Figure 1. Beams in Place at Jobsite
Pier Cap
Three pier caps were selected for SCC application. All pier caps used conventional
concrete except the last three. The first one was placed April 21, 2014. Each cap had 39.2 yd3 of
8
concrete delivered in four truckloads. The trucks parked on the bridge next to the pier cap. SCC
was discharged into the cap mold through the truck chute and flowed from one end to the other
in the pier cap. The length of the pier cap was 58 ft. Buckets were used to supply SCC to the
farthest end of the pier cap. Limited internal vibration was used.
The SCC mixtures had a slump flow range of 20 to 24 in; these flow values are at the
lower acceptable range for SCC. The finishers noticed that the SCC was not setting the first day
of placement and that the top surface of the cap was still not set the next morning. The mixture
contained a retarding admixture that worked well with the HRWRA and provided good
workability, although it delayed setting time. The air temperature was around 50 °F, and the
mixture temperature was 60 °F to 64 °F. At night, the ambient temperature was in the 40s °F.
On the first day of placement, the last load had marginal stability. The geometry of the pier cap
was a sloping surface with raised areas for the beam seats. The load with marginal stability was
the last load placed on the top where the geometry made it difficult to keep it in place.
For the second cap placed on April 23, 2014, changes in the admixture dosages and type
were made as follows:
The slump flow range was reduced to 18 to 22 in.
The retarding admixture was replaced with a water-reducing admixture.
The dosage of HRWRA was reduced.
The dosage of VMA was increased.
A low dosage of an accelerator was added.
The concrete was stable, and finishing was accomplished without any delays. The air
temperature was around 60 °F, and the concrete temperature was 66 °F to 68 °F. At night, the
temperature was in the 50s °F. For the third day of placement for the third cap on April 25, 2014,
the previous day’s admixtures were continued except that the dosage of the accelerator was
reduced by one half. The air temperature this day and night was in the 50s °F.
The contractor was skeptical of using SCC before placement. The results after the first
day of placement did not reduce his skepticism. However, later placements went so well that the
contractor chose to use SCC in the patterned rail walls.
RESULTS
Laboratory Concretes
The fresh concrete properties for the mixtures made in the laboratory are given in Table 4.
Workable concretes with satisfactory and similar air contents were obtained. The hardened
concrete properties of these mixtures are given in Table 5. The values for strength, elastic
modulus, and length change were an average of three specimens, and the permeability values
were an average of two specimens.
9
Table 4. Fresh Concrete Properties
Property No. 68 Aggregate No. 8 Aggregate
Air content (%) 5.0 5.2
Density (lb/ft3 ) 142.4 141.2
Slump flow (in) 21 20
Slump flow time (sec) 7 9
Mix temperature (°F) 72 72
Table 5. Hardened Concrete Properties at 28 days
Test Age No. 68 Aggregate No. 8 Aggregate
Compressive strength (psi) 1 day 7080 7360
7 days 8600 8650
28 days 9590 9780
Elastic modulus (ksi) 28 days 4150
3960
Drying shrinkage (microstrain) 28a days 353 397
4a months 413 517
Permeability (C) 28 daysb 229 213
28 daysc 2260 1224
a Drying shrinkage specimens were moist cured for 7 days; the age does not include the moist-curing
period. b After steam curing, specimens were moist cured up to 1 week at room temperature and then 3 weeks
at 100 °F (accelerated curing). c
After the steam curing, specimens were moist cured at room temperature for the remaining 28 days.
Compressive strengths were high and comparable in the two mixtures but were slightly
higher in the mixture with the smaller aggregate. Elastic modulus values were also comparable
but slightly higher in the mixture with the larger aggregate. The shrinkage values were lower for
the mixtures with the larger aggregate as larger aggregate provides more resistance to shrinkage.
The permeability values were very low and similar when accelerated curing was used because of
the increased hydration and pozzolanic reactions with high temperatures.
Beams
Fresh and hardened samples of the SCC were tested for mixture qualification prior to the
casting of beams and for quality control and acceptance during production.
Mixture Qualification
For the mixture qualification, 40 cylinders were tested for compressive strength from a
batch of concrete. For permeability, 5 cylinders were tested from the same batch. Compressive
strength tests were conducted after 1, 7, and 28 days, and permeability tests were conducted at 28
days. The average strength value at 28 days was 11,067 psi, which is higher than the minimum
8,000 psi specified (Table 6). Average permeability was 270 coulombs at 28 days, which is
lower than the maximum 1500 coulombs specified. Specimens for compressive strength were
subjected to moist curing. The permeability samples were subjected to accelerated curing in a
moist environment for 1 week at room temperature and then 3 weeks at 100 °F. The test data
were satisfactory, and the mix design was approved by VDOT.
10
Table 6. Compressive Strength and Permeability Data for Mixture Qualification
Age
(days)
n
Compressive Strength
(psi)
n
Permeability
(coulombs)
1 40 5,076 - -
7 40 8,429 - -
28 40 11,067 5 270
n = number of specimens.
Quality Control and Acceptance
During production, fresh and hardened concrete properties were monitored periodically.
Table 7 shows the minimum, maximum, and average values for slump flow, air content, and
density (unit weight) for specimens placed at the live end and dead end. Specimens were
subjected to the same curing environment as the beams, i.e., steam curing and then storage
exposed to air. The maximum temperature reached during steam curing was 169 °F.
Specimens were tested for compressive strength at 1, 7, and 28 days. Since the specified
strengths were obtained at 7 days, further testing at 28 days was limited to a few specimens.
Table 8 summarizes the strength values, including the live end, dead end, and average results.
Dead end and live end specimens produced similar 1-day strengths, just above 7,000 psi, with
standard deviations over 900 psi. The large standard deviation was attributed to the testing of
only one cylinder for each end of the bed each day and to the short time period between casting
and testing. The 7-day average strengths exceeded the specified minimum 28-day strength of
8,000 psi, with average values over 9,000 psi. The relatively low standard deviations of the 7-
day strength tests were attributed to the average of three cylinders for each test value and indicate
good quality control in production. The 28-day strength was around 8,500 psi, and since it was
less than the 7-day strength, this result was attributed to the relatively small number of specimens.
The strength of the specimens was considered acceptable since it exceeded 8,000 psi at 7 and 28
days. The results in Tables 6 and 8 show that all values for 1-day and 7-day strengths were
higher during the production compared to the initial phase of the mixture qualification tests.
This indicates satisfactory quality control and the benefits of steam curing at an early age.
Table 7. Quality Control Data for Fresh Concrete Samples During Production
Test
Live End Dead End
n Minimum Maximum Average n Minimum Maximum Average
Slump flow (in) 64 18.0 27.0 22.6 64 17.5 27.0 24.0
Air content (%) 64 3.0 7.0 4.7 64 3.0 6.8 4.8
Density (lb/ft3) 64 139.0 147.0 144.0 64 141.0 145.6 143.1
n = number of specimens.
Table 8. Quality Control Tests for Concrete Strengths During Production
Age
(days)
Live End Dead End Average
n
Strength
(psi)
SD
n
Strength
(psi)
SD
n
Strength
(psi)
SD
1 63 7,254a
987 63 7,234a
956 126 7,244 936
7 62 9,100b
258 59 9,068b
439 121 9,074 310
28 1 8,745b - 4 8,579
b 349 5 8,612 312
n = number of samples; SD = standard deviation. a From 1 specimen each day.
b The test result was an average of 3 cylinders.
11
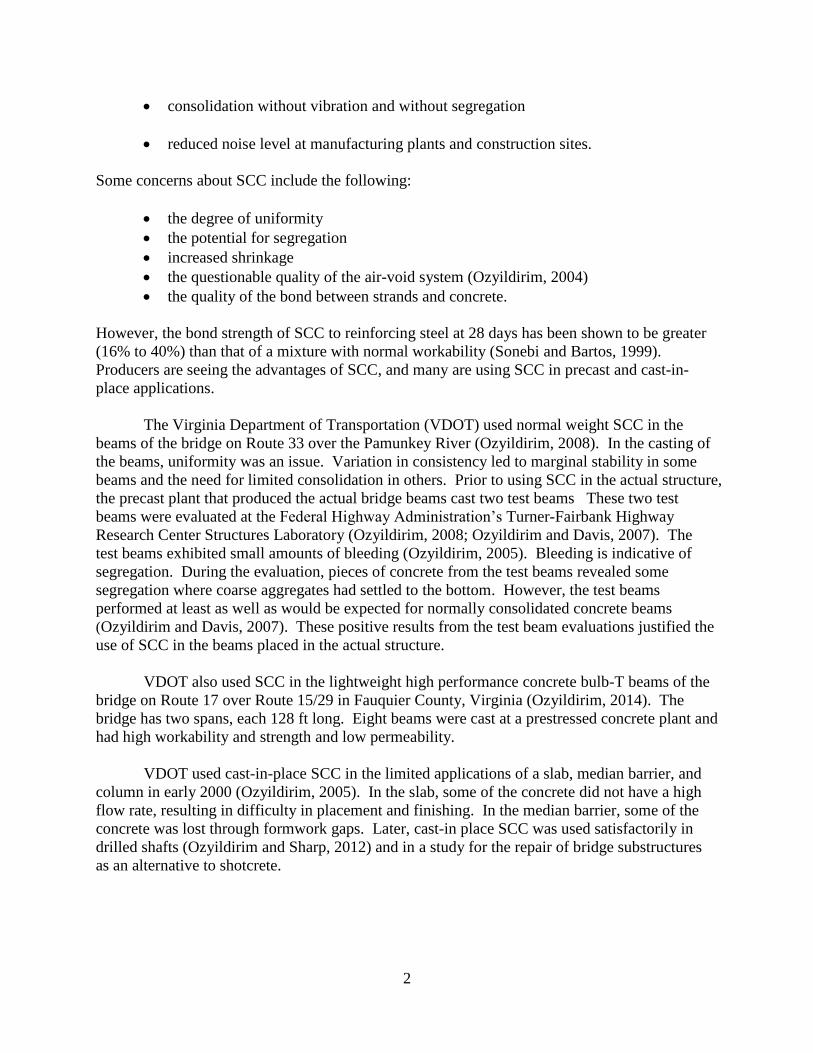
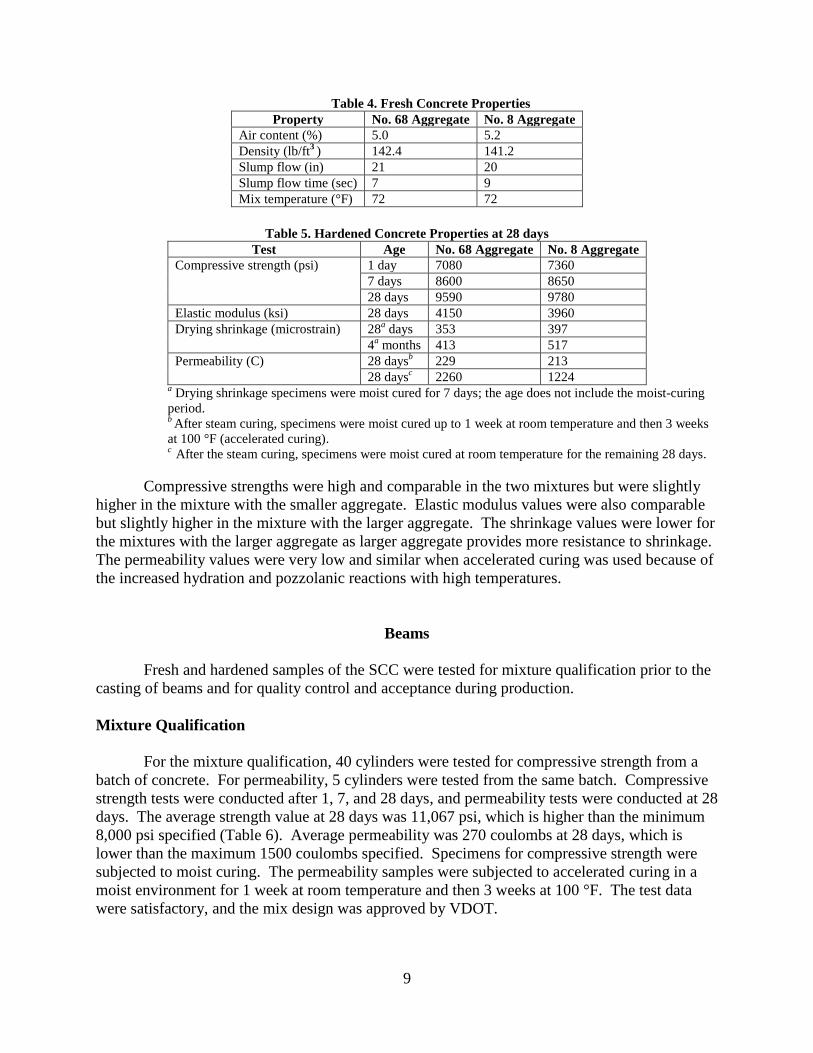
The surface quality of the SCC was also inspected and compared to the surface quality of
the conventional concrete. The surfaces of the SCC and the conventional concrete are shown for
comparison in Figure 2. Although there are surface blemishes in both concrete types, there are
fewer in the SCC and they are less pronounced than in the conventional concrete.
Figure 2. Surface of SCC (left) and of Conventional Concrete (right)
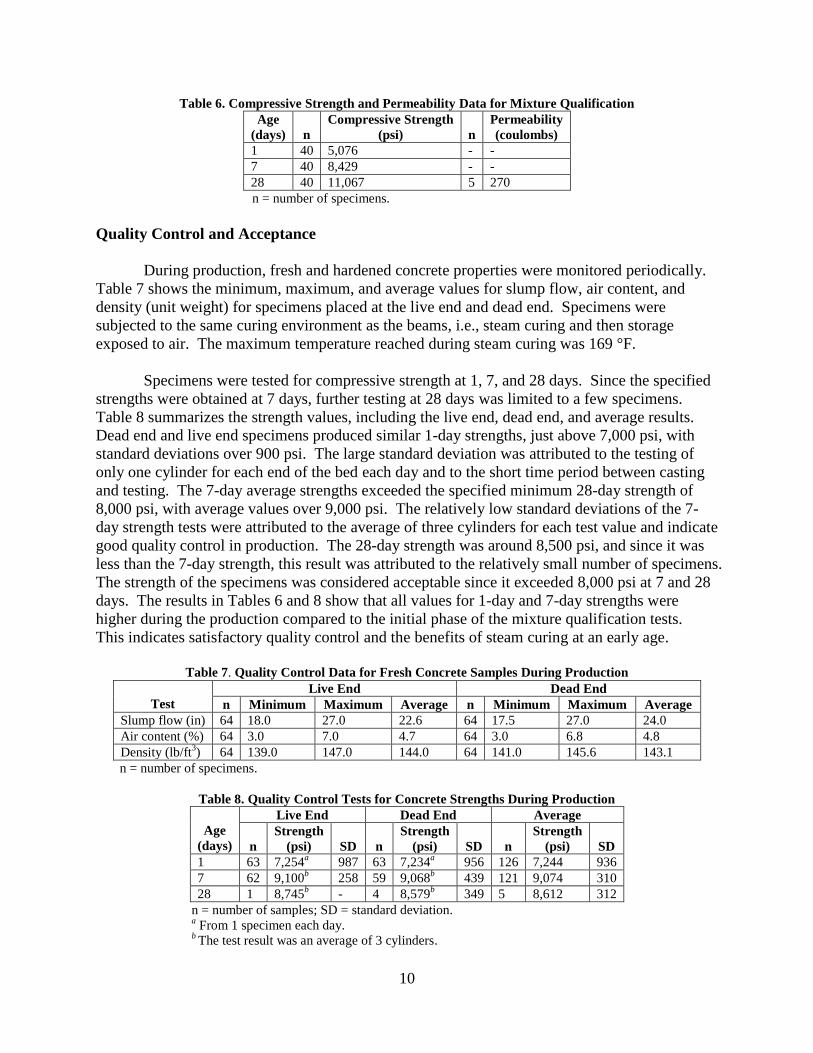
Pier Caps
The cast-in-place concretes were sampled and tested for fresh concrete properties at the
jobsite. Specimens were also made for hardened concrete tests. The specimens were kept
overnight at room temperature in the trailer at the jobsite and then brought to the laboratory for
moist curing. The permeability specimens were subjected to accelerated curing.
Fresh Concrete
Each of the four loads for each cap was tested, and the results are given in Table 9. The
mixtures had high workability and adequate air. Air contents ranged from 5.5% to 7.5%. The
fourth load from the first day (04/21/14) had marginal stability, and there was a slight halo
around the spread. There were concerns about strength and permeability values because of the
marginal stability, which could have resulted from a higher than anticipated water content in that
load. In general, stable mixtures were obtained even with a moderate cementitious material
content attributed to the presence of the VMA.
12
Table 9. Fresh Concrete Properties
Date
Load
Slump Flow
(in)
Air (%)
Density
(lb/ft3)
Concrete
Temp (°F)
Air Temp
(°F)
04/21/14 1 24.0 7.0 --- 61 46
04/21/14 2 23.0 7.5 --- 59 48
04/21/14 3a
23.8 7.6 142.0 60 49
04/21/14 4a
24.0 5.1 145.2 64 51
04/23/14 1 20.0 6.0 147.2 66 62
04/23/14 2a
17.0 5.8 145.6 68 62
04/23/14 3 19.0 5.8 145.6 66 59
04/23/14 4a
22.0 5.8 146.0 68 64
04/25/14 1 22.0 7.0 --- 69 48
04/25/14 2 23.0 5.5 --- 68 50
04/25/14 3 22.0 6.0 --- 69 55
04/25/14 4 20.0 6.2 --- 68 60 a
Load was tested at the hardened state.
Hardened Concrete
The strength, elastic modulus, splitting tensile strength, permeability, and length change
data are given in Table 10. The fourth load (L4) placed in Bent 15 on the first day had lower
compressive strength than the other batches; however, the strength was still higher than the 3,000
psi required at 28 days. The splitting tensile strength test also indicated the lowest value in that
load. The load also had the lowest elastic modulus, as expected because of the lower strength.
But all strength values were satisfactory. The permeability value for that load was the highest;
however, the values were very low, indicating very low permeability. L4 Bent 15 also had the
highest shrinkage value, indicating the addition of extra water, which was consistent with the
lower strength values. However, the shrinkage value at 28 days for this load was very close to
the 400 microstrain recommended for reduced cracking for bridge decks (Babaei and Fouladgar,
1997). At 4 months, all the values were less than the recommended maximum of 700 microstrain.
Table 10. Hardened Concrete Properties
Test
Age
L3 Bent 15 L4 Bent 15 L2 Bent 16 L4 Bent 16
04/21/14 04/21/14 04/23/14 04/23/14
Compressive strength (psi) 2 days - - 3780 3790
3 days 4350 3120 - -
7 days 5150 3780 4940 4710
28 days 6570 4950 6270 6250
Elastic modulus (106 psi) 5.09 5.09 5.40 5.31
Splitting tensile strength (psi) 28 days 590 555 650 640
Permeability (C) 28 days 444 729 453 543
Drying shrinkage (microstrain) 28a days 307 407 373 383
4a months 393 560 510 543
6a months 433 610 560 597
Strength and permeability values are an average of 2 specimens; length change data are an average of 3
beams. a
Specimens were moist cured for 7 days; the age does not include the moist curing period.
13
The data for the resistance to cycles of freezing and thawing are given in Table 11. The
VDOT acceptance criteria at 300 cycles are a weight loss of 7% or less, a durability factor of 60
or more, and a surface rating of 3 or less. The data given in Table 9 indicate that concretes made
on the second day of placement (4/23/14) had higher density, indicating a lower air content than
those prepared on the first day of placement (4/21/14) even though all air contents were within
the acceptable range. The concretes prepared the second day with the higher densities had low
durability factors and high weight loss compared to the specimens cast the first day. However,
the field performance of these concretes was expected to be satisfactory since they had very low
permeability and would be difficult to saturate critically under the deck.
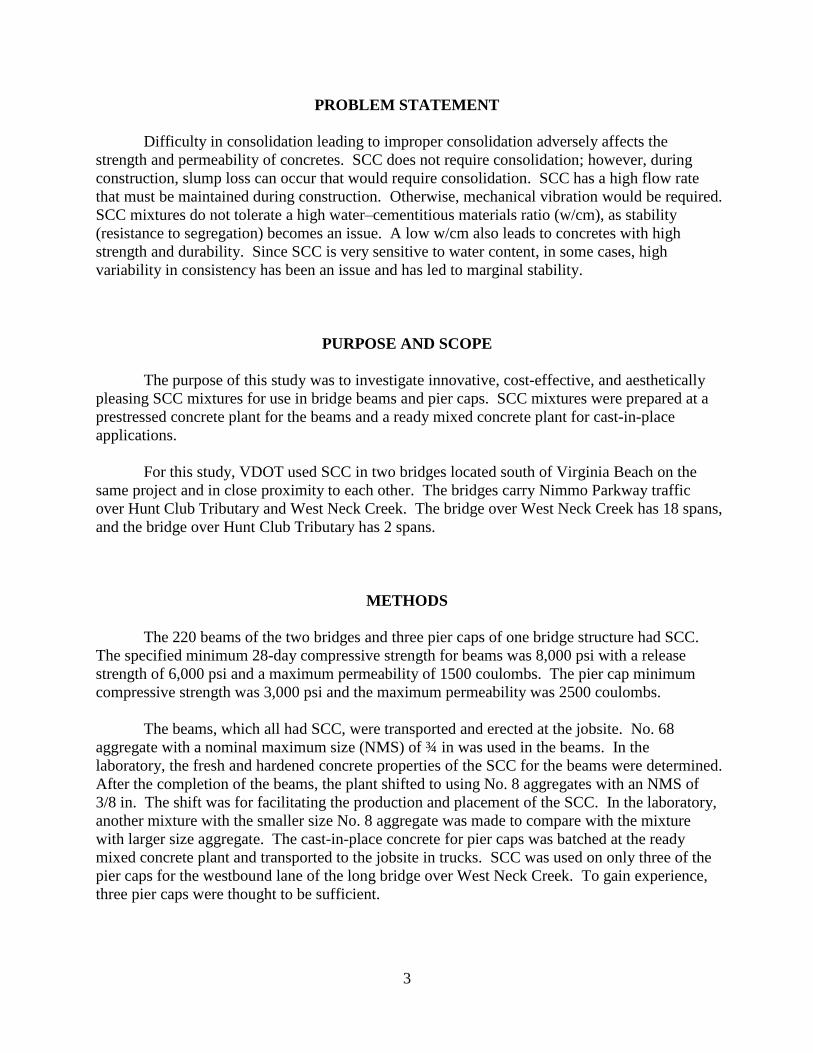
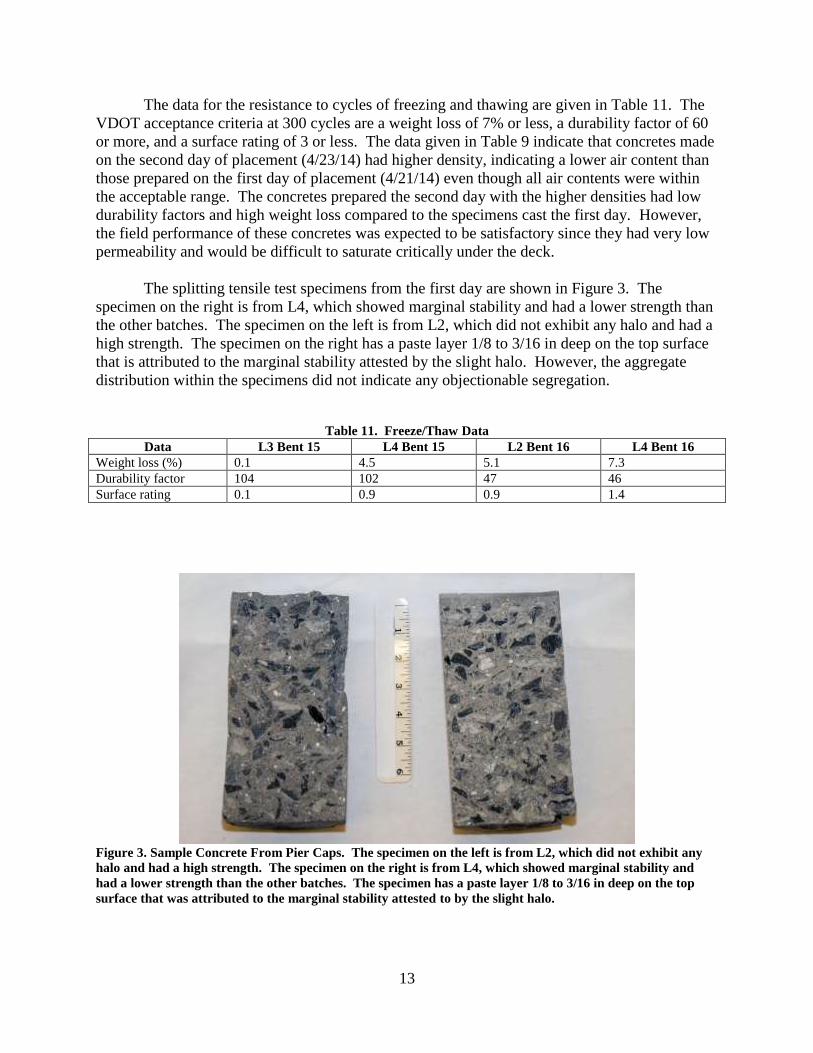
The splitting tensile test specimens from the first day are shown in Figure 3. The
specimen on the right is from L4, which showed marginal stability and had a lower strength than
the other batches. The specimen on the left is from L2, which did not exhibit any halo and had a
high strength. The specimen on the right has a paste layer 1/8 to 3/16 in deep on the top surface
that is attributed to the marginal stability attested by the slight halo. However, the aggregate
distribution within the specimens did not indicate any objectionable segregation.
Table 11. Freeze/Thaw Data
Data L3 Bent 15 L4 Bent 15 L2 Bent 16 L4 Bent 16
Weight loss (%) 0.1 4.5 5.1 7.3
Durability factor 104 102 47 46
Surface rating 0.1 0.9 0.9 1.4
Figure 3. Sample Concrete From Pier Caps. The specimen on the left is from L2, which did not exhibit any
halo and had a high strength. The specimen on the right is from L4, which showed marginal stability and
had a lower strength than the other batches. The specimen has a paste layer 1/8 to 3/16 in deep on the top
surface that was attributed to the marginal stability attested to by the slight halo.
14
CONCLUSIONS
Beams with SCC can be successfully produced at a precast prestressed concrete plant from
SCC mixtures with high workability, satisfactory strength, and the low permeability essential
for durability.
No. 57, No. 68, or No. 8 aggregates can be successfully used in making SCC.
Cast-in-place SCC with high workability and satisfactory strength and permeability can be
produced. Care should be exercised to prevent segregation in the SCC. Marginal stability
indicated by a slight halo did not cause objectionable segregation within the concrete.
However, a separate thin surface paste layer was observed.
VMAs help achieve stable mixtures. Dosages will need to be adjusted for the desired stability.
Accelerating admixtures help minimize the time of setting. Extended setting time causes
delays in finishing. Thus, accelerating admixtures provide timely finishing operations,
especially in cold weather.
Freeze/thaw tests indicated that concretes with high density had low durability factors. High
density indicates a low air content. However, the field performance of these concretes in pier
caps is expected to be satisfactory since they have very low permeability and will be difficult
to saturate critically under the deck.
RECOMMENDATION
1. VDOT’s Structure and Bridge Division and Materials Division should approve the use of
SCC as an option in prestressed concrete beams and cast-in-place applications to facilitate
fabrication, improve surface condition, and improve strength and durability.
BENEFITS AND IMPLEMENTATION
Benefits
Compared to conventional mixtures, SCC is expected to have greater material-related
costs because of changes in ingredients, particularly the addition of more and higher dosages of
chemical admixtures. However, the ease of placement, speed of construction, and reduced labor
requirements are expected to result in an overall cost savings in structures with SCC. Further,
the lack of problems with consolidation is expected to lead to improved surface appearance,
strength, and durability; an increased service life; and lower life cycle costs.
15
The acceptance of SCC as an option is expected to facilitate construction because of
SCC’s high workability and the absence of the need for consolidation. In addition, SCC is
expected to be of high quality because of its lack of entrapped air voids and its low w/cm.
Implementation
VDOT’s Structure and Bridge Division and Materials Division have approved SCC as an
option in prestressed concrete beams and cast-in-place applications to facilitate fabrication,
improve surface condition, and improve strength and durability. VDOT will include this option
in its new 2016 Road and Bridge Specifications.
ACKNOWLEDGMENTS
Appreciation is extended to the Virginia Transportation Research Council (VTRC),
VDOT, and the Federal Highway Administration for their support of this research. The authors
thank VTRC staff Mike Burton, Lewis Lloyd, and Andy Mills for the preparation and testing of
samples and Catherine Hyland and Abigail Leonard for the evaluation of the data.
REFERENCES
American Concrete Institute. 237R-07: Self-Consolidating Concrete. Farmington Hills, MI,
2007.
ASTM International. ASTM C666: Standard Test Method for Resistance of Concrete to Rapid
Freezing and Thawing. In Annual Book of ASTM Standards, Vol. 04.02. West
Conshohocken, PA, 2008a.
ASTM International. ASTM C157: Standard Test Method for Length Change of Hardened
Hydraulic-Cement Mortar and Concrete. In Annual Book of ASTM Standards, Vol. 04.02.
West Conshohocken, PA, 2008b.
ASTM International. ASTM C1611: Standard Test Method for Slump Flow of Self-
Consolidating Concrete. In Annual Book of ASTM Standards, Vol. 04.02. West
Conshohocken, PA, 2009a.
ASTM International. ASTM C1621: Standard Test Method for Passing Ability of Self-
Consolidating Concrete by J-Ring. In Annual Book of ASTM Standards, Vol. 04.02.
West Conshohocken, PA, 2009b.
16
ASTM International. ASTM C231: Standard Test Method for Air Content of Freshly Mixed
Concrete by the Pressure Method. In Annual Book of ASTM Standards, Vol. 04.02. West
Conshohocken, PA, 2010a.
ASTM International. ASTM C469: Standard Test Method for Static Modulus of Elasticity and
Poisson’s Ratio of Concrete in Compression. In Annual Book of ASTM Standards, Vol.
04.02. West Conshohocken, PA, 2010b.
ASTM International. ASTM C496: Standard Test Method for Splitting Tensile Strength of
Cylindrical Concrete Specimens. In Annual Book of ASTM Standards, Vol. 04.02. West
Conshohocken, PA, 2011.
ASTM International. ASTM C39: Standard Test Method for Compressive Strength of
Cylindrical Concrete Specimens. In Annual Book of ASTM Standards, Vol. 04.02. West
Conshohocken, PA, 2012a.
ASTM International. ASTM C1202: Standard Test Method for Electrical Indication of
Concrete’s Ability to Resist Chloride Ion Penetration. In Annual Book of ASTM
Standards, Vol. 04.02. West Conshohocken, PA, 2012b.
ASTM International. ASTM C138: Standard Test Method for Density (Unit Weight), Yield, and
Air Content (Gravimetric) of Concrete. In Annual Book of ASTM Standards, Vol. 04.02.
West Conshohocken, PA, 2013.
Babaei, K., and Fouladgar, A.M. Solutions to Concrete Bridge Deck Cracking. Concrete
International, Vol. 19, No. 7, 1997, pp. 34-37.
Okamura, H., and Ouchi, M. Self-Compacting Concrete: Development, Present Use and Future.
In Self Compacting Concrete: Proceedings of the First International RILEM Symposium,
A. Skarendahl, and O. Petersson, Eds. RILEM Publications, Cachan Cedex, France,
1999.
Ozyildirim, C. Air-Void Characteristics of Concretes in Different Applications. In
Transportation Research Record: Journal of the Transportation Research Board, No.
1893. Transportation Research Board of the National Academies, Washington, DC, 2004,
pp. 70-74.
Ozyildirim, C. Virginia Department of Transportation Early Experience With Self-
Consolidating Concrete. In Transportation Research Record: Journal of the
Transportation Research Board, No. 1893. Transportation Research Board of the
National Academies, Washington, DC, 2005, pp. 81-84.
Ozyildirim, C. Bulb-T Beams With Self-Consolidating Concrete on the Route 33 Bridge
Over the Pamunkey River in Virginia. VTRC 09-R5. Virginia Transportation Research
Council, Charlottesville, 2008.
17
Ozyildirim, C. Lightweight High-Performance Concrete Bulb-T Beams With Self-Consolidating
Concrete in a Bridge Structure. VCTIR 14-R15. Virginia Center for Transportation
Innovation and Research, Charlottesville, 2014.
Ozyildirim, C., and Davis, R.T. Bulb-T Beams With Self-Consolidating Concrete on Route 33
in Virginia. In Transportation Research Record: Journal of the Transportation Research
Board, No. 2020. Transportation Research Board of the National Academies,
Washington, DC, 2007, pp. 76-82.
Ozyildirim, C., and Sharp, S. Preparation and Testing of Drilled Shafts with Self-Consolidating
Concrete. VCTIR 12-R15. Virginia Center for Transportation Innovation and Research,
Charlottesville, 2012.
Sonebi, M., and Bartos, P.J.M. Hardened SCC and Its Bond With Reinforcement. In Self
Compacting Concrete: Proceedings of the First International RILEM Symposium, A.
Skarendahl, and O. Petersson, Eds. RILEM Publications, Cachan Cedex, France, 1999.

18
19
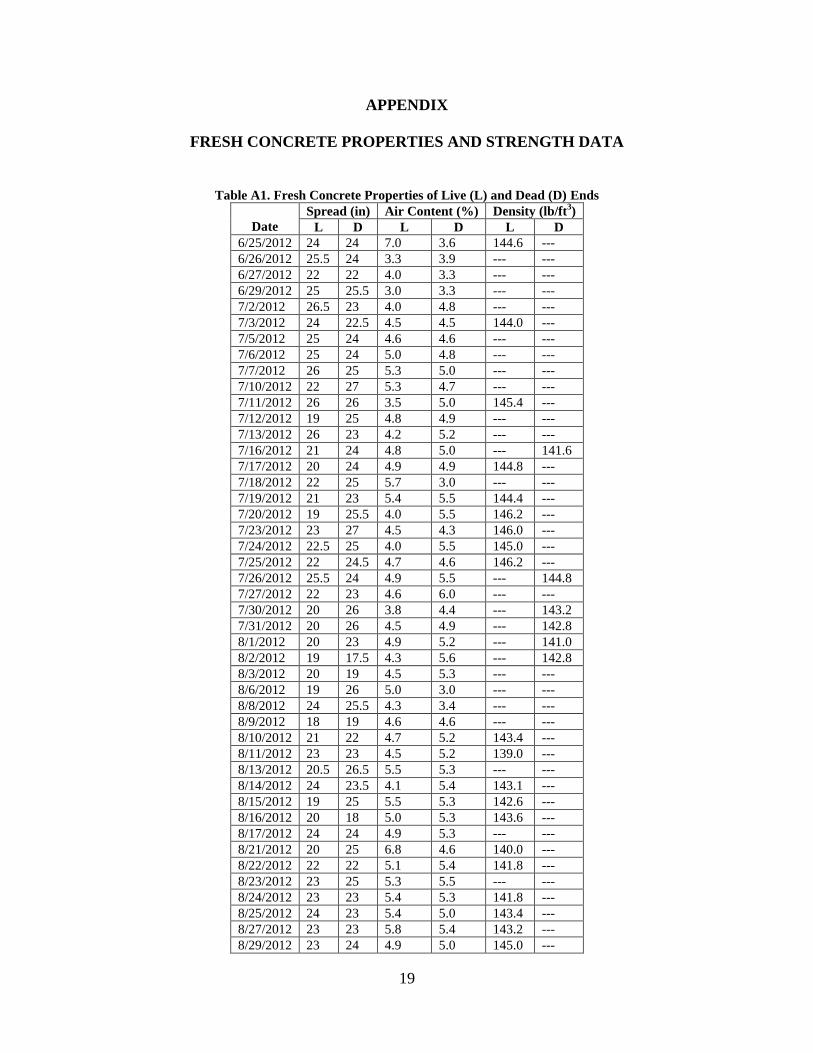
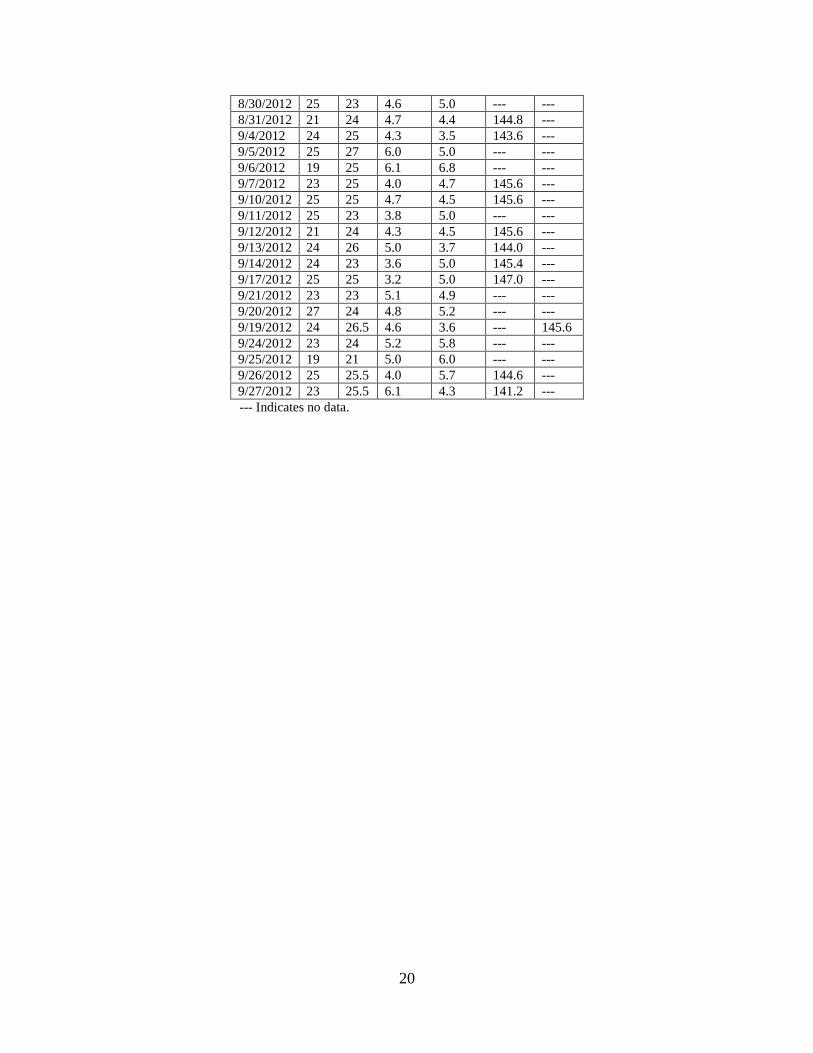
APPENDIX
FRESH CONCRETE PROPERTIES AND STRENGTH DATA
Table A1. Fresh Concrete Properties of Live (L) and Dead (D) Ends
Date
Spread (in) Air Content (%) Density (lb/ft3)
L D L D L D
6/25/2012 24 24 7.0 3.6 144.6 ---
6/26/2012 25.5 24 3.3 3.9 --- ---
6/27/2012 22 22 4.0 3.3 --- ---
6/29/2012 25 25.5 3.0 3.3 --- ---
7/2/2012 26.5 23 4.0 4.8 --- ---
7/3/2012 24 22.5 4.5 4.5 144.0 ---
7/5/2012 25 24 4.6 4.6 --- ---
7/6/2012 25 24 5.0 4.8 --- ---
7/7/2012 26 25 5.3 5.0 --- ---
7/10/2012 22 27 5.3 4.7 --- ---
7/11/2012 26 26 3.5 5.0 145.4 ---
7/12/2012 19 25 4.8 4.9 --- ---
7/13/2012 26 23 4.2 5.2 --- ---
7/16/2012 21 24 4.8 5.0 --- 141.6
7/17/2012 20 24 4.9 4.9 144.8 ---
7/18/2012 22 25 5.7 3.0 --- ---
7/19/2012 21 23 5.4 5.5 144.4 ---
7/20/2012 19 25.5 4.0 5.5 146.2 ---
7/23/2012 23 27 4.5 4.3 146.0 ---
7/24/2012 22.5 25 4.0 5.5 145.0 ---
7/25/2012 22 24.5 4.7 4.6 146.2 ---
7/26/2012 25.5 24 4.9 5.5 --- 144.8
7/27/2012 22 23 4.6 6.0 --- ---
7/30/2012 20 26 3.8 4.4 --- 143.2
7/31/2012 20 26 4.5 4.9 --- 142.8
8/1/2012 20 23 4.9 5.2 --- 141.0
8/2/2012 19 17.5 4.3 5.6 --- 142.8
8/3/2012 20 19 4.5 5.3 --- ---
8/6/2012 19 26 5.0 3.0 --- ---
8/8/2012 24 25.5 4.3 3.4 --- ---
8/9/2012 18 19 4.6 4.6 --- ---
8/10/2012 21 22 4.7 5.2 143.4 ---
8/11/2012 23 23 4.5 5.2 139.0 ---
8/13/2012 20.5 26.5 5.5 5.3 --- ---
8/14/2012 24 23.5 4.1 5.4 143.1 ---
8/15/2012 19 25 5.5 5.3 142.6 ---
8/16/2012 20 18 5.0 5.3 143.6 ---
8/17/2012 24 24 4.9 5.3 --- ---
8/21/2012 20 25 6.8 4.6 140.0 ---
8/22/2012 22 22 5.1 5.4 141.8 ---
8/23/2012 23 25 5.3 5.5 --- ---
8/24/2012 23 23 5.4 5.3 141.8 ---
8/25/2012 24 23 5.4 5.0 143.4 ---
8/27/2012 23 23 5.8 5.4 143.2 ---
8/29/2012 23 24 4.9 5.0 145.0 ---
20
8/30/2012 25 23 4.6 5.0 --- ---
8/31/2012 21 24 4.7 4.4 144.8 ---
9/4/2012 24 25 4.3 3.5 143.6 ---
9/5/2012 25 27 6.0 5.0 --- ---
9/6/2012 19 25 6.1 6.8 --- ---
9/7/2012 23 25 4.0 4.7 145.6 ---
9/10/2012 25 25 4.7 4.5 145.6 ---
9/11/2012 25 23 3.8 5.0 --- ---
9/12/2012 21 24 4.3 4.5 145.6 ---
9/13/2012 24 26 5.0 3.7 144.0 ---
9/14/2012 24 23 3.6 5.0 145.4 ---
9/17/2012 25 25 3.2 5.0 147.0 ---
9/21/2012 23 23 5.1 4.9 --- ---
9/20/2012 27 24 4.8 5.2 --- ---
9/19/2012 24 26.5 4.6 3.6 --- 145.6
9/24/2012 23 24 5.2 5.8 --- ---
9/25/2012 19 21 5.0 6.0 --- ---
9/26/2012 25 25.5 4.0 5.7 144.6 ---
9/27/2012 23 25.5 6.1 4.3 141.2 ---
--- Indicates no data.
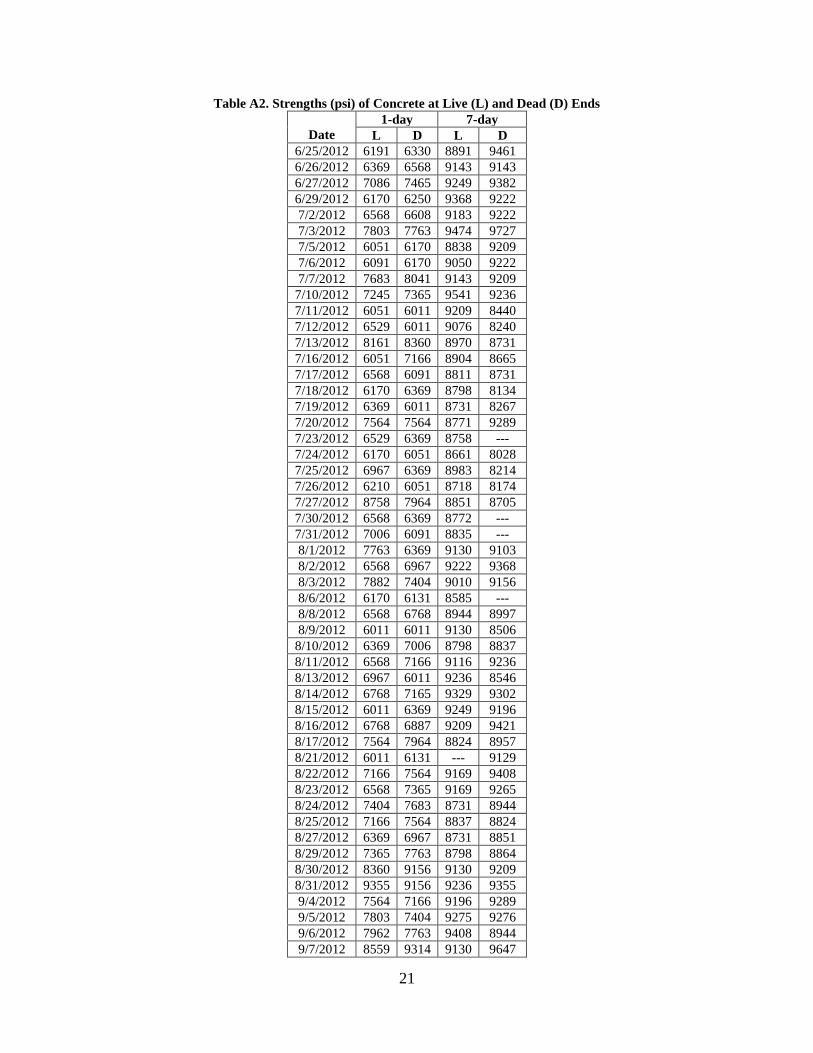
21
Table A2. Strengths (psi) of Concrete at Live (L) and Dead (D) Ends
Date
1-day 7-day
L D L D
6/25/2012 6191 6330 8891 9461
6/26/2012 6369 6568 9143 9143
6/27/2012 7086 7465 9249 9382
6/29/2012 6170 6250 9368 9222
7/2/2012 6568 6608 9183 9222
7/3/2012 7803 7763 9474 9727
7/5/2012 6051 6170 8838 9209
7/6/2012 6091 6170 9050 9222
7/7/2012 7683 8041 9143 9209
7/10/2012 7245 7365 9541 9236
7/11/2012 6051 6011 9209 8440
7/12/2012 6529 6011 9076 8240
7/13/2012 8161 8360 8970 8731
7/16/2012 6051 7166 8904 8665
7/17/2012 6568 6091 8811 8731
7/18/2012 6170 6369 8798 8134
7/19/2012 6369 6011 8731 8267
7/20/2012 7564 7564 8771 9289
7/23/2012 6529 6369 8758 ---
7/24/2012 6170 6051 8661 8028
7/25/2012 6967 6369 8983 8214
7/26/2012 6210 6051 8718 8174
7/27/2012 8758 7964 8851 8705
7/30/2012 6568 6369 8772 ---
7/31/2012 7006 6091 8835 ---
8/1/2012 7763 6369 9130 9103
8/2/2012 6568 6967 9222 9368
8/3/2012 7882 7404 9010 9156
8/6/2012 6170 6131 8585 ---
8/8/2012 6568 6768 8944 8997
8/9/2012 6011 6011 9130 8506
8/10/2012 6369 7006 8798 8837
8/11/2012 6568 7166 9116 9236
8/13/2012 6967 6011 9236 8546
8/14/2012 6768 7165 9329 9302
8/15/2012 6011 6369 9249 9196
8/16/2012 6768 6887 9209 9421
8/17/2012 7564 7964 8824 8957
8/21/2012 6011 6131 --- 9129
8/22/2012 7166 7564 9169 9408
8/23/2012 6568 7365 9169 9265
8/24/2012 7404 7683 8731 8944
8/25/2012 7166 7564 8837 8824
8/27/2012 6369 6967 8731 8851
8/29/2012 7365 7763 8798 8864
8/30/2012 8360 9156 9130 9209
8/31/2012 9355 9156 9236 9355
9/4/2012 7564 7166 9196 9289
9/5/2012 7803 7404 9275 9276
9/6/2012 7962 7763 9408 8944
9/7/2012 8559 9314 9130 9647
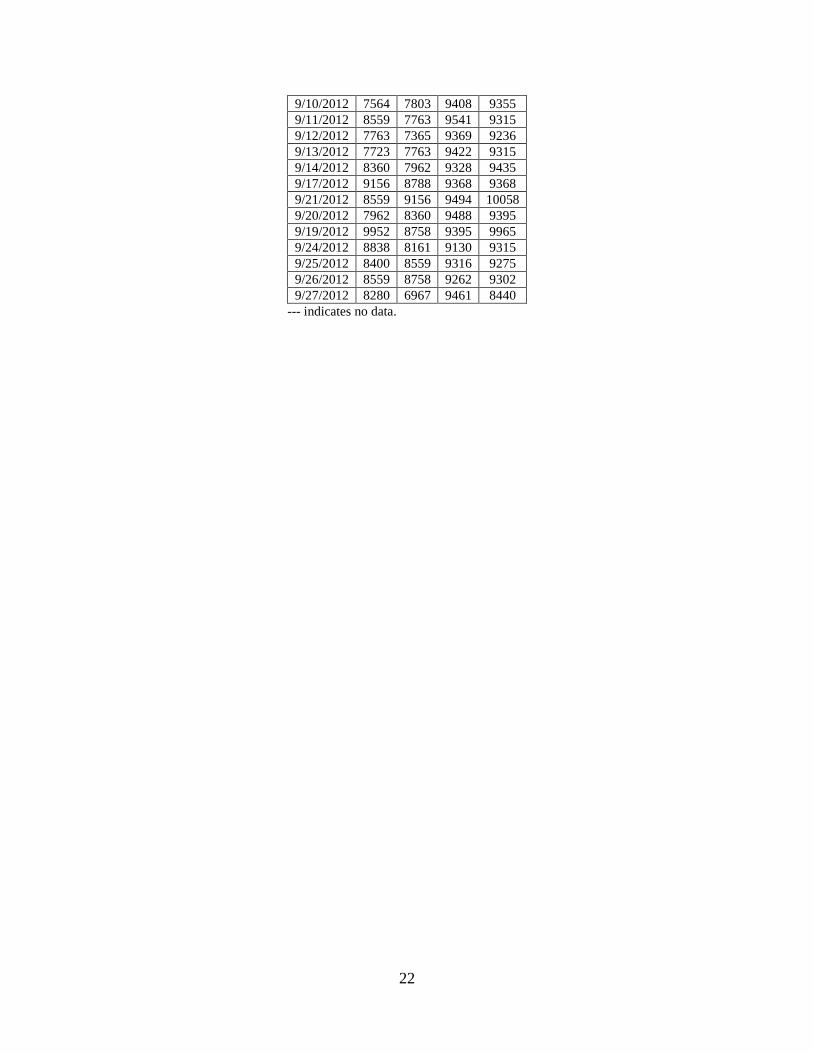
22
9/10/2012 7564 7803 9408 9355
9/11/2012 8559 7763 9541 9315
9/12/2012 7763 7365 9369 9236
9/13/2012 7723 7763 9422 9315
9/14/2012 8360 7962 9328 9435
9/17/2012 9156 8788 9368 9368
9/21/2012 8559 9156 9494 10058
9/20/2012 7962 8360 9488 9395
9/19/2012 9952 8758 9395 9965
9/24/2012 8838 8161 9130 9315
9/25/2012 8400 8559 9316 9275
9/26/2012 8559 8758 9262 9302
9/27/2012 8280 6967 9461 8440
--- indicates no data.


![Specialized strut-and-tie method for rapid strength ......program named STM-CAP (Strut-and-Tie Method for pier CAPs) [25,26].Theprogramisdividedintoseveralsectionscoveringvarious aspectsoftheinputparameters](https://img.pdfslide.us/doc/110x75/5f0349757e708231d408776e/specialized-strut-and-tie-method-for-rapid-strength-program-named-stm-cap.jpg)