Embed Size (px)
Citation preview
BRICS BRIEF SERIES
1
Introduction
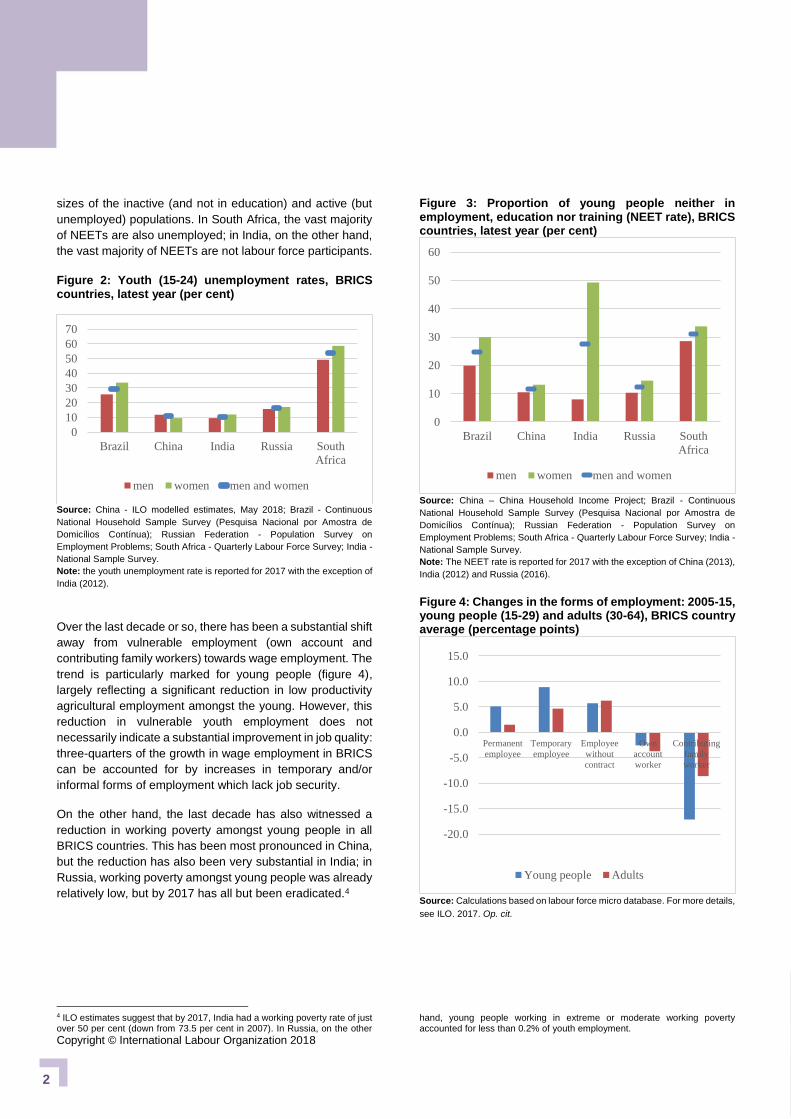
The BRICS countries fall into one of two identifiable groups
in terms of overall economic performance since 2010 (figure
1): China and India have experienced average growth rates
in the region of 7-8 per cent, whilst the other three countries
have averaged between 1 and 2 per cent. Brazil has had the
most variable performance: falling from 7.5 per cent in 2010
to -3.6 per cent in 2015. All of the BRICS countries, with the
partial exception of India, have witnessed a significant
slowdown during the decade.
Figure 1: Average annual real GDP growth rates, BRICS countries, 2010-17 (per cent)
Source: IMF, World Economic Outlook Update, July 2018.
Overall, the BRICS countries have seen a significant move
away from vulnerable employment towards wage
employment of 6.6 percentage points, well in excess of the
world average excluding BRICS of 1.6 percentage points.
Similarly, the BRICS countries have witnessed a significant
move out of agricultural employment - which has fallen by
almost 13 percentage points between 2006 and 2017 –
towards services which has risen by almost 14 percentage
points over the same period. This compares to a much more
modest 3 percentage point reduction in agricultural
employment and 4.4 percentage point increase in service
sector employment observed in the rest of the world. This
move has been dominated by the massive shift away from
agriculture towards services observed in China, but all the
other BRICS countries have experienced the same change
albeit in rather more moderate terms.
1 ILO. Forthcoming. Women and men in the informal economy: A statistical picture. Third Edition (Geneva).
Comparable time series data on informal employment are
not available; such data as does exist suggests that, with the
exception of Russia, in recent years informal employment
has been on a consistent downward trend. At the same time,
the phenomenon remains extensive, ranging from the
relatively moderate rates of 34.0 per cent of the employed in
South Africa and 35.9 per cent in Russia through to 46.0 per
cent in Brazil and 54.4 per cent in China, reaching 88.2 per
cent of the employed in India.1
Within this context, BRICS Labour and Employment
Ministers’ in 2017 noted the “progress in several labour and
social areas while facing a number of arduous tasks,
including improving labour force participation rates, tackling
persistent informality, and reducing inequality.” 2 They also
reiterated their commitment to the 2030 Agenda for
Sustainable Development and to promote sustained,
inclusive and sustainable economic growth, full and
productive employment and decent work for all, Sustainable
Development Goal 8. Providing productive employment
opportunities for young women and men is also a key
element of the SDGs. SDG target 8.6 for example aims at
“substantially reducing the proportion of youth not in
employment, education or training” by 2020 while SDG
target 8.b calls to “by 2020, develop and operationalize a
global strategy for youth employment and implement the
Global Jobs Pact of the International Labour Organization.”
Trends
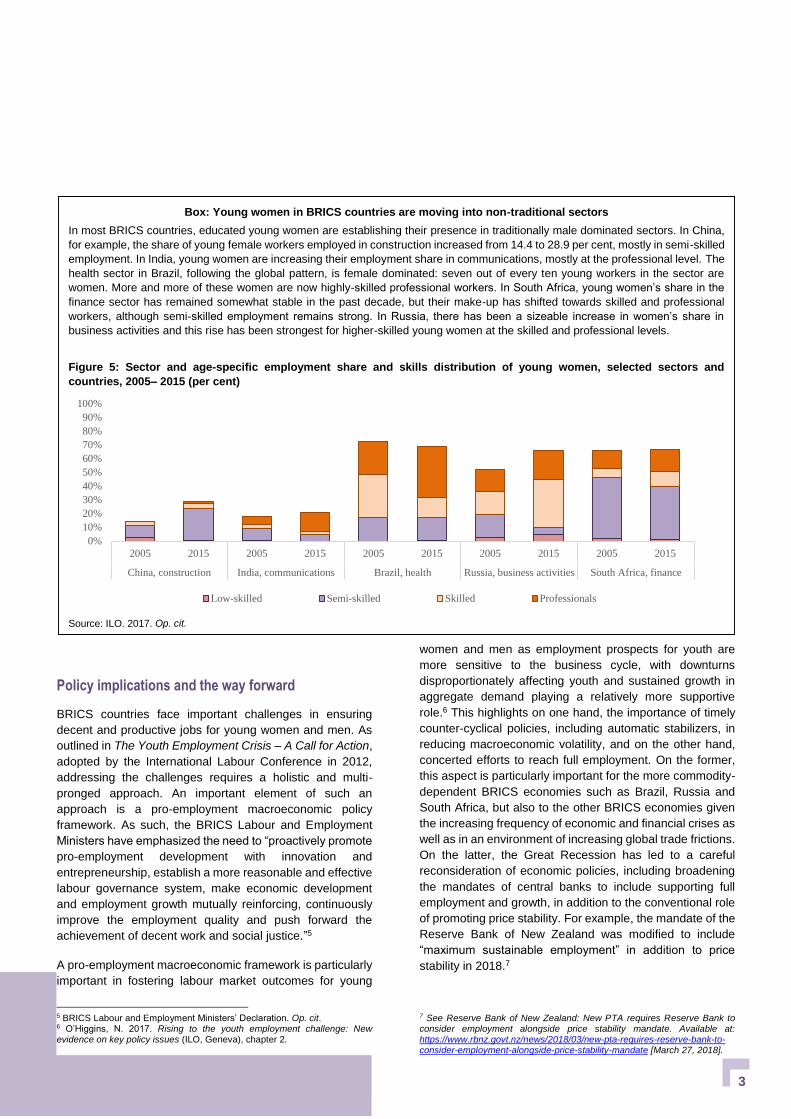
Youth unemployment rates are highest in South Africa whilst
the rate in Brazil also increased substantially following the
collapse of growth in the country (figure 2). The other three
countries hover around the global average rate of 12.6 per
cent.3 Of note, in all BRICS countries save China, the youth
unemployment rate is higher for young women than young
men.
The youth NEET rate – the proportion of 15 – 24 year olds
who are neither in employment nor in education or training –
provides a slightly different picture (figure 3); gender
differences are more marked and in all BRICS countries the
NEET rate is higher for young women than young men. In
India, the young female NEET rate is more than six times the
young male rate. The differences between NEET and
unemployment rates are to be accounted for by the relative
2 BRICS Labour and Employment Ministers’ Declaration, Chongqing, China July 27, 2017. 3ILO modelled estimates, May 2018.
0
1
2
3
4
5
6
7
8
9
Brazil China India Russia South
Africa
BRICS SUMMARY: YOUTH EMPLOYMENT
Copyright © International Labour Organization 2018
2
sizes of the inactive (and not in education) and active (but
unemployed) populations. In South Africa, the vast majority
of NEETs are also unemployed; in India, on the other hand,
the vast majority of NEETs are not labour force participants.
Figure 2: Youth (15-24) unemployment rates, BRICS countries, latest year (per cent)
Source: China - ILO modelled estimates, May 2018; Brazil - Continuous
National Household Sample Survey (Pesquisa Nacional por Amostra de
Domicílios Contínua); Russian Federation - Population Survey on
Employment Problems; South Africa - Quarterly Labour Force Survey; India -
National Sample Survey.
Note: the youth unemployment rate is reported for 2017 with the exception of
India (2012).
Over the last decade or so, there has been a substantial shift
away from vulnerable employment (own account and
contributing family workers) towards wage employment. The
trend is particularly marked for young people (figure 4),
largely reflecting a significant reduction in low productivity
agricultural employment amongst the young. However, this
reduction in vulnerable youth employment does not
necessarily indicate a substantial improvement in job quality:
three-quarters of the growth in wage employment in BRICS
can be accounted for by increases in temporary and/or
informal forms of employment which lack job security.
On the other hand, the last decade has also witnessed a
reduction in working poverty amongst young people in all
BRICS countries. This has been most pronounced in China,
but the reduction has also been very substantial in India; in
Russia, working poverty amongst young people was already
relatively low, but by 2017 has all but been eradicated.4
4 ILO estimates suggest that by 2017, India had a working poverty rate of just over 50 per cent (down from 73.5 per cent in 2007). In Russia, on the other
Figure 3: Proportion of young people neither in employment, education nor training (NEET rate), BRICS countries, latest year (per cent)
Source: China – China Household Income Project; Brazil - Continuous
National Household Sample Survey (Pesquisa Nacional por Amostra de
Domicílios Contínua); Russian Federation - Population Survey on
Employment Problems; South Africa - Quarterly Labour Force Survey; India -
National Sample Survey.
Note: The NEET rate is reported for 2017 with the exception of China (2013),
India (2012) and Russia (2016).
Figure 4: Changes in the forms of employment: 2005-15, young people (15-29) and adults (30-64), BRICS country average (percentage points)
Source: Calculations based on labour force micro database. For more details,
see ILO. 2017. Op. cit.
hand, young people working in extreme or moderate working poverty accounted for less than 0.2% of youth employment.
0
10
20
30
40
50
60
70
Brazil China India Russia South
Africa
men women men and women
0
10
20
30
40
50
60
Brazil China India Russia South
Africa
men women men and women
-20.0
-15.0
-10.0
-5.0
0.0
5.0
10.0
15.0
Permanent
employee
Temporary
employee
Employee
without
contract
Own
account
worker
Contributing
family
worker
Young people Adults
3
Policy implications and the way forward
BRICS countries face important challenges in ensuring
decent and productive jobs for young women and men. As
outlined in The Youth Employment Crisis – A Call for Action,
adopted by the International Labour Conference in 2012,
addressing the challenges requires a holistic and multi-
pronged approach. An important element of such an
approach is a pro-employment macroeconomic policy
framework. As such, the BRICS Labour and Employment
Ministers have emphasized the need to “proactively promote
pro-employment development with innovation and
entrepreneurship, establish a more reasonable and effective
labour governance system, make economic development
and employment growth mutually reinforcing, continuously
improve the employment quality and push forward the
achievement of decent work and social justice.”5
A pro-employment macroeconomic framework is particularly
important in fostering labour market outcomes for young
5 BRICS Labour and Employment Ministers’ Declaration. Op. cit. 6 O’Higgins, N. 2017. Rising to the youth employment challenge: New evidence on key policy issues (ILO, Geneva), chapter 2.
women and men as employment prospects for youth are
more sensitive to the business cycle, with downturns
disproportionately affecting youth and sustained growth in
aggregate demand playing a relatively more supportive
role.6 This highlights on one hand, the importance of timely
counter-cyclical policies, including automatic stabilizers, in
reducing macroeconomic volatility, and on the other hand,
concerted efforts to reach full employment. On the former,
this aspect is particularly important for the more commodity-
dependent BRICS economies such as Brazil, Russia and
South Africa, but also to the other BRICS economies given
the increasing frequency of economic and financial crises as
well as in an environment of increasing global trade frictions.
On the latter, the Great Recession has led to a careful
reconsideration of economic policies, including broadening
the mandates of central banks to include supporting full
employment and growth, in addition to the conventional role
of promoting price stability. For example, the mandate of the
Reserve Bank of New Zealand was modified to include
“maximum sustainable employment” in addition to price
stability in 2018.7
7 See Reserve Bank of New Zealand: New PTA requires Reserve Bank to consider employment alongside price stability mandate. Available at: https://www.rbnz.govt.nz/news/2018/03/new-pta-requires-reserve-bank-to-consider-employment-alongside-price-stability-mandate [March 27, 2018].
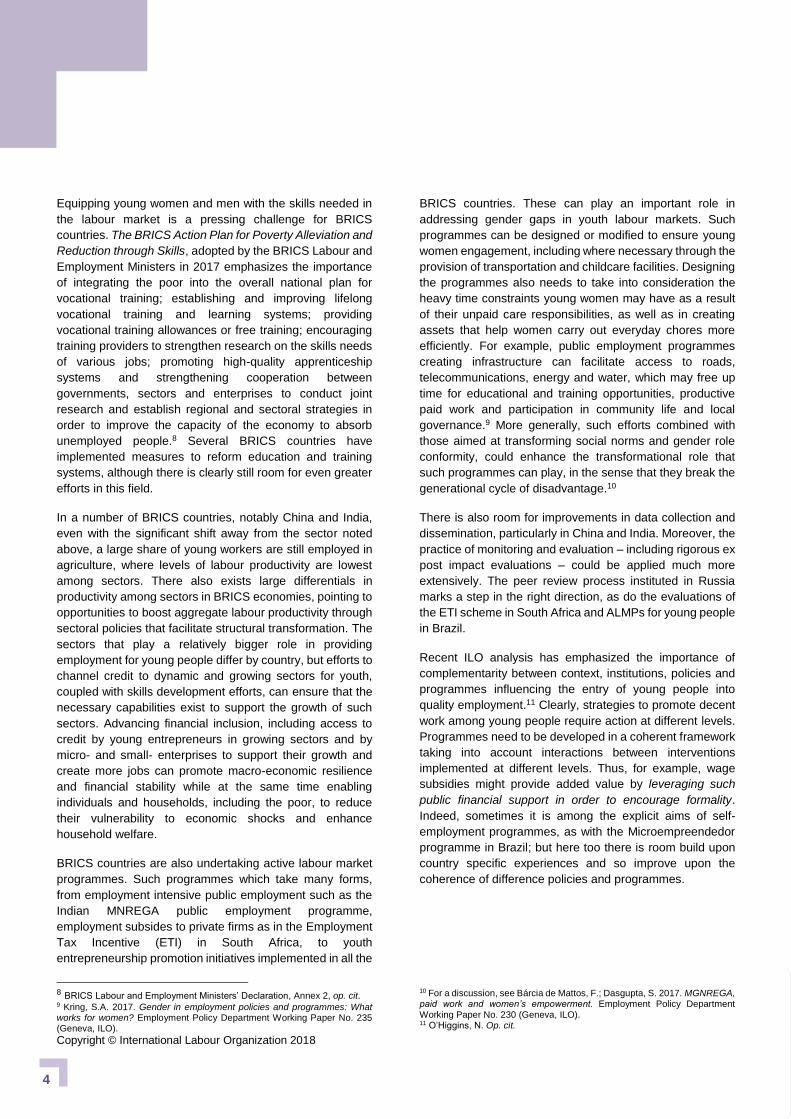
Box: Young women in BRICS countries are moving into non-traditional sectors
In most BRICS countries, educated young women are establishing their presence in traditionally male dominated sectors. In China,
for example, the share of young female workers employed in construction increased from 14.4 to 28.9 per cent, mostly in semi-skilled
employment. In India, young women are increasing their employment share in communications, mostly at the professional level. The
health sector in Brazil, following the global pattern, is female dominated: seven out of every ten young workers in the sector are
women. More and more of these women are now highly-skilled professional workers. In South Africa, young women’s share in the
finance sector has remained somewhat stable in the past decade, but their make-up has shifted towards skilled and professional
workers, although semi-skilled employment remains strong. In Russia, there has been a sizeable increase in women’s share in
business activities and this rise has been strongest for higher-skilled young women at the skilled and professional levels.
Figure 5: Sector and age-specific employment share and skills distribution of young women, selected sectors and
countries, 2005– 2015 (per cent)
Source: ILO. 2017. Op. cit. accessed 10 Sept. 2017).
0%
10%
20%
30%
40%
50%
60%
70%
80%
90%
100%
2005 2015 2005 2015 2005 2015 2005 2015 2005 2015
China, construction India, communications Brazil, health Russia, business activities South Africa, finance
Low-skilled Semi-skilled Skilled Professionals
Copyright © International Labour Organization 2018
4
Equipping young women and men with the skills needed in
the labour market is a pressing challenge for BRICS
countries. The BRICS Action Plan for Poverty Alleviation and
Reduction through Skills, adopted by the BRICS Labour and
Employment Ministers in 2017 emphasizes the importance
of integrating the poor into the overall national plan for
vocational training; establishing and improving lifelong
vocational training and learning systems; providing
vocational training allowances or free training; encouraging
training providers to strengthen research on the skills needs
of various jobs; promoting high-quality apprenticeship
systems and strengthening cooperation between
governments, sectors and enterprises to conduct joint
research and establish regional and sectoral strategies in
order to improve the capacity of the economy to absorb
unemployed people.8 Several BRICS countries have
implemented measures to reform education and training
systems, although there is clearly still room for even greater
efforts in this field.
In a number of BRICS countries, notably China and India,
even with the significant shift away from the sector noted
above, a large share of young workers are still employed in
agriculture, where levels of labour productivity are lowest
among sectors. There also exists large differentials in
productivity among sectors in BRICS economies, pointing to
opportunities to boost aggregate labour productivity through
sectoral policies that facilitate structural transformation. The
sectors that play a relatively bigger role in providing
employment for young people differ by country, but efforts to
channel credit to dynamic and growing sectors for youth,
coupled with skills development efforts, can ensure that the
necessary capabilities exist to support the growth of such
sectors. Advancing financial inclusion, including access to
credit by young entrepreneurs in growing sectors and by
micro- and small- enterprises to support their growth and
create more jobs can promote macro-economic resilience
and financial stability while at the same time enabling
individuals and households, including the poor, to reduce
their vulnerability to economic shocks and enhance
household welfare.
BRICS countries are also undertaking active labour market
programmes. Such programmes which take many forms,
from employment intensive public employment such as the
Indian MNREGA public employment programme,
employment subsides to private firms as in the Employment
Tax Incentive (ETI) in South Africa, to youth
entrepreneurship promotion initiatives implemented in all the
8 BRICS Labour and Employment Ministers’ Declaration, Annex 2, op. cit. 9 Kring, S.A. 2017. Gender in employment policies and programmes: What works for women? Employment Policy Department Working Paper No. 235 (Geneva, ILO).
BRICS countries. These can play an important role in
addressing gender gaps in youth labour markets. Such
programmes can be designed or modified to ensure young
women engagement, including where necessary through the
provision of transportation and childcare facilities. Designing
the programmes also needs to take into consideration the
heavy time constraints young women may have as a result
of their unpaid care responsibilities, as well as in creating
assets that help women carry out everyday chores more
efficiently. For example, public employment programmes
creating infrastructure can facilitate access to roads,
telecommunications, energy and water, which may free up
time for educational and training opportunities, productive
paid work and participation in community life and local
governance.9 More generally, such efforts combined with
those aimed at transforming social norms and gender role
conformity, could enhance the transformational role that
such programmes can play, in the sense that they break the
generational cycle of disadvantage.10
There is also room for improvements in data collection and
dissemination, particularly in China and India. Moreover, the
practice of monitoring and evaluation – including rigorous ex
post impact evaluations – could be applied much more
extensively. The peer review process instituted in Russia
marks a step in the right direction, as do the evaluations of
the ETI scheme in South Africa and ALMPs for young people
in Brazil.
Recent ILO analysis has emphasized the importance of
complementarity between context, institutions, policies and
programmes influencing the entry of young people into
quality employment.11 Clearly, strategies to promote decent
work among young people require action at different levels.
Programmes need to be developed in a coherent framework
taking into account interactions between interventions
implemented at different levels. Thus, for example, wage
subsidies might provide added value by leveraging such
public financial support in order to encourage formality.
Indeed, sometimes it is among the explicit aims of self-
employment programmes, as with the Microempreendedor
programme in Brazil; but here too there is room build upon
country specific experiences and so improve upon the
coherence of difference policies and programmes.
10 For a discussion, see Bárcia de Mattos, F.; Dasgupta, S. 2017. MGNREGA, paid work and women’s empowerment. Employment Policy Department Working Paper No. 230 (Geneva, ILO). 11 O’Higgins, N. Op. cit.
BRICS BRIEF SERIES
5
Introduction
The labour market in Brazil today presents numerous
challenges for workers. This partially reflects the country’s
recent economic performance. After strong economic and
labour market performance in the early 2000s, economic
growth stagnated in 2014, followed by two recessionary
years in 2015 and 2016, with small but positive growth in
2017.12 Since 2012, fluctuations in economic growth
translate into an average real contraction of 0.5 per cent
annually, with virtually nil employment growth13. At the same
time, vulnerable and informal employment – associated with
low wages, limited legal and social protection and poor
working conditions – are widespread, accounting for 27.5
per cent and 46.0 of employment respectively.14 The labour
market situation of young workers has been particularly
performance, with the risk of life-long consequences in terms
of lower earning prospects, more spells of unemployment,
and lower chances of accessing decent employment.15
Trends
In context of stagnation and recession, young people often
engage in labour markets to compensate for losses in
household income.16 Indeed, labour force participation rates
have risen along with unemployment rates. Between 2014
and 2017, participation expanded from 53.9 to 55.0 per cent,
while unemployment rose from 15.8 to 30.2 per cent, over
twice as high as the global rate. Unemployment is more than
three times as common among young workers as among
12 Economic growth data from IMF. 2018. World Economic Outlook Update, July 2018. 13 All labour market data refers to ILOSTAT (national data from), accessed 22 Mar. 2018, unless otherwise specified. Unemployment accessed in July 2018. 14 Vulnerable employment is defined as the sum of own-account workers and contributing family workers. The share of non-agricultural informal employment in non-agriculture, Sustainable Development Goal indicator 8.3.1, is also estimated to be 42.5 per cent. ILO. Forthcoming. Women and men in the informal economy: A statistical picture. Third edition (Geneva). 15 Youth refers to ages 15-24 and adults to persons ages 25 or more, unless otherwise specified. It is worth noting that the national definition of youth in Brazil includes young people ages 15-29, and this definition is used in the
current brief for a few indicators, as specified.
adults (9.3 per cent). More than one-third of young women
in the labour market (33.7 per cent) were unemployed in
2017, compared to 25.7 per cent of young men. A closer look
reveals unemployment is inversely related to education
attainment – it is highest for youth with basic education (35.6
per cent) and lowest for those with advanced education
(19.4 per cent).17 Although this can be partly explained by
the fact that young people may not yet have reached the
standard ages for secondary and tertiary completion, this
suggests a potential misalignment between skills demanded
in the labour market and those offered by youth. This is
corroborated by the findings of a recent school-to-work
transition survey, which indicate that one-fourth of employed
persons ages 15-29 were insufficiently qualified for their
jobs.18
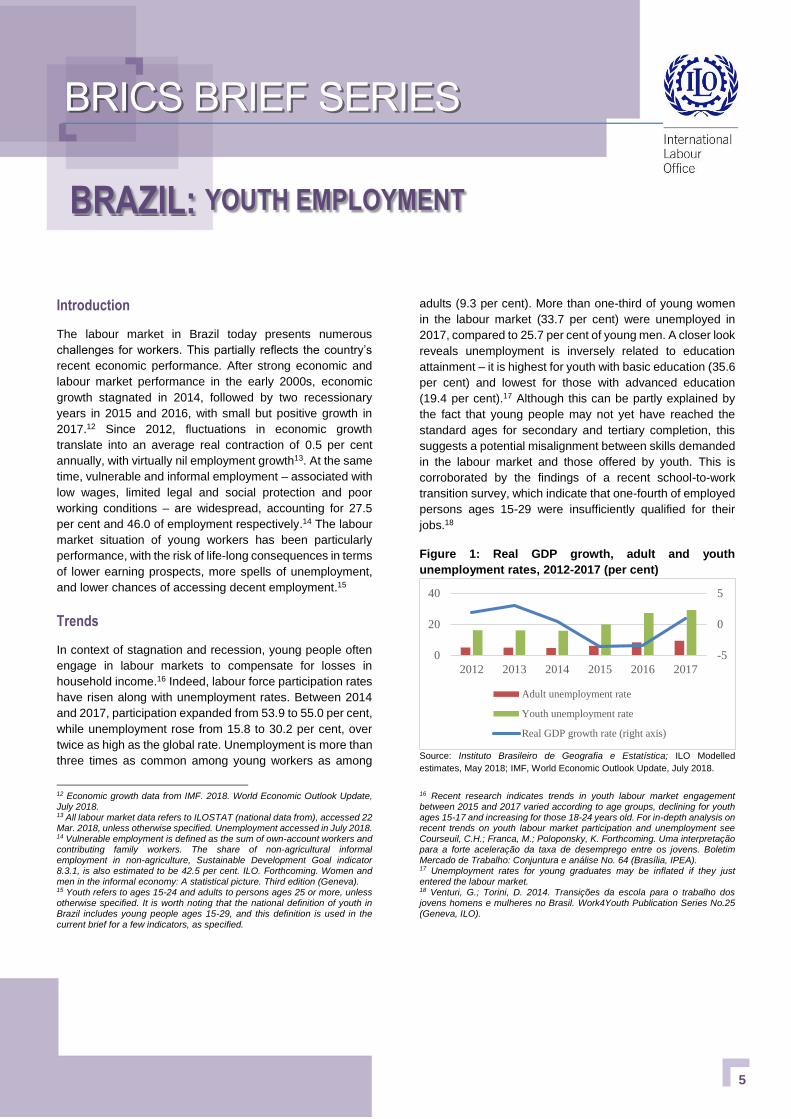
Figure 1: Real GDP growth, adult and youth
unemployment rates, 2012-2017 (per cent)
Source: Instituto Brasileiro de Geografia e Estatística; ILO Modelled
estimates, May 2018; IMF, World Economic Outlook Update, July 2018.
16 Recent research indicates trends in youth labour market engagement between 2015 and 2017 varied according to age groups, declining for youth ages 15-17 and increasing for those 18-24 years old. For in-depth analysis on recent trends on youth labour market participation and unemployment see Courseuil, C.H.; Franca, M.; Poloponsky, K. Forthcoming. Uma interpretação para a forte aceleração da taxa de desemprego entre os jovens. Boletim Mercado de Trabalho: Conjuntura e análise No. 64 (Brasília, IPEA). 17 Unemployment rates for young graduates may be inflated if they just entered the labour market. 18 Venturi, G.; Torini, D. 2014. Transições da escola para o trabalho dos jovens homens e mulheres no Brasil. Work4Youth Publication Series No.25 (Geneva, ILO).
-5
0
5
0
20
40
2012 2013 2014 2015 2016 2017
Adult unemployment rate
Youth unemployment rate
Real GDP growth rate (right axis)
BRAZIL: YOUTH EMPLOYMENT
Copyright © International Labour Organization 2018
6
Challenges are also reflected in the high incidence of youth
not in employment nor in education or training, (NEET): 24.8
per cent.19 Young women were much more likely than young
men to be NEET– 30.0 per cent relative to 19.9 per cent. The
gender gap has, however, declined in recent years, from
12.1 percentage points in 2012 to 10.1 points in 2017.
Economic and job growth in the early 2000s were
accompanied by marked improvements in job quality, but
challenges remain. The share of young employees ages 15-
29 in informal work declined from 33.5 per cent in 2005 to
25.8 per cent in 2015, as did the incidence of contributing
family work (-5.8 percentage points).20 Conversely, more
young workers are engaged in permanent contracts, 38.9
per cent. At the same time, the share of agriculture and
manufacturing in youth employment declined significantly,
and faster than adults’. In contrast, construction, trade,
hotels and restaurants and real estate and business
activities have become more prominent. Many 15-24 years
old in employment (6.6 per cent) do not earn enough to lift
themselves and their families out of poverty (US$ 3.10 per
day). Although the situation improved from the late 2000s,
downward trends were reversed in the past few years with
the subdued economic performance.
Policy implications and the way forward
The Government of Brazil and social partners have
displayed strong commitment to addressing youth labour
market challenges. In 2011, the country became the first in
the world to launch a National Agenda for Decent Work for
Youth, recognizing the need for comprehensive policy
action. More recently, since 2017, the Government launched
Brasil Mais Jovem to facilitate local implementation in states
and municipalities as well as several new youth initiatives,
but much remains to be done.
Higher unemployment rates among youth with lower
education attainment and widespread underqualification,
19 NEETs are a diverse group of young people who are available and looking for work (i.e. unemployed) but also young people who are discouraged having not been able to find jobs in previous searches, who do not believe they will be able to find employment, or who do not know where and how to look for jobs. See ILO. 2017. Global Employment Trends for Youth 2017: Paths to a better working future (Geneva). 20 Status in employment and sectoral data refer to young persons ages 15-29. Analysis based on ILO. 2017. Global Employment Trends for Youth 2017:
Paths to a better working future (Geneva).
particularly in technical occupations (74.8 per cent), suggest
the need for stronger education and training systems,
including technical and vocational education and training
(TVET). The Programa Nacional de Acesso ao Ensino
Técnico e Emprego (PRONATEC) has sought to increase
the offer of training schemes21, but recently released survey
results highlight several barriers to TVET, including financial
concerns, access to schools and difficulties in conciliating
school with work and domestic activities.22
Several public policies have been introduced to promote
youth employment in the private sector. Most recently, in
April 2018, the new Plano Nacional de Aprendizagem
Profissional was approved to strengthen the national
apprenticeship system. Brazil should strive to expand and
widen programme offer, including greater focus on retention
of young people, in context of great youth job turnover, as
well as on disadvantaged youth.
Youth entrepreneurship offers employment opportunities not
only for youth themselves but also for their peers. Here too,
Brazil has started to make progress with the recent launch
of the Plano Nacional de Desenvolvimento de Startups as
well as through new and older programmes such as Inova
Jovem and those offered by the Serviço de Apoio às Micro
e Pequenas Empresas (SEBRAE). Barriers in access to
finance and markets, entrepreneurial and business skills,
and the general business environment persist.23
The policy areas highlighted above are not sufficient to
tackle youth employment challenges in Brazil. As the
economy recovers, pro-employment macroeconomic
policies are critical to ensure economic growth is
accompanied by job creation. In addition, public employment
services and a strong social protection system are key to
smooth youth entry into labour markets and transition
between jobs. Moreover, it is paramount to protect and
promote young workers’ rights and ensure their participation
in social dialogue mechanisms for policy design.
21 International Policy Center for Inclusive Growth. 2014. Youth and employment among the BRICS. Policy in Focus No. 28 (Brasilia, IPC-UNDP). 22 IBGE. 2017. Educação e qualificação professional: 2014 (Rio de Janeiro, IBGE). 23 Brazil ranks 125 out of 190 countries in terms of ease of doing business in the World Bank’s Doing Business Report 2018. See World Bank. 2018. Doing Business 2018: Reforming to Create Jobs (Washington D.C.).
BRICS BRIEF SERIES
7
Introduction
Following the abrupt interruption to economic expansion in
2009 occasioned by the global financial crisis24, Russia
experienced moderate growth until the fall in oil prices in
2014 precipitated recession in 2015. Over the entire period,
2008 – 2017, Russian real GDP increased by only 6.3 per
cent corresponding to annual average real growth of under
0.7 per cent. Again in 2017, there was moderate recovery
with real GDP growth of an estimated 1.5 percent with
positive albeit slightly lower growth expected in 2018 and
201925.
Compared to the BRICS average, the employment-
population ratio is relatively high (65.7 vs. 59.3 per cent), as
is the level of skills in the workforce; in Russia 44 per cent of
workers were at skills level 3 or higher which compares to
16 per cent for BRICS as a whole. Informal work accounts
for 35.9 per cent of employment in the Federation, and is
more common amongst men (39.1 percent) than women
(32.7 percent)26. The gender gap in labour force participation
(and also in the employment population ratio) is relatively
low – 12 percentage points compared to nearly 30
percentage points for the BRICS as a whole. Over 90 per
cent of Russian workers are in wage employment, with a
correspondingly small percentage - 5.8 percent in 2016 - in
vulnerable employment27.
Trends
The youth unemployment rate has fallen from its crisis peak
of 18.5 per cent in 2009, although following the oil price
crisis, it increased from its low of 13.8 per cent in 2014,
remained above 16 per cent since 2015 (figure 1). Although
geographical disparities have lessened in recent years,
regional variations in youth unemployment remain very
24 In 2009, output growth in Russian Federation declined by nearly 8 per cent of GDP, driven by contracting domestic demand. 25 IMF. 2018. World Economic Outlook Update, July 2018. 26 ILO. Forthcoming. Women and men in the informal economy: A statistical picture. Third Edition (Geneva). 27 Vulnerable employment is defined as the sum of own-account workers and
contributing family workers.
pronounced. In Moscow and St. Petersburg, youth (15-29)
unemployment rates in 2017 were 3.3 per cent and 4.4 per
cent respectively which contrasts with a rate of 47.8 per cent
in Ingushetia and 26.0 per cent in the Tyva republic. 28
At the same time, the recent increase in the youth
unemployment rate has not been reflected also in the adult
unemployment rate. Consequently, the ratio of youth to adult
unemployment rates has been consistently increasing in
recent years, rising from under three in 2011 to almost four
by 2017. In part, this reflects the greater sensitivity of youth
unemployment (compared to adult unemployment) to
fluctuations in economic growth29.
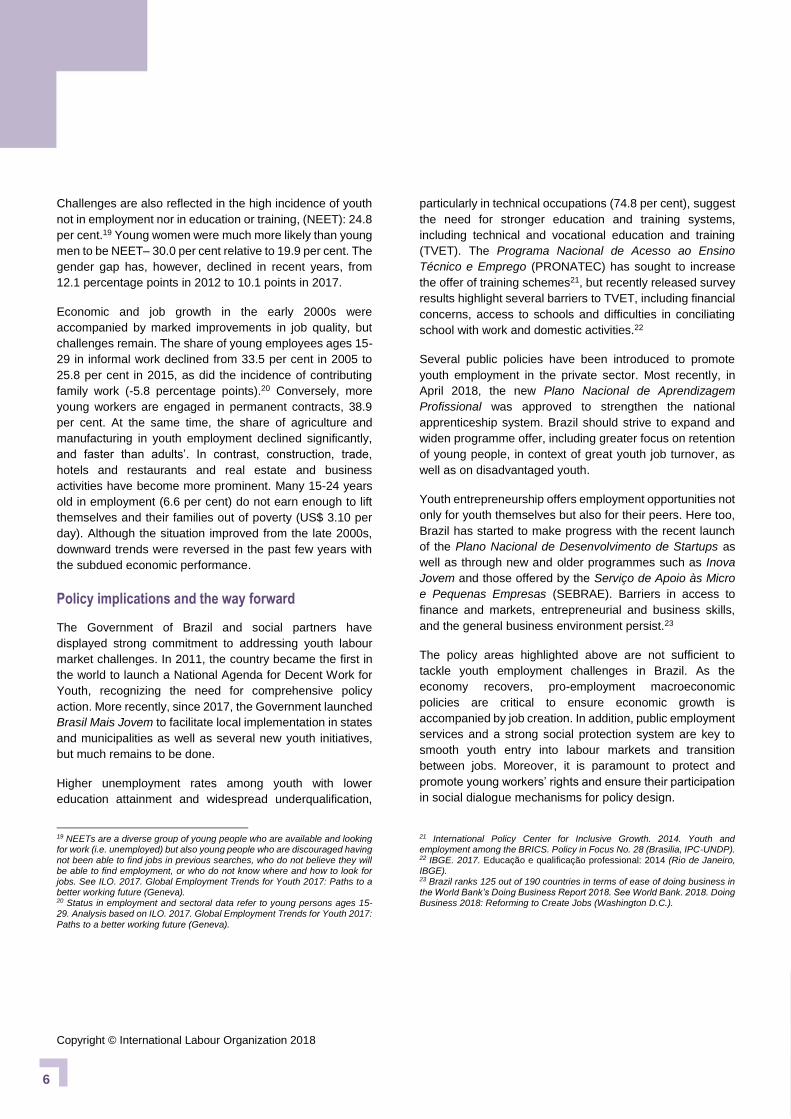
Figure 1: GDP growth, youth and adult unemployment rates, 2010-2017
Source: IMF WEO database (GDP growth rate); ILO estimates
derived from micro-data files (youth and adult unemployment rates).
Unemployment rates are slightly higher for young women
(17.1 per cent) than for young men (15.7 per cent) in 2017.
This is broadly in line with the gender gap in youth
unemployment observable in BRICS as a whole.
28 Calculated from RUSSTAT tabulated data –hence the broader age breakdown. In 2013, the youth unemployment rate was 72.1 per cent in Ingushetia and 34.1 per cent in Tyva. 29 The simple correlation between GDP growth and the youth unemployment rate is -0.64 for the period 2008-17 whilst the corresponding correlation is -0.37 for adults.
-5
0
5
10
0
5
10
15
20
2010 2011 2012 2013 2014 2015 2016 2017
Adult unemployment rate
Youth unemployment rate
Real GDP growth rate (right axis)
RUSSIA: YOUTH EMPLOYMENT
Copyright © International Labour Organization 2018
8
The youth NEET rate is relatively low at 12.4 per cent in
2016, although this too has shown an upward trend since the
2014 oil price crisis; there is also a significant difference
between male and female NEET rates, although the gender
gap of 4.3 percentage points is smaller in the other three
BRICS countries for which data is available30.
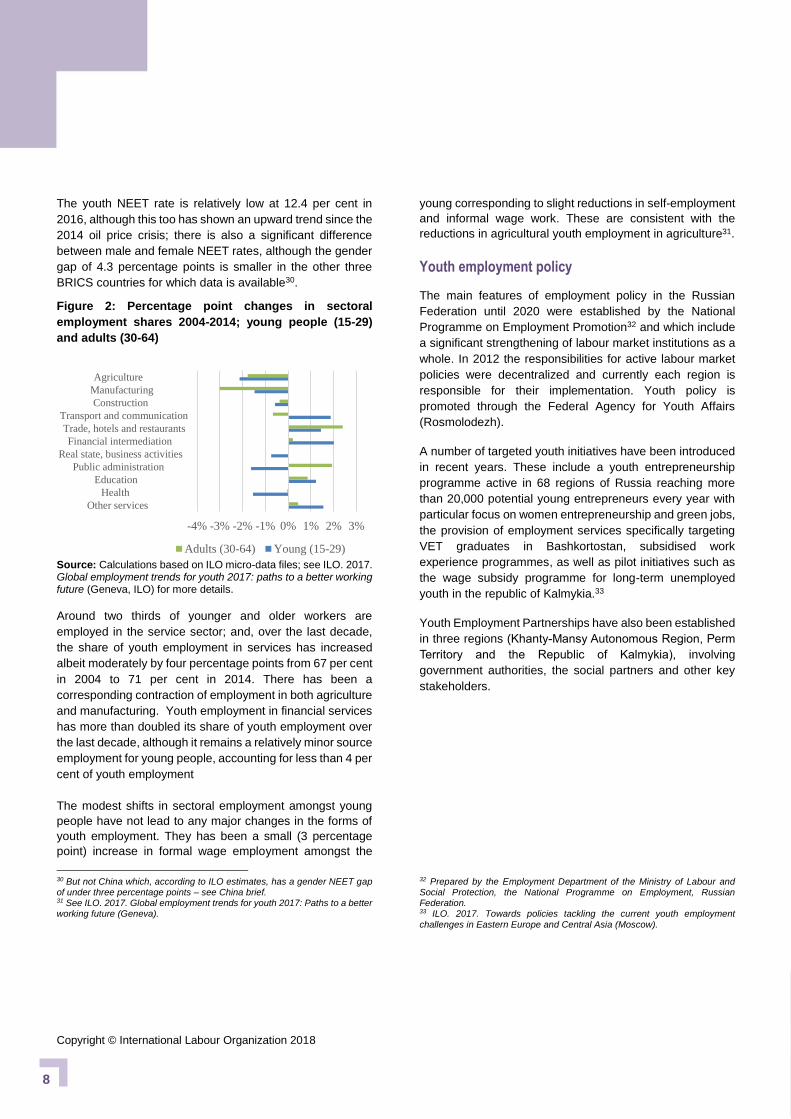
Figure 2: Percentage point changes in sectoral
employment shares 2004-2014; young people (15-29)
and adults (30-64)
Source: Calculations based on ILO micro-data files; see ILO. 2017. Global employment trends for youth 2017: paths to a better working future (Geneva, ILO) for more details.
Around two thirds of younger and older workers are
employed in the service sector; and, over the last decade,
the share of youth employment in services has increased
albeit moderately by four percentage points from 67 per cent
in 2004 to 71 per cent in 2014. There has been a
corresponding contraction of employment in both agriculture
and manufacturing. Youth employment in financial services
has more than doubled its share of youth employment over
the last decade, although it remains a relatively minor source
employment for young people, accounting for less than 4 per
cent of youth employment
The modest shifts in sectoral employment amongst young
people have not lead to any major changes in the forms of
youth employment. They has been a small (3 percentage
point) increase in formal wage employment amongst the
30 But not China which, according to ILO estimates, has a gender NEET gap of under three percentage points – see China brief. 31 See ILO. 2017. Global employment trends for youth 2017: Paths to a better working future (Geneva).
young corresponding to slight reductions in self-employment
and informal wage work. These are consistent with the
reductions in agricultural youth employment in agriculture31.
Youth employment policy
The main features of employment policy in the Russian
Federation until 2020 were established by the National
Programme on Employment Promotion32 and which include
a significant strengthening of labour market institutions as a
whole. In 2012 the responsibilities for active labour market
policies were decentralized and currently each region is
responsible for their implementation. Youth policy is
promoted through the Federal Agency for Youth Affairs
(Rosmolodezh).
A number of targeted youth initiatives have been introduced
in recent years. These include a youth entrepreneurship
programme active in 68 regions of Russia reaching more
than 20,000 potential young entrepreneurs every year with
particular focus on women entrepreneurship and green jobs,
the provision of employment services specifically targeting
VET graduates in Bashkortostan, subsidised work
experience programmes, as well as pilot initiatives such as
the wage subsidy programme for long-term unemployed
youth in the republic of Kalmykia.33
Youth Employment Partnerships have also been established
in three regions (Khanty-Mansy Autonomous Region, Perm
Territory and the Republic of Kalmykia), involving
government authorities, the social partners and other key
stakeholders.
32 Prepared by the Employment Department of the Ministry of Labour and Social Protection, the National Programme on Employment, Russian Federation. 33 ILO. 2017. Towards policies tackling the current youth employment
challenges in Eastern Europe and Central Asia (Moscow).
-4% -3% -2% -1% 0% 1% 2% 3%
Other services
Health
Education
Public administration
Real state, business activities
Financial intermediation
Trade, hotels and restaurants
Transport and communication
Construction
Manufacturing
Agriculture
Adults (30-64) Young (15-29)
BRICS BRIEF SERIES
9
Introduction
India has experienced robust economic growth in recent
years, averaging 7.3 per cent between 2010 and 2017.
While de-monetization and the introduction of the goods and
services tax (GST) is expected to have slowed growth to 6.7
per cent in 2017, the economy is projected to rebound and
increase by 7.3 per cent in 2018.34 Improvements in the
labour market however have not been commensurate with
the economic growth performance. The latest National
Sample Survey (NSS) undertaken in India in 2011-12
indicates that while the unemployment rate is relatively low
at 2.7 per cent, the challenge of poor job quality continues to
be acute. Vulnerable employment is estimated to account for
79.2 per cent of total employment. The share of informal
employment in total employment was 81.9 per cent, while
the share of informal employment in non-agricultural
employment was 66.1 per cent in 2012. Gender disparities
are prominent across all dimensions of the labour market –
for example, the labour force participation rate of women, at
23.4 per cent in 2012, is 55.7 percentage points lower than
that of men, which is more than double the global average
gender gap of 26 percentage points.35 ILO calculations
indicate that reducing the gender gap in labour force
participation in India by 25 per cent would raise India’s GDP
in 2025 by 9 per cent.36 Improving the quality of jobs and
addressing gender disparities are key challenges facing both
adult and young Indian women and men.
Trends
Young women in India are far less likely than young men to
participate in the labour market. The labour force
participation for young women aged 15-24 at 14.7 per cent
in 2012 was 33.9 percentage points lower than for young
men. In addition to barriers to the labour market, young
women face significant barriers to education compared to
their male counterparts. Almost one in two young women
(49.3 per cent) in India are not in education, employment or
training (NEET), compared to less than one in ten young
34 IMF. 2018. World Economic Outlook Update, July 2018 (Washington, DC). 35 For a detailed analysis of declining female labour force participation in India, see Bourmopoula, E.; Kapsos, S.; Silberman, A. 2016. "Decline of women's labour force participation in India: Explaining the puzzling trend", in S.
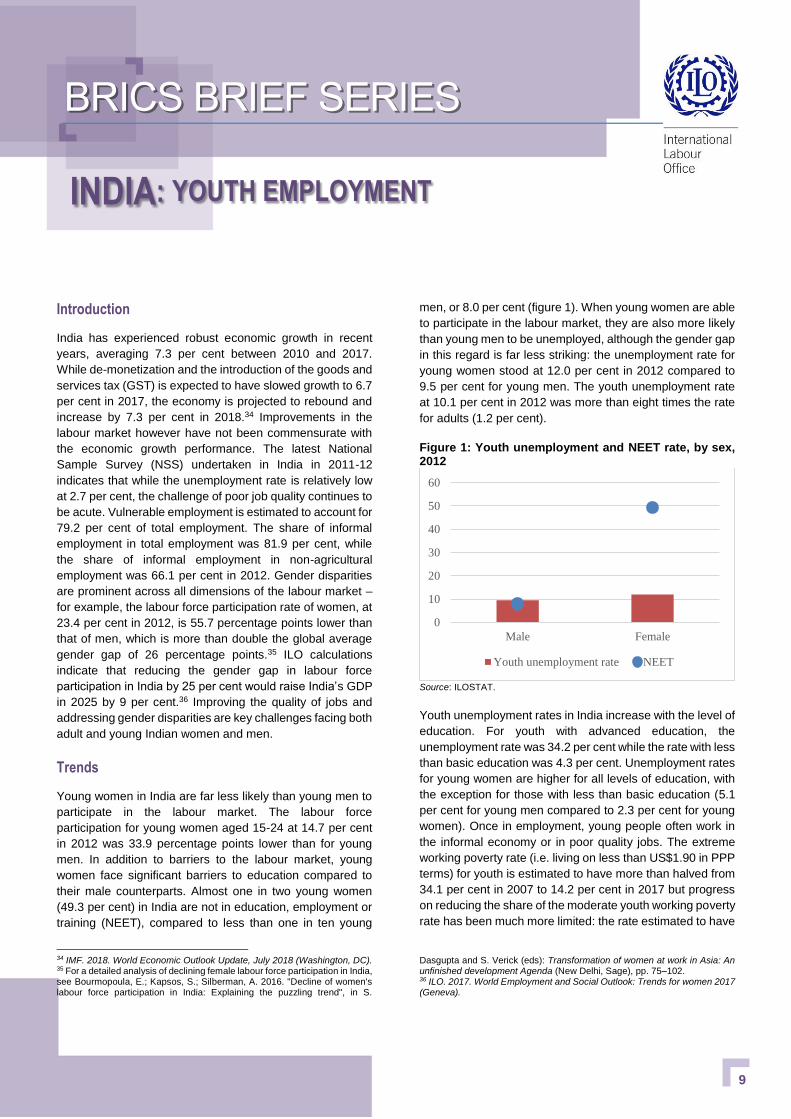
men, or 8.0 per cent (figure 1). When young women are able
to participate in the labour market, they are also more likely
than young men to be unemployed, although the gender gap
in this regard is far less striking: the unemployment rate for
young women stood at 12.0 per cent in 2012 compared to
9.5 per cent for young men. The youth unemployment rate
at 10.1 per cent in 2012 was more than eight times the rate
for adults (1.2 per cent).
Figure 1: Youth unemployment and NEET rate, by sex, 2012
Source: ILOSTAT.
Youth unemployment rates in India increase with the level of
education. For youth with advanced education, the
unemployment rate was 34.2 per cent while the rate with less
than basic education was 4.3 per cent. Unemployment rates
for young women are higher for all levels of education, with
the exception for those with less than basic education (5.1
per cent for young men compared to 2.3 per cent for young
women). Once in employment, young people often work in
the informal economy or in poor quality jobs. The extreme
working poverty rate (i.e. living on less than US$1.90 in PPP
terms) for youth is estimated to have more than halved from
34.1 per cent in 2007 to 14.2 per cent in 2017 but progress
on reducing the share of the moderate youth working poverty
rate has been much more limited: the rate estimated to have
Dasgupta and S. Verick (eds): Transformation of women at work in Asia: An unfinished development Agenda (New Delhi, Sage), pp. 75–102. 36 ILO. 2017. World Employment and Social Outlook: Trends for women 2017 (Geneva).
0
10
20
30
40
50
60
Male Female
Youth unemployment rate NEET
INDIA: YOUTH EMPLOYMENT
Copyright © International Labour Organization 2018
10
fallen from 39.5 per cent in 2007 to 36.4 per cent in 2017.
Increasingly, young workers in India are found in non-
standard employment, such as short-term and task-based
contract work or employment without written contracts.37
Figure 2: Changes in share of youth employment by sector, between 2005 and 2012 (percentage points)
Note: Youth defined as aged 15-29. Source: ILO calculations based on labour force survey microdata.
Most young Indians continue to be employed in agriculture,
although the share of young people aged 15-29 in
agriculture decreased from 52.5 per cent in 2005 to 42.0 per
cent in 2012, a decrease -10.5 percentage points (figure 2).
The share of employed youth in construction increased by
5.5 percentage points during the same period, while that of
manufacturing increased by 2.0 percentage points.
Policy implications and the way forward
India has undertaken a number of initiatives to address the
challenges of youth employment. In 2015, the Ministry of
Skill Development and Entrepreneurship was created to
focus on enhancing the employability of young persons
through skills development. The Ministry’s flagship
programme, the Pradhan Mantri Kaushal Vikas Yojana
(PMKVY) seeks to target another 10 million youth between
2016-2020 with government-sponsored industry-relevant
training and skills certification. 38 The Recognition of Prior
Learning (RPL) component of the programme in particular
37 ILO. 2017. Global Employment Trends for Youth 2017: Paths to a better
working future (Geneva). 38 India Ministry of Skill Development and Entrepreneurship. Available at: http://www.skilldevelopment.gov.in/pmkvy.html [April 3, 2018]. 39 Bárcia de Mattos, F.; Dasgupta, S. 2017. MGNREGA, paid work and women’s empowerment. Employment Policy Department Working Paper No. 230 (Geneva, ILO).
seeks to align the competencies of informal workers to the
National Standard Qualifications Framework.
India’s Mahatma Gandhi National Rural Employment
Guarantee Act (MGNREGA), which provides 100 days of
work in public works per household at minimum wages, has
served as an inspiration for many countries. A recent ILO
analysis finds that the Act, whose elements include work
close to home and child care facilities at the work site, has
been instrumental in ensuring paid employment for women,
and that paid employment and MGNREGA had a positive
and significant effect on women’s control of household
decisions.39 Furthermore, the study finds when a woman
working in MGNREGA has control over household
decisions, the likelihood of the oldest girl spending more
hours in school is greater. Continued efforts to transform
social norms and gender role conformity, including through
appropriate policies and public awareness initiatives, can
play an important role in addressing the gender gap in
education and youth employment.
With a large share of workers employed in agriculture, where
levels of labour productivity are lowest among sectors, and
large differentials in productivity among sectors (for
example, levels of output per worker in manufacturing were
5.2 times the levels in agriculture), there is considerable
scope to boost aggregate labour productivity through
sectoral policies that facilitate structural transformation.40 In
this regard, the government’s “Make in India” initiative seeks
increase manufacturing employment and continued efforts,
including through appropriate education and skills
development policies, will be required to boost job
opportunities in higher productivity services sectors.
A national employment policy has been under consideration
in India for some time. An integrated employment policy
framework, formulated on the basis of social dialogue and
tripartite consultation, and which addresses both labour
demand and supply, mainstreams gender and youth, and
addresses both the quality and quantity of employment, can
play an important role in supporting policy coordination and
coherence between states and line ministries in their efforts
to address the employment challenges in India.
40 ILO calculations of labour productivity based on Timmer, M.P.; de Vries, G.
J.; de Vries, K. 2015. “Patterns of Structural Change in Developing Countries”, in J. Weiss and M. Tribe (Eds.), Routledge Handbook of Industry and Development (Routledge), pp. 65-83.
-15.0% -10.0% -5.0% 0.0% 5.0% 10.0%
Other services
Health
Education
Public administration
Real state, business…
Financial intermediation
Trade, hotels and…
Transport and…
Construction
Manufacturing
Agriculture
BRICS BRIEF SERIES
11
Introduction
Although economic growth in China remains extremely high
by international standards, averaging 7.9 per cent over the
period 2010-17, there has been a marked slowdown in
growth since 2012. Average growth in 2010 and 2011 was
10.1 per cent per annum, between 2012 and 2017 it
averaged 7.2 per cent p.a., and since 2015 it remained
under 7 per cent and is expected to continue to do so in 2018
and 201941.
The last decade or so has seen a fairly massive shift from
agriculture (primarily) to services; agriculture’s share in
employment fell from 42.6 per cent in 2006 to 28.3 per cent
in 2015. There was a corresponding increase in the service
share of employment from 32.2 per cent (in 2006) to 42.4
per cent (in 2015) whilst over the same period,
manufacturing also increased its employment share but by a
much more modest 4 percentage points from 25.2 per cent
to 29.3 per cent.
Informal employment is extensive, particularly in rural areas.
54.4 per cent of all workers are in informal employment in
China as a whole, and in rural areas, the figure reaches 82.0
per cent42.
Trends
Strong albeit decelerating economic growth has meant
rapidly falling extreme and moderate poverty rates amongst
young workers in China. Between 2007 and 2017, ILO
estimates suggest that extreme and moderate poverty of
young workers was cut by two-thirds from 39.7 per cent to
11.4 per cent. The reduction in extreme poverty was even
more pronounced falling by over three-quarters from 18.7
per cent to 4.0 per cent.
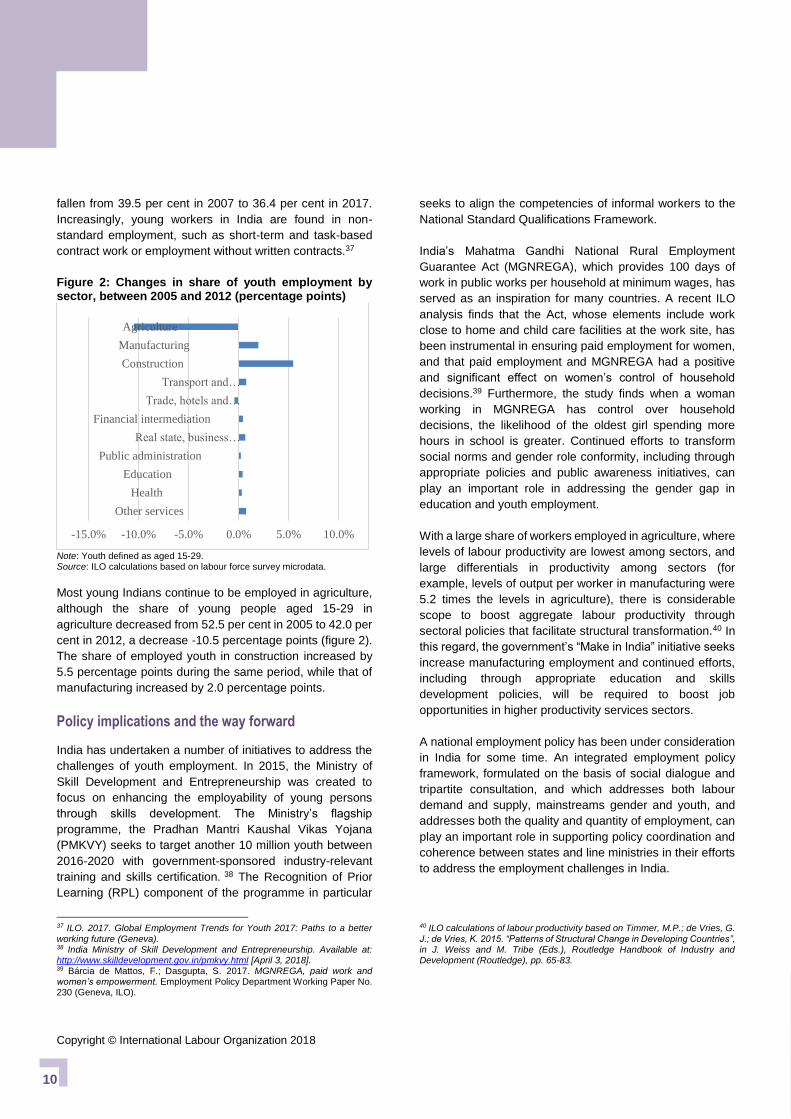
The strong performance on poverty has not been matched
in the quantity of employment available to young people. ILO
estimates (figure 1) suggest that youth unemployment rates
increased slightly over the last decade or so from 9 per cent
in 2005 to 10.8 per cent in 2017. Unemployment is a little
41 Economic growth data from IMF. 2018. World Economic Outlook Update, July 2018 (Washington D.C.). 42 ILO. Forthcoming. Women and men in the informal economy: A statistical picture. Third Edition (Geneva). Data on informal employment is derived from the China Household Income Project (CHIP) micro-data for 2013.
higher amongst young men (11.8 per cent) than young
women (9.6 per cent) in 2017. The increase in youth
unemployment has, however, been less than proportionate
to the increase in adult rates. Consequently, the ratio of
youth to adult unemployment rates is estimated to have
improved from 2.9 in 2005 to 2.7 in 2017. Still, given the
rapid reduction in working poverty it is evident that economic
growth has translated mainly into better pay rather than
more work.
Figure 1: GDP growth, youth (15-24) and adult (25-64) unemployment rates
Source: IMF WEO database (GDP growth rate); ILO modelled
estimates, May 2018 (youth and adult unemployment rates).
The youth NEET rate – the proportion of 15 – 24 year olds
who are neither in employment nor in education or training -
is not as high in China as in many developing and emerging
countries; it also fell from 12.7 per cent to 11.8 between 2002
and 2013. This reduction was, however, almost entirely
accounted for by a fall in the NEET rate of young men.
Consequently, a NEET gender gap of almost 3 percentage
points has opened up, although the gender difference in
NEET rates is much less than is observable in other BRICS
countries.43
The reduction in the agricultural share of youth employment
is even more marked than for adults (30-64); young people’s
involvement in agriculture has fallen from over 40 per cent
43 Calculations based on China Household income Project (CHIP) micro-data files from 2002 and 2013.
0
5
10
15
0
5
10
15
2010 2011 2012 2013 2014 2015 2016 2017
Adult unemployment rate
Youth unemployment rate
Real GDP growth rate (right axis)
CHINA: YOUTH EMPLOYMENT
Copyright © International Labour Organization 2018
12
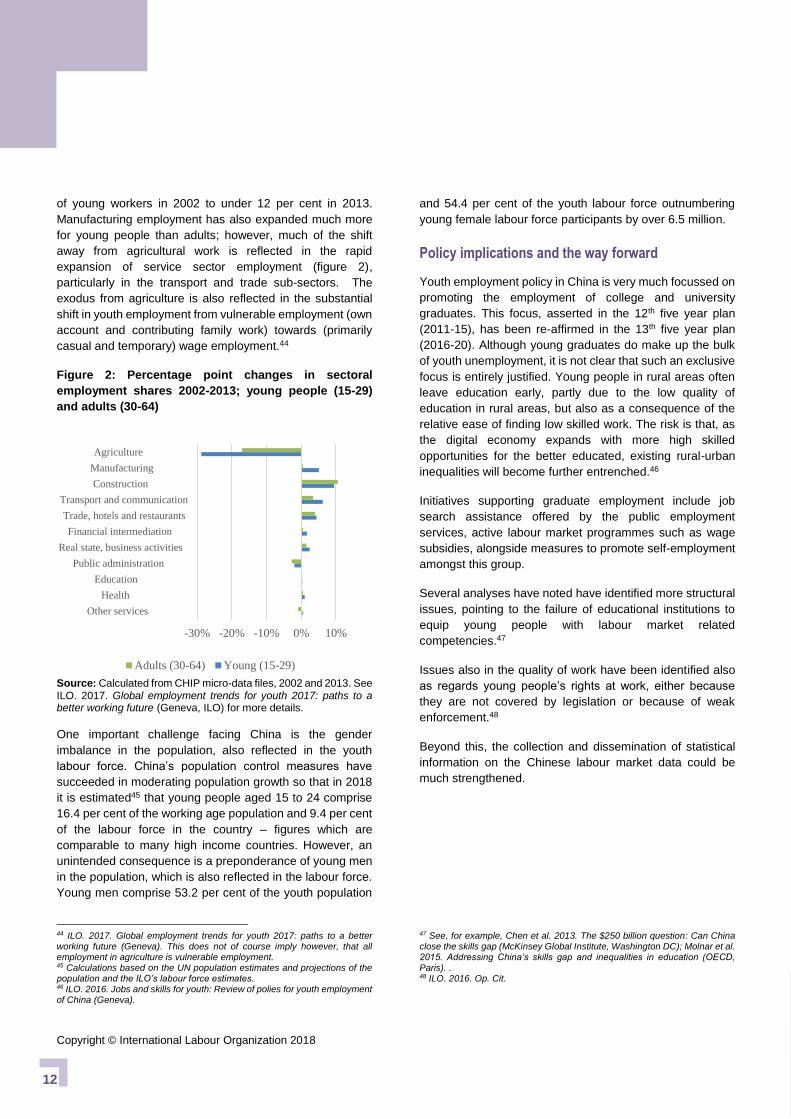
of young workers in 2002 to under 12 per cent in 2013.
Manufacturing employment has also expanded much more
for young people than adults; however, much of the shift
away from agricultural work is reflected in the rapid
expansion of service sector employment (figure 2),
particularly in the transport and trade sub-sectors. The
exodus from agriculture is also reflected in the substantial
shift in youth employment from vulnerable employment (own
account and contributing family work) towards (primarily
casual and temporary) wage employment.44
Figure 2: Percentage point changes in sectoral
employment shares 2002-2013; young people (15-29)
and adults (30-64)
Source: Calculated from CHIP micro-data files, 2002 and 2013. See ILO. 2017. Global employment trends for youth 2017: paths to a better working future (Geneva, ILO) for more details.
One important challenge facing China is the gender
imbalance in the population, also reflected in the youth
labour force. China’s population control measures have
succeeded in moderating population growth so that in 2018
it is estimated45 that young people aged 15 to 24 comprise
16.4 per cent of the working age population and 9.4 per cent
of the labour force in the country – figures which are
comparable to many high income countries. However, an
unintended consequence is a preponderance of young men
in the population, which is also reflected in the labour force.
Young men comprise 53.2 per cent of the youth population
44 ILO. 2017. Global employment trends for youth 2017: paths to a better working future (Geneva). This does not of course imply however, that all employment in agriculture is vulnerable employment. 45 Calculations based on the UN population estimates and projections of the population and the ILO’s labour force estimates. 46 ILO. 2016. Jobs and skills for youth: Review of polies for youth employment of China (Geneva).
and 54.4 per cent of the youth labour force outnumbering
young female labour force participants by over 6.5 million.
Policy implications and the way forward
Youth employment policy in China is very much focussed on
promoting the employment of college and university
graduates. This focus, asserted in the 12th five year plan
(2011-15), has been re-affirmed in the 13th five year plan
(2016-20). Although young graduates do make up the bulk
of youth unemployment, it is not clear that such an exclusive
focus is entirely justified. Young people in rural areas often
leave education early, partly due to the low quality of
education in rural areas, but also as a consequence of the
relative ease of finding low skilled work. The risk is that, as
the digital economy expands with more high skilled
opportunities for the better educated, existing rural-urban
inequalities will become further entrenched.46
Initiatives supporting graduate employment include job
search assistance offered by the public employment
services, active labour market programmes such as wage
subsidies, alongside measures to promote self-employment
amongst this group.
Several analyses have noted have identified more structural
issues, pointing to the failure of educational institutions to
equip young people with labour market related
competencies.47
Issues also in the quality of work have been identified also
as regards young people’s rights at work, either because
they are not covered by legislation or because of weak
enforcement.48
Beyond this, the collection and dissemination of statistical
information on the Chinese labour market data could be
much strengthened.
47 See, for example, Chen et al. 2013. The $250 billion question: Can China close the skills gap (McKinsey Global Institute, Washington DC); Molnar et al. 2015. Addressing China’s skills gap and inequalities in education (OECD, Paris). . 48 ILO. 2016. Op. Cit.
-30% -20% -10% 0% 10%
Other services
Health
Education
Public administration
Real state, business activities
Financial intermediation
Trade, hotels and restaurants
Transport and communication
Construction
Manufacturing
Agriculture
Adults (30-64) Young (15-29)
BRICS BRIEF SERIES
13
Introduction
Following four consecutive years of declining real annual
economic growth rates, South Africa’s economic growth rate
is estimated to have picked up in 2017, expanding by 1.3 per
cent (figure 1). In particular, investment has been lacklustre
in recent years, with gross fixed capital formation declining
by 4.1 per cent in 2016 before increasing by 0.4 per cent in
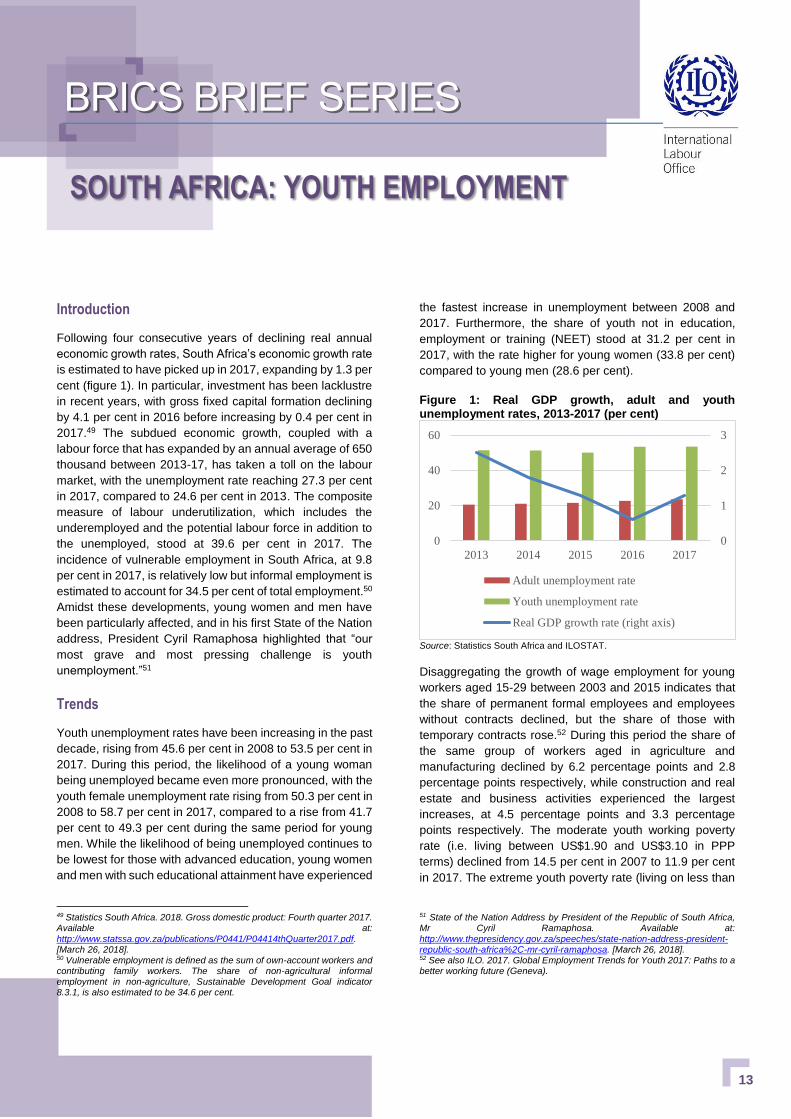
2017.49 The subdued economic growth, coupled with a
labour force that has expanded by an annual average of 650
thousand between 2013-17, has taken a toll on the labour
market, with the unemployment rate reaching 27.3 per cent
in 2017, compared to 24.6 per cent in 2013. The composite
measure of labour underutilization, which includes the
underemployed and the potential labour force in addition to
the unemployed, stood at 39.6 per cent in 2017. The
incidence of vulnerable employment in South Africa, at 9.8
per cent in 2017, is relatively low but informal employment is
estimated to account for 34.5 per cent of total employment.50
Amidst these developments, young women and men have
been particularly affected, and in his first State of the Nation
address, President Cyril Ramaphosa highlighted that “our
most grave and most pressing challenge is youth
unemployment.”51
Trends
Youth unemployment rates have been increasing in the past
decade, rising from 45.6 per cent in 2008 to 53.5 per cent in
2017. During this period, the likelihood of a young woman
being unemployed became even more pronounced, with the
youth female unemployment rate rising from 50.3 per cent in
2008 to 58.7 per cent in 2017, compared to a rise from 41.7
per cent to 49.3 per cent during the same period for young
men. While the likelihood of being unemployed continues to
be lowest for those with advanced education, young women
and men with such educational attainment have experienced
49 Statistics South Africa. 2018. Gross domestic product: Fourth quarter 2017. Available at:
http://www.statssa.gov.za/publications/P0441/P04414thQuarter2017.pdf. [March 26, 2018]. 50 Vulnerable employment is defined as the sum of own-account workers and contributing family workers. The share of non-agricultural informal employment in non-agriculture, Sustainable Development Goal indicator 8.3.1, is also estimated to be 34.6 per cent.
the fastest increase in unemployment between 2008 and
2017. Furthermore, the share of youth not in education,
employment or training (NEET) stood at 31.2 per cent in
2017, with the rate higher for young women (33.8 per cent)
compared to young men (28.6 per cent).
Figure 1: Real GDP growth, adult and youth unemployment rates, 2013-2017 (per cent)
Source: Statistics South Africa and ILOSTAT.
Disaggregating the growth of wage employment for young
workers aged 15-29 between 2003 and 2015 indicates that
the share of permanent formal employees and employees
without contracts declined, but the share of those with
temporary contracts rose.52 During this period the share of
the same group of workers aged in agriculture and
manufacturing declined by 6.2 percentage points and 2.8
percentage points respectively, while construction and real
estate and business activities experienced the largest
increases, at 4.5 percentage points and 3.3 percentage
points respectively. The moderate youth working poverty
rate (i.e. living between US$1.90 and US$3.10 in PPP
terms) declined from 14.5 per cent in 2007 to 11.9 per cent
in 2017. The extreme youth poverty rate (living on less than
51 State of the Nation Address by President of the Republic of South Africa, Mr Cyril Ramaphosa. Available at:
http://www.thepresidency.gov.za/speeches/state-nation-address-president-republic-south-africa%2C-mr-cyril-ramaphosa. [March 26, 2018]. 52 See also ILO. 2017. Global Employment Trends for Youth 2017: Paths to a better working future (Geneva).
0
1
2
3
0
20
40
60
2013 2014 2015 2016 2017
Adult unemployment rate
Youth unemployment rate
Real GDP growth rate (right axis)
SOUTH AFRICA: YOUTH EMPLOYMENT
Copyright © International Labour Organization 2018
14
US$1.90 per day) also declined from 11.3 per cent in 2007
to 6.5 per cent in 2015, but has risen since then to stand at
7.1 per cent in 2017.
Policy implications and the way forward
The government of South Africa, in partnership with
employers’ and workers’ organizations, has undertaken and
is continuing to undertake interventions to respond to the
youth unemployment challenge. Some key initiatives have
included the National Youth Policy 2015-2020 and the
Expanded Public Works Programme (EPWP), including the
Community Work Programme. Launched in 2014, the
Employment Tax Incentive (ETI) provides tax credits to
enterprises hiring young persons aged 18-29. Initial
assessments of the ETI following six months and one year
of implementation have pointed to limited changes in the
probabilities of youth employment.53 Another assessment
following 14 months of implementation finds that the
employment of young people (and non-youth) has increased
in enterprises with less than 200 employees but that the
increase could be a result of the policy or a general
expansion of employment within such enterprises.54 The
assessment also notes that the gains have potentially come
with high deadweight losses, that is, the young person could
have been hired even in the absence of the tax credit.
Workers organisations have also criticised the ETI, partly
based on concerns over its potential to displace existing or
older workers. Continued careful monitoring and impact
assessment, and policy adjustments based on the findings,
will be required.
In March 2018, in collaboration with organised business and
labour, the government launched the Youth Employment
Service (YES) aimed at providing one million young South
Africans with paid one-year internships to acquire a first work
place experience and with tools and resources to become
entrepreneurs. Other initiatives planned as outlined in
President Ramaphosa’s State of the Nation address include
efforts towards re-industrialization to spur job and export
growth, local procurement efforts, a Jobs Summit, an
Investment Conference amongst other policy initiatives.
53 Ranchhod, V.; Finn, A. 2014. Estimating the Short Run Effects of South
Africa’s Employment Tax Incentive on Youth Employment Probabilities Using a Difference-in-differences Approach. Southern Africa Labour and Development Research Unit Working Paper 134 (Cape Town, University of Cape Town); Ranchhod, V.; Finn A. 2015. Estimating the Effects of South Africa’s Youth Employment Tax Incentive – An Update Southern Africa Labour and Development Research Unit Working Paper 152 (Cape Town, University of Cape Town).
South Africa is also involved in a number of regional
integration initiatives, including efforts under the Southern
African Development Community (SADC), the Tripartite
Free Trade Agreement, which brings together SADC, the
Common Market for Eastern and Southern Africa
(COMESA), and the East African Community, and is
anticipated to sign the recently established African
Continental Free Trade Agreement (AfCFTA). Equipping
South African youth with relevant skills and formal
qualifications is a critical challenge, and strengthening these
efforts will also be instrumental in realizing the potential
benefits of integration and the associated structural
transformation.
With global economic growth picking up, and with South
Africa’s economy also projected to increase in 2018, a pro-
employment framework for macroeconomic and sectoral
policies may be an essential tool in order to translate positive
economic developments into enhanced labour market
outcomes and absorption for youth. Such a framework could
entail analysing and evaluating the direct and indirect
employment impacts of all major public policies and projects
with a view to identifying means of improving the specific
policy to enhance its productive employment impact, as is
being undertaken in the Republic of Korea. Through targeted
public policy interventions, it would also seek to stimulate
existing and new sectors that have the highest potential for
employment creation. It may also entail a reconsideration of
the mandate of monetary policy. It is worthwhile recalling
that the full employment mandate of the United States
Federal Reserve originated from efforts by racial justice
activists to attain full employment as the means of achieving
a more fair and just economy.55 More recently in 2018, the
mandate of the Reserve Bank of New Zealand was also
modified to include “maximum sustainable employment” in
addition to price stability.56 Finally, such a framework would
also contribute to coordinating and harmonising the large
number of existing policy and programme initiatives under
one unifying umbrella that may improve their impact,
efficiency, as well as a results-based management and
budget allocation.
54 Ebrahim, A.; Leibbrandt, M.; Ranchold V. 2017. The effects of the Employment Tax Incentive on South African employment. WIDER Working Paper 2017/5 (Helsinki, UNU-WIDER). 55 Baker, D.; Rawlins, S. 2017. The full employment mandate of the Federal
Reserve: Its origins and importance. Available at: http://cepr.net/images/stories/reports/full-employment-mandate-2017-07.pdf 56 See Reserve Bank of New Zealand: New PTA requires Reserve Bank to consider employment alongside price stability mandate. Available at: https://www.rbnz.govt.nz/news/2018/03/new-pta-requires-reserve-bank-to-consider-employment-alongside-price-stability-mandate [March 27, 2018].

Contact:
Employment Policy Department
Youth Employment Programme
International Labour Office
4, route des Morillons
CH-1211 Geneva 22, Switzerland
www.ilo.org/youth