Embed Size (px)
DESCRIPTION
Brian Wallace Group Finance Director. Hilton Group plc - Summary of Performance. Year to 31st December 2000 £m. Proforma year to 31st December 1999* £m. Hilton International Betting & Gaming Central costs and income Operating profit Goodwill amortisation Interest - PowerPoint PPT Presentation
Citation preview

Brian WallaceBrian WallaceGroup Finance DirectorGroup Finance Director
Brian WallaceBrian WallaceGroup Finance DirectorGroup Finance Director

Hilton Group plc Hilton Group plc - - Summary of Summary of PerformancePerformance
Hilton International
Betting & Gaming
Central costs and income
Operating profit
Goodwill amortisation
Interest
Profit before tax
Tax
Profit after tax
Hilton International
Betting & Gaming
Central costs and income
Operating profit
Goodwill amortisation
Interest
Profit before tax
Tax
Profit after tax
Year to31st December 2000
£m
Year to31st December 2000
£m
Proforma year to31st December 1999*
£m
Proforma year to31st December 1999*
£m
EBITDA before exceptional items 478.4 456.8Profit before tax, goodwill,FRS15 & exceptional items 301.2 305.0
EBITDA before exceptional items 478.4 456.8Profit before tax, goodwill,FRS15 & exceptional items 301.2 305.0
268.0
114.9
(11.6)371.3
(36.9)
(94.6)239.8
(57.2)182.6
268.0
114.9
(11.6)371.3
(36.9)
(94.6)239.8
(57.2)182.6
242.5139.2(21.4)
360.3(28.1)(76.8)255.4 (64.1)191.3
242.5139.2(21.4)
360.3(28.1)(76.8)255.4 (64.1)191.3
* 1999 results have been adjusted to show the effect of FRS15 depreciation as if it had been charged * 1999 results have been adjusted to show the effect of FRS15 depreciation as if it had been charged in 1999.in 1999.

Hilton Group plc - Hilton Group plc - Exceptional ItemsExceptional Items
£m£m
Profit on sale of UK Casinos
Loss on termination of Egyptian Casinos
Loss on sale of non-European betting and gaming businesses
Impairment of Belgium fixed assets
Profit on sale of UK Casinos
Loss on termination of Egyptian Casinos
Loss on sale of non-European betting and gaming businesses
Impairment of Belgium fixed assets
6.9
(10.4)
(14.3)
(25.6)
(43.4)
6.9
(10.4)
(14.3)
(25.6)
(43.4)
£m£m
52.7
(10.4)
(14.3)
(25.6)
2.4
52.7
(10.4)
(14.3)
(25.6)
2.4
P&L effectP&L effect
Net asset effect
Net asset effect
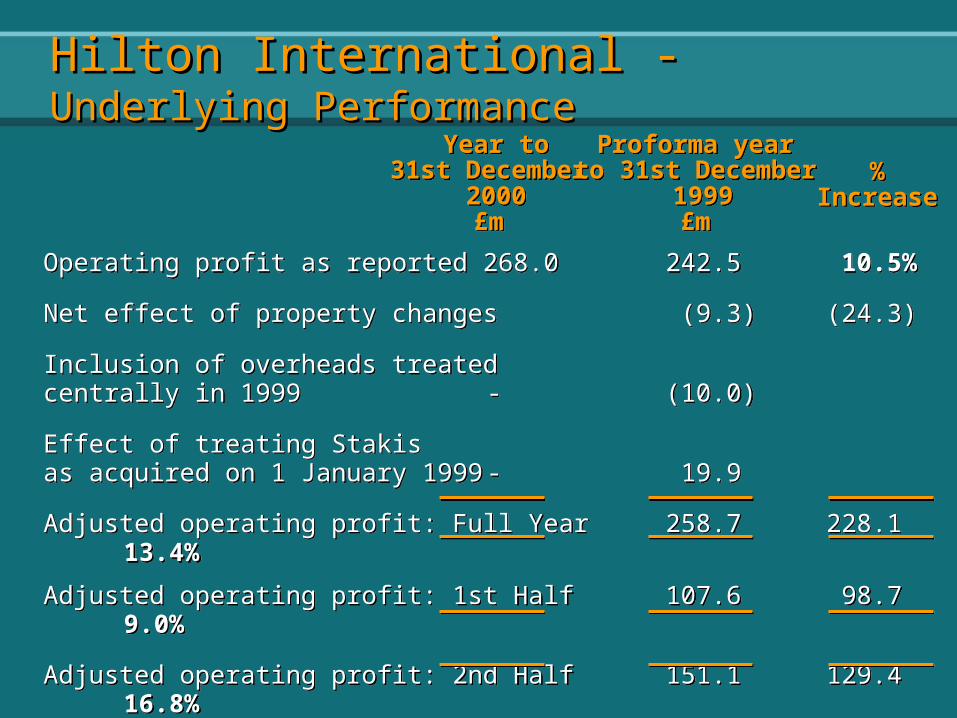
Operating profit as reported 268.0 242.5 10.5%
Net effect of property changes (9.3) (24.3)
Inclusion of overheads treated centrally in 1999 - (10.0)
Effect of treating Stakis as acquired on 1 January 1999 - 19.9
Adjusted operating profit: Full Year258.7 228.1 13.4%
Operating profit as reported 268.0 242.5 10.5%
Net effect of property changes (9.3) (24.3)
Inclusion of overheads treated centrally in 1999 - (10.0)
Effect of treating Stakis as acquired on 1 January 1999 - 19.9
Adjusted operating profit: Full Year258.7 228.1 13.4%
%Increase
%Increase
Year to31st December
2000£m
Year to31st December
2000£m
Proforma year to 31st December
1999£m
Proforma year to 31st December
1999£m
Adjusted operating profit: 1st Half107.6 98.7 9.0%
Adjusted operating profit: 2nd Half151.1 129.4 16.8%
Adjusted operating profit: 1st Half107.6 98.7 9.0%
Adjusted operating profit: 2nd Half151.1 129.4 16.8%
Hilton International - Hilton International - Underlying Underlying PerformancePerformance

UK 606.4 156.3 516.2 148.8 10.5%
Europe 553.7 68.3 485.8 48.311.4%
Middle Eastand Africa 216.6 14.3 192.8 14.0 2.2%
Asia / Australasia518.6 13.6 485.9 11.6 5.9%
Americas 247.3 25.4 193.7 34.1 6.3%
LivingWell 40.9 4.5 27.4 2.9 -
2,183.5 282.4 1,901.8 259.7 7.9%Central & non-operating Items (14.4) (17.2)
268.0 242.5 10.5%
Turnover Profit Turnover Profit * Revpar£m £m £m £m Growth
Turnover Profit Turnover Profit * Revpar£m £m £m £m Growth
* At constant currencies and including full 12 months of Stakis results.
20002000 1999 Proforma
1999 Proforma
Hilton InternationalHilton International

Hilton UK Revpar vs The London Hilton UK Revpar vs The London MarketMarket
-5%
0%
5%
10%
15%
20%
25%
Jan Feb Mar AprMay Jun Jul AugSep Oct NovDec
MarketMarketHiltonHilton
Source: AA & PKFSource: AA & PKF
2000 Revpar growth2000 Revpar growth

Hilton UK Revpar vs The Provincial Hilton UK Revpar vs The Provincial MarketMarket
-2%0%2%4%6%8%
10%12%14%16%18%
Jan FebMarAprMayJun Jul AugSepOctNovDec
MarketMarketHiltonHilton
Source: AA, PKF & TRISource: AA, PKF & TRI
2000 Revpar growth2000 Revpar growth

Hilton UK Year on Year MovementHilton UK Year on Year Movement
Year on Year Year on Year IncreaseIncrease
Comparable salesComparable sales
Comparable gross Comparable gross profitprofit
Comparable PBITComparable PBIT
11stst Half Half£m£m
9.49.4
5.55.5
(5.2)(5.2)
22ndnd Half Half£m£m
29.829.8
18.218.2
11.611.6

8.0%8.0%
3.0%3.0%
11.2%11.2%
22.8%22.8%
17.7%17.7%
11.9%11.9%
39.3%39.3%35.1%35.1%
Top Ten UK and International Hotel Top Ten UK and International Hotel GrowthsGrowths
First HalfFirst Half Second HalfSecond Half
0.00.0
5.05.0
10.010.0
15.015.0
20.020.0
25.025.0
Revpar Revpar GwthGwth
PBIT GwthPBIT Gwth
% Growth% Growth
Top 10 UK HotelsTop 10 UK Hotels Top 10 International Top 10 International HotelsHotels
Revpar Revpar GwthGwth
PBIT GwthPBIT Gwth
% Growth% Growth
0.00.05.05.0
10.010.015.015.020.020.025.025.030.030.035.035.040.040.045.045.0
31.031.0
47.047.0
37.537.5
47.47.88
39.239.2
33.33.55
37.37.99
46.46.9946.346.3
32.32.11
30.330.3
34.34.55
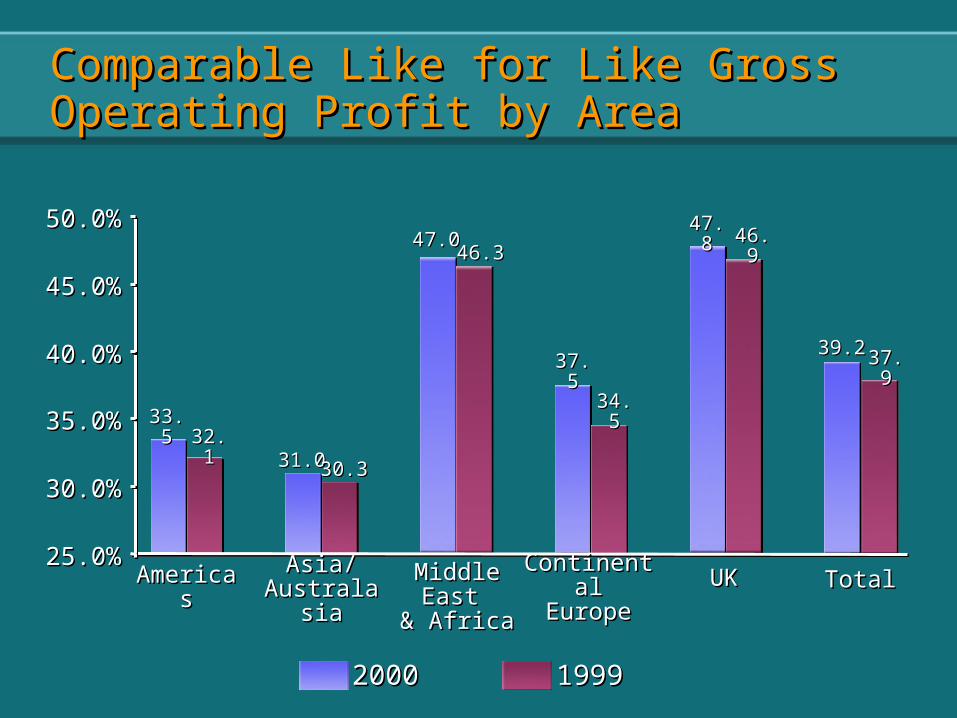
Comparable Like for Like Gross Comparable Like for Like Gross Operating Profit by AreaOperating Profit by Area
25.0%25.0%
30.0%30.0%
35.0%35.0%
40.0%40.0%
45.0%45.0%
50.0%50.0%
AmericaAmericass
Asia/ Asia/ AustralasiAustralasi
aa
MiddleMiddleEast East
& Africa& Africa
ContinentaContinentall
EuropeEuropeUKUK TotalTotal
20002000 19991999

Betting & Gaming Profit ComparisonBetting & Gaming Profit Comparison
1999 reported profit
High roller activity
Sale of Golden Gate Fields
Stakis Q1
2000 reported profit
Movement
1999 reported profit
High roller activity
Sale of Golden Gate Fields
Stakis Q1
2000 reported profit
Movement
RetailBettingRetail
Betting
TelephoneBetting /eGaming
TelephoneBetting /eGamingAmericasAmericasCasinosCasinosVernonsVernons TotalTotal
£m£m £m£m £m£m £m£m £m£m £m£m
12.5
2.6
15.1
14.1
(1.0)
12.5
2.6
15.1
14.1
(1.0)
6.1
6.1
5.6
(0.5)
6.1
6.1
5.6
(0.5)
10.4
(2.9)
7.5
8.5
1.0
10.4
(2.9)
7.5
8.5
1.0
91.0
91.0
94.6
3.6
91.0
91.0
94.6
3.6
19.2
(12.2)
7.0
(7.9)
(14.9)
19.2
(12.2)
7.0
(7.9)
(14.9)
139.2
(12.2)
(2.9)
2.6
126.7
114.9
(11.8)
139.2
(12.2)
(2.9)
2.6
126.7
114.9
(11.8)
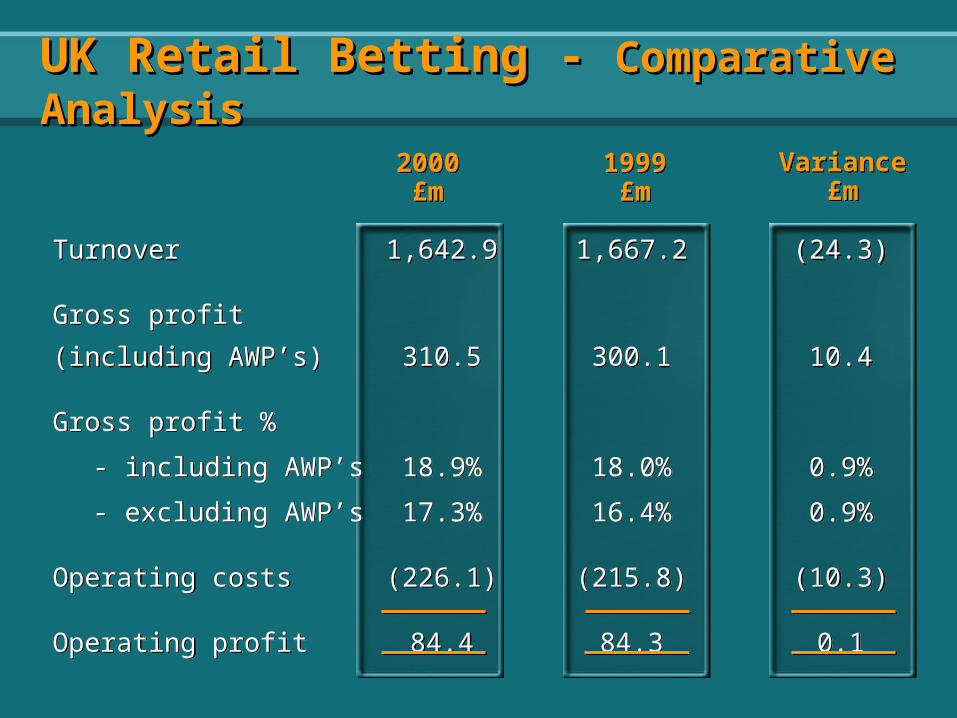
Turnover 1,642.9 1,667.2 (24.3)
Gross profit
(including AWP’s) 310.5 300.1 10.4
Gross profit %
- including AWP’s 18.9% 18.0% 0.9%
- excluding AWP’s 17.3% 16.4% 0.9%
Operating costs (226.1) (215.8) (10.3)
Operating profit 84.4 84.3 0.1
Turnover 1,642.9 1,667.2 (24.3)
Gross profit
(including AWP’s) 310.5 300.1 10.4
Gross profit %
- including AWP’s 18.9% 18.0% 0.9%
- excluding AWP’s 17.3% 16.4% 0.9%
Operating costs (226.1) (215.8) (10.3)
Operating profit 84.4 84.3 0.1
2000£m
2000£m
1999£m
1999£m
Variance£m
Variance£m
UK Retail Betting - UK Retail Betting - Comparative Comparative AnalysisAnalysis

Horses 15.2 16.1 15.6 15.1
Greyhounds 20.5 19.2 19.8 19.3
Numbers 29.0 29.4 29.2 28.5
Other Sports 12.6 10.2 11.3 11.6
Football 21.3 24.8 23.0 18.1
Total 16.9 17.6 17.3 16.4
Horses 15.2 16.1 15.6 15.1
Greyhounds 20.5 19.2 19.8 19.3
Numbers 29.0 29.4 29.2 28.5
Other Sports 12.6 10.2 11.3 11.6
Football 21.3 24.8 23.0 18.1
Total 16.9 17.6 17.3 16.4
First HalfFirst Half
Gross Betting Margin Before Gross Betting Margin Before Costs (%)Costs (%)
Second HalfSecond HalfFull YearFull Year20002000
20002000 19991999

Analysis of Telephone Betting/eGaming Analysis of Telephone Betting/eGaming profitprofit
UK
- Telephone Betting 2.1 3.3 (1.2)
- eGaming (8.0) - (8.0)
International
- Elite Telebetting 1.2 4.9 (3.7)
- Other Telebetting (1.9) (1.2) (0.7)
- High Roller activity 0.7 12.2 (11.5)
- Internet Betting (2.0) - (2.0)
(7.9) 19.2 (27.1)
UK
- Telephone Betting 2.1 3.3 (1.2)
- eGaming (8.0) - (8.0)
International
- Elite Telebetting 1.2 4.9 (3.7)
- Other Telebetting (1.9) (1.2) (0.7)
- High Roller activity 0.7 12.2 (11.5)
- Internet Betting (2.0) - (2.0)
(7.9) 19.2 (27.1)
2000£m
2000£m
1999£m
1999£m
Variance
£m
Variance
£m

UK Telebetting
UK Telebetting
GibraltarCall CentreGibraltar
Call CentreGibraltar
EliteGibraltar
EliteTotalTotal
2000
£m
2000
£m
1999
£m
1999
£m
2000
£m
2000
£m
1999
£m
1999
£m
2000
£m
2000
£m
1999
£m
1999
£m
2000
£m
2000
£m
1999
£m
1999
£mTurnover
Gross profit
Costs
Net profit
Turnover
Gross profit
Costs
Net profit
95.2
8.6
(6.5)
2.1
95.2
8.6
(6.5)
2.1
129.8
9.9
(6.6)
3.3
129.8
9.9
(6.6)
3.3
75.0
4.3
(6.2)
(1.9)
75.0
4.3
(6.2)
(1.9)
4.1
0.4
(1.6)
(1.2)
4.1
0.4
(1.6)
(1.2)
72.6
2.8
(1.6)
1.2
72.6
2.8
(1.6)
1.2
85.4
5.9
(1.0)
4.9
85.4
5.9
(1.0)
4.9
242.8
15.7
(14.3)
1.4
242.8
15.7
(14.3)
1.4
219.3
16.2
(9.2)
7.0
219.3
16.2
(9.2)
7.0
Note: Excludes high roller activity in GibraltarNote: Excludes high roller activity in Gibraltar
Telebetting AnalysisTelebetting Analysis

UK Telebetting
UK Telebetting
GibraltarCall CentreGibraltar
Call CentreGibraltar
EliteGibraltar
EliteTotalTotal
2000
£m
2000
£m
1999
£m
1999
£m
2000
£m
2000
£m
1999
£m
1999
£m
2000
£m
2000
£m
1999
£m
1999
£m
2000
£m
2000
£m
1999
£m
1999
£mTurnover
Gross profit
Costs
Net profit
No. of calls
Cost per call
Turnover
Gross profit
Costs
Net profit
No. of calls
Cost per call
95.2
8.6
(6.5)
2.1
2.5m
£2.60
95.2
8.6
(6.5)
2.1
2.5m
£2.60
129.8
9.9
(6.6)
3.3
2.6m
£2.50
129.8
9.9
(6.6)
3.3
2.6m
£2.50
75.0
4.3
(6.2)
(1.9)
1.2m
£5.10
75.0
4.3
(6.2)
(1.9)
1.2m
£5.10
4.1
0.4
(1.6)
(1.2)
39k
£41.00
4.1
0.4
(1.6)
(1.2)
39k
£41.00
72.6
2.8
(1.6)
1.2
67k
£23.90
72.6
2.8
(1.6)
1.2
67k
£23.90
85.4
5.9
(1.0)
4.9
60k
£16.80
85.4
5.9
(1.0)
4.9
60k
£16.80
242.8
15.7
(14.3)
1.4
3.8m
£3.80
242.8
15.7
(14.3)
1.4
3.8m
£3.80
219.3
16.2
(9.2)
7.0
2.7m
£3.40
219.3
16.2
(9.2)
7.0
2.7m
£3.40
Note: Excludes high roller activity in GibraltarNote: Excludes high roller activity in Gibraltar
Telebetting AnalysisTelebetting Analysis

UK Telebetting
UK Telebetting
GibraltarCall CentreGibraltar
Call CentreGibraltar
EliteGibraltar
EliteTotalTotal
2000
£m
2000
£m
1999
£m
1999
£m
2000
£m
2000
£m
1999
£m
1999
£m
2000
£m
2000
£m
1999
£m
1999
£m
2000
£m
2000
£m
1999
£m
1999
£mTurnover
Gross profit
Costs
Net profit
No. of calls
Cost per call
Full yeargross profit %
Half year gross profit %
Turnover
Gross profit
Costs
Net profit
No. of calls
Cost per call
Full yeargross profit %
Half year gross profit %
95.2
8.6
(6.5)
2.1
2.5m
£2.60
9.0%
7.9%
95.2
8.6
(6.5)
2.1
2.5m
£2.60
9.0%
7.9%
129.8
9.9
(6.6)
3.3
2.6m
£2.50
7.6%
6.9%
129.8
9.9
(6.6)
3.3
2.6m
£2.50
7.6%
6.9%
75.0
4.3
(6.2)
(1.9)
1.2m
£5.10
5.7%
3.4%
75.0
4.3
(6.2)
(1.9)
1.2m
£5.10
5.7%
3.4%
4.1
0.4
(1.6)
(1.2)
39k
£41.00
9.8%
-
4.1
0.4
(1.6)
(1.2)
39k
£41.00
9.8%
-
72.6
2.8
(1.6)
1.2
67k
£23.90
3.9%
3.6%
72.6
2.8
(1.6)
1.2
67k
£23.90
3.9%
3.6%
85.4
5.9
(1.0)
4.9
60k
£16.80
6.9%
6.8%
85.4
5.9
(1.0)
4.9
60k
£16.80
6.9%
6.8%
242.8
15.7
(14.3)
1.4
3.8m
£3.80
6.5%
5.4%
242.8
15.7
(14.3)
1.4
3.8m
£3.80
6.5%
5.4%
219.3
16.2
(9.2)
7.0
2.7m
£3.40
7.4%
6.9%
219.3
16.2
(9.2)
7.0
2.7m
£3.40
7.4%
6.9%Note: Excludes high roller activity in GibraltarNote: Excludes high roller activity in Gibraltar
Telebetting AnalysisTelebetting Analysis
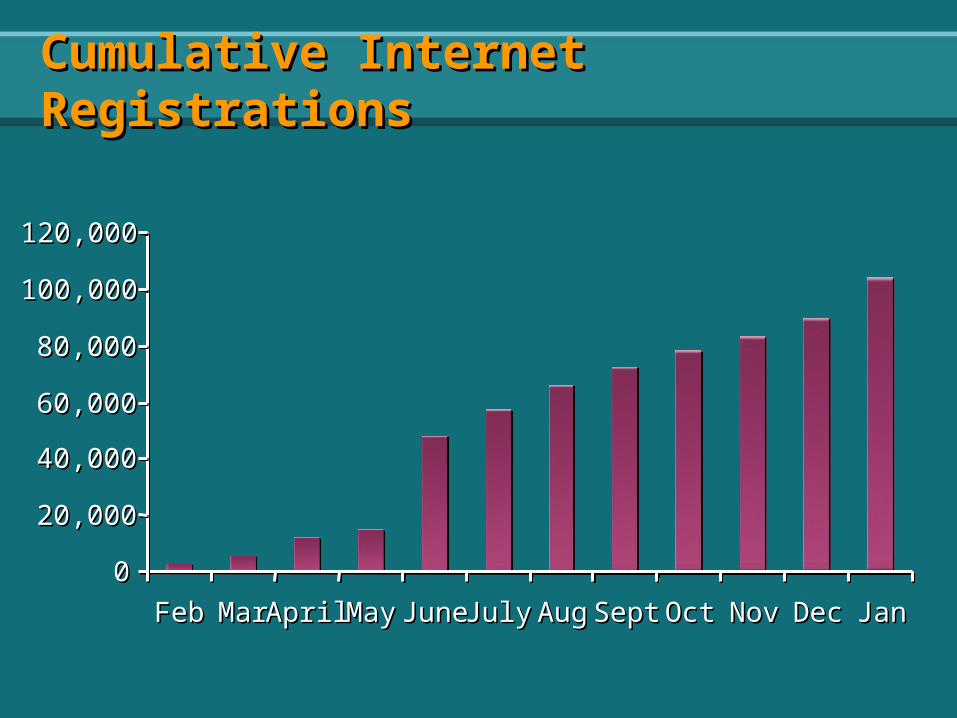
Cumulative Internet Cumulative Internet RegistrationsRegistrations
00
20,00020,000
40,00040,000
60,00060,000
80,00080,000
100,000100,000
120,000120,000
FebFeb MarMar AprilAprilMayMay JuneJune JulyJuly AugAug SeptSept OctOct NovNov DecDec JanJan

Sportsbook Margin Progression Sportsbook Margin Progression
-5%-5%
0%0%
5%5%
10%10%
15%15%
20%20%
JulyJuly AugAug SeptSept OctOct NovNov DecDec JanJan

Inflow from operating activities 462.0 363.2
Interest paid (103.9) (60.2)
Tax paid (48.9) (58.5)
Dividends paid (123.5) (177.0)
Free cash flow 185.7 67.5
Capital expenditure (476.9) (358.6)
Proceeds from asset sales 22.0 244.5
Acquisitions, disposals 244.4 (366.7)
(24.8) (413.3)
Exchange & other movements (12.7) 26.0
Opening net debt (1,336.8) (949.5)
Closing net debt (1,374.3) (1,336.8)
2000 £m
2000 £m
1999 £m
1999 £m
Group Cash FlowGroup Cash Flow

HiltonHilton
Analysis of Capital ExpenditureAnalysis of Capital Expenditure
£m£m £m£m Acquisitions
Sydney 70.8 Caledonian 45.8Dusseldorf 30.0
146.6Other Capital
United Kingdom 147.3Overseas 99.8LivingWell 30.8
277.9Betting & Gaming
Refurbishment/relocation 19.5 BS2000 EPOS system 8.5 Other 24.4
52.4
476.9
Acquisitions Sydney 70.8 Caledonian 45.8Dusseldorf 30.0
146.6Other Capital
United Kingdom 147.3Overseas 99.8LivingWell 30.8
277.9Betting & Gaming
Refurbishment/relocation 19.5 BS2000 EPOS system 8.5 Other 24.4
52.4
476.9

David MichelsDavid MichelsGroup Chief ExecutiveGroup Chief Executive
David MichelsDavid MichelsGroup Chief ExecutiveGroup Chief Executive

Hilton InternationalHilton International
Worldwide revpar increase 1999 vs 2000Worldwide revpar increase 1999 vs 2000 7.9% 7.9% (constant currencies and comparable Stakis) (constant currencies and comparable Stakis)
UK revpar increaseUK revpar increase 10.5%10.5%
Like for like UK:Like for like UK:1st half1st half 2nd half2nd half
GOP conversionGOP conversion 46.5%46.5% 49.0%49.0%
PBITPBIT (7.0%)(7.0%) 14.3%14.3%20002000 19991999 20002000 19991999£m£m £m£m £m £m £m£m68.668.6 73.873.8 92.7 92.7 81.181.1

ObjectivesObjectives
More falls to the bottom line
These businesses are as customer friendly as we can make them
That our physical hotel estate lives up to Hilton’s perceived reputation
That our eGaming investment is sensibly directed
That we expand the group
To improve the long term return on capital of the group as a whole
As at Interim Results 2000As at Interim Results 2000

Openings and PipelineOpenings and Pipeline
HotelsHotels No. of roomsNo. of rooms
Openings 2000Openings 2000 1212 3,7133,713Medina, Malta, Caledonian, Buenos Aires, Algiers, Budapest WestEnd, Medina, Malta, Caledonian, Buenos Aires, Algiers, Budapest WestEnd, Dalian, Dubai Jumeirah, Hua Hin, Mauritius, Seremban, TobagoDalian, Dubai Jumeirah, Hua Hin, Mauritius, Seremban, Tobago
PipelinePipeline 4141 11,237 11,237Opening 2001Opening 2001 2020 5,1625,162
Incl:Incl: Copenhagen, Sofia, Rhodes, Melbourne Airport, Dubai, Jeddah, Copenhagen, Sofia, Rhodes, Melbourne Airport, Dubai, Jeddah, Trafalgar Square, Paddington, Auckland, Moscow, Bangalore, AmmanTrafalgar Square, Paddington, Auckland, Moscow, Bangalore, Amman
Opening 2002/2003Opening 2002/2003 21 21 6,0756,075Incl: Dubrovnik, Philippines, Beirut, Xiamen, Sao Paulo, Lagos, Kuala Incl: Dubrovnik, Philippines, Beirut, Xiamen, Sao Paulo, Lagos, Kuala Lumpur, Tahiti, Inchon Lumpur, Tahiti, Inchon

Customer SatisfactionCustomer Satisfaction
Independent research Independent research carried out for Hilton carried out for Hilton International, based International, based on a sample of over on a sample of over 8,100 respondents8,100 respondents
1999199968%68%
20%20%
12%12%
20002000
Completely or Very Completely or Very SatisfiedSatisfiedFairly SatisfiedFairly Satisfied
DissatisfiedDissatisfied
71%71%
20%20%
9%9%
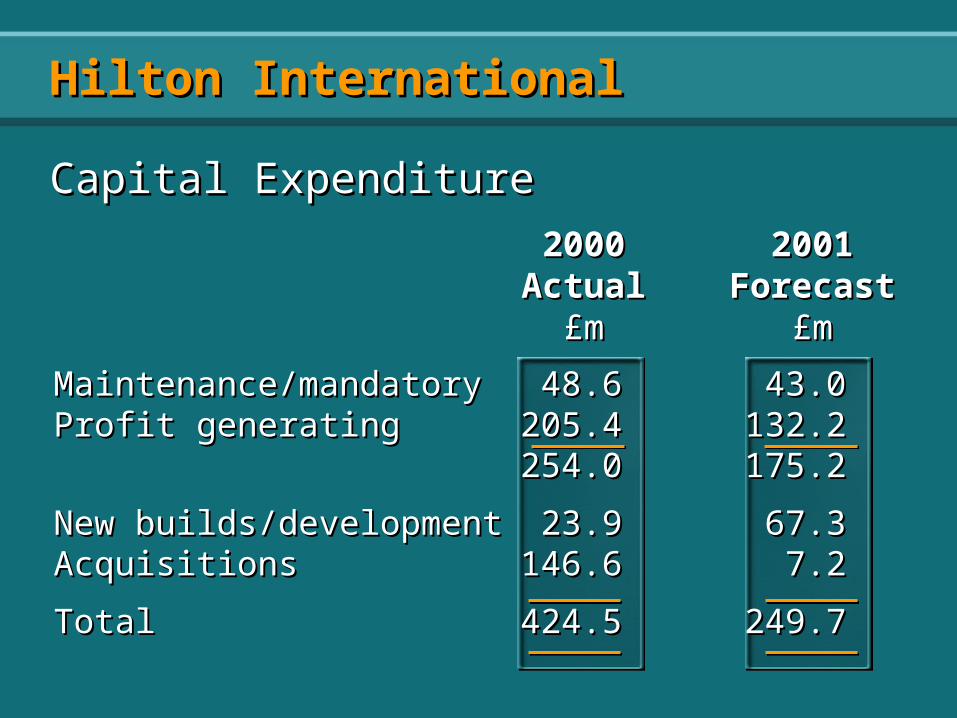
Maintenance/mandatoryMaintenance/mandatory 48.6 48.6 43.043.0Profit generatingProfit generating 205.4205.4 132.2132.2
254.0254.0 175.2175.2
New builds/developmentNew builds/development 23.923.9 67.367.3AcquisitionsAcquisitions 146.6146.6 7.27.2
Total Total 424.5424.5 249.7249.7
Hilton InternationalHilton International
Capital ExpenditureCapital Expenditure
20002000 20012001ActualActual ForecastForecast
£m£m £m£m

Major ProjectsMajor Projects
AmsterdamAmsterdam - major refurbishment- major refurbishment 16.516.5 49.0%49.0%MetropoleMetropole - extension- extension 90.990.9 22.3%22.3%Munich ParkMunich Park - major refurbishment- major refurbishment 39.939.9 15.0%15.0%CaribeCaribe - purchase & refurbishment- purchase & refurbishment 85.485.4 12.9%12.9%
CapitalCapitalExpenditure Expenditure
£m£m
IRRIRRForecastForecast
Amsterdam Hilton - Profit HistoryAmsterdam Hilton - Profit History
Note: 2000 numbers are on a Pre FRS 15 basisNote: 2000 numbers are on a Pre FRS 15 basis
00
11
22
33
44
19971997 19981998 19991999 20002000
Total cost £16.5m substantially completed Q2 1999Total cost £16.5m substantially completed Q2 1999
Amsterdam Hilton RefurbishmentAmsterdam Hilton Refurbishment

Hilton AllianceHilton Alliance
Hilton HHonorsHilton HHonorsTotal membersTotal members 10.5m10.5m 7.7m7.7mActive membersActive members 5.3m5.3m 2.8m2.8m
Hilton Reservations WorldwideHilton Reservations WorldwideTotal worldwideTotal worldwide 9.2m9.2m 7.8m7.8mhilton.com worldwide 376khilton.com worldwide 376k 149k149kHRW Hilton InternationalHRW Hilton International 1.6m1.6m 1.2m1.2m
Conrad Joint VentureConrad Joint VentureFamily of brands - Hilton Garden Inn, Doubletree, Family of brands - Hilton Garden Inn, Doubletree, Embassy, Hampton, Homewood, Red LionEmbassy, Hampton, Homewood, Red Lion
20002000 19991999

Current Total MembershipCurrent Total Membership 125,000125,000UK UK 112,500112,500InternationalInternational 12,50012,500
UK Development 2000/2001UK Development 2000/2001Clubs opened in UK in 2000Clubs opened in UK in 2000Clubs to Open in UK in Clubs to Open in UK in 20012001
HotelHotel PremierPremier
NottinghamNottingham PeterboroughPeterborough(open) (open) CaledonianCaledonian Burton on Trent Burton on Trent (open) (open)
InvernessInvernessPremierPremier BarnsleyBarnsleySutton Coldfield Sutton Coldfield YorkYorkCarlisle Carlisle AshfordAshford
LivingWellLivingWell

Health Club Malta (open)
Melbourne
Airport
Mersin Adana Dresden Berlin Mainz
Health Club Malta (open)
Melbourne
Airport
Mersin Adana Dresden Berlin Mainz
Premier Health Club
North Sydney (open)
Castlehill, Sydney (open)
Brisbane (open)
Carindale, Brisbane
Sydney Hilton
Premier Health Club
North Sydney (open)
Castlehill, Sydney (open)
Brisbane (open)
Carindale, Brisbane
Sydney Hilton
LivingWellLivingWell
Bucharest
Prague Dresden Bangkok Colombo Adelaide
Bucharest
Prague Dresden Bangkok Colombo Adelaide
International Development 2000 / 2001International Development 2000 / 2001International Development 2000 / 2001International Development 2000 / 2001

Hilton InternationalHilton International
PropertyProperty
UKUK -- £1.9 billion£1.9 billion
OverseasOverseas -- £0.9 billion£0.9 billion
£300 million to be sold in UK whilst £300 million to be sold in UK whilst retaining flagretaining flag

UK Ladbroke CasinosUK Ladbroke Casinos -- non corenon coreSold for £236.7 million vs 2000 PBIT £14.9 Sold for £236.7 million vs 2000 PBIT £14.9 millionmillion
Overseas GamingOverseas Gaming -- non corenon coreSold - Fort Erie; Argentina; Peru; San Pablo Sold - Fort Erie; Argentina; Peru; San Pablo Card Club;Card Club;PennsylvaniaPennsylvania (conditional contract);(conditional contract); ColoradoColorado (auction process at advanced stage)(auction process at advanced stage)
To be sold - 2 Cairo casinosTo be sold - 2 Cairo casinos
Sale of BusinessesSale of Businesses

UK Betting Industry & UK Betting Industry & EnvironmentEnvironment
Government review of a new betting tax regime
Gambling Review Body to submit report to Home Office during summer
Horserace levy agreed for 2001/02. Home Office consulting on a replacement scheme
SIS in discussions with the Racecourse Association (RCA) over renewal of betting shop picture rights
Government review of a new betting tax regime
Gambling Review Body to submit report to Home Office during summer
Horserace levy agreed for 2001/02. Home Office consulting on a replacement scheme
SIS in discussions with the Racecourse Association (RCA) over renewal of betting shop picture rights

EBITDA break even achieved
Further investment planned
By end 2001 sustainable break even will be achieved
Move into profit during 2002
Sportsbook registrations 105,000
Casino players 6,000
Average cost customer recruitment 2000 £42.00 2001 £29.00
EBITDA break even achieved
Further investment planned
By end 2001 sustainable break even will be achieved
Move into profit during 2002
Sportsbook registrations 105,000
Casino players 6,000
Average cost customer recruitment 2000 £42.00 2001 £29.00
eGaming PerformanceeGaming Performance

PlatformPlatform MediaMedia TimingTimingInternetInternet Bet.co.ukBet.co.uk Launched February 2000Launched February 2000
Ladbrokes.co.ukLadbrokes.co.uk Launched February 2000Launched February 2000Ladbrokes.comLadbrokes.com Launched February 2000Launched February 2000Ladbrokescasino.comLadbrokescasino.com Launched November 2000Launched November 2000Vernons.co.ukVernons.co.uk Launched February 2001Launched February 2001
MobileMobile WAPWAP Launched August 2000Launched August 2000GPRSGPRS Summer 2001Summer 2001UMTSUMTS 20032003
Digital TV Digital TV CableCable }} TelewestTelewest Launched February 2000Launched February 2000}} CWCCWC Launched March 2000Launched March 2000}} NtlNtl Launch April/May 2001Launch April/May 2001
SatelliteSatellite}} OpenOpen In DiscussionIn Discussion}} Sky (WAPTV)Sky (WAPTV) Awaiting platform ratesAwaiting platform rates
TerrestrialTerrestrial}} On DigitalOn Digital LaunchedLaunched
eGaming PlatformseGaming Platforms

Partner ActivityTeamtalk Exclusive sportsbook and casino link
South ChinaMorning Post Sportsbook and casino link
Soccernet World’s largest soccer site – exclusive sportsbook link
Cricinfo World’s largest single sports site Sportsbook and casino link
Autosport.com Europe’s second biggest motor racing site
Sportsbook link
Totalsports.asia.com Dedicated sales team in KL generating affiliate deals for Ladbrokes sportsbook
and casino in Far East
Playboy Provide sportsbook. One of the top ten most searched words on the worldwide
web
eGaming PartnershipseGaming Partnerships

eGaming Future DevelopmentseGaming Future Developments
Activity Planned 2001 Flash casino games March Cantonese Casino April Ntl interactive TV service April Playboy sportsbook April Progressive casino games (blackjack/roulette/slots) May High roller casino September Numbers games July Sportsbook – next generation July Poker Million web site September Video streamed casino December
Activity Planned 2001 Flash casino games March Cantonese Casino April Ntl interactive TV service April Playboy sportsbook April Progressive casino games (blackjack/roulette/slots) May High roller casino September Numbers games July Sportsbook – next generation July Poker Million web site September Video streamed casino December

NB:* 1 million digital terrestrial homes via OnDigital but only circa 50,000 currently subscribe to OnNet boxes which enable Web access (i.e. delivers a return path)
NB:* 1 million digital terrestrial homes via OnDigital but only circa 50,000 currently subscribe to OnNet boxes which enable Web access (i.e. delivers a return path)
eGaming - Digital TVeGaming - Digital TV
2000 2000 2004 (F’cast)2004 (F’cast)
Homes Connected
Satellite Sky/Open 4.7m 7.2m
Cable Ntl 0.5m 2.8m
Telewest 0.3m 1.5m
Terrestrial On-Digital 1.0m 3.3m
6.5m 14.8m
2000 2000 2004 (F’cast)2004 (F’cast)
Homes Connected
Satellite Sky/Open 4.7m 7.2m
Cable Ntl 0.5m 2.8m
Telewest 0.3m 1.5m
Terrestrial On-Digital 1.0m 3.3m
6.5m 14.8m


![Singer, Brian & Fedorinchik, Greg – Investment Leadership ... · Singer, Brian & Fedorinchik, Greg – Investment Leadership and Portfolio Management John Wiley & Sons, 2010, [Finance]](https://img.pdfslide.us/doc/110x75/5b4ca20e7f8b9acc378b48fc/singer-brian-fedorinchik-greg-investment-leadership-singer-brian.jpg)