Embed Size (px)
Citation preview
Living in interesting times
Brian Parker, CFAChief Economist

Before we begin
• This presentation contains general advice and does not take into account the investment objectives, financial situation orneeds of any particular individual.
• You should consider the appropriateness of the advice, having regard to your own particular objectives, financial situationand needs before acting on any advice. You need to apply the concepts to your own situation before making aninvestment decision.
• You should obtain and consider a copy of the Product Disclosure Statement (PDS) before making a decision to acquireor continue to hold the product. You can obtain a PDS by calling Sunsuper on 13 11 84 or by visiting sunsuper.com.au.
•Presenters are either employees of the Sunsuper Group, who act as representatives of Sunsuper Financial Services PtyLtd (ABN 50 087 154 818 AFSL No. 227867, wholly owned by the Sunsuper Superannuation Fund) or financial plannerson Sunsuper’s National Advice Panel. Sunsuper Group employees may recommend Sunsuper superannuation productswhen they are appropriate and are remunerated by salary package, a portion of which is payable on achievement of keyperformance indicators. Further information is available in the Financial Services Guides for Sunsuper and SunsuperFinancial Services. Information about financial planners on Sunsuper’s National Advice Panel, including the services theyoffer, remuneration, any potential conflicts of interest, and dispute resolution, are set out in their own Financial ServicesGuide(s). Sunsuper does not receive or pay any referral fees to these planners. The National Advice Panel planners arenot employed by Sunsuper, and Sunsuper is not responsible for the advice provided by these planners.
Main messages - economics
• Despite the central banks’ best efforts, growth has been sub-par since GFC and there are good reasons for that, but…
• ...it isn’t likely to get much better
• Even though governments are likely to spend more money
• Inflation does eventually rise (but getting inflation up is easier said than done)
As good as it gets… but at least it won’t get much worse
Investment implications
• Lower interest rates for longer (but not forever)
• Hard to find value in publicly traded markets (especially fixed income)...
• ...but emerging markets look genuinely cheap
• Unlisted assets still offer best return potential, but...
• ...even here potential returns have been compressed

Main messages - geopolitics
• Geopolitical risk is not new
• Multi-polar world – inherently unstable
• The grown-ups have largely exited – populism rules?
• Globalisation stalling – but does it reverse?
• Global solutions to a range of global crises are that much harder to achieve
• Crisis management ‘trumps’ forward planning?
As good as it gets… but it can (will?) get worse
Investment implications
• Geopolitical environment adds to volatility
• Will the next financial crisis be that much harder to deal with?
• Over time, investors still get rewarded for risk – the world hasn’t changed that much

Economics
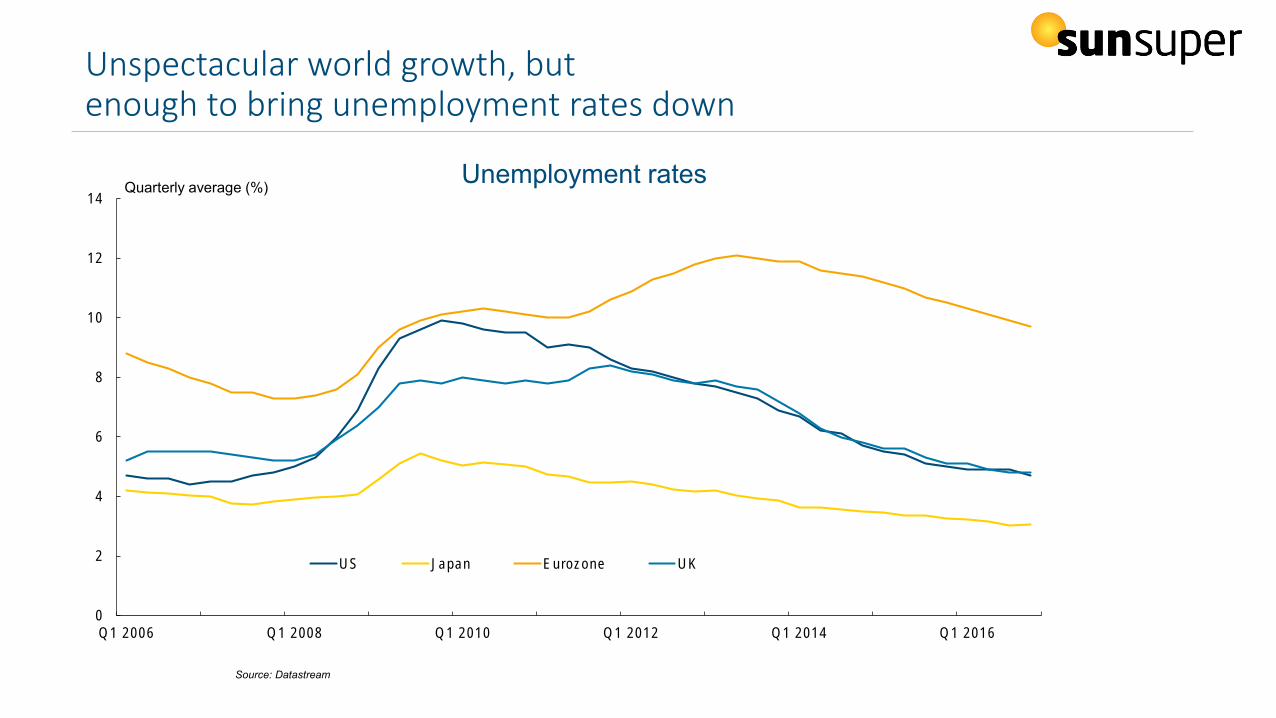
Unspectacular world growth, but enough to bring unemployment rates down
0
2
4
6
8
10
12
14
Q1 2006 Q1 2008 Q1 2010 Q1 2012 Q1 2014 Q1 2016
Unemployment rates
US Japan Eurozone UK
Quarterly average (%)
Source: Datastream

Fiscal policy is much less restrictive
• Fewer countries in tightening* mode
3
7
16
26
1820
1815
1012
16
3
3
3
4
3
5
4
5
8
10
14
29
25
16
5
14
1013
1517
13
5
0
5
10
15
20
25
30
35
2008 2009 2010 2011 2012 2013 2014 2015 2016F 2017F 2018F
Easing
Neutral
Tightening
No. of countries
Source: Sunsuper, IMF Fiscal Monitor, October 2016. *Based on changes in cyclically adjusted primary budget balances. Neutral policy implies an absolute change of less than 0.1% of potential GDP in the cyclically adjusted primary balance.

Demographics trends point clearly to lower long-term potential growth
Source: World Bank
2001-2015 2015-2035 Change
Australia 1.4 0.7 -0.7
US 0.8 0.2 -0.6
Japan -0.8 -0.8 0.0
EU 0.1 -0.5 -0.6
UK 0.6 0.1 -0.5
Korea 0.6 -0.8 -1.4
China 1.0 -0.5 -1.5
India 2.0 1.1 -0.9
Indonesia 1.6 0.9 -0.7
Brazil 1.5 0.4 -1.1
Mexico 2.0 1.0 -1.0
South Africa 2.0 1.2 -0.8
World 1.5 0.8 -0.7
Working age (15-64) Population Growth Trends
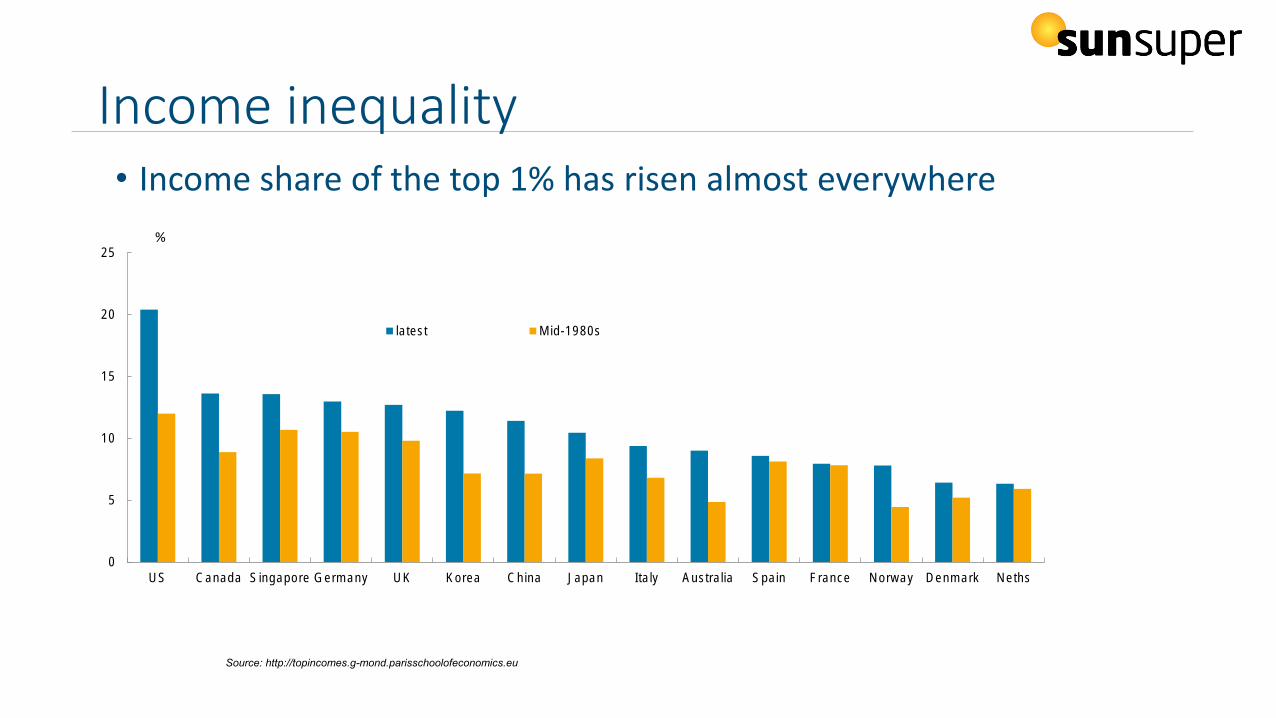
Income inequality• Income share of the top 1% has risen almost everywhere
0
5
10
15
20
25
US Canada Singapore Germany UK Korea China Japan Italy Australia Spain France Norway Denmark Neths
latest Mid-1980s
%
Source: http://topincomes.g-mond.parisschoolofeconomics.eu
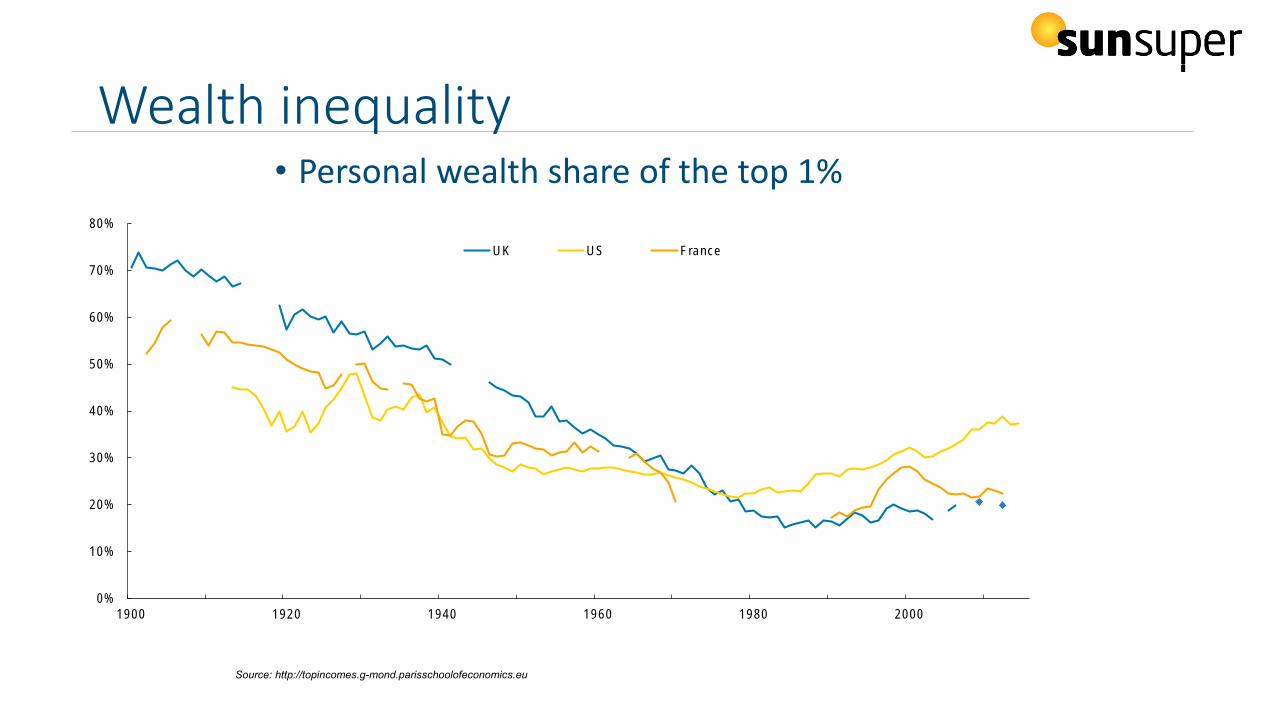
Wealth inequality• Personal wealth share of the top 1%
0%
10%
20%
30%
40%
50%
60%
70%
80%
1900 1920 1940 1960 1980 2000
UK US France
Source: http://topincomes.g-mond.parisschoolofeconomics.eu
Geopolitics

The geopolitical thermometer?
1950s - 1989 1990- 2001 Now
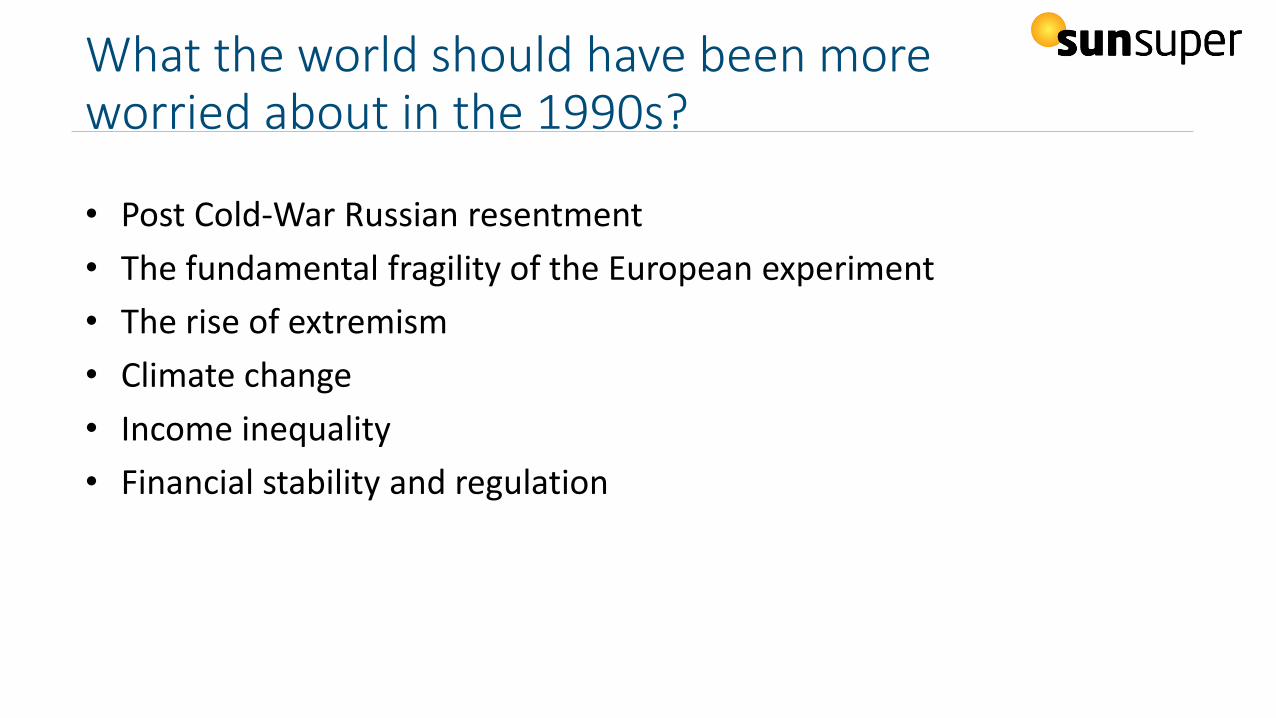
What the world should have been moreworried about in the 1990s?
• Post Cold-War Russian resentment
• The fundamental fragility of the European experiment
• The rise of extremism
• Climate change
• Income inequality
• Financial stability and regulation
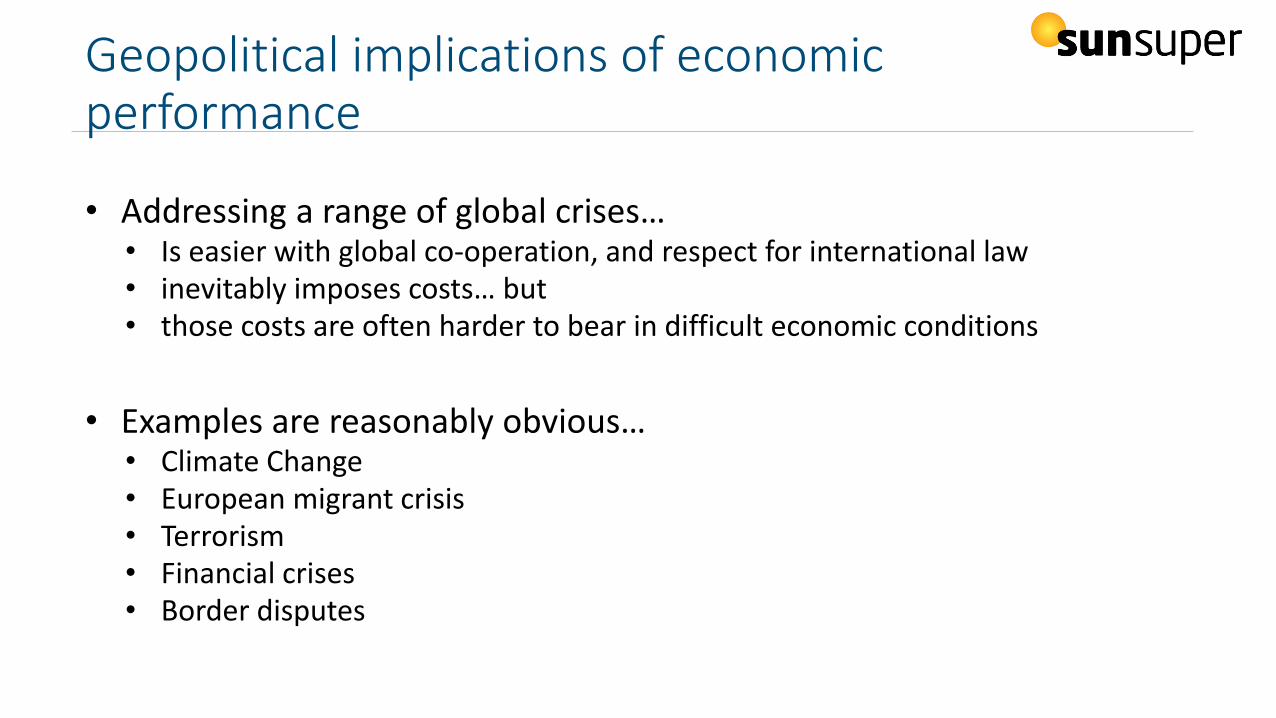
Geopolitical implications of economic performance
• Addressing a range of global crises…• Is easier with global co-operation, and respect for international law• inevitably imposes costs… but• those costs are often harder to bear in difficult economic conditions
• Examples are reasonably obvious…• Climate Change• European migrant crisis• Terrorism• Financial crises• Border disputes

Europe 1984

Europe 1984
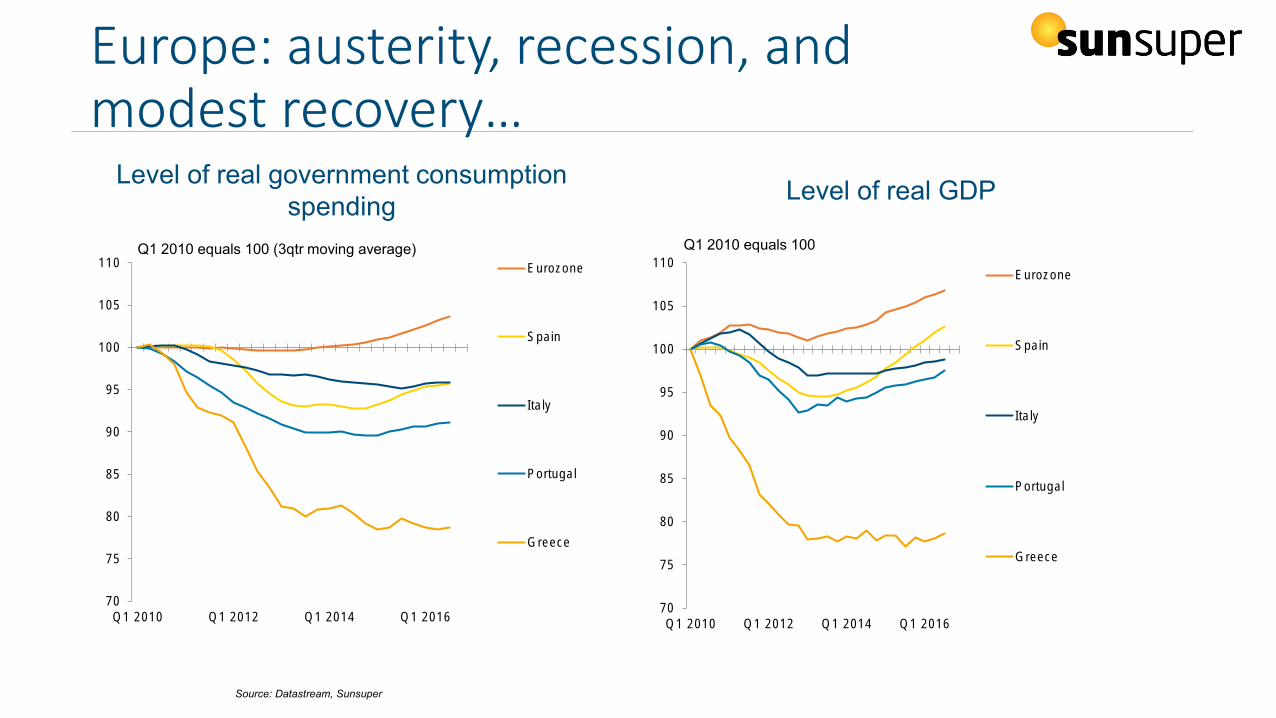
Europe: austerity, recession, and modest recovery…
70
75
80
85
90
95
100
105
110
Q1 2010 Q1 2012 Q1 2014 Q1 2016
Eurozone
Spain
Italy
Portugal
Greece
Q1 2010 equals 100 (3qtr moving average)
70
75
80
85
90
95
100
105
110
Q1 2010 Q1 2012 Q1 2014 Q1 2016
Eurozone
Spain
Italy
Portugal
Greece
Q1 2010 equals 100
Source: Datastream, Sunsuper
Level of real government consumption
spendingLevel of real GDP
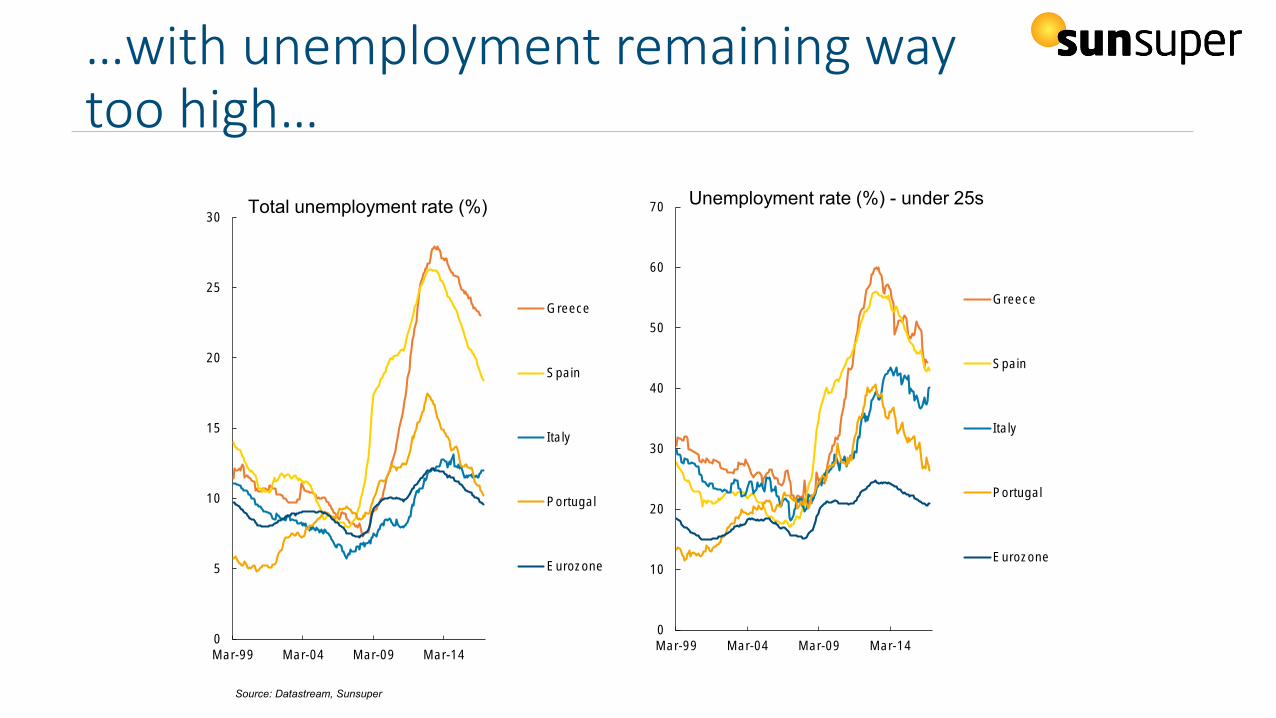
…with unemployment remaining way too high…
Source: Datastream, Sunsuper
0
5
10
15
20
25
30
Mar-99 Mar-04 Mar-09 Mar-14
Greece
Spain
Italy
Portugal
Eurozone
Total unemployment rate (%)
0
10
20
30
40
50
60
70
Mar-99 Mar-04 Mar-09 Mar-14
Greece
Spain
Italy
Portugal
Eurozone
Unemployment rate (%) - under 25s
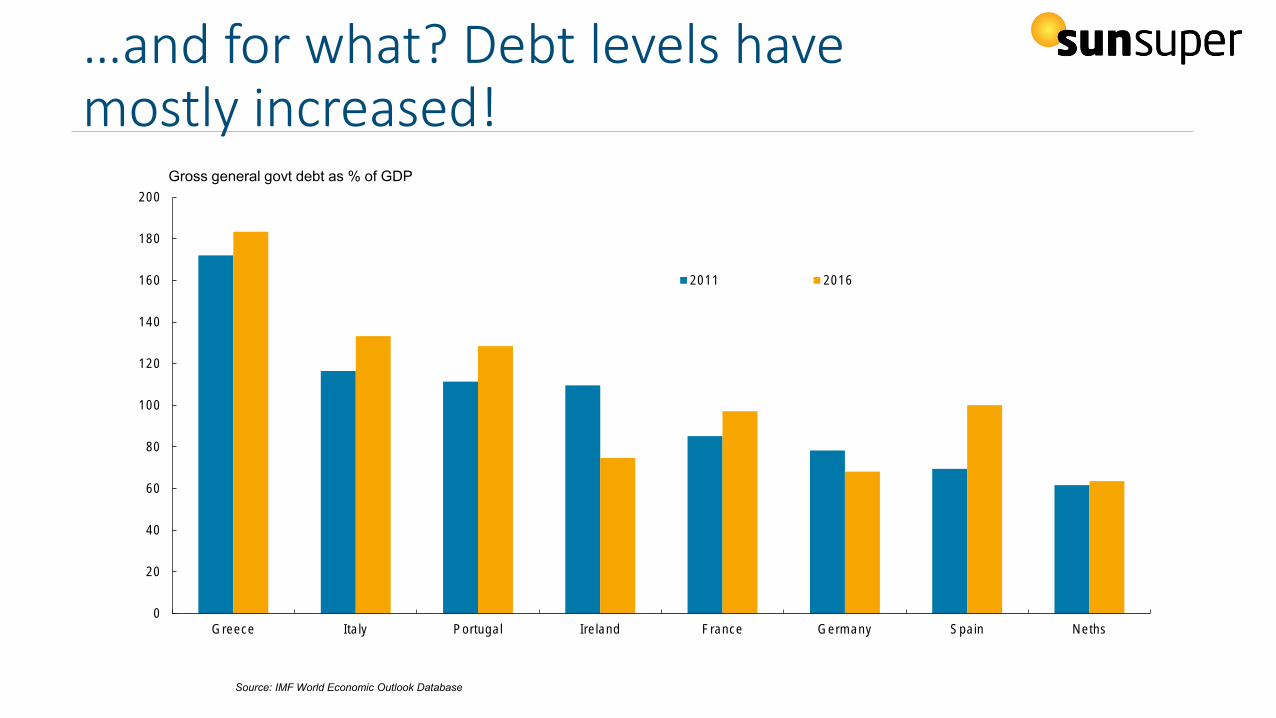
…and for what? Debt levels have mostly increased!
0
20
40
60
80
100
120
140
160
180
200
Greece Italy Portugal Ireland France Germany Spain Neths
2011 2016
Gross general govt debt as % of GDP
Source: IMF World Economic Outlook Database

Europe 2016

Brexit implications
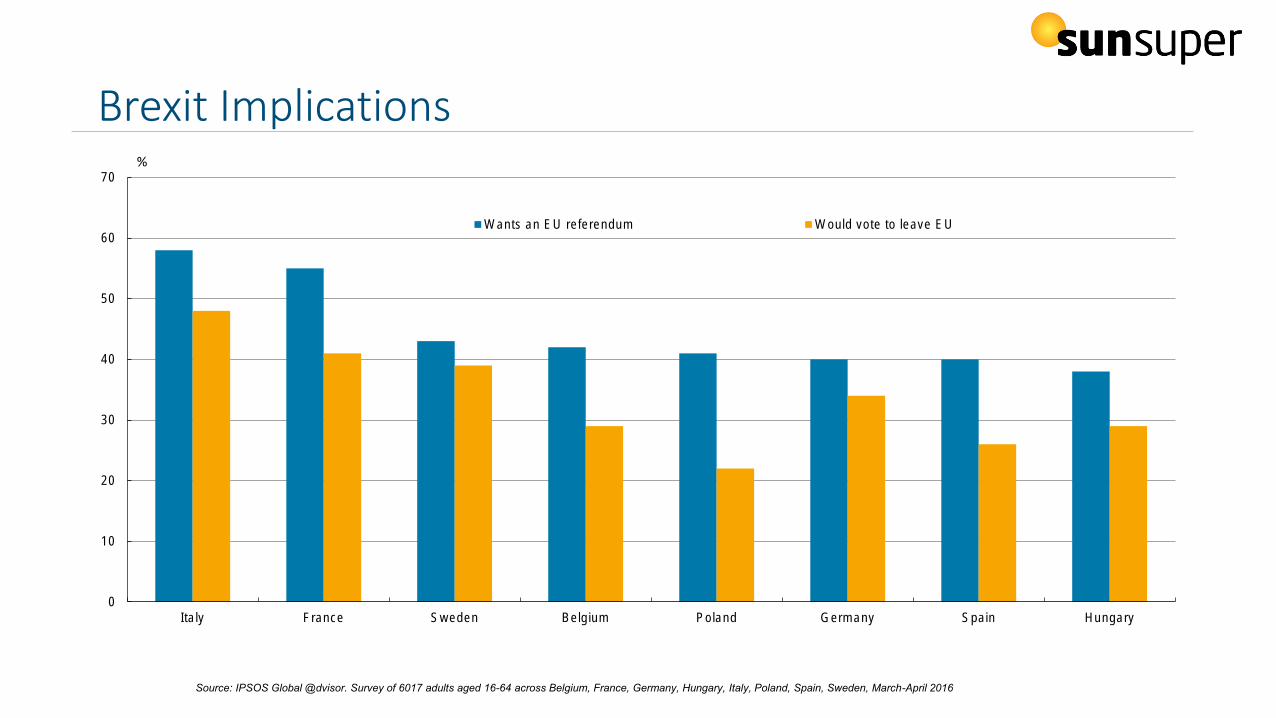
Brexit Implications
0
10
20
30
40
50
60
70
Italy France Sweden Belgium Poland Germany Spain Hungary
Wants an EU referendum Would vote to leave EU
%
Source: IPSOS Global @dvisor. Survey of 6017 adults aged 16-64 across Belgium, France, Germany, Hungary, Italy, Poland, Spain, Sweden, March-April 2016
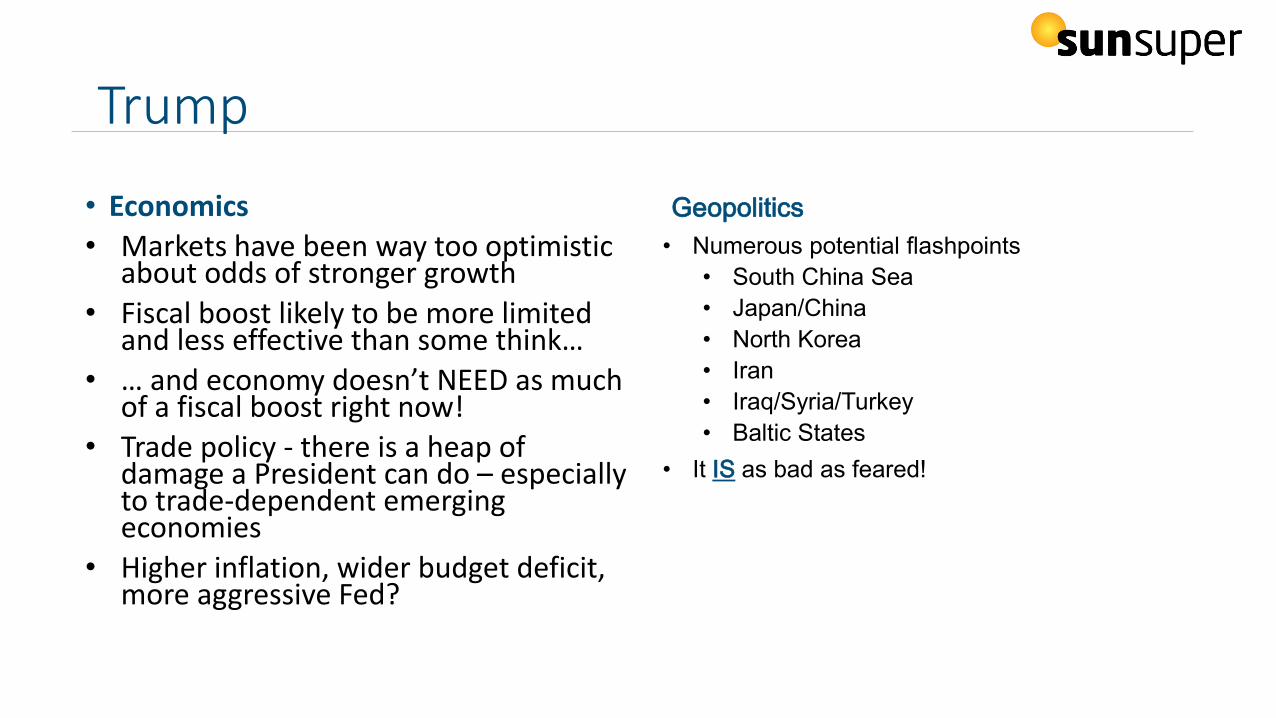
Trump
• Economics
• Markets have been way too optimistic about odds of stronger growth
• Fiscal boost likely to be more limited and less effective than some think…
• … and economy doesn’t NEED as much of a fiscal boost right now!
• Trade policy - there is a heap of damage a President can do – especially to trade-dependent emerging economies
• Higher inflation, wider budget deficit, more aggressive Fed?
Geopolitics
• Numerous potential flashpoints
• South China Sea
• Japan/China
• North Korea
• Iran
• Iraq/Syria/Turkey
• Baltic States
• It IS as bad as feared!

You say Senkaku, I say Diaoyu
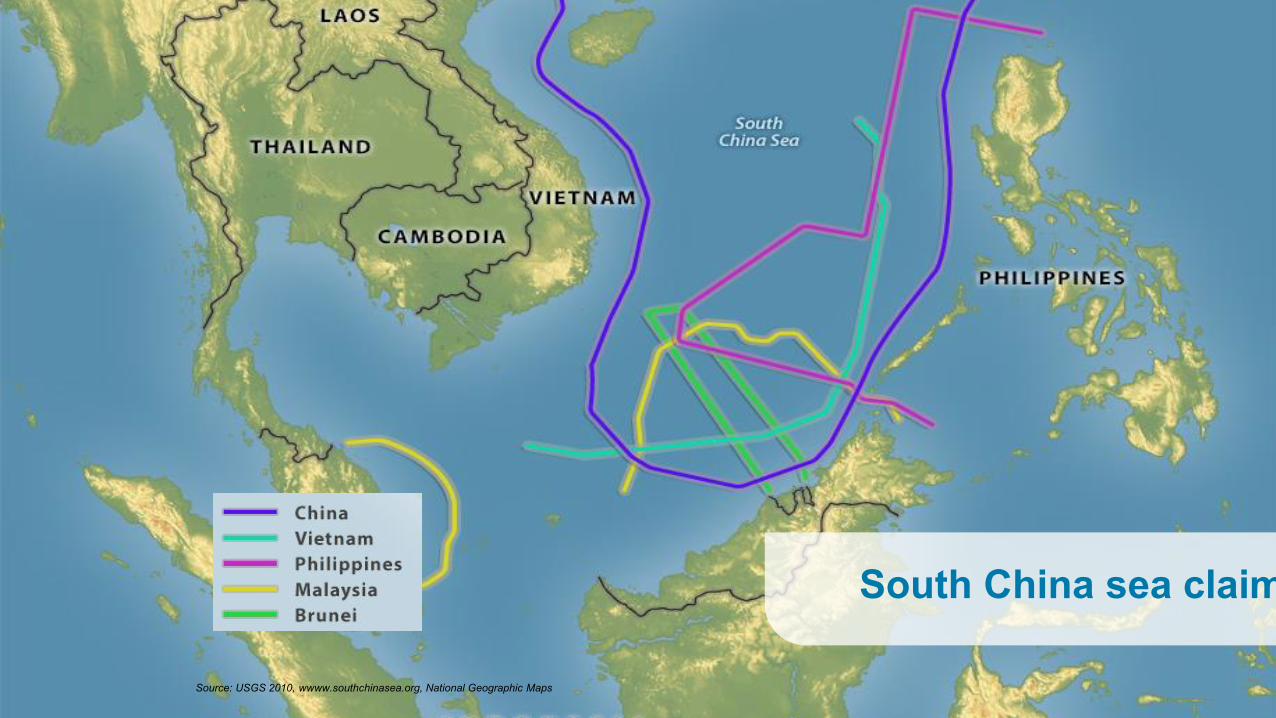
South China Sea Claims
South China sea claims
Source: USGS 2010, wwww.southchinasea.org, National Geographic Maps
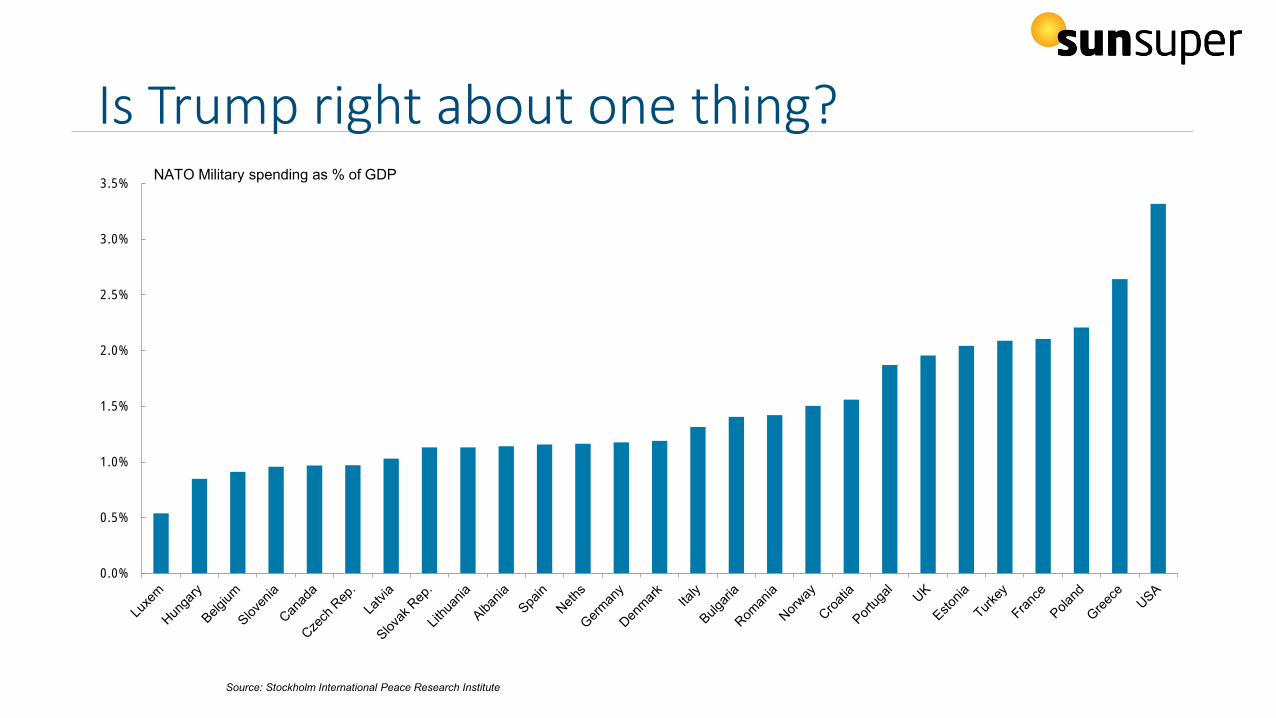
Is Trump right about one thing?
0.0%
0.5%
1.0%
1.5%
2.0%
2.5%
3.0%
3.5%NATO Military spending as % of GDP
Source: Stockholm International Peace Research Institute
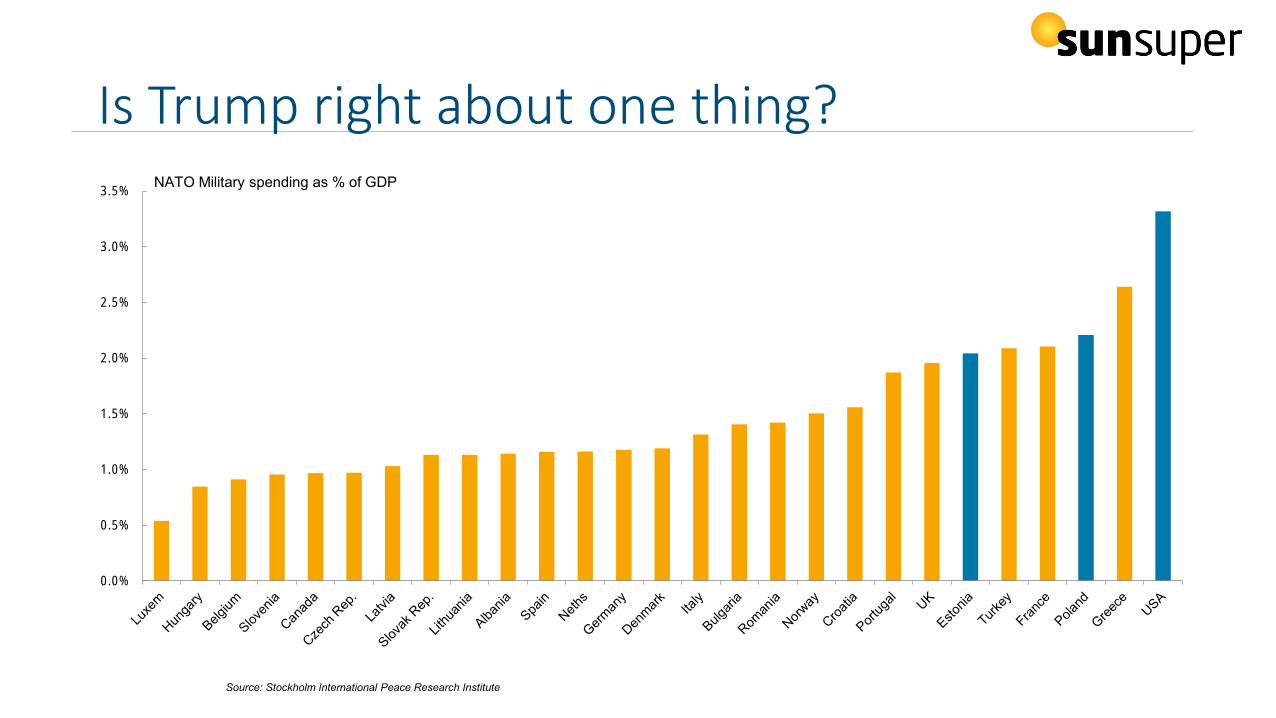
Is Trump right about one thing?
0.0%
0.5%
1.0%
1.5%
2.0%
2.5%
3.0%
3.5%NATO Military spending as % of GDP
Source: Stockholm International Peace Research Institute
Investment implications and prospects
• In publicly traded markets, finding genuine value is tough
• Emerging market equities one of the few asset classes that look genuinely cheap…
• ... BUT they are subject to a number of Trump-related (and other) risks
• Sovereign bonds still look lousy – even after recent sell-off.
• Unlisted assets attractive – but even here return potential has been compressed
• Even in difficult and volatile times, life, the economy, and business goes on!

Even in a challenging geopolitical environment…• Life, business, and the economy (eventually) goes on…
10
100
1000
10000
100000
1000000
Jan-00 Jan-20 Jan-40 Jan-60 Jan-80 Jan-00
US shares 1900 – 2016: Real return index* (log scale)
Source: Stock Market Data Used in "Irrational Exuberance" Princeton University Press, 2000, 2005, 2015, updated.
*Total returns adjusted for US CPI inflation
“ ”
The complete annihilation of all
human life represents the mother of
all tail risks.
We estimate that there is a 50%
chance that doomsday will occur by
2290 and a 95% chance that it will
occur by 2710.
Could be worse…
- BCA Research September 2016.

Questions