Embed Size (px)
Citation preview
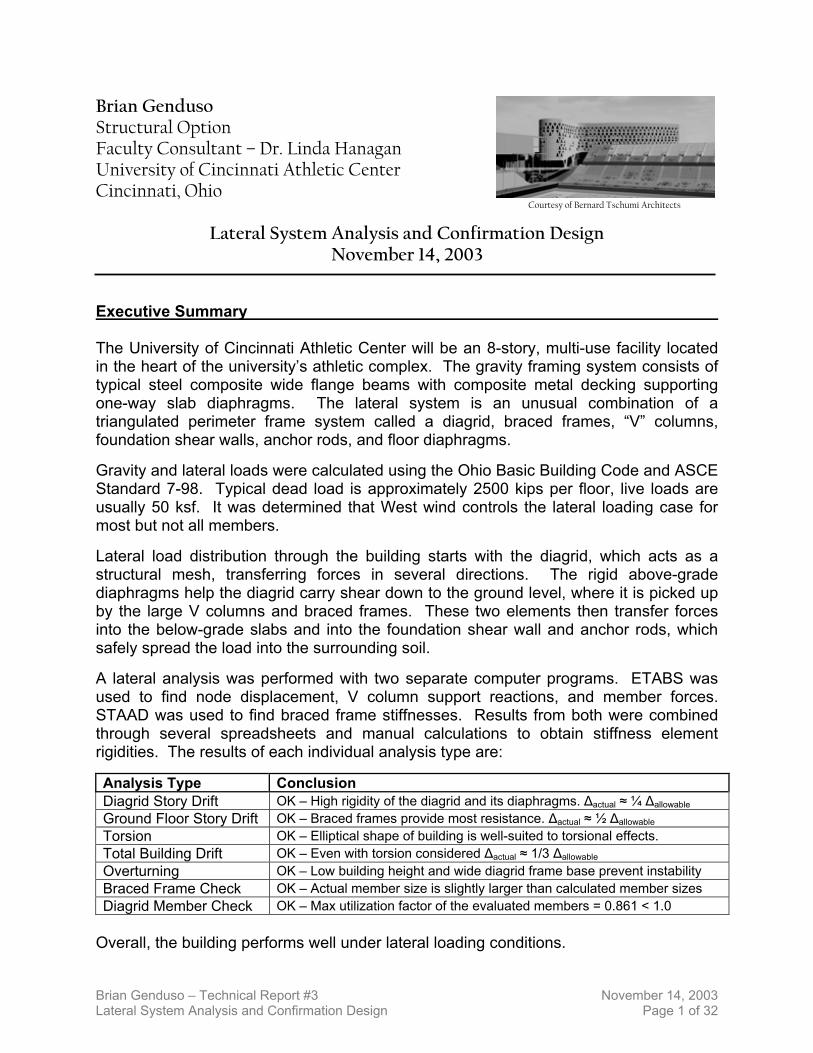
Brian Genduso Structural Option Faculty Consultant – Dr. Linda Hanagan University of Cincinnati Athletic Center Cincinnati, Ohio
Courtesy of Bernard Tschumi Architects Lateral System Analysis and Confirmation Design
November 14, 2003 Executive Summary The University of Cincinnati Athletic Center will be an 8-story, multi-use facility located in the heart of the university’s athletic complex. The gravity framing system consists of typical steel composite wide flange beams with composite metal decking supporting one-way slab diaphragms. The lateral system is an unusual combination of a triangulated perimeter frame system called a diagrid, braced frames, “V” columns, foundation shear walls, anchor rods, and floor diaphragms. Gravity and lateral loads were calculated using the Ohio Basic Building Code and ASCE Standard 7-98. Typical dead load is approximately 2500 kips per floor, live loads are usually 50 ksf. It was determined that West wind controls the lateral loading case for most but not all members. Lateral load distribution through the building starts with the diagrid, which acts as a structural mesh, transferring forces in several directions. The rigid above-grade diaphragms help the diagrid carry shear down to the ground level, where it is picked up by the large V columns and braced frames. These two elements then transfer forces into the below-grade slabs and into the foundation shear wall and anchor rods, which safely spread the load into the surrounding soil. A lateral analysis was performed with two separate computer programs. ETABS was used to find node displacement, V column support reactions, and member forces. STAAD was used to find braced frame stiffnesses. Results from both were combined through several spreadsheets and manual calculations to obtain stiffness element rigidities. The results of each individual analysis type are: Analysis Type Conclusion Diagrid Story Drift OK – High rigidity of the diagrid and its diaphragms. ∆actual ≈ ¼ ∆allowable
Ground Floor Story Drift OK – Braced frames provide most resistance. ∆actual ≈ ½ ∆allowable
Torsion OK – Elliptical shape of building is well-suited to torsional effects. Total Building Drift OK – Even with torsion considered ∆actual ≈ 1/3 ∆allowable
Overturning OK – Low building height and wide diagrid frame base prevent instability Braced Frame Check OK – Actual member size is slightly larger than calculated member sizes Diagrid Member Check OK – Max utilization factor of the evaluated members = 0.861 < 1.0
Overall, the building performs well under lateral loading conditions.
Brian Genduso – Technical Report #3 November 14, 2003 Lateral System Analysis and Confirmation Design Page 1 of 32
Index
Introduction 3 General Building Description 3 Gravity Framing System 3 Lateral System 4
Loads 5
Calculations 5 Wind 5 Seismic 6
Load Cases 6
Distribution 7 Above-grade 7 Below-grade 9
Lateral Analysis 10 Theory 10 Diagrid Story Drifts 12 Ground Floor Story Drift 14 ETABS Analysis 15 STAAD Analysis 20 Combined Results 21 Torsion 23 Total Building Drift 25 Overturning 25
Member Checks 26
Braced Frames 26 Diagrid Members 27
Conclusions 32 Appendices Appendix A – Gravity Load Calculations Appendix B – Wind and Seismic Load Calculations Appendix C – Node Numbering System Appendix D – ETABS Analysis Results Appendix E – STAAD Analysis Results Appendix F – Diagrid Member Checking Spreadsheets
Brian Genduso – Technical Report #3 November 14, 2003 Lateral System Analysis and Confirmation Design Page 2 of 32
Introduction General Building Description
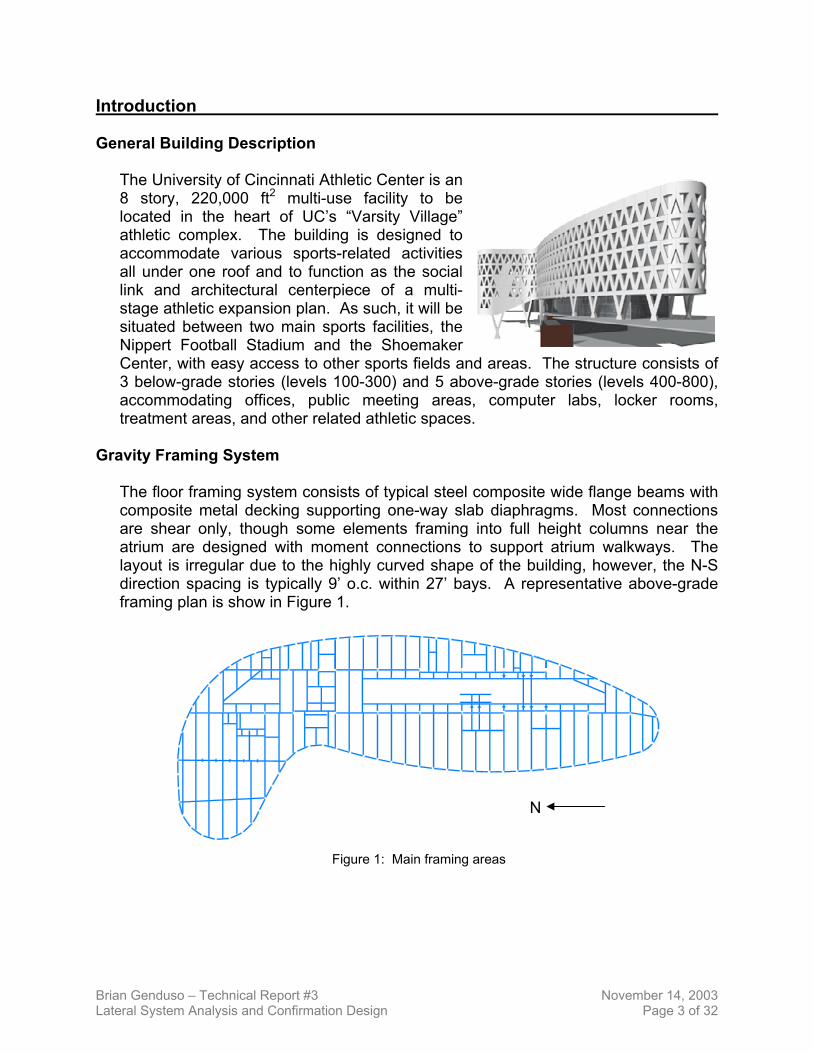
The University of Cincinnati Athletic Center is an 8 story, 220,000 ft2 multi-use facility to be located in the heart of UC’s “Varsity Village” athletic complex. The building is designed to accommodate various sports-related activities all under one roof and to function as the social link and architectural centerpiece of a multi-stage athletic expansion plan. As such, it will be situated between two main sports facilities, the Nippert Football Stadium and the Shoemaker Center, with easy access to other sports fields and areas. The structure consists of 3 below-grade stories (levels 100-300) and 5 above-grade stories (levels 400-800), accommodating offices, public meeting areas, computer labs, locker rooms, treatment areas, and other related athletic spaces.
Gravity Framing System
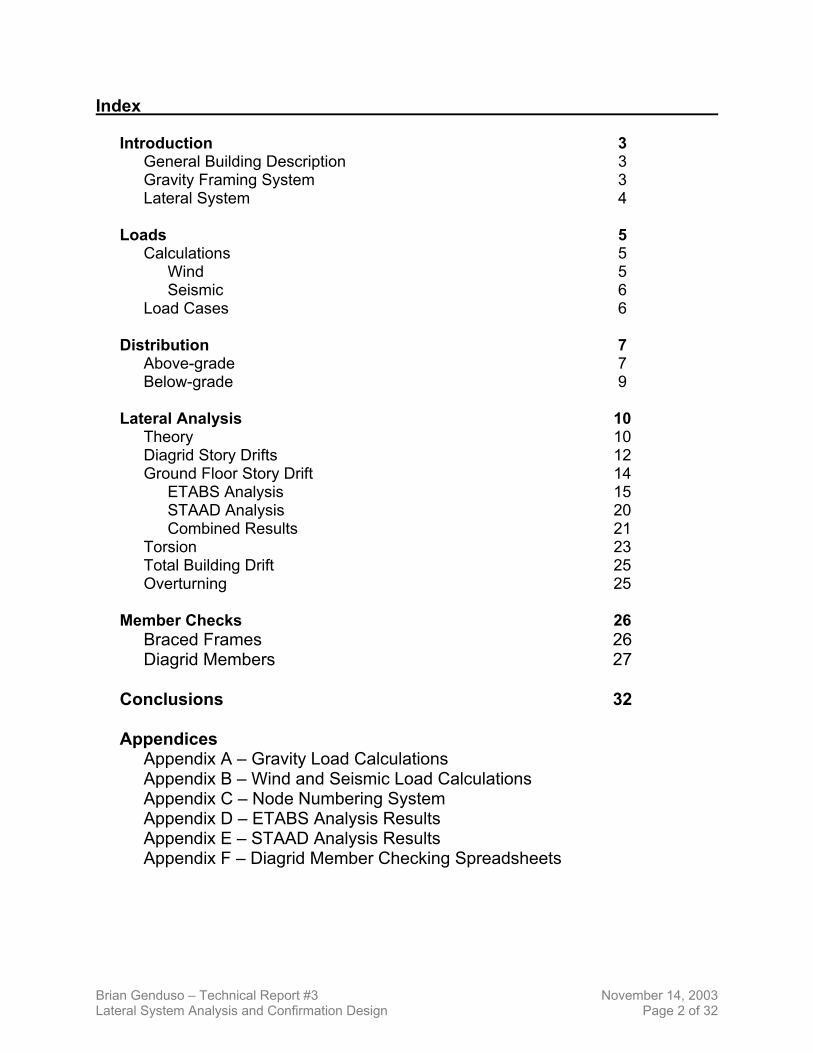
The floor framing system consists of typical steel composite wide flange beams with composite metal decking supporting one-way slab diaphragms. Most connections are shear only, though some elements framing into full height columns near the atrium are designed with moment connections to support atrium walkways. The layout is irregular due to the highly curved shape of the building, however, the N-S direction spacing is typically 9’ o.c. within 27’ bays. A representative above-grade framing plan is show in Figure 1.
N
Figure 1: Main framing areas
Brian Genduso – Technical Report #3 November 14, 2003 Lateral System Analysis and Confirmation Design Page 3 of 32
Lateral System
Diagrid and Diaphragms The above-grade enclosure of the UC Athletic Center is a triangulated, curved perimeter frame system called a diagrid. The diagrid acts as a rigid shell, and for structural purposes can be considered a very thin, deep beam. It is composed of wide flange rolled sections welded or bolted for full restraint. The steel will be covered with concrete or similar material to produce a monolithic appearance. Between the beams are triangular window glazings. A rendering of a typical diagrid connection is shown in Figure 2. The above-grade diaphragms are 6.5” reinforced concrete slabs on metal deck, supported by steel framing. There are numerous slab openings, including the main atrium and several elevator and stair shafts.
Figure 2
Braced Frames
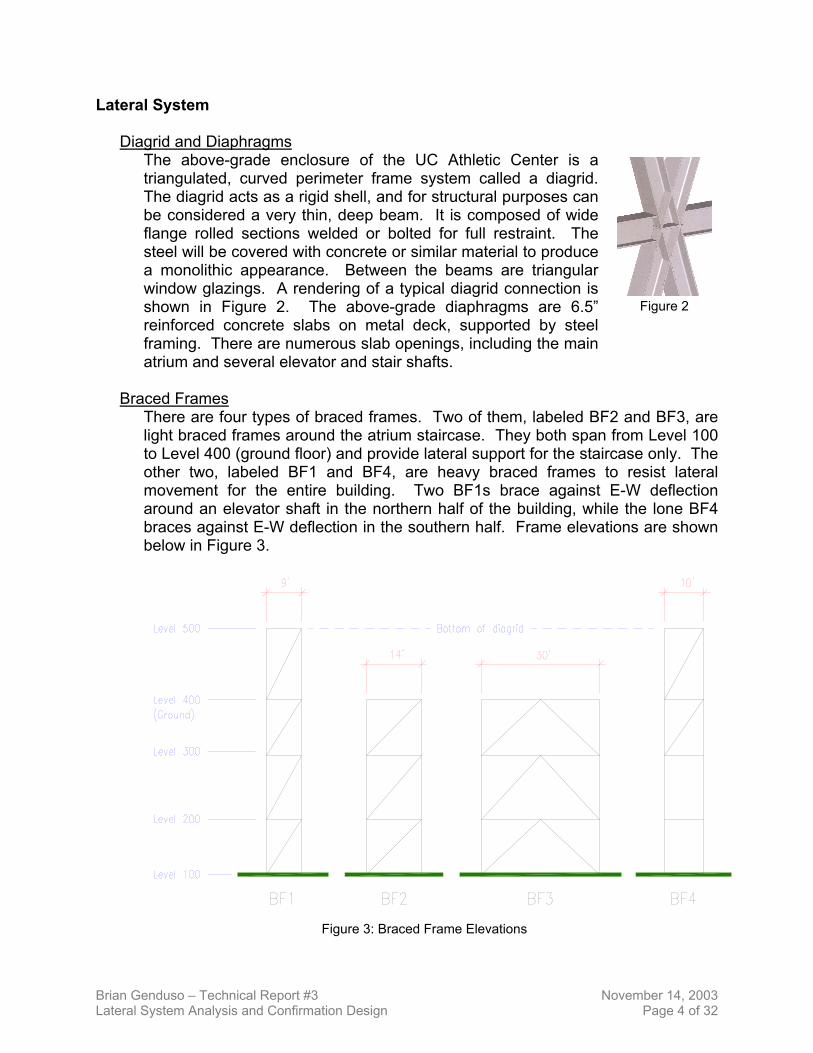
There are four types of braced frames. Two of them, labeled BF2 and BF3, are light braced frames around the atrium staircase. They both span from Level 100 to Level 400 (ground floor) and provide lateral support for the staircase only. The other two, labeled BF1 and BF4, are heavy braced frames to resist lateral movement for the entire building. Two BF1s brace against E-W deflection around an elevator shaft in the northern half of the building, while the lone BF4 braces against E-W deflection in the southern half. Frame elevations are shown below in Figure 3.
Figure 3: Braced Frame Elevations
Brian Genduso – Technical Report #3 November 14, 2003 Lateral System Analysis and Confirmation Design Page 4 of 32
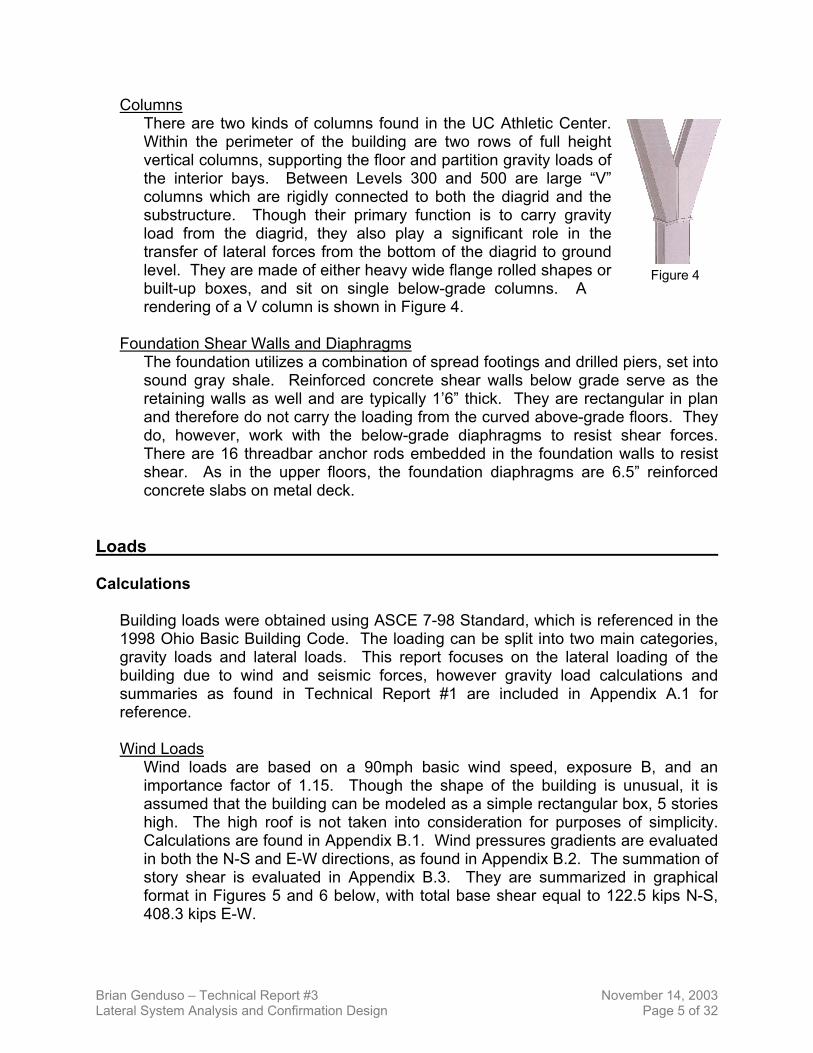
Columns There are two kinds of columns found in the UC Athletic Center. Within the perimeter of the building are two rows of full height vertical columns, supporting the floor and partition gravity loads of the interior bays. Between Levels 300 and 500 are large “V” columns which are rigidly connected to both the diagrid and the substructure. Though their primary function is to carry gravity load from the diagrid, they also play a significant role in the transfer of lateral forces from the bottom of the diagrid to ground level. They are made of either heavy wide flange rolled shapes or built-up boxes, and sit on single below-grade columns. A rendering of a V column is shown in Figure 4.
Figure 4
Foundation Shear Walls and Diaphragms
The foundation utilizes a combination of spread footings and drilled piers, set into sound gray shale. Reinforced concrete shear walls below grade serve as the retaining walls as well and are typically 1’6” thick. They are rectangular in plan and therefore do not carry the loading from the curved above-grade floors. They do, however, work with the below-grade diaphragms to resist shear forces. There are 16 threadbar anchor rods embedded in the foundation walls to resist shear. As in the upper floors, the foundation diaphragms are 6.5” reinforced concrete slabs on metal deck.
Loads Calculations
Building loads were obtained using ASCE 7-98 Standard, which is referenced in the 1998 Ohio Basic Building Code. The loading can be split into two main categories, gravity loads and lateral loads. This report focuses on the lateral loading of the building due to wind and seismic forces, however gravity load calculations and summaries as found in Technical Report #1 are included in Appendix A.1 for reference.
Wind Loads
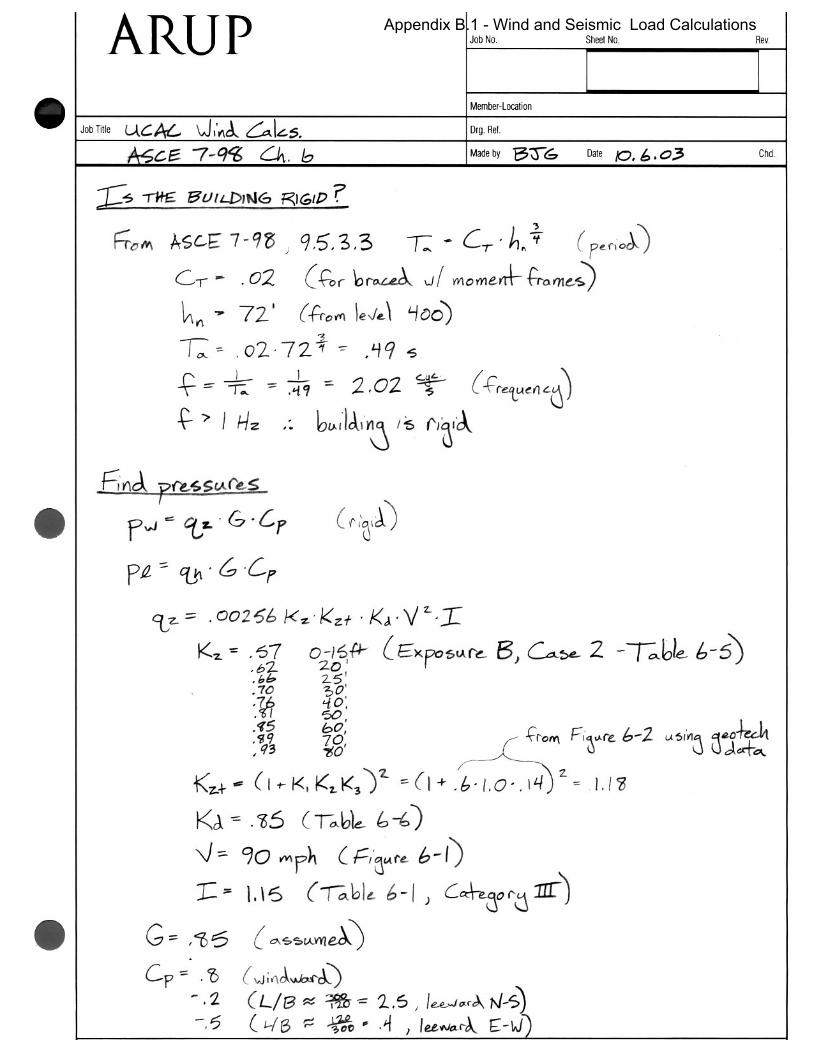
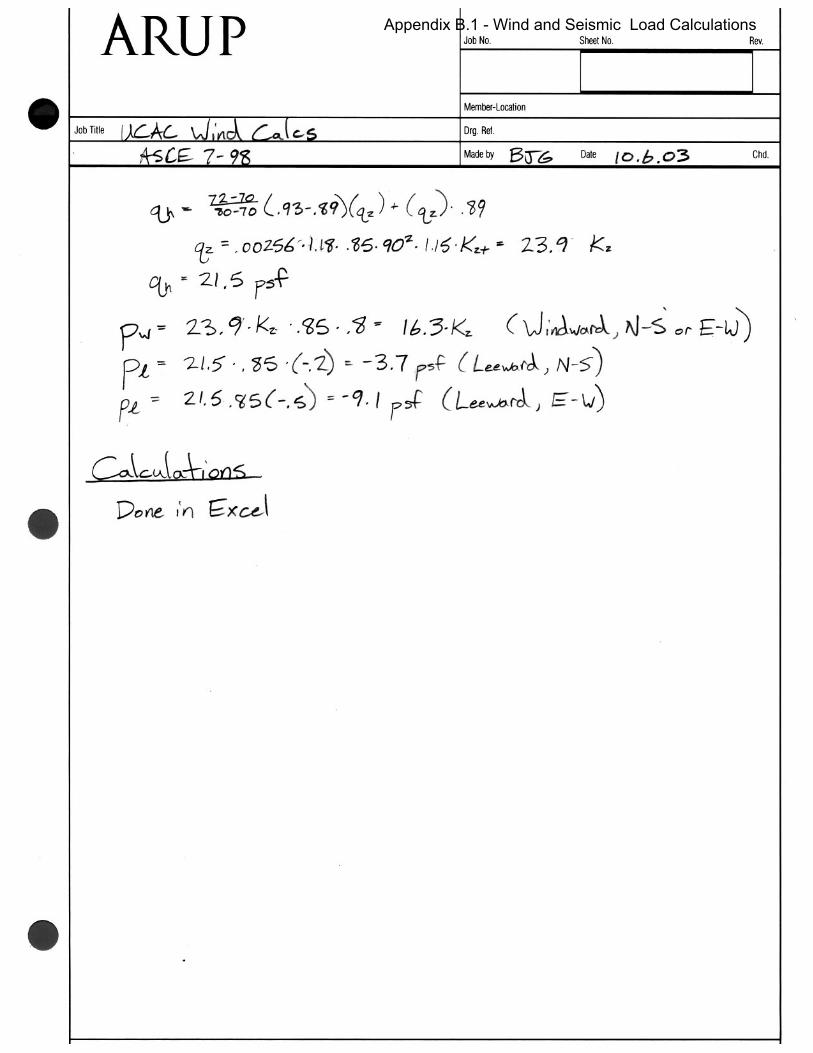
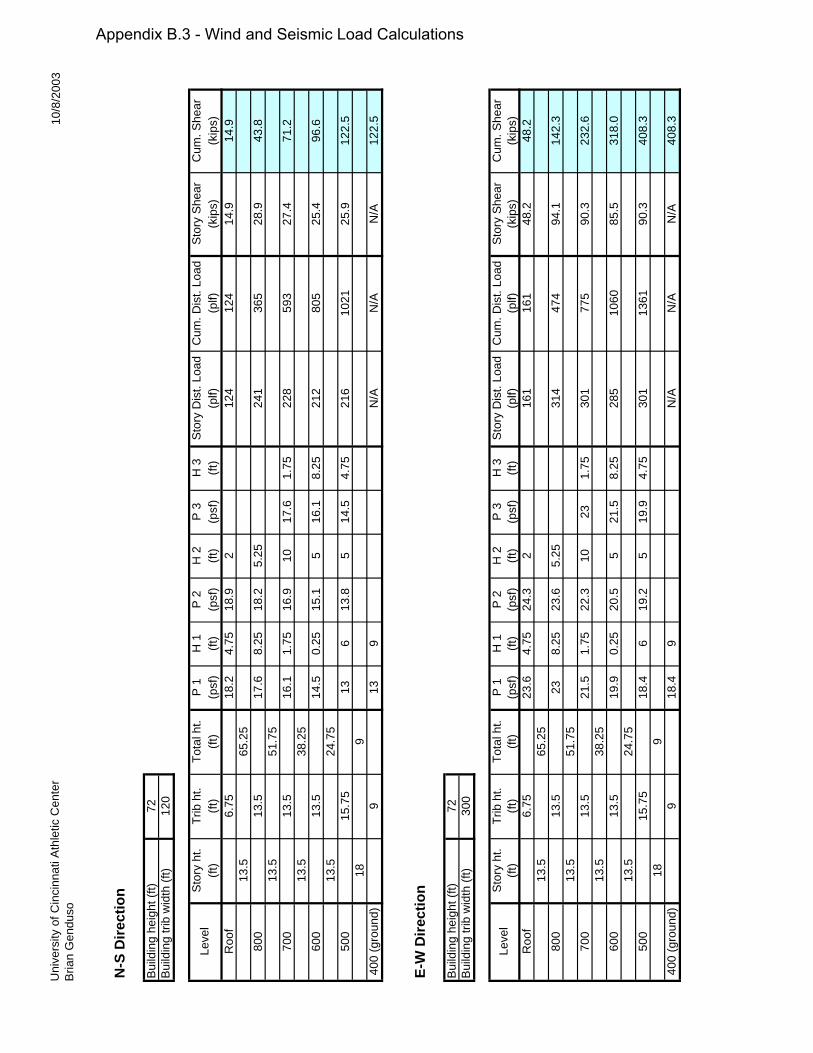
Wind loads are based on a 90mph basic wind speed, exposure B, and an importance factor of 1.15. Though the shape of the building is unusual, it is assumed that the building can be modeled as a simple rectangular box, 5 stories high. The high roof is not taken into consideration for purposes of simplicity. Calculations are found in Appendix B.1. Wind pressures gradients are evaluated in both the N-S and E-W directions, as found in Appendix B.2. The summation of story shear is evaluated in Appendix B.3. They are summarized in graphical format in Figures 5 and 6 below, with total base shear equal to 122.5 kips N-S, 408.3 kips E-W.
Brian Genduso – Technical Report #3 November 14, 2003 Lateral System Analysis and Confirmation Design Page 5 of 32
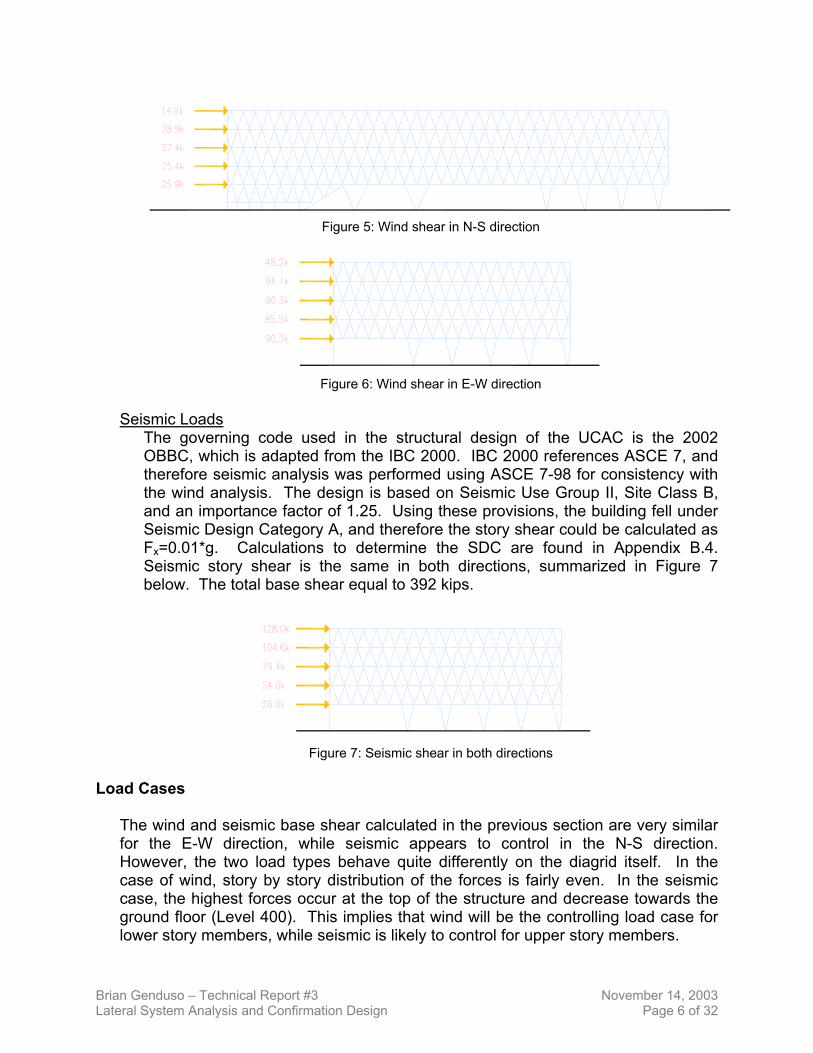
Figure 5: Wind shear in N-S direction
Figure 6: Wind shear in E-W direction
Seismic Loads
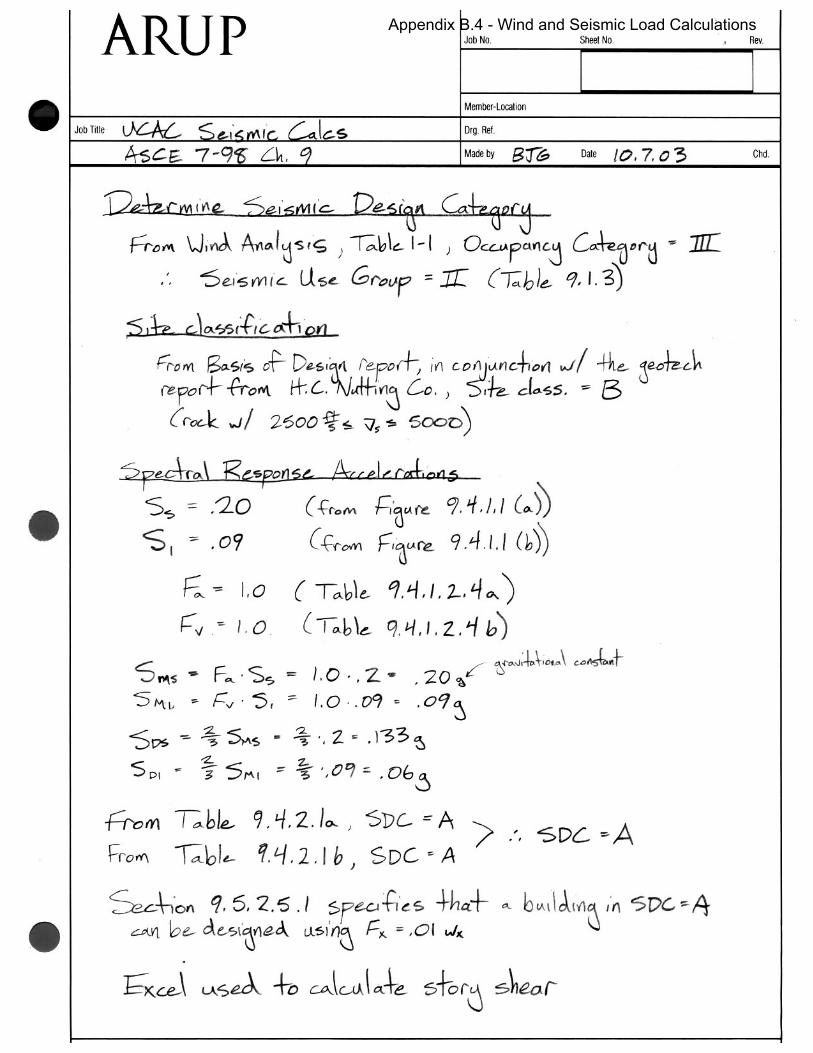
The governing code used in the structural design of the UCAC is the 2002 OBBC, which is adapted from the IBC 2000. IBC 2000 references ASCE 7, and therefore seismic analysis was performed using ASCE 7-98 for consistency with the wind analysis. The design is based on Seismic Use Group II, Site Class B, and an importance factor of 1.25. Using these provisions, the building fell under Seismic Design Category A, and therefore the story shear could be calculated as Fx=0.01*g. Calculations to determine the SDC are found in Appendix B.4. Seismic story shear is the same in both directions, summarized in Figure 7 below. The total base shear equal to 392 kips.
Figure 7: Seismic shear in both directions
Load Cases
The wind and seismic base shear calculated in the previous section are very similar for the E-W direction, while seismic appears to control in the N-S direction. However, the two load types behave quite differently on the diagrid itself. In the case of wind, story by story distribution of the forces is fairly even. In the seismic case, the highest forces occur at the top of the structure and decrease towards the ground floor (Level 400). This implies that wind will be the controlling load case for lower story members, while seismic is likely to control for upper story members.
Brian Genduso – Technical Report #3 November 14, 2003 Lateral System Analysis and Confirmation Design Page 6 of 32
For purposes of keeping the amount of computer modeling and calculations to a minimum only one load case will be evaluated. It is assumed that a thorough study of one particular loading situation will be sufficient to understand the concepts behind the lateral design, and that additional loading situations would simply reinforce those concepts. With that in mind, the West wind situation was chosen as the overall controlling load case. This case provides the highest base shear, which will be critical in evaluating Level 400 story drift and the braced frames. It also allows an opportunity to look at unbalanced loading and torsion issues. For the West wind load situation, there are four applicable cases from the Basic Load Combinations found in section 2.3 of ASCE 7-98. They will be used to check member sizes in subsequent sections. They are:
Case 1: 1.4D Case 2: 1.2D + 1.6L + 0.5S Case 3: 1.2D + 0.5L + 1.6S Case 4: 1.2D + 1.6W + 0.5L + 0.5S
Where D = Dead Load, L = Live Load, S = Snow Load, W = Wind Load
Distribution Above-grade
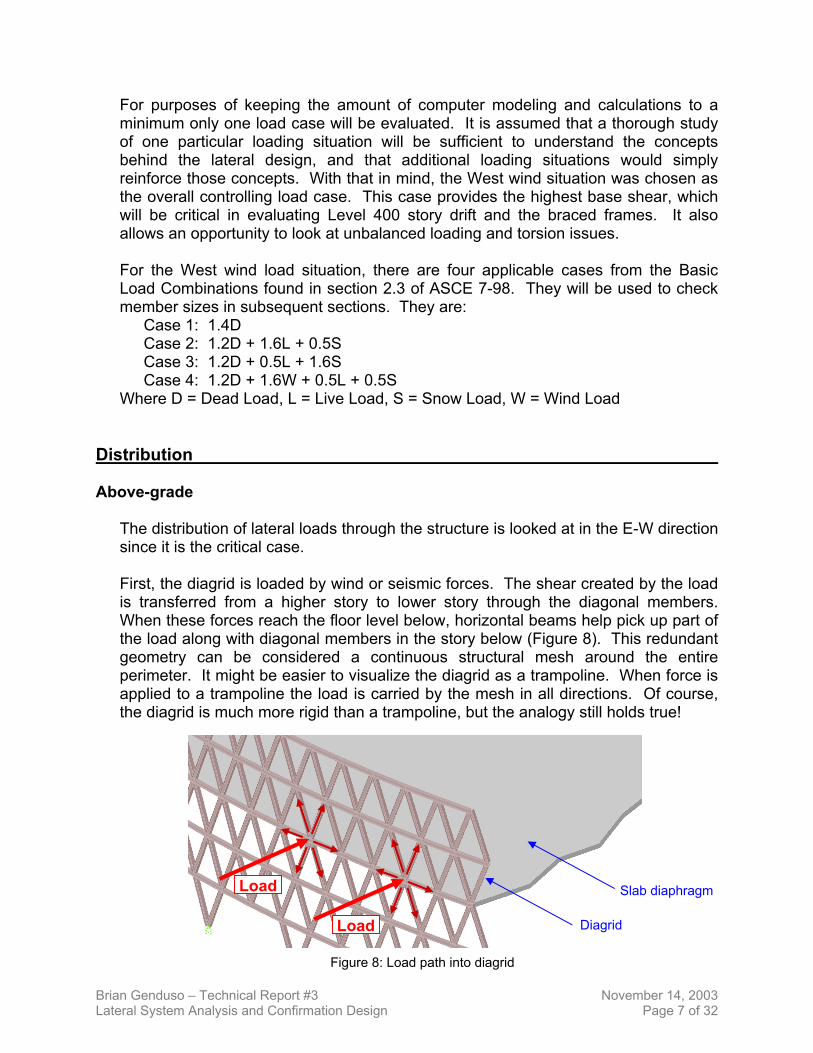
The distribution of lateral loads through the structure is looked at in the E-W direction since it is the critical case. First, the diagrid is loaded by wind or seismic forces. The shear created by the load is transferred from a higher story to lower story through the diagonal members. When these forces reach the floor level below, horizontal beams help pick up part of the load along with diagonal members in the story below (Figure 8). This redundant geometry can be considered a continuous structural mesh around the entire perimeter. It might be easier to visualize the diagrid as a trampoline. When force is applied to a trampoline the load is carried by the mesh in all directions. Of course, the diagrid is much more rigid than a trampoline, but the analogy still holds true!
Diagrid
Slab diaphragm L d
F
Brian Genduso – Technical Report #3 Lateral System Analysis and Confirmation
Load
oadLoa
igure 8: Load path into diagrid
November 14, 2003 Design Page 7 of 32
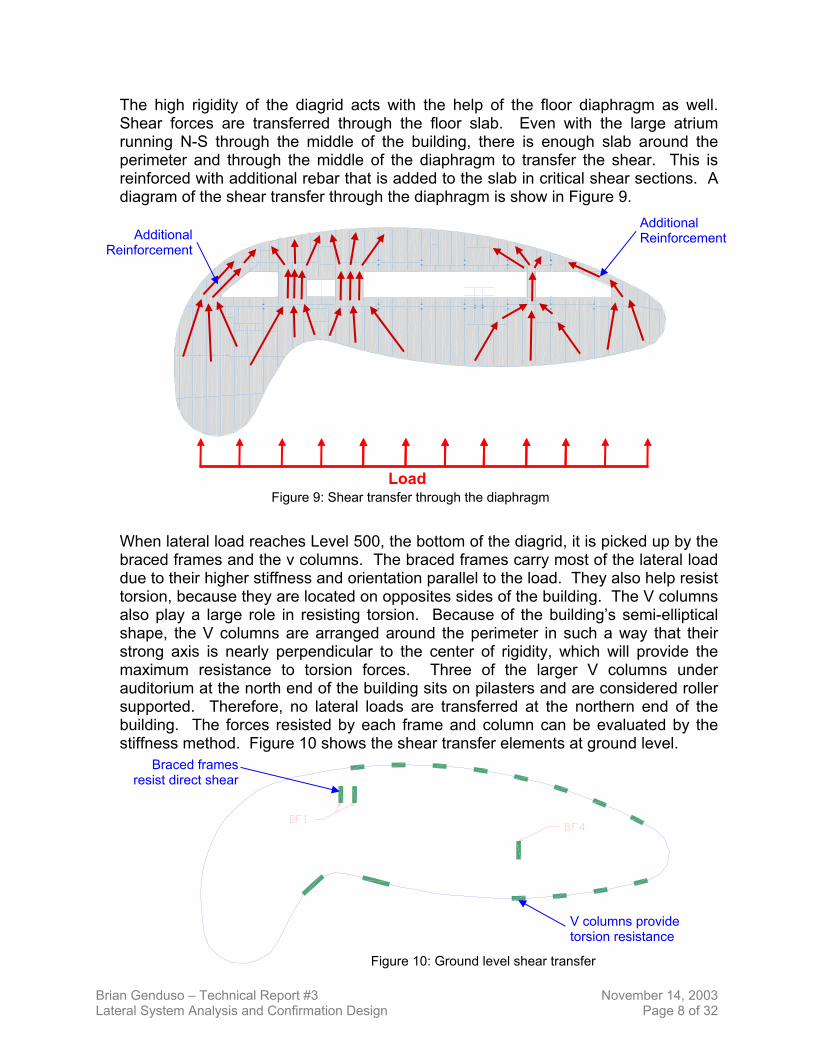
The high rigidity of the diagrid acts with the help of the floor diaphragm as well. Shear forces are transferred through the floor slab. Even with the large atrium running N-S through the middle of the building, there is enough slab around the perimeter and through the middle of the diaphragm to transfer the shear. This is reinforced with additional rebar that is added to the slab in critical shear sections. A diagram of the shear transfer through the diaphragm is show in Figure 9.
Additional Reinforcement Additional
Reinforcement
L
Figure 9: Shear tran When lateral load reaches Level 500, braced frames and the v columns. Thdue to their higher stiffness and orientatorsion, because they are located on oalso play a large role in resisting torsshape, the V columns are arranged astrong axis is nearly perpendicular tomaximum resistance to torsion forcauditorium at the north end of the buildsupported. Therefore, no lateral loadbuilding. The forces resisted by eachstiffness method. Figure 10 shows the Braced frames
resist direct shear
Fig
Brian Genduso – Technical Report #3 Lateral System Analysis and Confirmation Design
oad
sfer through the diaphragmthe bottom of the diagrid, it is picked up by the e braced frames carry most of the lateral load tion parallel to the load. They also help resist
pposites sides of the building. The V columns ion. Because of the building’s semi-elliptical round the perimeter in such a way that their the center of rigidity, which will provide the es. Three of the larger V columns under ing sits on pilasters and are considered roller s are transferred at the northern end of the frame and column can be evaluated by the shear transfer elements at ground level.
V columns provide torsion resistance
ure 10: Ground level shear transfer
November 14, 2003 Page 8 of 32
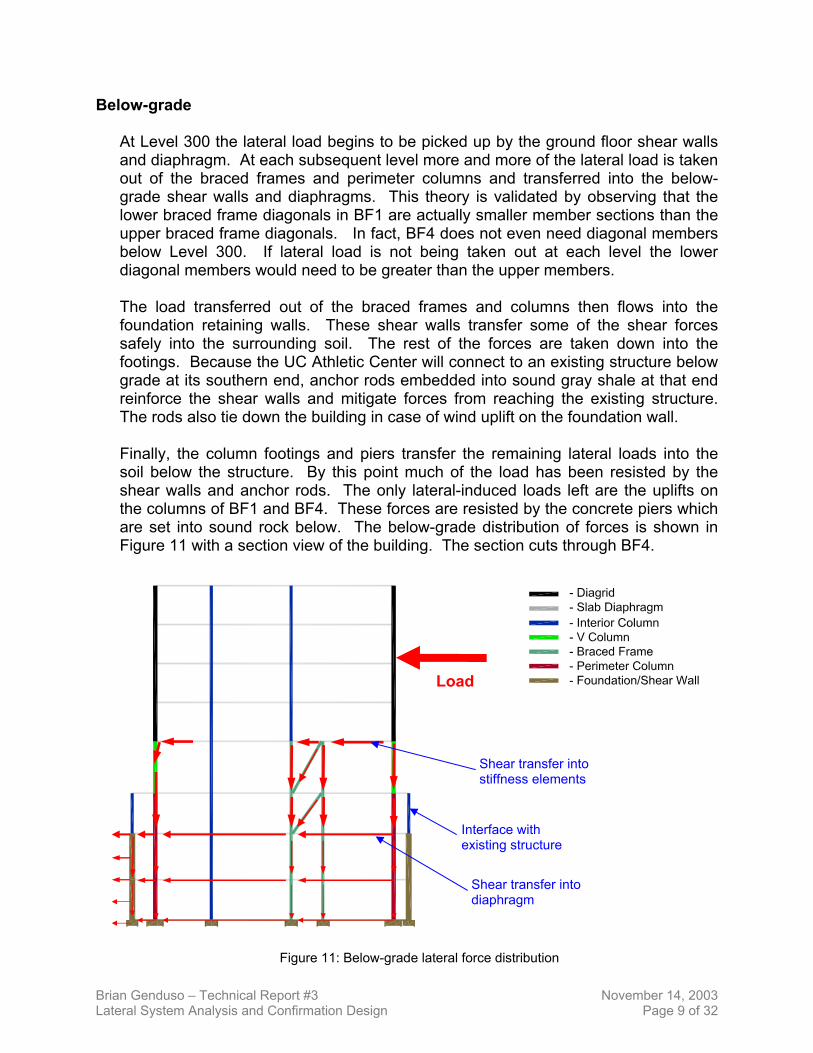
Below-grade At Level 300 the lateral load begins to be picked up by the ground floor shear walls and diaphragm. At each subsequent level more and more of the lateral load is taken out of the braced frames and perimeter columns and transferred into the below-grade shear walls and diaphragms. This theory is validated by observing that the lower braced frame diagonals in BF1 are actually smaller member sections than the upper braced frame diagonals. In fact, BF4 does not even need diagonal members below Level 300. If lateral load is not being taken out at each level the lower diagonal members would need to be greater than the upper members. The load transferred out of the braced frames and columns then flows into the foundation retaining walls. These shear walls transfer some of the shear forces safely into the surrounding soil. The rest of the forces are taken down into the footings. Because the UC Athletic Center will connect to an existing structure below grade at its southern end, anchor rods embedded into sound gray shale at that end reinforce the shear walls and mitigate forces from reaching the existing structure. The rods also tie down the building in case of wind uplift on the foundation wall. Finally, the column footings and piers transfer the remaining lateral loads into the soil below the structure. By this point much of the load has been resisted by the shear walls and anchor rods. The only lateral-induced loads left are the uplifts on the columns of BF1 and BF4. These forces are resisted by the concrete piers which are set into sound rock below. The below-grade distribution of forces is shown in Figure 11 with a section view of the building. The section cuts through BF4.
L
Figure 11: Below-grade late
Brian Genduso – Technical Report #3 Lateral System Analysis and Confirmation Design
oad
Shear transfer into stiffness elements
Interface with existing structure
Shear transfer into diaphragm
ral force distribution
November 14, 2003 Page 9 of 32
Lateral Analysis Theory
Much time was spent assessing the lateral behavior of the UC Athletic Center and how it should be modeled for a lateral analysis. In the end, though the building could have been simplified enough to perform hand calculations, it was determined that a more accurate 3-dimensional computer model is the best method of analysis. The flow of forces through the unique lateral system of the diagrid is difficult to visualize compared to a traditional box-shaped building. As you will see by the graphic-intensive nature of this report, a 3D model presents a clearer picture of the structure’s response to load, yet also provides an opportunity to check the results of the output using manual methods. Learning a new structural analysis software program is an additional benefit. ETABS was chosen to perform the analysis. ETABS is a non-linear, finite element pre and post-processing software package enhanced for the structural analysis of buildings. The benefits of ETABS include dxf file import, unlimited node and member input, graphical and tabular output options including forces and displacements, and pre-loaded steel member section properties. Even with these computational capabilities, the procedure for modeling the structure in ETABS was simplified. Only the above-grade diagrid structure was included. Foundation shear walls and braces would have to be a separate analysis. The procedure was done so that all of the separate required analyses (i.e. story drift, total drift, torsion, overturning) could be modeled individually. For instance, the diagrid drifts were treated separately from Level 400 drifts because of potential for torsion effects and disproportionately high Level 400 drifts. Also, because it was not determined how to accurately model braced frames and V columns at the same time, the stiffnesses of the V columns were assessed first, the braced frames second. The two were then put together to obtain total stiffness at the ground level. The model was constructed in the following fashion:
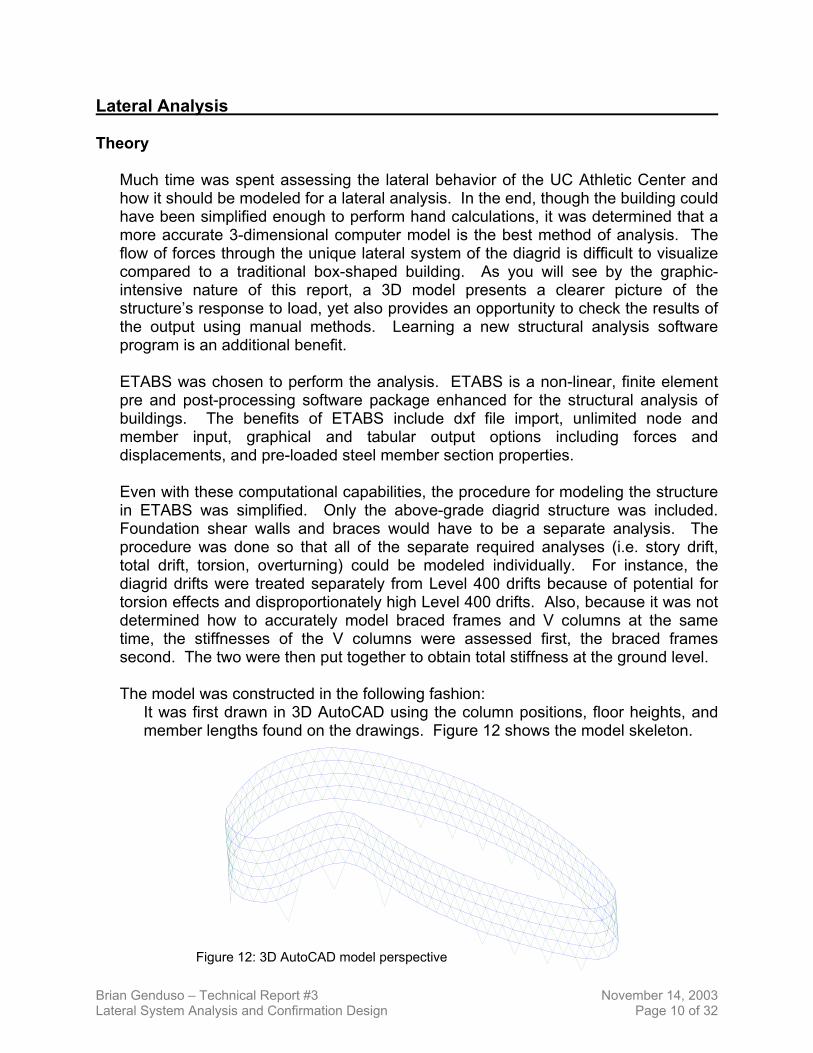
It was first drawn in 3D AutoCAD using the column positions, floor heights, and member lengths found on the drawings. Figure 12 shows the model skeleton.
Figure 12: 3D AutoCAD model perspective
Brian Genduso – Technical Report #3 November 14, 2003 Lateral System Analysis and Confirmation Design Page 10 of 32
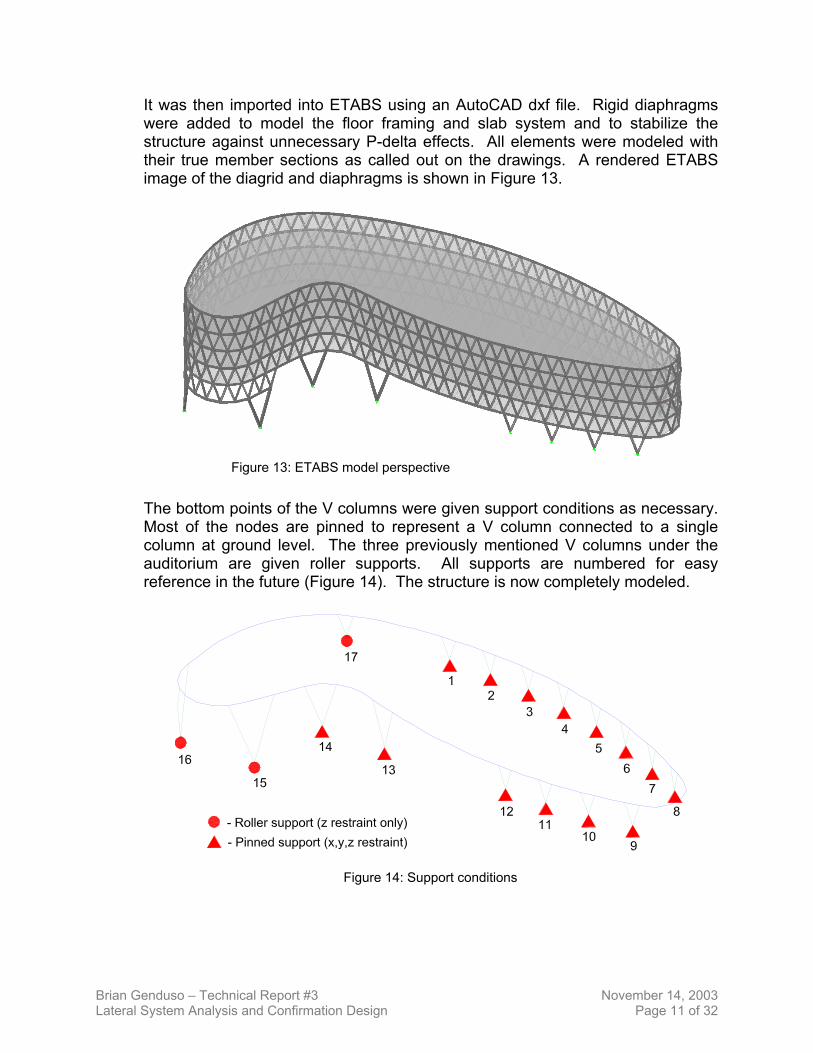
It was then imported into ETABS using an AutoCAD dxf file. Rigid diaphragms were added to model the floor framing and slab system and to stabilize the structure against unnecessary P-delta effects. All elements were modeled with their true member sections as called out on the drawings. A rendered ETABS image of the diagrid and diaphragms is shown in Figure 13.
Figure 13: ETABS model perspective
The bottom points of the V columns were given support conditions as necessary. Most of the nodes are pinned to represent a V column connected to a single column at ground level. The three previously mentioned V columns under the auditorium are given roller supports. All supports are numbered for easy reference in the future (Figure 14). The structure is now completely modeled.
Figure 14: Support conditions
Brian Genduso – Technical Report #3 November 14, 2003 Lateral System Analysis and Confirmation Design Page 11 of 32
Diagrid Story Drifts
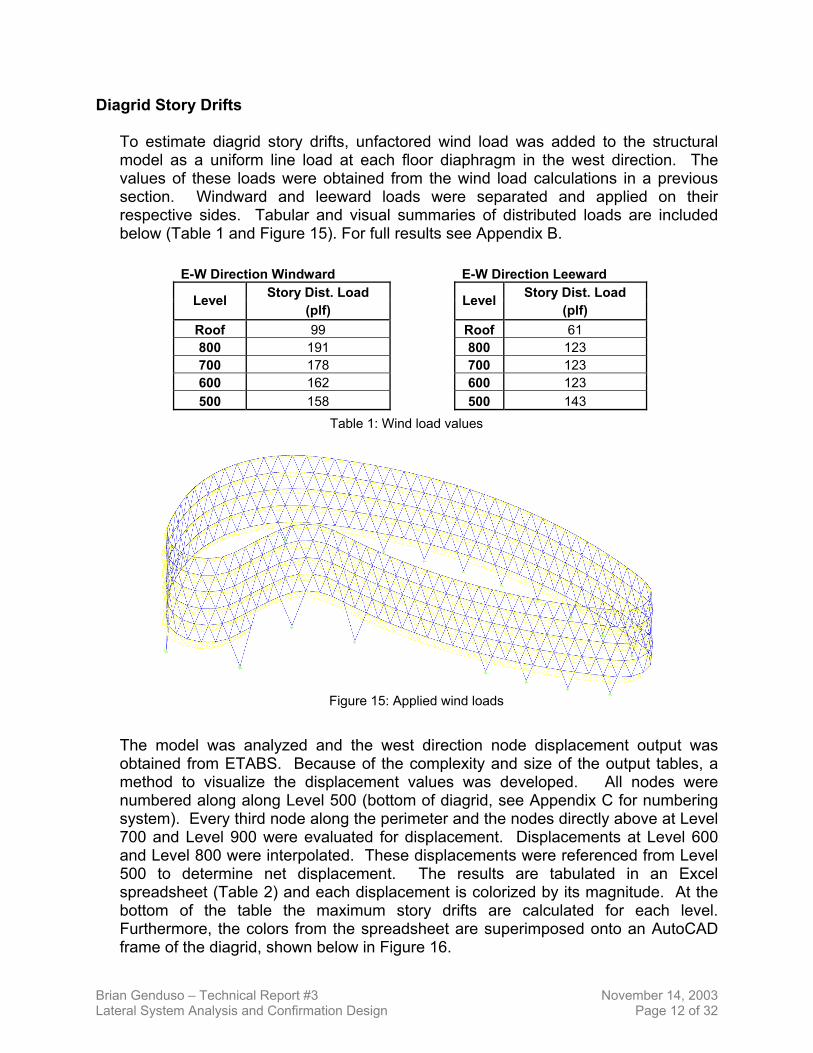
To estimate diagrid story drifts, unfactored wind load was added to the structural model as a uniform line load at each floor diaphragm in the west direction. The values of these loads were obtained from the wind load calculations in a previous section. Windward and leeward loads were separated and applied on their respective sides. Tabular and visual summaries of distributed loads are included below (Table 1 and Figure 15). For full results see Appendix B.
E-W Direction Windward E-W Direction Leeward
Story Dist. Load Story Dist. Load Level (plf)
Level(plf)
Roof 99 Roof 61 800 191 800 123 700 178 700 123 600 162 600 123 500 158 500 143
Table 1: Wind load values
Figure 15: Applied wind loads
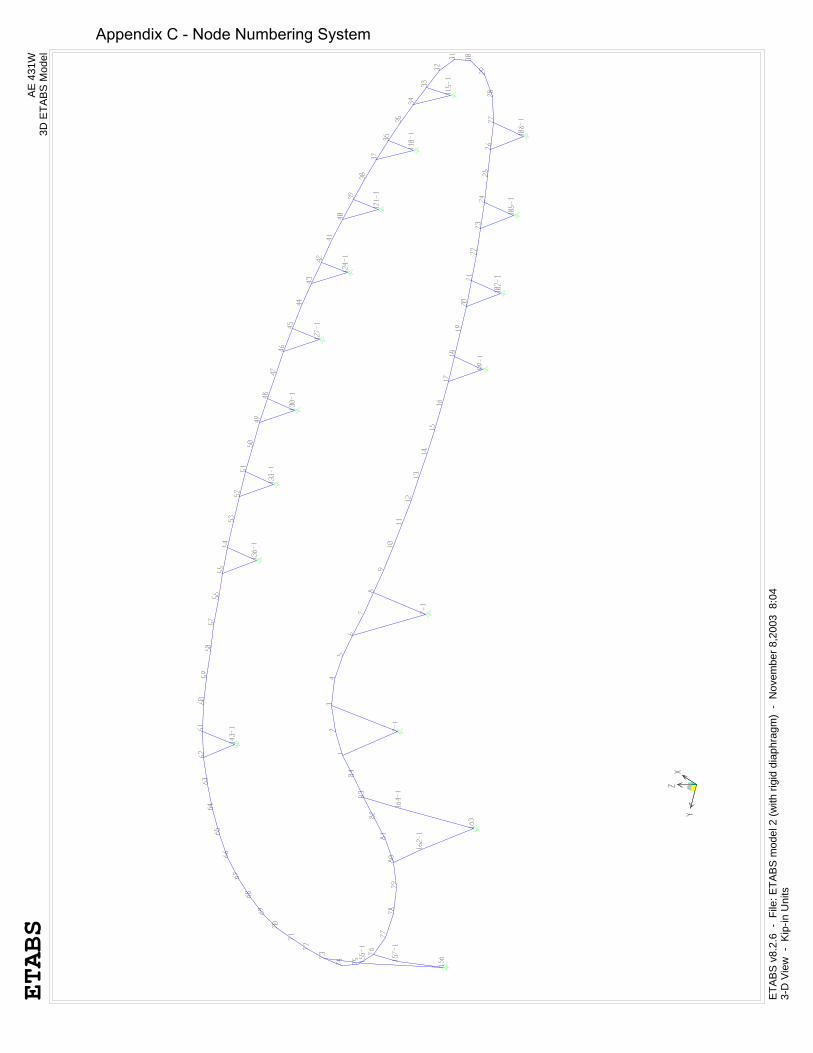
The model was analyzed and the west direction node displacement output was obtained from ETABS. Because of the complexity and size of the output tables, a method to visualize the displacement values was developed. All nodes were numbered along along Level 500 (bottom of diagrid, see Appendix C for numbering system). Every third node along the perimeter and the nodes directly above at Level 700 and Level 900 were evaluated for displacement. Displacements at Level 600 and Level 800 were interpolated. These displacements were referenced from Level 500 to determine net displacement. The results are tabulated in an Excel spreadsheet (Table 2) and each displacement is colorized by its magnitude. At the bottom of the table the maximum story drifts are calculated for each level. Furthermore, the colors from the spreadsheet are superimposed onto an AutoCAD frame of the diagrid, shown below in Figure 16.
Brian Genduso – Technical Report #3 November 14, 2003 Lateral System Analysis and Confirmation Design Page 12 of 32
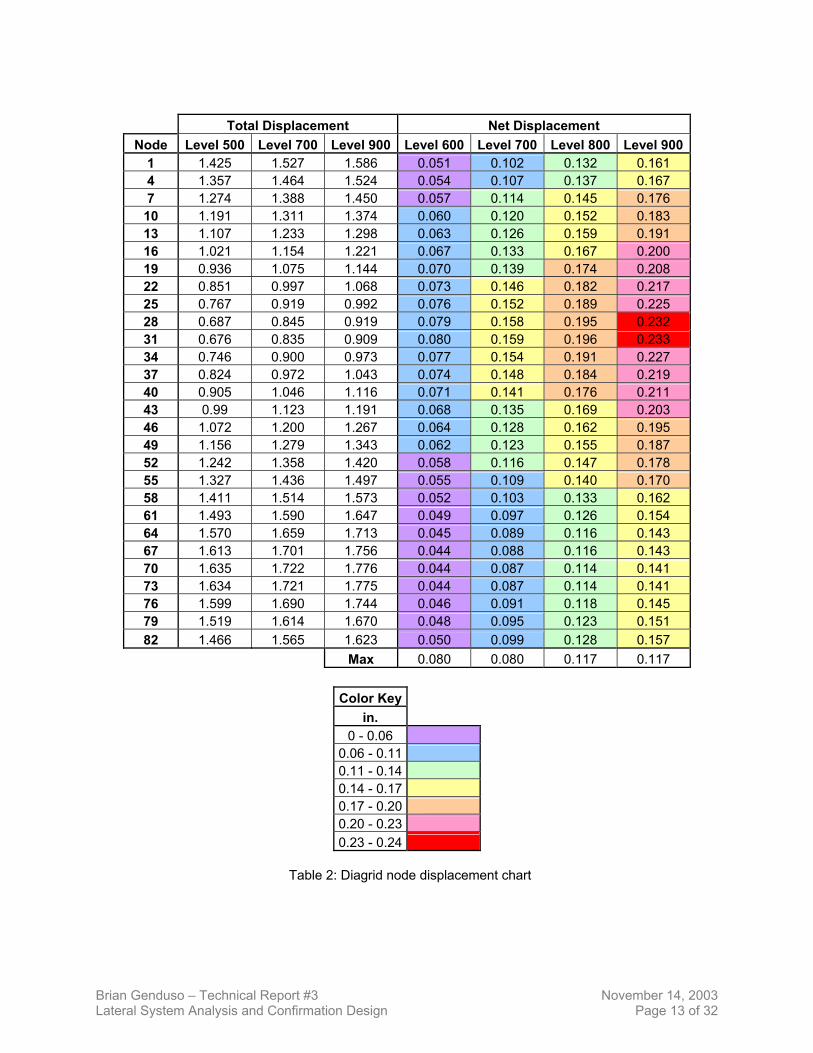
Total Displacement Net Displacement
Node Level 500 Level 700 Level 900 Level 600 Level 700 Level 800 Level 9001 1.425 1.527 1.586 0.051 0.102 0.132 0.161 4 1.357 1.464 1.524 0.054 0.107 0.137 0.167 7 1.274 1.388 1.450 0.057 0.114 0.145 0.176 10 1.191 1.311 1.374 0.060 0.120 0.152 0.183 13 1.107 1.233 1.298 0.063 0.126 0.159 0.191 16 1.021 1.154 1.221 0.067 0.133 0.167 0.200 19 0.936 1.075 1.144 0.070 0.139 0.174 0.208 22 0.851 0.997 1.068 0.073 0.146 0.182 0.217 25 0.767 0.919 0.992 0.076 0.152 0.189 0.225 28 0.687 0.845 0.919 0.079 0.158 0.195 0.232 31 0.676 0.835 0.909 0.080 0.159 0.196 0.233 34 0.746 0.900 0.973 0.077 0.154 0.191 0.227 37 0.824 0.972 1.043 0.074 0.148 0.184 0.219 40 0.905 1.046 1.116 0.071 0.141 0.176 0.211 43 0.99 1.123 1.191 0.068 0.135 0.169 0.203 46 1.072 1.200 1.267 0.064 0.128 0.162 0.195 49 1.156 1.279 1.343 0.062 0.123 0.155 0.187 52 1.242 1.358 1.420 0.058 0.116 0.147 0.178 55 1.327 1.436 1.497 0.055 0.109 0.140 0.170 58 1.411 1.514 1.573 0.052 0.103 0.133 0.162 61 1.493 1.590 1.647 0.049 0.097 0.126 0.154 64 1.570 1.659 1.713 0.045 0.089 0.116 0.143 67 1.613 1.701 1.756 0.044 0.088 0.116 0.143 70 1.635 1.722 1.776 0.044 0.087 0.114 0.141 73 1.634 1.721 1.775 0.044 0.087 0.114 0.141 76 1.599 1.690 1.744 0.046 0.091 0.118 0.145 79 1.519 1.614 1.670 0.048 0.095 0.123 0.151 82 1.466 1.565 1.623 0.050 0.099 0.128 0.157
Max 0.080 0.080 0.117 0.117
Color Key in.
0 - 0.06 0.06 - 0.11 0.11 - 0.14 0.14 - 0.17 0.17 - 0.20 0.20 - 0.23 0.23 - 0.24
Table 2: Diagrid node displacement chart
Brian Genduso – Technical Report #3 November 14, 2003 Lateral System Analysis and Confirmation Design Page 13 of 32
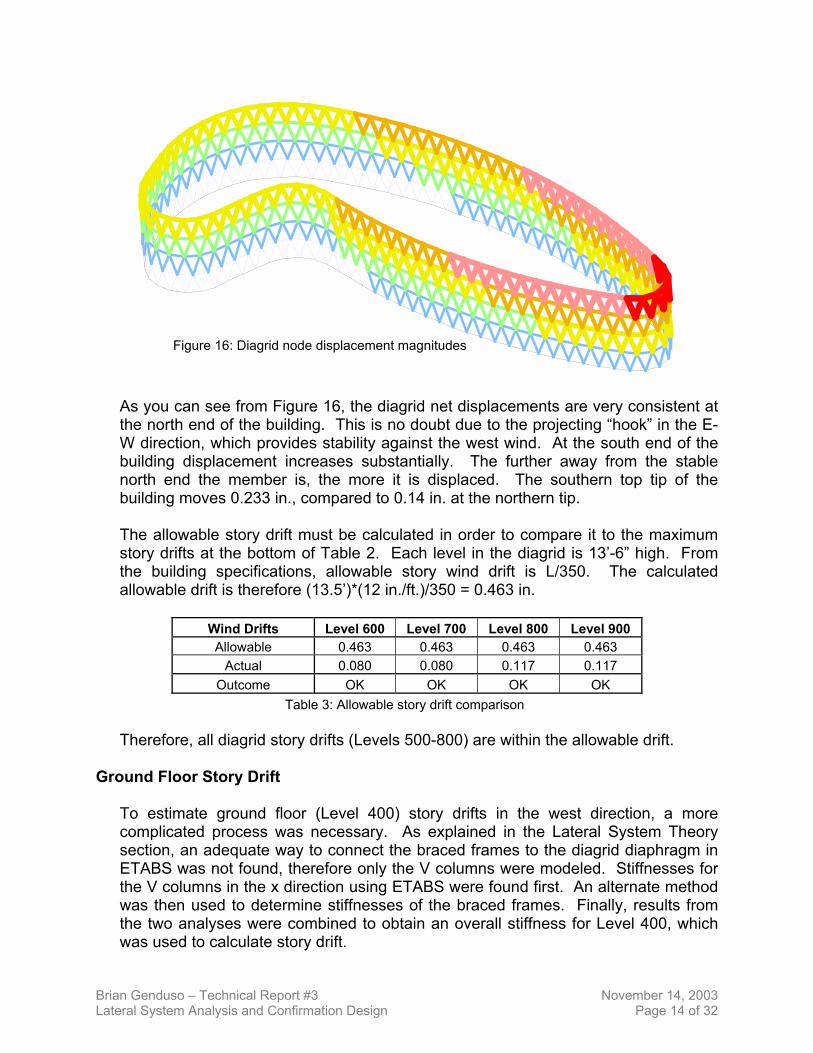
Figure 16: Diagrid node displacement magnitudes
As you can see from Figure 16, the diagrid net displacements are very consistent at the north end of the building. This is no doubt due to the projecting “hook” in the E-W direction, which provides stability against the west wind. At the south end of the building displacement increases substantially. The further away from the stable north end the member is, the more it is displaced. The southern top tip of the building moves 0.233 in., compared to 0.14 in. at the northern tip.
The allowable story drift must be calculated in order to compare it to the maximum story drifts at the bottom of Table 2. Each level in the diagrid is 13’-6” high. From the building specifications, allowable story wind drift is L/350. The calculated allowable drift is therefore (13.5’)*(12 in./ft.)/350 = 0.463 in.
Wind Drifts Level 600 Level 700 Level 800 Level 900 Allowable 0.463 0.463 0.463 0.463
Actual 0.080 0.080 0.117 0.117 Outcome OK OK OK OK
Table 3: Allowable story drift comparison
Therefore, all diagrid story drifts (Levels 500-800) are within the allowable drift.
Ground Floor Story Drift
To estimate ground floor (Level 400) story drifts in the west direction, a more complicated process was necessary. As explained in the Lateral System Theory section, an adequate way to connect the braced frames to the diagrid diaphragm in ETABS was not found, therefore only the V columns were modeled. Stiffnesses for the V columns in the x direction using ETABS were found first. An alternate method was then used to determine stiffnesses of the braced frames. Finally, results from the two analyses were combined to obtain an overall stiffness for Level 400, which was used to calculate story drift.
Brian Genduso – Technical Report #3 November 14, 2003 Lateral System Analysis and Confirmation Design Page 14 of 32
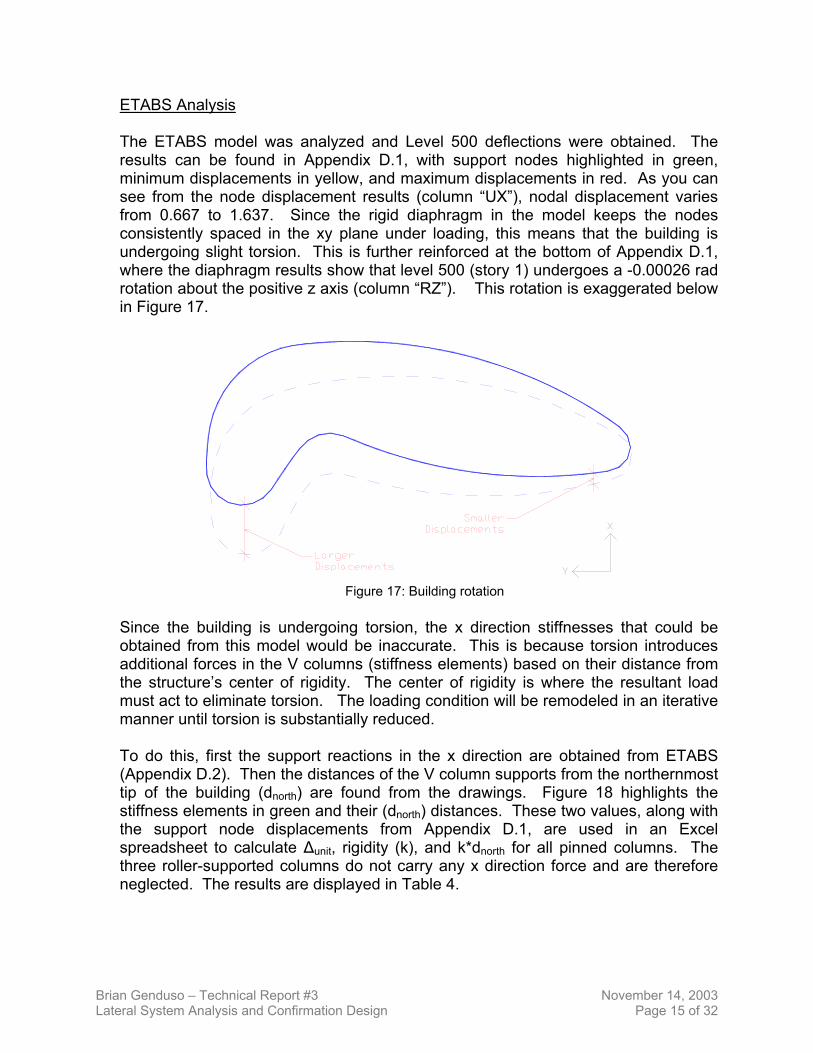
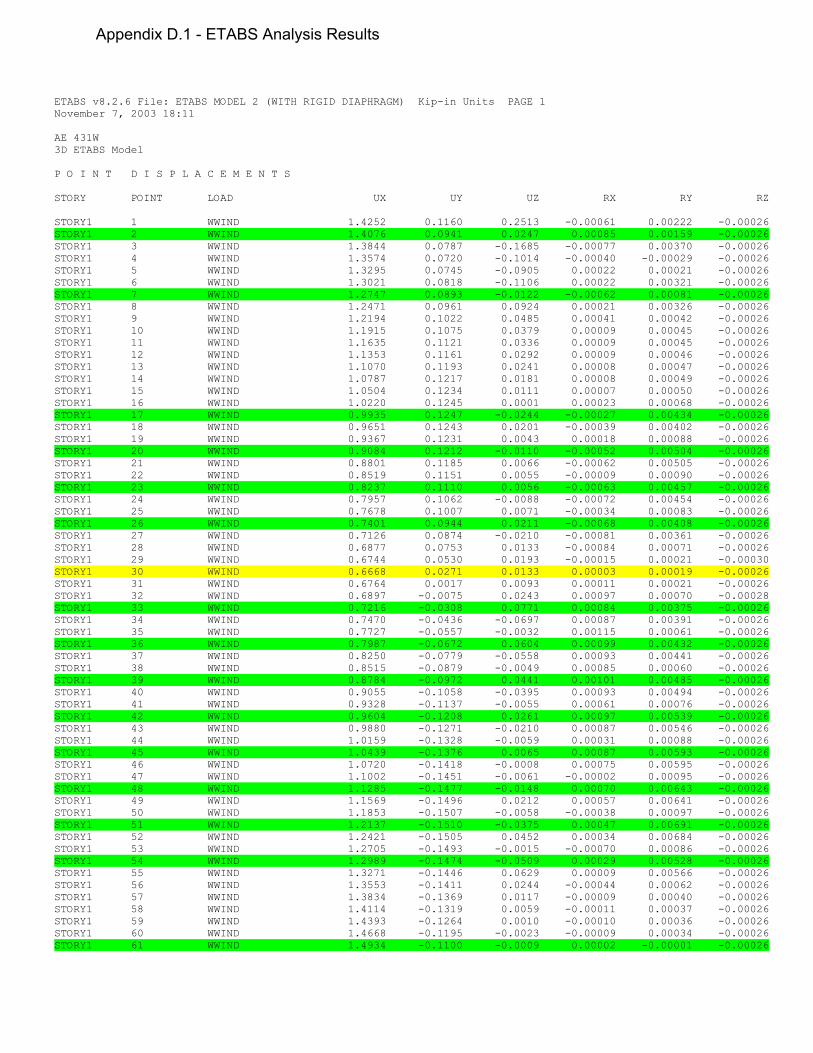
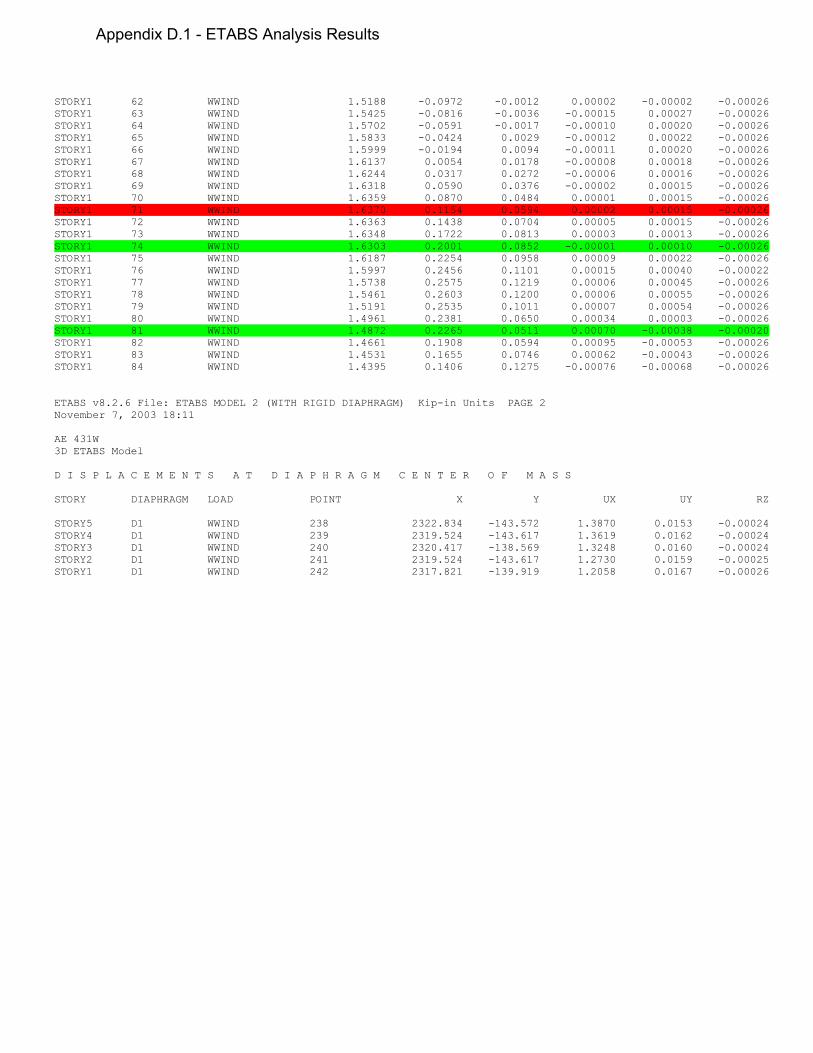
ETABS Analysis The ETABS model was analyzed and Level 500 deflections were obtained. The results can be found in Appendix D.1, with support nodes highlighted in green, minimum displacements in yellow, and maximum displacements in red. As you can see from the node displacement results (column “UX”), nodal displacement varies from 0.667 to 1.637. Since the rigid diaphragm in the model keeps the nodes consistently spaced in the xy plane under loading, this means that the building is undergoing slight torsion. This is further reinforced at the bottom of Appendix D.1, where the diaphragm results show that level 500 (story 1) undergoes a -0.00026 rad rotation about the positive z axis (column “RZ”). This rotation is exaggerated below in Figure 17.
Figure 17: Building rotation
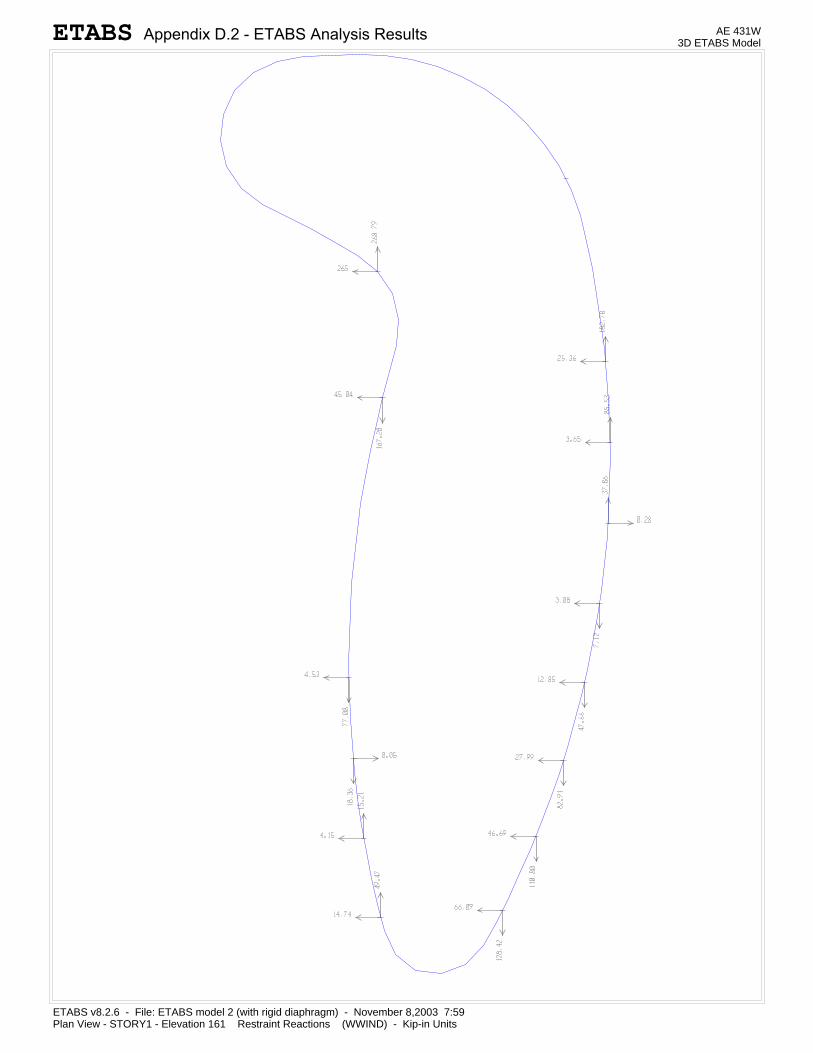
Since the building is undergoing torsion, the x direction stiffnesses that could be obtained from this model would be inaccurate. This is because torsion introduces additional forces in the V columns (stiffness elements) based on their distance from the structure’s center of rigidity. The center of rigidity is where the resultant load must act to eliminate torsion. The loading condition will be remodeled in an iterative manner until torsion is substantially reduced. To do this, first the support reactions in the x direction are obtained from ETABS (Appendix D.2). Then the distances of the V column supports from the northernmost tip of the building (dnorth) are found from the drawings. Figure 18 highlights the stiffness elements in green and their (dnorth) distances. These two values, along with the support node displacements from Appendix D.1, are used in an Excel spreadsheet to calculate ∆unit, rigidity (k), and k*dnorth for all pinned columns. The three roller-supported columns do not carry any x direction force and are therefore neglected. The results are displayed in Table 4.
Brian Genduso – Technical Report #3 November 14, 2003 Lateral System Analysis and Confirmation Design Page 15 of 32
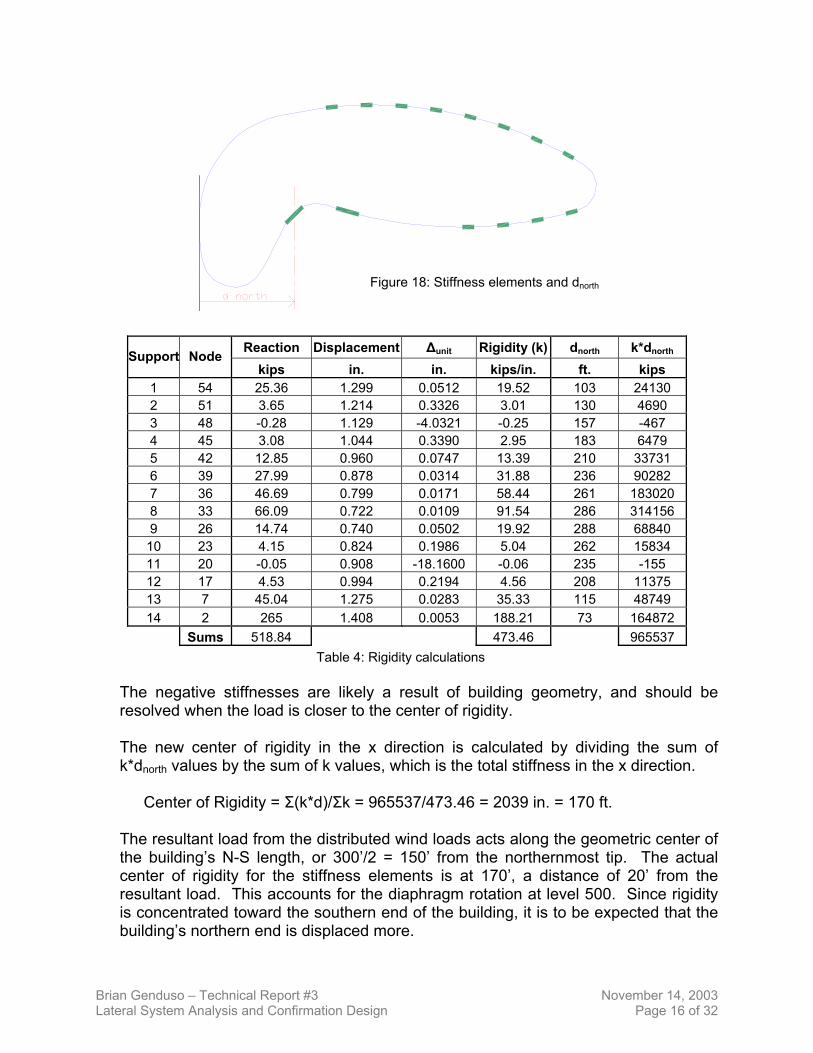
Figure 18: Stiffness elements and dnorth
Reaction Displacement ∆unit Rigidity (k) dnorth k*dnorthSupport Node
kips in. in. kips/in. ft. kips 1 54 25.36 1.299 0.0512 19.52 103 24130 2 51 3.65 1.214 0.3326 3.01 130 4690 3 48 -0.28 1.129 -4.0321 -0.25 157 -467 4 45 3.08 1.044 0.3390 2.95 183 6479 5 42 12.85 0.960 0.0747 13.39 210 33731 6 39 27.99 0.878 0.0314 31.88 236 90282 7 36 46.69 0.799 0.0171 58.44 261 183020 8 33 66.09 0.722 0.0109 91.54 286 314156 9 26 14.74 0.740 0.0502 19.92 288 68840
10 23 4.15 0.824 0.1986 5.04 262 15834 11 20 -0.05 0.908 -18.1600 -0.06 235 -155 12 17 4.53 0.994 0.2194 4.56 208 11375 13 7 45.04 1.275 0.0283 35.33 115 48749 14 2 265 1.408 0.0053 188.21 73 164872 Sums 518.84 473.46 965537
Table 4: Rigidity calculations
The negative stiffnesses are likely a result of building geometry, and should be resolved when the load is closer to the center of rigidity. The new center of rigidity in the x direction is calculated by dividing the sum of k*dnorth values by the sum of k values, which is the total stiffness in the x direction.
Center of Rigidity = Σ(k*d)/Σk = 965537/473.46 = 2039 in. = 170 ft. The resultant load from the distributed wind loads acts along the geometric center of the building’s N-S length, or 300’/2 = 150’ from the northernmost tip. The actual center of rigidity for the stiffness elements is at 170’, a distance of 20’ from the resultant load. This accounts for the diaphragm rotation at level 500. Since rigidity is concentrated toward the southern end of the building, it is to be expected that the building’s northern end is displaced more.
Brian Genduso – Technical Report #3 November 14, 2003 Lateral System Analysis and Confirmation Design Page 16 of 32
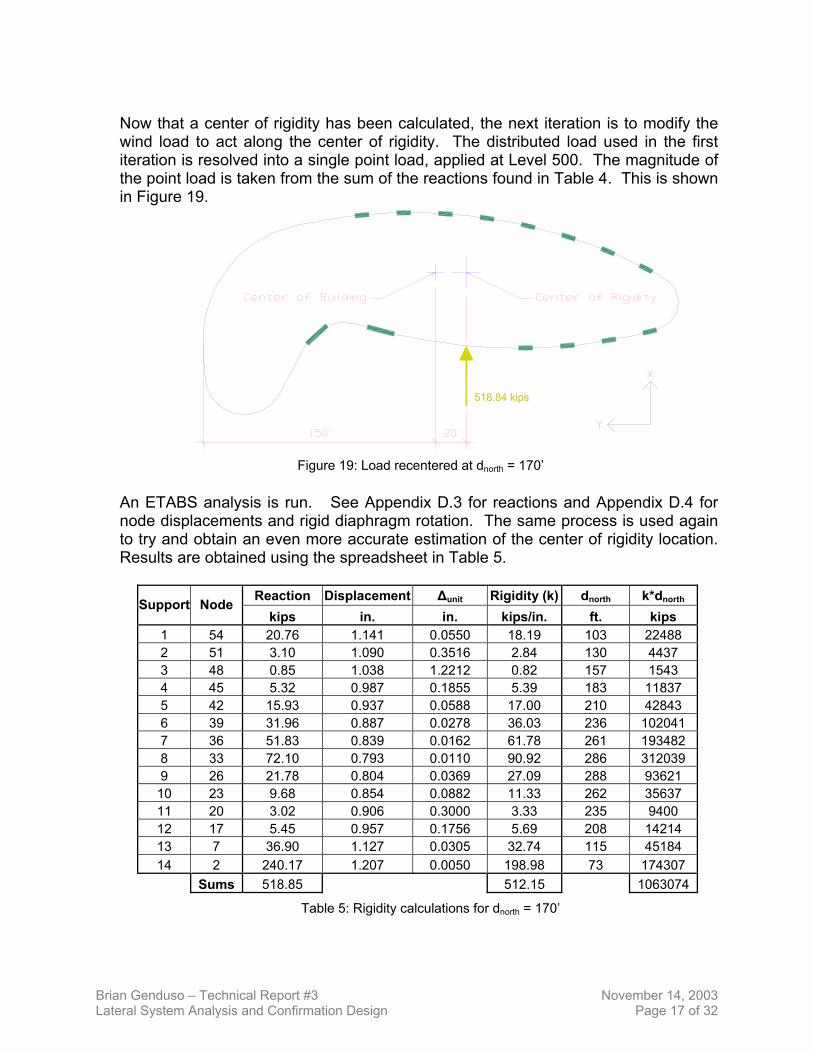
Now that a center of rigidity has been calculated, the next iteration is to modify the wind load to act along the center of rigidity. The distributed load used in the first iteration is resolved into a single point load, applied at Level 500. The magnitude of the point load is taken from the sum of the reactions found in Table 4. This is shown in Figure 19.
Figure 19: Load recentered at dnorth = 170’
An ETABS analysis is run. See Appendix D.3 for reactions and Appendix D.4 for node displacements and rigid diaphragm rotation. The same process is used again to try and obtain an even more accurate estimation of the center of rigidity location. Results are obtained using the spreadsheet in Table 5.
Reaction Displacement ∆unit Rigidity (k) dnorth k*dnorthSupport Node
kips in. in. kips/in. ft. kips 1 54 20.76 1.141 0.0550 18.19 103 22488 2 51 3.10 1.090 0.3516 2.84 130 4437 3 48 0.85 1.038 1.2212 0.82 157 1543 4 45 5.32 0.987 0.1855 5.39 183 11837 5 42 15.93 0.937 0.0588 17.00 210 42843 6 39 31.96 0.887 0.0278 36.03 236 102041 7 36 51.83 0.839 0.0162 61.78 261 193482 8 33 72.10 0.793 0.0110 90.92 286 312039 9 26 21.78 0.804 0.0369 27.09 288 93621 10 23 9.68 0.854 0.0882 11.33 262 35637 11 20 3.02 0.906 0.3000 3.33 235 9400 12 17 5.45 0.957 0.1756 5.69 208 14214 13 7 36.90 1.127 0.0305 32.74 115 45184 14 2 240.17 1.207 0.0050 198.98 73 174307 Sums 518.85 512.15 1063074
Table 5: Rigidity calculations for dnorth = 170’
Brian Genduso – Technical Report #3 November 14, 2003 Lateral System Analysis and Confirmation Design Page 17 of 32
As suspected, the rigidities are all positive now that the load has been moved. The new center of rigidity in the x direction is again calculated by dividing the sum of k*d values by the sum of k values.
Center of Rigidity = Σ(k*d)/Σk = 1063074/512.15 = 2076 in. = 173 ft. This new center of rigidity is now only 3 feet away from the previous center of rigidity, yet the rotation of the rigid diaphragm as found in Appendix D.4 remains fairly high, -0.00016 rad as opposed to -0.00026 rad from the first load situation. It is obvious that the method developed above is not going to converge at the true center of rigidity. This might be due to the 2D nature of V column stiffness. In this method only stiffness in the x direction has been considered, when in fact a large portion of the structure’s resistance is being resolved in the y direction. The above method, however, gives us a starting point to proceed further. By using a simple linear relationship, a new trial center of rigidity is obtained. The process is now based on the relative differences in diaphragm rotation. New trial locations are calculated, again iteratively, until a reasonable accuracy is found.
cd20'
0.00026rad))0.00016rad(0.00026(=
−−−− , dc = 52.0’
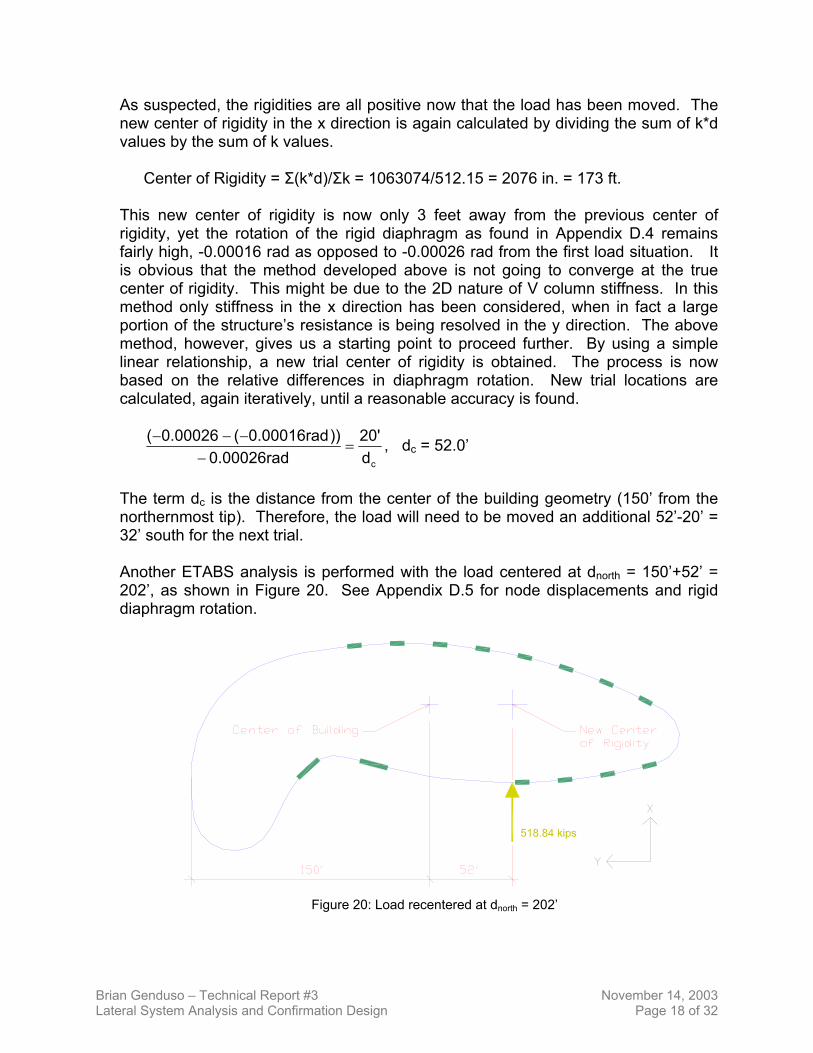
The term dc is the distance from the center of the building geometry (150’ from the northernmost tip). Therefore, the load will need to be moved an additional 52’-20’ = 32’ south for the next trial.
Another ETABS analysis is performed with the load centered at dnorth = 150’+52’ = 202’, as shown in Figure 20. See Appendix D.5 for node displacements and rigid diaphragm rotation.
Figure 20: Load recentered at dnorth = 202’
Brian Genduso – Technical Report #3 November 14, 2003 Lateral System Analysis and Confirmation Design Page 18 of 32
Torsion is now limited to -0.00007 rad as opposed to -0.00016 rad. One more iteration should be sufficient to obtain a direct load (i.e. no torsion) case. Again, a linear relationship is established.
cd52'
0.00026rad))0.00007rad(0.00026(=
−−−− , dc = 71.2’
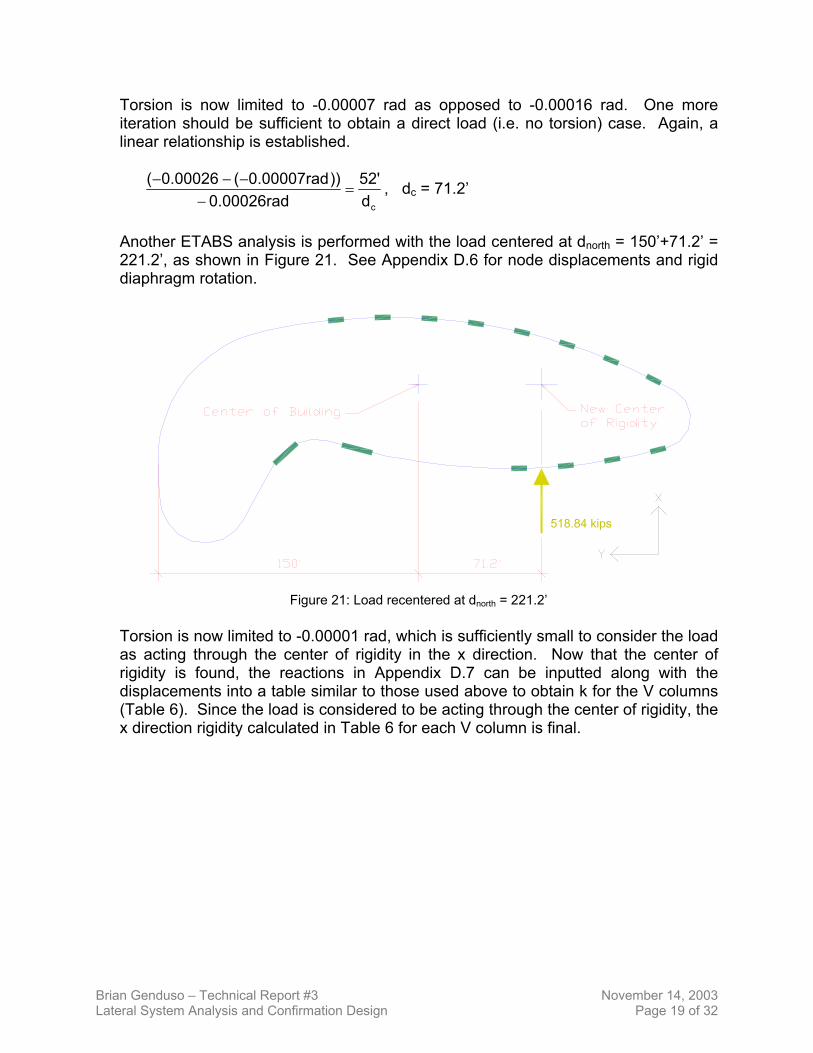
Another ETABS analysis is performed with the load centered at dnorth = 150’+71.2’ = 221.2’, as shown in Figure 21. See Appendix D.6 for node displacements and rigid diaphragm rotation.
Figure 21: Load recentered at dnorth = 221.2’
Torsion is now limited to -0.00001 rad, which is sufficiently small to consider the load as acting through the center of rigidity in the x direction. Now that the center of rigidity is found, the reactions in Appendix D.7 can be inputted along with the displacements into a table similar to those used above to obtain k for the V columns (Table 6). Since the load is considered to be acting through the center of rigidity, the x direction rigidity calculated in Table 6 for each V column is final.
Brian Genduso – Technical Report #3 November 14, 2003 Lateral System Analysis and Confirmation Design Page 19 of 32
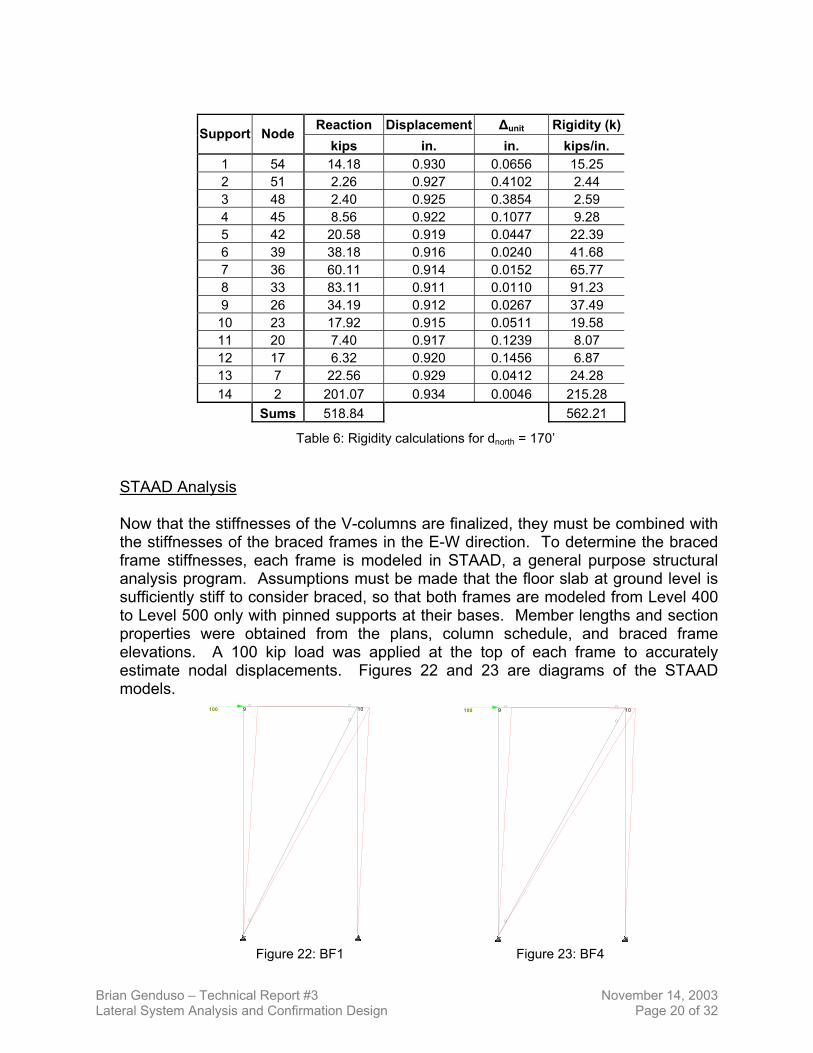
Reaction Displacement ∆unit Rigidity (k) Support Node
kips in. in. kips/in. 1 54 14.18 0.930 0.0656 15.25 2 51 2.26 0.927 0.4102 2.44 3 48 2.40 0.925 0.3854 2.59 4 45 8.56 0.922 0.1077 9.28 5 42 20.58 0.919 0.0447 22.39 6 39 38.18 0.916 0.0240 41.68 7 36 60.11 0.914 0.0152 65.77 8 33 83.11 0.911 0.0110 91.23 9 26 34.19 0.912 0.0267 37.49 10 23 17.92 0.915 0.0511 19.58 11 20 7.40 0.917 0.1239 8.07 12 17 6.32 0.920 0.1456 6.87 13 7 22.56 0.929 0.0412 24.28 14 2 201.07 0.934 0.0046 215.28 Sums 518.84 562.21
Table 6: Rigidity calculations for dnorth = 170’
STAAD Analysis Now that the stiffnesses of the V-columns are finalized, they must be combined with the stiffnesses of the braced frames in the E-W direction. To determine the braced frame stiffnesses, each frame is modeled in STAAD, a general purpose structural analysis program. Assumptions must be made that the floor slab at ground level is sufficiently stiff to consider braced, so that both frames are modeled from Level 400 to Level 500 only with pinned supports at their bases. Member lengths and section properties were obtained from the plans, column schedule, and braced frame elevations. A 100 kip load was applied at the top of each frame to accurately estimate nodal displacements. Figures 22 and 23 are diagrams of the STAAD models.
87
109
7 8
9100 10100
Figure 22: BF1 Figure 23: BF4
Brian Genduso – Technical Report #3 November 14, 2003 Lateral System Analysis and Confirmation Design Page 20 of 32
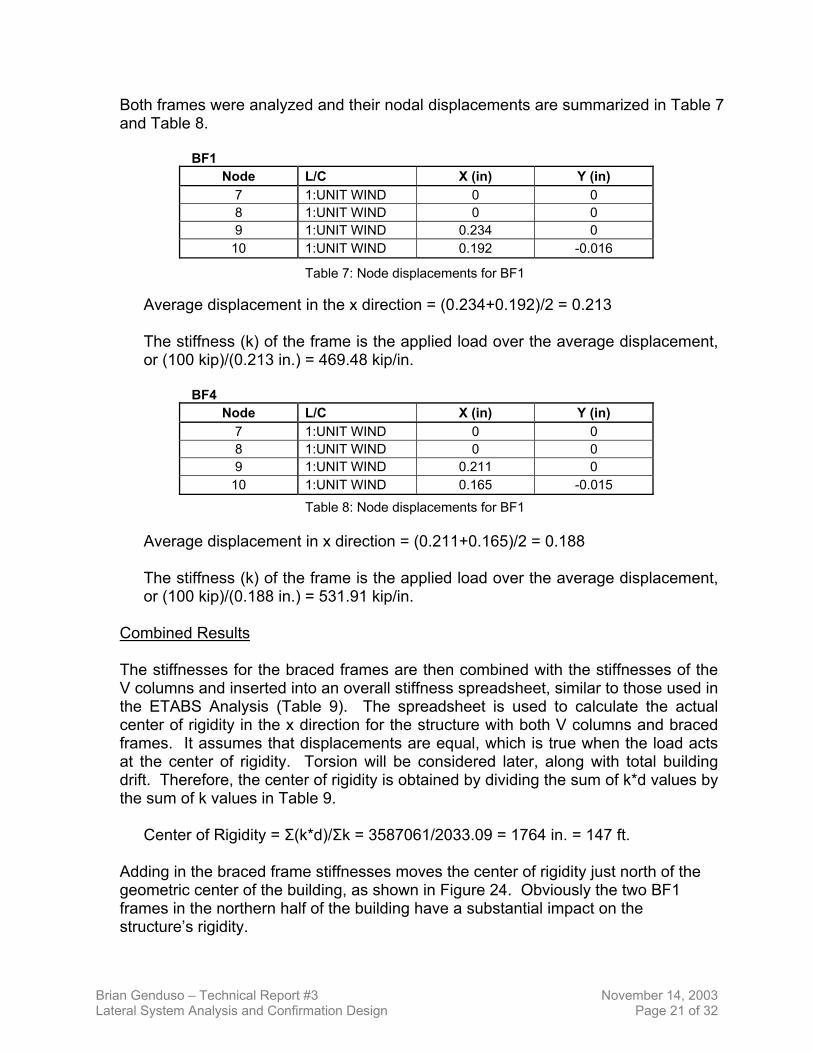
Both frames were analyzed and their nodal displacements are summarized in Table 7 and Table 8.
BF1
Node L/C X (in) Y (in) 7 1:UNIT WIND 0 0 8 1:UNIT WIND 0 0 9 1:UNIT WIND 0.234 0
10 1:UNIT WIND 0.192 -0.016 Table 7: Node displacements for BF1 Average displacement in the x direction = (0.234+0.192)/2 = 0.213 The stiffness (k) of the frame is the applied load over the average displacement, or (100 kip)/(0.213 in.) = 469.48 kip/in.
BF4
Node L/C X (in) Y (in) 7 1:UNIT WIND 0 0 8 1:UNIT WIND 0 0 9 1:UNIT WIND 0.211 0
10 1:UNIT WIND 0.165 -0.015 Table 8: Node displacements for BF1
Average displacement in x direction = (0.211+0.165)/2 = 0.188 The stiffness (k) of the frame is the applied load over the average displacement, or (100 kip)/(0.188 in.) = 531.91 kip/in.
Combined Results The stiffnesses for the braced frames are then combined with the stiffnesses of the V columns and inserted into an overall stiffness spreadsheet, similar to those used in the ETABS Analysis (Table 9). The spreadsheet is used to calculate the actual center of rigidity in the x direction for the structure with both V columns and braced frames. It assumes that displacements are equal, which is true when the load acts at the center of rigidity. Torsion will be considered later, along with total building drift. Therefore, the center of rigidity is obtained by dividing the sum of k*d values by the sum of k values in Table 9.
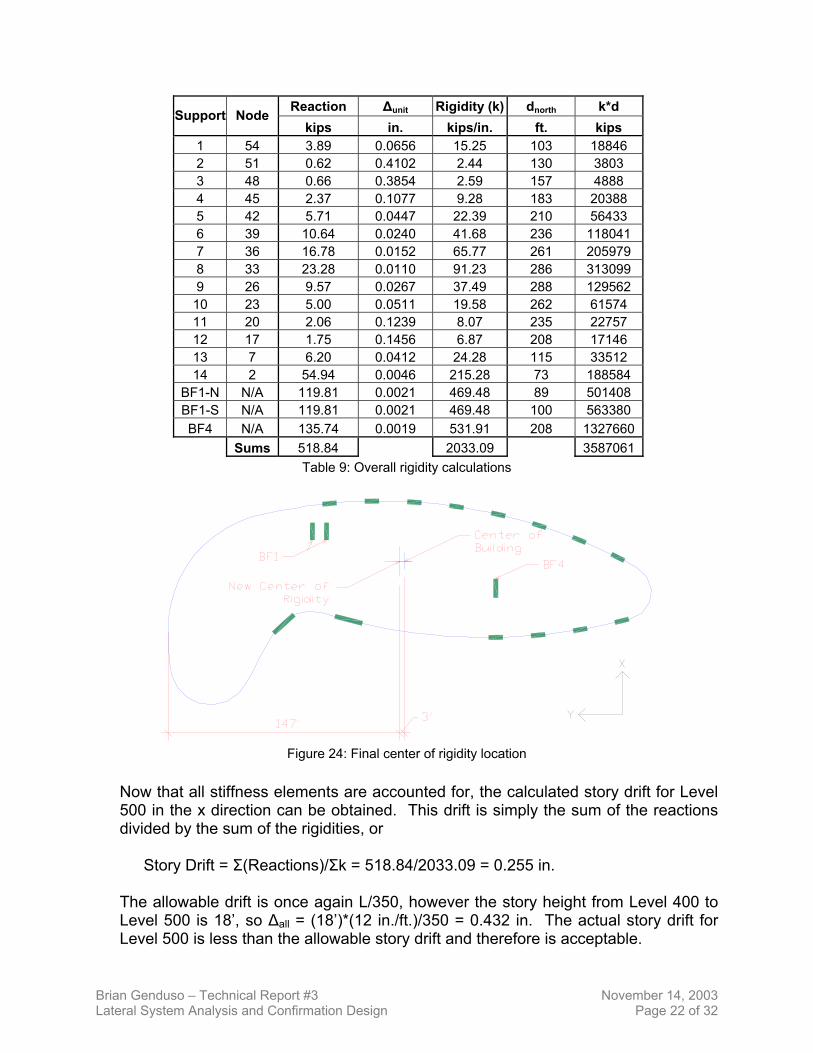
Center of Rigidity = Σ(k*d)/Σk = 3587061/2033.09 = 1764 in. = 147 ft. Adding in the braced frame stiffnesses moves the center of rigidity just north of the geometric center of the building, as shown in Figure 24. Obviously the two BF1 frames in the northern half of the building have a substantial impact on the structure’s rigidity.
Brian Genduso – Technical Report #3 November 14, 2003 Lateral System Analysis and Confirmation Design Page 21 of 32
Reaction ∆unit Rigidity (k) dnorth k*d Support Node kips in. kips/in. ft. kips
1 54 3.89 0.0656 15.25 103 18846 2 51 0.62 0.4102 2.44 130 3803 3 48 0.66 0.3854 2.59 157 4888 4 45 2.37 0.1077 9.28 183 20388 5 42 5.71 0.0447 22.39 210 56433 6 39 10.64 0.0240 41.68 236 118041 7 36 16.78 0.0152 65.77 261 205979 8 33 23.28 0.0110 91.23 286 313099 9 26 9.57 0.0267 37.49 288 129562 10 23 5.00 0.0511 19.58 262 61574 11 20 2.06 0.1239 8.07 235 22757 12 17 1.75 0.1456 6.87 208 17146 13 7 6.20 0.0412 24.28 115 33512 14 2 54.94 0.0046 215.28 73 188584
BF1-N N/A 119.81 0.0021 469.48 89 501408 BF1-S N/A 119.81 0.0021 469.48 100 563380 BF4 N/A 135.74 0.0019 531.91 208 1327660
Sums 518.84 2033.09 3587061 Table 9: Overall rigidity calculations
Figure 24: Final center of rigidity location
Now that all stiffness elements are accounted for, the calculated story drift for Level 500 in the x direction can be obtained. This drift is simply the sum of the reactions divided by the sum of the rigidities, or
Story Drift = Σ(Reactions)/Σk = 518.84/2033.09 = 0.255 in.
The allowable drift is once again L/350, however the story height from Level 400 to Level 500 is 18’, so ∆all = (18’)*(12 in./ft.)/350 = 0.432 in. The actual story drift for Level 500 is less than the allowable story drift and therefore is acceptable.
Brian Genduso – Technical Report #3 November 14, 2003 Lateral System Analysis and Confirmation Design Page 22 of 32
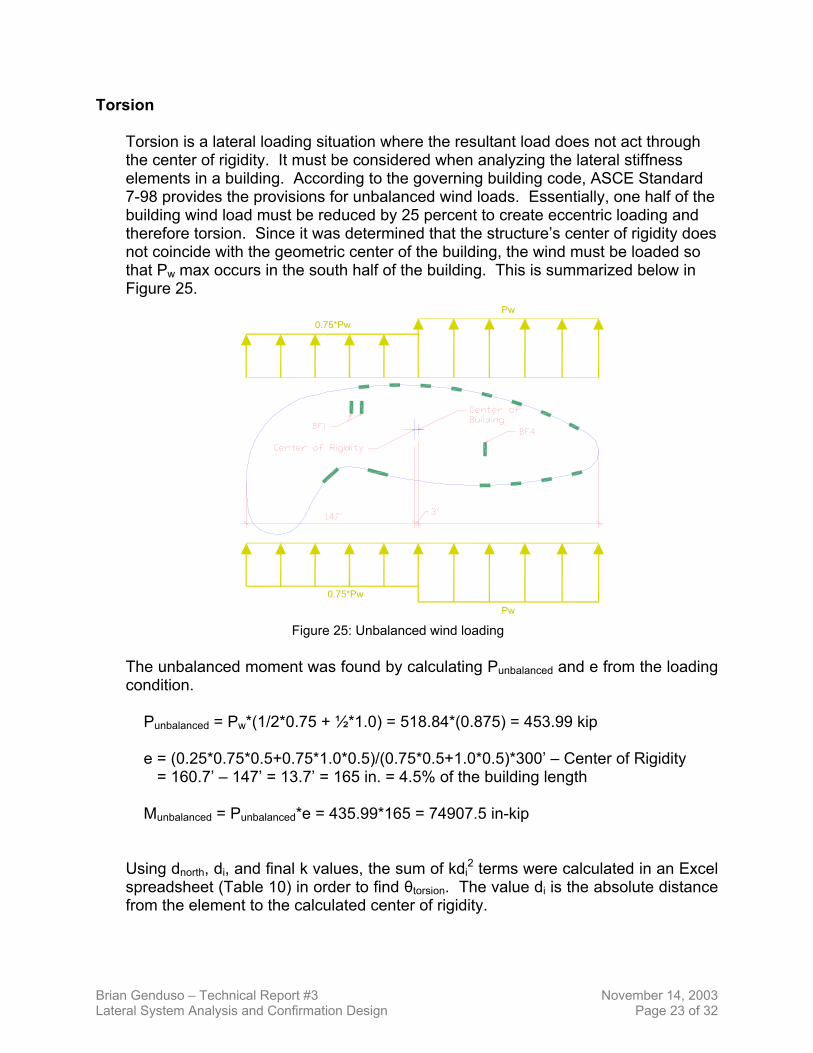
Torsion Torsion is a lateral loading situation where the resultant load does not act through the center of rigidity. It must be considered when analyzing the lateral stiffness elements in a building. According to the governing building code, ASCE Standard 7-98 provides the provisions for unbalanced wind loads. Essentially, one half of the building wind load must be reduced by 25 percent to create eccentric loading and therefore torsion. Since it was determined that the structure’s center of rigidity does not coincide with the geometric center of the building, the wind must be loaded so that Pw max occurs in the south half of the building. This is summarized below in Figure 25.
Figure 25: Unbalanced wind loading
The unbalanced moment was found by calculating Punbalanced and e from the loading condition.
Punbalanced = Pw*(1/2*0.75 + ½*1.0) = 518.84*(0.875) = 453.99 kip e = (0.25*0.75*0.5+0.75*1.0*0.5)/(0.75*0.5+1.0*0.5)*300’ – Center of Rigidity = 160.7’ – 147’ = 13.7’ = 165 in. = 4.5% of the building length
Munbalanced = Punbalanced*e = 435.99*165 = 74907.5 in-kip Using dnorth, di, and final k values, the sum of kdi
2 terms were calculated in an Excel spreadsheet (Table 10) in order to find θtorsion. The value di is the absolute distance from the element to the calculated center of rigidity.
Brian Genduso – Technical Report #3 November 14, 2003 Lateral System Analysis and Confirmation Design Page 23 of 32
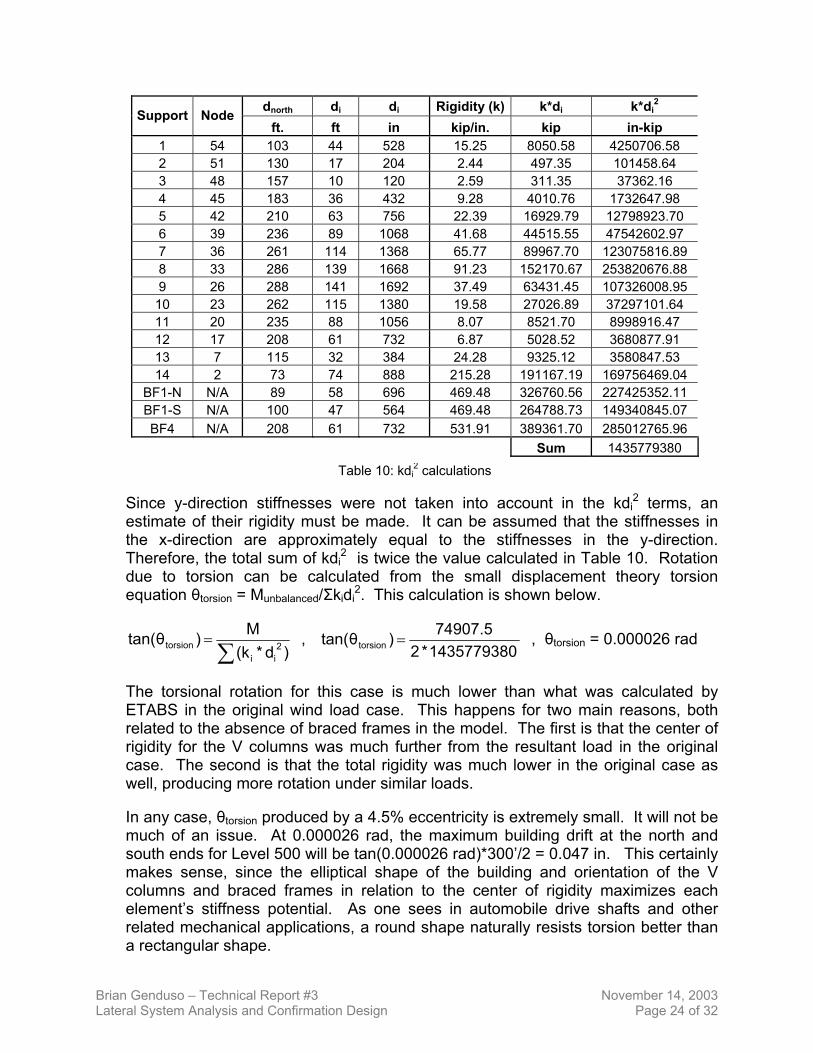
dnorth di di Rigidity (k) k*di k*di2
Support Node ft. ft in kip/in. kip in-kip
1 54 103 44 528 15.25 8050.58 4250706.58 2 51 130 17 204 2.44 497.35 101458.64 3 48 157 10 120 2.59 311.35 37362.16 4 45 183 36 432 9.28 4010.76 1732647.98 5 42 210 63 756 22.39 16929.79 12798923.70 6 39 236 89 1068 41.68 44515.55 47542602.97 7 36 261 114 1368 65.77 89967.70 123075816.89 8 33 286 139 1668 91.23 152170.67 253820676.88 9 26 288 141 1692 37.49 63431.45 107326008.95
10 23 262 115 1380 19.58 27026.89 37297101.64 11 20 235 88 1056 8.07 8521.70 8998916.47 12 17 208 61 732 6.87 5028.52 3680877.91 13 7 115 32 384 24.28 9325.12 3580847.53 14 2 73 74 888 215.28 191167.19 169756469.04
BF1-N N/A 89 58 696 469.48 326760.56 227425352.11 BF1-S N/A 100 47 564 469.48 264788.73 149340845.07 BF4 N/A 208 61 732 531.91 389361.70 285012765.96
Sum 1435779380 Table 10: kdi
2 calculations
Since y-direction stiffnesses were not taken into account in the kdi2 terms, an
estimate of their rigidity must be made. It can be assumed that the stiffnesses in the x-direction are approximately equal to the stiffnesses in the y-direction. Therefore, the total sum of kdi
2 is twice the value calculated in Table 10. Rotation due to torsion can be calculated from the small displacement theory torsion equation θtorsion = Munbalanced/Σkidi
2. This calculation is shown below.
∑=
)d*(kM)tan(θ 2
iitorsion ,
1435779380*274907.5)tan(θtorsion = , θtorsion = 0.000026 rad
The torsional rotation for this case is much lower than what was calculated by ETABS in the original wind load case. This happens for two main reasons, both related to the absence of braced frames in the model. The first is that the center of rigidity for the V columns was much further from the resultant load in the original case. The second is that the total rigidity was much lower in the original case as well, producing more rotation under similar loads. In any case, θtorsion produced by a 4.5% eccentricity is extremely small. It will not be much of an issue. At 0.000026 rad, the maximum building drift at the north and south ends for Level 500 will be tan(0.000026 rad)*300’/2 = 0.047 in. This certainly makes sense, since the elliptical shape of the building and orientation of the V columns and braced frames in relation to the center of rigidity maximizes each element’s stiffness potential. As one sees in automobile drive shafts and other related mechanical applications, a round shape naturally resists torsion better than a rectangular shape.
Brian Genduso – Technical Report #3 November 14, 2003 Lateral System Analysis and Confirmation Design Page 24 of 32
Total Building Drift
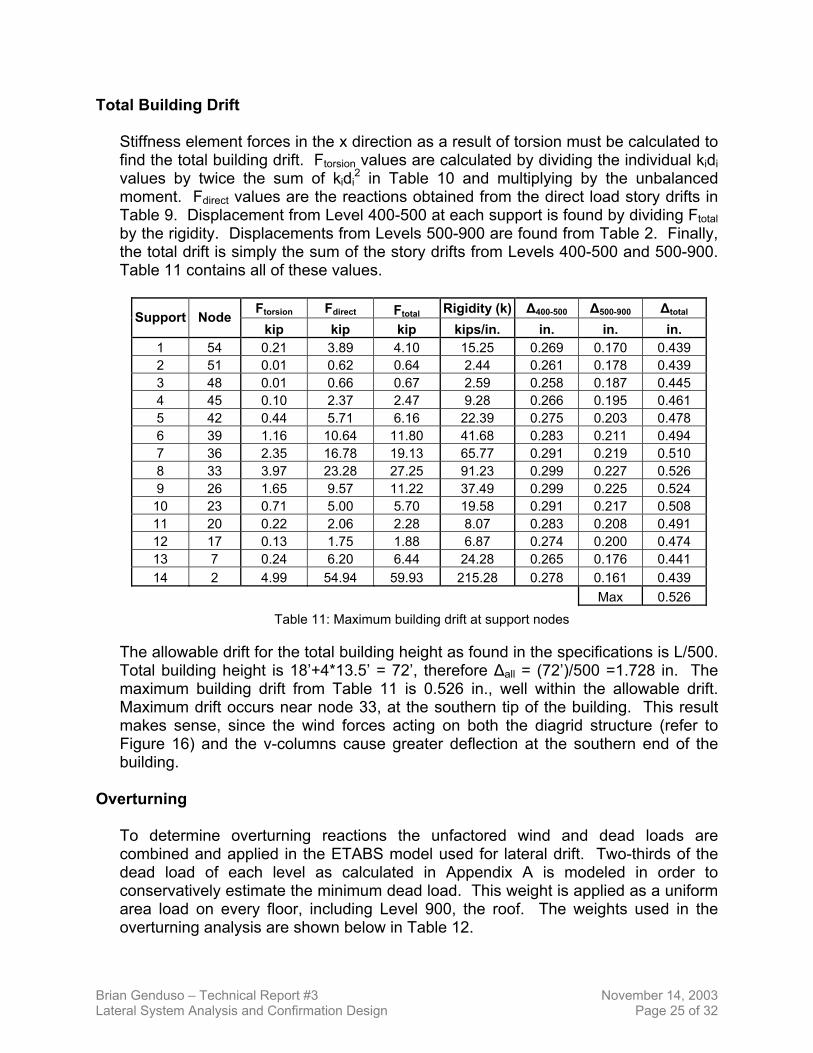
Stiffness element forces in the x direction as a result of torsion must be calculated to find the total building drift. Ftorsion values are calculated by dividing the individual kidi values by twice the sum of kidi
2 in Table 10 and multiplying by the unbalanced moment. Fdirect values are the reactions obtained from the direct load story drifts in Table 9. Displacement from Level 400-500 at each support is found by dividing Ftotal by the rigidity. Displacements from Levels 500-900 are found from Table 2. Finally, the total drift is simply the sum of the story drifts from Levels 400-500 and 500-900. Table 11 contains all of these values.
Ftorsion Fdirect Ftotal Rigidity (k) ∆400-500 ∆500-900 ∆totalSupport Node
kip kip kip kips/in. in. in. in. 1 54 0.21 3.89 4.10 15.25 0.269 0.170 0.439 2 51 0.01 0.62 0.64 2.44 0.261 0.178 0.439 3 48 0.01 0.66 0.67 2.59 0.258 0.187 0.445 4 45 0.10 2.37 2.47 9.28 0.266 0.195 0.461 5 42 0.44 5.71 6.16 22.39 0.275 0.203 0.478 6 39 1.16 10.64 11.80 41.68 0.283 0.211 0.494 7 36 2.35 16.78 19.13 65.77 0.291 0.219 0.510 8 33 3.97 23.28 27.25 91.23 0.299 0.227 0.526 9 26 1.65 9.57 11.22 37.49 0.299 0.225 0.524 10 23 0.71 5.00 5.70 19.58 0.291 0.217 0.508 11 20 0.22 2.06 2.28 8.07 0.283 0.208 0.491 12 17 0.13 1.75 1.88 6.87 0.274 0.200 0.474 13 7 0.24 6.20 6.44 24.28 0.265 0.176 0.441 14 2 4.99 54.94 59.93 215.28 0.278 0.161 0.439 Max 0.526
Table 11: Maximum building drift at support nodes
The allowable drift for the total building height as found in the specifications is L/500. Total building height is 18’+4*13.5’ = 72’, therefore ∆all = (72’)/500 =1.728 in. The maximum building drift from Table 11 is 0.526 in., well within the allowable drift. Maximum drift occurs near node 33, at the southern tip of the building. This result makes sense, since the wind forces acting on both the diagrid structure (refer to Figure 16) and the v-columns cause greater deflection at the southern end of the building.
Overturning
To determine overturning reactions the unfactored wind and dead loads are combined and applied in the ETABS model used for lateral drift. Two-thirds of the dead load of each level as calculated in Appendix A is modeled in order to conservatively estimate the minimum dead load. This weight is applied as a uniform area load on every floor, including Level 900, the roof. The weights used in the overturning analysis are shown below in Table 12.
Brian Genduso – Technical Report #3 November 14, 2003 Lateral System Analysis and Confirmation Design Page 25 of 32
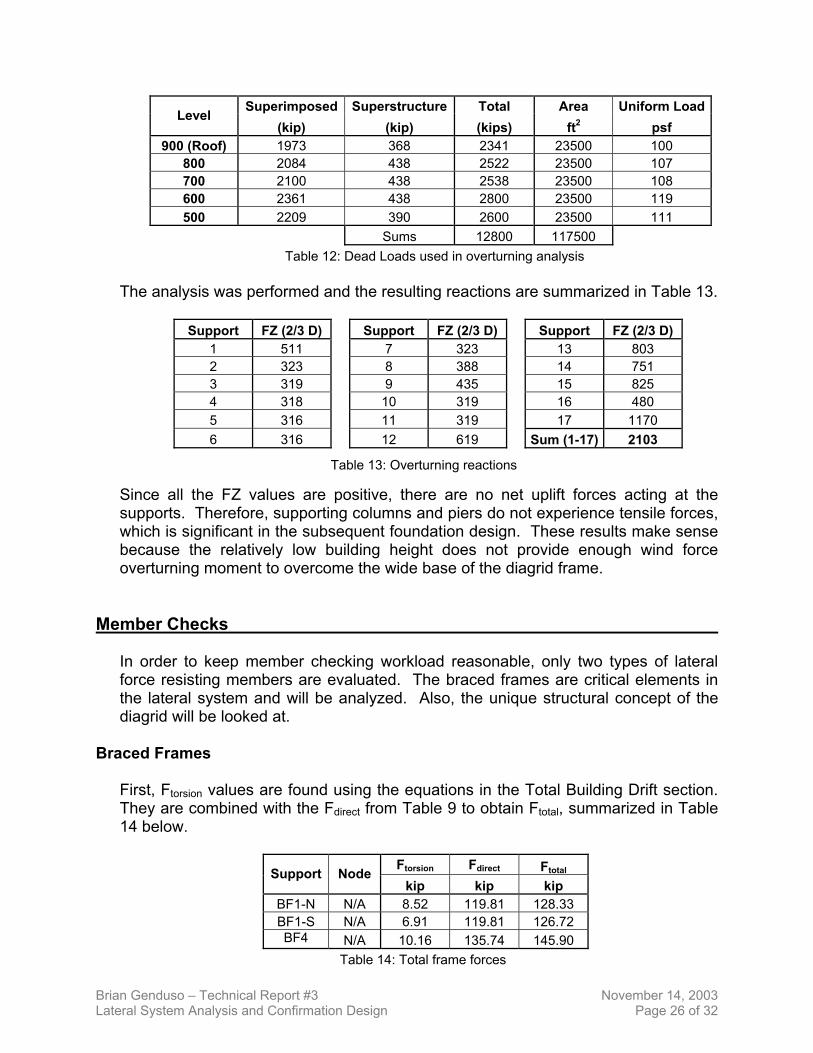
Superimposed Superstructure Total Area Uniform LoadLevel (kip) (kip) (kips) ft2 psf
900 (Roof) 1973 368 2341 23500 100 800 2084 438 2522 23500 107 700 2100 438 2538 23500 108 600 2361 438 2800 23500 119 500 2209 390 2600 23500 111
Sums 12800 117500 Table 12: Dead Loads used in overturning analysis
The analysis was performed and the resulting reactions are summarized in Table 13.
Support FZ (2/3 D) Support FZ (2/3 D) Support FZ (2/3 D) 1 511 7 323 13 803 2 323 8 388 14 751 3 319 9 435 15 825 4 318 10 319 16 480 5 316 11 319 17 1170 6 316 12 619 Sum (1-17) 2103
Table 13: Overturning reactions
Since all the FZ values are positive, there are no net uplift forces acting at the supports. Therefore, supporting columns and piers do not experience tensile forces, which is significant in the subsequent foundation design. These results make sense because the relatively low building height does not provide enough wind force overturning moment to overcome the wide base of the diagrid frame.
Member Checks
In order to keep member checking workload reasonable, only two types of lateral force resisting members are evaluated. The braced frames are critical elements in the lateral system and will be analyzed. Also, the unique structural concept of the diagrid will be looked at.
Braced Frames First, Ftorsion values are found using the equations in the Total Building Drift section. They are combined with the Fdirect from Table 9 to obtain Ftotal, summarized in Table 14 below.
Ftorsion Fdirect FtotalSupport Node
kip kip kip BF1-N N/A 8.52 119.81 128.33 BF1-S N/A 6.91 119.81 126.72 BF4 N/A 10.16 135.74 145.90
Table 14: Total frame forces
Brian Genduso – Technical Report #3 November 14, 2003 Lateral System Analysis and Confirmation Design Page 26 of 32
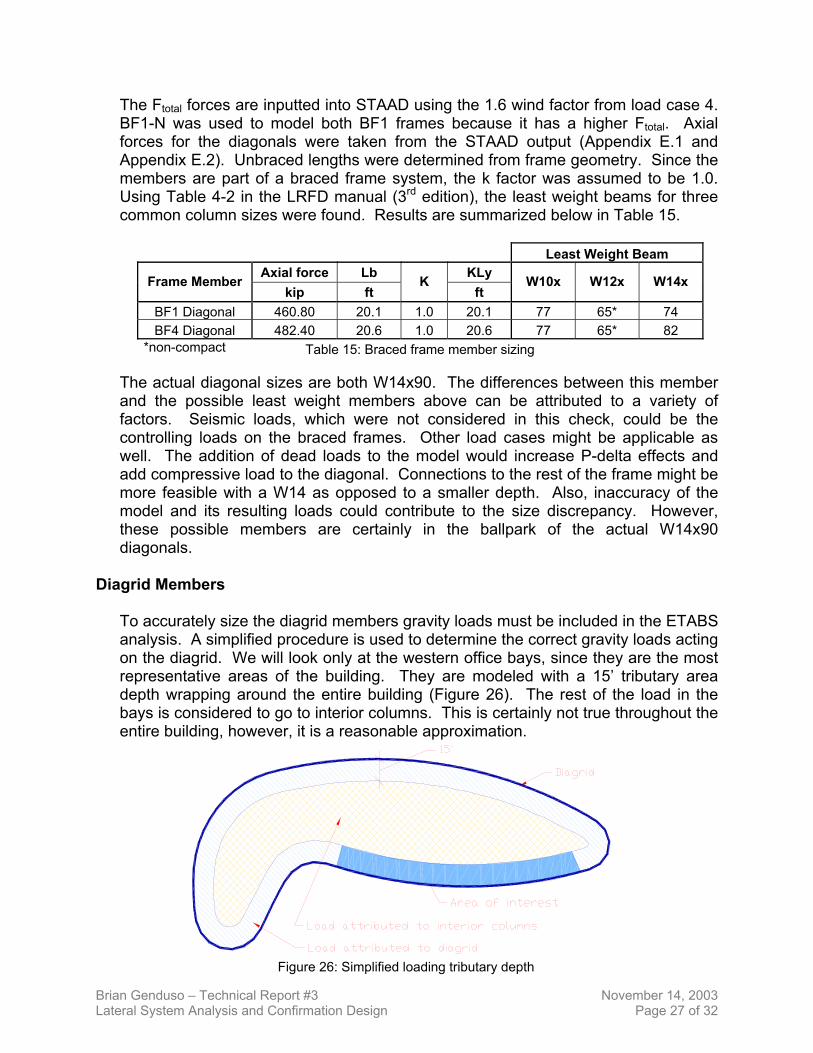
The Ftotal forces are inputted into STAAD using the 1.6 wind factor from load case 4. BF1-N was used to model both BF1 frames because it has a higher Ftotal. Axial forces for the diagonals were taken from the STAAD output (Appendix E.1 and Appendix E.2). Unbraced lengths were determined from frame geometry. Since the members are part of a braced frame system, the k factor was assumed to be 1.0. Using Table 4-2 in the LRFD manual (3rd edition), the least weight beams for three common column sizes were found. Results are summarized below in Table 15.
Least Weight Beam
Axial force Lb KLy Frame Member kip ft
K ft
W10x W12x W14x
BF1 Diagonal 460.80 20.1 1.0 20.1 77 65* 74 BF4 Diagonal 482.40 20.6 1.0 20.6 77 65* 82
*non-compact Table 15: Braced frame member sizing
The actual diagonal sizes are both W14x90. The differences between this member and the possible least weight members above can be attributed to a variety of factors. Seismic loads, which were not considered in this check, could be the controlling loads on the braced frames. Other load cases might be applicable as well. The addition of dead loads to the model would increase P-delta effects and add compressive load to the diagonal. Connections to the rest of the frame might be more feasible with a W14 as opposed to a smaller depth. Also, inaccuracy of the model and its resulting loads could contribute to the size discrepancy. However, these possible members are certainly in the ballpark of the actual W14x90 diagonals.
Diagrid Members
To accurately size the diagrid members gravity loads must be included in the ETABS analysis. A simplified procedure is used to determine the correct gravity loads acting on the diagrid. We will look only at the western office bays, since they are the most representative areas of the building. They are modeled with a 15’ tributary area depth wrapping around the entire building (Figure 26). The rest of the load in the bays is considered to go to interior columns. This is certainly not true throughout the entire building, however, it is a reasonable approximation.
Figure 26: Simplified loading tributary depth
Brian Genduso – Technical Report #3 November 14, 2003 Lateral System Analysis and Confirmation Design Page 27 of 32
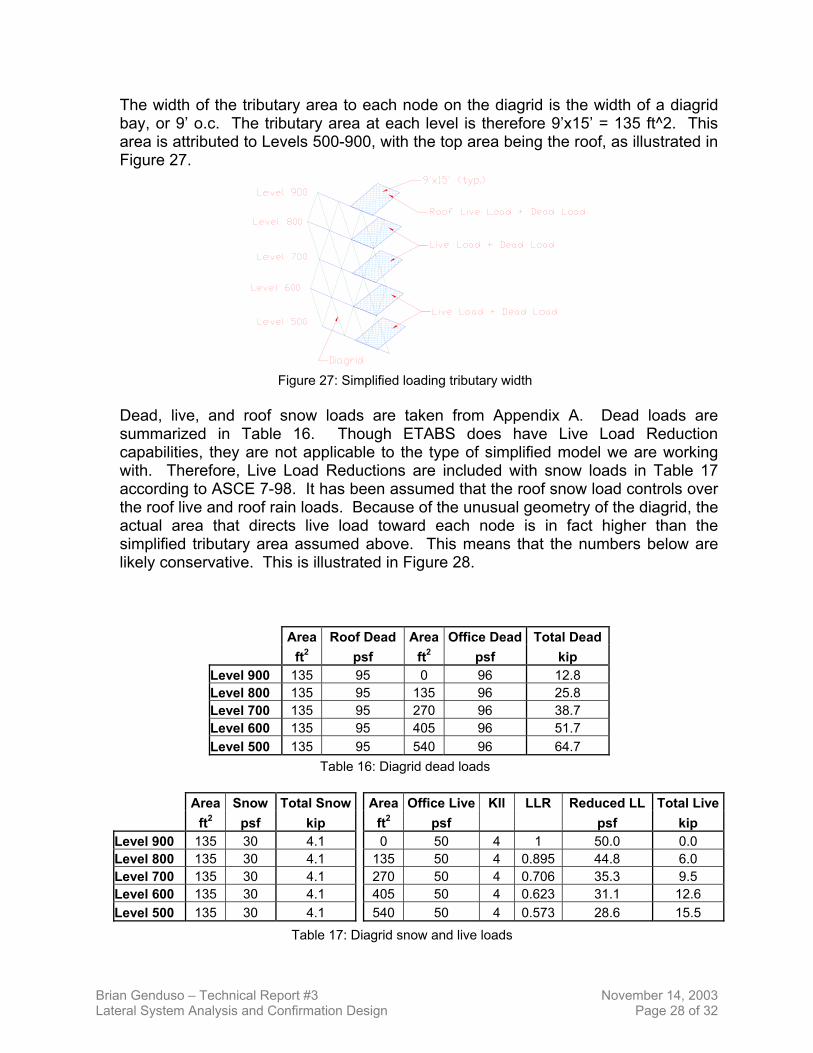
The width of the tributary area to each node on the diagrid is the width of a diagrid bay, or 9’ o.c. The tributary area at each level is therefore 9’x15’ = 135 ft^2. This area is attributed to Levels 500-900, with the top area being the roof, as illustrated in Figure 27.
Figure 27: Simplified loading tributary width Dead, live, and roof snow loads are taken from Appendix A. Dead loads are summarized in Table 16. Though ETABS does have Live Load Reduction capabilities, they are not applicable to the type of simplified model we are working with. Therefore, Live Load Reductions are included with snow loads in Table 17 according to ASCE 7-98. It has been assumed that the roof snow load controls over the roof live and roof rain loads. Because of the unusual geometry of the diagrid, the actual area that directs live load toward each node is in fact higher than the simplified tributary area assumed above. This means that the numbers below are likely conservative. This is illustrated in Figure 28.
Area Roof Dead Area Office Dead Total Dead ft2 psf ft2 psf kip Level 900 135 95 0 96 12.8 Level 800 135 95 135 96 25.8 Level 700 135 95 270 96 38.7 Level 600 135 95 405 96 51.7 Level 500 135 95 540 96 64.7
Table 16: Diagrid dead loads Area Snow Total Snow Area Office Live Kll LLR Reduced LL Total Live ft2 psf kip ft2 psf psf kip
Level 900 135 30 4.1 0 50 4 1 50.0 0.0 Level 800 135 30 4.1 135 50 4 0.895 44.8 6.0 Level 700 135 30 4.1 270 50 4 0.706 35.3 9.5 Level 600 135 30 4.1 405 50 4 0.623 31.1 12.6 Level 500 135 30 4.1 540 50 4 0.573 28.6 15.5
Table 17: Diagrid snow and live loads
Brian Genduso – Technical Report #3 November 14, 2003 Lateral System Analysis and Confirmation Design Page 28 of 32
F
The dead, live, and snow loads were then inputted into each node. Appropriate load combination factors, in accorBuilding Code, were evaluated. Refer to the Load combinations.
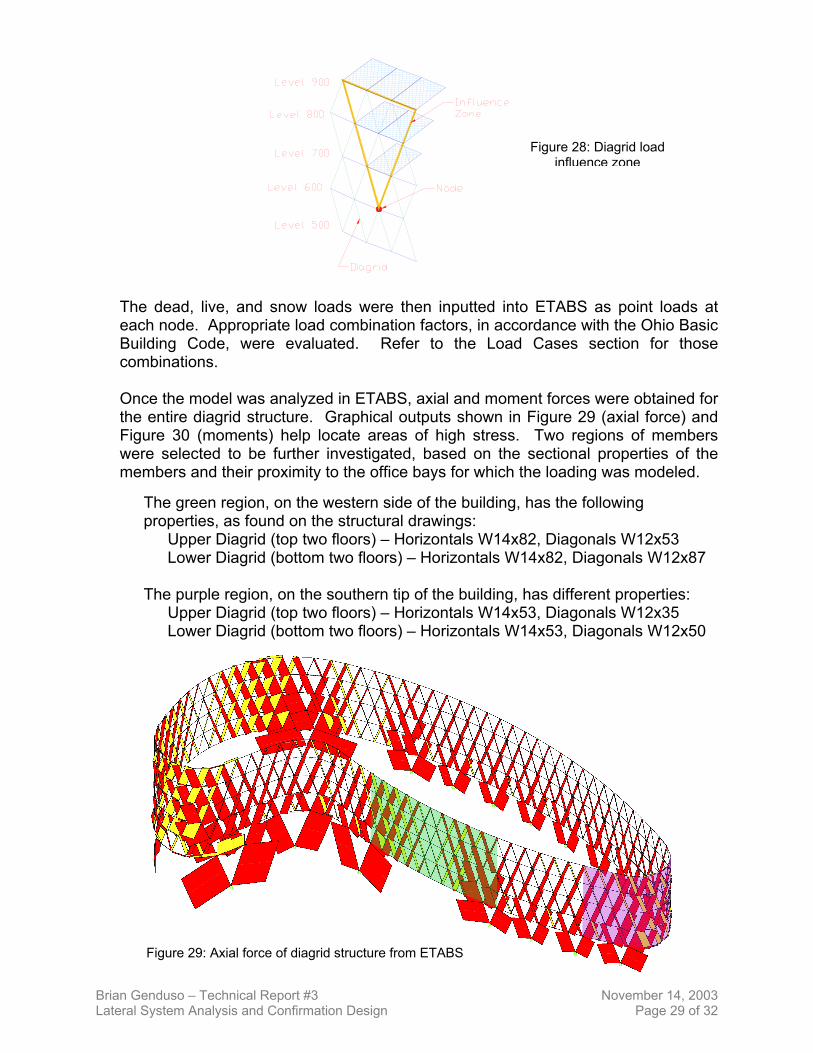
Once the model was analyzed in ETABS, axial and momenthe entire diagrid structure. Graphical outputs shown in FFigure 30 (moments) help locate areas of high stress. were selected to be further investigated, based on the smembers and their proximity to the office bays for which th
The green region, on the western side of the building, hproperties, as found on the structural drawings:
Upper Diagrid (top two floors) – Horizontals W14x82Lower Diagrid (bottom two floors) – Horizontals W14
The purple region, on the southern tip of the building, h
Upper Diagrid (top two floors) – Horizontals W14x53Lower Diagrid (bottom two floors) – Horizontals W14
Figure 29: Axial force of diagrid structure from ETABS
Brian Genduso – Technical Report #3 Lateral System Analysis and Confirmation Design
igure 28: Diagrid load influence zone
ETABS as point loads at dance with the Ohio Basic Cases section for those
t forces were obtained for igure 29 (axial force) and Two regions of members ectional properties of the e loading was modeled.
as the following
, Diagonals W12x53 x82, Diagonals W12x87
as different properties: , Diagonals W12x35 x53, Diagonals W12x50
November 14, 2003 Page 29 of 32
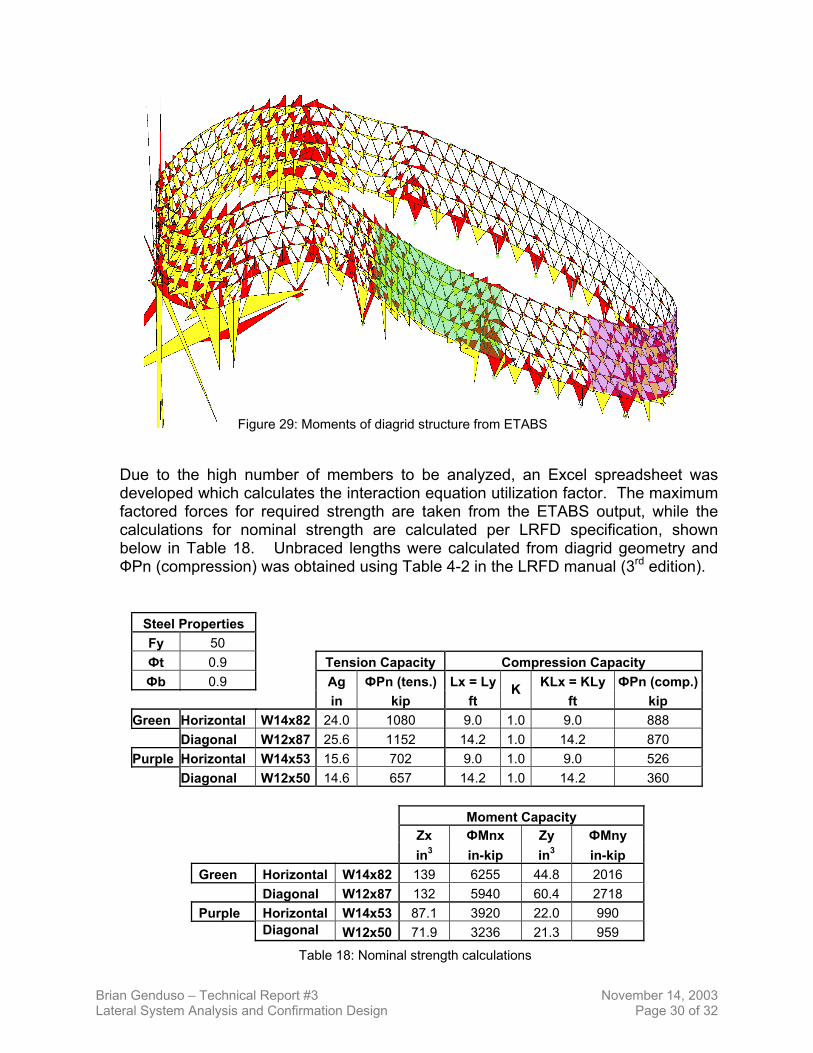
Figure 29: Moments of diagrid structure from ETABS
Due to the high number of members to be analyzed, an Excel spreadsheet was developed which calculates the interaction equation utilization factor. The maximum factored forces for required strength are taken from the ETABS output, while the calculations for nominal strength are calculated per LRFD specification, shown below in Table 18. Unbraced lengths were calculated from diagrid geometry and ФPn (compression) was obtained using Table 4-2 in the LRFD manual (3rd edition).
Steel Properties Fy 50 Фt 0.9 Tension Capacity Compression Capacity Фb 0.9 Ag ФPn (tens.) Lx = Ly K ФLx = KLy Pn (comp.)
in kip ft K
ft kip Green Horizontal W14x82 24.0 1080 9.0 1 9 888 .0 .0 Diagonal W12x87 25.6 1152 14.2 1 14.2 870 .0Purple Horizontal W14x53 15.6 702 9.0 1 9 526 .0 .0 Diagonal W12x50 14.6 657 14.2 1 14.2 360 .0
Moment Capacity Zx ФMnx Zy ФMny in3 in-kip in3 in-kip Green Horizontal W14x82 139 6255 44.8 2016 Diagonal W12x87 132 5940 60.4 2718 Purple Horizontal W14x53 87.1 3920 22.0 990 Diagonal W12x50 71.9 3236 21.3 959
Table 18: Nominal strength calculations
Brian Genduso – Technical Report #3 November 14, 2003 Lateral System Analysis and Confirmation Design Page 30 of 32
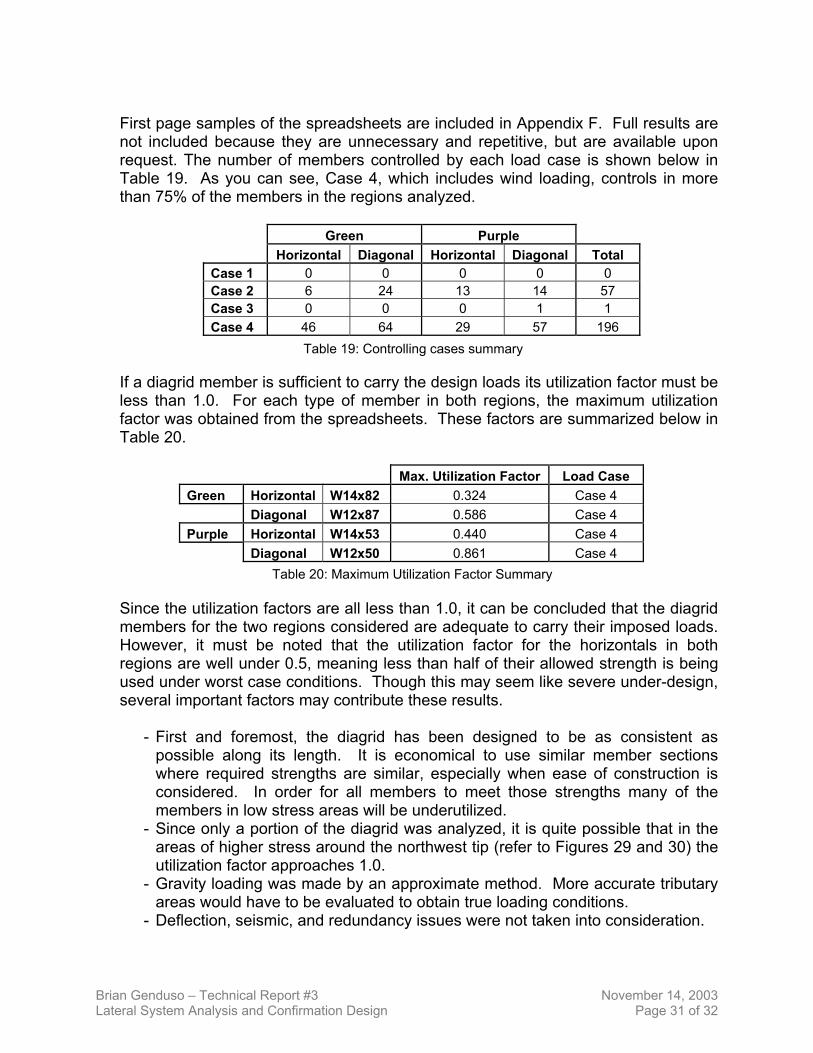
First page samples of the spreadsheets are included in Appendix F. Full results are not included because they are unnecessary and repetitive, but are available upon request. The number of members controlled by each load case is shown below in Table 19. As you can see, Case 4, which includes wind loading, controls in more than 75% of the members in the regions analyzed.
Green Purple Horizontal Diagonal Horizontal Diagonal Total Case 1 0 0 0 0 0 Case 2 6 24 13 14 57 Case 3 0 0 0 1 1 Case 4 46 64 29 57 196
Table 19: Controlling cases summary If a diagrid member is sufficient to carry the design loads its utilization factor must be less than 1.0. For each type of member in both regions, the maximum utilization factor was obtained from the spreadsheets. These factors are summarized below in Table 20.
Max. Utilization Factor Load Case Green Horizontal W14x82 0.324 Case 4 Diagonal W12x87 0.586 Case 4 Purple Horizontal W14x53 0.440 Case 4 Diagonal W12x50 0.861 Case 4
Table 20: Maximum Utilization Factor Summary
Since the utilization factors are all less than 1.0, it can be concluded that the diagrid members for the two regions considered are adequate to carry their imposed loads. However, it must be noted that the utilization factor for the horizontals in both regions are well under 0.5, meaning less than half of their allowed strength is being used under worst case conditions. Though this may seem like severe under-design, several important factors may contribute these results.
- First and foremost, the diagrid has been designed to be as consistent as possible along its length. It is economical to use similar member sections where required strengths are similar, especially when ease of construction is considered. In order for all members to meet those strengths many of the members in low stress areas will be underutilized.
- Since only a portion of the diagrid was analyzed, it is quite possible that in the areas of higher stress around the northwest tip (refer to Figures 29 and 30) the utilization factor approaches 1.0.
- Gravity loading was made by an approximate method. More accurate tributary areas would have to be evaluated to obtain true loading conditions.
- Deflection, seismic, and redundancy issues were not taken into consideration.
Brian Genduso – Technical Report #3 November 14, 2003 Lateral System Analysis and Confirmation Design Page 31 of 32
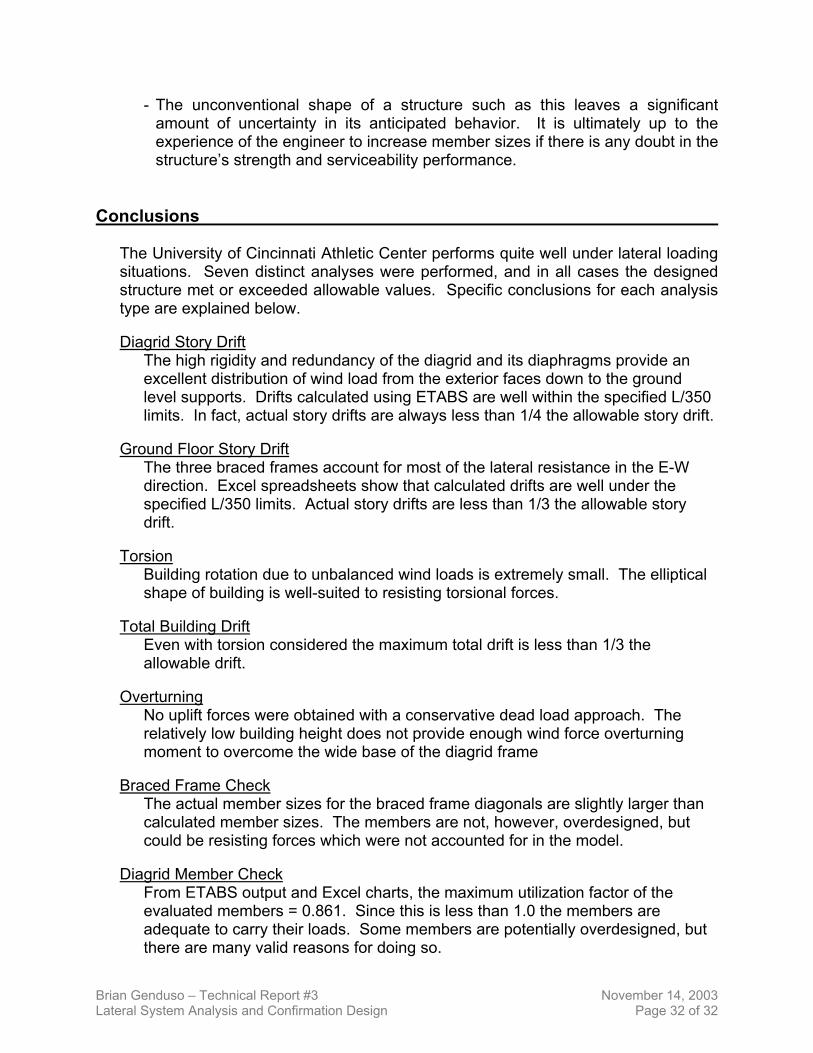
- The unconventional shape of a structure such as this leaves a significant amount of uncertainty in its anticipated behavior. It is ultimately up to the experience of the engineer to increase member sizes if there is any doubt in the structure’s strength and serviceability performance.
Conclusions
The University of Cincinnati Athletic Center performs quite well under lateral loading situations. Seven distinct analyses were performed, and in all cases the designed structure met or exceeded allowable values. Specific conclusions for each analysis type are explained below. Diagrid Story Drift
The high rigidity and redundancy of the diagrid and its diaphragms provide an excellent distribution of wind load from the exterior faces down to the ground level supports. Drifts calculated using ETABS are well within the specified L/350 limits. In fact, actual story drifts are always less than 1/4 the allowable story drift.
Ground Floor Story Drift The three braced frames account for most of the lateral resistance in the E-W direction. Excel spreadsheets show that calculated drifts are well under the specified L/350 limits. Actual story drifts are less than 1/3 the allowable story drift.
Torsion Building rotation due to unbalanced wind loads is extremely small. The elliptical shape of building is well-suited to resisting torsional forces.
Total Building Drift Even with torsion considered the maximum total drift is less than 1/3 the allowable drift.
Overturning No uplift forces were obtained with a conservative dead load approach. The relatively low building height does not provide enough wind force overturning moment to overcome the wide base of the diagrid frame
Braced Frame Check The actual member sizes for the braced frame diagonals are slightly larger than calculated member sizes. The members are not, however, overdesigned, but could be resisting forces which were not accounted for in the model.
Diagrid Member Check From ETABS output and Excel charts, the maximum utilization factor of the evaluated members = 0.861. Since this is less than 1.0 the members are adequate to carry their loads. Some members are potentially overdesigned, but there are many valid reasons for doing so.
Brian Genduso – Technical Report #3 November 14, 2003 Lateral System Analysis and Confirmation Design Page 32 of 32
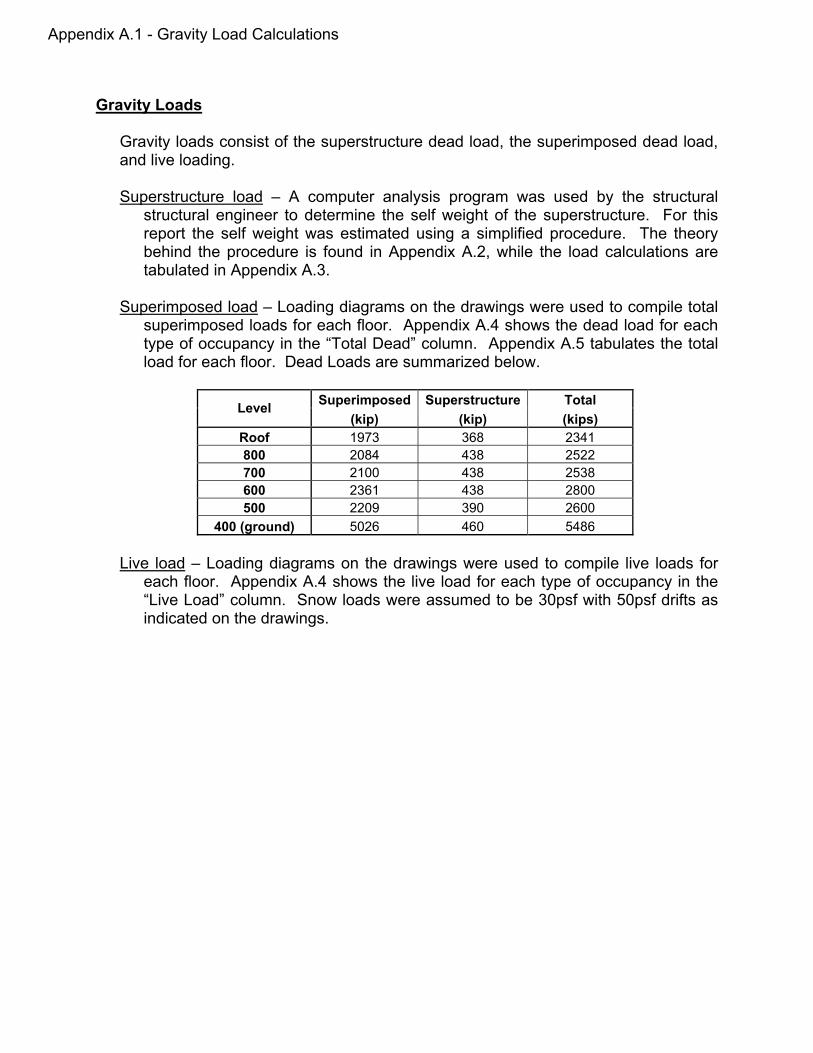
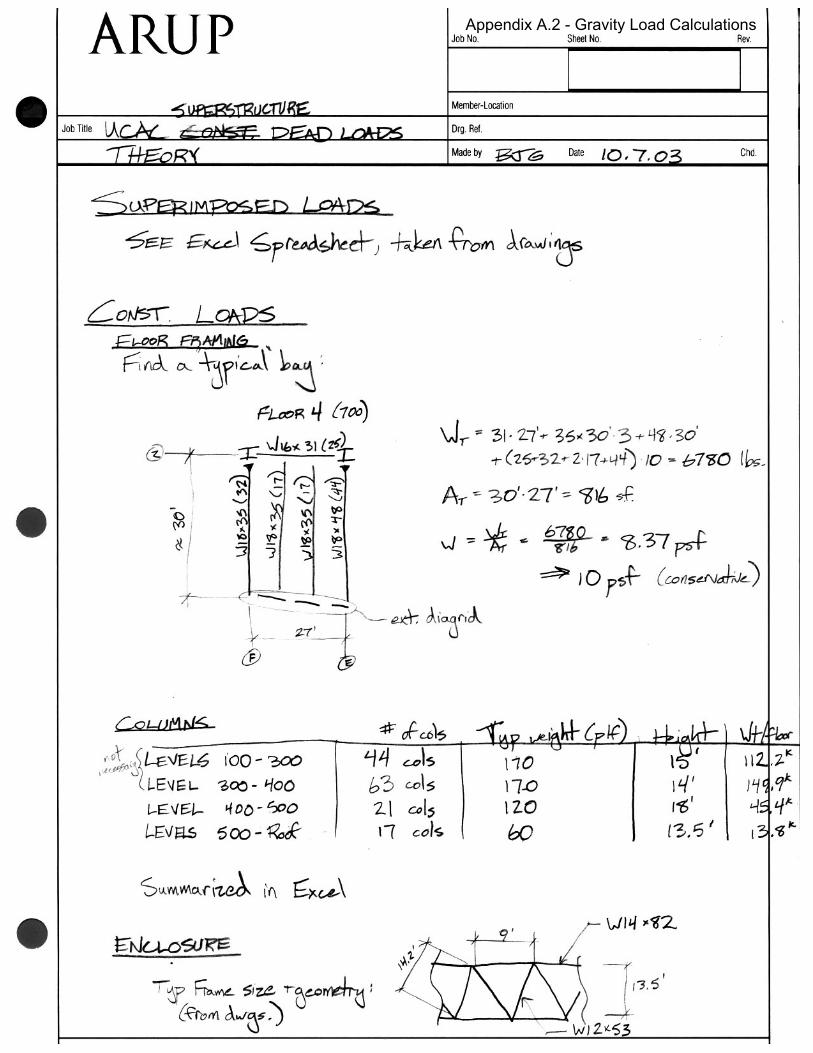
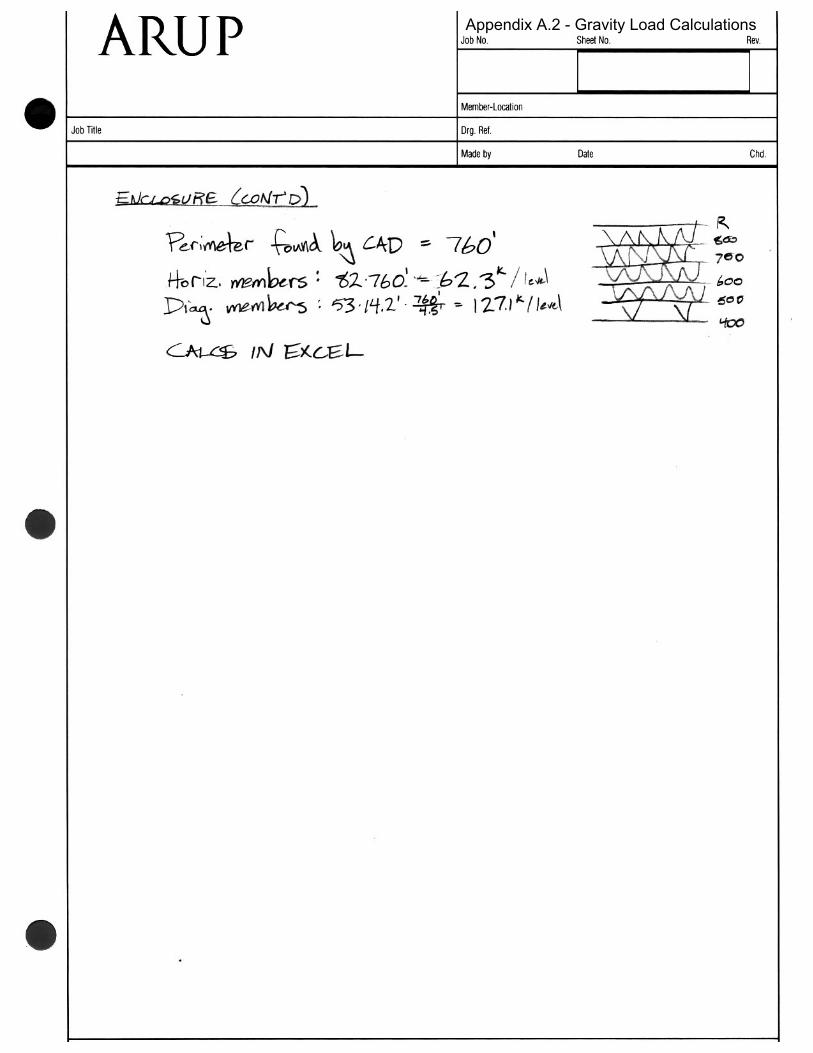
Gravity Loads
Gravity loads consist of the superstructure dead load, the superimposed dead load, and live loading.
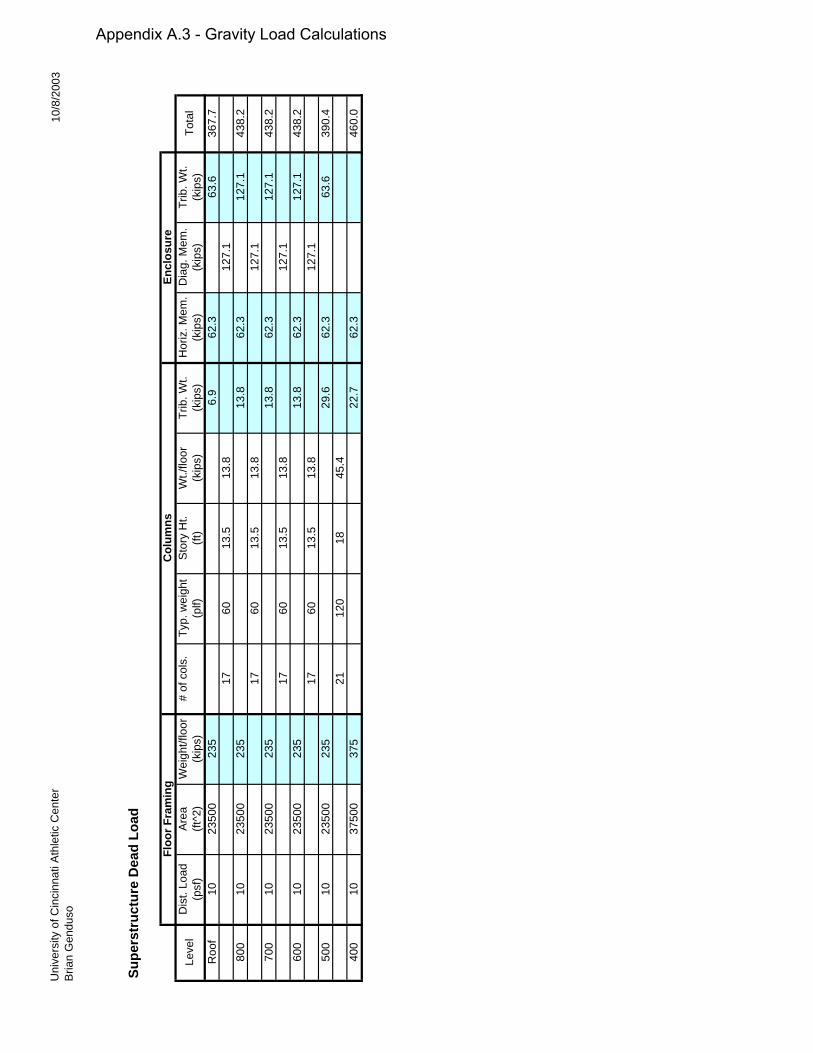
Superstructure load – A computer analysis program was used by the structural
structural engineer to determine the self weight of the superstructure. For this report the self weight was estimated using a simplified procedure. The theory behind the procedure is found in Appendix A.2, while the load calculations are tabulated in Appendix A.3.
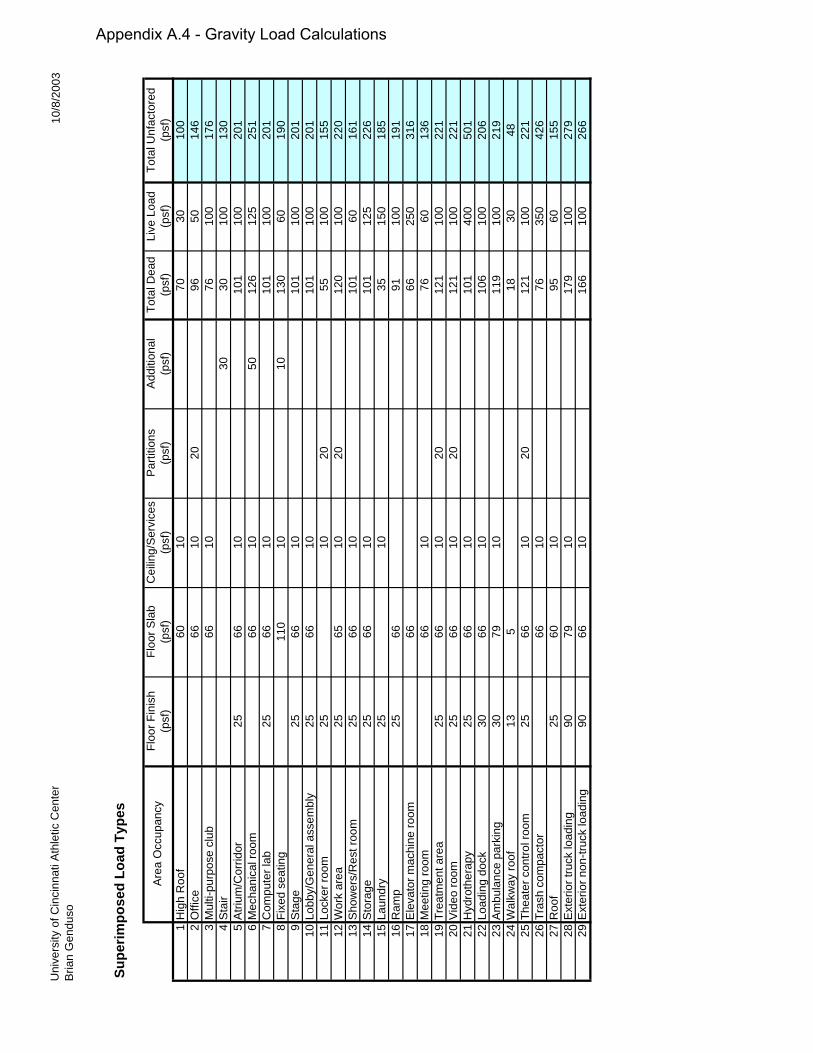
Superimposed load – Loading diagrams on the drawings were used to compile total
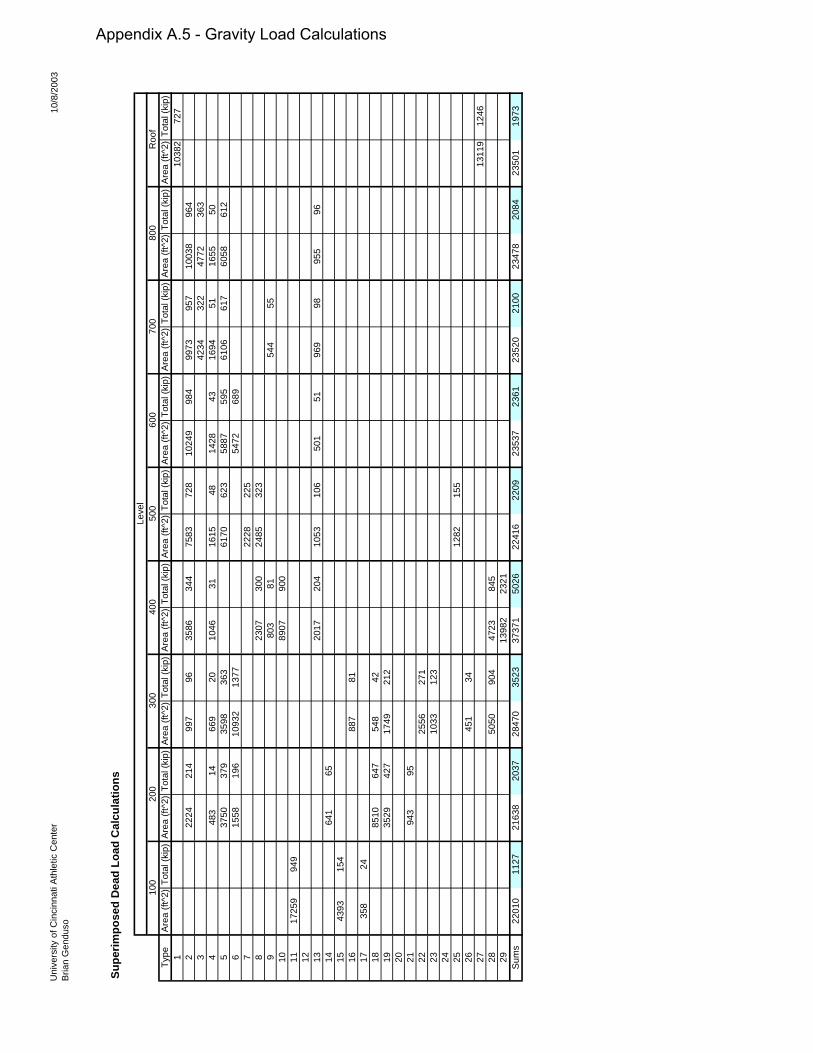
superimposed loads for each floor. Appendix A.4 shows the dead load for each type of occupancy in the “Total Dead” column. Appendix A.5 tabulates the total load for each floor. Dead Loads are summarized below.
Superimposed Superstructure Total Level
(kip) (kip) (kips) Roof 1973 368 2341 800 2084 438 2522 700 2100 438 2538 600 2361 438 2800 500 2209 390 2600
400 (ground) 5026 460 5486
Live load – Loading diagrams on the drawings were used to compile live loads for each floor. Appendix A.4 shows the live load for each type of occupancy in the “Live Load” column. Snow loads were assumed to be 30psf with 50psf drifts as indicated on the drawings.
Appendix A.1 - Gravity Load Calculations
Appendix A.2 - Gravity Load Calculations
Appendix A.2 - Gravity Load Calculations
Uni
vers
ity o
f Cin
cinn
ati A
thle
tic C
ente
rB
rian
Gen
duso
10/8
/200
3
Supe
rstr
uctu
re D
ead
Load
Floo
r Fra
min
gC
olum
nsEn
clos
ure
Leve
lD
ist.
Load
Are
aW
eigh
t/flo
or#
of c
ols.
Typ.
wei
ght
Sto
ry H
t.W
t./flo
orTr
ib. W
t.H
oriz
. Mem
.D
iag.
Mem
.Tr
ib. W
t.To
tal
(psf
)(ft
^2)
(kip
s)(p
lf)(ft
)(k
ips)
(kip
s)(k
ips)
(kip
s)(k
ips)
Roo
f10
2350
023
56.
962
.363
.636
7.7
1760
13.5
13.8
127.
180
010
2350
023
513
.862
.312
7.1
438.
217
6013
.513
.812
7.1
700
1023
500
235
13.8
62.3
127.
143
8.2
1760
13.5
13.8
127.
160
010
2350
023
513
.862
.312
7.1
438.
217
6013
.513
.812
7.1
500
1023
500
235
29.6
62.3
63.6
390.
421
120
1845
.440
010
3750
037
522
.762
.346
0.0
Appendix A.3 - Gravity Load Calculations
Uni
vers
ity o
f Cin
cinn
ati A
thle
tic C
ente
rB
rian
Gen
duso
10/8
/200
3
Supe
rimpo
sed
Load
Typ
es
Are
a O
ccup
ancy
Floo
r Fin
ish
Floo
r Sla
bC
eilin
g/S
ervi
ces
Par
titio
nsA
dditi
onal
Tota
l Dea
dLi
ve L
oad
Tota
l Unf
acto
red
(psf
)(p
sf)
(psf
)(p
sf)
(psf
)(p
sf)
(psf
)(p
sf)
1H
igh
Roo
f60
1070
3010
02
Offi
ce66
1020
9650
146
3M
ulti-
purp
ose
club
6610
7610
017
64
Sta
ir30
3010
013
05
Atri
um/C
orrid
or25
6610
101
100
201
6M
echa
nica
l roo
m66
1050
126
125
251
7C
ompu
ter l
ab25
6610
101
100
201
8Fi
xed
seat
ing
110
1010
130
6019
09
Sta
ge25
6610
101
100
201
10Lo
bby/
Gen
eral
ass
embl
y25
6610
101
100
201
11Lo
cker
room
2510
2055
100
155
12W
ork
area
2565
1020
120
100
220
13S
how
ers/
Res
t roo
m25
6610
101
6016
114
Sto
rage
2566
1010
112
522
615
Laun
dry
2510
3515
018
516
Ram
p25
6691
100
191
17E
leva
tor m
achi
ne ro
om66
6625
031
618
Mee
ting
room
6610
7660
136
19Tr
eatm
ent a
rea
2566
1020
121
100
221
20V
ideo
room
2566
1020
121
100
221
21H
ydro
ther
apy
2566
1010
140
050
122
Load
ing
dock
3066
1010
610
020
623
Am
bula
nce
park
ing
3079
1011
910
021
924
Wal
kway
roof
135
1830
4825
Thea
ter c
ontro
l roo
m25
6610
2012
110
022
126
Tras
h co
mpa
ctor
6610
7635
042
627
Roo
f25
6010
9560
155
28E
xter
ior t
ruck
load
ing
9079
1017
910
027
929
Ext
erio
r non
-truc
k lo
adin
g90
6610
166
100
266
Appendix A.4 - Gravity Load Calculations
Uni
vers
ity o
f Cin
cinn
ati A
thle
tic C
ente
rB
rian
Gen
duso
10/8
/200
3
Supe
rimpo
sed
Dea
d Lo
ad C
alcu
latio
ns
Leve
l10
020
030
040
050
060
070
080
0R
oof
Type
Are
a (ft
^2)
Tota
l (ki
p)A
rea
(ft^2
)To
tal (
kip)
Are
a (ft
^2)
Tota
l (ki
p)A
rea
(ft^2
)To
tal (
kip)
Are
a (ft
^2)
Tota
l (ki
p)A
rea
(ft^2
)To
tal (
kip)
Are
a (ft
^2)
Tota
l (ki
p)A
rea
(ft^2
)To
tal (
kip)
Are
a (ft
^2)
Tota
l (ki
p)1
1038
272
72
2224
214
997
9635
8634
475
8372
810
249
984
9973
957
1003
896
43
4234
322
4772
363
448
314
669
2010
4631
1615
4814
2843
1694
5116
5550
537
5037
935
9836
361
7062
358
8759
561
0661
760
5861
26
1558
196
1093
213
7754
7268
97
2228
225
823
0730
024
8532
39
803
8154
455
1089
0790
011
1725
994
912 13
2017
204
1053
106
501
5196
998
955
9614
641
6515
4393
154
1688
781
1735
824
1885
1064
754
842
1935
2942
717
4921
220 21
943
9522
2556
271
2310
3312
324 25
1282
155
2645
134
2713
119
1246
2850
5090
447
2384
529
1398
223
21S
ums
2201
011
2721
638
2037
2847
035
2337
371
5026
2241
622
0923
537
2361
2352
021
0023
478
2084
2350
119
73
Appendix A.5 - Gravity Load Calculations
Appendix B.1 - Wind and Seismic Load Calculations
Appendix B.1 - Wind and Seismic Load Calculations
University of Cincinnati Athletic CenterBrian Genduso
10/8/2003
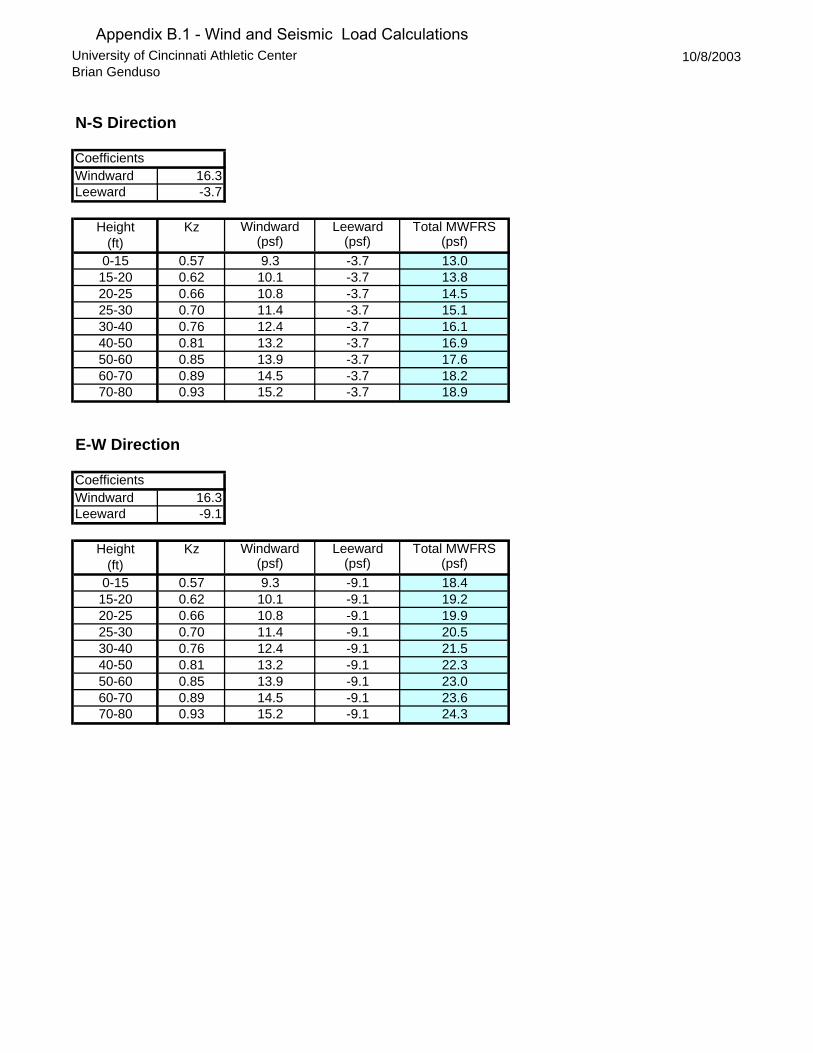
N-S Direction
CoefficientsWindward 16.3Leeward -3.7
Height Kz Windward Leeward Total MWFRS(ft) (psf) (psf) (psf)
0-15 0.57 9.3 -3.7 13.015-20 0.62 10.1 -3.7 13.820-25 0.66 10.8 -3.7 14.525-30 0.70 11.4 -3.7 15.130-40 0.76 12.4 -3.7 16.140-50 0.81 13.2 -3.7 16.950-60 0.85 13.9 -3.7 17.660-70 0.89 14.5 -3.7 18.270-80 0.93 15.2 -3.7 18.9
E-W Direction
CoefficientsWindward 16.3Leeward -9.1
Height Kz Windward Leeward Total MWFRS(ft) (psf) (psf) (psf)
0-15 0.57 9.3 -9.1 18.415-20 0.62 10.1 -9.1 19.220-25 0.66 10.8 -9.1 19.925-30 0.70 11.4 -9.1 20.530-40 0.76 12.4 -9.1 21.540-50 0.81 13.2 -9.1 22.350-60 0.85 13.9 -9.1 23.060-70 0.89 14.5 -9.1 23.670-80 0.93 15.2 -9.1 24.3
Appendix B.1 - Wind and Seismic Load Calculations
Uni
vers
ity o
f Cin
cinn
ati A
thle
tic C
ente
rB
rian
Gen
duso
10/8
/200
3
N-S
Dire
ctio
n
Bui
ldin
g he
ight
(ft)
72B
uild
ing
trib
wid
th (f
t)12
0
Leve
lS
tory
ht.
Trib
ht.
Tota
l ht.
P 1
H 1
P 2
H 2
P 3
H 3
Sto
ry D
ist.
Load
Cum
. Dis
t. Lo
adS
tory
She
arC
um. S
hear
(ft)
(ft)
(ft)
(psf
)(ft
)(p
sf)
(ft)
(psf
)(ft
)(p
lf)(p
lf)(k
ips)
(kip
s)R
oof
6.75
18.2
4.75
18.9
212
412
414
.914
.913
.565
.25
800
13.5
17.6
8.25
18.2
5.25
241
365
28.9
43.8
13.5
51.7
570
013
.516
.11.
7516
.910
17.6
1.75
228
593
27.4
71.2
13.5
38.2
560
013
.514
.50.
2515
.15
16.1
8.25
212
805
25.4
96.6
13.5
24.7
550
015
.75
136
13.8
514
.54.
7521
610
2125
.912
2.5
189
400
(gro
und)
913
9N
/ AN
/AN
/A12
2.5
E-W
Dire
ctio
n
Bui
ldin
g he
ight
(ft)
72B
uild
ing
trib
wid
th (f
t)30
0
Leve
lS
tory
ht.
Trib
ht.
Tota
l ht.
P 1
H 1
P 2
H 2
P 3
H 3
Sto
ry D
ist.
Load
Cum
. Dis
t. Lo
adS
tory
She
arC
um. S
hear
(ft)
(ft)
(ft)
(psf
)(ft
)(p
sf)
(ft)
(psf
)(ft
)(p
lf)(p
lf)(k
ips)
(kip
s)R
oof
6.75
23.6
4.75
24.3
216
116
148
.248
.213
.565
.25
800
13.5
238.
2523
.65.
2531
447
494
.114
2.3
13.5
51.7
570
013
.521
.51.
7522
.310
231.
7530
177
590
.323
2.6
13.5
38.2
560
013
.519
.90.
2520
.55
21.5
8.25
285
1060
85.5
318.
013
.524
.75
500
15.7
518
.46
19.2
519
.94.
7530
113
6190
.340
8.3
189
400
(gro
und)
918
.49
N/ A
N/A
N/A
408.
3
Appendix B.3 - Wind and Seismic Load Calculations
Appendix B.4 - Wind and Seismic Load Calculations
ETA
BS
v8.
2.6
- F
ile: E
TAB
S m
odel
2 (w
ith ri
gid
diap
hrag
m)
- N
ovem
ber 8
,200
3 8
:04
3-D
Vie
w -
Kip
-in U
nits
AE
431
W3D
ETA
BS
Mod
elE
TA
BS
Appendix C - Node Numbering System
ETABS v8.2.6 File: ETABS MODEL 2 (WITH RIGID DIAPHRAGM) Kip-in Units PAGE 1 November 7, 2003 18:11 AE 431W 3D ETABS Model P O I N T D I S P L A C E M E N T S STORY POINT LOAD UX UY UZ RX RY RZ STORY1 1 WWIND 1.4252 0.1160 0.2513 -0.00061 0.00222 -0.00026 STORY1 2 WWIND 1.4076 0.0941 0.0247 0.00085 0.00159 -0.00026 STORY1 3 WWIND 1.3844 0.0787 -0.1685 -0.00077 0.00370 -0.00026 STORY1 4 WWIND 1.3574 0.0720 -0.1014 -0.00040 -0.00029 -0.00026 STORY1 5 WWIND 1.3295 0.0745 -0.0905 0.00022 0.00021 -0.00026 STORY1 6 WWIND 1.3021 0.0818 -0.1106 0.00022 0.00321 -0.00026 STORY1 7 WWIND 1.2747 0.0893 -0.0122 -0.00062 0.00081 -0.00026 STORY1 8 WWIND 1.2471 0.0961 0.0924 0.00021 0.00326 -0.00026 STORY1 9 WWIND 1.2194 0.1022 0.0485 0.00041 0.00042 -0.00026 STORY1 10 WWIND 1.1915 0.1075 0.0379 0.00009 0.00045 -0.00026 STORY1 11 WWIND 1.1635 0.1121 0.0336 0.00009 0.00045 -0.00026 STORY1 12 WWIND 1.1353 0.1161 0.0292 0.00009 0.00046 -0.00026 STORY1 13 WWIND 1.1070 0.1193 0.0241 0.00008 0.00047 -0.00026 STORY1 14 WWIND 1.0787 0.1217 0.0181 0.00008 0.00049 -0.00026 STORY1 15 WWIND 1.0504 0.1234 0.0111 0.00007 0.00050 -0.00026 STORY1 16 WWIND 1.0220 0.1245 0.0001 0.00023 0.00068 -0.00026 STORY1 17 WWIND 0.9935 0.1247 -0.0244 -0.00027 0.00434 -0.00026 STORY1 18 WWIND 0.9651 0.1243 0.0201 -0.00039 0.00402 -0.00026 STORY1 19 WWIND 0.9367 0.1231 0.0043 0.00018 0.00088 -0.00026 STORY1 20 WWIND 0.9084 0.1212 -0.0110 -0.00052 0.00504 -0.00026 STORY1 21 WWIND 0.8801 0.1185 0.0066 -0.00062 0.00505 -0.00026 STORY1 22 WWIND 0.8519 0.1151 0.0055 -0.00009 0.00090 -0.00026 STORY1 23 WWIND 0.8237 0.1110 0.0056 -0.00063 0.00457 -0.00026 STORY1 24 WWIND 0.7957 0.1062 -0.0088 -0.00072 0.00454 -0.00026 STORY1 25 WWIND 0.7678 0.1007 0.0071 -0.00034 0.00083 -0.00026 STORY1 26 WWIND 0.7401 0.0944 0.0211 -0.00068 0.00408 -0.00026 STORY1 27 WWIND 0.7126 0.0874 -0.0210 -0.00081 0.00361 -0.00026 STORY1 28 WWIND 0.6877 0.0753 0.0133 -0.00084 0.00071 -0.00026 STORY1 29 WWIND 0.6744 0.0530 0.0193 -0.00015 0.00021 -0.00030 STORY1 30 WWIND 0.6668 0.0271 0.0133 0.00003 0.00019 -0.00026 STORY1 31 WWIND 0.6764 0.0017 0.0093 0.00011 0.00021 -0.00026 STORY1 32 WWIND 0.6897 -0.0075 0.0243 0.00097 0.00070 -0.00028 STORY1 33 WWIND 0.7216 -0.0308 0.0771 0.00084 0.00375 -0.00026 STORY1 34 WWIND 0.7470 -0.0436 -0.0697 0.00087 0.00391 -0.00026 STORY1 35 WWIND 0.7727 -0.0557 -0.0032 0.00115 0.00061 -0.00026 STORY1 36 WWIND 0.7987 -0.0672 0.0604 0.00099 0.00432 -0.00026 STORY1 37 WWIND 0.8250 -0.0779 -0.0558 0.00093 0.00441 -0.00026 STORY1 38 WWIND 0.8515 -0.0879 -0.0049 0.00085 0.00060 -0.00026 STORY1 39 WWIND 0.8784 -0.0972 0.0441 0.00101 0.00485 -0.00026 STORY1 40 WWIND 0.9055 -0.1058 -0.0395 0.00093 0.00494 -0.00026 STORY1 41 WWIND 0.9328 -0.1137 -0.0055 0.00061 0.00076 -0.00026 STORY1 42 WWIND 0.9604 -0.1208 0.0261 0.00097 0.00539 -0.00026 STORY1 43 WWIND 0.9880 -0.1271 -0.0210 0.00087 0.00546 -0.00026 STORY1 44 WWIND 1.0159 -0.1328 -0.0059 0.00031 0.00088 -0.00026 STORY1 45 WWIND 1.0439 -0.1376 0.0065 0.00087 0.00593 -0.00026 STORY1 46 WWIND 1.0720 -0.1418 -0.0008 0.00075 0.00595 -0.00026 STORY1 47 WWIND 1.1002 -0.1451 -0.0061 -0.00002 0.00095 -0.00026 STORY1 48 WWIND 1.1285 -0.1477 -0.0148 0.00070 0.00643 -0.00026 STORY1 49 WWIND 1.1569 -0.1496 0.0212 0.00057 0.00641 -0.00026 STORY1 50 WWIND 1.1853 -0.1507 -0.0058 -0.00038 0.00097 -0.00026 STORY1 51 WWIND 1.2137 -0.1510 -0.0375 0.00047 0.00691 -0.00026 STORY1 52 WWIND 1.2421 -0.1505 0.0452 0.00034 0.00684 -0.00026 STORY1 53 WWIND 1.2705 -0.1493 -0.0015 -0.00070 0.00086 -0.00026 STORY1 54 WWIND 1.2989 -0.1474 -0.0509 0.00029 0.00528 -0.00026 STORY1 55 WWIND 1.3271 -0.1446 0.0629 0.00009 0.00566 -0.00026 STORY1 56 WWIND 1.3553 -0.1411 0.0244 -0.00044 0.00062 -0.00026 STORY1 57 WWIND 1.3834 -0.1369 0.0117 -0.00009 0.00040 -0.00026 STORY1 58 WWIND 1.4114 -0.1319 0.0059 -0.00011 0.00037 -0.00026 STORY1 59 WWIND 1.4393 -0.1264 0.0010 -0.00010 0.00036 -0.00026 STORY1 60 WWIND 1.4668 -0.1195 -0.0023 -0.00009 0.00034 -0.00026 STORY1 61 WWIND 1.4934 -0.1100 -0.0009 0.00002 -0.00001 -0.00026
Appendix D.1 - ETABS Analysis Results
STORY1 62 WWIND 1.5188 -0.0972 -0.0012 0.00002 -0.00002 -0.00026 STORY1 63 WWIND 1.5425 -0.0816 -0.0036 -0.00015 0.00027 -0.00026 STORY1 64 WWIND 1.5702 -0.0591 -0.0017 -0.00010 0.00020 -0.00026 STORY1 65 WWIND 1.5833 -0.0424 0.0029 -0.00012 0.00022 -0.00026 STORY1 66 WWIND 1.5999 -0.0194 0.0094 -0.00011 0.00020 -0.00026 STORY1 67 WWIND 1.6137 0.0054 0.0178 -0.00008 0.00018 -0.00026 STORY1 68 WWIND 1.6244 0.0317 0.0272 -0.00006 0.00016 -0.00026 STORY1 69 WWIND 1.6318 0.0590 0.0376 -0.00002 0.00015 -0.00026 STORY1 70 WWIND 1.6359 0.0870 0.0484 0.00001 0.00015 -0.00026 STORY1 71 WWIND 1.6370 0.1154 0.0594 0.00002 0.00015 -0.00026 STORY1 72 WWIND 1.6363 0.1438 0.0704 0.00005 0.00015 -0.00026 STORY1 73 WWIND 1.6348 0.1722 0.0813 0.00003 0.00013 -0.00026 STORY1 74 WWIND 1.6303 0.2001 0.0852 -0.00001 0.00010 -0.00026 STORY1 75 WWIND 1.6187 0.2254 0.0958 0.00009 0.00022 -0.00026 STORY1 76 WWIND 1.5997 0.2456 0.1101 0.00015 0.00040 -0.00022 STORY1 77 WWIND 1.5738 0.2575 0.1219 0.00006 0.00045 -0.00026 STORY1 78 WWIND 1.5461 0.2603 0.1200 0.00006 0.00055 -0.00026 STORY1 79 WWIND 1.5191 0.2535 0.1011 0.00007 0.00054 -0.00026 STORY1 80 WWIND 1.4961 0.2381 0.0650 0.00034 0.00003 -0.00026 STORY1 81 WWIND 1.4872 0.2265 0.0511 0.00070 -0.00038 -0.00020 STORY1 82 WWIND 1.4661 0.1908 0.0594 0.00095 -0.00053 -0.00026 STORY1 83 WWIND 1.4531 0.1655 0.0746 0.00062 -0.00043 -0.00026 STORY1 84 WWIND 1.4395 0.1406 0.1275 -0.00076 -0.00068 -0.00026 ETABS v8.2.6 File: ETABS MODEL 2 (WITH RIGID DIAPHRAGM) Kip-in Units PAGE 2 November 7, 2003 18:11 AE 431W 3D ETABS Model D I S P L A C E M E N T S A T D I A P H R A G M C E N T E R O F M A S S STORY DIAPHRAGM LOAD POINT X Y UX UY RZ STORY5 D1 WWIND 238 2322.834 -143.572 1.3870 0.0153 -0.00024 STORY4 D1 WWIND 239 2319.524 -143.617 1.3619 0.0162 -0.00024 STORY3 D1 WWIND 240 2320.417 -138.569 1.3248 0.0160 -0.00024 STORY2 D1 WWIND 241 2319.524 -143.617 1.2730 0.0159 -0.00025 STORY1 D1 WWIND 242 2317.821 -139.919 1.2058 0.0167 -0.00026
Appendix D.1 - ETABS Analysis Results
ETABS v8.2.6 - File: ETABS model 2 (with rigid diaphragm) - November 8,2003 7:59Plan View - STORY1 - Elevation 161 Restraint Reactions (WWIND) - Kip-in Units
AE 431W3D ETABS ModelETABS Appendix D.2 - ETABS Analysis Results
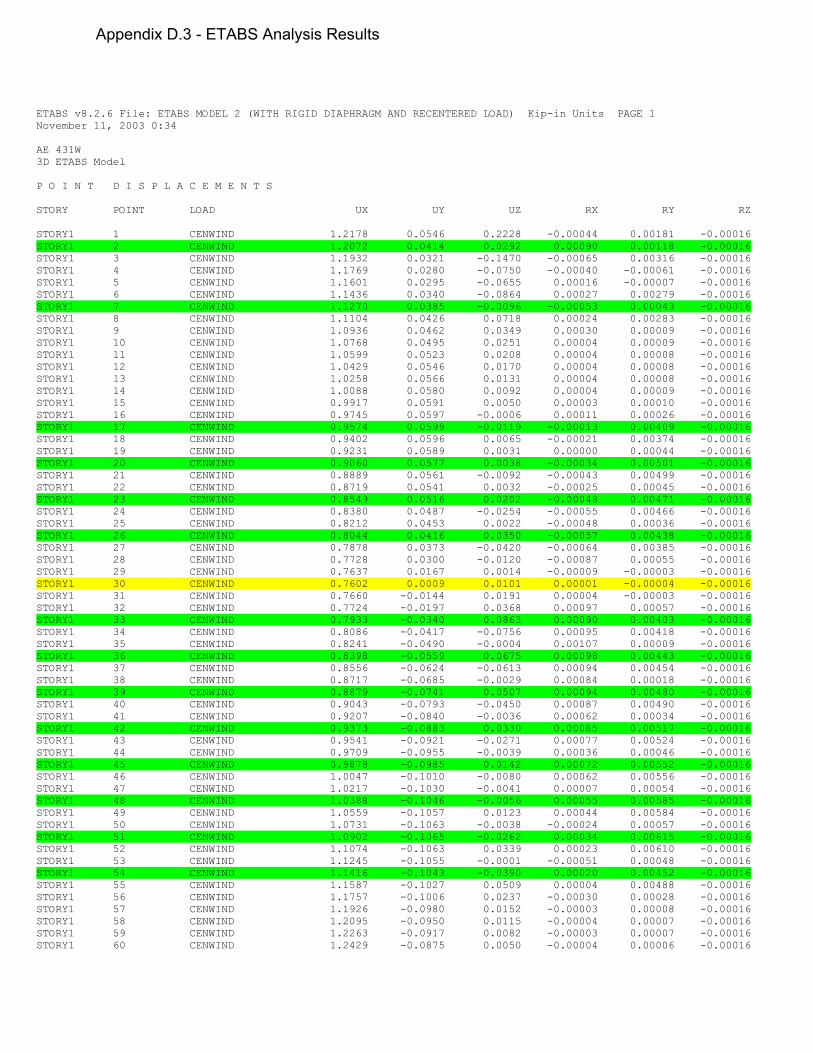
ETABS v8.2.6 File: ETABS MODEL 2 (WITH RIGID DIAPHRAGM AND RECENTERED LOAD) Kip-in Units PAGE 1 November 11, 2003 0:34 AE 431W 3D ETABS Model P O I N T D I S P L A C E M E N T S STORY POINT LOAD UX UY UZ RX RY RZ STORY1 1 CENWIND 1.2178 0.0546 0.2228 -0.00044 0.00181 -0.00016 STORY1 2 CENWIND 1.2072 0.0414 0.0292 0.00090 0.00118 -0.00016 STORY1 3 CENWIND 1.1932 0.0321 -0.1470 -0.00065 0.00316 -0.00016 STORY1 4 CENWIND 1.1769 0.0280 -0.0750 -0.00040 -0.00061 -0.00016 STORY1 5 CENWIND 1.1601 0.0295 -0.0655 0.00016 -0.00007 -0.00016 STORY1 6 CENWIND 1.1436 0.0340 -0.0864 0.00027 0.00279 -0.00016 STORY1 7 CENWIND 1.1270 0.0385 -0.0096 -0.00053 0.00043 -0.00016 STORY1 8 CENWIND 1.1104 0.0426 0.0718 0.00024 0.00283 -0.00016 STORY1 9 CENWIND 1.0936 0.0462 0.0349 0.00030 0.00009 -0.00016 STORY1 10 CENWIND 1.0768 0.0495 0.0251 0.00004 0.00009 -0.00016 STORY1 11 CENWIND 1.0599 0.0523 0.0208 0.00004 0.00008 -0.00016 STORY1 12 CENWIND 1.0429 0.0546 0.0170 0.00004 0.00008 -0.00016 STORY1 13 CENWIND 1.0258 0.0566 0.0131 0.00004 0.00008 -0.00016 STORY1 14 CENWIND 1.0088 0.0580 0.0092 0.00004 0.00009 -0.00016 STORY1 15 CENWIND 0.9917 0.0591 0.0050 0.00003 0.00010 -0.00016 STORY1 16 CENWIND 0.9745 0.0597 -0.0006 0.00011 0.00026 -0.00016 STORY1 17 CENWIND 0.9574 0.0599 -0.0119 -0.00013 0.00409 -0.00016 STORY1 18 CENWIND 0.9402 0.0596 0.0065 -0.00021 0.00374 -0.00016 STORY1 19 CENWIND 0.9231 0.0589 0.0031 0.00000 0.00044 -0.00016 STORY1 20 CENWIND 0.9060 0.0577 0.0038 -0.00034 0.00501 -0.00016 STORY1 21 CENWIND 0.8889 0.0561 -0.0092 -0.00043 0.00499 -0.00016 STORY1 22 CENWIND 0.8719 0.0541 0.0032 -0.00025 0.00045 -0.00016 STORY1 23 CENWIND 0.8549 0.0516 0.0202 -0.00048 0.00471 -0.00016 STORY1 24 CENWIND 0.8380 0.0487 -0.0254 -0.00055 0.00466 -0.00016 STORY1 25 CENWIND 0.8212 0.0453 0.0022 -0.00048 0.00036 -0.00016 STORY1 26 CENWIND 0.8044 0.0416 0.0350 -0.00057 0.00438 -0.00016 STORY1 27 CENWIND 0.7878 0.0373 -0.0420 -0.00064 0.00385 -0.00016 STORY1 28 CENWIND 0.7728 0.0300 -0.0120 -0.00087 0.00055 -0.00016 STORY1 29 CENWIND 0.7637 0.0167 0.0014 -0.00009 -0.00003 -0.00016 STORY1 30 CENWIND 0.7602 0.0009 0.0101 0.00001 -0.00004 -0.00016 STORY1 31 CENWIND 0.7660 -0.0144 0.0191 0.00004 -0.00003 -0.00016 STORY1 32 CENWIND 0.7724 -0.0197 0.0368 0.00097 0.00057 -0.00016 STORY1 33 CENWIND 0.7933 -0.0340 0.0863 0.00090 0.00403 -0.00016 STORY1 34 CENWIND 0.8086 -0.0417 -0.0756 0.00095 0.00418 -0.00016 STORY1 35 CENWIND 0.8241 -0.0490 -0.0004 0.00107 0.00009 -0.00016 STORY1 36 CENWIND 0.8398 -0.0559 0.0675 0.00098 0.00443 -0.00016 STORY1 37 CENWIND 0.8556 -0.0624 -0.0613 0.00094 0.00454 -0.00016 STORY1 38 CENWIND 0.8717 -0.0685 -0.0029 0.00084 0.00018 -0.00016 STORY1 39 CENWIND 0.8879 -0.0741 0.0507 0.00094 0.00480 -0.00016 STORY1 40 CENWIND 0.9043 -0.0793 -0.0450 0.00087 0.00490 -0.00016 STORY1 41 CENWIND 0.9207 -0.0840 -0.0036 0.00062 0.00034 -0.00016 STORY1 42 CENWIND 0.9373 -0.0883 0.0330 0.00085 0.00517 -0.00016 STORY1 43 CENWIND 0.9541 -0.0921 -0.0271 0.00077 0.00524 -0.00016 STORY1 44 CENWIND 0.9709 -0.0955 -0.0039 0.00036 0.00046 -0.00016 STORY1 45 CENWIND 0.9878 -0.0985 0.0142 0.00072 0.00552 -0.00016 STORY1 46 CENWIND 1.0047 -0.1010 -0.0080 0.00062 0.00556 -0.00016 STORY1 47 CENWIND 1.0217 -0.1030 -0.0041 0.00007 0.00054 -0.00016 STORY1 48 CENWIND 1.0388 -0.1046 -0.0056 0.00055 0.00585 -0.00016 STORY1 49 CENWIND 1.0559 -0.1057 0.0123 0.00044 0.00584 -0.00016 STORY1 50 CENWIND 1.0731 -0.1063 -0.0038 -0.00024 0.00057 -0.00016 STORY1 51 CENWIND 1.0902 -0.1065 -0.0262 0.00034 0.00615 -0.00016 STORY1 52 CENWIND 1.1074 -0.1063 0.0339 0.00023 0.00610 -0.00016 STORY1 53 CENWIND 1.1245 -0.1055 -0.0001 -0.00051 0.00048 -0.00016 STORY1 54 CENWIND 1.1416 -0.1043 -0.0390 0.00020 0.00452 -0.00016 STORY1 55 CENWIND 1.1587 -0.1027 0.0509 0.00004 0.00488 -0.00016 STORY1 56 CENWIND 1.1757 -0.1006 0.0237 -0.00030 0.00028 -0.00016 STORY1 57 CENWIND 1.1926 -0.0980 0.0152 -0.00003 0.00008 -0.00016 STORY1 58 CENWIND 1.2095 -0.0950 0.0115 -0.00004 0.00007 -0.00016 STORY1 59 CENWIND 1.2263 -0.0917 0.0082 -0.00003 0.00007 -0.00016 STORY1 60 CENWIND 1.2429 -0.0875 0.0050 -0.00004 0.00006 -0.00016
Appendix D.3 - ETABS Analysis Results
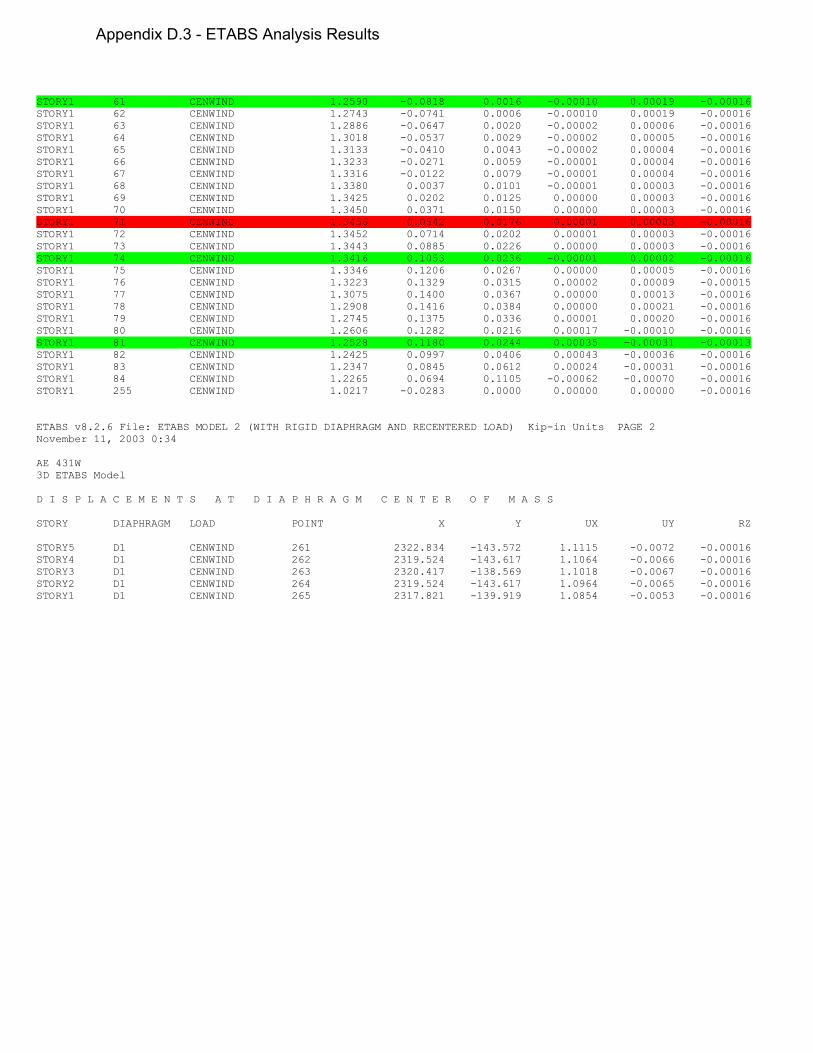
STORY1 61 CENWIND 1.2590 -0.0818 0.0016 -0.00010 0.00019 -0.00016 STORY1 62 CENWIND 1.2743 -0.0741 0.0006 -0.00010 0.00019 -0.00016 STORY1 63 CENWIND 1.2886 -0.0647 0.0020 -0.00002 0.00006 -0.00016 STORY1 64 CENWIND 1.3018 -0.0537 0.0029 -0.00002 0.00005 -0.00016 STORY1 65 CENWIND 1.3133 -0.0410 0.0043 -0.00002 0.00004 -0.00016 STORY1 66 CENWIND 1.3233 -0.0271 0.0059 -0.00001 0.00004 -0.00016 STORY1 67 CENWIND 1.3316 -0.0122 0.0079 -0.00001 0.00004 -0.00016 STORY1 68 CENWIND 1.3380 0.0037 0.0101 -0.00001 0.00003 -0.00016 STORY1 69 CENWIND 1.3425 0.0202 0.0125 0.00000 0.00003 -0.00016 STORY1 70 CENWIND 1.3450 0.0371 0.0150 0.00000 0.00003 -0.00016 STORY1 71 CENWIND 1.3456 0.0542 0.0176 0.00001 0.00003 -0.00016 STORY1 72 CENWIND 1.3452 0.0714 0.0202 0.00001 0.00003 -0.00016 STORY1 73 CENWIND 1.3443 0.0885 0.0226 0.00000 0.00003 -0.00016 STORY1 74 CENWIND 1.3416 0.1053 0.0236 -0.00001 0.00002 -0.00016 STORY1 75 CENWIND 1.3346 0.1206 0.0267 0.00000 0.00005 -0.00016 STORY1 76 CENWIND 1.3223 0.1329 0.0315 0.00002 0.00009 -0.00015 STORY1 77 CENWIND 1.3075 0.1400 0.0367 0.00000 0.00013 -0.00016 STORY1 78 CENWIND 1.2908 0.1416 0.0384 0.00000 0.00021 -0.00016 STORY1 79 CENWIND 1.2745 0.1375 0.0336 0.00001 0.00020 -0.00016 STORY1 80 CENWIND 1.2606 0.1282 0.0216 0.00017 -0.00010 -0.00016 STORY1 81 CENWIND 1.2528 0.1180 0.0244 0.00035 -0.00031 -0.00013 STORY1 82 CENWIND 1.2425 0.0997 0.0406 0.00043 -0.00036 -0.00016 STORY1 83 CENWIND 1.2347 0.0845 0.0612 0.00024 -0.00031 -0.00016 STORY1 84 CENWIND 1.2265 0.0694 0.1105 -0.00062 -0.00070 -0.00016 STORY1 255 CENWIND 1.0217 -0.0283 0.0000 0.00000 0.00000 -0.00016 ETABS v8.2.6 File: ETABS MODEL 2 (WITH RIGID DIAPHRAGM AND RECENTERED LOAD) Kip-in Units PAGE 2 November 11, 2003 0:34 AE 431W 3D ETABS Model D I S P L A C E M E N T S A T D I A P H R A G M C E N T E R O F M A S S STORY DIAPHRAGM LOAD POINT X Y UX UY RZ STORY5 D1 CENWIND 261 2322.834 -143.572 1.1115 -0.0072 -0.00016 STORY4 D1 CENWIND 262 2319.524 -143.617 1.1064 -0.0066 -0.00016 STORY3 D1 CENWIND 263 2320.417 -138.569 1.1018 -0.0067 -0.00016 STORY2 D1 CENWIND 264 2319.524 -143.617 1.0964 -0.0065 -0.00016 STORY1 D1 CENWIND 265 2317.821 -139.919 1.0854 -0.0053 -0.00016
Appendix D.3 - ETABS Analysis Results
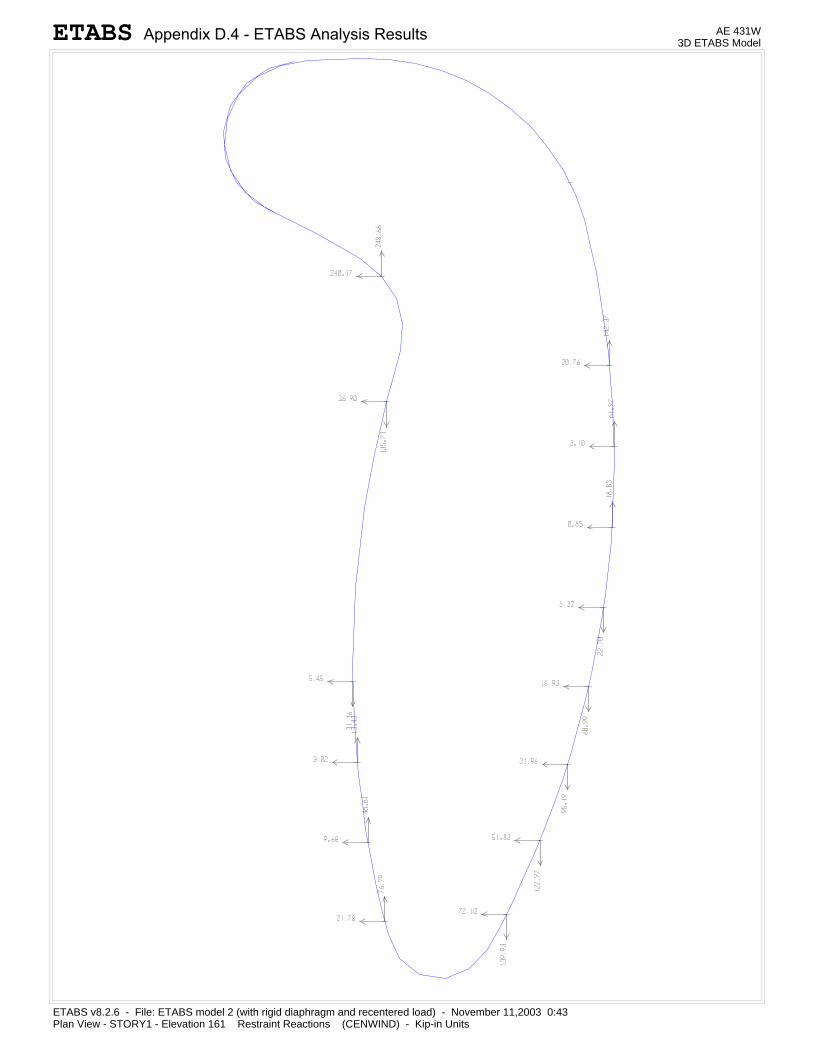
ETABS v8.2.6 - File: ETABS model 2 (with rigid diaphragm and recentered load) - November 11,2003 0:43Plan View - STORY1 - Elevation 161 Restraint Reactions (CENWIND) - Kip-in Units
AE 431W3D ETABS ModelETABS Appendix D.4 - ETABS Analysis Results
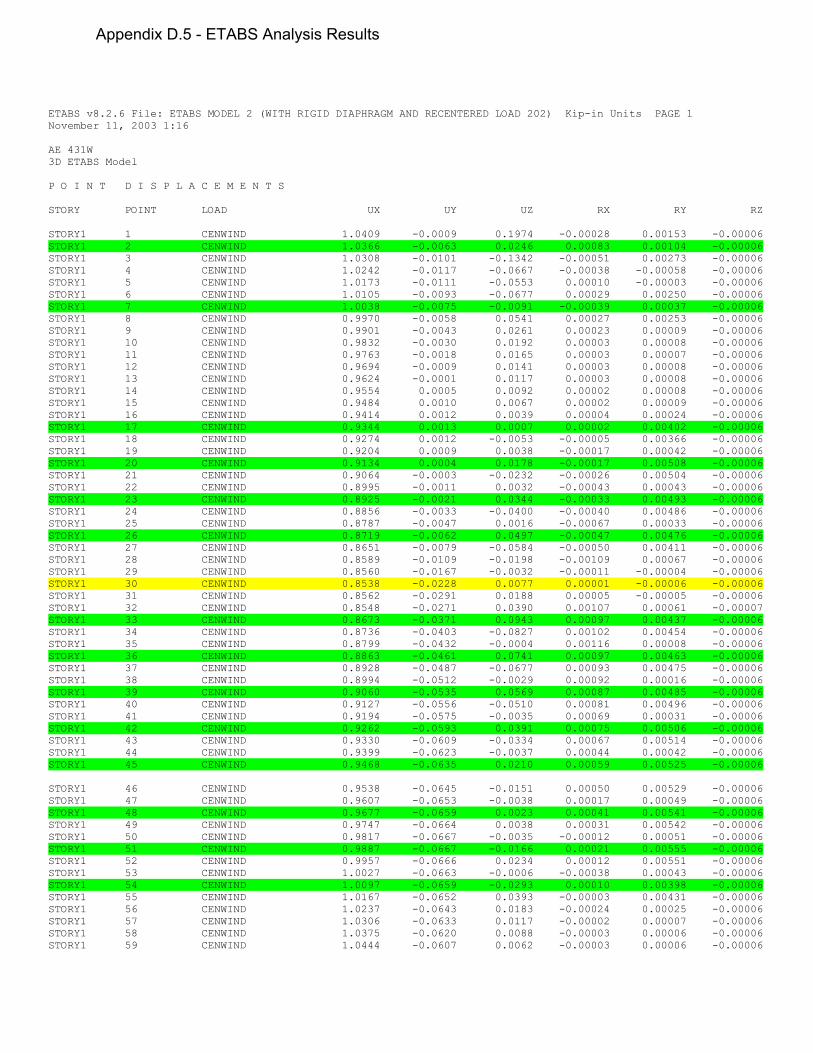
ETABS v8.2.6 File: ETABS MODEL 2 (WITH RIGID DIAPHRAGM AND RECENTERED LOAD 202) Kip-in Units PAGE 1 November 11, 2003 1:16 AE 431W 3D ETABS Model P O I N T D I S P L A C E M E N T S STORY POINT LOAD UX UY UZ RX RY RZ STORY1 1 CENWIND 1.0409 -0.0009 0.1974 -0.00028 0.00153 -0.00006 STORY1 2 CENWIND 1.0366 -0.0063 0.0246 0.00083 0.00104 -0.00006 STORY1 3 CENWIND 1.0308 -0.0101 -0.1342 -0.00051 0.00273 -0.00006 STORY1 4 CENWIND 1.0242 -0.0117 -0.0667 -0.00038 -0.00058 -0.00006 STORY1 5 CENWIND 1.0173 -0.0111 -0.0553 0.00010 -0.00003 -0.00006 STORY1 6 CENWIND 1.0105 -0.0093 -0.0677 0.00029 0.00250 -0.00006 STORY1 7 CENWIND 1.0038 -0.0075 -0.0091 -0.00039 0.00037 -0.00006 STORY1 8 CENWIND 0.9970 -0.0058 0.0541 0.00027 0.00253 -0.00006 STORY1 9 CENWIND 0.9901 -0.0043 0.0261 0.00023 0.00009 -0.00006 STORY1 10 CENWIND 0.9832 -0.0030 0.0192 0.00003 0.00008 -0.00006 STORY1 11 CENWIND 0.9763 -0.0018 0.0165 0.00003 0.00007 -0.00006 STORY1 12 CENWIND 0.9694 -0.0009 0.0141 0.00003 0.00008 -0.00006 STORY1 13 CENWIND 0.9624 -0.0001 0.0117 0.00003 0.00008 -0.00006 STORY1 14 CENWIND 0.9554 0.0005 0.0092 0.00002 0.00008 -0.00006 STORY1 15 CENWIND 0.9484 0.0010 0.0067 0.00002 0.00009 -0.00006 STORY1 16 CENWIND 0.9414 0.0012 0.0039 0.00004 0.00024 -0.00006 STORY1 17 CENWIND 0.9344 0.0013 0.0007 0.00002 0.00402 -0.00006 STORY1 18 CENWIND 0.9274 0.0012 -0.0053 -0.00005 0.00366 -0.00006 STORY1 19 CENWIND 0.9204 0.0009 0.0038 -0.00017 0.00042 -0.00006 STORY1 20 CENWIND 0.9134 0.0004 0.0178 -0.00017 0.00508 -0.00006 STORY1 21 CENWIND 0.9064 -0.0003 -0.0232 -0.00026 0.00504 -0.00006 STORY1 22 CENWIND 0.8995 -0.0011 0.0032 -0.00043 0.00043 -0.00006 STORY1 23 CENWIND 0.8925 -0.0021 0.0344 -0.00033 0.00493 -0.00006 STORY1 24 CENWIND 0.8856 -0.0033 -0.0400 -0.00040 0.00486 -0.00006 STORY1 25 CENWIND 0.8787 -0.0047 0.0016 -0.00067 0.00033 -0.00006 STORY1 26 CENWIND 0.8719 -0.0062 0.0497 -0.00047 0.00476 -0.00006 STORY1 27 CENWIND 0.8651 -0.0079 -0.0584 -0.00050 0.00411 -0.00006 STORY1 28 CENWIND 0.8589 -0.0109 -0.0198 -0.00109 0.00067 -0.00006 STORY1 29 CENWIND 0.8560 -0.0167 -0.0032 -0.00011 -0.00004 -0.00006 STORY1 30 CENWIND 0.8538 -0.0228 0.0077 0.00001 -0.00006 -0.00006 STORY1 31 CENWIND 0.8562 -0.0291 0.0188 0.00005 -0.00005 -0.00006 STORY1 32 CENWIND 0.8548 -0.0271 0.0390 0.00107 0.00061 -0.00007 STORY1 33 CENWIND 0.8673 -0.0371 0.0943 0.00097 0.00437 -0.00006 STORY1 34 CENWIND 0.8736 -0.0403 -0.0827 0.00102 0.00454 -0.00006 STORY1 35 CENWIND 0.8799 -0.0432 -0.0004 0.00116 0.00008 -0.00006 STORY1 36 CENWIND 0.8863 -0.0461 0.0741 0.00097 0.00463 -0.00006 STORY1 37 CENWIND 0.8928 -0.0487 -0.0677 0.00093 0.00475 -0.00006 STORY1 38 CENWIND 0.8994 -0.0512 -0.0029 0.00092 0.00016 -0.00006 STORY1 39 CENWIND 0.9060 -0.0535 0.0569 0.00087 0.00485 -0.00006 STORY1 40 CENWIND 0.9127 -0.0556 -0.0510 0.00081 0.00496 -0.00006 STORY1 41 CENWIND 0.9194 -0.0575 -0.0035 0.00069 0.00031 -0.00006 STORY1 42 CENWIND 0.9262 -0.0593 0.0391 0.00075 0.00506 -0.00006 STORY1 43 CENWIND 0.9330 -0.0609 -0.0334 0.00067 0.00514 -0.00006 STORY1 44 CENWIND 0.9399 -0.0623 -0.0037 0.00044 0.00042 -0.00006 STORY1 45 CENWIND 0.9468 -0.0635 0.0210 0.00059 0.00525 -0.00006 STORY1 46 CENWIND 0.9538 -0.0645 -0.0151 0.00050 0.00529 -0.00006 STORY1 47 CENWIND 0.9607 -0.0653 -0.0038 0.00017 0.00049 -0.00006 STORY1 48 CENWIND 0.9677 -0.0659 0.0023 0.00041 0.00541 -0.00006 STORY1 49 CENWIND 0.9747 -0.0664 0.0038 0.00031 0.00542 -0.00006 STORY1 50 CENWIND 0.9817 -0.0667 -0.0035 -0.00012 0.00051 -0.00006 STORY1 51 CENWIND 0.9887 -0.0667 -0.0166 0.00021 0.00555 -0.00006 STORY1 52 CENWIND 0.9957 -0.0666 0.0234 0.00012 0.00551 -0.00006 STORY1 53 CENWIND 1.0027 -0.0663 -0.0006 -0.00038 0.00043 -0.00006 STORY1 54 CENWIND 1.0097 -0.0659 -0.0293 0.00010 0.00398 -0.00006 STORY1 55 CENWIND 1.0167 -0.0652 0.0393 -0.00003 0.00431 -0.00006 STORY1 56 CENWIND 1.0237 -0.0643 0.0183 -0.00024 0.00025 -0.00006 STORY1 57 CENWIND 1.0306 -0.0633 0.0117 -0.00002 0.00007 -0.00006 STORY1 58 CENWIND 1.0375 -0.0620 0.0088 -0.00003 0.00006 -0.00006 STORY1 59 CENWIND 1.0444 -0.0607 0.0062 -0.00003 0.00006 -0.00006
Appendix D.5 - ETABS Analysis Results
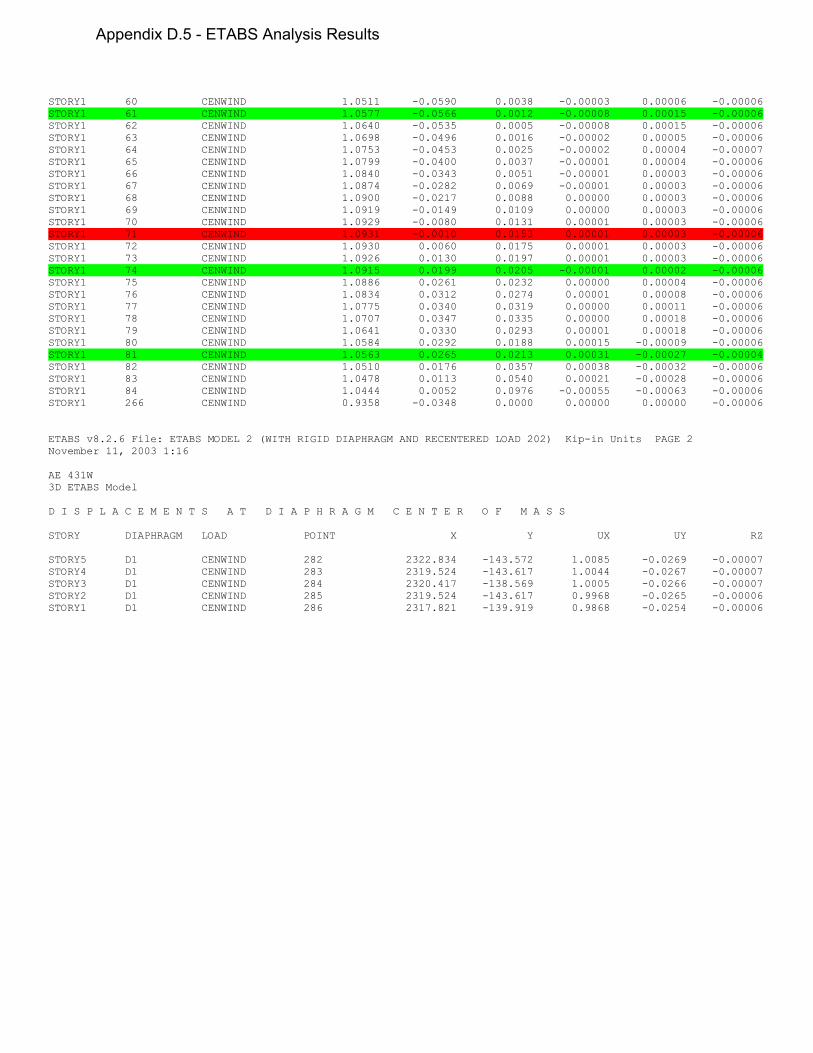
STORY1 60 CENWIND 1.0511 -0.0590 0.0038 -0.00003 0.00006 -0.00006 STORY1 61 CENWIND 1.0577 -0.0566 0.0012 -0.00008 0.00015 -0.00006 STORY1 62 CENWIND 1.0640 -0.0535 0.0005 -0.00008 0.00015 -0.00006 STORY1 63 CENWIND 1.0698 -0.0496 0.0016 -0.00002 0.00005 -0.00006 STORY1 64 CENWIND 1.0753 -0.0453 0.0025 -0.00002 0.00004 -0.00007 STORY1 65 CENWIND 1.0799 -0.0400 0.0037 -0.00001 0.00004 -0.00006 STORY1 66 CENWIND 1.0840 -0.0343 0.0051 -0.00001 0.00003 -0.00006 STORY1 67 CENWIND 1.0874 -0.0282 0.0069 -0.00001 0.00003 -0.00006 STORY1 68 CENWIND 1.0900 -0.0217 0.0088 0.00000 0.00003 -0.00006 STORY1 69 CENWIND 1.0919 -0.0149 0.0109 0.00000 0.00003 -0.00006 STORY1 70 CENWIND 1.0929 -0.0080 0.0131 0.00001 0.00003 -0.00006 STORY1 71 CENWIND 1.0931 -0.0010 0.0153 0.00001 0.00003 -0.00006 STORY1 72 CENWIND 1.0930 0.0060 0.0175 0.00001 0.00003 -0.00006 STORY1 73 CENWIND 1.0926 0.0130 0.0197 0.00001 0.00003 -0.00006 STORY1 74 CENWIND 1.0915 0.0199 0.0205 -0.00001 0.00002 -0.00006 STORY1 75 CENWIND 1.0886 0.0261 0.0232 0.00000 0.00004 -0.00006 STORY1 76 CENWIND 1.0834 0.0312 0.0274 0.00001 0.00008 -0.00006 STORY1 77 CENWIND 1.0775 0.0340 0.0319 0.00000 0.00011 -0.00006 STORY1 78 CENWIND 1.0707 0.0347 0.0335 0.00000 0.00018 -0.00006 STORY1 79 CENWIND 1.0641 0.0330 0.0293 0.00001 0.00018 -0.00006 STORY1 80 CENWIND 1.0584 0.0292 0.0188 0.00015 -0.00009 -0.00006 STORY1 81 CENWIND 1.0563 0.0265 0.0213 0.00031 -0.00027 -0.00004 STORY1 82 CENWIND 1.0510 0.0176 0.0357 0.00038 -0.00032 -0.00006 STORY1 83 CENWIND 1.0478 0.0113 0.0540 0.00021 -0.00028 -0.00006 STORY1 84 CENWIND 1.0444 0.0052 0.0976 -0.00055 -0.00063 -0.00006 STORY1 266 CENWIND 0.9358 -0.0348 0.0000 0.00000 0.00000 -0.00006 ETABS v8.2.6 File: ETABS MODEL 2 (WITH RIGID DIAPHRAGM AND RECENTERED LOAD 202) Kip-in Units PAGE 2 November 11, 2003 1:16 AE 431W 3D ETABS Model D I S P L A C E M E N T S A T D I A P H R A G M C E N T E R O F M A S S STORY DIAPHRAGM LOAD POINT X Y UX UY RZ STORY5 D1 CENWIND 282 2322.834 -143.572 1.0085 -0.0269 -0.00007 STORY4 D1 CENWIND 283 2319.524 -143.617 1.0044 -0.0267 -0.00007 STORY3 D1 CENWIND 284 2320.417 -138.569 1.0005 -0.0266 -0.00007 STORY2 D1 CENWIND 285 2319.524 -143.617 0.9968 -0.0265 -0.00006 STORY1 D1 CENWIND 286 2317.821 -139.919 0.9868 -0.0254 -0.00006
Appendix D.5 - ETABS Analysis Results
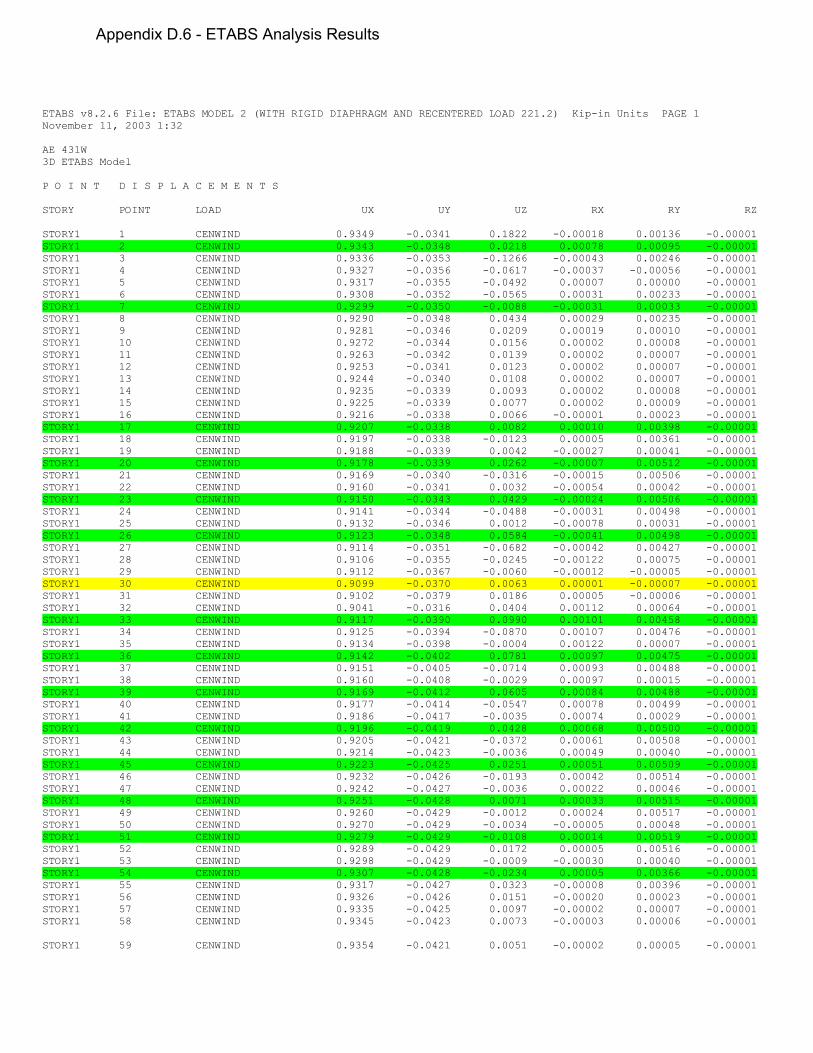
ETABS v8.2.6 File: ETABS MODEL 2 (WITH RIGID DIAPHRAGM AND RECENTERED LOAD 221.2) Kip-in Units PAGE 1 November 11, 2003 1:32 AE 431W 3D ETABS Model P O I N T D I S P L A C E M E N T S STORY POINT LOAD UX UY UZ RX RY RZ STORY1 1 CENWIND 0.9349 -0.0341 0.1822 -0.00018 0.00136 -0.00001 STORY1 2 CENWIND 0.9343 -0.0348 0.0218 0.00078 0.00095 -0.00001 STORY1 3 CENWIND 0.9336 -0.0353 -0.1266 -0.00043 0.00246 -0.00001 STORY1 4 CENWIND 0.9327 -0.0356 -0.0617 -0.00037 -0.00056 -0.00001 STORY1 5 CENWIND 0.9317 -0.0355 -0.0492 0.00007 0.00000 -0.00001 STORY1 6 CENWIND 0.9308 -0.0352 -0.0565 0.00031 0.00233 -0.00001 STORY1 7 CENWIND 0.9299 -0.0350 -0.0088 -0.00031 0.00033 -0.00001 STORY1 8 CENWIND 0.9290 -0.0348 0.0434 0.00029 0.00235 -0.00001 STORY1 9 CENWIND 0.9281 -0.0346 0.0209 0.00019 0.00010 -0.00001 STORY1 10 CENWIND 0.9272 -0.0344 0.0156 0.00002 0.00008 -0.00001 STORY1 11 CENWIND 0.9263 -0.0342 0.0139 0.00002 0.00007 -0.00001 STORY1 12 CENWIND 0.9253 -0.0341 0.0123 0.00002 0.00007 -0.00001 STORY1 13 CENWIND 0.9244 -0.0340 0.0108 0.00002 0.00007 -0.00001 STORY1 14 CENWIND 0.9235 -0.0339 0.0093 0.00002 0.00008 -0.00001 STORY1 15 CENWIND 0.9225 -0.0339 0.0077 0.00002 0.00009 -0.00001 STORY1 16 CENWIND 0.9216 -0.0338 0.0066 -0.00001 0.00023 -0.00001 STORY1 17 CENWIND 0.9207 -0.0338 0.0082 0.00010 0.00398 -0.00001 STORY1 18 CENWIND 0.9197 -0.0338 -0.0123 0.00005 0.00361 -0.00001 STORY1 19 CENWIND 0.9188 -0.0339 0.0042 -0.00027 0.00041 -0.00001 STORY1 20 CENWIND 0.9178 -0.0339 0.0262 -0.00007 0.00512 -0.00001 STORY1 21 CENWIND 0.9169 -0.0340 -0.0316 -0.00015 0.00506 -0.00001 STORY1 22 CENWIND 0.9160 -0.0341 0.0032 -0.00054 0.00042 -0.00001 STORY1 23 CENWIND 0.9150 -0.0343 0.0429 -0.00024 0.00506 -0.00001 STORY1 24 CENWIND 0.9141 -0.0344 -0.0488 -0.00031 0.00498 -0.00001 STORY1 25 CENWIND 0.9132 -0.0346 0.0012 -0.00078 0.00031 -0.00001 STORY1 26 CENWIND 0.9123 -0.0348 0.0584 -0.00041 0.00498 -0.00001 STORY1 27 CENWIND 0.9114 -0.0351 -0.0682 -0.00042 0.00427 -0.00001 STORY1 28 CENWIND 0.9106 -0.0355 -0.0245 -0.00122 0.00075 -0.00001 STORY1 29 CENWIND 0.9112 -0.0367 -0.0060 -0.00012 -0.00005 -0.00001 STORY1 30 CENWIND 0.9099 -0.0370 0.0063 0.00001 -0.00007 -0.00001 STORY1 31 CENWIND 0.9102 -0.0379 0.0186 0.00005 -0.00006 -0.00001 STORY1 32 CENWIND 0.9041 -0.0316 0.0404 0.00112 0.00064 -0.00001 STORY1 33 CENWIND 0.9117 -0.0390 0.0990 0.00101 0.00458 -0.00001 STORY1 34 CENWIND 0.9125 -0.0394 -0.0870 0.00107 0.00476 -0.00001 STORY1 35 CENWIND 0.9134 -0.0398 -0.0004 0.00122 0.00007 -0.00001 STORY1 36 CENWIND 0.9142 -0.0402 0.0781 0.00097 0.00475 -0.00001 STORY1 37 CENWIND 0.9151 -0.0405 -0.0714 0.00093 0.00488 -0.00001 STORY1 38 CENWIND 0.9160 -0.0408 -0.0029 0.00097 0.00015 -0.00001 STORY1 39 CENWIND 0.9169 -0.0412 0.0605 0.00084 0.00488 -0.00001 STORY1 40 CENWIND 0.9177 -0.0414 -0.0547 0.00078 0.00499 -0.00001 STORY1 41 CENWIND 0.9186 -0.0417 -0.0035 0.00074 0.00029 -0.00001 STORY1 42 CENWIND 0.9196 -0.0419 0.0428 0.00068 0.00500 -0.00001 STORY1 43 CENWIND 0.9205 -0.0421 -0.0372 0.00061 0.00508 -0.00001 STORY1 44 CENWIND 0.9214 -0.0423 -0.0036 0.00049 0.00040 -0.00001 STORY1 45 CENWIND 0.9223 -0.0425 0.0251 0.00051 0.00509 -0.00001 STORY1 46 CENWIND 0.9232 -0.0426 -0.0193 0.00042 0.00514 -0.00001 STORY1 47 CENWIND 0.9242 -0.0427 -0.0036 0.00022 0.00046 -0.00001 STORY1 48 CENWIND 0.9251 -0.0428 0.0071 0.00033 0.00515 -0.00001 STORY1 49 CENWIND 0.9260 -0.0429 -0.0012 0.00024 0.00517 -0.00001 STORY1 50 CENWIND 0.9270 -0.0429 -0.0034 -0.00005 0.00048 -0.00001 STORY1 51 CENWIND 0.9279 -0.0429 -0.0108 0.00014 0.00519 -0.00001 STORY1 52 CENWIND 0.9289 -0.0429 0.0172 0.00005 0.00516 -0.00001 STORY1 53 CENWIND 0.9298 -0.0429 -0.0009 -0.00030 0.00040 -0.00001 STORY1 54 CENWIND 0.9307 -0.0428 -0.0234 0.00005 0.00366 -0.00001 STORY1 55 CENWIND 0.9317 -0.0427 0.0323 -0.00008 0.00396 -0.00001 STORY1 56 CENWIND 0.9326 -0.0426 0.0151 -0.00020 0.00023 -0.00001 STORY1 57 CENWIND 0.9335 -0.0425 0.0097 -0.00002 0.00007 -0.00001 STORY1 58 CENWIND 0.9345 -0.0423 0.0073 -0.00003 0.00006 -0.00001 STORY1 59 CENWIND 0.9354 -0.0421 0.0051 -0.00002 0.00005 -0.00001
Appendix D.6 - ETABS Analysis Results
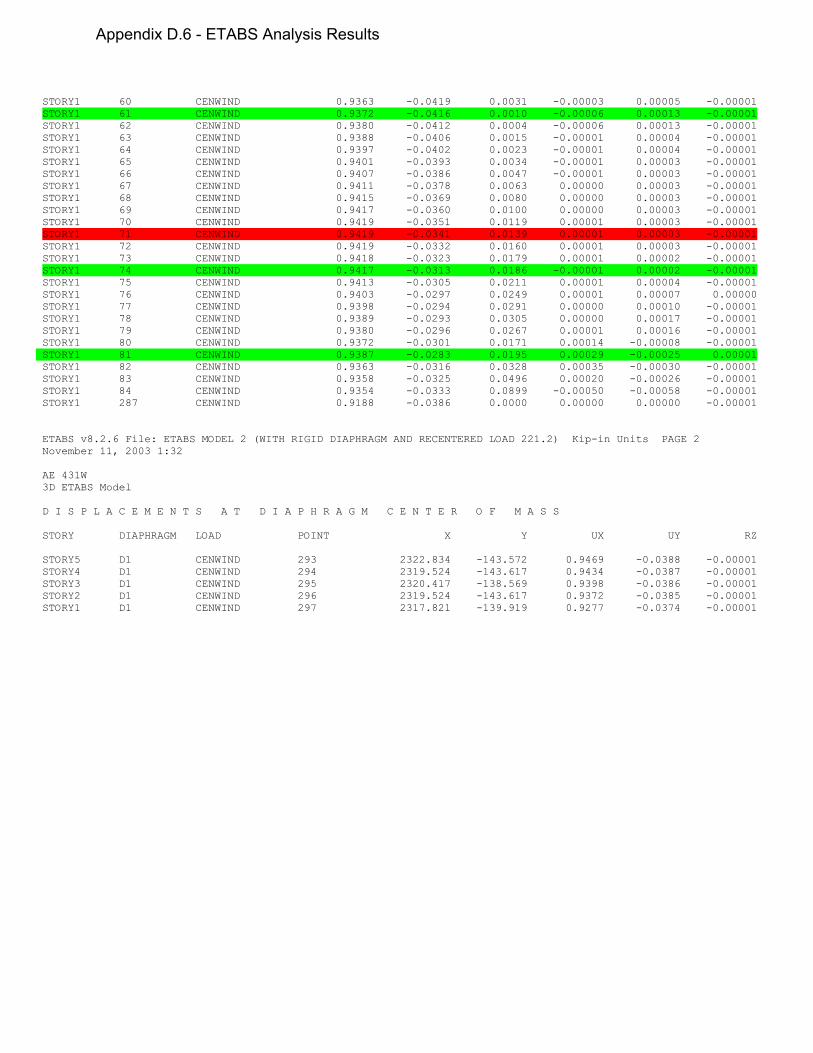
STORY1 60 CENWIND 0.9363 -0.0419 0.0031 -0.00003 0.00005 -0.00001 STORY1 61 CENWIND 0.9372 -0.0416 0.0010 -0.00006 0.00013 -0.00001 STORY1 62 CENWIND 0.9380 -0.0412 0.0004 -0.00006 0.00013 -0.00001 STORY1 63 CENWIND 0.9388 -0.0406 0.0015 -0.00001 0.00004 -0.00001 STORY1 64 CENWIND 0.9397 -0.0402 0.0023 -0.00001 0.00004 -0.00001 STORY1 65 CENWIND 0.9401 -0.0393 0.0034 -0.00001 0.00003 -0.00001 STORY1 66 CENWIND 0.9407 -0.0386 0.0047 -0.00001 0.00003 -0.00001 STORY1 67 CENWIND 0.9411 -0.0378 0.0063 0.00000 0.00003 -0.00001 STORY1 68 CENWIND 0.9415 -0.0369 0.0080 0.00000 0.00003 -0.00001 STORY1 69 CENWIND 0.9417 -0.0360 0.0100 0.00000 0.00003 -0.00001 STORY1 70 CENWIND 0.9419 -0.0351 0.0119 0.00001 0.00003 -0.00001 STORY1 71 CENWIND 0.9419 -0.0341 0.0139 0.00001 0.00003 -0.00001 STORY1 72 CENWIND 0.9419 -0.0332 0.0160 0.00001 0.00003 -0.00001 STORY1 73 CENWIND 0.9418 -0.0323 0.0179 0.00001 0.00002 -0.00001 STORY1 74 CENWIND 0.9417 -0.0313 0.0186 -0.00001 0.00002 -0.00001 STORY1 75 CENWIND 0.9413 -0.0305 0.0211 0.00001 0.00004 -0.00001 STORY1 76 CENWIND 0.9403 -0.0297 0.0249 0.00001 0.00007 0.00000 STORY1 77 CENWIND 0.9398 -0.0294 0.0291 0.00000 0.00010 -0.00001 STORY1 78 CENWIND 0.9389 -0.0293 0.0305 0.00000 0.00017 -0.00001 STORY1 79 CENWIND 0.9380 -0.0296 0.0267 0.00001 0.00016 -0.00001 STORY1 80 CENWIND 0.9372 -0.0301 0.0171 0.00014 -0.00008 -0.00001 STORY1 81 CENWIND 0.9387 -0.0283 0.0195 0.00029 -0.00025 0.00001 STORY1 82 CENWIND 0.9363 -0.0316 0.0328 0.00035 -0.00030 -0.00001 STORY1 83 CENWIND 0.9358 -0.0325 0.0496 0.00020 -0.00026 -0.00001 STORY1 84 CENWIND 0.9354 -0.0333 0.0899 -0.00050 -0.00058 -0.00001 STORY1 287 CENWIND 0.9188 -0.0386 0.0000 0.00000 0.00000 -0.00001 ETABS v8.2.6 File: ETABS MODEL 2 (WITH RIGID DIAPHRAGM AND RECENTERED LOAD 221.2) Kip-in Units PAGE 2 November 11, 2003 1:32 AE 431W 3D ETABS Model D I S P L A C E M E N T S A T D I A P H R A G M C E N T E R O F M A S S STORY DIAPHRAGM LOAD POINT X Y UX UY RZ STORY5 D1 CENWIND 293 2322.834 -143.572 0.9469 -0.0388 -0.00001 STORY4 D1 CENWIND 294 2319.524 -143.617 0.9434 -0.0387 -0.00001 STORY3 D1 CENWIND 295 2320.417 -138.569 0.9398 -0.0386 -0.00001 STORY2 D1 CENWIND 296 2319.524 -143.617 0.9372 -0.0385 -0.00001 STORY1 D1 CENWIND 297 2317.821 -139.919 0.9277 -0.0374 -0.00001
Appendix D.6 - ETABS Analysis Results
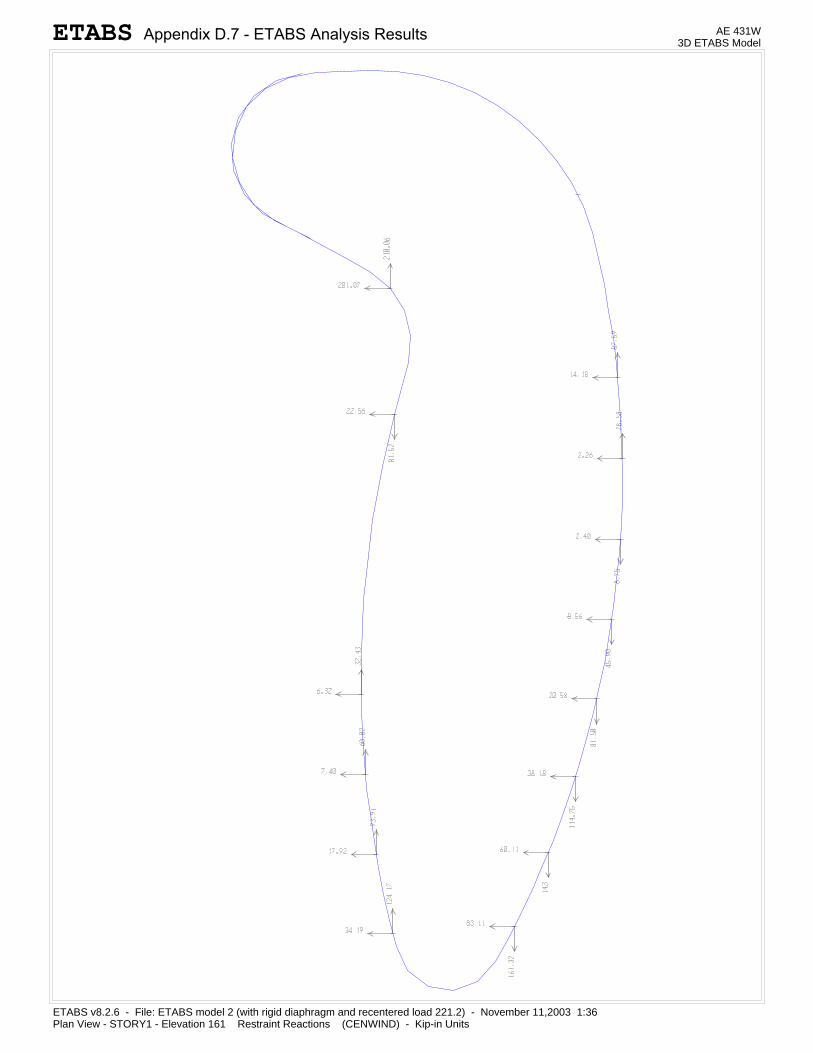
ETABS v8.2.6 - File: ETABS model 2 (with rigid diaphragm and recentered load 221.2) - November 11,2003 1:36Plan View - STORY1 - Elevation 161 Restraint Reactions (CENWIND) - Kip-in Units
AE 431W3D ETABS ModelETABS Appendix D.7 - ETABS Analysis Results
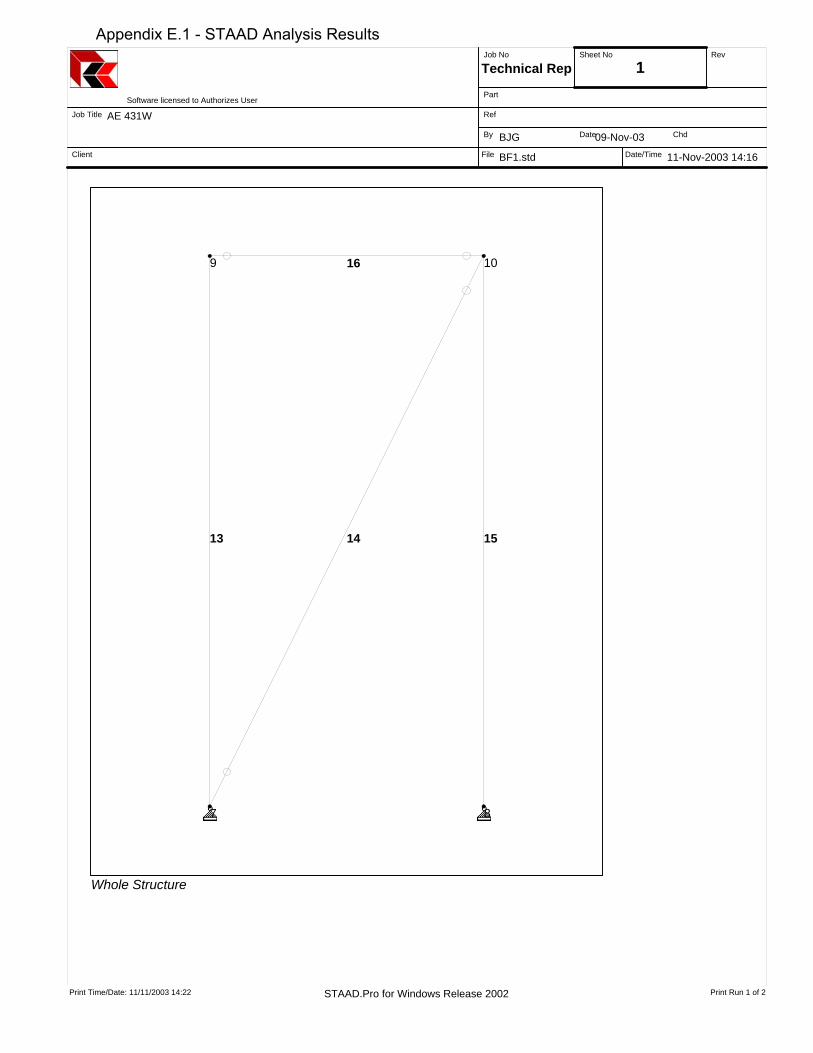
Software licensed to Authorizes User
Job Title
Client
Job No Sheet No Rev
Part
Ref
By Date Chd
File Date/Time
Technical Rep 1
AE 431W
BJG 09-Nov-03
11-Nov-2003 14:16BF1.std
Print Time/Date: 11/11/2003 14:22 Print Run 1 of 2STAAD.Pro for Windows Release 2002
13 14 15
16
7 8
9 10
Whole Structure
Appendix E.1 - STAAD Analysis Results
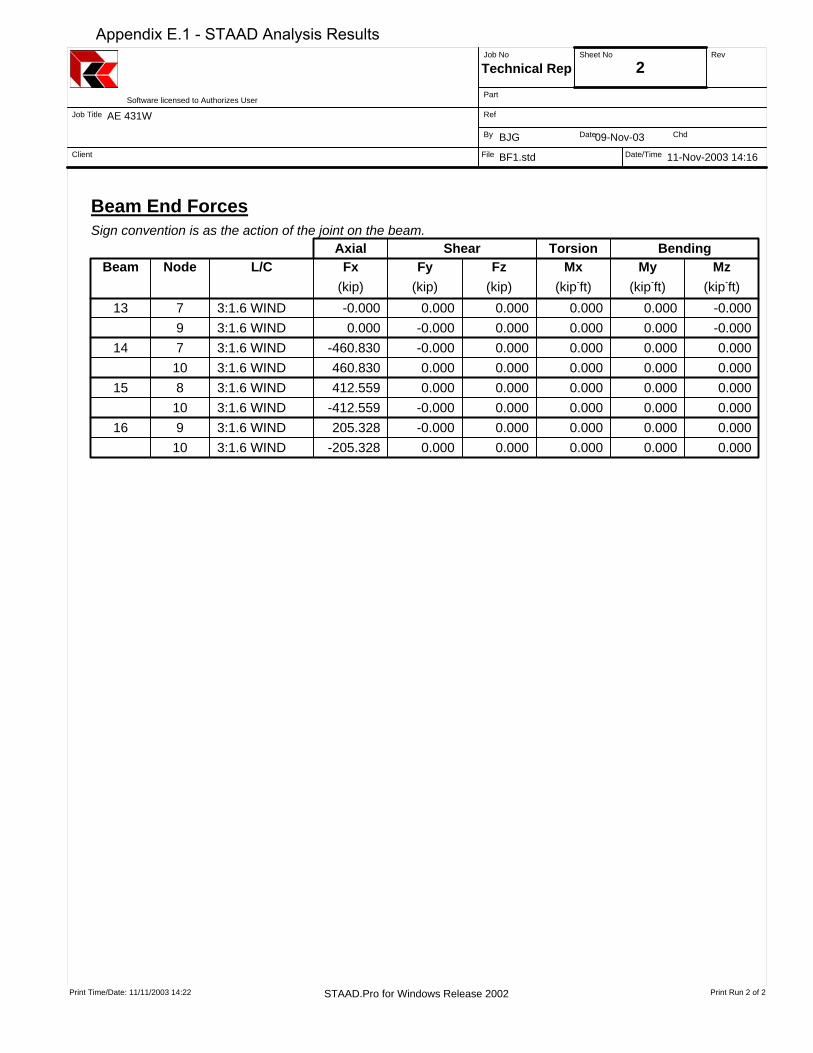
Software licensed to Authorizes User
Job Title
Client
Job No Sheet No Rev
Part
Ref
By Date Chd
File Date/Time
Technical Rep 2
AE 431W
BJG 09-Nov-03
11-Nov-2003 14:16BF1.std
Print Time/Date: 11/11/2003 14:22 Print Run 2 of 2STAAD.Pro for Windows Release 2002
Beam End ForcesSign convention is as the action of the joint on the beam.
Axial Shear Torsion BendingBeam Node L/C Fx
(kip)Fy
(kip)Fz
(kip)Mx
(kip-ft)My
(kip-ft)Mz
(kip-ft)13 7 3:1.6 WIND -0.000 0.000 0.000 0.000 0.000 -0.000
9 3:1.6 WIND 0.000 -0.000 0.000 0.000 0.000 -0.00014 7 3:1.6 WIND -460.830 -0.000 0.000 0.000 0.000 0.000
10 3:1.6 WIND 460.830 0.000 0.000 0.000 0.000 0.00015 8 3:1.6 WIND 412.559 0.000 0.000 0.000 0.000 0.000
10 3:1.6 WIND -412.559 -0.000 0.000 0.000 0.000 0.00016 9 3:1.6 WIND 205.328 -0.000 0.000 0.000 0.000 0.000
10 3:1.6 WIND -205.328 0.000 0.000 0.000 0.000 0.000
Appendix E.1 - STAAD Analysis Results

Software licensed to Authorizes User
Job Title
Client
Job No Sheet No Rev
Part
Ref
By Date Chd
File Date/Time
Technical Rep 1
AE 431W
BJG 09-Nov-03
11-Nov-2003 14:30BF4.std
Print Time/Date: 11/11/2003 14:32 Print Run 1 of 2STAAD.Pro for Windows Release 2002
13 14 15
16
7 8
9 10
Whole Structure
Appendix E.2 - STAAD Analysis Results
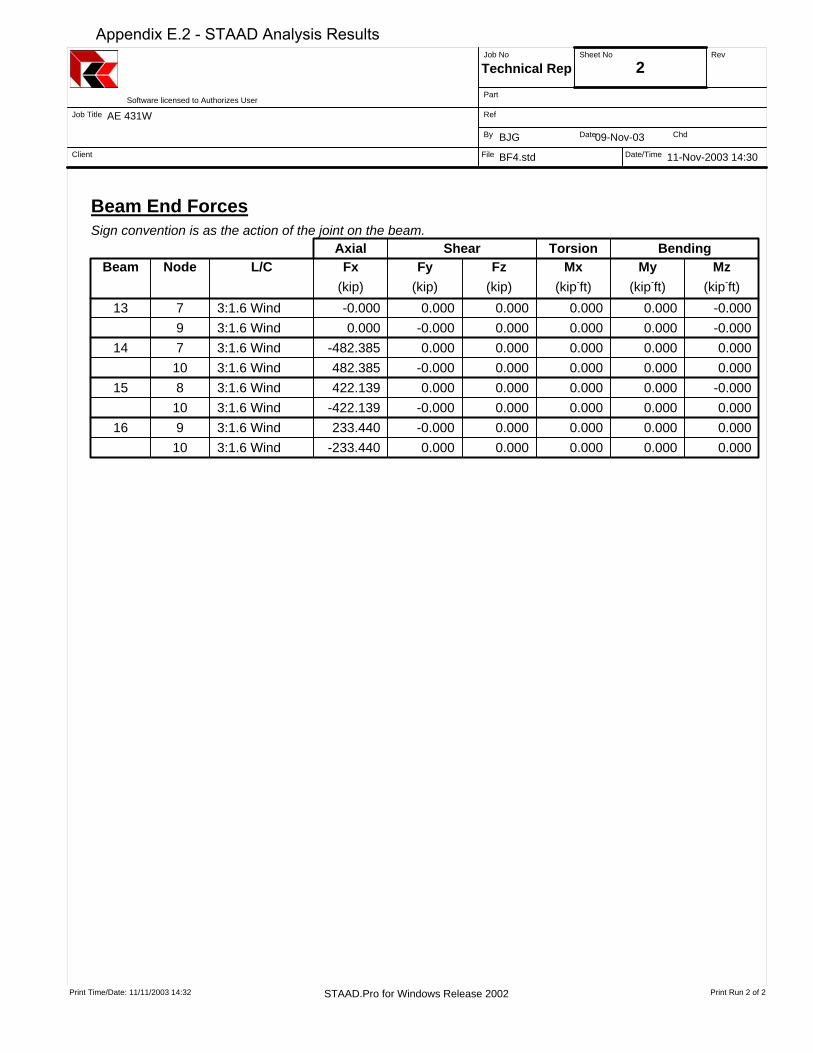
Software licensed to Authorizes User
Job Title
Client
Job No Sheet No Rev
Part
Ref
By Date Chd
File Date/Time
Technical Rep 2
AE 431W
BJG 09-Nov-03
11-Nov-2003 14:30BF4.std
Print Time/Date: 11/11/2003 14:32 Print Run 2 of 2STAAD.Pro for Windows Release 2002
Beam End ForcesSign convention is as the action of the joint on the beam.
Axial Shear Torsion BendingBeam Node L/C Fx
(kip)Fy
(kip)Fz
(kip)Mx
(kip-ft)My
(kip-ft)Mz
(kip-ft)13 7 3:1.6 Wind -0.000 0.000 0.000 0.000 0.000 -0.000
9 3:1.6 Wind 0.000 -0.000 0.000 0.000 0.000 -0.00014 7 3:1.6 Wind -482.385 0.000 0.000 0.000 0.000 0.000
10 3:1.6 Wind 482.385 -0.000 0.000 0.000 0.000 0.00015 8 3:1.6 Wind 422.139 0.000 0.000 0.000 0.000 -0.000
10 3:1.6 Wind -422.139 -0.000 0.000 0.000 0.000 0.00016 9 3:1.6 Wind 233.440 -0.000 0.000 0.000 0.000 0.000
10 3:1.6 Wind -233.440 0.000 0.000 0.000 0.000 0.000
Appendix E.2 - STAAD Analysis Results
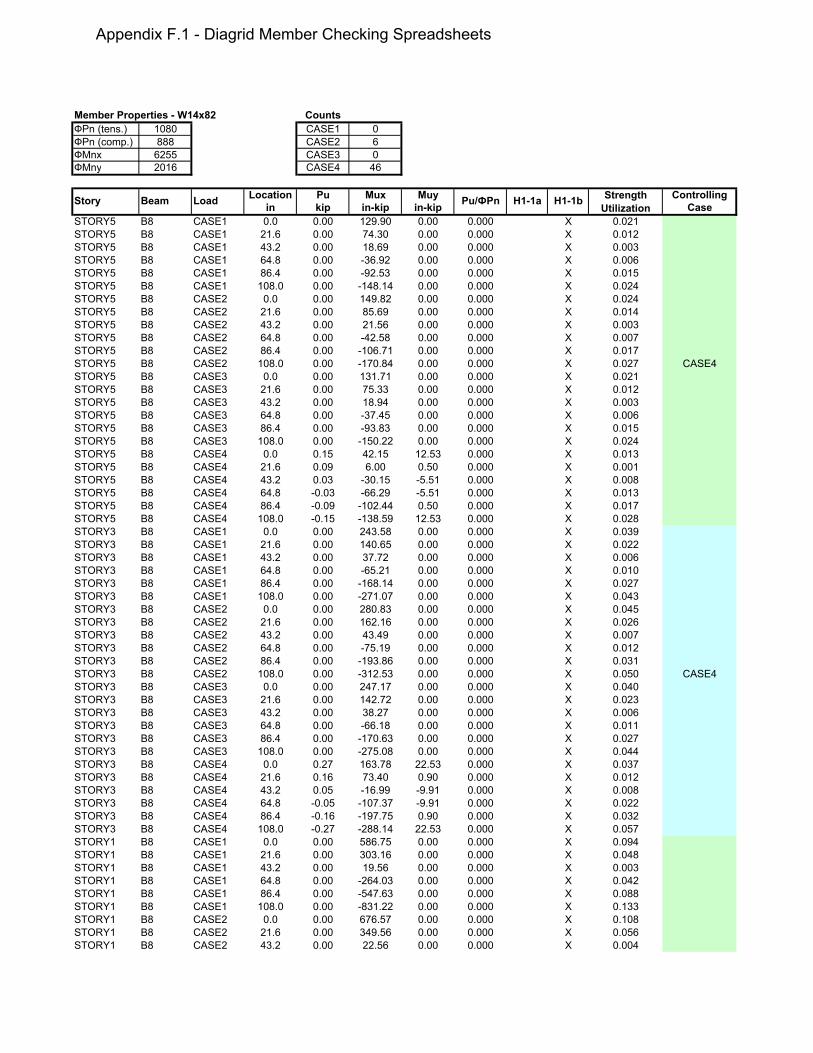
Member Properties - W14x82 CountsФPn (tens.) 1080 CASE1 0ФPn (comp.) 888 CASE2 6ФMnx 6255 CASE3 0ФMny 2016 CASE4 46
Location Pu Mux Muy Strength Controllingin kip in-kip in-kip Utilization Case
STORY5 B8 CASE1 0.0 0.00 129.90 0.00 0.000 X 0.021STORY5 B8 CASE1 21.6 0.00 74.30 0.00 0.000 X 0.012STORY5 B8 CASE1 43.2 0.00 18.69 0.00 0.000 X 0.003STORY5 B8 CASE1 64.8 0.00 -36.92 0.00 0.000 X 0.006STORY5 B8 CASE1 86.4 0.00 -92.53 0.00 0.000 X 0.015STORY5 B8 CASE1 108.0 0.00 -148.14 0.00 0.000 X 0.024STORY5 B8 CASE2 0.0 0.00 149.82 0.00 0.000 X 0.024STORY5 B8 CASE2 21.6 0.00 85.69 0.00 0.000 X 0.014STORY5 B8 CASE2 43.2 0.00 21.56 0.00 0.000 X 0.003STORY5 B8 CASE2 64.8 0.00 -42.58 0.00 0.000 X 0.007STORY5 B8 CASE2 86.4 0.00 -106.71 0.00 0.000 X 0.017STORY5 B8 CASE2 108.0 0.00 -170.84 0.00 0.000 X 0.027 CASE4STORY5 B8 CASE3 0.0 0.00 131.71 0.00 0.000 X 0.021STORY5 B8 CASE3 21.6 0.00 75.33 0.00 0.000 X 0.012STORY5 B8 CASE3 43.2 0.00 18.94 0.00 0.000 X 0.003STORY5 B8 CASE3 64.8 0.00 -37.45 0.00 0.000 X 0.006STORY5 B8 CASE3 86.4 0.00 -93.83 0.00 0.000 X 0.015STORY5 B8 CASE3 108.0 0.00 -150.22 0.00 0.000 X 0.024STORY5 B8 CASE4 0.0 0.15 42.15 12.53 0.000 X 0.013STORY5 B8 CASE4 21.6 0.09 6.00 0.50 0.000 X 0.001STORY5 B8 CASE4 43.2 0.03 -30.15 -5.51 0.000 X 0.008STORY5 B8 CASE4 64.8 -0.03 -66.29 -5.51 0.000 X 0.013STORY5 B8 CASE4 86.4 -0.09 -102.44 0.50 0.000 X 0.017STORY5 B8 CASE4 108.0 -0.15 -138.59 12.53 0.000 X 0.028STORY3 B8 CASE1 0.0 0.00 243.58 0.00 0.000 X 0.039STORY3 B8 CASE1 21.6 0.00 140.65 0.00 0.000 X 0.022STORY3 B8 CASE1 43.2 0.00 37.72 0.00 0.000 X 0.006STORY3 B8 CASE1 64.8 0.00 -65.21 0.00 0.000 X 0.010STORY3 B8 CASE1 86.4 0.00 -168.14 0.00 0.000 X 0.027STORY3 B8 CASE1 108.0 0.00 -271.07 0.00 0.000 X 0.043STORY3 B8 CASE2 0.0 0.00 280.83 0.00 0.000 X 0.045STORY3 B8 CASE2 21.6 0.00 162.16 0.00 0.000 X 0.026STORY3 B8 CASE2 43.2 0.00 43.49 0.00 0.000 X 0.007STORY3 B8 CASE2 64.8 0.00 -75.19 0.00 0.000 X 0.012STORY3 B8 CASE2 86.4 0.00 -193.86 0.00 0.000 X 0.031STORY3 B8 CASE2 108.0 0.00 -312.53 0.00 0.000 X 0.050 CASE4STORY3 B8 CASE3 0.0 0.00 247.17 0.00 0.000 X 0.040STORY3 B8 CASE3 21.6 0.00 142.72 0.00 0.000 X 0.023STORY3 B8 CASE3 43.2 0.00 38.27 0.00 0.000 X 0.006STORY3 B8 CASE3 64.8 0.00 -66.18 0.00 0.000 X 0.011STORY3 B8 CASE3 86.4 0.00 -170.63 0.00 0.000 X 0.027STORY3 B8 CASE3 108.0 0.00 -275.08 0.00 0.000 X 0.044STORY3 B8 CASE4 0.0 0.27 163.78 22.53 0.000 X 0.037STORY3 B8 CASE4 21.6 0.16 73.40 0.90 0.000 X 0.012STORY3 B8 CASE4 43.2 0.05 -16.99 -9.91 0.000 X 0.008STORY3 B8 CASE4 64.8 -0.05 -107.37 -9.91 0.000 X 0.022STORY3 B8 CASE4 86.4 -0.16 -197.75 0.90 0.000 X 0.032STORY3 B8 CASE4 108.0 -0.27 -288.14 22.53 0.000 X 0.057STORY1 B8 CASE1 0.0 0.00 586.75 0.00 0.000 X 0.094STORY1 B8 CASE1 21.6 0.00 303.16 0.00 0.000 X 0.048STORY1 B8 CASE1 43.2 0.00 19.56 0.00 0.000 X 0.003STORY1 B8 CASE1 64.8 0.00 -264.03 0.00 0.000 X 0.042STORY1 B8 CASE1 86.4 0.00 -547.63 0.00 0.000 X 0.088STORY1 B8 CASE1 108.0 0.00 -831.22 0.00 0.000 X 0.133STORY1 B8 CASE2 0.0 0.00 676.57 0.00 0.000 X 0.108STORY1 B8 CASE2 21.6 0.00 349.56 0.00 0.000 X 0.056STORY1 B8 CASE2 43.2 0.00 22.56 0.00 0.000 X 0.004
LoadBeamStory H1-1bH1-1aPu/ФPn
Appendix F.1 - Diagrid Member Checking Spreadsheets
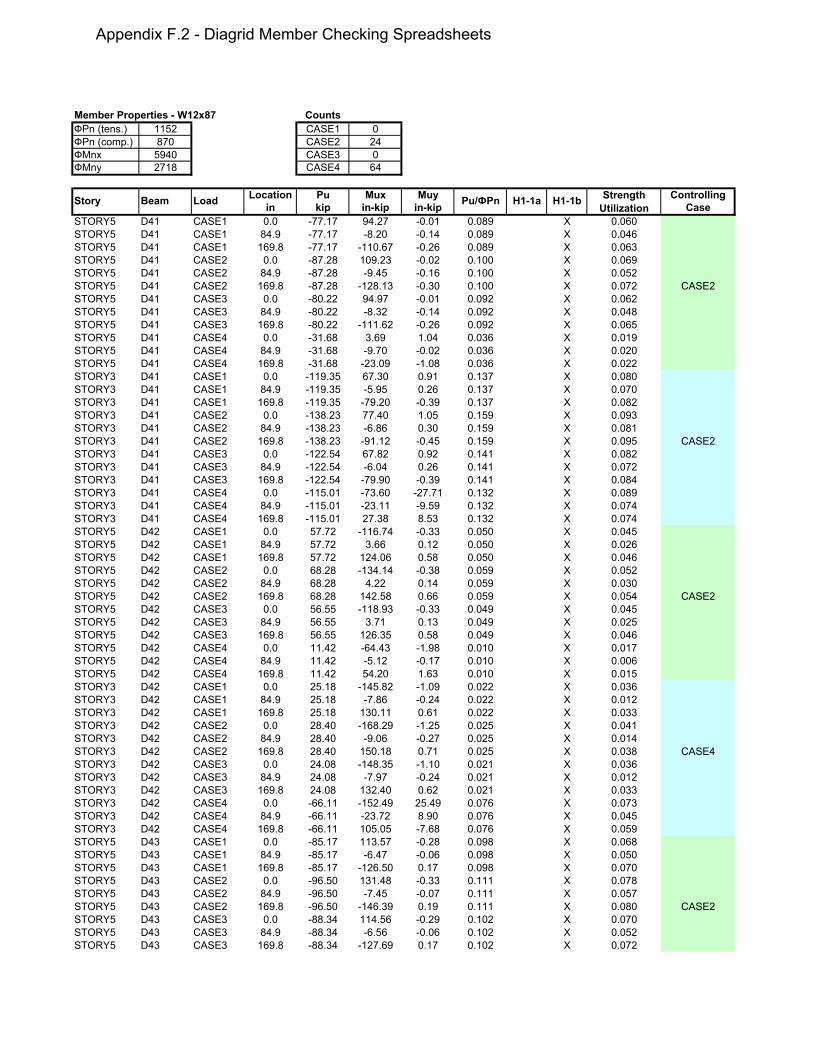
Member Properties - W12x87 CountsФPn (tens.) 1152 CASE1 0ФPn (comp.) 870 CASE2 24ФMnx 5940 CASE3 0ФMny 2718 CASE4 64
Location Pu Mux Muy Strength Controllingin kip in-kip in-kip Utilization Case
STORY5 D41 CASE1 0.0 -77.17 94.27 -0.01 0.089 X 0.060STORY5 D41 CASE1 84.9 -77.17 -8.20 -0.14 0.089 X 0.046STORY5 D41 CASE1 169.8 -77.17 -110.67 -0.26 0.089 X 0.063STORY5 D41 CASE2 0.0 -87.28 109.23 -0.02 0.100 X 0.069STORY5 D41 CASE2 84.9 -87.28 -9.45 -0.16 0.100 X 0.052STORY5 D41 CASE2 169.8 -87.28 -128.13 -0.30 0.100 X 0.072 CASE2STORY5 D41 CASE3 0.0 -80.22 94.97 -0.01 0.092 X 0.062STORY5 D41 CASE3 84.9 -80.22 -8.32 -0.14 0.092 X 0.048STORY5 D41 CASE3 169.8 -80.22 -111.62 -0.26 0.092 X 0.065STORY5 D41 CASE4 0.0 -31.68 3.69 1.04 0.036 X 0.019STORY5 D41 CASE4 84.9 -31.68 -9.70 -0.02 0.036 X 0.020STORY5 D41 CASE4 169.8 -31.68 -23.09 -1.08 0.036 X 0.022STORY3 D41 CASE1 0.0 -119.35 67.30 0.91 0.137 X 0.080STORY3 D41 CASE1 84.9 -119.35 -5.95 0.26 0.137 X 0.070STORY3 D41 CASE1 169.8 -119.35 -79.20 -0.39 0.137 X 0.082STORY3 D41 CASE2 0.0 -138.23 77.40 1.05 0.159 X 0.093STORY3 D41 CASE2 84.9 -138.23 -6.86 0.30 0.159 X 0.081STORY3 D41 CASE2 169.8 -138.23 -91.12 -0.45 0.159 X 0.095 CASE2STORY3 D41 CASE3 0.0 -122.54 67.82 0.92 0.141 X 0.082STORY3 D41 CASE3 84.9 -122.54 -6.04 0.26 0.141 X 0.072STORY3 D41 CASE3 169.8 -122.54 -79.90 -0.39 0.141 X 0.084STORY3 D41 CASE4 0.0 -115.01 -73.60 -27.71 0.132 X 0.089STORY3 D41 CASE4 84.9 -115.01 -23.11 -9.59 0.132 X 0.074STORY3 D41 CASE4 169.8 -115.01 27.38 8.53 0.132 X 0.074STORY5 D42 CASE1 0.0 57.72 -116.74 -0.33 0.050 X 0.045STORY5 D42 CASE1 84.9 57.72 3.66 0.12 0.050 X 0.026STORY5 D42 CASE1 169.8 57.72 124.06 0.58 0.050 X 0.046STORY5 D42 CASE2 0.0 68.28 -134.14 -0.38 0.059 X 0.052STORY5 D42 CASE2 84.9 68.28 4.22 0.14 0.059 X 0.030STORY5 D42 CASE2 169.8 68.28 142.58 0.66 0.059 X 0.054 CASE2STORY5 D42 CASE3 0.0 56.55 -118.93 -0.33 0.049 X 0.045STORY5 D42 CASE3 84.9 56.55 3.71 0.13 0.049 X 0.025STORY5 D42 CASE3 169.8 56.55 126.35 0.58 0.049 X 0.046STORY5 D42 CASE4 0.0 11.42 -64.43 -1.98 0.010 X 0.017STORY5 D42 CASE4 84.9 11.42 -5.12 -0.17 0.010 X 0.006STORY5 D42 CASE4 169.8 11.42 54.20 1.63 0.010 X 0.015STORY3 D42 CASE1 0.0 25.18 -145.82 -1.09 0.022 X 0.036STORY3 D42 CASE1 84.9 25.18 -7.86 -0.24 0.022 X 0.012STORY3 D42 CASE1 169.8 25.18 130.11 0.61 0.022 X 0.033STORY3 D42 CASE2 0.0 28.40 -168.29 -1.25 0.025 X 0.041STORY3 D42 CASE2 84.9 28.40 -9.06 -0.27 0.025 X 0.014STORY3 D42 CASE2 169.8 28.40 150.18 0.71 0.025 X 0.038 CASE4STORY3 D42 CASE3 0.0 24.08 -148.35 -1.10 0.021 X 0.036STORY3 D42 CASE3 84.9 24.08 -7.97 -0.24 0.021 X 0.012STORY3 D42 CASE3 169.8 24.08 132.40 0.62 0.021 X 0.033STORY3 D42 CASE4 0.0 -66.11 -152.49 25.49 0.076 X 0.073STORY3 D42 CASE4 84.9 -66.11 -23.72 8.90 0.076 X 0.045STORY3 D42 CASE4 169.8 -66.11 105.05 -7.68 0.076 X 0.059STORY5 D43 CASE1 0.0 -85.17 113.57 -0.28 0.098 X 0.068STORY5 D43 CASE1 84.9 -85.17 -6.47 -0.06 0.098 X 0.050STORY5 D43 CASE1 169.8 -85.17 -126.50 0.17 0.098 X 0.070STORY5 D43 CASE2 0.0 -96.50 131.48 -0.33 0.111 X 0.078STORY5 D43 CASE2 84.9 -96.50 -7.45 -0.07 0.111 X 0.057STORY5 D43 CASE2 169.8 -96.50 -146.39 0.19 0.111 X 0.080 CASE2STORY5 D43 CASE3 0.0 -88.34 114.56 -0.29 0.102 X 0.070STORY5 D43 CASE3 84.9 -88.34 -6.56 -0.06 0.102 X 0.052STORY5 D43 CASE3 169.8 -88.34 -127.69 0.17 0.102 X 0.072
BeamStory H1-1bH1-1aPu/ФPnLoad
Appendix F.2 - Diagrid Member Checking Spreadsheets
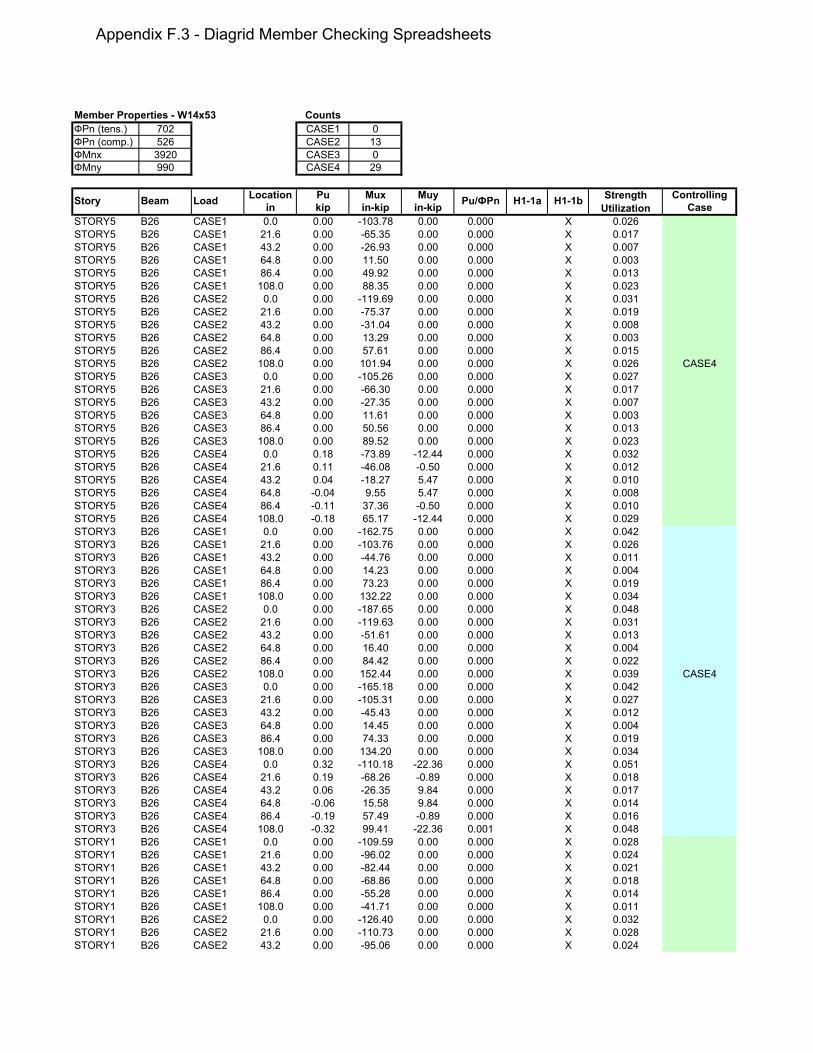
Member Properties - W14x53 CountsФPn (tens.) 702 CASE1 0ФPn (comp.) 526 CASE2 13ФMnx 3920 CASE3 0ФMny 990 CASE4 29
Location Pu Mux Muy Strength Controllingin kip in-kip in-kip Utilization Case
STORY5 B26 CASE1 0.0 0.00 -103.78 0.00 0.000 X 0.026STORY5 B26 CASE1 21.6 0.00 -65.35 0.00 0.000 X 0.017STORY5 B26 CASE1 43.2 0.00 -26.93 0.00 0.000 X 0.007STORY5 B26 CASE1 64.8 0.00 11.50 0.00 0.000 X 0.003STORY5 B26 CASE1 86.4 0.00 49.92 0.00 0.000 X 0.013STORY5 B26 CASE1 108.0 0.00 88.35 0.00 0.000 X 0.023STORY5 B26 CASE2 0.0 0.00 -119.69 0.00 0.000 X 0.031STORY5 B26 CASE2 21.6 0.00 -75.37 0.00 0.000 X 0.019STORY5 B26 CASE2 43.2 0.00 -31.04 0.00 0.000 X 0.008STORY5 B26 CASE2 64.8 0.00 13.29 0.00 0.000 X 0.003STORY5 B26 CASE2 86.4 0.00 57.61 0.00 0.000 X 0.015STORY5 B26 CASE2 108.0 0.00 101.94 0.00 0.000 X 0.026 CASE4STORY5 B26 CASE3 0.0 0.00 -105.26 0.00 0.000 X 0.027STORY5 B26 CASE3 21.6 0.00 -66.30 0.00 0.000 X 0.017STORY5 B26 CASE3 43.2 0.00 -27.35 0.00 0.000 X 0.007STORY5 B26 CASE3 64.8 0.00 11.61 0.00 0.000 X 0.003STORY5 B26 CASE3 86.4 0.00 50.56 0.00 0.000 X 0.013STORY5 B26 CASE3 108.0 0.00 89.52 0.00 0.000 X 0.023STORY5 B26 CASE4 0.0 0.18 -73.89 -12.44 0.000 X 0.032STORY5 B26 CASE4 21.6 0.11 -46.08 -0.50 0.000 X 0.012STORY5 B26 CASE4 43.2 0.04 -18.27 5.47 0.000 X 0.010STORY5 B26 CASE4 64.8 -0.04 9.55 5.47 0.000 X 0.008STORY5 B26 CASE4 86.4 -0.11 37.36 -0.50 0.000 X 0.010STORY5 B26 CASE4 108.0 -0.18 65.17 -12.44 0.000 X 0.029STORY3 B26 CASE1 0.0 0.00 -162.75 0.00 0.000 X 0.042STORY3 B26 CASE1 21.6 0.00 -103.76 0.00 0.000 X 0.026STORY3 B26 CASE1 43.2 0.00 -44.76 0.00 0.000 X 0.011STORY3 B26 CASE1 64.8 0.00 14.23 0.00 0.000 X 0.004STORY3 B26 CASE1 86.4 0.00 73.23 0.00 0.000 X 0.019STORY3 B26 CASE1 108.0 0.00 132.22 0.00 0.000 X 0.034STORY3 B26 CASE2 0.0 0.00 -187.65 0.00 0.000 X 0.048STORY3 B26 CASE2 21.6 0.00 -119.63 0.00 0.000 X 0.031STORY3 B26 CASE2 43.2 0.00 -51.61 0.00 0.000 X 0.013STORY3 B26 CASE2 64.8 0.00 16.40 0.00 0.000 X 0.004STORY3 B26 CASE2 86.4 0.00 84.42 0.00 0.000 X 0.022STORY3 B26 CASE2 108.0 0.00 152.44 0.00 0.000 X 0.039 CASE4STORY3 B26 CASE3 0.0 0.00 -165.18 0.00 0.000 X 0.042STORY3 B26 CASE3 21.6 0.00 -105.31 0.00 0.000 X 0.027STORY3 B26 CASE3 43.2 0.00 -45.43 0.00 0.000 X 0.012STORY3 B26 CASE3 64.8 0.00 14.45 0.00 0.000 X 0.004STORY3 B26 CASE3 86.4 0.00 74.33 0.00 0.000 X 0.019STORY3 B26 CASE3 108.0 0.00 134.20 0.00 0.000 X 0.034STORY3 B26 CASE4 0.0 0.32 -110.18 -22.36 0.000 X 0.051STORY3 B26 CASE4 21.6 0.19 -68.26 -0.89 0.000 X 0.018STORY3 B26 CASE4 43.2 0.06 -26.35 9.84 0.000 X 0.017STORY3 B26 CASE4 64.8 -0.06 15.58 9.84 0.000 X 0.014STORY3 B26 CASE4 86.4 -0.19 57.49 -0.89 0.000 X 0.016STORY3 B26 CASE4 108.0 -0.32 99.41 -22.36 0.001 X 0.048STORY1 B26 CASE1 0.0 0.00 -109.59 0.00 0.000 X 0.028STORY1 B26 CASE1 21.6 0.00 -96.02 0.00 0.000 X 0.024STORY1 B26 CASE1 43.2 0.00 -82.44 0.00 0.000 X 0.021STORY1 B26 CASE1 64.8 0.00 -68.86 0.00 0.000 X 0.018STORY1 B26 CASE1 86.4 0.00 -55.28 0.00 0.000 X 0.014STORY1 B26 CASE1 108.0 0.00 -41.71 0.00 0.000 X 0.011STORY1 B26 CASE2 0.0 0.00 -126.40 0.00 0.000 X 0.032STORY1 B26 CASE2 21.6 0.00 -110.73 0.00 0.000 X 0.028STORY1 B26 CASE2 43.2 0.00 -95.06 0.00 0.000 X 0.024
LoadBeamStory H1-1bH1-1aPu/ФPn
Appendix F.3 - Diagrid Member Checking Spreadsheets
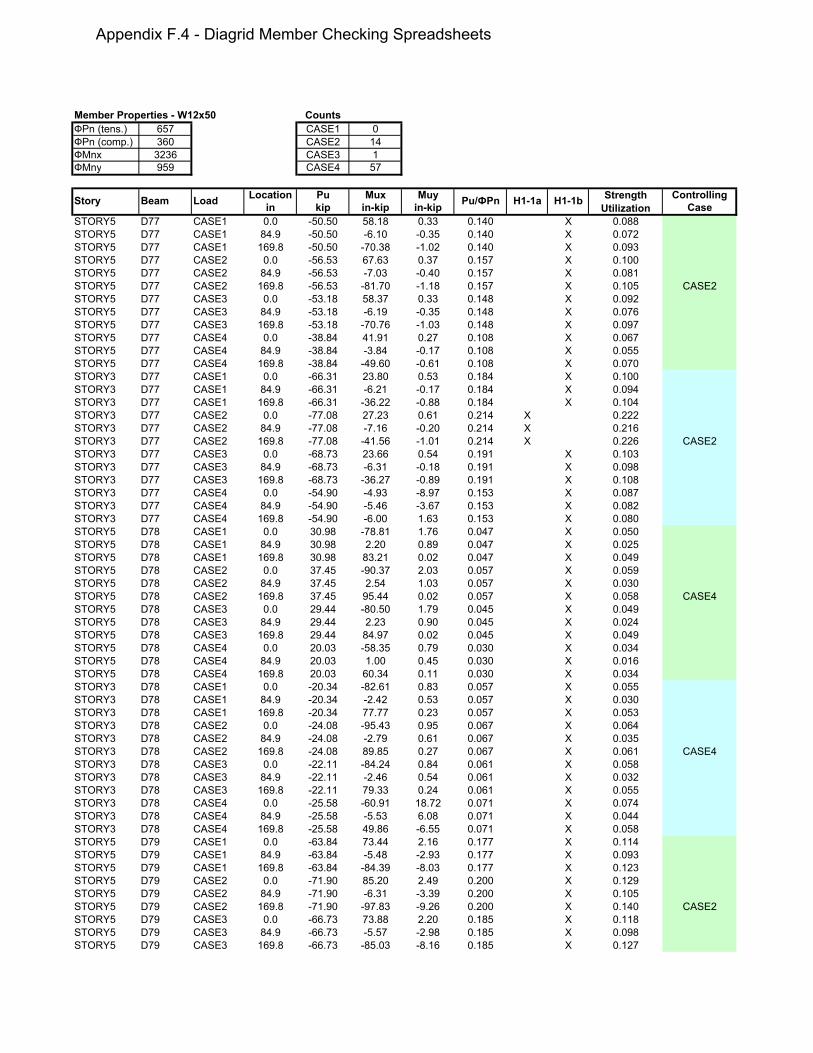
Member Properties - W12x50 CountsФPn (tens.) 657 CASE1 0ФPn (comp.) 360 CASE2 14ФMnx 3236 CASE3 1ФMny 959 CASE4 57
Location Pu Mux Muy Strength Controllingin kip in-kip in-kip Utilization Case
STORY5 D77 CASE1 0.0 -50.50 58.18 0.33 0.140 X 0.088STORY5 D77 CASE1 84.9 -50.50 -6.10 -0.35 0.140 X 0.072STORY5 D77 CASE1 169.8 -50.50 -70.38 -1.02 0.140 X 0.093STORY5 D77 CASE2 0.0 -56.53 67.63 0.37 0.157 X 0.100STORY5 D77 CASE2 84.9 -56.53 -7.03 -0.40 0.157 X 0.081STORY5 D77 CASE2 169.8 -56.53 -81.70 -1.18 0.157 X 0.105 CASE2STORY5 D77 CASE3 0.0 -53.18 58.37 0.33 0.148 X 0.092STORY5 D77 CASE3 84.9 -53.18 -6.19 -0.35 0.148 X 0.076STORY5 D77 CASE3 169.8 -53.18 -70.76 -1.03 0.148 X 0.097STORY5 D77 CASE4 0.0 -38.84 41.91 0.27 0.108 X 0.067STORY5 D77 CASE4 84.9 -38.84 -3.84 -0.17 0.108 X 0.055STORY5 D77 CASE4 169.8 -38.84 -49.60 -0.61 0.108 X 0.070STORY3 D77 CASE1 0.0 -66.31 23.80 0.53 0.184 X 0.100STORY3 D77 CASE1 84.9 -66.31 -6.21 -0.17 0.184 X 0.094STORY3 D77 CASE1 169.8 -66.31 -36.22 -0.88 0.184 X 0.104STORY3 D77 CASE2 0.0 -77.08 27.23 0.61 0.214 X 0.222STORY3 D77 CASE2 84.9 -77.08 -7.16 -0.20 0.214 X 0.216STORY3 D77 CASE2 169.8 -77.08 -41.56 -1.01 0.214 X 0.226 CASE2STORY3 D77 CASE3 0.0 -68.73 23.66 0.54 0.191 X 0.103STORY3 D77 CASE3 84.9 -68.73 -6.31 -0.18 0.191 X 0.098STORY3 D77 CASE3 169.8 -68.73 -36.27 -0.89 0.191 X 0.108STORY3 D77 CASE4 0.0 -54.90 -4.93 -8.97 0.153 X 0.087STORY3 D77 CASE4 84.9 -54.90 -5.46 -3.67 0.153 X 0.082STORY3 D77 CASE4 169.8 -54.90 -6.00 1.63 0.153 X 0.080STORY5 D78 CASE1 0.0 30.98 -78.81 1.76 0.047 X 0.050STORY5 D78 CASE1 84.9 30.98 2.20 0.89 0.047 X 0.025STORY5 D78 CASE1 169.8 30.98 83.21 0.02 0.047 X 0.049STORY5 D78 CASE2 0.0 37.45 -90.37 2.03 0.057 X 0.059STORY5 D78 CASE2 84.9 37.45 2.54 1.03 0.057 X 0.030STORY5 D78 CASE2 169.8 37.45 95.44 0.02 0.057 X 0.058 CASE4STORY5 D78 CASE3 0.0 29.44 -80.50 1.79 0.045 X 0.049STORY5 D78 CASE3 84.9 29.44 2.23 0.90 0.045 X 0.024STORY5 D78 CASE3 169.8 29.44 84.97 0.02 0.045 X 0.049STORY5 D78 CASE4 0.0 20.03 -58.35 0.79 0.030 X 0.034STORY5 D78 CASE4 84.9 20.03 1.00 0.45 0.030 X 0.016STORY5 D78 CASE4 169.8 20.03 60.34 0.11 0.030 X 0.034STORY3 D78 CASE1 0.0 -20.34 -82.61 0.83 0.057 X 0.055STORY3 D78 CASE1 84.9 -20.34 -2.42 0.53 0.057 X 0.030STORY3 D78 CASE1 169.8 -20.34 77.77 0.23 0.057 X 0.053STORY3 D78 CASE2 0.0 -24.08 -95.43 0.95 0.067 X 0.064STORY3 D78 CASE2 84.9 -24.08 -2.79 0.61 0.067 X 0.035STORY3 D78 CASE2 169.8 -24.08 89.85 0.27 0.067 X 0.061 CASE4STORY3 D78 CASE3 0.0 -22.11 -84.24 0.84 0.061 X 0.058STORY3 D78 CASE3 84.9 -22.11 -2.46 0.54 0.061 X 0.032STORY3 D78 CASE3 169.8 -22.11 79.33 0.24 0.061 X 0.055STORY3 D78 CASE4 0.0 -25.58 -60.91 18.72 0.071 X 0.074STORY3 D78 CASE4 84.9 -25.58 -5.53 6.08 0.071 X 0.044STORY3 D78 CASE4 169.8 -25.58 49.86 -6.55 0.071 X 0.058STORY5 D79 CASE1 0.0 -63.84 73.44 2.16 0.177 X 0.114STORY5 D79 CASE1 84.9 -63.84 -5.48 -2.93 0.177 X 0.093STORY5 D79 CASE1 169.8 -63.84 -84.39 -8.03 0.177 X 0.123STORY5 D79 CASE2 0.0 -71.90 85.20 2.49 0.200 X 0.129STORY5 D79 CASE2 84.9 -71.90 -6.31 -3.39 0.200 X 0.105STORY5 D79 CASE2 169.8 -71.90 -97.83 -9.26 0.200 X 0.140 CASE2STORY5 D79 CASE3 0.0 -66.73 73.88 2.20 0.185 X 0.118STORY5 D79 CASE3 84.9 -66.73 -5.57 -2.98 0.185 X 0.098STORY5 D79 CASE3 169.8 -66.73 -85.03 -8.16 0.185 X 0.127
BeamStory H1-1bH1-1aPu/ФPnLoad
Appendix F.4 - Diagrid Member Checking Spreadsheets