Embed Size (px)
Citation preview

Centre for Cities1
Brexit, trade and the economic impacts on UK cities Naomi Clayton and Professor Henry G. Overman July 2017
Summary of findings
This paper summarises new analysis by the LSE’s Centre for Economic Performance (CEP) and Centre for Cities, which examines for the first time the potential impact of both a ‘hard’ and ‘soft’ Brexit on British cities in the ten years following the implementation of new trade arrangements with the EU.
• All British cities are set to be negatively affected as a result of higher trade costs between the UK and EU, and this impact will be greater in the scenario of a ‘hard Brexit’. Economic output in cities (as measured by Gross Value Added, GVA) is predicted to be 1.2 per cent lower on average under a ‘soft Brexit’ and 2.3 per cent lower under a ‘hard Brexit’ than if the UK remained in the EU.
• Cities with large shares of employment in private-sector knowledge-intensive services (KIBS), predominantly in the South, are predicted to be most negatively affected due to the increase trade costs linked to Brexit.1
• Cities that are predicted to be most negatively affected by Brexit were more likely to vote remain in the 2016 referendum.
• Cities predicted to be most negatively affected tend to be more productive and have highly skilled workforces, which means they may find it easier to adapt in the longer term.
• National government needs to consider the spatial implications of deals negotiated and support cities to adapt to changes in the UK’s international trading relationships. Cities should combine this insight with local knowledge to consider how approaches to local economic development should be restructured.
1 The analysis in this paper covers the 62 Primary Urban Areas (PUAs) in Great Britain. More information on PUAs is available from www.centreforcities.org/puas. Data for Northern Ireland was not available for this analysis.
Brexit, trade and the economic impacts on UK cities • July 2017
Centre for Cities2
Introduction
Most mainstream studies predict that Brexit will have a negative impact on the UK economy. For example, work by researchers at the CEP predicts that reductions in trade resulting from Brexit will lead to a fall of 1.3 to 2.6 per cent in national income depending on the type of deal negotiated (‘soft’ or ‘hard’ Brexit).2
The economic impact of changes to the UK’s trading relationships will vary across the country. Different cities specialise in different products and services, and trade with different countries.3 Yet, to the best of our knowledge, the impacts of Brexit have not been analysed at a local level. This report fills that gap by summarising the local area findings from recent modelling undertaken by researchers at the CEP.4 It focuses on the potential impacts of Brexit at city level under two scenarios – ‘soft Brexit’ and ‘hard Brexit’ – and considers whether Brexit is likely to alleviate or exacerbate existing inequalities.5,6
For national government, it aims to build understanding of how different areas might be affected by Brexit and the terms negotiated. For city leaders, it provides insight on the potential sector-specific impacts of Brexit as a complement to local knowledge. Understanding how different areas might be affected by Brexit is crucial to developing appropriate policy responses at the local and national levels.
This analysis will be used by the Centre for Cities and What Works Centre for Local Economic Growth to inform their joint programme on the local implications of Brexit and how local economic development strategies can best respond.7
Box 1: Approach
The trade model developed by CEP uses the most comprehensive data on trade flows and trade barriers available, including industry-level data on exports and imports covering all sectors of the economy in every country in the world. It is used to predict the sectoral impact of Brexit under two scenarios:
• ‘Soft Brexit’ – a scenario where the UK joins a free trade area with the EU, such as the European Free Trade Association (EFTA). While tariffs would remain at zero, non-tariff barriers (including customs checks, border controls, differences in product market regulations and legal barriers) would increase the costs of trade.
• ‘Hard Brexit’ – a scenario where the UK and the EU do not immediately form a free trade area and the default situation is to trade under World Trade Organisation (WTO) rules. This would result in an increase in tariffs and non-tariff barriers that would be substantially larger than under soft Brexit.
The sectoral impacts predicted under these two scenarios are then weighted using local employment shares to predict changes to GVA at the city level. This gives estimates of the ‘medium-run’ impact on GVA as it is assumed that it would take 10 years for the non-tariff barriers within the EU to converge to a new level post-Brexit.
2 Dhingra, S, G Ottaviano, T. Sampson and J. Van Reenen (2016a) The consequences of Brexit for UK trade and living standards. CEP BREXIT paper no. 02.3 See Centre for Cities (2017) Cities Outlook 2017.4 Dhingra, S, Machin, S and Overman, H G (2017) The Local Economic Impacts of Brexit, Centre for Economic Performance Brexit Paper no 010.5 For more detail on methodology and local authority level findings see Dhingra et al (2017).6 The analysis in this paper covers the 62 Primary Urban Areas (PUAs) in Great Britain. More information on PUAs is available from www.centreforcities.org/puas.
Data for Northern Ireland was not available for this analysis.7 For further information see whatworksgrowth.org.
Brexit, trade and the economic impacts on UK cities • July 2017
Centre for Cities3
It is important to note that the model predicts the static effects of Brexit-related increases in trade costs on city economies. This is likely to underestimate the impact of Brexit as the model does not take account of the other effects of Brexit, for example on innovation, foreign investment and migration. Factoring in these additional effects at the national level increases the costs of Brexit to a loss of 6.3 per cent to 9.5 per cent of national income. The predictions also do not account for how cities might adjust to these shocks. Just as with the financial crisis, there are good reasons to think that these adjustments will have significant implications for understanding the long run differences in impact across the country (see p.10).
Key findings
Every local authority area is predicted to be negatively affected but cities are likely to be hit harder than non-urban areas.
Every local authority area is predicted to see a decrease in economic output, measured by Gross Value Added (GVA) as a result of Brexit.8 The impacts are predicted to be more negative under hard Brexit in every local authority area, as the increase in trade costs would be larger.
Cities are predicted to see larger decreases in GVA than non-urban areas on average in both scenarios. The average decrease in GVA under soft Brexit is 1.2 per cent in cities compared to 1.1 per cent in non-urban local authority areas, and 2.3 per cent compared to 2.0 per cent, respectively under hard Brexit (in all cases, predictions are relative to GVA if the UK had remained in the EU). There is less variation between cities compared to individual local authorities, however, as city-wide economies tend to have more diverse sectoral profiles than local authorities.
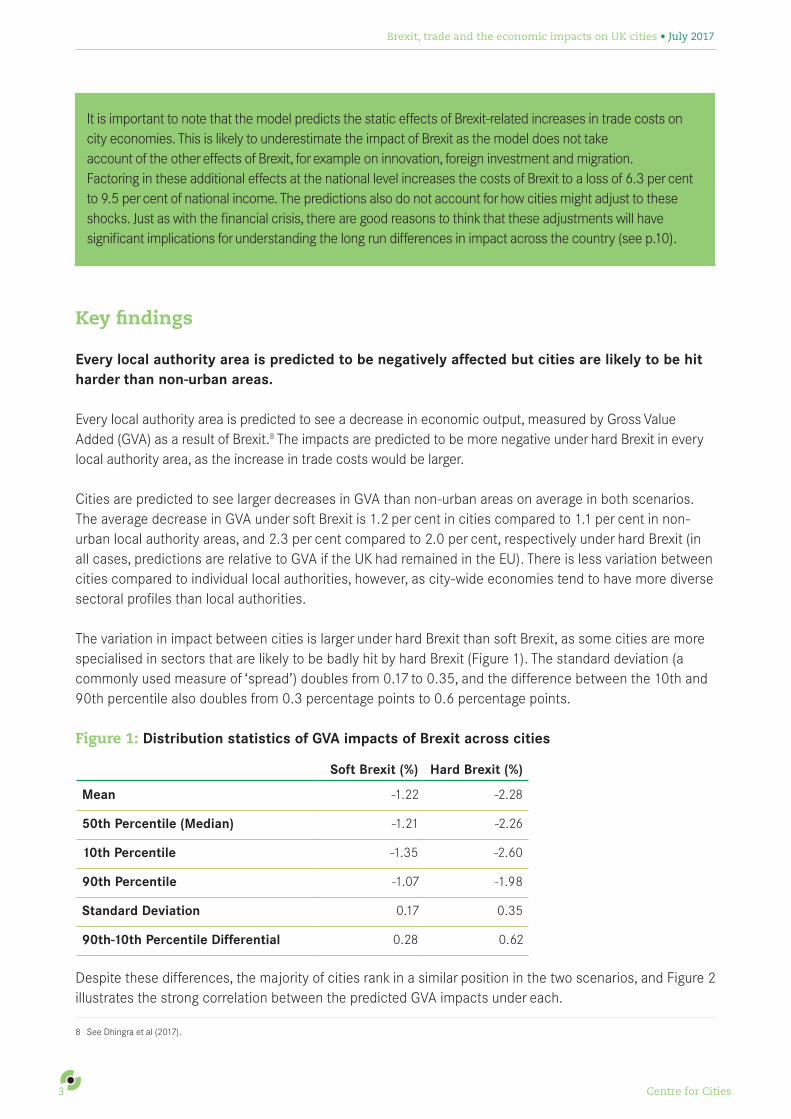
The variation in impact between cities is larger under hard Brexit than soft Brexit, as some cities are more specialised in sectors that are likely to be badly hit by hard Brexit (Figure 1). The standard deviation (a commonly used measure of ‘spread’) doubles from 0.17 to 0.35, and the difference between the 10th and 90th percentile also doubles from 0.3 percentage points to 0.6 percentage points.
Figure 1: Distribution statistics of GVA impacts of Brexit across cities
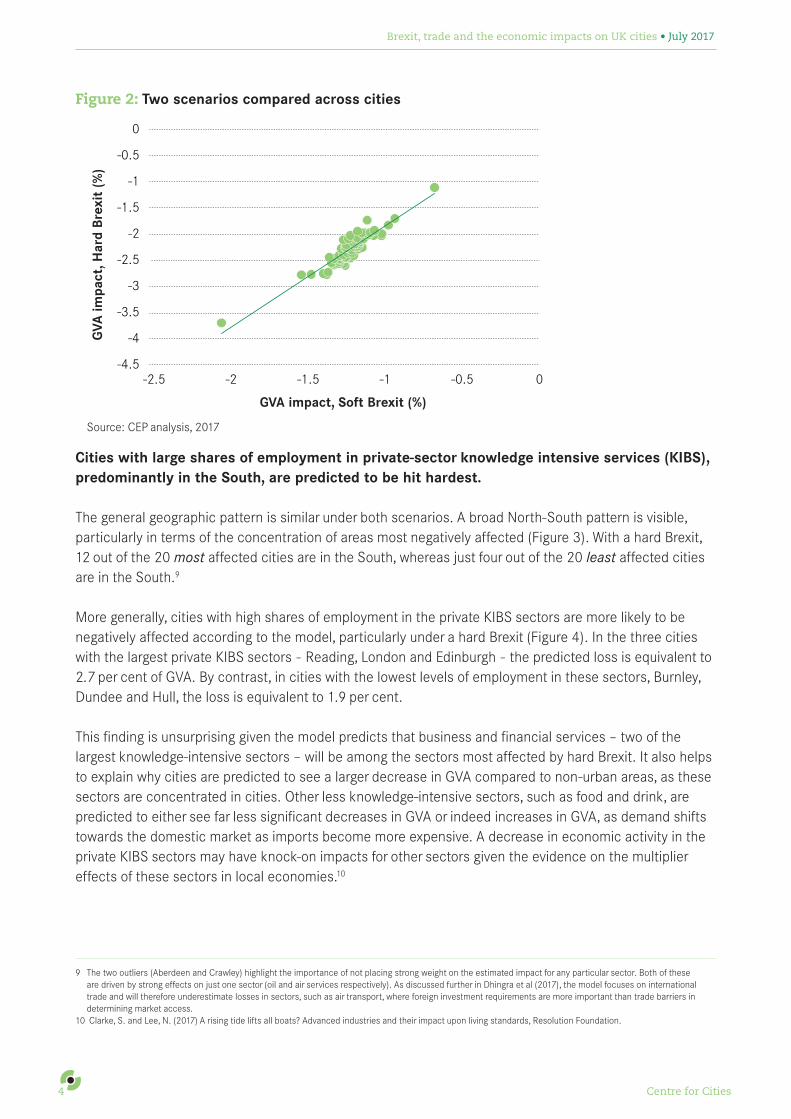
Despite these differences, the majority of cities rank in a similar position in the two scenarios, and Figure 2 illustrates the strong correlation between the predicted GVA impacts under each.
8 See Dhingra et al (2017).
Soft Brexit (%) Hard Brexit (%)
Mean -1.22 -2.28
50th Percentile (Median) -1.21 -2.26
10th Percentile -1.35 -2.60
90th Percentile -1.07 -1.98
Standard Deviation 0.17 0.35
90th-10th Percentile Differential 0.28 0.62
Brexit, trade and the economic impacts on UK cities • July 2017
Centre for Cities4
Figure 2: Two scenarios compared across cities
-4
-4.5
-3.5
-3
-2.5
-2
-1.5
-1
-0.5
0
-2.5 -2 -1.5 -1 -0.5 0
GVA impact, Soft Brexit (%)
GVA
impa
ct, H
ard
Brex
it (%
)
Source: CEP analysis, 2017
Cities with large shares of employment in private-sector knowledge intensive services (KIBS), predominantly in the South, are predicted to be hit hardest.
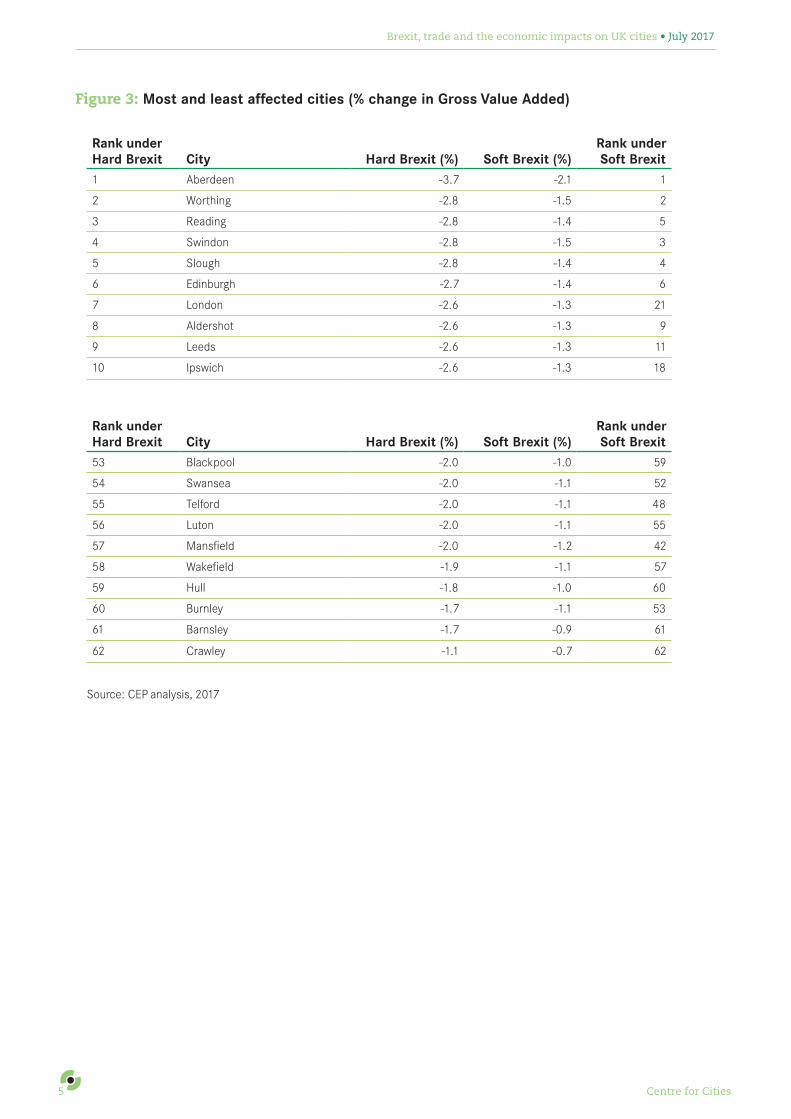
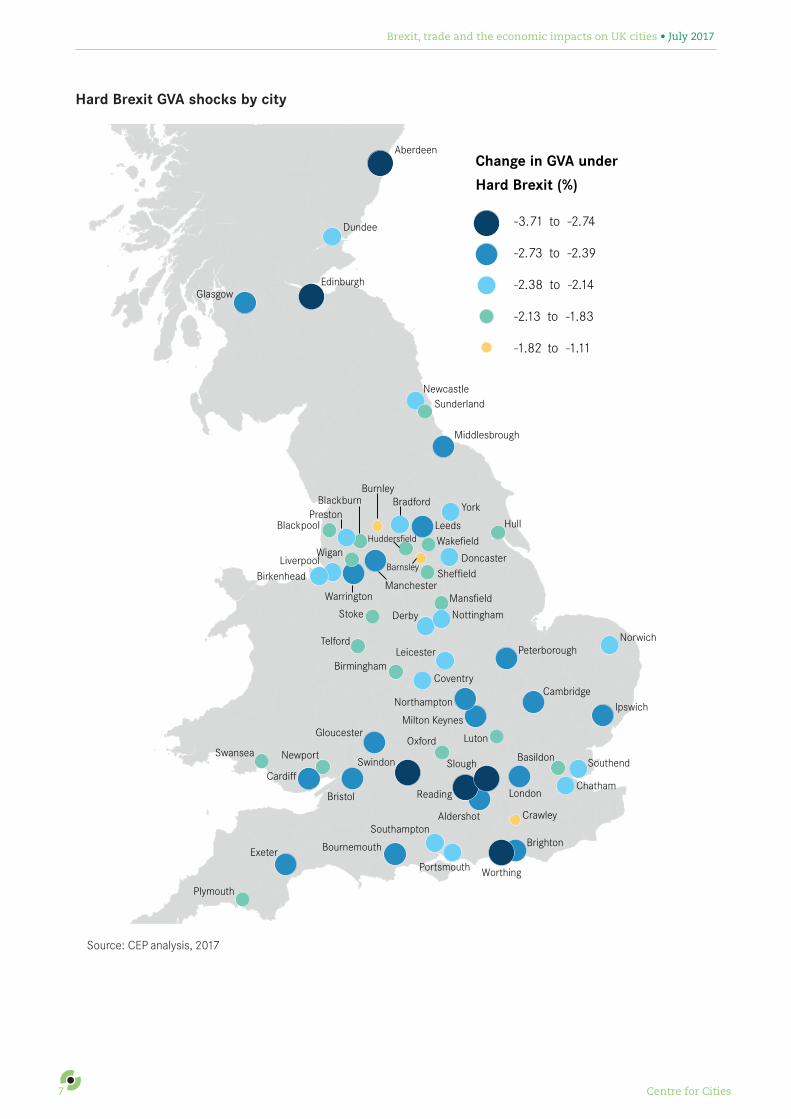
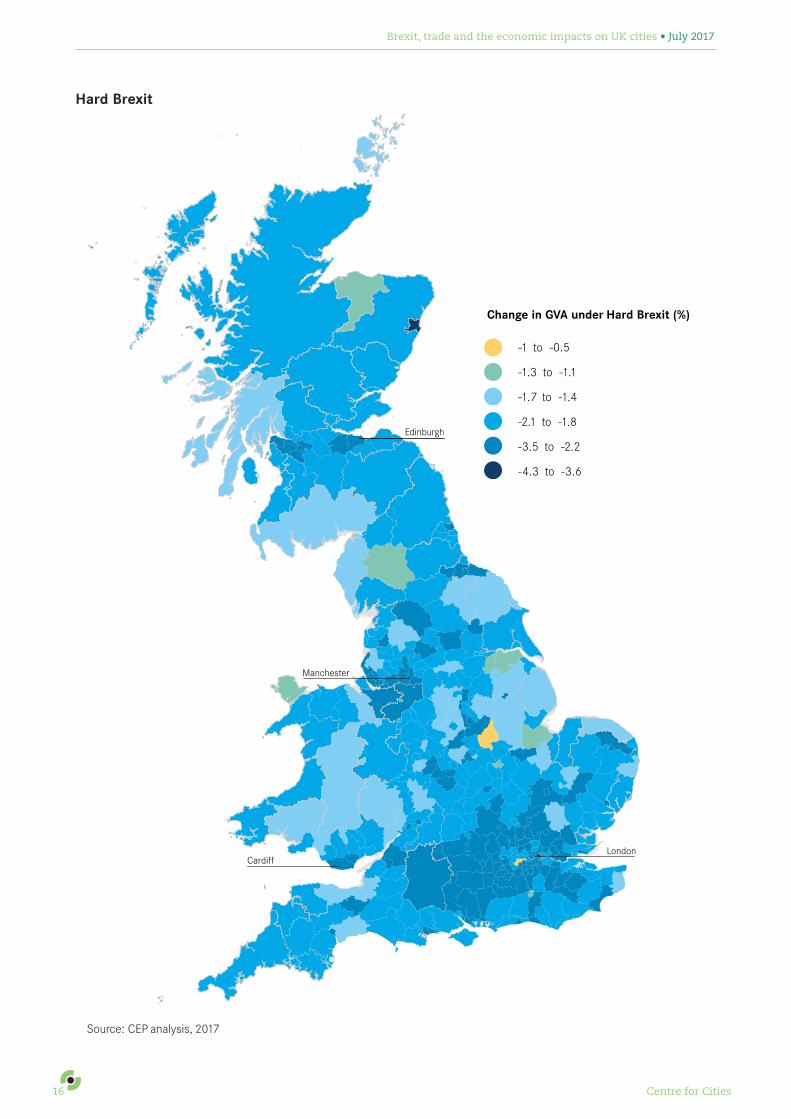
The general geographic pattern is similar under both scenarios. A broad North-South pattern is visible, particularly in terms of the concentration of areas most negatively affected (Figure 3). With a hard Brexit, 12 out of the 20 most affected cities are in the South, whereas just four out of the 20 least affected cities are in the South.9
More generally, cities with high shares of employment in the private KIBS sectors are more likely to be negatively affected according to the model, particularly under a hard Brexit (Figure 4). In the three cities with the largest private KIBS sectors - Reading, London and Edinburgh - the predicted loss is equivalent to 2.7 per cent of GVA. By contrast, in cities with the lowest levels of employment in these sectors, Burnley, Dundee and Hull, the loss is equivalent to 1.9 per cent.
This finding is unsurprising given the model predicts that business and financial services – two of the largest knowledge-intensive sectors – will be among the sectors most affected by hard Brexit. It also helps to explain why cities are predicted to see a larger decrease in GVA compared to non-urban areas, as these sectors are concentrated in cities. Other less knowledge-intensive sectors, such as food and drink, are predicted to either see far less significant decreases in GVA or indeed increases in GVA, as demand shifts towards the domestic market as imports become more expensive. A decrease in economic activity in the private KIBS sectors may have knock-on impacts for other sectors given the evidence on the multiplier effects of these sectors in local economies.10
9 The two outliers (Aberdeen and Crawley) highlight the importance of not placing strong weight on the estimated impact for any particular sector. Both of these are driven by strong effects on just one sector (oil and air services respectively). As discussed further in Dhingra et al (2017), the model focuses on international trade and will therefore underestimate losses in sectors, such as air transport, where foreign investment requirements are more important than trade barriers in determining market access.
10 Clarke, S. and Lee, N. (2017) A rising tide lifts all boats? Advanced industries and their impact upon living standards, Resolution Foundation.
Brexit, trade and the economic impacts on UK cities • July 2017
Centre for Cities5
Figure 3: Most and least affected cities (% change in Gross Value Added)
Source: CEP analysis, 2017
Rank under Hard Brexit City Hard Brexit (%) Soft Brexit (%)
Rank under Soft Brexit
1 Aberdeen -3.7 -2.1 1
2 Worthing -2.8 -1.5 2
3 Reading -2.8 -1.4 5
4 Swindon -2.8 -1.5 3
5 Slough -2.8 -1.4 4
6 Edinburgh -2.7 -1.4 6
7 London -2.6 -1.3 21
8 Aldershot -2.6 -1.3 9
9 Leeds -2.6 -1.3 11
10 Ipswich -2.6 -1.3 18
Rank underHard Brexit City Hard Brexit (%) Soft Brexit (%)
Rank under Soft Brexit
53 Blackpool -2.0 -1.0 59
54 Swansea -2.0 -1.1 52
55 Telford -2.0 -1.1 48
56 Luton -2.0 -1.1 55
57 Mansfield -2.0 -1.2 42
58 Wakefield -1.9 -1.1 57
59 Hull -1.8 -1.0 60
60 Burnley -1.7 -1.1 53
61 Barnsley -1.7 -0.9 61
62 Crawley -1.1 -0.7 62

Brexit, trade and the economic impacts on UK cities • July 2017
Centre for Cities6
Figure 4: Predicted GVA shocks by city
Soft Brexit GVA shocks by City
Dundee
EdinburghGlasgow
NewcastleSunderland
Middlesbrough
Hull
YorkLeeds
Swansea
Cardiff
Newport
Bristol
Gloucester
Exeter
Plymouth
Portsmouth
Aberdeen
SouthamptonBournemouth
BrightonWorthing
SouthendBasildon
Chatham
Crawley
London
Norwich
Ipswich
Peterborough
Aldershot
Reading
Swindon
Oxford
Milton Keynes
Northampton
Luton
Cambridge
Stoke
Telford
BirminghamCoventry
Leicester
NottinghamMansfield
Derby
Sheffield
DoncasterWakefield
Bradford
BirkenheadLiverpool
Wigan
Manchester
Burnley
Blackpool
PrestonBlackburn
Warrington
Barnsley
Slough
Huddersfield
-1.05 to -0.67
-1.19 to -1.06
-1.31 to -1.20
-2.04 to -1.32
-2.05
Change in GVA under
Soft Brexit (%)
Source: CEP analysis, 2017
Brexit, trade and the economic impacts on UK cities • July 2017
Centre for Cities7
Hard Brexit GVA shocks by city
Dundee
EdinburghGlasgow
NewcastleSunderland
Middlesbrough
Hull
York
Leeds
Swansea
Cardiff
Newport
Bristol
Gloucester
Exeter
Plymouth
Portsmouth
Aberdeen
Southampton
Bournemouth Brighton
Worthing
SouthendBasildon
Chatham
Crawley
London
Norwich
Ipswich
Peterborough
Aldershot
Reading
Swindon
Oxford
Milton Keynes
Northampton
Luton
Cambridge
Stoke
Telford
BirminghamCoventry
Leicester
Nottingham
Mansfield
Derby
SheffieldDoncaster
Wakefield
Bradford
BirkenheadLiverpool
Wigan
Manchester
Burnley
BlackpoolPreston
Blackburn
Warrington
Barnsley
Slough
Huddersfield
-1.82 to -1.11
-2.13 to -1.83
-2.38 to -2.14
-2.73 to -2.39
-3.71 to -2.74
Change in GVA under
Hard Brexit (%)
Source: CEP analysis, 2017

Brexit, trade and the economic impacts on UK cities • July 2017
Centre for Cities8
Figure 5: KIBS and predicted GVA shocks
Soft Brexit
Crawley
Aberdeen
Worthing Swindon
LondonReading
Edinburgh
-2.5
-2
-1.5
-1
-0.5
0
5 10 15 20 25 30
Private KIBS jobs (%), 2015
GVA
impa
ct, S
oft
Brex
it (%
)
Burnley
HullBarnsley
Hard Brexit
Source: CEP analysis, 2017 and BRES, 2017
-4
-3.5
-3
-2.5
-2
-1.5
-1
-0.5
0
50 10 15 20 25 30
Private KIBS jobs (%), 2015
GVA
impa
ct, H
ard
Brex
it (%
)
Crawley
Aberdeen
Worthing Swindon
LondonReading
Edinburgh
Burnley Barnsley
Brexit, trade and the economic impacts on UK cities • July 2017
Centre for Cities9
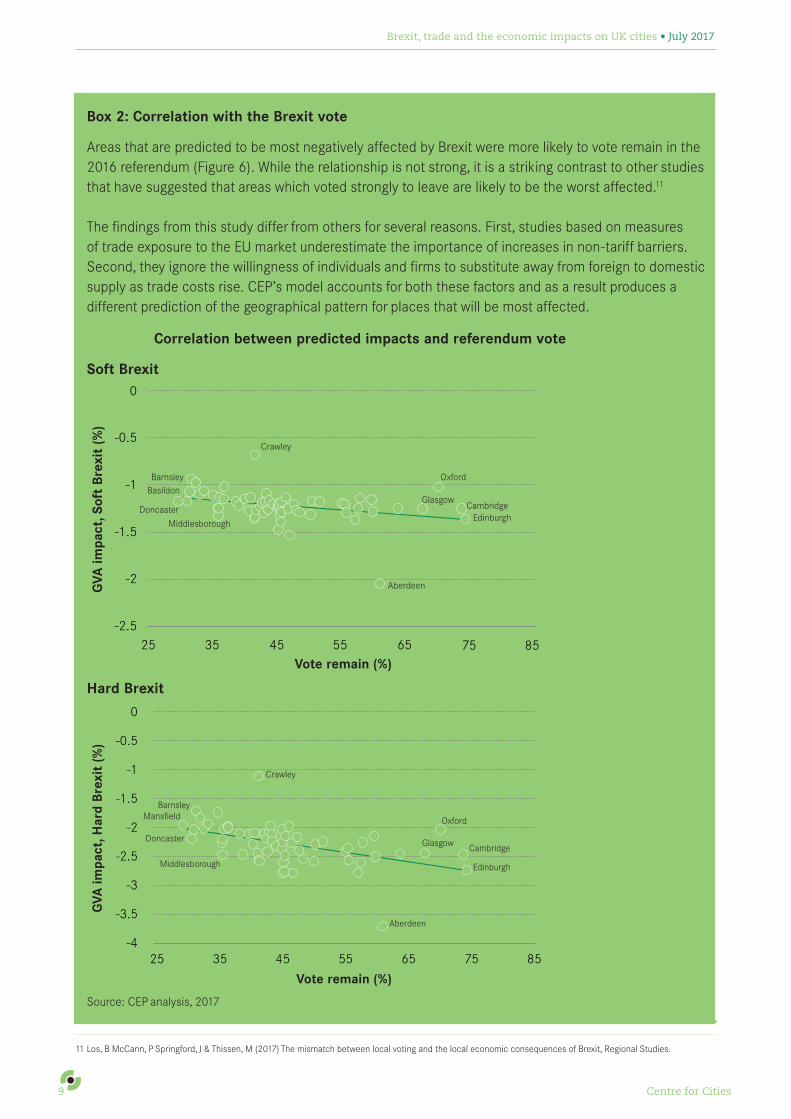
Box 2: Correlation with the Brexit vote Areas that are predicted to be most negatively affected by Brexit were more likely to vote remain in the 2016 referendum (Figure 6). While the relationship is not strong, it is a striking contrast to other studies that have suggested that areas which voted strongly to leave are likely to be the worst affected.11
The findings from this study differ from others for several reasons. First, studies based on measures of trade exposure to the EU market underestimate the importance of increases in non-tariff barriers. Second, they ignore the willingness of individuals and firms to substitute away from foreign to domestic supply as trade costs rise. CEP’s model accounts for both these factors and as a result produces a different prediction of the geographical pattern for places that will be most affected.
Figure 6: Correlation between predicted impacts and referendum vote
Soft Brexit
-2.5
-2
-1.5
-1
-0.5
0
3525 45 55 65 75 85Vote remain (%)
GVA
impa
ct, S
oft
Brex
it (%
)
Doncaster
Barnsley
Glasgow
Oxford
CambridgeEdinburgh
Aberdeen
Crawley
Middlesborough
Basildon
Hard Brexit
-4
-3.5
-3
-2.5
-2
-1.5
-1
-0.5
0
GVA
impa
ct, H
ard
Brex
it (%
)
3525 45 55 65 75 85
Vote remain (%)
Doncaster
Barnsley
Glasgow
Oxford
Cambridge
Edinburgh
Aberdeen
Crawley
Middlesborough
Mansfield
Source: CEP analysis, 2017
11 Los, B McCann, P Springford, J & Thissen, M (2017) The mismatch between local voting and the local economic consequences of Brexit, Regional Studies.
Brexit, trade and the economic impacts on UK cities • July 2017
Centre for Cities10
Cities predicted to be most negatively affected may find it easier to adapt in the longer term.
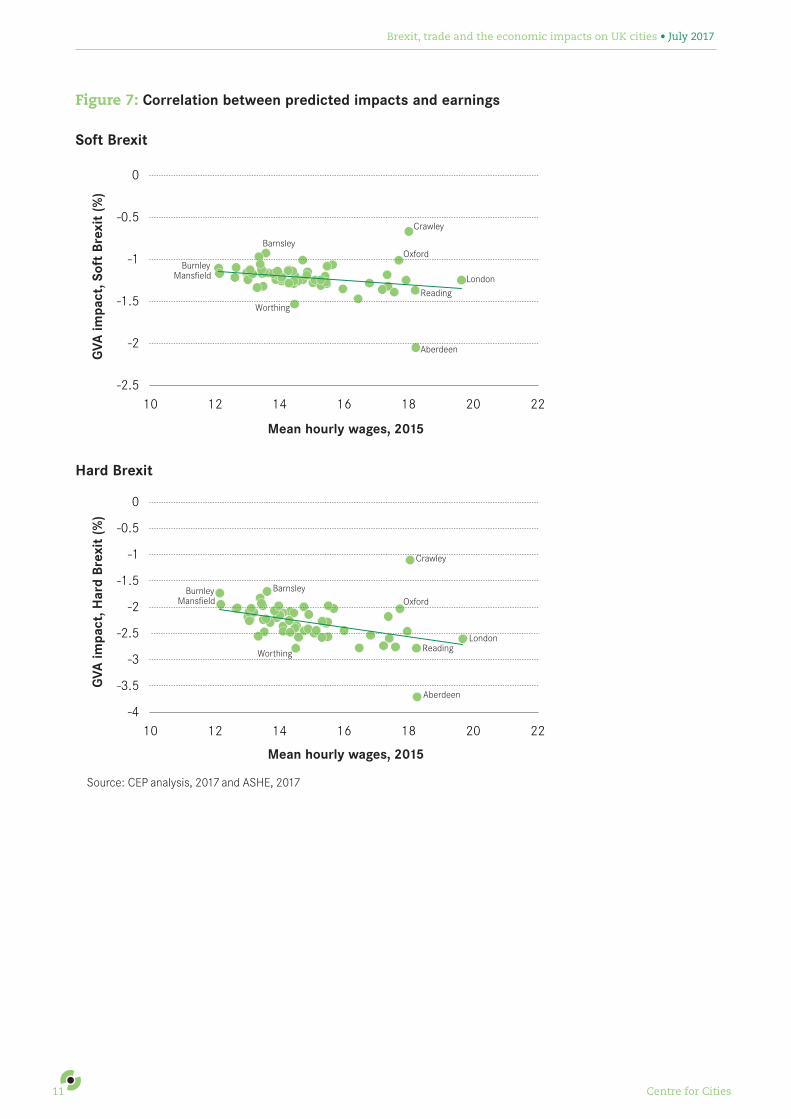
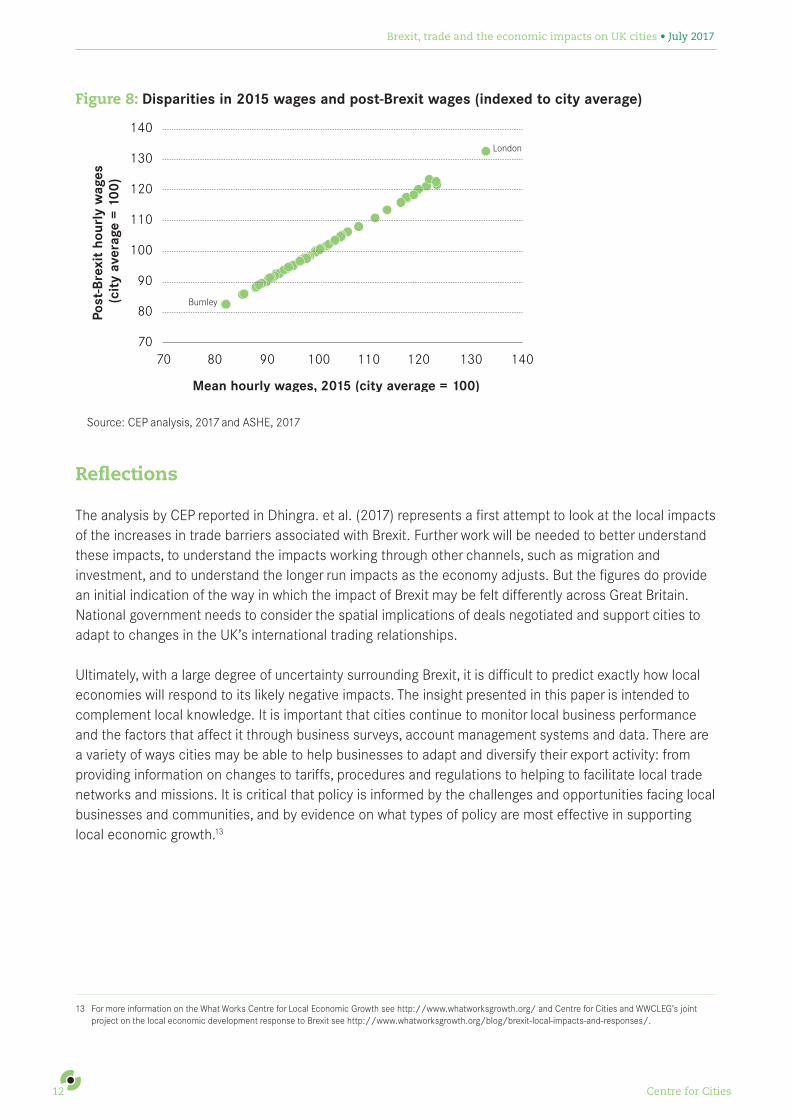
Cities that are predicted to be most negatively impacted tend to have higher average earnings (Figure 7). The disparities swamp the expected impacts of Brexit. Average hourly earnings are 1.6 times higher in London compared to Burnley, for example. Predictions of differences in the impact of Brexit will make little impact on these disparities – the gap between London and Burnley is reduced by 1.4 percentage points (Figure 8). More generally, only a handful of cities move one or two places in the overall ranking.
Differences in cities ability to adapt to Brexit-related changes may mean that the gap between cities widens in the long run. Even though the immediate negative impacts are predicted to be smaller in poorer regions, households in those areas start off poorer and may experience considerably more difficulty in adapting to those negative changes.
Here there is a parallel with the 2008 financial crisis, and specifically the contrast between the immediate and long run impacts, which saw London and the South East hit hardest before recovering much more strongly than other areas of the UK. Cities with more highly skilled workforces pre-2008 tended to be less negatively affected during this period.12
Overall, this suggests that the cities predicted to be most negatively impacted, which also tend to have higher wages, larger pools of graduate labour and a more innovative business base, may not necessarily experience the most negative effects once the economy has adjusted.
12 Source: NOMIS, ONS, 2017.
Brexit, trade and the economic impacts on UK cities • July 2017
Centre for Cities11
Figure 7: Correlation between predicted impacts and earnings
Soft Brexit
-2.5
-2
-1.5
-1
-0.5
0
10 12 14 16 18 20 22
Mean hourly wages, 2015
GVA
impa
ct, S
oft
Brex
it (%
)
Reading
London
Crawley
Oxford
Aberdeen
BurnleyMansfield
Worthing
Barnsley
Hard Brexit
Reading
-4
-3.5
-3
-2.5
-2
-1.5
-1
-0.5
0
10 12 14 16 18 20 22
Mean hourly wages, 2015
GVA
impa
ct, H
ard
Brex
it (%
)
London
Crawley
Oxford
Aberdeen
BurnleyMansfield
Worthing
Barnsley
Source: CEP analysis, 2017 and ASHE, 2017
Brexit, trade and the economic impacts on UK cities • July 2017
Centre for Cities12
Figure 8: Disparities in 2015 wages and post-Brexit wages (indexed to city average)
70
80
90
100
110
120
130
140
70 80 90 100 110 120 130 140
Mean hourly wages, 2015 (city average = 100)
Post
-Bre
xit
hour
ly w
ages
(c
ity
aver
age
= 10
0)
Burnley
London
Source: CEP analysis, 2017 and ASHE, 2017
Reflections
The analysis by CEP reported in Dhingra. et al. (2017) represents a first attempt to look at the local impacts of the increases in trade barriers associated with Brexit. Further work will be needed to better understand these impacts, to understand the impacts working through other channels, such as migration and investment, and to understand the longer run impacts as the economy adjusts. But the figures do provide an initial indication of the way in which the impact of Brexit may be felt differently across Great Britain. National government needs to consider the spatial implications of deals negotiated and support cities to adapt to changes in the UK’s international trading relationships.
Ultimately, with a large degree of uncertainty surrounding Brexit, it is difficult to predict exactly how local economies will respond to its likely negative impacts. The insight presented in this paper is intended to complement local knowledge. It is important that cities continue to monitor local business performance and the factors that affect it through business surveys, account management systems and data. There are a variety of ways cities may be able to help businesses to adapt and diversify their export activity: from providing information on changes to tariffs, procedures and regulations to helping to facilitate local trade networks and missions. It is critical that policy is informed by the challenges and opportunities facing local businesses and communities, and by evidence on what types of policy are most effective in supporting local economic growth.13
13 For more information on the What Works Centre for Local Economic Growth see http://www.whatworksgrowth.org/ and Centre for Cities and WWCLEG’s joint project on the local economic development response to Brexit see http://www.whatworksgrowth.org/blog/brexit-local-impacts-and-responses/.
Brexit, trade and the economic impacts on UK cities • July 2017
Centre for Cities13
Appendix
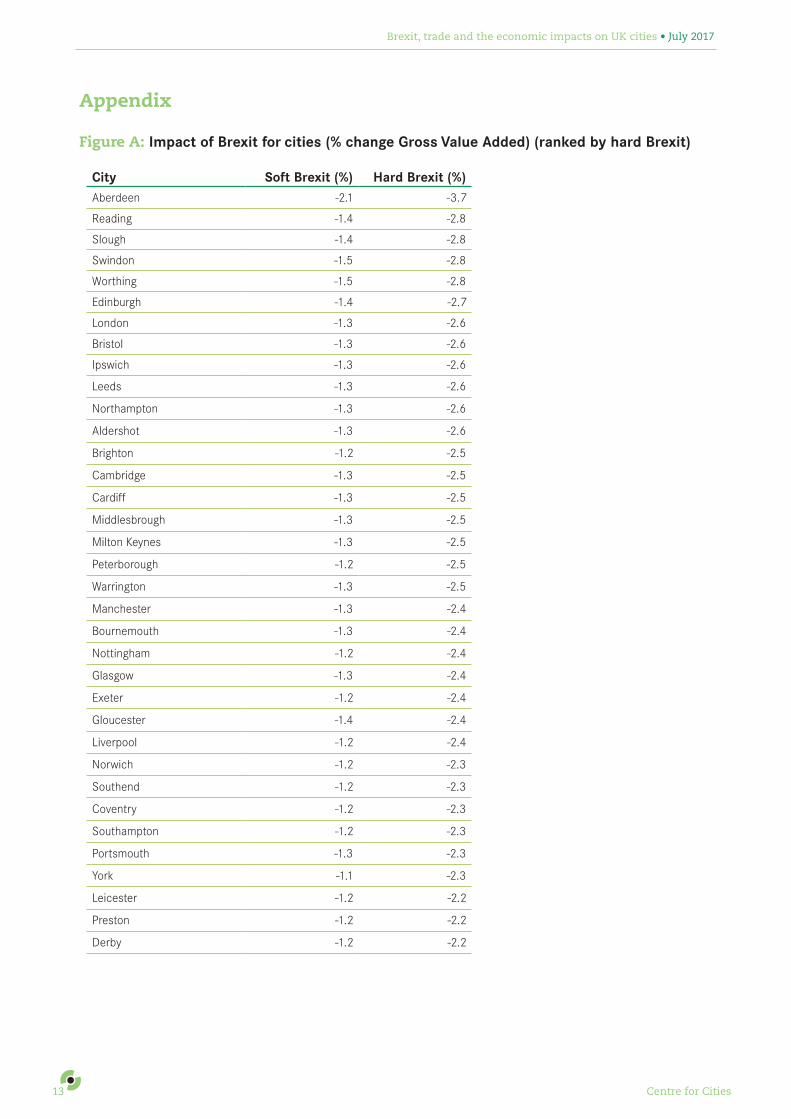
Figure A: Impact of Brexit for cities (% change Gross Value Added) (ranked by hard Brexit)
City Soft Brexit (%) Hard Brexit (%)Aberdeen -2.1 -3.7
Reading -1.4 -2.8
Slough -1.4 -2.8
Swindon -1.5 -2.8
Worthing -1.5 -2.8
Edinburgh -1.4 -2.7
London -1.3 -2.6
Bristol -1.3 -2.6
Ipswich -1.3 -2.6
Leeds -1.3 -2.6
Northampton -1.3 -2.6
Aldershot -1.3 -2.6
Brighton -1.2 -2.5
Cambridge -1.3 -2.5
Cardiff -1.3 -2.5
Middlesbrough -1.3 -2.5
Milton Keynes -1.3 -2.5
Peterborough -1.2 -2.5
Warrington -1.3 -2.5
Manchester -1.3 -2.4
Bournemouth -1.3 -2.4
Nottingham -1.2 -2.4
Glasgow -1.3 -2.4
Exeter -1.2 -2.4
Gloucester -1.4 -2.4
Liverpool -1.2 -2.4
Norwich -1.2 -2.3
Southend -1.2 -2.3
Coventry -1.2 -2.3
Southampton -1.2 -2.3
Portsmouth -1.3 -2.3
York -1.1 -2.3
Leicester -1.2 -2.2
Preston -1.2 -2.2
Derby -1.2 -2.2

Brexit, trade and the economic impacts on UK cities • July 2017
Centre for Cities14
Doncaster -1.2 -2.2
Newcastle -1.2 -2.2
Chatham -1.2 -2.2
Birkenhead -1.2 -2.2
Birmingham -1.1 -2.1
Blackburn -1.3 -2.1
Bradford -1.2 -2.1
Dundee -1.2 -2.1
Newport -1.2 -2.1
Plymouth -1.1 -2.1
Sheffield -1.2 -2.1
Sunderland -1.2 -2.1
Mansfield -1.2 -2.0
Basildon -1.1 -2.0
Blackpool -1.0 -2.0
Huddersfield -1.2 -2.0
Luton -1.1 -2.0
Swansea -1.1 -2.0
Stoke -1.1 -2.0
Oxford -1.0 -2.0
Telford -1.1 -2.0
Wigan -1.1 -2.0
Wakefield -1.1 -1.9
Hull -1.0 -1.8
Barnsley -0.9 -1.7
Burnley -1.1 -1.7
Crawley -0.7 -1.1
Source: CEP analysis, 2017

Brexit, trade and the economic impacts on UK cities • July 2017
Centre for Cities15
Figure B: Impact of Brexit for local authorities (% change Gross Value Added) Soft Brexit
-0.4 to -0.2
-0.7 to -0.5
-1 to -0.8
-1.4 to -1.1
-1.7 to -1.5
-2.1 to -1.8
Change in GVA under Soft Brexit (%)
CardiffLondon
Manchester
Edinburgh
Brexit, trade and the economic impacts on UK cities • July 2017
Centre for Cities16
Hard Brexit
-1 to -0.5
-1.3 to -1.1
-1.7 to -1.4
-2.1 to -1.8
-3.5 to -2.2
-4.3 to -3.6
Change in GVA under Hard Brexit (%)
CardiffLondon
Manchester
Edinburgh
Source: CEP analysis, 2017
July 2017
Centre for CitiesSecond Floor
9 Holyrood StreetLondon SE1 2EL
020 7803 [email protected]
© Centre for Cities 2017
Centre for Cities is a registered charity (No 1119841) and a company limited by guarantee registered in England (No 6215397)
Partnerships
Centre for Cities is always keen to work in partnership with like-minded organisations who share our commitment to helping cities to thrive, and supporting policy makers to achieve that aim.
As a registered charity (no. 1119841) we rely on external support to deliver our programme of quality research and events.
To find out more please visit:
www.centreforcities.org/about/partnerships
Supported by
The CEP is an interdisciplinary research centre at the LSE Research Laboratory. It was established by the Economic and Social Research Council (ESRC) in 1990 and is now one of the leading economic research groups in Europe. The CEP studies the determinants of economic performance at the level of the company, the nation and the global economy by focusing on the major links between globalisation, technology and institutions (above all the educational system and the labour market) and their impact on productivity, inequality, employment, stability and wellbeing