Embed Size (px)
Citation preview

Industrial Energy Efficiency Accelerator - Guide to the brewing sector They UK produces 49 Mhl per year and emits approximately 446,000tCO2/yr. Current CCA data shows that in the UK there are 14 large breweries or packaging sites (over 1Mhl per annum), a further 35 smaller breweries and circa 700 micro-brewers. This Sector Guide describes the IEEA findings for the UK brewing sector. The investigation centred on the brewhouse, small pack packaging, kegging/casking and clean-in-place (CIP) as the key areas where significant improvements could be made.
Executive Summary
The Carbon Trust has worked with a range of industry sectors as part of its Industrial Energy Efficiency
Accelerator (IEEA), to identify where step-change reductions in energy use can be achieved through detailed
investigation of sector-specific production processes. The IEEA aims to support industry-wide process carbon
emissions reduction by accelerating innovation in processes, product strategy and the uptake of low carbon
technologies, substantiated by process performance data and detailed process analysis.
This Sector Guide describes the IEEA findings for the UK brewing sector. The investigation centred on the
brewhouse, small pack packaging, kegging/casking and clean-in-place (CIP) as the key areas where significant
improvements could be made, and opportunities categorised according to their degree of technical/commercial
maturity; that is, their relative ease of implementation and cost-effectiveness:
Wave 1: Energy efficiency best practice and process optimisation: On the basis of the best practice
survey carried out as part of the investigation, we estimate that a 5% carbon saving (22,000tCO2/year) could
be made across the sector, from the consistent application of all feasible best practice opportunities.
Furthermore, a large number of process optimisation opportunities were identified, relating to the kettle, small-
pack pasteurisation, keg/cask processing, and CIP. Those that were possible to quantify show that a further
9% reduction (40,000tCO2/year) in carbon emissions could be achieved by optimising and implementing
existing best practice process technologies.
Wave 2: Opportunities on the horizon: Some newer technologies have the potential to make step-change
reductions in energy use; these are commercially available but UK take-up has been low due to concerns over
quality impacts, lack of capital, and longer than acceptable payback periods. Areas of potential are: adding a
wort stripping column or direct steam injection to the kettle; kettle vapour heat recovery; using a heat pump to
recover energy from refrigeration system condensers; and switching to flash pasteurisation or cold sterile

Brewing Sector Guide 2
filtration for small-pack pasteurisation. An estimated 12% further carbon reduction (54,000tCO2/year) could be
achieved from such measures.
Wave 3: The future: A number of game-changing technologies have been identified but will require both a
time and financial commitment from the industry to bring them to technical and commercial fruition. We
estimate the key areas with potential to be UV pasteurisation for both kegs and small pack, as well as the
development of more precise techniques for monitoring and controlling CIP processes. We estimate that a
further 5% carbon saving (22,000tCO2/year) could be made across the sector from these measures.
The cumulative impact of these opportunities, illustrated in the “carbon reduction road map” shown in the figure
below, shows that a total sector carbon saving of 31% is achievable, equivalent to 138,000tCO2/yr on sector
baseline emissions of 446,000tCO2/yr. This is based on a sequenced scenario where all Wave 1 opportunities
are implemented first, so that the impact of the more innovative opportunities of Waves 2 and 3 is made against
an already reduced baseline carbon emissions level.
The table below summarises the main areas of opportunity categorised according to the three-wave approach
described above, along with their sector-wide carbon saving potential. Note that the measures are not necessarily
additive; for example, a wort-stripping column and direct steam injection are alternative boil-off reduction
technologies, and cannot both be applied. Furthermore, the sector saving potential is also affected by previous
improvements: for example, if best practice and the optimisation of existing processes has first been carried out,
then the incremental benefit of, say, cold sterile filtration will be against an already reduced starting position of
energy use and carbon emissions. The road map graph above has taken these factors into account.
Wave (1/2/3)
Area Description
Sector Carbon Saving
Average Payback (years) (tCO2) (%)
1 Best practice in energy Implement all feasible opportunities 22,300 5.0% Unknown
1 Process optimisation Reduce boil-off 11,200 2.5% Unknown
1 Process optimisation Increase high gravity dilution 11,900 2.7% Unknown
1 Process optimisation Optimise tunnel pasteurisers 14,000 3.1% Unknown
1 Process optimisation Optimising cask washing 3,100 0.7% 5.9
100%
14%
12%
5%
69%
0%
10%
20%
30%
40%
50%
60%
70%
80%
90%
100%
Step change road map for UK brewery sector

Brewing Sector Guide 3
Wave (1/2/3)
Area Description
Sector Carbon Saving
Average Payback (years) (tCO2) (%)
2 Small pack pasteurisation Flash pasteurisation with clean room 53,400 12.0% 2.5
2 Small pack pasteurisation Cold sterile filtration 68,600 15.4% 6.3
2 Pasteurisation Heat pump on refrigeration condenser 29,200 6.5% 2.7
2 Kettle Wort stripping column 21,500 4.8% 2.4
2 Kettle Wort steam injection 18,700 4.2% 3.2
2 Kegs/Casks One way containers Dependent on transport distance
3 CIP Real-time cleaning verification 4,600 1.0% Unknown
3 CIP CIP – novel technologies and low temperature detergents (ECA)
7,500 1.7% Unknown
3 Small pack pasteurisation UV pasteurisation for small pack 68,300 15.3% 6.5
3 Kegs/Casks UV pasteurisation for kegs 13,100 2.9% 1.9
Recommendations
We recommend that the brewing industry takes the following, tiered approach to energy and carbon efficiency
improvement:
Implement remaining best practice techniques and technologies: investigation has shown a considerable
potential for sector-wide savings by ensuring the consistent application of sustained best practice
management techniques and available technologies.
Optimise existing processes in the brewhouse, packaging and CIP: further, low cost savings can be
achieved through improvements to operating practices and production methods and by refinements to existing
process technologies.
Collaborate with equipment suppliers on technology trials and pilot projects: to assess the potential
impact of less proven technologies and techniques on product quality and to support the progression to cost-
effective equipment design.
BBPA and Carbon Trust support: should be sustained to ensure that the UK brewing sector has access to
the information, case studies, partnerships and innovation support funding that will enable it to achieve the
significant carbon emissions reduction potential identified as part of this IEEA project.

Brewing Sector Guide 4
Table of contents
Executive Summary .............................................................................................................................. 1
1 Introduction ....................................................................................................................................... 6
1.1 Sector background ............................................................................................................. 6
1.2 Process operations and energy ......................................................................................... 7
1.3 Sector carbon emissions ................................................................................................. 15
1.4 Issues and barriers relating to energy efficiency and change ......................................... 16
1.5 Focus processes .............................................................................................................. 17
1.6 Regulatory drivers ............................................................................................................ 18
1.7 Other business drivers ..................................................................................................... 20
1.8 Industry progress on energy saving ................................................................................ 20
2 Methodology for monitoring and analysis ................................................................................... 21
2.1 What metering/data gathering was done and why .......................................................... 21
2.2 The kettle ......................................................................................................................... 21
2.3 Small pack pasteurisation ................................................................................................ 21
2.4 Keg/cask processing ........................................................................................................ 22
2.5 CIP ................................................................................................................................... 22
2.6 Engagement with the sector ............................................................................................ 22
2.7 Participating host sites ..................................................................................................... 22
2.8 Data gathering ................................................................................................................. 23
2.9 Metering approach ........................................................................................................... 23
2.10 Best practice checklist .................................................................................................... 24
3 Key findings: best practice survey ............................................................................................... 25
4 Key findings and opportunities: the kettle - wort stabilisation ................................................. 27
4.1 Key differences between the sites investigated ............................................................... 27
4.2 Data to support analysis .................................................................................................. 28
4.3 Best practice process optimisation opportunities ............................................................ 35
4.4 Innovative wort stabilisation opportunities ....................................................................... 37
4.5 Summary of findings ........................................................................................................ 40
4.6 Barriers to implementation ............................................................................................... 40
5 Key findings and opportunities: small pack pasteurisation ...................................................... 41
5.1 Process description ......................................................................................................... 41
5.2 Data analysis and modelling ............................................................................................ 43
5.3 Process optimisation opportunities .................................................................................. 47

Brewing Sector Guide 5
5.4 Innovative opportunities and significant change .............................................................. 50
5.5 Summary of findings ........................................................................................................ 53
5.6 Barriers to implementation ............................................................................................... 54
6 Key findings and opportunities: keg and cask processing ....................................................... 55
6.1 Keg processing ................................................................................................................ 55
6.2 Cask processing .............................................................................................................. 59
6.3 Summary of findings ........................................................................................................ 62
6.4 Barriers to implementation ............................................................................................... 62
7 Key findings and opportunities: clean-in-place .......................................................................... 64
7.1 Data analysis ................................................................................................................... 64
7.2 Process optimisation opportunities .................................................................................. 66
7.3 Innovative opportunities ................................................................................................... 67
7.4 Summary of findings ........................................................................................................ 69
7.5 Barriers to implementation ............................................................................................... 70
8 Summary of opportunities ............................................................................................................. 72
8.1 Overview .......................................................................................................................... 72
8.2 General best practice energy efficiency opportunities ..................................................... 73
8.3 Process optimisation opportunities .................................................................................. 73
8.4 Innovative opportunities ................................................................................................... 73
9 Sector roadmap and next steps for the UK brewery sector....................................................... 78
9.1 The step change roadmap ............................................................................................... 78
9.2 Elements of the roadmap ................................................................................................. 79
9.3 Next steps for the UK brewery sector .............................................................................. 81
Appendix 1: Metering rationale .......................................................................................................... 84
Appendix 2: Good practice checklist ................................................................................................ 87
Appendix 3: Kettle technologies and business cases .................................................................... 99
Appendix 4: Small pack technologies and business cases .......................................................... 104
Appendix 5: Keg/cask technologies and business cases ............................................................. 112
Appendix 6: CIP technologies and business cases ...................................................................... 115
Brewing Sector Guide 6
1 Introduction
1.1 Sector background
Beer has been a staple part of British food since the early 12th century; it is a much-loved part of British culture,
and the industry supports around 400,000 jobs, as well as sustaining many other UK businesses. The British
Beer and Pub Association (BBPA) is the leading trade organisation representing the UK beer and pub sector. Its
members account for 96% of beer brewed in the UK and own more than half of Britain's 53,000 pubs.
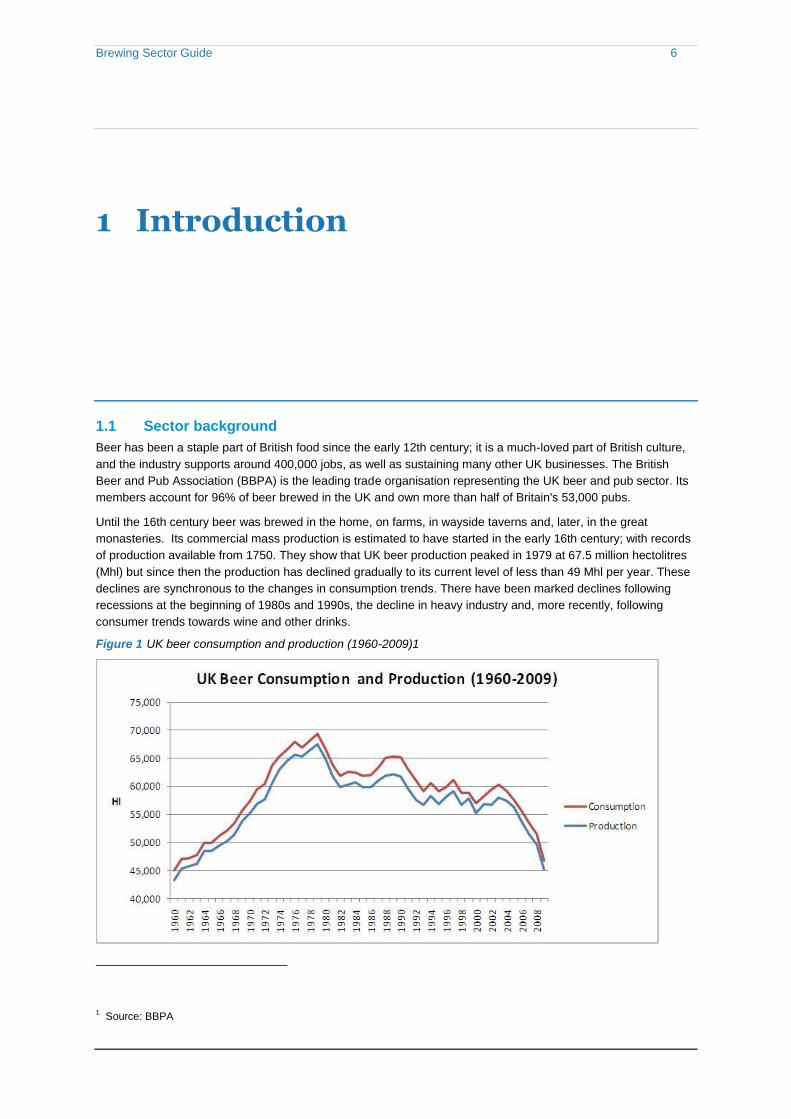
Until the 16th century beer was brewed in the home, on farms, in wayside taverns and, later, in the great
monasteries. Its commercial mass production is estimated to have started in the early 16th century; with records
of production available from 1750. They show that UK beer production peaked in 1979 at 67.5 million hectolitres
(Mhl) but since then the production has declined gradually to its current level of less than 49 Mhl per year. These
declines are synchronous to the changes in consumption trends. There have been marked declines following
recessions at the beginning of 1980s and 1990s, the decline in heavy industry and, more recently, following
consumer trends towards wine and other drinks.
Figure 1 UK beer consumption and production (1960-2009)1
1 Source: BBPA

Brewing Sector Guide 7
Against the background of declining production, there has been a rationalisation within the industry. The earliest
record of number of breweries is in 1690, which shows around 48,000 breweries in existence at that time. In the
past thirty years, the number of industrial breweries has reduced from 140 to 49; however the number of micro-
breweries has gone up in this period. Current CCA2 data shows that in the UK there are 14 large breweries or
packaging sites (over 1Mhl per annum), a further 35 smaller breweries, and circa 700 micro-brewers. Heineken
UK (formerly known as Scottish & Newcastle), is the market leader, with more than a quarter of UK beer sales.
The next three largest companies are also foreign-owned companies; Molson Coors UK; AB-InBev UK; and
Carlsberg UK. On the other hand, Irish-based Diageo is famous for its Guinness brand and is a major
multinational3.
There are some changing trends in beer consumption that are worth noting. Data from the BBPA CCA 2010
report shows that the volume of ale and stout, the traditional British beers, has been slowly replaced by lager,
changing the proportion of ale and stout to lager from 99:1 to 25:75 over the last 50 years. Climate Change
Agreement (CCA) data for the brewery sector shows that the majority of exclusive ale producers are relatively
small in size (annual production below 1 Mhl), whilst all the exclusive lager producers fall in the large category
(annual production greater than 1 Mhl).
There has also been a shift from drinking in pubs, clubs and bars to taking beer home for consumption. Take-
home sales now account for 47% of the total sales volume as against 10% in the 1970s. Change in the
packaging mix is consistent with the growth in take-home sales; the percentage of returnable bottles, kegs and
casks is steadily declining matched by the percentage of non-returnable bottles and cans increasing. The volume
sold in cans has doubled in the last 30 years.4
From the perspective of energy and water consumption, the UK brewing industry has seen some encouraging
trends. Even though, for lager, lower fermentation temperatures and cold-conditioning periods result in higher
requirements for refrigeration and thus electricity consumption, and specific energy consumption (SEC) in
manufacturing is higher for small-pack products, BBPA data shows that the overall SEC for the industry has
fallen by 53% since 1976. Overall water consumption has declined by 49% over the past 30 years and total
carbon emission for the industry has dropped by 55% from its 1990 level. These achievements are discussed in
detail further in this report.
1.2 Process operations and energy
1.2.1 Process overview
Brewing is the production of alcoholic beverage through fermentation. Brewing specifically refers to the process
of steeping, and extraction (chemical mixing process), usually through heat. The brewing process uses malted
barley and/or cereals, un-malted grains and/or sugar/corn syrups (adjuncts), hops, water, and yeast to produce
beer. Brewing has a very long history, and archaeological evidence suggests that this technique was used in
ancient Egypt. Descriptions of various beer recipes can be found in Sumerian writings, some of the oldest known
writing of any sort.
Most brewers in the UK use malted barley as their principal raw material. The main ingredient for the brewery
process (barley grain) goes through malting process (this process is usually done in a dedicated maltings facility
separate to the brewery).
2 Climate Change Agreements between industry trade associations and the Government allow industry members to claim an 80% discount on the Climate Change Levy. In return companies must hit energy/carbon saving targets and report on progress.
3 Source: BBPA
4 Source: BBPA

Brewing Sector Guide 8
First the grain is steeped in water. This prompts germination which generates α-amylase and β-amylase among
other enzymes. These enzymes are used later to help the starch in the grain be broken down to sugar. Before
the malted grain is delivered to the brewery it is usually roasted or dried in a kiln, with longer roasting periods
resulting in a darker and stronger tasting beer.
1. The first step in brewing involves milling the malted grain to increase the surface areas available so that
a high yield of extracted substances can be obtained. This is either done wet or dry.
2. The crushed malt (grist) is then mixed with heated water in the mash tun (a large vessel). During
mashing natural enzymes within the malt break down much of the starch into sugars which play a vital
part in the fermentation process. This process usually involves the mash being heated to several
specific temperatures (break points) and resting at these temperatures where different enzymes break
down the starch into the desired mix of sugars. The sugar and starch solution that is created in the
process is called the wort. Before the mash is filtered the temperature is raised to 75ºC to deactivate
enzymes.
3. To separate out the wort from the grist the mash is either sent through a lauter tun or mash filter.
o A lauter tun is a large vessel up to several meters wide and tall which has a slotted bottom (like a
giant sieve), which allows the wort to fall through while retaining the spent grain grist behind. To
extract any remaining available sugars fresh water is sprayed onto the mash after the initial wort
has drained through the slotted base (sparging).
o A mash filter is comprised of a series of plates where the mash is compressed to remove as much
wort as possible. The remaining mash is sparged but less water is needed as the mash filter
provides a larger cross section of mash with less depth to penetrate than in a lauter tun.
o In some cases the lauter tun is combined with the mash tun to form a mash vessel. In this case, the
wort run off is directed through a series of slotted plates at the bottom of the tun. The mash floats
on top of the wort. This tends to be the slowest wort separation system although it is the lowest cost
in terms of capital outlay.
4. The next step involves the wort being heated in a wort copper or kettle; wort stabilisation involves the
boiling and evaporation of the wort (about a 4-8% evaporation rate) over a 1 to 1.5 hour period. The boil
is a strong rolling boil and is the most energy-intensive step of the beer production process.
The boiling sterilises the wort, coagulates grain protein, stops enzyme activity, drives off volatile
compounds, causes metal ions, tannin substances and lipids to form insoluble complexes, extracts
soluble substances from hops and cultivates colour and flavour. During this stage hops, which extract
bitter resins and essential oils, can be added. Hops can be fully or partially replaced by hop extracts,
which reduce boiling time and remove the need to extract hops from the boiled wort. If hops are used,
they can be removed after boiling with different filtering devices in a process called hop straining.
5. In order to remove the hot break or trub (denatured proteins that form a solid residue), the boiled wort is
clarified through sedimentation, filtration, centrifugation or whirlpool (being passed through a whirlpool
tank). Whirlpool vessels are most common in the UK.
6. After clarification, the cleared hopped wort is cooled. Heat exchangers for cooling are of two types:
single-stage (chilled water only) or multiple-stage (ambient water and glycol). Wort enters the heat
exchanger at approximately 96-99ºC and exits cooled to pitching temperature. Pitching temperatures
vary depending on the type of beer being produced. Pitching temperature for lagers run between 6-
15°C, whilst for ales are higher at 12-25°C. Certain brewers aerate the wort before cooling to drive off
undesirable volatile organic compounds. A secondary cold clarification step is used in some breweries
to settle out trub, an insoluble protein precipitate, present in the wort obtained during cooling.

Brewing Sector Guide 9
7. Once the wort is cooled, it is oxygenated and blended with yeast on its way to the fermentation vessel.
During fermentation, the yeast metabolizes the fermentable sugars in the wort to produce alcohol and
carbon dioxide (CO2). The process also generates significant heat that must be dissipated in order to
avoid damaging the yeast. Fermenters are cooled by coils or cooling jackets. In a closed fermenter,
CO2 can be recovered and later reused. Fermentation time will vary from a few days for ales to closer
to 10 days for lagers. The rate is dependent on the yeast strain, fermentation parameters and the taste
profile that the brewer is targeting.
8. At the conclusion of the fermentation process the beer is cooled to stop the action of the yeast, then the
yeast is removed through settling or through a centrifuge (although with real ale: some yeast is retained
and after the ageing it is added with the beer into the barrel).
9. Beer aging, conditioning or maturation is the final production step. The beer is cooled and stored in
order to settle remaining yeast and other precipitates and to allow the beer to mature and stabilize.
Different brewers age their beer at different temperatures, partially dependent on the desired taste
profile. Beer is held at conditioning temperature (-1ºC to 10ºC) for several days to over a month, and
then chill-proofed and filtered (the process for real ale is different to lager as the yeast is not filtered out
of the beer).
10. With the beer at a temperature of -1ºC, a kieselguhr (diatomaceous earth or mud) filter is typically used
to remove any precipitated protein and prevent the beer from clouding when served at a cool
temperature. With real ale the beer is not filtered so that the yeast is still ‟live‟ when it goes out in the
cask.
11. In high gravity brewing (high alcohol content), specially treated de-aerated water is added after the
filtration stage to achieve the desired final gravity. The beer‟s CO2 content can also be trimmed with
CO2 that was collected during fermentation or from external supplies if enough CO2 is not recovered
on site.
12. After being blended the beer is then sent to the bright (i.e. filtered) beer tanks before packaging.
13. Beer that is destined for bottles or cans is sent to the fillers where a vacuum or counter pressure filler
will be used to fill the bottles or cans. Other beer will go to the flash pasteuriser and be filled at a later
stage in, casks, kegs or sometimes directly into tankers (for real ale the beer is not pasteurised as this
would kill the yeast).
14. The beer must be cleaned of spoiling bacteria to lengthen its shelf life. One method to achieve this,
especially for beer that is expected to have a long shelf life, is pasteurisation, where the beer is heated
to 75°C to destroy biological contaminants (this is not carried out with real ale as the process would kill
the yeast in the beer). Different pasteurisation techniques are tunnel or flash pasteurisation:
o Flash pasteurisation involves the beer being heated for a short amount of time and then being
bought down in temperature in a heat exchanger prior to filling.
o In-pack pasteurisation is the pasteurisation of beer that has already been packed in bottles or cans,
by bringing the whole packed beer container up to temperature by heating with hot water. This is
typically done in a tunnel pasteuriser.
15. Finally, the packaged beer undergoes any secondary or retail packing processes and is ready to be
shipped.
The diagram below shows these 15 process steps, with annotation as to where cold liquor (cold water), hot
liquor (hot water) and de-aerated water are added and where heating and cooling take place.

Brewing Sector Guide 10
Figure 2 Brewing process diagram

Brewing Sector Guide 11
1.2.2 Process energy use
Energy consumption in any typical brewery is divided into two parts: electrical energy consumption and thermal
energy consumption. Thermal energy or heat is typically generated using different fuels in a boiler house. Coal
and oil were the traditional boiler fuels but the majority of boilers in the UK now run on natural gas, with fuel oil
used as a backup. Process heating typically accounts for a large share of thermal energy. Electrical energy is
either sourced from grid or generated on-site, for example, in a combined heat and power (CHP) system.
Refrigeration for process cooling typically accounts for a significant amount of electricity. An estimated CO2
emission breakdown by main process areas in percent of total energy consumption is shown in Figure 3 for a
typical brewery.
Figure 3 Brewery CO2 consumption breakdown from a typical 2Mhl brewery5
Brewhouse38%
Packaging35%
Cold Block11%
Waste Water7%
Building services5%
Warehouse4%
Typical site CO2 breakdown
From this information the main energy users can be identified as the brewhouse, packaging and the cold
block. By looking at data gathered during previous studies at several large breweries (2+ Mhl/year) we have
been able to build an approximate model of where both electrical and thermal energy is consumed in these
individual sections of the brewery.
The following diagrams and charts demonstrate what type of inputs each process requires and how much energy
each stage consumes. In each stage the areas that we have focused on may not be broken down into exactly the
same stages that the process diagram indicates. This is down to insufficient metering for each process.
5 Source: Camco data and IEEA data collection

Brewing Sector Guide 12
As the charts below indicate, the vast majority of thermal energy is used in brewing operations and
pasteurisation, while electricity consumption is more evenly divided among fermentation, beer conditioning and
utilities.
Brew House
Figure 4: Brew house process diagram
Brew House
2. Mash Tun 5. Whirlpool4. Kettle3. Lauter Tun or Mash Filter
6. Wort Cooler
Vapour heat recovery
1. Milling
Steam
Cold Liquor
Hot Liquor
Deaerated Liquor
Cooling
Electricity
Heat lost through hot spent grain
In Figure 5 below, the wort cooler has been combined with the whirlpool and kettle as a single energy user. The
wort cooler also recovers a lot of heat as hot liquor (water) which is subsequently used to mash in the next batch,
therefore the virgin energy consumed for mashing is not as much as might be imagined as the energy recovered
by the wort cooler reduces the energy input required for mashing in.
Figure 5 Brewhouse energy demands
The largest energy consumer in this area is clearly the kettle and any energy improvements in this area could
have a significant impact to overall brewery SEC (Specific Energy Consumption measured in this report as
kWh/hl).

Brewing Sector Guide 13
Cold Block
Figure 6: Cold block process diagram
In Figure 7 below, the centrifuge has been combined with the fermenters, and the beer cooler has been combined with the filtration process. Figure 7 Cold block energy demands
From the data available the electrical energy used in fermentation and filtration are the highest users in this area
and involve multiple processes (maturation involves cooling tanks only). The thermal inputs to filtration and
fermentation are down to the local clean-in-place (CIP) systems. The filters use a considerable amount of hot
caustic solution to regenerate.

Brewing Sector Guide 14
Packaging
Figure 8: Packaging process diagram
In Figure 3 the packaging block is shown to be responsible for the second highest energy demand within the
brewery, but how this energy is used cannot be simply mapped out by individual processes as each brewery
operates a different packaging set up and pack type mix.
Packaging in the UK is comprised mostly of non-returnable bottles and cans, and returnable kegs and casks.
Table 1 shows the percentage of beer packed in each of these pack types.
Table 1 UK packaged beer by packaging type
Pack Type Percentage of Packed
volume
Casked 6%
Kegged 44%
Bottled 12%
Canned 38%
The main energy users within packaging are pasteurisation and keg/cask washing. Small pack types (bottles and
cans) are known to be more energy intensive than keg or cask per unit volume of beer packaged. As the UK
produces only small quantities of returnable bottles, bottle washers are not common and so have not been
investigated as part of this IEEA project.

Brewing Sector Guide 15
1.3 Sector carbon emissions
1.3.1 Carbon dioxide emissions
In the UK in 2009, 43 Mhl of beer was produced, and 49 Mhl of beer was packed, by the 49 sites covered by the
sector‟s CCA (ie, 6 Mhl was imported in bulk but packaged in the UK). From these sites a total of 446,000 tonnes
of energy-related carbon dioxide (tCO2) was created, either through electricity or direct fuel consumption on site.
From CCA data this gives average specific energy consumption (delivered) of 37.5 kWh/hl and emissions of 10.4
kgCO2/hl
1.3.2 Brewery archetypes
We plotted a scatter graph of the 49 sites included in the BBPA CCA of production versus specific delivered
energy per hectolitre of beer produced, and specific CO2/hl of beer produced. This allowed us to draw a line of
best fit or performance curve through where the sites lay on the graph. By combining this line with a production
dividing line (1 Mhl/year production was close to the average and also a sensible division between smaller and
larger sites); the graph is divided up into four sections, or “archetypes”:
Large sites with higher Specific CO2 (kgCO2/hl product)
Large sites with lower Specific CO2
Small sites with higher Specific CO2
Small sites with lower Specific CO2
Figure 9 CCA brewery archetypes: total CO2 ratio vs. total production with 90% of sites falling between the grey lines

Brewing Sector Guide 16
Table 2 CCA brewery archetypes
Number of sites
Production (hl)
UK production
(%)
Carbon emissions
(tCO2e)
UK-wide emissions
(%)
Large sites - Higher specific energy 7 23,249,238 48% 229,170 51%
Large sites - Lower specific energy 7 16,890,668 35% 106,892 24%
Small sites - Higher specific energy 15 4,705,475 10% 76,901 17%
Small sites - Lower specific energy 20 3,362,530 7% 32,680 7%
We can draw the following conclusions from this analysis:
The 14 largest sites account for 83% of the volume of beer packaged and 75% of the total sector carbon
emissions;
Small sites with a high SEC are the next most significant group accounting for 10% of volume and 17% of
sector carbon emissions;
In general, larger sites have a lower SEC; and
Implementing emissions reduction projects in larger sites has the greatest potential to reduce sector
emissions.
1.4 Issues and barriers relating to energy efficiency and change
1.4.1 Authority for change within the UK brewery sector
Of the 49 brewery sites in the UK under the sector‟s CCA, 14 account for 83% of all beer produced and 75% of
sector emissions. These 14 large breweries are solely lager or mixed breweries and replicability of opportunities
within these sites will lead to the highest source of emissions reductions within the sector.
However, a large amount of beer is brewed under license in the UK, with many of these sites owned by
multinational companies based outside the UK, producing the same brand in many locations around the world, as
well as similar beers under different brand names, depending on location and market. Hence, the need to seek
agreement from internationally based head offices for changes of UK based plants creates a significant barrier to
change.
A potential barrier to energy and carbon emission saving opportunities that may affect the recipe of beers or
fundamental packaging methodologies (e.g. reductions in kettle boil-off or different pasteurisation techniques)
could understandably be the manufacturing standards used by non-UK companies that apply to multiple
breweries around the world.
If significant energy saving opportunities can be identified without any negative impact on beer quality or taste,
then the key to enabling these opportunities for the UK industry may be the effective engagement of such
international stakeholders. These companies are all committed to reducing their environmental impact across
each market they operate in.
1.4.2 Heritage and tradition
Many UK brewers rely on brands that claim to have been brewed in the same way for long periods of time. This
builds a brand that the consumer can associate with and trust to deliver quality with a recognisable taste.
Encouraging any changes to the brewing process to save energy could be met with opposition if these changes
might impact on marketability, and any such changes would need to be measured in terms of the impact on
Brewing Sector Guide 17
quality and taste. The customer is king and many breweries perceive that their customers have great loyalty to
their beer being produced in the traditional way in the traditional place.
This should not deter this project from investigating opportunities that could lead to large emissions reductions,
but it demonstrates that the Carbon Trust and its partners must engage sensitively with brewing companies to
examine how to mitigate any issues that may arise in this area.
1.4.3 Awareness of best practice
Initial site visits have shown that, on the whole, sites are aware of what is termed „best practice‟ for energy
efficiency. However, this does not mean that all best practice opportunities have been carried out where possible.
Where best practice has not been carried out, it is usually down to lack of available capital, resources or
expertise or the barriers discussed above.
By sending out a best practice survey to the whole sector we aimed to understand the level of remaining best
practice implementation potential, including the key opportunities still outstanding for the sector and the main
reasons they have not already been implemented (see Section 3 for the summary of the best practice survey
results).
1.4.4 Sector inclusion
The UK brewery sector is made up of three main types of site: large lager and mixed breweries; small ale-only
breweries; and micro-breweries that do not participate in the CCA. The way in which each type of brewery makes
beer is similar, but the technology used can be very different.
While looking for opportunities for this project care has been taken to include areas of focus that have an effect
on all parties involved. This has been carried out to reduce the likelihood of disenfranchisement and maximise
the potential benefits of having the whole sector involved.
1.5 Focus processes
Through choosing the following processes to focus on we aimed to direct the project into the investigation of the
highest energy using processes with the potential for improvement, as discussed and agreed in initial sector
stakeholder meetings.
Kettle. As shown in Figures 3 and 5, the kettle is the biggest energy user on site, so we have looked into
how much energy is required to boil several different types of beer. By looking at multiple breweries we have
been able to see what effect different kettle technologies have on the energy demand of the brewery process
and have used this information for building business cases for alternative approaches.
Small pack pasteurisation. The second biggest area of energy use in the brewery is in packaging. Within
this area the pasteurisation of the beer is the largest user of heat and a considerable user of water and
electricity. We have monitored two distinctive types of small pack pasteurisation:
o Flash, where the beer is heated up to pasteurisation temperature and then brought back down in a
plate pack heat exchanger and then bottled; and
o Tunnel, where the beer is bottled or canned and then raised in temperature by spraying hot water
over the containers to bring the whole package up to pasteurisation temperature.
Currently, the use of flash pasteurisation is relatively rare in the UK due to a number of perceived product
quality issues. By looking at these two types of pasteurisation we have been able to build a case study of
the two systems, showing the cost involved with each and the implications for moving from one technology to
the other. This has also been used to quantify savings from using alternative pasteurisation techniques such
as ultra-violet light.

Brewing Sector Guide 18
Kegging and casking. The third area that we have focused on is in kegging and casking. After our initial
site visits we identified that the way in which kegs are cleaned was different at each site and there was no
common approach. The monitoring programme aimed to understand what the different heat loads within the
keg cleaning process are and recorded exactly how much water, electricity and compressed air is used to
process each keg at different sites. By calculating these utilities benchmarks we assessed the potential
savings from alternative technologies in both the keg cleaning and flash pasteurisation for kegging.
Cask cleaning has been largely been ignored over recent years as the ale industry has been in decline
against lager. Resurgence in ale from the cask means that this area needed to be revisited and so we have
tried to understand how much energy is used in cleaning a cask and to define standards for current best
practice.
Technical difficulties acquiring data from kegging plants during the analysis period resulted in the data being
limited to electrical, heating and water demands for two of the sites monitored. The compressed air recorded
was not reliable and so has not been included in the analysis.
The implication of the decline in casking means that we were unable to find no real innovative technologies
in the market place.
Clean in Place (CIP) within breweries is a significant energy and water consumer. Camco carried out an
extensive analysis of CIP as part of the Dairy Sector IEEA project. It is believed that much of this information
and knowledge is transferable to the brewing sector, therefore metering of CIP was not carried out under the
scope of this project. Where data already exists we have sought to establish benchmarks of key parameters
for comparison.
1.6 Regulatory drivers
Climate Change Agreement
The UK brewery sector is covered by a Climate Change Agreement, under which its members receive an 80%
(65% from April 2011) discount on the Climate Change Levy, which is a surcharge on energy bills. The CCA
requires companies to reduce their carbon emissions according to an agreed series of milestone targets or risk
losing the discount. The scheme provides an incentive to improve energy efficiency: if the milestone reduction
target is not achieved, the CCL discount is lost on all eligible energy and fuels purchased. As a consequence, the
brewery sector has performed well, reducing energy consumption by 16% since the start of the scheme in 2001.6
The brewing sector has met its final targets, resulting in the discount being received up to March 2013. The
Government has recently announced that Climate Change Agreements will continue until 2023, albeit with a
reduction in the discount from 80% to 65% up to April 2013.
EU Emissions Trading Scheme
The EU ETS is an emissions reduction framework based on the cap-and-trade principle. First implemented in
2005 across the EU, it covers selected energy intensive industries such as cement and steel production, as well
as all combustion plant above a certain size threshold (20MW). If a site meets one of these criteria then it must
join the EU ETS, even if it is also covered by a CCA. Sites in the EU ETS are assigned an emissions “cap” and
they must buy emissions permits to hit the cap if they are not able to reduce their emissions internally. Large
brewery processing sites are covered by the EU ETS on the basis of their boiler plant, which typically will be
above the size threshold.
Phase 3 of the EU ETS runs from 2013 to 2020.
6 Source: BBPA

Brewing Sector Guide 19
F-Gas Regulations
HFC refrigerants are affected by EU Regulation 842/2006 which covers certain fluorinated greenhouse gases (F-
Gases) commonly used in refrigeration equipment. HFCs are potent greenhouse gases, with global warming
potential of around 2,000 times that of CO2. In the past, refrigeration and air-conditioning systems have leaked
potent HFCs into the environment. Some brewery sites use separate refrigeration plants with HFCs for areas
such as cold storage.
The F-Gas regulations require operators of air-conditioning and refrigeration plant to prevent refrigerant leakage
and carry out regular leak tests; recover HFC refrigerants during maintenance and plant decommissioning;
maintain accurate records and ensure that equipment is appropriately labelled and operated and maintained by
suitably trained personnel.
Ozone depleting substance regulations (R22 phase out)
The phase out of HCFCs for maintenance of existing refrigeration and air-conditioning systems began at the end
of 2009, as required by EU Regulation 2037/2000 on ozone-depleting substances. The regulation banned the
use of virgin HCFCs for maintenance from the end of 2009 and recycled fluid from the end of 2014. This is of
crucial importance for many companies and means that all users of R22 and other HCFC systems, if they have
not already, need to consider alternative refrigerants or the purchase of new equipment. Other clauses in the
regulation also affect the use of existing HCFC systems.
It is important that R22 users have plans in place for the phase out of HCFCs as it is not recommended to rely on
the 2014 recycled fluid phase-out date, as this date could be brought forward as part of the review process. The
amount of fluid being recycled has in fact turned out to be very small to date, so there is no guarantee that
sufficient supplies of recycled R22 will be available between 2011 and 2014.
An alternative in some refrigeration plant is to use drop in replacement gases, but in nearly all cases these have
a degrading effect on refrigeration plant energy efficiency.
IPPC
Integrated Pollution Prevention and Control (IPPC) has been in place since 2005 and is a regulatory system that
employs an integrated approach to control the environmental impacts of certain industrial activities. It involves
determining the appropriate controls for industry to protect the environment through a single permitting process.
This UK Guidance for delivering the PPC (IPPC) Regulations in this sector is based on the Best Available
Techniques (BAT) reference document BREF produced by the European Commission7. For the brewery industry
the relevant reference document is (BREF 08.2006) Food, Drink and Milk Industries. The key environmental
issues managed by the permitting system are:
Energy use
Water use
Effluent management
Waste handling
Accident risk
7 Further information on the European IPPC Bureau and the BREF document may be found at http://eippcb.jrc.es/reference/

Brewing Sector Guide 20
Hygiene
The system covers operators who are treating and processing vegetable raw materials which are intended for the
production of food products with a finished product production capacity greater than 300 tonnes per day. To gain
a permit, operators have to demonstrate that the techniques they are using, or are proposing to use, are on the
BAT list.
1.7 Other business drivers
Brewery processing is energy and water intensive and the introduction of carbon-related costs as well as rising
utility prices means there is ongoing pressure to reduce utility usage. This is compounded by the squeeze on
product sales prices applied by the major customers – supermarkets – who are in a position to dominate the
supply chain and who often require their suppliers to take the pain of product discounts and promotions in the
stores. Cost minimisation is a powerful driver.
Another driver is corporate responsibility where, in addition to meeting any regulatory requirements, a brewery
company wishes to demonstrate to investors, environmental organisations, the local community and the wider
public its commitment to being proactive on climate change: for example, by setting voluntary carbon reduction
targets; producing product carbon footprints; or investing in environmental initiatives which reduce energy use
and carbon emissions.
1.8 Industry progress on energy saving
Beer brewing and processing into consumable products is complex and energy intensive. The internal and
external pressures on the industry to reduce costs have led to the brewery sector being progressive in terms of
energy efficiency. This in turn means that good practice in energy management is already quite widespread
(although there is still potential for improvement, as described in Section 3), and that many of the cost-effective
technology opportunities for reducing energy consumption – such as improved controls, or more efficient motors
and drives - have already been implemented at some sites. The good practice survey (Section 3) shows that
there are still significant opportunities available, and perhaps the best way to address this is to raise awareness
of what is possible at a site level.

Brewing Sector Guide 21
2 Methodology for monitoring and analysis
2.1 What metering/data gathering was done and why
The monitoring design and associated data gathering carried out as part of this project concentrated on the first
three of the four focus areas described in Section 1.5. The objective of the monitoring exercise was to deploy
additional meters to supplement the information that could be collected from the existing sites‟ SCADA systems
to build up a more detailed understanding of the following process energy consumptions:
The kettle/wort copper
Small pack pasteurisation
Keg/cask processing
Virtually all breweries in the UK have these processes as part of their facilities, meaning the opportunities
identified in these areas will have the widest possible potential for replication across the UK brewing industry (for
further details, see the metering rationale in Appendix 1).
2.2 The kettle
For the kettle we wanted to understand how much energy is used to process the wort. For each type of beer, a
target % boil-off or evaporation is predetermined and then the wort is heated for a time period to produce this
reduction. We measured the energy going into the kettle and the level of wort in the kettle during the boiling
process to determine how efficiently this energy was used to achieve the required evaporation.
With data from three different wort heating systems (three different breweries), we were able to approximate the
potential savings to be made through using alternative technologies. That is, by understanding the relationships
between boil-off and energy consumption for different kettle types, we were able to quantify the benefits from
technologies that claim to reduce evaporation energy requirements.
2.3 Small pack pasteurisation
The heat energy used in small pack pasteurisation is used to raise the temperature of the beer up to a set level
so that pasteurisation can occur. We measured the heating energy, electrical energy for pumping and water
consumed over a period of time then divided it by the bottle count on a bi-daily basis to get a specific metric for
tunnel pasteurising systems.
We did not meter a canning line as there were more systems running bottle pasteurisers in the sites that we
visited than canning lines, so bottle pasteurisers were targeted.

Brewing Sector Guide 22
2.4 Keg/cask processing
To look at how energy savings could be made with kegs and casks we first needed to know how much energy is
used in keg and cask processing. For casks, the process varies from site to site and so we compiled a list of five
different sites showing how much heat, water and - where possible - electrical energy and compressed air is used
to process each cask. From this list we were able to identify the key differences and best practices available, to
determine the savings that could theoretically be made if all cask sites moved to that option.
This process was also carried out for kegs. Both of these figures were then used to work out the emissions
savings associated with alternative packaging technologies.
2.5 CIP
CIP was not specifically metered during the monitoring process since much CIP monitoring had been done under
the IEEA dairy sector project. However one ale production site did have comprehensive data available for heat
and water input to CIP. Lessons from the dairy sector IEEA project were applied to existing CIP data provided by
the brewing sector project partners. In the dairy sector IEEA project, the heat input for CIP detergent tanks in
several systems was measured over a two week period at two dairies. This heat input was then divided by
production over this period to give a specific heat consumption figure based on production. Although this figure
was obtained for a different industry, dairy processing plants and breweries share common CIP problems, both
sending fluids through multiple tanks and processes which have to be cleaned to a high level.
Although the cleaning requirements for milk and beer are different owing to the differing viscosities and chemical
properties the nature of CIP systems and their operational parameters are similar in both industries in that both
run caustic and acid cleaning solutions, at similar temperatures to lines and vessels. The notable difference for
the brewing industry is that a lot of hot water product pushes and line flushes are used between batches and
optimisation represents a significant area for water and subsequently heat savings.
This dairy analysis will be used in conjunction with available brewery energy data to gain an understanding on
CIP costs and produce some indicative figures for energy saving opportunities. Relevant technologies have been
analysed and potential energy savings and project costings have been carried out where the available data
permits.
2.6 Engagement with the sector
During the study there was continual engagement with the sector laying out the progress with the investigations
and the direction that we were intending to follow. This was initially done through agreement with the five
companies providing sites for metering, agreeing which site would be the most suitable, and then through regular
update emails, project steering group meetings and a final workshop, in which a wider industry group (including
technology companies, equipment suppliers and academics) participated in a discussion on the benefits and
barriers relating to the opportunities identified.
2.7 Participating host sites
Five companies volunteered five sites as hosts for the IEEA Stage 1 project investigation. Out of these sites there
are three large sites with lower SEC, one large site with higher SEC and one small site with higher SEC. This
group is therefore representative of archetypes that represent 93% of sector volume and carbon emissions.

Brewing Sector Guide 23
When choosing the most suitable sites to work with there were a number of considerations to take into account.
By working with larger sites the opportunities highlighted can be rolled out over the largest proportion of the
market (in terms of beer production volume and emissions). But working with smaller sites can often prove fruitful
as small organisations are often much more free to implement and trial new technologies than larger companies.
Selecting two sites with similar production volumes, but different SECs allowed us to compare directly the effects
that different innovative technologies may have on energy consumption at higher and lower energy intensity
sites.
From these five sites, three were selected for additional metering in order to give a clearer picture of the energy
consumption in the focus areas and the potential for savings through the adoption of new and innovative
technologies. The information already available from the site SCADA systems for the other two sites was deemed
adequate, allowing the data gathering budget to be used in the most efficient manner.
2.8 Data gathering
Data on process energy performance was gathered in the following ways:
Historical CCA data from UK breweries;
Meetings with site engineers over the course of the metering programme;
Data collected during the metering programme itself; and
An energy good practice check list that was sent out to industry members.
2.9 Metering approach
Having focused the metering strategy on the kettle, small pack pasteurisation, keg and cask processing, a
monitoring plan was devised to collect process performance data whilst minimising disruption to the day-to-day
running of the site. The approach involved looking at the individual processes that needed to be understood in
more detail, highlighting the data needed to build this picture.
The first step was to assess the range of information already being recorded on the sites‟ SCADA systems, to
identify data gaps and to specify the data collection hardware to be installed in order to build up a complete set of
data. The appropriate metering technology was then specified and installed by the Carbon Trust‟s IEEA meter
data services contractor and either connected to the sites‟ SCADA system or operated independently of site
systems, with the data from both sources combined for analysis after the end of the monitoring period.
Ease of metering
Collecting identical data sets from the target sites was not possible, as the data that could be extracted from the
SCADA systems, or the variables to be metered, varied from site to site, depending on the age and installation of
the systems. Older SCADA systems have limited memory and so the number of variables that were monitored in
such cases was limited, reducing the amount of data that could be combined with any additional metering for
analysis.
Typical metering devices installed at the three sites: Steam meters
Cold and hot water flow meters
Compressed air flow meters
Temperature sensors
Pressure sensors
Level sensors
Electricity meters

Brewing Sector Guide 24
Data Integrity
The metering devices were installed between December 2010 to February 2011 and data collection from new
metering came online in a phased manner from early February through to early March. The target minimum data
collection duration was a two-week period, since brewery operations normally run 24/7 with little variation and a
representative data set should be achieved over that period.
Through data collected from all of these sources process energy models were compiled that enabled the review
of energy consumption during the monitoring period and the identification of any irregularities during process
runs.
It should be noted, that at the time of writing, not all data had been analysed due to various operational delays
relating to meter installation, therefore the breadth and depth of the data set, whilst representative, is not as
comprehensive as originally planned. Where any assumptions have had to be made as a result of this we have
indicated them clearly.
2.10 Best practice checklist
During the project a survey of energy best practice in energy efficiency was sent to industry members. The aim of
this survey was to gain an understanding of how widespread the take-up of good practice was across the
industry, and also to raise awareness of energy related issues and the IEEA programme itself. The survey
comprised a checklist of around 150 questions, divided into the following sections:
Compressed air
Building and lighting
Cooling and refrigeration
Boilers and steam distribution
Vacuum
Waste water treatment
Process energy
Energy management practices
Whilst best practice is not directly in the scope of the IEEA project this exercise allows companies to benchmark
themselves against the industry and drive forward best practice, and allows us to highlight potential areas for
improvement later in this report.
The results of the IEEA investigations are shown in the following sections:
Section 3: summary results from the best practice survey
Section 4: key findings for the kettle process
Section 5: key findings for small pack pasteurisation
Section 6: key findings for keg and cask processing
Section 7: key findings for clean-in-place
Whilst Section 8 provides a summary of innovative energy saving opportunities relating to these process areas
and Section 9 some recommendations on next steps for the sector.

Brewing Sector Guide 25
3 Key findings: best practice survey
The pie chart below illustrates how, for the 10 companies that responded to the survey, a quarter of the
measures classed as „best practice‟ have not yet been carried out, but could still be implemented. There could be
good remaining potential for energy savings within the industry simply based on the implementation of further
low, or no-cost measures. Whilst this is not the focus of the IEEA programme, energy managers within the
industry should make sure that they have not overlooked any of these measures that may apply to their sites.
The full analysis of survey responses from the 10 different sites (all separate companies) is shown in Appendix 2,
which also provides the full list of best practice measures.
Figure 10 Summary of responses from the best practice survey
Some examples of the reasons that were chosen for „not possible‟ responses were:
Payback deemed too long
Not relevant to our specific processes / operation
Impact on production downtime
Lack of people skills
Lack of available capital budget

Brewing Sector Guide 26
Process change control restricted to group level
From the collated responses there were several opportunities that half or more of the respondents thought were
possible, and were either easy to implement or could lead to substantial savings. These opportunities included,
for example:
Installing a flue gas economiser to use the waste heat from the boiler flue gas for preheating the boiler feed
water saving between 4 – 6 % on annual fuel bills
Improving boiler burner efficiency through oxygen trim with flue gas analysis (2-3% fuel savings for out of
spec burners)
Install VSDs on air compressors
Whilst the survey provides a useful indication, the true value of such opportunities will only be assessable on a
site-by-site basis, through more detailed analysis of the relevant process area.

Brewing Sector Guide 27
4 Key findings and opportunities: the kettle - wort stabilisation
Stabilising wort through boiling in the kettle has been a largely unchanged process for the last few hundred years
in the brewing industry. Only recently has this process been challenged and the real underlying process
requirements identified which affect the flavour and quality of the wort.
In summary, the main aims of the boiling process are:
Isomerisation of hops (unless using pre-isomerised hops)
Sterilisation of the wort
Removal of volatile compounds
Boiling sterilises the wort to stop spoilage during fermentation, breaks down the hops, and the gas bubbles
formed during boiling help strip the wort of unwanted volatile compounds. This process is very energy intensive
due to the large amount of heat going into the system to evaporate the wort to the prescribed level (boil-off).
4.1 Key differences between the sites investigated
Percentage boil-off
The breweries that we visited for this project had boil-offs of around 3.5% to 7.5%. In one of the breweries visited
there was one beer with a boil-off of 10% - 12%, but since this was a unique brewing process not representative
of the UK brewing industry, it has not been included for analysis in this project.
Gravity
The gravity at which the beer was brewed varied from no final dilution to up to 49% final gravity dilution. Brewing
at higher gravity, and blending after the kettle or fermentation stage, reduces the amount of wort that needs to be
boiled and hence energy consumption. When beer is brewed with a 49% end dilution only 51% of the final
packaged beer needs to pass through the kettle, roughly halving the required energy necessary.
Vapour heat recovery
Vapour heat recovery for the kettle was found on one of the host sites. The technology involves passing the
vapour from the kettle boil-off and condensing it through a vapour condenser where the heat is extracted to a hot
water tank storage tank. This hot water is then used for a pre-heater to increase the temperature of wort entering
the kettle. This technology typically works well with high percentage boil-off sites, since there is more vapour
produced and hence more energy to capture. Therefore the lower the boil-off the lower the financial return on
investment for such a system and it is not typically viable for boil-offs below 4%.

Brewing Sector Guide 28
For the IEEA site where there was vapour heat recovery, the size of the system was actually quite small and was
primarily designed to remove odour from the vapour that drifted to the local town rather than to recover a
significant amount of energy.
Internal / external calandria
Wort heating is carried out through passing the wort through a heat exchanger known as a calandria. The
calandria can either be placed externally, outside the kettle, or placed in the centre of the kettle. The advantage
of an external type is that it can be easily inspected for maintenance but there is an efficiency advantage for the
internal variety as all of the heat exchanger is emerged in the wort, reducing heat losses as well as reducing
pumping needs.
Heat source – steam or high pressure hot water
The calandrias (kettle heat exchangers) at the IEEA sites monitored were supplied with steam or high pressure
hot water (HPHW, 140ºC). Steam systems are more common and typically easier to maintain than HPHW
systems, but there are no flash steam losses from trapping and condensate recovery in a HPHW system, which
theoretically makes them more energy efficient. Flash losses are explained in the pasteurisation section of this
report (Section 5).
4.2 Data analysis
The diagram below shows a simplified wort kettle and shows the four variables that were recorded to support the
analysis of the specific energy used on each brew:
Wort input temperature
Temperature of wort in the kettle
Fill level
Heat input
Figure 11 Simplified kettle diagram
Heat in, temp
Fill level
Temp of
wort
The variables have been plotted for a single boil in Figure 12 below to demonstrate a boil profile. This particular
kettle uses a dynamic boiling system where the wort is heated under pressure and then the kettle depressurised
causing vigorous boiling and flashing. At first, a consistent heat input can be seen which raises the wort
temperature to boiling point. When the temperature gets to around 100ºC a number of sequential heat inputs can
be seen through the evaporation phase, where the level of the wort starts to reduce until 3.5% of the wort has
been evaporated. A traditional kettle shows a similar profile, but with a more consistent heat input.

Brewing Sector Guide 29
The total energy input over the duration of the boil has been used to work out the specific energy per hectolitre of
beer processed.
Figure 12 Kettle level, temperature of the wort in the kettle and heat input for a brew at Site 1
0
100
200
300
400
500
600
700
0
1000
2000
3000
4000
5000
6000
7000
8000
1 7
13 19 25
31
37
43
49
55
61
67
73
79 85 91 97
103
109
115
121
12
7
13
3
13
9
14
5
15
1
15
7
16
3
16
9
17
5
181
187
193
199
205
211
217
22
3
22
9
23
5
Ke
ttle
te
mp
era
ture
(blu
e in
Deg
C)
and
Ke
ttle
leve
l (re
d in
hl)
He
at in
pu
t (g
ree
n in
KW
)
Time (minutes)
Kettle level, kettle temperature and heat input over one brew for a standard product at one brewery
Heat input into kettle (kW) Temperature of wort in kettle (C) Level of kettle (hl)
4.2.1. Kettle energy balance
Based on a mixture of monitored and calculated data, we have derived a loss bridge for the kettle heat input. The
following diagrams shows loss bridges (energy balances) for the boiling process at two of the monitored
breweries. Delays in metering installation resulted in monitored data for the third site not being available in time
for this report.
Figure 13 below shows that is a 4% unaccounted for loss in the kettle, with the remaining energy being roughly
split 50:50 between heating up the wort to boiling point, and evaporating the necessary amount to achieve the
required boil-off level. Figure 14 shows a 3.5% under-measurement which is most likely due to the steam meters
not reading true.
Overall however there is a good correlation between the calculated and empirical data, suggesting that it is
credible for us to estimate the specific energy for other sites based on calculation from their boil-off percentage
and other kettle parameters.

Brewing Sector Guide 30
Figure 13 Loss Bridge for the kettle process in Site 1
Figure 144 Loss Bridge for the kettle process in Site 3

Brewing Sector Guide 31
The other important fact when looking at the energy used per specific volume of packed beer is the high gravity
(HG) dilution rate. This is the percentage of fresh water that is added after the wort has been boiled in the kettle.
This can be before fermentation or prior to filling.
All of the beer brewed in the IEEA host sites visited boiled-off some fraction of their wort in the kettle; however,
the energy per hl needed to raise the wort temperature to boiling point will be similar across these sites. The
differentiating variables are the amount of wort that is boiled-off and the end dilution rate. A beer with 50% HG
dilution rate will only need half the heat energy per packed volume to a beer with a 0% HG dilution rate. Figure 15
shows the boil-off and HG dilution of the main products at three of the IEEA host sites monitored. Both of these
parameters have an effect on the overall specific energy consumption for packaged beer, as shown in Figure 16.
Figure 15 Specific heat breakdown of the kettle at three breweries
0.0%
1.0%
2.0%
3.0%
4.0%
5.0%
6.0%
7.0%
8.0%
0%
10%
20%
30%
40%
50%
60%
Site 1 Site 2 Site 3
HG dilution rate (%)
Recorded boil off (%)
Figure 16 shows that the higher the brewed gravity (the HG dilution rate) and the lower the boil-off, the lower the
specific energy per unit of packed product. The losses associated with the kettle have been shown to have up to
a minimal effect on the specific energy consumption (4% maximum, shown in Figure 13) and so the important
factors remain boil-off and HG dilution. How both of these factors affect the specific energy is discussed in
Section 0 below.
HG
dil
uti
on
rate
Boil-o
ff rate

Brewing Sector Guide 32
Figure 16 Specific heat from boiling in packaged beer
0.00
1.00
2.00
3.00
4.00
5.00
6.00
7.00
Site 1 Site 2 Site 3
Spec
ific
heat
in t
he k
ettl
e fo
r pa
ckag
ed b
eer
(kw
h/hl
)
4.2.2 Specific heat energy per boil
To calculate the energy needed for a boil we take the input temperature into the kettle and calculate the energy
needed to bring the wort to boil. For the theoretical boil-off for that product we can calculate the energy needed to
evaporate the liquid from the wort. These two figures were then compared to the energy actually used in the plant
as steam or high temperature hot water.
The results shown in Figure 17 show that the amount of energy used for boiling the wort of the main product at a
modern brewery is approximately 5.3 kWh/hl (average for the main product at one site over a month). The
variance demonstrated for one product is explained below in Section 4.2.3.
Figure 17: Specific energy recorded for wort heating of one product at one site over a month
The range for other products over the same period was from 4kWh/hl to 8kWh/h with the majority of the brews
having specific energy consumptions between 5 and 6kWh/hl. The high gravity dilution rate at which the beer
shown in Figure 17 was brewed was 49%, so the overall specific energy for the wort stabilisation process,
5.3
kWh/hl

Brewing Sector Guide 33
allowing for dilution, is around 2.6kWh/hl of packaged product. This is for a brewery that has an average boil-off
in the kettle of 3.6%.
The more energy intensive breweries that we visited for this project had boil-offs of around 7% with a high gravity
dilution rate of 10% and so the specific energy per hectolitre of packaged product relating to wort
stabilisation/dilution would be higher at 7.8kWh/hl.
This demonstrates the energy saving potential of high gravity brewing, where this is allowed by site conditions
and the product requirements.
4.2.3 Energy variance between boils
The key variables we expect to lead to energy input variances between boils are laid out below. For each case
we have compared two of the breweries where in-depth data was available to show our rationale for quantifying
the difference in how the kettles are controlled:
Wort input temperature – was measured to be consistent at the two breweries analysed. Both consistently
show a variation in kettle entry temperature of only 2ºC (between 75ºC and 77ºC). This was consistent
across a broad range of products.
Figure 18: Wort entry temperature per brew for multiple products at one brewery
The volume of the batch – the two monitored sites showed variable kettle volumes, usually due to the kettle
being topped up with fresh process water to correct any wort strength inconsistencies.
Figure 19: Maximum fill level for the kettle per brew
for one product over a month for two sites
0
100
200
300
400
500
600
700
800
0 10 20 30 40 50 60 70 80
Ke
ttle
leve
(hl)
Number of brews in a month of one product
0
100
200
300
400
500
600
700
800
0 20 40 60 80 100 120
Ke
ttle
leve
l (h
l)
Number of brews in a month of one product
Brewery A Brewery B

Brewing Sector Guide 34
Heat losses from the system – should remain consistent for the same kettle, boiling the same product over
a month.
The effectiveness of the heat exchange – varying degrees of heat exchanger cleanliness will have an
impact on energy transferred into the wort
Specific energy input to the wort – the variance of which is shown in Figure 20 and Figure 21 below
Taking into account the above factors we plotted specific energy data for a single product type at both breweries
over a month-long period to see if there was a significant variance in heat input for the entire wort heating and
evaporation process. The first site used a dynamic pressure boiling system, internal calandria and a time-based
boil. The second site used a calorific-controlled boil (that is, only the amount of heat input necessary to achieve
the required boil-off level was input to the kettle).
As can be seen from Figure 20 there is a significant variation in specific energy for evaporation input per brew of +/-50% from the average specific heat energy. As evaporation accounts for approximately half of the energy going into the kettle (the other half is for pre- heating), this gives a total energy variance of up to +/-25% per brew.
Figure 20 Specific energy recorded for wort heating of one product at one site over a month for a site with timed boils
Because the rate of heat input and boil time are constant the specific energy of the boil varies according to other
inconsistencies such as brew volume. For example, if the boil was based around the actual volume of beer
starting in the kettle the energy delivered would be on a quantified basis.
The second brewery monitored controlled its kettle based on calorific input (heat energy input level as a function
of product volume and desired boil-off), rather than timed controls (boiling the wort for a fixed time and then
testing for volatile removal level). The variance in specific energy for one product using a calorific controlled boil
over a month is shown in Figure 21 below. The amount of energy input per hectolitre of product is visibly much
more consistent.
Note that the different average specific energy shown in Figures 20 and 21 are not material here, since kettle
configuration and boil-of level vary between the two sites. The relevant finding is that a calorific (or specific heat
input) controlled boil gives a more consistent specific energy compared to time control, and offers a potential
energy saving through the avoidance of over provision of heat.

Brewing Sector Guide 35
Figure 21: Specific energy recorded for wort heating of one product at one site over a month for a site with heat
input controlled boils
3.1
3.12
3.14
3.16
3.18
3.2
0 20 40 60 80
kWh
/hl
Number of brews in a month of one product
Another possible cause of the inconsistency seen in Figure 20 could be burn-on, which reduces the efficiency of
the calandria (fouling). However the kettles monitored were both cleaned weekly and if there had been burn-on
then within each week a consistent pattern of increasing energy consumption would have been seen, which it
was not. As we did not have alternative data to identify the burn-on status of the kettle we cannot make any
further judgements on this possible variable, but it seems unlikely from the data collected.
For the site that has a varying heat input (Figure 20), the boils with the least specific energy are currently deemed
acceptable, inferring that the boils with higher specific energy are using more energy than is necessary. It is
therefore reasonable to assume that moving to a system that operates on calorific controlled boils will reduce the
variance in heat input, and result in an overall reduction in energy consumption though the avoidance of over
provision of heat.
If a kettle with a timed boil-off could be re-programmed to provide heat on a calorific controlled approach, then
the amount of energy needed for evaporation could potentially be reduced by as much as 25% from the average
for a site where the boil off is around 3.5%. For sites with a higher boil (say 7% boil off) the fraction of total kettle
energy needed for evaporation will be higher at 64% as more energy is needed to drive off more wort compared
to the pre-heat energy, so the potential saving by moving from a time-based to calorific controlled boil-off will be
greater.
4.3 Best practice process optimisation opportunities
4.3.1 Areas of opportunity
There are several methods in which the energy necessary to carry out these processes can be reduced. All of
the following opportunities have been carried out in one form or another by international brewers and have been
proven to work without detrimental effects to the quality of the beer. We recommend that if any of these

Brewing Sector Guide 36
opportunities have not yet been implemented then they should be investigated; their savings potential has been
estimated in Section 4.3.2 below.
Calorific kettle heating: As described above, controlling the heat input to the kettle based on specific energy
per hectolitre of wort in the kettle allows for more accurate control of kettle energy input and process
consistency. For the specific example identified during the monitoring exercise, if the kettle with the timed
boil-off had been re-programmed to provide heat on a volume based or specific calorific approach, then the
amount of energy used for evaporation could potentially be reduced by as much as 30% from the average. As
the loss bridges in Figure 13 and Error! Reference source not found. show, as about half of the energy
used in the kettle is used for boiling, the equivalent energy reduction for a site could be between; equivalent
to around 10% of total site energy usage (this saving will ultimately depend on the level of boil-off in the kettle
which depends on product type and whether high gravity brewing is used).
Reducing boil-off and using a sparge ring: The processes needed to stabilise the wort are heating and
volatile stripping. The heat can be provided by heating the wort to 99.9ºC as boiling does not increase the
temperature for sterilisation or hop isomerisation. The stripping of volatiles can then be performed through
sparging air or another stripping gas through the wort instead of relying on the steam bubbles generated
through a boil. This can be done in conjunction with boiling, gradually reducing the boil and increasing gas
sparging while controlling the product characteristics in line with the recipe requirements. This concept differs
from the opportunities discussed in Section 4.3.2 regarding reduced boil-off, as it uses air as the stripping gas
rather than steam.
Low pressure boiling: The have been a number of systems introduced to the market which use a vacuum
pump to lower the static pressure on the kettle and reduce the boiling temperature to extract volatiles from the
wort while reducing the total energy needed for the process. Evaporation rates as low as 2.6% have been
cited using this technology. This will give similar savings to the direct steam injection savings quantified below
(2.5% equivalent boil-off).
Vapour heat recovery: The technology involves passing the vapour from the kettle boil-off and condensing it
through a vapour condenser where the heat is extracted to a hot water tank storage tanks. This hot water is
then used for a pre-heater to increase the temperature of wort entering the kettle. This technology typically
works well with high percentage boil-off sites since there is more vapour and so more energy to capture.
Therefore the lower the boil-off, the lower the financial return on investment for such a system and it is not
typically viable for boil-offs below 4%.
Isomerised hops: The use of pre-isomerised hops allows the boil-off of the wort to be reduced as the
process of breaking down the hops has already been completed prior to insertion into the kettle. As one of the
key reasons for boiling the wort is to isomerise the hops this allows the amount of energy needed for the boil
to be reduced. There will still be some energy needed (outside the brewery) to pre-isomerise the hops, but
this will be only to heat a small volume of liquid to boiling point, with no evaporation needed, so there will be a
net reduction in energy use.
Reduction in steam pressure: Through reducing the steam pressure that is delivered to the calandria the
burn-on of wort onto the heat exchanger (calandria) will be reduced and the efficiency of the heat exchangers
increased. This will also result in a reduction in CIP as the amount of burnt-on material adhered to the heat
exchanger will be less, saving further energy and water. The flash steam losses in the condensate system will
also be reduced (explained in detail in the pasteuriser section of Section Error! Reference source not
found.). The penalty to pay for reducing steam pressure is an effective de-rating of heat exchanger capacity.
Adding adjunct after the kettle: If adjunct is needed then it should be added on the hot side of the wort
cooler. This will save on the energy needed to boil-off the fraction on the adjunct added since the adjunct
material will not need heating. The reduction in kettle energy consumption is in proportion to the reduction of
liquid volume in the kettle.

Brewing Sector Guide 37
4.3.2 Impact on the UK brewing sector
Due to the variations in brewing techniques across companies, sites and product types it is difficult to estimate
with any accuracy the overall impact potential of the above measures across the UK brewing sector. The
following opportunities have been quantified using data from the monitored sites to act as a baseline for the
current industry position.
From the monitoring and analysis carried out on the data collected on kettle energy use we have shown that the
energy used can be accurately modelled to within 7 % in terms of specific energy consumption (see loss bridges
in Figure 13 and Error! Reference source not found.). The figures below demonstrate the effect of changing
the key wort stabilisation variables and give an indication of the potential savings available for these changes.
Reduction in boil-off: For every 1% that boil-off can be reduced in the kettle, the specific energy needed to
boil the wort can be reduced by 0.63 kWh/hl, which results from less energy being used for the latent heat of
evaporation, through evaporating 1% less of the total beer volume. For a gas-fired 2Mhl per year brewery this
works out as approximately 1.85p/hl reduction in the heat costs or a total site energy cost reduction of
£37,000 per annum. If we assume that ale brewers use an average boil-off of 7.5% and that the bigger lager
and mixed brewers have an average boil off of 5%, bringing the entire sector down to a common baseline
boil-off of 3.5% would yield a sector carbon emissions reduction of around 2.5%. Through this reduction in
heating fuel, the equivalent average carbon emissions reduction per site would be 337tCO2 per year, for a
notional 2Mhl site.
Increase in high gravity brewing: For a kettle where the input temperature is 75ºC and there is a 3.5% boil-
off (similar to one of the breweries monitored as part of this project), we have looked into what difference a
change in the final gravity dilution of the beer will have on specific kettle energy consumption. Through
increasing the final gravity dilution less wort has to be processed (heated and evaporated) in the kettle for the
same amount of beer packaged.
Across the sector, it appears that lager brewers already have reasonably high HG dilution rates of 35% to 50%.
The ale brewers we spoke to appear to have lower rates, on the order of 10%, and the biggest opportunity for
change exists here. However, if the large breweries were able to make a further incremental increase in HG rate
then a significant impact could be made across the sector.
For every 10% increase in the final gravity dilution of the beer at an ale brewery the specific kettle energy can be
reduced by 0.73 kWh/hl. If we extrapolate an increase from 10% HG dilution to 50% HG dilution this equates to a
sector carbon saving of approximately 1.4% (just for the smaller, mostly ale-producing sites).
For a 2Mhl brewery this equates to a £31,000 annual energy cost saving and an annual carbon reduction of 275
tCO2. If the brewery had a higher boil-off of around 7% (similar to the higher boil-off brewery that we monitored),
this saving would be 0.73 kWh/hl, with a total annual site energy cost saving of £44,000 and annual carbon
reductions of 390 tCO2.
If the same were carried out for the larger breweries, by moving from an average HG dilution of 42% at the larger
sites monitored to 50% HG dilution, the savings would be 5,800 tCO2 across the UK, equivalent to a further 1.3%
sector carbon saving. That is, the total sector potential from increased levels of high gravity brewing could lead to
a total sector carbon saving of around 2.7%.
4.4 Innovative wort stabilisation opportunities
4.4.1 Opportunity areas
We have investigated a number of innovative opportunity areas with the potential to reduce kettle energy
significantly:
Using a stripping column
Using a steam injection atomiser

Brewing Sector Guide 38
Continuous brewing
Sequential mashing
These are described below; further details on the first two opportunities are described in Appendix 3, together
with their outline business cases. Insufficient data was available to quantify the savings and hence provide
business cases for continuous brewing and sequential mashing.
Wort stripping column: The concept involves applying alternative wort boiling technology that offers major
energy savings while producing very high quality wort, and so improving final beer quality. The technology
also assures an efficient and flexible elimination of unwanted volatile compounds in the wort (such as DMS –
dimethyl sulphides).
The device is placed "in line" between the wort cooler and the settling tank and sends the wort through a
packed bed, with steam sent up through the bed in the opposite direction. This packed bed increases the
surface area of the wort, while subjecting the liquid to high temperature steam, ensuring that volatiles can be
removed effectively.
With a maximum evaporation rate of 2% claimed by manufactures the amount of energy used in the wort
boiling process is dramatically reduced, especially for the breweries that currently operate at higher boil-off.
Note that energy is still needed to pre-heat the wort.
Figure 22 Illustration of where a stripping column would sit in the wort processing line
Wort steam injection: The technology is a specifically designed steam injection system that produces very
effective mixing through promoting a supersonic shock wave in the mixing zone. The wort is atomised and the
mixture of high surface area and the high temperature of the steam allow for elevated removal of volatiles and
unwanted flavours from the beer. Through removing these compounds faster the total amount of energy
needed in the boil is reduced. This technology can be retrofitted to existing wort coppers and takes the place
of heat exchanger based calandrias.
Up to 50% energy reduction in comparison to using calandria based technology is cited by manufacturer with
no burn-on of material as there is no heat exchange surface. This technology also requires energy to pre-heat
the wort, so the savings relate to the reduction in evaporation energy.
Other innovative opportunities
Below are more innovative opportunities to do with the wort stabilisation process where, due to their early
developmental stage, it has not been possible to develop outline business cases.

Brewing Sector Guide 39
Continuous brewing: Continuous brewing involves sending the wort through from the grist stage through to
the filling process in one continuous process. At present beer production is a batch process, where each
batch is limited to the size of the vessel in which it is being processed.
Sequential mashing: Sequential mashing involves sending the mash down through multiple vessels while
transferring the wort from vessel to vessel in the opposite direction. This process involves increasing the
extract potential of the wort, using less water, therefore using less energy to heat the mash to the temperature
required for enzyme reactions to take place.
4.4.2 Potential impact on energy consumption
The effect of on the energy needed to carry out the wort stabilisation process on both of the brewery types
investigated is shown in the graph of Figure 23 below. We compare the existing baselines to the technologies
and improvements that have the potential to deliver the largest reductions, for both a low and high boil-off
brewery archetype using supplier data. Many of the optimisation opportunities would improve site energy
performance to somewhere in between these two extremes. These figures take both boil-off and final gravity
dilution into account to calculate the specific heat requirements for final packaged beer.
Direct steam injection into the wort has been carried out in the UK but all of the previous examples of wort
stripping columns to reduce evaporation have been carried out outside the UK in Russia, Belgium, China and
Peru to name a few locations.
Figure 23 Wort kettle: innovative opportunities
0
1
2
3
4
5
6
7
Low boil off brewery High boil off brewery
Spe
cifi
c e
ne
rgy
(kW
h/h
l)
Existing specific energy
Using wort steam injection
Using a wort stripping column
Figure 23 shows the effect the first two innovative opportunities have on the energy used at a brewery. Clearly
the opportunity for saving is greater at sites with higher boil-off rates. Implementing these opportunities could
result in a sector-wide CO2 saving of between 4.2% for the wort steam reactor, and 4.8% for the wort stripping
column assuming a 50:50 split of more modern breweries with low boil-off rates, and older, less energy-efficient
breweries.
The payback period for these opportunities depends on the boil-off rate at the brewery. Those that operate their
kettles with a boil-off of less than 4%, as well as brewing at high gravity, will find it difficult justify the adoption of
these technologies. However the payback at the other end of the spectrum is more favourable, with breweries
operating an 8% boil-off with final gravity brewing (0% final high gravity dilution) yielding a payback of less than

Brewing Sector Guide 40
three and a half years. These paybacks should improve as the technologies become more mainstream and unit
costs reduce.
4.5 Summary of findings
Table 3 below summarises the savings. The first two opportunities should be regarded as best practice process
optimisation opportunities and the second two more innovative options.
Table 3 Kettle opportunities
Area Description Sector
Applicability (%)
Sector Carbon Saving
(tCO2 pa)
Sector Carbon Saving
(%)
Average Site Cost Saving
(£)
CAPEX (£)
Average Payback (years)
Kettle Reduce boil-off 100% 11,200 2.52% £56,000 Unknown Unknown
Kettle Increase high gravity dilution
100% 11,900 2.66% £60,000 Unknown Unknown
Kettle Wort stripping
column 100% 21,500 4.8% £152,000 £360,000 2.4
Kettle Wort steam
injection 100% 18,700 4.2% £130,000 £420,000 3.2
4.6 Barriers to implementation
Changing traditional brewing methods: Tradition has been a very strong influence in how beer is made
with many sites taking pride in producing beer in a similar manor for many years. Opportunities that involve
changing this tried and tested method raise concerns that the reputation for consistency may be damaged,
leading to loss of confidence in the brand.
Scalability of small-scale test results: Brewers may agree that beer made with new technology on a pilot
scale tastes just as good, or even better at times but confidence is lacking that this can then be produced on
an industrial scale with sufficiently mitigated risks, as there may be no reasonable way to go back.
Available capital: Lack of available capital resources has been cited as a reason why breweries do not take
up utility saving technologies. For example, modernising a brewhouse or replacing packaging equipment
could be a multimillion pound investment which may not be justifiable on utility savings alone.

Brewing Sector Guide 41
5 Key findings and opportunities: small pack pasteurisation
5.1 Process description
Pasteurisation involves reducing the number of dangerous and potentially spoiling microbes within beer to a level
that will extend the shelf life and make the product safe for consumption within the best before dates. In most
cases in the UK this is done thermally through heating the beer to around 70ºC and then bringing the
temperature down again to near or below ambient to stop thermal flavour spoilage. To measure the process,
pasteurisation units (PUs) are calculated by multiplying the product temperature by the time spent at that
temperature. The greater the PUs inputted the greater the deactivation / kill rate.
Currently the two primary technologies employed for this in the UK are in-pack pasteurisation, where the entire
filled and sealed beer can or bottle is brought up to pasteurisation temperature, and flash pasteurisation, where
the beer is heated and cooled in a continuous process using a heat exchanger before being filled into a clean
bottle in controlled conditions to avoid contamination.
The main energy involved is needed to heat the beer (and in the case of tunnel pasteurisation the container as
well), cool the beer, as well as pumping the product and heat transfer fluids.
5.1.1 Tunnel Pasteurisation
Bottles and cans enter the tunnel pasteuriser en masse on
a wide in-feed conveyor and are typically propelled through
the tunnel on either a walking bed or conveyor belt. The
pasteuriser is divided up into a number of heating, holding
and cooling zones to gently change the temperature of the
container and its contents, avoiding thermal shock and
ensuring, as far as possible, equal heating throughout.
Figure 25 shows a tunnel pasteuriser heating profile; the
water spray temperature in each of the zones and the
respective product temperature at each point.
Pasteurisation Units (PUs) – a measure of pasteurisation
level - are also monitored.
Figure 24 Tunnel pasteuriser illustration (www.krones.com)

Brewing Sector Guide 42
Typically a tunnel pasteuriser would fall into the
category of „low temperature long time‟ (LTLT)
pasteurisation.
If all the heating and cooling had to be done with
external energy input, then the process would
require a large amount of energy, so typically a
tunnel pasteuriser has pumps that exchange the
water between heating and cooling zones in
order to increase heat regeneration (ie, the hot
containers leaving are heating the cold
containers entering).
Figure 26 shows an example of a single bed, eight zone pasteuriser. It can be seen that the pre-heat and pre-
cool zones use pumps to exchange heat and therefore improve process thermal efficiency. However it is also
clear to see that there is still a large amount of heating and cooling done with raw heat input. In the case of
cooling, temperatures are often maintained in each zone by inputting cold fresh water to displace the hot water.
In this case water-to-drain losses can be very high.
Figure 26 Example tunnel pasteuriser heating and cooling zones (barry-wehmiller-company.com)
The number of zones, the number of regenerative zones, the management and control of the system and the
operational demands and profiles all have a profound effect on the energy efficiency of a tunnel pasteuriser.
5.1.2 Flash
Pasteurisation
5.1.2 Flash Pasteurisation
A flash pasteuriser typically uses a three-stage regenerative plate heat exchanger (PHE) arrangement to heat the
beer to pasteurisation temperature, where it is pumped at a certain flow rate through a holding tube before being
cooled back down to filling temperature.
Figure 27 shows the key elements of the pasteuriser; the PHE and the holding tube which is the pipe running
back and forth above it.
Figure 26 shows an example of the heating and cooling profile of a flash pasteuriser. The bright beer arrives at
the pasteuriser where it is heated in the regenerative zone of the PHE by the outgoing hot beer. The heat source
for heating up to pasteurisation temperature is typically from the site‟s steam or high pressure hot water system.
The beer then passes through the holding tube where it is held at the pasteurisation temperature before being
regeneratively cooled and then trim-chilled to the desired filling temperature.
The defined beer input and output temperatures, as well as the heat transfer rate of PHE, each affect how much
energy is theoretically required for the process.
Figure 25 Example tunnel pasteuriser heating profile (www.krones.com)

Brewing Sector Guide 43
Modern PHEs enable a regeneration of up to around
94% in the optimum circumstances and minimise the
required heat input, but if the desired beer output
temperature is more than a few degrees above the
input temperature then the requirement for cooling is
negated but the heat input goes up accordingly as the
capacity for effective regeneration is reduced.
5.2 Data analysis and modelling
Both tunnel and flash pasteurisation were modelled
and metered to understand the associated energy
consumption between the two technologies.
From the five host sites involved in the project only
one used flash pasteurisation and only on two of five
lines (8% of production). Through industry discussions
we deduce that this broadly represents the sector,
with very few sites carrying out flash pasteurisation for
small pack. For the purpose of quantifying
opportunities we have therefore assumed that 10% of
small pack beer packed in the UK is flash pasteurised
with the remaining 90% tunnel pasteurised. This split
has been used for all of opportunities involving
pasteurisation when trying to quantify the CO2
savings for the sector.
Figure 278 Flash pasteurisation heating profile
Figure 26: Example flash pasteuriser (www.khs.com)

Brewing Sector Guide 44
5.2.1 Tunnel Pasteurisation
Tunnel pasteurisation was modelled from the average of data collected at three of the IEEA host sites. The heat
consumption for pasteurisation was modelled by taking the steam consumption over a period, whilst the electrical
consumption was based the variously sized motors used by the processes including recirculation pumps and
conveyor motors.
The graph below shows the average specific heat energy consumption of the three different tunnel pasteurisers
at the three IEEA host sites.
Figure 29 Average specific energy consumption of three tunnel pasteurisers
Note that it was discovered as part of the data collection exercise for Site 3 that two cold water valves had been
passing cold water into the central hot section of the pasteuriser, meaning that additional steam was continuously
inserted into the pasteuriser to keep the temperature at the required level. This at least partly explains the high
specific heat consumption at Site 3 in comparison to the other two sites. Pasteuriser imbalance is a common
occurrence and so even though this machine (at Site 3) was running with such a high heat consumption it will be
included into the average for quantifying opportunities.
There is a large range in the heat performance for each of the pasteurisers and so an average of the three will be
used for quantification of opportunities moving away from tunnel pasteurisation to alternative technologies. This
gives an average specific heat consumption of 11.2 kWh/hl.
When the electrical loads from the recirculation motors and conveyor pumps are added to this the total specific
energy is 11.8kWh/hl of beer pasteurised. Figure 30 below shows a minute-by-minute profile for heat and water
input to one specific tunnel pasteuriser.

Brewing Sector Guide 45
Figure 30 Heat and water input for a tunnel pasteuriser at Site 1
Through looking at detail at the profile for Site 1 we are able to draw some useful conclusions. Line
stoppages/unbalances cause regular inputs of fresh cooling water (every 10 minutes or so). This cold water influx
was then balanced out with a large amount of steam added a few minutes later. This shows that the system is
constantly hunting for the right temperature, and overshooting both of the cooling and heating inputs, leading to
excess energy use.
The specific heat energy consumed by the pasteuriser at Site 2 was recorded as 10.1 kWh/hl which was 20%
higher than Site 1. Figure 31 below shows the production status for the tunnel pasteuriser at Site 2 showing
operational (green), rebalancing (yellow) and stops (red) for one day. One reason why this site‟s pasteuriser had
a higher specific energy could have been the large number of stop-starts.
Figure 31 Production for Site 2 pasteuriser over a day
This could be caused through either the control system of the pasteuriser not being set up correctly, or through
periodic line stoppages (for example, lack of product entering or downstream build-backs), which would account
for both the cold and hot sides becoming unbalanced.
Better operational scheduling and line efficiency – the impact
When a tunnel pasteuriser is running between products or unloading / loading with product due to line stoppage
the machine will be out of balance as the heat cannot be recycled. This results in extra cooling being necessary
for the cold sections at the end of the pasteuriser and extra heat being needed for the hot section at the
beginning.

Brewing Sector Guide 46
5.2.2 Flash pasteurisation
Because of unreliable metered data, flash pasteurisation was modelled theoretically in three combinations to
demonstrate the effect of differing on- and off-temperatures for the heat exchanger.
The first is based on flash pasteurisation for a filler that can only take beer at low temperatures, meaning that
the on- and off-temperature of the pasteuriser will be the same. The beer passes through a 90% regeneration
heat exchanger meaning that 10% of the temperature rise from 0ºC to 70ºC will be provided by heat, and
10% of the decrease in temperature will be covered by refrigeration.
The second option shows what would be possible if the beer could come off 7ºC higher than the on-
temperature, and therefore have no need for the cooling circuit.
If the filling temperature was higher (nearer 14ºC) the heating energy would increase as the regeneration
section of the pasteuriser would have to reduce.
These three options and the monitored average for tunnel pasteurisation are presented in Figure 32 below.
5.2.3 Comparing tunnel and flash pasteurisation
Figure 32 shows the comparison of the average tunnel pasteurisation figure compared to the modelled flash
pasteurisation scenarios.
The flash pasteurisation metered data collected during the monitoring period was unreliable and irremediable
within the project time so a theoretical model was used instead. Through detailed monitoring carried out with
flash pasteurisation in the dairy industry one of the key findings was that a proportion of potential operational time
was used for start-up, shut down and circulation when no product is being processed. Where we have calculated
theoretical energy consumptions for flash pasteurisation, we have corrected by a similar factor to ensure that the
energy estimates are not overly optimistic.
Figure 32 Energy breakdown for flash and tunnel pasteurisation
The specific energy consumption figures shown in Figure 32 are used as the baselines to quantify opportunities
in this report. Based on the analysis, the conversion from tunnel to flash pasteurisation should provide an energy
saving of 75% - 85% per unit of beer pasteurised.

Brewing Sector Guide 47
5.3 Process optimisation opportunities
5.3.1 Tunnel pasteurisation optimisation
The energy used in tunnel pasteurisers is mostly heat as large amounts of water are circulated around and often
diluted with colder water when the machine is out of balance. At this point fresh heat needs to be added to the
system. There are a number of simple opportunities to optimise operation as well as a great retrofit potential.
Optimisation opportunities
Optimisation using water and energy metering: Installing a water and steam / heat meter on a tunnel
pasteuriser and recording high frequency readings through a SCADA system or similar enables the
consumption profiles of the system to be identified and investigated. This metering allows the identification of
periods when the pasteuriser is out of balance, when faults arise that cause step changes in the energy and
water performance and to track steady incremental changes in performance over time.
Better operational scheduling: When a tunnel pasteuriser is running between products or different sizes, or is
forced to unload due to a line stoppage or build-back, the machine will go out of thermal balance as the heat
exchange between incoming and outgoing packs cannot be made. This results in extra cooling water being
necessary for the cooling zones at the end of the pasteuriser during run-out and extra heat being needed for
the heating zones during run-in. Steady-state operation of a tunnel pasteuriser plays a key role in utility
efficiency. The two key areas where this can be controlled are to minimise the impact of intermittent line
stoppages, and to manage product changeovers effectively.
Insulation of pipes, valves and surface areas: Significant standing heat losses can often be attributed to poor
insulation of pasteurisers and their associated pump and pipe work. The tunnel pasteuriser environment is
wet, hot and steamy, so can be hostile to many forms of insulation if maintenance is poor or inappropriate
material selections are made. Nonetheless, insulation of heat exchangers, steam valves, pipe work and any
significant hot surface areas can be an economical solution to reduce energy loss.
Maintenance of pumps, valves and control systems, operational practice: Poor maintenance is often cited as
a cause for excessive energy and water use in tunnel pasteurisers, typical failure points can include; ball
valves causing overflows, inoperable controls which are unnoticed or manually overridden, leaks, drain and fill
valves left open, worn pump impellors and blockages causing out of balance operation.
The reality is that after the brewhouse, a tunnel pasteuriser is probably the most energy and water intensive
process to operate in a typical UK brewery, so extra care and vigilance will always pay off.
Use flash steam condensers on heat exchangers: Most pasteurisers are heated by steam using direct steam
injection or localised hot water heat exchangers. If heat exchangers are used there is an inherent inefficiency
due to flash steam losses created by the reduction in pressure as the hot condensate reduces in pressure
passing through a steam trap. The higher the steam pressure at the heat exchanger, the higher the flash
losses. Figure 33 shows the theoretical flash losses at both 2.5 and 5.0 bar gauge.
If the flash steam could be condensed directly to produce useful heat for the pasteuriser rather than lost to
atmosphere, then energy saving could be made. Based on the calculated figures this could be as much as
10% is other losses are taken into account.
This same logic equally applies to other steam using equipment if a use for the flash can be found. For high
pressure steam applications there are a number of high pressure condensate recovery systems commercially
available, specifically designed to alleviate this problem.

Brewing Sector Guide 48
Figure 33 Theoretical flash losses across steam traps
Retrofit opportunities
Increasing thermal regeneration: Figure 34 below shows an example of a retrofit upgrade to improve the
regeneration on a tunnel pasteuriser. In the first example (upper profile) the pasteuriser only has two
regenerative zones: pre-heat and pre-cool, where the water from each respective section is pumped across
so that, in effect, the hot packs coming out of the holding zone heat the cold packs coming in and vice versa.
This provides a limited improvement in efficiency but in this circumstance the first and second heating
sections would still be heated by steam and typically the three cooling sections would have their temperature
maintained by purging with fresh water.
The second example (lower profile) is more representative of best practice, with a higher number of
regenerative zones, which reduce the required heat input as well as the water for cooling. In reality, the final
cooling section will still typically need an amount of fresh water to maintain a stable discharge temperature.
Figure 34 Example regeneration zone improvement project carried out by Barry Wehmiller (barry-wehmiller-
company.com)

Brewing Sector Guide 49
Use of a cooling tower for final cooling zone water cooling: A final addition to the above scheme can be
the addition of a cooling tower to cool and re-circulate the final cooling water. This means that purge water is
no longer required to maintain a stable out-temperature in most operational circumstances. This is primarily a
water saving measure.
Intelligent water exchange during imbalance: Some modern tunnel pasteurisers have a further
improvement over and above a high number of regenerative zones. They have a series of automatically
controlled valves that, as well as allowing the direct exchange of water between regenerative zones, allow for
the intelligent exchange of different temperature water between other zones as well, to maintain temperature
balance whilst minimising the input of water and heat.
PU controls: An intelligent PU controller on a tunnel pasteuriser will vary the operating parameters (speed,
temperatures, etc.) within defined parameters to ensure that over pasteurisation is not occurring and that the
input of water and heat are minimised.
Smaller water reservoirs: Through reducing the size of the water reservoirs for each zone of the pasteuriser
the amount of heating, cooling and water needed during start up, refilling and when it is out of balance can be
reduced. This is typical of more modern machines
The relevance and quantification of the above opportunities at a particular site will be dependent on site-specific
process conditions and its energy consumption baseline.
5.3.2 Flash Pasteuriser optimisation
Improving heat exchanger regeneration efficiency:
There are two principal areas to consider for improving
the thermal regeneration efficiency of flash
pasteurisers: upgrading to more efficient heat
exchangers with lower approach temperatures; and
optimising the temperature profile across the heat
exchanger.
Heat exchangers are typically sized as a compromise
between surface area (and therefore achieved
approach temperature, which limits the level of
regeneration), and capital cost. As energy costs have
increased significantly in recent years and many
brewery heat exchangers are quite old, a review with a
supplier could highlight opportunities to re-plate or
optimise and so reduce the heating and cooling energy
required.
Optimising the temperature profile can be achieved in a
number of ways. Firstly, the beer out temperature, relative to the beer in temperature governs the amount of
both heating and cooling input required by the process. As the required beer out temperature is increased
the cooling requirement is decreased. If the heat exchanger has an approach temperature of 3ºC (that is,
how close the regenerative section can get to the temperatures of the approaching and leaving fluid), then the
optimum temperature for the beer out would also be 3ºC higher than that of the entering beer as this would
mean no extra cooling input was required.
If the desired beer out temperature was lower, then cooling would be needed. If however the desired beer
output temperature was greater than the 3ºC above the temperature of the entering beer, then more heat
input would be required. This is because, as the output temperature rises, the temperature difference across
Figure 1 Flash pasteuriser heating profile

Brewing Sector Guide 50
the regenerative cooling reduces, so the regenerative heat also reduces and the heat input required to
achieve the pasteurisation temperature increases.
Therefore in circumstances where the beer out temperature desired is more than 3ºC or 4ºC above that of the
entering beer, for example if the filling temperature is high, the site should consider adjusting the off-
temperature to optimise the heat exchange, or alternatively consider using free heating (from a cooling tower
or similar) to preheat the entering beer to a few degrees below the desired out temperature. Both of these
steps will serve to minimise the heat input to the pasteuriser, but the second could potentially be a source of
cold liquor generation if the temperature difference was sufficiently large.
Circulation of pasteurisers and hibernation: Findings in the IEEA dairy sector project showed that up to
14% of the energy for pasteurisation is used during extended periods of circulation (periods longer than 10
minutes). During hibernation the cooling section is turned off and the heating is reduced by about 90% (some
heat losses through circulation). The heating and cooling load will therefore be reduced be approximately
95%.
Pasteuriser holding tube insulation: In many cases the holding tubes of pasteurisers are not insulated.
Insulating the holding tubes is a cost effective way to reduce heat losses. Some tests carried out in the dairy
industry also highlighted an associated improvement in pasteuriser temperature stability.
Avoiding bottle condensation / minimising bottle warmer energy: Bottle condensation caused by
moisture condensing out of the air due to low pack temperatures is sometimes cited as a problem for clean-
filled bottles, making labelling difficult. In hot climates this is a problem due to the high dew point and the
solution is usually a bottle warmer which is very energy intensive. In the UK it is unlikely that a bottle warmers
are needed, however condensation is a problem or a bottle warmer is in place, the following steps could be
considered to reduce energy consumption: fill at the highest temperature possible; take steps to condition the
surrounding air; and avoid the addition of excess moisture to the local air from plant such as tunnel
pasteurisers; or to scavenge the low temperature (~40ºC) water needed for a bottle warmer from other parts
of the site.
Higher filling temperature: The fillers for flash pasteurisation have historically run at low temperature to
reduce fobbing. Modern fillers are capable of running at up to 14ºC, negating the risk of condensation and
removing the need for a refrigeration side to the pasteuriser (flash only). The most energy efficient solution
would be to have a heat exchanger with the highest regeneration and have the filler fill at the temperature at
which the beer leaves the cooling regeneration section.
o Example of an older flash pasteuriser system: Beer going onto the pasteuriser at 2ºC, being heated
to 63ºC in the first regeneration section, further heated to 70ºC through steam or hot water and
then cooled to 9ºC in the regeneration section and then being cooled to 2ºC with a cooling section.
o Example of an energy efficient flash pasteuriser system: Energy consumption can almost be
halved by moving from a beer on and off temperature of 2ºC with a regeneration of 90%, to a beer
on temperature of 2º and an off temperature of 6ºC with a regeneration of 94%. This would involve
no cooling section and a larger regeneration section but a reduced specific energy for
pasteurisation.
5.4 Innovative opportunities and significant change
These cover the use of alternative heat sources for pasteurisation and alternative pasteurisation technologies.
The UK industry on the whole uses tunnel pasteurisation currently, although flash pasteurisation and cold sterile
filtration are what might be considered mature technologies. In this section, as well as a looking at alternative
heat sources, we cover the benefits of a fundamental technology shift away from in-pack pasteurisation for small
pack pasteurisation.

Brewing Sector Guide 51
Use of alternative heat sources
Flash pasteurisation
Cold sterile filtration
UV pasteurisation
Pulsed electric field pasteurisation
5.4.1 Use of alternative heat sources
Use of heat from more efficient alternative sources could be an effective way to reduce the cost and emissions
associated with heating a tunnel or flash pasteuriser. Waste heat recovery from other processes e.g. excess hot
liquor, using a hot water heat pump or CHP waste heat could all be potential heat sources. The localised use of a
hot water storage tank would probably be needed in order to ensure a steady and synchronised heat supply. We
are not aware of any commercial brewery applications of this opportunity.
Heat pump on main refrigeration plant: A high temperature hot water heat pump is a mechanism for the
recovery of waste heat from existing centralised site refrigeration systems to generate hot water which can
subsequently be used to heat brewing processes including pasteurisers, CIP and bottle washers. It takes low
grade heat from the hot pressurised refrigerant gas which would normally be discharged to atmosphere at
around 30°C, and using a secondary high pressure compressor system, upgrades it to a condensing
temperature which can heat up water via a heat exchanger to a maximum of around 80°C.
Using a buffer tank and pumps, the hot water is distributed around the factory, (in a similar fashion to that of a
regular chilled water system – but hot) and is used as a heat source for processes.
In the food and drink sector in the UK there are currently a handful of examples of hot water heat pumps but
these are limited to food manufacturers that have a requirement for large volumes of 50°C – 60°C wash-down
water.
The first example of a heat pump using refrigeration condenser heat as a low temperature source in a milk
processing facility is currently being installed in the North West of England. We are not aware of any brewery
examples.
Currently steam raised by firing a boiler is normally used as a heating medium in breweries and has an
efficiency of 60% - 80% for useful output. A heat pump producing 80°C water has a COP of around 5; or in
other words, an efficiency of around 500% heat output to electrical energy in. When the relative costs of fuel
and electricity are taken into account, as well as the different carbon intensities of the different energy
sources, a significant saving in carbon emissions and costs can be achieved compared to steam-based
heating.
5.4.2 Alternatives to tunnel pasteurisation
Flash pasteurisation: Although there are a few sites in the UK which operate flash pasteurisers the move
from tunnel to flash pasteurisation is quite significant. There are multiple processes which need to be taken
into account, the most noticeable being the filling process.
Unlike tunnel pasteurisation the beer and the bottles/can must be cleaned/pasteurised before filling and so
filling must take place in either a clean room or shrouded environment, with a positive pressure clean air
supply to stop any risk of potentially spoiling organisms entering the packaging during filling. However the
experience of some breweries with flash pasteurisation is that a more basic level of air quality control in the
packing environment is sufficient to maintain clean conditions. For this project the business cases have been
based on the average tunnel pasteurisation energy consumption figure against theoretical energy of flash
pasteurisation.

Brewing Sector Guide 52
One of the concerns of flash pasteurisation is that it can leave the bottles with condensation, which can ruin
packaging materials such as labels and crates. Therefore we have modelled this opportunity for both filling at
0ºC and filling at 14ºC, as there are now fillers being capable of filling beer at higher temperatures.
Cold sterile filtration: Cold sterile filtration involves sending the beer through a filtration process that
removes the organisms that can be harmful or spoil the beer. After passing through the filtration unit the beer
is then filled. Further details on this product can be found in the business case in Appendix 4.
UV pasteurisation: UV pasteurisation involves passing the beer through a UV light sources which can
reduce the number of microbes in the beer to similar, if not lower levels to that of tunnel or flash
pasteurisation. Further details on this product can be found in the business case in Appendix 4.
Pulsed electric field pasteurisation: Pulsed electric field pasteurisation involves pulsing high voltage fields
through the beer which actually stretches the bacteria and microorganism to destruction. This is still a young
technology and the actual energy needed to pasteurise beer to acceptable levels is unknown with a
suggested specific energy consumption ranging from below that of flash pasteurisation, up to that of tunnel
pasteurisers.
The table below shows the specific energy and emissions for different pasteurisation systems. Tunnel
pasteurisation is by far the highest energy user of any of the options, using over four times as much energy as
flash pasteurisation per unit of packaged product.
Table 4 Pasteurisation and sterilisation energy
Flash pasteurisation with a shroud
around the filler (0
oC)
Flash using a new filler
(7oC)
Flash with a higher filling temperature
(14oC)
Tunnel pasteurisation
energy breakdown
Cold sterile
filtration
UV Pasteurisation
Total primary energy (kWh/hl)
2.81 1.73 3.39 12.72 0.07 0.13
Total CO2 emissions (kgCO2/hl)
0.69 0.46 0.91 3.33 0.01 0.03
For cold sterile filtration the energy needed is just that of the pumping (1 bar pressure drop over the filter). For UV
sterilisation the energy necessary is 1kJ/litre. Combining this with the added pumping energy (the same for flash
pasteurisation) the total specific energy for UV pasteurisation and cold sterile filtration are several times lower
than either tunnel or flash pasteurisation.
Table 5 Alternative pasteurisation options
Flash Pasteurisation Cold sterile filtration UV Pasteurisation
Total CO2 sector saving 12% 15% 15%
Annual saving for a 2 Mhl site moving from tunnel pasteurisation £295,000 £374,000 £372,000
Payback with a clean room / shroud (years) 3.3 0.9 1.1
Payback with a new filler (years) 8.5 6.3 6.5

Brewing Sector Guide 53
5.5 Summary of findings
Optimising tunnel pasteurisers: As described in this section the majority of pasteurisation in the UK brewery
sector occurs in tunnel pasteurisers. Therefore optimisation of this technology poses a significant initial
opportunity. For the three sites where pasteurisation was monitored the average specific heat energy
consumption was 11.2 kWh/hl of beer packed. The best performing of the sites had a heat specific energy of
8.6 kWh/hl. If the average specific heat could be reduced to this level and we extrapolate this small pack
pasteuriser potential across the sector this would equate to a sector saving of 14,000tCO2, or 3.1% of the
total sector emissions.
These machines are very energy intensive and moving to alternative technology is one of the fastest ways to
reduce the energy consumption and utility consumption in a brewery. The technologies investigated in this
project all use considerably less energy than tunnel pasteurisation per hectolitre of beer packaged. From an
average tunnel pasteurisation benchmark (attained from the specific energy of three breweries monitored in
this project) we have worked out the potential savings for breweries and the sector as a whole from moving
away from tunnel pasteurisation to alternatives.
From moving from tunnel to flash pasteurisation there are options on the filling temperature which will slightly
change the energy consumption (depending on how much cooling or extra heating is needed for the off
temperature out of the pasteuriser - see Table 4), of the process but on average there will be a four to eight
times decrease in the primary energy needed, with a potential total sector carbon saving of 12%.
If cold sterile filtration can be used (with a low filling temperature for filling) the primary energy consumption
can be reduced to around 0.6% of that of tunnel pasteurisation. This energy savings works out as around
£375,000 per year for a 2Mhl/yr brewery if moving from tunnel pasteurisation and would result in a total sector
carbon saving of 15% if implemented across the estimated 90% of breweries that still run tunnel
pasteurisation.
UV pasteurisation involves using slightly more energy than cold sterile filtration but the order of savings are in
the same region, using just 1% of the energy used in tunnel pasteurisation, simply powering the pumps and
UV lamps needed to pasteurise the beer. There are however some primary concerns over the technology
and potential effects on beer quality still to be understood. For our 2Mhl/yr brewery the savings using UV
pasteurisation technology would be around £370,000 per annum if moving from tunnel pasteurisation with a
potential total sector CO2 saving of 15%.
In all cases moving from tunnel pasteurisation involves reaping substantial savings in terms of energy
reduction. The more challenging aspect is to work out the payback as this depends on the required quality
standards for each site, affecting the choice of filling conditions from shrouding the existing filler (the cheaper
option at ~£125,000) to purchasing an entirely new filler at over £2,000,000 for a 2Mhl/yr brewery. The
change in payback for the clean room/new filler option is shown in Table 5.
Table 6 Summary of pasteuriser opportunity business cases
Area Description
Sector Applicabili
ty (%)
Sector Carbon Saving (tCO2)
Sector Carbon Saving
(%)
Average Site Cost Saving
(£)
CAPEX (£)
Average Payback (Years)
Process optimisation
Optimise tunnel pasteurisers
45% 14,000 3.2% £150,000 Unknown Unknown
Small pack pasteurisation
Flash pasteurisation with a clean room
45% 53,000 12.0% £300,000 £725,000 2.5
Small pack pasteurisation
Cold Sterile Filtration with a new filler
50% 69,000 15.4% £350,000 £2,200,000 6.3

Brewing Sector Guide 54
Small pack pasteurisation
Ultraviolet Pasteurisation for
small pack with a new filler
50% 68,000 15.3% £350,000 £2,300,000 6.5
5.6 Barriers to implementation
Clean filling conditions: The difficult part for opportunities regarding small pack is that by moving away from
tunnel to flash pasteurisation the filling conditions usually have to become cleaner. This can require a shroud
over the existing filler, a clean room for the filler or an entirely new filling machine, although there is anecdotal
evidence that a lower standard of air cleanliness is sufficient.
A clean room and foam cleaning system amount to £125,000 whereas a set of two new filling machines (one
for can and another for bottles) will cost in the region of £2,000,000 including installation. Depending on which
option is necessary, the paybacks of the opportunities as shown above in Table 6 can vary greatly.
The key barriers to be overcome aside from financing appear to be uneasiness over potential impact on
product shelf life and failure rates. Host companies feel that these techniques are in essence less reliable.
Converts do however cite improvements in product flavour quality due to reduced thermal damage.
Condensation: The main other issue that is regularly brought up is that flash pasteurisation can lead to the
bottles being filled at low temperatures and then picking up condensation before being labelled and packed.
This condensation can cause problems with label application as well as causing cardboard boxes weaken
through dampness.
Bottle warmers have been cited as a solution but the energy needed to run the warmer often removes the
savings from moving to flash pasteurisation in the first place. If this is a genuine problem in UK climatic
conditions (yet to be demonstrated), this can be solved either through filling at higher temperatures with new
fillers (up to 14ºC) or by controlling the amount of moisture in the packing hall through air handling systems.
There have also been developments in labels that work on damp bottles as seen currently in other cold fill
beverage industries such as soft drinks.

Brewing Sector Guide 55
6 Key findings and opportunities: keg and cask processing
To investigate the energy used for processing and cleaning kegs and cask two approaches were taken: kegging
plants were metered for compressed air, water, electricity and heat consumption to obtain specific metrics that
could be used for quantifying alternative packaging technologies; whereas for cask cleaning the approach was to
work through from first principles the amount of energy, water and consumables used to clean each cask and
compare several different sites.
We have then used this analysis to compare the current approach of reusable packaging to new single use
keg/cask technologies, as well as identifying process improvement opportunities and technologies.
6.1 Keg processing
The majority of returnable kegs in the UK are made of steel or aluminium and comprise a solid outer shell with a
valve on the top, connected to a spear that runs down through the centre of the keg.
Figure 36 Beer keg cut open to reveal interior
When kegs return to site they have to be cleaned to a specification where fresh beer can be pumped into the keg
and then remain fresh for several months after filling. This involves two processes with the beer being

Brewing Sector Guide 56
pasteurised in a flash pasteuriser and the kegs being thoroughly cleaned. The most common set up for this
cleaning is the keg to be cleaned on the outside, washed internally and then sterilised with steam:
1. The keg is washed externally
2. Pre-rinse water is then inserted into the keg
3. After the pre-rinse has drain out of the keg (usually to drain) a heated detergent mixture is added
4. The detergent is drained and a final rinse is put through to clear out any remaining detergent
5. The final rinse is drained out and usually recovered to be used as the pre-rinse for another keg in the
line
6. The keg is filled with steam and held at pressure and temperature to sterilise the internal surfaces of the
keg, valve and spear
7. The steam is let out and fresh beer is filled into the keg
8. The keg is ready to be sealed
In order to quantify the potential savings from alternative packaging we needed to know how much energy is
used to process kegs. For the total keg plant we measured the heat input against production over an eight day
period to demonstrate the relationship between heat necessary and when kegs are actually being processed.
This is demonstrated below in Figure 37.
Figure 37 Heat and electrical demand against keg production over 8 days for kegging plant at Site 2
For a site where half hourly production was not available (but weekly production information was) we also plotted
the heat, electrical demand and water input to the keg plant to understand how much energy and resources were
consumed per hl of beer that was packaged over the monitored period. This is shown in Figure 38.
In both of these cases the electrical load is seen to carry on at a reduced level during periods of no production.
This is could be down to baseload demands such as lighting and air handling which will happen 24/7 for
maintenance or any other work not relating to production in the keg processing plant.

Brewing Sector Guide 57
The data was collated over this period to produce a breakdown of the average utility consumption between the
two sites with a total cost per hl based on the following averaged utility prices:
Cost of heat in the boilers (£0.03/kWh)
Cost of electricity (£0.07/kWh)
Cost of water (£1.00/m3)
Cost of effluent (£1.80/m3)
Figure 38 Utility consumption at Site 3 for the kegging plant
6.1.1 Keg pasteurisation
The beer that is packed into kegs is currently pasteurised through flash pasteurisation. The energy for flash
pasteurisation has been taken from the small pack pasteurisation section of this report and taken away from the
total energy going to the kegging plant to give the figure for processing and cleaning the keg only.
An opportunity exists to pasteurise the beer using UV pasteurisation and for this the same parameters have been
used for small pack when looking at the savings associated with moving from flash to UV, only here using the
quantities of beer that are filled into kegs (44% of UK production).
Table 7 Breakdown of average utility consumption per hl for the keg cleaning and filling process at two sites
Keg Processing
Total primary energy 8.4 kWh/hl
Total specific CO2 2.1 kgCO2/hl
Total cost to process a keg 0.42 £/hl
Keg Cleaning & Filling
(minus flash pasteurisation energy) Specific heat (post pasteurisation) 4.0 kWh/hl
Specific electrical energy (post pasteurisation) 0.6 kWh/hl

Brewing Sector Guide 58
Specific water 0.7 hl/hl
Total primary energy 5.6 kWh/hl
Total specific CO2 1.4 kgCO2/hl
Total cost to clean and fill a keg 0.34 £/hl
Alternative packaging opportunities
Metal kegs and casks have dominated the market for the last several decades for large pack distribution of lager
and ale. This involves filling a reusable metal container with beer, sending it out to the customer and then
shipping back the empty containers to be cleaned before they are filled again and so the process repeats itself.
The process of cleaning these containers is quite energy intensive as it involves cleaning all of the kegs/casks to
the worst case scenario. The containers are cleaned using a combination of water, detergent and steam. The
other main source of energy consumption for containers is the energy needed to transport these containers to the
point of use.
In order to reduce the energy for kegging and casking these two sets of variables need to be reduced. One
method of doing this is for one way packaging. New packaging systems for beer now offer all the physical
advantages of classical metal kegs and casks (ability to hold pressure, drop-proofness, ease of filling), with the
light weight of a one-way plastic container.
The historical apprehension of one-way containers going to land fill have stifled the market but recent
developments in recycling may have the potential to change the future dynamic.
The key to these alternative technologies reaching market is that they need to be both cost and environmentally
beneficial when compared to existing returnable kegs.
6.1.2 Process optimisation opportunities
Low temperature detergents and sterilants
The heat used in cleaning and sterilising the kegs accounts for 77% of the energy of the variables monitored
(compressed air usage was not shown due to lack of confidence in the monitored results). If cleaning and
sterilisation could be done at a lower temperature then this heat input would not be necessary.
Through reducing the cleaning and sterilisation temperature to ambient the keg cleaning costs (not including
compressed air) could be reduced from 34p to 22p per keg, reducing the annual costs of a 2Mhl/yr brewery by
£120,000 (1Mhl through the kegging plant and the other 1Mhl through small pack).
If all of the sector were able to carry out this conversion the sector could reduce its carbon emissions by 4.8% or
21,000 tCO2 per annum.
6.1.3 Innovative opportunities
One-way keg packaging: The concept is for kegged beer to
be sent in one-way packaging in place of steel and aluminium
kegs as is currently practiced with the majority of the UK pub
market.
The packaging involves a pressurised PET ball that houses a
flexible inner bag. This system allows the traditional system of
using gas at pressure to force the beer out of a keg and up
through the lines. The entire package is inserted into Figure 39 KeyKeg one way kegs

Brewing Sector Guide 59
cardboard outer packaging.
For products travelling over 90 miles the manufacturers claim that the new one way packaging products have a
smaller carbon footprint than their returnable metal counterparts.
The main sticking point for these newer returnable kegs are that there are several different designs out on the
market at present, all with different shapes and filling valves. This disparity across the market is stifling industrial
take-up and progress towards a unified standard needs to take place before the industry can compete effectively
with metal containers.
The energy used to make a 30 litre one-way keg is equivalent to approximately 0.53 kg of CO2. This works out at
1.7kgCO2 per hl which is currently more than is used to process the kegs in a brewery (currently not counting
compressed air). We can therefore conclude that the carbon savings are not to be found in the brewery but out
on the road/sea/air where the reduced weight allows more beer to be carried on each load and eliminates the
need for empty kegs to be returned. Transport emissions can therefore be more than halved, provided that
alternative backhaul loads can be found.
Based on initial calculations we
estimate that for a 30 tonne
load on an articulated lorry the
difference in carbon emissions
between manufacturing a new,
recyclable plastic one-way keg
and delivering it, versus
processing and delivering a
standard keg breaks even at a
return journey distance of
around 180km from the brewery
(i.e. 90km each way). Beyond
this distance, the one-way keg
offers better net carbon savings
compared to a steel keg. Figure
40 shows the breakdown in
carbon emissions for each keg
type at the breakeven point.
6.2 Cask processing
Casks are cleaned in a different way to kegs as they are not capable of
holding compressed liquid so they must be cleaned through spraying
water and or detergent into the central hole as shown below in Figure 41.
This hole is used for filling and allowing air into the cask so that when it is
opened at the side air can flow in, allowing the beer to drain away.
Figure 41 Beer cask
Information was collected from four ale brewing sites on their cask
washers in order to gauge the level of consumption of a number of variables on a per cask method. This data
was collected through empirical tests without direct metering, so the figures are based on analysis of the
Figure 40 CO2 breakdown for 90km each way trip (CO2 breakeven point)

Brewing Sector Guide 60
equipment used, for example, steam usage was calculated by the brewery team mimicking the wash cycle and
measuring the rise in temperature of a bucket of water after passing the sterilisation steam through a pipe to the
bucket.
Compressed air usage
Electrical demand for incorporated motors
Water usage
Water temperature
Steam usage
Detergent usage
These variables have been collated in Table 8 and Figure 42 below, and show that the use of a detergent wash
and effective management of CIP water can lead to significantly lower costs and carbon emissions per cask
cleaned.
For Sites 2 and 3, the higher water consumption (and therefore specific heat as the water is used hot) is due to
the pressure at Sites 2 and 3 being higher for the cleaning jets. Upon investigation it was found that the nozzles
that were used for Sites 2 and 3 were simple slots and inferior to the nozzles at Site 1 which allowed higher
impact velocities for the water with less water usage, through restricting the hole size.
Table 8 Utility consumption per cask cleaned
Site 1
Site 2
Site 3
Site 4
(Detergent wash)
Total electrical energy (kWh) 0.24 0.28 0.29 0.26
Total heat energy (kWh) 2.33 3.87 3.93 1.06
Total water consumption (l) 22 45 45 16
Detergent used No No No Yes
Total energy (kWh) 2.57 4.15 4.22 1.32
Total primary energy (kWh) 2.96 4.59 4.69 1.74
Total CO2 per cask 0.76 1.19 1.21 0.43
The four breweries that were looked at for this cask washer comparison paid different energy cost rates for their
utilities. In order to give a direct comparison average universal rates have been applied to the above specific
utility figures to see how the much the processing a cask in each machine costs.
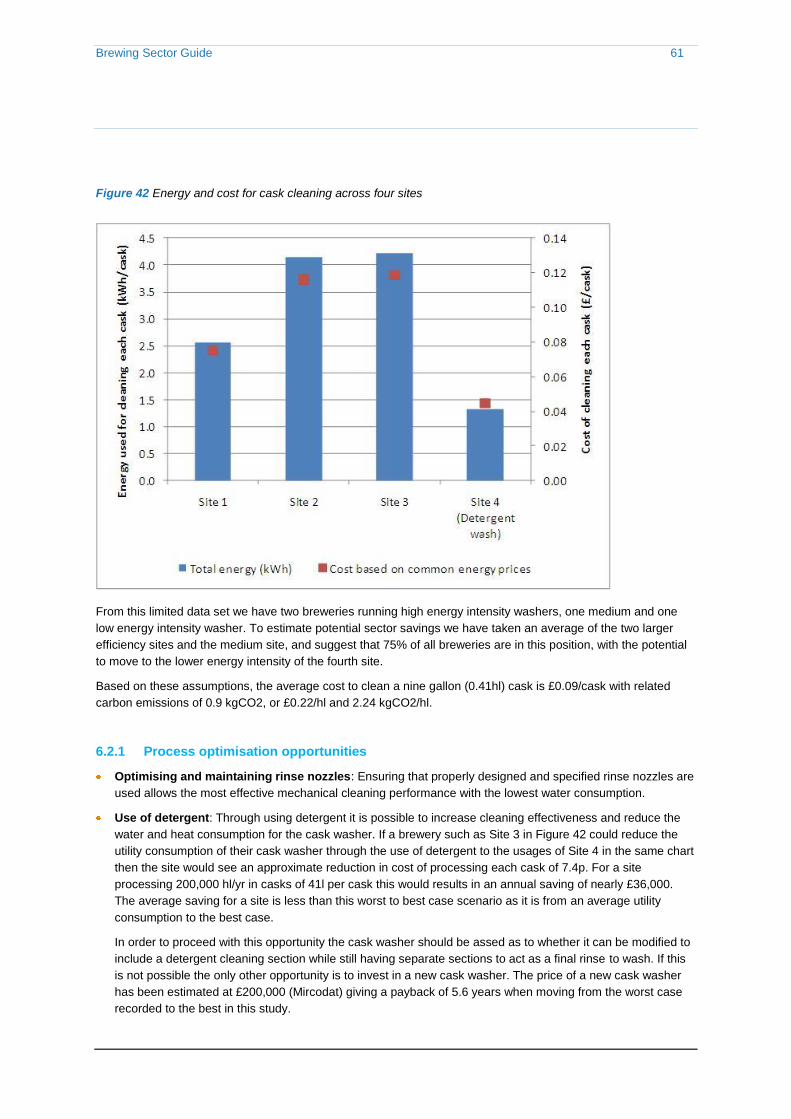
Brewing Sector Guide 61
Figure 42 Energy and cost for cask cleaning across four sites
From this limited data set we have two breweries running high energy intensity washers, one medium and one
low energy intensity washer. To estimate potential sector savings we have taken an average of the two larger
efficiency sites and the medium site, and suggest that 75% of all breweries are in this position, with the potential
to move to the lower energy intensity of the fourth site.
Based on these assumptions, the average cost to clean a nine gallon (0.41hl) cask is £0.09/cask with related
carbon emissions of 0.9 kgCO2, or £0.22/hl and 2.24 kgCO2/hl.
6.2.1 Process optimisation opportunities
Optimising and maintaining rinse nozzles: Ensuring that properly designed and specified rinse nozzles are
used allows the most effective mechanical cleaning performance with the lowest water consumption.
Use of detergent: Through using detergent it is possible to increase cleaning effectiveness and reduce the
water and heat consumption for the cask washer. If a brewery such as Site 3 in Figure 42 could reduce the
utility consumption of their cask washer through the use of detergent to the usages of Site 4 in the same chart
then the site would see an approximate reduction in cost of processing each cask of 7.4p. For a site
processing 200,000 hl/yr in casks of 41l per cask this would results in an annual saving of nearly £36,000.
The average saving for a site is less than this worst to best case scenario as it is from an average utility
consumption to the best case.
In order to proceed with this opportunity the cask washer should be assed as to whether it can be modified to
include a detergent cleaning section while still having separate sections to act as a final rinse to wash. If this
is not possible the only other opportunity is to invest in a new cask washer. The price of a new cask washer
has been estimated at £200,000 (Mircodat) giving a payback of 5.6 years when moving from the worst case
recorded to the best in this study.

Brewing Sector Guide 62
6.2.2 Innovative opportunities
UV sterilisation: The use of UV light as a more energy efficient sterilising technique was looked at in this
project but as UV sources have to be surrounded by quartz glass the option was not deemed possible to
include into a cask washer due to the potential of the glass breaking and entering the cask before filling.
6.3 Summary of findings
Kegs
For kegging an average cost of beer processed has been identified as approximately 50p/hl (excluding the
cost of compressed air) and 5.6kWh/hl of primary energy. The total carbon emissions associated with kegging
account for 6% of the UK sector total.
If keg processing could be carried out at ambient temperature up to 77% of the heat energy used could be
removed.
Alternative (one-way) packaging offers carbon saving potential but the determining factor is the distance they
are transported, the degree to which the plastic containers are recycled in practice, and the degree to which
alternative backhaul loads can be found for delivery vehicles.
Casks
For casking the cost was 9p/cask based on a monitored energy use of 8.52kWh/hl. For casks this report has
shown the value of cleaning with detergent, insofar that it can reduce by up to two-thirds the cost of
processing each cask through the reduction in water and energy needed. The cost of a new cask washing
plant unfortunately prohibits this from being a retrofit opportunity but this information should be taken into
account when replacing systems or planning new facilities.
Table 9 Keg and cask opportunities
Area Description Sector
Applicability (%)
Sector Carbon Saving (tCO2)
Sector Carbon Saving
(%)
Average Site Cost Saving
(£)
CAPEX (£)
Average Payback (years)
Kegs/Casks Optimising cask
washing 6% 3,100 0.7% £34,000 £250,000 5.9
Kegs/Casks One way
containers 50%
Dependent on
transport
Dependent on
transport
Dependent on
transport Unknown Unknown
Kegs/Casks Ultraviolet
Pasteurisation for kegs
44% 13,000 2.9% £127,000 £240,000
1.9
6.4 Barriers to implementation
Compatibility: One of the main reasons metal kegs and casks have not changed their fundamental design
over the last few decades is that most can be filled at any brewery regardless of their brand. The majority of
kegs come in similar sizes with one type of valve that is compatible with most automatic keg processing and
filling machines. Casks differ a little but the machines that process them are usually able to accommodate the
different varieties without too much trouble.
This compatibility relates back to the designs of these containers being free to use and so everyone builds
their machines to be compatible with this industry standard. The new one-way products that are emerging into
the market do not have this advantage, with each having its own geometry, filling adaptors and equipment

Brewing Sector Guide 63
which a brewery must buy to convert their existing equipment to be compatible. This creates a barrier in that a
brewery committing to one type of one-way container may be left stranded if another type eventually comes to
dominate the market.
Without consensus within the industry it is unlikely that a one-way product will be introduced widely in the
numbers necessary to make a clear impact on the sector‟s carbon emissions.
Storage and transport: One of the areas that one-way packaging needs to be proficient is their strength
when stacking. Existing containers are stacked several times over in courtyards and on transport lorries and
any other packaging would have to do the same to fit in existing warehouses.

Brewing Sector Guide 64
7 Key findings and opportunities: clean-in-place
7.1 Data analysis
Although CIP was not included in the metering process for this project we have taken energy data that was
already available from a single site to get indicative figures for opportunities. The steam used for heating CIP
systems was divided by the overall production for the site (Figure 43 below).
The average specific CIP heat for the measured multipack type brewery over one year was: 0.95 kWh/hl. It
should be noted that we have been unable to explain the steady decline demonstrated over time.
Figure 43 CIP specific energy at a site over 5 months
We have taken the main findings of the investigative works done for the dairy industry IEEA project which we
think are equally applicable to the brewing industry in many areas and have extrapolated the potential savings
available based upon the benchmark derived above. As this was a single figure only acquired from one site this
was compared to the specific heat measured for CIP in the dairy sector IEEA project. As a reference point, the
range recorded for milk was 0.75 – 1.87 kWh/hl.

Brewing Sector Guide 65
7.1.1 CIP heat loss bridge
From the IEEA dairy sector monitoring and analysis we were able to break down the heat balance for the CIP
plants monitored. The total energy input was derived from the metered data, whilst tank standing losses and tank
dumps to drain were based on calculation, and the energy lost to drain during CIP was calculated from the
amount of raw detergent addition to the system (replacing losses at a given concentration). The following figures
show two thermal loss bridges for dairy sites. The top bar shows the total energy added to the system over the
monitoring period and the other bars the balance of the heat lost. Both loss bridges are broadly similar.
Figure 44 Example dairy CIP Loss Bridge 1
Figure 45 Example dairy CIP Loss Bridge 2
The key points to note are:
Tank standing losses are from the radiation and convection of heat away from the surface of the CIP tanks
and in general are small.
Caustic lost to drain is the energy lost during each CIP where some of the hot detergent solution is sent to
drain rather than recovered – this forms one of the significant losses from the system and is largely
dependent on system optimisation.
Caustic lost during tank dumps is related to the sporadic dumping of an entire tank when the tank is too
contaminated with foreign material to carry on working effectively – these generally account for a small

Brewing Sector Guide 66
amount of losses and hence carbon emissions. In breweries this could however be larger due to
carbonisation of the detergent solutions.
Heating up infrastructure includes heating up pipe work, tanks, valves and other conducting materials that the
CIP solution comes into contact with while in circulation, as well as the subsequent losses to the surrounding
atmosphere – this forms the most significant amount of the CIP heat load.
7.1.2 Effect of temperature on CIP runs
Heat use in CIP is affected by temperature. The temperature of the caustic CIPs measured in the dairy industry
were approximately 80°C (acid CIP temperatures were lower, nearer 65°C), with ambient temperature at 20°C,
therefore the differential temperature is approximately 60°C between equipment at its CIP temperature and the
surroundings. Therefore for every 1°C reduction in CIP temperature there will be approximately 1/60th reduction
in the heat energy needed.
If all CIP was done with caustic at 80°C then for every 10°C reduction in CIP temperature, there would be on
average a 17% (10/60) reduction in the heat energy consumed by CIP. Multiplying out across the sector would
result in a sector-wide reduction of just below 1,400 tCO2 for every 10°C the CIP temperature could be reduced.
This demonstrates the significant potential for optimisation or technologies that reduce temperature.
7.2 Process optimisation opportunities
The opportunities associated with CIP can be classified into two areas: opportunities that involve optimisation of
the current process, and opportunities that require fundamental redesign with a new system.
Through the CIP loss bridges we have shown that the two largest areas of heat use are hot detergent lost to
drain and heat absorbed through infrastructure in order to get the system up to temperature. With detergent loss
to drain there are opportunities for optimisation of the CIP system, but in order to reduce the costs associated
with heating up infrastructure, a system that uses lower temperatures or does not use heat as a fundamental
component of cleaning could be considered.
Minimising detergent loss to drain: By looking at the split of CIP energy use we were able to identify hot
detergent lost to drain during CIP runs as one of the main causes of energy loss. The most common reasons
for CIP systems to lose hot detergent are as follows:
o When cleaning valves and vents, hot detergent solution is pushed out of seals and openings and
this is lost to drain.
o Parts of the system are „non-return‟ CIPs where either the age of the system, or the cost of initially
setting up the return, means that the caustic used to clean these items is not reused and simply
goes to drain.
o When some systems are cleaned the amount of material that the detergent solution picks up results
in the detergent being thrown to drain as it would contaminate the central detergent supply.
o Insufficient caustic tank size means that if a single system is performing multiple cleans at once, the
caustic tank level may fall below the minimum point and will be filled with fresh cold caustic and
water which then needs to be heated up. When the existing caustic solution comes back from the
items it has cleaned there is not enough space in the tank and so the hot solution is either sent to
drain or to the pre-rinse tank and then to drain.
o User alteration: over time, minor adjustments or „tweaking‟ of the system to the CIP recipes can
result in the system becoming out of balance.

Brewing Sector Guide 67
o CIP systems are set for specific periods of time and if aspects of wash cycles are optimised to
increase production availability then associated costs can sometimes increase. As energy prices
increase this balance may tip in the other direction.
If a low temperature CIP system was implemented then the cost of heating caustic and fresh water to replace the
solution lost to drain would be mitigated. However before a new CIP system is installed we would recommend
that a CIP engineer visit the site in question and check through all of the items mentioned above with the aim of
achieving some quick wins and reducing the heat, water and chemical demand of the CIP system.
Reduction of CIP water volume and/or temperature would reduce the energy consumption of CIP
systems. It will not be possible to predict how much impact this would have across the sector as each site
benchmarks their CIP systems differently and has a different set up of caustic and acid systems. The
regulated aspects of CIP are the microbial levels within the pipes and not the temperature of the working fluid.
Volume reduction can generally be achieved through incremental monitoring, adjusting and testing. Often
this is best achieved with the assistance of a commissioning engineer.
Reduction in the number of CIPs: Typically CIP cycles are instigated through either timers, product change
and also through operator discretion. Of the three sites monitored as part of the dairy sector IEEA project, the
plant with the highest CIP load had 60% more CIP units for the same volume of raw milk throughput.
Reductions can be achieved in two ways: either increasing the utilisation of the plant whilst keeping the CIP
schedule similar; or reducing the frequency of CIP runs in areas where possible. As CIP is primarily time
driven, the higher the plant utilisation, proportionally the less CIP carried out per unit output.
Understanding what is clean: through a better understanding of “what constitutes clean”, i.e. avoiding an
unnecessary level of cleaning for a required standard of hygiene. Knowing how much energy is used to heat
the fluid used for CIP enables the calculation of potential energy savings from alternative forms of CIP that do
not involve the heating of large amounts of caustic and acid for cleaning.
Optimising process plant design to reduce CIP requirements: Including reducing pipe runs, ensuring all
pipes and tanks are free draining. Further investigation into how the design of process plant and a CIP
system affects its energy demand will be needed to model accurately the potential savings associated with
CIP. The analysis carried out for the dairy sector IEEA project has shown the size of prize that is available in
terms of heating energy reduction potential, but when taking into account chemical usage and pumping costs
the overall energy consumption savings would be considerably greater.
Cleaning of CIP detergent solution with thin membranes: would reduce the amount of hot solution that is
currently lost to drain after becoming too contaminated to return to the main tanks. The cost savings would
be associated with the amount of solution lost through tank dumps and solution not currently returned to the
detergent tank due to excessive soiling.
Reduce infrastructure losses: It is unlikely that the proportion of heating energy used for heating up
infrastructure can be simply reduced through optimisation of current CIP systems. By using an alternative
system that does not use hot solution to clean, the energy that is lost to drain and the energy used to heat up
the infrastructure can be saved, meaning that much of the CIP energy losses could be reduced. An
alternative approach could be to minimise the heat capacity of process equipment through new equipment
materials and design e.g. alternative pipe material.
7.3 Innovative opportunities
If we are to use this figure of 0.95 kWh/hl as the base for CIP heat energy use for breweries then we can
estimate the potential savings for a number of more innovative CIP opportunities.
Real time cleaning verification
Low temperature detergents

Brewing Sector Guide 68
Ultrasonic cleaning
Ice pigging
Whirlwind pigging
Electrochemically activated water (ECA)
These are described briefly below; fuller descriptions including business cases are shown in Appendix 6.
Real time cleaning verification: Real time cleaning verification is a concept where a CIP system can be
finely tuned so the amount of cleaning necessary is not exceeded. This is accomplished through a thorough
understanding of what the term „clean‟ encompasses for each site and then monitoring the contents of the
cleaning fluid until it matches with the previously defined criteria.
At present CIP systems are set to run for timed amounts or volumes, or react to the conductivity of the flow.
None of these systems uses a closed loop control that actually reacts to the amount of material that has been
removed during the cleaning process or how much remains.
A previous EU-funded project run by Birmingham University called „ZEAL‟ covering real time cleaning
verification has estimated potential energy savings of up to 50%, by reducing CIP time, as well as reducing
chemical and water use.
It is unknown to what extent the sector could benefit from this 50% reduction through better control of CIP in
real time. We have estimated that 80% of sites could achieve this reduction.
Low temperature detergents: Normally a CIP system works at a temperature of 70 - 80ºC. If we use 80ºC
as a baseline then using a detergent that is effective at 40ºC will reduce the site CIP heat demand by 38%
and if it can be reduced to 25ºC the heat reduction will be 82%. These low temperature CIP systems have
been trialled in the UK brewing sector but are not wide spread and so we will model the applicability of these
opportunities at 80%.
One such CIP technology is ECA or electro chemically activated detergent that produces an anolyte and
catholyte out of a Sodium chloride (salt) solution or other compounds such as sodium carbonate. The anolyte
is a steriliser that removes bio-films and biological compounds and the catholyte solution has many of the
properties of a detergent.
There are however compatibility issues with the ECA technology and acid cleaning systems already installed
in CIP systems in current breweries. ECA can only be used to remove biological compounds and not mineral
deposits such as burn on in the kettle or lime scale. Currently acid is used for removing this but if ECA comes
into contact with acid this results in chlorine gas being given off which is poisonous. The use of this
technology is still possible if the two liquids are kept separate and always flushed with water in-between. The
other option is to use a different solution other than sodium chloride such as sodium carbonate. ECA has
been found to work well in packaging where acid is not used with interest in the UK and further afield in South
Africa to name another country.
Running the 25ºC system on a 2Mhl site will save £66,000 a year and could reduce the UK total brewery
sector emission by 1.7%.
Ultrasonic cleaning: Ultrasound has historically been used for to clean difficult to reach areas, or internal
surfaces of components that would be difficult to reach. Components are placed in baths of cleaning solutions
and then sonotrodes agitate the solution at an ultrasonic frequency with creates cavitation on the surface of
the components, dislodging dirt and other contaminants. Cavitation is when the fluid pressure drops below the
vapour point of the liquid and a bubble of gas is formed. This bubble then collapses and forces a high
pressure jet onto the surface which aids in dislodging material.

Brewing Sector Guide 69
The concept of using ultrasonics in the brewing industry is that this technology can be applied to pipework,
tanks and solid metal objects, dislodging material from the inner surfaces and reducing the loads on CIP. By
attaching ultrasonic actuators to either sections of pipework, solid metal components, or putting inside tanks a
low ultrasonic source would stop the build-up of material adhering to the inner surfaces. The wort cooler
would be an obvious application for this at it is frequently subject to blinding; however plate pack heat
exchangers would not work well as they contain numerous rubber gaskets between the metallic plates that
would damp out the ultrasonic vibration.
This is not a substitute for standard CIP but a system that would work in tandem with it, reducing the load or
frequency of the primary method.
The savings for cleaning certain areas alone are not fully understood and so further research needs to be
done when the products are more commercially available and have been proved in other industries.
Ice pigging: Pigging is widely employed in the hydrocarbon industry where solid plugs or „pigs‟ are used to
clear and clean pipes. The technique is beginning to be adopted in the food and pharmaceutical industries
and can be used for more than just cleaning as the technique is effective for both product recovery and
separation. But conventional pigging is limited in the pipe geometries to which it can be applied.
Ice pigging is a novel and innovative new pigging technique that has significant advantages over conventional
solid pigs. The ice pig plug is formed from thermodynamically stable ice slurry combined with a freezing point
depressant which is capable of cleaning a product from ductwork and/or separating products in different
phases of the production cycle. The unique non-Newtonian flow characteristics of the pig allow it to negotiate
a wide variety of obstacles successfully (even plate pack heat exchangers), while maintaining the cleaning
efficiency and in many cases a sharp product interface.
Ice pigging allows for much higher product capture (product recovery) at the end of each run as the sharp
interface of the ice acts as a solid plug, contaminating only the small volume abutting the pig face. The ice pig
also has superior cleaning abilities to fluid washes as the high shear forces within pig mean the ice crystals
effectively dislodge material as they scrape past. Due to its nature the pig is unsuitable for tank cleaning so
only forms a partial CIP solution and, in any case, extensive trials will be needed to evaluate the technology in
terms of its practical applicability and potential cost-effectiveness to the brewing industry.
Whirlwind pigging: Whirlwind pigging is a process where a vortex (whirlwind) is generated in a pipe system
which cleans the inner surfaces of the pipes through gaseous displacement and through adding cleaning
additives to the „whirlwind‟.
An air stream is blown through the pipe work to recover product. This is done by a blower system and does
not involve compressed air (which is very energy inefficient). At this point a small amount of water or cleaning
agent (caustic or acid) can be introduced into the airflow, enhancing the cleaning effect from the turbulent
flow. Heated air is introduced to dry the pipe work.
The technology currently has a small number of active applications in the food and beverage industry, but
trials are needed to prove its wider applicability. The technology cannot be used to clean plate pack heat
exchangers or large tanks and silos. As for ice pigging, further work is needed to evaluate the technology in
terms of its practical applicability and potential cost-effectiveness to the brewing industry.
7.4 Summary of findings
Through identifying the specific energy for CIP in a brewery and comparing it to the dairy industry benchmark
developed as part of the IEEA dairy sector project, this study has managed to quantify the savings for
switching to low temperature detergents and for real time cleaning verification.
We have identified that through reducing the temperature of CIP in a brewery by 10ºC the energy needed can
be reduced by 17%, giving a saving nearly £7,000 per annum for a 2Mhl/yr site. Running a project on real

Brewing Sector Guide 70
time cleaning verification can also offer significant financial savings (reducing energy cost by 50%) and with a
potential sector CO2 savings of up to 1.7% but this will depend on which other opportunities are applied first
and how much CIP related energy consumption has reduced.
There are many novel CIP technologies which have recently been developed such as whirlwind pigging, ice
pigging and ultrasonic cleaning but none of these have been trialled successfully in breweries or produced
any case studies for the brewery industry and so the savings or applicability cannot yet be evaluated.
What this section on newer CIP technologies should provide is insight into what is becoming available and so
when future planning for replacing systems or building new plants takes place they can be quickly considered
and further investigation carried out.
Table 10 CIP opportunities
Area Description Sector
Applicability (%)
Sector Carbon Saving (tCO2)
Sector Carbon Saving
(%)
Average Site Cost Saving
(£)
CAPEX (£)
Average Payback (Years)
CIP
CIP - Real time cleaning
verification ZEAL
80% 4,600 1.0% £40,500 unknown Unknown
CIP CIP - Low temp detergents and
ECA 80% 7,500 1.7% £66,000 unknown Unknown
7.5 Barriers to implementation
CIP culture: It is sometimes the case that only a few people working at a brewery know why a CIP system is
set up to have the temperatures, concentrations of detergents and run times that are operated. The case in
the majority of breweries are that a CIP system was set up to clean with a degree of contingency built in. If
this was set up years ago it would have been at a time when the price of energy and water meant that over
cleaning the system by a factors of two or three did not have a substantial impact on the running costs on
site. This is no longer the case.
CIP set points are also regularly altered as a result of poor microbiological results somewhere on a line. A
typical response is to either increase the temperature of CIP or increase the run times of CIP on that line
without really looking into the reasons behind the poor test results. Formalised monitoring, investigation and
change procedures could help to minimise the potential for these changes.
Compatibility with multiple systems: For the alternative CIP systems investigated a common theme has
been that the different systems all offer reduced energy cleaning but are not able to offer the whole brewery
with one solution, as with the current system of caustic, acid and sterilant of today. We have looked at
systems such as ice pigging and whirlwind pigging which can clean lines but not tanks. We have looked at
ECA which is very effective at cleaning biological deposits but cannot remove scale or work near acids.
The issue with proposing multiple CIP systems could be that as the complexity increases the workload of
employees, individual training needs and effective quality control measures become greater or more complex.
Multiple systems may offer substantial energy savings but the added cost of work to maintain such systems
and be trained enough to achieve these savings may not be initially apparent and may be the deciding factors
in their uptake.
Lack of metering: The energy going into CIP was not part of the metering process of this project as it was
felt that to fully understand the energy used within CIP the amount of metering and access to site personal

Brewing Sector Guide 71
would exceed the budget of this project. For this reason we have used data from a site that had two CIP
systems from which the monthly data for CIP steam usage was available, as well as drawn on the findings
from the IEEA dairy sector project.
Brewery CIP systems vary from site to site, from systems that deliver flushes, detergent cleaning solutions
and final rinses to into discreet areas of the plant, to systems that have multiple uses. What is common with
most systems is the lack of metered data on the water and energy inputs into these systems and the end
uses for these CIP stations. Without a move to increase the understanding of where energy goes within CIP,
the ability to quantify the savings for new technologies on specific areas will be hampered.

Brewing Sector Guide 72
8 Summary of opportunities
8.1 Overview
The approach taken during this IEEA Stage 1 project was to categorise opportunities in terms of “waves”,
dependent on their level of commercial and technical maturity, and associated cost-effectiveness of
implementation. This is shown in the diagram below.
Figure 46 Categorising energy saving opportunities in terms of commercial and technical readiness
The so-called “Wave 1” opportunities include both low/no cost energy good practice measures (such as effective
energy management and maintenance), as well as proven energy and carbon saving technologies for which
there is a solid business case without any need for external grant support or subsidy. Examples in this latter
category include VSDs, improved controls, and areas of process optimisation such as high gravity brewing.

Brewing Sector Guide 73
To the extent that these cost-effective opportunities have not yet been implemented within the brewery sector,
the requirement is one of awareness raising across companies and sites so that they can be taken up to their
fullest extent, allowing for the fact that some sites may have insurmountable, site-specific constraints to
implementation.
The “Wave 2 and 3” opportunities are those where there are financial, commercial, process-related and/or
technical barriers to be overcome and these therefore are the focus of this project. These opportunities can be
classed as either ready to be piloted at a demonstration scale at a brewery site or to be the subject of further
tests and/or development to generate the additional data needed to quantify their energy saving benefits in more
detail, as well as to provide confidence for the industry to speed up the uptake of the technology.
The barriers here relate to high costs (since they are not yet in production and so must be built as “one-offs”), or
to available experience (for example, beer has not been pasteurised in the UK using UV light before ).
8.2 General best practice energy efficiency opportunities
The following best practice opportunities have been extracted from the collated survey responses, selecting the
measures that were still possible (i.e., not yet implemented, but could be), at most sites, but which also have the
potential to achieve effective emissions reduction. The full summary of responses to the check list survey can be
found in Appendix 2.
Based on the ten survey respondents, the following list summarises the measures which had the most potential
for implementation (i.e., had not yet been implemented, but could be):
Monitoring and targeting: Protected budgets for energy saving measures
Process: Recover heat from spent grain (40% possible)
Boilers and steam distribution: Install a flue gas economiser (50%)
Cooling and refrigeration: Reduce unnecessary parasitic loads e.g. pumping (60% possible)
Compressed air: install VSDs onto compressors (50% possible).
Buildings and lighting: Presence sensors (60% possible)
Appendix 2 provides the full list of survey questions (the good practice “check list”) as well as tabulated summary
of responses.
8.3 Process optimisation opportunities
Table 11 and Table 13 below summarises the process optimisation opportunities identified as part of this project
and relevant to the focus subject areas.
8.4 Innovative opportunities
Table 12 and Table 14 below summarises the more innovative opportunities investigated as a part of this project.

Brewing Sector Guide 74
Table 11 Process optimisation opportunities
Wave
(1) Area Description
1 Kettle Calorific Kettle Heating
1 Kettle Reducing boil-off & using a sparge ring
1 Kettle Vapour heat recovery
1 Kettle Reduction in calandria steam pressure
1 Kettle Adding adjunct after the kettle
1
Tunnel Pasteuriser Optimisation using water & energy metering
1 Tunnel Pasteuriser Operational scheduling & line stoppages
1 Tunnel Pasteuriser Insulation of pipes, valves and surface areas
1 Tunnel Pasteuriser Maintenance of pumps, valves and control systems, operational practice
1 Tunnel Pasteuriser Use flash steam condensers on heat exchangers
1 Tunnel Pasteuriser Increasing thermal regeneration
1 Tunnel Pasteuriser Use of a cooling tower for final cooling zone water cooling
1 Tunnel Pasteuriser Intelligent water exchange during imbalance
1 Tunnel Pasteuriser PU controls
1 Tunnel Pasteuriser Smaller water reservoirs
1 Flash Pasteuriser Improving heat exchanger regeneration efficiency
1 Flash Pasteuriser Circulation of Pasteurisers & hibernation
1 Flash Pasteuriser Pasteuriser holding Tube Insulation
1 CIP Minimising detergent loss to drain
1 CIP Reduction of CIP water volume and/or temperature
1 CIP Reduction in the number of CIPs
1 CIP Understanding what is clean and more robust commissioning
1 CIP Optimising process plant design to reduce CIP requirements
1 CIP Cleaning of CIP detergent solution with thin membranes
1 CIP Reduce infrastructure heat losses
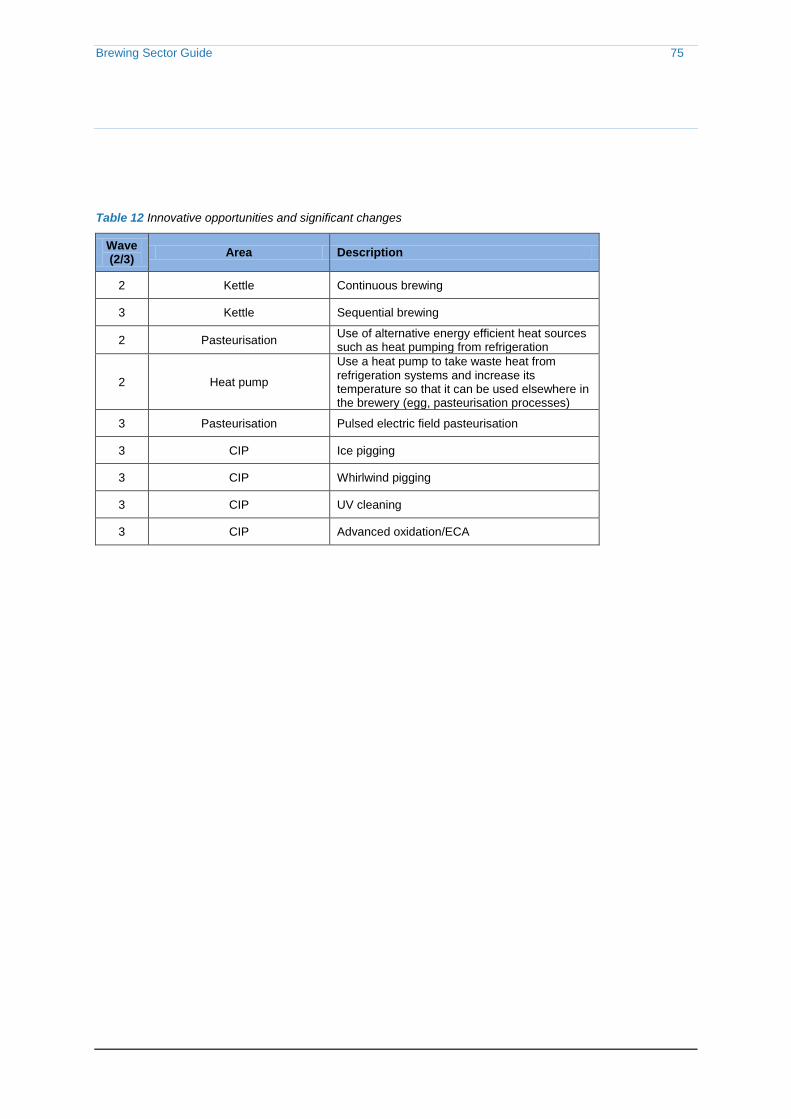
Brewing Sector Guide 75
Table 12 Innovative opportunities and significant changes
Wave (2/3)
Area Description
2 Kettle Continuous brewing
3 Kettle Sequential brewing
2 Pasteurisation Use of alternative energy efficient heat sources such as heat pumping from refrigeration
2 Heat pump
Use a heat pump to take waste heat from refrigeration systems and increase its temperature so that it can be used elsewhere in the brewery (egg, pasteurisation processes)
3 Pasteurisation Pulsed electric field pasteurisation
3 CIP Ice pigging
3 CIP Whirlwind pigging
3 CIP UV cleaning
3 CIP Advanced oxidation/ECA
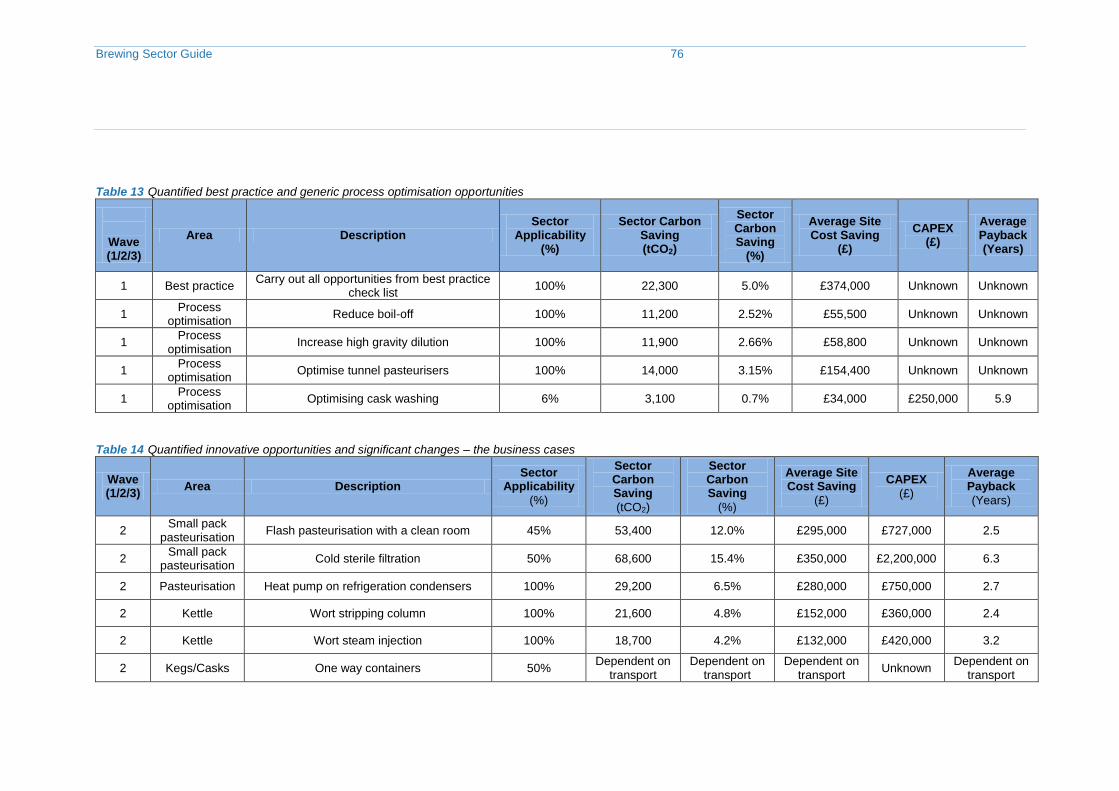
Brewing Sector Guide 76
Table 13 Quantified best practice and generic process optimisation opportunities
Wave (1/2/3)
Area Description Sector
Applicability (%)
Sector Carbon Saving (tCO2)
Sector Carbon Saving
(%)
Average Site Cost Saving
(£)
CAPEX (£)
Average Payback (Years)
1 Best practice Carry out all opportunities from best practice
check list 100% 22,300 5.0% £374,000 Unknown Unknown
1 Process
optimisation Reduce boil-off 100% 11,200 2.52% £55,500 Unknown Unknown
1 Process
optimisation Increase high gravity dilution 100% 11,900 2.66% £58,800 Unknown Unknown
1 Process
optimisation Optimise tunnel pasteurisers 100% 14,000 3.15% £154,400 Unknown Unknown
1 Process
optimisation Optimising cask washing 6% 3,100 0.7% £34,000 £250,000 5.9
Table 14 Quantified innovative opportunities and significant changes – the business cases
Wave (1/2/3)
Area Description Sector
Applicability
(%)
Sector Carbon Saving
(tCO2)
Sector Carbon Saving
(%)
Average Site Cost Saving
(£)
CAPEX
(£)
Average Payback
(Years)
2 Small pack
pasteurisation Flash pasteurisation with a clean room 45% 53,400 12.0% £295,000 £727,000 2.5
2 Small pack
pasteurisation Cold sterile filtration 50% 68,600 15.4% £350,000 £2,200,000 6.3
2 Pasteurisation Heat pump on refrigeration condensers 100% 29,200 6.5% £280,000 £750,000 2.7
2 Kettle Wort stripping column 100% 21,600 4.8% £152,000 £360,000 2.4
2 Kettle Wort steam injection 100% 18,700 4.2% £132,000 £420,000 3.2
2 Kegs/Casks One way containers 50% Dependent on
transport Dependent on
transport Dependent on
transport Unknown
Dependent on transport

Brewing Sector Guide 77
Wave (1/2/3)
Area Description Sector
Applicability
(%)
Sector Carbon Saving
(tCO2)
Sector Carbon Saving
(%)
Average Site Cost Saving
(£)
CAPEX
(£)
Average Payback
(Years)
distance distance distance distance
2 CIP CIP - Real time cleaning verification
(Project ZEAL) 80% 4,600 1.0% £40,500 Unknown Unknown
3 CIP CIP – Novel technologies and low
temperature detergents (including ECA) 80% 7,500 1.7% £66,355 Unknown Unknown
3 Small pack
pasteurisation Ultraviolet pasteurisation for small pack 50% 68,300 15.3% £350,000 £2,270,000 6.5
3 Kegs/Casks Ultraviolet pasteurisation for kegs 44% 13,000 2.9% £127,000 £240,000 1.9

Brewing Sector Guide 78
9 Sector roadmap and next steps for the UK brewery sector
9.1 The step change roadmap
This section describes our recommended next steps for the significant opportunities (larger than 10,000 tonnes
There have been multiple opportunities identified for the brewing sector to reduce energy consumption in each of
the focus process areas. But many of these opportunities represent different ways to save the same energy from
a process, and therefore cannot simply be added together. Examples of this are flash pasteurisation, cold sterile
filtration and UV pasteurisation, only one of which can be implemented at a site. The sequence in which
improvements are made also has an impact; for example, if all brewers move to a position of best practice for
boil-off and HG dilution in the kettle, then this will reduce the impact of other, newer kettle technologies that may
subsequently be introduced.
Figure 47 Three-wave step reduction potential in sector CO2 emissions
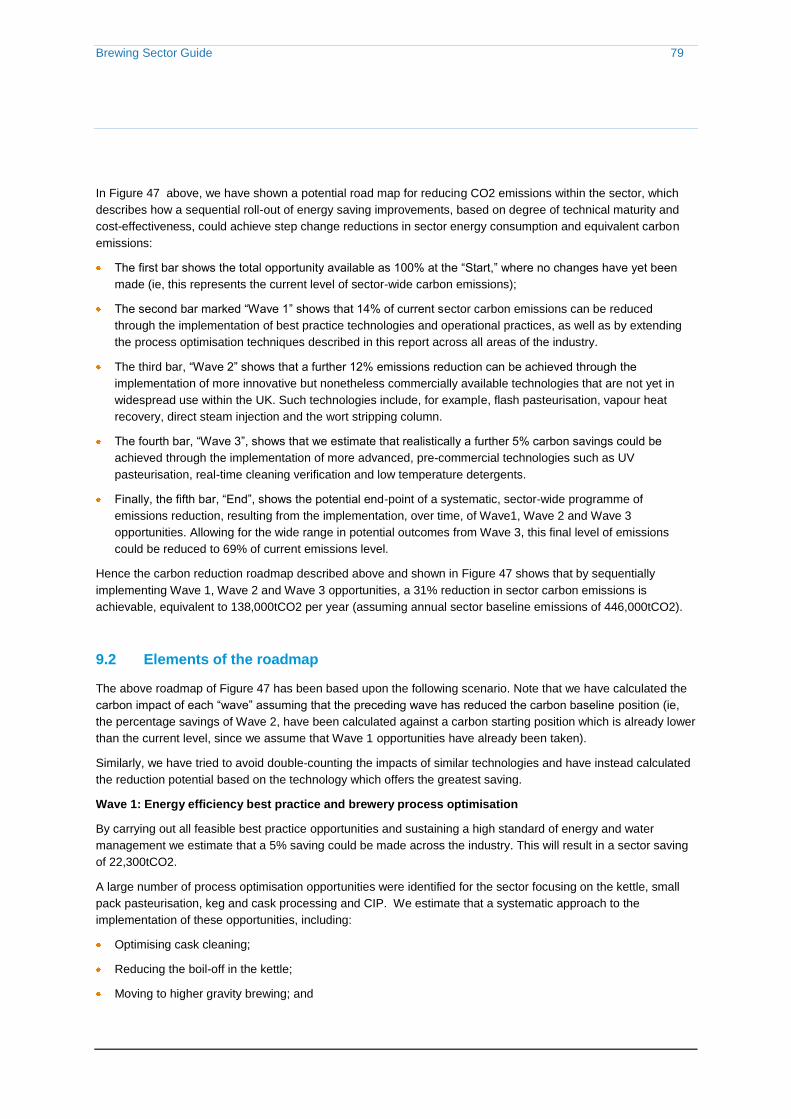
Brewing Sector Guide 79
In Figure 47 above, we have shown a potential road map for reducing CO2 emissions within the sector, which
describes how a sequential roll-out of energy saving improvements, based on degree of technical maturity and
cost-effectiveness, could achieve step change reductions in sector energy consumption and equivalent carbon
emissions:
The first bar shows the total opportunity available as 100% at the “Start,” where no changes have yet been
made (ie, this represents the current level of sector-wide carbon emissions);
The second bar marked “Wave 1” shows that 14% of current sector carbon emissions can be reduced
through the implementation of best practice technologies and operational practices, as well as by extending
the process optimisation techniques described in this report across all areas of the industry.
The third bar, “Wave 2” shows that a further 12% emissions reduction can be achieved through the
implementation of more innovative but nonetheless commercially available technologies that are not yet in
widespread use within the UK. Such technologies include, for example, flash pasteurisation, vapour heat
recovery, direct steam injection and the wort stripping column.
The fourth bar, “Wave 3”, shows that we estimate that realistically a further 5% carbon savings could be
achieved through the implementation of more advanced, pre-commercial technologies such as UV
pasteurisation, real-time cleaning verification and low temperature detergents.
Finally, the fifth bar, “End”, shows the potential end-point of a systematic, sector-wide programme of
emissions reduction, resulting from the implementation, over time, of Wave1, Wave 2 and Wave 3
opportunities. Allowing for the wide range in potential outcomes from Wave 3, this final level of emissions
could be reduced to 69% of current emissions level.
Hence the carbon reduction roadmap described above and shown in Figure 47 shows that by sequentially
implementing Wave 1, Wave 2 and Wave 3 opportunities, a 31% reduction in sector carbon emissions is
achievable, equivalent to 138,000tCO2 per year (assuming annual sector baseline emissions of 446,000tCO2).
9.2 Elements of the roadmap
The above roadmap of Figure 47 has been based upon the following scenario. Note that we have calculated the
carbon impact of each “wave” assuming that the preceding wave has reduced the carbon baseline position (ie,
the percentage savings of Wave 2, have been calculated against a carbon starting position which is already lower
than the current level, since we assume that Wave 1 opportunities have already been taken).
Similarly, we have tried to avoid double-counting the impacts of similar technologies and have instead calculated
the reduction potential based on the technology which offers the greatest saving.
Wave 1: Energy efficiency best practice and brewery process optimisation
By carrying out all feasible best practice opportunities and sustaining a high standard of energy and water
management we estimate that a 5% saving could be made across the industry. This will result in a sector saving
of 22,300tCO2.
A large number of process optimisation opportunities were identified for the sector focusing on the kettle, small
pack pasteurisation, keg and cask processing and CIP. We estimate that a systematic approach to the
implementation of these opportunities, including:
Optimising cask cleaning;
Reducing the boil-off in the kettle;
Moving to higher gravity brewing; and

Brewing Sector Guide 80
Optimising tunnel pasteurisers
will deliver a further estimated savings of 9% or 40,000tCO2 of sector CO2 emissions.
Wave 2: Opportunities on the horizon
A number of opportunities were identified which have the potential to make big step changes; many, such as
vapour heat recovery, flash pasteurisation and cold sterile filtration, are mature technologies elsewhere in the
world but take-up in the UK has been low due to concerns over quality impacts, lack of capital, and payback
periods which, although good in terms of rates of return on investment, are still longer than the two years or so
normally expected by industry. We estimate that engaging in a select number of initiatives including:
Installing either a wort stripping column or wort steam injection apparatus for the kettle, which could result in a
further maximum reduction of 1.2%, equivalent to 5,500tCO2 of sector carbon emissions if implemented
across the industry after Wave 1 opportunities have been implemented (or 4.8% and 21,500tCO2 respectively
if implemented from a current position baseline).
Switch to flash pasteurisation or cold sterile filtration for small pack pasteurisation after implementing
pasteurisation process optimisation. This would result in a maximum sector carbon emission reduction (with
cold sterile filtration) of 12.2%, 54,500tCO2 (or 15.4% and 68,500tCO2 from a current position baseline).
Using a heat pump to recover low grade waste heat from refrigeration compressors, to provide hot water at
up to 80oC to pasteurising and/or CIP processes, is another potentially effective energy and carbon saving
measure. Although viability will depend on pipe lengths, the amount of recoverable condenser waste heat and
other site-specific factors, heat pumps could result in a sector carbon emission reduction of up to 6.5%
against the current emissions baseline (equivalent to 29,200tCO2/yr).
Wave 3: the future
A few game changing technologies have been identified but will require both a time and financial commitment
from the industry to bring them to fruition. We estimate the key areas showing potential are:
Use UV pasteurisation for small pack and keg pasteurisation
Carry out real time cleaning verification through enhanced monitoring of CIP return water and clearer
definitions of “what constitutes clean”
Use low temperature detergents, including ECA (electrochemically activated water).This opportunity is only
worth only 50% as much if done in conjunction with real time cleaning verification, as these reduce the CIP
baseline energy consumption.
As part of the road map the total further potential for these opportunities is shown as 5.0%, equivalent across
the sector to an annual reduction of 22,400tCO2
Not all of the measures covered by the three waves are additional since, as mentioned above, some
technologies are targeted at the same energy saving opportunity (for example, direct steam injection and a wort
stripping column are alternative methods to reduce kettle-related energy consumption, so are not additive).
Similarly, lower cost, easier to implement measures (which should be done first, as part of Wave 1), will reduce
baseline energy consumption and hence the potential impact (in absolute terms) of the more innovative
measures included in Waves 2 and 3.
The road map of Figure 47 takes these factors into account, and shows that by sequentially implementing Wave
1, Wave 2 and Wave 3 opportunities, a 31% reduction in sector carbon emissions is achievable, equivalent to
138,000tCO2 per year (assuming annual sector baseline emissions of 446,000tCO2).

Brewing Sector Guide 81
9.3 Next steps for the UK brewery sector
Awareness within the UK brewing industry of the need for energy and carbon savings is high, and the cost-
focused nature of the sector means it has already taken many steps to reduce energy consumption. But there is
still potential to raise awareness of „what is still possible‟ in terms of best practice and process optimisation, as
well as an opportunity to investigate the implementability of more innovative technologies on a pilot or
demonstration scale. We recommend that the brewing industry takes the following tiered approach to energy and
carbon efficiency improvement.
Implement remaining good practice: More robust implementation of good practice opportunities at all sites
in the sector is recommended. Operational staff should be made more aware of the level of opportunity that
is still available as indicated by the best practice survey, and companies should ensure that this is applied
consistently across all sites.
Optimise existing processes: A number of significant opportunities were highlighted including the remaining
potential for reducing boil-off, increasing high gravity dilution, optimising tunnel pasteurisation and optimising
cask washing machines.
Businesses should focus on making operational staff more aware of the level of opportunity that is still
available as indicated by the process improvement opportunities highlighted.
Engage in demonstration and pilot projects: The opportunities discussed in this report have been costed
where possible for an average brewery producing 2Mhl/year. This „average‟ brewery has a product split of
50:50 between small pack and large pack and has been used to give the sector an appreciation of the
potential savings and the estimated capital cost where available. For any further level of detail these
opportunities need to be worked out on a site by site basis, taking into account the specific set-up of the
brewery, its present energy consumption and the product split.
For Wave 1 and 2 projects that sites may find interesting, individual business cases must be drawn up taking
into account the site specific conditions. This will very quickly indicate whether the opportunity is viable under
the availability of capital for the project.
For the Wave 3 concepts sites should look to either invest in burgeoning technologies themselves in the
interest of gaining the technical edge on their competitors or the risk could be shared equally among several
partners. Projects to test equipment such as UV pasteurisation and low temperature detergents could be
shared by organisations, all equally benefitting from the energy reduction rewards. Many brewing companies
operate small-scale brewing plant for the development and testing of new products; such plant could also be
used to trial new process technologies, and to monitor any impact on product quality, under controlled
conditions. This sort of work could be done in collaboration with technology developers/suppliers.
There is an opportunity here for industry to collaborate with equipment suppliers to prove that some of the
more innovative technologies are technically feasible and have the potential to offer the level of savings
expected. Some require modest investments, while others require substantially more.
Whilst the challenge is often significant for companies to obtain sufficient internal capital to support
investments around energy reduction, collaborating together with other companies and equipment suppliers
may be a way to help share the financial costs. Initial pilot scale tests at research facilities or universities may
offer a lower cost way to gain confidence before deploying on site.
BBPA support: The BBPA should play a pivotal role in pushing forward campaigns that focus on some of the
areas that this study has delved into. It is in a good position to encourage cross-sectoral awareness of best
practice and process optimisation techniques, though the production of case studies and events. Many of the
barriers to implementing best practice and process optimisation are cultural in nature. Industry wide initiatives
lead by the BBPA could help to focus the sector on specific areas of best practice and process optimisation.

Brewing Sector Guide 82
When new technologies are implemented successfully, a case study could be shared throughout the industry.
This would help instil confidence in new technology and speed its integration into the sector. An example of
this would be sharing the experience at Shepherd Neame with their direct wort steam injection system, which
has saved almost 50% of evaporation energy in the kettle.
As capital was highlighted as being one of the main reasons for not being able to move forward with many of
these opportunities the proposed Green Bank could be investigated with the BBPA instigating access to
finance.
The Carbon Trust hopes to continue dialogue with the British Beer and Pub Association, sector companies
and technology providers to develop new opportunities to support the implementation of energy and carbon
saving projects and technologies.

Brewing Sector Guide 83
Appendices
Appendix 1: Metering rationale Appendix 2: Good practice checklist Appendix 3: Kettle technologies and business cases Appendix 4: Small pack technologies and business cases Appendix 5: Keg/cask technologies and business cases Appendix 6: CIP technologies and business cases

Brewing Sector Guide 84
Appendix 1: Metering rationale
Capturing the following variables for each process shown in Table A1.1 will allow a detailed understanding to be
developed and allow the comparison of information collected from the different sites.
Table A1.1 Processes to be metered at each site
Host site Plant to be metered Rationale
–Site A The kettle The selected plant is representative of the more
technically advanced breweries. The amount of current metering allows in depth analysis of the majority of processes at this plant
Small pack pasteurisation There are both tunnel and flash pasteurisers allowing a case study comparison between the two technologies.
Kegging The equipment is largely representative of what is in more energy efficient breweries, with alternative heat sources being used (hot liquor). This set up is also designed for sending kegs abroad and cleaning them to the highest possible standard
Additional metering required
1 x hot water meter to measure the hot liquor going into the kegging plant
–Site B The kettle The selected plant is representative of the more middle stage breweries. The amount of current metering allows in depth analysis of the majority of processes at this plant. The technology of the plant is suitably different to provide a useful comparison against the kettles at other sites within this programme.
Additional metering required
No additional metering required

Brewing Sector Guide 85
Host site Plant to be metered Rationale
Site C Small pack pasteurisation The older tunnel pasteuriser can be used in the
comparison case study against the newer pasteurisers at Magor.
Kegging The equipment is similar to other breweries but with enough subtle difference to make monitoring it useful when determining the difference in demand when compared to the other sites.
Additional metering required
3 x cold water meters: flow and return for cooling tower water to the pasteuriser & water for the bottle rinser
2 x electrical meters for the bottle line: electrical consumption for the pasteuriser and electrical consumption for the rest of the bottling line
Site D Small pack pasteurisation The older tunnel pasteuriser can be used in the comparison case study against the newer pasteurisers at Magor.
Casking The cask cleaning plant is largely representative of many smaller ale brewery systems and is being compared to 4+ other cask washers and new washer.
Additional metering required
Rental of a new cask washer for a one week period
Site E The kettle This is representative of older breweries with limited technical improvements over the basic kettle design. This would provide a useful technical comparison to the more advance kettle at the other breweries in this program
Kegging This kegging plant is representative of another type of heavily cleaned keg process as kegs are all cleaned for foreign export.
Additional metering required
GPRS router for sending back 4 signals from kettle 'piggy backed' meters
Meters for steam, water, electrical and compressed air with signal sent back via GPRS router for kegging plant

Brewing Sector Guide 86
Table A1.2 Variables to be measured on each process
Process Variable Rationale
The kettle At a time interval of 1 minute By recording these variables we will be able to build a model showing the amount of energy needed to produce different variations of boil using different technologies. This data can then be used to quantify the savings associated with alternative methods and technologies as well as their impact on the quality of the beer. As the kettle is the single biggest user of energy on site and most sites have a similar set up any savings made here will provide substantial savings across the sector.
Kettle temperature
Kettle volume
Temperature of wort coming out of Calandria
Heat energy going into the calandria
Energy recovered from vapour heat recovery in stack (where this is installed)
Heat energy going into the wort pre-heater (where this is installed)
Measured per brew
The type of beer being brewed
The gravity of the beer being produced
Small pack pasteurisation
At a time interval of 30 minutes By recording these variables we will be able to build a case study of the different types of pasteurisation available at the moment while also using the information to quantify the savings associated with alternative methods and technologies. Previous experience suggests that there is a heat needed with flash pasteurisation is five times less than that of tunnel pasteurisation and so this could lead to considerable savings if the process is taken up across the sector.
The production of the pasteuriser and bottling process
The type of beer being brewed
Heat going into the pasteuriser
Water being used by the pasteuriser and bottling process
Elect being used by the pasteuriser and bottling process
Kegging At a time interval of 30 minutes This information will allow us to make a comparison study with the amount of heat, water, compressed air and electricity that is being used in the cleaning process for each keg. This information can then be used as an industry benchmarking tool and referenced against the type of equipment found on each metered site. This benchmarking can then be used to quantify the savings associated with alternative methods and technologies. Through understanding the amount of steam used in sterilisation loss bridge of the process can be built, identifying where the highest energy demands are in the process and focussing our investigation on them.
The number of kegs through the keg cleaning process over a period of time
Heat used in the Kegging plant over this period
Water used in the Kegging plant over this period
Electricity used in the Kegging plant over this period
Steam use for final sterilisation (where available)
Casking Metrics measured per cask cleaning cycle This information will allow us to make a comparison study with the amount of heat, water, compressed air and electricity that is being used in the cleaning process for each keg. This information can then be used as an industry benchmarking tool and referenced against the type of equipment found on each metered site. This benchmarking can then be used to quantify the savings associated with alternative methods and technologies while demonstrating which approach uses the least energy and water.
Brewing Sector Guide 87
Appendix 2: Good practice checklist
A2.1 Methodology
The following questions were asked in the good practice survey sent to brewing industry members as part of this
project. The options for response were:
Implemented
Possible
Not possible
No selection
The check list had drop-down boxes where, if the measure had not been implemented, an option could be
chosen as to why not. The options were:
Pay back too long >12 months
Pay back too long >24 months
Pay back too long >36 months
Impact on production downtime
Lack of people skills
Lack of available capital budget
Lack of available revenue budget
Saving not perceived large enough
Saving not perceived large enough
Not relevant to our specific processes / operation
Other – please indicate to the right (in a comment box)
The good practice measures are listed in the following sections.

Brewing Sector Guide 88
A2.2 Good practice measures, by utility area
Compressed air
Sequence compressors to reduce unloaded hours
Use high efficiency jet nozzles in blowing applications
Replacement of outdated pneumatic tools
Connect specific applications of compressed air to separate compressed air facilities. Do not run the entire
compressed air system at high pressure to satisfy one user when a booster could be used
Heat recovery for space heating or hot water
Ensure cold feed air for compressors
Application of small weekend compressor
Install VSD compressors or retrofit VSD on existing compressors
Isolate unused areas e.g. at weekends
Separate compressed-air networks (high/low pressure/quality) to minimise generating costs
Buildings / lighting
Switch lighting to energy saving lamps or LED lighting
Daylight dependable control
Lighting on the workplace evaluation for lighting per m2 of floor space
Presence sensors
High frequent lighting containing fittings with an optical mirror system
Installing several light switching groups
Cooling and refrigeration
Improve part load performance by changing compressor sequencing or retrofitting a VSD
Reduce parasitic loads e.g. unnecessary pumping
Fit VSDs to secondary pumping
Fit VSDs to condenser and evaporator fans
Common compressor suction and discharge piping
Heat recovery from oil coolers
Floating head pressure control on condenser fans
Electronic expansion valves on DX systems
Adiabatic cooling on air cooled condensers
Use alternative heat sinks if available e.g. river or lake
Have large enough pipes to minimise pressure drop
Calculate and reduce your cooling loads e.g. chilling set points (increase by 0.5°C?)

Brewing Sector Guide 89
Reduce condensing temperature
Increase evaporating temperature / secondary coolant temperature
Switch off evaporator fans with compressor
Automatic air bleed
Heat recovery (de-superheat/oil heat recovery)
High efficiency motor or double-speed motor for evaporator fans
Smooth loads to stabilise plant loading
Improving heat release of condenser to reduce scaling and water treatment
Boiler and steam distribution
Sequence boilers to reduce low fire running
To improve burner efficiency use oxygen trim through exhaust gas analysis
Fit VSDs to FD fan and feed pump
Flue gas economiser (preheats boiler feed water)
Measure and increase condensate return
Improve lagging on valves, steam and condensate pipe
RO treat make up water to reduce blowdown
Using closed loop dosing
Use automatic side and bottom blowdown controls
Use of direct firing for hot water generation
Condensate flash steam injection e.g. into CIP detergent tank or high pressure condensate return
Reduce end user steam pressure to reduce flash losses
Increase hot well temperature or use a de-aerator to reduce blowdown (less chemicals required)
Manage instantaneous loads or use a surplussing valve
Blowdown heat recovery
Use fully modulating burner
Vacuum
Switching off pump outside of working hours
Optimising pressure measurement
Frequency control of pumps
Valves at point of use
Waste water treatment

Brewing Sector Guide 90
Intermittent aeration
Connecting aeration to measurement of the oxygen level
Full utilization of biogas
Mechanical sludge dewatering
Decreasing sludge content (amount of sludge per m3)
Anaerobic (pre- or post-) treatment
Process
Recover heat from spent grain
VSD on grain blowers and conveyors
VSD on dust extraction systems
Equipment efficiencies / baseloads
CIP
Use sensors (conductivity) instead of timers for CIP runs
Recover final rinse water for pre-rinse.
Recover heat from hot final rinse
Other
Voltage reduction - fit tap down transformers
Scheduling & Simulation (debottlenecking/buffer reduction)
Use of cogged V-belts instead of standard V-belts to transfer mechanical power
Monitoring and targeting
Have a written energy policy
Have a quantitative improvement target
An assigned carbon/energy manager at site level
Regular on site meetings to review energy use
Regular collection of main meter data
Extensive sub-metering on key processes
Half hourly collection of sub meter data
Regular analysis of consumption patterns (e.g. regression analysis)
Utility mass balances
Cary out regular energy surveys
Energy awareness training for staff

Brewing Sector Guide 91
Technical training for staff
Active reporting systems for energy waste (e.g. steam leaks)
Predicative maintenance procedures on energy consuming plant equipment
Good operation/practice guides
Capital procedure to take account of energy
Capital procedure to take account of carbon savings
Hedged budget for energy saving measures
A2.3 Summary of responses
This section shows the results of the survey (for the 10 sites which responded), by utility area.

Brewing Sector Guide 92
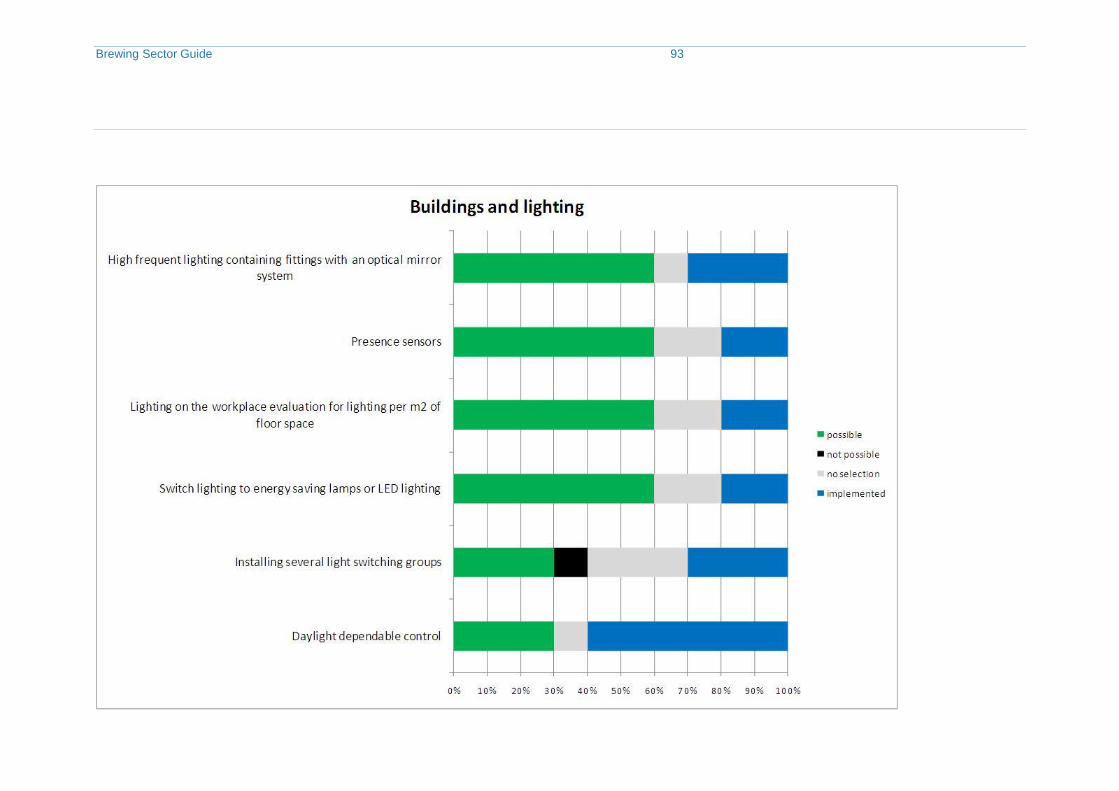
Brewing Sector Guide 93

Brewing Sector Guide 94

Brewing Sector Guide 95

Brewing Sector Guide 96

Brewing Sector Guide 97

Brewing Sector Guide 98

Brewing Sector Guide 99
Appendix 3: Kettle technologies and business cases
A3.1 Wort Stripping column
The concept involves applying alternative wort boiling technology that offers major energy savings while
producing very high quality wort, and so improving final beer quality. The technology also assures an efficient and
flexible elimination of unwanted volatile compounds in the wort (such as DMS – dimethyl sulfides).
The device is placed "in line" between the wort cooler and the settling tank and sends the wort through a packed
bed, with steam sent up through the bed in the opposite direction. This packed bed increases the surface area of
the wort, while subjecting the liquid to high temperature steam, ensuring that volatiles can be removed effectively.

Brewing Sector Guide 100
Where is the technology currently used?
The technology is currently used in seven breweries around the world, noticeably several large international
breweries with the following size throughput. 10, 200, 200, 400, 450, 600, 1,000 hl/hour systems.
What is the advantage over the current best practice?
With a maximum evaporation rate of 2% the amount of energy used in the wort boiling process is dramatically
reduced, especially for the breweries that currently operate at higher boil-off.
Figure A3.2 Illustration of where a stripping column would sit in the wort processing line
Are there any limitations to the technology?
The steam used for this system must be free from all contaminants and be fit for mixing with the wort.
What is the development stage of the technology?
This technology is a fully commercial product that is provided by a well-respected international process
equipment manufacturer, offering comprehensive after sales care and support.
Barriers to overcome
The main obstacle to overcome is a culture change within brewers to allow the beer to be brewed in a deferent
method to what has been a historically stable process for hundreds of years.
Who are the technology providers?
Meura, Boccard Enterprises, Belgium

Brewing Sector Guide 101
Business case: wort stripping
Wort stripping column
Carbon Emissions
Original process intensity 2.50 - 6.63 kWh thermal energy / hl
0.67 1.78 kgCO2/hl
New process intensity 2.05 - 3.53 kWh thermal energy / hl
0.55 0.95 kgCO2/hl
Specific energy saved 0.45 3.10 kWh thermal energy / hl
Carbon intensity saved 0.12 - 0.83 kgCO2/hl
Sector applicability 100%
% high and low 50.0% 50.0%
Sector carbon dioxide saving (absolute)
5,488 - 37,506 tCO2 per annum
Sector % carbon dioxide saving 1.2% - 8.4% per annum
Site Financials
Site Capex (2,000,000 hl/yr site) £360 £360 £k
Cost Saving £39 - £265 £k per annum
Payback 9.3 - 1.4 years
Lifetime Savings
Lifetime Carbon Cost 1,475.8 - 215.9 £/tCO2
Technology Life (persistence) 15 15 years
Lifetime Carbon Cost per year 98.4 - 14.4 £/tCO2/year

Brewing Sector Guide 102
A3.2 Wort steam injection
The technology is a specifically designed steam injection system that produces very effective mixing through promoting a supersonic shock wave in the mixing zone. This wort is atomised and the mixture of high surface area and the high temperature of the steam allow for elevated removal of volatiles and unwanted flavours from the beer. Through removing these compounds faster the total amount of energy needed in the boil is reduced. This technology can be retrofitted to existing wort coppers and takes the place of heat exchanger based calandrias. Where is the technology currently used?
The technology has been successfully installed at Shepard Neame brewery and has been producing beer to previously high standards for several years. What is the advantage over the current best practice?
Up to 50% energy reduction in evaporation energy for boil-off compared to using calandria based technology.
Parameters such as unwanted volatiles and hop isomerisation can be easily controlled.
No burn-on of material as there is no heat exchange surface – improvement of quality and reduction in CIP
times and energy.
Faster wort stabilisation times resulting from a more effective heat exchange medium.
Capacity for increasing capacity without further capital expenditure
Figure A3.3 Wort steam injection system provided by PDX Are there any limitations to the technology?
The steam used for this system must be free from all contaminants and be fit for mixing with the wort.

Brewing Sector Guide 103
What is the development stage of the technology?
This is a fully commercial product that is offered by an international R & D organisation that offer comprehensive after sales care and support in the UK Barriers to overcome
The main obstacle to overcome is a culture change within brewers to allow the beer to be brewed with a different method to what has been a historically stable process for hundreds of years. Business case
Wort steam injection
Carbon Emissions
Original process intensity 2.50 - 6.63 kWht/hl
0.67 1.78 kgCO2/hl
New process intensity 2.22 - 3.81 kWht/hl
0.60 1.02 kgCO2/hl
Specific energy saved 0.28 2.82 kWh/hl
Carbon intensity saved 0 - 1 kgCO2/hl
Sector applicability 100% %
% high and low 50.0% 50.0%
Sector carbon dioxide saving (absolute) 3,382 - 34,096 tCO2 per annum
Sector % carbon dioxide saving 0.8% - 7.6% % per annum
Site Financials
Site Capex (2,000,000 hl/yr site) £420 £420 £k
Cost Saving £24 - £240 £k per annum
Payback 17.6 - 1.7 years
Lifetime Savings
Lifetime Carbon Cost 2,794.4 - 277.2 £/tCO2
Technology Life (persistence) 15 15 years
Lifetime Carbon Cost per year 186.3 - 18.5 £/tCO2/year
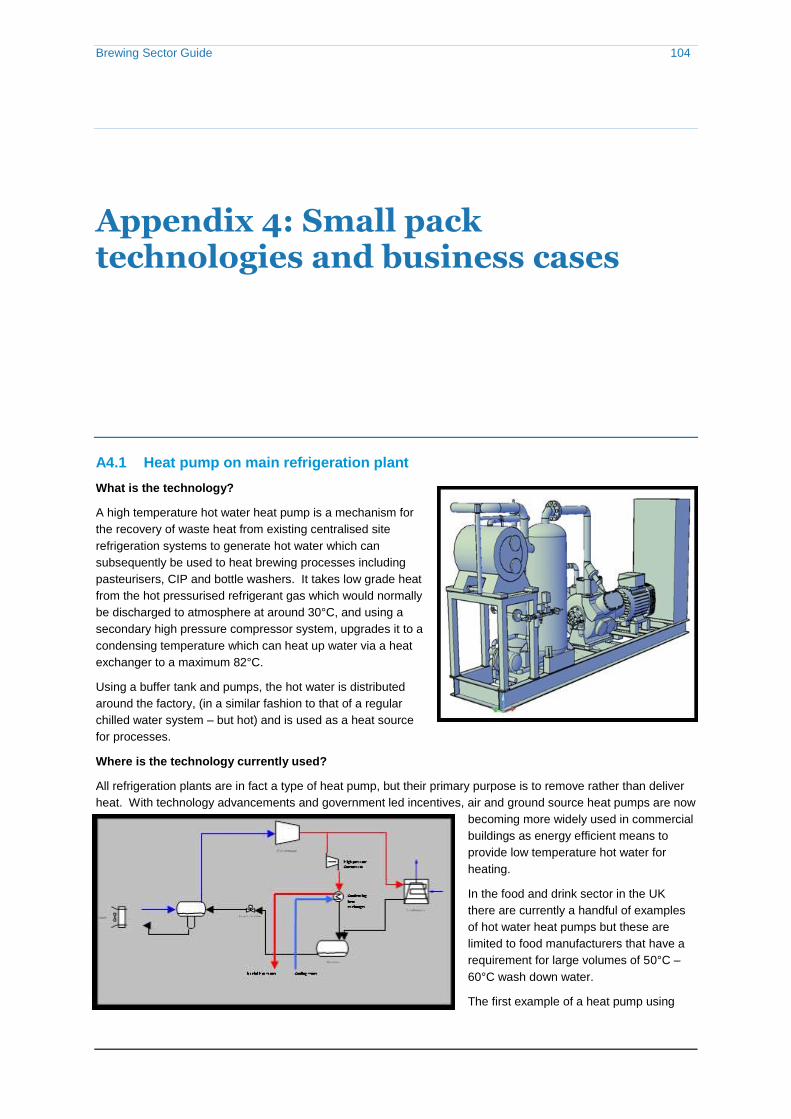
Brewing Sector Guide 104
Appendix 4: Small pack technologies and business cases
A4.1 Heat pump on main refrigeration plant
What is the technology?
A high temperature hot water heat pump is a mechanism for
the recovery of waste heat from existing centralised site
refrigeration systems to generate hot water which can
subsequently be used to heat brewing processes including
pasteurisers, CIP and bottle washers. It takes low grade heat
from the hot pressurised refrigerant gas which would normally
be discharged to atmosphere at around 30°C, and using a
secondary high pressure compressor system, upgrades it to a
condensing temperature which can heat up water via a heat
exchanger to a maximum 82°C.
Using a buffer tank and pumps, the hot water is distributed
around the factory, (in a similar fashion to that of a regular
chilled water system – but hot) and is used as a heat source
for processes.
Where is the technology currently used?
All refrigeration plants are in fact a type of heat pump, but their primary purpose is to remove rather than deliver
heat. With technology advancements and government led incentives, air and ground source heat pumps are now
becoming more widely used in commercial
buildings as energy efficient means to
provide low temperature hot water for
heating.
In the food and drink sector in the UK
there are currently a handful of examples
of hot water heat pumps but these are
limited to food manufacturers that have a
requirement for large volumes of 50°C –
60°C wash down water.
The first example of a heat pump using

Brewing Sector Guide 105
refrigeration condenser hear as a low temperature source in a dairy, is currently being installed in the North West
of England. We are not aware of any brewery examples.
What is the advantage over current practice?
Currently steam raised by firing a boiler is normally used as a heating medium in breweries and has an efficiency
of 60% - 80% for useful output. A heat pump producing 80°C water has a COP of around 5; or in other words, an
efficiency of around 500% heat output to electrical energy in.
When the relative costs of fuel and electricity are taken into account, as well as the different carbon intensities of
the different energy sources, a significant saving in carbon emissions and costs is made over existing technology.
Are there any limitations?
If the generation of process waste heat and the requirement for heat are not synchronised, this could cause heat
storage issues at the factory. A hot water heat pump is limited to generating water temperatures of just over
80°C, whereas temperatures far in excess of 100°C can be achieved using a conventional steam system,
therefore flexibility is lower. However 80°C should be sufficient for thermal pasteurisation processes.
The higher the temperature of heat required, the lower the efficiency of the heat pump become, therefore water
temperature has a direct impact on project economics.
What is the development stage?
To be considered useful for pasteurisation and CIP in a brewery, heat sources need to be in the region of 80-
85°C. Until recently limitations in fridge plant technology have meant that the maximum temperature achievable
using a heat pump was 65-70°C and at a low coefficient of performance (COP) or efficiency.
New design and technology developments have meant that a fully commercialised skid mounted capable of
generating 82°C water is available. The first example of a dairy application of this technology is currently being
installed in the North West of England and undergoing commissioning. We are unaware of a brewery application.
Barriers to overcome
A lack of industry case studies and technology acceptance could be barriers to take up of heat pump systems.
Maintaining existing systems in tandem till the capability of new heat pump system is proved could be a solution
for this. If the first UK dairy implementation later this year proves successful there will also be tangible results to
be assessed and many of these concerns may be overcome.
Effective integration to existing process heating systems may also be complex as the application of a heat pump
affects numerous systems including processing, steam and refrigeration. The distance between refrigeration
condensers and pasteuriser units may prove a barrier: if too long, the cost of insulated pipework could render the
project financially unviable.
Who are the technology providers?
GEA Grenco: a refrigeration plant manufacturer who produce a skid-mounted high temperature heat pump
Star Refrigeration: a UK based industrial refrigeration engineering company.

Brewing Sector Guide 106
Business case
The example below assumes that a heat pump system recovering low grade heat from refrigeration condensers
can substitute between 30% and 50% of the total thermal energy needed for a site‟s small-pack pasteurisation
processes.
Heat pump on refrigeration condenser
Carbon Emissions Notes
Original process intensity 11.79 - 11.79 kWh/hl Relating to pasteurisation process
3.33
3.33 kgCO2/hl
New process intensity 8.25 - 5.90 kWh/hl
2.33
1.66 kgCO2/hl
Specific energy saved 3.54
5.90 kWh/hl
Carbon intensity saved 1.00 - 1.66 kgCO2/hl
Sector applicability 30% - 60% Applicable to small pack; site layout also affects viability
Sector carbon dioxide saving (absolute) 13,470
44,900 tCO2/year
Sector % carbon dioxide saving 3.0% - 10.1% %
Site Financials
Site capex (2Mhl/yr site) £600
£900 £k
Cost Saving £210 - £350 £k/year
Payback 1.7 - 4.3 years
Lifetime Savings
Lifetime Carbon Cost 180 - 900 £/tCO2
Technology Life (persistence) 10
15 years
Lifetime Carbon Cost per year 12 - 90 £/tCO2

Brewing Sector Guide 107
A4.2 Cold sterile filtration
What is the technology?
Beer sterile filtration processes play a key role in many of the final
stages of modern brewing. Many breweries now choose sterile filtration
as an alternative to pasteurization, because this makes it possible to
remove undesirable microorganisms before the beer is filled into bottles
or kegs. The process involves sending the beer through a very fine mesh
of filters which trap all the unwanted products and allow the beer to pass
through. The filter is sporadically regenerated through applying a flow in
reverse to dislodge the trapped material and return the filter to its
previous condition.
Where is the technology currently used?
This technology is currently used for brewing in locations all over the
world. The largest take up has been in East Asia where several famous brands are produced using this
techniques (e.g., Singha).
What is the advantage over the current best practice?
Reduced specific energy consumption.
Improved quality of beer with no heat treatment
Total elimination of kieselguhr
No waste disposal
No intrusion of heavy metals
Fully automated process
Monitoring of the system for controlling the microbiological count in the filtered beer
Highest hygiene standard
Low energy consumption
Low water consumption
Reduced beer losses
Continuous filtration possible
Easy product changes

Brewing Sector Guide 108
Are there any limitations to the technology?
The filtration pore sizes need to be carefully managed so that the
protein that is responsible for forming the head on a beer is able
to pass through the filtration process while maintaining a barrier
against any spoiling organisms.
What is the development stage of the technology?
This technology is a fully commercial product that is provided by
some of the largest process equipment manufacturers in the
world, offering comprehensive after sales care and support.
Barriers to overcome
Identifying the energy savings in comparison to other systems so that a clear business case can be made. The
relative lack of this technology within the UK means that culture and confidence are lacking in the UK brewery
sector and so demonstrations of this technology are needed to instil this confidence.
Who are the technology providers?
Alfa Laval, Milipore, PALL SeitzSchenk

Brewing Sector Guide 109
Business Case
Cold Sterile Filtration
Carbon Emissions Notes
Original process intensity 2.11 - 11.79 kWht/hl
0.69 3.33 kgCO2/hl
New process intensity 0.028 - 0.028 kWhe/hl 0.0150 0.0150 kgCO2/hl
Specific energy saved 2.08 11.76 kWh/hl
Carbon intensity saved 0.672 - 3.311 kgCO2/hl
Sector applicability 50% Only for small pack pasteurisation
% high and low 10.0% 90.0%
See flash pasteurisation
Sector carbon dioxide saving (absolute)
15,116 74,502 tCO2 per annum
Sector % carbon dioxide saving
3.4% - 16.7% % per annum
Site Financials
Site capex (2Mhl/yr site) £180 £2,200 £k
Full cost figures from Alfa Laval have not been provided (estimated at £600,000 for the new filler plus half of flash)
Cost saving £128 - £374 £k per annum
This takes into account the electrical, cooling and heating costs. This is only for 1,000,000hl a year as this is large pack only
Payback 1.4 - 5.9 years
Lifetime Savings
Lifetime Carbon Cost 134 - 333 £/tCO2
Technology Life (persistence) 15 - 15 years
Lifetime Carbon Cost per year 9 - 22 £/tCO2/year

Brewing Sector Guide 110
A4.3 UV pasteurisation technology
What is the technology?
Non-thermal processes, such as ultraviolet (UV) light
technology, have the potential to cut demand for energy
currently used for thermal pasteurisation. While some
countries have explored these technologies, there have
been no commercial demonstrations of UV beer
processing in the UK.
UV pasteurisation is a process where milk is subjected
to a certain wave length of light that is just the right
frequency to interact with DNA and stop its ability to
replicate.
Where is the product currently used?
The technology has been successfully trialled and is used on milk for calves in South Africa. In the UK there are
currently trials to extend the shelf life of milk through post-pasteurising UV treatment of milk where it has been
shown abroad (USA) to increase shelf life by up to 30%.
The technology is currently used in the photo-purification of wine, fruit juices and is also used in large scale water
treatment facilities as a last stage sterilisation process.
What is the advantage over the current best practice?
The energy needed to disable bacteria with UV light is
dramatically lower than that of thermal pasteurisation. By using
UV light the energy is focused in breaking down the DNA of the
bacteria, rendering it ineffective, whereas in the heat based
method the whole of the product is heated in order to break
down the entire structure of the bacteria.
Used in conjunction with thermal pasteurisation the shelf life of
beer can be increased without any associated taste
degradation.
Are there any limitations to the technology?
The dosage needed to treat beer depends on its absorptivity and transmissivity. These characteristics change
with different beers so there will need to be a control system that can cater for changing the exposure with
specific recipes.
What is the development stage of the technology?
The UV photo-purification process is well understood and the effects on microbial levels within different products
have been researched and compared with heat based pasteurisation. Large scale equipment has been
manufactured for other industries and incorporated into factories.

Brewing Sector Guide 111
The modification to plants in order to replace heat based pasteurisation would not be extensive as the only
consumable needed is electricity and no further pipe work would be necessary.
Barriers to overcome
The largest barrier will be in producing robust validation trials that would give the industry confidence that this
technology can provide the shelf life extension necessary and reduce spoiling effectively to a similar level to
thermal pasteurisation.
Cost - HIGH
Who are the technology providers?
SurePure – A global leader in turbid liquid photo purification
MicroTek – A global leader in microwave induced UV light tubes.
Steribeam – A German based company that offers pulsed light, cold plasma and UV sterilization
Business case:
Ultraviolet Pasteurisation for small pack
Carbon Emissions Notes
Original process intensity 2.11 - 11.79 kWht/hl
0.69 3.33 kgCO2/hl
New process intensity 0.05 - 0.05 kWhe/hl UV power +pumping
0.028 0.028 kgCO2/hl
Specific energy saved 2.06 11.74 kWh/hl
Carbon intensity saved 0.659 - 3.299 kgCO2/hl
Sector applicability 50.00% Just for cans and bottles
% high and low 10.0% 90.0% see flash pasteurisation
Sector carbon dioxide saving (absolute)
14,831 74,218 tCO2 per annum
Sector % carbon dioxide saving 3.3% - 16.6% % per annum
Site Financials
Site Capex (2,000,000 hl/yr site) £240 £2,270 £k
Price is estimated through discussions with Microtek and uses the tunnel to flash capex when going from tunnel
Cost Saving £127 - £372 £k per annum
This takes into account the electrical, cooling and heating costs. This is only for 1,000,000hl a year as this is small pack only
Payback 1.9 - 6.1 years
Lifetime Savings
Lifetime Carbon Cost 182 - 344 £/tCO2
Technology Life (persistence) 15 years
Lifetime Carbon Cost per year 12 - 23 £/tCO2/year

Brewing Sector Guide 112
Appendix 5: Keg/cask technologies and business cases
A5.1 One-way keg packaging
What is the technology?
A high temperature hot water heat pump is a mechanism for the
recovery of waste heat from existing centralised site
The concept is for kegged beer to be sent in one-way packaging
in place of steel and aluminium kegs as is currently practiced
with the majority of the UK pub market.
The packaging involves a pressurised PET ball that houses a
flexible inner bag. This systems allows the traditional system of
using gas at pressure to force the beer out of a keg and up
through the lines. The entire package is inserted into cardboard
outer packaging.
Where is the technology currently used?
The technology is currently manufactured in Holland and has seen take up in Europe, including the UK
What is the advantage over the current best practice?
Reduction of costs and capital investment:
25% more beer per transport and no return shipments
Extra capacity during peak periods; no expensive extra keg pool
No loss or damage of steel kegs
Cleaning and administration costs are no longer necessary (laid out above)
No storage of empty kegs
Cheaper containers

Brewing Sector Guide 113
New marketing opportunities:
The secondary packaging can be very visibly branded
The one-way keg offers opportunities for the party- and low-volume segments
Some long-distance markets become viable again
Extra advantages to end users: 10 minutes after transport its ready to dispense and a more constant quality
beer
Enhanced quality:
Lightweight: incl. beer 21.5 kg (meets the lifting requirements of the EU)
Fresh beer for one month after connecting
Shelf time of at least 9 months
Most of the technology can be recycled
For products travelling over 90 km (180km round trip) these new packaging products can have a small CO2
footprint than their metal counterparts.
Are there any limitations to the technology?
The main sticking point for these newer returnable kegs are that there are several different designs out on the
market at present, all with different shapes and filling valves. This disparity across the market is stifling industrial
take-up and progress towards a unified standard needs to take place before the industry can compete effectively
with metal containers.
The strength of the product is not as high as with metallic kegs. The kegs are for one use only and so an effective
recycling procedure needs to be in place to ensure that the is dealt with effectively.
What is the development stage of the technology?
This technology is a fully commercial product that is provided by a manufacturer that offers comprehensive after
sales care and support.
Barriers to overcome
Specific studies on a brewery by brewery basis need to be done to ascertain the savings available, depending
on the average distance that beer travels from each site.
A culture change in necessary for landlords to have faith in this type of packaging.
A recycling system must be put in place for this system to make sure that the associated waste is disposed or
re-used in an environmentally sound manner. Without this the, argument for one way containers fall down.
Who are the technology providers?
KeyKeg
CypherCo

Brewing Sector Guide 114
Costs:
20 litre: ~£8.40
30 litre: ~£10
Comparison to returnable kegs
Processing a metallic keg has been shown to cost close to £0.62/hl (excluding compressed air). For the 30l
variety of one way keg this will work out as £0.19.

Brewing Sector Guide 115
Appendix 6: CIP technologies and business cases
A6.1 Real time cleaning verification
What is the technology?
A previous EU-funded research project with Birmingham
University called „ZEAL‟ covering real time cleaning
verification has estimated savings at a 50% energy
reduction, while reducing CIP times, chemical and water
use.
It is unknown to what extent the sector applies to this 50%
reduction in general workshop participants were unaware of
the savings of this opportunity we will estimate that 80% of
sites could achieve this reduction.
What is the technology?
Real time cleaning verification is a concept where a CIP
system can be finely tuned so the amount of cleaning necessary is not exceeded. This is accomplished through a
thorough understanding of what the term „clean‟ encompasses for each site and then monitoring the contents of
the cleaning fluid until it matches with the previously defined criteria.
Where is the technology currently used?
This concept is currently a research project at Birmingham University in collaboration with worldwide
manufacturers.
What is the advantage over current practice?
At present CIP systems are set to run for timed amounts or volumes, or react to the conductivity of the flow. None
of these systems uses a closed loop control that actually reacts to the amount of material that has been removed
during the cleaning process or how much remains.

Brewing Sector Guide 116
Are there any limitations to the technology?
Designing a system that can guarantee the internal
composition of a pipe system is virtually impossible. So,
with a finely tuned system comes an element of risk that
some areas that are not measured would still be unclean
after the cleaning process. This would need further
detailed trials in a variety of environments to ascertain
limitations and appropriate fail safes to be developed.
What is the development?
University collaborative research project.
Barriers to overcome?
If the results from the project are a success then this technology can be trialled at a volunteer site and compared
against an established CIP system. The biggest barrier to overcome will be to prove robust, consistent, failsafe
performance.
Who are the technology providers?
The University of Birmingham: they are working on a project to define what „clean‟ is in the food and drink
processing industry. They have been working with Cadbury and others on an EU-funded project called ZEAL and
have managed to improve their CIP systems to great effect. They are currently looking for future partners to take
on the next ZEAL 2 and would be keen to work with a brewing industry partner to understand their CIP system
and optimise it at the same time.

Brewing Sector Guide 117
Business case
The predicted values are: reduction in cleaning time up to 70% and in water consumption up to 40% (depending
on factory and process line considered). - Birmingham University quote.
CIP - Real time cleaning, verification and validation - ZEAL
Carbon Emissions
Original process intensity 0.95 - 0.95 kWh/hl
0.26 0.26 kgCO2/hl
New process intensity 0.47 - 0.47 kWh/hl
0.13 0.13 kgCO2/hl
Specific energy saved 0.47 0.47 kWh/hl
Carbon intensity saved 0.13 - 0.13 kgCO2/hl
Sector applicability 80% %
% high and low 50.0% 50.0% %
Sector carbon dioxide saving (absolute)
4,590 - 4,590 tCO2 per annum
Sector % carbon dioxide saving 1.0% - 1.0% % per annum
Site Financials
Site Capex (2,000,000 hl/yr site) Unknown Unknown £k
Cost Saving £40 - £40 £k per annum
Payback - years

Brewing Sector Guide 118
A6.2 Low temperature detergents
What is the technology?
Low temperature detergents that operate at lower
temperatures than current caustic solutions offer
significant savings as a large proportion of the energy
involved is used for heating up the infrastructure.
Normally a CIP system works at a temperature of 70 -
80ºC. If at 80ºC then a using a solution that can work at
40ºC will reduce the site CIP heat demand by 38% and
if it can be reduced to 25ºC the heat reduction will be
82%. These low temperature CIP systems have been
trialled in the UK brewing sector but are not wide spread
and so we will model the applicability of these opportunities at 80%.
One type of such CIP technology is ECA or electro chemically activated detergent that produces an anolyte and
cathalyte out of a sodium chloride (salt) solution or other compounds such as sodium carbonate. The anolyte is a
steriliser that removes bio-film and biological compounds and the catholyte solution has many of the properties of
a detergent.
Running the 25ºC system on a 2Mhl site will save £66,000 a year and reduce the UK brewery sector emission by
1.7%
Where is the technology currently used?
This technology has already been adopted in several breweries in the UK and overseas.
What is the advantage over current practice?
Through reducing the temperature at which the CIP solution can operate the amount of heat energy needed to
bring the brewery infrastructure up to temperature reduces. Moving to 25ºC will reduce the heat energy needed
for CIP by 82%. Other advantages include:
Shorter CIP cycle times as the time needed to heat up the system is no longer needed
Less energy consumption in terms of heat
Less water usage
Are there any limitations to the technology?
This technology needs to have dosing points installed at regular intervals along the lines and tanks to which it is
being applied.
This technology is only capable of removing biological compounds and not mineral deposits. Acid will still be
required to remove any scale or burn on material. This can be an issue for chlorine based solutions as contact
with acid and the anolyte can cause chlorine gas to form. This issue has been solved through using alternative
solutions rather than sodium chloride.
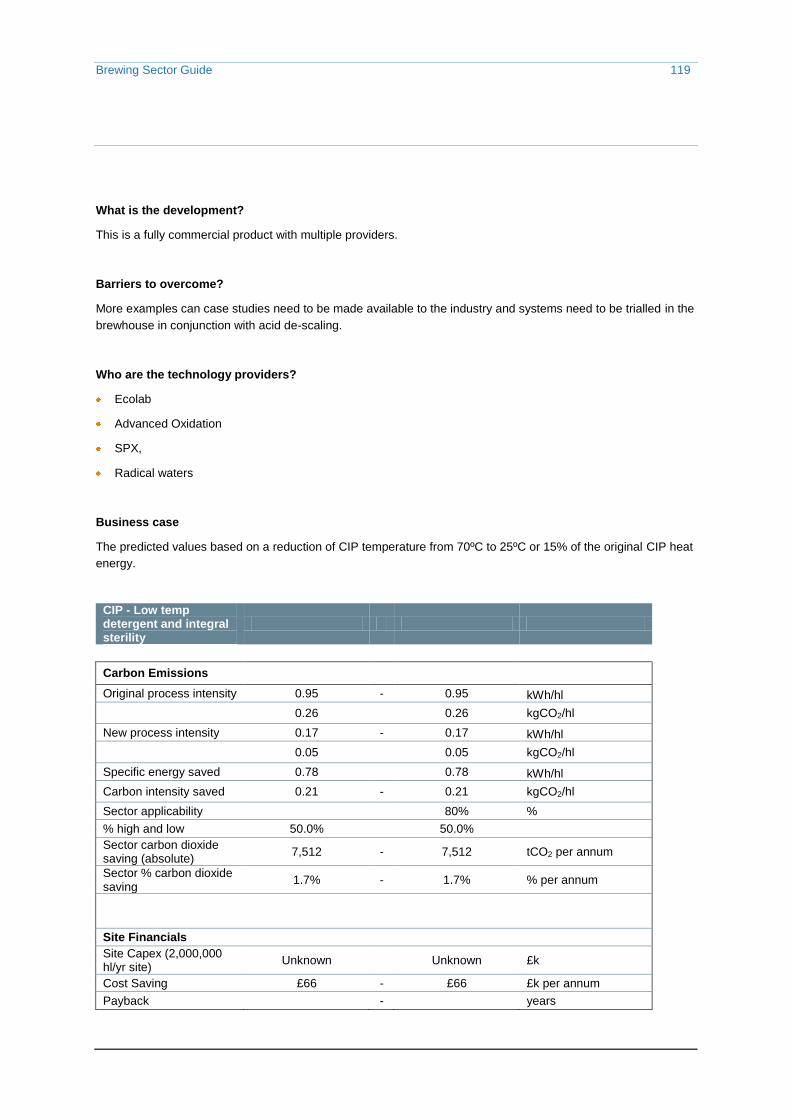
Brewing Sector Guide 119
What is the development?
This is a fully commercial product with multiple providers.
Barriers to overcome?
More examples can case studies need to be made available to the industry and systems need to be trialled in the
brewhouse in conjunction with acid de-scaling.
Who are the technology providers?
Ecolab
Advanced Oxidation
SPX,
Radical waters
Business case
The predicted values based on a reduction of CIP temperature from 70ºC to 25ºC or 15% of the original CIP heat
energy.
CIP - Low temp detergent and integral sterility
Carbon Emissions
Original process intensity 0.95 - 0.95 kWh/hl
0.26 0.26 kgCO2/hl
New process intensity 0.17 - 0.17 kWh/hl
0.05 0.05 kgCO2/hl
Specific energy saved 0.78 0.78 kWh/hl
Carbon intensity saved 0.21 - 0.21 kgCO2/hl
Sector applicability 80% %
% high and low 50.0% 50.0%
Sector carbon dioxide saving (absolute)
7,512 - 7,512 tCO2 per annum
Sector % carbon dioxide saving
1.7% - 1.7% % per annum
Site Financials
Site Capex (2,000,000 hl/yr site)
Unknown Unknown £k
Cost Saving £66 - £66 £k per annum
Payback - years

Brewing Sector Guide 120
A6.3 Ultrasonic cleaning
What is the technology?
Ultrasound has historically been used for to
clean difficult to reach areas, or internal
surfaces of components that would be difficult to
reach. Components are placed in baths of
cleaning solutions and then sonotrodes agitate
the solution at an ultrasonic frequency which
creates cavitation on the surface of the
components, dislodging dirt and other
contaminants. Cavitation is when the fluid
pressure drops below the vapour point of the
liquid and a bubble of gas is formed. This
bubble then collapses and forces a high
pressure jet onto the surface which aids in dislodging material.
The concept of using ultrasonics in the brewing industry is that this technology can be applied to pipework, tanks
and solid metal objects, dislodging material from the inner surfaces and reducing the loads on CIP. By attaching
ultrasonic actuators to either sections of pipework, solid metal components, or putting inside tanks a low
ultrasonic source would stop the build-up of material adhering to the inner surfaces.
This is not a substitute for standard CIP but a system that would work in tandem with it, reducing the load of the
primary method.
Where is the technology currently used?
Ultrasonics is used in a number of industries. The use for ultrasonic transducers to be attached to pipes and
metal work for internal cleaning is still a relatively new concept most work has been carried out at the
experimentation level only. Attaching actuators to tube in shell heat exchangers has been shown to reduce the
fouling within the chemical industry but has not yet been tested in the food and drinks sector within the UK.
An alternative approach is using tube actuators that resonate inside tanks and silos and reduce the fouling build
up on the walls, further reducing the CIP loading.
What is the advantage over current practice?
Currently the only way in which pipe work and heat
exchangers are cleaned in the brewing industry is
through CIP. This involves pumping large amounts of hot
caustic and acid solutions around the system to break up
and dislodge any material that has adhered to the inner
surfaces. The demand of these CIP runs is determined
through the most difficult areas to clean, which usually
have a complex topology where a low flow rate zone
would result in a build-up of solids. If the amount of solid
deposits in these „problem spots‟ could be reduced then
the amount of water and energy used for CIP could be
reduced.

Brewing Sector Guide 121
There is also a potential that ultrasonics could be used during
production to reduce the rate of fouling and therefore reduce the
required frequency of CIP.
Ultrasonic cavitation not only dislodges material from solid surfaces
but also kills bacteria and other microbes that are present on these
surfaces, through the shock wave that is caused as the bubble
collapses (there is no damage to solid surfaces) .
Are there any limitations?
The ultrasonic transducers that clamp onto the outside of pipework
and heat exchangers work best when the subject they are connected
to is one solid body with minimal internal damping. Plate pack heat
exchangers would not work well as they contain numerous rubber
gaskets between the metallic plates that would damp out the ultrasonic vibration. The ideal heat exchangers
would be the shell and tube type. However reduced heat transfer rates would be sacrificed for lower cleaning
energy and water use. There are several other disadvantages from using a shell and tube exchanger that would
only make this a possibility if the saving from CIP were deemed sufficient. The size of the exchanger would have
to increase as would the space around it due the way that they are opened and extended to double their length.
There would also be issues around the classification of shell and tube exchangers as pressure vessels which
may lead to increased regulatory problems under the pressure system regulations.
If this system was used in conjunction with UV pasteurisation then the UV tubes could be cleaned using this
system as they are comprised of solid state materials.
What is the development stage?
The technology is fully developed and available as a commercial product, but as of yet is new to the brewing
industry and therefore new to the specific contaminants that need to be dislodged. This type of technology would
involve bespoke design for each plant and so individual analysis of each pipe system would be necessary.
For cleaning tanks new technology has just become available in the shape of long round bars that resonate in all
directions. These would be placed inside tanks and would keep the inner surfaces clean and bacteria free with
occasional pulses of ultrasound. This is a new commercial product.
Barriers to overcome
Experimentation would have to be done to determine the transducers needed to act as an effective anti-fouling
method. The sector would have to change their primary heat exchangers to a solid state variety. If this was not
practical then the technology would be limited to pipework and other solid body sections of the brewing system.
Trials would then have to take place in which the amount of liquid and energy (heat) used would be reduced in
parallel with introducing a clamp on ultrasonic system and determining if the finished clean was similar enough to
pass standards.
Who are the technology providers?
MPI Interconsulting: Offers products, R&D services and consultancy in high power ultrasonics, a range of
top quality ultrasonic cleaning and sonochemistry equipment and special equipment development for new
applications.

Brewing Sector Guide 122
Bio Sonics: A new company that specialises in ultrasonic components for the cleaning of tanks and other
components.
Business case
(Only for transducers for attaching to heat exchangers)
CAPEX
Equipment: €15,000 per heat exchanger
Installation (10% estimates): €1,500
OPEX per year
40W: £25 per heat exchanger per year
The savings for cleaning certain areas alone are not fully understood and so further research needs to be done
when the products are more commercially available and have been proved in other industries.
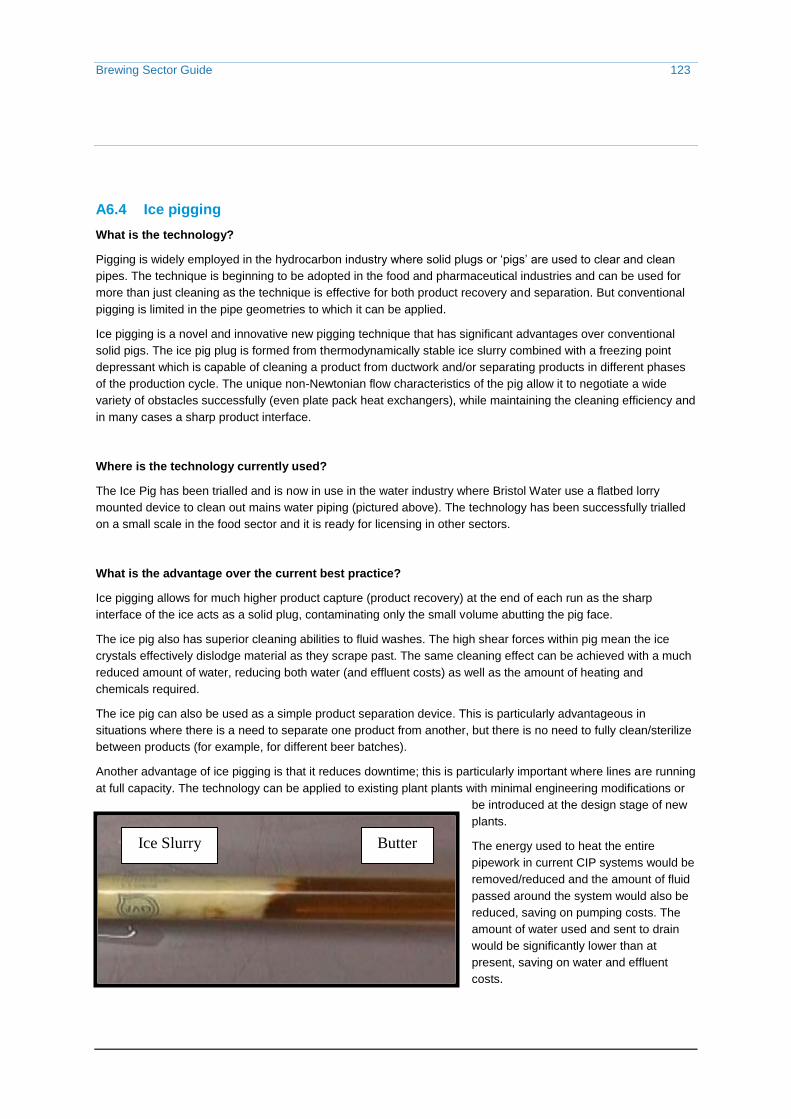
Brewing Sector Guide 123
Ice Slurry Butter
A6.4 Ice pigging
What is the technology?
Pigging is widely employed in the hydrocarbon industry where solid plugs or „pigs‟ are used to clear and clean
pipes. The technique is beginning to be adopted in the food and pharmaceutical industries and can be used for
more than just cleaning as the technique is effective for both product recovery and separation. But conventional
pigging is limited in the pipe geometries to which it can be applied.
Ice pigging is a novel and innovative new pigging technique that has significant advantages over conventional
solid pigs. The ice pig plug is formed from thermodynamically stable ice slurry combined with a freezing point
depressant which is capable of cleaning a product from ductwork and/or separating products in different phases
of the production cycle. The unique non-Newtonian flow characteristics of the pig allow it to negotiate a wide
variety of obstacles successfully (even plate pack heat exchangers), while maintaining the cleaning efficiency and
in many cases a sharp product interface.
Where is the technology currently used?
The Ice Pig has been trialled and is now in use in the water industry where Bristol Water use a flatbed lorry
mounted device to clean out mains water piping (pictured above). The technology has been successfully trialled
on a small scale in the food sector and it is ready for licensing in other sectors.
What is the advantage over the current best practice?
Ice pigging allows for much higher product capture (product recovery) at the end of each run as the sharp
interface of the ice acts as a solid plug, contaminating only the small volume abutting the pig face.
The ice pig also has superior cleaning abilities to fluid washes. The high shear forces within pig mean the ice
crystals effectively dislodge material as they scrape past. The same cleaning effect can be achieved with a much
reduced amount of water, reducing both water (and effluent costs) as well as the amount of heating and
chemicals required.
The ice pig can also be used as a simple product separation device. This is particularly advantageous in
situations where there is a need to separate one product from another, but there is no need to fully clean/sterilize
between products (for example, for different beer batches).
Another advantage of ice pigging is that it reduces downtime; this is particularly important where lines are running
at full capacity. The technology can be applied to existing plant plants with minimal engineering modifications or
be introduced at the design stage of new
plants.
The energy used to heat the entire
pipework in current CIP systems would be
removed/reduced and the amount of fluid
passed around the system would also be
reduced, saving on pumping costs. The
amount of water used and sent to drain
would be significantly lower than at
present, saving on water and effluent
costs.

Brewing Sector Guide 124
Additives can be mixed with the pig to deliver a range of results. Abrasive materials can be added to scour the
inside of the pipe. The pig can be made alkali (caustic) or acid and if the pig ever becomes lodged in a certain
inaccessible location the solution is merely to wait for it to melt.
Are there any limitations?
Ice pigging cannot be used to clean tanks and so a separate system would have to be in place, working
alongside ice pigging to clean the entire factory. There are some products (such as chocolate) that are difficult to
treat with this technology.
What is the development stage?
Ice pigging technology is at a stage where it can be effectively demonstrated at any site where the pipe topology
is suitable. Bristol University are now at a stage where they are looking to license the technology to an
international equipment provider who can provide the support necessary to make this a saleable product within
the food and drinks industry. The technology is currently at a pre-commercial state having been proven with
several prototypes currently in use in different industries including the food and drink sector.
Barriers to overcome
Equipment manufacturer acquiring licence: a suitable equipment manufacturer would need to acquire the
technology under license from the university to develop a commercial product. This would also provide a
support network for the product which is not currently possible from Bristol University.
Technology commercialisation: a control system would also have to be developed for integrating the
technology into the CIP systems and processes that exist in most breweries. A robust set of brewery
validation trials will also be required before this technology can be evaluated in terms of its practical
applicability and potential cost-effectiveness to the brewing industry.
Freezing Point Depressant: the use of salt as a freezing point depressant within the ice pig may involve the
need for a flush after each cleaning run to eliminate the salt from the system. Other temperature depressants
are available and so the right one most suited to the brewing industry would have to be selected.
Who are the technology providers?
Bristol University - The technology has been developed by Prof Joe Quarini and team in the Department of
Mechanical Engineering.

Brewing Sector Guide 125
A6.5 Whirlwind pigging
What is the technology?
Whirlwind pigging is a process where a vortex (whirlwind) is generated in a pipe system which cleans the inner
surfaces of the pipes through gaseous displacement and through adding cleaning additives to the „whirlwind‟.
A laminar air stream is blown through the pipework, recovering 60 – 80% of the product. A whirlwind is generated
within the airstream which clears the remaining
product. This is done by a blower system and
does not involve compressed air (which is very
energy inefficient). This typically reduces the
remaining product to less than 5%. At this point
a small amount of water or cleaning agent
(caustic or acid) can be introduced into the
airflow, enhancing the cleaning effect from the
turbulent flow. This generates an inner surface
which is fully clean.
Heated air is introduced completely drying the
pipework. By warming the whirlwind airflow any
traces of water droplets on the inner surfaces
are dried ready for production to restart in a
short period of time.
Where is the technology currently used?
The whirlwind technology is currently used to recover product and clean with wine, spirits, juice drinks, drink
additives, soups and sauces, perfumes and soaps as well as food pastes and spreads. It is particularly relevant
to high-value products where the value of additional product recovery due to the whirlwind technology makes it
commercially attractive. It has been used at a whisky distillery where its main benefit is to reduce product
wastage.
The technology is currently being trialled in the construction and utilities sectors.
What are the advantages over current practice?
Product recovery: The initial vortex that is formed can push
the majority of the product out of the pipe system without
having to use contaminants such as water or detergent. This
product would normally not be recoverable and in the cases
of more expensive products this can offer a valuable cost
saving.
Heat, water and effluent reduction: This system uses less
heat and water for CIP and less chemical cleaning agents
than conventional CIP.
Are there any limitations?
The technology cannot be used to clean plate pack heat

Brewing Sector Guide 126
exchangers or large tanks and silos. Separate cleaning systems would have to work side by side with the
whirlwind pig. To date the only pipe diameters that have been successfully pigged are 0.5 inch to 4 inch pipes.
Any pipe sizes outside of this level will require additional testing before they are deemed suitable.
What is the development stage?
The technology has been proven to work in the sectors identified above. The whirlwind system is a commercial
product with a procurement process that starts as an initial assessment and carries through with after sales
service.
Barriers to overcome
The whirlwind concept should prove very efficient at cleaning through pipework using less energy than is
currently used with traditional CIP systems, but it will be unable to clean through plate pack heat exchangers
tanks. Removing plate packs from pasteurisation would allow the technology to be utilised further and be more
effective. Coupling this technology with UV pasteurisation would overcome the problems associated with
navigation of the plate packs and reduce the number of separate systems needed to CIP, but proper trials will be
required before this technology can be evaluated in terms of its practical applicability and potential cost-
effectiveness to the brewing industry.
Who are the technology providers?
Aeolus Technologies: A company formed specifically to commercialise and develop the whirlwind
technology for use in industry.

Brewing Sector Guide 127
The Carbon Trust receives funding from Government including the Department of Energy and Climate Change, the Department for Transport, the Scottish Government, the Welsh Assembly Government and Invest Northern Ireland.
Whilst reasonable steps have been taken to ensure that the information contained within this publication is correct, the authors, the Carbon Trust, its agents, contractors and sub-contractors give no warranty and make no representation as to its accuracy and accept no liability for any errors or omissions.
Any trademarks, service marks or logos used in this publication, and copyright in it, are the property of the Carbon Trust or its licensors. Nothing in this publication shall be construed as granting any licence or right to use or reproduce any of the trademarks, service marks, logos, copyright or any proprietary information in any way without the Carbon Trust‟s prior written permission. The Carbon Trust enforces infringements of its intellectual property rights to the full extent permitted by law.
The Carbon Trust is a company limited by guarantee and registered in England and Wales under Company number 4190230 with its Registered Office at: 6th Floor, 5 New Street Square, London EC4A 3BF.
Published: August 2011
© The Carbon Trust 2011. All rights reserved. CTG058