Embed Size (px)
Citation preview
13 November 2017 Manager, Company Announcements ASX Limited Level 4, 20 Bridge Street Sydney NSW 2000 Dear Sir Breville Group Limited – Annual General Meeting Presentations
The AGM 2017 presentations released earlier today contained a typographical error on slide 24. An amended presentation is attached.
Yours faithfully
Sasha Kitto Company Secretary Breville Group Limited Telephone: + 61 2 9384 8100
For
per
sona
l use
onl
y

2
13 November 2017
Chairman’s Address
Slide 2
Good morning ladies and gentlemen and welcome to Breville Group Limited’s 2017 AGM.
Turn to Slide 3
The 2017 financial year was another significant year of achievement for the Breville Group with
continued sales and profit growth driven by transformational execution. The 2017 year also
represents a significant endorsement of our evolving business model and strategy.
Transformational execution continues under the leadership of CEO Jim Clayton, resulting in the
Group being well placed for further global growth under the four region structure of ANZ, North
America, Europe and Rest of World.
Breville continues to launch innovation driven products to ensure that it remains relevant to its
customers globally and has embraced a culture of change, which is a natural part of the
transformation.
Turn to Slide 4
The Group delivered a 5.1% increase in revenue to $605.7m, with solid revenue growth in the
core Global Product segment increasing by 9.9% to $469.6m. The Distribution segment revenue
for the year of $136.2m was 8.8% lower than the previous year, though the decline rate began to
flatten out in the second half.
Group EBIT for the year finished at $79.0m, 7.2% higher than the prior year with Group EBIT
margins steady at 13.0% compared to 12.8% in the prior year. Net profit after tax increased by
7.3% to $53.8m.
Net cash flow generated from operating activities of $62.7m was 19.9% higher than the $52.3m
generated in the prior year. In line with the Group’s acceleration program, the Group continued
its investment in capital projects, including product development projects, and marketing and
global IT systems, with cash flows used in investing activities increasing from $13.8m in FY16 to
$19.3m. Net cash at 30 June 2017 increased to $41.3m.
Jim will take you through the numbers in more detail, and will update you on the considerable
progress the team has made during the year in building the Group’s global scalable platform. Jim
will also talk you through the Global segment acceleration program and the Distribution segment
turnaround program.
Turn to Slide 5
For
per
sona
l use
onl
y
3
I would like to take a moment to formally thank and acknowledge the efforts of Jim and his
talented management team, who delivered a number of foundational elements and key
milestones in Breville’s transformation journey during FY17.
I would also like to thank Breville team members around the world for the creative passion and
energy that they bring to our company.
On behalf of our suppliers, customers, consumers and of course, our valued shareholders and my
Board colleagues, thank you all for your continued support.
I also take this opportunity of thanking my colleague, Steven Klein, who will not be seeking re-
election today as a non-executive director. Steven Klein has been on the Board since 2003 and
has seen first-hand the transition of the company from a steady homewares business to one of
the world’s leading small appliance companies. I am sure he is proud of what Breville has
achieved. On behalf of the Board and management of Breville, I would like to say thank you to
Steven for his years of dedicated service to Breville.
Lastly, thank you all for your attendance this morning and I, together with my Board colleagues,
look forward to having a chat with you at the conclusion of the meeting.
Prior to moving to the business of this meeting, I will now handover to our CEO, Jim Clayton to
present his Review of Operations.
END CHAIRMAN ADDRESS
CEO’s Review of Operations
Thank you, Steve. I’d like to welcome everyone to Breville’s AGM. Thank you for taking the time
to join us.
Turn to Slide 7
Today I will walk you through our FY17 results, give you an update on our transformation
program, and end with a discussion of the work that lies ahead. Before we get started, to the
extent my discussion includes “forward-looking statements”, I’d like to remind you that such
statements are based on our current understanding of the overall business environment and that
actual results may differ materially.
Turn to Slide 8
Overall, we delivered a solid result for FY17. Revenue increased 5.1% to $605.7m (which was
8.0% in constant currency); EBITDA grew 7.6%; EBIT improved 7.2% with a stable margin of
13.0%; and NPAT increased 7.3%. The differential between the EBITDA and EBIT growth rates
reflects our continued investment in R&D and IT. A final dividend for the year of 15.0 cents per
For
per
sona
l use
onl
y

4
share was declared, bringing the total dividends for the year to 30.5 cents per share, an increase
of 7.0% on FY16.
Turn to Slide 9
Drilling down to the segment level, you can see two very different stories playing through in FY17.
The Global segment delivered 14.3% revenue growth in constant currency, growing to $469.6m,
while the Distribution segment contracted (8.8%) to $136.2m.
The Distribution segment shouldered a fair amount of volatility in FY17. While we continued to
face headwinds in the mass channel, we also saw the end of the Philips distribution agreement, as
well as the tailing in of the expanded Nespresso machine partnership agreement to North
America. With all the puts and takes in this segment, coupled with our turnaround efforts, we
anticipate FY17’s $6.6m EBIT to be the bottom for this segment. As we move forward, we expect
the Distribution segment to show improved EBIT performance in FY18 and beyond.
Turn to Slide 10
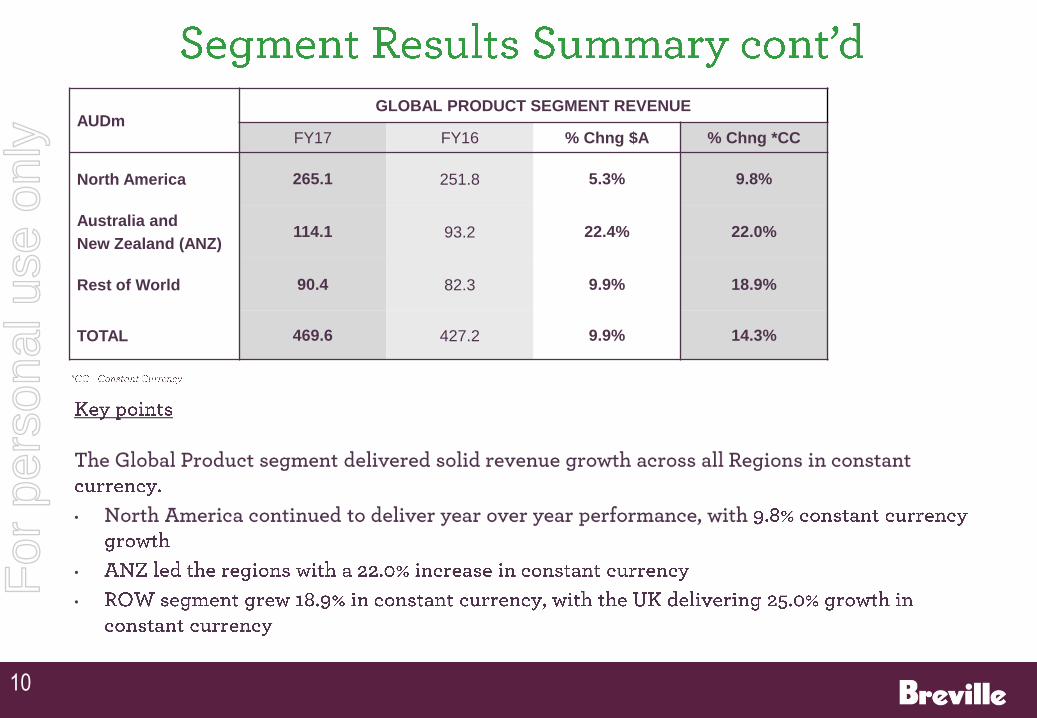
Looking at regional revenue performance in the Global segment, we saw a solid growth profile
across all geographies in FY17. North America continued to deliver year-over-year performance,
growing 9.8% in constant currency. ANZ led the pack with 22.0% growth, and the Rest of World
region posted a constant currency growth of 18.9%, collectively resulting in 14.3% constant
currency revenue growth for the Global segment as a whole.
Turn to Slide 11
Turning to the balance sheet, we saw a slight increase in net working capital of $5.9m. The
primary driver was receivables, up $16.9m, driven by strong sales in Q4. We also saw an increase
in inventory primarily as a result of (i) our expansion of the Nespresso machine partnership to
North America, as we purchased the initial inventory for launch, and (ii) the front edge of our
purchases for this Christmas. As we progress through FY18, we should see our inventory position
revert back to our current equilibrium point of a little less than 4 turns per year. Consistent with
our acceleration program, intangibles increased by a net $8.0m as we continued to investment in
both R&D and IT.
Turn to Slide 12
With the numbers out of the way, I’d now like to update you on the progress of our acceleration
program for the Global segment.
Turn to Slide 13
Throughout FY17, and into this year, we are continuing to improve our in-store execution. This
continues to be a work in progress, but we are beginning to see some results. We installed our
first build-out in the David Jones store at Bondi Junction, and we have rolled out end caps in 220
Best Buy stores in the US. Point of sale material has begun to materialise across the system; we
continue to expand and improve our in-store demonstration program; and we are piloting our
store associate training program in the US. On the whole, we have a tremendous amount of work
For
per
sona
l use
onl
y
5
in front of us, but it is great to see the efforts we have put into this over the last two years finally
reflected in store.
Turn to Slide 14
We have made solid strides in delivering quality digital content to our retailers for their omni-
channel efforts as well as to consumers in their “path to purchase” journeys. I’d like to show you
a video of our newest espresso machine, the Barista Touch, to give you a feel for the quality of
content we are developing as a part of our “product launch” efforts.
I am proud of the progress we have made in the last twelve months, and I look forward to
continued improvements in this area.
Turn to Slide 15
In an effort to improve our geographic execution, we also made progress in Europe during FY17.
Building on our efforts to date, we expanded the Sage brand in Europe to include the countries
from Poland to Greece. Again, we have quite a bit of work in front of us, but we continue to
progress.
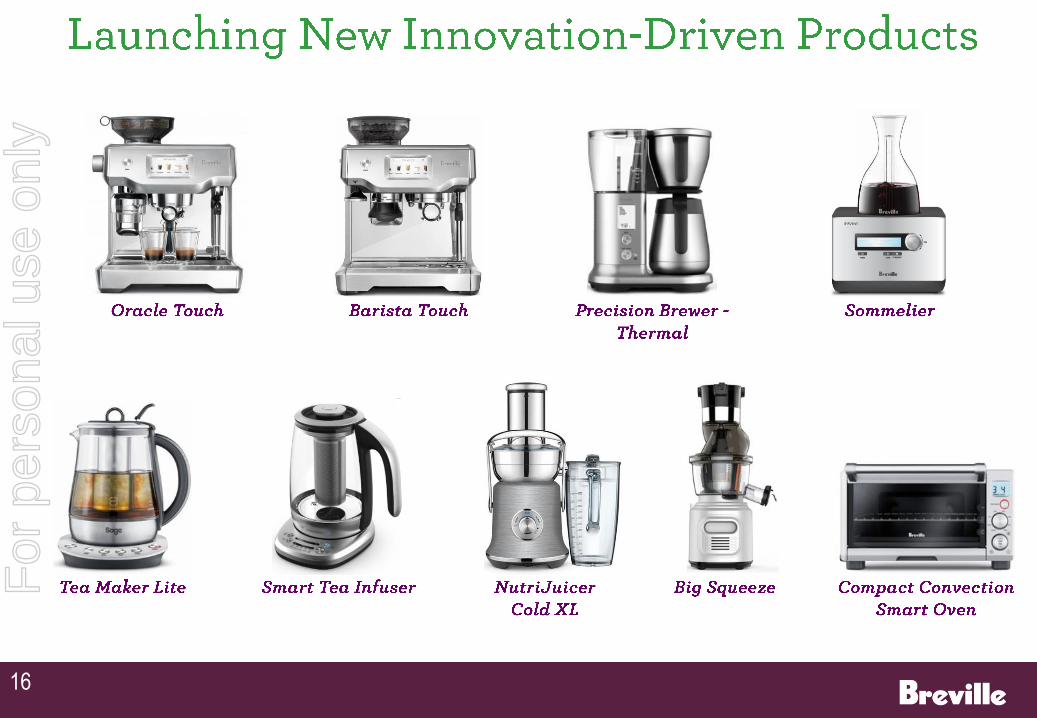
Turn to Slide 16
While much has changed at Breville—one thing hasn’t—the continued focus on delivering
innovation-driven products. This slide shows several new products for this Christmas season. We
are excited about each of these products and look forward to getting them into consumers’
homes.
Turn to Slide 17
The one new product I’d like to talk about in more detail is the Compact Convection Smart Oven.
This is a particularly important product, which is why it is on the front page of the AGM
presentation … not because of what it does, but because of how it came to be.
Breville’s traditional product development process was to put one designer and one engineer on
the new product project from cradle to grave. Looking back over the last 10 years, this process
was clearly successful. The disadvantage, however, was that the more innovative the product,
the longer it took to develop, like The Oracle which took 5 years. Beginning the day after I started
at Breville, we began experimenting with an “accelerated” process, which meant allocating larger
teams to a single project. We used this new approach successfully with the Creatista and the
Oracle Touch, releasing these products much earlier than planned. With both development
approaches in our toolbox, we have more flexibility in how we deploy resources to drive
innovation.
While this accelerated approach has enabled us to reduce our time to market for innovation-
heavy projects, it still left one challenge, which is how to accelerate expanding our range within a
category, while at the same time disrupting other categories with new innovations. To solve this
problem, we began building an offshore development centre 18 months ago. The Compact
Convection Smart Oven is our first product developed through this new process.
For
per
sona
l use
onl
y

6
From a structure perspective, the Sydney team focuses on breakthrough innovations. Once they
develop the innovation into a flagship product, the Sydney team specifies how this innovation
should be pulled through the product range. The offshore development centre takes the product
specification handoff and works directly with our manufacturing partners to develop range down
products—that is, products that are keyed off an original set of innovations but may include a
subset, or a variation, of those innovations. The team in Sydney plays an oversight and quality
assurance role during the entire process.
Our product development organisation is now able to align all three approaches against our
innovation and commercialisation pipeline. By applying the right process to the right project, for
a given R&D spend, we are able to assign our most talented resources to our most challenging
problems, while also attaining the benefit of scale to maximise our collective output in the
shortest amount of time.
Turn to Slide 18
I’d now like to give you a brief update on our turnaround program for the Distribution segment.
Turn to Slide 19
Over the last few years, we have seen deterioration in the profitability of the Distribution
segment. In FY16, we kicked off a turnaround project. This entailed rightsizing the team,
rationalising the product portfolio, adjusting our approach to market, shedding unprofitable
components, and adding new offerings to the segment. After focused efforts, we believe we
have found the bottom in FY17 at $6.6m of EBIT and that this segment should improve its
performance in FY18. That said, there will be quite a bit of volatility in the year-over-year
numbers because of Philips coming out and Nespresso North America, Aquaport, and Dolce Gusto
coming in. For those who may not be aware, Breville recently became the sole distributor for
Dolce Gusto in ANZ.
Turn to Slide 20
Next, I will give you a quick update on our progress as it relates to the underlying platform on
which we will scale.
Turn to Slide 21
With our corporate structure, we have implemented a 4 region model: ANZ, North America,
Europe and Rest of World. To accomplish this, we merged the US and Canada into the North
American region, and the UK and our European partners into the Europe region. Functionally, we
are in the process of globalising our finance function, which is the last major function to go
through the globalisation process.
In FY17 and into this financial year, we have continued to evolve our supply chain and Sales and
Operations Process. On the planning front, we capacity planned with our manufacturers last
February to ensure alignment for this holiday season; we adjusted our high season purchasing
pattern to sidestep delivery risk; and we began co-planning with a few retail partners to remove
For
per
sona
l use
onl
y

7
demand variation. As we move through the holiday season, we will have a chance to assess the
impact of these changes and apply what we learn to the planning cycle for next year.
For the supply chain itself, we recently went live with a consolidation warehouse—enabling us to
overcome any minimum order quantity issues--and we are working to move a handful of
suppliers to a vendor managed inventory model. The picture on the slide is the very first
container that moved through the consolidation warehouse. These new features of our supply
chain will enable us to migrate to a new equilibrium point for our inventory levels. As I have
mentioned previously, we expect that to be a gradual migration.
From an IT perspective, the good news is that we have now completed the initial roll out of all
major corporate systems. We are now in the process of learning how to best leverage our new
systems, as well as implementing incremental functionality, especially in our CRM and
eCommerce systems.
Turn to Slide 22
Now on to the road that lies ahead.
Turn to Slide 23
Over the last 2 ½ years, we have accomplished quite a bit in our acceleration program, but we still
have much to do. With our product and go-to-market levers, it’s about absorbing the changes we
have made, and continuing to improve our overall effectiveness. And, now that our house is
basically in order, we need to apply more focus on strengthening the integration and alignment
with our retail partners.
The core elements of our platform are in place. We now need to bring the consolidation
warehouse and vendor managed inventory on line, making them a standard component of our
go-forward planning process. We also need to expand our use of retailer co-planning and drive
functional standardisation across geographies where it makes sense.
And, lastly, we need to continue our efforts on rightsizing our overall business model, with the
goal of spending 12% of net sales on marketing and R&D related activities.
Turn to Slide 24
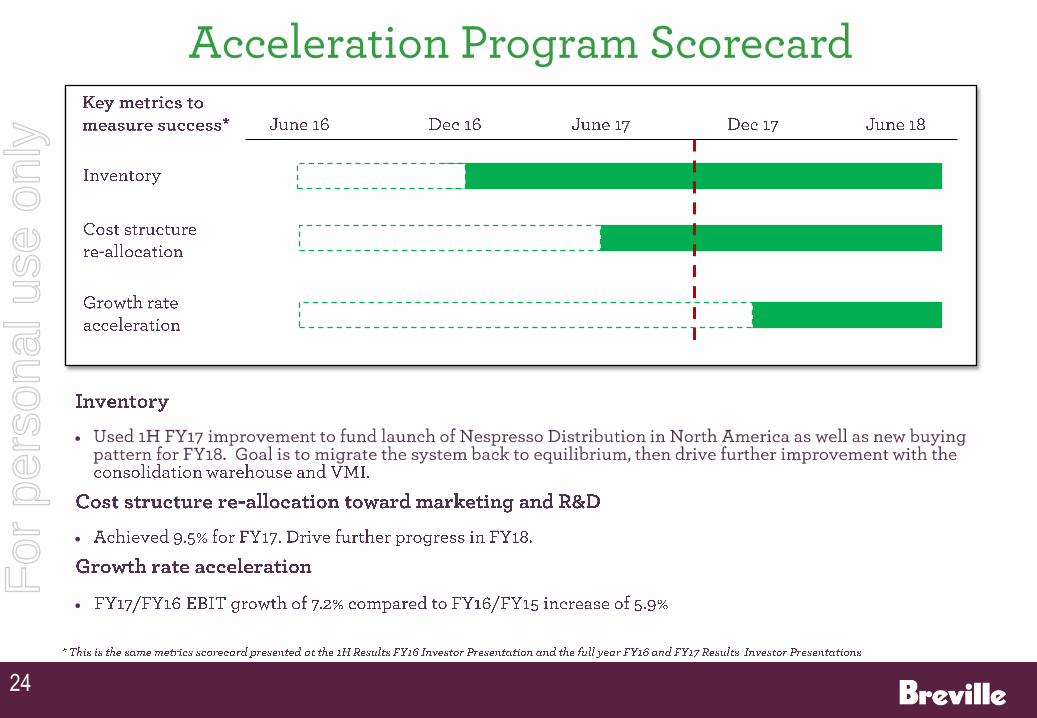
Relative to the scorecard we laid down 2 years ago, we are on track. We saw inventory release in
the 1H of FY17, and we used this release to fund the expansion of the Nespresso machine
partnership. As we progress through FY18, I’d like to see inventory revert to its system-wide
equilibrium point and then begin to drift downward as the impact of the consolidation warehouse
is realised.
On our business model evolution metric, we made progress in FY17 by spending 9.5% of net sales
on marketing and R&D, up from 8.5% the year before. We would like to see continued progress
on this metric in FY18 and beyond until we achieve our target of 12%.
For
per
sona
l use
onl
y

8
The final metric, EBIT acceleration, is the core objective of the acceleration program, though it is
an output vs. an input. In FY17—a year where we added an incremental 1% of net sales to our
marketing and R&D spend—we also delivered an EBIT growth of 7.2% over FY16 vs. the 5.9%
growth we saw the year before. As we continue to increase our investment in marketing and
R&D as a percent of net sales on the path to the 12% target, our business model transformation
exercise will inhibit the rate of EBIT growth, but once completed, it will be the engine that drives
sustainable growth in the future.
Closing Remarks
In closing, I’d like to thank the Board for their guidance, support and patience. And, I would also
like to thank the entire Breville team for the commitment, resilience, and focus they have shown
in driving both the acceleration plan for the Global segment as well as the turnaround program
for the Distribution segment. I am proud of what the team accomplished in FY17, and I look
forward to continuing the journey.
With Mervyn Cohen’s announcement that he will be leaving us, I want to take this opportunity to
thank Mervyn—on behalf of every employee at Breville—for all the years he has invested in
making Breville what it is today, both as CFO and, at times, CEO. We all wish you the very best,
and you will be missed. With Mervyn’s departure, let me introduce Michelle Waters, who has
graciously agreed to step in as the Interim CFO. Michelle has worked at Breville for over 10 years,
with her most recent position being the General Manager Finance for the Group. Given how
closely we have worked together over the last 2 years, this will be a seamless transition for
Michelle, and I encourage each of you to meet her today if you haven’t already.
Thank you again for joining us today and please stay for refreshments.
I will now hand you back to Steve Fisher.
Disclaimer
This Announcement contains certain ‘forward looking statements’ including indications of, and
guidance or outlook on, future earnings or financial position or performance. The forward looking
statements contained in this Announcement are not guarantees of future performance and
involve known and unknown risks and uncertainties and other factors, many of which are beyond
the control of Breville, its Directors and management, and involve elements of subjective
judgement and assumptions as to future events which may or may not be correct. Actual
performance may differ materially from these forward looking statements. A number of
important factors could cause actual results or performance to differ materially from the forward
looking statements. The forward looking statements are based on information available to
Breville as at the date of this Announcement. Except as required by law, including the ASX Listing
Rules, Breville undertakes no obligation to provide any additional or updated information,
whether as a result of new information, future events or results or otherwise.
For
per
sona
l use
onl
y

For
per
sona
l use
onl
y

2
For
per
sona
l use
onl
y

3
For
per
sona
l use
onl
y

•
•
4
For
per
sona
l use
onl
y

•
5
For
per
sona
l use
onl
y

6
For
per
sona
l use
onl
y

7
•
•
•
•
•
For
per
sona
l use
onl
y

AUDm FY17 FY16 % Chng
Revenue 605.7 576.6 5.1%
EBITDA 89.8 83.4 7.6%
EBIT 79.0 73.7 7.2%
EBIT margin (%) 13.0% 12.8%
NPAT 53.8 50.2 7.3%
Basic EPS (cents) 41.4 38.6 7.3%
ROE1
(%) 21.3% 21.0%
Dividends per share (cents) 30.5 28.5 7.0%
• Interim 15.5 14.5
• Final 15.0 14.0
Franked (%) 60.0% 72.6%
Net cash ($m) 41.3 36.1
8
•
•
•
•
•
For
per
sona
l use
onl
y

9
AUDm
REVENUE EBIT EBIT MARGIN (%)
FY17 FY16 % Chng FY17 FY16 % Chng FY17 FY16
Global Product 469.6 427.2 9.9% 72.4 65.1 11.1% 15.4% 15.3%
% Change CC* 14.3%
Distribution 136.2 149.4 (8.8%) 6.6 8.6 (22.5%) 4.9% 5.7%
TOTAL 605.7 576.6 5.1% 79.0 73.7 7.2% 13.0% 12.8%
•
•
•
•
For
per
sona
l use
onl
y
10
AUDm GLOBAL PRODUCT SEGMENT REVENUE
FY17 FY16 % Chng $A % Chng *CC
North America 265.1 251.8 5.3% 9.8%
Australia and
New Zealand (ANZ) 114.1 93.2 22.4% 22.0%
Rest of World 90.4 82.3 9.9% 18.9%
TOTAL 469.6 427.2 9.9% 14.3%
•
•
•
For
per
sona
l use
onl
y

AUDm FY17 FY16
Inventory 116.6 107.7
Receivables 106.4 89.5
Trade and other payables (94.8) (74.9)
Working Capital 128.2 122.3
Fixed assets 10.7 11.8
Intangibles 100.1 92.1
Other (liabilities)/assets (net) (20.7) (16.3)
NET ASSETS EMPLOYED 218.3 209.9
(Cash) (net) (41.3) (36.1)
Shareholders’ equity 259.6 246.0
CAPITAL EMPLOYED 218.3 209.9
11
•
•
•
•
For
per
sona
l use
onl
y
12
•
•
•
•
•
For
per
sona
l use
onl
y

13
For
per
sona
l use
onl
y

14
For
per
sona
l use
onl
y

15
For
per
sona
l use
onl
y
16
For
per
sona
l use
onl
y

17
•
•
•
•
•
•
•
•
•
For
per
sona
l use
onl
y

18
•
•
•
•
•
For
per
sona
l use
onl
y

19
For
per
sona
l use
onl
y

20
•
•
•
•
•
For
per
sona
l use
onl
y

21
•
•
•
•
•
•
•
•
•For
per
sona
l use
onl
y
22
•
•
•
•
•
For
per
sona
l use
onl
y

23
For
per
sona
l use
onl
y
24
For
per
sona
l use
onl
y

For
per
sona
l use
onl
y