Embed Size (px)
Citation preview
Drivers and Implications of Land Use and Land Cover Change in the Central Highlands of Ethiopia: Evidence from Remote Sensing and Socio-demographic Data Integration
Berhan Gessesse* and Woldeamlak Bewket**
Abstract This study explores the major drivers of Land-use/Land-cover (LULC) dynamics and the observed environmental degradation as a response to these changes in the Modjo watershed, central Ethiopia. Data for this study were generated through household survey and supplemented with remotely sensed image interpretation. The data were analyzed using descriptive statistics and remote sensing-based image processing. The findings of the study revealed that LULC dynamics together with a range of ecological changes are serious environmental problems in the study site. LULC changes are driven by a combination of proximate and underlying drivers such as economic, demographic, biophysical and institutional factors. Bareland expansion, increased surface runoff production and soil erosion are major environmental damages partly attributed to LULC dynamics in the study site. These environmental degradation processes have adverse impacts on local agricultural productivity, water resource availability and food security of communities. Thus, policy responses are needed for integrated natural resource management and livelihood sustainability in the study area. Key words: Ethiopia, Land Use and Land Cover Change, Modjo Watershed, Remote Sensing
* Assistant Professor, Earth Observation Research Division, Entoto Observatory and Research Center, Addis Ababa, Ethiopia and; Department of Geography and Environmental Studies, Kotebe University College, Addis Ababa, Ethiopia. ** Professor, Department of Geography and Environmental Studies, Addis Ababa University, Ethiopia.
Berhan Gessesse and Woldeamlak Bewket
2
Introduction
Watersheds provide essential goods and services on which living organisms depend, such as provisioning, regulating and supporting functions and services (Millennium Ecosystem Assessment 2005). However, LULC has been intensely subjected to change globally in the forms of conversion or modification and their environmental functions and services have been weakened from time to time (Turner and Meyer 1994; Geist et al. 2006).
Like many other developing countries, Ethiopia has been experiencing environmental degradation problems including LULC conversion, soil erosion, loss of forest and other vegetation covers and water resource degradation (MoA and WB 2007). National level detailed investigation regarding the magnitude of LULC change and its environmental implication is inadequate, however, micro-watershed level land use change studies using remotely sensed images were carried out in different parts of Ethiopia (Solomon 1994; Gete and Hurni 2001; Kebrom and Hedlund 2000; Woldeamlak 2002; Aklilu et al. 2007; Bezuayehu and Sterk 2008; Mohammed and Tassew 2009).
Almost all of these studies found that LULC conversion process is very intense in the highlands of Ethiopia. For example, one of the land cover components, forest has declined from 40% about a century ago to an estimated less than 15% currently with an approximate deforestation rate of 160,000 to 200,000 ha yr–1. Nonetheless, the estimated figure lacks consistency from literature to literature. The expansion of cultivated, grazing and both urban and rural settlement were the typical reasons for this (Shiberu and Kifle 1998; Badege 2001; MoARD and SLM Secretariat 2008). Besides, too much reliance on woody biomass for fuel, the expansion of agricultural activities at the expense of vegetation cover and demand for wood for construction materials contributed to uncontrolled land cover change and deforestation in Ethiopia (Alemu and Damte 2011).
Theorists in the field of social and earth system sciences hypothesized that LULC dynamics are triggered by the interaction of anthropogenic and biophysical driving forces. These drivers are a complex mixture of political, social, economic and biophysical factors that add force to environmental changes (Geist et al. 2006) and intensified through high population growth
EJOSSAH Vol. X, No.2 December 2014
3
rates (UNEP 2000). The expansion of diversified agricultural activities, wood extraction and infrastructure extension are clusters of proximate (direct) causes of LULC changes. As opposed to proximate causes, complexes of technological, economic, demographic, political, institutional and socio-cultural factors are grouped under underlying (root) causes of LULC changes. Thirdly, biophysical triggers such as topography, landslides, droughts, and natural fires are referred to as biophysical factors that underpin LULC changes (Ojima et al. 1994, Lambin et al. 2003, 2006, Geist et al. 2006).
Extensive conversion of vegetation cover and expansion of farmlands along with the dissected terrain and ecological vulnerability lands have implications for large-scale geo-ecological fragmentation and land degradation in Ethiopia (Lakew et al. 2000, Bezuayehu et al. 2002, Dessalegn 2001, Vivero et al. 2005, MoARD and WB 2007). The whole process leads to deterioration of soil quality and productivity. Increasingly focused studies were carried out in Ethiopia to examine the major challenges for the adoption of land management technologies (Shiferaw and Holden 1998, Woldeamlak and Sterk 2002, Berhanu and Swinton 2003, Wegeayehu and Drake 2003, Fitsum and Holden 2006, Woldeamlak 2007, Aklilu and de Graaff 2007). However, integrated discourse regarding the driving forces, implications of LULC changes and major determinants of land management investment decisions have been limited indicating the need for further studies.
This study attempts to contribute to the limited literature in line with the major drivers of LULC change, and on-site and off-site implications these changes have on the rain-fed farming landscapes of the Modjo watershed (central highlands of Ethiopia). The specific objectives of the study were to: (i) investigate the major driving forces of LULC change processes, and (ii) assess the effects of long-term LULC changes on local environmental condition, and (iii) draw lessons for land resource management interventions.
Berhan Gessesse and Woldeamlak Bewket
4
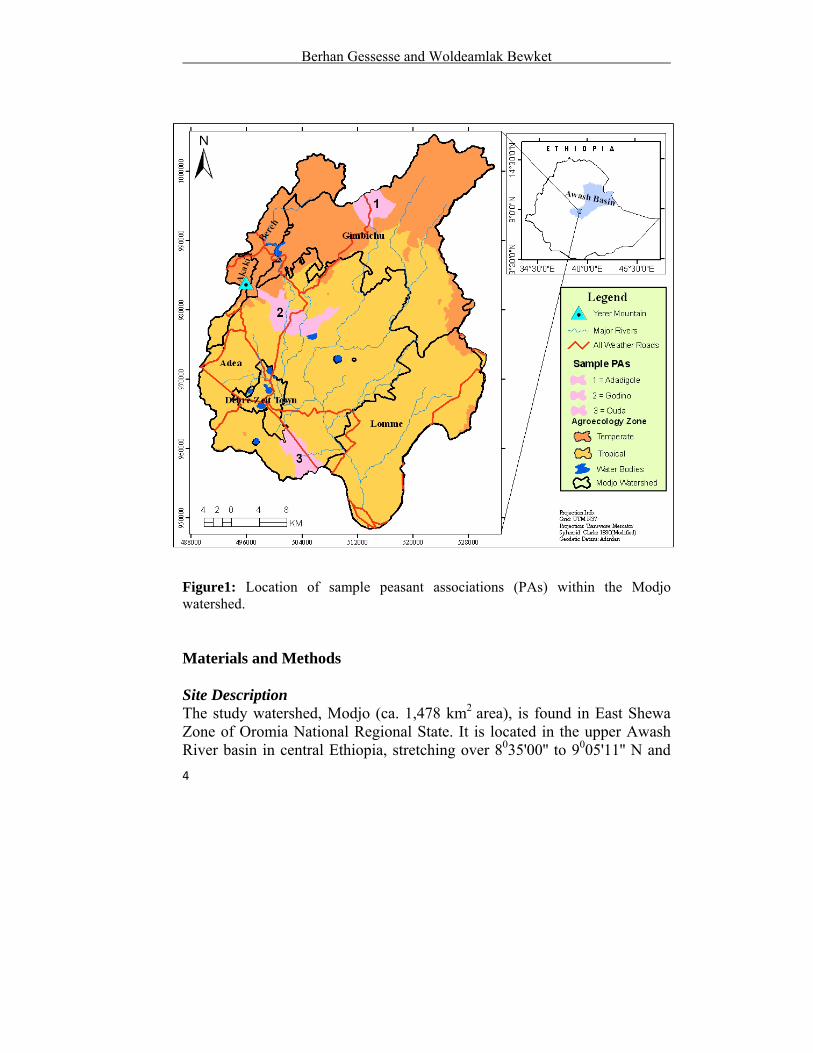
Figure1: Location of sample peasant associations (PAs) within the Modjo watershed. Materials and Methods Site Description The study watershed, Modjo (ca. 1,478 km2 area), is found in East Shewa Zone of Oromia National Regional State. It is located in the upper Awash River basin in central Ethiopia, stretching over 8035'00'' to 9005'11'' N and
EJOSSAH Vol. X, No.2 December 2014
5
38054'35'' to 39015' 30'' E (Figure 1). It is characterized by undulating topography with hills, mountains, plains and river valleys. Elevation in the watershed ranges from 1740 m (south of Modjo town) to 3060 m asl (at Yerer volcanic mountains) with a mean value 2142 m. According to Alemneh (2003) and Hurni (1998) traditional agro-ecological zonation of Ethiopia, the Modjo watershed falls under the Weyna-Dega (Tropical) (1740m to 2300 m) and Dega (Temperate) (2300m to 3060m) agro-ecological zone.
Considering FAO’s (2006) slope classification scheme, the gradient of Modjo watershed is categorized into flat to very gently sloping (<2%) (9.5% of the total watershed), gently sloping to sloping (2 - 10%) (61.2%), strongly sloping to moderately steep (10 - 30%) (18.4%) and steep to very steep (>30%) (2.9%). The annual total rainfall and mean annual temperature of the area are 881 mm and 19.50C, respectively. Nine generalized LULC classes including bare land, cultivated land (comprises cropland plots with scattered rural settlements), forest, grass land, marsh land, plantation areas, shrubs, urban settlements and water bodies were identified in the study watershed based on the year 2007 SPOT image interpretation and classification.
Based on the year 2010 Central Statistical Authority (CSA) population projection, about 625,131 people with an average population density of 172 persons per km2 live in and around the Modjo watershed. The majority of this population depends on mixed crop-livestock production. In addition, some part of the Modjo watershed is inhabited by urban dwellers and densely populated areas are observed particularly in and around Chefe-Donsa, Godino, Bishoftu, Ejeri and Modjo towns.
Data Sources and Analysis
The study was mainly based on a survey of farm households supplemented with interpretation of satellite remote sensing images. Specifically, the data required for the study were generated through both primary and secondary sources including household survey, field observation, informal discussion with local land users and experts as well as remotely sensed data interpretation. The geographical distribution of the sample Rural Kebele

Berhan Gessesse and Woldeamlak Bewket
6
Associations (RKAs) in the upstream, midstream and downstream parts of the watershed as well as agro-ecological zones, spatial patterns of the LULC, land degradation hotspot sites and land management practices were used as criteria for selecting the sampling sites for the household survey. Multistage sampling design was used to select the sample households (Table 1). First, the watershed was purposively clustered into upstream, midstream and downstream parts together with the two agro-ecological zones namely Dega (temperate) and Woyna-Dega (tropical). Then, based on the set criteria mentioned above, three RKAs namely Adadigole, Godino and Ouda were selected (Figure 1). In the third stage, 10% of sample households were selected from a list of registered households obtained from the respective RKA offices.
Table 1: Distribution of sample respondents in the Modjo watershed
Position Elevation(m) Climate zone District RKA Sample size %
Upstream 2300-3060 Temperate Gimbichu Adadigole 32 26.
45
Midstream 1740-2300 Tropical Addaa Godino 47 38.
84
Downstream 1740-2300 Tropical Addaa Ouda 42 34.
71
Grand Total 121 100
A survey instrument was developed and used to collect information on household characteristics, long-term spatio-temporal LULC changes, driving forces to LULC changes, and implications of LULC changes as well as constraints that influence farmers’ decisions to plant trees. One hundred twenty one respondents (of which 14.9% were female household heads) were selected using a random sampling technique. Two extension workers in each RKA were trained as enumerators to carry out the household survey under close supervision by the researcher. Respondents were interviewed at the end of 2011. A structured questionnaire was used to explore the
EJOSSAH Vol. X, No.2 December 2014
7
background information of the respondents, major driving forces of the LULC process, its environmental implications and factors that are likely to influence farmers’ decisions on tree planting for land management. Besides, formal and informal discussions with key informants including elders, extension workers and district (Woreda) level natural resource conservation experts as well as field observations were carried out. Finally, the survey data were analyzed using the Statistical Package for Social Scientists (SPSS) version SPSS 20.
Results and Discussion
Socio-demographic Characteristics of Sample Households
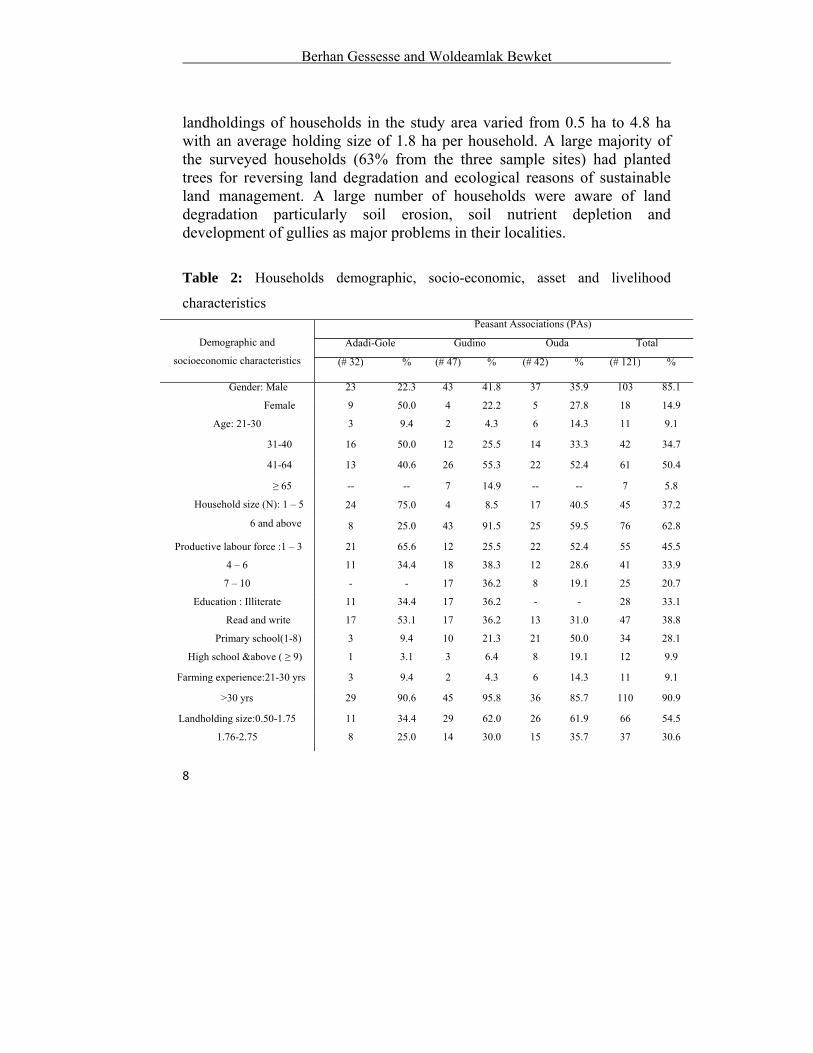
Table 2 shows key demographic and socioeconomic characteristics of the surveyed households. A large percentage of household heads (85.1%) was males whereas females constituted the remaining proportion (14.9%). Large proportions (85.1%) of respondents were between the ages of 31 and 64 years, while 9.1% and 5.8% of them were between 21 and 30 years, and 65 or older, respectively. Family seizes ranged from one to 11 persons, with an average family size of 5.9 persons. About 37.2% of respondents had between one and five household members, while a majority (62.8%) of them had six or more members in the family. Households with productive labor force of 1-3, 4-6 and 7-10 categories accounted for 45.5%, 33.9% and 20.7% of the sample households, respectively. Economically dependent age groups (0-14) and elderly (65 and above) varied from family to family. In this regard, 66.1% of respondents had household dependency ratios of between 0.0 and 0.5, while 33.9% of households had dependency ratios of between 0.5 and 3. Twenty-three percent of the respondents were illiterate.
Relatively a greater proportion (38.8%) of the respondents could read and write whereas the educational achievements of 28.1% of respondents ranged from grade 1 to grade 8. A small proportion of the household heads (9.9%) had attended grade 9 and above level of formal education. Most of the surveyed households were engaged in mixed farming activities (70.3%), and some of them (2.5%) were engaged in some form of off-farm activities like petty trading, informal labor and selling charcoal and wood. The
Berhan Gessesse and Woldeamlak Bewket
8
landholdings of households in the study area varied from 0.5 ha to 4.8 ha with an average holding size of 1.8 ha per household. A large majority of the surveyed households (63% from the three sample sites) had planted trees for reversing land degradation and ecological reasons of sustainable land management. A large number of households were aware of land degradation particularly soil erosion, soil nutrient depletion and development of gullies as major problems in their localities.
Table 2: Households demographic, socio-economic, asset and livelihood
characteristics
Demographic and
socioeconomic characteristics
Peasant Associations (PAs)
Adadi-Gole Gudino Ouda Total
(# 32) % (# 47) % (# 42) % (# 121) %
Gender: Male 23 22.3 43 41.8 37 35.9 103 85.1
Female 9 50.0 4 22.2 5 27.8 18 14.9
Age: 21-30 3 9.4 2 4.3 6 14.3 11 9.1
31-40 16 50.0 12 25.5 14 33.3 42 34.7
41-64 13 40.6 26 55.3 22 52.4 61 50.4
≥ 65 -- -- 7 14.9 -- -- 7 5.8
Household size (N): 1 – 5 24 75.0 4 8.5 17 40.5 45 37.2
6 and above 8 25.0 43 91.5 25 59.5 76 62.8
Productive labour force :1 – 3 21 65.6 12 25.5 22 52.4 55 45.5
4 – 6 11 34.4 18 38.3 12 28.6 41 33.9
7 – 10 - - 17 36.2 8 19.1 25 20.7
Education : Illiterate 11 34.4 17 36.2 - - 28 33.1
Read and write 17 53.1 17 36.2 13 31.0 47 38.8
Primary school(1-8) 3 9.4 10 21.3 21 50.0 34 28.1
High school &above ( ≥ 9) 1 3.1 3 6.4 8 19.1 12 9.9
Farming experience:21-30 yrs 3 9.4 2 4.3 6 14.3 11 9.1
>30 yrs 29 90.6 45 95.8 36 85.7 110 90.9
Landholding size:0.50-1.75 11 34.4 29 62.0 26 61.9 66 54.5
1.76-2.75 8 25.0 14 30.0 15 35.7 37 30.6
EJOSSAH Vol. X, No.2 December 2014
9
2.75-4.75 13 40.6 4 9.0 1 2.4 18 14.9
Livelihoods: Only crop
cultivation 0 0 15 31.91 18 42.9 33 27.3
Mixed framing 31 96.9 30 63.8 24 57.1 85 70.3
Off-farm activities 1 3.1 2 4.3 0 0 3 2.5
Involving in tree planting: Yes 16 50 45 95.7 14 33.3 75 62
No 16 50 2 4.3 28 65.7 46 38
LULC Change: Reality and Perceptions
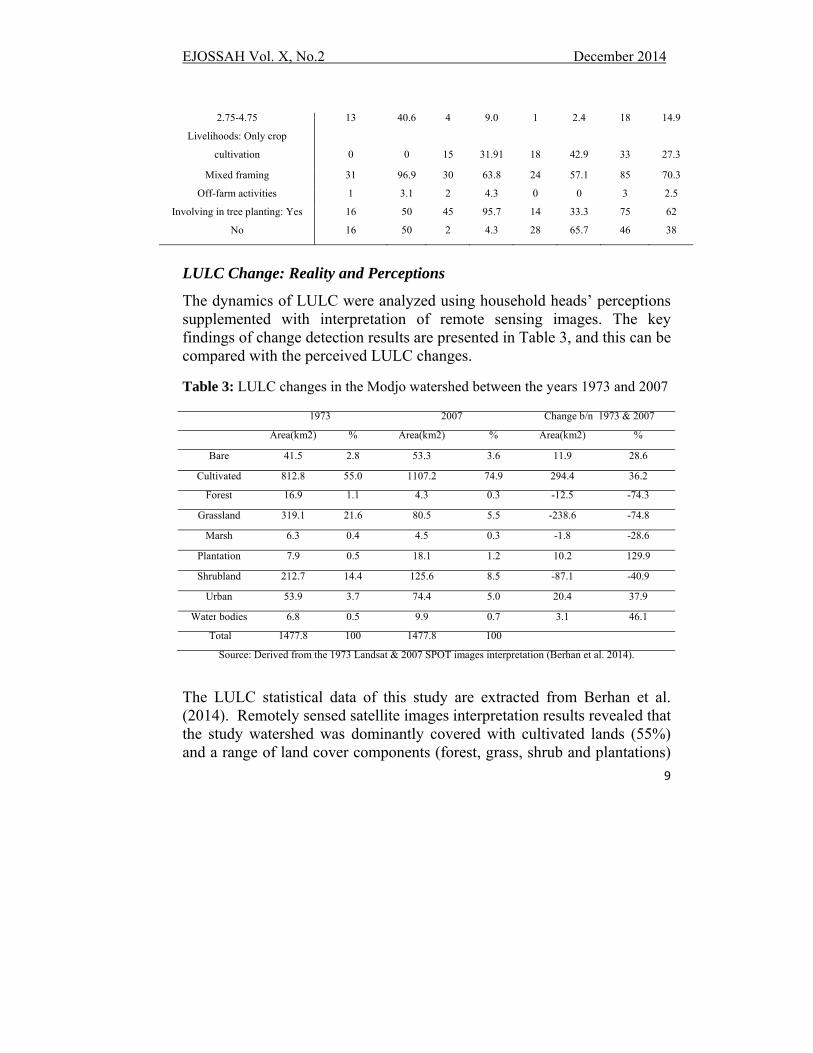
The dynamics of LULC were analyzed using household heads’ perceptions supplemented with interpretation of remote sensing images. The key findings of change detection results are presented in Table 3, and this can be compared with the perceived LULC changes.
Table 3: LULC changes in the Modjo watershed between the years 1973 and 2007
1973 2007 Change b/n 1973 & 2007
Area(km2) % Area(km2) % Area(km2) %
Bare 41.5 2.8 53.3 3.6 11.9 28.6
Cultivated 812.8 55.0 1107.2 74.9 294.4 36.2
Forest 16.9 1.1 4.3 0.3 -12.5 -74.3
Grassland 319.1 21.6 80.5 5.5 -238.6 -74.8
Marsh 6.3 0.4 4.5 0.3 -1.8 -28.6
Plantation 7.9 0.5 18.1 1.2 10.2 129.9
Shrubland 212.7 14.4 125.6 8.5 -87.1 -40.9
Urban 53.9 3.7 74.4 5.0 20.4 37.9
Water bodies 6.8 0.5 9.9 0.7 3.1 46.1
Total 1477.8 100 1477.8 100
Source: Derived from the 1973 Landsat & 2007 SPOT images interpretation (Berhan et al. 2014).
The LULC statistical data of this study are extracted from Berhan et al. (2014). Remotely sensed satellite images interpretation results revealed that the study watershed was dominantly covered with cultivated lands (55%) and a range of land cover components (forest, grass, shrub and plantations)
Berhan Gessesse and Woldeamlak Bewket
10
(37.7%) in 1973. The remaining 7.3% of the study area was covered by bare land, urban settlement, water bodies and marsh land. In 2007, about 74.9% of the watershed area was covered by cultivated land. About 25% of the watershed was covered with the remaining eight LULC types in the same year. Specifically, areas in bare land, cultivated, plantations, urban and water bodies expanded by 28.6%, 36.2%, 129.9%, 37.9% and 46.1%, respectively, at the expense of other land cover types whereas forest, grassland, shrub land and marshland declined by 74.3%, 74.8%, 28.6% and 40.9% since 1973, respectively, primarily due to conversion into cultivated, built-up and bare land categories (Table 3).
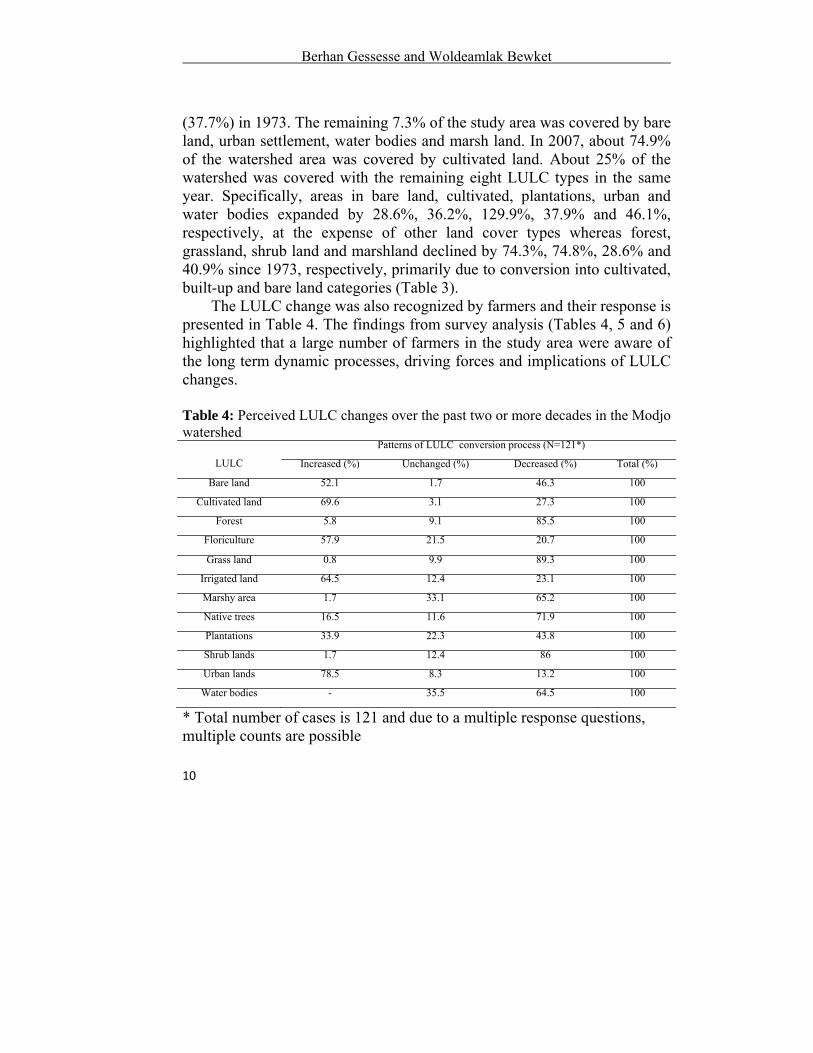
The LULC change was also recognized by farmers and their response is presented in Table 4. The findings from survey analysis (Tables 4, 5 and 6) highlighted that a large number of farmers in the study area were aware of the long term dynamic processes, driving forces and implications of LULC changes. Table 4: Perceived LULC changes over the past two or more decades in the Modjo watershed
LULC
Patterns of LULC conversion process (N=121*)
Increased (%) Unchanged (%) Decreased (%) Total (%)
Bare land 52.1 1.7 46.3 100
Cultivated land 69.6 3.1 27.3 100
Forest 5.8 9.1 85.5 100
Floriculture 57.9 21.5 20.7 100
Grass land 0.8 9.9 89.3 100
Irrigated land 64.5 12.4 23.1 100
Marshy area 1.7 33.1 65.2 100
Native trees 16.5 11.6 71.9 100
Plantations 33.9 22.3 43.8 100
Shrub lands 1.7 12.4 86 100
Urban lands 78.5 8.3 13.2 100
Water bodies - 35.5 64.5 100
* Total number of cases is 121 and due to a multiple response questions, multiple counts are possible
EJOSSAH Vol. X, No.2 December 2014
11
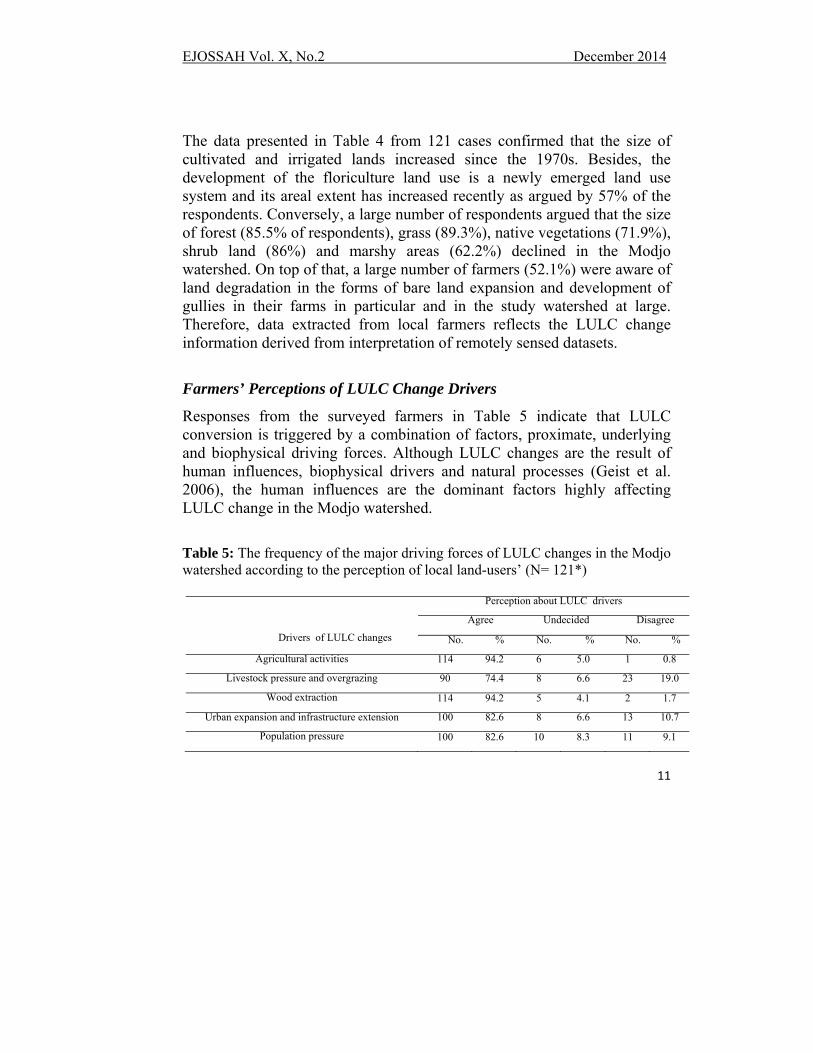
The data presented in Table 4 from 121 cases confirmed that the size of cultivated and irrigated lands increased since the 1970s. Besides, the development of the floriculture land use is a newly emerged land use system and its areal extent has increased recently as argued by 57% of the respondents. Conversely, a large number of respondents argued that the size of forest (85.5% of respondents), grass (89.3%), native vegetations (71.9%), shrub land (86%) and marshy areas (62.2%) declined in the Modjo watershed. On top of that, a large number of farmers (52.1%) were aware of land degradation in the forms of bare land expansion and development of gullies in their farms in particular and in the study watershed at large. Therefore, data extracted from local farmers reflects the LULC change information derived from interpretation of remotely sensed datasets.
Farmers’ Perceptions of LULC Change Drivers
Responses from the surveyed farmers in Table 5 indicate that LULC conversion is triggered by a combination of factors, proximate, underlying and biophysical driving forces. Although LULC changes are the result of human influences, biophysical drivers and natural processes (Geist et al. 2006), the human influences are the dominant factors highly affecting LULC change in the Modjo watershed.
Table 5: The frequency of the major driving forces of LULC changes in the Modjo watershed according to the perception of local land-users’ (N= 121*)
Drivers of LULC changes
Perception about LULC drivers
Agree Undecided Disagree
No. % No. % No. %
Agricultural activities 114 94.2 6 5.0 1 0.8
Livestock pressure and overgrazing 90 74.4 8 6.6 23 19.0
Wood extraction 114 94.2 5 4.1 2 1.7
Urban expansion and infrastructure extension 100 82.6 8 6.6 13 10.7
Population pressure 100 82.6 10 8.3 11 9.1

Berhan Gessesse and Woldeamlak Bewket
12
Uses of trees for income generation 106 87.6 4 3.3 25 20.7
Better market and road accessibility 85 70.3 23 19.0 13 10.7
Land tenure system and limited transfer rights 57 47.1 19 15.7 48 39.7
Physiography of the watershed (slope nature,
accessibility) 109 90.1 6 5.0 6 5.0
Rainfall variability and drought occurrences 107 88.4 4 3.3 10 8.3
* Total number of cases is 121 and due to a multiple response questions, multiple counts are possible.
Proximate Driving Forces
Agricultural Activities: Subsistence rain-fed farming and livestock husbandry are the major livelihoods of the rural community in the Modjo watershed. As the study area is a typical rain-fed farming system, smallholder agricultural land expansion at the expense of other land covers is by far the most widespread proximate driver of land use dynamics and related land cover and ecosystem changes. The change detection analysis based on remotely sensed data showed that 294 km2 areas of grass, forest, plantations, shrub and marsh land covers were changed into cultivated land between 1973 and 2007 (Table 3). Moreover, extensive areas of private woodlots, grazing lands, communal shrub and woodlands, state forests and plantation were changed to cultivated land as reported by 94.2% of respondents (Table 4). Free grazing in vulnerable steep slope sites is also one of the major drivers of land cover change. As shown in Table 5, 74.4% of respondents reported that increasing livestock population and livestock density along with prevalence of free grazing system are major causes of land cover change and land degradation. Shiberu and Kifle (1998), Badege (2001), MoARD and WB (2007), and MoARD and SLM Secretariat (2008) also concluded that the dominant mixed farming practices in the highlands of Ethiopia without appropriate and integrated land management practices were major driving forces of vegetation cover loss and land degradation. Wood Extraction: Wood extraction to fulfill the demand of fuel and pole woods is one of the major drivers for clearing extensive area of vegetation
EJOSSAH Vol. X, No.2 December 2014
13
cover and trees in Ethiopia in general. Felling of trees for firewood, charcoal and constructional materials without replacement is a critical problem contributing to the loss of various forms of vegetation in general and native tree species in particular. In this regard, a study conducted by Geist and Lambin (2001) indicated that harvesting of fuel and pole woods for commercial purposes and domestic uses were the leading causes of deforestation in Africa, Latin America and Asia. As Table 3 shows, between 1973 and 2007, forest, shrub and grasslands declined by 74.7%, 74.8% and 40.9%, respectively. About 340 km2 of vegetation cover was converted into other land-use systems like cultivated land and built up areas. A large number of respondents (90.2%) suggested that wood cutting for the fulfillment of domestic uses was the most prevalent driving force of vegetation destruction. The majority of the surveyed farmers (87.6%) also noted that some households that are very poor were engaged in cutting and selling of trees for income generation. Discussion with elders and local natural resource conservation experts also confirmed that the increasing demand of tree products such as fuel wood, construction materials and charcoal for domestic uses in and around the Modjo watershed was one of the major driving forces of land cover change. Therefore, the findings of this study support the assumption that poverty is a cause for land resource degradation, as argued by the political ecology school of thought advocates such as Jolly (1994), De Sherbinin et al. (2007) and Andersson et al. (2011) just to mention a few. Infrastructure and Settlement Expansion: Information derived from change detection analysis using remotely sensed data confirmed that the expansion of infrastructure such as urban and rural settlements, road network and reservoir construction (e.g. Wedecha and Belbela reservoirs) increased by 38% at the expense of other LULC units in the Modjo watershed since the 1970s (Table 3). Some 82% of the respondents also argued that the expansion of built-up areas was a cause of LULC change in the Modjo watershed. Previous studies also highlighted that better market and road infrastructure availability were driving forces of LULC changes (Lambin et al. 2003, Geist and Lambin 2004, Geist et al. 2006). In this respect, 85% of respondents argued that road accessibility and better market
Berhan Gessesse and Woldeamlak Bewket
14
opportunities for pole wood, fuel wood and charcoal as well as various forms of agricultural outputs are also the conditioning factors for land cover change in the study site. Based on reconnaissance field survey almost all parts of the watershed have become accessible by all-weather roads and there are big markets nearby like Addis Ababa, Bishoftu and Adama. This market accessibility stimulates the expansion of crop and grazing lands into vegetation covers like natural forest, plantations as well as shrub lands, and consequently leads to the LULC change processes. Underlying Drivers Demographic Factors: The demographic characteristics mainly population growth and density are indirect factors for LULC conversion through the growing needs for additional lands for farming and grazing as well as demands for tree products (fuel and construction wood). In this regard, recent studies concluded that land cover conversion due to demographic pressure are more serious largely in tropical regions such as Latin America, Africa and Southeast Asia (Lambine et al. 2003, Geist and Lambin 2004, Geist et al. 2006). The land cover conditions of the Ethiopian highlands have also been modified or significantly transformed by the rapidly increasing population pressure and growing livestock population. Human population in the highlands has grown fast on the limited land area and almost every piece of land is converted into cultivated land to produce food (Solmon 1994, Badege 2001, Woldeamlak 2002, Alemneh 2003, Hurni et al. 2005). Like elsewhere in the country, the study area watershed has experienced fast population growth (Table 6, CSA, 2010).
Table 6: Population growth in 5 districts in and around Modjo watershed between 1994 & 2010
Districts
Area(km2)a
Populationb Growth b/n
1994 &2007 Densityd
Portion of the watershed
in each district (%) 1994b 2010c
Ada'a 934.4 234,614 263,358 28,744 281.9 25.7
Akaki 582.6 53,886 85,219 31,333 146.3 16.0
EJOSSAH Vol. X, No.2 December 2014
15
Berhe 736.5 77,967 88,916 10,949 120.7 20.3
Gimbich
u 705.2
62,561 94,427
31,866 133.9 19.4
Lomme 675.2 93,007 12,7564 34,557 188.9 18.6
Total 3633.9 522,035 625,131 103,096 172.03 100
Data source: a) CSA 2007 Ethiopian administrative digital datasets, b) the 1994 Hosing and Population Census of
Ethiopia, c) 2010 CSA Report, d) the density is calculated based on 2010 population data.
The high population growth increases the demand for land for agricultural activities and biomass as the source of fuel and construction materials. Due to the increase in food and fuel wood demands resulting from population pressure, local farmers are forced to push farm lands at the expense of vegetation cover (forest, shrub lands and grasslands) in the more marginal and fragile landscapes, for instance, along the buffer zones of highly degraded lake, Lake Chelekleka and even above the timberline of the Yerer mountain. Over 82% of the surveyed farmers indicated that rapidly growing population pressure is one of the major driving forces of LULC change and related land degradation in the study area (Table 5). Key informants also asserted that land holding per capita had declined due to the increasing population pressure. This situation has created pressure on the limited land for agricultural production. This is a clear evidence in favor of the Malthusian and Neo-Malthusian theoretical premise and the stand of political ecologist school of thought regarding population dynamics, land system change and resource degradation (Malthus 1798, Jolly 1994, Panayotou 2000, Geist et al. 2006, De Sherbinin et al. 2007, Andersson et al. 2011).
Property Rights Issues: Land tenure arrangement affects the utilization of land resources and land management investment decisions. In this regard, Fitsum et al.(1999), Lakew et al. (2000), Bezuayehu et al. (2002), MoARD and WB (2007) and MoARD and SLM Secretariat (2008) argued that easily transferable and secure property rights have long been identified as key elements to bring about natural resources conservation, sustained use of
Berhan Gessesse and Woldeamlak Bewket
16
resources and investments on land resources management. Under the current land tenure policy of Ethiopia, land is public property and land users have only use rights. Short-term leasing or sharecropping is allowed, however, land cannot be sold, exchanged, or mortgaged (MoARD and WB 2007). Since the utilization of land resources and application of land resource management practices involve long-term investments, land tenure security is an important consideration for sustained use of land resources. Results from discussions with key informants and interviews with household heads showed mixed arguments. About 47% of respondents suggested that the existing tenure system had negative effects on LULC change and contributed to land degradation, whereas 15.7% of respondents did not agree with this view and 39.7% of respondents were unable to judge on this. Some key informants highlighted that the existing land tenure system had undermined farmers' motivation for sustainable land management and tree planting.
Biophysical Factors
Low lying zones and flat topography, natural fires, climate variability and droughts are some of the possible biophysical triggers for LULC change mainly in Africa, Latin America and Asia (Lambin et al. 2003, Geist et al. 2006). In this context, elders, local natural resource conservation experts and interviewed household heads argued that the general topography of the Modjo watershed was one of the biophysical factors conditioning LULC changes. Landscape restrictions such as steep slopes and inaccessibly high elevation zones played a key role in protecting and preserving forests, shrub and grass vegetation covers. However, about 81.3% and 92.4% of the Modjo watershed lies between 1760 m and 2300 m elevation and less than 150 slope inclination, respectively (Berhan et al. 2014). From a topographic point of view, most parts of the watershed are easily accessible by local land-users. This condition has contributed to the expansion of various forms of agricultural activities at the expense of vegetation cover. In this regard, 90.1% of respondents argued that the remnants of natural and plantation vegetation covers found in the flat and gently sloping areas are highly vulnerable to deforestation and conversion into other land use systems
EJOSSAH Vol. X, No.2 December 2014
17
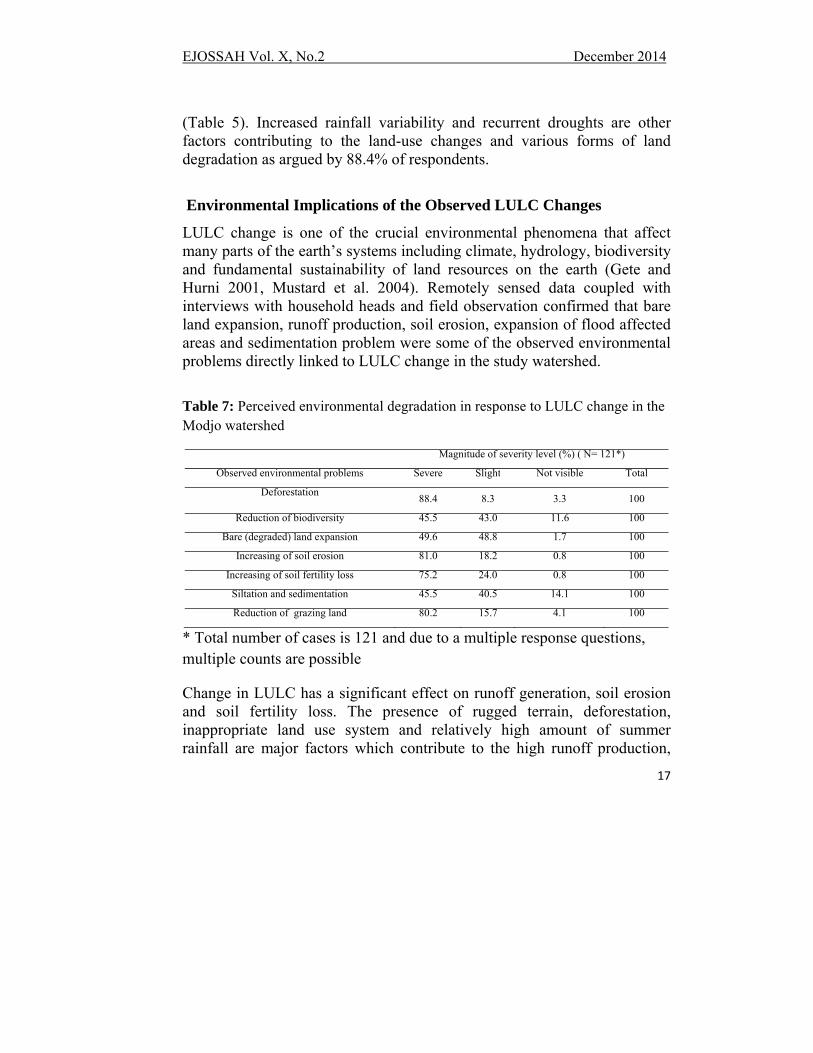
(Table 5). Increased rainfall variability and recurrent droughts are other factors contributing to the land-use changes and various forms of land degradation as argued by 88.4% of respondents.
Environmental Implications of the Observed LULC Changes
LULC change is one of the crucial environmental phenomena that affect many parts of the earth’s systems including climate, hydrology, biodiversity and fundamental sustainability of land resources on the earth (Gete and Hurni 2001, Mustard et al. 2004). Remotely sensed data coupled with interviews with household heads and field observation confirmed that bare land expansion, runoff production, soil erosion, expansion of flood affected areas and sedimentation problem were some of the observed environmental problems directly linked to LULC change in the study watershed.
Table 7: Perceived environmental degradation in response to LULC change in the Modjo watershed
Magnitude of severity level (%) ( N= 121*)
Observed environmental problems Severe Slight Not visible Total
Deforestation 88.4 8.3 3.3 100
Reduction of biodiversity 45.5 43.0 11.6 100
Bare (degraded) land expansion 49.6 48.8 1.7 100
Increasing of soil erosion 81.0 18.2 0.8 100
Increasing of soil fertility loss 75.2 24.0 0.8 100
Siltation and sedimentation 45.5 40.5 14.1 100
Reduction of grazing land 80.2 15.7 4.1 100
* Total number of cases is 121 and due to a multiple response questions, multiple counts are possible
Change in LULC has a significant effect on runoff generation, soil erosion and soil fertility loss. The presence of rugged terrain, deforestation, inappropriate land use system and relatively high amount of summer rainfall are major factors which contribute to the high runoff production,
Berhan Gessesse and Woldeamlak Bewket
18
soil erosion, soil fertility loss, and bare land expansion and gully formation in the study watershed. As Table 3 shows, the size of bare land had expanded by 28.6% since the 1970s. Furthermore, the impact of LULC change on surface runoff generation and soil erosion in the watershed was simulated using the ArcSWAT (Soil and Water Assessment Tool) model (Berhan et al. 2014). Results showed that vegetation cover loss and increasing of bare and farming lands led to increases in surface runoff generation (by 14.1%) and soil losses (by 37%) since 1970s. This high surface runoff and soil erosion leads to the occurrence of significant soil nutrient losses in the upstream part and siltation and sedimentation problems in the downstream part. Similarly, about 81%, 75% and 50% of the respondents argued that increasing soil erosion, soil fertility loss and bare land expansion, respectively, were some of the observed environmental consequences that resulted from LULC changes (Table 7). Concluding Remarks The objective of this study was to explore the major driving forces of LULC change and their environmental implications in the Modjo watershed. Long term watershed level LULC change detection analysis is mostly done using remotely sensed images, however, this study verified that household level survey data provide an equally important source of information and even additional details can be extracted regarding the magnitude, driving forces and environmental and socioeconomic impacts of LULC changes. The study found that significant LULC change has occurred in the study area, with associated land resource degradation. The major changes observed include expansion of cultivated land, bare land expansion, and loss of wetlands.
Proximate factors (the traditional practices of farming and overgrazing, wood extraction and infrastructure extension), underlying pressures (demographic pressure coupled with poverty, the land tenure system) and biophysical factors (the topography of the watershed) are the key drivers of LULC change in the study site. Hence, addressing the underlying drivers such as balancing human population pressure with available land resources, devising policies and programs for sustainable utilization of natural

EJOSSAH Vol. X, No.2 December 2014
19
resources, and community-based watershed management will be required to ensure sustainable local development in the study area.
Acknowledgements: This research was financed by research grants from the Graduate School of Addis Ababa University and the German Academic Exchange Service (DAAD). Special thanks also go to Zone and Woreda natural resources conservation experts, extension workers as well as local farmers for their willingness and cooperation during fieldwork.
References
Aklilu Amsalu, and De Graaff, J., 2007. "Determinants of adoption and continued use of stone terraces for soil and water conservation in the Ethiopian highlands." Ecological Economics, 61: 294-302.
Aklilu Amsalu, Stroosnijder, L., and De Graaff, J., 2007. "Long-term dynamics in land resource use and the driving forces in the Beressa watershed, highland Ethiopia." Journal of Environmental Management, 83: 448-459.
Alemneh Dejene. 2003. Integrated natural resources management to enhance food security. FAO, Rome.
Alemu Mekonnen and Damte Abebe. 2011. Private trees as household assets and determinants of tree-growing behavior in rural Ethiopia. EfD Discussion Paper 11-14. Resources for the Future and Environment for Development, Washington, DC and Gothenburg.
Andersson, E., Brogaard, S. and Olsson , L., 2011. "The political ecology of land degradation." The Annual Review of Environment and Resources, 36: 295-319.
Badege Bishaw. 2001. "Deforestation and land degradation in the Ethiopian Highlands: A strategy for physical recovery." Northeast African Studies, 8(1): 7-25.
Berhan Gessesse, Woldeamlak Bewket and Achim B., 2014. "Model-based characterization and monitoring of runoff and soil erosion in response
Berhan Gessesse and Woldeamlak Bewket
20
to land use/land cover changes in the Modjo watershed, Ethiopia." Land degradation and Development, In press DOI: 10.1002/ldr.2276.
Berhanu Gebremedhin and Swinton, S.M., 2003. "Investment in soil conservation in northern Ethiopia: the role of land tenure security and public programs." Agricultural Economics, 29: 69-84.
Bezuayehu Tefera and Sterk, G., 2008. "Hydropower-induced land use change in Fincha’ watershed, western Ethiopia: analysis and impacts." Mountain Research and Development, l28: 72-80.
Bezuayehu Tefera, Gezehagn Ayele, Yigezu Atnafe, Jabbar, M.A., and Dubale, P., 2002. Nature and causes of land degradation in the Oromiya Region: A review. Socio-economics and Policy Research Working Paper 36. International Livestock Research Institute (ILRI), Nairobi, Kenya.
CSA (Central Statistical Agency), 2010. Statistical abstract. Addis Ababa, Ethiopia.
Dessalegn Rahamto. 2001. Environmental change and state policy in Ethiopia: Lessons from past experience. Forum for social studies monograph series, 2. Forum for Social Studies, Addis Ababa.
De Sherbinin, A., Carr, D., Cassels, S. and Jiang, L., 2007. "Population and environment." The Annual Review of Environment and Resources, 32:345-373.
FAO. 2006. A framework for international classification, correlation and communication. World Soil Resources Reports 103. Rome, Italy.
Fitsum Hagos and Holden, S., 2006. Tenure security, resource poverty, public programs, and household plot-level conservation investments in the highlands of northern Ethiopia. Agricultural Economics, 34:183–196.
Geist, H., McConnell, W., Lambin, E. F., Moran, E., Alves, D. and Rudel, T., 2006. "Causes and trajectories of land-use/cover change" In E. F. Lambin and H. Geist, editors. Land-use and land-cover change: Local processes and global impact. Berlin: Springer, 41-70.
Geist, H.J, Lambin, E.F., 2004. "Dynamic causal patterns of desertification." BioScience, 54:817–829.
Geist, H. J., Lambin, E.F., 2001. What drives tropical deforestation? A meta-analysis of proximate and underlying causes of deforestation
EJOSSAH Vol. X, No.2 December 2014
21
based on sub-national case study evidence. LUCC Report Series No. 4, LUCC International Project Office, Louvain-la-Neuve.
Gete Zeleke and Hurni, H., 2001. "Implications of land use and land cover dynamics for mountain resource degradation in the Northwestern Ethiopian Highlands." Mountain Research and Development, 21:184–191.
Hurni, H., Kebede Tato and Gete Zeleke. 2005. "The implications of changes in population, land use, and land management for surface runoff in the upper Nile Basin area of Ethiopia. Mountain Research and Development, 25: 147–154.
Hurni, H.,1998. Agroecological belts of Ethiopia. Centre for Development and Environment. Wittwer Druck AG: Bern.
Jolly, C.L., 1994. "Four theories of population change and the environment." Population and Environment:16:61–90.
Kebrom Tekle and Hedlund, L., 2000. "Land cover changes between 1958 and 1995 in Kalu District, Southern Wello, Ethiopia." Mountain Research and Development, 20: 42–51
Lakew, Desta., Minale Kassie, Benin, S. and Pender, J., 2000. Land degradation in the highlands of Amhara Region and strategies for sustainable land management. Livestock Policy Analysis Program, Working Paper No. 32. International Livestock Research Institute (ILRI), Nairobi, Kenya.
Lambin, E. F., Geist, H., Rindfuss, R.R., 2006. "Introduction: Local processes with global impacts" In E. F. Lambin and H. Geist, editors. Land-use and land-cover change: Local processes and global impact. Berlin: Springer, 1–7.
Lambin E.F., Geist, H.J. and Lepers, E., 2003. "Dynamics of land use and cover change in tropical and subtropical regions." The Annual Review of Environment and Resources, 28:205-241.
Malthus, T., 1798. An essay on the principle of population. London: Printed for J. Johnson, in ST. Paul’s church-Yard.
Millennium Ecosystem Assessment. 2005. Ecosystems and Human Well-Being: General Synthesis. Washington, DC: Island Press.
Ministry of Agriculture and Rural Development and Sustainable Land Management Secretariat (MoARD and SLM Secretariat). 2008.
Berhan Gessesse and Woldeamlak Bewket
22
Ethiopian strategic investment framework for sustainable land management. Ministry of Agriculture and Rural Development, Addis Ababa, Ethiopia.
Ministry of Agriculture and Rural Development and World Bank (MoARD and WB). 2007. Ethiopia: Thematic papers on land degradation in Ethiopia. Ministry of Agriculture and Rural Development and World Bank publication, Addis Ababa
Mohammed Assen and Tassew Nigussie. 2009. "Land use/Land cover changes between 1966 and 1996 in Chirokella micro watershed, southern Ethiopia." East African Journal of Sciences, 3: 1-8..
Mustard, J., DeFries, R., Fisher T. and Moran, E., 2004. "Land-use and land-cover change pathways and impacts" In G. Gutman, A. Janetos, C. Justice, E. Moran, J. Mustard, R. Rindfuss, et al., editors. Land Change Science: Observing Monitoring and Understanding Trajectories of Change on the Earth’s Surface, Dordrecht: Kluwer Academic Publishers, 411-430.
Ojima D. S., Galvin, K.A. and Turner B. L. II., 1994. "The global impact of land use change." Bioscience, 44: 300–304.
Panayotou, T., 2000. Population and Environment: Environment and Development Paper No.2. CID Working Paper No. 54. Harvard University Center for International Development: Harvard.
Shiberu Tedla and Kifle Lemma. 1998. Environmental management in Ethiopia: Have the national conservation plans worked? Environmental Forum Publications Series, No.1. OSSREA, Addis Ababa.
Shiferaw, Bekele and Holden, S., 1998. Resource degradation and adoption of land conservation technologies in the Ethiopian highlands: a case study in Andit Tid, North Shewa. Agric. Econ, 18: 233–247.
Solomon Abate. 1994. Land use dynamics, soil degradation and potential for sustainable use in Metu Area, Illubaor Region, Ethiopia. Thesis (PhD), University of Berne, Berne.
Turner, B.L. II and Meyer, W.B., 1994. "Global land-use and land-cover change: An overview." In W.B. Meyer, Turner B.L. II, editors. Changes in land use and land cover: A global perspective. Cambridge,
EJOSSAH Vol. X, No.2 December 2014
23
New York and Melbourne: Press Syndicate of the University of Cambridge, 3-10.
United Nations Environmental Programme (UNEP). 2000. Global environmental outlook 2000. http://www.unep.org /geo2000 /English /index.htm. [Accessed 4 November 2012].
Vivero, J.L., Kelbessa, E. and Demissew, S., 2005. The red list of endemic trees and shrubs of Ethiopia and Eritrea. Cambridge: Fauna & Flora International.
Wegeayehu Bekele and Drake, L., 2003. "Soil and water conservation decision behavior of subsistence farmers in the Eastern Highlands of Ethiopia: a case study of the Hunde-Lafto area." Ecological Economics, 46: 437- 451.
Woldeamlak Bewket. 2007. "Soil and water conservation intervention with conventional technologies in northwestern highlands of Ethiopia: acceptance and adoption by farmers." Land Use Policy, 24: 404–416.
Woldeamlak Bewket. 2002." Land cover dynamics since the 1950s in Chemoga Watershed, Blue Nile Basin, Ethiopia." Mountain Research and Development, 22: 263-269.
Woldeamlak Bewket and Sterk, G., 2002. "Farmers' participation in soil and water conservation activities in the Chemoga watershed, Blue Nile basin, Ethiopia." Land Degradation and Development, 13:189 - 200.


![storage.googleapis.com€¦ · [katheryne davis] [and heirs and assigns] [john mchale] [and heirs and assigns] [ricki reese] [and heirs and assigns] [nicole phelps] [and heirs and](https://img.pdfslide.us/doc/110x75/5f06dad27e708231d41a1204/katheryne-davis-and-heirs-and-assigns-john-mchale-and-heirs-and-assigns.jpg)