Embed Size (px)
Citation preview
8966
ABSTRACT
Current breeding tools aiming to improve feed ef-ficiency use definitions based on total dry matter intake (DMI); for example, residual feed intake or feed saved. This research aimed to define alternative traits using existing data that differentiate between feed intake ca-pacity and roughage or concentrate intake, and to inves-tigate the phenotypic and genetic relationships among these traits. The data set contained 39,017 weekly milk yield, live weight, and DMI records of 3,164 cows. The 4 defined traits were as follows: (1) Feed intake capacity (FIC), defined as the difference between how much a cow ate and how much she was expected to eat based on diet satiety value and status of the cow (parity and lactation stage); (2) feed saved (FS), defined as the dif-ference between the measured and the predicted DMI, based on the regression of DMI on milk components within experiment; (3) residual roughage intake (RRI), defined as the difference between the measured and the predicted roughage intake, based on the regression of roughage intake on milk components and concentrate intake within experiment; and (4) residual concentrate intake (RCI), defined as the difference between the measured and the predicted concentrate intake, based on the regression of concentrate intake on milk com-ponents and roughage intake within experiment. The phenotypic correlations were −0.72 between FIC and FS, −0.84 between FS and RRI, and −0.53 between FS and RCI. Heritability of FIC, FS, RRI, and RCI were estimated to be 0.21, 0.12, 0.15, and 0.03, respec-tively. The genetic correlations were −0.81 between FS and FIC, −0.96 between FS and RRI, and −0.25 between FS and RCI. Concentrate intake and RCI had low heritability. Genetic correlation between DMI and FIC was 0.98. Although the defined traits had moder-ate phenotypic correlations, the genetic correlations between DMI, FS, FIC, and RRI were above 0.79 (in
absolute terms), suggesting that these traits are geneti-cally similar. Therefore, selecting for FIC is expected to simply increase DMI and RRI, and there seems to be little advantage in separating concentrate and roughage intake in the genetic evaluation, because measured con-centrate intake was determined by the feeding system in our data and not by the genetics of the cow.Key words: feed efficiency, DMI, feed saved, breeding goal
INTRODUCTION
Feed costs are approximately 50% of total costs on a dairy farm (FADN, 2011). Selection on feed ef-ficiency in dairy cattle can lead to reduced feed costs, as animals will require less feed for milk production. Additionally, selection on feed efficiency could lead to genetic improvement and reduction of methane excre-tion (Arthur and Herd, 2005; de Haas et al., 2017). Therefore, breeding for feed-efficient cows has become even more important over the past few years.
To breed for feed efficiency, feed intake and produc-tion records need to be recorded, and feed efficiency traits need to be defined to estimate (genomic) breed-ing values for these traits. Subsequently, breeding values can be used to breed for feed efficiency in the required direction. The definition of feed efficiency in dairy cows has undergone scientific debate for a long time (Veerkamp, 1998; Berry and Crowley, 2013; Veerkamp et al., 2013; Pryce et al., 2015; Hurley et al., 2017; Tempelman and Lu, 2020). Major elements of this debate are summarized here. Feed efficiency can be calculated as gross feed efficiency or feed conversion ra-tio, which is easier to understand for the end user (e.g., farmers). However, these ratio traits favor animals with high milk production rather than net efficient cows, because maintenance costs are diluted (Veerkamp and Emmans, 1995). Furthermore, it is difficult to predict the response to selection for the underlying traits (e.g., feed intake, production traits) and feed efficiency when selection is for the ratio trait (Gunsett, 1984) because of dependencies between the variance and covariance
Breeding goal traits accounting for feed intake capacity and roughage or concentrate intake separatelyMargreet Heida, Ghyslaine C. B. Schopen, Marinus F. W. te Pas, Birgit Gredler-Grandl, and Roel F. Veerkamp* Wageningen University & Research Animal Breeding and Genomics, PO Box 338, 6700 AH Wageningen, the Netherlands
J. Dairy Sci. 104:8966–8982https://doi.org/10.3168/jds.2020-19533© 2021, The Authors. Published by Elsevier Inc. and Fass Inc. on behalf of the American Dairy Science Association®. This is an open access article under the CC BY-NC-ND license (http://creativecommons.org/licenses/by-nc-nd/4.0/).
Received August 27, 2020.Accepted April 20, 2021.*Corresponding author: Roel.Veerkamp@ wur .nl
8967
Journal of Dairy Science Vol. 104 No. 8, 2021
components and the mean of the underlying traits (Veerkamp and Emmans, 1995). Also, improving feed efficiency ratios does not necessarily lead to improve-ment of energy conversion toward milk (Veerkamp and Emmans, 1995). Alternatively, efficiency has been de-fined as the linear difference between the observed and the expected feed intake, as is the case for residual feed intake (RFI), which is calculated as the residuals of the regression of milk production and other energy sinks on feed intake (Koch et al., 1963; Veerkamp et al., 1995; Li et al., 2020). The RFI is phenotypically independent of its regressors by construction and not affected by the dilution of maintenance costs by increased milk yield, unlike gross efficiency or feed conversion ratio. So far, RFI is the closest approximation of net feed efficiency (Veerkamp et al., 2013), although it might be sensitive to inaccurately modeled factors that could also lead to variation in residuals (Li et al., 2017), or to an imperfect regression model used to calculate RFI. Using RFI has another major disadvantage for dairy cows: RFI is, by construction, independent of (metabolic) weight; there-fore, a very heavy cow gets a favorable RFI if she ate less than expected based on her milk production and body weight. In fact, if 2 cows of different body weight eat the same amount and have the same milk produc-tion, the heavier cow gets the best RFI as the most net efficient. However, the heavier cow will necessarily allocate more energy to maintenance. A suggested al-ternative could be feed saved (FS), defined as the feed saved when the animal consumes less feed than other animals to produce the same amount of milk (Pryce et al., 2015). For FS, animals are penalized for extra body weight as well. A larger animal gets a less-favorable value for FS compared with a smaller animal. This debate about the definition of efficiency remains lively because of the difficulty of defining the exact sources of genetic variation, which is often investigated with overly limited data (Veerkamp and Emmans, 1995).
Another issue related to the definition of feed ef-ficiency in the definition of current breeding goals is the lack of differentiation between roughage and con-centrate intake. Especially now, the aim is to increase the amount of roughage (human-inedible food) in the ration of Dutch dairy cows. Sixty-five percent of dietary protein has to be produced in the Netherlands from the year 2025 onward (Kleijne et al., 2018). This can be achieved by increasing the amount of grass in the ration while reducing maize and concentrate (Hilhorst, 2018). Also, based on nutritional models, it could be argued that cows that eat more roughage per kilogram of milk can be fed less concentrate and can also convert more grass into milk (Groen and Korver, 1989; Harrison et al., 1990; Veerkamp, 1998; Buckley et al., 2005). This hypothesis that cows should eat more roughage is also
used by breed-oriented breeders who prefer big and heavy cows. The answer to the question of whether we should breed for cows that can eat more roughage is partly economic and depends on the cost of roughage versus concentrate (Koenen et al., 2000).
Nutritional model predictions ignore genetic varia-tion between animals and the ability to reduce yield production on a given diet, which has been shown in classic genotype by environment interaction (G×E) experiments (Pryce et al., 1999; Coffey et al., 2004). Also, Veerkamp et al. (2018) investigated whether we should select for cows that can eat more or cows that are more efficient, from the viewpoint of G×E. In that study, DMI data were divided between high concentrate versus high roughage-based rations, and heritability and genetic correlations were estimated for these 2 distinct traits, which can be seen as 2 different environments. Then selection responses were predicted for either a high concentrate or high roughage-based ra-tion. There was too little evidence for G×E to suggest that selecting for increased DMI on the high roughage ration is beneficial for performance on the high rough-age-based ration. The study presented here addresses the same question about concentrate versus roughage efficiency but from a different viewpoint. Rather than investigating G×E for total DMI, the objective here was to use existing data, which is used in the national genetic evaluations for DMI, to define alternative traits related to feed intake capacity and roughage or concen-trate intake separately and quantify their phenotypic and genetic parameters, an approach that was also used by Tarekegn et al. (2021). Insight on these novel traits might help to judge whether it is worthwhile to separate these traits in the genetic evaluation, to breed for intake capacity or to breed for concentrate- or roughage-efficient cows separately.
MATERIALS AND METHODS
Data Description
The data used in this study were a subset of the data used for the national DMI genetic evaluations in the Netherlands and were collected during several short- and long-term experiments on farms of Wagenin-gen University & Research in the Netherlands [Aver Heino (Heino), Bosma Zathe (Ureterp), Cranendonck (Soerendonk), t Gen (Lelystad), Minderhoudhoeve (Swifterbant), Waiboerhoeve Dairy Unit 2 and 3 (Lely-stad), Zegveld Farm (Zegveld), Hoorn (Lelystad), New Wairboerhoeve (Lelystad), and Dairy Campus (Leeu-warden)]. A description of the methodology of most ex-periments has been summarized previously (Veerkamp et al., 2000; Beerda et al., 2007; Zom et al., 2012; Man-
Heida et al.: DAIRY CATTLE ROUGHAGE AND CONCENTRATE INTAKE
Journal of Dairy Science Vol. 104 No. 8, 2021
8968
zanilla Pech et al., 2014; van Knegsel et al., 2014). All cows were kept indoors in conventional cubicle hous-ings and were offered partial mixed diets ad libitum, and concentrate was given in separate dispensers on an individual-cow basis. The amount of concentrate dis-pensed varied by each experiment, reflecting common practices in the Netherlands. Cows were milked twice per day, except for 50 cows at Bosma Zathe (n = 50), which were milked 3 times per day. Individual animal DMI were transformed to weekly measurements by averaging over 7-d (or sometimes 5-d) measurements. Roughage DMI (DMIR) was the partial mixed ration fed to the cows (mainly grass and maize silage, but of-ten complemented with other products), whereas con-centrate DMI (DMIC) was the amount of concentrate fed separately in the concentrate dispenser or milking parlor. Only those weekly DMI records were kept that had milk yield, fat and protein production, and cow live weight (LW) measured in the same week.
Experiments with a concentrate portion of 1 kg/d or less were discarded because a TMR was fed to these cows. After excluding extreme experiments and delet-ing records with milk yield below 5 kg of milk/day, 0.3 kg of fat/day, and 0.3 kg of protein/day, the new traits were calculated. For the analysis of the traits, records between ±3 standard deviations (SD) from the mean were retained for all traits. The final data set (Table 1) contained 39,017 records from 3,164 cows of 789 sires and 2,471 dams, and 1,073 dams also had records them-selves. Sires had on average 3.9 daughters, ranging from 1 to 54 daughters per sire.
Definition of Traits
Four different traits were defined: feed intake capac-ity (FIC), FS, residual roughage intake (RRI), and residual concentrate intake (RCI). With FIC, we aimed to measure how much a cow ate in relation to how much she was expected to eat based on her diet: FIC = DMImeasured − DMIexpected. A high value for FIC means that the cow ate more dry matter than expected
based on the dairy cow nutrition model (Zom, 2014). The DMIexpected was calculated as the expected feed intake (EFI), divided by the satiety value (SV) of that diet: DMIexpected = EFI/SV. The expected feed intake is calculated as follows (Zom, 2014):
EFI e ea e d
= + × −( )
×− × × − − ×
8 743 3 563 1 1 140 0 1365 1 0 05889
. . . . .(( )
× − ×
1 0 05529
220. ,
g
where a combines the parity and the DIM, a = parity − 1 + d/365, d represents DIM, e represents the exponen-tial constant, and g represents the days that the animal is pregnant. Insemination data were not available in this data set; therefore, it was assumed that cows were pregnant from d 130 in lactation onward. This assump-tion was based on the average calving interval in the Netherlands, 410 d (CRV, 2019), and the duration of pregnancy, 280 d.
The satiety value (Zom, 2014) of the ration was cal-culated here as
SV = c1 × percentage roughage + c2
× percentage concentrates.
Percentage roughage or concentrate means the percent-age of roughage or concentrate DM per DM of the diet; c1 and c2 represent diet-specific constants based on, for example, energy and fiber content. Specific information on the c1 and c2 for each diet in each experiment was not available, except for amounts of roughage and con-centrate intake. Therefore, constants were taken from the national nutritional guidelines for maize and grass silage (c1 = 1) and for concentrates (c2 = 0.34; CVB, 2019).
Feed saved was defined as the difference between the measured DMI and the expected DMI based on fat and protein yield. Unlike definitions of RFI, it was not regressed on LW, and a positive value is favorable. Feed saved was defined as the negative residuals of the following regression:
DMIij = exptreatj∙β0 + exptreatj∙β1kgfati
+ exptreatj∙β2kgproteini + eij,
where DMIij was the dry matter intake of record i, and β0, β1, and β2 represented the intercept and the regres-sion coefficients for kilograms of fat and kilograms of protein of record i, respectively (kgfati and kgproteini), within experimental treatment j (exptreatj) to allow for different intercepts and slopes among experimental
Heida et al.: DAIRY CATTLE ROUGHAGE AND CONCENTRATE INTAKE
Table 1. General information on the edited data set
Item No.
Experimental treatments in data 517Total number of weekly records for each trait 39,017Unique animals in data 3,164Total number of animal lactations 5,209Average number of records per experimental treatment
75.5
Average number of animals per experimental treatment
14.18
Average number of weekly records per animal 12.3Average number of daughters per sire 3.9
8969
Journal of Dairy Science Vol. 104 No. 8, 2021
treatments j, and eij stands for the random residual ef-fect. For FS we calculated the residual as the difference between fitted value and measured value. A high value for FS means that animals ate less than expected based on their fat and protein production.
Residual roughage intake was defined as the differ-ences between the measured roughage DMI and the expected roughage DMI. Like FS, the expectation was based on the milk production level, but additionally the amount of concentrate fed was adjusted for in the model.
Residual roughage intake was defined as the residuals of the following model:
DMIRij = exptreatj∙β0 + exptreatj∙β1kgproteini
+ exptreatj∙β2kgfati + β3DMICi + eij,
where DMIRij was the DM roughage intake in kilo-grams for record i, and β0, β1, and β2 represented the intercept and the regression coefficients for kilograms of fat and kilograms of protein of record i, respectively (kgfati and kgproteini), within experimental treatment j (exptreatj), to allow for different intercepts and slopes among experimental treatments j, and eij stands for the random residual effect. Regression coefficient β3 repre-sents the regression coefficient on concentrate intake (DMIC) of record i. For RRI, we calculated the dif-ference between the measured value and fitted value. A low value for RRI means that the animal ate less roughage than expected based on its concentrate intake and fat and protein production on an average diet.
Residual concentrate intake was defined as the differ-ence between the observed concentrate intake and the expected concentrate intake. Residual concentrate in-take was defined similarly to FS and RRI. The DMICij was based on the milk components and the amount of roughage fed.
Residual concentrate intake is represented as the residuals of the following model:
DMICij = exptreatj∙β0 + exptreatj∙β1kgproteini
+ exptreatj∙β2kgfati + β3DMIRi + eij,
where DMICij was the DMI of concentrate for record i in kilograms; β0, β1, and β2 represented the intercept and the regression coefficients for kilograms of fat and kilograms of protein of record i, respectively (kgproteini and kgfati), within experimental treatment j (exptreatj) to allow for different intercepts and slopes among experimental treatments j. Regression coefficient β3 represents the regression coefficient on roughage intake (DMIR) of record i, and eij represents the random
residual effect. For RRI we calculated the difference between the measured value and fitted value. A low value for RCI means that animals ate less concentrate than expected based on their roughage intake and milk production.
Statistical Analysis
Initially, an exploratory analysis was performed for the 4 defined traits FIC, FS, RRI, and RCI using simple descriptive statistics (histograms, Pearson correlations, and scatterplots) using R (R Core Team, 2019). Asso-ciations with milk yield, LW, and DMI were visualized by calculating the average (and standard error, SE) for the 4 defined traits, based on bins of 1 kg of milk or DMI and 10 kg of LW, respectively. Also, the mean and SE for the 4 defined traits were calculated for parity and lactation stage.
The phenotypic associations between the 4 defined traits and milk yield, LW, and DMI were also estimated using the linear model described for the genetic analysis with a linear regression coefficient on either LW, milk yield, or DMI.
For the genetic analysis, we were interested in vari-ance components for 10 traits: milk yield (MY), fat plus protein yield, LW, DMI, DMIC, DMIR, and the 4 defined traits FIC, FS, RRI, and RCI. Phenotypic, genetic, and permanent environmental variances were estimated univariately with REML using a linear mixed model (Gilmour et al., 2015). The following model was used:
yijklmnopqr = µ + Pj + β1 × ageck(Pj) + WIMl
+ exptreatm + β2 × breedHOn + β3 × breedFHo + β4
× breedMOp + β5 × breedFVq + β6 × breedMRYr
+ ai + permi + eijklmnopqr,
where yijklmnopqr represents the phenotype for the trait analyzed for individual i, µ was the overall mean, and Pj represented the fixed effect of parity j. Cows in par-ity 4 or above (up to 11) were grouped in a common class. β1 × ageck(Pj) was the fixed quadratic regression of age at calving in month k nested within parity j, with β1 as regression coefficient. WIMl was the fixed effect of lactation stage with week in milk l (1–53 wk in lacta-tion); exptreatm was the fixed effect of experimental treatment m (518 levels). When the record was not in a specific experiment, a fixed effect of herd-year-season was fitted instead. Four seasons were defined: January to March, April to June, July to September, and Octo-ber to December. β2 × breedHOn, β3 × breedFHo, β4 ×
Heida et al.: DAIRY CATTLE ROUGHAGE AND CONCENTRATE INTAKE
Journal of Dairy Science Vol. 104 No. 8, 2021
8970
breedMOp, β5 × breedFVq, and β6 × breedMRYr were the fixed quadratic regressions of breed proportions n, o, p, q, and r of Holstein, Friesian Holstein, Montbé-liarde, Fleckvieh, and Meuse-Rhine-Issel, respectively, with β2 to β6 being the corresponding regression coef-ficients. ai was the random additive genetic effect of animal and var ,a a( ) = Aσ2 where A was the additive
genetic relationship matrix and σa2 the additive genetic
variance. Permi was the permanent environmental ef-fect nested within parity o, and var perm perm( ) = Iσ2 was
the permanent environmental variance, for permi; there was no grouping of parities higher than 4. Finally, eijklmnopqr was the random residual term, with var .e e( ) = Iσ2
Estimating genetic and phenotypic correlations be-tween the 10 traits simultaneously is difficult, especially when the traits are linear combinations of each other (for example, DMI is the sum of DMIR and DMIC) and when the SE of the estimated correlations are relatively large. Dependencies between the traits and large SE make the (co-)variance matrices more prone to become nonpositive definite, which might give convergence problems for AI-REML algorithms. Therefore, several approaches were used to estimate the correlation, using the model described and including genetic, permanent environmental, and residual covariances between the traits. Initially 45 bivariate analysis were performed in ASReml (Gilmour et al., 2015) that all converged eventually. Second, the full 10-trait model was started in ASREML version 4.2nc (Jan. 20, 2021), using a com-bination of AI and (PX)EM-REML algorithms. After more than 600 iterations in total, parameters remained stable, and the log-likelihood changed with 0.08 only in the last 50 iterations, but no full convergence was apparent (judged on the decreasing improvement in log-likelihood per iteration). Therefore, a second pack-age, Wombat (Version 27-05-2020; Meyer, 2007), was tested with the same model and data. This package could only use the AI-REML algorithm, due to a re-sidual covariance between repeated records on the same animal. It failed to find a maximum likelihood solution. Subsequently, a more parsimonious model was fitted by reducing the rank of fit for the genetic (co-)vari-ance matrix from 10 to 9. This reduced model gave full convergence and a better log-likelihood compared with the log-likelihood of the full fit model (which did not fully converge). We compared the outcomes of the initial bivariate models, the incompletely converged ASReml and Wombat 10-trait models, and the con-verged reduced rank Wombat model. Heritabilities and genetic and phenotypic correlations differed only
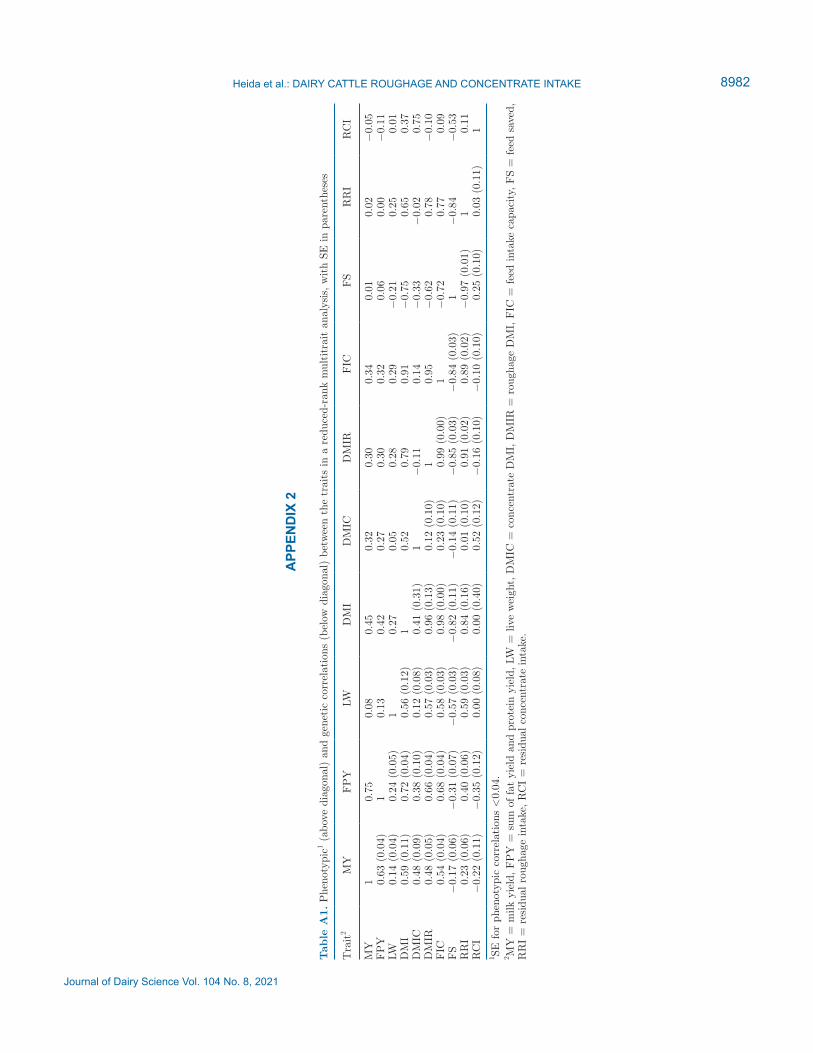
slightly. Somewhat surprisingly, the SE of the estimate of the variance components for DMI increased unrealis-tically (compared with the univariate analysis). In the Results section we use the estimates of the bivariate analysis, and in Appendix 2, Table A1, we present the correlations estimated with the reduced-rank Wombat model.
RESULTS
Descriptive Statistics
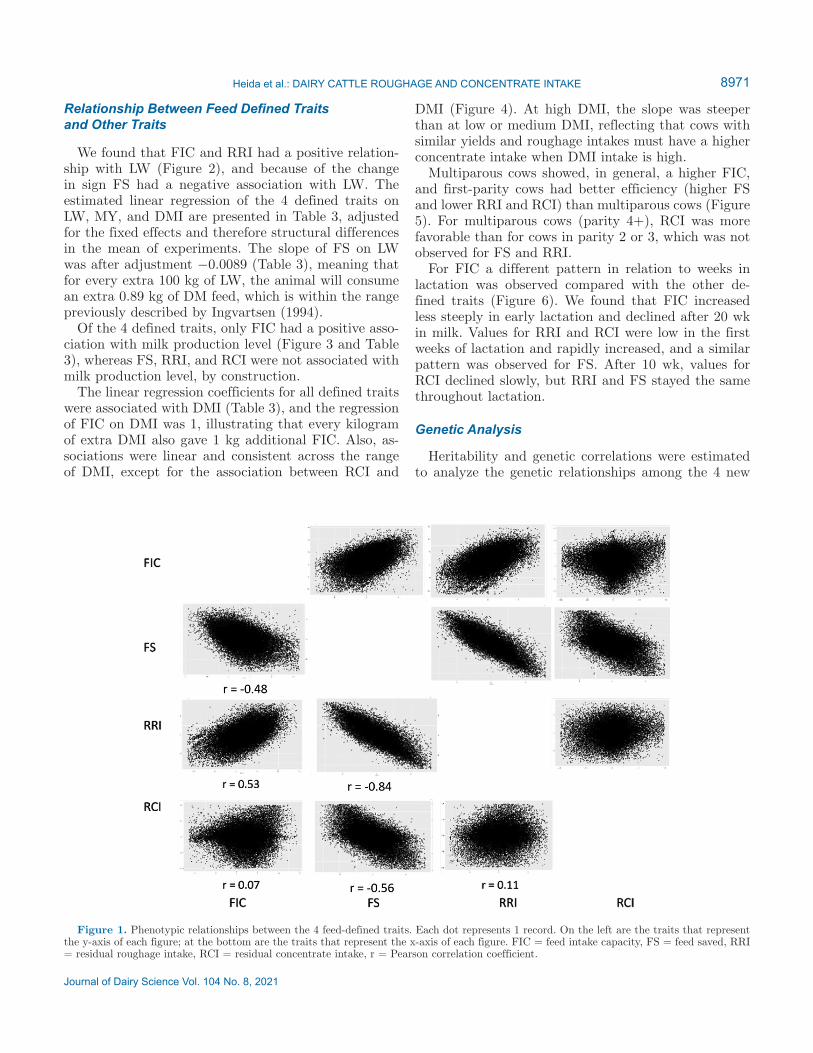
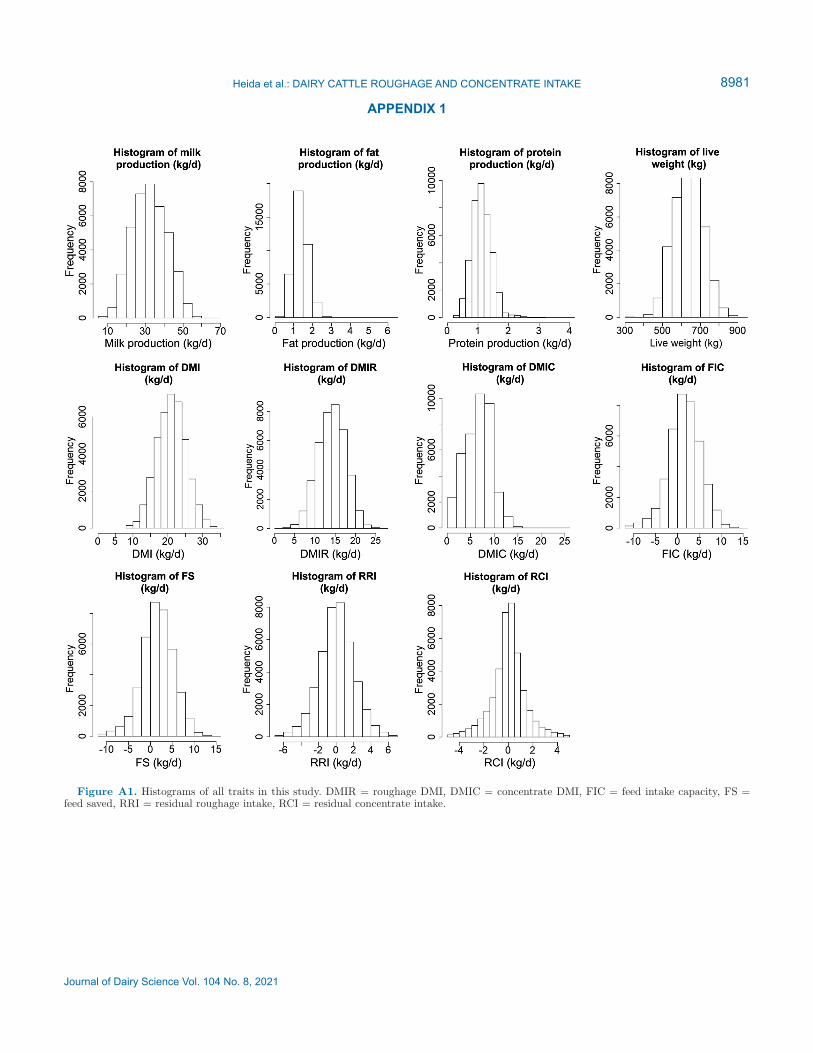
Descriptive statistics for the recorded traits and for the 4 defined traits FIC, FS, RRI, and RCI are sum-marized in Table 2. The mean of FIC was 1.66 kg of DM/d, which means that the cows in the data set on average ate 1.66 kg of DM per day more than predicted by the simplification of the dairy cow model used by Zom (2014). The mean of FS, RRI, and RCI was 0 by construction, because these traits were defined as the residuals of a linear regression. The SD was largest for FIC and smallest for RCI. A similar trend was observed for DMI total, DMIR, and DMIC. The histograms in Figure A1 of Appendix 1 suggest that all traits fol-low a normal distribution. The strongest Pearson cor-relation (−0.84) was found between FS and RRI, but FS was moderately correlated with RCI (−0.56). The weakest Pearson correlation was found between FIC and RCI and between RRI and RCI, both below 0.11. Not only was the association between FIC and RCI, but it showed some underlying structure variation as well, probably due to different feeding systems in some experiments (Figure 1).
Heida et al.: DAIRY CATTLE ROUGHAGE AND CONCENTRATE INTAKE
Table 2. Mean, minimum (min), maximum (max), and SD for all traits
Variable1 Mean Min Max SD
Parity 2.76 1.00 11 1.54DIM 99 2.00 365 73.2MY (kg/d) 32.54 5.34 67.15 9.08FPY (kg/d) 2.51 0.64 7.53 0.67LW (kg) 637 306 932 77.97DMI (kg/d) 21.15 8.00 35.00 4.13DMIR (kg/d) 14.28 1.28 28.00 3.43DMIC (kg/d) 6.94 0.00 25.57 2.86Defined traits FIC (kg/d) 1.66 −11.44 14.39 3.66 FS (kg/d) 0.00 −7.97 7.95 2.29 RRI (kg/d) 0.00 −6.73 6.71 2.00 RCI (kg/d) 0.00 −4.91 4.91 1.401MY = milk yield, FPY = sum of fat yield and protein yield, LW = live weight, DMIC = concentrate DMI, DMIR = roughage DMI, FIC = feed intake capacity, FS = feed saved, RRI = residual roughage intake, RCI = residual concentrate intake.
8971
Journal of Dairy Science Vol. 104 No. 8, 2021
Relationship Between Feed Defined Traits and Other Traits
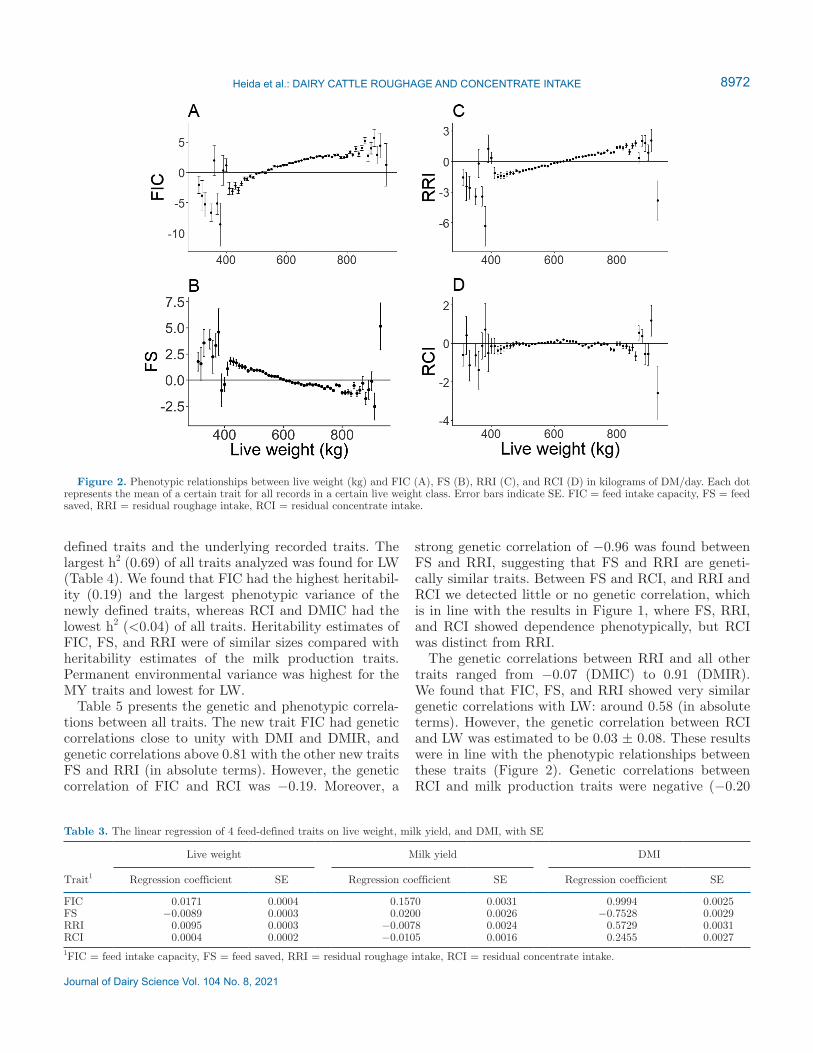
We found that FIC and RRI had a positive relation-ship with LW (Figure 2), and because of the change in sign FS had a negative association with LW. The estimated linear regression of the 4 defined traits on LW, MY, and DMI are presented in Table 3, adjusted for the fixed effects and therefore structural differences in the mean of experiments. The slope of FS on LW was after adjustment −0.0089 (Table 3), meaning that for every extra 100 kg of LW, the animal will consume an extra 0.89 kg of DM feed, which is within the range previously described by Ingvartsen (1994).
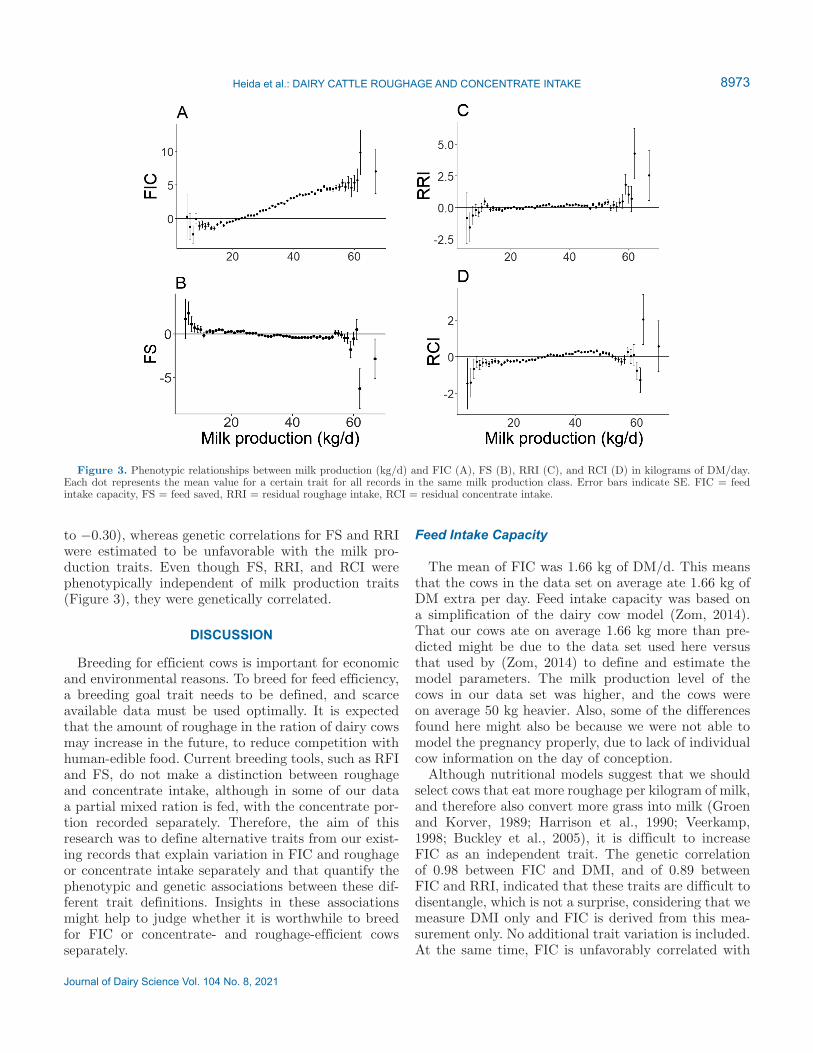
Of the 4 defined traits, only FIC had a positive asso-ciation with milk production level (Figure 3 and Table 3), whereas FS, RRI, and RCI were not associated with milk production level, by construction.
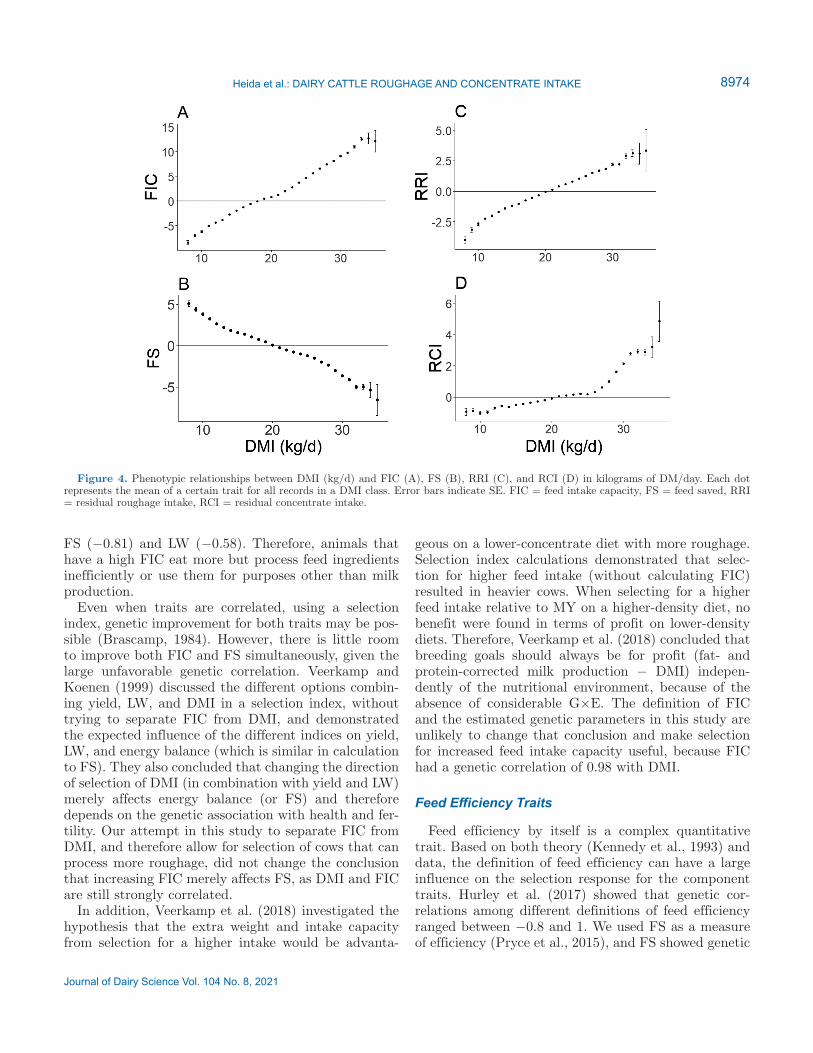
The linear regression coefficients for all defined traits were associated with DMI (Table 3), and the regression of FIC on DMI was 1, illustrating that every kilogram of extra DMI also gave 1 kg additional FIC. Also, as-sociations were linear and consistent across the range of DMI, except for the association between RCI and
DMI (Figure 4). At high DMI, the slope was steeper than at low or medium DMI, reflecting that cows with similar yields and roughage intakes must have a higher concentrate intake when DMI intake is high.
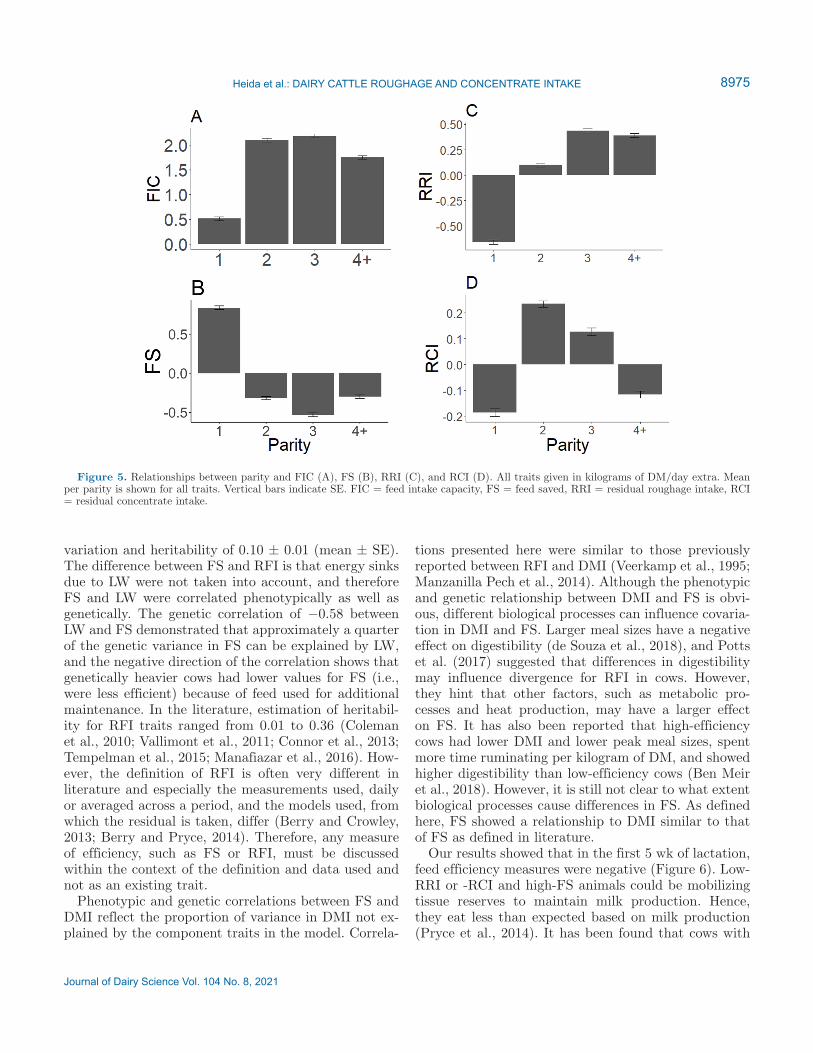
Multiparous cows showed, in general, a higher FIC, and first-parity cows had better efficiency (higher FS and lower RRI and RCI) than multiparous cows (Figure 5). For multiparous cows (parity 4+), RCI was more favorable than for cows in parity 2 or 3, which was not observed for FS and RRI.
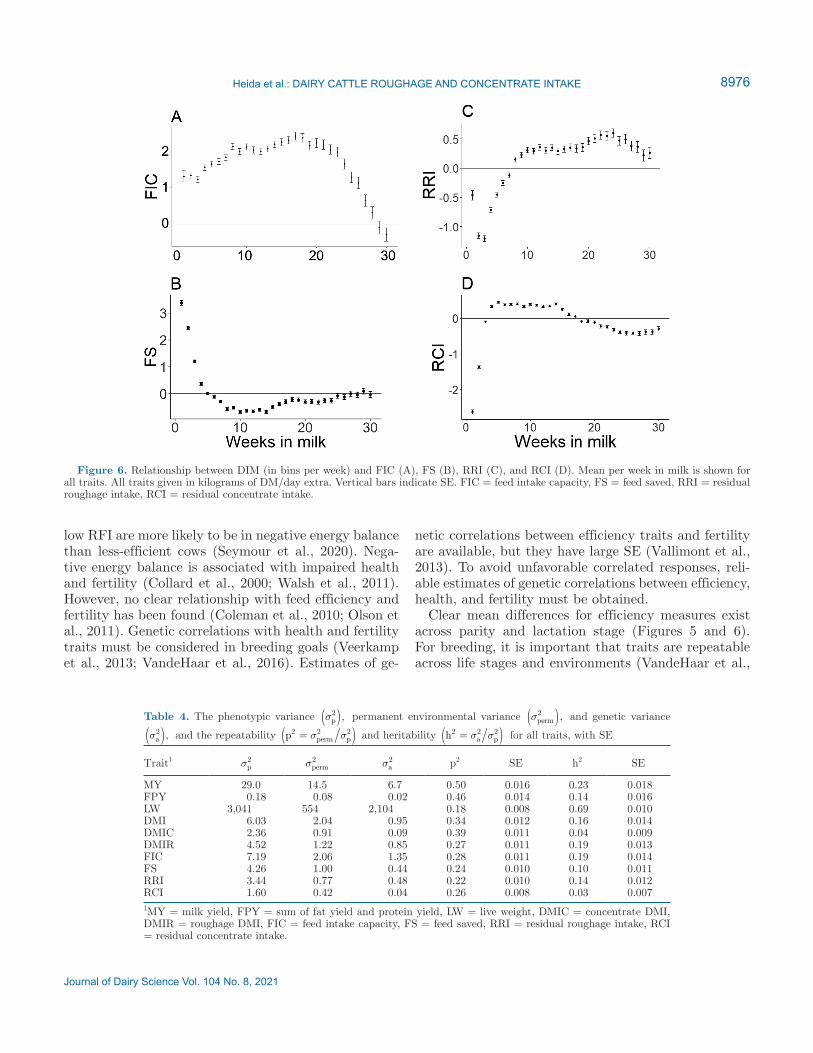
For FIC a different pattern in relation to weeks in lactation was observed compared with the other de-fined traits (Figure 6). We found that FIC increased less steeply in early lactation and declined after 20 wk in milk. Values for RRI and RCI were low in the first weeks of lactation and rapidly increased, and a similar pattern was observed for FS. After 10 wk, values for RCI declined slowly, but RRI and FS stayed the same throughout lactation.
Genetic Analysis
Heritability and genetic correlations were estimated to analyze the genetic relationships among the 4 new
Heida et al.: DAIRY CATTLE ROUGHAGE AND CONCENTRATE INTAKE
Figure 1. Phenotypic relationships between the 4 feed-defined traits. Each dot represents 1 record. On the left are the traits that represent the y-axis of each figure; at the bottom are the traits that represent the x-axis of each figure. FIC = feed intake capacity, FS = feed saved, RRI = residual roughage intake, RCI = residual concentrate intake, r = Pearson correlation coefficient.
Journal of Dairy Science Vol. 104 No. 8, 2021
8972
defined traits and the underlying recorded traits. The largest h2 (0.69) of all traits analyzed was found for LW (Table 4). We found that FIC had the highest heritabil-ity (0.19) and the largest phenotypic variance of the newly defined traits, whereas RCI and DMIC had the lowest h2 (<0.04) of all traits. Heritability estimates of FIC, FS, and RRI were of similar sizes compared with heritability estimates of the milk production traits. Permanent environmental variance was highest for the MY traits and lowest for LW.
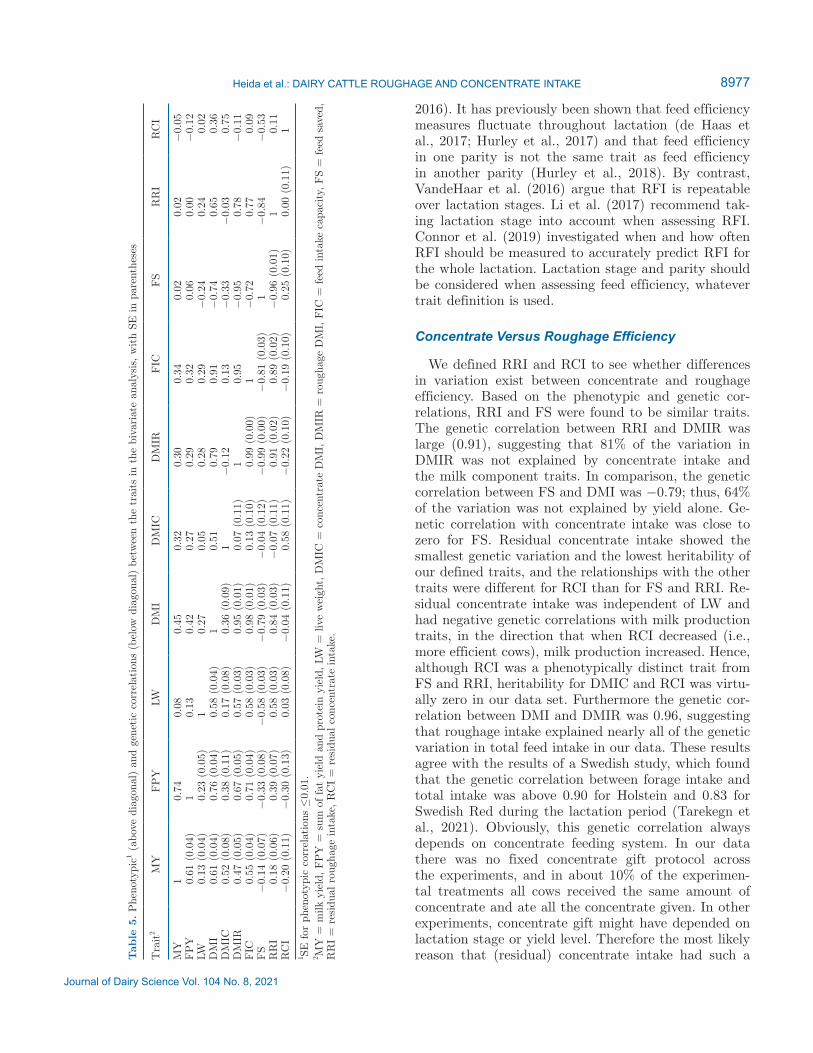
Table 5 presents the genetic and phenotypic correla-tions between all traits. The new trait FIC had genetic correlations close to unity with DMI and DMIR, and genetic correlations above 0.81 with the other new traits FS and RRI (in absolute terms). However, the genetic correlation of FIC and RCI was −0.19. Moreover, a
strong genetic correlation of −0.96 was found between FS and RRI, suggesting that FS and RRI are geneti-cally similar traits. Between FS and RCI, and RRI and RCI we detected little or no genetic correlation, which is in line with the results in Figure 1, where FS, RRI, and RCI showed dependence phenotypically, but RCI was distinct from RRI.
The genetic correlations between RRI and all other traits ranged from −0.07 (DMIC) to 0.91 (DMIR). We found that FIC, FS, and RRI showed very similar genetic correlations with LW: around 0.58 (in absolute terms). However, the genetic correlation between RCI and LW was estimated to be 0.03 ± 0.08. These results were in line with the phenotypic relationships between these traits (Figure 2). Genetic correlations between RCI and milk production traits were negative (−0.20
Heida et al.: DAIRY CATTLE ROUGHAGE AND CONCENTRATE INTAKE
Figure 2. Phenotypic relationships between live weight (kg) and FIC (A), FS (B), RRI (C), and RCI (D) in kilograms of DM/day. Each dot represents the mean of a certain trait for all records in a certain live weight class. Error bars indicate SE. FIC = feed intake capacity, FS = feed saved, RRI = residual roughage intake, RCI = residual concentrate intake.
Table 3. The linear regression of 4 feed-defined traits on live weight, milk yield, and DMI, with SE
Trait1
Live weight
Milk yield
DMI
Regression coefficient SE Regression coefficient SE Regression coefficient SE
FIC 0.0171 0.0004 0.1570 0.0031 0.9994 0.0025FS −0.0089 0.0003 0.0200 0.0026 −0.7528 0.0029RRI 0.0095 0.0003 −0.0078 0.0024 0.5729 0.0031RCI 0.0004 0.0002 −0.0105 0.0016 0.2455 0.00271FIC = feed intake capacity, FS = feed saved, RRI = residual roughage intake, RCI = residual concentrate intake.
8973
Journal of Dairy Science Vol. 104 No. 8, 2021
to −0.30), whereas genetic correlations for FS and RRI were estimated to be unfavorable with the milk pro-duction traits. Even though FS, RRI, and RCI were phenotypically independent of milk production traits (Figure 3), they were genetically correlated.
DISCUSSION
Breeding for efficient cows is important for economic and environmental reasons. To breed for feed efficiency, a breeding goal trait needs to be defined, and scarce available data must be used optimally. It is expected that the amount of roughage in the ration of dairy cows may increase in the future, to reduce competition with human-edible food. Current breeding tools, such as RFI and FS, do not make a distinction between roughage and concentrate intake, although in some of our data a partial mixed ration is fed, with the concentrate por-tion recorded separately. Therefore, the aim of this research was to define alternative traits from our exist-ing records that explain variation in FIC and roughage or concentrate intake separately and that quantify the phenotypic and genetic associations between these dif-ferent trait definitions. Insights in these associations might help to judge whether it is worthwhile to breed for FIC or concentrate- and roughage-efficient cows separately.
Feed Intake Capacity
The mean of FIC was 1.66 kg of DM/d. This means that the cows in the data set on average ate 1.66 kg of DM extra per day. Feed intake capacity was based on a simplification of the dairy cow model (Zom, 2014). That our cows ate on average 1.66 kg more than pre-dicted might be due to the data set used here versus that used by (Zom, 2014) to define and estimate the model parameters. The milk production level of the cows in our data set was higher, and the cows were on average 50 kg heavier. Also, some of the differences found here might also be because we were not able to model the pregnancy properly, due to lack of individual cow information on the day of conception.
Although nutritional models suggest that we should select cows that eat more roughage per kilogram of milk, and therefore also convert more grass into milk (Groen and Korver, 1989; Harrison et al., 1990; Veerkamp, 1998; Buckley et al., 2005), it is difficult to increase FIC as an independent trait. The genetic correlation of 0.98 between FIC and DMI, and of 0.89 between FIC and RRI, indicated that these traits are difficult to disentangle, which is not a surprise, considering that we measure DMI only and FIC is derived from this mea-surement only. No additional trait variation is included. At the same time, FIC is unfavorably correlated with
Heida et al.: DAIRY CATTLE ROUGHAGE AND CONCENTRATE INTAKE
Figure 3. Phenotypic relationships between milk production (kg/d) and FIC (A), FS (B), RRI (C), and RCI (D) in kilograms of DM/day. Each dot represents the mean value for a certain trait for all records in the same milk production class. Error bars indicate SE. FIC = feed intake capacity, FS = feed saved, RRI = residual roughage intake, RCI = residual concentrate intake.
Journal of Dairy Science Vol. 104 No. 8, 2021
8974
FS (−0.81) and LW (−0.58). Therefore, animals that have a high FIC eat more but process feed ingredients inefficiently or use them for purposes other than milk production.
Even when traits are correlated, using a selection index, genetic improvement for both traits may be pos-sible (Brascamp, 1984). However, there is little room to improve both FIC and FS simultaneously, given the large unfavorable genetic correlation. Veerkamp and Koenen (1999) discussed the different options combin-ing yield, LW, and DMI in a selection index, without trying to separate FIC from DMI, and demonstrated the expected influence of the different indices on yield, LW, and energy balance (which is similar in calculation to FS). They also concluded that changing the direction of selection of DMI (in combination with yield and LW) merely affects energy balance (or FS) and therefore depends on the genetic association with health and fer-tility. Our attempt in this study to separate FIC from DMI, and therefore allow for selection of cows that can process more roughage, did not change the conclusion that increasing FIC merely affects FS, as DMI and FIC are still strongly correlated.
In addition, Veerkamp et al. (2018) investigated the hypothesis that the extra weight and intake capacity from selection for a higher intake would be advanta-
geous on a lower-concentrate diet with more roughage. Selection index calculations demonstrated that selec-tion for higher feed intake (without calculating FIC) resulted in heavier cows. When selecting for a higher feed intake relative to MY on a higher-density diet, no benefit were found in terms of profit on lower-density diets. Therefore, Veerkamp et al. (2018) concluded that breeding goals should always be for profit (fat- and protein-corrected milk production − DMI) indepen-dently of the nutritional environment, because of the absence of considerable G×E. The definition of FIC and the estimated genetic parameters in this study are unlikely to change that conclusion and make selection for increased feed intake capacity useful, because FIC had a genetic correlation of 0.98 with DMI.
Feed Efficiency Traits
Feed efficiency by itself is a complex quantitative trait. Based on both theory (Kennedy et al., 1993) and data, the definition of feed efficiency can have a large influence on the selection response for the component traits. Hurley et al. (2017) showed that genetic cor-relations among different definitions of feed efficiency ranged between −0.8 and 1. We used FS as a measure of efficiency (Pryce et al., 2015), and FS showed genetic
Heida et al.: DAIRY CATTLE ROUGHAGE AND CONCENTRATE INTAKE
Figure 4. Phenotypic relationships between DMI (kg/d) and FIC (A), FS (B), RRI (C), and RCI (D) in kilograms of DM/day. Each dot represents the mean of a certain trait for all records in a DMI class. Error bars indicate SE. FIC = feed intake capacity, FS = feed saved, RRI = residual roughage intake, RCI = residual concentrate intake.
8975
Journal of Dairy Science Vol. 104 No. 8, 2021
variation and heritability of 0.10 ± 0.01 (mean ± SE). The difference between FS and RFI is that energy sinks due to LW were not taken into account, and therefore FS and LW were correlated phenotypically as well as genetically. The genetic correlation of −0.58 between LW and FS demonstrated that approximately a quarter of the genetic variance in FS can be explained by LW, and the negative direction of the correlation shows that genetically heavier cows had lower values for FS (i.e., were less efficient) because of feed used for additional maintenance. In the literature, estimation of heritabil-ity for RFI traits ranged from 0.01 to 0.36 (Coleman et al., 2010; Vallimont et al., 2011; Connor et al., 2013; Tempelman et al., 2015; Manafiazar et al., 2016). How-ever, the definition of RFI is often very different in literature and especially the measurements used, daily or averaged across a period, and the models used, from which the residual is taken, differ (Berry and Crowley, 2013; Berry and Pryce, 2014). Therefore, any measure of efficiency, such as FS or RFI, must be discussed within the context of the definition and data used and not as an existing trait.
Phenotypic and genetic correlations between FS and DMI reflect the proportion of variance in DMI not ex-plained by the component traits in the model. Correla-
tions presented here were similar to those previously reported between RFI and DMI (Veerkamp et al., 1995; Manzanilla Pech et al., 2014). Although the phenotypic and genetic relationship between DMI and FS is obvi-ous, different biological processes can influence covaria-tion in DMI and FS. Larger meal sizes have a negative effect on digestibility (de Souza et al., 2018), and Potts et al. (2017) suggested that differences in digestibility may influence divergence for RFI in cows. However, they hint that other factors, such as metabolic pro-cesses and heat production, may have a larger effect on FS. It has also been reported that high-efficiency cows had lower DMI and lower peak meal sizes, spent more time ruminating per kilogram of DM, and showed higher digestibility than low-efficiency cows (Ben Meir et al., 2018). However, it is still not clear to what extent biological processes cause differences in FS. As defined here, FS showed a relationship to DMI similar to that of FS as defined in literature.
Our results showed that in the first 5 wk of lactation, feed efficiency measures were negative (Figure 6). Low-RRI or -RCI and high-FS animals could be mobilizing tissue reserves to maintain milk production. Hence, they eat less than expected based on milk production (Pryce et al., 2014). It has been found that cows with
Heida et al.: DAIRY CATTLE ROUGHAGE AND CONCENTRATE INTAKE
Figure 5. Relationships between parity and FIC (A), FS (B), RRI (C), and RCI (D). All traits given in kilograms of DM/day extra. Mean per parity is shown for all traits. Vertical bars indicate SE. FIC = feed intake capacity, FS = feed saved, RRI = residual roughage intake, RCI = residual concentrate intake.
Journal of Dairy Science Vol. 104 No. 8, 2021
8976
low RFI are more likely to be in negative energy balance than less-efficient cows (Seymour et al., 2020). Nega-tive energy balance is associated with impaired health and fertility (Collard et al., 2000; Walsh et al., 2011). However, no clear relationship with feed efficiency and fertility has been found (Coleman et al., 2010; Olson et al., 2011). Genetic correlations with health and fertility traits must be considered in breeding goals (Veerkamp et al., 2013; VandeHaar et al., 2016). Estimates of ge-
netic correlations between efficiency traits and fertility are available, but they have large SE (Vallimont et al., 2013). To avoid unfavorable correlated responses, reli-able estimates of genetic correlations between efficiency, health, and fertility must be obtained.
Clear mean differences for efficiency measures exist across parity and lactation stage (Figures 5 and 6). For breeding, it is important that traits are repeatable across life stages and environments (VandeHaar et al.,
Heida et al.: DAIRY CATTLE ROUGHAGE AND CONCENTRATE INTAKE
Figure 6. Relationship between DIM (in bins per week) and FIC (A), FS (B), RRI (C), and RCI (D). Mean per week in milk is shown for all traits. All traits given in kilograms of DM/day extra. Vertical bars indicate SE. FIC = feed intake capacity, FS = feed saved, RRI = residual roughage intake, RCI = residual concentrate intake.
Table 4. The phenotypic variance σp2( ), permanent environmental variance σperm
2( ), and genetic variance
σa2( ), and the repeatability p perm p
2 2 2=( )σ σ and heritability h a p2 2 2=( )σ σ for all traits, with SE
Trait1 σp2 σperm
2 σa2 p2 SE h2 SE
MY 29.0 14.5 6.7 0.50 0.016 0.23 0.018FPY 0.18 0.08 0.02 0.46 0.014 0.14 0.016LW 3,041 554 2,104 0.18 0.008 0.69 0.010DMI 6.03 2.04 0.95 0.34 0.012 0.16 0.014DMIC 2.36 0.91 0.09 0.39 0.011 0.04 0.009DMIR 4.52 1.22 0.85 0.27 0.011 0.19 0.013FIC 7.19 2.06 1.35 0.28 0.011 0.19 0.014FS 4.26 1.00 0.44 0.24 0.010 0.10 0.011RRI 3.44 0.77 0.48 0.22 0.010 0.14 0.012RCI 1.60 0.42 0.04 0.26 0.008 0.03 0.0071MY = milk yield, FPY = sum of fat yield and protein yield, LW = live weight, DMIC = concentrate DMI, DMIR = roughage DMI, FIC = feed intake capacity, FS = feed saved, RRI = residual roughage intake, RCI = residual concentrate intake.
8977
Journal of Dairy Science Vol. 104 No. 8, 2021
2016). It has previously been shown that feed efficiency measures fluctuate throughout lactation (de Haas et al., 2017; Hurley et al., 2017) and that feed efficiency in one parity is not the same trait as feed efficiency in another parity (Hurley et al., 2018). By contrast, VandeHaar et al. (2016) argue that RFI is repeatable over lactation stages. Li et al. (2017) recommend tak-ing lactation stage into account when assessing RFI. Connor et al. (2019) investigated when and how often RFI should be measured to accurately predict RFI for the whole lactation. Lactation stage and parity should be considered when assessing feed efficiency, whatever trait definition is used.
Concentrate Versus Roughage Efficiency
We defined RRI and RCI to see whether differences in variation exist between concentrate and roughage efficiency. Based on the phenotypic and genetic cor-relations, RRI and FS were found to be similar traits. The genetic correlation between RRI and DMIR was large (0.91), suggesting that 81% of the variation in DMIR was not explained by concentrate intake and the milk component traits. In comparison, the genetic correlation between FS and DMI was −0.79; thus, 64% of the variation was not explained by yield alone. Ge-netic correlation with concentrate intake was close to zero for FS. Residual concentrate intake showed the smallest genetic variation and the lowest heritability of our defined traits, and the relationships with the other traits were different for RCI than for FS and RRI. Re-sidual concentrate intake was independent of LW and had negative genetic correlations with milk production traits, in the direction that when RCI decreased (i.e., more efficient cows), milk production increased. Hence, although RCI was a phenotypically distinct trait from FS and RRI, heritability for DMIC and RCI was virtu-ally zero in our data set. Furthermore the genetic cor-relation between DMI and DMIR was 0.96, suggesting that roughage intake explained nearly all of the genetic variation in total feed intake in our data. These results agree with the results of a Swedish study, which found that the genetic correlation between forage intake and total intake was above 0.90 for Holstein and 0.83 for Swedish Red during the lactation period (Tarekegn et al., 2021). Obviously, this genetic correlation always depends on concentrate feeding system. In our data there was no fixed concentrate gift protocol across the experiments, and in about 10% of the experimen-tal treatments all cows received the same amount of concentrate and ate all the concentrate given. In other experiments, concentrate gift might have depended on lactation stage or yield level. Therefore the most likely reason that (residual) concentrate intake had such a
Heida et al.: DAIRY CATTLE ROUGHAGE AND CONCENTRATE INTAKE
Tab
le 5
. P
heno
typi
c1 (a
bove
dia
gona
l) a
nd g
enet
ic c
orre
lation
s (b
elow
dia
gona
l) b
etw
een
the
trai
ts in
the
biva
riat
e an
alys
is, w
ith
SE in
pare
nthe
ses
Tra
it2
MY
FP
YLW
DM
ID
MIC
DM
IRFIC
FS
RR
IR
CI
MY
10.
740.
080.
450.
320.
300.
340.
020.
02−
0.05
FP
Y0.
61 (
0.04
)1
0.13
0.42
0.27
0.29
0.32
0.06
0.00
−0.
12LW
0.13
(0.
04)
0.23
(0.
05)
10.
270.
050.
280.
29−
0.24
0.24
0.02
DM
I0.
61 (
0.04
)0.
76 (
0.04
)0.
58 (
0.04
)1
0.51
0.79
0.91
−0.
740.
650.
36D
MIC
0.52
(0.
08)
0.38
(0.
11)
0.17
(0.
08)
0.36
(0.
09)
1−
0.12
0.13
−0.
33−
0.03
0.75
DM
IR0.
47 (
0.05
)0.
67 (
0.05
)0.
57 (
0.03
)0.
95 (
0.01
)0.
07 (
0.11
)1
0.95
−0.
950.
78−
0.11
FIC
0.55
(0.
04)
0.71
(0.
04)
0.58
(0.
03)
0.98
(0.
01)
0.13
(0.
10)
0.99
(0.
00)
1−
0.72
0.77
0.09
FS
−0.
14 (
0.07
)−
0.33
(0.
08)
−0.
58 (
0.03
)−
0.79
(0.
03)
−0.
04 (
0.12
)−
0.99
(0.
00)
−0.
81 (
0.03
)1
−0.
84−
0.53
RR
I0.
18 (
0.06
)0.
39 (
0.07
)0.
58 (
0.03
)0.
84 (
0.03
)−
0.07
(0.
11)
0.91
(0.
02)
0.89
(0.
02)
−0.
96 (
0.01
)1
0.11
RC
I−
0.20
(0.
11)
−0.
30 (
0.13
)0.
03 (
0.08
)−
0.04
(0.
11)
0.58
(0.
11)
−0.
22 (
0.10
)−
0.19
(0.
10)
0.25
(0.
10)
0.00
(0.
11)
11 S
E for
phe
noty
pic
corr
elat
ions
≤0.
01.
2 MY
= m
ilk y
ield
, FP
Y =
sum
of fa
t yi
eld
and
prot
ein
yiel
d, L
W =
live
wei
ght, D
MIC
= c
once
ntra
te D
MI, D
MIR
= r
ough
age
DM
I, F
IC =
fee
d in
take
cap
acity,
FS
= fee
d sa
ved,
R
RI
= r
esid
ual ro
ugha
ge int
ake,
RC
I =
res
idua
l co
ncen
trat
e in
take
.
Journal of Dairy Science Vol. 104 No. 8, 2021
8978
low heritability is that concentrate intake is primarily determined by the feeding system and not by the genet-ics of the cow.
Despite the definition and the name of RRI, we must ask whether selecting for RRI really selects animals that are better suited to convert roughage into milk. This is especially important because concentrate and roughage intake are not independent (Faverdin et al., 1991). In our definition of RRI, it could still be that animals produce more efficiently from concentrate and therefore require less roughage at the same yield and concentrate levels. For cows with a high RRI, 27% of DMI consisted of concentrate. For cows with a low RRI (i.e., efficient with roughage), almost 40% of the DMI consisted of concentrate. Hence, low-RRI cows ate less roughage compared with high-RRI cows. For cows with a low RCI (i.e., efficient with concentrate), 24% of the DMI consisted of concentrate. Thus, low-RCI cows processed more roughage than low-RRI cows. Although these scale effects are clear across the diets, it is unclear how they play a role when comparing animals after adjusting for experimental treatments. More sophisti-cated adjustments might be required to fully separate concentrate and roughage intake, and it is important to investigate the biological differences between animals for these traits.
In this research, roughage and concentrate intake were separated, and for roughage intake the total intake of the partial mixed ration was used. From a nutritional perspective this is suboptimal. Intake of concentrate limits the intake of roughage (Faverdin et al., 1991). Additionally, there is huge variety in types of rough-age and concentrate. For example, roughage may be either straw or maize silage. These types of roughages have different amounts of fiber, starch, and protein. Moreover, many different types of concentrate exist, but this information was not recorded for all data. The distinction between concentrate and roughage made in this study was a beginning and gave the opportunity to investigate differences between roughage and con-centrate efficiency. Classification on a continuous scale (e.g., based on yield response per kg of DMI) might be another way to classify diets (Veerkamp et al., 2018).
CONCLUSIONS
This research aimed to define alternative traits that differentiate between FIC and roughage or concen-trate intake, and to investigate the phenotypic and genetic relationships among them. We found that FIC was strongly correlated with DMI. The RCI trait was distinct from other definitions; however, RCI was hardly heritable. The traits FS and RRI were found to be genetically similar. Therefore, selection for FIC
is expected to simply increase DMI and RRI. There seems to be little advantage in separating concentrate and roughage intake, or to select for FIC in our data, because measured concentrate intake is determined by the feeding system and not by the genetics of the cow.
ACKNOWLEDGMENTS
We acknowledge CRV BV, Samenwerkingsverband Noord-Nederland (SNN), and the Dairy Campus in-novation program for funding the project “Feed Intake of Dairy Cows; Roughage Versus Concentrate.” We acknowledge the reviewers for a very thorough review with clear suggestions for improvement. The authors have not stated any conflicts of interest.
REFERENCES
Arthur, P. F., and R. M. Herd. 2005. Efficiency of feed utilisation by livestock—Implications and benefits of genetic improvement. Can. J. Anim. Sci. 85:281–290. https: / / doi .org/ 10 .4141/ A04 -062.
Beerda, B., W. Ouweltjes, L. B. J. Šebek, J. J. Windig, and R. F. Veerkamp. 2007. Effects of genotype by environment interactions on milk yield, energy balance, and protein balance. J. Dairy Sci. 90:219–228. https: / / doi .org/ 10 .3168/ jds .S0022 -0302(07)72623 -1.
Ben Meir, Y. A., M. Nikbachat, Y. Fortnik, S. Jacoby, H. Levit, G. Adin, M. Cohen Zinder, A. Shabtay, E. Gershon, M. Zachut, S. J. Mabjeesh, I. Halachmi, and J. Miron. 2018. Eating behavior, milk production, rumination, and digestibility characteristics of high- and low-efficiency lactating cows fed a low-roughage diet. J. Dairy Sci. 101:10973–10984. https: / / doi .org/ 10 .3168/ jds .2018 -14684.
Berry, D. P., and J. J. Crowley. 2013. Cell Biology Symposium: Ge-netics of feed efficiency in dairy and beef cattle. J. Anim. Sci. 91:1594–1613. https: / / doi .org/ 10 .2527/ jas .2012 -5862.
Berry, D. P., and J. E. Pryce. 2014. Feed efficiency in growing and mature animals. Proc. 10th World Congress of Genetics Applied to Livestock Production, Vancouver, Canada. Page 109 in Genetics of Trait Complexes: Feed Intake and Efficiency.
Brascamp, E. W. 1984. Selection indices with constraints. Animal Breeding Abstracts 52:645–654.
Buckley, F., C. Holmes, and M. G. Keane. 2005. Genetic character-istics required in dairy and beef cattle for temperate grazing sys-tems. Pages 61–78 in Utilisation of Grazed Grass in Temperate Animal Systems. Proc. Satellite Workshop of the XXth Interna-tional Grassland Congress, Cork, Ireland. J. J. Murphy, ed.
Coffey, M. P., G. Simm, J. D. Oldham, W. G. Hill, and S. Brother-stone. 2004. Genotype and diet effects on energy balance in the first three lactations of dairy cows. J. Dairy Sci. 87:4318–4326. https: / / doi .org/ 10 .3168/ jds .S0022 -0302(04)73577 -8.
Coleman, J., D. P. Berry, K. M. Pierce, A. Brennan, and B. Horan. 2010. Dry matter intake and feed efficiency profiles of 3 genotypes of Holstein-Friesian within pasture-based systems of milk produc-tion. J. Dairy Sci. 93:4318–4331. https: / / doi .org/ 10 .3168/ jds .2009 -2686.
Collard, B. L., P. J. Boettcher, J. C. M. Dekkers, D. Petitclerc, and L. R. Schaeffer. 2000. Relationships between energy balance and health traits of dairy cattle in early lactation. J. Dairy Sci. 83:2683–2690. https: / / doi .org/ 10 .3168/ jds .S0022 -0302(00)75162 -9.
Connor, E. E., J. L. Hutchison, H. D. Norman, K. M. Olson, C. P. Van Tassell, J. M. Leith, and R. L. Baldwin. 2013. Use of residual feed intake in Holsteins during early lactation shows potential to improve feed efficiency through genetic selection. J. Anim. Sci. 91:3978–3988. https: / / doi .org/ 10 .2527/ jas .2012 -5977.
Connor, E. E., J. L. Hutchison, C. P. Van Tassell, and J. B. Cole. 2019. Defining the optimal period length and stage of growth or lacta-
Heida et al.: DAIRY CATTLE ROUGHAGE AND CONCENTRATE INTAKE
8979
Journal of Dairy Science Vol. 104 No. 8, 2021
tion to estimate residual feed intake in dairy cows. J. Dairy Sci. 102:6131–6143. https: / / doi .org/ 10 .3168/ jds .2018 -15407.
CRV. 2019. Jaarstatistieken 2018 voor Nederland [Annual Statistics 2018 for the Netherlands]. Cooperatie CRV.
CVB. 2019. Veevoedertabel 2019 [Animal feed table 2019]. In Che-mische samenstellingen en nutritionele waarden van voedermid-delen [Chemical Compositions and Nutritional Values of Feed Ma-terials]. Federatie Nederlandse Diervoederketen.
de Haas, Y., M. Pszczola, H. Soyeurt, E. Wall, and J. Lassen. 2017. Invited review: Phenotypes to genetically reduce greenhouse gas emissions in dairying. J. Dairy Sci. 100:855–870. https: / / doi .org/ 10 .3168/ jds .2016 -11246.
de Souza, R. A., R. J. Tempelman, M. S. Allen, W. P. Weiss, J. K. Bernard, and M. J. VandeHaar. 2018. Predicting nutrient digest-ibility in high-producing dairy cows. J. Dairy Sci. 101:1123–1135. https: / / doi .org/ 10 .3168/ jds .2017 -13344.
FADN. 2011. Farm Economics Brief. EU Production Costs Overview. European Commission–EU FADN. Accessed Feb. 20, 2021. https: / / ec .europa .ed/ agriculture/ rica/ pdf/ Brief201102 .pdf.
Faverdin, P., J. P. Dulphy, J. B. Coulon, R. Vérité, J. P. Garel, J. Rouel, and B. Marquis. 1991. Substitution of roughage by concen-trates for dairy cows. Livest. Prod. Sci. 27:137–156. https: / / doi .org/ 10 .1016/ 0301 -6226(91)90092 -5.
Gilmour, A. R., B. Gogel, B. Cullis, S. Welham, and R. Thompson. 2015. ASReml User Guide Release 4.1 Functional Specification. VSN International Ltd.
Groen, A. F., and S. Korver. 1989. The economic value of feed intake capacity of dairy cows. Livest. Prod. Sci. 22:269–281. https: / / doi .org/ 10 .1016/ 0301 -6226(89)90060 -2.
Gunsett, F. C. 1984. Linear index selection to improve traits defined as ratios. J. Anim. Sci. 59:1185–1193. https: / / doi .org/ 10 .2527/ jas1984 .5951185x.
Harrison, R. O., S. P. Ford, J. W. Young, A. J. Conley, and A. E. Freeman. 1990. Increased milk production versus reproductive and energy status of high producing dairy cows. J. Dairy Sci. 73:2749–2758. https: / / doi .org/ 10 .3168/ jds .S0022 -0302(90)78960 -6.
Hilhorst, G. 2018. Eiwit van eigen land: Het begint met het goed benutten van gras [Protein from your own land: It starts with making good use of grass]. Vol. 2020. Accessed Feb. 20, 2021. www .kringloopwijzer .nl.
Hurley, A. M., N. López-Villalobos, S. McParland, E. Lewis, E. Ken-nedy, M. O’Donovan, J. L. Burke, and D. P. Berry. 2017. Genet-ics of alternative definitions of feed efficiency in grazing lactating dairy cows. J. Dairy Sci. 100:5501–5514. https: / / doi .org/ 10 .3168/ jds .2016 -12314.
Hurley, A. M., N. Lopez-Villalobos, S. McParland, E. Lewis, E. Ken-nedy, M. O’Donovan, J. L. Burke, and D. P. Berry. 2018. Charac-teristics of feed efficiency within and across lactation in dairy cows and the effect of genetic selection. J. Dairy Sci. 101:1267–1280. https: / / doi .org/ 10 .3168/ jds .2017 -12841.
Ingvartsen, K. L. 1994. Models of voluntary food intake in cattle. Livest. Prod. Sci. 39:19–38. https: / / doi .org/ 10 .1016/ 0301 -6226(94)90149 -X.
Kennedy, B. W., J. H. van der Werf, and T. H. Meuwissen. 1993. Genetic and statistical properties of residual feed intake. J. Anim. Sci. 71:3239–3250. https: / / doi .org/ 10 .2527/ 1993 .71123239x.
Kleijne, J. d., S. Ruiter, A. v. Velde, H. Zonderland, K. Bolscher, N. Oerlemans, W. d. Weijden, L. Hendrix, J. J. v. Dijk, and T. Loman. 2018. Grondgebondenheid als basis voor een toekomst-bestendige melkveehouderij [Land-relatedness as the basis for fu-ture-proof dairy farming]. De Commissie Grondgebondenheid [The Land-Relatedness Committee].
Koch, R. M., L. A. Swiger, D. Chambers, and K. E. Gregory. 1963. Ef-ficiency of feed use in beef cattle. J. Anim. Sci. 22:486–494. https: / / doi .org/ 10 .2527/ jas1963 .222486x.
Koenen, E. P. C., P. B. M. Berentsen, and A. F. Groen. 2000. Eco-nomic values of live weight and feed intake capacity of dairy cattle under Dutch production circumstances. Livest. Prod. Sci. 66:235–250. https: / / doi .org/ 10 .1016/ S0301 -6226(00)00167 -6.
Li, B., B. Berglund, W. F. Fikse, J. Lassen, M. H. Lidauer, P. Män-tysaari, and P. Løvendahl. 2017. Neglect of lactation stage leads
to naive assessment of residual feed intake in dairy cattle. J. Dairy Sci. 100:9076–9084. https: / / doi .org/ 10 .3168/ jds .2017 -12775.
Li, B., P. M. VanRaden, E. Guduk, J. R. O’Connell, D. J. Null, E. E. Connor, M. J. VandeHaar, R. J. Tempelman, K. A. Weigel, and J. B. Cole. 2020. Genomic prediction of residual feed intake in US Holstein dairy cattle. J. Dairy Sci. 103:2477–2486. https: / / doi .org/ 10 .3168/ jds .2019 -17332.
Manafiazar, G., L. Goonewardene, F. Miglior, D. H. Crews Jr., J. A. Basarab, E. Okine, and Z. Wang. 2016. Genetic and phenotypic correlations among feed efficiency, production and selected confor-mation traits in dairy cows. Animal 10:381–389. https: / / doi .org/ 10 .1017/ S1751731115002281.
Manzanilla Pech, C. I. V., R. F. Veerkamp, M. P. L. Calus, R. Zom, A. van Knegsel, J. E. Pryce, and Y. De Haas. 2014. Genetic pa-rameters across lactation for feed intake, fat-and protein-corrected milk, and liveweight in first-parity Holstein cattle. J. Dairy Sci. 97:5851–5862. https: / / doi .org/ 10 .3168/ jds .2014 -8165.
Meyer, K. 2007. WOMBAT—A tool for mixed model analyses in quantitative genetics by restricted maximum likelihood (REML). J. Zhejiang Univ. Sci. B 8:815–821. https: / / doi .org/ 10 .1631/ jzus .2007 .B0815.
Olson, K. M., B. G. Cassell, M. D. Hanigan, and R. E. Pearson. 2011. Short communication: Interaction of energy balance, feed effi-ciency, early lactation health events, and fertility in first-lactation Holstein, Jersey, and reciprocal F1 crossbred cows. J. Dairy Sci. 94:507–511. https: / / doi .org/ 10 .3168/ jds .2010 -3433.
Potts, S. B., J. P. Boerman, A. L. Lock, M. S. Allen, and M. J. Vande-Haar. 2017. Relationship between residual feed intake and digest-ibility for lactating Holstein cows fed high and low starch diets. J. Dairy Sci. 100:265–278. https: / / doi .org/ 10 .3168/ jds .2016 -11079.
Pryce, J. E., O. Gonzalez-Recio, G. Nieuwhof, W. J. Wales, M. P. Coffey, B. J. Hayes, and M. E. Goddard. 2015. Hot topic: Defini-tion and implementation of a breeding value for feed efficiency in dairy cows. J. Dairy Sci. 98:7340–7350. https: / / doi .org/ 10 .3168/ jds .2015 -9621.
Pryce, J. E., B. L. Nielsen, R. F. Veerkamp, and G. Simm. 1999. Geno-type and feeding system effects and interactions for health and fertility traits in dairy cattle. Livest. Prod. Sci. 57:193–201. https: / / doi .org/ 10 .1016/ S0301 -6226(98)00180 -8.
Pryce, J. E., W. J. Wales, Y. de Haas, R. F. Veerkamp, and B. J. Hayes. 2014. Genomic selection for feed efficiency in dairy cattle. Animal 8:1–10. https: / / doi .org/ 10 .1017/ S1751731113001687.
R Core Team. 2019. R: A Language and Environment for Statistical Computing. R Foundation for Statistical Computing.
Seymour, D. J., A. Cánovas, T. C. S. Chud, J. P. Cant, V. R. Osborne, C. F. Baes, F. S. Schenkel, and F. Miglior. 2020. The dynamic be-havior of feed efficiency in primiparous dairy cattle. J. Dairy Sci. 103:1528–1540. https: / / doi .org/ 10 .3168/ jds .2019 -17414.
Tarekegn, G. M., J. Karlsson, C. Kronqvist, B. Berglund, K. Hol-tenius, and E. Strandberg. 2021. Genetic parameters of forage dry matter intake and milk produced from forage in Swedish Red and Holstein dairy cows. J. Dairy Sci. 104:4424–4440. https: / / doi .org/ 10 .3168/ jds .2020 -19224.
Tempelman, R. J., and Y. Lu. 2020. Symposium review: Genetic rela-tionships between different measures of feed efficiency and the im-plications for dairy cattle selection indexes. J. Dairy Sci. 103:5327–5345. https: / / doi .org/ 10 .3168/ jds .2019 -17781.
Tempelman, R. J., D. M. Spurlock, M. Coffey, R. F. Veerkamp, L. E. Armentano, K. A. Weigel, Y. de Haas, C. R. Staples, E. E. Con-nor, Y. Lu, and M. J. VandeHaar. 2015. Heterogeneity in genetic and nongenetic variation and energy sink relationships for residual feed intake across research stations and countries. J. Dairy Sci. 98:2013–2026. https: / / doi .org/ 10 .3168/ jds .2014 .8510.
Vallimont, J. E., C. D. Dechow, J. M. Daubert, M. W. Dekleva, J. W. Blum, C. M. Barlieb, W. Liu, G. A. Varga, A. J. Heinrichs, and C. R. Baumrucker. 2011. Short communication: Heritability of gross feed efficiency and associations with yield, intake, residual intake, body weight, and body condition score in 11 commercial Penn-sylvania tie stalls. J. Dairy Sci. 94:2108–2113. https: / / doi .org/ 10 .3168/ jds .2010 -3888.
Heida et al.: DAIRY CATTLE ROUGHAGE AND CONCENTRATE INTAKE
Journal of Dairy Science Vol. 104 No. 8, 2021
8980
Vallimont, J. E., C. D. Dechow, J. M. Daubert, M. W. Dekleva, J. W. Blum, W. Liu, G. A. Varga, A. J. Heinrichs, and C. R. Ba-umrucker. 2013. Short communication: Feed utilization and its associations with fertility and productive life in 11 commercial Pennsylvania tie-stall herds. J. Dairy Sci. 96:1251–1254. https: / / doi .org/ 10 .3168/ jds .2012 -5712.
van Knegsel, A. T. M., G. J. Remmelink, S. Jorjong, V. Fievez, and B. Kemp. 2014. Effect of dry period length and dietary energy source on energy balance, milk yield, and cow composition of dairy cows. J. Dairy Sci. 97:1499–1512. https: / / doi .org/ 10 .3168/ jds .2013 -7391.
VandeHaar, M. J., L. E. Armentano, K. Weigel, D. M. Spurlock, R. J. Tempelman, and R. Veerkamp. 2016. Harnessing the genetics of the modern dairy cow to continue improvements in feed ef-ficiency1. J. Dairy Sci. 99:4941–4954. https: / / doi .org/ 10 .3168/ jds .2015 -10352.
Veerkamp, R. F. 1998. Selection for economic efficiency of dairy cat-tle using information on live weight and feed intake: A review. J. Dairy Sci. 81:1109–1119. https: / / doi .org/ 10 .3168/ jds .S0022 -0302(98)75673 -5.
Veerkamp, R. F., and G. C. Emmans. 1995. Sources of genetic varia-tion in energetic efficiency of dairy cows. Livest. Prod. Sci. 44:87–97. https: / / doi .org/ 10 .1016/ 0301 -6226(95)00065 -0.
Veerkamp, R. F., G. C. Emmans, A. R. Cromie, and G. Simm. 1995. Variance components for residual feed intake in dairy cows. Livest. Prod. Sci. 41:111–120. https: / / doi .org/ 10 .1016/ 0301 -6226(94)00056 -D.
Veerkamp, R. F., and E. P. C. Koenen. 1999. Genetics of food in-take, live weight, condition score and energy balance. BSAP Occasional Publication 24:63–73. https: / / doi .org/ 10 .1017/ S1463981500043089.
Veerkamp, R. F., J. K. Oldenbroek, H. J. Van der Gaast, and J. H. Van der Werf. 2000. Genetic correlation between days until start of luteal activity and milk yield, energy balance, and live weights.
J. Dairy Sci. 83:577–583. https: / / doi .org/ 10 .3168/ jds .S0022 -0302(00)74917 -4.
Veerkamp, R. F., J. E. Pryce, D. Spurlock, D. P. Berry, M. Coffey, P. Løvendahl, R. van der Linde, J. Bryant, F. Miglior, Z. Wang, M. Winters, N. Krattenmacher, N. Charfeddine, J. Pedersen, and Y. de Haas. 2013. Selection on feed intake or feed efficiency: A posi-tion paper from gDMI breeding goal discussions. Pages 15–22 in Proc. Interbull Meeting No. 47, Nantes, France. Interbull.
Veerkamp, R. F., G. C. B. Schopen, and Y. de Haas. 2018. Selection for low or high feed intake cows: Genotype by environment inter-action for milk yield, live weight and dry matter intake in dairy cows. Page 189 in Proc. World Congress on Genetics Applied to Livestock Production. Auckland, New Zealand.
Walsh, S. W., E. J. Williams, and A. C. O. Evans. 2011. A review of the causes of poor fertility in high milk producing dairy cows. Anim. Reprod. Sci. 123:127–138. https: / / doi .org/ 10 .1016/ j .anireprosci .2010 .12 .001.
Zom, R. 2014. The development of a model for the prediction of feed intake and energy partitioning in dairy cows. PhD thesis. Animal Nutrition, Wageningen Institute of Animal Sciences, Wagenigen, the Netherlands.
Zom, R. L. G., G. André, and A. M. van Vuuren. 2012. Development of a model for the prediction of feed intake by dairy cows: 1. Pre-diction of feed intake. Livest. Sci. 143:43–57. https: / / doi .org/ 10 .1016/ j .livsci .2011 .08 .014.
ORCIDS
Ghyslaine C. B. Schopen https: / / orcid .org/ 0000 -0003 -3941 -9872Birgit Gredler-Grandl https: / / orcid .org/ 0000 -0002 -5916 -8639Roel F. Veerkamp https: / / orcid .org/ 0000 -0002 -5240 -6534
Heida et al.: DAIRY CATTLE ROUGHAGE AND CONCENTRATE INTAKE
8981
Journal of Dairy Science Vol. 104 No. 8, 2021
APPENDIX 1
Heida et al.: DAIRY CATTLE ROUGHAGE AND CONCENTRATE INTAKE
Figure A1. Histograms of all traits in this study. DMIR = roughage DMI, DMIC = concentrate DMI, FIC = feed intake capacity, FS = feed saved, RRI = residual roughage intake, RCI = residual concentrate intake.
Journal of Dairy Science Vol. 104 No. 8, 2021
8982Heida et al.: DAIRY CATTLE ROUGHAGE AND CONCENTRATE INTAKE
APP
END
IX 2
Tab
le A
1. P
heno
typi
c1 (a
bove
dia
gona
l) a
nd g
enet
ic c
orre
lation
s (b
elow
dia
gona
l) b
etw
een
the
trai
ts in
a re
duce
d-ra
nk m
ultitr
ait
anal
ysis
, w
ith
SE in
pare
nthe
ses
Tra
it2
MY
FP
YLW
DM
ID
MIC
DM
IRFIC
FS
RR
IR
CI
MY
10.
750.
080.
450.
320.
300.
340.
010.
02−
0.05
FP
Y0.
63 (
0.04
)1
0.13
0.42
0.27
0.30
0.32
0.06
0.00
−0.
11LW
0.14
(0.
04)
0.24
(0.
05)
10.
270.
050.
280.
29−
0.21
0.25
0.01
DM
I0.
59 (
0.11
)0.
72 (
0.04
)0.
56 (
0.12
)1
0.52
0.79
0.91
−0.
750.
650.
37D
MIC
0.48
(0.
09)
0.38
(0.
10)
0.12
(0.
08)
0.41
(0.
31)
1−
0.11
0.14
−0.
33−
0.02
0.75
DM
IR0.
48 (
0.05
)0.
66 (
0.04
)0.
57 (
0.03
)0.
96 (
0.13
)0.
12 (
0.10
)1
0.95
−0.
620.
78−
0.10
FIC
0.54
(0.
04)
0.68
(0.
04)
0.58
(0.
03)
0.98
(0.
00)
0.23
(0.
10)
0.99
(0.
00)
1−
0.72
0.77
0.09
FS
−0.
17 (
0.06
)−
0.31
(0.
07)
−0.
57 (
0.03
)−
0.82
(0.
11)
−0.
14 (
0.11
)−
0.85
(0.
03)
−0.
84 (
0.03
)1
−0.
84−
0.53
RR
I0.
23 (
0.06
)0.
40 (
0.06
)0.
59 (
0.03
)0.
84 (
0.16
)0.
01 (
0.10
)0.
91 (
0.02
)0.
89 (
0.02
)−
0.97
(0.
01)
10.
11R
CI
−0.
22 (
0.11
)−
0.35
(0.
12)
0.00
(0.
08)
0.00
(0.
40)
0.52
(0.
12)
−0.
16 (
0.10
)−
0.10
(0.
10)
0.25
(0.
10)
0.03
(0.
11)
11 S
E for
phe
noty
pic
corr
elat
ions
<0.
04.
2 MY
= m
ilk y
ield
, FP
Y =
sum
of fa
t yi
eld
and
prot
ein
yiel
d, L
W =
live
wei
ght, D
MIC
= c
once
ntra
te D
MI, D
MIR
= r
ough
age
DM
I, F
IC =
fee
d in
take
cap
acity,
FS
= fee
d sa
ved,
R
RI
= r
esid
ual ro
ugha
ge int
ake,
RC
I =
res
idua
l co
ncen
trat
e in
take
.